Currency exchange rates.
Changes in our financial strength and ultimately profit margins and reserve levels.credit ratings.
Increased competition from other insurers and financial services companies due to industry consolidation or other factors.
Legislative, regulatory, or tax changes, both domestic and foreign, including the effect of potential legislation and increased regulation in the current political environment.
Effectiveness of our risk management programs,program.
The level and implementationresults of the multistate regulatory settlement agreementslitigation.
Effectiveness in supporting new product offerings and the California Departmentproviding customer service.
Actual experience in pricing, underwriting, and reserving may deviate from our assumptions.
Lower than projected persistency and lower sales growth.
Fluctuation in insurance reserve liabilities.
Ability and willingness of Insurance settlement agreement.reinsurers to meet their obligations.
Changes in assumptions related to intangible assets such as deferred acquisition costs, value of business acquired, and goodwill.
Ability of our subsidiaries to pay dividends as a result of changesregulatory restrictions.
Events or consequences relating to terrorism and acts of war, both domestic and foreign.
Changes in numerous factors,accounting standards, practices, or policies.
Ability to recover our systems and such fluctuations can have material positive or negative effects on net income.
All subsequent written and oral forward-looking statements attributable to the Companyus or any person acting on itsour behalf are expressly qualified in their entirety by the cautionary statements contained or referred to in this section. The Company does not undertake any obligation
Index to release publicly any revisions to such forward-looking statements to reflect events or circumstances after the date of this document or to reflect the occurrence of unanticipated events.Financial Statements
| ITEM 1. BUSINESS |
General
As used in this Form 10-K, the “Company” refers to UnumProvident Corporation,Unum Group, a Delaware general business corporation, and its insurance and non-insurance companies thatsubsidiaries, which collectively with Unum Group we refer to as the Company, operate in the United States, the United Kingdom, and, to a limited extent, in certain other countries around the world. The Company’s principal operating subsidiaries in the United States are Unum Life Insurance Company of America (Unum America), Provident Life and Accident Insurance Company (Accident)(Provident), The Paul Revere Life Insurance Company (Paul Revere Life), and Colonial Life & Accident Insurance Company, (Colonial), and in the United Kingdom, Unum Limited. The Company isWe are the largest provider of group and individual income protectiondisability insurance products in the United States and the United Kingdom. ItWe also providesprovide a complementary portfolio of other insurance products, including long-term care insurance, life insurance, employer- and employee-paid group benefits, and other related services.
The Company is the surviving corporation in the merger on June 30, 1999 of Provident Companies, Inc. (Provident), the leading individual income protection insurance provider in North America, with Unum Corporation (Unum), the leading group income protection insurance provider. Prior to the merger, Unum acquired Unum Limited, the leading income protection insurer in the United Kingdom, in 1990 and in 1993, merged with Colonial Companies, Inc., the parent company of Colonial, a leader in payroll marketing of a broad line of supplemental insurance products. Also prior to the merger, Provident acquired Paul Revere Life, a leading provider of individual income protection insurance in North America. The Company sold its Canadian branch operations in 2004.
The Company hasWe have three major business segments: U.S. Brokerage, Unum Limited,US, Unum UK, and Colonial as well asLife. Our other segments are the Individual Income ProtectionDisability – Closed Block segment and the Corporate and Other segment, and Corporate segment, assegment. These segments are discussed more fully under “Reporting Segments” included herein in Item 1.
Business Strategies
The Company offersAs one of the leading providers of employee benefits, we offer a comprehensivebroad portfolio of income protection products and services to meet the diverse needs of the marketplace. The Company seeksWe try to achieve a competitive advantage by offering group, individual, and voluntary workplacebenefits products that can combinebe offered as stand alone products or that can be combined with other coverages to provide integrated productcomprehensive benefits solutions for customers. The Company offersWe offer competitive benefit plans to businesses of all sizes highly competitive benefits to help them attract and retain a stronger workforce and protect the incomes and lifestyles of employees and their families. Through a variety of technological tools and trained professionals, the Company offers a service environment, including comprehensive claims managementwe offer services which isare designed to be responsive, timely, and committedmeet the evolving needs of our customers. We strive to provide the highest level of service excellence.
We believe that we are a well positioned and competitive force in our sector. However, due to the nature of our business, we are sensitive to economic and financial market movements, including consumer confidence, employment levels, and the level of interest rates.
In order to maintain its competitive business position, duringDuring the last few years, the Company’swe have successfully developed an overall risk management structure that focuses on risk at all levels of our organization. Through our capital management risk strategy, has been to:
avoided certain asset class problems.
During 2006, the Company intends2009, we intend to continue toour focus on:on a number of key areas. Objectives for 2009 include:
| • | Consistent execution of our operating plans. We will continue our emphasis on disciplined, profitable growth. |
| • | Maintain a strong investment portfolio. We will maintain disciplined credit analysis in our selection of investment assets and continue to be conservative within our investment risk tolerances. |
| • | Build and effectively use capital. We intend to continue to build capital and manage it effectively within our stated capital management strategy objectives. |
| • | Professional development of our employees. We will continue our focus on employee training and development as well as talent management. |
Index to Financial Statements
Reporting Segments
Effective July 1, 2005, the Company modified its reporting segments to separate its United States business from that of its United Kingdom subsidiary, Unum Limited, due to the continued growth in that subsidiary and to recent organizational changes within the Company which established a separate management team to focus solely on the U.S. Brokerage lines of business. The Company’s newOur reporting segments are comprised of the following: U.S. Brokerage, Unum Limited,US, Unum UK, Colonial Life, Individual Income ProtectionDisability – Closed Block, and Corporate and Other. Effective with the fourth quarter of 2008, we made slight modifications to our reporting segments to better align the debt of our securitizations with the business segments and to align the allocation of capital for Unum UK similar to that of Unum US and Colonial Life. Specifically, we transferred the assets, non-recourse debt, and associated capital of Tailwind Holdings, LLC (Tailwind Holdings) and Northwind Holdings, LLC (Northwind Holdings) from our former Corporate segment to Unum US group disability and Individual Disability – Closed Block, respectively. We transferred excess assets, capital in excess of target, and the associated investment income from Unum UK to our Corporate and Other segment. We also modified the investment income allocation on capital supporting certain of our group disability and Corporate. long-term care product lines within Unum US and have also aggregated our former Other segment and Corporate segment into one reporting segment. Financial results previously reported have been revised to reflect these reclassifications.
Measured as a percentage of consolidated premium income for the year ended December 31, 2005,2008, premium income was approximately 6763.8 percent for the U.S. BrokerageUnum US segment, 1011.4 percent for Unum Limited, 10UK, 12.6 percent for Colonial Life, and 1312.2 percent for the Individual Income ProtectionDisability – Closed Block and Corporate and Other segments combined.
The products now reported in the U.S. Brokerage segment and the Unum Limited segment were previously combined and reported in the Income Protection and Life and Accident segments. The results of the disability management services business are now reported in the Other segment, which has been redefined to include the disability management services business as well as results from U.S. Brokerage insured products not actively marketed (with the exception of the individual income protection products in the Individual Income Protection – Closed Block segment). There were no changes to the Colonial, Individual Income Protection – Closed Block, or Corporate segments. Segment information for prior years has been reclassified to conform to the current reporting segments.
Financial information is provided in “Management’s Discussion and Analysis of Financial Condition and Results of Operations” contained herein in Item 7 and Note 1413 of the “Notes to Consolidated Financial Statements” contained herein in Item 8.
U.S. BrokerageUnum US Segment
The U.S. BrokerageUnum US segment includes group income protectionlong-term and short-term disability insurance, group life and accidental death and dismemberment products, and supplemental and voluntary lines of business, comprised of individual income protectiondisability – recently issued, group and individual long-term care, and brokerage voluntary workplace benefits products, issued primarily by Unum America, Accident,Provident, and Paul Revere Life. Paul Revere Life no longer actively markets new business but continues to service its existing business. Premium income for this segment totaled $5,229.0$4,963.0 million in 2005.2008. These products are marketed through the Company’sour field sales personnel who work in conjunction with independent brokers and consultants. The Company utilizes a distribution model for the sale of individual income protection andEffective in 2009, we will discontinue selling individual long-term care insurance products whereby independent brokers and consultants are provided direct access to a sales support center centrally located in the Company’s corporate offices.
on an active basis.
Group Long-term and Short-term Income ProtectionDisability
Group long-term and short-term income protectiondisability products contributed approximately 4845.8 percent of the U.S. BrokerageUnum US segment premium income in 2005. Group2008. We sell group long-term and short-term income protectiondisability products are sold to employers for the benefit of employees. Group long-term income protectiondisability provides employees with insurance coverage for loss of income in the event of extended work absences due to sickness or injury. Services are offeredWe offer services to employers and insureds to encourage and facilitate rehabilitation, retraining, and re-employment. Most policies begin providing benefits following 90 or 180 day waiting periods and continue providing benefits until the employee reaches a certain age, generally between 65 and 70. The benefits are limited to specified maximums as a percentage of income.
Group short-term income protectiondisability insurance generally provides coverage from loss of income due to injury or sickness, effective immediately for accidents and after one week for sickness, for up to 26 weeks, limited to specified maximums as a percentage of income. Short-term income protection is sold primarily on a basis permitting periodic repricing to address the underlying claims experience.
Premiums for group long-term and short-term income protectiondisability are generally based on expected claims of a pool of similar risks plus provisions for administrative expenses and profit. Some cases carry experience rating provisions. Premiums for experience rated group long-term and short-term income protectiondisability business are based on the expected experience of the client given their industry group, adjusted for the credibility of the specific claim experience of the client. The CompanyWe also offersoffer accounts handled on an administrative services only (ASO) basis, with the responsibility for funding claim payments remaining with the customer. Both group long-term and short-term disability are sold primarily on a basis permitting periodic repricing to address the underlying claims experience.
Index to Financial Statements
The Company hasWe have defined underwriting practices and procedures. If the coverage amount exceeds certain prescribed age and amount limits, the Companywe may require a prospective insured to submit evidence of insurability. Policies are typically issued, both at inception and renewal, with rate guarantees. For new group policyholders, the usual rate guarantee is one to three years. For group policies being renewed, the rate guarantee is generally one year, but may be longer. The profitability of the policy is dependent upondepends on the adequacy of the rate during the rate guarantee period. The contracts provide for certain circumstances in which the rate guarantees can be overridden.
Profitability of group long-term and short-term income protectiondisability insurance is affected by deviations of actual claims experience from expected claims experience, investment returns, persistency, and the abilitylevel of the Company to control its administrative expenses. Morbidity is an important factor in income protectiondisability claims experience. Also important is the general state of the economy; for example, during a recession the incidence of claims tends to increase under this type of insurance. In general, experience rated income protectiondisability coverage for large groups has narrower profit margins and represents less risk to the Companyus than business of this type sold to small employers because the Company mustwe bear all of the risk of adverse claims experience in small case fully-insured coverages while larger employers often bear much of this risk themselves. The CompanyWe routinely makesmake pricing adjustments, when contractually permitted, which take into account the emerging experience on itsour group insurance products.
Group Life and Accidental Death and Dismemberment
Group life and accidental death and dismemberment products contributed approximately 2824.0 percent of the U.S. BrokerageUnum US segment premium income in 2005.2008. Group life and accidental death and dismemberment products are sold to employers as employee benefit products. Group life consists primarily of renewable term life insurance with the coverages frequently linked to employees’ wages. Accidental death and dismemberment consists primarily of travel accident and other specialty risk products. Premiums are generally based on expected claims of a pool of similar risks plus provisions for administrative expenses and profit. Underwriting and rate guarantees are similar to those utilizedused for group income protectiondisability products.
Profitability of group life and accidental death and dismemberment productsinsurance is affected by deviations of actual claims experience from expected claims experience, investment returns, persistency, and the abilitylevel of the Company to control administrative expenses.
Individual Income ProtectionDisability – Recently Issued
Individual income protectiondisability – recently issued products generated approximately 89.5 percent of the U.S. BrokerageUnum US segment premium income in 2005.2008. Individual income protectiondisability is offered primarily to multi-life employer groups, but also on a single-life customer basis. Individual income protectiondisability insurance provides the insured with a portion of earned income lost as a result of sickness or injury. Under an individual income protectiondisability policy, monthly benefits generally are fixed at the time the policy is written. The benefits typically range from 30 percent to 75 percent of the insured’s monthly earned income. VariousWe provide various options with respect to length of benefit periods and waiting periods before payment begins are available and permitbenefit payments begin, which permits tailoring of the policy to a specific policyholder’s needs. The CompanyWe also marketsmarket individual income protectiondisability policies which include payments for the transfer of business ownership between partners and payments for business overhead expenses. Individual income protectiondisability products do not provide for the accumulation of cash values.
Premium rates for individual income protectiondisability products vary by age, gender, and occupation based on assumptions concerning morbidity, persistency, administrative expenses, and investment income. The Company develops itsWe develop our assumptions based on itsour own claims experience and published industry tables. The Company’sOur underwriters evaluate the medical and financial condition of prospective policyholders prior to the issuance of a policy. For larger multi-life groups, some underwriting requirements may be waived.
In 1994, the Company began introducing products that insured loss of earnings as opposed to occupations, and these products generally contained more limited benefit periods and longer waiting periods. In contrast to traditional noncancelable own-occupation policies, for which benefits are determined based on whether the insured can work in his or her original occupation, the loss of earnings policy requires the policyholder to satisfy two conditions for benefits to begin: reduced ability to work due to accident or sickness and earnings loss of at least 20 percent. These policies are aimed at repositioning the individual income protection product by making it more attractive to a broader market of individual consumers, including middle to upper income individuals and corporate benefit buyers.
The majority of the Company’s in-force individual income protection insurance which was written on a noncancelable basis is included in the Individual Income Protection – Closed Block segment. Under a noncancelable policy, as long as the insured continues to pay the fixed annual premium for the policy’s duration, the policy cannot be canceled by the Company nor can the premium be raised. As of December 31, 2005, premium income for noncancelable policies included in the Individual Income Protection – Recently Issued line of business represented approximately $359.0 million, or 84 percent, of premium income for that line of business.
The Company also offers lifelong income protection coverage for loss of income due to injury or sickness on a guaranteed renewable basis, with the right to re-price in-force policies subject to regulatory approval. Lifelong income protection coverage provides benefits and transitional support for moderate disabilities, with greater benefits for severe disabilities. Common options include additional coverage for catastrophic injury or illness and an option to convert to a long-term care policy at retirement age.
Since 1998, most individual income protection business written has been through multi-life workplace settings. The Company intends to maintain this focus on workplace customers and increased integration between individual and multi-life and group offerings.
Profitability of individual income protection productsdisability insurance is affected by persistency, investment returns, deviations of actual claims experience from expected claims experience, and the abilitylevel of the Company to control administrative expenses.
Group and Individual Long-term Care
Long-term care products generated approximately 911.7 percent of the U.S. BrokerageUnum US segment premium income in 2005.2008. Long-term care insurance is offered to employers for the benefit of employees and also sold to individuals on a single-life customer basis. During 2009, we will discontinue selling individual long-term care. Long-term care
Index to Financial Statements
insurance pays a benefit upon the loss of two or more “activitiesactivities of daily living” (e.g., bathing, dressing, feeding)living and the insured’s requirement of standby assistance or cognitive impairment. Payment is made on an indemnity basis, regardless of expenses incurred, up to a lifetime maximum. A reimbursement model payment option is also available for individual long-term care policies. Benefits begin after a waiting period, generally 90 days or less.
Premium rates for long-term care vary by age and gender and are based on assumptions concerning morbidity, mortality, persistency, administrative expenses, and investment income. The Company develops itsWe develop our assumptions based on itsour own claims experience and published industry tables. The Company’sOur underwriters evaluate the medical condition of prospective policyholders prior to the issuance of a policy. For larger groups, some underwriting requirements may be waived. Long-term care insurance is offered on a guaranteed renewable basis wherein the Company maintains the rightwhich allows us to re-price in-force policies, subject to regulatory approval.
Profitability is affected by deviations of actual claims experience from expected claims experience, investment returns, persistency, and the abilitylevel of the Company to control administrative expenses.
Voluntary Workplace Benefits
Voluntary workplace benefits products generated almost 7approximately 9.0 percent of the U.S. BrokerageUnum US segment premium income in 2005.2008. Voluntary workplace benefits products include individual universal life and interest-sensitive life, products, individual income protection products,disability, group and individual critical illness, and individual cancer products. These products are sold to groups of employees through payroll deduction at the workplace.
Premium rates for voluntary benefits products are based on assumptions concerning morbidity, mortality, persistency, administrative expenses, and investment income. The Company develops itsWe develop our assumptions based on itsour own claims experience and published industry tables. The Company’sOur underwriters evaluate the medical condition of prospective policyholders prior to the issuance of a policy. For larger groups with high participation rates, some underwriting requirements may be waived.
Voluntary benefits products other than life insurance are offered on a guaranteed renewable basis which allows us to re-price in-force policies, subject to regulatory approval.
Profitability of voluntary benefits products is affected by the level of employee participation, persistency, investment returns, deviations of actual claims experience from expected claims experience, and the abilitylevel of the Company to control administrative expenses.
Unum LimitedUK Segment
The Unum LimitedUK segment includes group long-term income protectiondisability insurance, group life products, and individual income protectiondisability products issued by Unum Limited and sold primarily in the United Kingdom through field sales personnel and independent brokers and consultants. Premium income for this segment totaled $785.3$889.3 million in 2005.
2008, or £478.6 million in local currency.
Group Long-term Income ProtectionDisability
Group long-term income protectiondisability products contributed approximately 7476.1 percent of the Unum LimitedUK segment premium income in 2005.2008. Group long-term income protectiondisability products are sold to employers for the benefit of employees. Group long-term income protectiondisability provides employees with insurance coverage for loss of income in the event of extended work absences due to sickness or injury. Services are offered to employers and insureds to encourage and facilitate rehabilitation, retraining, and re-employment. Most policies begin providing benefits following 90 or 180 day waiting periods and continue providing benefits until the employee reaches a certain age, generally between 60 and 65. The benefits are limited to specified maximums as a percentage of income.
Premiums for group long-term income protectiondisability are generally based on expected claims of a pool of similar risks plus provisions for administrative expenses and profit. Some cases carry experience rating provisions. Premiums for experience rated group long-term income protectiondisability business are based on the expected experience of the client given theirits industry group, adjusted for the credibility of the specific claim experience of the client.
The Company has
Index to Financial Statements
We have defined underwriting practices and procedures. If the coverage amount exceeds certain prescribed age and amount limits, the Companywe may require a prospective insured to submit evidence of insurability. Policies are typically issued, both at inception and renewal, with rate guarantees. In both cases the usual rate guarantee is two years. Guarantees of one year may be offered either at the request of the client or as required by the Companyus to manage risk. In a very limited number of circumstances guarantees of three years may be offered, but this will be at an additional cost. The profitability of the policy is dependent upon the adequacy of the rate during the rate guarantee period. The contracts provide for certain circumstances in which the rate guarantees can be overridden.
Profitability of group long-term income protectiondisability insurance is affected by deviations of actual claims experience from expected claims experience, investment returns, persistency, and the abilitylevel of the Company to control its administrative expenses. Morbidity is an important factor in income protectiondisability claims experience. Also important is the general state of the economy; for example, during a recession the incidence of claims tends to increase under this type of insurance.
Group Life
Group life products contributed approximately 2119.5 percent of the Unum LimitedUK segment premium income in 2005.2008. Group life products are sold to employers as employee benefit products. Group life consists primarily of renewable term life insurance with the coverages frequently linked to employees’ wages. Premiums for group life are generally based on expected claims of a pool of similar risks plus provisions for administrative expenses and profit. Underwriting and rate guarantees are similar to those utilized for group income protectionlong-term disability products.
Profitability forof group life is affected by deviations of actual claims experience from expected claims experience, investment returns, persistency, and the abilitylevel of the Company to control administrative expenses.
Individual Income ProtectionDisability
Individual income protectiondisability products generated approximately 54.4 percent of the Unum LimitedUK segment premium income in 2005.2008. Individual income protectiondisability is offered primarily to individual retail customers. Individual income protectiondisability insurance provides the insured with a portion of earned income lost as a result of sickness or injury. Under an individual income protectiondisability policy, monthly benefits generally are fixed at the time the policy is written. The benefits typically range from 30 percent to 50 percent of the insured’s monthly earned income. Various options with respect to length of benefit periods and waiting periods before payment begins are available and permit tailoring of the policy to a specific policyholder’s needs. The Company also markets individual income protection
policies which include payments for the transfer of business ownership between partners and payments for business overhead expenses. Individual income protectiondisability products do not provide for the accumulation of cash values.
Premium rates for individual income protectiondisability products vary by age, gender, and occupation based on assumptions concerning morbidity, persistency, administrative expenses, and investment income. The Company develops itsWe develop our assumptions based on itsour own claims experience and published industry tables. The Company’sOur underwriters evaluate the medical and financial condition of prospective policyholders prior to the issuance of a policy. For larger multi-life groups, some underwriting requirements may be waived.
The Company offers products that insure loss of earnings as well as those that insure occupations. In contrast to traditional noncancelable own-occupation policies, for which benefits are determined based on whether the insured can work in his or her original occupation, the loss of earnings policy requires the policyholder to satisfy two conditions for benefits to begin: reduced ability to work due to accident or sickness and earnings loss of at least 20 percent.
The Company also offers lifelong income protection coverage for loss of income due to injury or sickness on a guaranteed renewable basis, with the right to re-price in-force policies subject to regulatory approval. Lifelong income protection coverage provides benefits and transitional support for moderate disabilities, with greater benefits for severe disabilities. Common options include additional coverage for catastrophic injury or illness and an option to convert to a long-term care policy at retirement age.
Profitability of individual income protection productsdisability insurance is affected by persistency, investment returns, deviations of actual claims experience from expected claims experience, and the abilitylevel of the Company to control administrative expenses.
Colonial Life Segment
The Colonial Life segment includes insurance for income protectionaccident, sickness, and disability products, life products, and cancer and critical illness products issued primarily by Colonial Life & Accident Insurance Company and marketed to employees at the workplace through an agency sales force and brokers. Premium income for this segment totaled $787.0$977.3 million in 2005.2008.
Accident, Sickness, and Disability
The income protection products,accident, sickness, and disability product line, which generated approximately 6562.1 percent of the Colonial segmentLife premium income in 2005, consist2008, consists of short-term income protectiondisability plans as well as accident-only plans providing benefits for injuries on a specified loss basis andbasis. It also includes accident and health plans covering hospital admissions, confinement, and surgeries on an indemnity basis and group limited benefit medical plans which provide limited indemnity benefits for basic healthcare expenses.
Index to Financial Statements
Premiums for accident, sickness, and disability products are generally based on our experience for morbidity, mortality, persistency, and expenses. Premiums are primarily individual guaranteed renewable wherein we have the ability to change premiums on a state by state basis. The life products contributed approximately 14 percentA small percentage of the 2005 premium incomepolicies are written on a group basis wherein we retain the right to change premiums at the individual account level. We have defined underwriting practices and procedures for Colonialeach of our products. Most policies are issued on a simplified issue basis, based on answers to simple health and are primarily comprisedemployment questions. If the amount applied for exceeds certain levels, the applicant may be asked to answer additional health questions or submit to additional medical examinations.
Profitability is affected by the level of universal life, whole life,employee participation, persistency, claims experience, investment returns, and the level term life, and a small block of group term life policies.
Cancer and critical illness policies, which generated approximately 21 percent of the 2005 premium income for the Colonial segment, provide various benefits for the treatment of cancer including hospitalization, surgery, radiation, and chemotherapy and for critical illness, provide a lump-sum benefit on the occurrence of a covered critical illness event.
administrative expenses.
The accident and health products qualify as fringe benefits that can be purchased with pre-tax employee dollars as part of a flexible benefits program pursuant to Section 125 of the Internal Revenue Code. Flexible benefits programs assist employers in managing benefit and compensation packages and provide policyholders the ability to choose benefits that best meet their needs. Congress could change the laws to limit or eliminate fringe benefits available on a pre-tax basis, eliminating the Company’sour ability to continue marketing itsour products this way. However, the Company believes itswe believe our products provide value to itsour policyholders which will remain even if the tax advantages offered by flexible benefitbenefits programs are modified or eliminated.
Life
PremiumsGroup and individual life products contributed approximately 16.1 percent of the 2008 premium income for all products are based on Company experience for morbidity, mortality, persistency,Colonial Life and expenses where such experience is credible and appropriate. Premiums for the income protection, cancer, and critical illness products are primarily individual guaranteed renewable wherein the Company has the ability to change premiums oncomprised of universal life, whole life, level term life, and a state by state basis. A small percentageblock of the policies are written on a group basis wherein the Company retains the right to change premiums at the individual account level.term life policies. Premiums for the whole life and level term products are guaranteed for the life of the contract. Premiums for the universal life products are flexible and may vary at the
individual policyholder level. For the group term life product, the Company retainswe retain the right to change premiums at the account level based on the experience of the account.
Profitability is affected by the level of employee participation, persistency, claims experience, investment returns, and the level of administrative expenses.
The Company has defined underwriting practicesCancer and proceduresCritical Illness
Cancer and critical illness policies generated approximately 21.8 percent of the 2008 premium income for eachthe Colonial Life segment. Cancer policies provide various benefits for the treatment of its products. Mostcancer including hospitalization, surgery, radiation, and chemotherapy. Critical illness policies provide a lump-sum benefit on the occurrence of a covered critical illness event.
Premiums are issuedgenerally based on our experience for morbidity, mortality, persistency, and expenses. Premiums are primarily individual guaranteed renewable wherein we have the ability to change premiums on a simplified issue basis, based on answers to simple health and employment questions. If the amount applied for exceeds certain levels, the applicant may be asked to answer additional health questions or submit to additional medical examinations.
state by state basis.
Profitability of these products is affected by the level of employee participation, persistency, deviations of actual claims experience from expected claims experience, investment returns, and the abilitylevel of the Company to control administrative expenses.
Individual Income ProtectionDisability – Closed Block Segment
Generally, the insurance policies included in the Individual Income Protection -Disability – Closed Block segment are individual income protectiondisability insurance policies that were designed to be distributed to individuals in a non-workplace setting and that were written or assumed prior to the restructuring of the Company’sour individual income protectiondisability business. This restructuring principally occurred during the period from 1994 through 1998 and included changes in product offerings, pricing, distribution, and underwriting. During this period the Companywe gradually changed itsour distribution focus for individual income protectiondisability insurance to workplace distribution as opposed to individual setting distribution, resulting in many of these changes. A minimal amount of new business continued to be sold subsequent to these changes, but the Company ceasedwe stopped selling new policies in this segment at the beginning of 2004 other than update features contractually allowable on existing policies. Premium income for this segment totaled $952.3 million in 2008.
Index to Financial Statements
The majority of the policies included in this segment represent individual income protectiondisability insurance which was written on a noncancelable basis and issued or assumed by Unum America, Accident,Provident, and Paul Revere Life. Under a noncancelable policy, as long as the insured continues to pay the fixed annual premium for the policy’s duration, we cannot cancel the policy cannot be canceledor raise the premium.
Profitability is affected by persistency, investment returns, claims experience, and the Company nor can the premium be raised. Due to the noncancelable, fixed premium naturelevel of the policies marketed in the past, profitability of this part of the business is largely dependent upon achieving the pricing assumptions for morbidity, persistency, interest earned rates, and expense levels. Premium income for this segment totaled $1,011.7 million in 2005, with approximately 93 percent of the premium income attributable to noncancelable policies.administrative expenses.
The Company has in placeWe have reinsurance agreements which effectively provide approximately 60 percent reinsurance coverage for the Company’sour overall consolidated risk above a specified retention limit, which at December 31, 2005,2008, equaled approximately $8.0$7.8 billion. The maximum risk limit for the reinsurer grows to approximately $2.6$2.3 billion over time, after which any further losses, if any, will revert to the Company.
us.
Corporate and Other Segment
The Corporate and Other operating segment includes investment income on corporate assets not specifically allocated to a line of business, interest expense on corporate debt other than non-recourse debt, and certain other corporate income and expense not allocated to a line of business. The Corporate and Other segment also includes results from disability management services and U.S. Brokerage insuredcertain Unum US insurance products not actively marketed, (with the exception of the individual income protection products in the Individual Income Protection – Closed Block segment), including individual life and corporate-owned life insurance, reinsurance pools and management operations, group pension, health insurance, and individual annuities.
The disability management services line of business relates primarily to the results of GENEX Services, Inc. (GENEX), which was acquired in early 1997. GENEX provides specialized skills in disability case management and vocational rehabilitation to assist disabled claimants to return to work. GENEX provides a full range of disability management services, including workplace injury management, telephonic early intervention services for injured workers, medical case management, vocational rehabilitation, and disability cost analysis, to third party administrators, corporate clients, and insurance companies. Fee income for disability management services totaled $177.9 million in 2005.
Premium income for the insurance products in this segment totaled $2.6$1.4 million in 2005.2008. It is expected that revenue and income resulting from thethese insurance products will decline over time as these business lines wind down, and management expects to reinvest the capital supporting these lines of business in the future growth of the U.S. Brokerage, Unum Limited, and Colonial segments.
Corporate Segment
The Corporate segment consists of revenue earned on corporate assets, interest expense on corporate debt, and certain corporate income and expense not allocated to a line of business.
down.
Discontinued Operations
During the first quarter of 2007, we completed the sale of our wholly-owned subsidiary, GENEX Services, Inc. (GENEX), a leading workers’ compensation and medical cost containment services provider. Our growth strategy is focused on the development of our primary markets, and GENEX’s specialty role in case management and medical cost containment related to the workers’ compensation market was no longer consistent with our overall strategic direction.
During 2003, the Companywe entered into an agreement to sell itsour Canadian branch. The transaction closed April 30, 2004.
See “Selected Financial Data” contained herein in Item 6 and Note 2 of the “Notes to Consolidated Financial Statements” contained herein in Item 8 for further discussion of the Company’sinformation on our discontinued operations.
Reinsurance
In the normal course of business, the Company assumeswe assume reinsurance from and cedescede reinsurance to other insurance companies. In a reinsurance transaction a reinsurer agrees to indemnify another insurer for part or all of its liability under a policy or policies it has issued for an agreed upon premium. The primary purpose of ceded reinsurance is to limit losses from large exposures. However, if the assuming reinsurer is unable to meet its obligations, the Company remainswe remain contingently liable. The Company evaluatesWe evaluate the financial condition of reinsurers to whom it cedeswe cede business and monitorsmonitor concentration of credit risk to minimize thisour exposure. The CompanyWe may also require assets to be held in trust, letters of credit, or other acceptable collateral to support reinsurance receivablerecoverable balances.
In general, the maximum amount of risk retained by the Company’sour U.S. insurance subsidiaries and not ceded is $0.5$0.6 million on anyper covered life per policy under a group or individual life policy and $0.5 million onor a group andor individual accidental death and dismemberment insurance. Effective January 1, 2006, this retention level is $0.6 million for group life and accidental death and dismemberment policies.policy. For Unum Limited, the Company retains 50 percent of the risk and reinsures the other 50 percent on eachwe generally retain £1.0 million per covered life insured.per policy. The amount of risk retained by the Company on individual income protectiondisability products varies by policy type and year of issue. Other than catastrophic reinsurance coverage, the Company doeswe generally do not generally reinsure group or individual income protectiondisability policies issued subsequent to 1999.
The Company has
Index to Financial Statements
We have catastrophic reinsurance coverage which includes threefive layers of coverage to limit the Company’sour exposure under life, accidental death and dismemberment, long-term care, and income protectiondisability policies. In 2006, thisWe have 80 percent reinsurance coverage isin each of the first four layers and 60 percent coverage in the fifth layer for any accident involving seventeen, twenty-eight, and fifty-five or more lives for the three layers, respectively, in a single event. In total the three layers provide $110.0of $174.0 million of catastrophic reinsurance coverage, after a $20.0 million deductible. The Company has 100 percent reinsurance coverage in the first layer and 80 percent reinsurance coverage in the second and third layers. The first $30.0 million layer includes terrorism coverage other than that resulting from nuclear, biological, chemical, and chemicalnuclear terrorism, whereas the second, third, fourth, and thirdfifth layers each provide $40.0$50.0 million of coverage for all catastrophic events, including acts of war and any type of terrorism. The year 2005 catastrophic coverage was for any accident involving three, thirty, and sixty or more lives for the three layers, respectively, in a single event. In total, the three layers provided $100.0 million of catastrophic reinsurance coverage, after a $20.0 million deductible, and included coverage for all catastrophic events, including acts of war and any type of terrorism. Events may occur which limit or eliminate the availability of catastrophic reinsurance coverage in future years.
The reinsurance receivablerecoverable of $4,974.2 million at December 31, 20052008 relates to approximately 10088 companies. Thirteen major companies account for approximately 91 percent of the reinsurance receivablerecoverable at December 31, 2005,2008, and are all of these companies are rated A or better by A.M. Best Company (AM Best) or are fully securitized by letters of credit or investment-grade fixed maturity securities held in trust. Virtually all of the remaining nine percent of the reinsurance receivablerecoverable relates to business reinsured either with companies rated A- or better by A.M.AM Best, Company, with overseas entities with equivalent ratings or backed by letters of credit or trust agreements, or through reinsurance arrangements wherein the Company retainswe retain the assets in itsour general account. Less than one percent of the reinsurance receivablerecoverable is held by companies either rated below A- by A.M.AM Best Company or not rated.
The collectibility of our reinsurance receivablesrecoverable is primarily a function of the solvency of the individual reinsurers. Although the Company haswe have controls to minimize itsour exposure, the insolvency of a reinsurer or the inability or unwillingness of a reinsurer to comply with the terms of a reinsurance contract could have a material adverse effect on the Company’sour results of operations.
SeeFor further discussion of our reinsurance activities, refer to “Risk Factors” contained herein in Item 1A and Note 1312 of the “Notes to Consolidated Financial Statements” contained herein in Item 8 for further discussion of the Company’s reinsurance activities.
8.
Reserves
The applicable insurance laws under which insurance companies operate require that they report, as liabilities, policy reserves to meet future obligations on their outstanding policies. These reserves are the amounts which, with the additional premiums to be received and interest thereon compounded annually at certain assumed rates, are calculated to be sufficient to meet the various policy and contract obligations as they mature. These laws specify that the reserves shall not be less than reserves calculated using certain specified mortality and morbidity tables, interest rates, and methods of valuation.
The reserves reported in the Company’sour financial statements contained herein are calculated in conformity with U.S. generally accepted accounting principles (GAAP) and differ from those specified by the laws of the various states and carriedreported in the statutory financial statements of theour life insurance subsidiaries. These differences ariseresult from the use of mortality and morbidity tables and interest assumptions which we believe are believed to be more representative of the expected experience for these policies than those required for statutory accounting purposes and also result from differences in actuarial reserving methods.
The assumptions on whichwe use to calculate our reserves are based are intended to represent an estimationestimate of experience for the period that policy benefits are payable. If actual experience is not less favorable than theour reserve assumptions, then reserves should be adequate to provide for future benefits and expenses. If experience is less favorable than the reserve assumptions, additional reserves may be required. The key experience assumptions include disability claim incidence rates, disability claim recovery rates, mortality rates, policy persistency, and interest rates. The CompanyWe periodically reviews itsreview our experience and updates itsupdate our policy reserves for new issues and reserves for all claims incurred, as it believeswe believe appropriate.
The consolidated statements of operationsincome include the annual change in reserves for future policy and contract benefits. The change reflects a normal accretion for premium payments and interest buildup and decreases for policy terminations such as lapses, deaths, and benefit payments.
Index to Financial Statements
For further discussion of reserves, refer to “Risk Factors – Reserves”Factors” contained herein in Item 1A and to the critical accounting policies“Critical Accounting Estimates” and the discussion of segment operating results included in “Management’s Discussion and Analysis of Financial Condition and Results of Operations” contained herein in Item 7.
Investments
Investment activities are an integral part of the Company’sour business, and profitability is significantly affected by investment results. InvestedWe segment our invested assets are segmented into portfolios that support theour various product lines. Generally, theour investment strategy for theour portfolios is to match the effective asset cash flows and durations with related expected liability cash flows and durations to consistently meet the liability funding requirements of the Company’s business. The Company seeksour businesses. We try to maximize investment income and total return and to assume credit risk in a prudent and selective manner, subject to constraints of quality, liquidity, diversification, and regulatory considerations. The Company’sOur overall investment philosophy is to invest in a portfolio of high quality assets that provide investment returns consistent with that assumed in the pricing of itsour insurance products. Assets are invested predominately in fixed maturity securities, and the portfolio is matched with liabilities so as to eliminate as much as possible the Company’sour exposure to changes in the overall level of interest rates. Changes in interest rates may affect the amount and timing of cash flows.
The CompanyWe actively manages itsmanage our asset and liability cash flow match as well as itsand our asset and liability duration match in order to minimize interest rate risk. The CompanyWe may redistribute its investments within itsbetween our different lines of business, when necessary, to adjust the cash flow and/or duration of the asset portfolios to better match the cash flow and duration of the liability portfolios. Asset and liability portfolio modeling is updated on a quarterly basis and is used as part of the overall interest rate risk management strategy. Cash flows from the inforce asset and liability portfolios are projected at current interest rate levels and also at levels reflecting an increase and a decrease in interest rates to obtain a range of projected cash flows under the different interest rate scenarios. These results enable us to assess the impact of projected changes in cash flows and duration resulting from potential changes in interest rates. Testing the asset and liability portfolios under various interest rate scenarios enables the Companyus to choose the most appropriate investment strategy as well as to minimize the risk of disadvantageous outcomes. This analysis is a precursor to the Company’sour activities in derivative financial instruments, which are used to hedge interest rate risk and to match duration. The Company doesmanage duration match. We do not use derivatives for speculative purposes.
Refer to “Risk Factors – Investments”Factors” contained herein in Item 1A and the discussion of investments in “Management’s Discussion and Analysis of Financial Condition and Results of Operations” and Notes 4 and 5 of the “Notes to Consolidated Financial Statements” contained herein in Items 7 and 8, respectively, for information on the Company’sour investments and derivative financial instruments.
Ratings
A.M.AM Best, Company (AM Best), Fitch Ratings (Fitch), Moody’s Investors Service (Moody’s), and Standard & Poor’s Corporation (S&P) are among the third parties that rateassign issuer credit ratings to Unum Group and financial strength ratings to our insurance subsidiaries. Issuer credit ratings reflect an agency’s opinion of the Company’soverall financial capacity of a company to meet its senior debt and the financial strength of the Company’s principal U.S. insurance subsidiaries.obligations. Financial strength ratings are based primarily on U.S. statutory financial information for thespecific to each individual U.S. domiciled insurance companiessubsidiary and reflect theeach rating agency’s view of the overall financial strength (capital levels, earnings, growth, investments, business mix, operating performance, and market position) of that insuring entity and its ability to meet its obligations to policyholders. DebtBoth the issuer credit ratings represent the opinions of the rating agencies regarding an issuer’s ability to repay its debt and are based primarily on consolidated financial information prepared using generally accepted accounting principles. Both financial strength ratings incorporate quantitative and debt ratings incorporate qualitative analyses by rating agencies and are routinely reviewed and updated on an ongoing basis.
Rating agencies assign an outlook statement of “positive,” “negative,” or “developing” to indicate an intermediate-term trend in credit fundamentals which could lead to a rating change. “Positive” means that a rating may be raised, “negative” means that a rating may be lowered, and “developing” means that a rating may be raised or lowered with equal probability. Alternatively, a rating may have a “stable” outlook to indicate that the rating is not expected to change.
“Credit watch” or “under review” highlights the potential direction of a short-term or long-term rating. It focuses on identifiable events and short-term trends that cause a rating to be placed under heightened surveillance by thea rating agency. These eventsEvents that may trigger this action include mergers, acquisitions, recapitalizations, or anticipated operating developments. Ratings may be placed on credit watch or under review when an event or a change in an expected
Index to Financial Statements
trend occurs and additional information is needed to evaluate the current rating level. This status does not mean that a rating change is inevitable, and ratings may change without first being placed on a watch list.
The Company’sOur financial strength ratings as of February 20062009 for itsour principal U.S. domiciled insurance company subsidiaries were:
A- (Excellent) by AM Best – 4th of 15 rankings
The senior debtOur issuer credit ratings for the Company as of February 20062009 were:
bbb- (Adequate)(Good) by AM Best – 10th of 22 rankings
BBB- (Good) by S&P – 11th10th of 22 rankings
TheAt present, our ratings from FitchAM Best, Moody’s, and S&P have a stable“stable” outlook, and the ratingsour rating from Moody’s and AM Best haveFitch has a negative“positive” outlook. None of the ratings are currently under review or on credit watch. See further discussion in “Risk Factors – Debt and Financial Strength Ratings”Factors” contained herein in Item 1A and in “Management’s Discussion and Analysis of Financial Condition and Results of Operations”Operations – Ratings” contained herein in Item 7.
A rating is not a recommendation to buy, sell, or hold securities and may be subject to revision or withdrawal at any time by the rating agency. Each rating should be evaluated independently of any other rating.
Competition
There is intense competition among insurance companies for the types of products sold by the Company. The Company believeswe sell. We believe that the principal competitive factors affecting itsour business are integrated product choices, price, quality of customer service and claims management, financial strength, and claims-paying ratings. In the individual and group income protectiondisability markets, the Company competeswe compete in the United States with a limited number of major companies and regionally with other companies offering specialty products. The Company’sOur principal competitors for itsour other products, including group life and long-term care as well as itsthe product offerings sold to groups of employees through payroll deduction, include the largest insurance companies in the United States. Some of these
companies have more competitive pricing or have higher claims-paying ratings. Some may also have greater financial resources with which to compete.
In the United Kingdom, the Company competeswe compete for individual and group products with a number of large internationally recognized providers. The life insurance market continues to go through a restructuring phase which has led to opportunities for both the strong specialist supplier and also the new organizations that have recently been established to handle the run-off of closed business.businesses. Current penetration levels indicate that there is still significant upside growth potential in the United Kingdom for the types of products offered by the Company.
we offer.
All areas of the employee benefits markets are highly competitive due to the yearly renewable term nature of the products and the large number of insurance companies offering products in this market. There is a risk that purchasers of employee benefits products may be able to obtain more favorable terms from competitors in lieu of renewing coverage with the Company.us. The effect of competition may, as a result, adversely affect the persistency of these and other products, as well as the Company’sour ability to sell products in the future.
The CompanyWe must attract and retain independent agents and brokers to actively market itsour products. Strong competition exists among insurers for agents and brokers. The Company competesWe compete with other insurers for sales agents and brokers primarily on the basis of itsour product offerings, financial strength, support services, and compensation. Sales of the Company’sour products could be materially adversely affected if it iswe are unsuccessful in attracting and retaining agents and brokers.
Index to Financial Statements
Regulation
General
The Company’sOur U.S. insurance subsidiaries are subject to comprehensive regulation and oversight by insurance departments in jurisdictions in which they do business and by the U.S. Department of Labor on a national basis, primarily for the protection of policyholders. Unum Limited is subject to regulation by the Financial Services Authority (FSA) in the U.K. The FSAstate insurance departments in the United States and the U.S. insurance departmentsFSA in the U.K. have broad administrative powers with respect to all aspects of the insurance business and, in particular, monitor the manner in which an insurance company offers, sells, and administers its products. This monitoring may include reviewing sales practices, including the content and use of advertising materials and the licensing and appointing of producers,agents and brokers, as well as underwriting, claims, and customer service practices. The U.S. Department of Labor (DOL) enforces a comprehensive federal statute which regulates claims paying fiduciary responsibilities and reporting and disclosure requirements for most employee benefit plans. The Company’sOur domestic insurance subsidiaries must meet the standards and tests for investments imposed by state insurance laws and regulations of the jurisdictions in which they are domiciled. Domestic insurance subsidiaries operate under insurance laws which require they establish and carry, as liabilities, statutory reserves to meet policyholder obligations. These reserves are verified periodically by various regulators. The Company’sOur domestic insurance subsidiaries are examined periodically by examiners from their states of domicile and by other states in which they are licensed to conduct business. The domestic examinations have traditionally emphasized financial matters from the perspective of protection of policyholders, but they can coverand have covered other subjects that an examining state may be interested in reviewing, such as market conduct issues. Other states more typically perform market conduct examinations that include a review of a company’s sales practices, including advertising and licensing of producers,agents and brokers, as well as underwriting, claims, and customer service practices to determine compliance with state laws.
Examinations and Investigations
Claim Related
In NovemberDuring 2004 and 2005, certain of the Company’sour insurance subsidiaries entered into settlement agreements with state insurancevarious regulators upon conclusion of a multistate market conduct examination led by Maine, Massachusetts, and Tennessee relatingrelated to disability claims handling practices. A total of 48 states and the District of Columbia were parties to the settlementThe agreements which provide for changes in certain of our claims handling procedures and a claim reassessment process available to certain claimants whose claims were denied or closed during certain periodsspecified periods. During 2007, we completed the claim reassessment process required by the 2004 and who choose2005 regulatory settlement agreements. The lead regulators conducted a final examination and presented their findings to participate, changesUnum Group’s board of directors and management in governance to increase oversightApril 2008. The report of the claims handling and reassessment process, and contingent fines for non-compliance. In addition, the U.S. Department of Labor (DOL), which had been conducting an inquiry relating to certain Employee Retirement Income Security Act (ERISA) plans, was a
party to the settlement agreements,multistate market conduct examination and the Officereport of the New York Attorney General (NYAG), which had engaged in its own investigation of the Company’s claims handling practices, notified the Company that it was in support of the settlement and was, therefore, closing its investigation on this issue.
In October 2005, certain of the Company’s insurance subsidiaries entered into a settlement agreement with the California Department of Insurance (DOI), concluding a market conduct examination and investigationprovided that we satisfactorily complied with each of the subsidiaries’ disability claims handling practices. The California DOI had chosen notagreements’ mandates and that no fines would be assessed. We continue to join the 2004 multistate settlement agreements. As partwork closely with our regulators and also continue to work toward resolution of the settlement with the California DOI, the Company paid a civil penalty of $8.0 millionother outstanding legal and agreed to change certain practices and policy provisions related to its California business. The settlement also incorporates claims handling practices previously covered by the multistate settlement agreements and includes certain additional claim handling changes.
In entering the settlement, the Company did not agree with the allegations and characterization of the Company’s past claims handling practices made by the California DOI. During the past two years, the Company has undertaken broad changes designed to improve the quality of claims decisions and its service levels to policyholders, including changes made as a result of the multistate settlement agreements. Because of this, the Company does not believe that the California DOI’s allegations or its market conduct examination report provide an accurate portrayal of the Company’s claim practices today.
Under the terms of the settlement, the Company will change certain provisions specific to California disability policies. Additionally as part of the settlement, the Company received approval from the California DOI for the use of new individual and group disability policy forms, which became available for sale on November 1, 2005.
The California settlement also incorporates the claim reassessment process contained in the 2004 multistate settlement agreements. California claimants were included in the 2004 multistate settlement agreements and could choose to participate in that claim reassessment process even though California did not join the multistate settlement agreements. Under the California agreement, reassessment notices are being mailed to approximately 26,000 individuals whose claims were denied or terminated between January 1, 1997, and September 30, 2005. Many of these individuals had already received reassessment notices under the multistate settlement agreements. Additionally, as part of the California agreement, an individual whose claim denial or termination is upheld by the Company’s reassessment unit may request an independent review by a member of a panel established for that purpose. Following such review, the final decision on the claim is that of the Company’s reassessment unit; however, if there is information that the reviewer believes is appropriate relating to the handling of the claim, the reviewer may add a report to the claim file.
The Company has amended the multistate settlement agreements to include mailing a notice of eligibility to participate in the claim reassessment process to approximately 29,500 individuals whose claims were denied or terminated between January 1, 1997, and December 31, 1999. Under the original multistate settlement agreements, claimants during this period could request participation in the reassessment process, but they were not sent a notice. Those claimants who are eligible to participate but do not receive notice pursuant to the amendment remain eligible to request participation until June 30, 2006.
Separately, the Company is offering to reassess private label, acquired, and reinsured block claims, as well as claims administered on behalf of certain employers from January 1, 1997, through January 18, 2005 (and through September 30, 2005 for California residents). These approximately 24,000 claims were not included in the 2004 multistate settlement agreements, but the offer being made generally follows the reassessment procedures contained in those agreements.
regulatory issues.
See further discussion under “Management’s Discussion and Analysis of Financial Condition and Results of Operations” and Note 15 of the “Notes to Consolidated Financial Statements” contained herein in Items 7 and 8, respectively.
Item 7.
Broker Compensation, Quoting Process, and RelatedOther Matters
Beginning in 2004, several of the Company’sour insurance subsidiaries’ insurance regulators requested information relating to the subsidiaries’ policies and practices on one or more aspects of broker compensation, quoting insurance business, and related matters. Additionally, the Company haswe have responded to investigations about certain of these
same matters by state attorneys general and the U.S. Department of Labor.DOL. Following highly publicized litigation involving the alleged practices of a major insurance broker, the National Association of Insurance Commissioners (NAIC) has undertaken to provide a uniform Compensation Disclosure Amendment to the Producer Licensing Model Act that can be adopted by states in an effort to provide uniform guidance to insurers, brokers, and customers relating to disclosure of broker compensation. The Company expectsWe expect there to be continued uncertainty surrounding this matter until clearer regulatory guidelines are established.
Index to Financial Statements
In June 2004, the Companywe received a subpoena from the NYAGOffice of the New York Attorney General (NYAG) requesting documents and information relating to compensation arrangements between insurance brokers or intermediaries and the Company and its subsidiaries. The Company has received additional subpoenas or requests for additional information fromour companies. In November 2006, we entered into a settlement agreement with the NYAG concerning its relations with insurance brokers. The NYAG has filed several lawsuits against brokers arising out of its investigation. Several insurers were cited in the complaints but not named as defendants — one such complaint cited the Company but did not name it asform of an assurance of discontinuance that provided for a defendant. The Company is cooperating with the NYAG’s investigations and inquiries.
national restitution fund of $15.5 million, which we expect will be fully dispensed by March 2009.
Since October 2004, the Companywe and/or itsour insurance subsidiaries have received subpoenas or information requests from the Office of the NYAG, a Federal Grand Jury in San Diego, the District Attorney for the County of San Diego, insurance departments, and/or other state regulatory or investigatory agencies of at least eight additionalseven states including California, Connecticut, Florida, Maine, Massachusetts, North Carolina, Oklahoma,South Carolina, and South Carolina.Tennessee. The subpoenas andand/or information requests sought information regarding,relate to, among other things, compliance with the Employee Retirement Income Security Act (ERISA) relating to our interactions with insurance brokers and to regulations concerning insurance information provided by us to plan administrators of ERISA plans, as well as compliance with state and federal laws with respect to quoting processes, producer compensation, solicitation activities, policies sold to state or municipal entities, and information regarding compensation arrangements with brokers, particularly with regard to Universal Life Resources, Inc. The Company is cooperatingbrokers.
We have cooperated fully with all investigations and will continue to do so. However, due to a prolonged period of inactivity, we consider these investigations.
The Company also has had discussions with the DOL regarding compliance with ERISA, relating to the Company’s interactions with insurance brokers and to regulations concerning insurance information provided by the Company to plan administrators of ERISA plans, including specifically the reporting of fees and commissions paid to agents, brokers, and others in accordance with the requirements of Schedule A of Form 5500. The DOL is pursuing an investigation of the Company concerning these issues, both generally and specifically in connection with certain brokers, including Universal Life Resources. The Company is cooperating with the DOL’s investigation.
In addition to various regulatory agencies investigating issues relating to broker compensation and quoting practices, the Company has been named as a defendant, along with other insurers, in litigation brought by regulatory agencies or private parties in putative class actions making allegations arising out of broker compensation arrangements or quoting practices.
Beginning in March 2005, several of the Company’s insurance subsidiaries received requests from various regulatory agencies seeking information relating to finite reinsurance and whether there are any ancillary or verbal side agreements that affect the potential loss under the terms of the reinsurance agreement. Additionally, the requests seek information on such matters as the Company’s use of finite reinsurance, controls relating to proper accounting treatment, and maintenance of underwriting files on the reinsurance agreements. The Company has responded to the earlier requests and is in the process of responding to the more recent requests.
state investigations dormant.
See further discussion under “Management’s Discussion and Analysis of Financial Condition and Results of Operations” and Note 1514 of the “Notes to Consolidated Financial Statements” contained herein in Items 7 and 8, respectively.
Capital Requirements
Risk-based capital (RBC) standards for U.S. life insurance companies have been prescribed by the NAIC. The domiciliary states of the Company’sour U.S. insurance subsidiaries have all adopted a version of the RBC model formula of the NAIC, which prescribes a system for assessing the adequacy of statutory capital and surplus for all life and health insurers. The basis of the system is a risk-based formula that applies prescribed factors to the various risk elements in a life and health insurer’s business to report a minimum capital requirement proportional to the amount of risk assumed by the insurer. The life and health RBC formula is designed to measure annually (i) the risk of loss from asset defaults and asset value fluctuations, (ii) the risk of loss from adverse mortality and morbidity experience, (iii) the risk of loss from mismatching of asset and liability cash flow due to changing interest rates, and (iv)
business risks. The formula is to be used as an early warning tool to identify companies that are potentially inadequately capitalized. The formula is intended to be used as a regulatory tool only and is not intended as a means to rank insurers generally. Unum Limited is subject to regulation, including capital adequacy requirements and minimum solvency margins, by the FSA in the U.K. See further discussion in “Risk Factors – Capital Adequacy”Factors” contained hereherein in Item 1A and “Liquidity and Capital Resources” contained herein in Item 7.
Insurance Holding Company Regulation
The insurance holding company laws and regulations of the states of Maine, Massachusetts, Tennessee, South Carolina, New York, Vermont, and California require the registration of and periodic reporting of financial and other information about operations, including inter-company transactions within the system, by insurance companies domiciled within their jurisdiction which control or are controlled by other corporations or persons so as to constitute an insurance holding company system.
The CompanyUnum Group is registered under such laws as an insurance holding company system in Maine, Massachusetts, Tennessee, South Carolina, New York, Vermont, and California. Most states, including the states in which the Company’sour insurance subsidiaries are domiciled, have laws and regulations that require regulatory approval of a change in control of an insurer or an insurer’s holding company. Where such laws and regulations apply to the CompanyUnum Group and its insurance subsidiaries, there can be no effective change in control of the CompanyUnum Group unless the person seeking to acquire control has filed a statement with specified information with the insurance regulators and has obtained prior approval for the proposed change from such regulators. The usual measure for a presumptive change of control pursuant to these laws is the acquisition of 10 percent or more of the voting stock of an insurance company or its parent, although this presumption is rebuttable. Consequently, a person acquiring 10 percent or more of the voting stock of an insurance company or its parent without the prior approval of the insurance regulators in the states in
Index to Financial Statements
which the Company and itscompany’s insurance subsidiaries are domiciled or deemed to be domiciled will be in violation of these laws. Such a person may also be subject to one or more of the following actions: (i) injunctive action requiring the disposition or seizure of those securities by the applicable insurance regulator; (ii) prohibition of voting of such shares; and, (iii) other actions determined by the relevant insurance regulator. Further, many states’ insurance laws require prior notification ofto state insurance regulators of a change of control of a non-domiciled insurance company doing business in that state. These pre-notification statutes do not authorize the state insurance regulators to disapprove the change in control; however, they do authorize regulatory action in the affected state if particular conditions exist such as undue market concentration. Any future transactions that would constitute a change in control of the CompanyUnum Group may require prior notification in those states that have adopted pre-notification laws.
These laws may discourage potential acquisition proposals and may delay, deter, or prevent a change in control of the Company,Unum Group, including through transactions, and in particular unsolicited transactions, that some or all of the stockholders of the CompanyUnum Group might consider to be desirable.
In addition, such laws and regulations restrict the amount of dividends that may be paid by the Company’sour insurance subsidiaries to the Company.their respective stockholders, including Unum Group and certain of its intermediate holding company subsidiaries and/or finance subsidiaries. See further discussion in “Risk Factors – Dividend Restrictions”Factors” contained herein in Item 1A and “Liquidity and Capital Resources – Cash Available from Subsidiaries” contained herein in Item 7.
The CompanyUnum Group may also from time to time be subject to regulation under applicable regulations and reporting requirements in the foreign jurisdictions in which it or its affiliates do business or have done business, including the United Kingdom, Canada, Bermuda, Japan, and Argentina.
business.
Federal Laws and Regulations
The USA PATRIOT Act of 2001 (Patriot Act), enacted in response to the terrorist attack on September 11, 2001, contains anti-money laundering and financial transparency laws and mandates the implementation of various new regulations applicable to broker-dealers and other financial services companies, including insurance companies. The Patriot Act seeks to promote cooperation among financial institutions, regulators and law enforcement entities in identifying parties that may be involved in terrorism or money laundering. Anti-money laundering laws outside of the United States contain some similar provisions. The increased obligations of financial institutions to identify their customers, watch for and report suspicious transactions, respond to requests for information by regulatory authorities and law enforcement agencies, and share information with other financial institutions, require the implementation and maintenance of internal practices, procedures, and controls.
For further discussion of regulation, refer to “Risk Factors – Regulation”Factors” contained herein in Item 1A.
Geographic Areas
Segment operating revenue, which excludes net realized investment gains and losses, attributable to the Unum Limited segment, the Company’s United Kingdom subsidiary,for our U.K. operations totaled $945.6$1,086.1 million, $801.8$1,171.8 million, and $593.4$1,017.5 million for 2005, 2004,2008, 2007, and 2003,2006, respectively. Unum Limited’s operating revenue in 2005 equaledThese amounts were approximately 910.4 percent, 11.1 percent, and 9.7 percent of total segment operating revenue.revenue for 2008, 2007, and 2006, respectively. Total assets and total liabilities, as of December 31, 2005,2008, were $3.3$2.9 billion and $2.6$2.1 billion, respectively, for Unum Limited.our U.K. operations. Fluctuations in the U.S. dollar relative to the local currency of this subsidiaryour U.K. operations will impact our reported operating resultsresults. See “Risk Factors” contained herein in Item 1A for the Company. Seefurther discussion of fluctuations in foreign currency exchange rates and “Management’s Discussion and Analysis of Financial Condition and Results of Operations” contained herein in Item 7 and Note 1413 of the “Notes to Consolidated Financial Statements” contained herein in Item 8 for further discussion of Unum Limited’sUK’s operating results.
Employees
At December 31, 2005, the Company2008, we had approximately 11,3009,800 full-time employees.
Index to Financial Statements
Available Information
The Company’sOur internet website address is www.unumprovident.com. The Company has adopted corporate governance guidelines, a code of business practices and ethics, and charters for its board of directors’ audit, compensation, governance, finance, and regulatory compliance committees in accordance with NYSE requirements. These documents are available free of charge on the website and in print at the request of any stockholder from the Office of the Corporate Secretary, 1 Fountain Square, Chattanooga, Tennessee, 37402, or by calling toll-free 1-800-718-8824.
The Company also makeswww.unum.com. We make available, free of charge, on or through itsour website itsour Annual Report on Form 10-K, Quarterly Reports on Form 10-Q, Current Reports on Form 8-K, and amendments to those reports filed or furnished pursuant to Section 13(a) or 15(d) of the Exchange Act as soon as reasonably practicable after filing such material with the Securities and Exchange Commission.
Executive Officers of the Registrant
Our executive officers, all of whom are also executive officers of certain of our principal subsidiaries, were appointed by Unum Group’s board of directors to serve until their successors are chosen and qualified or until their earlier resignation or removal.
| Age |
| |||
Thomas R. Watjen | 54 | President and Chief Executive Officer and a Director | ||
Robert O. Best | 59 | Executive Vice President, Chief Operating Officer Unum US | ||
Liston Bishop III | 62 | Executive Vice President and General Counsel | ||
Robert C. Greving * | 57 | Executive Vice President, Chief Financial Officer and Chief Actuary | ||
Randall C. Horn | 56 | Executive Vice President, President and Chief Executive Officer, Colonial Life | ||
Kevin P. McCarthy | 53 | Executive Vice President, President and Chief Executive Officer, Unum US | ||
Susan L. Ring | 48 | Executive Vice President, President and Chief Executive Officer, Unum UK | ||
* Mr. Greving has announced his intention to retire from the Company during 2009.
Set forthMr. Watjen became President and Chief Executive Officer in March 2003. He served as Vice Chairman and Chief Operating Officer from May 2002 until March 2003. He became Executive Vice President, Finance in June 1999 and assumed the additional Risk Management responsibilities in November 1999. Mr. Watjen originally joined a Unum Group predecessor company as Executive Vice President and Chief Financial Officer in 1994.
Mr. Best became Executive Vice President, Chief Operating Officer Unum US in January 2007. Prior to that, he served as Executive Vice President, Service Operations and Chief Information Officer from January 2006. Prior to that time, he served as Executive Vice President, The Client Services Center, and Chief Information Officer from May 2003. He served as Senior Vice President, Customer Loyalty Services, and Chief Information Officer from March 2000 until May 2003. Mr. Best originally joined a Unum Group predecessor company as Senior Vice President and Chief Information Officer in 1994.
Mr. Bishop became Executive Vice President and General Counsel in October 2008. Prior to this appointment, he served as Interim General Counsel beginning in April 2008. From August 1979 through September 2008, Mr. Bishop practiced corporate and securities law with the law firm of Miller & Martin PLLC, except during the period from January 2005 through July 2007 when he was employed as deputy general counsel and corporate secretary of Coca-Cola Enterprises Inc.
Mr. Greving was named Executive Vice President and Chief Financial Officer in May 2003 and appointed Chief Actuary in August 2005. He served as Senior Vice President and Chief Financial Officer from May 2002 until May 2003. Prior to that time, he served as Senior Vice President, Finance from August 2000. Mr. Greving originally joined a Unum Group predecessor company as Senior Vice President and Chief Actuary in April 1997.
Mr. Horn was named Executive Vice President, President and Chief Executive Officer, Colonial Life in May 2007. Prior to that, he served as Executive Vice President, President and Chief Executive Officer of Colonial Life & Accident Insurance Company from March 2004. Before joining the Company, he served as Executive Vice President of Mutual of Omaha Insurance Company from September 1981 until September 2003.
Index to Financial Statements
Mr. McCarthy was named Executive Vice President, President and Chief Executive Officer, Unum US in May 2007. He previously served as Executive Vice President, President, Unum US from January 2007. Prior to that, he served as Executive Vice President, Risk Operations from January 2006. He previously served as Executive Vice President, Underwriting from May 2003. He served as Senior Vice President, Underwriting from November 2001 until May 2003 and as Senior Vice President, Marketing, Product Development, and International from December 1999 until November 2001. Mr. McCarthy originally joined a Unum Group predecessor company in 1976.
Ms. Ring was named Executive Vice President, President and Chief Executive Officer, Unum UK in May 2007. She previously served as Executive Vice President, Chairman and Managing Director, Unum Limited from May 2006. She served as Chairman and Managing Director of Unum Limited from December 2002 until November 2006. She served as Operations Director from 1999 until 2002 and prior to that time was Director of Risk Management. Ms. Ring joined Unum Limited as Director of Customer Services in 1995.
Index to Financial Statements
We face a wide range of risks, and our continued success depends on our ability to identify and appropriately manage our risk exposures. Discussed below are certain factors that may adversely affect the Company’sour business, financial condition, or results of operations.operations, or financial condition. Any one or more of the following factors may cause the Company’sour actual results for various financial reporting periods to differ materially from those expressed in any forward looking statements made by or on behalf of the Company.Company, including those in this document or made by us elsewhere, such as in earnings release investor calls, investor conference presentations, or press releases. The risks and uncertainties described herein may not be the only ones we face. Additional risks and uncertainties not presently known to us or that we currently believe to be immaterial may also adversely affect our business. See “Cautionary Statement Regarding Forward-Looking Statements” contained herein on page 1.
Regulation
The Company’s U.S. insurance subsidiaries are subjectgeneral outlook for corporate bond defaults in 2009 is high relative to extensive supervision and regulation. The regulations may affect the costhistorical levels. Defaults in our fixed maturity securities, mortgage loan, or demand for the Company’s products and may hinder the Company from taking desired actions to increase its profitability. The Company’s insurance company subsidiaries may not be able to obtain or maintain necessary licenses, permits, authorizations, or accreditations, or may be able to do so only at great cost. In addition, the Company may not be able to comply fully with, or obtain appropriate exemptions from, the wide variety of laws and regulations applicable to insurance companies and insurance holding companies. Failure to comply with or to obtain appropriate exemptions under any applicable laws could result in restrictions on the Company’s ability to do business in one or more of the jurisdictions in which it operates and could result in fines and other sanctions, which could have a material adverse effect on the Company’s business.
Congress, as well as foreign, state, and local governments, could enact legislation related to changes in tax laws that could increase the Company’s tax costs or affect the desirability of the Company’s products by consumers.
ERISA was passed by Congress in 1974. One of the purposes of ERISA was to reserve for federal authority the sole power to regulate the field of employee benefits. ERISA eliminated the threat of conflicting or inconsistent state and local regulation of employee benefit plans. In doing so, ERISA pre-empted all state laws except those that specifically regulated the business of insurance. ERISA also provides an exclusive remedial scheme for any action brought by ERISA plan participants and beneficiaries. ERISA has allowed plan administrators and plan fiduciaries to efficiently manage employee benefit plans in the United States. Most group long-term and short-term income protection plans administered by the Company are governed by ERISA. Changes to ERISA enacted by Congress or via judicial interpretations couldinvestment portfolios will adversely affect the risk of managing employee benefit plans, increase the premiums associated with such plans, and ultimately affect their affordability.
Unum Limited is subject to regulation by the FSA in the U.K. These laws and regulations generally grant supervisory agencies and self-regulatory organizations broad administrative powers, including the power to limit or restrict Unum Limited from doing business in the event that it fails to comply with such laws and regulations.
Many regulatory and governmental bodies have the authority to review the Company’s products and business practices and those of its agents and employees. These regulatory or governmental bodies may bring regulatory or other legal actions against the Company if, in their view, the Company’s practices are improper. These actions can result in substantial fines or restrictions on the Company’s business activities and could have a material adverse effect on the Company’s business or results of operations.
During 2002 and 2003, the Company experienced increased market conduct examinations focused specifically on its disability claims handling policies and practices. These examinations by state insurance departments have generally involved a review of complaints from policyholders or insureds on a range of subjects and a review of disability claim files and associated materials from group long-term and individual income protection product lines. Because of the number of market conduct examinations initiated during 2002 and 2003, a coordinated multistate market conduct examination of the Company’s disability claims handling practices was organized during 2003 by Maine, Massachusetts, and Tennessee, the states of domicile for several of the Company’s insurance subsidiaries. In November 2004, certain of the Company’s insurance subsidiaries entered into settlement agreements with state insurance regulators upon conclusion of a multistate market conduct examination led by Maine, Massachusetts, and Tennessee relating to disability claims handling practices. A total of 48 states and the District of Columbia were parties to the settlement agreements. In addition, the U.S. Department of Labor, which had been conducting an inquiry relating to certain ERISA plans, was a party to the settlement agreements, and the Office of the NYAG, which had engaged in its own investigation of the Company’s claims handling practices, notified the Company that it was in support of the settlement and was, therefore, closing its investigation on this issue. In October 2005, certain
of the Company’s insurance subsidiaries entered into a settlement agreement with the California DOI, concluding a market conduct examination and investigation of the subsidiaries’ disability claims handling practices. The California DOI had chosen not to join the 2004 multistate settlement agreements. See previous discussion under “Regulation – Examinations and Investigations” contained herein in Item 1, “Management’s Discussion and Analysis of Financial Condition and Results of Operations” contained herein in Item 7, and Note 15 of the “Notes to Consolidated Financial Statements” contained herein in Items 8 for additional information concerning these settlement agreements and other regulatory examinations and investigations.
The 2004 multistate regulatory settlement agreements and the 2005 California DOI settlement agreement resulted in changes in the Company’s claim handling practices and a process for reassessing certain claims to determine whether the earlier claim decision was properly decided. Failure to meet the requirements of these settlement agreements could result in a substantial fine. These and other regulatory examinations or investigations could result in, among other things, changes in business practices, including changes in broker compensation and related disclosure practices, changes in the use and oversight of finite reinsurance, changes in governance and other oversight procedures, fines, and other administrative action. Such results, singly or in combination, could injure the Company’s reputation, cause negative publicity, adversely affect the Company’s debt and financial strength ratings, place the Company at a competitive disadvantage in marketing or administering its products, or impair the Company’s ability to sell or retain insurance policies, thereby adversely affecting the Company’s business, and potentially materially adversely affecting theour results of operations in a period, depending on the results of operations of the Company for the particular period. Determination by regulatory authorities that the Company or its insurance subsidiaries have engaged in improper conduct could also adversely affect the Company’s defense of various lawsuits.
Reservesand financial condition.
Reserves, whether calculated under GAAP or statutory accounting principles, do not representInvestments are an exact calculation of future benefit liabilities but are instead estimates made by the Company using actuarial and statistical procedures. There can be no assurance that any such reserves will be sufficient to fund future liabilities of the Company in all circumstances. Future loss development could require reserves to be increased, which would adversely affect earnings in current and future periods. Adjustments to reserve amounts may be required in the event of changes from the assumptions regarding future morbidity (the incidence of claims and the rate of recovery, including the effects thereon of inflation and other societal and economic factors), persistency, mortality, and interest rates used in calculating the reserve amounts.
Debt and Financial Strength Ratings
The Company competes based in part on the financial strength ratings provided by rating agencies. The downgrade of the financial strength ratings could adversely affect the Company by, among other things, adversely affecting relationships with distributors of its products and services and retention of its sales force, negatively impacting persistency and new sales, and generally adversely affecting its ability to compete. Changes in the Company’s debt ratings could have an effect on the Company’s ability to raise capital and its cost of capital.
See “Ratings” contained herein in Item 1 and in “Management’s Discussion and Analysis of Financial Condition and Results of Operations” contained herein in Item 7 for further discussion of the Company’s ratings from these agencies.
Litigation
The Company and/or its subsidiaries’ directors and officers have been sued in over 20 purported class action and stockholder derivative lawsuits. These lawsuits are in a very preliminary stage, the outcome is uncertain, and the Company is unable to estimate a range of reasonably possible losses. Reserves have not been established for these matters. An adverse outcome in one or more of these actions could, depending on the nature, scope, and amount of the ruling, materially adversely affect the Company’s results of operations, encourage other litigation, and limit the Company’s ability to write new business, particularly if the adverse outcomes negatively impact certain of the Company’s ratings.
In addition to the claim related litigation described above, the Company and its insurance subsidiaries, asintegral part of their normal operations in managing disability claims, are engaged in claim litigation where disputes arise as a result of a denial or termination of benefits. Typically those lawsuits are filed on behalf of a single claimant or policyholder, and in some of these individual actions punitive damages are sought, such as claims alleging bad faith in the handling of insurance claims. For its general claim litigation, the Company and its insurance company subsidiaries maintain reserves based on experience to satisfy judgments and settlements in the normal course. Management expects that the ultimate liability, if any, with respect to general claim litigation, after consideration of the reserves maintained, will not be material to the consolidated financial condition of the Company. Nevertheless, given the inherent unpredictability of litigation, it is possible that an adverse outcome in certain claim litigation involving punitive damages could, from time to time, have a material adverse effect on the Company’s results of operations in a period, depending on the results of operations of the Company for the particular period. The Company is unable to estimate a range of reasonably possible punitive losses.
Refer to Note 15 of the “Notes to Consolidated Financial Statements” contained herein in Item 8 for information on the above legal proceedings.
Deferred Policy Acquisition Costs, Value of Business Acquired, and Goodwill
The Company defers certain costs incurred in acquiring newour business, and expenses these costs over the life of the related policies. These costs include certain commissions, other agency compensation, selectionour investments support our policyholder liabilities and policy issue expenses, and field expenses. Value of business acquired (VOBA) represents the present value of future profits recorded in connection with the acquisition of a block of insurance policies. Deferred policy acquisition costs and VOBA are amortized based primarily upon expected future premium income of the related insurance policies. Recoverability testing for deferred policy acquisition costs and VOBA is performed when, in the judgment of management, adverse deviations from original assumptions have occurred and may be likely to continue such that recoverability of deferred policy acquisition costs and/or VOBA on a line of business is questionable. Insurance contracts are grouped on a basis consistent with the Company’s manner of acquiring, servicing, and measuring profitability of the contracts. If recoverability testing indicates that either deferred policy acquisition costs and/or VOBA are not recoverable, the deficiency is charged to expense.
Goodwill is not amortized, but the Company reviews on an annual basis the carrying amount of goodwill for indications of impairment, with consideration given to financial performance and other relevant factors. In accordance with accounting guidance, the Company tests for impairment at either the operating segment level or one level below. In addition, certain events including, but not limited to, a significant adverse change in legal factors or the business environment, an adverse action by a regulator or rating agency, or unanticipated competition would cause the Company to review goodwill for impairment more frequently than annually.
Industry Factors
All of the Company’s businesses are highly regulated and competitive. The Company’s profitability is affected by a number of factors, including rate competition, frequency and severity of claims, lapse rates, government regulation, interest rates, and general business considerations. There are many insurance companies which actively compete with the Company in its lines of business, some of which are larger and have greater financial resources than the Company, and there is no assurance that the Company will be able to compete effectively against such companies in the future.
Capital Adequacy
The capacity for an insurance company’s growth in premiums is in part a function of its statutory surplus. Maintaining appropriate levels of statutory surplus, as measured by state insurance regulations, is considered important by state insurance regulatory authorities and the private agencies that rate insurers’ claims-paying abilities and financial strength. Failure to maintain certain levels of statutory surplus could result in increased regulatory scrutiny, action by state regulatory authorities, or a downgrade by the private rating agencies.
The individual RBC ratios for the Company’s U.S. insurance subsidiaries at December 31, 2005, were above the range that would require state regulatory action. If the NAIC adopts revisions to the RBC formula, the Company’s insurance subsidiaries may require additional capital. The additional capital required may not be available on favorable terms, if at all. In addition, insurance companies in the U.K. are subject to regulation, including capital adequacy requirements and minimum solvency margins, by the FSA. Need for additional capital could limit a subsidiary’s ability to distribute funds to the Company and adversely affect the Company’s ability to pay dividends on its common stock and meet its debt and other payment obligations.
Income Protection Insurance
Income protection insurance may be affected by a number of social, economic, governmental, competitive, and other factors. Changes in societal attitudes, work ethics, motivation, stability, and mores can significantly affect the demand for and underwriting results from income protection products. The climate and the nature of competition in income protection insurance have also been markedly affected by the growth of social security, worker’s compensation, and other governmental programs in the workplace.
Both economic and societal factors can affect claim incidence for income protection insurance. The relationship between these factors and overall incidence is very complex and will vary due to contract design features and the degree of expertise within the insuring organization to price, underwrite, and adjudicate the claims. Within the group income protection market, pricing and renewal actions can be taken to react to higher claim rates. However, these actions take time to implement, and there is a risk that the market will not sustain increased prices. In addition, changes in economic and external conditions may not manifest themselves in claims experience for an extended period of time.
The pricing actions available in the individual income protection market differ between product classes. The nature of that portion of the Company’s outstanding insurance business that consists of individual noncancelable income protection policies, whereby the policy is guaranteed to be renewable through the life of the policy at a fixed premium, does not permit the Company to adjust its premiums on in-force business due to changes resulting from such factors. Guaranteed renewable contracts can be re-priced to reflect external factors, but rate changes cannot be implemented as quickly as in the group income protection market.
Income protection insurance products are important products for the Company. To the extent that income protection products are adversely affected in the future as to sales or claims, the business or results of operations of the Company could be materially adversely affected.
Long-term Care Insurance
Long-term care insurance can be affected by a number of demographic, medical, economic, governmental, competitive, and other factors. Because long-term care insurance is a relatively new insurance product, the degree of expertise within the insuring organization to properly price the products and use appropriate assumptions when establishing reserves potentially has greater risk than that of other product offerings for which greater experience exists regarding trends and appropriate assumptions. Mortality is a critical factor influencing the length of time a claimant receives long-term care benefits. Mortality continues to improve for the general population, and life expectancy trends have extended. Changes in actual mortality trends relative to assumptions may adversely affect the results of the Company. Long-term care insurance is guaranteed renewable and can be re-priced to reflect external factors.
Group Life Insurance
Group life insurance may be affected by many factors, including the characteristics of the employees insured, the amount of insurance employees may elect voluntarily, the Company’s risk selection process, the ability of the Company to retain employer groups with lower claim incidence rates, the geographical concentration of employees, and mortality rates. Claim incidence may also be influenced by unexpected catastrophic events such as terrorist attacks and natural disasters, which may also affect the availability of reinsurance coverage. Changes in any of these factors may adversely affect the results of the Company.
Investments
The Company maintains anshareholders’ equity. Our investment portfolio that consists primarily of fixed incomematurity securities. The quality and/or yield of the portfolio may be affected by a number of factors, including the general economic and business environment, changes in the credit quality of the issuer, changes in market conditions, changes in interest rates, changes in foreign exchange rates, or regulatory changes. These securities are issued by both domestic and foreign entities and are backed either by collateral or the credit of the underlying issuer. Factors such as an economic downturn or political change in the country of the issuer, a regulatory change pertaining to the issuer’s industry, a significant deterioration in the cash flows of the issuer, accounting irregularities or fraud committed by the issuer, orwidening risk spreads, ratings downgrades, a change in the issuer’s marketplace mayor business prospects, or other events that adversely affect the Company’sissuers of these securities may result in the issuer defaulting on its obligations.
Our mortgage loan portfolio has default risk. Events or developments, such as the current economic conditions that could impact the ability of tenants to pay their rents or could limit the availability of refinancing, may have a negative effect on our mortgage loan portfolio. Events or developments that have a negative effect on any particular geographic region or sector may have a greater adverse effect on an investment portfolio to the extent that the portfolio is concentrated in that region or sector.
A default results in the recognition of an other than temporary impairment loss on the investment. A default may also adversely affect our ability to collect principal and interest due to us. The fixed income markets are experiencing a period of extreme volatility and illiquidity which has resulted in credit downgrade events and increased probability of default.
Events that damage our reputation may adversely affect our business, results of operations, or financial condition.
There are many events, including but not limited to those discussed herein in Item 1A, which may harm our reputation. Depending on the severity of the damage to our reputation, we may be unable to effectively compete for new products or retain our existing business. Damage to our reputation may also hinder our ability to raise new capital or increase our cost of capital.
A decrease in our financial strength or issuer credit ratings may have an adverse effect on our competitive position, results of operations, or financial condition.
We compete based in part on the financial strength ratings provided by rating agencies. A downgrade of our financial strength ratings may adversely affect us and could potentially, among other things, adversely affect relationships with distributors of our products and services and retention of our sales force, negatively impact persistency and new sales, and generally adversely affect our ability to compete. A downgrade in the issuer credit rating assigned to Unum Group or a negative outlook statement by a rating agency could have an effect on our ability to raise capital and on our cost of capital. See “Ratings” contained herein in Item 1 and in “Management’s Discussion and Analysis of Financial Condition and Results of Operations” contained herein in Item 7 for further discussion.
Index to Financial Statements
United Kingdom currency translation risk could materially impact reported operating results.
The functional currency of our U.K. operations is the British pound sterling. Fluctuations in the pound to dollar exchange rate have an effect on our financial results. In periods when the pound weakens, translating pounds into dollars decreases current period results relative to the prior period. In periods when the pound strengthens, translating pounds into dollars increases current period results in relation to the prior period. However, it is important to distinguish between translating and converting foreign currency. Except for a limited number of transactions, we do not actually convert pounds into dollars. As a result, we view foreign currency translation as a financial reporting issue and not a reflection of operations or profitability in the U.K.
Sustained declines in long-term interest rates or the rate of return on pension plan assets may have a negative effect on the funded status of our pension plans and/or increase our pension costs.
The rate of return on pension plan assets is determined based on the fair value of the plan assets at the beginning and end of the measurement period. Declines in long-term interest rates or the fair value of our plan assets may result in a decrease in the funded status of our pension plans and/or increased pension costs, which may adversely affect our results of operations, financial condition, or liquidity. See “Critical Accounting Estimates” included in “Management’s Discussion and Analysis of Financial Condition and Results of Operations” contained herein in Item 7 for further discussion.
The current adverse economic conditions may adversely affect demand for our products or may result in higher disability claims incidence or longer claims duration.
As a large financial institution, we are affected by conditions in the capital markets and the general economy, both in the United States and in the United Kingdom. The adversity experienced in the capital markets and general economy that began in the middle of 2007 and worsened during 2008 may adversely affect our business and results of operations. In particular, factors such as unemployment levels, consumer confidence levels, consumer spending, business investment, government spending, the volatility and strength of the capital markets, and inflation all affect the business and economic environment and, ultimately, the amount and profitability of our businesses. Given the nature of our products, in an economic environment characterized by higher unemployment, lower personal income, reduced consumer spending, and lower corporate earnings and investment, the demand for our products may be adversely affected. In addition, during such periods we may experience higher disability claims incidence, longer disability claims duration, and/or an increase in policy lapses.
Differences between actual claims experience and reserving assumptions may materially adversely affect our results or operations or financial condition.
Reserves, whether calculated under GAAP or statutory accounting principles, do not represent an exact calculation of future benefit liabilities but are instead estimates made by us using actuarial and statistical procedures. There can be no assurance that any such reserves will be sufficient to fund our future liabilities in all circumstances. Future loss development may require reserves to be increased, which would adversely affect earnings in current and future periods. Adjustments to reserve amounts may be required in the event of changes from the issuer.assumptions regarding future morbidity (the incidence of claims and the rate of recovery, including the effects thereon of inflation and other societal and economic factors); persistency; mortality; policy benefit offsets, including those for social security; and interest rates used in calculating the reserve amounts. See “Critical Accounting Estimates” included in “Management’s Discussion and Analysis of Financial Condition and Results of Operations” contained herein in Item 7 for further discussion.
We and our insurance subsidiaries are subject to extensive supervision and regulation, which may affect the cost or demand for our products or may impact our profitability or growth.
Our insurance company subsidiaries may not be able to obtain or maintain necessary licenses, permits, authorizations, or accreditations, or may be able to do so only at great cost. In addition, we may not be able to comply fully with, or obtain appropriate exemptions from, the wide variety of laws and regulations applicable to insurance companies and insurance holding companies. Failure to comply with or to obtain appropriate exemptions under any applicable laws could result in restrictions on our ability to do business in one or more of the jurisdictions
Index to Financial Statements
in which we operate and could result in fines and other sanctions, which may have a material adverse effect on our business or results of operations.
Because of recent events involving certain financial institutions, including insurance companies, it is possible that there will be heightened oversight of insurers at both the state and federal level. We cannot predict specific proposals that might be adopted, or what impact, if any, such proposals or, if enacted, such laws, could have on our business, results of operations, or financial condition.
New programs may be enacted at the state or federal level that will compete with or diminish the need for our products, particularly as it may affect our ability to sell our products through employers or in the workplace.
Congress, as well as foreign, state, and local governments, could enact legislation related to changes in tax laws that could increase our tax costs or affect the desirability of our products to customers.
Most group long-term and short-term disability plans we administer are governed by ERISA. Changes to ERISA enacted by Congress or via judicial interpretations may adversely affect the risk to us of managing employee benefit plans, increase the premiums associated with such plans, and ultimately affect their affordability and our profitability.
Many regulatory and governmental bodies have the authority to review our products and business practices and those of our agents and employees. These regulatory or governmental bodies may bring regulatory or other legal actions against us if, in their view, our practices are improper. These actions can result in substantial fines or restrictions on our business activities and may have a material adverse effect on our business or results of operations.
During 2004 and 2005, certain of our insurance subsidiaries entered into settlement agreements with various regulators related to disability claims handling practices. The investments heldagreements resulted in changes in our claims handling practices and a process for reassessing certain claims. These and other regulatory examinations or investigations could result in, among other things, changes in business practices, including changes in broker compensation and related disclosure practices, changes in the use and oversight of reinsurance, changes in governance and other oversight procedures, fines, and other administrative action. Such results, singly or in combination, may injure our reputation, cause negative publicity, adversely affect our issuer credit ratings and financial strength ratings, place us at a competitive disadvantage in marketing or administering our products, or impair our ability to sell or retain insurance policies, thereby adversely affecting our business, and potentially materially adversely affecting the results of operations. Determination by regulatory authorities that we have engaged in improper conduct may also adversely affect our defense of various lawsuits. See “Examinations and Investigations” contained herein in Item 1 and “Legal and Regulatory Issues” in “Management’s Discussion and Analysis of Financial Condition and Results of Operations” contained herein in Item 7 for further discussion.
Our insurance products may be affected by many factors, and changes in any of those factors may adversely affect our profitability.
Disability insurance may be affected by a number of social, economic, governmental, competitive, and other factors. Changes in societal attitudes, such as work ethic, motivation, or stability, can significantly affect the demand for and underwriting results from disability products. Competition in disability insurance has also been markedly affected by the Companygrowth of social security, workers’ compensation, and other governmental programs in the workplace.
Both economic and societal factors can affect claim incidence for disability insurance. Claim incidence and claim recovery rates may be influenced by, among other factors, the rate of unemployment and consumer confidence. Claim incidence and claim recovery rates may also be influenced by the emergence of new infectious diseases or illnesses. The relationship between these and other factors and overall incidence is very complex and will vary due to contract design features and the degree of expertise within the insuring organization to price, underwrite, and adjudicate the claims. Within the group disability market, pricing and renewal actions can be taken to react to higher claim rates. However, these actions take time to implement, and there is a risk that the market will not sustain increased prices. In addition, changes in economic and external conditions may not manifest themselves in claims experience for an extended period of time.
Index to Financial Statements
The pricing actions available in the individual disability market differ between product classes. Our individual noncancelable disability policies, in which the policy is guaranteed to be renewable through the life of the policy at a fixed premium, do not permit us to adjust premiums on our in-force business due to changes resulting from such factors. Guaranteed renewable contracts that are predominantly investednot noncancelable can be re-priced to supportreflect adverse experience, but rate changes cannot be implemented as quickly as in the group disability market.
Long-term care insurance can be affected by a number of demographic, medical, economic, governmental, competitive, and other factors. Because long-term care insurance is a relatively new product for the insurance liabilitiesindustry and is long-duration in nature, there is not as much historical data as is available for our other products. This creates a level of uncertainty in properly pricing the product and using appropriate assumptions when establishing reserves. Mortality is a critical factor influencing the length of time a claimant receives long-term care benefits. Mortality continues to improve for the general population, and life expectancy has increased. Changes in actual mortality trends relative to assumptions may adversely affect our profitability. Long-term care insurance is guaranteed renewable and can be re-priced to reflect adverse experience, but the re-pricing is subject to regulatory approval which can affect the length of time in which the re-pricing can be implemented, if at all. Due to the long duration of the Company. Theproduct, we may be unable to purchase appropriate assets with cash flows and durations such that the timing and/or amount of theour investment cash flows may not match those of our maturing liabilities.
Group life insurance may be affected by the liabilitiescharacteristics of the Company.employees insured, the amount of insurance employees may elect voluntarily, our risk selection process, our ability to retain employer groups with lower claim incidence rates, the geographical concentration of employees, and mortality rates. Claim incidence may also be influenced by unexpected catastrophic events such as terrorist attacks and natural disasters, which may also affect the availability of reinsurance coverage.
In addition to investment default risk as previously discussed, we are exposed to other risks related to our investment portfolio which may adversely affect our results of operations, financial condition, or liquidity. These risks include interest rate and credit spread fluctuations, the contractual terms of derivative contracts, the accuracy of valuations of securities, and the possibility that we might need to sell securities at disadvantageous times.
Fluctuations in interest rates affect our ability to earn the interest rates assumed in our policyholder reserves or reported in previous periods’ net investment income and also affect the fair value of our investment portfolio. A rise in interest rates may increase the net unrealized loss position of our investment portfolio, but may improve our ability to earn higher rates of return on new purchases of fixed income securities. Conversely, a decline in interest rates may decrease the net unrealized loss position of our investment portfolio, but new securities may be purchased at lower rates of return. Our exposure to credit spreads, which is the yield above comparable Treasury securities, primarily relates to market price and cash flow variability associated with changes in credit spreads. A widening of credit spreads may increase the net unrealized loss position of the investment portfolio. Credit spread tightening may reduce net investment income associated with new purchases of fixed income securities.
We use derivative instruments to help us manage interest rate risk. While we use relatively simple over-the-counter instruments, they are complicated contracts. Risks to our results of operations, financial condition, or liquidity include:
TheOur hedges may become ineffective due to changes in expected future events for which we have hedged or if our counterparties fail or refuse to honor their obligations under these derivative instruments. Ineffectiveness of our hedges may have a material adverse effect on our results of operations or financial condition.
If we are downgraded significantly, ratings triggers in our contracts may result in our counterparties enforcing their option to terminate the derivative contracts. Such an event may have a material adverse effect on our financial condition or our ability to hedge our risks.
Many of our counterparties are financial institutions, and the recent capital market turmoil has resulted in an increase in the risk of non-performance by many financial institutions. Non-performance by our counterparties may force us to unwind the hedge. We may be unable to replace the hedge, thereby leaving the risk unhedged.
Index to Financial Statements
Under the terms of our hedging contracts, we are required to post collateral and to maintain a certain level of collateral. This may adversely affect our liquidity and could subject us to the credit risk of the counterparty to the extent it holds such collateral.
An increase in interest rates may result in losses at the time hedges are terminated, which may have a material adverse effect on our financial condition or results of operations.
See Note 5 of the “Notes to Consolidated Financial Statements” contained herein in Item 8 for a discussion of our derivative financial instruments.
We report our fixed maturity securities and certain other financial instruments at market value. During periods of market disruption, it may be difficult to value certain of our securities or to determine other than temporary impairments. Valuations may include inputs and assumptions that are less observable or require greater estimation, resulting in values which may be less than the value at which the investments held bymay ultimately be sold. Further, rapidly changing and unprecedented credit and equity market conditions could materially impact the Company’s insurance subsidiaries are highly regulated by specific legislationvaluation of securities as reported in each stateour financial statements, and the period to period changes in value could vary significantly. Decreases in value may have a material adverse effect on our results of operations or financial condition.
We evaluate our investment portfolio for impairments. There can be no assurance that governswe have accurately assessed the type, amount,level of impairments taken. Additional impairments may need to be taken in the future, and credit qualityhistorical trends may not be indicative of allowable investments. Legislativefuture impairments. Any event reducing the value of our securities other than on a temporary basis may have a material adverse effect on our business, results of operations, or financial condition.
While we attempt to match our asset cash flows and durations with expected liability cash flows and durations to meet the funding requirements of our business, we may in certain circumstances need to sell investments due to changes couldin regulatory or capital requirements, changes in tax laws, rating agency decisions, and/or unexpected changes in liquidity needs. Events such as these may force the Companyus to restructure the portfoliosell securities in an unfavorable interest rate or credit environment, with a resulting adverse effect on profitabilityour results of operations, financial condition, or liquidity.
We may be required to establish a valuation allowance against our deferred income tax asset.
Factors in our ability to realize a tax benefit from our deferred income tax asset include the performance of our businesses and our ability to generate realized investment gains. If we determine that all or a portion of the leveldeferred income tax asset will not result in a future tax benefit, a valuation allowance must be established with a corresponding charge to net income or other comprehensive income. Such charges may have a material adverse effect on our results of statutory capital.operations or financial condition. The likelihood of recording such a valuation increases during periods of economic downturn.
An assessment by a governing tax authority may have a material adverse effect on our results of operations or financial condition.
The calculation of our tax liabilities involves dealing with uncertainties in the application of complex tax laws in a multitude of jurisdictions, both domestic and foreign. The amount of income taxes we pay is subject to ongoing audits in various jurisdictions, and a material assessment by a governing tax authority could affect profitability. Such an assessment may have a material adverse effect on our results of operations or financial condition.
Our overall risk management program may leave us exposed to unidentified or unanticipated risk, which could negatively affect our business.
We have devoted significant resources to develop our enterprise risk management program, which has the objective of managing our strategic, market, credit, insurance, operations, capital and liquidity, and reputational risks. However, our program may not be comprehensive, and our methods for managing risk may not fully predict future exposures. See “Quantitative and Qualitative Disclosures About Market Risk” contained herein in Item 7A for further information about our risk management program.
Index to Financial Statements
Litigation is common in our businesses and may result in significant financial losses and/or harm to our reputation.
The Company usesand/or its subsidiaries’ directors and officers have been sued in several purported class action and stockholder derivative instrumentslawsuits. The outcome of these lawsuits is uncertain, and we are unable to estimate a range of reasonably possible losses. Reserves have not been established for these matters. An adverse outcome in one or more of these actions may, depending on the nature, scope and amount of the ruling, adversely affect our results of operations or financial condition, encourage other litigation, and limit our ability to write new business, particularly if the adverse outcomes negatively impact certain of our ratings.
Unum Group and its insurance subsidiaries, as part of their normal operations in managing claims, are engaged in claim litigation where disputes arise as a result of a denial or termination of benefits. Typically those lawsuits are filed on behalf of a single claimant or policyholder, and in some of these individual actions punitive damages are sought, such as claims alleging bad faith in the handling of insurance claims. For our general claim litigation, we maintain reserves based on experience to satisfy judgments and settlements in the normal course. We expect that the ultimate liability, if any, with respect to general claim litigation, after consideration of the reserves maintained, will not be material to our financial condition. Nevertheless, given the inherent unpredictability of litigation, it is possible that an adverse outcome in certain claim litigation involving punitive damages may, from time to time, have a material adverse effect on our results of operations. We are hedgingunable to estimate a range of reasonably possible punitive losses.
Refer to Note 14 of the “Notes to Consolidated Financial Statements” contained herein in nature. The Company’s profitabilityItem 8 for additional information on legal proceedings.
We need to finance our ongoing operations, and this may not always be possible solely from internal sources of capital and liquidity. If we need to seek external capital, there is the risk that adverse market conditions may significantly affect our access to capital or our cost of capital.
A decrease in demand for our insurance products or an increase in the incidence of new claims or the duration of existing claims could negatively impact our cash flows from operations. Deterioration in the credit market, which could delay our ability to sell our positions in certain of our fixed maturity securities in a timely manner, could also negatively impact our cash flows. Without sufficient liquidity, we could be forced to curtail our operations, and our business may suffer. If our internal sources of liquidity prove to be insufficient, we may be unable to successfully obtain additional financing and capital on favorable terms, or at all, which may adversely affected ifaffect us.
In the near term, we expect that our need for external financing is small, but changes in our business could increase our need. If our financial results are unfavorable, we may need to increase our capital in order to maintain our credit ratings or satisfy regulatory requirements. Maintaining appropriate levels of statutory surplus, as measured by state insurance regulations, is considered important by state insurance regulatory authorities and the rating agencies that rate insurers’ claims-paying abilities and financial strength. Failure to maintain certain levels of statutory surplus could result in increased regulatory scrutiny, action by state regulatory authorities, or a counterpartydowngrade by the rating agencies. If the NAIC or state regulators adopt revisions to the derivative defaults inRBC formula, or if the FSA revises its payment. This default risk is mitigated by cross-collateralization agreements.
Dividend Restrictions
Ascapital adequacy requirements and minimum solvency margins, our insurance subsidiaries may require additional capital. Need for additional capital may limit a subsidiary’s ability to distribute funds to the holding company and adversely affect our ability to pay dividends on our common stock and meet our debt and other payment obligations.
Obtaining financing for even a small amount of capital could be complicated in the Company reliescurrent market environment. In some cases during the past year, the markets have exerted downward pressure on availability of liquidity and credit capacity for certain issuers. The availability of financing will depend on a variety of factors such as market conditions, the general availability of credit, the overall availability of credit to the financial services industry, our credit ratings and credit capacity, and the possibility that customers or lenders could develop a negative perception of our financial prospects. Similarly, our access to funds may be impaired if regulatory authorities or rating agencies take negative actions against us. Raising capital in unfavorable market conditions could increase our interest expense or negatively impact our shareholders through increased dilution of their common stock holding in Unum Group.
Index to Financial Statements
See “Liquidity and Capital Resources” included in “Management’s Discussion and Analysis of Financial Condition and Results of Operations” contained herein in Item 7 for further discussion.
Competition may adversely affect our market share or profitability.
All of our businesses are highly competitive. We believe that the principal competitive factors affecting our business are integrated product choices, price, quality of customer service and claims management, financial strength, and claims-paying ratings. We compete for new product sales, the retention of existing business, and the ability to attract and retain independent agents and brokers to market our products, all of which affect our profitability. There are many insurance companies which actively compete with us in our lines of business, some of which are larger and have greater financial resources, and there is no assurance that we will be able to compete effectively against such companies in the future. See “Competition” contained herein in Item 1 for further discussion.
We are subject to various operational risks resulting from inadequate or failed internal processes or from external events which may damage our market position and reputation and/or adversely affect our results of operations or financial condition.
We face challenges and risks associated with the development, sale, and retention of product offerings that meet the needs of our targeted markets; maintaining effective underwriting and pricing discipline; continued effective claim management and customer service performance; ongoing expense management; delivering effective technology solutions; continued execution of our capital management strategy; and the successful implementation of operational improvements and strategic growth initiatives. Failure to successfully manage our operational risks may adversely affect our competitiveness, profitability, or financial condition.
Our subsidiaries may be restricted from paying dividends to our holding companies.
Unum Group and certain of its subsidiaries rely on dividends or extensions of credit from itsour insurance and non-insurance company subsidiaries including its U.S. insurance subsidiaries and Unum Limited, to make dividend payments on itsour common stock, meet debt payment obligations, and pay itsour other obligations. The Company’sOur insurance company subsidiaries are subject to regulatory limitations on the payment of dividends and on other transfers of funds to affiliates. The level of statutory earnings and capital in the Company’sour insurance subsidiaries could impact their ability to pay dividends or to make other transfers of funds to the Company,our holding companies, which could impair the Company’sour ability to pay itsour dividends or meet itsour debt and other payment obligations. See “Liquidity and Capital Resources” included in “Management’s Discussion and Analysis of Financial Condition and Results of Operations” contained herein in Item 7 and Note 1615 of the “Notes to Consolidated Financial Statements” contained herein in Item 8 for a discussion of the existing regulatory limitations on dividends.
Reinsurance may not be available or affordable, or reinsurers may be unwilling or unable to meet their obligations under our reinsurance contracts, which may adversely affect our results of operations or financial condition.
As part of our overall risk management strategy, we purchase reinsurance for certain risks underwritten by our various businesses. Market conditions beyond our control determine the availability and cost of the reinsurance protection. Any decrease in the amount of reinsurance will increase our risk of loss and any increase in the cost of reinsurance will, absent a decrease in the amount of reinsurance, reduce our results of operations. Accordingly, we may be forced to incur additional expenses for reinsurance or may be unable to obtain sufficient reinsurance on acceptable terms, which may adversely affect our ability to write future business or result in the assumption of more risk with respect to the policies we issue. The collectibility of our reinsurance recoverable is primarily a function of the solvency of the individual reinsurers. The insolvency of a reinsurer or the inability or unwillingness of a reinsurer to comply with the terms of a reinsurance contract may have an adverse effect on our results of operations or financial condition. Index to Financial StatementsWe have intangible assets such as deferred acquisition costs (DAC), value of business acquired (VOBA), and goodwill. We may be required to accelerate amortization or recognize an impairment, which may adversely affect our results of operations or financial condition. We defer certain costs incurred in acquiring new business and expense these costs over the life of the related policies. These costs include certain commissions, other agency compensation, selection and policy issue expenses, and field expenses. VOBA represents the present value of future profits recorded in connection with the acquisition of a block of insurance policies. DAC and VOBA are amortized based primarily upon expected future premium income of the related insurance policies. Recoverability testing for DAC and VOBA is performed on an annual basis. Insurance contracts are grouped on a basis consistent with our manner of acquiring, servicing, and measuring profitability of the contracts. If recoverability testing indicates that either DAC and/or VOBA are not recoverable, the deficiency is charged to expense. Goodwill is not amortized, but on an annual basis we review the carrying amount of goodwill for indications of impairment, considering in that review the financial performance and other relevant factors. In accordance with accounting guidance, we test for impairment at either the operating segment level or one level below. In addition, certain events including, but not limited to, a significant adverse change in legal factors or the business environment, an adverse action by a regulator or rating agency, or unanticipated competition would cause us to review goodwill for impairment more frequently than annually. Extreme events, including terrorism, can affect the economy in general, our industry, and us specifically. Events such as epidemics, pandemics, terrorist attacks, natural disasters, or other extreme events may materially adversely affect our business, the level of claims, or our results of operations, and in the event of extreme circumstances, our financial condition or viability. Beyond obtaining insurance coverage for our facilities, there are few, if any, commercial options through which to transfer the exposure from extreme events away from us. The continued threat of terrorism could result in increased reinsurance prices and reduced insurance coverage and potentially cause us to retain more risk than we otherwise would retain if we were able to obtain reinsurance at lower prices. In the event of nuclear or bioterrorism attacks, epidemics, or other extreme events, we could face significant costs depending on the government’s actions and the responsiveness of public agencies and other insurers. In addition, we may also be adversely affected if we do not maintain adequate procedures to ensure disaster recovery and business continuity for our facilities and operations in the event of such occurrences. Changes in accounting standards issued by the Financial Accounting Standards Board (FASB) or other standard-setting bodies may adversely affect our financial statements. Our financial statements are subject to the application of generally accepted accounting principles in both the United States and the United Kingdom, which are periodically revised and/or expanded. Accordingly, we are required to adopt new or revised accounting standards issued by recognized authoritative bodies, including the FASB. Market conditions have prompted accounting standard setters to expose new guidance which further interprets or seeks to revise accounting pronouncements related to financial instruments as well as to issue new standards expanding disclosures. It is possible that future accounting standards we are required to adopt could change the current accounting treatment that we apply to our financial statements and that such changes may have a material adverse effect on our results of operations or financial condition. We also face other risks that may adversely affect our business, results of operations, or financial condition, including but not limited to: A significant deficiency in our internal controls over financial reporting; Any requirement to restate financial results due to inappropriate application of accounting principles; Risks associated with security or interruption of information systems, which could cause, among other things, operational disruption; Failure to adequately plan for succession of our senior management and other key executives; and Failure of our processes to prevent and detect fraud and/or unethical conduct of employees. Index to Financial Statements |
None
The Company occupiesWe occupy approximately 3.12.7 million square feet of space at four principal operating centers in Chattanooga, Tennessee; Portland, Maine; Worcester, Massachusetts; and Columbia, South Carolina.
The Company occupiesWe own and occupy two connected buildings totalingin Chattanooga, Tennessee, with approximately 901,000 square feet in Chattanooga, Tennessee. The office buildings and substantially all of the surrounding 23 acres of land used for employee parking are owned by the Company, including an employee parking garage and a 27-unit apartment building for corporate use and residential leasing to the general public. In addition, approximately 171,000 square feet of office space is leasedspace. We own and occupied in a nearby office building.
The Company owns and occupiesoccupy five facilities in Portland, Maine, with approximately 838,000 square feet of office spacespace. We own and 250 acres of land, a portion of which has been developed for employee parking. In addition, approximately 115,000 square feet of office space is leased and occupied.
The Company owns and occupiesoccupy facilities totaling approximately 385,000 square feet in Worcester, Massachusetts, with approximately 5.6 acres of surrounding property used primarily for parking.
The Company ownsMassachusetts. We own and occupiesoccupy approximately 523,000 square feet of office space in Columbia, South Carolina. The buildings are located on approximately 47 acres with a portion developed for employee parking.
The CompanyWe also occupiesoccupy office buildings in the United Kingdom which serve as the home offices of Unum Limited. The Company ownsWe own and occupiesoccupy property located in Dorking, with approximately 63,000 square feet of office space located on approximately 60 acres with a portion developed for employee parking.space. In addition, approximately 65,000 square feet of office space is leased and occupied in two office buildings located in Bristol and BasingstokeBasingstoke.
We lease and another 11,000 square feet of leased office space serves five major city locations in England and Scotland.
The Company leases and occupiesoccupy approximately 89,000 square feet of office space in Glendale, California. Additionally, the Company leaseswe lease other office space, for periods principally from five to ten years, for use by itsour affiliates and sales forces.
The Company believes itsOur properties and facilities are suitable and adequate for current operations.
| ITEM 3. LEGAL PROCEEDINGS |
Refer to Item 8 Note 1514 of the “Notes to Consolidated Financial Statements” contained herein in Item 8 for information on legal proceedings.
| ITEM 4. SUBMISSION OF MATTERS TO A VOTE OF SECURITY HOLDERS |
None
Index to Financial Statements
| ITEM 5. MARKET FOR REGISTRANT’S COMMON EQUITY, RELATED STOCKHOLDER MATTERS AND ISSUER PURCHASES OF EQUITY SECURITIES |
Common stock of UnumProvident CorporationUnum Group is traded on the New York Stock Exchange. The stock symbol is UNM.
Common“UNM.” Quarterly market prices and dividends paid per share of common stock information is shownare as follows:
| Market Price | Market Price | ||||||||||||||
| High | Low | Dividend | High | Low | Dividend | ||||||||||
2005 | |||||||||||||||
2008 | |||||||||||||||
1st Quarter | $ | 18.08 | $ | 16.49 | $ | 0.075 | $24.50 | $19.22 | $0.075 | ||||||
2nd Quarter | 18.84 | 15.50 | 0.075 | 24.99 | 20.40 | 0.075 | |||||||||
3rd Quarter | 20.91 | 18.29 | 0.075 | 27.50 | 19.43 | 0.075 | |||||||||
4th Quarter | 22.90 | 19.01 | 0.075 | 26.20 | 9.33 | 0.075 | |||||||||
2004 | |||||||||||||||
2007 | |||||||||||||||
1st Quarter | $ | 16.40 | $ | 13.35 | $ | 0.075 | $23.40 | $19.79 | $0.075 | ||||||
2nd Quarter | 16.10 | 13.50 | 0.075 | 28.20 | 22.83 | 0.075 | |||||||||
3rd Quarter | 16.85 | 14.93 | 0.075 | 26.75 | 22.02 | 0.075 | |||||||||
4th Quarter | 18.25 | 11.41 | 0.075 | 26.67 | 22.36 | 0.075 | |||||||||
The following graph shows a five year comparison of cumulative total returns for our common stock’s historical performance, the S&P 500 Index, and the Insurance Index (non-weighted average of “total returns” from the S&P Life & Health Index and the S&P Multi-line Index). Past performance is not an indication of future results.
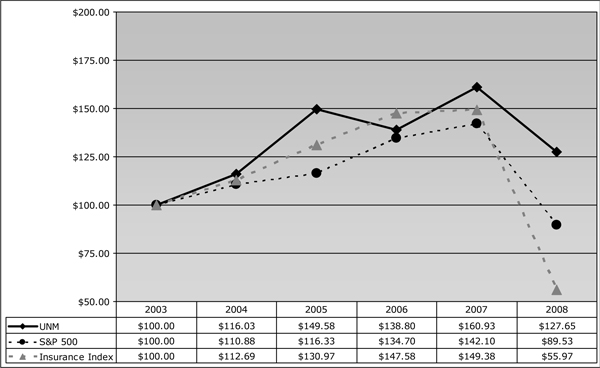
As of February 2, 2006,23, 2009, there were 17,83715,469 registered holders of common stock.
Index to Financial Statements
The following table provides information about our share repurchase activity for the fourth quarter of 2008:
| (a) Total Number of Shares Purchased | (b) Average Price Paid per Share | (c) Total Number of Shares Purchased as Part of Publicly Announced Program (1) (2) (3) | (d) Approximate Dollar Value of Shares that May Yet Be Purchased Under the Program (1) (2) (3) | |||||||
October 1 - October 31, 2008 | 1,981,782 | $ | 24.17 | 1,981,782 | $ | - | ||||
November 1 - November 30, 2008 | - | - | - | - | ||||||
December 1 - December 31, 2008 | - | - | - | - | ||||||
Total | 1,981,782 | 1,981,782 | ||||||||
| (1) | On October 31, 2007, we announced that Unum Group’s board of directors authorized the repurchase of up to $700.0 million of Unum Group common stock. |
| (2) | On January 31, 2008, we repurchased 14,000,000 shares of Unum Group common stock for $350.0 million using an accelerated share repurchase agreement. Under the terms of the repurchase agreement, we were to receive, or be required to pay, a price adjustment based on the volume weighted average price of Unum Group common stock during the term of the agreement. Any price adjustment payable to us was to be settled in shares of Unum Group common stock. Any price adjustment we would have been required to pay would have been settled in either cash or common stock. A 30 percent partial acceleration of the agreement, 4,200,000 shares, occurred on March 26, 2008 and settled on March 28, 2008 with the price adjustment resulting in the delivery to us of 482,483 additional shares of Unum Group common stock. The remaining 9,800,000 shares settled on May 29, 2008, with the price adjustment resulting in the delivery to us of 913,707 additional shares. In total, we repurchased 15,396,190 shares of Unum Group common stock under this agreement for an average price paid per share of $22.73. |
| (3) | On August 4, 2008, we repurchased 12,500,000 shares of Unum Group common stock for $350.0 million using an accelerated share repurchase agreement. Under the terms of the repurchase agreement, we were to receive, or be required to pay, a price adjustment based on the volume weighted average price of Unum Group common stock during the term of the agreement. Any price adjustment payable to us was to be settled in shares of Unum Group common stock. Any price adjustment we would have been required to pay would have been settled in either cash or common stock. A 50 percent partial acceleration of the agreement, 6,250,000 shares, occurred on October 7, 2008 and settled on October 10, 2008 with the price adjustment resulting in the delivery to us of 980,886 additional shares of Unum Group common stock. The remaining 6,250,000 shares settled on October 14, 2008, with the price adjustment resulting in the delivery to us of 1,000,896 additional shares. In total, we repurchased 14,481,782 shares of Unum Group common stock under this agreement for an average price paid per share of $24.17. |
For information on restrictions relating to the Company’sour insurance subsidiaries’ ability to pay dividends to the Companyholding company see “Dividend Restrictions” contained herein in Item 1A, “Liquidity and Capital Resources – Cash Available from Subsidiaries” contained herein in Item 7 and Note 1615 of the “Notes to Consolidated Financial Statements” contained herein in Item 8.
Information For information relating to compensation plans under which Unum Group’s equity securities of the Company are authorized for issuance, is set forth undersee Item 12 includedcontained herein.
Index to Financial Statements |
(in millions of dollars, except share data)
| At or for the Year Ended December 31 | |||||||||||||||
| 2008 | 2007 | 2006 | 2005 | 2004 | |||||||||||
Statement of Operations Data | |||||||||||||||
Revenue | |||||||||||||||
Premium Income | $ | 7,783.3 | $ | 7,901.1 | $ | 7,948.2 | $ | 7,815.6 | $ | 7,839.6 | |||||
Net Investment Income | 2,389.0 | 2,409.9 | 2,320.6 | 2,188.3 | 2,158.7 | ||||||||||
Net Realized Investment Gain (Loss) | (465.9) | (65.2) | 2.2 | (6.7) | 29.2 | ||||||||||
Other Income | 275.9 | 274.1 | 264.3 | 262.1 | 260.3 | ||||||||||
Total | 9,982.3 | 10,519.9 | 10,535.3 | 10,259.3 | 10,287.8 | ||||||||||
Benefits and Expenses | |||||||||||||||
Benefits and Change in Reserves for | 6,626.4 | 6,988.2 | 7,577.2 | 7,083.2 | 7,248.4 | ||||||||||
Commissions | 853.3 | 841.1 | 819.0 | 804.7 | 842.3 | ||||||||||
Interest and Debt Expense(2) | 156.7 | 241.9 | 217.6 | 208.0 | 207.1 | ||||||||||
Other Expenses(3) | 1,521.9 | 1,451.5 | 1,456.1 | 1,469.5 | 2,265.7 | ||||||||||
Total | 9,158.3 | 9,522.7 | 10,069.9 | 9,565.4 | 10,563.5 | ||||||||||
Income (Loss) from Continuing Operations | 824.0 | 997.2 | 465.4 | 693.9 | (275.7) | ||||||||||
Income Tax (Benefit)(4) | 270.8 | 324.8 | 61.8 | 189.9 | (74.3) | ||||||||||
Income (Loss) from Continuing Operations | 553.2 | 672.4 | 403.6 | 504.0 | (201.4) | ||||||||||
Income (Loss) from Discontinued | - | 6.9 | 7.4 | 9.6 | (51.6) | ||||||||||
Net Income (Loss) | $ | 553.2 | $ | 679.3 | $ | 411.0 | $ | 513.6 | $ | (253.0) | |||||
Balance Sheet Data | |||||||||||||||
Assets(6) | $ | 49,417.4 | $ | 52,701.9 | $ | 52,977.8 | $ | 51,975.8 | $ | 50,905.5 | |||||
Long-term Debt | $ | 2,259.4 | $ | 2,515.2 | $ | 2,659.6 | $ | 3,261.6 | $ | 2,862.0 | |||||
Accumulated Other Comprehensive Income (Loss) | $ | (958.2) | $ | 463.5 | $ | 612.8 | $ | 1,163.5 | $ | 1,481.1 | |||||
Other Stockholders’ Equity | 7,356.1 | 7,576.4 | 7,106.0 | 6,200.4 | 5,743.0 | ||||||||||
Total Stockholders’ Equity | $ | 6,397.9 | $ | 8,039.9 | $ | 7,718.8 | $ | 7,363.9 | $ | 7,224.1 | |||||
Index to Financial Statements
| At or for the Year Ended December 31 | ||||||||||||||||
| 2008 | 2007 | 2006 | 2005 | 2004 | ||||||||||||
Per Share Data | ||||||||||||||||
Income (Loss) from Continuing Operations |
| |||||||||||||||
Basic | $ | 1.62 | $ | 1.90 | $ | 1.25 | $ | 1.71 | $ | (0.68 | ) | |||||
Assuming Dilution | $ | 1.62 | $ | 1.89 | $ | 1.21 | $ | 1.61 | $ | (0.68 | ) | |||||
Income (Loss) from Discontinued Operations |
| |||||||||||||||
Basic | $ | - | $ | 0.02 | $ | 0.02 | $ | 0.03 | $ | (0.18 | ) | |||||
Assuming Dilution | $ | - | $ | 0.02 | $ | 0.02 | $ | 0.03 | $ | (0.18 | ) | |||||
Net Income (Loss) | ||||||||||||||||
Basic | $ | 1.62 | $ | 1.92 | $ | 1.27 | $ | 1.74 | $ | (0.86 | ) | |||||
Assuming Dilution | $ | 1.62 | $ | 1.91 | $ | 1.23 | $ | 1.64 | $ | (0.86 | ) | |||||
Stockholders’ Equity | $ | 19.32 | $ | 22.28 | $ | 22.53 | $ | 24.66 | $ | 24.36 | ||||||
Cash Dividends | $ | 0.30 | $ | 0.30 | $ | 0.30 | $ | 0.30 | $ | 0.30 | ||||||
Weighted Average Common Shares Outstanding |
| |||||||||||||||
Basic (000s) | 341,022.8 | 352,969.1 | 324,654.9 | 295,776.4 | 295,224.3 | |||||||||||
Assuming Dilution (000s) | 341,560.3 | 355,776.5 | 334,361.7 | 312,512.6 | 295,224.3 | |||||||||||
| At or for the Year Ended December 31 | ||||||||||||||||||||
| 2005 | 2004 | 2003 | 2002 | 2001 | ||||||||||||||||
Statement of Operations Data | ||||||||||||||||||||
Revenue | ||||||||||||||||||||
Premium Income | $ | 7,815.6 | $ | 7,839.6 | $ | 7,615.7 | $ | 7,151.1 | $ | 6,797.2 | ||||||||||
Net Investment Income | 2,188.3 | 2,158.7 | 2,158.4 | 2,028.9 | 1,951.1 | |||||||||||||||
Net Realized Investment Gain (Loss) | (6.7 | ) | 29.2 | (173.8 | ) | (309.1 | ) | (100.0 | ) | |||||||||||
Other Income | 440.0 | 437.4 | 391.3 | 388.2 | 354.2 | |||||||||||||||
Total | 10,437.2 | 10,464.9 | 9,991.6 | 9,259.1 | 9,002.5 | |||||||||||||||
Benefits and Expenses | ||||||||||||||||||||
Benefits and Change in Reserves for Future Benefits | 7,083.2 | 7,248.4 | 7,868.1 | 6,324.8 | 5,983.9 | |||||||||||||||
Commissions | 804.7 | 842.3 | 844.1 | 820.2 | 744.1 | |||||||||||||||
Interest and Debt Expense | 208.0 | 207.1 | 187.2 | 162.4 | 169.6 | |||||||||||||||
Other Expenses (1) (2) (3) | 1,631.7 | 2,426.6 | 1,527.4 | 1,358.5 | 1,351.1 | |||||||||||||||
Total | 9,727.6 | 10,724.4 | 10,426.8 | 8,665.9 | 8,248.7 | |||||||||||||||
Income (Loss) from Continuing Operations Before Income Tax and Cumulative Effect of Accounting Principle Change | 709.6 | (259.5 | ) | (435.2 | ) | 593.2 | 753.8 | |||||||||||||
Income Tax (Benefit) | 196.0 | (67.3 | ) | (170.6 | ) | 196.3 | 216.1 | |||||||||||||
Income (Loss) from Continuing Operations Before Cumulative Effect of Accounting Principle Change | 513.6 | (192.2 | ) | (264.6 | ) | 396.9 | 537.7 | |||||||||||||
Income (Loss) from Discontinued Operations, Net of Income Tax (4) | — | (60.8 | ) | (161.7 | ) | 11.4 | 3.5 | |||||||||||||
Cumulative Effect of Accounting Principle Change, Net of Income Tax (5) | — | — | 39.9 | (7.1 | ) | — | ||||||||||||||
Net Income (Loss) | $ | 513.6 | $ | (253.0 | ) | $ | (386.4 | ) | $ | 401.2 | $ | 541.2 | ||||||||
Balance Sheet Data | ||||||||||||||||||||
Assets | $ | 51,866.8 | $ | 50,832.3 | $ | 49,718.3 | $ | 45,259.5 | $ | 42,442.7 | ||||||||||
Long-term Debt (6) | $ | 3,261.6 | $ | 2,862.0 | $ | 2,789.0 | $ | 1,914.0 | $ | 2,004.2 | ||||||||||
Company-Obligated Mandatorily Redeemable Preferred Securities of Subsidiary Trust Holding Solely Junior Subordinated Debt Securities of the Company (6) | $ | 300.0 | $ | 300.0 | ||||||||||||||||
Accumulated Other Comprehensive Income | $ | 1,163.5 | $ | 1,481.1 | $ | 1,171.2 | $ | 777.4 | $ | 111.3 | ||||||||||
Other Stockholders’ Equity | 6,200.4 | 5,743.0 | 6,099.8 | 6,065.8 | 5,828.6 | |||||||||||||||
Total Stockholders’ Equity | $ | 7,363.9 | $ | 7,224.1 | $ | 7,271.0 | $ | 6,843.2 | $ | 5,939.9 | ||||||||||
Per Share Data Income (Loss) from Continuing Operations(7) Basic Assuming Dilution Income (Loss) from Discontinued Operations Basic Assuming Dilution Cumulative Effect of Accounting Principle Change Basic Assuming Dilution Net Income (Loss) Basic Assuming Dilution Stockholders’ Equity Cash Dividends Weighted Average Common Shares Outstanding Basic (000s) Assuming Dilution (000s) At or for the Year Ended December 31 2005 2004 2003 2002 2001 $ 1.74 $ (0.65 ) $ (0.96 ) $ 1.64 $ 2.22 $ 1.64 $ (0.65 ) $ (0.96 ) $ 1.63 $ 2.21 $ (0.21 ) $ (0.58 ) $ 0.05 $ 0.02 $ (0.21 ) $ (0.58 ) $ 0.05 $ 0.01 $ 0.14 $ (0.03 ) $ 0.14 $ (0.03 ) $ 1.74 $ (0.86 ) $ (1.40 ) $ 1.66 $ 2.24 $ 1.64 $ (0.86 ) $ (1.40 ) $ 1.65 $ 2.22 $ 24.66 $ 24.36 $ 24.55 $ 28.33 $ 24.52 $ 0.30 $ 0.30 $ 0.37 $ 0.59 $ 0.59 295,776.4 295,224.3 276,132.2 242,032.9 241,824.9 312,512.6 295,224.3 276,132.2 243,070.1 243,608.7
Introduction(1) Included are regulatory claim reassessment charges of $65.8 million, $396.4 million, $52.7 million, and $84.5 million in 2007, 2006, 2005, and 2004, respectively, and reserve strengthening of $110.6 million in 2004 related to the restructuring of the individual disability – closed block.
(2) Included are costs related to early retirement of debt of $0.4 million, $58.8 million, and $25.8 million in 2008, 2007, and 2006, respectively.
(3) Includes the net increase in deferred acquisition costs, compensation expense, and other expenses. Included in these expenses are regulatory claim reassessment charges (credits) and broker compensation settlement expenses of $(12.8) million, $33.5 million, $22.3 million, and $42.5 million in 2007, 2006, 2005, and 2004, respectively, and, in 2004, charges related to the impairment of the individual disability – closed block deferred acquisition costs, value of business acquired, and goodwill balances of $282.2 million, $367.1 million, and $207.1 million, respectively.
(4) Amounts reported for 2006 and 2005 include income tax benefits of $91.9 million primarily as the result of group relief benefits obtained from the use of net operating losses in a foreign jurisdiction in which our businesses operate and $42.8 million related to the reduction of income tax liabilities, respectively.
(5) Includes after-tax losses of $71.3 million from the Canadian branch sale and write-downs in 2004.
(6) Prior year amounts have been reclassified to conform to current year presentation, as discussed in Note 1 of the “Notes to Consolidated Financial Statements” contained herein in Item 8.
Index to Financial Statements
ITEM 7. MANAGEMENT’S DISCUSSION AND ANALYSIS OF FINANCIAL CONDITION AND RESULTS OF OPERATIONS
The following management assessment of the Company’s financial conditiondiscussion and results of operationsanalysis presented in this section should be read in conjunction with theour consolidated financial statements and notes thereto contained herein in Item 8.
Executive Summary
Segment operating performance improved during 2005 relative to the prior year, with the Unum Limited segment, the Colonial segment, and many of the lines of business in the U.S. Brokerage segment reporting stable or improving operating performance. The Company believes that its U.S. Brokerage segment group income protection business continues to exhibit long-term improvement with respect to underwriting, pricing, and expense management due to the actions taken over the past several quarters to increase the profitability in this business. Claims management resultsOur primary objectives for U.S. Brokerage group long-term income protection during 2005 were below the Company’s long-term expectations for this business.2008 included:
Combined statutory capital and surplus for the Company’s U.S. insurance subsidiaries was approximately $4.270 billion at December 31, 2005, compared to $4.105 billion at December 31, 2004, maintaining the desired capital strength and dividend capacity.
The Company’s 2005 priorities were as follows:
Progress in 2005 included the following:
| • |
|
| • | Continued innovation throughout our businesses. Within Unum US, we broadly launchedSimply Unum in the |
| • | Leveraging of our leadership positions and marketplace reputation. We built on the |
| • | Execution of |
| • | Professional development of our employees. We continued our emphasis on training and leadership development and talent management |
Through focusing on these objectives, we believe that we have instilled greater confidence in our company among our constituents. In commenting on our results for 2008, we will discuss our operating performance, strategic and capital initiatives, the current economic environment, and our major areas of focus for 2009.
Operating Performance
During 2008, Unum Limited and Colonial segments produced favorable operating resultsUS reported an increase in 2005 relative to 2004, with segment operating income increasing $36.4 million, or 24.1of 12.5 percent for Unum Limited and $12.5 million, or 8.0 percent, for Colonial. Sales for Colonial increased marginally compared to 2004, but gained growth momentum inthe prior year and excluding the 2007 revision to the claim reassessment reserve estimate. The group disability benefit ratio was 88.7 percent for the fourth quarter of 2005. Sales2008 and 89.9 percent for full year 2008, consistent with our goal of continual profit margin improvement for this line of business. Unum US sales increased 11.0 percent in 2008 compared to 2007. Our group core market segment, which we define for Unum Limited decreased relativeUS as employee groups with less than 2,000 lives, had a sales increase of 23.7 percent over the prior year, and the number of new accounts increased 16.4 percent. Our supplemental and voluntary sales increased 6.8 percent in 2008 compared to last year, with a 14.6 percent increase in voluntary sales offsetting the expected decrease in sales of individual long-term care. Sales in the group large case market segment declined 1.8 percent compared to the prior year. During the third quarter of 2007, we introducedSimply Unum, an integrated platform of products and online services that we believe will transform the benefits marketplace through innovative solutions for our group core market segment and our voluntary market. The initial limited market rollout occurred in 2007, and we have now expanded the availability ofSimply Unum to 45 states nationwide. We will complete the rollout to the remaining states as state approvals are received. We are also in the process of developing additional products and services.
Our Unum UK segment continues to produce excellent operating results, with an increase in segment operating income of 6.5 percent for 2008, as measured in Unum UK’s local currency, relative to 2007. The functional currency of Unum UK is the British pound sterling, and we translate Unum UK’s pound-denominated financial statements into dollars for our consolidated financial reporting. The recent fluctuations in the pound to dollar exchange rate have decreased our current year due primarilyresults relative to higher2007, particularly results reported for the second half of 2008. We expect this volatility in translated financial results, which is a financial reporting issue and is not indicative of an operating problem, to continue in 2009. Overall sales during 2004 that resultedin Unum UK increased 3.6 percent in 2008 compared to the prior year. Sales in 2007 benefited from the exitchange in age equality legislation more so than in 2008. Excluding sales related to the change in age equality legislation from all comparable periods, Unum UK achieved underlying sales growth of a major insurer from theapproximately 16 percent in 2008 relative to 2007. The U.K. market butremains highly competitive. We are developing new products and services to target new customer segments. During 2008 we launched a dual benefit group life sales were also negatively impacted duedisability product designed for the needs of the smaller employer.
Index to Financial Statements
Our Colonial Life segment reported an increase in segment operating income of 9.1 percent in 2008 compared to the competitive environmentprior year. Colonial Life’s sales increased 1.6 percent in 2008 relative to last year, with sales in the U.K.commercial market segment for employee groups with less than 100 lives increasing 6.9 percent. The number of new accounts and the average new case size both increased over the prior year. During the latter part of 2007, we introduced a new hospital confinement indemnity insurance plan product and a group limited benefit medical plan product, and in the first quarter of 2008, we introduced the new Colonial Life brand. We are pleased with the marketplace reception for our new Colonial Life brand and these new product offerings. Colonial Life continues to expand its enrollment capabilities and its product offerings. In the third quarter of 2008, Colonial Life introduced two new life products and the Company’s decisionlatest release of its enrollment system,Harmony, which offers multiple enrollment solutions. In addition, all of Colonial Life’s individual products, including the two new life products, are available onHarmony.
Our investment strategy continues to provide benefits to our overall business performance. We are focused on both the quality of our investment portfolio and on investing new money in investments appropriate for our liabilities and with yields that will increase our portfolio yield. Our net investment income in 2008 was slightly below the level of 2007 due primarily to a decrease in the level of bond call premiums. Included in 2008 results are net realized investment losses from sales and write-downs of investments related primarily to fixed maturity securities in the financial institutions, automotive, and media sectors that we either sold or considered other than temporarily impaired during the third and fourth quarters of 2008. We believe our investment portfolio is well positioned for the current environment, with historically low levels of below-investment-grade securities, no exposure to subprime mortgages, “Alt-A” loans, or collateralized debt obligations in our asset-backed or mortgage-backed securities portfolios, and minimal exposure to collateralized debt obligations within our public bond portfolio. Further discussion is included in “Investments” contained in this Item 7.
Strategic and Capital Initiatives
The first priority of our capital management strategy is to maintain its pricing discipline.
Maintain a risk based capital ratio of 300 percent or greater for our traditional U.S. insurance subsidiaries. This is to pressurebe measured on a weighted average basis using the Company’sNAIC Company Action Level formula.
Maintain leverage at approximately 25 percent. Leverage will be measured as total debt to total capital, which we define as total long-term and short-term debt plus stockholders’ equity, excluding the net unrealized gain or loss on securities and the net gain or loss on cash flow hedges. This target level excludes the non-recourse debt and associated capital of Tailwind Holdings and Northwind Holdings.
Maintain cash and liquid investments at our holding companies sufficient to cover one year of fixed charges (measured as interest expense plus common stock dividends) plus a capital fund which will vary with business and economic conditions.
Maintain a common stock dividend yield that is near the median of our peer companies.
At the end of 2008, all of our financial measurements for capital management continue to compare favorably to our target levels. We have completed our $700.0 million authorized share repurchase program, and we have maintained our leverage at 21.5 percent, compared to 21.4 percent at the end of 2007.
See “Liquidity and Capital Resources” contained in this Item 7 for further detail.
Economic Environment
Analysis and stress testing are important aspects of understanding our financial risk exposure and developing proactive risk management efforts. As part of our recessionary analysis, we have identified the following potential challenges to our 2009 business outlook, as well as what we perceive to be opportunities and mitigating factors, resulting from the current economy.
Index to Financial Statements
Potential Challenges
Lower premium income from fewer employees in the work-force of our markets; employer- and employee-paid cost pressures may also limit sales and reduce persistency.
Lower net investment results in 2005. The Company believes its portfolios are well positionedincome from an asset-liability management perspective and thatfewer long-term assets to match our liability portfolio; lower bond call prepayment income.
Lower investment income and/or higher realized investment losses due to an increase in interestdefaults.
Higher unrealized investment losses.
Higher disability claim costs.
Higher operating expense ratios due to declining premiums.
Opportunities and Mitigating Factors
Lower premium income may be mitigated by mix of business and by our growing position in the voluntary market.
Lower premium income may be mitigated by the flexibility of our product design and pricing.
We may achieve higher investment income from wider corporate spreads which enhance investment income associated with new purchases of fixed maturity securities.
We have low levels of exposure to high risk investments.
We believe our claim reserve discount rates are adequate relative to investment portfolio yield rates.
We believe our risk management is strong; we have a diversified business mix, with a core market focus which generally has lower and less volatile claim incidence.
Our historical pattern of benefits paid to revenues is consistent, even slightly, will improveduring cycles of economic downturns.
We manage our expenses aggressively and have cost management initiatives in place.
We believe our risk-based capital and holding company liquidity position us well for an economic downturn.
Our business outlook recognizes both the Company’s ability to grow the profitability of its businesses. Despite this continued low interest rate environment and flat yield curve, allchallenges of the reserve interest marginscurrent economic environment as well as the mitigating impact of risk-reducing actions we have taken in recent years, including product diversification across sectors and locations, our mix of business, our disciplined underwriting, pricing, claims, and expense management, a reduced credit risk profile in our investment portfolio, our capital management strategy, and better risk management practices. Our outlook is responsive to our risk management framework and is consistent with our risk appetite. Although occurrence of one or more of the risk factors previously discussed herein in Item 1A may cause our results to differ from our outlook, we believe that our business outlook is built on sound operating plans that have been tested against many of the challenges presented by the current economic environment.
Focus for 2009
During 2009, we intend to continue our focus on a number of key areas.
| • | Consistent execution of our operating plans. We will continue our emphasis on disciplined, profitable growth. |
| • | Maintain a strong investment portfolio. We will maintain disciplined credit analysis in our selection of investment assets and continue to be conservative within our investment risk tolerances. |
| • | Build and effectively use capital. We intend to continue to build capital and manage it effectively within our stated capital management strategy objectives. |
| • | Professional development of our employees. We will continue our focus on employee training and development as well as talent management. |
Index to Financial Statements
2008 Significant Transactions and Events
Legal and Regulatory Issues
On January 12, 2009, in a two-to-one decision, the Sixth Circuit Court of Appeals reversed the District Court’s earlier ruling certifying a class in the Company’s primary business lines remained abovecase styled,In re UnumProvident Corp. ERISA Benefits Denial Actions. On January 26, 2009, the Company’s target range at year-end 2005, andplaintiffs filed a petition for rehearing of this decision by the full court. The District Court has yet to rule on our pending motions for judgment on the pleadings or for summary judgment.
During 2008, we reached a settlement in the current interest rate environment,Shareholder Derivative action that was originally filed in 2002. Under the Company believesterms of the settlement, which is subject to approval of the court, we have agreed to implement or continue certain corporate governance measures and pay plaintiffs’ attorneys’ fees in an amount to be determined by the court.
Also during 2008, we reached a settlement with the U.S. Attorney in San Diego regarding broker compensation disclosure practices dating back several years. While this settlement was only recently finalized, it covers issues that were resolved several years ago with other regulators. We have worked cooperatively with the U.S. Attorney’s office since its marginsinquiry into the industry’s compensation practices began. As part of the settlement, we agreed to a payment of $5.6 million and included this expense in our 2008 results. Compliance with the terms of the settlement agreement will remain adequate.
We continue to work closely with our regulators and also continue to work toward resolution of other outstanding legal and regulatory issues. See Note 14 of the “Notes to Consolidated Financial Statements” contained herein in 2005Item 8 for information on our legal proceedings.
Financing
During 2007, Unum Group’s board of directors authorized the repurchase of up to $700.0 million of Unum Group common stock. During 2008, we completed our share repurchase program and $42.5purchased 29.9 million resultingshares of Unum Group common stock for $700.0 million.
During the second quarter of 2008, we retired the remaining $175.0 million of our 5.997% senior notes. During 2008, we made principal payments of $59.3 million and $10.0 million on our senior secured non-recourse variable rate notes issued by Northwind Holdings and Tailwind Holdings, respectively. We also purchased and retired $36.6 million of our 6.85% senior debentures due 2015 and $17.8 million of our outstanding 5.859% senior notes due in May 2009.
In December 2008, we obtained a new credit facility. The current facility establishes a $250.0 million unsecured revolving line of credit and replaces an existing facility. We intend to use any drawn borrowings from the multistate settlement agreementsfacility for general corporate purposes. Any actions that we may take will be consistent with our stated capital management strategy.
See “Liquidity and Capital Resources” contained in 2004, as discussedthis Item 7 and Note 8 of the “Notes to Consolidated Financial Statements” contained herein in Item 8 for additional information.
Index to Financial Statements
Other
During the operating expense ratio increased slightlyfirst quarter of 2008, we established a new non-insurance company, Unum Ireland Limited, which is an indirect wholly-owned subsidiary of Unum Group. The purpose of Unum Ireland Limited is to 21.1 percentexpand our information technology resource options to ensure that our resource capacity keeps pace with the growing demand for 2005 comparedinformation technology support. This subsidiary, which is located in Carlow, Ireland, had approximately 40 full-time employees at the end of 2008.
Accounting Pronouncements
Effective January 1, 2008, we adopted the provisions of Statement of Financial Accounting Standards No. 157 (SFAS 157),Fair Value Measurements. SFAS 157 defines fair value, establishes a framework for measuring fair value, and expands disclosures about fair value measurements. The adoption of SFAS 157 did not have a material effect on our financial position or results of operations.
Effective December 31, 2008, we adopted the provisions of FASB Staff Position No. EITF 99-20-1, (FSP EITF 99-20-1),Amendments to 20.8 percentthe Impairment Guidance of EITF Issue No. 99-20. This FSP amends the impairment guidance in Emerging Issues Task Force (EITF) Issue No. 99-20, Recognition of Interest Income and Impairment on Purchased Beneficial Interests and Beneficial Interests That Continue to Be Held by a Transferor in Securitized Financial Assets,” to achieve more consistent determination of whether an other-than-temporary impairment has occurred. The FSP also retains and emphasizes the objective of an other-than-temporary impairment assessment and the related disclosure requirements in Statement of Financial Accounting Standards No. 115,Accounting for 2004. Premium income has been negatively impactedCertain Investments in Debt and Equity Securities,and other related guidance. The adoption of FSP EITF 99-20-1 did not have a material effect on our financial position or results of operations.
Statement of Financial Accounting Standards No. 161 (SFAS 161),Disclosures about Derivative Instruments and Hedging Activities, an amendment of FASB Statement No. 133, was issued in March 2008. SFAS 161 is intended to improve financial reporting about derivative instruments and hedging activities by requiring enhanced disclosures to enable investors to better understand their effects on an entity’s financial position, financial performance, and cash flows. We will adopt the provisions of SFAS 161 effective January 1, 2009. The adoption of SFAS 161 will amend our disclosures but will have no effect on our financial position or results of operations.
FASB Staff Position No. FAS 132(R)-1, (FSP FAS 132(R)-1),Employers’ Disclosures about Postretirement Benefit Plan Assets, was issued December 30, 2008. This FSP amends Statement of Financial Accounting Standards No. 132 (revised 2003),Employers’ Disclosures about Pensions and Other Postretirement Benefits,to provide guidance on an employer’s disclosures about plan assets of a defined benefit pension or other postretirement plan. The disclosures about plan assets required by this FSP are required for fiscal years ending after December 15, 2009. The adoption of FSP FAS 132(R)-1 will amend our disclosures but will have no effect on our financial position or results of operations.
2007 Significant Transactions and Events
Legal and Regulatory Issues
Revised Claim Reassessment Reserve Estimate
As previously noted, during 2007 we completed the claim reassessment process required by the Company’s targeted2004 and 2005 regulatory settlement agreements. Prior to completion of the claim reassessment process, in the second quarter of 2007 we increased our provision for the estimated cost of the claim reassessment process $53.0 million before tax and $34.5 million after tax based on changes in our emerging experience for the number of decisions being overturned and the average cost per reassessed claim. The revised second quarter of 2007 estimate was based on the cost of approximately 99 percent of the potential inventory of claim reassessment information forms returned to us, with our claim reassessment on approximately 88 percent of the forms completed at that time. At the time of our second quarter of 2007 revision, we had not yet finalized our claim reassessment on the remaining forms but had performed a financial review and included that information in our analysis of emerging experience. Additional information regarding the second quarter revision to our estimate is as follows:
Index to Financial Statements
| 1. | We increased our previous estimate for benefit costs for claims reopened for our Unum US group long-term disability product line $76.5 million. The revision related to the increase during the second quarter of 2007 in the overturn rate and the average cost, as well as a slightly higher number of claims. |
| 2. | We decreased our previous estimate for benefit costs for claims reopened for our Individual Disability – Closed Block segment $10.7 million. Although the experience relative to our assumptions for the overturn rate was slightly higher, experience indicated that the total number of claims for this segment would be less than our previous assumptions. |
| 3. | We decreased our previous estimate for the additional incremental direct claim reassessment operating expenses $12.8 million due to our projections for an earlier completion of the reassessment process. We released $10.3 million for Unum US group long-term disability and $2.5 million for our Individual Disability – Closed Block segment. |
| 4. | These second quarter of 2007 adjustments to our claim reassessment costs decreased 2007 before-tax operating earnings for our Unum US group disability line of business $66.2 million and increased 2007 before-tax operating earnings for our Individual Disability – Closed Block segment $13.2 million. |
Financing
The scheduled remarketing of the senior note element of our 2004 adjustable conversion-rate equity units (units) occurred in February 2007, as stipulated by the terms of the original offering, and we reset the interest rate increaseson $300.0 million of senior notes due May 15, 2009 to 5.859%. We purchased $150.0 million of the senior notes in its group linesthe remarketing which were subsequently retired. In May 2007, we settled the purchase contract element of business. The Company is aggressively managing its expenses against this expected decline in premium income while at the same time continuing to provide innovative and high quality service to its customers.
Throughout 2007, we repaid an additional $619.5 million of our outstanding debt, for total long-term debt repayments of $769.5 million. The cost related to the early retirement of debt during 2007 decreased our 2007 operating results approximately $58.8 million before tax, or $38.3 million after tax.
On October 31, 2007, Northwind Holdings issued $800.0 million of floating rate, insured, senior, secured notes due 2037 in a private offering. The notes bear interest at a floating rate equal to the three month London Interbank Offered Rate (LIBOR) plus 0.78%. Recourse for the payment of principal, interest, and also continues to cooperateother amounts due on the notes will be dependent principally on the receipt of dividends from Northwind Reinsurance Company (Northwind Re), the sole subsidiary of Northwind Holdings. See “Liquidity and provide informationCapital Resources” contained in response to other regulatory investigations, as discussed more fully hereinthis Item 7 and in NoteNotes 8 and 15 of the “Notes to Consolidated Financial Statements” contained herein in Item 8.
In December 2007, we established a $400.0 million unsecured revolving credit facility.
Dispositions
During the announcementfirst quarter of 2007, we completed the sale of our wholly-owned subsidiary, GENEX Services, Inc. (GENEX), a leading workers’ compensation and medical cost containment services provider. Our growth strategy is focused on the development of our primary markets, and GENEX’s specialty role in case management and medical cost containment related to the workers’ compensation market was no longer consistent with our overall strategic direction. We recognized an after-tax gain on the transaction of approximately $6.2 million. See Note 2 of the settlement agreement“Notes to Consolidated Financial Statements” contained herein in Item 8 for additional information.
Accounting Pronouncements
Effective January 1, 2007, we adopted the provisions of Statement of Position 05-1 (SOP 05-1),Accounting by Insurance Enterprises for Deferred Acquisition Costs in Connection With Modifications or Exchanges of Insurance Contracts. SOP 05-1 provides guidance on accounting by insurance enterprises for deferred acquisition costs
Index to Financial Statements
(DAC) on internal replacements of insurance and investment contracts other than those specifically described in Statement of Financial Accounting Standards No. 97,Accounting and Reporting by Insurance Enterprises for Certain Long-Duration Contracts and for Realized Gains and Losses from the Sale of Investments. The cumulative effect of applying the provisions of SOP 05-1 decreased our 2007 opening balance of retained earnings $445.2 million.
Effective January 1, 2007, we adopted the provisions of Financial Accounting Standards Board Interpretation No. 48 (FIN 48),Accounting for Uncertainty in Income Taxes, an interpretation of FASB Statement No. 109 (SFAS 109). FIN 48 clarifies the accounting for uncertainty in income taxes recognized in an enterprise’s financial statements in accordance with SFAS 109. Unlike SFAS 109, FIN 48 prescribes a recognition threshold and measurement attribute for the California DOI,financial statement recognition and again subsequentmeasurement of a tax position taken or expected to be taken in a tax return. Additionally, FIN 48 provides guidance on derecognition, classification, interest and penalties, accounting in interim periods, disclosure, and transition. The cumulative effect of applying the provisions of FIN 48 increased our 2007 opening balance of retained earnings $22.7 million.
Effective January 1, 2007, we adopted the provisions of Statement of Financial Accounting Standards No. 155 (SFAS 155),Accounting for Certain Hybrid Financial Instruments, an amendment of Statement of Financial Accounting Standards Nos. 133 (SFAS 133) and 140 (SFAS 140). SFAS 155: (a) permits fair value remeasurement for any hybrid financial instrument that contains an embedded derivative that otherwise would require bifurcation; (b) clarifies which interest-only strips and principal-only strips are not subject to the issuancerequirements of SFAS 133; (c) establishes a requirement to evaluate beneficial interests in securitized financial assets to identify interests that are freestanding derivatives or that are hybrid financial instruments that contain an embedded derivative requiring bifurcation; (d) clarifies that concentrations of credit risk in the senior notes in November 2005, all four rating agencies reaffirmed the Company’s existing senior debt ratings, as more fully discussed in “Ratings” contained herein.
2006 Significant Transactions and as part of its repatriation plan, issued $400.0 million of ten-year senior notes. Events
Legal and Regulatory Issues
Revised Claim Reassessment Reserve Estimate
In order to maintain its current debt leverage ratio, the Company reduced its outstanding debt $400.0 million during the first quarter of 2006, by participatingwe completed an analysis of our assumptions related to the reserves we established for our claim reassessment process. Our analysis was based on preliminary data as of the end of the first quarter of 2006, when actual results to date were considered credible enough to enable us to update our initial expectations of costs related to the reassessment process. We concluded that a change in our initial assumptions, primarily related to the number of claimants for whom payments will continue because the claimant remains eligible for disability payments, was warranted. We based our conclusion and our revised estimate on the information that existed at that time, which was the actual cost related to approximately 20 percent of the projected ultimate total number of claims expected to be reassessed. The characteristics, profile, and cost of those initial 20 percent of claims were more statistically credible than the information on which we based the initial charges in 2004 and 2005. Based on our analysis, in the remarketingfirst quarter of 2006 we recorded a charge of $86.0 million before tax, or $55.9 million after tax, to reflect our then current estimate of future obligations for benefit costs for claims reopened in the senior note element of the Company’s adjustable conversion-rate equity security units in February 2006.
Duringreassessment. The first quarter charge decreased 2006 the Company’s priorities are:
2005 Significant Transactions and Events
California Settlement Agreement and Amendment of the Multistate Market Conduct Examination Settlement Agreements
On October 3, 2005, certain of the Company’s insurance subsidiaries entered into a settlement agreement with the California DOI, concluding a market conduct examination and investigation of the subsidiaries’ disability claims handling practices. The California DOI had chosen not to join the fourth quarter of 2004 multistate settlement agreements the Company’s insurance subsidiaries entered into with state insurance regulators of 48 states upon conclusion of a multistate market conduct examination. See“Settlement of Multistate Market Conduct Examination” contained herein for further discussion of the multistate settlement agreements.
As part of the settlement with the California DOI, the Company paid a civil penalty of $8.0$72.8 million and agreed to change certain practices and policy provisions related to its California business. The settlement also incorporates claims handling practices previously covered by the multistate settlement agreements and includes certain additional claim handling changes. In entering the settlement, the Company did not agree with the allegations and characterization of the Company’s past claims handling practices made by the California DOI. During the past two years, the Company has undertaken broad changes designed to improve the quality of claims decisions and its service levels to policyholders, including changes made as a result of the multistate settlement agreements. Because of this, the Company does not believe that the California DOI’s allegations or its market conduct examination report provide an accurate portrayal of the Company’s claim practices today.our Individual Disability – Closed Block segment $13.2 million.
Under the terms of the settlement, the Company will change certain provisions specific to California disability policies. Additionally as part of the settlement, the Company received approval from the California DOI for the use of new individual and group disability policy forms, which became available for sale on November 1, 2005.
The California settlement also incorporates the claim reassessment process contained in the 2004 multistate settlement agreements. California claimants were included in the 2004 multistate settlement agreements and could choose to participate in that claim reassessment process even though California did not join the multistate settlement agreements. Under the California agreement, reassessment notices are being mailed to approximately 26,000 individuals whose claims were denied or terminated between January 1, 1997, and September 30, 2005. Many of these individuals had already received reassessment notices under the multistate settlement agreements. Additionally, as part of the California agreement, an individual whose claim denial or termination is upheld by the Company’s reassessment unit may request an independent review by a member of a panel established for that purpose. Following such review, the final decision on the claim is that of the Company’s reassessment unit; however, if there is information that the reviewer believes is appropriate relating to the handling of the claim, the reviewer may add a report to the claim file.
The Company amended the multistate settlement agreements to include mailing a notice of eligibility to participate in the claim reassessment process to approximately 29,500 individuals whose claims were denied or terminated between January 1, 1997, and December 31, 1999. Under the original multistate settlement agreements, claimants during this period could request participation in the reassessment process, but they were not sent a notice. Those claimants who are eligible to participate but do not receive notice pursuant to the amendment remain eligible to request participation until June 30, 2006.
Separately, the Company is offering to reassess private label, acquired, and reinsured block claims, as well as claims administered on behalf of certain employers from January 1, 1997, through January 18, 2005 (and through September 30, 2005 for California residents). These approximately 24,000 claims were not included in the 2004 multistate settlement agreements, but the offer being made generally follows the reassessment procedures contained in those agreements.
Based on the settlement agreement and related matters, inIn the third quarter of 20052006, we increased our provision for the Company recorded a chargecost of $75.0the reassessment process $325.4 million before tax or $51.6and $211.5 million after tax based on changes in our emerging experience for the number of decisions being overturned by the reassessment process and the average cost per reassessed claim. The revised third quarter estimate was based on the cost of approximately 55 percent of the projected ultimate total number of claims expected to be reassessed. The third quarter charge was comprised of four elements: $14.3$310.4 million to reflect our revised estimate of incremental direct operating expenses to conduct the reassessment process; $37.3 millionfuture obligations for benefit costs and reserves fromfor claims reopened fromin the reassessment; $15.4reassessment and $15.0 million for additional benefit costs and reserves for claims already incurred and currently in inventory that are anticipated as a resultincremental direct claim reassessment operating expenses because of the claim process changes being implemented;additional time then estimated to complete the process. Our best estimate of $310.4 million for the reopened claims assumed that the nature and characteristics of the $8.0 million civil penalty.approximately 45 percent remaining claims estimated to be reassessed at that time would be similar to the
Index to Financial Statements
average profile of the 55 percent already reviewed at that time. The third quarter charge decreased before-tax operating results for the U.S. Brokerage segmentour Unum US group income protectiondisability line of business and supplemental and voluntary lines of business $37.4$291.4 million and $3.3 million, respectively, and theour Individual Income ProtectionDisability – Closed Block segment $34.3$34.0 million. The ongoing costs of changes in the claims handling process and governance improvements will be included in the Company’s operating expenses as incurred going forward. These ongoing costs are not anticipated to materially affect the Company’s results of operations.
Status of the Settlement Agreements
In connection with the settlement agreements related to the multistate market conduct examination and the California DOI market conduct examination and investigation, as of mid-February 2006, the Company had completed the mailing of approximately 90 percent of the total required claim reassessment notices. Those individuals who want their claims reviewed have the opportunity to request a claim reassessment information form and have 60 days to complete the form once it is received. Through mid-February 2006, approximately 29 percent of the recipients of the reassessment notice have requested claim reassessment information forms. The rate of response for reassessment is likely to increase over time as many of the individuals have unexpired time remaining to request and complete the necessary information forms. The Company believes that total reserves for the reassessment process are adequate based on the reassessment results to date; however, actual results of the reassessment process may differ from the Company’s initial expectations.
Other Regulatory Investigations
Beginning in 2004, several of the Company’sour insurance subsidiaries’ insurance regulators requested information relating to the subsidiaries’ policies and practices on one or more aspects of broker compensation, quoting insurance business, and related matters. Additionally, the Company haswe responded to investigations about certain of these same matters by state attorneys general and the U.S. Department of Labor.Labor (DOL). Following highly publicized litigation involving the alleged practices of a major insurance broker, the National Association of Insurance Commissioners (NAIC)NAIC has undertaken to provide a uniform Compensation Disclosure Amendment to the Producer Licensing Model Act that can be adopted by states in an effort to provide uniform guidance to insurers, brokers, and customers relating to disclosure of broker compensation. The Company expectsWe expect there to be continued uncertainty surrounding this matter until clearer regulatory guidelines are established.
In June 2004, the Companywe received a subpoena from the NYAG requesting documents and information relating to compensation arrangements between insurance brokers or intermediaries and the Companyus and itsour subsidiaries. The Company has received additional subpoenas or requests for additional information fromIn November 2006, we entered into a settlement agreement on broker compensation with the NYAG concerning its relations with insurance brokers. The NYAG has filed several lawsuits against brokers arising out of its investigation. Several insurers were cited in the complaints but not named as defendants — one such complaint citedform of an assurance of discontinuance that provided for a national restitution fund of $15.5 million and a fine of $1.9 million.
We support the Company but did not name it as a defendant. The Company is cooperating with the NYAG’s investigations and inquiries.
Since October 2004, the Company and/or its insurance subsidiaries have received subpoenas or information requests from the Office of the NYAG, a Federal Grand Jury in San Diego, the District Attorney for the County of San Diego, insurance departments, and/or other state regulatory or investigatory agencies of at least eight additional states including California, Connecticut, Florida, Maine, Massachusetts, North Carolina, Oklahoma, and South Carolina.
The subpoenas and information requests sought information regarding, among other things, quoting processes, producer compensation, solicitation activities, policies sold to state or municipal entities, and information regarding compensation arrangements with brokers, particularly with regard to Universal Life Resources, Inc. The Company is cooperating fully with these investigations.
The Company also has had discussions with the DOL regarding compliance with ERISA, relating to the Company’s interactions with insurance brokers and to regulations concerning insurance information provided by the Company to plan administrators of ERISA plans, including specifically the reporting of fees and commissions paid to agents, brokers, and others in accordance with the requirements of Schedule A of Form 5500. The DOL is pursuing an investigation of the Company concerning these issues, both generally and specifically in connection with certain brokers, including Universal Life Resources. The Company is cooperating with the DOL’s investigation.
The Company has been reviewing its compensation policies and procedures for compliance with applicable legal requirements. In accordance with its announced support forfull disclosure of compensation paid to producers, including both brokers and agents the Company hasand have implemented policies to facilitate customers obtaining information regarding producerbroker compensation from the producers.their brokers. Additionally, the Company provideswe provide appropriate notices to customers stating itsour policy surrounding disclosure and providesprovide information on itsour Company website about its producerour broker compensation programs. Under these policies, any customer who wants specific producerbroker compensation related information can obtain this information by contacting the Company’s Producerour Broker Compensation Services at a toll-free number. Other changes includeimplemented during 2006 included requiring customer approval of compensation paid by the Companyus to the producerbroker when the customer is also paying a fee to the producerbroker and strengthening certain policies and procedures associated with new business and quoting activities.
Financing
The Company is still monitoring developments relating to “contingent commissions” and will consider alternative arrangements when there is more clarity on the issue as a component of producer compensation.
In addition to various regulatory agencies investigating issues relating to broker compensation and quoting practices, the Company has been named as a defendant, along with other insurers, in litigation brought by regulatory agencies or private parties in putative class actions making allegations arising out of broker compensation arrangements or quoting practices. For further information on the various lawsuits, see Note 15scheduled remarketing of the “Notes to Consolidated Financial Statements” contained hereinsenior note element of our 2003 units occurred in Item 8.
Beginning in March 2005, several of the Company’s insurance subsidiaries received requests from various regulatory agencies seeking information relating to finite reinsurance and whether there are any ancillary or verbal side agreements that affect the potential loss underFebruary 2006, as stipulated by the terms of the reinsurance agreement. Additionally,original offering, and we reset the requests seek informationinterest rate on such matters as$575.0 million of senior notes due May 15, 2008 to 5.997%. We purchased $400.0 million of the Company’s usesenior notes in the remarketing which were subsequently retired. In May 2006, we settled the purchase contract element of finite reinsurance, controls relating to proper accounting treatment, and maintenancethe units by issuing 43.3 million shares of underwriting files oncommon stock. We received proceeds of approximately $575.0 million from the reinsurance agreements.transaction.
Throughout 2006, we repaid an additional $332.0 million of our outstanding debt, for total long-term debt repayments of $732.0 million. The Company has respondedcost related to the earlier requests and is in the processearly retirement of responding to the more recent requests.
In Februarydebt decreased our 2006 the Company received from the Financial Services Authority (FSA) in the U.K. the results of the FSA’s recent risk assessment review of Unum Limited. In the normal course of regulatory review, the FSA focuses on the identification and assessment of risks within U.K. regulated businesses. The Company is in the process of responding to the report.
Acquisitions and Dispositions
During 2005, the Company’s wholly-owned subsidiary GENEX acquired Independent Review Services, Inc., a provider of medical diagnostic networks and independent medical examinations, at a price of $3.5 million. This acquisition will broaden GENEX’s product offerings through the addition of medical diagnostic services.
In 2005, Unum Limited completed the sale of its Netherlands branch. The gain on the sale wasannual income approximately $4.0$25.8 million before tax, or $16.9 million after tax.
In 2005, the Company disposedNovember 2006, Tailwind Holdings, a Delaware limited liability company and a wholly-owned subsidiary of its remaining 40 percent ownership position in its Argentinean operation and recognized an after tax gain of approximately $0.4 million.
Income Tax
Under the Life Insurance Company Tax Act of 1959, U.S. stock life insurance companies were required to maintain a policyholders’ surplus account containing the accumulated portion of income which had not been subjected to income tax in the year earned. The Deficit Reduction Act of 1984 required that no future amounts be added after 1983 to the policyholders’ surplus account and that any future distributions to shareholders from the account would become subject to federal income tax at the general corporate federal income tax rate then in effect. During 2004, the Homeland Investment Act of 2004 was enacted. The Homeland Investment Act of 2004 provides, in part, that distributions from policyholders’ surplus accounts during 2005 and 2006 will not be taxed.
The amount of the policyholders’ surplus accounts of the Company’s U.S. insurance subsidiaries at December 31, 2004, was approximately $228.8 million. Distributions made during 2005 by these life insurance subsidiaries, including dividend distributions, were deemed to occur first from the policyholders’ surplus accounts. As a result, the Company’s U.S. life insurance subsidiaries distributed as dividends the remaining balance of their policyholders’ surplus accounts to the holding company during 2005. This resulted in the elimination of a future potential tax of approximately $80.1 million which had not previously been provided for in current or deferred taxes because management considered the conditions under which such a tax would be paid to be remote. This will also allow the Company to engage in transactions in the future without concern for triggering a tax liability related to distributions from the policyholders’ surplus accounts.
In April 2005, the Internal Revenue Service (IRS) completed its examination of tax years 1999 through 2001 andUnum Group, issued its revenue agent’s report (RAR). Income tax liabilities of approximately $32.0 million that related primarily to interest on the timing of expense deductions were released in the first quarter of 2005, all of which was reflected as a reduction to income tax expense. In the fourth quarter of 2005, the Company paid the IRS proposed adjustments for its 1999 through 2001 tax years and will file claims for refund on disputed issues.
In the third quarter of 2005, the Company recognized an income tax benefit of approximately $10.8 million related to the finalization of income tax reviews of the Company’s U.K. subsidiaries.
During the fourth quarter of 2005, the Company repatriated $454.8 million in unremitted foreign earnings from its U.K. subsidiaries under the Homeland Investment Act of 2004. In connection with the repatriation, the Company recorded current taxes payable on such previously unremitted foreign earnings of approximately $15.3 million and recorded a tax benefit of approximately $18.6 million as a result of the reversal of the deferred tax liability related to unremitted earnings of its foreign subsidiaries, both of which are included in the results reported for 2005.
Financing
During 2005, the Company repaid $227.0$130.0 million of maturing debt. In conjunction with the repatriation, in November 2005, the Company completed a long-term debt offering, issuing $400.0 million of 6.85%floating rate, insured, senior, secured notes due November 15, 2015.
Closed Block Reinsurance Recapture from Centre Life Reinsurance Ltd.
During 2005, the Company recaptured its closed block individual income protection business originally ceded to Centre Life Reinsurance Ltd. in 1996. The recaptured business includes approximately $1.6 billion in invested assets and $185.0 million of annual premium. The effective date of the recapture was August 8, 2005.
Prior to recapture, the reinsurance contract had an embedded derivative that required the bifurcation of the derivative from the basic reinsurance contract. The fair value attributed to the embedded derivative was reported in fixed maturity securities, and the change in the fair value of this embedded derivative was reported as a realized investment gain or loss during the period of change. At the date of recapture, the embedded derivative was terminated, and the time value component of this derivative was recognized as a realized investment loss of $9.4 million before tax.
The underlying operating results of the reinsurance contract, prior to recapture, were reflected in other income. The recapture therefore did not have a material impact on operating income for the Individual Income Protection – Closed Block segment.
On a statutory basis of reporting, the recapture increased statutory surplus $57.5 million in Unum America. The recapture does not have a material impact on the Company’s targeted risk-based capital objectives for its U.S. insurance subsidiaries.
Impact of Hurricanes
During 2005, several hurricanes struck the United States gulf coast region in close proximity and timing. The Company has client companies and sales offices that were impacted by the storms. Some individual policyholders who resided in the area have moved, taken other jobs, or lost their jobs as a result of the storms. In addition, some of the Company’s group policyholders may be unable to continue business as a result of the storms.
The Company has extended its grace period for premium payments due from its policyholders in counties and parishes proclaimed disaster areas by the Federal Emergency Management Agency (FEMA) due to these hurricanes. The Company is unable to estimate a range of reasonably possible losses on policies that may ultimately lapse, but the Company will likely experience some persistency and premium collection reductions during 2006 as a result of the storms. It is also expected that sales in the affected region will be lower for some period of time until recovery is achieved.
The impact on the Company’s financial position and results of operations as a result of these storms is expected to be immaterial.
2004 Significant Transactions and Events
Settlement of Multistate Market Conduct Examination
During 2004, certain of the Company’s insurance subsidiaries entered into settlement agreements with state insurance regulators upon conclusion of a multistate market conduct examination led by Maine, Massachusetts, and Tennessee relating to disability claims handling practices. A total of 48 states and the District of Columbia are parties to the settlement agreements. In addition, the U.S. Department of Labor (DOL), which had been conducting an inquiry relating to certain ERISA plans, is a party to the settlement agreements, and the Office of the NYAG, which had engaged in its own investigation of the Company’s claims handling practices, notified the Company that it was in support of the settlement and was, therefore, closing its investigation on this issue. The examination report did not make any findings of violations of law or market conduct regulations. However, the examination report did identify areas of concern. These became the focus of specific changes and enhancements to the Company’s disability claims handling operations which are designed to assure each claim decision is made in a consistently high quality manner.
The primary components of the settlement agreements include:
In the fourth quarter of 2004, the Company recorded a charge of $127.0 million before tax, or $87.8 million after tax, comprised of four elements: $27.5 million of incremental direct operating expenses to conduct the two-year reassessment process; $44.0 million for benefit costs and reserves from claims reopened from the reassessment; $40.5 million for additional benefit costs and reserves for claims already incurred and currently in inventory that are
anticipated as a result of the claim process changes being implemented; and the $15.0 million fine. The charge decreased before-tax operating results for the U.S. Brokerage segment group income protection and individual income protection – recently issued lines of business $116.7 million and $1.7 million, respectively, and the Individual Income Protection – Closed Block segment $8.6 million. The ongoing costs of changes in the claims handling process and governance improvements will be included in the Company’s operating expenses as incurred going forward. These ongoing costs are not anticipated to materially affect the Company’s results of operations.
The insurance commissioners of Maine, Massachusetts, and Tennessee, the states in which the Company’s three principal insurance subsidiaries are domiciled, began the multistate targeted market conduct examination in September 2003 and, as the lead state regulators, directed the course of the exam. The Company also has an insurance subsidiary domiciled in New York, but New York had been proceeding separately with its market conduct examination prior to commencement of the multistate examination. It became a participating state and also entered into a substantially identical settlement agreement covering the subsidiary domiciled in New York. The purpose of the examination was to determine whether the long-term disability claims handling practices of the Company’s insurance subsidiaries reflected unfair claim settlement practices. Examiners working under the direction of the three lead state regulators reviewed policy forms, manuals, and administration and organization charts, but primarily focused on reviewing individual or group long-term claim files closed, appealed, or open during two time periods from 2002 to early 2004. The claim file review led to discussions with the Company that resulted in the settlement agreements.
A principal feature of the settlement agreements is a reassessment process. Under the agreements, the Company is offering to reassess any individual or group long-term disability claim that was denied or closed since January 1, 2000, except for specific categories of closures such as settlement, death, or payment of maximum benefits. The potential pool of claims decided over the nearly five year period that are eligible for reassessment if the claimant elects to participate is approximately 215,000 claims. However, almost half of these claims are subject to a preliminary determination as to whether the claimant seeking reassessment “returned to work” under the policy, in which case the claim is not eligible for further reassessment. The Company will also accept requests for reassessment from other individuals whose claims were closed after January 1, 1997, and through December 31, 1999, subject to the same closure exceptions as the group receiving notice, and from claimants who dispute the category for closure if it affects their eligibility for reassessment. There will be ongoing oversight by the Company and lead state regulators of the reassessment process. The DOL may also participate in this monitoring of the reassessment process. See previous discussion under“California Settlement Agreement and Amendment of the Multistate Market Conduct Examination Settlement Agreements” contained herein pertaining to subsequent amendments to the multistate settlement agreements’ reassessment process.
The Company also agreed to enhance certain aspects of its claim operations, including making changes to its organization and procedures to improve the consistency of and the support for each claim decision and create an easier process for claimants. First, the Company increased the number of experienced claims professionals involved in making claim decisions, as well as more heavily involved higher levels of management in signing off on adverse claim decisions. Doing so not only put more experienced people into closer contact with claim decisions, but it should also improve turnaround times and clarify accountability for claims decisions. Second, to improve the support for the initial claim decisions, the Company modified its policies regarding medical information, including guidelines for the use of independent medical evaluations and the process for handling claimants with multiple medical conditions. Third, to make it easier for a claimant to understand and proceed through the claim process, the Company added a number of service components, including referring certain claims to field personnel who will meet with the claimant in an effort to make the process less burdensome. Also, there is an additional telephone hotline available to claimants who seek additional assistance. Finally, to further assure consistency in the initial claim decision, the Company added a position of quality compliance consultant to assess the totality of the claim decision and to focus on issues of compliance and documentation.
The final principal part of the settlement agreements addressed aspects of corporate governance which are intended to reflect today’s greater emphasis in this area and to help establish best practices for the industry. A regulatory compliance unit, reporting directly to a newly formed regulatory compliance committee of the board of directors, was created to monitor the reassessment process, compliance with market conduct regulations and ERISA
requirements, as well as general claims handling compliance. The committee is composed of five independent directors, including two directors with significant insurance industry or insurance regulatory experience.
The agreements will remain in place until the later of January 1, 2007, or the completion of an examination of claims handling practices and an examination of the reassessment process, both of which will be conducted by the lead state regulators. In addition to the fine of $15.0 million, the insurance subsidiaries that are parties to the settlement agreements are subject as a group to potential fines for non-compliance with the settlement agreements, including contingent fines of $100,000 per day if certain implementation deadlines are not met and a contingent fine of $145.0 million for failure to satisfactorily meet the performance standards in the settlement agreements relating to the examinations referred to above, which will be conducted in approximately two years. This latter contingent fine relating to examination of the claims handling practices or the reassessment process is limited to a maximum of $145.0 million for both examinations should the performance standards not be met. The performance standard is based on compliance with a maximum tolerance standard for claims procedures based on review of a statistically credible random sample of individual or group claims. The Company believes that the changes it has made to its claims operations and to enhance its oversight functions will substantially reduce the likelihood that the Company would fail to meet the performance standards in the agreements when these examinations are concluded.
Restructuring of Individual Income Protection – Closed Block Business
In the first quarter of 2004, the Company restructured its individual income protection – closed block business wherein three of its insurance subsidiaries entered into reinsurance agreements to reinsure approximately 66.7 percent of potential future losses that occur above a specified retention limit. The individual income protection – closed block reserves in these three subsidiaries comprise approximately 90 percent of the Company’s overall retained risk in the closed block of individual income protection. The reinsurance agreements effectively provide approximately 60 percent reinsurance coverage for the Company’s overall consolidated risk above the retention limit, which equaled approximately $8.0 billion in existing statutory reserves at the date of the transaction. The maximum risk limit for the reinsurer was approximately $783.0 million initially and grows to approximately $2.6 billion over time, after which any further losses will revert to the Company. These reinsurance transactions were effective as of April 1, 2004. The Company transferred cash equal to $521.6 million of reserves ceded in the Individual Income Protection – Closed Block segment plus an additional $185.8 million in cash for a before-tax prepaid cost of insurance which was deferred and is being amortized into earnings over the expected claim payment period covered under the Company’s retention limit. The Company retained the higher yielding investments historically associated with these reserves and redeployed these investments to other lines of business.
In conjunction with the restructuring of the individual income protection – closed block business, effective January 1, 2004, the Company modified its reporting segments to include a separate segment for this business. The reporting, monitoring, and management of the closed block of individual income protection business as a discrete segment is consistent with the Company’s financial restructuring and separation of this business from the lines of business which actively market new products. In the past, this business had been reported in combination with the individual income protection – recently issued line of business. Prior to 2004, detailed separate financial metrics and models were unavailable to appropriately manage this block of business separately from the recently issued individual income protection block of business.
The separation of the closed block business into a separate reporting segment required the Company to perform, separately for the individual income protection – closed block business and individual income protection – recently issued business, impairment testing for goodwill and loss recognition testing for the recoverability of deferred policy acquisition costs and value of business acquired. As required under GAAP, prior to the change in reporting segments, these tests were performed for the individual income protection line of business on a combined basis. The testing indicated impairment of the individual income protection – closed block deferred policy acquisition costs, value of business acquired, and goodwill balances of $282.2 million, $367.1 million, and $207.1 million, respectively. These impairment charges, $856.4 million before tax and $629.1 million after tax, were recorded in the first quarter of 2004.
Also as part of the restructuring, the Company analyzed the reserve assumptions related to its individual income protection – closed block reserves as a stand-alone segment. Previously these reserves were analyzed for the individual income protection line of business on a combined basis. Included in the analysis was a review of morbidity assumptions, primarily claim resolution rates, and claim reserve discount rate assumptions. Based upon this analysis, the Company lowered the claim reserve discount rate to reflect the segmentation of assets between the individual income protection – recently issued business and the individual income protection – closed block business, the change in the Company’s investment portfolio yield rates during the first quarter of 2004, the Company’s expectation of future investment portfolio yield rates, and the Company’s desire to maintain the relationship between the claim reserve discount rate and the investment portfolio yield rate for the individual income protection – closed block at the Company’s long-term objective. The segmentation of the investment portfolio was necessary to ensure appropriate matching of the duration of the assets and the related policy liabilities. Based on this analysis, in the first quarter of 2004 the Company increased its individual income protection – closed block claim reserves by $110.6 million before tax, or $71.9 million after tax, to reflect its current estimate of future benefit obligations. The first quarter 2004 change represented a 1.2 percent increase in total net Individual Income Protection – Closed Block segment reserves as of March 31, 2004, which equaled $9.530 billion prior to this increase.
Financing
As part of the restructuring, in May 2004, the Company issued 12.0 million 8.25% adjustable conversion-rate equity security units (units) in a private offering for $300.0 million.offering. The Company subsequently registered the privately placed securities for resale by the private investors. Proceeds from the offering were used to restore the Company’s insurance subsidiaries’ risk-based capital to the approximate overall level that existed prior to the individual income protection – closed block reinsurance transactionpayment of principal, interest, and to provide additional liquidity at the holding company level.
Acquisitions and Dispositions
In the first quarter of 2004, Unum Limited became responsible for the ongoing administration and management of the United Kingdom portion of the group income protection claims portfolio of Swiss Life (UK) plc (Swiss Life), and Swiss Life reinsured this portfolio to Unum Limited. Unum Limited also became a multi-national pooling partner for Swiss Life Insurance & Pension Company with respect to business written in the United Kingdom.
With the goal of focusing on its core operations, in 2004 the Company sold its Japanese operation, Unum Japan Accident Insurance Co., Ltd. The Company also entered into an agreement with the buyer to reinsure certain existing income protection business and intends to have a continuing presence in these operations for at least one year. The Company wrote down the book value of the Japan operations to the estimated fair value less cost to sell during 2003 and at that time recognized an impairment loss of $1.2 million before tax and $0.8 million after tax. The Company also recognized a tax benefit of $6.8 million, for a net after-tax gain of $6.0 million in 2003.
During the second quarter of 2004, the Company completed the sale of its Canadian branch and reported a loss of $70.9 million after taxother amounts due on the sale. On a statutory basis of reporting, the Company’s U.S. insurance subsidiaries reported a 2004 gain of $250.6 million after taxnotes will be dependent principally on the salereceipt of dividends from Tailwind Reinsurance Company (Tailwind Re), the branch. Additionally, the transaction resultedsole subsidiary of Tailwind Holdings. See “Liquidity and Capital Resources” contained in an approximate 29 point improvement in the Company’s RBC ratio for its U.S. insurance subsidiaries, calculated on a weighted average basis.
Assets transferred to the buyer included available-for-sale fixed maturity securities with a fair value of $1,099.4 million (book value of $957.7 million) and cash of $31.7 million. Liabilities transferred included reserves of $1,254.8 million. The Company retained a portion of the Canadian branch fixed maturity bond portfolio according to the terms of the transaction. At the close of the transaction, the bonds retained had a fair value of $732.9 million and a yield of 7.14 percent, which added approximately four basis points to the investment portfolio yield rate in the Company’s continuing operations. These investments were subsequently redeployed to the Company’s other lines of business. Financial results for the Canadian branch are reported as discontinued operations in the consolidated financial statements. Accordingly, the discussion of results by segment as follows does not include amounts related to those operations. See “Discontinued Operations” contained herein inthis Item 7 and Note 2Notes 8 and 15 of the “Notes to Consolidated Financial Statements” contained herein in Item 8 for further discussion of the Company’s discontinued operations.
In 2004, GENEX acquired Integrated Benefits Management, a provider of case management services, to further broaden GENEX’s relationship and distribution partnerships. The purchase price was $0.7 million.Income Tax
In conjunction with the restructuring of its Argentinean operation, the Company reduced its ownership position in this operation to 40 percent during 2004 and reported a before-tax loss of $4.7 million. The Company alsoDuring 2006, we recognized from this transaction aan income tax benefit of $7.4approximately $91.9 million for a net after-tax gain of $2.7 million onas the 2004 transaction. The Company wrote down the book valueresult of the Argentinean operation to the estimated fair value less cost to sell during 2003 and at that time recognized an impairment loss of $13.5 million before tax and $11.3 million after tax.
Income Tax
During 2004, the Company recognized tax benefits as a result of settlements with the IRS of certain tax issues (primarily related to insurance tax reserves and investment losses) affecting the Company’s federal income tax liability related to its 1996 through 1998 tax years. During the fourth quarter of 2004, the Company obtained a judgment in refund litigation for federal income tax paid for tax year 1984, plus interest, and as a result will be entitled to a refundreversal of tax plus interest for all tax years subsequent to tax year 1984 in which the IRS took inconsistent positions on the deductibility of insurance tax reserves that were the subject of the litigation and for which the Company paid tax based on the IRS’ inconsistent positions. Included in 2004 operating results is income of $14.0 million before tax and approximately $59.3 million after tax attributable to these prior year tax items.
2003 Significant Transactions and Events
Reserve Strengthening
In April 2003, the Company completed an analysis of its assumptions related to its U.S. Brokerage group long-term income protection claim reserves. Included in the analysis was a review of active claim reserves, incurred but not reported (IBNR) reserves, and claim reopen reserves. An active claim reserve is established for future benefit payments when a claim is incurred and reported to the Company. IBNR reserves are established on claims which are estimated to have been incurred but not yet reported to the Company. Claim reopen reserves are established for those claimants who have previously recovered but who are anticipated to return to disabled status under the same disability and within a specified period of time, as contractually allowed by the disability policy. The analysis was initiated based on lower claim resolution rates observed during the first quarter of 2003. The claim resolution rate is the rate of probability that a disability claimant will recover, die, or reach maximum benefit limits and no longer receive benefit payments from the Company. Generally, claim resolution rates vary by the age of the claimant at the time of disability, duration or length of time since the disability initially occurred, and claim diagnosis. The claim resolution rates for group long-term income protection during the first quarter of 2003 were below levels anticipated for reserves and were lower than those experienced in the full years 2002, 2001, and 2000. The analysis indicated not only a decrease in overall claim resolution rates, but also a change in claim resolution rates by claim duration. The analysis of emerging claim resolution rates and the reasons driving the changes resulted in a reduction in the Company’s long-term expectations with respect to claim resolution rates. The Company’s long-term expectations applied to all claims incurred regardless of the date of incurral. In addition, the Company reviewed the reserve discount rate, which is the interest rate at which future cash flows for benefits and expenses to be paid are discounted to determine the current value of those cash flows. The Company concluded at that time that a change in its discount rate assumptions was not warranted. Based on the April 2003 analysis, in the first quarter of 2003 the Company increased its U.S. Brokerage group long-term income protection claim reserves by $454.0 million before tax, or $295.1 million after tax, to reflect its current estimate of future benefit obligations. The active claim reserve for claims already reported to the Company and still in open claim status was increased by $516.0 million, the IBNR reserve was decreased by $23.0 million, and the reopen reserve was decreased by $39.0 million before tax. The first quarter 2003 change represented a 7.8 percent increase in total net U.S. Brokerage group income protection reserves as of March 31, 2003, which equaled $5.828 billion prior to this increase.
In January 2004, the Company completed its annual review of claim reserves to ensure that its claim reserves make adequate and reasonable provision for future benefits and expenses. Based upon this review, as of December 31, 2003, the Company increased its U.S. Brokerage group long-term income protection claim reserves by $421.0 million and its U.S. Brokerage group short-term income protection claim reserves by $19.0 million, for a total
increase of $440.0 million before tax and $286.0 million after tax. Approximately $300.0 million of the reserve strengthening reflected implementation of a lower discount rate for the Company’s group income protection claim reserves. The discount rate was lowered to reflect the Company’s actual change in investment portfolio yield rates during 2003, the expectation of future investment portfolio yield rates, and the Company’s new discount rate management approach of maintaining a wider spread between its group income protection portfolio investment yield rate and its average discount rate. The Company’s new discount rate management approach is intended to better reflect the current investment environment and position the Company to be more responsive with discount rates on new incurred claims as changes to the investment environment emerge. Approximately $140.0 million of the reserve increase related to a strengthening of the morbidity assumptions to reflect the impact of the Company’s view of a continuing jobless economic recovery on claim incidence and severity. Of this amount, approximately $64.0 million was established to reflect higher claim incidence expectations. Claim incidence in the second half of 2003 was 8.4 percent higher than the first half of the year and 5.8 percent above the second half of 2002. The Company’s January 2004 review indicated that claim incidence is expected to continue at an elevated level for several quarters as the Company believes that early indications of a recovering economy are not yet reflected in improved consumer confidence or job creation. Also included in the $140.0 million strengthening was approximately $76.0 million to reflect higher severity expectations driven primarily by a lengthening of claim duration expectations in those claims that have been open 36 months or longer. The $440.0 million reserve increase represented a 6.6 percent increase in total net U.S. Brokerage group income protection reserves as of December 31, 2003, which totaled $6.674 billion prior to this increase.
Acquisitions and Dispositions
During the first quarter of 2003, Unum Limited acquired the United Kingdom group income protection business of Sun Life Assurance Company of Canada (UK) Ltd (Sun Life) together with the renewal rights to Sun Life’s group life business, at a price of approximately $37.2 million.
Furthering its goal of divesting its non-core operations, during 2003, the Company reinsured on a 100 percent indemnity coinsurance basis for non-New York policies and a 90 percent indemnity coinsurance basis for New York policies certain of its insurance policies sold through trade associations and ceded approximately $121.0 million of reserves to the reinsurer. The annual premium on the block reinsured was approximately $40.0 million andliabilities related primarily to individual income protection – closed block policies. The transaction had an effective dategroup relief benefits recognized from the use of April 1, 2003.
Financing
In order to strengthen its capital position, during 2003, the Company issued 52.9 million shares of common stock, par value $0.10 per share,net operating losses in a public offeringforeign jurisdiction in which our businesses operate.
Index to Financial Statements
Accounting Pronouncements
Effective January 1, 2006, we adopted Statement of Financial Accounting Standards No. 123 (revised 2004) (SFAS 123(R)),Share-Based Payment, which is a revision to Statement of Financial Accounting Standards No. 123 (SFAS 123),Accounting for Stock-Based Compensation. SFAS 123(R) focuses primarily on accounting for transactions in which an entity obtains employee service in exchange for share-based payments. Under SFAS 123(R), share-based awards that do not require future service (i.e., vesting awards) are expensed immediately. Share-based employee awards that require future service are amortized over the relevant service period. We adopted SFAS 123(R) using the modified prospective transition method. Under this method, the provisions are generally applied only to share-based awards granted after adoption. The adoption of SFAS 123(R) did not have a material effect on our financial position or results of operations. Additional information concerning the adoption of SFAS 123(R) can be found in Notes 1 and received approximately $547.7 million in proceeds from the sale11 of the shares after deducting underwriting discounts. Also“Notes to Consolidated Financial Statements” contained herein in 2003,Item 8.
Effective January 1, 2006, we adopted the Company issued 23.0 million 8.25% adjustable conversion-rate equity security units (units) in a $575.0 million public offering. Proceeds fromprovisions of FASB Staff Position No. FAS 115-1 (FSP 115-1),The Meaning of Other-Than-Temporary Impairment and Its Application to Certain Investments, which addresses the offerings were used primarily to increasedetermination of when an investment is considered impaired, whether the capitalizationimpairment is other than temporary, and the measurement of the Company’s insurance subsidiaries and to repay amounts loanedan impairment loss. FSP 115-1 also includes accounting considerations subsequent to the Company from its insurance subsidiaries.
Accounting Pronouncementsrecognition of other-than-temporary impairment and requires certain disclosures about unrealized losses. The adoption of FSP 115-1 did not have a material effect on our financial position or results of operations.
Derivatives Implementation Group Issue B36
Effective October 1, 2003, the CompanyDecember 31, 2006, we adopted the provisions of Statement of Financial Accounting Standards No. 133 Implementation Issue B36 (DIG Issue B36)158 (SFAS 158),Embedded Derivatives: Modified Coinsurance ArrangementsEmployers’ Accounting for Defined Benefit Pension and Debt Instruments That Incorporate Credit Risk Exposure That Are UnrelatedOther Postretirement Plans, an amendment of FASB Statements No. 87, 88, 106, and 132(R). SFAS 158 requires an employer to recognize the overfunded or Only Partially Relatedunderfunded status of defined benefit pension and other postretirement plans as an asset or liability in its balance sheet and to the Creditworthinessrecognize changes in that funded status through comprehensive income. Also, under SFAS 158, defined benefit pension and other postretirement plan assets and obligations are to be measured as of the Obligor Under Those Instruments.DIG Issue B36 addresses financial accounting and reporting for embedded derivatives in modified coinsurance contracts that incorporate credit risk exposure unrelated to the credit risk of the counterparty to the reinsurance contract and requires the bifurcation of any such derivative from the host reinsurance contract. The change in the fair value of the derivative is reported as a realized investment gain or loss during the period of change.
The Company had two reinsurance contracts for which DIG Issue B36 was applicable. Transition to the provisions of DIG Issue B36 required the Company to value the credit risk provisions in these contracts as derivatives and report them in the consolidated statements of financial condition at their current fair values, with the change in fair value since inception of the reinsurance contracts up to the date of adoption reported as a 2003 cumulative effect of accounting principle change. The Company included in miscellaneous assets a deposit asset for one of the applicable reinsurance contracts. The deposit asset previously included unrealized gains or losses on the marketable securities held in the trust. Under the provisions of DIG Issue B36, any net unrealized gain was attributed to the value of the embedded derivative and was reported as such in fixed maturity securities. Any net unrealized loss was attributed to the marketable securities held in the trust and reported as an adjustment to the deposit asset, with the related effects on claim reserves reflected in the reinsurance receivable for claim reserves.
employer’s fiscal year-end. The adoption of DIG Issue B36SFAS 158, which resulted in an increase in fixed maturity securities of $61.3$84.1 million to record the fair value of the embedded derivatives, a decrease of $116.1 million in miscellaneous assets, $18.4 million in reinsurance receivable, and $134.5 million in accumulated other comprehensive income (net unrealized gainin stockholders’ equity, had no effect on securities)our results of operations.
Critical Accounting Estimates
We prepare our financial statements in accordance with GAAP. The preparation of financial statements in conformity with GAAP requires us to eliminate the previouslymake estimates and assumptions that affect amounts reported adjustmentin our financial statements and accompanying notes. The accounting estimates we deem to fair valuebe most critical to our results of the marketable securities heldoperations and balance sheets are those related to reserves for policy and contract benefits, deferred acquisition costs, investments, and income taxes. Estimates and assumptions could change in the trustfuture as more information becomes known, which could impact the amounts reported and the related effects on claim reserves, and a $39.9 million cumulative effect ofdisclosed in our financial statements.
For additional information, refer to our significant accounting principle change, net of $21.4 millionpolicies in tax. See Item 8, Notes 1 and 5 of the “Notes to Consolidated Financial Statements” for further discussion.
Stock Compensation
The Company has various stock-based employee compensation plans. Prior to 2003, the Company accounted for those plans under the recognition and measurement principles of Accounting Principles Board Opinion No. 25,Accounting for Stock Issued to Employees, and related Interpretations. Effective January 1, 2003, the Company adopted the fair value recognition provisions of Statement of Financial Accounting Standards No. 123,Accounting for Stock-Based Compensation, and selected the prospective method of adoption allowed under the provisions of Statement of Financial Accounting Standards No. 148,Accounting for Stock-Based Compensation – Transition and Disclosure. The adoption increased before tax operating expenses for 2003 approximately $0.9 million. See Item 8, Note 1 of the “Notes to Consolidated Financial Statements” concerning the subsequent issuance of SFAS 123(R).
contained herein in Item 8.
Critical Accounting Policies
Reserves for Policy and Contract Benefits
Our largest liabilities are reserves for claims that we estimate we will eventually pay to our policyholders. The two primary categories of liabilities for policy and contract benefitsreserves are policy reserves for claims not yet incurred and claim reserves for claims that have been incurred or are estimated to have been incurred but not yet reported to us. These reserves equaled $37.2 billion and have future benefits$36.9 billion at December 31, 2008 and 2007, respectively, or approximately 85 percent of our total liabilities. Reserves ceded to be paid. reinsurers were $6.7 billion and $6.6 billion at December 31, 2008 and 2007, respectively, and are reported as a reinsurance recoverable in our consolidated balance sheets.
Policy Reserves
Policy reserves equalare established in the present value ofsame period we issue a policy and equal the difference between projected future policy benefits and future premiums, allowing a margin for expenses and profit. These reserves are applicable for the majority of the Company’s business, which isrelate primarily to our traditional non interest-sensitive products, including our individual disability, individual and group long-term care, and voluntary benefits products in nature.our Unum US segment; individual disability products in our
Index to Financial Statements
Unum UK segment; disability and cancer and critical illness policies in our Colonial Life segment; and, the Individual Disability – Closed Block segment products. The claim paymentsreserves are estimated usingcalculated based on assumptions established whenthat were appropriate at the date the policy was issued. Throughout the life of the policy, the reserve is based on the original assumptions used for the policy’s issue year. Ordinarily, generally accepted accounting principles require that these assumptionsissued and are not be subsequently modified unless the policy reserves become inadequate (i.e., loss recognition occurs).
Persistency assumptions are based on our actual historical experience adjusted for future expectations.
Claim incidence and claim resolution rate assumptions related to mortality and morbidity are based on actual experience or industry standards adjusted as appropriate to reflect our actual experience and future expectations.
Discount rate assumptions are based on our current and expected net investment returns.
In establishing policy reserves, we use assumptions that reflect our best estimate while considering the potential for adverse variances in actual future experience, which results in a total policy reserve balance that has an embedded reserve for adverse deviation. We do not, however, establish an explicit and separate reserve as a provision for adverse deviation from our assumptions.
We perform loss recognition tests on our policy reserves annually, or more frequently if appropriate, using best estimate assumptions as of the date of the test, without a provision for adverse deviation. We group the policy reserves for each major product line within a segment when we perform the loss recognition tests. If the policy reserves determined using these best estimate assumptions are higher than our existing policy reserves net of any deferred acquisition cost balance, the existing policy reserves are increased or deferred acquisition costs are reduced to immediately recognize the deficiency. Thereafter, the policy reserves for the product line are calculated using the same method we used for the loss recognition testing, referred to as the gross premium valuation method, wherein we use our best estimate as of the gross premium valuation (loss recognition) date rather than the initial policy issue date to determine the expected future claims, commissions, and expenses we will pay and the expected future gross premiums we will receive.
We maintain policy reserves for a policy for as long as the policy remains in force, even after a separate claim reserve is established.
Policy reserves for Unum US, Unum UK, and Colonial Life products, which at December 31, 2008 represented approximately 34.6 percent, 0.2 percent, and 9.2 percent, respectively, of our total gross policy reserves, are determined using the net level premium method as prescribed by GAAP. In applying this method, we use, as applicable by product type, morbidity and mortality incidence rate assumptions, claim resolution rate assumptions, and policy persistency assumptions, among others, to determine our expected future claim payments and expected future premium income. We then apply an interest, or discount, rate to determine the present value of the expected future claims, commissions, and expenses we will pay and the expected future premiums we will receive, with a provision for profit allowed.
Policy reserves for our Individual Disability – Closed Block segment, which at December 31, 2008, represented approximately 12.0 percent of our total gross policy reserves, are determined using the gross premium valuation method based on assumptions established as of January 1, 2004, the date of loss recognition. Key assumptions are policy persistency, claim incidence, claim resolution rates, commission rates, and maintenance expense rates. We then apply an interest, or discount, rate to determine the present value of the expected future claims, commissions, and expenses we will pay as well as the expected future premiums we will receive. There is no provision for profit. The interest rate is based on our expected net investment returns on the investment portfolio supporting the reserves for this segment. Under the gross premium valuation method, we do not include an embedded provision for the risk of adverse deviation from these assumptions. Gross premium valuation assumptions do not change after the date of loss recognition unless reserves are again determined to be inadequate.deficient. We perform loss recognition tests on the policy reserves for this block of business quarterly.
The Corporate and Other segment includes certain products no longer actively marketed, the majority of which have been reinsured. Policy reserves for this segment represent $5.6 billion on a gross basis, or approximately 44.0 percent, of our total policy reserves. We have ceded $4.2 billion of the related policy reserves to reinsurers. The ceded reserve balance is reported in our consolidated balance sheets as a reinsurance recoverable. We continue to service a block of group pension products, which we have not ceded, and the policy reserves for these products are
A claim reserve is
Index to Financial Statements
based on expected mortality rates and retirement rates. Expected future payments are discounted at interest rates reflecting the anticipated investment returns for the assets supporting the liabilities.
Claim Reserves
Claim reserves are established when a claim is incurred or is estimated to have been incurred but not yet reported (IBNR) to the Company. Policy reserves for a particular policy continue to be maintained after a claim reserve has been established forus and, as long as the policy remains in force. Claim reserves generally equal the Company’sprescribed by GAAP, equals our long-term best estimate at the current reporting period, of the present value of the liability for future benefitsclaim payments and expenses to be paid on claims incurred as of that date.claim adjustment expenses. A claim reserve for a specific claim is based on assumptions derived fromactual known facts regarding the Company’s actual historical experienceclaim, such as to claim duration as well as the specific characteristics of the claimant such as benefits available under the applicable policy, the covered benefit period, and the age and occupation of the claimant. Consideration is given to current andclaimant, as well as assumptions derived from our actual historical trends in the Company’s experience and to expected deviations from historical experience that result fromfuture changes in benefits available, changes in the Company’s risk management policies and procedures, and other economic, environmental, or societal factors. Reservesexperience for claims that are estimated to have already been incurred but that have not yet been reported to the Company are based on factors such as the claim duration and discount rate. Reserves for IBNR claims, similar to incurred claim reserves, include our assumptions for claim duration and discount rates but because we do not yet know the facts regarding the specific claims, are also based on historical incidence rate assumptions, including claim reporting patterns, the average cost of claims, and the expected volumes of incurred claims. Our incurred claim reserves and IBNR claim reserves do not include any provision for the risk of adverse deviation from our assumptions.
Claim reserves, unlike policy reserves, are subject to revision as current claim experience and projections of future factors affecting claim experience change. In a reporting period, actual experience may deviate from the long-term assumptions used to determine the claim reserves. The Company reviews annually, or more frequently as appropriate,Each quarter we review our emerging experience to ensure that itsour claim reserves make adequateare appropriate. If we believe, based on our actual experience and reasonable provisionour view of future events, that our long-term assumptions need to be modified, we adjust our reserves accordingly with a charge or credit to our current period income.
Multiple estimation methods exist to establish claim reserve liabilities, with each method having its own advantages and disadvantages. Available reserving methods utilized to calculate claim reserves include the tabular reserve method, the paid development method, the incurred loss development method, the count and severity method, and the expected claim cost method. No singular method is better than the others in all situations and for future benefitsall product lines. The estimation methods we have chosen are those that we believe produce the most reliable reserves at that time.
Claim reserves supporting our Unum US group and expenses. The Company’sindividual disability and group and individual long-term care lines of business and our Individual Disability – Closed Block segment represent approximately 39.6 percent and 43.4 percent, respectively, of our total claim reserves at December 31, 2008. We use a tabular reserve methodology for group and individual income protectionlong-term disability and group and individual long-term care claims that have been reported. Under the tabular reserve methodology, reserves for reported claims are based on certain characteristics of the actual reported claimants, such as age, length of time disabled, and medical diagnosis. We believe the tabular reserve method is the most accurate to calculate long-term liabilities and allows us to use the most available known facts about each claim. IBNR claim reserves for our long-term products include a provision for future payments, other than legal expenses, on all claim related lawsuits for whichare calculated using the causecount and severity method using historical patterns of action has already occurred. This includes known lawsuits and those yetthe claims to be filed. The reserve amount isreported and the Company’s estimate of the payments on all such lawsuits based on past payments and expected future payments.
Claim reserves, in general, areassociated claim costs. For group short-term disability products, an estimate of the current value of future otherwise unfunded, benefit commitments or liabilities. The calculationpayments to be made on claims already submitted, as well as IBNR claims, is determined in aggregate rather than on the individual claimant basis that we use for our long-term products, using historical patterns of claim incidence as well as historical patterns of aggregate claim resolution rates. The average length of time between the event triggering a claim under a policy and the final resolution of those claims is much shorter for these products than for our long-term liabilities and results in less estimation variability.
Claim reserves involves numerous assumptions. In settingsupporting the Unum US group life and accidental death and dismemberment products represent approximately 3.8 percent of our total claim reserves at December 31, 2008. Claim reserves for these products are related primarily to death claims reported but not yet paid, IBNR death claims, and a liability for waiver of premium benefits. The death claim reserve is based on the actual face amount to be paid, the IBNR reserve is calculated using the count and severity method, and the waiver of premium benefits reserve is calculated using the tabular reserve methodology.
Index to Financial Statements
Claim reserves supporting our Unum UK segment represent approximately 8.5 percent of our total claim reserves at December 31, 2008, and are calculated using generally the same methodology that we use for Unum US disability and group life reserves. The assumptions used in calculating claim reserves for this line of business are based on standard United Kingdom industry experience, adjusted for Unum UK’s own experience.
The majority of the Company depends upon industry informationColonial Life segment lines of business have short-term benefits, which have less estimation variability than our long-term products because of the shorter claim payout period. Our claim reserves for Colonial Life’s lines of business, which approximate 1.4 percent of our total claim reserves at December 31, 2008, are predominantly determined using the incurred loss development method based on our own experience. The incurred loss development method uses the historical patterns of payments by loss date to predict future claim payments for each loss date. Where the incurred loss development method may not be appropriate, we estimate the incurred claims using an expected claim cost per policy or other measure of exposure. The key assumptions for claim reserves for the Colonial Life lines of business are: (1) the timing, rate, and experience, Company experienceamount of estimated future claim payments; and analysis,(2) the estimated expenses associated with the payment of claims.
The following table displays policy reserves, incurred claim reserves, and reasoned judgment. There can be no guarantee that these assumptions individually, or collectively,IBNR claim reserves by major product line, with the summation of the policy reserves and claim reserves shown both gross and net of the associated reinsurance recoverable. Incurred claim reserves represent reserves determined for each incurred claim and also include estimated amounts for litigation expenses and other expenses associated with the payment of the claims as well as provisions for claims which we estimate will be duplicated by actual experience over time. The primary assumptions related toreopened for our long-term care products. IBNR claim reserves are the discount rate, the claim resolution rate, and the incidence rateinclude provisions for incurred but not reported (IBNR) claims.
The discount rate is the interest rate at which future benefit cash flows are discounted to determine the present value of those cash flows. It is important since higher discount rates produce lower reserves. If the discount rate is higher than future investment returns, the Company’s assets will not earn sufficient investment income to support future liabilities. In this case, the reserves may eventually be insufficient. Alternatively, if a discount rate is chosen that is too low relative to future investment results, the reserve, and thus the claim cost in the current period, will be overstated and profits will be accumulated in the reserves rather than released through earnings. The Company sets its discount rate assumptions in conjunction with the current and expected future investment income rate of the assets supporting the reserves. If the investment yield at which new investments are purchased is below or above the investment yield of the existing investment portfolio, it is likely that the discount rate on new claims will be established below or above the discount rate on existing claims. It is the Company’s intent to use a discount rate that provides some margin for adverse movement in the investment portfolio yield rate.
Since policies may receive claim payments for a number of years, it is unlikely that the chosen discount rate assumption will prove to be accurate for any one policy; rather, the discount rate is chosen to apply to many claims with various characteristics of length and severity. The Company uses its experience and analysis of its existing claims and investment performance to determine the appropriate discount rate assumption. Actuala provision for reopened claims for our disability products. The IBNR and reopen claim reserves incurredfor our disability products are developed and maintained in the calendar quarter are sensitiveaggregate based on historical monitoring that has only been on a combined basis.
Index to the choice of discount rate. For example, a 25 basis point increase or decrease in the U.S. Brokerage group long-term income protection claim discount rate for current year claims would change a quarter’s incurred claim cost in 2005 by approximately $4.0 million.The claim resolution rate is the rate of probability that a disability claim will close or change due to maximum benefits being paid under the policy, the recovery or death of the insured, or a change in status in any given period. It is important because it is used to estimate how long benefits will be paid for a claim. Estimated resolution rates that are set too high will result in reserves that are lower than they need to be to pay the claim benefits over time. A claim closes due to maximum benefits being paid if all of the contractual benefits under the policy have been paid. A claim also closes if the policyholder recovers from his or her disability and is no longer receiving disability benefit payments or if the policyholder dies in the period. A claim may change status during the period. For example, a policyholder receiving disability benefits may return to part time work, and the claim benefit may be reduced to reflect the change to partial disability. Establishing claim resolution assumptions is complex and involves many factors, including the cause of disability, the policyholder’s age, the type of contractual benefits provided, etc. Claim resolution assumptions also vary by duration of disability and time since initially becoming disabled. The Company uses its extensive claim experience and analysis to develop its claim resolution assumptions. Claim resolution experience is studied over a number of years with more weight placed on the more recent experience. Claim resolution assumptions are established to represent the Company’s future resolution rate expectations. Due to the individual nature of each claim, it is unlikely that the claim resolution rate will be accurate for any particular claim. The Company establishes its claim resolution assumptions to apply as an average to its large base of active claims. In this manner, the assumed rates are much more accurate over the broad base of claims. Actual claim reserves incurred in the calendar quarter are sensitive to the choice of resolution rate. For example, a
one percent increase or decrease in the U.S. Brokerage group long-term income protection claim resolution rate would change a quarter’s incurred claim cost in 2005 by approximately $3.0 million.
The Company has liability for claims that have been incurred but not reported to the Company and must establish a liability for these claims equal to the present value of the expected benefit payments. In addition to the discount rate and claim resolution rate, the incidence rate is also a primary assumption in the IBNR reserve. The incidence rate is the rate at which new claims per thousand insured lives are submitted to the Company. The incidence rate is affected by many factors including the age of the insured, the insured’s occupation or industry, the benefit plan design, and certain external factors such as consumer confidence and levels of unemployment. The Company establishes the incidence assumption using a historical review of actual incidence results along with an outlook of future incidence expectations. As the actual claims are reported and claim reserves are established, the accuracy of the IBNR emerges. While the Company expects its IBNR reserve to be appropriate over the long term, it will not always equal, in a particular reporting period, the actual reserve established for a reported claim. For example, a 10 basis point deviation in the actual incidence rate from that assumed in the U.S. Brokerage IBNR reserve would result in an increase or decrease of approximately $10.0 million in claim reserves established during a quarter in 2005, relative to the IBNR reserve previously established to cover those claims.
Presented as follows are reserves by each major line of business within each segment with discussion regarding material changes.
Financial Statements
(in millions of dollars)
| December 31, 2008 | ||||||||||||||||||||||||
| Gross | Total Reinsurance Ceded | Total Net | ||||||||||||||||||||||
| Policy Reserves | % | Claim Reserves | % | Total | ||||||||||||||||||||
| Incurred | IBNR | |||||||||||||||||||||||
Group Disability | $ | - | - | % | $ | 7,799.1 | $ | 583.1 | 34.3 | % | $ | 8,382.2 | $ | 81.1 | $ | 8,301.1 | ||||||||
Group Life and Accidental Death & Dismemberment | 72.9 | 0.6 | 750.1 | 170.3 | 3.8 | 993.3 | 0.9 | 992.4 | ||||||||||||||||
Individual Disability - Recently Issued | 493.6 | 3.9 | 882.5 | 90.3 | 4.0 | 1,466.4 | 84.1 | 1,382.3 | ||||||||||||||||
Long-term Care | 2,915.3 | 22.9 | 295.9 | 35.2 | 1.3 | 3,246.4 | 48.9 | 3,197.5 | ||||||||||||||||
Voluntary Benefits | 925.5 | 7.2 | 21.1 | 37.0 | 0.2 | 983.6 | 19.1 | 964.5 | ||||||||||||||||
Unum US Segment | 4,407.3 | 34.6 | 9,748.7 | 915.9 | 43.6 | 15,071.9 | 234.1 | 14,837.8 | ||||||||||||||||
Unum UK Segment | 22.6 | 0.2 | 1,887.6 | 181.5 | 8.5 | 2,091.7 | 102.7 | 1,989.0 | ||||||||||||||||
Colonial Life Segment | 1,172.2 | 9.2 | 237.0 | 97.3 | 1.4 | 1,506.5 | 31.1 | 1,475.4 | ||||||||||||||||
Individual Disability - Closed Block Segment | 1,527.6 | 12.0 | 10,239.9 | 350.3 | 43.4 | 12,117.8 | 1,456.6 | 10,661.2 | ||||||||||||||||
Corporate and Other Segment | 5,605.4 | 44.0 | 490.7 | 270.1 | 3.1 | 6,366.2 | 4,853.8 | 1,512.4 | ||||||||||||||||
Subtotal, Excl. Unrealized Adj. | $ | 12,735.1 | 100.0 | % | $ | 22,603.9 | $ | 1,815.1 | 100.0 | % | 37,154.1 | 6,678.3 | 30,475.8 | |||||||||||
Adjustment to Reserves for Unrealized Investment Losses | (803.1) | (31.9) | (771.2) | |||||||||||||||||||||
Consolidated | $ | 36,351.0 | $ | 6,646.4 | $ | 29,704.6 | ||||||||||||||||||
| December 31, 2007 | ||||||||||||||||||||||||
| Gross | Total Reinsurance Ceded | Total Net | ||||||||||||||||||||||
| Policy Reserves | % | Claim Reserves | % | Total | ||||||||||||||||||||
| Incurred | IBNR | |||||||||||||||||||||||
Group Disability | $ | - | - | % | $ | 7,770.4 | $ | 596.9 | 33.8 | % | $ | 8,367.3 | $ | 92.9 | $ | 8,274.4 | ||||||||
Group Life and Accidental Death & Dismemberment | 73.9 | 0.6 | 772.4 | 178.5 | 3.8 | 1,024.8 | 3.4 | 1,021.4 | ||||||||||||||||
Individual Disability - Recently Issued (1) | 458.4 | 3.8 | 808.3 | 86.6 | 3.6 | 1,353.3 | 79.4 | 1,273.9 | ||||||||||||||||
Long-term Care | 2,478.2 | 20.4 | 244.3 | 32.6 | 1.1 | 2,755.1 | 52.6 | 2,702.5 | ||||||||||||||||
Voluntary Benefits | 853.1 | 7.0 | 19.1 | 35.0 | 0.2 | 907.2 | 14.6 | 892.6 | ||||||||||||||||
Unum US Segment | 3,863.6 | 31.8 | 9,614.5 | 929.6 | 42.5 | 14,407.7 | 242.9 | 14,164.8 | ||||||||||||||||
Unum UK Segment | 30.7 | 0.2 | 2,420.4 | 268.8 | 10.8 | 2,719.9 | 149.3 | 2,570.6 | ||||||||||||||||
Colonial Life Segment | 1,091.7 | 9.0 | 239.9 | 104.1 | 1.4 | 1,435.7 | 33.4 | 1,402.3 | ||||||||||||||||
Individual Disability - Closed Block Segment (1) | 1,657.2 | 13.6 | 10,043.5 | 362.0 | 42.0 | 12,062.7 | 1,374.4 | 10,688.3 | ||||||||||||||||
Corporate and Other Segment | 5,515.2 | 45.4 | 518.3 | 288.9 | 3.3 | 6,322.4 | 4,770.8 | 1,551.6 | ||||||||||||||||
Subtotal, Excl. Unrealized Adj. | $ | 12,158.4 | 100.0 | % | $ | 22,836.6 | $ | 1,953.4 | 100.0 | % | 36,948.4 | 6,570.8 | 30,377.6 | |||||||||||
Adjustment to Reserves for Unrealized Investment Gains | 859.3 | - | 859.3 | |||||||||||||||||||||
Consolidated | $ | 37,807.7 | $ | 6,570.8 | $ | 31,236.9 | ||||||||||||||||||
(1) Amounts have been reclassified to conform to current year presentation.
Key Assumptions
The calculation of policy and claim reserves involves numerous assumptions, but the primary assumptions used to calculate reserves are (1) the discount rate, (2) the claim resolution rate, and (3) the claim incidence rate for policy reserves and IBNR claim reserves. Of these assumptions, our discount rate and claim resolution rate assumptions
Index to Financial Statements
have historically had the most significant effects on our level of reserves because many of our product lines provide benefit payments over an extended period of time.
| December 31, 2005 | December 31, 2004 (3) | |||||||||||||||||
| IBNR (1) | All Other | Total (2) | IBNR (1) | All Other | Total (2) | |||||||||||||
Group Income Protection | $ | 698.6 | $ | 7,600.1 | $ | 8,298.7 | $ | 781.9 | $ | 7,261.3 | $ | 8,043.2 | ||||||
Group Life and Accidental Death & Dismemberment | 237.6 | 1,386.7 | 1,624.3 | 261.8 | 1,452.2 | 1,714.0 | ||||||||||||
Individual Income Protection - Recently Issued | 77.8 | 1,064.8 | 1,142.6 | 72.0 | 927.7 | 999.7 | ||||||||||||
Long-term Care | 32.1 | 1,959.0 | 1,991.1 | 28.4 | 1,589.6 | 1,618.0 | ||||||||||||
Voluntary Workplace Benefits | 32.3 | 764.5 | 796.8 | 31.4 | 692.3 | 723.7 | ||||||||||||
U.S. Brokerage Segment | 1,078.4 | 12,775.1 | 13,853.5 | 1,175.5 | 11,923.1 | 13,098.6 | ||||||||||||
Unum Limited Segment | 242.9 | 2,100.1 | 2,343.0 | 206.9 | 2,201.6 | 2,408.5 | ||||||||||||
Colonial Segment | 83.7 | 1,204.3 | 1,288.0 | 71.9 | 1,119.1 | 1,191.0 | ||||||||||||
Individual Income Protection - Closed Block Segment | 428.9 | 12,202.9 | 12,631.8 | 360.3 | 12,376.5 | 12,736.8 | ||||||||||||
Other Segment | 239.6 | 8,466.3 | 8,705.9 | 217.7 | 8,339.9 | 8,557.6 | ||||||||||||
Consolidated | $ | 2,073.5 | $ | 36,748.7 | $ | 38,822.2 | $ | 2,032.3 | $ | 35,960.2 | $ | 37,992.5 | ||||||
| 1. | Thediscount rate, which is used in calculating both policy reserves and incurred and IBNR |
| 2. | The |
| 3. | The |
Establishing reserve assumptions is complex and involves many factors. Reserves, particularly for policies offering insurance coverage for long-term disabilities, are dependent on numerous assumptions other than just those presented in the preceding discussion. The impact of internal and external events, such as changes in claims management procedures, economic trends such as the rate of unemployment and the level of consumer confidence, the emergence of new diseases, new trends and developments in medical treatments, and legal trends and legislative changes, among other factors, will influence claim incidence and resolution rates. Reserve assumptions differ by product line and by policy type within a product line. Additionally, in any period and over time, our actual experience may have a positive or negative variance from our long-term assumptions, either singularly or collectively, and these variances may offset each other. We test the overall adequacy of our reserves using all assumptions and with a long-term view of our expected experience over the life of a block of business rather than test just one or a few assumptions independently that may be aberrant over a short period of time. Therefore it is not possible to bifurcate the assumptions to evaluate the sensitivity of a change in each assumption, but rather in the aggregate by product line. We have presented in the following section an overview of our trend analysis for key assumptions and the results of variability in our assumptions, in aggregate, for the reserves which we believe are reasonably possible to have a material impact on our future financial results if actual claims yield a materially different amount than what we currently expect and have reserved for, either favorable or unfavorable.
Trends in Key Assumptions
TheBecause our actual experience regarding persistency and claim incidence has varied very little from our policy reserve and IBNR claim reserve assumptions, we have had minimal adjustments to our persistency assumptions and claim incidence assumptions during the years 2006 through 2008. Generally, we do not expect our mortality and morbidity claim incidence trends or our persistency trends to change significantly in the short-term, and to the extent
Index to Financial Statements
that these trends do change, we expect those changes to be gradual over a longer period of time. However, we have historically experienced an increase in IBNRour group long-term disability morbidity claim incidence trends during and following a recessionary period, particularly in our Unum US operations. Given the current weakening economy, it is possible that our claim incidence rates for this type of product may increase.
Actual new money interest rates varied throughout 2008 but generally trended downward for all segments and product lines during 2007 and 2006. The assumptions we use to discount our reserves from December 31, 2004 is due primarilygenerally trended downward slightly for all segments and product lines during 2008, 2007, and 2006. Reserve discount rate assumptions for new policies and new claims have been adjusted to reflect our current and expected net investment returns. Changes in our discount rate assumptions tend to occur gradually over a longer period of time because of the long duration investment portfolio needed to support the reserves for the majority of our lines of business.
Both the mortality rate experience and the retirement rate experience for our block of group pension products have remained stable and consistent with expectations.
Claim resolution rates have a greater chance of significant variability in a shorter period of time than our other reserve assumptions. These rates are reviewed on a quarterly basis for the death and recovery components separately. Claim resolution rates in our Unum US segment group and individual long-term disability product lines and our Individual Income ProtectionDisability – Closed Block segment which includes a reclassification of reserves from All Otherhave over the last several years exhibited some variability. Relative to IBNR reflecting additional IBNR reserves associated with the recaptureresolution rate we expect to experience over the life of the reinsurance treatyblock of business, actual quarterly rates during the period 2006 through 2008 have varied by +7 and -5 percent in 2005,our Unum US group long-term disability line of business, between +10 and the-5 percent in our Unum Limited segment, which is due to growth in insured lives and the average premium size per policy. Partially offsetting these increases is a decrease in the IBNR reserves for the U.S. Brokerage segment due primarily to decreases in insured lives in the group income protection and group life and accidental death and dismemberment lines of business. The increase in All Other reserves from December 31, 2004 is driven by growth in the active life reserves for the U. S. Brokerage long-term care andUS individual income protectiondisability – recently issued linesline of business, and growthbetween +8 and -6 percent in our Individual Disability – Closed Block segment.
Claim resolution rates are very sensitive to operational and environmental changes and can be volatile over short periods of time. During 2006, we experienced quarter to quarter variability in our claim resolution rates. We believe this variability was primarily the result of a short-term reduction in the disabledoperating effectiveness of our Unum US and Individual Disability – Closed Block segment claims management performance. During 2007 and continuing throughout 2008, we gained more stability in our claims management performance, and our claim resolution rates were more consistent with our long-term assumptions. Our claim resolution rate assumption used in determining reserves is our expectation of the resolution rate we will experience over the life of the block of business and will vary from actual experience in any one period, both favorably and unfavorably.
We monitor and test our reserves for adequacy relative to all of our assumptions in the U.S. Brokerageaggregate. In our estimation, scenarios based on reasonably possible variations in each of our reserve assumptions, when modeled together in aggregate, could produce a potential result, either positive or negative, in our Unum US group income protectiondisability line of business.
business that would change our reserve balance by +/- 2.5 percent. Using our actual claim reserve balance at December 31, 2008, this variation would have resulted in an approximate change (either positive or negative) of $200 million to our claim reserves. Using the same sensitivity analysis approach for our Individual Disability – Closed Block segment, the claim reserve balance could potentially vary by +/- 2.2 percent of our reported balance, which at December 31, 2008, would have resulted in an approximate change (either positive or negative) of $225 million to our claim reserves. The major contributor to the variance for both the group long-term disability line of business and the Individual Disability – Closed Block segment is the claim resolution rate. We believe that these ranges provide a reasonable estimate of the possible changes in reserve balances for those product lines where we believe it is possible that variability in the assumptions, in the aggregate, could result in a material impact on our reserve levels, but we record our reserves based on our long-term best estimate. Because these product lines have long-term claim payout periods, there is a greater potential for significant variability in claim costs, either positive or negative.
Deferred Policy Acquisition Costs (DAC)
The Company defersWe defer certain costs incurred in acquiring new business and amortizes (expenses)amortize (expense) these costs over the life of the related policies. Deferred costs include certain commissions, other agency compensation, selection and policy issue expenses, and field expenses. Acquisition costs that do not vary with the production of new business, such as commissions on group products which are generally level throughout the life of the policy, are excluded from deferral.
Index to Financial Statements
The Company uses its own historical experience and expectation of the future performance of its business in determining the expected life of the policies. Over 90 percent of the Company’s deferred policy acquisition costs relateour DAC relates to traditional non interest-sensitive products, for which the costs are amortizedand we amortize DAC in proportion to the estimated premium income we expect to be receivedreceive over the life of the policies in accordance with the provisions of Statement of Financial Accounting Standards No. 60,Accounting and Reporting by Insurance Enterprises. Key assumptions used in developing the future amortization of DAC are future persistency and future premium income. We use our own historical experience and expectation of the future performance of our businesses in determining the expected persistency and premium income. The estimated premium income in the early years of the amortization period is generally higher than in the later years due to higher anticipated policy persistency in the early years, which results in a greater proportion of the costs being amortized in the early years of the life of the policy. During 2006, our key assumptions used to develop the future amortization did not change materially from those we had previously used. We adopted the provisions of SOP 05-1 effective January 1, 2007. The adoption of SOP 05-1 shortened the amortization period of our Unum US and Unum UK group disability, group life, and group accidental death and dismemberment products, as shown below. The amortization periods for the other product lines were not impacted by the adoption of SOP 05-1. Generally, we do not expect our persistency or interest rates to change significantly in the short-term, and to the extent that these trends do change, we expect those changes to be gradual over a longer period of time.
Presented below are our assumptions, both before and after the adoption of SOP 05-1, for the years 2008, 2007, and 2006, regarding the length of our amortization periods and the approximate DAC balance that remains at the end of years 3, 10, and 15, as a percentage of the cost initially deferred.
| 2008 and 2007 | 2006 | |||||||||||||
| Balance Remaining as a % | Balance Remaining as a % | |||||||||||||
| Amortization | of Initial Deferral | Amortization | of Initial Deferral | |||||||||||
| Period | Year 3 | Year 10 | Year 15 | Period | Year 10 | Year 15 | ||||||||
Unum US | ||||||||||||||
Group Disability | 6 | 25% | 0% | 0% | 20 | 25% | 10% | |||||||
Group Life and Accidental | ||||||||||||||
Death & Dismemberment | 6 | 20% to 25% | 0% | 0% | 15 | 15% | 0% | |||||||
Supplemental and Voluntary | ||||||||||||||
Individual Disability - | ||||||||||||||
Recently Issued | 20 | 75% | 50% | 25% | 20 | 50% | 25% | |||||||
Long-term Care | 20 | 80% | 55% | 25% to 30% | 20 | 55% | 25% | |||||||
Voluntary Benefits | 15 | 55% to 60% | 15% | 0% | 15 | 15% | 0% | |||||||
Unum UK | ||||||||||||||
Group Disability | 6 | 25% | 0% | 0% | 15 | 20% | 0% | |||||||
Group Life | 6 | 20% | 0% | 0% | 15 | 20% | 0% | |||||||
Individual Disability | 15 | 60% | 15% | 0% | 15 | 15% | 0% | |||||||
Colonial Life | 17 | 60% | 20% to 25% | 10% | 17 | 20% | 10% | |||||||
Amortization of deferred costsDAC on traditional products is adjusted to reflect the actual policy persistency as compared to the anticipated experience. The Company willexperience, and as a result, the unamortized balance of DAC reflects actual persistency. We may experience accelerated amortization if policies terminate earlier than projected.
Deferred costs related Because our actual experience regarding persistency and premium income has varied very little from our assumptions during the last three years, we have had minimal adjustments to U.S. Brokerage group and individual income protection products are generally amortized over a twenty-year period, with approximately 75 percent and 90 percentour projected amortization of DAC during those years. We measure the original deferred costs related to group income protection products expected to be amortizedrecoverability of DAC annually by years ten and fifteen, respectively. For individual income protection policies, approximately 35 percent and 65 percent of the original deferred costs are expected to be amortized by years ten and fifteen, respectively. Deferred costs for U.S. Brokerage group and individual long-term care products are amortized over a twenty-year period, with approximately 45 percent and 70 percent of the original deferred costs expected to be amortized by years ten and fifteen, respectively. Deferred costs for U.S. Brokerage group life and accidental death and dismemberment products are amortized over a fifteen-year period, with approximately 85 percent of the cost expected to be amortized by year ten. Deferred costs for U.S. Brokerage voluntary products are amortized over a fifteen-year period, with approximately 90 percent of the cost expected to be amortized by year ten.
Deferred costs for Unum Limited group and individual income protection and group life products are generally amortized over a fifteen-year period, with approximately 80 percent of the original deferred costs expected to be amortized by year ten. Deferred costs for products issued by the Colonial segment are generally amortized over a seventeen-year period, on average, with approximately 80 percent and 90 percent of the original deferred costs expected to be amortized by years ten and fifteen, respectively.
performing gross premium valuations. Our testing indicates that our DAC is recoverable.
Valuation of Fixed Maturity SecuritiesInvestments
In determining when a decline in fair value below amortized costAll of a fixed maturity security is other than temporary, the Company evaluates the following factors:
The Company’s review procedures include, but are not limited to, monthly meetings of certain members of the Company’s senior management personnel to review reports on the entire portfolio, identifying investments with changes in market value of five percent or more, investments with changes in rating either by external rating agencies or internal analysts, investments segmented by issuer, industry, and foreign exposure levels, and any other relevant investment information to help identify the Company’s exposure to possible credit losses.
Based on this review of the entire investment portfolio, individual investments may be added to or removed from the Company’s “watch list”, which is a list of securities subject to enhanced monitoring and a more intensive review. The Company also determines if its investment portfolio is overexposed to an issuer that is showing warning signs of deterioration and, if so, the Company makes no further purchases of that issuer’s securities and may seek opportunities to sell securities it holds from that issuer to reduce the Company’s exposure. The Company monitors below-investment-grade securities as to individual exposures and in comparison to the entire portfolio as an additional credit risk management strategy, looking specifically at the Company’s exposure to individual securities currently classified as below-investment-grade. In determining current and future business prospects and cash availability, the Company considers the parental support of an issuer in its analysis but does not rely heavily on this support.
If the Company determines that the decline in value of an investment is other than temporary, the investment is written down to fair value, and an impairment loss is recognized in the current period to the extent of the decline in value. If the decline is considered temporary, the security continues to be carefully monitored. These controls have been established to identify the Company’s exposure to possible credit losses and are intended to give the Company the ability to respond rapidly.
The Company has no held-to-maturity fixed maturity securities. Allour fixed maturity securities are classified as available-for-sale and are reported at fair value. Our derivative financial instruments, including certain derivative instruments embedded in other contracts, are reported as either assets or liabilities and measured at fair value. We hold an immaterial amount of equity securities, which are also reported at fair value.
Index to Financial Statements
Effective January 1, 2008, we adopted the provisions of Statement of Financial Accounting Standards No. 157 (SFAS 157),Fair Value Measurements. SFAS 157 defines fair value, establishes a framework for measuring fair value, and expands disclosures about fair value measurements. The adoption of SFAS 157 did not materially change the approach or methods we utilize for determining fair value measurements or the fair values derived under those methods.
Definition of Fair Value
Fair value is defined as the price that would be received to sell an asset or paid to transfer a liability in an orderly transaction between market participants at the measurement date and, therefore, represents an exit price, not an entry price. The exit price objective applies regardless of a reporting entity’s intent and/or ability to sell the asset or transfer the liability at the measurement date.
The degree of judgment utilized in measuring the fair value of financial instruments generally correlates to the level of pricing observability. Financial instruments with readily available active quoted prices or for which fair value can be measured from actively quoted prices in active markets generally have more pricing observability and less judgment utilized in measuring fair value. An active market for a financial instrument is a market in which transactions for an asset or a similar asset occur with sufficient frequency and volume to provide pricing information on an ongoing basis. A quoted price in an active market provides the most reliable evidence of fair value and should be used to measure fair value whenever available. Conversely, financial instruments rarely traded or not quoted have less observability and are measured at fair value using valuation techniques that require more judgment. Pricing observability is generally impacted by a number of factors, including the type of financial instrument, whether the financial instrument is new to the market and not yet established, the characteristics specific to the transaction, and overall market conditions.
Valuation Techniques
Valuation techniques used for assets and liabilities accounted for at fair value are generally categorized into three types:
| 1. | Themarket approach uses prices and other relevant information from market transactions involving identical or comparable assets or liabilities. Valuation techniques consistent with the market approach often use market multiples derived from a set of comparables or matrix pricing. Market multiples might lie in ranges with a different multiple for each comparable. The selection of where within the range the appropriate multiple falls requires judgment, considering both quantitative and qualitative factors specific to the measurement. Matrix pricing is a mathematical technique used principally to value certain securities without relying exclusively on quoted prices for the specific securities but comparing the securities to benchmark or comparable securities. |
| 2. | The income approach converts future amounts, such as cash flows or earnings, to a single present amount, or a discounted amount. Income approach techniques rely on current market expectations of future amounts. Examples of income approach valuation techniques include present value techniques, option-pricing models that incorporate present value techniques, and the multi-period excess earnings method. |
| 3. | Thecost approachis based upon the amount that currently would be required to replace the service capacity of an asset, or the current replacement cost. That is, from the perspective of a market participant (seller), the price that would be received for the asset is determined based on the cost to a market participant (buyer) to acquire or construct a substitute asset of comparable utility. |
We use valuation techniques that are appropriate in the circumstances and for which sufficient data are available that can be obtained without undue cost and effort. In some cases, a single valuation technique will be appropriate (for example, when valuing an asset or liability using quoted prices in an active market for identical assets or liabilities). In other cases, multiple valuation techniques will be appropriate. If we use multiple valuation techniques to measure fair value, we evaluate and weigh the results, as appropriate, considering the reasonableness of the range indicated by those results. A fair value measurement is the point within that range that is most representative of fair value in the circumstances.
Index to Financial Statements
The selection of the valuation method(s) to apply considers the definition of an exit price and depends on the nature of the asset or liability being valued. For assets and liabilities accounted for at fair value, we generally use valuation techniques consistent with the market approach, and to a lesser extent, the income approach. We believe the market approach valuation technique provides more observable data than the income approach, considering the type of investments we hold. Our fair value measurements could differ significantly based on quotedthe valuation technique and available inputs. When markets are less active, brokers may rely more on models with inputs based on the information available only to the broker. In weighing a broker quote as an input to fair value, we place less reliance on quotes that do not reflect the result of market transactions. We also consider the nature of the quote, particularly whether the quote is an indicative price or a binding offer. If prices where available.in an inactive market do not reflect current prices for the same or similar assets, adjustments may be necessary to arrive at fair value. When relevant market data is unavailable, which may be the case during periods of market uncertainty, the income approach can, in appropriate circumstances, provide a more appropriate fair value. During 2008, we have applied valuation techniques on a consistent basis to similar assets and liabilities and consistent with those techniques used at year end 2007. Due to recent market conditions, the mix and availability of observable inputs for valuation techniques have been volatile, and the risk inherent in the inputs is elevated relative to prior periods.
Inputs to Valuation Techniques
Private placementInputs refer broadly to the assumptions that market participants use in pricing assets or liabilities, including assumptions about risk, for example, the risk inherent in a particular valuation technique used to measure fair value (such as a pricing model) and/or the risk inherent in the inputs to the valuation technique. Inputs may be observable or unobservable.
Observable inputs are inputs that reflect the assumptions market participants would use in pricing the asset or liability developed based on market data obtained from independent sources.
Unobservable inputs are inputs that reflect our own assumptions about the assumptions market participants would use in pricing the asset or liability developed based on the best information available in the circumstances.
Observable inputs which we utilize to determine the fair values of our investments and derivative financial instruments include indicative broker prices and prices obtained from external pricing services. At December 31, 2008, approximately 87.6 percent of our fixed maturity securities hadwere valued based on active trades and/or broker quotes or prices obtained from pricing services that generally use observable inputs in their valuation techniques, with no additional adjustments to the prices. These assets were classified as either Level 1 or Level 2, with the categorization dependent on whether the price was for an actual representative sale, for identical assets actively traded, and/or the quote binding or non-binding. We generally obtain, on average, one quote per financial instrument. We review the prices obtained to ensure they are consistent with a fair valuevariety of observable market inputs and to verify the validity of a security’s price. These inputs, along with our knowledge of the financial conditions and industry in which the issuer operates, will be considered in determining whether the quoted or indicated price, as well as the change in price from quarter to quarter, are valid.
On selected securities where there is not an indicated price or where we cannot validate the price, some combination of market inputs may be used to determine a price using a pricing matrix, or we may use pricing inputs from a comparable security. At December 31, 2008, we valued approximately $3.9 billion, or 11.19.8 percent of totalour fixed maturity securities using this method. These assets were classified as Level 2. The parameters and inputs used to validate a price on a security may be adjusted for assumptions about risk and current market conditions on a quarter to quarter basis, as certain features may be more significant drivers of valuation at December 31, 2005. Private placement fixed maturity securitiesthe time of pricing. Changes to inputs in valuations are not changes to valuation methodologies; rather, the inputs are modified to reflect direct or indirect impacts on asset classes from changes in market conditions.
We consider transactions in inactive or disorderly markets to be less representative of fair value. We use all available observable inputs when measuring fair value, but when significant other unobservable inputs and adjustments are necessary, we classify these assets as Level 3.
Index to Financial Statements
Inputs that may be used include the following:
Benchmark yields (Treasury and swap curves)
Transactional data for new issuance and secondary trades
Broker/dealer quotes and pricing
Security cash flows and structures
Recent issuance/supply
Sector and issuer level spreads
Credit ratings/maturity/weighted average life/seasoning/capital structure
Security optionality
Corporate actions
Underlying collateral
Prepayment speeds/loan performance/delinquencies
Public covenants
Comparative bond analysis
Derivative spreads
Third-party pricing sources
Relevant reports issued by analysts and rating agencies
The overall valuation process for determining fair values may include adjustments to valuations obtained from our pricing sources when they do not represent a valid exit price. These adjustments may be made when, in our judgment, certain features of the financial instrument, such as its complexity or the market in which the financial instrument is traded (such as counterparty, credit, concentration, or liquidity), require that an adjustment be made to the value originally obtained from our pricing sources. Additionally, an adjustment to the price derived from a model typically reflects our judgment of the inputs that other participants in the market for the financial instrument being measured at fair value would consider in pricing that same financial instrument.
We analyze credit default swap spreads relative to the average credit spread embedded within the London Interbank Offered Rate (LIBOR) setting syndicate in determining the effect of credit risk on our derivatives’ fair values. If counterparty credit risk for a derivative asset is determined to be material and is not adequately reflected in the LIBOR-based fair value obtained from our pricing sources, we adjust the valuations obtained from our pricing sources. In regards to our own credit risk component, we adjust the valuation of derivative liabilities wherein the counterparty is exposed to our credit risk when the LIBOR-based valuation of our derivatives obtained from pricing sources does not effectively include an adequate credit component for our own credit risk.
Certain of our investments do not have readily determinable market prices.prices and/or observable inputs or may at times be affected by the lack of market liquidity. For these securities, the Company useswe use internally prepared valuations combining matrix pricing with vendor purchased software programs, including valuations based on estimates of future profitability, to estimate the fair value. Additionally, the Company obtainswe may obtain prices from independent third-party brokers to establishaid in establishing valuations for certain of these securities. The Company’s abilityKey assumptions used by us to liquidate its positions in some ofdetermine fair value for these securities could be impacted to a significant degree by the lack of an actively traded market, and the Company may not be able to dispose of these investments in a timely manner. Although the Company believes its estimates reasonably reflect the fair value of those securities, the key assumptions about theinclude risk-free interest rates, risk premiums, performance of underlying collateral (if any), and other factors involveinvolving significant assumptions andwhich may or may not reflect those of an active market. The Company believes that generally these private placement securities carry a credit quality comparable to companies rated Baa or BBB by major credit rating organizations.
As of December 31, 2005,2008, the key assumptions we generally used to estimate the fair value of private placement fixed maturitythese types of securities included those listed below. Where appropriate, we have noted the following:assumption used for the prior period as well as the reason for the change.
Risk free interest rates of 4.351.55 percent for five-year maturities to 4.542.68 percent for 30-year maturities were derived from the current yield curve for U.S. Treasury Bonds with similar maturities. This compares to interest rates of 3.44 percent for five-year maturities to 4.45 percent for 30-year maturities used at December 31, 2007.
Index to Financial Statements
on observable market spreads. Newly issued private placement securities have historically offered yield premiums of 20 basis points over comparable newly issued public securities. |
An additional five basis points were added to the risk free rates for foreign investments.investments, consistent with December 31, 2007.
Increasing the 3020 basis points added to the risk free rate for lack of liquidity by 1.5 basis points, increasing the five basis points added to the risk free rates for foreign investments by one basis point, and increasing the additional basis points added to each industry considered to be of greater risk by one basis point would have decreased the December 31, 2005 net unrealized gain in the2008 fair value of our fixed maturity securities portfolio by approximately $1.7$1.1 million. We believe this range of variability is appropriate, and although the current market is very volatile, historically the inputs noted have generally not deviated outside the range provided.
We regularly test the validity of the fair values determined by our valuation techniques by comparing the prices of assets sold to the fair values reported for the assets in the immediately preceding reporting period. Historically, the Company’sour realized gains or losses on dispositions of its private placement fixed maturity securitiesinvestments have not varied significantly from amounts estimated under the valuation methodologymethodologies described above.above, which, combined with the results of our testing, indicates to us that our pricing methodologies are appropriate.
Fair Value Hierarchy
Financial instruments measured at fair value are categorized into a three-level classification. The lowest level input that is significant to the fair value measurement of a financial instrument is used to categorize the instrument and reflects the judgment of management. Financial assets and liabilities presented at fair value in our consolidated balance sheets generally are categorized as follows:
Level 1 – Inputs are unadjusted and represent quoted prices in active markets for identical assets or liabilities at the measurement date.
Level 2 – Inputs (other than quoted prices included in Level 1) are either directly or indirectly observable for the asset or liability through correlation with market data at the measurement date and for the duration of the instrument’s anticipated life. Level 2 inputs include, for example, indicative prices obtained from brokers or pricing services validated to other observable market data and quoted prices for similar assets or liabilities.
Level 3 – Inputs reflect our best estimate of what market participants would use in pricing the asset or liability at the measurement date. Generally, assets and liabilities carried at fair value and included in this category are comprised of certain mortgage and asset-backed securities, certain corporate fixed maturity securities, certain private equity investments, and certain derivatives. Financial assets and liabilities presented at fair value and categorized as Level 3 are generally those that are valued using unobservable inputs to extrapolate an estimated fair value. The inputs reflect our assumptions about the assumptions that market participants would use in pricing the instrument in a current period transaction, and outputs represent an exit price and expected future cash flows. Unobservable inputs are primarily internally derived credit spread assumptions and lack of liquidity assumptions and are unobservable due to the lack of an active market pertaining to these securities.
As of December 31, 2008, approximately 9.4 percent of our fixed maturity securities were categorized as Level 1, 88.3 percent as Level 2, and 2.3 percent as Level 3. During 2008, we transferred $672.6 million of fixed maturity securities into Level 3 and $160.0 million of fixed maturity securities out of Level 3. The reclassifications between levels resulted primarily from a change in observability of three inputs used to determine fair values of the securities reclassified: (1) transactional data for new issuance and secondary trades, (2) broker/dealer quotes and pricing, primarily related to the lack of an active and orderly market, and (3) comparable bond metrics from which to perform an analysis. For fair value measurements of financial instruments that were transferred either into or out of Level 3, we reflect the transfers using the fair value at the beginning of the period. We believe this allows for
Index to Financial Statements
greater transparency as all changes in fair value that arise during the reporting period of the transfer are disclosed as a component of our Level 3 reconciliation as shown in Note 4 of the “Notes to Consolidated Financial Statements” contained herein in Item 8.
Other than Temporary Impairment Analysis for Investments
In determining other than temporary impairments for our investment portfolio, we evaluate the following factors, as applicable for each type of investment:
The probability of recovering principal and interest.
Our ability and intent to retain the security for a sufficient period of time for it to recover.
Whether the security is current as to principal and interest payments.
The significance of the decline in value.
The time period during which there has been a significant decline in value.
Current and future business prospects and trends of earnings.
The valuation of the security’s underlying collateral.
Relevant industry conditions and trends relative to their historical cycles.
Market conditions.
Rating agency actions.
Bid and offering prices and the level of trading activity.
Adverse changes in estimated cash flows for securitized investments.
Any other key measures for the related security.
Our review procedures include, but are not limited to, monthly meetings of certain members of our senior management personnel to review reports on the entire portfolio, identifying investments with changes in market value of five percent or more, investments with changes in rating either by external rating agencies or internal analysts, investments segmented by issuer, industry, and foreign exposure levels, and any other relevant investment information to help identify our exposure to possible credit losses. We also determine if our investment portfolio is overexposed to an issuer that is showing warning signs of deterioration and, if so, we make no further purchases of that issuer’s securities and may seek opportunities to sell securities we hold from that issuer to reduce our exposure.
We monitor below-investment-grade fixed maturity securities as to individual exposures and in comparison to the entire portfolio as an additional credit risk management strategy, looking specifically at our exposure to individual securities currently classified as below-investment-grade. In determining current and future business prospects and cash availability, we consider the parental support of an issuer in our analysis but do not rely heavily on this support.
We use a comprehensive rating system to evaluate the investment and credit risk of our mortgage loans and to identify specific properties for inspection and reevaluation. Mortgage loans are considered impaired when, based on current information and events, it is probable that we will be unable to collect all amounts due according to the contractual terms of the loan agreement. We establish an allowance for probable losses on mortgage loans based on a review of individual loans and the overall loan portfolio, considering the value of the underlying collateral.
Based on our review of the entire investment portfolio, individual investments may be added to or removed from our “watch list,” which is a list of investments subject to enhanced monitoring and a more intensive review. If we determine that the decline in value of an investment is other than temporary, the investment is written down to fair value, and an impairment loss is recognized in the current period to the extent of the decline in value. If the decline is considered temporary, the investment continues to be carefully monitored. These controls have been established to identify our exposure to possible credit losses and are intended to give us the ability to respond rapidly.
Changes in the fair valuevalues of fixed maturity securities and derivative financial instruments designated as cash flow hedges, other than declines that are determined to be other than temporary, are reported as a component of other comprehensive income in stockholders’ equity. If it iswe subsequently determineddetermine that any of these securities are other than temporarily impaired, the impairment loss is reported as a realized investment loss in theour consolidated statements of operations.income. The recognition of the impairment loss does not affect total stockholders’ equity to the extent that the decline in value had been previously reflected in other comprehensive income. Mortgage loans are not
Index to Financial Statements
reported at fair value in our consolidated balance sheets unless the decline in value is considered to be other than temporary, in which case the reduction is recognized as a realized investment loss in our consolidated statements of income.
There are a number of significant risks inherent in the process of monitoring the Company’s fixed maturity securitiesour investments for impairments and determining when and if an impairment is other than temporary. These risks and uncertainties include the following possibilities:
The assessment of a borrower’s ability to meet its contractual obligations will change.
Significant increases in interest rates may occur and may not return to levels similar to when securities were initially purchased.
Adverse rating agency actions may occur.
Pension and Postretirement Benefit Plans
We sponsor several defined benefit pension and other postretirement benefit (OPEB) plans for our employees, including non-qualified pension plans. The U.S. pension plans comprise the majority of our total benefit obligation and pension expense. Our U.K. operation maintains a separate defined benefit plan for eligible employees. The U.K. defined benefit pension plan was closed to new entrants on December 31, 2002.
We follow Statements of Financial Accounting Standards No. 87 (SFAS 87),Reinsurance ReceivableEmployers’ Accounting for Pensions
Reinsurance is a contractual agreement whereby the Company’s reinsurance partners assume a defined portion, No. 106 (SFAS 106),Employers’ Accounting for Postretirement Benefits Other Than Pensions, No. 132 (SFAS 132),Employers’ Disclosures about Pensions and Other Postretirement Benefits, and No. 158 (SFAS 158),Employers’ Accounting for Defined Benefit Pension and Other Postretirement Plans, an amendment of FASB Statements No. 87, 88, 106, and 132(R) in our financial reporting and accounting for our pension and postretirement benefit plans. See Note 9 of the risk“Notes to Consolidated Financial Statements” contained herein in Item 8 for further discussion.
Our net periodic benefit costs and the value of our benefit obligations for these plans are determined based on a set of economic and demographic assumptions that represent our best estimate of future benefits payable under reinsurance contracts. The reinsurance receivable reportedexpected experience. Major assumptions used in accounting for these plans include the expected discount (interest) rate and the long-term rate of return on plan assets. We also use, as an assetapplicable, expected increases in compensation levels and a weighted-average annual rate of increase in the Company’s consolidated statementsper capita cost of financial condition includescovered benefits, which reflects a health care cost trend rate.
The assumptions chosen for our pension and OPEB plans generally use consistent methodology but reflect the differences in the plan obligations. The assumptions are reviewed annually, and we use a December 31 measurement date for each of our plans. The discount rate assumptions and expected long-term rate of return assumptions have the most significant effect on our net periodic benefit costs associated with these plans. In addition to the effect of changes in our assumptions, the net periodic cost or benefit obligation under our pension and OPEB plans may change due to factors such as actual experience being different from our assumptions, special benefits to terminated employees, or changes in benefits provided under the plans.
Discount Rate Assumptions
Thediscount rate is an interest assumption used to convert the benefit payment stream to a present value. We set the discount rate assumption at the measurement date for each of our retirement related benefit plans to reflect the yield of a portfolio of high quality fixed income debt instruments matched against the timing and amounts due fromof projected future benefits. A lower discount rate increases the Company’s reinsurers on current claimspresent value of benefit obligations and estimatesincreases our costs.
Index to Financial Statements
The discount rate we used to determine our 2009 net periodic benefit costs for our U.S. pension plans was 6.40 percent, compared to 6.50 percent for 2008. The discount rate used for the net periodic benefit costs for 2009 and 2008 for our U.K. pension plan was 6.40 percent and 5.80 percent, respectively. The discount rate used in the net periodic benefit cost for our OPEB plan for 2009 and 2008 was 6.10 percent and 6.30 percent, respectively.
Reducing the discount rate assumption by 50 basis points would have resulted in an increase in our 2008 pension expense of amountsapproximately $11.5 million, before tax, and an increase in our benefit obligation of approximately $101.1 million as of December 31, 2008, resulting in an after-tax decrease in stockholders’ equity of approximately $66.9 million as of December 31, 2008. A 50 basis point reduction in the discount rate assumption would not change our annual OPEB costs.
Increasing the discount rate assumption by 50 basis points would have resulted in a decrease in our 2008 pension expense of approximately $10.4 million, before tax, and a decrease in our benefit obligation of approximately $89.6 million as of December 31, 2008, resulting in an after-tax increase in stockholders’ equity of approximately $59.3 million as of December 31, 2008. A 50 basis point increase in the discount rate assumption would not change our annual OPEB costs.
Long-term Rate of Return Assumptions
Thelong-term rate of return assumption is the best estimate of the average annual assumed return that will be dueproduced from the pension trust assets until current benefits are paid. We use a compound interest method in computing the rate of return on pension plan assets. The investment portfolio for our U.S. pension plans contains a diversified blend of domestic and international large cap, mid cap, and small cap equity securities, investment-grade and below-investment-grade fixed income securities, private equity funds of funds, and hedge funds of funds. Assets for our U.K. pension plan are invested in pooled funds, with approximately 57 percent in diversified growth assets including global equities, hedge funds, commodities, below-investment-grade fixed income securities, and currencies. The remainder of the assets for our U.K. plan is predominantly invested in fixed interest U.K. corporate bonds and index linked U.K. government bonds. Assets for our OPEB plan are invested primarily within life insurance contracts issued by one of our insurance subsidiaries. The terms of these contracts are consistent in all material respects with those the subsidiary offers to unaffiliated parties that are similarly situated. We believe our investment portfolios are well diversified by asset class and sector, with no potential risk concentrations in any one category.
Our expectations for the future claims. Policy reservesinvestment returns of the asset categories are based on a combination of historical market performance and claim reserves reportedevaluations of investment forecasts obtained from external consultants and economists. The methodology underlying the return assumption included the various elements of the expected return for each asset class such as long-term rates of return, volatility of returns, and the correlation of returns between various asset classes. The expected return for the total portfolio is calculated based on the plan’s strategic asset allocation. Investment risk is measured and monitored on an ongoing basis through annual liability measurements, periodic asset/liability studies, and quarterly investment portfolio reviews. Risk tolerance is established through consideration of plan liabilities, plan funded status, and corporate financial condition.
The long-term rate of return on assets used in the Company’s consolidated statementsnet periodic pension costs for our U.S. qualified defined benefit pension plan for 2009 and 2008 was 7.50 percent for both years. The long-term rate of financial condition are not reducedreturn on asset assumption used for reinsurance.2009 and 2008 for our U.K. pension plan was 7.20 percent and 6.90 percent, respectively, and for our OPEB plan, 5.75 percent for both years. The reinsurance receivableactual rate of return on plan assets is generally equal to the policy reserves and claim reserves related to the risk being reinsured. The Company reduces the reinsurance receivable if recovery is not likely due to the financial position of the reinsurer or if there is disagreement between the Company and the reinsurer regarding the liability of the reinsurer.
Goodwill
Goodwill is the excess of the cost of an acquired entity over the net of the amounts assigned to assets acquired and liabilities assumed. Goodwill is not amortized, but the Company reviewsdetermined based on an annual basis the carrying amount of goodwill for indications of impairment, with consideration given to financial performance and other relevant factors. In accordance with accounting guidance, the Company tests for impairment at either the operating segment level or one level below. In addition, certain events including, but not limited to, a significant adverse change in legal
factors or the business environment, an adverse action by a regulator or rating agency, or unanticipated competition would cause the Company to review goodwill for impairment more frequently than annually.
The goodwill reported as an asset in the Company’s consolidated statements of financial condition at December 31, 2005 is attributable primarily to the acquisition of The Paul Revere Life Insurance Company (individual income protection – recently issued business) and GENEX Services, Inc. (disability management services business). The impairment testing for goodwill involves estimating the fair value of the individual income protection blockplan assets at the beginning and the end of recently issued businessthe period, adjusted for contributions and benefit payments.
Changing the expected long-term rate of return on the plan assets by +/-50 basis points would have changed our 2008 pension plan expense by approximately $4.9 million before tax, but our OPEB plan expense would not change. A lower rate of return on plan assets increases our expense.
Index to Financial Statements
Benefit Obligation and Fair Value of Plan Assets
The market related value equals the fair value of assets, determined as of the disability management services business based uponmeasurement date. The assets are not smoothed for purposes of SFAS 87. The expected return on assets, therefore, fully recognizes all asset gains and losses, including changes in fair value, through the presentmeasurement date.
The fair value of our plan assets is determined in accordance with SFAS 157. During 2008, the fair value of our plan assets in our U.S. qualified defined benefit pension plan declined $126.2 million, or approximately 16.1 percent. The fair value of plan assets for our U.K. pension plan declined £11.7 million, or approximately 12.5 percent, during 2008. Although the effect of these declines had no impact on our 2008 net periodic pension costs, the unfavorable rate of return on plan assets in 2008 increases our net periodic pension costs for 2009. We expect that our 2009 pension costs will be approximately $42.5 million higher than our pension costs for 2008. We believe our assumptions appropriately reflect the impact of a prolonged market decline.
Our pension and OPEB plans have an aggregate unrecognized net actuarial loss and an unrecognized prior service credit, which represent the cumulative liability and asset gains and losses and the portion of prior service credits that have not been recognized in pension expense. As of December 31, 2008, the unrecognized net loss for these two items combined was approximately $622.0 million compared to $301.8 million at December 31, 2007. The increase is primarily due to the unfavorable rate of return on plan assets in 2008 and to the decrease in the year end discount rate for our U.S. pension plans. Prior to the adoption of SFAS 158, unrecognized actuarial gains or losses and prior service costs or credits were amortized as a component of pension expense but were not reported in companies’ balance sheets. SFAS 158 requires that actuarial gains or losses and prior service costs or credits that have not yet been included in net periodic benefit cost as of the adoption date of SFAS 158 be recognized as components of accumulated other comprehensive income, net of tax. The unrecognized gains or losses will be amortized out of accumulated other comprehensive income and included as a component of the net benefit cost, as they were prior to the adoption of SFAS 158. Our 2008, 2007, and 2006 pension and OPEB expense includes $10.6 million, $15.3 million, and $17.8 million, respectively, of amortization of the unrecognized net actuarial loss and prior service credit. The unrecognized net actuarial loss for our pension plans, which is $625.7 million at December 31, 2008, will be amortized over the average future working life of pension plan participants, currently estimated at 12 years for U.S. participants and 15 years for U.K. participants. The unrecognized net actuarial loss of $6.2 million for our OPEB plan will be amortized over the average future working life of OPEB plan participants, currently estimated at 10 years, to the extent the loss is outside of a corridor established in accordance with GAAP. The corridor is established based on the greater of 10 percent of the plan assets or 10 percent of the accumulated postretirement benefit obligation. At December 31, 2008, none of the actuarial loss was outside of the corridor.
The fair value of plan assets in our U.S. qualified defined benefit pension plan was $658.1 million at December 31, 2008, compared to $784.3 million at year end 2007. This decline in fair value of plan assets, as well as the decrease in the discount rate, more than offset the effect of the plan contribution during 2008, resulting in a year end deficit funding level in the plan of $266.9 million as of December 31, 2008, compared to a deficit of $43.8 million as of December 31, 2007.
The fair value of plan assets in our OPEB plan was $12.0 million at December 31, 2008 and 2007. These assets represent life insurance reserves to fund the life insurance benefit portion of our OPEB plan. Our OPEB plan represents a non-vested, non-guaranteed obligation, and current regulations do not require specific funding levels for these benefits, which are comprised of retiree life, medical, and dental benefits. It is our practice to use general assets to pay medical and dental claims as they come due in lieu of utilizing plan assets for the medical and dental benefit portions of our OPEB plan. We expect to receive subsidies under the Medicare Prescription Drug, Improvement and Modernization Act of 2003 to partially offset these payments.
Our expected return on plan assets and discount rate discussed above will not affect the cash flows using assumptions such as future sales, morbidity experience, portfolio yield rate,contributions we are required to make to our U.S. pension and OPEB plans because we have met all minimum funding requirements set forth by ERISA. We had no regulatory contribution requirements for 2008 and 2007; however, we elected to make voluntary contributions of $130.0 million and $110.0 million, respectively, to our U.S. qualified defined benefit pension plan. We expect to make a voluntary contribution of approximately $70.0 million in 2009, based on current tax law.
Index to Financial Statements
During 2006, the federal government enacted the Pension Protection Act of 2006 which requires companies to fully fund defined benefit pension plans over a seven year period. We have evaluated this requirement and have made estimates of amounts to be funded in the future. Based on this assessment, we do not believe that the funding requirements of the Pension Protection Act will cause a material adverse effect on our liquidity.
The fair value of plan assets for our U.K. pension plan was £82.1 million at December 31, 2008, compared to £93.8 million at December 31, 2007. The U.K. pension plan has a deficit of £4.7 million at December 31, 2008, compared to £0.9 million at December 31, 2007. We contribute to the plan in accordance with a schedule of contributions which requires that we contribute to the plan at the rate of return at whichleast 15.0 percent of employee salaries, sufficient to meet the Company believes the market would price the businesses for purchase. Adverse changes in anyminimum funding requirement under U.K. legislation. During 2008, we made a required contribution of these factors could result in an impairment£4.0 million. During 2007, we made a required contribution of goodwill for either or both£5.3 million. We anticipate that we will make contributions during 2009 of the blocks of business.
approximately £3.5 million.
Income Taxes
The Company recordsWe record a valuation allowance to reduce deferred tax assets to the amount that is more likely than not to be realized. The Company’sOur valuation allowance relates primarily to assets for foreign net operating loss carryforwards and assets for the Company’sour basis in certain of itsour foreign subsidiaries that are not likely to be realized in the future based on management’sour expectations using currently available evidence. In evaluating the ability to recover deferred tax assets, the Company haswe have considered all available positive and negative evidence including past operating results, the existence of cumulative losses in the most recent years, forecasted earnings, future taxable income, and prudent and feasible tax planning strategies. In the event the Company determineswe determine that itwe most likely would not be able to realize all or part of itsour deferred tax assets in the future, an increase to the valuation allowance would be charged to earnings in the period such determination is made. Likewise, if it is later determined that it is more likely than not that those deferred tax assets would be realized, the previously provided valuation allowance would be reversed.
The calculation of the Company’sour tax liabilities involves dealing with uncertainties in the application of complex tax laws in a multitude of jurisdictions, both domestic and foreign. The amount of income taxes paid by the Companywe pay is subject to ongoing audits in various jurisdictions, and a material assessment by a governing tax authority could affect profitability.
FIN 48 prescribes a recognition threshold and measurement attribute for the financial statement recognition and measurement of tax positions taken or expected to be taken in income tax returns. The Company recordsevaluation of a tax liabilities for anticipatedposition under FIN 48 is a two step process. The first step is to determine whether it is more likely than not that a tax audit issuesposition will be sustained upon examination based on the technical merits of the position. The second step is to measure a position that satisfies the recognition threshold at the largest amount of benefit that is greater than 50 percent likely of being realized upon ultimate settlement. Tax positions that previously failed to meet the more likely than not threshold but that now satisfy the recognition threshold are recognized in the U.S. and otherfirst subsequent financial reporting period in which that threshold is met. Previously recognized tax jurisdictions based on management’s estimate of whether, and topositions that no longer meet the extentmore likely than not recognition threshold are derecognized in the first subsequent financial reporting period in which additional taxes will probably be due. However, due to the complexity of thethat threshold is no longer met. If a previously recognized tax laws and uncertainties in their interpretation, the ultimate resolution may result in a paymentposition is settled for an amount that is materially different from the current estimate ofamount initially measured under FIN 48, the probabledifference will be recognized as a tax liabilities. If the estimate of the tax liabilities proves to be less than the ultimate assessment, an additional charge tobenefit or expense would result. If payment of these amounts ultimately proves to be less than the recorded amounts, the reversal of the liabilities would result in tax benefits being recognized in the period when the Company determines the liabilities are no longer probable. Management believessettlement is effective. We believe that adequate accrualstax positions have been provided for all years presented.reflected in our financial statements at appropriate amounts in conformity with FIN 48.
Index to Financial Statements
Consolidated Operating Results
(in millions of dollars)
| Year Ended December 31 | ||||||||||||||||||
| 2005 | % Change | 2004 | % Change | 2003 | ||||||||||||||
Revenue | ||||||||||||||||||
Premium Income | $ | 7,815.6 | (0.3 | )% | $ | 7,839.6 | 2.9 | % | $ | 7,615.7 | ||||||||
Net Investment Income | 2,188.3 | 1.4 | 2,158.7 | — | 2,158.4 | |||||||||||||
Net Realized Investment Gain (Loss) | (6.7 | ) | (122.9 | ) | 29.2 | 116.8 | (173.8 | ) | ||||||||||
Other Income | 440.0 | 0.6 | 437.4 | 11.8 | 391.3 | |||||||||||||
Total | 10,437.2 | (0.3 | ) | 10,464.9 | 4.7 | 9,991.6 | ||||||||||||
Benefits and Expenses | ||||||||||||||||||
Benefits and Change in Reserves for Future Benefits | 7,083.2 | (2.3 | ) | 7,248.4 | (7.9 | ) | 7,868.1 | |||||||||||
Commissions | 804.7 | (4.5 | ) | 842.3 | (0.2 | ) | 844.1 | |||||||||||
Interest and Debt Expense | 208.0 | 0.4 | 207.1 | 10.6 | 187.2 | |||||||||||||
Deferral of Policy Acquisition Costs | (519.4 | ) | (6.8 | ) | (557.3 | ) | (16.3 | ) | (665.9 | ) | ||||||||
Amortization of Deferred Policy Acquisition Costs | 463.7 | 6.2 | 436.7 | (4.8 | ) | 458.6 | ||||||||||||
Amortization of Value of Business Acquired | 15.1 | (4.4 | ) | 15.8 | (57.9 | ) | 37.5 | |||||||||||
Impairment of Intangible Assets | — | N.M. | 856.4 | N.M. | — | |||||||||||||
Compensation Expense | 753.9 | 1.9 | 739.6 | (5.2 | ) | 779.8 | ||||||||||||
Other Operating Expenses | 918.4 | (1.8 | ) | 935.4 | 2.0 | 917.4 | ||||||||||||
Total | 9,727.6 | (9.3 | ) | 10,724.4 | 2.9 | 10,426.8 | ||||||||||||
Income (Loss) from Continuing Operations Before Income Tax and Cumulative Effect of Accounting Principle Change | 709.6 | N.M. | (259.5 | ) | 40.4 | (435.2 | ) | |||||||||||
Income Tax (Benefit) | 196.0 | N.M. | (67.3 | ) | (60.6 | ) | (170.6 | ) | ||||||||||
Income (Loss) from Continuing Operations Before Cumulative Effect of Accounting Principle Change | 513.6 | N.M. | (192.2 | ) | 27.4 | (264.6 | ) | |||||||||||
Loss from Discontinued Operations, Net of Tax | — | N.M. | (60.8 | ) | 62.4 | (161.7 | ) | |||||||||||
Cumulative Effect of Accounting Principle Change, Net of Tax | — | — | — | N.M. | 39.9 | |||||||||||||
Net Income (Loss) | $ | 513.6 | N.M. | $ | (253.0 | ) | 34.5 | $ | (386.4 | ) | ||||||||
| Year Ended December 31 | |||||||||||||||
| 2008 | % Change | 2007 | % Change | 2006 | |||||||||||
Revenue | |||||||||||||||
Premium Income | $ | 7,783.3 | (1.5) | % | $ | 7,901.1 | (0.6) | % | $ | 7,948.2 | |||||
Net Investment Income | 2,389.0 | (0.9) | 2,409.9 | 3.8 | 2,320.6 | ||||||||||
Net Realized Investment Gain (Loss) | (465.9) | N.M. | (65.2) | N.M. | 2.2 | ||||||||||
Other Income | 275.9 | 0.7 | 274.1 | 3.7 | 264.3 | ||||||||||
Total | 9,982.3 | (5.1) | 10,519.9 | (0.1) | 10,535.3 | ||||||||||
Benefits and Expenses | |||||||||||||||
Benefits and Change in Reserves for Future Benefits | 6,626.4 | (5.2) | 6,988.2 | (7.8) | 7,577.2 | ||||||||||
Commissions | 853.3 | 1.5 | 841.1 | 2.7 | 819.0 | ||||||||||
Interest and Debt Expense | 156.7 | (35.2) | 241.9 | 11.2 | 217.6 | ||||||||||
Deferral of Acquisition Costs | (590.9) | 6.2 | (556.3) | 5.3 | (528.2) | ||||||||||
Amortization of Deferred Acquisition Costs | 519.1 | 8.1 | 480.4 | 0.4 | 478.6 | ||||||||||
Compensation Expense | 772.6 | 6.9 | 722.4 | 6.2 | 680.5 | ||||||||||
Other Expenses | 821.1 | 2.0 | 805.0 | (2.4) | 825.2 | ||||||||||
Total | 9,158.3 | (3.8) | 9,522.7 | (5.4) | 10,069.9 | ||||||||||
Income from Continuing Operations | 824.0 | (17.4) | 997.2 | 114.3 | 465.4 | ||||||||||
Income Tax | 270.8 | (16.6) | 324.8 | N.M. | 61.8 | ||||||||||
Income from Continuing Operations | 553.2 | (17.7) | 672.4 | 66.6 | 403.6 | ||||||||||
Income from Discontinued Operations | - | (100.0) | 6.9 | (6.8) | 7.4 | ||||||||||
Net Income | $ | 553.2 | (18.6) | $ | 679.3 | 65.3 | $ | 411.0 | |||||||
N.M. = not a meaningful percentage
The following chart lists charges in 2007 and 2006 which affect the comparability of our financial results. In describing our results, we may at times note these items and exclude the impact on financial ratios and metrics to enhance the understanding and comparability of our Company’s performance and the underlying fundamentals in our operations, but this exclusion is not an indication that similar items may not recur.
Included(in millions of dollars)
| Year Ended December 31 | ||||||
| 2007 | 2006 | |||||
Benefits and Change in Reserves for Future Benefits | ||||||
Regulatory Claim Reassessment Charges | $ | 65.8 | $ | 396.4 | ||
Other Operating Expenses | ||||||
Regulatory Claim Reassessment Charges | (12.8) | 15.0 | ||||
Broker Compensation Settlements | - | 18.5 | ||||
Total Charges, Before Tax | $ | 53.0 | $ | 429.9 | ||
Total Charges, After Tax | $ | 34.5 | $ | 280.1 | ||
Index to Financial Statements
Also affecting comparability of our financial results between years is the fluctuation in the results for 2005British pound sterling to dollar exchange rate. The functional currency of our U.K. operations is an after tax charge of $51.6 million related to the Company’s settlement of a market conduct examination withBritish pound sterling. In periods when the California DOI and related matters. Included in thepound weakens, translating pounds into dollars decreases current period results for 2004 are after tax charges of $701.0 million related to the restructuring of the individual income protection – closed block business and $87.8 million related to the Company’s settlement of the multistate market conduct examination. Included in the results for 2003 is an after tax charge of $581.1 million related to U.S. Brokerage group income protection reserve strengthening. The losses from discontinued operations are related to the sale of the Company’s Canadian branch, which closed effective April 30, 2004. See preceding discussions concerning significant transactions and events and “Discontinued Operations” contained herein in Item 7 and the “Notes to Consolidated Financial Statements” contained herein in Item 8 for further details.
The decline in premium income in 2005 relative to the prior yearperiod. In periods when the pound strengthens, translating pounds into dollars increases current period results in relation to the prior period. However, it is generallyimportant to distinguish between translating and converting foreign currency. Except for a limited number of transactions, we do not actually convert pounds into dollars. As a result, we view foreign currency translation as a financial reporting issue and not a reflection of operations or profitability in line with the Company’s expectations asU.K. Because of the volatility in the weighted average pound/dollar exchange rate during the last three years, results translated into dollars are not comparable between years. Our weighted average pound/dollar exchange rate was 1.871, 2.004, and 1.851 for the years ended 2008, 2007, and 2006, respectively. Our operating revenue and operating income by segment would have been higher in 2008 by approximately $86.7 million and $24.2 million, respectively, and higher in 2006 by approximately $86.7 million and $21.3 million, respectively, if the results for our U.K. operations had been translated at a constant exchange rate of 2.004, the rate for 2007.
Consolidated premium income has declined infor both 2008 and 2007 includes premium growth, relative to the Company’s U.S. Brokeragepreceding year, for Unum US supplemental and voluntary lines of business and Colonial Life. Unum US group income protectiondisability and group life and accidental death and dismemberment lines of business experienced year over year declines in premium income during 2008 and 2007, as expected, due primarily to the Company’sour continued pricing discipline for our Unum US group business and our strategy of developing a more balanced business mix. However, both premium and case persistency for its group business. The Unum Limited segment, Colonial segment, and remaining U.S. Brokerage segmentthese lines of business reported growthimproved during 2008 relative to 2007 and 2006, indicating that persistency for these product lines has begun to stabilize as expected. Unum UK premium income, in premium income. In addition, premiumlocal currency, increased in 2007 relative to the prior year but declined in 2008 due to lower persistency in the group long-term disability line of business. Premium income in the Individual Income ProtectionDisability – Closed Block segment decreased in 2008 and 2007, as expected in this closed block of business.
Net investment income is marginally lower in 2008 relative to the prior year. Our portfolio yield has increased in 2005slightly year over year due to the recaptureinvestment of a ceded blocknew cash at higher rates than that of business effective August 8, 2005. Premium income increasedprior periods, particularly during the last two quarters of 2008. We also received fewer bond call premiums in 20042008 relative to 2003 dueprior year periods, and the level of prepayment income on mortgage-backed securities declined in 2008 relative to increasesthe preceding year. The weaker pound in 2008 relative to 2007 also unfavorably affected translated results for net investment income. Somewhat mitigating the impact of these items is continued growth in the U.S. Brokerage supplemental and voluntary lines and the Unum Limited and Colonial segments. This growth was partially offset by a decline in premium income in the U.S. Brokerage group income protection and group life and accidental death and dismemberment lineslevel of business. See the operating results by segment contained herein for further discussions of premium income variances between years.
invested assets.
Net investment income increased slightly in 20052007 relative to the prior year. Included in net investment income for 2005 is approximately $35.0 million relatedThe increase was due primarily to the $1.6 billion of bonds transferred to the Company in conjunction with the 2005 recapture of a ceded closed block of individual income protection business. Excluding that, net investment income was consistent year over year, with the increase from the growth in invested assets, and higher bond call premiumspartially offset by a lower yield due to the investment of new cash at lower rates than that of our existing portfolio yield and a decline in the level of prepayments on mortgage-backed securities relative to the prior year. Net investmentprepayment income in 2004 was level with 2003, with the growth in invested assets offset by lower income on new cash invested in the lower interest rate environment and by a decline in the level of prepayments on mortgage-backed securities. See “Investments” contained hereinThe pound strengthened during 2007 relative to 2006, which favorably affected translated results for net investment income.
We reported a net realized investment loss of $465.9 million in Item 7 for further discussion.
2008 compared to a loss of $65.2 million in 2007 and a gain of $2.2 million in 2006. Included in 2008 realized investment losses are $174.2 million of net realized investment losses from sales and write-downs of investments. The Company’s volatility2008 losses relate primarily to fixed maturity securities in netthe financial institutions, automotive, and media sectors that we either sold or considered other than temporarily impaired during the third and fourth quarters of 2008. Also reported as realized investment gains and losses is duethe change in partthe fair value of an embedded derivative, as required under the provisions of Statement of Financial Accounting Standards No. 133 Implementation Issue B36 (DIG Issue B36),Embedded Derivatives: Modified Coinsurance Arrangements and Debt Instruments That Incorporate Credit Risk Exposure That Are Unrelated or Only Partially Related to the Creditworthiness of the Obligor Under Those Instruments. During 2008, changes in the fair value of the embedded derivatives in certain reinsurance contracts. These fair value changesderivative resulted in a net realized loss of $7.9 million in 2005 compared to net realized gains of $88.6 million for 2004 and $0.8 million for 2003. The Company also experienced improvements in net realized investment gains and losses from sales and write-downs, with a net realized gain of $1.2$291.7 million in 2005 compared to net realized losses of $59.4$57.3 million and $174.6$5.3 million in 20042007 and 2003,2006, respectively. The Company believes that its active managementDIG Issue B36 losses in both 2008 and 2007 resulted primarily from a widening of credit risk has resultedspreads in this improving trendthe overall investment market.
Index to Financial Statements
DIG Issue B36 relates to one modified coinsurance arrangement entered into in 2000 wherein we assumed the profits and expects the levellosses related to a closed block of individual disability business. DIG Issue B36 requires us to include in our realized investment gains and losses a calculation intended to estimate the value of the option of our reinsurance counterparty to cancel the reinsurance contract with us. However, neither party can unilaterally terminate the reinsurance agreement except in extreme circumstances resulting from regulatory supervision, delinquency proceedings, or lossesother direct regulatory action. Cash settlements or collateral related to this embedded derivative are not required at any time during 2006 from salesthe reinsurance contract or at termination of the reinsurance contract, and write-downsany accumulated embedded derivative gain or loss reduces to be relatively consistent withzero over time as the levelreinsured business winds down. We therefore view DIG Issue B36 as a reporting requirement that will not result in a permanent reduction of 2005.assets or stockholders’ equity. See “Investments” contained herein in this Item 7 for further discussion.
The reported ratio of benefits and change in reserves for future benefits to premium income was 90.685.1 percent in 2008 compared to 88.4 percent in 2007 and 95.3 percent for 2005 compared to 92.5 percent for 20042006, with improved risk results in each of our segments and 103.3 percent for 2003.in most lines of business within the Unum US segment. As previously noted,discussed, our reported benefits and change in reserves for future benefits for 2005in 2007 and 2006 include charges of $52.7 million relatedpertaining to our claim reassessment process required by the regulatory settlement agreement with the California DOI and related matters and for 2004 include charges of $84.5 million related to the multistate market conduct examination settlement agreements and $110.6 million related to the restructuring of the individual income protection – closed block business. In 2003, benefits and change in reserves for future benefits include charges of $894.0 million related to the U.S. Brokerage group income protection reserve strengthening.agreements. Excluding these items,charges, the ratio of benefits and change in reserves for future benefits to premium income was 90.087.6 percent for 2005 compared to 90.02007 and 90.3 percent for 2004 and 91.6 percent for 2003.2006. See operating results by segment contained herein“Segment Results” as follows for discussions of line of business risk results.results and claims management performance in each of our segments.
Interest and debt expense for 2008 is lower than 2007 due to lower rates of interest on our outstanding debt, primarily as a result of the replacement of older fixed rate debt with non-recourse floating rate debt, and due to lower cost for early retirement of debt. Interest and debt expense in 2007 increased from the level of 2006 due to an increase in cost related to early retirement of debt, offset partially by the reduction in our outstanding debt. The cost related to early retirement of debt is minimal in 2008. Costs related to early retirement of debt for 2007 and 2006 were $58.8 million and $25.8 million, respectively, and were related to our $769.5 million and $732.0 million debt repurchases during those two years. See “Debt” contained in this Item 7 for additional information.
Commissions decreasedThe deferral and amortization of deferred acquisition costs was higher in 2005both 2008 and 2007 relative to 2004 and 2003the prior year comparable period due primarily to continued growth in certain of our product lines. Amortization also increased in 2008 due to an increase in the declineamortization related to Unum US internal replacement transactions that result in salesa policy that is substantially changed as well as slightly elevated persistency in certain policy issue years.
Operating expenses have increased year over year for expenditures related to our investment in brand and alsoproduct promotion and an increase in product and service development costs in our core lines of business. In addition to the restructuring of the Colonial agency field sales force. The Company is aggressively managing itsadjustments to other operating expenses particularlyas noted in those linesthe preceding chart, additional expenses of business with declining revenue. The Company reportednote in 2008 include a consolidated$5.6 million settlement regarding broker compensation as well as litigation expenses related to two pending cases in our individual disability – closed block segment. During 2007, expenses include an $11.6 million settlement related to a plan beneficiary class action. We intend to aggressively manage our expenses while continuing to increase the effectiveness of our operating expense ratio in 2005 consistent with the level of 2004 and lower than 2003. Excluding the 2005 charges of $22.3 million resulting from the California DOI settlement agreement and related matters and the 2004 charges of $42.5 million resulting from the multistate market conduct examination settlement agreements, as discussed herein, the operating expense ratios were 21.1 percent in 2005 compared to 20.8 percent and 22.3 percent for 2004 and 2003, respectively.
As previously discussed, the Company’s incomeIncome tax for 20052006 includes tax benefits of $42.8$91.9 million related toas a result of the reductionreversal of income tax liabilities related primarily to group relief benefits recognized from the use of net operating losses in the first and third quarters of 2005 and a net tax benefit of $3.3 million recordedforeign jurisdiction in connection with the repatriation of unremitted foreign earnings from its U.K. subsidiaries under the Homeland Investment Act of 2004.which our businesses operate.
Index to Financial Statements
Consolidated Sales Results
(in millions of dollars)
| Year Ended December 31 | |||||||||||||||
| 2005 | % Change | 2004 | % Change | 2003 | |||||||||||
U.S. Brokerage Segment | |||||||||||||||
Fully Insured Products | |||||||||||||||
Group Long-term Income Protection | $ | 180.4 | — | % | $ | 180.4 | (39.7 | )% | $ | 299.1 | |||||
Group Short-term Income Protection | 74.8 | (5.9 | ) | 79.5 | (37.5 | ) | 127.2 | ||||||||
Group Life | 157.8 | (5.2 | ) | 166.5 | (31.1 | ) | 241.6 | ||||||||
Accidental Death & Dismemberment | 14.7 | 14.8 | 12.8 | (51.9 | ) | 26.6 | |||||||||
Individual Income Protection - Recently Issued | 53.8 | (12.7 | ) | 61.6 | (15.5 | ) | 72.9 | ||||||||
Group Long-term Care | 21.1 | 12.8 | 18.7 | (30.7 | ) | 27.0 | |||||||||
Individual Long-term Care | 13.0 | (33.3 | ) | 19.5 | (55.6 | ) | 43.9 | ||||||||
Voluntary Workplace Benefits | 130.2 | 14.1 | 114.1 | 7.8 | 105.8 | ||||||||||
Total Fully Insured Products | 645.8 | (1.1 | ) | 653.1 | (30.8 | ) | 944.1 | ||||||||
Administrative Services Only (ASO) Products | |||||||||||||||
Group Long-term Income Protection | 1.8 | 63.6 | 1.1 | (83.1 | ) | 6.5 | |||||||||
Group Short-term Income Protection | 5.8 | (20.5 | ) | 7.3 | (49.3 | ) | 14.4 | ||||||||
Total ASO Products | 7.6 | (9.5 | ) | 8.4 | (59.8 | ) | 20.9 | ||||||||
U.S. Brokerage Segment | 653.4 | (1.2 | ) | 661.5 | (31.5 | ) | 965.0 | ||||||||
Unum Limited Segment | |||||||||||||||
Group Long-term Income Protection | 91.2 | (11.7 | ) | 103.3 | 26.7 | 81.5 | |||||||||
Group Life | 33.0 | (51.5 | ) | 68.1 | 145.8 | 27.7 | |||||||||
Individual Income Protection | 8.1 | (27.0 | ) | 11.1 | (42.8 | ) | 19.4 | ||||||||
Unum Limited Segment | 132.3 | (27.5 | ) | 182.5 | 41.9 | 128.6 | |||||||||
Colonial Segment | |||||||||||||||
Income Protection | 176.8 | 2.5 | 172.5 | (5.6 | ) | 182.7 | |||||||||
Life | 60.6 | 3.4 | 58.6 | 2.4 | 57.2 | ||||||||||
Cancer and Critical Illness | 49.0 | 3.4 | 47.4 | 4.6 | 45.3 | ||||||||||
Colonial Segment | 286.4 | 2.8 | 278.5 | (2.3 | ) | 285.2 | |||||||||
Individual Income Protection - Closed Block Segment | 6.5 | (16.7 | ) | 7.8 | (35.5 | ) | 12.1 | ||||||||
Total Sales from Continuing Operations | 1,078.6 | (4.6 | ) | 1,130.3 | (18.7 | ) | 1,390.9 | ||||||||
Discontinued Operations | — | N.M. | 10.1 | (72.4 | ) | 36.6 | |||||||||
Total | $ | 1,078.6 | (5.4 | ) | $ | 1,140.4 | (20.1 | ) | $ | 1,427.5 | |||||
N.M. = not a meaningful percentage
| Year Ended December 31 | |||||||||||||||
| 2008 | % Change | 2007 | % Change | 2006 | |||||||||||
Unum US | |||||||||||||||
Fully Insured Products | $ | 701.5 | 11.2 | % | $ | 631.0 | (6.1) | % | $ | 671.8 | |||||
Administrative Services Only (ASO) Products | 7.2 | - | 7.2 | (47.4) | 13.7 | ||||||||||
Total Unum US | 708.7 | 11.0 | 638.2 | (6.9) | 685.5 | ||||||||||
Unum UK | 99.5 | (5.6) | 105.4 | 4.3 | 101.1 | ||||||||||
Colonial Life | 340.2 | 1.6 | 334.9 | 6.3 | 315.1 | ||||||||||
Individual Disability - Closed Block | 2.4 | (20.0) | 3.0 | (31.8) | 4.4 | ||||||||||
Consolidated | $ | 1,150.8 | 6.4 | $ | 1,081.5 | (2.2) | $ | 1,106.1 | |||||||
Sales results shown in the preceding chart generally represent the annualized premium or annualized fee income on new sales expectedwhich we expect to be receivedreceive and reportedreport as premium income or fee income during the next twelve12 months following or commencingbeginning in the initial quarter in which the sale is reported, depending on the effective date of the new sale. Sales do not correspond to premium income or fee income reported as revenue under GAAPin accordance with GAAP. This is because new
annualized sales premiums measurereflect current sales performance and what we expect to recognize as premium or fee income over a 12 month period, while premium income and fee income reported in our financial statements are recognized when earnedreported on an “as earned” basis rather than an annualized basis and reflectalso include renewals and persistency of in force policies written in prior years as well as current new sales. Prior year sales results by segment have been reclassified to conform to the current reporting segments, the change of which is discussed herein.
Premiums for fully insured products are reported as premium income while the feesincome. Fees for administrative services only (ASO)ASO products wherein(those where the risk and responsibility for funding claim payments remainsremain with the customer and we only provide services) are included in other income. Sales, together with persistency of the existing block of business, and the Company’seffectiveness of the renewal program are an indicatorindicators of growth in the Company’sour premium and fee income. Trends in new sales, as well as existing market share, are also indicators of the Company’sindicate our potential for growth in itsour respective markets and the level of market acceptance of price changes and new product offerings. Sales results may fluctuate significantly due to case size and timing of sales submissions. Negative media attention or downgrades in the financial strength ratings of the Company’s insurance subsidiaries may adversely affect the Company’s ability to grow sales and renew its existing business. The Company intends
We intend to continue with itsour disciplined approach to pricing and also with theour strategy of developing a more balanced business mix of large, small, and mid-employer markets.
The Company has field sales personnel who specializemix. This strategy is expected to result in (1) employer-provided plans for employees and (2) supplemental benefit plans that include multi-life income protection and long-term care product offerings and products sold to groups of employees through payroll deduction at the workplace. These field sales personnel partner with Company representatives from claims, customer service, and underwriting who work in conjunction with independent brokers and consultants to present coverage solutions to potential customers and to manage existing customer accounts. The Company utilizes a distribution model for the sale of individual income protection and individual long-term care insurance products whereby independent brokers and consultants are provided direct access to a sales support center centrally locatedlower premium persistency or market share, particularly in the Company’s corporate offices. The Company intends to maintain its focuslarge case Unum US group market, but historically the profitability of business that terminates has generally been lower than the profitability of retained business. We do not anticipate a decline in the number of cases, or case persistency, for our Unum US group market on workplace customers and increased integration between supplemental benefit plans and group offeringsan aggregate basis.
See “Segment Results” as follows for additional discussion of sales by continuing to provide highly focused field support. The Company also utilizes an agency field sales force to market the products offered by its Colonial segment.
Segment Operating Results
Effective July 1, 2005, the Company modified its reporting segments to separate its United States business from that of its United Kingdom subsidiary, Unum Limited, due to the continued growth in that subsidiary and to recent organizational changes within the Company which established a separate management team to focus solely on the U.S. Brokerage lines of business. The Company’s newOur reporting segments are comprised of the following: U.S. Brokerage, Unum Limited (U.K. business),US, Unum UK, Colonial Life, Individual Income ProtectionDisability – Closed Block, Other, and Corporate.
The U.S. Brokerage segment includesCorporate and Other. Effective with the resultsfourth quarter of the Company’s U.S. group income protection insurance, group life and accidental death and dismemberment products, and supplemental and voluntary lines of business, including individual income protection – recently issued, group and individual long-term care, and brokerage voluntary workplace benefits products. The Unum Limited segment includes group long-term income protection, group life, and individual income protection products. The products now reported in the U.S. Brokerage segment and the Unum Limited segment were previously combined and reported in the Income Protection and Life and Accident segments. The modification of the Company’s2008, we made slight modifications to our reporting segments had no impact onto better align the level at whichdebt of our securitizations with the Company performs impairment testingbusiness segments and to align the allocation of capital for goodwill or loss recognition testing forUnum UK similar to that of Unum US and Colonial Life. Specifically, we transferred the recoverabilityassets, non-recourse debt, and associated capital of deferred policy acquisition costsTailwind Holdings, LLC (Tailwind Holdings) and value of business acquired.
The results of theNorthwind Holdings, LLC (Northwind Holdings) from our former Corporate segment to Unum US group disability management services business are now reported in the Other segment, which has been redefined to include the disability management services business as well as results from U.S. Brokerage insured products not actively marketed (with the exception of the individual income protection products in theand Individual Income ProtectionDisability – Closed Block, segment). There were no changesrespectively. We transferred excess assets, capital in excess of target, and the associated investment income from Unum UK to our Corporate and Other segment. We also modified the Colonial, Individual Income Protection – Closed Block, orinvestment income allocation on capital supporting certain of our group disability and long-term care product lines within Unum US and have also aggregated our former Other segment and Corporate segments. Segment information for prior periods hassegment into one reporting segment. Financial results previously reported have been reclassifiedrevised to conform to the current reporting segments.reflect these reclassifications.
Index to Financial Statements
In the following segment financial data and discussions of segment operating results, “operating revenue” excludes net realized investment gains and losses. “Operating income” or “operating loss” excludes net realized investment gains and losses and income tax, and results of discontinued operations.tax. These are considered non-GAAP financial measures. A non-GAAP financial measure is a numerical measure of a company’s performance, financial position, or cash flows that excludes or includes amounts that are not normally excluded or included in the most directly comparable measure calculated and presented in accordance with U.S. generally accepted accounting principles (GAAP).
GAAP.
These non-GAAP financial measures of “operating revenue” and “operating income” or “operating loss” differ from revenue and income (loss) from continuing operations before income tax as presented in the Company’sour consolidated operating results reported herein and in income statements prepared in accordance with GAAP due to the exclusion of before tax realized investment gains and losses. The Company measuresWe measure segment performance for purposes of Statement of Financial Accounting Standards No. 131,Disclosures about Segments of an Enterprise and Related Information, excluding realized investment gains and losses because management believeswe believe that this performance measure is a better indicator of the ongoing businesses and the underlying trends in the businesses. The Company’sOur investment focus is on investment income to support itsour insurance liabilities as opposed to the generation of realized investment gains and losses, and a long-term focus is necessary to maintain profitability over the life of the business. Realized investment gains and losses are dependentdepend on market conditions and do not necessarily relatedrelate to decisions regarding the underlying business of the Company’sour segments. However, income or loss excluding realized investment gains and losses does not replace net income or net loss as a measure of the Company’s overall profitability. The CompanyWe may experience realized investment losses, which will affect future earnings levels as thesince our underlying business is long-term in nature and requires that the Company be ablewe need to earn the assumed interest rates in itsour liabilities.
A reconciliation of total operating revenue by segment to total consolidated revenue and total operating income (loss) by segment to consolidated net income (loss) is as follows.
follows:
(in millions of dollars)
| Year Ended December 31 | ||||||||||||
| 2005 | 2004 | 2003 | ||||||||||
Operating Revenue by Segment | $ | 10,443.9 | $ | 10,435.7 | $ | 10,165.4 | ||||||
Net Realized Investment Gain (Loss) | (6.7 | ) | 29.2 | (173.8 | ) | |||||||
Revenue | $ | 10,437.2 | $ | 10,464.9 | $ | 9,991.6 | ||||||
Operating Income (Loss) by Segment | $ | 716.3 | $ | (288.7 | ) | $ | (261.4 | ) | ||||
Net Realized Investment Gain (Loss) | (6.7 | ) | 29.2 | (173.8 | ) | |||||||
Income Tax (Benefit) | 196.0 | (67.3 | ) | (170.6 | ) | |||||||
Loss from Discontinued Operations, Net of Tax | — | (60.8 | ) | (161.7 | ) | |||||||
Cumulative Effect of Accounting Principle Change, Net of Tax | — | — | 39.9 | |||||||||
Net Income (Loss) | $ | 513.6 | $ | (253.0 | ) | $ | (386.4 | ) | ||||
| Year Ended December 31 | |||||||||
| 2008 | 2007 | 2006 | |||||||
Operating Revenue by Segment | $ | 10,448.2 | $ | 10,585.1 | $ | 10,533.1 | |||
Net Realized Investment Gain (Loss) | (465.9) | (65.2) | 2.2 | ||||||
Revenue | $ | 9,982.3 | $ | 10,519.9 | $ | 10,535.3 | |||
Operating Income by Segment | $ | 1,289.9 | $ | 1,062.4 | $ | 463.2 | |||
Net Realized Investment Gain (Loss) | (465.9) | (65.2) | 2.2 | ||||||
Income Tax | 270.8 | 324.8 | 61.8 | ||||||
Income from Discontinued Operations | - | 6.9 | 7.4 | ||||||
Net Income | $ | 553.2 | $ | 679.3 | $ | 411.0 | |||
IncludedAs previously noted, included in the 2005 before-tax operating income by segment shown above are before-tax charges of $716.3$53.0 million is a before-tax charge of $75.0and $411.4 million in 2007 and 2006, respectively, related to the settlement ofclaim reassessment process and $18.5 million in 2006 for the market conduct examination with the California DOIbroker compensation settlement. Also as previously discussed, operating revenue and related matters. Included in the 2004 before-tax operating lossincome by segment would have been higher in 2008 by approximately $86.7 million and $24.2 million, respectively, and higher in 2006 by approximately $86.7 million and $21.3 million, respectively, if the results for our U.K. operations had been translated at a constant exchange rate of $288.7 million is a before-tax charge of $127.0 million related to2.004, the settlement of the multistate market conduct examination and a before-tax charge of $967.0 million related to the first quarter of 2004 restructuring of the individual income protection – closed block of business. Included in the 2003 before-tax operating loss by segment of $261.4 million is a before-tax charge of $894.0 million related to U.S. Brokerage group income protection reserve strengthening.rate for 2007.
Index to Financial Statements
U.S. BrokerageUnum US Segment Operating Results
The U.S. BrokerageUnum US segment includes group long-term and short-term income protectiondisability insurance, group life and accidental death and dismemberment (AD&D) products, and supplemental and voluntary lines of business. The supplemental and voluntary lines of business are comprised of recently issued individual income protectiondisability insurance, group and individual long-term care insurance, and voluntary workplace benefits products. Effective with the fourth quarter of 2008, we made slight modifications to our reporting segments to better align the debt of our securitizations with our business segments. The assets, non-recourse debt, and associated capital of Tailwind Holdings are now reported in our Unum US segment in the group disability line of business. The primary effect on operating results from the movement of Tailwind Holdings to Unum US is the inclusion of interest and debt expense associated with the Tailwind Holdings non-recourse debt. We also modified the investment income allocation on capital supporting certain of our group disability and long-term care product lines within Unum US. Financial results previously reported have been revised to reflect these reclassifications.
Unum US Operating Results
Shown below are financial results for the U.S. BrokerageUnum US segment. In the sections following, financial results and key ratios are also presented for the major lines of business within the segment.
(in millions of dollars)
| Year Ended December 31 | |||||||||||||||
| 2008 | % Change | 2007 | % Change | 2006 | |||||||||||
Operating Revenue | |||||||||||||||
Premium Income | $ | 4,963.0 | (1.0) | % | $ | 5,014.0 | (3.5) | % | $ | 5,196.0 | |||||
Net Investment Income | 1,136.4 | 2.0 | 1,114.0 | 5.3 | 1,057.5 | ||||||||||
Other Income | 132.7 | (2.1) | 135.6 | 25.0 | 108.5 | ||||||||||
Total | 6,232.1 | (0.5) | 6,263.6 | (1.5) | 6,362.0 | ||||||||||
Benefits and Expenses | |||||||||||||||
Benefits and Change in Reserves for Future Benefits | 3,998.4 | (5.8) | 4,246.4 | (10.6) | 4,752.1 | ||||||||||
Commissions | 518.6 | 3.4 | 501.5 | (0.7) | 505.2 | ||||||||||
Interest and Debt Expense | 4.2 | (44.0) | 7.5 | N.M. | 1.3 | ||||||||||
Deferral of Acquisition Costs | (329.7) | 8.4 | (304.2) | (0.7) | (306.2) | ||||||||||
Amortization of Deferred Acquisition Costs | 320.3 | 15.6 | 277.1 | (8.3) | 302.2 | ||||||||||
Other Expenses | 1,036.2 | 4.3 | 993.2 | (2.5) | 1,018.7 | ||||||||||
Total | 5,548.0 | (3.0) | 5,721.5 | (8.8) | 6,273.3 | ||||||||||
Operating Income Before Income Tax and Net Realized Investment Gains and Losses | $ | 684.1 | 26.2 | $ | 542.1 | N.M. | $ | 88.7 | |||||||
N.M. = not a meaningful percentage
As previously discussed, included in operating income for Unum US are before-tax charges of $66.2 million and $364.2 million in 2007 and 2006, respectively, related to the claim reassessment process.
We adopted the provisions of SOP 05-1 effective January 1, 2007, and recorded a cumulative effect adjustment which decreased our 2007 opening balance of Unum US DAC $589.8 million. SOP 05-1 provides guidance on accounting for DAC on internal replacements and effectively shortens the amortization period for DAC for many of our group products.
Index to Financial Statements
Unum US Sales
(in millions of dollars)
| Year Ended December 31 | ||||||||||||||||||
| 2005 | % Change | 2004 | % Change | 2003 | ||||||||||||||
Operating Revenue | ||||||||||||||||||
Premium Income | $ | 5,229.0 | (3.6 | )% | $ | 5,421.6 | 0.7 | % | $ | 5,382.4 | ||||||||
Net Investment Income | 998.2 | 3.4 | 965.8 | (0.8 | ) | 974.0 | ||||||||||||
Other Income | 108.6 | 20.9 | 89.8 | 27.2 | 70.6 | |||||||||||||
Total | 6,335.8 | (2.2 | ) | 6,477.2 | 0.8 | 6,427.0 | ||||||||||||
Benefits and Expenses | ||||||||||||||||||
Benefits and Change in Reserves for Future Benefits | 4,419.3 | (4.2 | ) | 4,614.4 | (15.1 | ) | 5,437.5 | |||||||||||
Commissions | 501.6 | (6.8 | ) | 538.3 | (1.9 | ) | 548.8 | |||||||||||
Deferral of Policy Acquisition Costs | (311.9 | ) | (9.9 | ) | (346.0 | ) | (24.6 | ) | (458.8 | ) | ||||||||
Amortization of Deferred Policy Acquisition Costs | 306.9 | 7.2 | 286.3 | 1.5 | 282.0 | |||||||||||||
Amortization of Value of Business Acquired | 0.3 | 50.0 | 0.2 | (33.3 | ) | 0.3 | ||||||||||||
Operating Expenses | 1,031.9 | (1.6 | ) | 1,048.5 | — | 1,048.4 | ||||||||||||
Total | 5,948.1 | (3.2 | ) | 6,141.7 | (10.4 | ) | 6,858.2 | |||||||||||
Operating Income (Loss) Before Income Tax and Net Realized Investment Gains and Losses | $ | 387.7 | 15.6 | $ | 335.5 | 177.8 | $ | (431.2 | ) | |||||||||
| Year Ended December 31 | |||||||||||||||
| 2008 | % Change | 2007 | % Change | 2006 | |||||||||||
Sales by Product | |||||||||||||||
Fully Insured Products | |||||||||||||||
Group Disability, Group Life, and AD&D | |||||||||||||||
Group Long-term Disability | $ | 190.3 | 7.1 | % | $ | 177.7 | (14.8) | % | $ | 208.5 | |||||
Group Short-term Disability | 71.5 | 10.5 | 64.7 | (12.7) | 74.1 | ||||||||||
Group Life | 165.4 | 23.4 | 134.0 | (10.5) | 149.8 | ||||||||||
AD&D | 17.2 | 24.6 | 13.8 | 0.7 | 13.7 | ||||||||||
Subtotal | 444.4 | 13.9 | 390.2 | (12.5) | 446.1 | ||||||||||
Supplemental and Voluntary | |||||||||||||||
Individual Disability - Recently Issued | 57.9 | (3.0) | 59.7 | 7.8 | 55.4 | ||||||||||
Group Long-term Care | 32.2 | (1.8) | 32.8 | 30.7 | 25.1 | ||||||||||
Individual Long-term Care | 8.4 | (15.2) | 9.9 | (10.0) | 11.0 | ||||||||||
Voluntary Benefits | 158.6 | 14.6 | 138.4 | 3.1 | 134.2 | ||||||||||
Subtotal | 257.1 | 6.8 | 240.8 | 6.7 | 225.7 | ||||||||||
Total Fully Insured Products | 701.5 | 11.2 | 631.0 | (6.1) | 671.8 | ||||||||||
Administrative Services Only (ASO) Products | 7.2 | - | 7.2 | (47.4) | 13.7 | ||||||||||
Total Sales | $ | 708.7 | 11.0 | $ | 638.2 | (6.9) | $ | 685.5 | |||||||
Sales by Market Sector | |||||||||||||||
Group Disability, Group Life, and AD&D | |||||||||||||||
Core Market (< 2,000 lives) | $ | 297.2 | 23.7 | % | $ | 240.3 | 0.6 | % | $ | 238.9 | |||||
Large Case Market | 147.2 | (1.8) | 149.9 | (27.7) | 207.2 | ||||||||||
Subtotal | 444.4 | 13.9 | 390.2 | (12.5) | 446.1 | ||||||||||
Supplemental and Voluntary | 257.1 | 6.8 | 240.8 | 6.7 | 225.7 | ||||||||||
Total Fully Insured Products | 701.5 | 11.2 | 631.0 | (6.1) | 671.8 | ||||||||||
Administrative Services Only (ASO) Products | 7.2 | - | 7.2 | (47.4) | 13.7 | ||||||||||
Total Sales | $ | 708.7 | 11.0 | $ | 638.2 | (6.9) | $ | 685.5 | |||||||
Segment SalesYear Ended December 31, 2008 Compared with Year Ended December 31, 2007
Unum US sales increased 11.0 percent in 2008 compared to 2007. Our group core market segment, which we define for Unum US as employee groups with less than 2,000 lives, had a sales increase of 23.7 percent over the prior year, and the number of new accounts increased 16.4 percent. We had a sales mix of approximately 67 percent core market and 33 percent large case market in 2008, in line with our targeted 60 percent core/40 percent large case market distribution mix. Our supplemental and voluntary sales increased 6.8 percent in 2008 compared to last year, with a 14.6 percent increase in voluntary sales offsetting the expected decrease in sales of individual long-term care.
Sales in the group large case market segment declined 1.8 percent compared to the prior year. Sales for our individual disability line of business, of which approximately 91.0 percent are in the multi-life market, decreased slightly during 2008 compared to 2007.
Index to Financial Statements
During 2009 we will continue to focus on our group core market segment, group long-term care, and voluntary products market, as well as disciplined growth in our group large case and individual disability markets. In order to focus more completely on the group long-term care market, we have decided to discontinue selling individual long-term care insurance on an active basis effective in 2009.
Year Ended December 31, 20052007 Compared with Year Ended December 31, 20042006
While overall sales for Unum US declined in 2007 relative to 2006, we maintained our disciplined pricing and our sales mix was generally in line with our target mix. In 2007, we had a sales mix of approximately 62 percent core market and 38 percent large case market. Although sales on an annualized premium basis declined year over year in our group core market segment, the number of new accounts in this segment increased over 2006.
Sales for the U.S. Brokerage segment during 2005 were generally consistent with Company expectations. The Company anticipated relatively weakerour individual disability line of business increased over 2006. Long-term care sales for the first half of 2005 relative to the comparable period of 2004 for both group and individual income protection products primarily as a result of the competitive pricing environment. The Company began to restore sales momentum during the latter half of the year, particularly in the small and mid-employer core markets, while maintaining its commitment to a disciplined pricing approach for new business. The Company intends to continue to emphasize profitable premium growth through a balance of new sales, renewal programs, and persistency of existing profitable blocks of business.
Sales highlights for 2005 showing progress in achievement of the strategy of disciplined pricing and a balanced business mix through diversification include:
Year Ended December 31, 2004 Compared with Year Ended December 31, 2003
Group long-term and short-term income protection sales, on a fully insured basis, decreased during 2004 compared to 2003 due to a decline in sales as a result of the Company’s aforementioned approach to pricing and continued shift to focus on the small and mid-employer core markets. Sales for group life decreased in 2004 relative to 2003 due to a more competitive market, which resulted in sales declines in all market sizes, and also due to a decrease in large-employer market sales. The Company anticipated weaker sales for 2004 as compared to 2003 for its group products due primarily to its balanced business mix strategy and the competitive pricing environment.
The portion of the individual income protection sales attributable to multi-life business was approximately 81 percent for 2004 sales and 77 percent for 2003 sales, although both multi-life and non multi-life sales declined in 2004 relative to the prior year. Voluntary workplace benefits sales increased in 2004 relative to 2003 and were generally in line with the Company’s expectations.
Segment Persistency and Renewal of Existing Business
Year Ended December 31, 2005 Compared with Year Ended December 31, 2004
The Company monitors persistency of its existing business and reflects adverse changes in persistency in the current period’s amortization of deferred policy acquisition costs. One way in which the Company monitors persistency is at the overall block of business level (i.e., group long-term income protection, group short-term income protection, and group life). Persistency, at the overall block of business level, is the year-to-date rate at which existing business for all issue years in the block of business at the beginning of the period remains inforce at the end of the period. In determining whether additional amortization of deferred policy acquisition costs is required due to adverse persistency, the Company measures persistency by issue year (i.e., the rate at which existing business for that specific issue year at the beginning of the period remains inforce at the end of the period). The rate of persistency for an overall block of business may improve while individual issue years within the overall block of business may deteriorate and require additional amortization of deferred policy acquisition costs.
Persistency during 2005 for the overall block of fully-insured group long-term income protection, on average, was level with 2004, but was higher than expected. Persistency for fully insured group short-term income protection, on average, declined marginally during 2005 compared to the prior year and was slightly less than expected. Included in the 2005 policy terminations was a group policyholder who did not terminate the relationship with the Company, but transferred from fully insured short-term income protection to ASO. Adjusting persistencyour strategy for this policyholder’s transfer, persistency for fully insured group short-term income protection was slightly higher than expected for 2005. It was anticipated that persistencyproduct line, with growth in the group income protection business wouldproduct and a decline in 2005 duesales for individual long-term care. Our voluntary benefits sales increased in 2007 relative to 2006, consistent with our focus on sales growth in our voluntary product lines.
Because our focus for our 2007 renewal program was aimed primarily at improving the Company’s more disciplined approach to pricing, renewals,profitability of our large case group business, sales and risk selection. Since the group life and accidental death and dismemberment products are primarily sold in conjunction with group income protection, the more focused renewal effort in group income protection has reduced persistency in these lines, though the reduction in persistency is less than anticipated. The persistency for the supplemental and voluntary product lines generally continues to be within expected levels.
For the years 2002 and subsequent, the Company lowered its premium persistency assumptions for group income protection, group life, and group accidental death and dismemberment policy acquisition costs deferred in those years to reflect its current estimate of persistency. This accelerated the amortization of acquisition costs deferred in those years into the early life of the policy by using lower premium persistency assumptions to determine the “scheduled” or expected amortization. Although persistency in the future may be lower than historical levels, particularly in certain issue years due to the Company’s increased emphasis on retaining profitable business, the acceleration of “scheduled” amortization may eliminate the need for additional amortization related to the decline in actual persistency relative to “scheduled” or expected persistency. The Company does not anticipate that the persistency levels for 2006 will result in increased amortization.
During 2005, the Company completed its annual comprehensive scenario testing with respect to the amortization and recoverability of its group income protection and group life deferred policy acquisition costs. The deferred policy acquisition costs were fully recoverable. The assessment is performed primarily to test both recoverability and the limits of recoverability. Sustained adverse persistency at the levels tested would result in lower emerging future profits due to lower overall premium levels and additional acceleration, on a prospective basis, of the amortization of deferred policy acquisition costs relative to the “scheduled” or expected amortization, but the Company does not anticipate prolonged persistency rates at the stress levels tested.
A continuing part of the Company’s strategy for U.S. Brokerage group business involves executing its renewal programs and managing persistency in its existing blocks of business. Persistency for the primary lines of business within the U.S. Brokeragelarge case market segment is expected to remain stable or slightly improve during 2006, which reflects the need for less aggressive renewal actions needed on the in-force business and a smaller 2006 renewal program than those of 2004 and 2005. Included in the Company’s 2006 renewal program is a focus on group income protection products sold in the State of California. As a result of the Company’s settlement agreement with the California DOI and the resulting revisions in group income protection product requirements for policies issued in California, the Company’s 2006 renewal program includes a focus on new sales and renewal of existing business in the California market.
The Company’s previous renewal programs have generally been successful in retaining business that is relatively more profitable than business that terminated. While it is expected that the additional premium and related profits associated with renewal activity will continue to emerge, the Company intends to balance the renewal program with the need to maximize persistency and retain producer relationships.
In January of 2006, the Company began a process of filing a request with various state insurance departments for rate adjustments on one older series of individual long-term care policies. The rate adjustment will bring the rates for this policy series closer to today’s market, better reflecting current interest rates, higher expected future claims, persistency, experience, and other factors related to pricing individual long-term care coverage. Overall, the average increase will be in the 30 percent range and will affect approximately 130,000 policyholders, less than 16 percent of the Company’s total long-term care block of business. Increases are subject to state review and approval and will be effective on the policy anniversary following the state approval and only after the proper state-specific notification requirements have been satisfied. In states for which a rate increase is submitted and approved, customers will also be given options for coverage changes or other approaches that might fit their current financial and insurance needs.
Year Ended December 31, 2004 Compared with Year Ended December 31, 2003
Persistency during 2004 for group long-term income protection, on average, declined from that experienced in 2003. Terminations were more heavily concentrated in the large-employer market, while persistency in the small and mid-employer markets improved slightly in 2004 compared to 2003. Persistency for fully insured short-term income protection also declined during 2004, on average, over the prior year. These declines in persistency were expected due2007, as expected.
Index to the Company’s disciplined approach to pricing, renewals, and risk selection. Persistency in 2004 in group life and the supplemental and voluntary lines of business within this segment was consistent with the levels of 2003.Financial Statements
U.S. BrokerageUnum US Group Income ProtectionDisability Operating Results
Shown below are financial results and key performance indicators for U.S. BrokerageUnum US group income protection.
disability.
(in millions of dollars, except ratios)
| Year Ended December 31 | |||||||||||||||
| 2008 | % Change | 2007 | % Change | 2006 | |||||||||||
Operating Revenue | |||||||||||||||
Premium Income | |||||||||||||||
Group Long-term Disability | $ | 1,838.5 | (3.0) | % | $ | 1,895.7 | (2.9) | % | $ | 1,953.3 | |||||
Group Short-term Disability | 435.1 | (10.4) | 485.6 | (8.4) | 530.2 | ||||||||||
Total Premium Income | 2,273.6 | (4.5) | 2,381.3 | (4.1) | 2,483.5 | ||||||||||
Net Investment Income | 631.3 | (2.7) | 648.7 | 1.6 | 638.5 | ||||||||||
Other Income | 100.2 | 0.1 | 100.1 | 21.6 | 82.3 | ||||||||||
Total | 3,005.1 | (4.0) | 3,130.1 | (2.3) | 3,204.3 | ||||||||||
Benefits and Expenses | |||||||||||||||
Benefits and Change in Reserves for Future Benefits | 2,043.9 | (10.3) | 2,277.4 | (15.7) | 2,702.5 | ||||||||||
Commissions | 165.9 | (1.1) | 167.7 | (4.6) | 175.8 | ||||||||||
Interest and Debt Expense | 4.2 | (44.0) | 7.5 | N.M. | 1.3 | ||||||||||
Deferral of Acquisition Costs | (59.4) | (1.7) | (60.4) | (6.4) | (64.5) | ||||||||||
Amortization of Deferred Acquisition Costs | 76.7 | 15.9 | 66.2 | (23.4) | 86.4 | ||||||||||
Other Expenses | 572.4 | 1.9 | 561.6 | (4.6) | 588.7 | ||||||||||
Total | 2,803.7 | (7.2) | 3,020.0 | (13.5) | 3,490.2 | ||||||||||
Operating Income (Loss) Before Income Tax and Net Realized Investment Gains and Losses | $ | 201.4 | 82.9 | $ | 110.1 | 138.5 | $ | (285.9) | |||||||
Operating Ratios (% of Premium Income): | |||||||||||||||
Benefit Ratio (1) | 89.9% | 95.6% | 108.8% | ||||||||||||
Other Expense Ratio (2) | 25.2% | 23.6% | 23.7% | ||||||||||||
Before-tax Operating Income (Loss) Ratio (3) | 8.9% | 4.6% | (11.5)% | ||||||||||||
Premium Persistency: | |||||||||||||||
Group Long-term Disability | 87.8% | 85.1% | 87.8% | ||||||||||||
Group Short-term Disability | 82.1% | 74.0% | 85.6% | ||||||||||||
Case Persistency: | |||||||||||||||
Group Long-term Disability | 89.2% | 88.4% | 87.4% | ||||||||||||
Group Short-term Disability | 88.2% | 87.4% | 86.2% | ||||||||||||
N.M. = not a meaningful percentage
| Year Ended December 31 | ||||||||||||||||||
| 2005 | % Change | 2004 | % Change | 2003 | ||||||||||||||
Operating Revenue | ||||||||||||||||||
Premium Income | ||||||||||||||||||
Group Long-term Income Protection | $ | 1,961.6 | (3.3 | )% | $ | 2,028.6 | (0.2 | )% | $ | 2,031.7 | ||||||||
Group Short-term Income Protection | 566.3 | (8.1 | ) | 616.1 | (2.3 | ) | 630.9 | |||||||||||
Total Premium Income | 2,527.9 | (4.4 | ) | 2,644.7 | (0.7 | ) | 2,662.6 | |||||||||||
Net Investment Income | 605.7 | 1.7 | 595.8 | (2.3 | ) | 609.7 | ||||||||||||
Other Income | 80.3 | 15.4 | 69.6 | 23.4 | 56.4 | |||||||||||||
Total | 3,213.9 | (2.9 | ) | 3,310.1 | (0.6 | ) | 3,328.7 | |||||||||||
Benefits and Expenses | ||||||||||||||||||
Benefits and Change in Reserves for Future Benefits | 2,397.7 | (5.3 | ) | 2,533.1 | (25.8 | ) | 3,412.1 | |||||||||||
Commissions | 175.1 | (12.0 | ) | 199.0 | (0.5 | ) | 200.1 | |||||||||||
Deferral of Policy Acquisition Costs | (64.6 | ) | (16.2 | ) | (77.1 | ) | (38.4 | ) | (125.1 | ) | ||||||||
Amortization of Deferred Policy Acquisition Costs | 92.2 | (1.4 | ) | 93.5 | (2.7 | ) | 96.1 | |||||||||||
Operating Expenses | 582.5 | (6.0 | ) | 619.6 | 0.7 | 615.5 | ||||||||||||
Total | 3,182.9 | (5.5 | ) | 3,368.1 | (19.8 | ) | 4,198.7 | |||||||||||
Operating Income (Loss) Before Income Tax and Net Realized Investment Gains and Losses | $ | 31.0 | 153.4 | $ | (58.0 | ) | 93.3 | $ | (870.0 | ) | ||||||||
Benefit Ratio (% of Premium Income) (1) | 94.8 | % | 95.8 | % | 128.1 | % | ||||||||||||
Operating Expense Ratio (% of Premium Income) (2) | 23.0 | % | 23.4 | % | 23.1 | % | ||||||||||||
Before-tax Operating Income (Loss) Ratio (% of Premium Income) (3) | 1.2 | % | (2.2 | )% | (32.7 | )% | ||||||||||||
Persistency - Group Long-term Income Protection | 84.8 | % | 84.8 | % | 87.2 | % | ||||||||||||
Persistency - Group Short-term Income Protection | 79.6 | % | 80.6 | % | 84.5 | % | ||||||||||||
(1) Included in these ratios are charges of $76.5 million and $349.2 million in 2007 and 2006, respectively, related to the claim reassessment process. Excluding these charges, the charges noted in (3) abovebenefit ratios for 2007 and discussed more fully in the preceding significant transactions and events discussions for each applicable year, group income protection2006 would have reportedbeen 92.4% and 94.8%, respectively.
(2) Included in these ratios are increases (decreases) of $(10.3) million and $15.0 million in 2007 and 2006, respectively, related to the claim reassessment process. Excluding these items, the other expense ratios for 2007 and 2006 would have been 24.0% and 23.1%, respectively.
(3) Included in these ratios are charges of $66.2 million and $364.2 million in 2007 and 2006, respectively, related to the claim reassessment process. Excluding these charges, the before-tax operating income of $68.4 million in 2005, $58.7 million in 2004,ratio for 2007 and $24.0 million in 2003.2006 would have been 7.4% and 3.2%, respectively.
Index to Financial Statements
Year Ended December 31, 20052008 Compared with Year Ended December 31, 20042007
Operating revenuePremium income for group income protectiondisability decreased in 20052008 relative to the prior year, as expected, due primarily to our pricing, renewal, and risk selection strategy as well as the termination of one large case group in September 2007. However, premium persistency and case persistency both improved over the prior year in both the core and large case markets, indicating that persistency for these lines is beginning to stabilize as expected. Net investment income declined in 2008 in comparison to the prior year due primarily to a lower yield on assets supporting this line of business resulting from the investment of new cash at a lower yield than that of the existing portfolio and also due to a decrease in bond call premiums. The decline in yield and bond call premiums was partially offset by an increase in the level of assets in the portfolio. Other income includes ASO fees of $64.8 million and $65.2 million for 2008 and 2007, respectively.
The benefit ratio for 2008 was lower than the benefit ratio for the prior year, excluding the 2007 revision to our estimate for the claim reassessment costs, due primarily to a higher rate of claim recoveries in group long-term disability and lower paid claims in short-term disability. Annual claim incidence rates for both group long-term and short-term disability are slightly lower than the prior year, with no unusual trends noted by sector or by case size. An increase in incidence rates for group short-term disability generally precedes an increase in long-term disability submitted incidence.
Interest and debt expense related to the debt issued by Tailwind Holdings decreased from the prior year due to a decrease in the variable rate of interest during 2008 compared to 2007 and a decrease in the amount of outstanding debt resulting from principal payments made during 2008 and 2007.
The deferral of acquisition costs was generally consistent with the prior year. Amortization was higher in 2008 relative to the prior year due to the expected declinean increase in premium income. Net investment income increased dueamortization related to the growthinternal replacement transactions that result in the level of assets supporting these lines of business, offsetting the impacta policy that is substantially changed. These transactions are accounted for as an extinguishment of the declining yield which results from investingoriginal policy and the issuance of a new cash in the lower interest rate environment. Other income, whichpolicy.
The other expense ratio increased in 2005 relative2008 compared to the prior year, includes ASO fees of $59.0 million and $56.1 million for 2005 and 2004, respectively.
The benefit ratio for group long-term income protection increased in 2005 relative to the prior year, excluding the charges taken in 2005 and 2004 related to the settlement agreement with the California DOI and related matters and the settlement agreements related to the multistate market conduct examination, due primarily to claims management performance, particularly reduced operational effectiveness in the timing of claim decisions and claim recoveries. For group short-term income protection, the 2005 benefit ratio was lower than 2004 due primarily to increased premiums per insured life and a decrease in the paid claim incidence rate.
Commissions and the deferral of policy acquisition costs were below the prior year due primarily to lower sales. Operatingthe decline in premium income and an increase in policy maintenance expenses for 2005 include charges of $10.1 millionand product service and development costs. Also contributing to the increase in the other expense ratio was the expense related to the broker compensation settlement agreement with the California DOI and related matters andpreviously discussed, of which $4.4 million was included in 2008 expenses for 2004 includes charges of $36.5 million related to the settlement of the multistate market conduct examination. Excluding those charges, expenses are lower than the prior year, and while the adjusted operating expense ratio has increased slightly relative to the prior year, the Company is aggressively managing its expenses against the expected decline in premium income.
group disability.
As discussed under “Cautionary Statement Regarding Forward-Looking Statements,” and in “Risk Factors” contained herein in Item 1A, certain risks and uncertainties are inherent in the Company’s group income protectiondisability business. Components of claims experience, including, but not limited to, incidence and recovery rates, may be worse than expected.we expect. Both economic and societal factors can affect claim incidence. Disability claim incidence and claim recovery rates may be influenced by, among other factors, the rate of unemployment and consumer confidence. The relationship between these and other factors and overall incidence is very complex and will vary due to contract design features and the degree of expertise within the insuring organization to price, underwrite, and adjudicate the claims. Adjustments to reserve amounts may be required in the event ofif there are changes fromin assumptions regarding the incidence of claims or the rate of recovery, as well as persistency, mortality, and interest rates used in calculating the reserve amounts. Within the group disability market, pricing and renewal actions can be taken to react to higher claim rates. However, these actions take time to implement, and there is a risk that the market will not sustain increased prices. In addition, changes in economic and external conditions may not manifest themselves in claims experience for an extended period of time.
Year Ended December 31, 20042007 Compared with Year Ended December 31, 20032006
Premium income for group income protectiondisability decreased slightly in 20042007 relative to 2003, primarily due to the expected decrease in persistency for group short-term income protection. Net investment income decreased in 2004 compared with 20032006 due primarily to lower investment portfolio yields resulting from the decline in market interest ratesour strategy on pricing, renewals, and from less prepayment income on fixed maturity securities, offset somewhat by a year over year increase in the retrospective adjustment of the amortization of the purchase discount on mortgage-backed securities. Included in other income are ASO fees of $56.1 million for 2004risk selection. Premium persistency and $46.5 million for 2003.
The settlement of the multistate market conduct examination resulted in a 2004 charge of $80.2 million for benefit costs and reserves. Excluding this reserve charge as well as the 2003 reserve strengthening previously discussed, the benefit ratio for 2004 declined compared to 2003. Contributing to the decline in the 2004 benefit ratio relative to 2003 was a decrease in the submitted claim incidence rate for group long-term income protection and an increase in premium per insured life, primarily due to rate increases placed on poorer performingcase persistency were both consistent with our expectations given our business through the 2004 renewal program. Partially offsetting the factors contributing to the decline in the benefit ratio was a lower claim discount rate used for new claims occurring in 2004 relative to the rate used in 2003. For group short-term income protection, the benefit ratio was lower primarily due to a decline in paid claim incidence in 2004 compared to 2003.
Costs capitalized during 2004 for group income protection were lower than in the prior year due to an updated analysis of costs associated with the acquisition of new business and due to the decrease in sales. Operating expenses for 2004 include a charge of $36.5 million related to the settlement of the multistate market conduct examination.
U.S. Brokerage Group Life and Accidental Death and Dismemberment Operating Results
Shown below are financial results and key performance indicators for U.S. Brokerage group life and accidental death and dismemberment.
(in millions of dollars, except ratios)
| Year Ended December 31 | ||||||||||||||||||
| 2005 | % Change | 2004 | % Change | 2003 | ||||||||||||||
Operating Revenue | ||||||||||||||||||
Premium Income | ||||||||||||||||||
Group Life | $ | 1,306.8 | (9.3 | )% | $ | 1,441.0 | (1.6 | )% | $ | 1,463.8 | ||||||||
Accidental Death & Dismemberment | 156.4 | (14.3 | ) | 182.4 | (8.2 | ) | 198.6 | |||||||||||
Total Premium Income | 1,463.2 | (9.9 | ) | 1,623.4 | (2.3 | ) | 1,662.4 | |||||||||||
Net Investment Income | 151.9 | 2.7 | 147.9 | 2.0 | 145.0 | |||||||||||||
Other Income (Loss) | 2.0 | N.M. | (0.6 | ) | (220.0 | ) | 0.5 | |||||||||||
Total | 1,617.1 | (8.7 | ) | 1,770.7 | (2.1 | ) | 1,807.9 | |||||||||||
Benefits and Expenses | ||||||||||||||||||
Benefits and Change in Reserves for Future Benefits | 1,111.9 | (10.6 | ) | 1,244.3 | (2.8 | ) | 1,280.0 | |||||||||||
Commissions | 97.8 | (7.9 | ) | 106.2 | (6.2 | ) | 113.2 | |||||||||||
Deferral of Policy Acquisition Costs | (42.7 | ) | (9.1 | ) | (47.0 | ) | (41.3 | ) | (80.0 | ) | ||||||||
Amortization of Deferred Policy Acquisition Costs | 73.0 | 9.0 | 67.0 | (6.8 | ) | 71.9 | ||||||||||||
Operating Expenses | 188.3 | 0.8 | 186.8 | (6.6 | ) | 200.1 | ||||||||||||
Total | 1,428.3 | (8.3 | ) | 1,557.3 | (1.8 | ) | 1,585.2 | |||||||||||
Operating Income Before Income Tax and Net Realized Investment Gains and Losses | $ | 188.8 | (11.5 | ) | $ | 213.4 | (4.2 | ) | $ | 222.7 | ||||||||
Benefit Ratio (% of Premium Income) | 76.0 | % | 76.6 | % | 77.0 | % | ||||||||||||
Operating Expense Ratio (% of Premium Income) | 12.9 | % | 11.5 | % | 12.0 | % | ||||||||||||
Before-tax Operating Income Ratio (% of Premium Income) | 12.9 | % | 13.1 | % | 13.4 | % | ||||||||||||
Persistency - Group Life | 78.3 | % | 84.0 | % | 83.2 | % | ||||||||||||
Persistency - Accidental Death & Dismemberment | 76.9 | % | 80.3 | % | 84.2 | % | ||||||||||||
N.M. = not a meaningful percentage
Year Ended December 31, 2005 Compared with Year Ended December 31, 2004
Premium income decreased in 2005 relative to the prior year due to decreased sales growth and lower persistency levels. The increase in net investment income relative to the prior year is due to an increase in the yield on floating rate investments that support certain products within the group life line of business offset somewhat by a decline in the level of assets supporting this business.
The group life line of business reported a decrease in the benefit ratio for 2005 relative to the prior year. Submitted claim incidence was slightly lower in 2005 relative to the prior year, but the average paid claim size and submitted waiver incidence increased relative to the prior year. The accidental death and dismemberment line of business reported a slightly increased benefit ratio for 2005 compared to the prior year due to slightly higher levels of paid claim incidence offset partially by a decreased average paid claim size.
Commissions and the deferral of policy acquisition costs decreased in 2005 compared to the prior year due primarily to the decrease in sales in comparison to the prior year, partially offset by a 2005 buy-out of a block of business from a commissioned sales agency. Operating expenses have remained relatively stable in 2005 relative to the prior year, but the operating expense ratio increased due to the decline in premium income. Although aggressively managing expenses, the Company anticipates continuing pressure on its operating expense ratios for group life and accidental death and dismemberment.
Year Ended December 31, 2004 Compared with Year Ended December 31, 2003
Premium income decreased in 2004 relative to 2003 due primarily to lower sales. The group life line of business benefit ratio decreased slightly in 2004 relative to 2003 due to an increase in premiums per life partially offset by higher submitted and paid claim incidence rates in 2004 relative to 2003 as well as an increase in the average paid claim size.
Acquisition costs capitalized during 2004 were lower than in 2003 due primarily to an updated analysis of costs associated with the acquisition of new business and due to the decrease in sales.
U.S. Brokerage Supplemental and Voluntary Operating Results
Shown below are financial results and key performance indicators for U.S. Brokerage supplemental and voluntary product lines.
(in millions of dollars, except ratios)
| Year Ended December 31 | ||||||||||||||||||
| 2005 | % Change | 2004 | % Change | 2003 | ||||||||||||||
Operating Revenue | ||||||||||||||||||
Premium Income | ||||||||||||||||||
Individual Income Protection - Recently Issued | $ | 425.1 | 2.3 | % | $ | 415.6 | 5.8 | % | $ | 392.8 | ||||||||
Long-term Care | 473.2 | 6.5 | 444.5 | 9.9 | 404.6 | |||||||||||||
Voluntary Workplace Benefits | 339.6 | 15.7 | 293.4 | 12.8 | 260.0 | |||||||||||||
Total Premium Income | 1,237.9 | 7.3 | 1,153.5 | 9.1 | 1,057.4 | |||||||||||||
Net Investment Income | 240.6 | 8.3 | 222.1 | 1.3 | 219.3 | |||||||||||||
Other Income | 26.3 | 26.4 | 20.8 | 51.8 | 13.7 | |||||||||||||
Total | 1,504.8 | 7.8 | 1,396.4 | 8.2 | 1,290.4 | |||||||||||||
Benefits and Expenses | ||||||||||||||||||
Benefits and Change in Reserves for Future Benefits | �� | 909.7 | 8.7 | 837.0 | 12.3 | 745.4 | ||||||||||||
Commissions | 228.7 | (1.9 | ) | 233.1 | (1.0 | ) | 235.5 | |||||||||||
Deferral of Policy Acquisition Costs | (204.6 | ) | (7.8 | ) | (221.9 | ) | (12.5 | ) | (253.7 | ) | ||||||||
Amortization of Deferred Policy Acquisition Costs | 141.7 | 12.6 | 125.8 | 10.4 | 114.0 | |||||||||||||
Amortization of Value of Business Acquired | 0.3 | 50.0 | 0.2 | (33.3 | ) | 0.3 | ||||||||||||
Operating Expenses | 261.1 | 7.8 | 242.1 | 4.0 | 232.8 | |||||||||||||
Total | 1,336.9 | 9.9 | 1,216.3 | 13.2 | 1,074.3 | |||||||||||||
Operating Income Before Income Tax and Net Realized Investment Gains and Losses | $ | 167.9 | (6.8 | ) | $ | 180.1 | (16.7 | ) | $ | 216.1 | ||||||||
Benefit Ratios (% of Premium Income) | ||||||||||||||||||
Individual Income Protection - Recently Issued (1) | 57.5 | % | 57.7 | % | 54.6 | % | ||||||||||||
Long-term Care | 93.0 | % | 88.8 | % | 84.7 | % | ||||||||||||
Voluntary Workplace Benefits | 66.3 | % | 69.0 | % | 72.5 | % | ||||||||||||
Interest Adjusted Loss Ratio | ||||||||||||||||||
Individual Income Protection - Recently Issued | 43.8 | % | 46.0 | % | 41.5 | % | ||||||||||||
Operating Expense Ratio (% of Premium Income) (2) | 21.1 | % | 21.0 | % | 22.0 | % | ||||||||||||
Before-tax Operating Income Ratio (% of Premium Income) (3) | 13.6 | % | 15.6 | % | 20.4 | % | ||||||||||||
Persistency - Individual Income Protection - Recently Issued | 89.6 | % | 90.7 | % | 89.6 | % | ||||||||||||
Persistency - Long-term Care | 95.8 | % | 95.5 | % | 95.0 | % | ||||||||||||
Persistency - Voluntary Workplace Benefits | 81.1 | % | 81.0 | % | 82.1 | % | ||||||||||||
Year Ended December 31, 2005 Compared with Year Ended December 31, 2004
The increase in premium income for 2005 relative to the prior year for the individual income protection – recently issued business and individual long-term care is due to sales growth in prior periods and stable persistency. The increase in premium income in the group long-term care and voluntary workplace benefits lines of business is attributable to current year sales growth as well as sales growth in previous periods and stable persistency.
mix strategy. Net investment income increased relativein 2007 in comparison to the prior year2006 due primarily to the growth in the level of assets supporting these lines of business, partially offset by the inclusion in 2004 of a portionimpact of the investment income attributable to the bonds retainedlower yield resulting from the sale of the Canadian branch that were subsequently redeployed to other lines of business and also due to a decline in the yield on the portfolio from investing new cash in the lower interest rate environment.environment and a decrease in bond call premiums. Other income includes ASO fees of $65.2 million and $60.9 million for 2007 and 2006, respectively.
Index to Financial Statements
TheExcluding the revisions to our estimate for claim reassessment costs, the benefit ratio for 2007 was lower than the individualbenefit ratio for 2006 due primarily to lower paid claims in both group long-term and short-term disability and a higher rate of claim recoveries relative to 2006. Our claim operational effectiveness continued to improve during 2007 as a result of our organizational and process changes.
Interest and debt expense in 2007 is related to the Tailwind Holdings debt that was issued in the fourth quarter of 2006.
The net decrease in the amortization of DAC was due primarily to the decrease in the level of DAC as a result of the adoption of the new accounting policy related to DAC on internal replacements, offset somewhat by higher amortization resulting from the shorter amortization period for DAC. The other expense ratio, excluding the adjustments to our claim reassessment incremental operating expense estimate, increased in 2007 compared to 2006 due to the decline in premium income protection – recently issued businessas well as an increase in advertising and branding expenses and product and service development costs.
Index to Financial Statements
Unum US Group Life and Accidental Death and Dismemberment Operating Results
Shown below are financial results and key performance indicators for Unum US group life and accidental death and dismemberment.
(in millions of dollars, except ratios)
| Year Ended December 31 | |||||||||||||||
| 2008 | % Change | 2007 | % Change | 2006 | |||||||||||
Operating Revenue | |||||||||||||||
Premium Income | |||||||||||||||
Group Life | $ | 1,062.8 | (4.0) | % | $ | 1,107.4 | (11.3) | % | $ | 1,248.1 | |||||
Accidental Death & Dismemberment | 127.6 | (2.6) | 131.0 | (13.6) | 151.6 | ||||||||||
Total Premium Income | 1,190.4 | (3.9) | 1,238.4 | (11.5) | 1,399.7 | ||||||||||
Net Investment Income | 126.0 | (6.6) | 134.9 | (4.5) | 141.3 | ||||||||||
Other Income | 2.3 | (4.2) | 2.4 | N.M. | - | ||||||||||
Total | 1,318.7 | (4.1) | 1,375.7 | (10.7) | 1,541.0 | ||||||||||
Benefits and Expenses | |||||||||||||||
Benefits and Change in Reserves for Future Benefits | 827.6 | (8.2) | 901.6 | (15.5) | 1,067.3 | ||||||||||
Commissions | 85.4 | (3.7) | 88.7 | (1.6) | 90.1 | ||||||||||
Deferral of Acquisition Costs | (40.3) | 11.6 | (36.1) | (4.2) | (37.7) | ||||||||||
Amortization of Deferred Acquisition Costs | 55.0 | 39.6 | 39.4 | (39.4) | 65.0 | ||||||||||
Other Expenses | 180.1 | 9.2 | 164.9 | (7.5) | 178.3 | ||||||||||
Total | 1,107.8 | (4.4) | 1,158.5 | (15.0) | 1,363.0 | ||||||||||
Operating Income Before Income Tax and Net Realized Investment Gains and Losses | $ | 210.9 | (2.9) | $ | 217.2 | 22.0 | $ | 178.0 | |||||||
Operating Ratios (% of Premium Income): | |||||||||||||||
Benefit Ratio | 69.5% | 72.8% | 76.3% | ||||||||||||
Other Expense Ratio | 15.1% | 13.3% | 12.7% | ||||||||||||
Before-tax Operating Income Ratio | 17.7% | 17.5% | 12.7% | ||||||||||||
Premium Persistency: | |||||||||||||||
Group Life | 83.8% | 78.8% | 81.2% | ||||||||||||
Accidental Death & Dismemberment | 86.4% | 80.8% | 82.8% | ||||||||||||
Case Persistency: | |||||||||||||||
Group Life | 89.1% | 87.7% | 86.9% | ||||||||||||
Accidental Death & Dismemberment | 89.2% | 88.0% | 87.0% | ||||||||||||
N.M. = not a meaningful percentage
Year Ended December 31, 2008 Compared with Year Ended December 31, 2007
Premium income for group life decreased slightly in 20052008 relative to the prior year excludingdue primarily to our pricing, renewal, and risk selection strategy. Premium persistency and case persistency both improved in comparison to the 2005 reserve chargeprior year. The decrease in net investment income relative to the prior year resulted from a decline in the level of assets supporting these lines of business and from a lower yield on the portfolio due to the investment of new cash at a lower yield than that of the existing portfolio.
The benefit ratio decreased in 2008 due primarily to lower paid claim incidence rates for both group life and the accidental death and dismemberment lines of business.
Index to Financial Statements
The deferral of acquisition costs increased in 2008 due primarily to increased sales in the group core market segment. Amortization of deferred acquisition costs was higher in 2008 relative to the prior year due to an increase in amortization related to the California DOI settlement agreement and related matters and the 2004 reserve charge relatedinternal replacement transactions.
The other expense ratio increased in 2008 in comparison to the multistate market conduct examinationprior year due primarily to the decline in premium income as discussed above, drivenwell as an increase in policy maintenance expenses and product and service development costs.
Year Ended December 31, 2007 Compared with Year Ended December 31, 2006
Premium income for group life decreased in 2007 relative to 2006 due primarily to our more disciplined approach to pricing, renewals, and risk selection. Premium persistency and case persistency were both consistent with our expectations. The decrease in net investment income relative to 2006 resulted primarily from a decline in the level of assets supporting these lines of business.
The benefit ratio decreased in 2007 due primarily to a lower submitted and paid claim incidence rate for group life, offset partially by higher paid claim incidence rates for the accidental death and dismemberment line of business.
Similar to our group disability products, amortization of DAC was lower incidencein 2007 relative to 2006 due to the adoption of SOP 05-1. The other expense ratio increased in 2007 in comparison to 2006 due to the decline in premium income.
Index to Financial Statements
Unum US Supplemental and a releaseVoluntary Operating Results
Shown below are financial results and key performance indicators for Unum US supplemental and voluntary product lines.
(in millions of active life reserves on two large multi-life cases which terminated during 2005. Multi-life business, which constitutes approximately 60 percentdollars, except ratios)
| Year Ended December 31 | |||||||||||||
| 2008 | % Change | 2007 | % Change | 2006 | |||||||||
Operating Revenue | |||||||||||||
Premium Income | |||||||||||||
Individual Disability - Recently Issued | $ | 471.5 | 3.2 % | $ | 456.7 | 4.2 % | $ | 438.5 | |||||
Long-term Care | 580.7 | 9.0 | 532.9 | 8.2 | 492.4 | ||||||||
Voluntary Benefits | 446.8 | 10.4 | 404.7 | 6.0 | 381.9 | ||||||||
Total Premium Income | 1,499.0 | 7.5 | 1,394.3 | 6.2 | 1,312.8 | ||||||||
Net Investment Income | 379.1 | 14.7 | 330.4 | 19.0 | 277.7 | ||||||||
Other Income | 30.2 | (8.8) | 33.1 | 26.3 | 26.2 | ||||||||
Total | 1,908.3 | 8.6 | 1,757.8 | 8.7 | 1,616.7 | ||||||||
Benefits and Expenses | |||||||||||||
Benefits and Change in Reserves for Future Benefits | 1,126.9 | 5.6 | 1,067.4 | 8.7 | 982.3 | ||||||||
Commissions | 267.3 | 9.1 | 245.1 | 2.4 | 239.3 | ||||||||
Deferral of Acquisition Costs | (230.0) | 10.7 | (207.7) | 1.8 | (204.0) | ||||||||
Amortization of Deferred Acquisition Costs | 188.6 | 10.0 | 171.5 | 13.7 | 150.8 | ||||||||
Other Expenses | 283.7 | 6.4 | 266.7 | 6.0 | 251.7 | ||||||||
Total | 1,636.5 | 6.1 | 1,543.0 | 8.7 | 1,420.1 | ||||||||
Operating Income Before Income Tax and Net Realized Investment Gains and Losses | $ | 271.8 | 26.5 | $ | 214.8 | 9.3 | $ | 196.6 | |||||
Operating Ratios (% of Premium Income): | |||||||||||||
Benefit Ratios | |||||||||||||
Individual Disability - Recently Issued | 53.3% | 56.7% | 58.0% | ||||||||||
Long-term Care | 106.1% | 106.0% | 99.2% | ||||||||||
Voluntary Benefits | 58.0% | 60.1% | 62.7% | ||||||||||
Other Expense Ratio | 18.9% | 19.1% | 19.2% | ||||||||||
Before-tax Operating Income Ratio | 18.1% | 15.4% | 15.0% | ||||||||||
Interest Adjusted Loss Ratios: | |||||||||||||
Individual Disability - Recently Issued | 35.9% | 40.0% | 42.8% | ||||||||||
Long-term Care | 75.5% | 77.7% | 73.1% | ||||||||||
Premium Persistency: | |||||||||||||
Individual Disability - Recently Issued | 90.7% | 90.6% | 90.5% | ||||||||||
Long-term Care | 95.5% | 95.4% | 95.3% | ||||||||||
Voluntary Benefits | 80.4% | 79.4% | 80.9% | ||||||||||
Year Ended December 31, 2008 Compared with Year Ended December 31, 2007
The increase in premium income for 2008 relative to the prior year is due to sales growth in our supplemental and voluntary product lines, the impact of premium rate increases implemented for individual long-term care, and overall stable persistency. Net investment income increased relative to the prior year primarily from growth in the level of assets supporting these lines of business.
Index to Financial Statements
The decrease in the interest adjusted loss ratio for the individual income protectiondisability – recently issued blockline of business has consistently hadfor 2008 relative to the prior year is due primarily to a decrease in paid incidence rates, partially offset by a lower claim incidence rates than the non multi-life business.recovery rate. The benefitinterest adjusted loss ratio for long-term care was higherlower in 20052008 than in the prior year due primarily to the aging of the block of business and a lower nethigher premium income, partially offset by an increase in claim resolution rate.incidence rates. The benefit ratio for the voluntary workplace benefits products was lowerdecreased in comparison2008 as compared to the prior year due primarily to a lower rate of insureds inpaid claim payout status inincidence for the voluntary income protectiondisability line of business and improveda lower mortality experience inrate for the voluntary life line of business.
The increase in commissions and the deferral and amortization of policy acquisition costs decreased during 2005 relative to the prior year is due primarily to the lower level of salesgrowth in the individual income protection – recently issued and long-term carethese lines of business, offset somewhat by higher levels of deferral for the voluntary workplace benefits product lines due to increased sales. Amortization of deferred policy acquisition costs was higher for 2005 due to the termination during 2005 of two large multi-life cases which resulted in the write-off of associated unamortized acquisition costs. This increased amortization was offset by the release of active life reserves, as previously mentioned. Operating expenses increasedbusiness. The other expense ratio decreased slightly in comparison to the prior year due to a higher rate of premium growth in these lines of business; however, the operatingrelative to expense ratio remained consistent with that of the prior year.
growth.
Year Ended December 31, 20042007 Compared with Year Ended December 31, 20032006
The growthincrease in premium income for individual income protection – recently issued resulted from prior year2007 relative to 2006 is due to sales growth and overall stable persistency, although premium persistency for certain of the existing block of business. Premium income for long-term care increased during 2004product lines declined compared to 2003 primarily due to new sales growth in previous periods. Changes in the product offering during 2003 decreased the 2004 growth in individual long-term care sales relative to historical trends. Persistency in the long-term care line of business remained high and stable. The growth in premium income for voluntary workplace benefits was due primarily to sales growth.
2006. Net investment income for 2004 increased slightlyrelative to 2006 primarily from 2003 due to the continued growth in investedthe level of assets supporting these lines of business.
The interest adjusted loss ratio for the individual disability – recently issued business offset bydecreased in 2007 relative to 2006 due primarily to a declinedecrease in the yield on the portfoliosubmitted claim incidence rate as well as internal redistributions of invested assets in conjunction with the Company’s management of asset and liability cash flows.
Thean increase in the claim recovery rate. The interest adjusted loss ratio for long-term care was higher in 2007 than in 2006 due primarily to an increase in the submitted claim incidence rate and a decrease in the claim recovery and mortality rates. The benefit ratio for individual income protection – recently issued for 2004 relativevoluntary benefits decreased in comparison to 2003 was2006 due primarily due to a decline inlower rate of paid claim incidence for the net claim resolution rate,voluntary benefits disability line of business partially offset by a decreasehigher mortality rate for the voluntary life line of business.
The amortization of DAC increased in submitted claim incidence2007 relative to 2006 due to the acceleration of amortization for certain of the product lines with lower than anticipated persistency. The other expense ratio remained level with 2006 due to the growth in premium income and the multi-life portion of thiscorresponding growth in operating expenses.
Segment Outlook
Throughout 2008 we focused on improvement in group disability profitability and growth in our core group market and our voluntary line of business,business. We remained disciplined with pricing and risk selection, focusing on margin improvement and top-line growth in select markets.
During 2009, we will maintain our risk discipline and culture of operating effectiveness, with a focus on talent development across our businesses. We will seek to continue to improve our financial performance, driven primarily by our group disability line, with greater product diversification through our voluntary product growth. We will continue the expansion of our growth platform – our core group market, group long-term care, and voluntary lines of business. Our growth strategy includes offering a broad selection of benefits which has consistently had lowerprovide cost predictability and stability over the long term for our clients through employee funding and defined employer contribution programs. We will seek to leverage capabilities being developed in our growth platform with our large case clients. We will focus on continued innovation for all of our customers and sales force, including the completion of ourSimply Unum platform to be effective for larger employers.
Periods of economic downturns have historically affected disability claim incidence rates thanand, to a lesser extent, disability claim recovery rates in certain sectors of the non multi-life business.market. The current downturn may lead to a similar pattern of claim incidence or recoveries. We have previously taken steps to improve our risk profile. We have reduced our exposure to volatile business segments through diversification by market size, product segment, and industry segment. We believe our claims management organization is positioned for stable and sustainable performance levels. We experienced a slight increase in claim incidence levels during the benefit ratio forfourth quarter of 2008, but not in any particular market sector or case size. It is not determinable as to whether this increase is economically related. We may experience some impact from the long-term care lines of business isuncertain economic environment on premium growth due to higher submitted claim incidenceunfavorable persistency of existing cases or lower sales, particularly if customers elect to delay expansion of existing benefits in 2004 in comparison to 2003 andtoday’s environment or if there is a higher net claim resolution rate.
Acquisition costs capitalized during 2004 were lower than in 2003 due primarily to thesignificant reduction in salesthe number of individualcovered employees. We may also see some volatility in net investment income protection – recently issuedas a result of fluctuations in bond calls and long-term care business.other types of miscellaneous net
Index to Financial Statements
investment income. We continuously monitor key indicators to assess our risk to an economic slowdown or recession and attempt to adjust our business plans accordingly.
Segment Outlook
The Company’s primary focus during 2006 will be continued improvement of itsOur outlook for 2009 reflects higher disability claims management results and profitability enhancementincidence from the weakening economy resulting in its group income protection line of business, along with an emphasis on continued growth in the small and mid-employer core markets and the supplemental and voluntary product lines. The Company intends to continue its disciplined approach to pricing, renewals, and risk selection, with a more conscious effort to balance growth and profitability. Although this strategy may cause a somewhat lower persistency or market share, historically the profitability of business that terminates has generally been less than the profitability of retained business.
Because of anticipated long-term improvements in the claim management results for the group long-term income protection business, the Company expects its overallflat benefit ratio for group income protection to gradually improve relative to 2005 while the benefit ratiosdisability on a quarterly basis, though improved on a full year comparison with 2008. We expect continued growth in the otherour voluntary and supplemental lines of business are expectedand flat operating results relative to remain relatively stable year over year.
The Company believes that its U.S. Brokerage results will benefit if there is an improvement in overall economic conditions2008 for our group life and a higher interest rate environment, although the improvement in results may lag behind the improvements in the economyaccidental death and interest rate environment.dismemberment line of business.
Unum LimitedUK Segment Operating Results
The Unum Limited segmentUK includes insurance for group long-term income protection,disability, group life, and individual income protectiondisability products sold primarily in the United Kingdom through field sales personnel and independent brokers and consultants. Effective with the fourth quarter of 2008, we made slight modifications to our Unum UK segment to align the allocation of capital for Unum UK similar to that of Unum US and Colonial Life. We transferred excess assets, capital in excess of target, and the associated investment income from Unum UK to our Corporate and Other segment. Financial results previously reported have been revised to reflect these reclassifications.
Operating Results
Shown below are financial results and key performance indicators for the Unum LimitedUK segment.
(in millions of dollars, except ratios)
| Year Ended December 31 | ||||||||||||||||||
| 2005 | % Change | 2004 | % Change | 2003 | ||||||||||||||
Operating Revenue | ||||||||||||||||||
Premium Income | ||||||||||||||||||
Group Long-term Income Protection | $ | 582.9 | 16.2 | % | $ | 501.8 | 35.2 | % | $ | 371.2 | ||||||||
Group Life | 164.1 | 39.2 | 117.9 | 93.9 | 60.8 | |||||||||||||
Individual Income Protection | 38.3 | (2.8 | ) | 39.4 | (12.4 | ) | 45.0 | |||||||||||
Total Premium Income | 785.3 | 19.1 | 659.1 | 38.2 | 477.0 | |||||||||||||
Net Investment Income | 154.2 | 10.5 | 139.6 | 31.1 | 106.5 | |||||||||||||
Other Income | 6.1 | 96.8 | 3.1 | (68.7 | ) | 9.9 | ||||||||||||
Total | 945.6 | 17.9 | 801.8 | 35.1 | 593.4 | |||||||||||||
Benefits and Expenses | ||||||||||||||||||
Benefits and Change in Reserves for Future Benefits | 545.8 | 17.5 | 464.5 | 34.8 | 344.5 | |||||||||||||
Commissions | 56.4 | 15.3 | 48.9 | 43.4 | 34.1 | |||||||||||||
Deferral of Policy Acquisition Costs | (34.1 | ) | (9.5 | ) | (37.7 | ) | 12.2 | (33.6 | ) | |||||||||
Amortization of Deferred Policy Acquisition Costs | 21.6 | 12.5 | 19.2 | 12.9 | 17.0 | |||||||||||||
Amortization of Value of Business Acquired | 14.2 | (1.4 | ) | 14.4 | 166.7 | 5.4 | ||||||||||||
Operating Expenses | 154.0 | 9.1 | 141.2 | 23.9 | 114.0 | |||||||||||||
Total | 757.9 | 16.5 | 650.5 | 35.1 | 481.4 | |||||||||||||
Operating Income Before Income Tax and Net Realized Investment Gains and Losses | $ | 187.7 | 24.1 | $ | 151.3 | 35.1 | $ | 112.0 | ||||||||||
Benefit Ratio (% of Premium Income) | 69.5 | % | 70.5 | % | 72.2 | % | ||||||||||||
Operating Expense Ratio (% of Premium Income) | 19.6 | % | 21.4 | % | 23.9 | % | ||||||||||||
Before-tax Operating Income Ratio (% of Premium Income) | 23.9 | % | 23.0 | % | 23.5 | % | ||||||||||||
Persistency - Group Long-term Income Protection | 94.2 | % | 92.1 | % | 92.9 | % | ||||||||||||
Persistency - Group Life | 86.3 | % | 83.0 | % | 87.7 | % | ||||||||||||
Persistency - Individual Income Protection | 88.4 | % | 86.7 | % | 87.2 | % | ||||||||||||
Operating Revenue Premium Income Group Long-term Disability Group Life Individual Disability Total Premium Income Net Investment Income Other Income Total Benefits and Expenses Benefits and Change in Reserves for Future Benefits Commissions Deferral of Acquisition Costs Amortization of Deferred Acquisition Costs Other Expenses Total Operating Income Before Income Tax and Net Realized Investment Gains and Losses Operating Ratios (% of Premium Income): Benefit Ratio Other Expense Ratio Before-tax Operating Income Ratio Premium Persistency: Group Long-term Disability Group Life Individual Disability Year Ended December 31 2008 % Change 2007 % Change 2006 $ 675.9 (10.2) % $ 752.6 17.8 % $ 638.9 174.6 (1.6) 177.4 3.7 171.0 38.8 1.3 38.3 16.4 32.9 889.3 (8.2) 968.3 14.9 842.8 181.9 (2.9) 187.4 10.2 170.1 2.0 (35.5) 3.1 N.M. 0.1 1,073.2 (7.4) 1,158.8 14.4 1,013.0 511.4 (11.0) 574.3 3.8 553.5 59.0 (11.9) 67.0 34.8 49.7 (37.4) (9.2) (41.2) 19.8 (34.4) 32.4 (34.4) 49.4 54.4 32.0 183.8 0.2 183.5 15.5 158.9 749.2 (10.1) 833.0 9.6 759.7 $ 324.0 (0.6) $ 325.8 28.6 $ 253.3 57.5% 59.3% 65.7% 20.7% 19.0% 18.9% 36.4% 33.6% 30.1% 87.4% 88.0% 90.4% 74.9% 70.5% 69.1% 87.6% 89.4% 88.2%
Segment SalesN.M. = not a meaningful percentage
Sales decreased
Index to Financial Statements
Foreign Currency Translation
The functional currency of Unum UK is the British pound sterling. Unum UK’s premiums, net investment income, claims, and expenses are received or paid in 2005pounds, and we hold pound denominated assets to support Unum UK’s pound denominated policy reserves and liabilities. We translate Unum UK’s pound-denominated financial statement items into dollars for our consolidated financial reporting. We translate income statement items using an average exchange rate for the reporting period, and we translate balance sheet items using the exchange rate at the end of the period. We report unrealized foreign currency translation gains and losses in accumulated other comprehensive income in our consolidated balance sheets.
Fluctuations in the pound to dollar exchange rate have an effect on Unum UK’s reported financial results and our consolidated financial results. In periods when the pound weakens, as occurred during the last half of 2008 relative to 2007, translating pounds into dollars decreases current year results relative to the prior year. In periods when the pound strengthens, translating into dollars increases current year dueresults in part to higher sales in 2004 related to the exit of a major insurer from the U.K. market during 2004. Sales for group life products were also unfavorably impacted in 2005 relativerelation to the prior year, due toas was the competitive environmentcase in the U.K. for group life products and the Company maintaining pricing discipline.
Group long-term income protection sales increased in 20042007 compared to 2003 due to the exit of a major insurer in the group long-term income protection market and the favorable movement in the foreign currency exchange rate in 2004 relative to 2003. When measured in its local currency, the sales growth rate in the group long-term income protection line was approximately 13.2 percent year over year. Group life sales increased in 2004 compared to 2003 due to the acquisition of the Sun Life block of business in 2003 as well as the favorable foreign exchange rate in 2004 compared to 2003.
2006.
Operating Results(in millions of pounds, except ratios)
| Year Ended December 31 | |||||||||||||||
| 2008 | % Change | 2007 | % Change | 2006 | |||||||||||
Operating Revenue | |||||||||||||||
Premium Income | |||||||||||||||
Group Long-term Disability | £ | 364.4 | (3.1) | % | £ | 375.9 | 8.5 | % | £ | 346.3 | |||||
Group Life | 93.3 | 5.4 | 88.5 | (4.2) | 92.4 | ||||||||||
Individual Disability | 20.9 | 9.4 | 19.1 | 7.3 | 17.8 | ||||||||||
Total Premium Income | 478.6 | (1.0) | 483.5 | 5.9 | 456.5 | ||||||||||
Net Investment Income | 98.5 | 5.3 | 93.5 | 1.5 | 92.1 | ||||||||||
Other Income | 1.2 | (25.0) | 1.6 | N.M. | - | ||||||||||
Total | 578.3 | (0.1) | 578.6 | 5.5 | 548.6 | ||||||||||
Benefits and Expenses | |||||||||||||||
Benefits and Change in Reserves for Future Benefits | 275.8 | (3.8) | 286.8 | (4.5) | 300.2 | ||||||||||
Commissions | 31.9 | (4.8) | 33.5 | 24.1 | 27.0 | ||||||||||
Deferral of Acquisition Costs | (20.1) | (2.4) | (20.6) | 10.2 | (18.7) | ||||||||||
Amortization of Deferred Acquisition Costs | 17.9 | (27.5) | 24.7 | 44.4 | 17.1 | ||||||||||
Other Expenses | 99.6 | 8.7 | 91.6 | 6.4 | 86.1 | ||||||||||
Total | 405.1 | (2.6) | 416.0 | 1.0 | 411.7 | ||||||||||
Operating Income Before Income Tax and Net Realized Investment Gains and Losses | £ | 173.2 | 6.5 | £ | 162.6 | 18.8 | £ | 136.9 | |||||||
Weighted Average Pound/Dollar Exchange Rate | 1.871 | 2.004 | 1.851 | ||||||||||||
| N.M. = not a meaningful percentage | |||||||||||||||
Year Ended December 31, 20052008 Compared with Year Ended December 31, 20042007
Premium income increaseddecreased in comparison2008 relative to the prior year due primarily to a decline in group long-term disability resulting from lower persistency levels and lower sales. This decline was partially offset by increases in premium income for group life due to higher sales and improved persistency and to individual disability due to the continued growth in the in-force block from higher levels of sales during 2008 and 2007. A decrease in group long-term income protection linelife ceded premiums as a result of business resulting from block acquisitions,a modification, in the related growth in prior yearfourth quarter of 2007, of a quota share reinsurance arrangement relating to new group life sales and favorable persistency. The premium incomealso contributed to the increase in the group life line of business was due to prior period sales growth and favorable persistency.premiums. Net investment income increased in 20052008 relative to 2004the prior year due primarily to the growth in the level of assets supporting these lines of business and a higher yield on the portfolio due to the investment of new cash at a higher yield than that of the existing portfolio.
Index to Financial Statements
The lower benefit ratio in 2008 in comparison to the prior year was primarily due to an increased rate of claim recoveries for group long-term disability. Also included in 2008 and 2007 results are adjustments to our long-term assumptions for claim reserves due to emerging experience and our view of future events, which increased operating income approximately £5.5 million and £8.2 million in 2008 and 2007, respectively.
The decrease in amortization of acquisition costs in 2008 relative to the prior year is due primarily to a decrease in amortization related to internal replacement transactions that result in a policy that is substantially changed. These transactions are accounted for as an extinguishment of the original policy and the issuance of a new policy.
The other expense ratio increased during 2008 in comparison with the prior year due primarily to expenses of £4.4 million related to the implementation of a disciplined cost management process during the fourth quarter of 2008 that is intended to reduce our operating expenses in the future by implementing expense efficiencies and aligning expenses with premium growth.
During 2008, Unum UK became responsible for the ongoing administration and management of a closed block of group long-term disability claims through a reinsurance arrangement with Royal London Mutual Insurance Society Limited. At the time of the transaction, Unum UK received cash of £24.5 million, recorded £0.4 million in accrued premiums receivable, assumed reserves of £22.2 million, and recorded a deferred gain of £2.7 million. The transaction is not expected to materially impact operating results.
Year Ended December 31, 2007 Compared with Year Ended December 31, 2006
Premium income increased in 2007 relative to 2006 due primarily to sales of group and individual disability products and stable persistency for those two lines of business, partially offset by lower sales for group life and continued lower persistency relative to the levels of 2005 and early 2006. Net investment income increased in 2007 relative to 2006 due to continued growth in the business and the assets supporting it, offset partially by a slight decrease in portfolio yields relative to the prior year. Other income for 2005 includes $5.7 million related to the disposal of Unum Limited’s Netherlands branch during 2005, as previously discussed.
While underlying claims experience was favorable, the benefit ratio for the group long-term income protection line of business increased in comparison to 2004 due to the inclusion in the prior year of extremely favorable claim resolution experience on an acquired block of group long-term income protection business. The benefit ratio for the group life line of business decreased in comparison to 2004 due to favorable claim experience in 2005 and recent renewal activity which resulted in terminations during 2005 of less profitable business.
Operating expenses have increased in 2005 compared to 2004 due to growth of the lines of business, but the operating expense ratios decreased due to an increase in premium income, economies of scale, and the Company’s focus on expense management.
Year Ended December 31, 2004 Compared with Year Ended December 31, 2003
The growth in the group long-term income protection premium income was primarily attributable to continued strong sales growth and the favorable foreign currency exchange rate in 2004 relative to 2003. When measured in its local currency, the growth rate in premium income in the group long-term income protection line was approximately 20.8 percent year over year. The growth in group life premium income for 2004 relative to 2003 was attributable primarily to the acquisition of Sun Life, as previously discussed, and the favorable exchange rate. The increase in net investment income was due primarily to the growth in assets supporting the lines of business and the favorable movementan increase in the exchange rate.
portfolio yields.
The lower benefit ratio in 2007 in comparison to 2006 was primarily the result of an adjustment to our long-term assumptions for claim reserves due to emerging experience and our view of future events, which increased 2007 segment operating income approximately £8.2 million. Also contributing to a lower benefit ratio for the Unum Limited lines2007 was a lower rate of business decreasedclaim incidence for both group long-term disability and group life, partially offset by lower claim recoveries for group long-term disability.
Commissions increased in 20042007 relative to 2003 due2006 primarily to the extremely favorable claim resolution experiencebecause of a higher portion of long-term disability business sold and renewed in 2007 on an acquired blockwhich a commission is paid. Amortization of group long-term income protection business.
The amortization of value of business acquiredDAC increased during 2004in 2007 due to the previously discussed transactionshorter amortization period for DAC resulting from the adoption of SOP 05-1 effective January 1, 2007. The amount of the cumulative effect adjustment decreased the 2007 opening balance of Unum UK DAC approximately £45.1 million, or $88.3 million, which resulted in decreased amortization because of the lower deferred asset level. However, the timing of policy renewals occurring during 2007 resulted in increased amortization, causing an overall net increase in expense for 2007. The other expense ratio remained consistent with Swiss Life.2006 due to our continued focus on expense management and the growth in premium income.
Index to Financial Statements
Sales
Shown below are sales results in dollars and in pounds for the Unum UK segment.
| Year Ended December 31 | |||||||||||||||
| 2008 | % Change | 2007 | % Change | 2006 | |||||||||||
(in millions) | |||||||||||||||
Group Long-term Disability | $ | 72.7 | (13.9) | % | $ | 84.4 | 6.7 | % | $ | 79.1 | |||||
Group Life | 19.6 | 48.5 | 13.2 | (20.0) | 16.5 | ||||||||||
Individual Disability | 7.2 | (7.7) | 7.8 | 41.8 | 5.5 | ||||||||||
Total Sales | $ | 99.5 | (5.6) | $ | 105.4 | 4.3 | $ | 101.1 | |||||||
Group Long-term Disability | £ | 39.7 | (5.7) | % | £ | 42.1 | - | % | £ | 42.1 | |||||
Group Life | 10.9 | 65.2 | 6.6 | (26.7) | 9.0 | ||||||||||
Individual Disability | 3.9 | - | 3.9 | 30.0 | 3.0 | ||||||||||
Total Sales | £ | 54.5 | 3.6 | £ | 52.6 | (2.8) | £ | 54.1 | |||||||
Sales in Unum UK increased in 2008 primarily due to growth in group life sales offset partially by a decrease in sales for group long-term disability. Continued aggressive competition in the U.K. market is unfavorably affecting sales in all product lines. In the U.K., legislative changes that removed discrimination by employers on the basis of age, therefore encouraging the extension of insurance coverage, became effective in October 2006. During 2007, Unum UK took advantage of the opportunities offered by age equality legislation, with £7.4 million of additional sales during 2007 compared to only £2.0 million in 2008. Excluding sales related to the change in age equality legislation, Unum UK achieved underlying sales growth of approximately 16 percent in 2008 as compared to the prior year.
Sales in 2007 declined slightly from 2006. Sales in the U.K. market were negatively impacted during 2006 by lower employee benefits purchase decisions caused by distraction in the U.K. employee benefits market due to changes in pension legislation. Sales related to the change in age equality legislation were £7.4 million during 2007 compared to £11.1 million during 2006. Excluding sales related to the change in age equality legislation, Unum UK achieved underlying sales growth of approximately 5 percent in 2007 as compared to 2006.
Segment Outlook
During 2006, the Company intends2008, we focused on continued profitable sales growth and improvement in our premium persistency. We will continue this focus in 2009, as we seek to focus on maintaining itsachieve sustainable and profitable growth through disciplined pricing, premium persistency, risk selection, and claims management. We expect to maintain our strong leadership position in the U.K, andbut in the current competitive market we have a cautious outlook for premium growth. We are exploring additional market opportunities to expand our growth in the group market through new product offerings. We continue to identify new sourcesmake progress on our initiative to provide the U.K. market with industry leading services, processes, systems, and operational capability.
Regarding the current economic downturn, as of year end 2008 we had not yet experienced any significant deterioration in disability claims incidence or claim recoveries. The more likely impact of a softer economic environment is on premium growth, which could be further impacted by a prolonged competitive pricing environment. We continuously monitor key indicators to assess our risk to an economic slowdown or recession and attempt to adjust our business to drive future growth in both the group and individual markets.
Total sales for 2006 are expected to be level with that of 2005, with increases in individual income protection sales offsetting declinesplans accordingly. Fluctuations in the sale of group income protection products. Sales growth is expected to gain momentum throughout the year, with quarter over prior year comparable quarter increases in the latter half of the year. It is expected that persistency will remain at its current levels, although pricing competition may negatively impact sales and/or persistency.
Although claims experience is favorable for the group long-term income protection line of business, it is expected that the benefit ratio may increase during 2006,U.S. dollar relative to the current level,British pound sterling, as positive claim resolution trends on recent block acquisitions become less pronounced.occurred during the last half of 2008, impact our reported operating results. We expect that our 2009 results, when translated into dollars for consolidated reporting, will compare unfavorably to 2008 due to the weakening of the pound.
Index to Financial Statements
The Company believes that this segmentOur outlook for 2009 is for the continuance of high levels of profitability, in local currency, despite the weaker economy. We expect our profit margins will continue to producebe strong as we invest in new growth opportunities. We completed an in-depth analysis of our expense efficiency and alignment to premium growth in operating income, although2008, and we believe the rate of growth will decline as the acquisition-related growthimplementation of the last several years subsides.resulting disciplined cost management process will reduce our operating expenses relative to premium income in 2009.
Colonial Life Segment Operating Results
The Colonial Life segment includes insurance for income protectionaccident, sickness, and disability products, life products, and cancer and critical illness products issued primarily by the Company’s subsidiary Colonial Life & Accident Insurance Company and marketed to employees at the workplace through an agency sales force and brokers.
Operating Results
Shown below are financial results and key performance indicators for the Colonial Life segment.
(in millions of dollars, except ratios)
| Year Ended December 31 | ||||||||||||||||||
| 2005 | % Change | 2004 | % Change | 2003 | ||||||||||||||
Operating Revenue | ||||||||||||||||||
Premium Income | ||||||||||||||||||
Income Protection | $ | 508.9 | 4.7 | $ | 486.2 | 4.6 | % | $ | 464.9 | |||||||||
Life | 114.0 | 6.6 | 106.9 | 10.5 | 96.7 | |||||||||||||
Cancer and Critical Illness | 164.1 | 11.0 | 147.9 | 12.1 | 131.9 | |||||||||||||
Total Premium Income | 787.0 | 6.2 | 741.0 | 6.8 | 693.5 | |||||||||||||
Net Investment Income | 96.0 | 1.6 | 94.5 | 5.0 | 90.0 | |||||||||||||
Other Income | 4.4 | 91.3 | 2.3 | (8.0 | ) | 2.5 | ||||||||||||
Total | 887.4 | 5.9 | 837.8 | 6.6 | 786.0 | |||||||||||||
Benefits and Expenses | ||||||||||||||||||
Benefits and Change in Reserves for Future Benefits | 433.2 | 6.1 | 408.3 | 3.3 | 395.4 | |||||||||||||
Commissions | 170.7 | (1.8 | ) | 173.9 | 5.5 | 164.9 | ||||||||||||
Deferral of Policy Acquisition Costs | (173.4 | ) | (0.2 | ) | (173.7 | ) | 4.6 | (166.1 | ) | |||||||||
Amortization of Deferred Policy Acquisition Costs | 134.7 | 2.7 | 131.2 | 10.9 | 118.3 | |||||||||||||
Amortization of Value of Business Acquired | 0.6 | (50.0 | ) | 1.2 | (233.3 | ) | (0.9 | ) | ||||||||||
Operating Expenses | 153.5 | 8.6 | 141.3 | 10.6 | 127.7 | |||||||||||||
Total | 719.3 | 5.4 | 682.2 | 6.7 | 639.3 | |||||||||||||
Operating Income Before Income Tax and Net Realized Investment Gains and Losses | $ | 168.1 | 8.0 | $ | 155.6 | 6.1 | $ | 146.7 | ||||||||||
Benefit Ratio (% of Premium Income) | 55.0 | % | 55.1 | % | 57.0 | % | ||||||||||||
Operating Expense Ratio (% of Premium Income) | 19.5 | % | 19.1 | % | 18.4 | % | ||||||||||||
Before-tax Operating Income Ratio (% of Premium Income) | 21.4 | % | 21.0 | % | 21.2 | % | ||||||||||||
Persistency - Income Protection | 75.3 | % | 75.6 | % | 72.0 | % | ||||||||||||
Persistency - Life | 84.1 | % | 84.1 | % | 87.2 | % | ||||||||||||
Persistency - Cancer and Critical Illness | 83.2 | % | 82.6 | % | 82.0 | % | ||||||||||||
Segment Sales
Sales in 2005 increased for all lines of business as compared to 2004 driven primarily by growth in the core markets, which are comprised of employee groups with less than 2,000 lives, partially offset by a decline in sales in the large case market. Sales were also unfavorably impacted by the hurricanes in the Gulf Coast and Florida.
The sales decrease in 2004 relative to 2003 was attributable to a decline in sales of income protection products, partially offset by an increase in sales for the cancer and life products. The decline in sales for income protection results from the discontinuance by the Company of new sales of group long-term income protection as well as from lower sales of individual short-term income protection to employee groups of 2,000 or more lives.
Operating Results
| Year Ended December 31 | |||||||||||||||
| 2008 | % Change | 2007 | % Change | 2006 | |||||||||||
Operating Revenue | |||||||||||||||
Premium Income | |||||||||||||||
Accident, Sickness, and Disability | $ | 606.9 | 7.1 | % | $ | 566.6 | 6.2 | % | $ | 533.3 | |||||
Life | 157.4 | 9.7 | 143.5 | 10.0 | 130.5 | ||||||||||
Cancer and Critical Illness | 213.0 | 8.1 | 197.1 | 10.5 | 178.3 | ||||||||||
Total Premium Income | 977.3 | 7.7 | 907.2 | 7.7 | 842.1 | ||||||||||
Net Investment Income | 105.7 | 5.8 | 99.9 | 6.7 | 93.6 | ||||||||||
Other Income | 0.4 | (55.6) | 0.9 | (18.2) | 1.1 | ||||||||||
Total | 1,083.4 | 7.5 | 1,008.0 | 7.6 | 936.8 | ||||||||||
Benefits and Expenses | |||||||||||||||
Benefits and Change in Reserves for Future Benefits | 464.0 | 6.0 | 437.8 | (0.8) | 441.4 | ||||||||||
Commissions | 211.8 | 5.1 | 201.6 | 9.0 | 184.9 | ||||||||||
Deferral of Acquisition Costs | (223.8) | 6.1 | (210.9) | 12.4 | (187.6) | ||||||||||
Amortization of Deferred Acquisition Costs | 166.4 | 8.1 | 153.9 | 6.6 | 144.4 | ||||||||||
Other Expenses | 196.9 | 9.5 | 179.8 | 16.0 | 155.0 | ||||||||||
Total | 815.3 | 7.0 �� | 762.2 | 3.3 | 738.1 | ||||||||||
Operating Income Before Income Tax and Net Realized Investment Gains and Losses | $ | 268.1 | 9.1 | $ | 245.8 | 23.7 | $ | 198.7 | |||||||
Operating Ratios (% of Premium Income): | |||||||||||||||
Benefit Ratio | 47.5% | 48.3% | 52.4% | ||||||||||||
Other Expense Ratio | 20.1% | 19.8% | 18.4% | ||||||||||||
Before-tax Operating Income Ratio | 27.4% | 27.1% | 23.6% | ||||||||||||
Premium Persistency: | |||||||||||||||
Accident, Sickness, and Disability | 75.8% | 75.9% | 74.9% | ||||||||||||
Life | 84.7% | 83.8% | 84.2% | ||||||||||||
Cancer and Critical Illness | 84.0% | 84.1% | 82.3% | ||||||||||||
Year Ended December 31, 20052008 Compared with Year Ended December 31, 20042007
Growth in premium income during 2005 was attributable to sales growth and stable persistency. The benefit ratio for 2005 was consistent with the prior year, with decreases in the income protection and life lines of business offset by an increase in the cancer and critical illness line of business. Individual short-term income protection claim incidence decreased in 20052008 compared to 2004, while the average claim duration for closed claims as well as the average indemnity was higher in 2005 relative to 2004. For accident and sickness products, which are included in the income protection line of business, the claim incidence rate decreased in 2005 relative to the prior year, but the average claim payment increased over that reported for 2004. The life line of business reported an increase in the number of paid claims in 2005 relative to 2004 and a decrease in the average claim payment. The cancer and critical illness line of business was unfavorably impacted by $3.5 million in benefit charges related to litigation.
Commissions in 2005 declined relative to the prior year, and operating expenses increased. These changes were due primarily to the restructuring of the agency field sales force wherein the Company is moving certain functions from a commissioned sales agency status to salaried employees of the Company.
Year Ended December 31, 2004 Compared with Year Ended December 31, 2003
Premium income growth in 2004 relative to the prior year was attributable primarily to favorablecurrent and prior period sales and stable persistency. Net investment income increased in 2008 in comparison to the prior year due primarily to growth in the level of assets supporting these lines of business and a higher yield on the portfolio due to the investment of new cash at a higher yield than that of the existing portfolio.
Index to Financial Statements
The 2004 benefit ratio for this segment was lower thandecreased in 20032008 in comparison to the prior year due primarily to favorable risk experience in the accident, sickness, and disability line of business, offset somewhat by higher benefit ratios in the life and cancer and critical illness lines of business. The improvement in the accident, sickness, and disability line of business resulted from the continued favorable experience related to several new products introduced between 2002 and 2004. The life line of business benefit ratio was higher in 2008 relative to the prior year due to a lowerhigher level of death claims and a higher average claim cost. The cancer and critical illness product line reported a higher benefit ratio in 2008 relative to the prior year due primarily to unfavorable claim experience associated with the older cancer products.
Although we continue to focus on expense management, the other expense ratio for 2008 increased in comparison to the prior year due primarily to field expansion and development.
Year Ended December 31, 2007 Compared with Year Ended December 31, 2006
Growth in premium income was attributable primarily to current and prior period sales growth and stable persistency. Net investment income increased in 2007 in comparison to 2006 due primarily to growth in the level of assets supporting these lines of business.
The benefit ratio for this segment decreased in 2007 in comparison to 2006 due primarily to favorable risk experience in the income protectionaccident, sickness, and disability line of business as well as the life line of business. IndividualThe improvement in the accident, sickness, and disability line of business resulted from the favorable experience related to several new products introduced between 2002 and 2004. In addition, individual short-term income protectiondisability claim incidence and average claim duration decreased for 2004in 2007 compared with the prior yearto 2006, while the average claim duration for closed claimspayment was higher in 20042007 relative to 2003. The average indemnity for individual short-term income protection was higher in 2004 relative to 2003.2006. For accident and sickness products, the claim incidence rate decreased in 2004 relative2007 compared to the prior year, but2006, while the average claim payment increased over that reportedremained constant in 2003.2007 relative to 2006. The life line of business reported a decrease in the rate of incurred claims for 2007, although the aggregate claim expense increased due to the larger block of business. The cancer and critical illness product line also reported a slightly lower benefit ratio in 2007 relative to 2006.
The other expense ratio for 2007 increased in comparison to 2006 due primarily to our investment in brand and product promotion and the development of additional product offerings. Also, during 2006 we reported a one-time adjustment to commissions and operating expenses that increased reported commissions and reduced other expenses for that year.
Sales
(in millions of dollars)
| Year Ended December 31 | |||||||||||||||
| 2008 | % Change | 2007 | % Change | 2006 | |||||||||||
Accident, Sickness, and Disability | $ | 222.1 | 5.1 | % | $ | 211.3 | 8.7 | % | $ | 194.4 | |||||
Life | 64.0 | (4.0) | 66.7 | 0.2 | 66.6 | ||||||||||
Cancer and Critical Illness | 54.1 | (4.9) | 56.9 | 5.2 | 54.1 | ||||||||||
Total Sales | $ | 340.2 | 1.6 | $ | 334.9 | 6.3 | $ | 315.1 | |||||||
Colonial Life’s 2008 sales increased in the commercial market segment for employee groups with less than 100 lives as compared to 2007 sales levels. Partially offsetting this increase was a decrease in sales in the commercial market segment for employee groups with greater than 100 lives and a decrease in the public sector markets for state and federal governments. The number of new accounts and the new account annualized sales premium per case sold both increased over the prior year.
Sales in 2007 increased in comparison to 2006 primarily due to sales increases in the public sector market for educators and in the commercial market segment for employee groups with less than 100 lives. Also contributing to the sales increase was an increase in the number of paid claims relativenew accounts over the prior year, offset partially by a decrease in the average new case size, which resulted in lower annualized premium per case sold.
Index to 2003Financial Statements
Segment Outlook
Throughout 2008, we focused on sales and distribution growth by accelerating recruiting and development, capitalizing on sales opportunities where we have less market share, and assessing emerging distribution opportunities.
During 2009, we will seek to continue to expand our distribution through recruiting, development, and training programs. We intend to focus our marketing resources on both existing accounts and new employers to maintain our in-force premium and generate sales opportunities. We believe sales and premium growth will be driven by the growth and productivity of our agency sales system, as well as continued product and brand development. We will also continue our collaboration with our Unum US business partners for marketing and product development opportunities.
Periods of economic downturns have historically had minimal impact on the operations of Colonial Life, due primarily to a diversified product portfolio that is designed with short duration, indemnity benefits. As of year end 2008, we had not experienced an increase in claim incidence levels, on a seasonally adjusted basis, in the average claim payment.aggregate or in any particular market sector. We expect to experience some near term impact on sales and premium growth if current economic conditions affect the buying patterns of employees or cause employers to defer introduction of new plans. We continuously monitor key indicators to assess our risk to an economic slowdown or recession and attempt to adjust our business plans accordingly.
Segment Outlook
Sales resultsOur outlook for 2009 is for the continuance of high levels of profitability in recent years have not grown atthis segment, but with margins decreasing modestly over time as the rate the Company believes it can competitively and profitably achieve. In 2006, the Company will continuebenefit ratio returns to emphasize consistent, profitable sales growth by focusing on the recruitment and productivity of agents, improved business tools, and enhanced marketing research and development.
The Company expectsmore historic levels. Premium growth in revenue and profitability2009 is expected to be driven by increasing premium income throughslightly less than 2008 due to slower sales growth and stable persistency while maintaining a focus on high-quality business and the management of expenses. High quality service is viewed as a differentiator for the Colonial segment in the marketplace. The two key drivers for quality service delivery are trained service professionals and effective use of technology. These key drivers will be emphasized by seeking to increase innovation, productivity, and performance through leadership development and technological advances.trends.
Individual Income ProtectionDisability - Closed Block Segment Operating Results
The Individual Income ProtectionDisability – Closed Block segment generally consists of those individual income protectiondisability policies in force prior tobefore the Company’s substantial changes in product offerings, pricing, distribution, and underwriting. These changesunderwriting, which generally occurred during the period 1994 through 1998. A minimalsmall amount of new business continued to be sold subsequent toafter these changes, but the Company ceasedwe stopped selling new policies in this segment at the beginning of 2004 other than update features contractually allowable on existing policies. As previously discussed, effective with the fourth quarter of 2008, we reclassified the assets, non-recourse debt, and associated capital of Northwind Holdings from our former Corporate segment to the Individual Disability – Closed Block segment. The primary effect on operating results from the movement of Northwind Holdings to the Individual Disability – Closed Block segment is the inclusion of interest and debt expense associated with the Northwind Holdings non-recourse debt.
Index to Financial Statements
Operating Results
Shown below are financial results and key performance indicators for the Individual Income ProtectionDisability – Closed Block segment.
(in millions of dollars, except ratios)
| Year Ended December 31 | ||||||||||||||||||
| 2005 | % Change | 2004 | % Change | 2003 | ||||||||||||||
Operating Revenue | ||||||||||||||||||
Premium Income | $ | 1,011.7 | 2.5 | % | $ | 986.6 | (4.1 | )% | $ | 1,028.5 | ||||||||
Net Investment Income | 770.0 | (3.6 | ) | 799.1 | (3.0 | ) | 824.2 | |||||||||||
Other Income | 95.2 | (5.1 | ) | 100.3 | 4.6 | 95.9 | ||||||||||||
Total | 1,876.9 | (0.5 | ) | 1,886.0 | (3.2 | ) | 1,948.6 | |||||||||||
Benefits and Expenses | ||||||||||||||||||
Benefits and Change in Reserves for Future Benefits | 1,562.7 | (3.5 | ) | 1,618.9 | 5.6 | 1,533.6 | ||||||||||||
Commissions | 74.9 | (1.8 | ) | 76.3 | (10.8 | ) | 85.5 | |||||||||||
Deferral of Policy Acquisition Costs | — | — | — | N.M. | (7.5 | ) | ||||||||||||
Amortization of Deferred Policy Acquisition Costs | — | — | — | N.M. | 41.3 | |||||||||||||
Amortization of Value of Business Acquired | — | — | — | N.M. | 32.7 | |||||||||||||
Impairment of Intangible Assets | — | — | 856.4 | N.M. | — | |||||||||||||
Operating Expenses | 159.4 | 1.4 | 157.2 | (21.6 | ) | 200.5 | ||||||||||||
Total | 1,797.0 | (33.7 | ) | 2,708.8 | 43.6 | 1,886.1 | ||||||||||||
Operating Income (Loss) Before Income Tax and Net Realized Investment Gains and Losses | $ | 79.9 | 109.7 | $ | (822.8 | ) | N.M. | $ | 62.5 | |||||||||
Benefit Ratio (% of Premium Income) (1) | 154.5 | % | 164.1 | % | 149.1 | % | ||||||||||||
Interest Adjusted Loss Ratio | 87.3 | % | 87.5 | % | 82.7 | % | ||||||||||||
Operating Expense Ratio (% of Premium Income) (2) | 15.8 | % | 15.9 | % | 19.5 | % | ||||||||||||
Before-tax Operating Income (Loss) Ratio (% of Premium Income) (3) | 7.9 | % | (83.4 | )% | 6.1 | % | ||||||||||||
Persistency | 94.5 | % | 94.5 | % | 94.2 | % | ||||||||||||
| Year Ended December 31 | |||||||||||||||
| 2008 | % Change | 2007 | % Change | 2006 | |||||||||||
Operating Revenue | |||||||||||||||
Premium Income | $ | 952.3 | (5.7) | % | $ | 1,009.9 | (5.0) | % | $ | 1,062.8 | |||||
Net Investment Income | 767.5 | (7.3) | 827.6 | (0.1) | 828.7 | ||||||||||
Other Income | 98.6 | (4.9) | 103.7 | (1.3) | 105.1 | ||||||||||
Total | 1,818.4 | (6.3) | 1,941.2 | (2.8) | 1,996.6 | ||||||||||
Benefits and Expenses | |||||||||||||||
Benefits and Change in Reserves for Future Benefits | 1,544.8 | (4.3) | 1,614.5 | (5.6) | 1,709.7 | ||||||||||
Commissions | 62.7 | (9.3) | 69.1 | (9.3) | 76.2 | ||||||||||
Interest and Debt Expense | 35.1 | N.M. | 8.3 | N.M. | - | ||||||||||
Other Expenses | 148.1 | 5.9 | 139.8 | 0.3 | 139.4 | ||||||||||
Total | 1,790.7 | (2.2) | 1,831.7 | (4.9) | 1,925.3 | ||||||||||
Operating Income Before Income Tax and Net Realized Investment Gains and Losses | $ | 27.7 | (74.7) | $ | 109.5 | 53.6 | $ | 71.3 | |||||||
Interest Adjusted Loss Ratio (1) | 82.2% | 84.1% | 90.5% | ||||||||||||
Operating Ratios (% of Premium Income): | |||||||||||||||
Other Expense Ratio (2) | 15.6% | 13.8% | 13.1% | ||||||||||||
Before-tax Operating Income Ratio (3) | 2.9% | 10.8% | 6.7% | ||||||||||||
Premium Persistency | 93.8% | 94.3% | 94.4% | ||||||||||||
N.M. = not a meaningful percentage
Excluding the charges noted in (3) above and discussed more fully in the preceding significant transactions and events discussions for each applicable year, the Individual Income Protection – Closed Block segment would have reported operating income of $114.2 million in 2005 and $152.8 million in 2004.
As previously discussed, effective August 8, 2005, the Company recaptured the closed block individual income protection business originally ceded to Centre Life Reinsurance Ltd. in 1996. The underlying operating results of the reinsurance contract, prior to recapture, were reflected in other income. The recapture did not have a material impact on operating income for the segment.
Operating Results(1) Included in these ratios are charges (credits) of $(10.7) million and $47.2 million in 2007 and 2006, respectively, related to the claim reassessment process. Excluding these charges and credits, the interest adjusted loss ratio for 2007 and 2006 would have been 85.2% and 86.1%, respectively.
(2) Included in this ratio is a decrease of $2.5 million in 2007 related to the claim reassessment process. Excluding this item, the other expense ratio for 2007 would have been 14.1%.
(3) Included in these ratios are charges (credits) of $(13.2) million and $47.2 million in 2007 and 2006, respectively, related to the claim reassessment process. Excluding these charges and credits, the before-tax operating income ratio for 2007 and 2006 would have been 9.5% and 11.1%, respectively.
Year Ended December 31, 20052008 Compared with Year Ended December 31, 20042007
PremiumThe decrease in premium income increasedfor 2008 relative to the prior year is due to the expected run-off of this block of closed business due to persistency and policy maturities. Net investment income decreased in 20052008 compared to the prior year due to the recapturea decrease in bond call premiums, a lower level of the previously discussed block of business, which added approximately $70.0 million of premium income to this segment and on an annual basis, is expected to add approximately $185.0 million of premium income. Other than premiums on the recaptured block of business, premium income declined in 2005 relative to the prior year, as expected inassets supporting this closed block of business. Net investment income decreased in 2005 relative to the prior year due tobusiness, and a decline in the portfolio yield rate andfor this segment. During the fourth quarter of 2007, we entered into an intercompany reinsurance transaction which allowed us to release excess statutory capital previously supporting this reinsured closed block of business. As a result, the capital allocated to our Individual Disability – Closed Block segment declined, with a resulting decrease in income from prepayments on mortgage-backed securities. These declines were offset somewhat by approximately $35.0 million ofnet investment income relateddue to the $1.6 billion of bonds transferredlower asset levels needed to support allocated capital. Because this is an intercompany reinsurance arrangement, reported results remain unchanged for this segment other than the Company in conjunction with the reinsurance recapture. lower net investment income.
Index to Financial Statements
Other income includes the underlying results of certain blocks of reinsured business, including the resultsnet investment income of portfolios held by those ceding companies to support the aforementioned block we have reinsured. The net investment income for those blocks of reinsured business also declined relative to prior years, primarily due to a lower level of assets.
Interest and debt expense is related to the recapture date.
Northwind Holdings debt issued in the fourth quarter of 2007.
The benefitinterest adjusted loss ratio for 2005 was stablelower in comparison2008 compared to the prior year, excluding the decrease in our claim reassessment reserve charge in 2005 related to the settlement agreement with the California DOI and the reserve charges in 2004 related to the restructuring of this block and the settlement of the multistate market conduct examination, as noted in the preceding financial metrics. Claim recovery rates were lower in 2005 relative to 2004, while claim incidence rates improved.
Excluding the charges noted in (2) above, operating expenses were lower than the prior yearestimate, due primarily to the Company’s overalllower average size of new claims and fewer reopened claims.
The other expense management initiatives.
Year Ended December 31, 2004 Compared with Year Ended December 31, 2003
Premium income decreased relative to the prior year due to the expected decline in this closed block of business. Net investment income declined in 2004ratio is higher for 2008 relative to the prior year due to a $4.7 million litigation settlement as well as higher legal fees related to two pending cases.
Year Ended December 31, 2007 Compared with Year Ended December 31, 2006
The decrease in premium income for 2007 relative to 2006 is due to the expected decline in this block of closed business, as well as an adjustment to premium income for a small block of ceded business for which the contract was modified during 2007. Partially offsetting these declines is an increase in premium income due to the 2007 reinsurance recapture, in the third quarter of 2007, of a small block of business, with an effective date of January 1, 2007, and annualized premium income of approximately $7.0 million. Neither the contract modification nor the recapture had a material effect on operating results for this segment.
Net investment income decreased slightly in 2007 compared to 2006 due to a decrease in the level of assets supporting this business and the decline in the portfolio yield rate. The lower asset levels were primarily the result of the previously discussed intercompany reinsurance arrangement which lowered the statutory capital requirements for the reinsured block of business.
The interest adjusted loss ratio was lower in 2007 than the ratio for 2006, excluding the revisions to the claim reassessment reserve estimate noted previously, due primarily to a higher rate of claim recoveries and a lower rate of submitted claims.
Segment Outlook
As a result of the decline in capital allocated to this segment, net investment income has decreased in 2008 relative to 2007 due to the lower prepayments on mortgage-backed securities, offset somewhat by a retrospective adjustment of the amortization of the purchase discount on mortgage-backed securities.asset levels needed to support allocated capital. Net investment income was also negatively impacted duein 2008 by a reduced level of bond call premiums, relative to the lower yield on cash equivalent investments held during the first half of 2004 in conjunction with the pending transfer of cash for the reinsurance agreements entered intorecent historical experience, as parta result of the restructuring ofvolatile capital market conditions and uncertain economic environment, and it is likely that this block. Othertrend may continue in 2009.
We also expect that operating revenue and income includes the underlying results of certain blocks of reinsured business.
The increase in the benefit ratio for 2004 relative to 2003, excluding the reserve charges in 2004 related to the restructuring of this block and the settlement of the multistate market conduct examination, was due to a decrease in the claim recovery rate relative to the level of 2003, offset somewhat by a decrease in claim incidence rates in 2004 relative to 2003 levels.
The operating expense ratio decreased relative to 2003 due primarily to a reduction in selling and underwriting expenses. A minimal amount of new business was still being sold during 2003, primarily related to update features on existing policies.
Due to the impairment of intangible assetswill decline over time as of January 1, 2004, no “scheduled” amortization of deferred policy acquisition costs or value of business acquired was included in operating results for this segment during 2004, compared to $74.0 million in 2003.
Segment Outlook
The Company believes that the 2004 restructuring of this closed block of business has strengthened the balance sheet for this segment and minimized the Company’s exposure to potential future adverse morbidity. As part of the 2004 restructuring, the Company entered into reinsurance agreements which effectively provide approximately 60 percent reinsurance coverage for the Company’s overall consolidated risk above a specified retention limit, which at December 31, 2005, equaled approximately $8.0 billion. The maximum risk limit for the reinsurer grows to approximately $2.6 billion over time, after which any further losses will revert to the Company. The Company has not yet reached the retention limit and does not currently anticipate that once reached, the Company’s experience would be such that its losses would exceed the maximum risk limit for the reinsurer and therefore revert back to the Company. The reinsurance receivable for this contract, as reported in the Company’s consolidated statements of financial condition, was approximately $570.0 million at December 31, 2005.
Total revenue, subsequent to a full year’s inclusion of premium and net investment income related to the recaptured block of business, is expected to decline very slowly over time as the Company believes that persistency will remain in the mid-90 percent range. The Company believeswinds down. We believe that the interest adjusted loss ratio for this block of business will be relatively flat over the long-term,long term, but the segment may experience quarterly volatility. The expense ratio throughout 2006Claim resolution rates are very sensitive to operational and environmental changes and can be volatile over short periods of time. Our claim resolution rate assumption used in determining reserves is expectedour expectation of the resolution rate we will experience over the life of the block of business and will vary from actual experience in any one period. It is possible, however, that variability in our reserve assumptions could result in a material impact on our reserve levels.
Corporate and Other Segment
As previously discussed, effective with the fourth quarter of 2008, we aggregated our former Other segment and Corporate segment into one reporting segment. Subsequent to be consistent with or lower than that aggregation, additional modifications to the reporting segment included the transfer of assets, non-recourse debt, and associated capital of Tailwind Holdings and Northwind Holdings out of Corporate and Other into Unum US and Individual Disability – Closed Block, respectively, and the transfer of excess assets, capital, and the associated investment income from Unum UK into Corporate and Other. Financial results previously reported for 2005.have been revised to reflect these reclassifications.
Other Segment Operating Results
Index to Financial Statements
The Corporate and Other operating segment includes investment income on corporate assets not specifically allocated to a line of business, interest expense on corporate debt other than non-recourse debt, and certain other corporate income and expense not allocated to a line of business. Corporate and Other also includes results from disability management services and U.S. Brokerage insuredcertain Unum US insurance products not actively marketed, (with the exception of certain individual income protection products in the Individual Income Protection – Closed Block segment), including individual life and corporate-owned life insurance, reinsurance pools and management operations, group pension, health insurance, and individual annuities. It is expected thatWe expect operating revenue and income in this segment resulting from thethese insurance products that are not actively marketed willto decline over time as these business lines wind down, and management expects to reinvest the capital supporting these lines of business in the future growth of the U.S. Brokerage, Unum Limited, and Colonial segments.down.
Operating Results
(in millions of dollars)
| Year Ended December 31 | |||||||||||||||
| 2005 | % Change | 2004 | % Change | 2003 | |||||||||||
Operating Revenue | |||||||||||||||
Premium Income | $ | 2.6 | (91.7 | )% | $ | 31.3 | (8.7 | )% | $ | 34.3 | |||||
Net Investment Income | 120.5 | (5.3 | ) | 127.3 | (9.1 | ) | 140.1 | ||||||||
Other Income | 213.9 | 2.7 | 208.3 | 1.9 | 204.4 | ||||||||||
Total | 337.0 | (8.1 | ) | 366.9 | (3.1 | ) | 378.8 | ||||||||
Benefits and Expenses | |||||||||||||||
Benefits and Change in Reserves for Future Benefits | 122.2 | (14.1 | ) | 142.3 | (9.4 | ) | 157.1 | ||||||||
Commissions | 1.1 | (77.6 | ) | 4.9 | (54.6 | ) | 10.8 | ||||||||
Deferral of Policy Acquisition Costs | — | N.M. | 0.1 | — | 0.1 | ||||||||||
Amortization of Deferred Policy Acquisition Costs | 0.5 | N.M. | — | N.M. | — | ||||||||||
Operating Expenses | 167.5 | (3.8 | ) | 174.2 | 3.3 | 168.7 | |||||||||
Total | 291.3 | (9.4 | ) | 321.5 | (4.5 | ) | 336.7 | ||||||||
Operating Income Before Income Tax and Net Realized Investment Gains and Losses | $ | 45.7 | 0.7 | $ | 45.4 | 7.8 | $ | 42.1 | |||||||
| Year Ended December 31 | |||||||||||||||
| 2008 | % Change | 2007 | % Change | 2006 | |||||||||||
Operating Revenue | |||||||||||||||
Premium Income | $ | 1.4 | (17.6) | % | $ | 1.7 | (62.2) | % | $ | 4.5 | |||||
Net Investment Income | 197.5 | 9.1 | 181.0 | 6.0 | 170.7 | ||||||||||
Other Income | 42.2 | 37.0 | 30.8 | (37.8) | 49.5 | ||||||||||
Total | 241.1 | 12.9 | 213.5 | (5.0) | 224.7 | ||||||||||
Benefits and Expenses | |||||||||||||||
Benefits and Change in Reserves for Future Benefits | 107.8 | (6.4) | 115.2 | (4.4) | 120.5 | ||||||||||
Commissions | 1.2 | (36.8) | 1.9 | (36.7) | 3.0 | ||||||||||
Interest and Debt Expense | 117.4 | (48.1) | 226.1 | 4.5 | 216.3 | ||||||||||
Other Expenses | 28.7 | (7.7) | 31.1 | (7.7) | 33.7 | ||||||||||
Total | 255.1 | (31.8) | 374.3 | 0.2 | 373.5 | ||||||||||
Operating Loss Before Income Tax and Net Realized Investment Gains and Losses | $ | (14.0) | 91.3 | $ | (160.8) | (8.1) | $ | (148.8) | |||||||
N.M. = not a meaningful percentageNon-Insurance Product Results
Disability Management Services
Operating revenue from disability management services, which includes the Company’s wholly-owned subsidiaries GENEX and Options and Choices, Inc., totaled $177.9was $106.0 million in 2005,2008 compared to $177.1$74.9 million and $73.2 million in 20042007 and $173.02006, respectively. Operating losses were $30.6 million in 2003. Operating income totaled $15.72008 compared to $178.3 million and $173.2 million in 2005,2007 and 2006, respectively.
The increase in operating revenue in 2008 compared to $16.2the prior years is due primarily to an increase in net investment income resulting from higher asset levels and $7.6 million of other income received during 2008 related to a refund of interest primarily attributable to tax years 1986 through 1996.
Interest and debt expense, excluding the costs related to early retirement of debt, was $117.0 million in 20042008 compared to $167.3 million and $17.2$190.5 million in 2003.2007 and 2006, respectively. Interest expense declined in 2008 relative to the prior two years due to the replacement, in the fourth quarter of 2007, of older fixed rate debt held in Corporate and Other with non-recourse debt issued in conjunction with the securitization of our closed block of individual disability reserves and held in the Individual Disability – Closed Block segment. Interest expense was lower in 2007 relative to 2006 due to the reduction in our outstanding debt year over year.
Costs related to the early retirement of debt were $0.4 million, $58.8 million, and $25.8 million in 2008, 2007, and 2006, respectively. See “Debt” contained in this Item 7 for further discussion.
Included in other expenses is a securities litigation settlement accrual of $11.6 million in 2007 and broker compensation settlement expenses of $18.5 million in 2006.
Insurance Product Results
Reinsurance Pools and Management
The Company’sOur reinsurance operations include the reinsurance management operations of Duncanson & Holt, Inc. (D&H) and the risk assumption, which includes reinsurance pool participation; direct reinsurance, which includes accident and health, (A&H), long-termlong-
Index to Financial Statements
term care, (LTC), and long-term disability coverages; and Lloyd’s of London (Lloyd’s) syndicate participations. During the years 1999 through 2001, the Company exited its reinsurance pools and management operations through a combination of a sale, reinsurance, and/or placement of certain components in run-off. Total operating revenue for the reinsurance pools and management operations was $7.7 million, $5.2 million, and $15.5 million in 2005, 2004, and 2003, respectively. During 2005,2008, this line of business reported an
operating loss of $11.0$7.7 million compared to operating losses of $7.5$6.0 million and $7.1$6.7 million in 20042007 and 2003,2006, respectively.
Individual Life and Corporate-Owned Life
During 2000, the Companywe reinsured substantially all of the individual life and corporate-owned life insurance blocks of business. The Companybusiness and ceded approximately $3.3 billion of reserves to the reinsurer. The $388.2 million before-tax gain on these transactions was deferred and is being amortized into income based upon expected future premium income on the traditional insurance policies ceded and estimated future gross profits on the interest-sensitive insurance policies ceded.
A portion of the ceded corporate-owned life insurance block of business surrendered during 2007. The termination of this fully ceded business had no impact on our operating results and will not materially affect the amortization of the deferred gain.
Total operating revenue for individual life and corporate-owned life insurance was $41.0$32.3 million, $40.0$29.4 million, and $39.9$37.8 million in 2005, 2004,2008, 2007, and 2003,2006, respectively. Operating income for the same periods was $38.8$26.2 million, $38.2$26.8 million, and $33.5$33.0 million.
Other
Group pension, health insurance, individual annuities, and other closed lines of business had combined operating revenue of $110.4 million, $144.6 million, and $150.4$97.3 million in 2005, 2004,2008 and 2003, respectively,$103.6 million in both 2007 and operating income (losses) of $2.2 million, $(1.5) million, and $(1.5) million. Decreases in operating revenue and income are expected to continue as these2006. These closed lines of business wind down.
Included in these amounts were the Company’s operating results for its previously owned operation in Argentina, which produced operating revenue of $27.7 million and $18.1 million in 2004 and 2003, respectively, andhad combined operating losses of $6.2$1.9 million, $3.3 million, and $13.4$1.9 million in 20042008, 2007, and 2003,2006, respectively.
Segment Outlook
Specific defaults within our investment portfolio are unforeseeable. We have tested whether our capital plan for 2009 has sufficient cushion to absorb possible losses. Because we currently have a margin of excess holding company liquidity and statutory capital above our capital management target guidelines, we believe we are well positioned for the economic downturn. It is possible, however, that defaults in our investment portfolio will result in realized investment losses, reduced net investment income, and lower statutory capital. Depending on the magnitude of defaults, we may need to seek additional external financing above the level anticipated in our current capital outlook.
As previously disclosed,noted, we expect our 2009 pension costs to be approximately $42.5 million higher than the level of 2008. This increase in the fourth quarter of 2005 the Company disposed of its remaining 40 percent ownership position in its Argentinean operation. The Argentinean operation had been restructured during 2004 wherein at that time the Company reduced its ownership positionexpense will be charged to 40 percentour Corporate and reported a before-tax loss of $4.7 million. During 2003, the Company recognized an impairment loss of $13.5 million related to this operation.Other segment.
Corporate Segment Operating Results
The Corporate segment includes investment income on corporate assets not specifically allocated to a line of business, corporate interest expense, and certain other corporate income and expense not allocated to a line of business.
Operating revenue in the Corporate segment was $61.2 million in 2005, compared to $66.0 million in 2004 and $31.6 million in 2003. As previously discussed, during the fourth quarter of 2004 the Company obtained a judgment in refund litigation for federal income tax paid for tax year 1984, plus interest, and as such, recognized $14.0 million of operating revenue in the Corporate segment related to the interest portion of the anticipated refund. Also contributing to the decline in revenue during 2005 relative to 2004 was a $9.4 million curtailment gain recognized in 2004 related to changes in the Company’s retiree medical plan. See Note 7 of the “Notes to Consolidated Financial Statements” contained herein in Item 8 for further discussion of the curtailment gain.
The Corporate segment reported operating losses of $152.8 million, $153.7 million, and $193.5 million in 2005, 2004, and 2003, respectively. Interest and debt expense increased from $187.2 million in 2003 and $207.1 million in 2004 to $208.0 million in 2005 due to the impact of the debt offerings, as discussed under “Liquidity and Capital Resources” included herein.
Included in operating expenses for 2003 is approximately $15.0 million in severance and pension benefit payouts related to the change of the Company’s president and chief executive officer.
Discontinued Operations
During 2003, the Company entered into an agreement to sell its Canadian branch. The transaction closed April 30, 2004, and the Company reported a secondfirst quarter of 2004 loss of $113.0 million before tax and $70.9 million after tax on2007, we completed the sale of the branch. The Company alsoGENEX and recognized a first quarter of 2004 loss of $0.6 million before tax and $0.4 million after tax to write down the value of bonds in the Canadian branch investment portfolio to market value.
Losses from discontinued operations were $60.8 million and $161.7 million, net of tax, in 2004 and 2003, respectively. Excluding the 2004 and 2003 lossesan after-tax gain on the sale and the write-downs,transaction of approximately $6.2 million. This gain is included with income from discontinued operations was $10.5in our statements of income. Also included in discontinued operations is after-tax income for GENEX of $0.7 million and $35.2$7.4 million in 20042007 and 2003,2006, respectively.
See Note 2 of the “Notes to Consolidated Financial Statements” contained herein in Item 8 for further discussion of the Company’s discontinued operations.
additional information.
Investments
Overview
Investment activities areWe believe that our investment portfolio, which consists primarily of fixed income securities, is positioned to moderate the potential impact of an integral parteconomic slowdown on our financial position or operating results. Our portfolio is well diversified by type of investment and industry sector. Over the Company’s business, and profitability is significantly affected by investment results. Invested assets are segmented into portfolios that support the various product lines. Generally, the investment strategy for the portfolios ispast few years, we have actively reduced our exposure to match the effective asset cash flows and durations with related expected liability cash flows and durations to consistently meet the liability funding requirements of the Company’s business. The Company seeks to maximize investment income and total return and to assume credit risk in a prudent and selective manner, subject to constraints of quality, liquidity, diversification, and regulatory considerations. The Company’s overall investment philosophy is to invest in a portfolio of high quality assets that provide investment returns consistent with that assumed in the pricing of its insurance products. Assets are invested predominately inbelow-investment-grade fixed maturity securities, although additional downgrades may occur during an economic slowdown. We have established an investment strategy that we believe will provide for adequate cash flows from operations and the portfolio is matched with liabilities so asallow us to eliminate as much as possible the Company’shold our securities through periods where significant decreases in fair value occur. We have no exposure to changessubprime mortgages, “Alt-A” loans, or collateralized debt obligations in the overall level of interest rates. Changes in interest rates affect the amount and timing of cash flows.
The Company actively manages its asset and liability cash flow match as well as its asset and liability duration match in order to minimize interest rate risk. The Company may redistribute its investments within its different lines of business, when necessary, to adjust the cash flow and/our asset-backed or duration of the asset portfolios to better match the cash flow and duration of the liabilitymortgage-backed securities portfolios. Asset and liability portfolio modeling is updated on a quarterly basis and is used as part of the overall interest rate risk management strategy. Cash flows from the inforce asset and liability portfolios are projected at current interest rate levels and also at levels reflecting an increase and a decrease in interest rates to obtain a range of projected cash flows under the different interest rate scenarios. These results enable the Company to assess the impact of projected changes in cash flows and duration resulting from potential changes in interest rates. Testing the asset and liability portfolios under various interest rate scenarios enables the Company to choose the most appropriate investment strategy as well as to minimize the risk of disadvantageous outcomes. This analysis is a precursor to the Company’s activities in derivative financial instruments, which are used to hedge interest rate risk and to manage duration match. At December 31, 2005,2008, we held $20.4 million fair value ($20.6
Index to Financial Statements
million amortized cost) of collateralized debt obligations within our public bond portfolio. We had $148.3 million fair value ($170.2 million amortized cost) of exposure to investments for which the payment of interest and principal is guaranteed under a financial guaranty insurance policy. The weighted average durationrating of the Company’s policyholder liability portfolio was approximately 8.09 years, andunderlying securities, absent the weighted average durationguaranty insurance policy, is A1. We held $302.7 million fair value ($496.1 million amortized cost) of perpetual debentures, or “hybrid” securities, that generally have no fixed maturity date. Interest on these securities due on any payment date may be deferred by the Company’s investment portfolio supporting those policyholder liabilities was approximately 7.71 years.issuer. The interest payments are generally deferrable only to the extent that the issuer has suspended dividends or other distributions or payments to any of its shareholders or any other perpetual debt instrument.
Below is a summary of the Company’sour formal investment policy, including the overall quality and diversification objectives.
The majority of investments are in high quality publicly traded securities to ensure the desired liquidity and preserve the capital value of the Company’sour portfolios.
Rating | Internal Limit | ||
| ($ in millions) | |||
AAA/A | $ | 150 | |
BBB | 100 | ||
BBB- | 75 | ||
BB/BBB- | 60 | ||
BB | 50 | ||
B/BB | 40 | ||
B | 20 | ||
Rating | Internal Limit | |
| ($ in millions) | ||
AAA/A | $150 | |
BBB+ | 125 | |
BBB | 100 | |
BBB- | 75 | |
BB+ | 60 | |
BB/BB- | 50 | |
B | 20 |
The portfolio is to be diversified across industry classification and geographic lines.
See “Critical Accounting Estimates” contained in this Item 7 for further discussion of our valuation of investments.
Index to Financial Statements
Investment Results
Net investment income was $2,188.3$2,389.0 million in 2005, up 1.42008, a decrease of 0.9 percent relative to the prior year. IncludedThe level of invested assets was higher in 2008 compared to 2007, but we received fewer bond call premiums during 2008. The weaker British pound in 2008 relative to 2007 also unfavorably affected translated results for net investment income for 2005 is approximately $35.0 million relatedincome. Our portfolio yield has increased slightly year over year due to the $1.6 billioninvestment of bonds transferred tonew cash at higher rates than that of prior periods, particularly during the Company in conjunction with the 2005 recapturelast two quarters of a ceded closed block of individual income protection business. Excluding that, net2008.
Net investment income was fairly consistent with$2,409.9 million in 2007, an increase of 3.8 percent relative to the prior year, with theyear. The increase from thewas due primarily to growth in invested assets, and higher bond call premiumspartially offset by a lower portfolio yield due to the low interest rate environment and the investment of new cash at lower rates as well asthan that of our existing portfolio yield and a decline in the level of prepaymentsprepayment income on mortgage-backed securities. The overallpound strengthened during 2007 relative to 2006, which favorably affected translated results for net investment income.
The duration weighted book yield on the fixed income securities in theour investment portfolio was 6.856.72 percent as of December 31, 2005,2008, and the weighted average credit rating was A2. This compares to an overalla yield in the portfolio of 6.936.66 percent as of December 31, 20042007 and a weighted average credit rating of A3. InA2. At December 31, 2008, the current low interest rate market,weighted average duration of our policyholder liability portfolio was approximately 7.17 years, and the Company expects that theweighted average duration of our investment portfolio yield will continue to gradually decline until the market rates on new purchases increase above the level of the overall yield.supporting those policyholder liabilities was approximately 6.51 years.
The Company reported before-tax realizedRealized investment gains and losses, during the last three years as shown in the following chart. Impairment losses were recognized as a result of management’s determination, based on the factors discussed herein in “Critical Accounting Policies,” that the value of certain fixed maturity and equity securities had
other than temporarily declined during the applicable reporting period, as well as the result of further declines in the values of fixed maturity and equity securities that had initially been written down in a prior period.
The Company also reports changes in the fair values of certain embedded derivatives as realized investment gains and losses, as required under the provisions of Statement of Financial Accounting Standards No. 133 Implementation Issue B36 (DIG Issue B36),Embedded Derivatives: Modified Coinsurance Arrangements and Debt Instruments That Incorporate Credit Risk Exposure That Are Unrelated or Only Partially Related to the Creditworthiness of the Obligor Under Those Instruments. During 2005, the change in fair values of the embedded derivatives was minimal, reflecting interest rate levels on mid-term and longer-term maturities that were, on average, fairly consistent at the end of 2005 with the level of rates existing at the end of 2004. The realized loss on these embedded derivatives for 2005 also includes recognition of a $9.4 million before tax, loss related to the time value component of the embedded derivative in the reinsurance contract that was recaptured in the third quarter of 2005. Interest rates generally decreased during 2004, resulting in an increase in the fair value of these embedded derivatives during that time period.
are as follows:
(in millions of dollars)
| Year Ended December 31 | |||||||||||
| 2005 | 2004 | 2003 | |||||||||
Gross Realized Investment Gain from Sales | $ | 110.8 | $ | 93.4 | $ | 166.9 | |||||
Gross Realized Investment Loss | |||||||||||
Write-downs | 19.4 | 88.0 | 187.3 | ||||||||
Sales | 90.2 | 64.8 | 154.2 | ||||||||
Total | 109.6 | 152.8 | 341.5 | ||||||||
Change in Fair Value of DIG Issue B36 Derivatives | (7.9 | ) | 88.6 | 0.8 | |||||||
Net Realized Investment Gain (Loss) | $ | (6.7 | ) | $ | 29.2 | $ | (173.8 | ) | |||
| Year Ended December 31 | |||||||||
| 2008 | 2007 | 2006 | |||||||
Gross Realized Investment Gain from Sales | $ | 79.1 | $ | 105.8 | $ | 82.0 | |||
Gross Realized Investment Loss | |||||||||
Write-downs | 166.1 | 76.2 | 17.2 | ||||||
Sales | 87.2 | 37.5 | 57.3 | ||||||
Total | 253.3 | 113.7 | 74.5 | ||||||
Change in Fair Value of DIG Issue B36 Derivatives | (291.7) | (57.3) | (5.3) | ||||||
Net Realized Investment Gain (Loss) | $ | (465.9) | $ | (65.2) | $ | 2.2 | |||
Realized Investment Losses during 2005$10.0 Million or Greater from Other than Temporary Impairments
Approximately 81 percent of the 2005 other than temporary impairment losses occurred in the transportation and financial institutions industries. Circumstances surrounding larger other than temporary impairment losses are as follows:
Realized Investment Losses during 2004 from Other than Temporary Impairments
Approximately 58 percent of the 2004 other than temporary impairment losses in continuing operations occurredloss recognition, the decline in the financial institutions and transportation industries. Circumstances surrounding larger other than temporary impairment losses are as follows:
During 2008, we recognized an other than temporary impairment loss of $32.0 million loss on senior notessecurities issued by a United KingdomU.S. based engineeringautomobile manufacturer and manufacturingits captive finance subsidiary. The company engagedhas experienced a decline in profitability and cash flow due to the bus and automotive industry.weak economic environment. Although
Index to Financial Statements
the company has not yet received government bailout money, the probability of receiving some form of government financial aid has significantly increased. Other U.S. automakers that have received bailout money are expected to request their bondholders to accept a significant reduction in principal. In order for this company to stay competitive with other U.S. automakers, it is likely that it, too, will seek debt relief from its bondholders and that we will not recover our entire principal for these securities. At the time of the impairment loss, these securities had been in an unrealized loss position for a period of greater than three years. |
During 2008, we recognized an other than temporary impairment loss of $27.8 million on securities issued by a large investment banking firm. The company experienced a rapid deterioration in business prospects at its main operating unit in late 2003credit and early 2004, followed byderivatives portfolio, which made it impossible for the discovery of bookkeeping fraud at one of its business units. Both of these issues were discovered and disclosedfirm to raise additional capital or to sell assets to increase liquidity. The inability to raise capital forced the company’s banks and note holders by outside financial consultants during the first quarter of 2004. The company filedto file for U.K. administration on March 31, 2004. The securities were investment-grade at the time of purchase but were downgraded to below-investment-gradebankruptcy protection in the third quarter of 2003.2008. The firm was rated A2 by Moody’s and A by S&P at the time of the bankruptcy filing. At the time of the impairment loss, these securities had been in an unrealized loss position for a period of greater than 180 days but less than 270 days. The circumstances of this impaired investment have no impact on other investments.
During 2008, we recognized an other than temporary impairment loss on these securities in the first quarter of 2002 due to the negative revenue impact resulting from the company’s loss of a single large client. The Company closely monitored the financial performance of the company during 2002 and 2003. In the first quarter of 2004, following a review of the company’s capital condition, its revenue and earnings performance, and discussions with company management, it was determined that the investment was further impaired. In the third quarter of 2004, the company was recapitalized at a market price that indicated an additional impairment loss had occurred. The investment was originally purchased as part of the Company’s private equity investment program. There had been no unrealized gain or loss subsequent to the initial impairment loss in 2002. The circumstances of this impaired investment have no impact on other investments.
Realized Investment Losses during 2003 from Other than Temporary Impairments
Approximately 46 percent of the 2003 impairments in continuing operations occurred in the energy and utilities industries. Circumstances surrounding larger other than temporary impairment losses are as follows:
During 2008, we recognized an other than temporary impairment loss of $12.9 million on securities issued by a large international chemical company. The Company also owns securitiescompany’s third quarter operating results were weak due to recessionary industry conditions and the negative impact of hurricane activity on its oil refinery operations. Due to these factors, the company experienced a significant decline in its liquidity. In late December, lenders denied the previously mentioned U.K. power customercompany’s request to obtain additional funding from its existing line of this issuercredit. As a result, the company’s liquidity was insufficient to fund required cash outflows, and previouslythe company hired external consultants to advise it on potential capital restructuring alternatives. We recorded an impairment loss on those securities in the fourth quarter of 2002.
During 2008, we recognized an other than temporary impairment loss of $12.1 million on securities issued by a large newspaper publishing company. The outlook for this industry continues to deteriorate due to the secular change away from newspaper advertising and weak economic conditions. The company reported poor third quarter operating results. The increase in leverage and lower cash flows increase the likelihood that the company may violate its bank covenants. The company has attempted to sell non-core assets to reduce its debt, but it has been unable to execute a sale. As a result, it is likely that our bonds will not fully recover in value. At the time of the impairment loss, these securities had been in an unrealized loss position for a period of greater than two years but less than three years. The circumstances
During 2007, we recognized an other than temporary impairment loss of this impaired investment have no impact$15.0 million on other investments.
Index to Financial Statements
these securities had been in an unrealized loss position for a period of greater than two years. The circumstances of this impaired investment have no impact on other investments. |
During 2007, we recognized losses of $18.4 million related to the decline in fair value below amortized cost for certain securities for which it was determined during the third quarter of 2007 that we no longer had been continuouslythe intent to hold to recovery or maturity due to anticipated changes in our capital requirements resulting from the reinsurance transactions involving our Individual Disability – Closed Block segment business and the related issuance of $800.0 million of notes, as well as our capital redeployment plans.
During 2007, we recorded an adjustment to the book values and related unrealized loss position forof two securitized asset trusts acquired in 2001 to reflect the values that would have been present had we recorded the investment income as dividends rather than interest accretion. The book value adjustment of $20.2 million was recognized as a periodrealized investment loss in the second quarter of greater than 1 year but less than two years. The circumstances2007. Because the investments no longer satisfied our investment objectives, we subsequently sold the trusts in June of this impaired2007 and recognized a realized investment have no impactgain of $24.9 million on other investments.the sale.
We had no individual realized investment losses $10.0 million or greater from other than temporary impairments during 2006.
Realized Investment Losses $10.0 Million or Greater from Sale of Fixed Maturity Securities
During 2008, we recognized a loss of $16.2 million on the sale of securities issued by the large investment banking firm discussed above.
During 2008, we recognized a travel services company locatedloss of $10.1 million on the disposition of the principal protected equity linked note discussed above. The note’s substitution clause was triggered in the United Kingdom. The impairment loss was taken following discussions betweenfourth quarter of 2008 due to the issuer and its creditors regarding difficultiescontinued decline in the issuer’s businesses due to geopolitical unrest and persistent weakness in demand for leisure travel and requests for certain waivers and consents of debt covenants. These securities were investment-grade at the time of purchase but were downgraded to below-investment-grade in the first quarter of 2003.S&P 500 index. At the time of the impairment loss, these securities had been continuouslytriggering event, we made the decision to take ownership in an unrealized loss position for a period of greaterthe underlying Vanguard S&P 500 index mutual fund shares rather than 270 days but less than one year. The circumstances of this impaired investment have no impact on other investments.
Realized Investment Losses during 2005 from Sale of Fixed Maturity Securities
Foraccept the year ended December 31, 2005, the Company realized a loss of $76.6 million on the sale of fixed maturity securities. The securities sold during the year had a book value of $919.4 million and a fair value of $842.8 million at the time of sale and represented 85 different issuers. Circumstances surrounding larger realized investment losses from sale of securities are as follows:
Realized Investment Losses during 2004 from Sale of Fixed Maturity Securities
For the year ended December 31, 2004, the Company realized a loss of $53.0 million on the sale of fixed maturity securities in its continuing operations. The securities sold during the year had a book value of $604.6 million and a fair value of $551.6 million at the time of sale and represented 67 different issuers. Circumstances surrounding larger realized investment losses from sale of securities are as follows:
Realized Investment Losses during 2003 from Sale of Fixed Maturity Securities
For the year ended December 31, 2003, the CompanyWe had no individual realized a loss of $143.6investments losses $10.0 million onor greater from the sale of fixed maturity securities in its continuing operations. The securities sold during the year had2007.
During 2006, we recognized a book valueloss of $821.0$13.1 million and a fair value of $677.4 million aton the time of sale and represented 94 different issuers, of which approximately 59 percent were a part of the Company’s 2003 program to reduce its below-investment-grade fixed maturity securities holdings to comply with its investment policy regarding diversification and to better position the investment portfolio in the then current environment and reduce exposure to potential credit-related losses. Circumstances surrounding larger realized investment losses from sale of securities are as follows:
Change in Fair Value of DIG Issue B36 Derivative
We report changes in the fair value of an Italian dairy company. The loss was incurred after it was revealed thatembedded derivative in a modified coinsurance arrangement as realized investment gains and losses, as required under the guarantor had engagedprovisions of DIG Issue B36. Losses in massive fraud, ultimately leadingboth 2008 and 2007 resulted primarily from a widening of credit spreads in the overall investment market, as previously discussed. DIG Issue B36 requires us to the company’s bankruptcy. The guarantor had been rated investment-grade until December 2003. At the time of sale, theinclude in our realized investment had been in an unrealized loss position forgains and losses a period of less than 90 days. The Company also owns $22.5 million of fixed maturity securities of a wholly-owned Canadian subsidiary of the parent company. Although the financial and operating profiles of the subsidiary are separate from the parent and no other than temporary impairment was deemedcalculation intended to exist, in conjunction with the classification of the Canadian branch as an asset held for sale, the Company recognized a loss of $4.0 million to write downestimate the value of these securities, which were heldthe option of our reinsurance counterparty to cancel the reinsurance contract with us. However, neither party can unilaterally terminate the reinsurance agreement except in the Canadian branch investment portfolio,extreme circumstances resulting from regulatory supervision, delinquency proceedings, or other direct regulatory action. Cash settlements or collateral related to market value. This loss is included in the loss from discontinued operations.
Index to substantially reduce its exposureFinancial Statements
the reinsurance contract, and any accumulated embedded derivative gain or loss reduces to zero over time as the airline. These securities had an investment-grade rating untilreinsured business winds down. We therefore view DIG Issue B36 as a reporting requirement that will not result in a permanent reduction of assets or stockholders’ equity. The fair value of this embedded derivative was $(360.5) million and $(68.8) million at December 31, 2008 and 2007, respectively, and is reported in other liabilities in our consolidated balance sheets.
Fair Value Measurements
Effective January 1, 2008, we adopted the various issues were downgradedprovisions of Statement of Financial Accounting Standards No. 157 (SFAS 157),Fair Value Measurements. SFAS 157 defines fair value, establishes a framework for measuring fair value, and expands disclosures about fair value measurements. SFAS 157 is intended to below-investment-gradeincrease consistency and comparability among fair value estimates used in financial reporting. It does not require any new fair value measurements. SFAS 157 clarifies a number of considerations with respect to fair value measurement objectives for financial reporting and expands disclosure about the third quarteruse of 2001 and the first quarter of 2002. At the time of sale, the investment had been in an unrealized loss position for a period of greater than one year but less than two years. The Company also took an other than temporary impairment charge of $0.3 millionfair value measurements, with particular emphasis on the inputs used to measure fair value. The adoption of SFAS 157 did not materially change the approach or methods we utilize for determining fair value of certain private, secured debt obligations ofmeasurements or the fair values derived under those methods. See “Critical Accounting Estimates” contained in this issuer as part of a consensual restructuring proposal.
Asset Distribution
The following table provides the distribution of invested assets for the periods indicated. Ceded policy loans of $3.0 billion as of December 31, 2005 and $2.9 billion as of December 31, 2004, which are reported on a gross basis in the consolidated statements of financial condition“Notes to Consolidated Financial Statements” contained herein in Item 8 are excluded from the table below. The investment income on these ceded policy loans is not included in income.
for further discussion of our fair value measurements.
Distribution of Invested Assets
| December 31 | ||||||
| 2005 | 2004 | |||||
Investment-Grade Fixed Maturity Securities | 89.9 | % | 90.0 | % | ||
Below-Investment-Grade Fixed Maturity Securities | 6.0 | 6.4 | ||||
Mortgage Loans | 2.0 | 1.5 | ||||
Real Estate | 0.1 | 0.1 | ||||
Short-Term Investments | 1.2 | 1.2 | ||||
Other Invested Assets | 0.8 | 0.8 | ||||
Total | 100.0 | % | 100.0 | % | ||
Fixed Maturity Securities
Fixed maturity securities at December 31, 2005,2008, included $34.7$31.9 billion, or 99.699.4 percent, of bonds and derivative instruments and $155.4$208.1 million, or 0.40.6 percent, of redeemable preferred stocks. The following table shows the fair value composition by internal industry classification of the fixed maturity bond portfolio and the associated unrealized gains and losses.
Fixed Maturity Bonds – By Industry Classification
As of December 31, 20052008
(in millions of dollars)
Classification | Fair Value | Net Unrealized Gain | Fair Value of Bonds with Gross Unrealized Loss | Gross Unrealized Loss | Fair Value of Bonds with Gross Unrealized Gain | Gross Unrealized Gain | Fair Value | Net Unrealized Gain (Loss) | Fair Value of Bonds with Gross Unrealized Loss | Gross Unrealized Loss | Fair Value of Bonds with Gross Unrealized Gain | Gross Unrealized Gain | |||||||||||||||||||||||||
Basic Industry | $ | 2,275.1 | $ | 121.6 | $ | 608.7 | $ | 37.4 | $ | 1,666.4 | $ | 159.0 | $ | 1,789.3 | $ | (345.0) | $ | 1,423.7 | $ | 360.6 | $ | 365.6 | $ | 15.6 | |||||||||||||
Canadian | 406.9 | 95.3 | — | — | 406.9 | 95.3 | 254.2 | 57.5 | - | - | 254.2 | 57.5 | |||||||||||||||||||||||||
Capital Goods | 2,520.1 | 230.6 | 439.2 | 15.6 | 2,080.9 | 246.2 | 2,538.4 | (327.3) | 1,719.1 | 418.6 | 819.3 | 91.3 | |||||||||||||||||||||||||
Communications | 2,929.2 | 216.1 | 623.6 | 40.8 | 2,305.6 | 256.9 | 1,945.6 | (207.4) | 1,095.6 | 285.8 | 850.0 | 78.4 | |||||||||||||||||||||||||
Consumer Cyclical | 1,155.6 | 26.3 | 355.2 | 44.4 | 800.4 | 70.7 | 1,210.7 | (298.7) | 907.8 | 315.9 | 302.9 | 17.2 | |||||||||||||||||||||||||
Consumer Non-Cyclical | 3,919.8 | 245.1 | 1,075.9 | 30.8 | 2,843.9 | 275.9 | 4,192.2 | (168.7) | 2,445.4 | 303.6 | 1,746.8 | 134.9 | |||||||||||||||||||||||||
Derivative Instruments | 263.6 | 247.7 | (129.1 | ) | 129.5 | 392.7 | 377.2 | ||||||||||||||||||||||||||||||
Energy (Oil & Gas) | 2,475.8 | 360.8 | 132.6 | 4.5 | 2,343.2 | 365.3 | 2,245.2 | (170.1) | 1,347.1 | 252.0 | 898.1 | 81.9 | |||||||||||||||||||||||||
Financial Institutions | 3,453.2 | 118.8 | 1,072.2 | 53.8 | 2,381.0 | 172.6 | 2,577.8 | (327.1) | 2,185.6 | 340.8 | 392.2 | 13.7 | |||||||||||||||||||||||||
Mortgage/Asset-Backed | 4,431.3 | 254.0 | 1,012.2 | 20.3 | 3,419.1 | 274.3 | 3,945.5 | 253.8 | 346.1 | 55.1 | 3,599.4 | 308.9 | |||||||||||||||||||||||||
Sovereigns | 633.1 | 33.4 | 57.4 | 0.4 | 575.7 | 33.8 | 947.2 | 56.3 | 357.6 | 12.6 | 589.6 | 68.9 | |||||||||||||||||||||||||
Technology | 379.9 | 27.4 | 124.7 | 6.6 | 255.2 | 34.0 | 633.3 | (87.9) | 456.5 | 105.7 | 176.8 | 17.8 | |||||||||||||||||||||||||
Transportation | 1,062.0 | 135.7 | 71.6 | 3.5 | 990.4 | 139.2 | 888.0 | (15.0) | 413.0 | 56.0 | 475.0 | 41.0 | |||||||||||||||||||||||||
U.S. Government Agencies and Municipalities | 2,651.6 | 180.9 | 326.6 | 9.6 | 2,325.0 | 190.5 | 1,875.3 | 166.2 | 731.8 | 68.3 | 1,143.5 | 234.5 | |||||||||||||||||||||||||
Utilities | 6,144.2 | 493.6 | 1,368.1 | 34.1 | 4,776.1 | 527.7 | 6,883.3 | (682.5) | 4,995.8 | 799.1 | 1,887.5 | 116.6 | |||||||||||||||||||||||||
Total | $ | 34,701.4 | $ | 2,787.3 | $ | 7,138.9 | $ | 431.3 | $ | 27,562.5 | $ | 3,218.6 | $ | 31,926.0 | $ | (2,095.9) | $ | 18,425.1 | $ | 3,374.1 | $ | 13,500.9 | $ | 1,278.2 | |||||||||||||
Index to Financial Statements
The following table is a distribution of the maturity dates for fixed maturity bonds in an unrealized loss position at December 31, 2005.
2008.
Fixed Maturity Bonds – By Maturity
As of December 31, 20052008
| Fair Value of Bonds with Gross Unrealized Loss | Gross Unrealized Loss | |||||
Due in 1 year or less | $ | 56.6 | $ | 0.1 | ||
Due after 1 year up to 5 years | 418.3 | 7.5 | ||||
Due after 5 years up to 10 years | 1,872.0 | 208.6 | ||||
Due after 10 years | 3,779.8 | 194.8 | ||||
Subtotal | 6,126.7 | 411.0 | ||||
Mortgage/Asset-Backed Securities | 1,012.2 | 20.3 | ||||
Total | $ | 7,138.9 | $ | 431.3 | ||
Of the $431.3 million in gross unrealized losses at December 31, 2005, $343.5 million, or 79.6 percent, are related to investment-grade fixed maturity bonds. The following table shows the length of time the Company’s investment-grade fixed maturity bonds had been in a gross unrealized loss position as of December 31, 2005.
Unrealized Loss on Investment-Grade Fixed Maturity Bonds
Length of Time in Unrealized Loss Position
As of December 31, 2005
(in millions of dollars)
| Fair Value | Gross Unrealized Loss | |||||
<= 90 days | $ | 1,906.9 | $ | 28.0 | ||
> 90 <= 180 days | 2,517.3 | 70.4 | ||||
> 180 <= 270 days | 72.1 | 1.7 | ||||
> 270 <= 1 year | 187.5 | 4.5 | ||||
> 1 year <= 2 years | 8.8 | 121.7 | ||||
> 2 years <= 3 years | 1,450.9 | 83.5 | ||||
> 3 years | 96.8 | 33.7 | ||||
Totals | $ | 6,240.3 | $ | 343.5 | ||
| Fair Value of Bonds with Gross Unrealized Loss | Gross Unrealized | |||||||||||||
Due in 1 year or less | $ 109.7 | $ 3.2 | ||||||||||||
Due after 1 year up to 5 years | 2,080.8 | 207.8 | ||||||||||||
Due after 5 years up to 10 years | 6,315.8 | 1,086.7 | ||||||||||||
Due after 10 years | 9,572.7 | 2,021.3 | ||||||||||||
Subtotal | 18,079.0 | 3,319.0 | ||||||||||||
Mortgage/Asset-Backed Securities | 346.1 | 55.1 | ||||||||||||
Total | $ 18,425.1 | $ 3,374.1 | ||||||||||||
Of the $3,374.1 million in gross unrealized losses at December 31, 2008, $2,719.0 million, or 80.6 percent, are related to investment-grade fixed maturity bonds and result primarily from increases in interest rates or changes in market or sector credit spreads which occurred subsequent to acquisition of the bonds.
Index to Financial Statements
The following table showstwo tables show the length of time the Company’sour investment-grade and below-investment-grade fixed maturity bonds had been in a gross unrealized loss position as of December 31, 2005.2008 and at the end of the prior four quarters. The fair value and gross unrealized losses are categorized by the relationshiprelationships of the current fair value to amortized cost for those securities on December 31, 2005. The fair value to amortized cost relationships are not necessarily indicative of the fair value to amortized cost relationships for the securities throughout the entire time that the securities have been in an unrealized loss position nor are they necessarily indicative of the relationships subsequent toafter December 31, 2005.2008. As is shown in the time period progression, the elevated level of unrealized losses occurred during the third and fourth quarters of 2008. The increase in unrealized losses during the third and fourth quarters of 2008 results primarily from the significant widening of credit spreads that occurred in the overall market.
Unrealized Loss on Investment-Grade Fixed Maturity Bonds
Length of Time in Unrealized Loss Position
As of December 31, 2008
(in millions of dollars)
| 2008 | 2007 | ||||||||||||||
| December 31 | September 30 | June 30 | March 31 | December 31 | |||||||||||
Fair value < 100% >= 70% of amortized cost | |||||||||||||||
<= 90 | $ | 171.3 | $ | 286.8 | $ | 95.8 | $ | 110.7 | $ | 8.7 | |||||
> 90 < 180 | 335.1 | 223.2 | 108.7 | 23.5 | 14.4 | ||||||||||
> 180 < 270 | 271.8 | 215.9 | 24.4 | 29.7 | 48.7 | ||||||||||
> 270 < 1 year | 292.9 | 50.7 | 23.9 | 85.3 | 35.4 | ||||||||||
> 1 year < 2 years | 461.4 | 449.7 | 265.4 | 161.6 | 198.5 | ||||||||||
> 2 years < 3 years | 196.7 | 477.7 | 479.6 | 403.0 | 154.2 | ||||||||||
> 3 years | 404.2 | 389.9 | 125.1 | 113.1 | 295.9 | ||||||||||
Sub-total | 2,133.4 | 2,093.9 | 1,122.9 | 926.9 | 755.8 | ||||||||||
Fair value < 70% >= 40% of amortized cost | |||||||||||||||
<= 90 | - | 4.8 | - | - | - | ||||||||||
> 90 < 180 | 1.6 | 1.2 | - | - | - | ||||||||||
> 180 <= 270 | 35.7 | 18.5 | - | - | - | ||||||||||
> 270 <= 1 year | 68.9 | - | - | - | - | ||||||||||
> 1 year <= 2 years | 209.6 | 54.3 | - | - | - | ||||||||||
> 2 years <= 3 years | 57.9 | 36.3 | 5.6 | 0.6 | 0.4 | ||||||||||
> 3 years | 162.0 | 55.2 | 48.3 | 31.6 | 25.3 | ||||||||||
Sub-total | 535.7 | 170.3 | 53.9 | 32.2 | 25.7 | ||||||||||
Fair Value < 40% | |||||||||||||||
> 270 <= 1 year | 6.3 | - | - | - | - | ||||||||||
> 1 year <= 2 years | 31.3 | - | - | - | - | ||||||||||
> 2 years <= 3 years | 11.7 | - | - | - | - | ||||||||||
> 3 years | 0.6 | - | - | - | - | ||||||||||
Sub-total | 49.9 | - | - | - | - | ||||||||||
Total | $ | 2,719.0 | $ | 2,264.2 | $ | 1,176.8 | $ | 959.1 | $ | 781.5 | |||||
Index to Financial Statements
Unrealized Loss on Below-Investment-Grade Fixed Maturity Bonds
Length of Time in Unrealized Loss Position
As of December 31, 20052008
(in millions of dollars)
| Fair Value | Gross Unrealized Loss | |||||
<= 90 days | ||||||
fair value < 100% >= 70% of amortized cost | $ | 131.5 | $ | 3.2 | ||
> 90 <= 180 days | ||||||
fair value < 100% >= 70% of amortized cost | 114.1 | 5.2 | ||||
> 180 <= 270 days | ||||||
fair value < 100% >= 70% of amortized cost | 61.1 | 3.7 | ||||
> 270 <=1 year | ||||||
fair value < 100% >= 70% of amortized cost | 256.4 | 28.3 | ||||
fair value < 70% >= 40% of amortized cost | 24.2 | 15.2 | ||||
Subtotal | 280.6 | 43.5 | ||||
> 1 year <= 2 years | ||||||
fair value < 100% >= 70% of amortized cost | 95.7 | 7.9 | ||||
> 2 years <= 3 years | ||||||
fair value < 100% >= 70% of amortized cost | 9.6 | 0.4 | ||||
> 3 years | ||||||
fair value < 100% >= 70% of amortized cost | 200.3 | 19.1 | ||||
fair value < 70% >= 40% of amortized cost | 5.7 | 4.8 | ||||
Subtotal | 206.0 | 23.9 | ||||
Totals | $ | 898.6 | $ | 87.8 | ||
| 2008 | 2007 | ||||||||||||||
| December 31 | September 30 | June 30 | March 31 | December 31 | |||||||||||
Fair value < 100% >= 70% of amortized cost | |||||||||||||||
<= 90 | $ | 25.6 | $ | 11.5 | $ | 2.7 | $ | 7.9 | $ | 5.6 | |||||
> 90 < 180 | 48.7 | 10.5 | 8.8 | 8.1 | 11.4 | ||||||||||
> 180 < 270 | 42.2 | 27.6 | 12.5 | 22.5 | 19.9 | ||||||||||
> 270 < 1 year | 16.3 | 19.4 | 12.6 | 30.4 | 11.3 | ||||||||||
> 1 year < 2 years | 39.8 | 88.7 | 46.0 | 23.9 | 19.3 | ||||||||||
> 2 years < 3 years | 0.4 | 14.5 | 31.1 | 38.4 | 40.7 | ||||||||||
> 3 years | 26.6 | 30.1 | 37.6 | 12.0 | 15.7 | ||||||||||
Sub-total | 199.6 | 202.3 | 151.3 | 143.2 | 123.9 | ||||||||||
Fair value < 70% >= 40% of amortized cost | |||||||||||||||
> 90 < 180 | 17.5 | - | 2.2 | - | - | ||||||||||
> 180 <= 270 | 32.3 | 2.6 | - | 1.6 | - | ||||||||||
> 270 <= 1 year | 18.4 | 3.5 | 13.9 | 13.8 | - | ||||||||||
> 1 year <= 2 years | 160.8 | 19.9 | 7.5 | - | - | ||||||||||
> 2 years <= 3 years | 28.1 | 8.4 | 25.0 | 39.2 | 7.9 | ||||||||||
> 3 years | 67.5 | 54.7 | 22.0 | 10.5 | - | ||||||||||
Sub-total | 324.6 | 89.1 | 70.6 | 65.1 | 7.9 | ||||||||||
Fair Value < = 40% | |||||||||||||||
> 180 <= 270 | 6.2 | - | - | - | - | ||||||||||
> 270 <= 1 year | 15.3 | - | - | - | - | ||||||||||
> 1 year <= 2 years | 26.8 | 36.5 | - | - | - | ||||||||||
> 2 years <= 3 years | 37.1 | 21.8 | - | - | - | ||||||||||
> 3 years | 45.5 | 28.6 | - | - | - | ||||||||||
Sub-total | 130.9 | 86.9 | - | - | - | ||||||||||
Total | $ | 655.1 | $ | 378.3 | $ | 221.9 | $ | 208.3 | $ | 131.8 | |||||
Index to Financial Statements
As of December 31, 2005, the Company2008, we held two102 fixed maturity securities with a gross unrealized loss of $10.0 million or greater, as shown in the chart below.
Gross Unrealized Losses on Fixed Maturity BondsSecurities
$10.0 Million or Greater
As of December 31, 20052008
(in millions of dollars)
Fixed Maturity Bonds | Fair Value | Gross Unrealized Loss | Length of Time in a | |||||
| Investment-Grade | ||||||||
Principal Protected Equity Linked Note | $ | 43.9 | $ | 26.4 | > 3 years | |||
| Below-Investment-Grade | ||||||||
U.S. Based Automobile Manufacturer | $ | 33.2 | $ | 13.1 | > 270 days <= 1 year | |||
Classification | Fair Value | Gross Unrealized Loss | Number of Issuers | |||||
Investment-Grade | ||||||||
Utilities | $ | 1,064.7 | $ | 294.6 | 20 | |||
Financial Institutions | 326.5 | 239.5 | 11 | |||||
Capital Goods | 665.2 | 223.5 | 13 | |||||
Consumer Cyclical | 265.7 | 125.2 | 8 | |||||
Consumer Non-Cyclical | 509.6 | 112.2 | 8 | |||||
Basic Industry | 255.0 | 109.0 | 5 | |||||
Communications | 208.3 | 97.1 | 6 | |||||
Energy | 389.7 | 95.5 | 6 | |||||
U.S. Government Agencies | 560.2 | 61.2 | 1 | |||||
Transportation | 61.0 | 23.2 | 1 | |||||
Technology | 37.6 | 12.3 | 1 | |||||
Total | $ | 4,343.5 | $ | 1,393.3 | 80 | |||
Below-Investment-Grade | ||||||||
Communications | $ | 86.3 | $ | 89.7 | 5 | |||
Consumer Cyclical | 58.8 | 75.6 | 4 | |||||
Basic Industry | 64.2 | 65.2 | 4 | |||||
Capital Goods | 68.4 | 22.7 | 2 | |||||
Technology | 19.1 | 22.0 | 2 | |||||
Consumer Non-Cyclical | 42.3 | 21.0 | 2 | |||||
Financial Institutions | 6.1 | 12.9 | 1 | |||||
Energy | 20.9 | 12.0 | 1 | |||||
Utilities | 42.3 | 10.9 | 1 | |||||
Total | $ | 408.4 | $ | 332.0 | 22 | |||
Unrealized losses on investment-grade fixed maturity securities principally relate to changes in interest rates or changes in market or sector credit spreads which occurred subsequent toafter the acquisition of the securities. These changes are generally temporary and are not recognized as realized investment losses unless the securities are sold, it becomes unlikely that the Companywe will hold the securities until recovery based on relevant facts and circumstances, or the securities become other than temporarily impaired. Generally, below-investment-grade fixed maturity securities are more likely to develop credit concerns. As previously discussed under “Critical Accounting Policies” contained herein, inIn determining whether a decline in fair value below amortized cost of a fixed maturity security is other than temporary, the Company utilizeswe utilize a formal, well-defined, and disciplined process to monitor and evaluate itsour fixed income investment portfolio. The process results in a thorough evaluation of problem investments and the recording of realized losses on a timely basis for investments determined to have an other than temporary impairment. See previous discussion of our other than temporary impairment analysis under “Critical Accounting Estimates” contained in this Item 7.
Index to Financial Statements
For those fixed maturity securities with an unrealized loss and on which the Company haswe have not recorded an impairment loss, the Company believeswe believe that the decline in fair value below amortized cost is temporary. The Company hasWe have the ability and intent to hold itsour securities to the earlier of recovery or maturity and intends to hold all of its fixed maturity investments until maturity to meet its liability obligations.maturity. If information becomes available that changes the Company’sour assessment as to whether the Companywe will receive contractual payments related to a fixed maturity security and the security is also not projected to recover in value, the related security is generally sold. The CompanyWe may also in certain circumstances sell a security in an unrealized loss position because of changes in tax laws, when a merger or the disposition of a segment or product line results in position levelspositions outside of the Company’sour investment guidelines, due to changes in regulatory or capital requirements, due to unexpected changes in liquidity needs, to better match portfolio cash flows, or to take advantage of relative value opportunities or tender offers that recover up to or beyond the cost of the investment.
Gross Unrealized Losses on Fixed Maturity Securities
$20.0 Million or Greater
As of December 31, 2008
(in millions of dollars)
Fixed Maturity Bonds | Fair Value | Gross Unrealized Loss | Length of Time in a Loss Position | |||||
Investment-Grade | ||||||||
Principal Protected Equity Linked Trust Certificates | $ | 50.3 | $ | 28.8 | > 180 <= 270 days | |||
U.S. Based Insurance and Financial Services Company | 15.6 | 37.6 | > 1 year <= 2 years | |||||
Global Building Materials Company | 60.3 | 29.6 | > 1 year <= 2 years | |||||
Global Building Materials Company | 38.0 | 26.0 | > 1 year <= 2 years | |||||
U.S. Based Retail Company | 35.2 | 25.3 | > 1 year <= 2 years | |||||
U.S. Based Retail Company | 51.1 | 24.0 | > 1 year <= 2 years | |||||
Canadian Based Railroad Company | 61.0 | 23.2 | > 1 year <= 2 years | |||||
U.S. Based Forest Products Company | 57.8 | 20.2 | > 1 year <= 2 years | |||||
U.K. Based Financial Institution | 51.8 | 35.9 | > 2 years <= 3 years | |||||
U.K. Based Financial Institution | 43.5 | 32.1 | > 2 years <= 3 years | |||||
U.S. Based Metals and Mining Company | 61.8 | 23.8 | > 2 years <= 3 years | |||||
U.S. Government Sponsored Mortgage Funding Company | 560.2 | 61.2 | > 3 years | |||||
Canadian Based Metals and Mining Company | 64.2 | 36.7 | > 3 years | |||||
U.S. Based Media Conglomerate | 42.1 | 30.6 | > 3 years | |||||
U.S. Based Building Materials Company | 49.0 | 25.6 | > 3 years | |||||
U.S. Based Electric Utility Company | 54.0 | 25.2 | > 3 years | |||||
Netherlands Based Financial Institution | 43.1 | 25.2 | > 3 years | |||||
U.S. Based Food and Agricultural Company | 106.4 | 22.7 | > 3 years | |||||
U.S. Based Electric Utility Company | 57.7 | 22.5 | > 3 years | |||||
U.S. Based Power Tool Manufacturing Company | 78.2 | 20.2 | > 3 years | |||||
Total | $ | 1,581.3 | $ | 576.4 | ||||
Below-Investment-Grade | ||||||||
U.S. Based Recreational Products Company | $ | 10.6 | $ | 20.8 | > 270 days <= 1 year | |||
U.S. Based Media Conglomerate | 4.6 | 35.1 | > 3 years | |||||
U.S. Based Automotive Supply Company | 17.7 | 23.7 | > 3 years | |||||
Canadian Based Metals and Mining Company | 18.8 | 21.0 | > 3 years | |||||
Total | $ | 51.7 | $ | 100.6 | ||||
For those securities with a gross unrealized loss of $10.0$20.0 million or greater, further discussed as follows are (a) the factors which the Company believeswe believe resulted in the impairment and (b) the information the Companywe considered, both positive and negative, in reaching the conclusion that the impairments were not other than temporary. We believe the decline in
Index to Financial Statements
fair value of these securities is temporary, and we have the ability to hold these securities to the earlier of recovery or maturity.
Investment-Grade Fixed Maturity Securities:
The principal protected equity linked note istrust certificates represent our investment in a zero coupon bond, issued by a large, well capitalized Fortune 500 financial services company, the returntrust which holds forward contracts to purchase shares of which is linked to a Vanguard S&P 500 index mutual fund. This bond matures on August 24, 2020 and carried the AA rating of the issuer, as determined by S&P as of December 31, 2005. This note has an embedded derivativetrust also holds a defeasance swap contract and substitutes highly ratedfor U.S. Treasury bonds in place of the underlying S&P 500 index mutual fund to provide principal protection infor the event of a significant decline in the equities market.investments. The notetrust investment derives its value from the underlying S&P 500 index mutual fund. The reductionThis security is currently at an unrealized loss because the fixed rate of accretion on the note has exceeded the rate of return on the underlying S&P 500 index fund since the purchase date of the note. Because we purchased this security at a price point in thea previous market value of this note was the result of the decline in the S&P 500 index subsequent to the purchase date of the note. Based on historical long-term returns of the S&P 500 index, the Company believesmutual fund, we believe that the value of the underlying S&P 500 index mutual fund will equate to or exceed the par value of the security at maturity.
The Company therefore believesfair value of the U.S. based insurance and financial services company securities declined primarily due to liquidity concerns specific to the company and for financial institutions in general. The company’s balance sheet is solid, and its core businesses are profitable. The company also owns marketable assets which can be sold to increase liquidity. The company is seeking approval to participate in the U.S. Treasury Department’s Capital Purchase Program under the Troubled Asset Relief Program in an effort to gain access to government funding.
The decline in the fair value of the global building materials company is due to the increased slowdown in commercial and infrastructure-related construction as well as a weak residential construction market. The company maintains adequate liquidity and owns marketable long-lived assets.
The decline in the fair value of the global building materials company is due to the increased slowdown in commercial and infrastructure-related construction as well as a weak residential construction market. While the company has acquisition-related debt that will require refinancing in the near future, it reduced this liquidity need through new debt issuance and asset sales prior to the current market pressure on credit availability. The company also owns marketable long-lived assets.
The decline in fair value of the note is temporary. The Company has the ability to hold this security to the earlier of recovery or maturity.
The fixed maturity bonds of the U.S. based automobile manufacturer are securities issued by the manufacturer and its captive finance subsidiary. The reduction in market value of these securities was primarily due to a decline in profitability and cash flowretail company is due to the competitive environment, loss of market share, high cost of raw materials, and rising employee healthcare and pension costs. The company recently announced several expense management initiatives that include plant closings, staffing reductions, and restructuring of employee healthcare and retiree benefits. The automotive companyrecent decline in consumer spending and the finance subsidiary both have substantial liquidity. The automotivedepressed economy. While concerns surrounding the retail sector and consumer spending will continue to affect performance, the company maintains its leading market position and has approximately $25 billion in cash and equivalents comparedadequate liquidity to $18 billion of debt withwithstand an average maturity of 25 years. economic downturn.
The finance subsidiary has approximately $18 billion in cash and equivalents. These securities have been in an unrealized loss position for greater than 270 days but less than one year, and the Company believes that the decline in fair value of the U.S. based retail company is due to the recent decline in consumer spending and the depressed economy. Management has reduced capital spending and has taken other appropriate steps to maintain adequate liquidity. While concerns surrounding the retail sector and consumer spending will continue to affect performance, the company has the financial strength to withstand an economic downturn.
The decline in fair value of the Canadian based railroad company securities is due primarily to its weakened financial risk profile resulting from a recent debt financed acquisition. The company’s position is strengthened by stable industry fundamentals and a favorable regulatory environment. The company has adequate access to capital markets, and it recently implemented cash preservation policies such as suspension of its share repurchase program and freezing any shareholder dividend increases. Additionally, management has stated that it will seek to improve cash flow through the implementation of operational efficiencies and a reduction in capital expenditures. Current liquidity should provide adequate coverage for near term funding requirements.
The decline in fair value of the U.S. based forest products company securities is due to lower demand and weaker pricing capabilities in the current environment. The company has adequate liquidity to meet its obligations and has a strong asset base through its ownership of 5.9 million acres of timberland.
Index to Financial Statements
The decline in the fair value of the securities of the U.K. based financial institution is primarily the result of the global credit crisis and the slowdown in the economy. In addition, a major acquisition at the peak of the credit cycle required this institution to realize impairments in loans and other assets, resulting in the need for additional capital. This capital was initially provided by shareholders and others, but as the economic environment deteriorated further, the company participated in the U.K. government guarantee of senior debt and capital injections in the form of preferred and common equity. Currently, the company is 58 percent owned by the U.K. government. Its current strategy is to reduce risk on its balance sheet and make asset sales as the market improves.
The decline in the fair value of the securities of the U.K. based financial institution is primarily the result of the global credit crisis and the slowdown in the economy. The company is well diversified and has global market operations in capital markets, asset-backed securities, wealth management, asset management, commodities, and insurance. The company has recently raised capital apart from the U.K. government program and purchased capital market businesses. The company eliminated its dividend during 2008 to accumulate additional capital.
The decline in the fair value of the securities of the U.S. based metals and mining company is due to the increased slowdown in global economic activity, resulting in lower commodity prices and earnings pressure for the sector. The company continues to proactively adjust its production activities to preserve its liquidity and manage through the current economic downturn. The company also owns marketable long-lived assets.
The fixed maturity securities of the U.S. government sponsored mortgage funding company were issued by the Federal Home Loan Mortgage Corporation. The securities were rated AAA by S&P as of December 31, 2008, with no negative outlook by rating agencies. The decline in the fair value of these securities is temporary. The Company hasrelates to changes in interest rates subsequent to purchase of the ability to hold these securities as well as concerns related to the earliermortgage market.
The decline in fair value of recovery or maturity.the Canadian based metals and mining company securities is due to the increased slowdown in global economic activity, resulting in lower commodity prices and earnings pressure for the sector. The company’s credit profile has been strengthened due to its recent acquisition by a larger, more diversified metals and mining company. The company also owns marketable long-lived assets. The company has adequate liquidity and free cash flow from operations.
The fair value of the U.S. based media conglomerate securities declined due to general widening of credit spreads in the media industry, particularly among companies sensitive to the cyclical advertising market. The company generates significant free cash flow, maintains a sizeable cash balance, and owns interests in various media businesses that provide additional liquidity.
The decline in fair value of the U.S. based building materials company securities is due to the ongoing weakness in the residential and remodeling markets. The company has adequate liquidity and maintains free cash flow given its low capital expenditure requirements.
The decline in the fair value of the U.S. based electric utility company securities is primarily due to the general widening of credit spreads in the corporate bond market. The company is located in a growing service territory, and recent regulatory decisions have been favorable to its business.
The decline in the fair value of the Netherlands based financial institution securities is due to the overall widening of credit spreads in the corporate bond market. The company is one of the largest and strongest banks in the Netherlands. The company’s Tier 1 capital, which is seen as the core measure of a bank’s financial strength, is indicative of a well capitalized financial institution.
The fair value of the U.S. based food and agricultural company securities declined primarily due to a general widening of credit spreads in the market, exacerbated by the securities’ very long-term maturity dates. The company has strong operating cash flows and is free cash flow positive.
Index to Financial Statements
The decline in the fair value of the U.S. based electric utility company securities is primarily due to the general widening of credit spreads in the investment-grade corporate bond market. The company operates a fully regulated business with no retail competition. The company’s customer base is expected to grow due to the expansion of a military base located within its service territory. Liquidity remains adequate.
The decline in fair value of the U.S. based power tools manufacturing company securities results primarily from weak consumer demand. Despite declining demand, the company continues to maintain positive earnings and cash flow. The company has sufficient liquidity and no near-term refinancing needs.
Below-Investment-Grade Fixed Maturity Securities:
The Company’s investmentdecline in mortgage-backedfair value of the U.S. based recreational products company securities results from a significant decline in consumer durable goods spending. The company operates in highly cyclical industries, and demand for its products has deteriorated rapidly. The company entered the current economic downturn with a significant cash balance and still retains adequate liquidity to manage through the current economic cycle.
The fair value of the U.S. based media conglomerate securities declined due to the increase in leverage from a leveraged buyout transaction, as well as a general widening of credit spreads in the media industry. The company is expected to continue to generate sufficient cash flow to service its debt obligations, and it has ownership interests in a variety of media businesses that could be sold to further reduce leverage.
The fair value of the securities of the U.S. based automotive supply company declined due to lower vehicle production from multiple domestic automobile manufacturers. The company maintains a significant amount of cash and liquidity to manage through the current economic cycle, with limited near-term debt maturities. The company has a dominant position in its markets.
The decline in fair value of the Canadian based metals and mining company is due to the increased slowdown in global economic activity, resulting in lower commodity prices and earnings pressure for this sector. As part of its diversification strategy, the company recently increased its leverage due to an acquisition prior to the current market pressure on credit availability. The company has ample cash flow to significantly reduce its debt burden in the coming year, which should allow for a timely refinance or extension of its bridge debt. The company also owns marketable long-lived assets.
Our mortgage/asset-backed securities waswere approximately $4.2$3.7 billion and $3.8$4.0 billion on an amortized cost basis at December 31, 20052008 and 2004,2007, respectively. At December 31, 2005,2008, the mortgage-backedmortgage/asset-backed securities had an average life of 7.93.79 years, and effective duration of 4.5 years.4.04 years, and a weighted average credit rating of AAA. The mortgage-backed and mortgage/asset-backed securities are valued on a monthly basis using valuations supplied by the brokerage firms that are dealers in these securities.securities as well as independent pricing services. The primary risk involved in investing in mortgage-backedmortgage/asset-backed securities is the uncertainty of the timing of cash flows from the underlying loans due to prepayment of principal with the possibility of reinvesting the funds in a lower interest rate environment. The Company usesWe use models which incorporate economic variables and possible future interest rate scenarios to predict future prepayment rates. The Company hastiming of prepayment cash flows may also cause volatility in our recognition of investment income. We recognize investment income on these securities using a constant effective yield based on projected prepayments of the underlying loans and the estimated economic life of the securities. Actual prepayment experience is reviewed periodically, and effective yields are recalculated when differences arise between prepayments originally projected and the actual prepayments received and currently projected. The effective yield is recalculated on a retrospective basis, and the adjustment is reflected in net investment income.
We have not invested in mortgage-backed derivatives, such as interest-only, principal-only, or residuals, where market values can be highly volatile relative to changes in interest rates. All of our mortgage-backed securities have fixed rate coupons. The credit quality of our mortgage-backed securities portfolio has not been negatively impacted by the recent issues in the market concerning subprime mortgage loans. The change in value of our mortgage-backed securities portfolio has moved in line with that of prime agency-backed mortgage-backed securities.
Index to Financial Statements
As of December 31, 2005, the Company’s2008, our exposure to below-investment-grade fixed maturity securities was $2,180.7$1,633.9 million, approximately 6.04.6 percent of the faircarrying value of invested assets excluding ceded policy loans, compared to 6.4 percent at the end of 2004.loans. Below-investment-grade bonds are inherently more risky than investment-grade bonds since the risk of default by the issuer, by definition and as exhibited by bond rating, is higher. Also, the secondary market for certain below-investment-grade issues can be highly illiquid. Additional downgrades may occur, during 2006, but the Company doeswe do not anticipate any liquidity problem caused by itsour investments in below-investment-grade securities, nor does itdo we expect these investments to adversely affect itsour ability to hold itsour other investments to maturity.
The Company hasWe have a significant interest in, but isare not the primary beneficiary of, a special purpose entity which is a collateralized bond obligation asset trust (CBO) in which the Company holdswe hold interests in several of the tranches and for which the Company actswe act as investment manager of the underlying high-yield securities. The Company’sThis entity is a cash flow CBO and was fully funded at the time of issuance. Our potential losses in this CBO are limited to our investment in the entity. Our investment in this entity is reported at fair value with fixed maturity securities in the consolidated statements of financial condition.balance sheets. The fair value of this investment was derived from the fair value of the underlying assets. The fair value and amortized cost of this investment were $21.5$2.5 million and $21.0$2.4 million, respectively, at December 31, 2005,2008, and $25.6$12.0 million and $24.8$11.8 million, respectively, at December 31, 2004.
Mortgage Loans and Real Estate
The Company’sOur mortgage loan portfolio was $739.4$1,274.8 million and $498.2$1,068.9 million on an amortized cost basis at December 31, 20052008 and 2004,2007, respectively. The Company believes itsOur mortgage loan portfolio is comprised entirely of commercial mortgage loans. We expect that we will continue to add investments in this category either through the secondary market or through loan originations. We believe our mortgage loan portfolio is well diversified geographically and among property types. The incidence of problem mortgage loans and foreclosure activity remains low, and management expectsis currently low. Due to conservative underwriting, we expect the level of delinquencies and problem loans to remain low inrelative to the future.industry. At December 31, 2008, delinquent mortgage loans, or those past due more than 30 days as to interest or principal payments, totaled $5.2 million and were considered impaired loans. The Companyimpaired loans were deemed permanently impaired and are reported at the estimated net realizable value. We had no restructureddelinquent or delinquentimpaired mortgage loans at December 31, 2005 or 2004.
The Company invested in commercial mortgage loans during 20052007 and expects that during 2006 it will continue to add investments in this category either through the secondary market or through loan originations.
Real estate was $18.2 million and $27.4 million at December 31, 2005 and 2004, respectively. Investment real estate is carried at cost less accumulated depreciation. Real estate acquired through foreclosure is valued at fair value at the date of foreclosure and may be classified as investment real estate if it meets the Company’s investment criteria. If investment real estate is determined to be permanently impaired, the carrying amount of the asset is reduced to fair value. Occasionally, investment real estate is reclassified to real estate held for sale when it no longer meets the Company’s investment criteria. Real estate held for sale, which is valued net of a valuation allowance that reduces the carrying value to the lower of cost or fair value less estimated cost to sell, was $6.7 million at December 31, 2005 and $6.2 million at December 31, 2004.
The Company uses a comprehensive rating system to evaluate the investment and credit risk of each mortgage loan and to identify specific properties for inspection and reevaluation. The Company establishes an investment valuation allowance for mortgage loans based on a review of individual loans and the overall loan portfolio, considering the value of the underlying collateral. Investment valuation allowances for real estate held for sale are established based on a review of specific assets. If a decline in value of a mortgage loan or real estate investment is considered to be other than temporary or if the asset is deemed permanently impaired, the investment is reduced to estimated net realizable value, and the reduction is recognized as a realized investment loss. Management monitors the risk associated with these invested asset portfolios and regularly reviews and adjusts the investment valuation allowance. At December 31, 2005, the balance in the valuation allowances for real estate was $7.6 million. No valuation allowance was held for mortgage loans at December 31, 2005.
2008 or 2007.
DerivativesDerivative Financial Instruments
The Company usesWe use derivative financial instruments to manage reinvestment risk, duration, and currency risk. Historically, the Company haswe have utilized interest rate futures contracts, current and forward interest rate swaps and options on forward interest rate swaps, current and forward currency swaps, interest rate forward contracts, forward treasury locks, currency forward contracts, and forward contracts on specific fixed income securities. All of these freestanding derivative transactions are hedging in nature and not speculative. Positions under the Company’sour hedging programs for derivative activity that were open during 20052008 involved current and forward interest rate swaps, current and forward currency swaps, currency forward contracts, forward treasury locks, currency forward contracts, and options on forward interest rate swaps.
Almost all hedging transactions involving product portfolios are associated with the individual and group long-term care and the individual and group income protectiondisability products. All other product portfolios are periodically reviewed to determine if hedging strategies would be appropriate for risk management purposes.
During the years ended December 31, 2005, 2004, and 2003, the Company recognized net gains of $120.7 million, $29.1 million, and $79.6 million, respectively, on the termination of cash flow hedges and reported $121.0 million, $29.2 million and $79.1 million, respectively, in other comprehensive income and $(0.3) million, $(0.1) million, and $0.5 million as a component of realized investment gains and losses. The Company amortized $21.8 million, $20.7 million, and $17.3 million of net deferred gains into net investment income in 2005, 2004, and 2003, respectively.
The Company’sOur current credit exposure on derivatives, which is limited to the value of those contracts in a net gain position less collateral held, was $63.4$37.7 million at December 31, 2005. Additions and terminations, in notional amounts,2008. The carrying value of fixed maturity securities pledged as collateral to the Company’s hedging programs during 2005 were $1,269.4 million and $1,458.8 million, respectively. Additions and terminations in 2004 were $1,706.6 million and $911.9 million, respectively. Additions and terminations include roll activity, which is the closing out of an old contract and initiation of a new one when a contract is about to
mature but the need for it still exists. The notional amount of derivatives outstanding under the hedge programsour counterparties was $4,606.5$107.9 million at December 31, 20052008. We believe that our credit risk is mitigated by our use of multiple counterparties, all of whom are rated A or better by both Moody’s and $4,795.9 million at December 31, 2004.
During 2005, the Company initiated a derivatives strategy to hedge the foreign currency risk associated with the U.S. dollar denominated debt issued by one of its U.K. subsidiaries. As of December 31, 2005, the Company had $400.0 million notional amount of currency swaps and $216.3 million notional amount of forward currency contracts outstanding under this program.
As of December 31, 2005 and 2004, the Company had $684.5 million and $707.3 million, respectively, notional amount of open current and forward foreign currency swaps to hedge fixed income Canadian dollar denominated securities the Company retained after the saleS&P. See Note 5 of the Canadian branch.
As of December 31, 2005 and 2004, the Company had $348.0 million and $785.0 million, respectively, notional amount of open options on forward interest rate swaps under the hedging program used“Notes to lockConsolidated Financial Statements” contained herein in a reinvestment rate floorItem 8 for the reinvestment of cash flows from renewals on policies with a one to two year minimum premium rate guarantee.
The Company also has embedded derivatives in modified coinsurance contracts recognized under DIG Issue B36. The derivatives recognized under DIG Issue B36 are not designated as hedging instruments, and the change in fair value is reported as a realized investment gain or loss during the period of change. Due to the change in fair value of these embedded derivatives, the Company recognized $7.9 million of net realized investment losses during 2005 and $88.6 million, and $0.8 million of net realized investment gains during 2004 and 2003, respectively.
additional information.
Non-current InvestmentsOther
The Company’sOur exposure to non-current investments, totaled $29.5 million at December 31, 2005, or 0.1 percent of invested assets excluding ceded policy loans, compared to $91.5 million at December 31, 2004. Non-current investments are those investments for which principal and/or interest payments are more than thirty days past due. At December 31, 2005 these investments, which are subject to the same review and monitoring procedures in place for other investments in determining when a decline in fair value is other than temporary, consisted of fixed maturity securities for which before-tax impairment losses of approximately $107.6 million had been recorded life-to-date. The amortized cost of these investments was $5.7 million. Approximately $28.8 million of the fixed maturity securities, on a fair value basis, had principal and/or interest payments past due for a period greater than one year.
Other
The Company has an investment program wherein it simultaneously enters into repurchase agreement transactionstotaled $11.8 million and reverse repurchase agreement transactions with the same party. The Company nets the related receivables and payables in the consolidated statements of financial condition as these transactions meet the requirements for the right of offset. As of December 31, 2005, the Company had $729.7$2.6 million face value of these agreements in an open position that were offset. The Company also uses the repurchase agreement market as a source of short-term financing. The Company had no contracts for this purpose outstanding at December 31, 2005.2008 and 2007, respectively.
Index to Financial Statements
Liquidity and Capital Resources
The Company’sOur liquidity requirements are met primarily by cash flows provided from operations, principally in itsour insurance subsidiaries. Premium and investment income, as well as maturities and sales of invested assets, provide the primary sources of cash. Debt and/or securities offerings provide an additional source of liquidity. Cash is applied to the payment of policy benefits, costs of acquiring new business (principally commissions), operating expenses, and taxes, as well as purchases of new investments. The Company has
We have established an investment strategy that management believeswe believe will provide for adequate cash flows from operations. We attempt to match our asset cash flows and durations with expected liability cash flows and durations to meet the funding requirements of our business. However, further deterioration in the credit market could delay our ability to sell our positions in certain of our fixed maturity securities in a timely manner, which may negatively impact our cash flows. Furthermore, if we experience defaults on securities held in the investment portfolios of our insurance subsidiaries, this will negatively impact statutory capital, which could reduce our insurance subsidiaries’ capacity to pay dividends to our holding companies. A reduction in dividends to our holding companies could force us to seek external financing to avoid impairing our ability to pay our stockholder dividends or meet our debt and other payment obligations.
The Company’sOur policy benefits are primarily in the form of claim payments, and the Company therefore haswe have minimal exposure to the policy withdrawal risk associated with deposit products such as individual life policies or annuities. The Company’s cash flows from operations could be negatively impacted by aA decrease in demand for the Company’sour insurance products or an increase in the incidence of new claims or the duration of existing claims.
Cash flow could alsoWe have met all minimum pension funding requirements set forth by ERISA. We expect to make a voluntary contribution of approximately $70.0 million in 2009 to our U.S qualified defined benefit pension plan, based on current tax law. We have evaluated the Pension Protection Act of 2006 which requires companies to fully fund defined benefit pension plans over a seven year period and have made estimates of amounts to be negatively impacted by a deteriorationfunded in the future. Based on this assessment, we do not believe that the funding requirements of the Pension Protection Act will cause a material adverse effect on our liquidity.
We also contribute to our U.K. pension plan sufficient to meet the minimum funding requirement under U.K. legislation. We anticipate that we will make a contribution of approximately £3.5 million during 2009.
In the near term, we expect that our need for external financing is small, but changes in our business as noted above could increase our need. Our short-term debt repayment requirements for 2009 can be met through existing cash flows. We currently anticipate that we may issue long-term debt of $150.0 million to $300.0 million during 2009, depending on market conditions and the availability and cost of financing.
In light of the recent credit market whereby the Company’s abilityturmoil, we have implemented a more conservative cash management strategy with respect to liquidate its positions in certain of its fixed maturityour securities would be impacted suchlending and commercial paper investment programs. In addition, we have a $250.0 million unsecured revolving credit facility and an open shelf registration that the Company might not be ablewe can utilize as needed to dispose of these investments in a timely manner. The Company believes itsprovide additional liquidity and financial flexibility. We believe our cash resources are sufficient to meet itsour liquidity requirements for the next twelve months.12 months and that our current level of holding company liquidity can be utilized to mitigate potential losses from defaults.
During 2009, we intend to retain sufficient capital in our traditional U.S. insurance subsidiaries to maintain a weighted average RBC ratio in excess of our stated long-term objective of 300 percent. We also intend to maintain our leverage ratio at or slightly below our target levels and maintain, as a minimum threshold, liquidity at our holding companies sufficient to cover one year of fixed charges, measured as interest expense plus common stock dividends.
The Company’s
Index to Financial Statements
Consolidated Cash Flows
Our cash flows from discontinued operations for the years ended December 31, 2004 and 2003 are combined with cash flows from continuing operations within each cash flow statement category in theour consolidated statements of cash flows.flows for the applicable periods. The absence of cash flows from discontinued operations in 2005 didhas not, nor is it expected to, materially affect liquidity and capital resources nor is it expected to do so in the future.
Consolidated Cash Flows
resources.
Operating Cash Flows
Net cash provided by operating activities was $1,503.6$1,326.1 million for the year ended December 31, 2005,2008, compared to $747.0$1,750.3 million and $1,345.2$1,431.9 million for the comparable periods of 20042007 and 2003. Included in the operating cash flows for 2004 is a cash disbursement of $707.4 million made in conjunction with the reinsurance of the Company’s individual income protection – closed block of business. During 2003, by mutual consent the Company amended existing reinsurance contracts with one of its reinsurers to transform the contracts from coinsurance to modified coinsurance arrangements. Under the terms of those amendments, the Company, as the assuming reinsurer, transferred to the ceding reinsurer cash equal to the statutory disabled life reserves of approximately $286.2 million and established a corresponding receivable. The ceding reinsurer will retain the assets backing the statutory disabled life reserves and will credit interest at a 7.00 percent effective annual rate to the Company. This 2003 cash disbursement is included in cash flows from operations.
2006, respectively. Operating cash flows are primarily attributable to the receipt of premium and investment income, offset by payments of claims, commissions, expenses, and income taxes. Premium income growth is dependent not only on new sales, but on renewals of existing business, renewal price increases, and stable persistency. Investment income growth is dependent on the growth in the underlying assets supporting the Company’sour insurance reserves and on the level of portfolio yield rates. Increases in commissions and operating expenses are attributable primarily to new sales growth and the first year acquisition expenses associated with new business. The level of paid claims is due partially to the growth and aging of the block of business and also to the general economy, as previously discussed in the operating results by segment.
Included in operating cash flows for 2008, 2007, and 2006 are voluntary pension contributions to our U.S. qualified defined benefit plan of $130.0 million, $110.0 million, and $92.0 million, respectively. We also had increased cash inflows of approximately $211.4 million in 2007 due to the reinsurance recapture of a small block of individual disability business.
The fluctuation in the income tax adjustment to reconcile net income (loss) to net cash provided by operating activities increased $231.3 millionis due primarily to the deferred tax asset established during 2008 related to the change in 2005 compared to 2004 primarily as a resultthe fair value of the utilizationDIG Issue B36 derivative and a tax benefit recognized during 2006 which resulted from the reversal of tax liabilities related to group relief benefits recognized from the use of net operating loss carryforwards during 2005losses in a foreign jurisdiction. The decrease in the “Other, Net” adjustment to reconcile net income to net cash provided by operating activities in 2008 compared to an income tax benefit in 2004the prior two years is due primarily to the 2007 and 2006 reclassification of costs related to the previously mentioned first quarterearly retirement of 2004 restructuring charges associated with the individual income protection – closed block segment.
debt to cash flows from financing activities.
Investing Cash Flows
Investing cash inflows consist primarily of the proceeds from the sales and maturities of investments. Investing cash outflows consist primarily of payments for purchases of investments. Net cash used inby investing activities was $1,633.3$424.7 million for the year ended December 31, 20052008 compared to $919.7$1,855.0 million and $2,107.9$1,222.0 million for the comparable periods of 20042007 and 2003,2006, respectively. The Company generated $575.1 million less in proceeds
Proceeds from sales and maturities of available-for-sale securities in 20052008 were consistent with the level of 2007 primarily due to an increase in bond maturities and bonds that were called at par, offset by a decrease in sales of fixed maturity securities, a lower level of proceeds from mortgage-backed securities prepayments, and the translation of investment proceeds from our U.K. operations at lower exchange rates. Proceeds from sales and maturities of other investments decreased in 2008 primarily due to lower proceeds from the sale of common stock investments and a reduction in commercial mortgage loan maturities and prepayments. The reduction in cash flows received on other investments was partially offset by higher proceeds in 2008 from terminations of derivatives within our cash flow hedging programs.
Purchases of available-for-sale securities decreased during 2008 relative to 2007 in part due to the lower exchange rate for translation of purchases within our U.K. operations and to investing more heavily in short-term investments rather than fixed maturity securities during the last half of 2008. During the first half of 2008, we invested more heavily in 2004,fixed maturity securities as we continued to transition out of short-term investments into floating rate fixed maturity securities to support the floating rate debt issued during the fourth quarter of 2007.
Index to Financial Statements
Net sales of short-term investments increased during 2008 due in part to the sale of investments to fund the $700.0 million accelerated share repurchase agreements executed one half in each of January and August 2008, as well as the transition to floating rate fixed maturity securities in lieu of short-term investments during the first half of 2008.
Proceeds from acquisitions relate to the second quarter of 2008 Unum UK acquisition of a group long-term disability claims portfolio.
We had lower proceeds from sales and maturities of available-for-sale securities in 2007 compared to 2006, primarily due to a decrease in scheduled maturities of fixed maturity securities as well as a lower level of proceeds from principal prepayments on mortgage-backed securities. Somewhat offsetting this decline was the sale of a block of available-for-sale securities to generate the liquidity needed to repurchase debt in the fourth quarter of 2007 as part of our capital redeployment plan.
Purchases of available-for-sale securities increased during 2007 in comparison to 2006, in part due to the investing of the net cash inflows of $98.8 million from the sale of GENEX and bond calls. The Company utilizedthe $211.4 million cash inflows from the reinsurance recapture. Purchases of other investments declined during 2007 relative to 2006 due to a decline in the purchase of commercial mortgage loans.
During the second quarter of 2007, a portion of the proceeds from the issuance of the 17.7 million shares of common stock was invested in short-term investments, thereby contributing to the higher purchase of short-term investments in 2007. Also, during 2004the third quarter of 2007, there was an increase in anticipationnet purchases of short-term investments to provide liquidity needed for the cash to be transferredcapital redeployment plan announced in the fourth quarter of 2007 in conjunction with the reinsurance transaction related toissuance of the individual income protection – closed block restructuring. The Company generated less in proceeds from maturitiesNorthwind Holdings debt.
Net purchases of available-for-sale securities in 2004 than in 2003, primarily due to a decrease in principal prepayments on mortgage-backed securities and bond callsshort-term investments increased during 2004. The Company received less in proceeds from sales of available-for-sale securities during 20042007 compared to 20032006 as a result of the liquidity needed for our capital redeployment plan previously discussed. During the fourth quarter of 2007, we issued $800.0 million of debt and invested the proceeds in floating rate bonds and short-term investments. Short-term investments were used as an interim investment as we sought suitable floating rate investments to support the floating rate debt. We also purchased short-term investments throughout 2007 as we anticipated the funding needed for our common stock repurchase program.
Policy loans, as reported in our consolidated balance sheet, declined during 2007 in comparison to 2006 due to the Company’s sales and subsequent purchases during 2003 related to the reduction and restructuringsurrender of its below-investment-grade portfolio.
During 2005, the Companya portion of our ceded corporate-owned life insurance block of business. The termination of this fully ceded business had no impact on our cash inflows of $8.8 million relatedor outflows.
The proceeds from dispositions in 2007 relate to the sale of Unum Limited’s Netherlands branch and cash outflows of $3.5 million related to the GENEX acquisition of Independent Review Services, Inc.
During 2004, the Company had cash inflows of $18.8 million in conjunction with the sale of its Japanese operations. In conjunction with the 2004 disposition of the Canadian branch, the Company transferred fixed maturity securities with a fair value and book value of approximately $1,099.4 million and $957.7 million, respectively, and cash of $31.7 million. While no cash was exchanged in the previously discussed 2004 Swiss Life transaction, the Company assumed reserves of approximately $279.6 million and received fixed maturity securities of approximately $259.0 million and other miscellaneous assets of approximately $5.2 million, for a net purchase price of $15.4 million. In 2004, the Company had cash outflows of $0.7 million to acquire Integrated Benefits Management.
During 2003, the Company had cash inflows of $110.0 million related to the acquisition of Sun Life. The Company also received fixed maturity securities of approximately $118.4 million and other miscellaneous assets and liabilities of approximately $20.3 million and assumed reserves of approximately $285.9 million relative to the Sun Life acquisition, for a net purchase price of $37.2 million. During 2003, the Company had $152.5 million of cash outflows related to the disposition, through reinsurance ceded, of a block of policies previously sold through trade associations.
GENEX.
Financing Cash Flows
Financing cash flows consist primarily of borrowings and repayments of debt, issuance or repurchase of common stock, and dividends paid to stockholders. Net cash providedused by financing activities was $71.0$1,049.5 million for 2005the year ended December 31, 2008 compared to $181.9net cash provided of $181.2 million for the year ended December 31, 2007 and $734.8net cash used of $157.0 million provided in 2004 and 2003, respectively.
for the year ended December 31, 2006.
During 2005,2007, Unum Group’s board of directors authorized the Company repaid $227.0repurchase of up to $700.0 million of maturing debt. Also in 2005,Unum Group common stock. In 2008, we completed our share repurchase program and purchased 29.9 million shares of Unum Group common stock for $700.0 million.
During 2008, we retired the Companyremaining $175.0 million of our 5.997% senior notes and we purchased and retired $17.8 million of our outstanding 5.859% notes. At December 31, 2008, we held $190.5 million of short-term debt, $58.3 million of which was borrowed during 2008. The remaining $132.2 million represents debt previously classified as long-term but which now has a maturity date within one year after the date of our balance sheet.
During 2008, we purchased and retired $36.6 million aggregate principal amount of our outstanding 6.85% notes due 2015.
Index to Financial Statements
During 2008, Tailwind Holdings made principal payments on its floating rate, senior secured non-recourse notes due 2036 of $10.0 million. During 2008, Northwind Holdings made principal payments of $59.3 million on its floating rate, senior secured non-recourse notes due 2037.
During 2007, we received proceeds of $399.6approximately $800.0 million, fromless debt issuance costs of 6.85% senior debentures less underwriting discounts of $4.0 million. During 2004, the Company received proceeds of $300.0$15.1 million, from the issuance of adjustable conversion-rate equity security$800.0 million aggregate principal amount of debt by Northwind Holdings. We also repurchased and/or made principal payments of $769.5 million aggregate principal amount of outstanding debt during 2007, for an aggregate cash outflow of $803.7 million including the debt repurchase costs of $34.2 million.
During 2007, we received proceeds of approximately $300.0 million and issued 17.7 million shares of common stock upon the settlement of the common stock purchase contract element of the 2004 units.
The Company’s combined offering in May 2003 provided $575.0During 2006, we received proceeds of approximately $130.0 million, in proceedsless debt issuance costs of $4.1 million, from the issuance of long-term$130.0 million aggregate principal amount of debt less underwriting discountsby Tailwind Holdings. We also repurchased and/or made principal payments of $17.2$732.0 million aggregate principal amounts of outstanding debt during 2006, for an aggregate cash outflow of $749.9 million including debt repurchase costs of $17.9 million.
During 2006, we received proceeds of approximately $575.0 million and $547.7issued 43.3 million in net proceeds from the issuanceshares of common stock. These proceeds were used primarily to increasestock upon the capitalizationsettlement of the Company’s insurance subsidiaries and to repay amounts loaned to the Company from its insurance subsidiaries. During 2003, the Company reduced short-term debt $235.0 million by repayment of reverse repurchase agreements and $20.0 million by repaymentcommon stock purchase contract element of the current portion of the medium-term notes.
2003 units.
See “Debt” as followscontained in this Item 7 for further information on the Company’s debt offerings.
information.
Cash Available from Subsidiaries
The Company is dependent uponUnum Group and certain of its intermediate holding company subsidiaries and/or finance subsidiaries depend on payments from its subsidiaries to pay dividends to its stockholders, to pay its debt obligations, andand/or to pay its expenses. These payments by the Company’sour insurance and non-insurance subsidiaries may take the form of interest payments on amounts loanedloans from the parent to such subsidiaries by the Company,a subsidiary, operating and investment management fees, and/or dividends. At December 31, 2005, the Company had outstanding
During 2008 and 2006, Unum Group received $100.0 million and $150.0 million, respectively, from its insurance subsidiaries a $150.0 millionfor the repayment of surplus debenture duedebentures previously issued to Unum Group in 1997 and in 1996. The debentures had maturity dates of October 2027 and December 2006, with a weighted average interest rate during 2005 of 8.56 percent and a $100.0 million surplus debenture due in 2027 with a weighted average interest rate during 2005 of 8.25 percent. Semi-annual interest payments are conditional upon the approval by the insurance department of the applicable state of domicile.
respectively.
Restrictions under applicable state insurance laws limit the amount of ordinary dividends that can be paid to the Companya parent company from its insurance subsidiaries in any 12-month period without prior approval by regulatory authorities. For life insurance companies domiciled in the United States, that limitation generally equals, depending on the state of domicile, either ten percent of an insurer’s statutory surplus with respect to policyholders as of the preceding year end or the statutory net gain from operations, excluding realized investment gains and losses, of the preceding year.
The payment of ordinary dividends to the Companya parent company from its insurance subsidiaries is generally further limited to the amount of statutory surplus as it relates to policyholders. Based on the restrictions under current law, during 2006, $621.42009, $653.3 million is available for the payment of ordinary dividends to the CompanyUnum Group from its traditional U.S. insurance subsidiaries.
The CompanyUnum Group and/or certain of its finance subsidiaries may also has the ability to draw a dividendreceive dividends from its U.K. insurance subsidiary,United Kingdom-based affiliate, Unum Limited. Such dividends are limited in amount, based onLimited, subject to applicable insurance company lawregulations and capital guidance in the U.K., which requires a minimum solvency margin.United Kingdom. Approximately $240.3£145.5 million is available for the payment of dividends from Unum Limited during 2006.
2009, subject to regulatory approval.
The amount available during 20052008 for the payment of ordinary dividends from the Company’sUnum Group’s traditional U.S. insurance subsidiaries was $663.3$626.5 million, of which $280.0$165.6 million was utilized.declared and paid. The traditional U.S. insurance subsidiaries also paid extraordinary dividends of $469.1 million in 2008 of which $28.2 million was declared in 2007. The amount available during 20052008 from Unum Limited was $152.5£202.1 million, of which $69.6£125.0 million was utilizeddeclared and repatriated underpaid.
Index to Financial Statements
Northwind Holdings’ and Tailwind Holdings’ ability to meet their debt payment obligations will be dependent upon the Homeland Investment Actreceipt of 2004.dividends from Northwind Re and Tailwind Re, respectively. The remaining dividendability of $385.2 millionNorthwind Re and Tailwind Re to pay dividends to their respective parent companies will depend on their satisfaction of unremitted foreign earnings repatriated in 2005 underapplicable regulatory requirements and on the Homeland Investment Actperformance of 2004 wasthe reinsured business. During 2008, Northwind Re received regulatory approval from the Company’s non-insurance U.K. subsidiaries.insurance department of its state of domicile to pay dividends of $80.6 million to Northwind Holdings, and Tailwind Re received regulatory approval from the insurance department of its state of domicile to pay dividends of $24.1 million to Tailwind Holdings.
The payment of dividends to the parent company from our subsidiaries also requires the approval of the individual subsidiary’s board of directors.
The ability of the CompanyUnum Group and certain of its intermediate holding company subsidiaries and/or finance subsidiaries to continue to receive dividends from itstheir insurance subsidiaries without regulatory approval will be dependent upongenerally depends on the level of earnings of itsthose insurance subsidiaries as calculated under law. In addition to regulatory restrictions, the amount of dividends that willmay be paid by insurance subsidiaries will depend on additional factors, such as risk-based capitalRBC ratios, funding growth objectives at an affiliate level, and maintaining appropriate capital adequacy ratios to support the ratings desired by the Company.ratings. Insurance regulatory restrictions do not limit the amount of dividends available for distribution to the Company from its non-insurance subsidiaries except where the non-insurance subsidiaries are held directly or indirectly by an insurance subsidiary and only indirectly by the Company. The Company’s risk-based capital (RBC)Unum Group. Unum Group’s RBC ratio for its traditional U.S. insurance subsidiaries, calculated on a weighted average basis using the NAIC Company Action Level formula, was 308 percent and 298approximately 332 percent at the end of 2005 and 2004, respectively.2008, with the individual RBC ratios for Unum Group’s principal traditional U.S. insurance subsidiaries all in excess of our long-term target ratio of 300 percent. The individual RBC ratios for Northwind Re and Tailwind Re, our special purpose financial captive insurance companies, are calculated using the Company’s principal operating subsidiaries ranged from 234NAIC Company Action Level formula and have a target level of 200 percent. The RBC ratios for Northwind Re and Tailwind Re were each approximately equal to the 200 percent to 447 percenttarget level at December 31, 2005.the end of 2008. The individual RBC ratio for each of our insurance subsidiarysubsidiaries is above the range that would require state regulatory action.
Debt
At December 31, 2005, the Company2008, we had long-term debt, including the adjustable conversion-rate equity security unitssenior secured notes and the junior subordinated debt securities, totaling $3,261.6$2,259.4 million and short-term debt of $190.5 million. At December 31, 2005,Short-term debt consisted of $132.2 million 5.859% senior notes due May 2009 and $58.3 million of reverse repurchase agreements. The reverse repurchase agreements were entered into during the fourth quarter of 2008, with a weighted average interest rate of 2.71 percent and a maturity date of January 20, 2009. Our leverage ratio, when calculated excluding the non-recourse debt to totaland associated capital ratioof Tailwind Holdings and Northwind Holdings, was 35.0 percent compared to 35.221.5 percent at December 31, 2004. The2008, compared to 21.4 percent at December 31, 2007. Our leverage ratio, when calculated using consolidated debt to total consolidated capital, ratio, when calculated allowingwas 26.6 percent at December 31, 2008 compared to 26.4 percent at December 31, 2007.
We monitor our compliance with our debt covenants. There are no equity credit forsignificant financial covenants associated with any of our outstanding debt obligations. A ratings downgrade from either S&P or Moody’s with respect to the Company’s“shadow” or underlying debt rating on the non-recourse debt issued by Tailwind Holdings or Northwind Holdings could cause an increase in the fee paid to the third party guarantor on those debt issuances but would not cause a breach. We remain in compliance with all debt covenants and have not observed any current trends that would cause a breach of any debt covenants.
Purchases and Retirement of Debt
During 2008, we retired the remaining $175.0 million of our 5.997% senior notes. During 2008, we made principal payments of $59.3 million and $10.0 million on our senior secured non-recourse variable rate notes issued by Northwind Holdings and Tailwind Holdings, respectively. We also purchased and retired $36.6 million of our 6.85% senior debentures due 2015 and $17.8 million of our 5.859% senior notes due May 2009.
Index to Financial Statements
In 2007, we purchased and retired $17.5 million of our outstanding 6.75% notes scheduled to mature in 2028. Pursuant to a cash tender offer, we purchased and retired $23.5 million aggregate liquidation amount of the 7.405% junior subordinated debt securities due 2038; $99.9 million aggregate principal amount of the 7.625% notes due 2011; $210.5 million aggregate principal amount of the 7.375% notes due 2032; and 50 percent equity credit$66.1 million aggregate principal amount of the 6.75% notes due 2028. We also called and retired all $150.0 million principal amount of our outstanding 7.25% notes scheduled to mature in 2032.
Also in 2007, in open market transactions, we purchased $34.5 million of our outstanding 6.85% notes due 2015 and $17.5 million of our outstanding senior secured notes issued by Tailwind Holdings. In February 2007, the scheduled remarketing of the senior note element of the 2004 units occurred, as stipulated by the terms of the original offering, and we reset the interest rate of $300.0 million of senior notes due May 15, 2009 to 5.859%. We purchased $150.0 million of the senior notes in the remarketing which were subsequently retired. In May 2007, we settled the purchase contract element of the units by issuing 17.7 million shares of common stock. We received proceeds of approximately $300.0 million from the transaction.
In 2006, pursuant to a cash tender offer, we purchased and retired $50.0 million aggregate liquidation amount of our 7.405% junior subordinated debt securities due 2038 and $250.0 million aggregate principal amount of our outstanding 7.625% notes due 2011. Also in 2006, in open market transactions, we purchased $32.0 million of our outstanding 6.85% notes due 2015.
In February 2006, the scheduled remarketing of the senior note element of the 2003 units occurred, as stipulated by the terms of the original offering, and we reset the interest rate on $575.0 million of senior notes due May 15, 2008 to 5.997%. We purchased $400.0 million of the senior notes in the remarketing which were subsequently retired. In May 2006, we settled the purchase contract element of the units by issuing 43.3 million shares of common stock. We received proceeds of approximately $575.0 million from the transaction.
Issuance of Debt
In 2007, Northwind Holdings issued $800.0 million floating rate, insured, senior, secured notes in a private offering. Recourse for the Company’s adjustable conversion-rate equity security units,payment of principal, interest, and other amounts due on the notes will be limited to the assets of Northwind Holdings, consisting primarily of the stock of its sole subsidiary Northwind Re, a Vermont special purpose financial captive insurance company. Northwind Holdings’ ability to meet its payment obligations under the notes will be dependent principally upon its receipt of dividends from Northwind Re. The ability of Northwind Re to pay dividends to Northwind Holdings will depend on its satisfaction of applicable regulatory requirements and on the performance of the reinsured claims of Provident, Paul Revere and Unum America (the ceding insurers) reinsured by Northwind Re. None of Unum Group, the ceding insurers, Northwind Re or any other affiliate of Northwind Holdings is an obligor or guarantor on the notes. The balance outstanding on these notes was 30.3 percent$740.7 million at December 31, 2005, compared2008.
In 2006, Tailwind Holdings issued $130.0 million floating rate, insured, senior, secured notes in a private offering. Recourse for the payment of principal, interest, and other amounts due on the notes will be limited to 30.2 percentthe assets of Tailwind Holdings, consisting primarily of the stock of its sole subsidiary Tailwind Re, a South Carolina special purpose financial captive insurance company. Tailwind Holdings’ ability to meet its payment obligations under the notes will be dependent principally upon its receipt of dividends from Tailwind Re. The ability of Tailwind Re to pay dividends to Tailwind Holdings will depend on its satisfaction of applicable regulatory requirements and on the performance of the reinsured claims of Unum America reinsured by Tailwind Re. None of Unum Group, Unum America, Tailwind Re or any other affiliate of Tailwind Holdings is an obligor or guarantor on the notes. The balance outstanding on these notes was $102.5 million at December 31, 2004.2008.
During the fourth quarter ofIn 2005, the CompanyUnum Group repatriated $454.8 million in unremitted foreign earnings from its U.K. subsidiaries, and as part of its repatriation plan, issued $400.0 million of 6.85% senior debentures due November 15, 2015 in a private offering.
In May 2004, the Company issued 12.0 million 8.25% adjustable conversion-rate equity security units (units) in a private offering for $300.0 million. The Company subsequently registered the privately placed securities for resale by the private investors. Each unit has a stated amount of $25 and will initially consist of (a) a contract pursuant to which the holder agrees to purchase, for $25, shares of the Company’s common stock on May 15, 2007 and which entitles the holder to contract adjustment payments at the annual rate of 3.165 percent, payable quarterly, and (b) a 1/40 or 2.5 percent ownership interest in a senior note issued by the Company due May 15, 2009 with aaggregate principal amount of $1,000, on which the Company will pay interestoutstanding was $296.7 million at the initial annual rate of 5.085 percent, payable quarterly. Upon settlement of the common stock purchase contract and successful remarketing of the senior note element of the units, the Company will receive proceeds of approximately $300.0 million and will issue between 17.7 million and 20.4 million shares of common stock.
In May 2003, the Company issued 23.0 million 8.25% adjustable conversion-rate equity security units (units) in a public offering for $575.0 million. Each unit has a stated amount of $25 and will initially consist of (a) a contract pursuant to which the holder agrees to purchase, for $25, shares of the Company’s common stock on May 15, 2006 and which entitles the holder to contract adjustment payments at the annual rate of 2.25 percent, payable quarterly, and (b) a 1/40, or 2.5 percent, ownership interest in a senior note issued by the Company due May 15, 2008 with a principal amount of $1,000, on which the Company will pay interest at the initial annual rate of 6.00 percent, payable quarterly. Upon settlement of the common stock purchase contract and successful remarketing of the senior note element of the units, the Company will receive proceeds of approximately $575.0 million and will issue between 43.3 million and 52.9 million shares of common stock. The scheduled remarketing of the senior note element of these units occurred in February 2006, as stipulated by the terms of the original offering, and theDecember 31, 2008.
Index to Financial Statements
Company issued $575.0 million of 5.997% senior notes due May 15, 2008. The Company participated in the remarketing of the units and purchased $400.0 million of the senior notes which were subsequently retired.
In 2001, the Company issued $575.0 million of 7.625% senior notes due March 1, 2011. In 2002, the CompanyUnum Group completed two long-term offerings, issuing $250.0 million of 7.375% senior debentures due June 15, 2032 and $150.0 million of 7.250% public income notes due June 15, 2032. The public income notes are redeemablewere called and retired in 2007 as previously discussed. The 7.375% notes have an aggregate principal amount outstanding of $39.5 million at the Company’s option, in whole or in part, on or after June 25, 2007. December 31, 2008.
In 2001, Unum Group issued $575.0 million of 7.625% senior notes due March 1, 2011. The aggregate principal amount outstanding was $225.1 million at December 31, 2008.
In 1998, the CompanyUnum Group completed public offerings of $200.0 million of 7.25% senior notes due March 15, 2028, $200.0 million of 7.0% senior notes due July 15, 2018, and $250.0 million of 6.75% senior notes due December 15, 2028.
None of these amounts have been reduced other than the 6.75% notes, which have an aggregate principal amount outstanding of $166.4 million at December 31, 2008.
In 1998, Provident Financing Trust I (the trust) issued $300.0 million of 7.405% capital securities in a public offering. These capital securities, which mature on March 15, 2038, are fully and unconditionally guaranteed by the Company,Unum Group, have a liquidation value of $1,000 per capital security, and have a mandatory redemption feature under certain circumstances. The CompanyUnum Group issued $300.0 million of 7.405% junior subordinated deferrable interest debentures, which mature on March 15, 2038, to Provident Financing Trust Ithe trust in connection with the capital securities offering. The sole assetssecurities issued by the trust have an aggregate principal amount outstanding of Provident Financing Trust I$226.5 million at December 31, 2008.
Unum Group has debt securities with an aggregate principal amount outstanding of $62.0 million which were initially issued in three separate series in 1990, 1993, and 1996, pursuant to an indenture dated September 15, 1990. The notes are fixed maturity rate notes with fixed maturity dates ranging between nine months to thirty years from the junior subordinated debt securities.issuance date.
Credit Facility
On December 8, 2008, we entered into $250.0 million unsecured revolving credit facility. Borrowings under the facility are for general corporate uses and are subject to financial covenants, negative covenants, and events of default that are customary. The Companyfacility has a 364 day tenor and a one year term out option. The facility provides for interest rates based on either the prime rate or LIBOR, as adjusted. Within this facility is a $100.0 million letter of credit sub-limit. At December 31, 2008, there were no amounts outstanding on the facility. Our previously existing $400.0 million credit facility expired as scheduled during 2008.
Although we believe that maintenance of the unsecured revolving credit facility provides an important source for contingent liquidity, we do not anticipate the need to access funds through the facility as we are able to meet short-term liquidity needs from operating cash flows. Our credit facility contains financial covenants regarding our leverage, net worth, interest coverage, issuer credit rating, and risk-based capital position. We do not anticipate any violation of those covenants. However, if economic conditions worsen and we incur unexpected losses, we could violate certain of the financial covenants imposed by the credit facility and lose access to available funds through that facility.
Shelf Registration
We have a shelf registration, which became effective in 2005,December 2008, with the Securities and Exchange Commission to issue various types of securities, including common stock, preferred stock, debt securities, depository shares, stock purchase contracts, units and warrants, or preferred securities of wholly-owned finance trusts up to an aggregate of $1.0 billion.trusts. If utilized, the shelf registration will enable the Companyus to raise funds from the offering of any individual security covered by the shelf registration as well as any combination thereof, subject to market conditions and the Company’sour capital needs.
See Note 8 of the “Notes to Consolidated Financial Statements” contained herein in Item 8 for additional information.
Index to Financial Statements
Commitments
Contractual debt, junior subordinated debt securities, adjustable conversion-rate equity security units, estimated policyholder liability maturities,The following table summarizes contractual obligations and estimated lease commitments areour reinsurance recoverable by period as followsof December 31, 2008 (in millions of dollars):. Excluded from the table are tax liabilities of approximately $163.2 million for which we are unable to make reasonably reliable estimates of the period of potential cash settlements, if any, with taxing authorities.
| Payments Due | Total | In 1 Year or Less | After 1 Year up to 3 Years | After 3 Years up to 5 Years | After 5 Years | |||||||||||||||||||||||||
| Total | In 1 Year or Less | After 1 Year up to 3 Years | After 3 Years up to 5 Years | After 5 Years | ||||||||||||||||||||||||||
Payments Due | ||||||||||||||||||||||||||||||
Short-term Debt | $ | 193.4 | $ | 193.4 | $ | - | $ | - | $ | - | ||||||||||||||||||||
Long-term Debt | $ | 2,087.0 | $ | — | $ | — | $ | — | $ | 2,087.0 | 4,926.3 | 143.1 | 497.1 | 251.9 | 4,034.2 | |||||||||||||||
Adjustable Conversion-rate Equity Security Units | 875.0 | — | 575.0 | 300.0 | — | |||||||||||||||||||||||||
Junior Subordinated Debt Securities | 300.0 | — | — | — | 300.0 | |||||||||||||||||||||||||
Policyholder Liabilities | 29,088.0 | 3,492.5 | 5,535.3 | 4,223.0 | 15,837.2 | 39,293.6 | 4,291.0 | 6,418.8 | 4,952.7 | 23,631.1 | ||||||||||||||||||||
Pensions and Other Postretirement Benefits | 2,156.1 | 104.0 | 187.3 | 194.2 | 1,670.6 | |||||||||||||||||||||||||
Payable for Collateral Under Derivative | ||||||||||||||||||||||||||||||
Financial Instruments | 174.3 | 174.3 | - | - | - | |||||||||||||||||||||||||
Miscellaneous Liabilities | 612.0 | 576.2 | 4.6 | 6.1 | 25.1 | |||||||||||||||||||||||||
Operating Leases | 144.7 | 34.3 | 57.6 | 26.7 | 26.1 | 95.6 | 26.6 | 37.5 | 18.0 | 13.5 | ||||||||||||||||||||
Purchase Obligations | 64.8 | 60.5 | 4.3 | - | - | |||||||||||||||||||||||||
Total | $ | 32,494.7 | $ | 3,526.8 | $ | 6,167.9 | $ | 4,549.7 | $ | 18,250.3 | $ | 47,516.1 | $ | 5,569.1 | $ | 7,149.6 | $ | 5,422.9 | $ | 29,374.5 | ||||||||||
Receipts Due | ||||||||||||||||||||||||||||||
Reinsurance Recoverable | $ | 7,636.1 | $ | 322.1 | $ | 577.0 | $ | 577.0 | $ | 6,160.0 | ||||||||||||||||||||
Short-term and long-term debt includes contractual principal and interest payments and therefore exceeds the amount shown in the consolidated balance sheet. See Note 8 of the “Notes to Consolidated Financial Statements” contained herein in Item 8 for additional information.
The Company’s policyholderPolicyholder liability maturities which are presented net ofand the related reinsurance ceded,recoverable represent the projected payout of the current inforce policyholder liabilities and the expected cash inflows from reinsurers for liabilities ceded and therefore incorporate uncertainties as to the timing and amount of claim payments. The Company utilizesWe utilize extensive liability modeling to project future cash flows from the inforce business. The primary assumptions used to project future cash flows are claim incidence rates for mortality and morbidity, claim resolution rates, persistency rates, and interest rates. These cash flows are discounted to determine the current value of the projected claim payments. The timing and amount of payments on policyholder liabilities may vary significantly from the projections above. See our previous discussion of asset/liability management under “Investments - Overview”“Investments” contained here.
During 2005,Pensions and other postretirement benefit obligations include our defined benefit pension and postretirement plans for our employees, including non-qualified pension plans. Pension plan obligations, other than the Company recorded an expense of $9.1 millionnon-qualified plans, represent our contributions to recognize a termination fee, payablethe pension plans. Amounts in the first quarterone year or less category equal our planned contributions within the next 12 months. The remaining years’ contributions are projected based on the expected future contributions as required under ERISA. Non-qualified pension plan and other postretirement benefit obligations represent the expected benefit payments related to these plans, discounted with respect to interest and reflecting expected future service, as appropriate. See Note 9 of 2006,the “Notes to exit an existing contract with an information technology provider.Consolidated Financial Statements” contained herein in Item 8 and “Critical Accounting Estimates” contained in this Item 7 for additional information.
Index to Financial Statements
Payable for collateral represents the obligation to return unrestricted cash collateral received from our counterparties in derivative transactions. The Company has entered into an agreement with a new provider whichtiming of the return of the collateral is expecteduncertain and is therefore included in the one year or less category. See Note 5 of the “Notes to resultConsolidated Financial Statements” contained herein in a significantlyItem 8 for additional information.
Miscellaneous liabilities include commissions due and accrued, deferred compensation liabilities, state premium taxes payable, amounts due to reinsurance companies, accounts payable, fair value of derivative obligations, and various other liabilities that represent contractual obligations. Obligations where the timing of the payment was uncertain were included in the one year or less costly infrastructure.category.
Operating leases include noncancelable obligations on certain office space and equipment.
At December 31, 2005 the Company had capitalPurchase obligations include commitments of approximately $71.1$37.8 million to fund certain of itsour investments in private placement fixed maturity securities and partnerships and $4.1 million for commercial mortgage loan originations. These are shown in the table above based on the expiration date of the commitments. The funds will be due upon satisfaction of contractual notice from the partnership trustee or issuer of the private placement securities or at closing of the mortgage loans. The amounts may or may not be funded. Also included are noncancelable obligations with outside parties for computer data processing services and related functions and software maintenance agreements. The aggregate obligation remaining under these agreements was $22.9 million at December 31, 2008.
Off-Balance Sheet Arrangements
As noted in the preceding discussion, we have operating lease commitments and purchase obligations totaling $95.6 million and $64.8 million, respectively, at December 31, 2008.
We maintain a committed and unsecured credit facility and letters of credit. See “Debt” contained in this item 7 for further description of this arrangement.
As part of our regular investing strategy, we receive collateral from unaffiliated third parties through transactions which include both securities lending and also short-term agreements to purchase securities with the agreement to resell them at a later specified date. For both types of transactions, we require that a minimum of 102 percent of the fair value of the securities loaned or securities purchased under repurchase agreements be maintained as collateral. Generally, cash is received as collateral under these agreements. In the event that securities are received as collateral, we are not permitted to sell or re-post them. We also post our fixed maturity securities as collateral to unaffiliated third parties through transactions including both securities lending and short-term agreements to sell securities with the agreement to repurchase them at a later specified date. At December 31, 2008, the carrying value of fixed maturity securities posted as collateral to third parties under these programs was $80.6 million.
To help limit the credit exposure of the derivatives, we enter into master netting agreements with our counterparties whereby contracts in a gain position can be offset against contracts in a loss position. We also typically enter into bilateral, cross-collateralization agreements with our counterparties to help limit the credit exposure of the derivatives. These agreements require the counterparty in a loss position to submit acceptable collateral with the other counterparty in the event the net loss position meets or exceeds an agreed upon amount. Our current credit exposure on derivatives, which is limited to the value of those contracts in a net gain position less collateral held, was $37.7 million at December 31, 2008. We post fixed maturity securities as collateral to our counterparties rather than cash. The carrying value of fixed maturity securities posted as collateral to our counterparties was $107.9 million at December 31, 2008.
Our derivatives counterparties have posted non-cash collateral in various segregated custody accounts to which we have a security interest in the event of counterparty default. This collateral, which is not reflected in the table above, had a market value of $174.6 million at December 31, 2008.
Index to Financial Statements
Ratings
A.M.AM Best, Company (AM Best), Fitch, Ratings (Fitch), Moody’s, Investors Service (Moody’s), and Standard & Poor’s Corporation (S&P)S&P are among the third parties that rateassign issuer credit ratings to Unum Group and financial strength ratings to our insurance subsidiaries. Issuer credit ratings reflect an agency’s opinion of the Company’soverall financial capacity of a company to meet its senior debt and the financial strength of the Company’s principal U.S. insurance subsidiaries.obligations. Financial strength ratings are based primarily on U.S. statutory financial information for thespecific to each individual U.S. domiciled insurance companiessubsidiary and reflect theeach rating agency’s view of the overall financial strength (capital levels, earnings, growth, investments, business mix, operating performance, and market position) of thatthe insuring entity and its ability to meet its obligations to policyholders. DebtBoth the issuer credit ratings represent the opinions of the rating agencies regarding an issuer’s ability to repay its debt and are based primarily on consolidated financial information prepared using generally accepted accounting principles. Both financial strength ratings incorporate quantitative and debt ratings incorporate qualitative analyses by rating agencies and are routinely reviewed and updated on an ongoing basis.
The Company competesWe compete based in part on the financial strength ratings provided by rating agencies. A downgrade of the Company’sour financial strength ratings can be expected to adversely affect the Company. A downgrade of the financial strength ratingsus and could potentially, among other things, adversely affect the Company’sour relationships with distributors of itsour products and services and retention of itsour sales force, negatively impact persistency and new sales, particularly large case group sales and individual sales, and generally adversely affect the Company’sour ability to compete. DowngradesA downgrade in the Company’s debt ratingsissuer credit rating assigned to Unum Group can be expected to adversely affect the Company’sour cost of capital or our ability to raise capital or its cost ofadditional capital.
In November 2004, AM Best reaffirmedThe table below reflects the Company’s ratings and commented that it would be closely monitoring the Company’s operations as to the impact of the multistate market conduct regulatory settlement. In this regard it noted that California conducted a separate examination and that there could be fines or remediation costs in addition to the charge announced by the Company in connection with the multistate settlement. AM Best stated that the maintenance of the Company’s current ratings reflected the agency’s expectation that several key financial and operational measures would be maintained.
These measures are as follows:
The Company believes that its results for the year ended December 31, 2005 are in compliance with each of these measures, as follows:
In June 2005 and again in October 2005, AM Best reaffirmed the existing financial strength rating of the Company and maintained a negative outlook. AM Best anticipates that the negative outlook will remain in effect until there is more clarity with regards to the ultimate cost of the multistate market conduct regulatory settlement agreements and the California settlement agreement and further improvement is exhibited in the financial flexibility of the parent company. In November 2005, AM Best assigned a bbb- rating to the $400.0 million 6.85% senior debentures and reaffirmed all of the Company’s remaining debt and financial strength ratings.
In the first quarter of 2004, the ratings from Fitch were placed under review for a possible downgrade due to concerns expressed about the Company’s fourth quarter of 2003 reserve strengthening for group income protection and the profitability for this line of business. In May 2004 and again in November 2004, Fitch reaffirmed all of the Company’s ratings but kept the ratings under review pending Fitch’s completion of an analysis of the Company’s reserves. In February 2005, Fitch completed its analysis, citing the material progress the Company has made in strengthening risk based capital levels, resolving the multi-state market conduct examination, and improving GAAP and statutory earnings. Fitch reaffirmed all of the Company’s ratings and revised the outlook to stable. In October 2005, Fitch again reaffirmed all of the ratings of the Company following the announcement of the settlement agreement with the California DOI. In November 2005, Fitch assigned a BBB- rating to the $400.0 million 6.85% senior debentures and reaffirmed its ratings on all outstanding debt of the Company.
In May 2004, Moody’s downgraded the Company’s senior debtissuer credit ratings to Ba1 from Baa3for Unum Group and the financial strength ratings on the Company’sfor each of our traditional insurance company subsidiaries to Baa1 from A3. The ratings outlook is “negative”. This action concluded the ratings review Moody’s initiated in February 2004. Moody’s indicated that the primary driver in the rating action was concern about the execution risk associated with the Company’s strategic plans to restore profitability to its core U.S. group long-term income protection business. Moody’s also noted that the Company had made considerable progress in improving its capital position throughout 2003. The change in the senior debt rating to Ba1 represents a below-investment-grade rating. In November 2004, Moody’s placed the Company’s senior debt credit ratings and the financial strength ratings of the Company’s insurance company subsidiaries on review for possible downgrade due to the heightened event risk associated with the issues concerning broker compensation in the employee benefit market. In April 2005, Moody’s confirmed the Company’s senior debt credit ratings and the financial strength ratings of the Company’s insurance subsidiaries while maintaining a
negative outlook. This rating action concluded the review for possible downgrade that began in November 2004. In October 2005, Moody’s reaffirmed the ratings of the Company following the announcement of the settlement agreement with the California DOI. In November 2005, Moody’s assigned a Ba1 rating to the $400.0 million 6.85% senior debentures and reaffirmed the financial strength ratings of the Company’s insurance subsidiaries.
In May 2004, S&P downgraded the Company’s counterparty credit rating and senior debt rating to BB+ from BBB- while at the same time lowering the counterparty credit and financial strength ratings on the Company’s insurance company subsidiaries to BBB+ from A-, all with a “stable” outlook, citing concerns about the consistency of risk controls and valuation practices, which S&P believes have led to reserve charges and asset impairments in the past several quarters and have also contributed to marginal operating performance in the Company’s U.S. group income protection business. The outlook reflects the effects of strengthened capital adequacy, improved investment risk, and corrective measures taken by the Company to limit the downside on the closed block of individual income protection business and to improve profitability on its U.S. group income protection insurance. The change in the senior debt rating to BB+ represents a below-investment-grade rating. In October 2005, S&P reaffirmed all of the ratings of the Company following the announcement of the settlement agreement with the California DOI. In November 2005, S&P assigned a BB+ rating to the $400.0 million 6.85% senior debentures.
The Company maintains an ongoing dialogue with these rating agencies to inform them of progress it is making regarding its strategic objectives and financial plans, as well as other issues which could impact the Company. There can be no assurance that further downgrades by these or other ratings agencies will not occur.
The table below reflects, as of the date of this filing, the senior debt ratings for the Company and the financial strength ratings for the U.S. domiciled insurance company subsidiaries.filing.
AM Best | Fitch | Moody’s | S&P | |||||
| bbb- (Good) | BBB- (Good) | Ba1 (Speculative) | |||||
Financial Strength Ratings | ||||||||
Provident Life & Accident | A- (Excellent) | A-(Strong) | Baa1 (Adequate) | |||||
Provident Life & Casualty | A- (Excellent) | Not Rated | Not Rated | |||||
Unum Life of America | A- (Excellent) | A- (Strong) | Baa1 (Adequate) | |||||
First Unum Life | A- (Excellent) | A- (Strong) | Baa1 (Adequate) | |||||
Colonial Life & Accident | A- (Excellent) | A- (Strong) | Baa1 (Adequate) | |||||
Paul Revere Life | A- (Excellent) | A- (Strong) | Baa1 (Adequate) | |||||
Paul Revere Variable | A- (Excellent) | A- (Strong) | Baa1 (Adequate) | |||||
Unum Limited | A- (Excellent) | Not Rated | Not Rated | A- (Strong) | ||||
We maintain an ongoing dialogue with the four rating agencies that evaluate us in order to inform them of progress we are making regarding our strategic objectives and financial plans, as well as other pertinent issues. A significant component of our communications involves an annual review meeting; included as well are other meetings not limited to quarterly updates regarding our business. During the second quarter of 2008, we held our annual review meetings with S&P and Moody’s. In the fourth quarter 2008, we held our annual review meetings with AM Best and Fitch.
TheseOn January 29, 2008, AM Best reaffirmed the ratings of Unum Group and its operating subsidiaries and upgraded the company’s outlook from “negative” to “stable.” The agency’s revised outlook was attributed to our increased financial flexibility, the quality of our investment portfolio, the operational execution of our operating segments, and the completion of the claim reassessment process. On February 4, 2008, Fitch revised its outlook for Unum Group and its operating subsidiaries to “positive” from “stable,” citing our progress in increasing profitability and decreasing risk along with our improved capitalization levels as the basis for the upgrade. On February 14, 2008, Moody’s revised its outlook for Unum Group and its operating subsidiaries to “stable” from “negative,” basing its revision on the overall improvement in our financial flexibility.
Index to Financial Statements
On July 17, 2008, S&P raised its counterparty credit and senior unsecured debt rating on Unum Group from “BB+” to “BBB-” and raised its counterparty credit and financial strength ratings on Unum Group’s insurance subsidiaries from “BBB+” to “A-”. S&P stated that the rating actions were reflective of the maintenance of our market position, the improved insurance risk profile of the company, our operating profitability, the enhanced investments quality of our portfolio, and our stronger capitalization through statutory earnings. Coincident with the ratings action, the company’s outlook from S&P was revised from “positive” to “stable.”
There have been no other changes in any of the rating agencies’ outlook statements or ratings during 2008 or prior to the date of this filing.
Agency ratings are not directed toward the holders of the Company’sour securities and are not recommendations to buy, sell, or hold suchour securities. Each rating is subject to revision or withdrawal at any time by the assigning rating organization, and each rating should be evaluated independently ofregarded as an independent assessment, not conditional on any other rating.
Given the dynamic nature of the ratings process, changes by these or other rating agencies may or may not occur in the near-term. Based on our ongoing dialogue with the rating agencies concerning our improved insurance risk profile, our financial flexibility, our operating performance, and the quality of our investment portfolio, we do not expect any negative actions from any of the four rating agencies related to either Unum Group’s current issuer credit ratings or the financial strength ratings of its insurance subsidiaries. However, in the event that we are unable to meet the rating agency specific guideline values to maintain our current ratings, including but not limited to maintenance of our capital management metrics at the threshold values stated and maintenance of our financial flexibility and operational consistency, we could be placed on a negative credit watch, with a potential for a downgrade to both our issuer credit ratings and our financial strength ratings.
See “Ratings” contained herein in Part 1, Item 1 and “Risk Factors – Debt and Financial Strength Ratings”Factors” contained herein in Part 1, Item 1A contained herein for further discussion.
Index to Financial Statements
Other InformationITEM 7A. QUANTITATIVE AND QUALITATIVE DISCLOSURES ABOUT MARKET RISK
Pension and Postretirement Benefit Plans
The Company sponsors several defined benefit pension and postretirement plans for its employees, including non-qualified pension plans. The U.S. pension plans comprise the majority of the total benefit obligation and pension expense for the Company. The value of the benefit obligations is determined based on a set of economic and demographic assumptions that represent the Company’s best estimate of future expected experience. These assumptionsWe are reviewed annually. Two of the economic assumptions, the discount rate and the long-term rate of return, are adjusted accordingly based on key external indices. The Company follows Statements of Financial Accounting Standards No. 87 (SFAS 87),Employers’ Accounting for Pensions, No. 106,Employers’ Accounting for Postretirement Benefits Other Than Pensions, and No. 132,Employers’ Disclosures about Pensions and Other Postretirement Benefits in its financial reporting and accounting for its pension and post-retirement benefit plans.
U.S. Pension and Post–Retirement Benefit Plans
The assumptions chosen for U.S. pension plans and the U.S. postretirement plan use consistent methodology but reflect the differences in the plan obligations. The Company uses a December 31 measurement date for each plan.
Thediscount rate is an interest assumption used to convert the benefit payment stream to a present value. The Company sets the discount rate assumption at the measurement date for each of its retirement related benefit plans to reflect the yield of a portfolio of high quality fixed income debt instruments matched against the timing and amounts of projected future benefits. The discount rate used for the net periodic benefit costs for the U.S. pension plans was 5.80 percent and 6.05 percent in 2006 and 2005, respectively. Using a similar methodology applied to the postretirement plan cash flows, the discount rate used in the net periodic benefit cost for 2006 and 2005 was 5.50 percent and 5.70 percent, respectively.
Lowering the discount rate by 50 basis points would have increased the 2005 pension expense for the U.S. pension plans by $10.0 million and would be expected to result in a $10.7 million increase in the 2006 pension expense.
Thelong-term rate of return assumption is the best estimate of the average annual assumed return that will be produced from the pension trust assets until current benefits are paid. The Company uses a compound interest method in computing the rate of return on pension plan assets. The long-term rate of return on assets used in the net periodic pension costs for the U.S. qualified defined benefit pension plan for 2006 and 2005 was 8.00 percent and 8.50 percent, respectively. Lowering the expected long-term rate of return on the plan assets by 50 basis points would have increased the 2005 pension expense by approximately $2.4 million. For 2006, lowering the assumption by 50 basis points would be expected to increase pension expense by approximately $2.6 million.
The market related value equals the fair value of assets, determined as of the measurement date. The assets are not smoothed for purposes of SFAS 87. The expected return on assets, therefore, fully recognizes all asset gains and losses through the measurement date.
The Company holds an unrecognized net loss representing the cumulative liability and asset gains and losses that have not been recognized in pension expense. As of December 31, 2005, there was an estimated unrecognized loss of approximately $363.9 million in the U.S. pension plans, compared to $318.2 million at December 31, 2004. The unrecognized loss has increased due to the decline in the year end discount rate from 6.05 percent at 2004 to 5.80 percent at 2005 and because the rate of return on assets was 4.90 percent in 2005 compared to an assumed rate of return of 8.50 percent. The unrecognized net loss is amortized as a component of pension expense. Only amounts outside of a corridor (equal to 10 percent of the greater of the projected benefit obligation or market related value of assets) are amortized. The 2006 pension expense is expected to include a loss amortization of approximately $22.4 million. This loss amortization was $19.2 million, $16.0 million, and $18.0 million in 2005, 2004, and 2003, respectively.
The Company reported U.S. pension expense of $54.8 million, $43.6 million, and $41.8 million in 2005, 2004 and 2003, respectively.
The fair value of plan assets in the U.S. qualified defined benefit pension plan was $515.4 million at December 31, 2005, compared to $478.1 million at year end 2004. In recent years, the moderate increase in assets, coupled with the liability increase due to declining discount rates, has reduced the year end funding level in the plan such that it has a deficit of $246.1 million as of December 31, 2005, compared to $176.5 million as of December 31, 2004. The Company had no regulatory contribution requirements for 2005 and 2004; however, the Company elected to make voluntary contributions of $23.0 million and $20.0 million, respectively, to its U.S. qualified defined benefit pension plan. The Company expects to make a voluntary contribution of approximately $42.0 million to its U.S. qualified defined benefit pension plan in 2006, based on current tax law.
Non-U.S. Pension Plans
The Company’s U.K. operation maintains a separate defined benefit plan for its eligible employees. The U.K. defined benefit pension plan (Scheme) was closed to new entrants on December 31, 2002.
The long-term rate of return on asset assumption used in the net periodic pension costs for 2006 and 2005 was 6.70 percent and 7.10 percent, respectively.
The Company elected to set the discount rate assumption at the measurement date for the Scheme to reflect the yield of a portfolio of high quality fixed income debt instruments matched against the timing and amounts of projected future benefits. The discount rate assumptions were 4.80 percent and 5.30 percent as of December 31, 2005 and 2004, respectively.
Pension expense was $11.7 million, $11.6 million, and $8.8 million in 2005, 2004, and 2003, respectively.
The fair value of plan assets in the Scheme was $92.1 million at December 31, 2005, compared to $80.5 million at year end 2004. The Scheme has a deficit of $45.2 million at December 31, 2005, compared to $50.2 million at December 31, 2004. The Company contributes to the Scheme in accordance with a schedule of contributions which requires the Company to contribute to the Scheme at the rate of at least 18.20 percent of eligible salaries, sufficient to meet the minimum funding requirement under U.K. legislation. The Company contribution rate of 20.25 percent of eligible salaries is currently being reviewed. The Company made a $44.2 million contribution into the Scheme in January 2006 to reduce the deficit. The Company anticipates it will make additional contributions during 2006 into the Scheme of approximately $9.1 million.
The Company previously maintained separate defined benefit plans for the employees of its Canadian branch operation. As a result of the sale of the Canadian branch, the Company froze the Canadian defined benefit pension plans during 2004 and recorded a curtailment loss of $0.7 million. The Company is currently in the process of terminating the Canadian plans.
The Company is subject to various market risk exposures, including interest rate risk and foreign exchange rate risk. The following discussion regarding the Company’sour risk management activities includes forward-looking statements that involve risk and uncertainties. Estimates of future performance and economic conditions are reflected assuming certain changes in market rates and prices were to occur (sensitivity analysis). Caution should be used in evaluating the Company’sour overall market risk from the information presented below, as actual results may differ. The Company employs various derivative programs to manage these material market risks. See “Investments” contained herein in Item 7 and Notes 4 and 5 of the “Notes to Consolidated Financial Statements” contained herein in Item 8 for further discussions of the qualitative aspects of market risk, including derivative financial instrument activity.
Interest Rate Risk
The operationsOur exposure to interest rate changes results from our holdings of the Companyfinancial instruments such as fixed rate investments, derivatives, and interest-sensitive liabilities. Fixed rate investments include fixed maturity securities, mortgage loans, policy loans, and short-term investments. Fixed maturity securities include U.S. and foreign government bonds, securities issued by government agencies, corporate bonds, mortgage-backed securities, and redeemable preferred stock, all of which are subject to risk resulting from interest rate fluctuations,fluctuations. Certain of our financial instruments, fixed maturity securities and derivatives, are carried at fair value in our consolidated balance sheets. The fair value of these financial instruments may be adversely affected by changes in interest rates. A rise in interest rates may increase the net unrealized loss related to these financial instruments, but may improve our ability to earn higher rates of return on new purchases of fixed maturity securities. Conversely, a decline in interest rates may decrease the net unrealized loss, but new securities may be purchased at lower rates of return. Although changes in fair value of fixed maturity securities and derivatives due to changes in interest rates may impact amounts reported in our consolidated balance sheets, these changes will not cause an economic gain or loss unless we sell investments, terminate derivative positions, determine that an investment is other than temporarily impaired, or determine that a derivative instrument is no longer an effective hedge.
Other fixed rate investments, such as mortgage loans and policy loans, are carried at amortized cost and unpaid balances, respectively, rather than fair value in our consolidated balance sheets. These investments may have fair values substantially higher or lower than the carrying values reflected in our balance sheets. A change in interest rates could impact our financial position if we sold our mortgage loan investments at times of low market value. A change in interest rates would not impact our financial position at repayment of policy loans, as ultimately the cash surrender values or death benefits would be reduced for the carrying value of any outstanding policy loans. Carrying amounts for short-term investments approximate fair value, and we believe we have minimal interest rate risk exposure from these investments.
We believe that the risk of being forced to liquidate investments or terminate derivative positions is minimal, primarily long-term U.S.due to the level of capital at our insurance subsidiaries, our holding company liquidity position, and our investment strategy which we believe provides for adequate cash flows to meet the funding requirements of our business. We may in certain circumstances, however, need to sell investments due to changes in regulatory or capital requirements, changes in tax laws, rating agency decisions, and/or unexpected changes in liquidity needs.
Although the majority of our liabilities related to insurance contracts are not interest rates.rate sensitive and we therefore have minimal exposure to policy withdrawal risk, the fair values of liabilities under all insurance contracts are taken into consideration in our overall management of interest rate risk, which minimizes exposure to changing interest rates through the matching of investment cash flows with amounts due under insurance contracts. Changes in interest rates and individuals’ behavior affect the amount and timing of asset and liability cash flows. Management continually modelsWe actively manage our asset and testsliability cash flow match and our asset and liability duration match to minimize interest rate risk. We model and test asset and liability portfolios to improve interest rate risk management and net yields. Testing the asset and liability portfolios under various interest rate and economic scenarios allows managementus to choose what we believe to be the most appropriate investment strategy, as well as to prepare for disadvantageous outcomes. This analysis is the precursor to the Company’sour activities in derivative financial instruments. The Company usesWe use current and forward interest rate swaps, currency forward contracts, forward treasury locks, and options on forward interest rate forward contracts, exchange-traded interest rate futures contracts, and optionsswaps to hedge interest rate risks and to match asset durations and cash flows with corresponding liabilities.
Assuming an
Index to Financial Statements
Short-term and long-term debt are not carried at fair value in our consolidated balance sheets. If we modify or replace existing short-term or long-term debt instruments at current market rates, we may incur a gain or loss on the transaction. We believe our debt-related risk to changes in interest rates is relatively minimal. In the near term, we expect that our need for external financing is small, but changes in our business could increase our need. Our short-term debt repayment requirements for 2009 can be met through existing cash flows.
We measure our financial instruments’ market risk related to changes in interest rates using a sensitivity analysis. This analysis estimates potential changes in fair values as of December 31, 2008 and 2007 based on a hypothetical immediate increase of 100 basis points in interest rates from year end levels, the net hypothetical decrease in stockholders’ equity related to financial and derivative instruments was estimated to be $1.5 billion and $1.6 billion at December 31, 2005 and 2004, respectively.levels. The fair valuesselection of mortgage loans, which are reported in the consolidated statements of financial condition at amortized cost, would decrease by approximately $90 million and $20 million at December 31, 2005 and 2004, respectively.
At December 31, 2005 and 2004, assuming a 100 basis point decreaseimmediate parallel change in long-term interest rates should not be construed as our prediction of future market events, but only as an illustration of the potential effect of such an event.
The hypothetical potential changes in fair value of our financial instruments at December 31, 2008 and 2007 are shown as follows:
| December 31, 2008 | |||||||||||||
| Notional | Hypothetical | ||||||||||||
| (in millions of dollars) | Amount of Derivatives | Fair Value | FV + 100 BP | Change in FV | |||||||||
Assets | |||||||||||||
Fixed Maturity Securities (1) | $ | 32,134.1 | $ | 29,719.2 | $ | (2,414.9) | |||||||
Mortgage Loans | 1,224.4 | 1,206.3 | (18.1) | ||||||||||
Policy Loans, Net of Reinsurance Ceded | 255.4 | 242.4 | (13.0) | ||||||||||
Liabilities | |||||||||||||
Unrealized Adjustment to Reserves, Net of | $ | 809.8 | $ | 1,921.9 | $ | 1,112.1 | |||||||
Short-term Debt | (188.9) | (188.5) | 0.4 | ||||||||||
Long-term Debt | (1,677.4) | (1,614.4) | 63.0 | ||||||||||
Derivatives (1) | |||||||||||||
Swaps | $ | 2,265.8 | $ | 242.2 | $ | 156.2 | $ | (86.0) | |||||
Forwards | 266.3 | 60.2 | 65.0 | 4.8 | |||||||||
DIG Issue B36 Embedded Derivative | (360.5) | (330.3) | 30.2 | ||||||||||
Index to Financial Statements
| December 31, 2007 | |||||||||||||
| Notional | Hypothetical | ||||||||||||
| (in millions of dollars) | Amount of Derivatives | Fair Value | FV + 100 BP | Change in FV | |||||||||
Assets | |||||||||||||
Fixed Maturity Securities (1) | $ | 35,814.7 | $ | 32,984.5 | $ | (2,830.2) | |||||||
Mortgage Loans | 1,079.8 | 1,019.8 | (60.0) | ||||||||||
Policy Loans, Net of Reinsurance Ceded | 228.7 | 218.3 | (10.4) | ||||||||||
Liabilities | |||||||||||||
Unrealized Adjustment to Reserves, Net of | $ | (859.3) | $ | 299.6 | $ | 1,158.9 | |||||||
Short-term Debt | (175.3) | (174.5) | 0.8 | ||||||||||
Long-term Debt | (2,673.8) | (2,530.8) | 143.0 | ||||||||||
Derivatives (1) | |||||||||||||
Swaps | $ | 2,590.6 | $ | (69.0) | $ | (208.0) | $ | (139.0) | |||||
Forwards | 315.1 | (28.8) | (10.8) | 18.0 | |||||||||
Options | 80.0 | 6.6 | 1.8 | (4.8) | |||||||||
DIG Issue B36 Embedded Derivative | (68.8) | (77.9) | (9.1) | ||||||||||
(1) These assets and liabilities are carried at fair value in our consolidated balance sheets. Changes in fair value resulting from year end levels,changes in interest rates may affect the fair valuesvalue at which the item is reported in our consolidated balance sheets with a corresponding offsetting change reported in other comprehensive income or loss, net of deferred taxes.
(2) The adjustment to reserves and other for unrealized investment gains and losses reflects the Company’s long-term debt, including junior subordinated debt,adjustments that would increase approximately $240 millionbe necessary to deferred acquisition costs and $200 million, respectively.
policyholder liabilities if the unrealized investment gains and losses related to the fixed maturity securities and derivatives had been realized. Changes in this adjustment are also reported as a component of other comprehensive income or loss, net of deferred taxes.
The effect of a change in interest rates on asset prices was determined using a duration implied methodology for corporate bonds private placement securities, and government and government agency securities whereby the duration of each security was used to estimate the change in price for the security assuming an increase of 100 basis points in interest rates. The effect of a change in interest rates on the mortgage-backed securities iswas estimated using a mortgage analytic system which takes into account the impact of changing prepayment speeds resulting from a 100 basis point increase in interest rates on the change in price of the mortgage-backed securities. These hypothetical prices were compared to the actual prices for the period to compute the overall change in market value. The changes in the fair values of long-term debt, including junior subordinated debt,shown in the chart above for all other items were determined using discounted cash flows analyses. Because the Companywe actively manages itsmanage our investments and liabilities, actual changes could be less than those estimated above.
Foreign Currency Risk
The Companyfunctional currency of our U.K. operations is also subjectthe British pound sterling. We are exposed to foreign exchangecurrency risk arising from itsfluctuations in the British pound sterling to U.S. dollar exchange rates primarily as they relate to the translation of the financial results of our U.K. operations. Fluctuations in the pound to dollar exchange rate have an effect on our reported financial results. We do not hedge against the possible impact of this risk. Because we do not actually convert pounds into dollars except for a limited number of transactions, we view foreign currency translation as a financial reporting issue and not a reflection of operations and certain investment securities denominatedor profitability in those local currencies. Foreign operations represented 6.4 percent and 6.7 percent of total assets at December 31, 2005 and 2004, respectively, and 9.1 percent and 8.0 percent of total revenue for 2005 and 2004, respectively. the U.K.
Index to Financial Statements
Assuming foreignthe pound to dollar exchange ratesrate decreased 10 percent from the December 31, 20052008 and 20042007 levels, stockholders’ equity and net income (loss)as reported in U.S. dollars as of and for the periods then ended would not have been materially affected.lower by approximately $72.8 million and $98.2 million, respectively. Assuming the pound to dollar average exchange rate decreased 10 percent from the actual average exchange rates for 2008 and 2007, segment operating income, which excludes net realized investment gains and losses and income tax, as reported in U.S. dollars would have decreased approximately $33.5 million and $33.8 million, respectively, for the years then ended.
Dividends paid by Unum Limited are generally held at our U.K. finance subsidiary. If these funds are repatriated to our U.S. holding company, we would at that time be subject to foreign currency risk as the value of the dividend, when converted into U.S. dollars, would be dependent upon the foreign exchange rate at the time of conversion.
We are also exposed to foreign currency risk related to certain foreign investment securities denominated in local currencies and U.S. dollar denominated debt issued by one of our U.K. subsidiaries. We use current and forward currency swaps and contracts to hedge or minimize the foreign exchange risk associated with these instruments.
See “Unum UK Segment” contained herein in Item 7 for further information concerning foreign currency translation and Note 5 of the “Notes to Consolidated Financial Statements” contained herein in Item 8 for further discussions of derivative financial instrument activity.
Risk Management
We have an Enterprise Risk Management (ERM) program. Our ERM program strives to:
Identify, measure, mitigate as appropriate, and report on our risk positions and exposures, including notable risk events;
Provide an assessment of our material risks, including how they affect us, how individual risks interrelate, and how management addresses the risks;
Coordinate development of and compliance with risk appetite statements, including systematic limit monitoring;
Identify emerging risks and analyze how material future risks might impact us;
Practice strong risk management, including ensuring diversification across and within business units; and
Fulfill regulatory, rating agency, and governance objectives.
We employ a “pyramid” risk committee structure, beginning with Unum Group’s board of director committees and cascading down to business unit risk committees, to govern our ERM process and manage our risks in an integrated manner. Collectively, these committees are responsible for managing our strategic, market, credit, insurance, operational, capital and liquidity, and reputational risks.
Business unit risk committees for each of our three primary business units as well as our corporate function are responsible for identifying, measuring, reporting, and managing insurance and operational risks within their respective areas, consistent with established corporate risk tolerance levels. We manage insurance and operational risk at the business unit level, based on consistent principles and policies established at the corporate level. Internal quality controls are routinely monitored by the risk committees. Market and credit risk are jointly managed by our investment committee, which is also responsible for monitoring our investment risk appetite and ratifying investment transactions. Capital and liquidity risk is under the purview of the capital management committee, which is responsible for planning and monitoring capital allocation, financing, liquidity, and solvency considerations. An executive risk management committee is responsible for overseeing our enterprise-wide risk management program that is managed by our chief risk officer. The executive management team is responsible for managing our strategic risk. We provide an ERM report to the audit committee of Unum Group’s board of directors on a regular basis.
We believe that by effectively executing against these objectives we will be better positioned to fulfill our corporate mission, improve and protect shareholder value, and reduce reputational risk.
Index to Financial Statements |
MANAGEMENT’S REPORT ON INTERNAL CONTROL OVER FINANCIAL REPORTINGReport of Independent Registered Public Accounting Firm
The Company’s management is responsible for designing, implementing, and maintaining adequate internal control over financial reporting. The Company’s internal control over financial reporting encompasses the processes and procedures management has established to (i) maintain records that, in reasonable detail, accurately and fairly reflect the Company’s transactions and dispositions of assets; (ii) provide reasonable assurance that transactions are recorded as necessary to permit preparation of financial statements in accordance with U.S. generally accepted accounting principles; (iii) provide reasonable assurance that receipts and expenditures are appropriately authorized; and (iv) provide reasonable assurance regarding prevention or timely detection of unauthorized acquisition, use, or disposition of the Company’s assets that could have a material effect on the financial statements.
Management recognizes that there are inherent limitations in the effectiveness of internal control over financial reporting, including the potential for human error or the circumvention or overriding of internal controls. Accordingly, even effective internal control over financial reporting cannot provide absolute assurance with respect to financial statement preparation. Because of such limitations, there is a risk that material misstatements may not be prevented or detected on a timely basis by internal control over financial reporting. In addition, any projection of the evaluation of effectiveness to future periods is subject to the risk that controls may become inadequate because of changes in conditions, or that the degree of compliance with the policies or procedures may deteriorate.
Management conducted an assessment of the effectiveness of the Company’s internal control over financial reporting based on criteria established inInternal Control – Integrated Frameworkissued by the Committee of Sponsoring Organizations of the Treadway Commission and concluded that, as of December 31, 2005, the Company maintained effective internal control over financial reporting.
The effectiveness of the Company’s internal control over financial reporting and management’s assessment of that effectiveness, as of December 31, 2005, have been audited by Ernst & Young LLP, an independent registered public accounting firm, as stated in their report which follows.
REPORT OF ERNST & YOUNG LLP, INDEPENDENT REGISTERED PUBLIC ACCOUNTING FIRM, ON INTERNAL CONTROL OVER FINANCIAL REPORTING
Board of Directors and Stockholders
UnumProvident CorporationUnum Group and Subsidiaries
We have audited management’s assessment, included in the accompanying Management’s Report on Internal Control over Financial Reporting, that UnumProvident Corporation and subsidiaries maintained effective internal control over financial reporting asconsolidated balance sheets of December 31, 2005, based on criteria established inInternal Control – Integrated Framework issued by the Committee of Sponsoring Organizations of the Treadway Commission (the COSO criteria). UnumProvident Corporation and subsidiaries’ management is responsible for maintaining effective internal control over financial reporting and for its assessment of the effectiveness of internal control over financial reporting. Our responsibility is to express an opinion on management’s assessment and an opinion on the effectiveness of the company’s internal control over financial reporting based on our audit.
We conducted our audit in accordance with the standards of the Public Company Accounting Oversight Board (United States). Those standards require that we plan and perform the audit to obtain reasonable assurance about whether effective internal control over financial reporting was maintained in all material respects. Our audit included obtaining an understanding of internal control over financial reporting, evaluating management’s assessment, testing and evaluating the design and operating effectiveness of internal control, and performing such other procedures as we considered necessary in the circumstances. We believe that our audit provides a reasonable basis for our opinion.
A company’s internal control over financial reporting is a process designed to provide reasonable assurance regarding the reliability of financial reporting and the preparation of financial statements for external purposes in accordance with generally accepted accounting principles. A company’s internal control over financial reporting includes those policies and procedures that (1) pertain to the maintenance of records that, in reasonable detail, accurately and fairly reflect the transactions and dispositions of the assets of the company; (2) provide reasonable assurance that transactions are recorded as necessary to permit preparation of financial statements in accordance with generally accepted accounting principles, and that receipts and expenditures of the company are being made only in accordance with authorizations of management and directors of the company; and (3) provide reasonable assurance regarding prevention or timely detection of unauthorized acquisition, use, or disposition of the company’s assets that could have a material effect on the financial statements.
Because of its inherent limitations, internal control over financial reporting may not prevent or detect misstatements. Also, projections of any evaluation of effectiveness to future periods are subject to the risk that controls may become inadequate because of changes in conditions, or that the degree of compliance with the policies or procedures may deteriorate.
In our opinion, management’s assessment that UnumProvident Corporation and subsidiaries maintained effective internal control over financial reporting as of December 31, 2005, is fairly stated, in all material respects, based on the COSO criteria. Also, in our opinion, UnumProvident Corporation and subsidiaries maintained, in all material respects, effective internal control over financial reporting as of December 31, 2005, based on the COSO criteria.
We also have audited, in accordance with the standards of the Public Company Accounting Oversight Board (United States), the consolidated statements of financial condition of UnumProvidentUnum Group and subsidiaries as of December 31, 20052008 and 2004,2007, and the related consolidated statements of operations,income, stockholders’ equity, and cash flows and comprehensive income (loss) for each of the three years in the period ended December 31, 2005, and our report dated February 28, 2006 expressed an unqualified opinion thereon.
Chattanooga, Tennessee
February 28, 2006
REPORT OF ERNST & YOUNG LLP, INDEPENDENT REGISTERED PUBLIC ACCOUNTING FIRM
Board of Directors and Stockholders
UnumProvident Corporation and Subsidiaries
We have audited the accompanying consolidated statements of financial condition of UnumProvident Corporation and subsidiaries as of December 31, 2005 and 2004, and the related consolidated statements of operations, stockholders’ equity, and cash flows for each of the three years in the period ended December 31, 2005.2008. Our audits also included the financial statement schedules listed in the index at Item 15(a). These financial statements and schedules are the responsibility of the Company’s management. Our responsibility is to express an opinion on these financial statements and schedules based on our audits.
We conducted our audits in accordance with the standards of the Public Company Accounting Oversight Board (United States). Those standards require that we plan and perform the audit to obtain reasonable assurance about whether the financial statements are free of material misstatement. An audit includes examining, on a test basis, evidence supporting the amounts and disclosures in the financial statements. An audit also includes assessing the accounting principles used and significant estimates made by management, as well as evaluating the overall financial statement presentation. We believe that our audits provide a reasonable basis for our opinion.
In our opinion, the financial statements referred to above present fairly, in all material respects, the consolidated financial position of UnumProvident CorporationUnum Group and subsidiaries at December 31, 20052008 and 2004,2007, and the consolidated results of their operations and their cash flows for each of the three years in the period ended December 31, 2005,2008, in conformity with U.S. generally accepted accounting principles. Also in our opinion, the related financial statement schedules, when considered in relation to the basic financial statements taken as a whole, present fairly in all material respects the information set forth therein.
As discussed in Note 1 to the consolidated financial statements, Unum Group changed its method of accounting for deferred acquisition costs and income taxes as of January 1, 2007 in accordance with adoption of Statement of Position 05-1,Accounting by Insurance Enterprises for Deferred Acquisition Costs in Connection With Modifications or Exchanges of Insurance Contracts, and Financial Accounting Standards Board Interpretation No. 48,Accounting for Uncertainty in Income Taxes, an interpretation of Statement of Financial Accounting Standards No. 109; and its method of accounting for defined benefit pension and other postretirement plans as of December 31, 2006 in accordance with Statement of Financial Accounting Standards No. 158 (SFAS 158),Employers’ Accounting for Defined Benefit Pension and Other Postretirement Plans, an amendment of FASB Statements No. 87, 88, 106, and 132(R).
We also have also audited, in accordance with the standards of the Public Company Accounting Oversight Board (United States), the effectiveness of UnumProvident CorporationUnum Group and subsidiaries’ internal control over financial reporting as of December 31, 2005,2008, based on criteria established inInternal Control – Integrated Framework issued by the Committee of Sponsoring Organizations of the Treadway Commission, and our report dated February 28, 200624, 2009 expressed an unqualified opinion thereon.
| /s/ ERNST & YOUNG LLP |
Chattanooga, Tennessee
February 28, 200624, 2009
Index to Financial Statements
CONSOLIDATED STATEMENTS OF FINANCIAL CONDITIONBALANCE SHEETS
UnumProvident CorporationUnum Group and Subsidiaries
| December 31 | ||||||
| 2005 | 2004 | |||||
| (in millions of dollars) | ||||||
Assets | ||||||
Investments | ||||||
Fixed Maturity Securities - at fair value (amortized cost: $32,062.1; $29,077.9) | $ | 34,856.8 | $ | 32,488.4 | ||
Equity Securities - at fair value (cost: $13.3; $13.7) | 13.6 | 12.9 | ||||
Mortgage Loans | 739.4 | 498.2 | ||||
Real Estate | 18.2 | 27.4 | ||||
Policy Loans | 3,201.4 | 3,073.6 | ||||
Other Long-term Investments | 109.2 | 77.0 | ||||
Short-term Investments | 417.9 | 410.2 | ||||
Total Investments | 39,356.5 | 36,587.7 | ||||
Other Assets | ||||||
Cash and Bank Deposits | 69.4 | 130.7 | ||||
Accounts and Premiums Receivable | 1,979.2 | 2,033.1 | ||||
Reinsurance Receivable | 5,609.2 | 6,969.2 | ||||
Accrued Investment Income | 618.7 | 588.3 | ||||
Deferred Policy Acquisition Costs | 2,913.3 | 2,882.5 | ||||
Value of Business Acquired | 78.5 | 101.5 | ||||
Goodwill | 273.0 | 271.1 | ||||
Property and Equipment | 379.5 | 398.5 | ||||
Miscellaneous | 559.9 | 838.0 | ||||
Separate Account Assets | 29.6 | 31.7 | ||||
Total Assets | $ | 51,866.8 | $ | 50,832.3 | ||
| December 31 | ||||||
| 2008 | 2007 | |||||
| (in millions of dollars) | ||||||
Assets | ||||||
Investments | ||||||
Fixed Maturity Securities - at fair value (amortized cost: $34,407.6; $34,628.1) | $ | 32,134.1 | $ | 35,814.7 | ||
Mortgage Loans | 1,274.8 | 1,068.9 | ||||
Policy Loans | 2,753.8 | 2,617.7 | ||||
Other Long-term Investments | 520.1 | 232.1 | ||||
Short-term Investments | 1,183.1 | 1,486.8 | ||||
Total Investments | 37,865.9 | 41,220.2 | ||||
Other Assets | ||||||
Cash and Bank Deposits | 49.9 | 199.1 | ||||
Accounts and Premiums Receivable | 1,784.8 | 1,914.7 | ||||
Reinsurance Recoverable | 4,974.2 | 5,160.0 | ||||
Accrued Investment Income | 605.6 | 592.3 | ||||
Deferred Acquisition Costs | 2,472.4 | 2,381.9 | ||||
Goodwill | 200.5 | 204.3 | ||||
Property and Equipment | 409.4 | 393.7 | ||||
Deferred Income Tax | 438.8 | - | ||||
Other Assets | 605.4 | 615.5 | ||||
Separate Account Assets | 10.5 | 20.2 | ||||
Total Assets | $ | 49,417.4 | $ | 52,701.9 | ||
See notes to consolidated financial statements.
Index to Financial Statements
CONSOLIDATED STATEMENTS OF FINANCIAL CONDITIONBALANCE SHEETS - Continued
UnumProvident CorporationUnum Group and Subsidiaries
| December 31 | ||||||||
| 2005 | 2004 | |||||||
| (in millions of dollars) | ||||||||
Liabilities and Stockholders’ Equity | ||||||||
Liabilities | ||||||||
Policy and Contract Benefits | $ | 2,063.4 | $ | 1,841.6 | ||||
Reserves for Future Policy and Contract Benefits | 34,041.5 | 33,224.8 | ||||||
Unearned Premiums | 481.8 | 500.8 | ||||||
Other Policyholders’ Funds | 2,235.5 | 2,425.3 | ||||||
Current Income Tax | 18.3 | 0.3 | ||||||
Deferred Income Tax | 989.7 | 1,060.6 | ||||||
Short-term Debt | — | 227.0 | ||||||
Long-term Debt | 3,261.6 | 2,862.0 | ||||||
Other Liabilities | 1,381.5 | 1,434.1 | ||||||
Separate Account Liabilities | 29.6 | 31.7 | ||||||
Total Liabilities | 44,502.9 | 43,608.2 | ||||||
Commitments and Contingent Liabilities - Note 15 | ||||||||
Stockholders’ Equity - Note 11 | ||||||||
Common Stock, $0.10 par | ||||||||
Authorized: 725,000,000 shares | ||||||||
Issued: 300,508,859 and 298,497,008 shares | 30.1 | �� | 29.8 | |||||
Additional Paid-in Capital | 1,627.9 | 1,588.4 | ||||||
Accumulated Other Comprehensive Income (Loss) | ||||||||
Net Unrealized Gain on Securities | 1,040.7 | 1,309.8 | ||||||
Net Gain on Cash Flow Hedges | 273.3 | 236.9 | ||||||
Foreign Currency Translation Adjustment | 22.4 | 96.3 | ||||||
Minimum Pension Liability Adjustment | (172.9 | ) | (161.9 | ) | ||||
Retained Earnings | 4,610.4 | 4,185.5 | ||||||
Treasury Stock - at cost: 1,951,095 shares | (54.2 | ) | (54.2 | ) | ||||
Deferred Compensation | (13.8 | ) | (6.5 | ) | ||||
Total Stockholders’ Equity | 7,363.9 | 7,224.1 | ||||||
Total Liabilities and Stockholders’ Equity | $ | 51,866.8 | $ | 50,832.3 | ||||
| December 31 | ||||||
| 2008 | 2007 | |||||
| (in millions of dollars) | ||||||
Liabilities and Stockholders’ Equity | ||||||
Liabilities | ||||||
Policy and Contract Benefits | $ | 1,769.5 | $ | 1,979.7 | ||
Reserves for Future Policy and Contract Benefits | 34,581.5 | 35,828.0 | ||||
Unearned Premiums | 463.9 | 523.1 | ||||
Other Policyholders’ Funds | 1,675.6 | 1,821.2 | ||||
Income Tax Payable | 115.5 | 148.6 | ||||
Deferred Income Tax | - | 251.7 | ||||
Short-term Debt | 190.5 | 175.0 | ||||
Long-term Debt | 2,259.4 | 2,515.2 | ||||
Other Liabilities | 1,953.1 | 1,399.3 | ||||
Separate Account Liabilities | 10.5 | 20.2 | ||||
Total Liabilities | 43,019.5 | 44,662.0 | ||||
Commitments and Contingent Liabilities - Note 14 | ||||||
Stockholders’ Equity | ||||||
Common Stock, $0.10 par | ||||||
Authorized: 725,000,000 shares | ||||||
Issued: 362,949,412 and 362,844,570 shares | 36.3 | 36.3 | ||||
Additional Paid-in Capital | 2,546.9 | 2,516.9 | ||||
Accumulated Other Comprehensive Income (Loss) | ||||||
Net Unrealized Gain (Loss) on Securities | (832.6) | 356.1 | ||||
Net Gain on Cash Flow Hedges | 458.5 | 182.5 | ||||
Foreign Currency Translation Adjustment | (177.6) | 123.4 | ||||
Unrecognized Pension and Postretirement Benefit Costs | (406.5) | (198.5) | ||||
Retained Earnings | 5,527.1 | 5,077.4 | ||||
Treasury Stock - at cost: 31,829,067 and 1,951,095 shares | (754.2) | (54.2) | ||||
Total Stockholders’ Equity | 6,397.9 | 8,039.9 | ||||
Total Liabilities and Stockholders’ Equity | $ | 49,417.4 | $ | 52,701.9 | ||
See notes to consolidated financial statements.
Index to Financial Statements
CONSOLIDATED STATEMENTS OF OPERATIONSINCOME
UnumProvident CorporationUnum Group and Subsidiaries
| Year Ended December 31 | ||||||||||||
| 2005 | 2004 | 2003 | ||||||||||
| (in millions of dollars, except share data) | ||||||||||||
Revenue | ||||||||||||
Premium Income | $ | 7,815.6 | $ | 7,839.6 | $ | 7,615.7 | ||||||
Net Investment Income | 2,188.3 | 2,158.7 | 2,158.4 | |||||||||
Net Realized Investment Gain (Loss) | (6.7 | ) | 29.2 | (173.8 | ) | |||||||
Other Income | 440.0 | 437.4 | 391.3 | |||||||||
Total Revenue | 10,437.2 | 10,464.9 | 9,991.6 | |||||||||
Benefits and Expenses | ||||||||||||
Benefits and Change in Reserves for Future Benefits | 7,083.2 | 7,248.4 | 7,868.1 | |||||||||
Commissions | 804.7 | 842.3 | 844.1 | |||||||||
Interest and Debt Expense | 208.0 | 207.1 | 187.2 | |||||||||
Deferral of Policy Acquisition Costs | (519.4 | ) | (557.3 | ) | (665.9 | ) | ||||||
Amortization of Deferred Policy Acquisition Costs | 463.7 | 436.7 | 458.6 | |||||||||
Amortization of Value of Business Acquired | 15.1 | 15.8 | 37.5 | |||||||||
Impairment of Intangible Assets | — | 856.4 | — | |||||||||
Compensation Expense | 753.9 | 739.6 | 779.8 | |||||||||
Other Operating Expenses | 918.4 | 935.4 | 917.4 | |||||||||
Total Benefits and Expenses | 9,727.6 | 10,724.4 | 10,426.8 | |||||||||
Income (Loss) from Continuing Operations Before Income Tax and Cumulative Effect of Accounting Principle Change | 709.6 | (259.5 | ) | (435.2 | ) | |||||||
Income Tax (Benefit) | ||||||||||||
Current | 120.2 | (16.1 | ) | 45.3 | ||||||||
Deferred | 75.8 | (51.2 | ) | (215.9 | ) | |||||||
Total Income Tax (Benefit) | 196.0 | (67.3 | ) | (170.6 | ) | |||||||
Income (Loss) from Continuing Operations Before Cumulative Effect of Accounting Principle Change | 513.6 | (192.2 | ) | (264.6 | ) | |||||||
Discontinued Operations - Note 2 | ||||||||||||
Loss Before Income Tax | — | (97.4 | ) | (145.8 | ) | |||||||
Income Tax (Benefit) | — | (36.6 | ) | 15.9 | ||||||||
Loss from Discontinued Operations, Net of Income Tax | — | (60.8 | ) | (161.7 | ) | |||||||
Cumulative Effect of Accounting Principle Change, Net of Income Tax - Note 1 | — | — | 39.9 | |||||||||
Net Income (Loss) | $ | 513.6 | $ | (253.0 | ) | $ | (386.4 | ) | ||||
Earnings Per Common Share | ||||||||||||
Basic | ||||||||||||
Income (Loss) from Continuing Operations Before Cumulative Effect of Accounting Principle Change | $ | 1.74 | $ | (0.65 | ) | $ | (0.96 | ) | ||||
Net Income (Loss) | $ | 1.74 | $ | (0.86 | ) | $ | (1.40 | ) | ||||
Assuming Dilution | ||||||||||||
Income (Loss) from Continuing Operations Before Cumulative Effect of Accounting Principle Change | $ | 1.64 | $ | (0.65 | ) | $ | (0.96 | ) | ||||
Net Income (Loss) | $ | 1.64 | $ | (0.86 | ) | $ | (1.40 | ) | ||||
| Year Ended December 31 | |||||||||
| 2008 | 2007 | 2006 | |||||||
| (in millions of dollars, except share data) | |||||||||
Revenue | |||||||||
Premium Income | $ | 7,783.3 | $ | 7,901.1 | $ | 7,948.2 | |||
Net Investment Income | 2,389.0 | 2,409.9 | 2,320.6 | ||||||
Net Realized Investment Gain (Loss) | (465.9) | (65.2) | 2.2 | ||||||
Other Income | 275.9 | 274.1 | 264.3 | ||||||
Total Revenue | 9,982.3 | 10,519.9 | 10,535.3 | ||||||
Benefits and Expenses | |||||||||
Benefits and Change in Reserves for Future Benefits | 6,626.4 | 6,988.2 | 7,577.2 | ||||||
Commissions | 853.3 | 841.1 | 819.0 | ||||||
Interest and Debt Expense | 156.7 | 241.9 | 217.6 | ||||||
Deferral of Acquisition Costs | (590.9) | (556.3) | (528.2) | ||||||
Amortization of Deferred Acquisition Costs | 519.1 | 480.4 | 478.6 | ||||||
Compensation Expense | 772.6 | 722.4 | 680.5 | ||||||
Other Expenses | 821.1 | 805.0 | 825.2 | ||||||
Total Benefits and Expenses | 9,158.3 | 9,522.7 | 10,069.9 | ||||||
Income from Continuing Operations Before Income Tax | 824.0 | 997.2 | 465.4 | ||||||
Income Tax (Benefit) | |||||||||
Current | 340.9 | 264.2 | 150.5 | ||||||
Deferred | (70.1) | 60.6 | (88.7) | ||||||
Total Income Tax | 270.8 | 324.8 | 61.8 | ||||||
Income from Continuing Operations | 553.2 | 672.4 | 403.6 | ||||||
Discontinued Operations - Note 2 | |||||||||
Income Before Income Tax | - | 17.8 | 13.2 | ||||||
Income Tax | - | 10.9 | 5.8 | ||||||
Income from Discontinued Operations | - | 6.9 | 7.4 | ||||||
Net Income | $ | 553.2 | $ | 679.3 | $ | 411.0 | |||
Earnings Per Common Share | |||||||||
Basic | |||||||||
Income from Continuing Operations | $ | 1.62 | $ | 1.90 | $ | 1.25 | |||
Net Income | $ | 1.62 | $ | 1.92 | $ | 1.27 | |||
Assuming Dilution | |||||||||
Income from Continuing Operations | $ | 1.62 | $ | 1.89 | $ | 1.21 | |||
Net Income | $ | 1.62 | $ | 1.91 | $ | 1.23 | |||
See notes to consolidated financial statements.
Index to Financial Statements
CONSOLIDATED STATEMENTS OF STOCKHOLDERS’ EQUITY
UnumProvident CorporationUnum Group and Subsidiaries
| Common Stock | Additional Paid-in Capital | Accumulated Other Comprehensive Income | Retained Earnings | Treasury Stock | Deferred Compensation | Total | |||||||||||||||||||||
| (in millions of dollars) | |||||||||||||||||||||||||||
Balance at December 31, 2002 | $ | 24.4 | $ | 1,086.8 | $ | 777.4 | $ | 5,011.4 | $ | (54.2 | ) | $ | (2.6 | ) | $ | 6,843.2 | |||||||||||
Comprehensive Income | |||||||||||||||||||||||||||
Net Loss | (386.4 | ) | (386.4 | ) | |||||||||||||||||||||||
Change in Net Unrealized Gain on Securities (net of tax expense of $132.3) | 180.9 | 180.9 | |||||||||||||||||||||||||
Change in Net Gain on Cash Flow Hedges (net of tax expense of $39.8) | 73.9 | 73.9 | |||||||||||||||||||||||||
Change in Foreign Currency Translation Adjustment (net of tax expense of $34.0) | 119.3 | 119.3 | |||||||||||||||||||||||||
Change in Minimum Pension Liability Adjustment (net of tax expense of $11.0) | 19.7 | 19.7 | |||||||||||||||||||||||||
Total Comprehensive Income | 7.4 | ||||||||||||||||||||||||||
Issuance of Equity Security Units | (37.4 | ) | (37.4 | ) | |||||||||||||||||||||||
Common Stock Activity | 5.4 | 559.7 | (9.2 | ) | 555.9 | ||||||||||||||||||||||
Dividends to Stockholders | (98.1 | ) | (98.1 | ) | |||||||||||||||||||||||
Balance at December 31, 2003 | 29.8 | 1,609.1 | 1,171.2 | 4,526.9 | (54.2 | ) | (11.8 | ) | 7,271.0 | ||||||||||||||||||
Comprehensive Income | |||||||||||||||||||||||||||
Net Loss | (253.0 | ) | (253.0 | ) | |||||||||||||||||||||||
Change in Net Unrealized Gain on Securities (net of tax expense of $130.8) | 228.8 | 228.8 | |||||||||||||||||||||||||
Change in Net Gain on Cash Flow Hedges (net of tax expense of $42.6) | 79.1 | 79.1 | |||||||||||||||||||||||||
Change in Foreign Currency Translation Adjustment (net of tax benefit of $3.3) | 38.6 | 38.6 | |||||||||||||||||||||||||
Change in Minimum Pension Liability Adjustment (net of tax benefit of $18.3) | (36.6 | ) | (36.6 | ) | |||||||||||||||||||||||
Total Comprehensive Income | 56.9 | ||||||||||||||||||||||||||
Issuance of Equity Security Units | (27.6 | ) | (27.6 | ) | |||||||||||||||||||||||
Common Stock Activity | 6.9 | 5.3 | 12.2 | ||||||||||||||||||||||||
Dividends to Stockholders | (88.4 | ) | (88.4 | ) | |||||||||||||||||||||||
Balance at December 31, 2004 | 29.8 | 1,588.4 | 1,481.1 | 4,185.5 | (54.2 | ) | (6.5 | ) | 7,224.1 | ||||||||||||||||||
Comprehensive Income | |||||||||||||||||||||||||||
Net Income | 513.6 | 513.6 | |||||||||||||||||||||||||
Change in Net Unrealized Gain on Securities (net of tax benefit of $147.9) | (269.1 | ) | (269.1 | ) | |||||||||||||||||||||||
Change in Net Gain on Cash Flow Hedges (net of tax expense of $19.7) | 36.4 | 36.4 | |||||||||||||||||||||||||
Change in Foreign Currency Translation Adjustment (net of tax benefit of $0.2) | (73.9 | ) | (73.9 | ) | |||||||||||||||||||||||
Change in Minimum Pension Liability Adjustment (net of tax benefit of $6.7) | (11.0 | ) | (11.0 | ) | |||||||||||||||||||||||
Total Comprehensive Income | 196.0 | ||||||||||||||||||||||||||
Common Stock Activity | 0.3 | 39.5 | (7.3 | ) | 32.5 | ||||||||||||||||||||||
Dividends to Stockholders | (88.7 | ) | (88.7 | ) | |||||||||||||||||||||||
Balance at December 31, 2005 | $ | 30.1 | $ | 1,627.9 | $ | 1,163.5 | $ | 4,610.4 | $ | (54.2 | ) | $ | (13.8 | ) | $ | 7,363.9 | |||||||||||
| Year Ended December 31 | |||||||||
| 2008 | 2007 | 2006 | |||||||
| (in millions of dollars) | |||||||||
Common Stock | |||||||||
Balance at Beginning of Year | $ | 36.3 | $ | 34.4 | $ | 30.1 | |||
Common Stock Activity | - | 1.9 | 4.3 | ||||||
Balance at End of Year | 36.3 | 36.3 | 34.4 | ||||||
Additional Paid-in Capital | |||||||||
Balance at Beginning of Year | 2,516.9 | 2,200.0 | 1,627.9 | ||||||
Common Stock Activity | 30.0 | 316.9 | 585.9 | ||||||
Cumulative Effect of Accounting Principle Change - Note 1 | - | - | (13.8) | ||||||
Balance at End of Year | 2,546.9 | 2,516.9 | 2,200.0 | ||||||
Accumulated Other Comprehensive Income | |||||||||
Balance at Beginning of Year | 463.5 | 612.8 | 1,163.5 | ||||||
Change During Year | (1,421.7) | (149.3) | (466.6) | ||||||
Cumulative Effect of Accounting Principle Change - Note 1 | - | - | (84.1) | ||||||
Balance at End of Year | (958.2) | 463.5 | 612.8 | ||||||
Retained Earnings | |||||||||
Balance at Beginning of Year | 5,077.4 | 4,925.8 | 4,610.4 | ||||||
Net Income | 553.2 | 679.3 | 411.0 | ||||||
Dividends to Stockholders ($0.30 per common share) | (103.5) | (105.2) | (95.6) | ||||||
Cumulative Effect of Accounting Principle Changes - Note 1 | - | (422.5) | - | ||||||
Balance at End of Year | 5,527.1 | 5,077.4 | 4,925.8 | ||||||
Treasury Stock | |||||||||
Balance at Beginning of Year | (54.2) | (54.2) | (54.2) | ||||||
Purchases of Treasury Stock | (700.0) | - | - | ||||||
Balance at End of Year | (754.2) | (54.2) | (54.2) | ||||||
Deferred Compensation | |||||||||
Balance at Beginning of Year | - | - | (13.8) | ||||||
Cumulative Effect of Accounting Principle Change - Note 1 | - | - | 13.8 | ||||||
Balance at End of Year | - | - | - | ||||||
Total Stockholders’ Equity at End of Year | $ | 6,397.9 | $ | 8,039.9 | $ | 7,718.8 | |||
See notes to consolidated financial statements.
Index to Financial Statements
CONSOLIDATED STATEMENTS OF CASH FLOWS
UnumProvident CorporationUnum Group and Subsidiaries
| Year Ended December 31 | ||||||||||||
| 2005 | 2004 | 2003 | ||||||||||
| (in millions of dollars) | ||||||||||||
Cash Flows from Operating Activities | ||||||||||||
Net Income (Loss) | $ | 513.6 | $ | (253.0 | ) | $ | (386.4 | ) | ||||
Adjustments to Reconcile Net Income (Loss) to Net Cash Provided by Operating Activities | ||||||||||||
Policy Acquisition Costs Capitalized | (519.4 | ) | (570.9 | ) | (700.2 | ) | ||||||
Amortization of Policy Acquisition Costs | 463.7 | 442.3 | 473.4 | |||||||||
Amortization of Value of Business Acquired | 15.1 | 17.1 | 41.2 | |||||||||
Impairment of Intangible Assets | — | 856.4 | 190.9 | |||||||||
Depreciation | 72.7 | 63.4 | 56.3 | |||||||||
Net Realized Investment (Gain) Loss | 6.7 | (28.9 | ) | 186.0 | ||||||||
Reinsurance Receivable | (92.9 | ) | (134.9 | ) | 39.4 | |||||||
Insurance Reserves and Liabilities | 1,319.7 | 1,714.6 | 2,437.1 | |||||||||
Income Tax | 90.2 | (141.1 | ) | (168.4 | ) | |||||||
Cumulative Effect of Change in Accounting Principle | — | — | (39.9 | ) | ||||||||
Cash Transferred to Reinsurer for Individual Income Protection - Closed Block Restructuring Transaction | — | (707.4 | ) | — | ||||||||
Cash Transferred to Reinsurer on Amendment of Existing Contract from Coinsurance to Modified Coinsurance | — | — | (286.2 | ) | ||||||||
Other | (365.8 | ) | (510.6 | ) | (498.0 | ) | ||||||
Net Cash Provided by Operating Activities | 1,503.6 | 747.0 | 1,345.2 | |||||||||
Cash Flows from Investing Activities | ||||||||||||
Proceeds from Sales of Available-for-Sale Securities | 1,871.0 | 1,607.0 | 2,203.5 | |||||||||
Proceeds from Maturities of Available-for-Sale Securities | 1,169.7 | 1,744.8 | 2,748.7 | |||||||||
Proceeds from Sales and Maturities of Other Investments | 139.6 | 167.3 | 195.7 | |||||||||
Purchase of Available-for-Sale Securities | (4,370.1 | ) | (4,190.4 | ) | (6,959.4 | ) | ||||||
Purchase of Other Investments | (524.4 | ) | (115.4 | ) | (161.8 | ) | ||||||
Net Sales (Purchases) of Short-term Investments | 5.4 | (74.7 | ) | (119.0 | ) | |||||||
Acquisition of Business | (3.5 | ) | (0.7 | ) | 110.0 | |||||||
Disposition of Business | 8.8 | (12.9 | ) | (152.5 | ) | |||||||
Other | 70.2 | (44.7 | ) | 26.9 | ||||||||
Net Cash Used by Investing Activities | $ | (1,633.3 | ) | $ | (919.7 | ) | $ | (2,107.9 | ) | |||
| Year Ended December 31 | |||||||||
| 2008 | 2007 | 2006 | |||||||
| (in millions of dollars) | |||||||||
Cash Flows from Operating Activities | |||||||||
Net Income | $ | 553.2 | $ | 679.3 | $ | 411.0 | |||
Adjustments to Reconcile Net Income to | |||||||||
Net Cash Provided by Operating Activities | |||||||||
Change in Receivables | 77.2 | 235.5 | 65.2 | ||||||
Change in Deferred Acquisition Costs | (71.8) | (75.9) | (49.6) | ||||||
Change in Insurance Reserves and Liabilities | 717.5 | 887.2 | 1,440.5 | ||||||
Change in Income Tax Liabilities | (84.3) | 114.8 | (67.4) | ||||||
Change in Other Accrued Liabilities | (93.5) | (119.8) | (120.8) | ||||||
Non-cash Adjustments to Net Investment Income | (306.7) | (363.6) | (370.0) | ||||||
Net Realized Investment (Gain) Loss | 465.9 | 65.2 | (2.2) | ||||||
Depreciation | 68.8 | 66.2 | 72.5 | ||||||
Cash Received from Reinsurance Recapture | - | 211.4 | - | ||||||
Other, Net | (0.2) | 50.0 | 52.7 | ||||||
Net Cash Provided by Operating Activities | 1,326.1 | 1,750.3 | 1,431.9 | ||||||
Cash Flows from Investing Activities | |||||||||
Proceeds from Sales of Available-for-Sale Securities | 2,066.1 | 2,179.3 | 1,990.5 | ||||||
Proceeds from Maturities of Available-for-Sale Securities | 1,288.0 | 1,171.4 | 1,364.0 | ||||||
Proceeds from Sales and Maturities of Other Investments | 205.6 | 312.9 | 323.3 | ||||||
Purchase of Available-for-Sale Securities | (4,083.7) | (4,205.2) | (4,050.2) | ||||||
Purchase of Other Investments | (291.2) | (488.8) | (561.0) | ||||||
Net Sales (Purchases) of Short-term Investments | 432.8 | (836.2) | (225.4) | ||||||
Acquisition of Business | 48.8 | - | - | ||||||
Disposition of Business | - | 98.8 | - | ||||||
Other, Net | (91.1) | (87.2) | (63.2) | ||||||
Net Cash Used by Investing Activities | (424.7) | (1,855.0) | (1,222.0) | ||||||
Cash Flows from Financing Activities | |||||||||
Maturities and Benefit Payments from Policyholder Accounts | (10.2) | (5.7) | (7.2) | ||||||
Net Short-term Debt Repayments | (134.5) | - | - | ||||||
Issuance of Long-term Debt | - | 800.0 | 130.0 | ||||||
Long-term Debt Repayments | (105.9) | (769.5) | (732.0) | ||||||
Cost Related to Early Retirement of Debt | (0.4) | (34.2) | (17.9) | ||||||
Issuance of Common Stock | 4.4 | 307.8 | 580.0 | ||||||
Dividends Paid to Stockholders | (103.5) | (105.2) | (95.6) | ||||||
Purchases of Treasury Stock | (700.0) | - | - | ||||||
Other, Net | 0.6 | (12.0) | (14.3) | ||||||
Net Cash Provided (Used) by Financing Activities | (1,049.5) | 181.2 | (157.0) | ||||||
Effect of Foreign Exchange Rate Changes on Cash | (1.1) | 1.3 | 1.3 | ||||||
Net Increase (Decrease) in Cash and Bank Deposits | (149.2) | 77.8 | 54.2 | ||||||
Cash and Bank Deposits at Beginning of Year | 199.1 | 121.3 | 67.1 | ||||||
Cash and Bank Deposits at End of Year | $ | 49.9 | $ | 199.1 | $ | 121.3 | |||
See notes to consolidated financial statements.
Index to Financial Statements
CONSOLIDATED STATEMENTS OF CASH FLOWS - ContinuedCOMPREHENSIVE INCOME (LOSS)
UnumProvident CorporationUnum Group and Subsidiaries
| Year Ended December 31 | ||||||||||||
| 2005 | 2004 | 2003 | ||||||||||
| (in millions of dollars) | ||||||||||||
Cash Flows from Financing Activities | ||||||||||||
Deposits to Policyholder Accounts | $ | 2.9 | $ | 3.7 | $ | 5.0 | ||||||
Maturities and Benefit Payments from Policyholder Accounts | (7.4 | ) | (11.3 | ) | (19.5 | ) | ||||||
Net Short-term Debt | (227.0 | ) | — | (255.0 | ) | |||||||
Issuance of Long-term Debt | 399.6 | 300.0 | 575.0 | |||||||||
Issuance of Common Stock | 18.1 | 5.7 | 551.9 | |||||||||
Dividends Paid to Stockholders | (88.7 | ) | (88.4 | ) | (98.1 | ) | ||||||
Other | (26.5 | ) | (27.8 | ) | (24.5 | ) | ||||||
Net Cash Provided by Financing Activities | 71.0 | 181.9 | 734.8 | |||||||||
Effect of Foreign Exchange Rate Changes on Cash | (2.6 | ) | 2.3 | 4.9 | ||||||||
Net Increase (Decrease) in Cash and Bank Deposits | (61.3 | ) | 11.5 | (23.0 | ) | |||||||
Cash and Bank Deposits at Beginning of Year | 130.7 | 119.2 | 142.2 | |||||||||
Cash and Bank Deposits at End of Year | $ | 69.4 | $ | 130.7 | $ | 119.2 | ||||||
| Year Ended December 31 | |||||||||
| 2008 | 2007 | 2006 | |||||||
| (in millions of dollars) | |||||||||
Net Income | $ | 553.2 | $ | 679.3 | $ | 411.0 | |||
Other Comprehensive Income (Loss) | |||||||||
Change in Net Unrealized Gains and Losses on | (2,394.5) | (248.8) | (613.0) | ||||||
Reclassification Adjustment for Net Realized | 114.8 | 0.3 | (0.6) | ||||||
Change in Net Gain on Cash Flow Hedges | 276.0 | (11.7) | (79.1) | ||||||
Change in Adjustment to Reserves for Future Policy | 1,091.0 | 69.8 | 107.7 | ||||||
Change in Foreign Currency Translation Adjustment | (301.0) | 7.4 | 93.6 | ||||||
Change in Unrecognized Pension and Postretirement | (208.0) | 33.7 | 24.8 | ||||||
Total Other Comprehensive Loss | (1,421.7) | (149.3) | (466.6) | ||||||
Comprehensive Income (Loss) | $ | (868.5) | $ | 530.0 | $ | (55.6) | |||
See notes to consolidated financial statements.
Index to Financial Statements
NOTES TO CONSOLIDATED FINANCIAL STATEMENTS
UnumProvident CorporationUnum Group and Subsidiaries
Note 1 - Significant Accounting Policies
Basis of Presentation: The accompanying consolidated financial statements of Unum Group and its subsidiaries (the Company) have been prepared in accordance with U.S. generally accepted accounting principles (GAAP). Such accounting principles differ from statutory accounting principles (see Note 16)15). The consolidated financial statements include the accounts of UnumProvident Corporation and its subsidiaries (the Company). Material intercompanyIntercompany transactions have been eliminated. Certain prior year amounts have been reclassified to conform to current year presentation.
During 2004, the Company completedIn March 2007, we closed the sale of its Canadian branch. Financialour wholly-owned subsidiary GENEX Services, Inc. (GENEX). The financial results for the Canadian branchof GENEX are reported as discontinued operations in the consolidated financial statements, and, exceptstatements. Except where noted, the information presented in the notes to the consolidated financial statements excludes the Canadian branch.GENEX. See Note 2 for further discussion ofdiscussion.
Freestanding derivatives with positive fair values are reported on our consolidated balance sheets at fair value as assets within other long-term investments, and those with negative fair values are carried as liabilities within other liabilities. Embedded derivatives, excluding those associated with modified coinsurance arrangements, are reported on the Company’s discontinued operations.
consolidated balance sheets at fair value with the host contract. The embedded derivatives associated with modified coinsurance contracts are reported at fair value as either other long-term investments or other liabilities in the consolidated balance sheets. We previously reported our freestanding derivatives and our embedded derivatives related to reinsurance contracts on a net basis within fixed maturity securities. We have increased fixed maturity securities, other long-term investments, and other liabilities $160.0 million, $109.2 million, and $269.2 million, respectively, at December 31, 2007 to conform to the current year presentation.
Description of Business: The Company isWe are the largest provider of group and individual income protectiondisability products in the United States and the United Kingdom. ItWe also providesprovide a complementary portfolio of other insurance products, including long-term care insurance, life insurance, employer- and employee-paid group benefits, and other related services. It markets itsWe market our products primarily to employers interested in providing benefits to their employees. The Company has
We have three major business segments: U.S. Brokerage, Unum Limited,US, Unum UK, and Colonial as well asLife. Our other segments are the Individual Income Protection –Disability - Closed Block segment Other segment, and the Corporate and Other segment. See Note 1413 for further discussion of theour operating segments.
Use of Estimates: The preparation of financial statements in conformity with GAAP requires managementus to make estimates and assumptions that affect amounts reported in the financial statements and accompanying notes. Such estimates and assumptions could change in the future as more information becomes known, which could impact the amounts reported and disclosed herein.
Many factors influence the assumptions upon which reserves for policy and contract benefits are based, including historical trends in the Company’sour experience and expected deviations from historical experience. Considerable judgment is required to interpret actual historical experience and to assess the future factors that are likely to influence the ultimate cost of settling existing claims. Given that insurance products contain inherent risks and uncertainties, the ultimate liability may be more or less than such estimates indicate.
Investments: Investments are reported in theour consolidated statements of financial conditionbalance sheets as follows:
Available-for-Sale Fixed Maturity Securities, which include bonds and redeemable preferred stocks classified as available-for-sale, are reported at fair value.
Equity Securities Interest income is recorded as part of net investment income when earned, using an effective yield method giving effect to amortization of premium and accretion of discount. Payment terms specified for fixed maturity securities may include a prepayment penalty for unscheduled payoff of the investment. Prepayment penalties are reported at fair value.
Mortgage Loans are generally carried at amortized cost less an allowance for probable losses.
Real Estateclassifiedrecognized as investment real estate is carried at cost less accumulated depreciation. Real estate acquired through foreclosure is valued at fair value at the date of foreclosure. Ifincome when received.
Included within fixed maturity securities are mortgage-backed and asset-backed securities. We recognize investment real estate is determined to be other than temporarily impaired, the carrying amountincome on these securities using a constant effective yield based on projected prepayments of the asset is reduced
Index to fair value. Occasionally, investment real estate is reclassified to real estate held for sale when it no longer meets the Company’s investment criteria. Real estate held for sale is valued net of a valuation allowance that reduces the carrying value to the lower of cost less accumulated depreciation or fair value less estimated cost to sell. Accumulated depreciation on real estate was $9.3 million and $14.1 million as of December 31, 2005 and 2004, respectively.Financial Statements
NOTES TO CONSOLIDATED FINANCIAL STATEMENTS - Continued
UnumProvident CorporationUnum Group and Subsidiaries
Note 1 - Significant Accounting Policies - Continued
Policy Loansunderlying loans and the estimated economic life of the securities. Actual prepayment experience is reviewed periodically, and effective yields are presented at unpaid balances directly related to policyholders. Includedrecalculated when differences arise between prepayments originally projected and the actual prepayments received and currently projected. The effective yield is recalculated on a retrospective basis, and the adjustment is reflected in policy loans are $3,005.4 million and $2,881.2 million of policy loans ceded to reinsurers at December 31, 2005 and 2004, respectively.
Other Long-term Investmentsare carried at cost plus the Company’s share of changes in the investee’s ownership equity since acquisition.
Short-term Investmentsare carried at cost.
net investment income.
Fixed maturity securities include bonds and redeemable preferred stocks. Equity securities include common stocks and nonredeemable preferred stocks. Fixed maturity and equity securities not bought and held for the purpose of selling in the near term but for which the Company doeswe do not have the positive intent and ability to hold to maturity are classified as available-for-sale.
Changes in the fair value of available-for-sale fixed maturity securities and equity securities are reported as a component of other comprehensive income. These amounts are net of income tax and valuation adjustments to deferred acquisition costs and reserves for future policy and contract benefits which would have been recorded had the related unrealized gain or loss on these securities been realized.
Mortgage Loans are generally carried at amortized cost less an allowance for probable losses. Interest income is accrued on the principal amount of the loan based on the loan’s contractual interest rate. Payment terms specified for mortgage loans may include a prepayment penalty for unscheduled payoff of the investment. Prepayment penalties are recognized as investment income when received.
Policy Loans are presented at unpaid balances directly related to policyholders. Interest income is accrued on the principal amount of the loan based on the loan’s contractual interest rate. Included in policy loans are $2,555.6 million and $2,422.0 million of policy loans ceded to reinsurers at December 31, 2008 and 2007, respectively.
Other Long-term Investments are comprised primarily of freestanding derivatives with a net positive fair value and private equity fund limited partnerships. For determining whether the fair value of freestanding derivatives is a net positive, the derivatives are grouped by counterparty for which a master netting agreement has been executed. Private equity fund limited partnerships are generally carried at cost plus our share of changes in the investee’s ownership equity since acquisition.
Short-term Investments are carried at cost. Short-term investments include investments maturing within one year, such as corporate commercial paper and U.S. Treasury bills, bank term deposits, and other cash accounts and cash equivalents earning interest.
We discontinue the accrual of investment income on invested assets when collection is uncertain. We recognize investment income on impaired investments when the income is received.
Realized investment gains and losses, which are reported as a component of revenue in the consolidated statements of operations,income, are based upon specific identification of the investments sold and do not include amounts allocable to separate accounts. At the time a decline in the value of an investment is determined to be other than temporary, a loss is recorded which is included in realized investment gains and losses.
The Company discontinues the accrual of investment incomeCash and Bank Deposits: Cash and bank deposits include cash on invested assets when it is determined that collection is uncertain. The Company recognizes investment income on impaired investments when the income is received.
hand and non-interest bearing cash and deposit accounts.
Derivative Financial Instruments: The Company recognizesWe recognize all of itsour derivative instruments (including certain derivative instruments embedded in other contracts) as either assets or liabilities in theour consolidated statements of financial conditionbalance sheets and measuresmeasure those instruments at fair value.
The accounting for changes in the fair value (i.e., gain or loss) of a derivative depends on whether it has been designated and qualifies as part of a hedging relationship, and further, on the type of hedging relationship. To qualify as a hedging instrument, a derivative must pass prescribed effectiveness tests, performed quarterly using
Index to Financial Statements
NOTES TO CONSOLIDATED FINANCIAL STATEMENTS - Continued
Unum Group and Subsidiaries
Note 1 - Significant Accounting Policies - Continued
both qualitative and quantitative methods. For those derivatives that are designated and qualify as hedging instruments, the derivative is designated, based upon the exposure being hedged, as one of the following:
Fair value hedge. Changes in the fair value of the derivative as well as the offsetting change in fair value on the hedged item attributable to the risk being hedged are recognized in current earnings during the period of change in fair value. The gain or loss on the termination of an effective fair value hedge is recognized in current earnings.
Cash flow hedge. To the extent it is effective, changes in the fair value of the derivative are reported in other comprehensive income and reclassified into earnings in the same period or periods during which the hedged item affects earnings. The ineffective portion of the hedge, if any, is recognized in current earnings during the period of change in fair value. The gain or loss on the termination of an effective cash flow hedge is reported in other comprehensive income and reclassified into earnings in the same period or periods during which the hedged item affects earnings.
NOTES TO CONSOLIDATED FINANCIAL STATEMENTS - Continued
UnumProvident Corporation and Subsidiaries
Note 1 - Significant Accounting Policies - Continued
Foreign currency exposure hedge. To the extent it is effective, changes in the fair value of the derivative are reported in other comprehensive income as part of the foreign currency translation adjustment and reclassified into earnings in the same period or periods during which remeasurement of the hedged foreign currency asset affects earnings. The ineffective portion of the hedge, if any, is recognized in current earnings during the period of change in fair value.Thevalue. The gain or loss on the termination of an effective foreign currency exposure hedge is reported in other comprehensive income as part of the foreign currency translation adjustment and reclassified into earnings in the same period or periods during which remeasurement of the hedged foreign currency asset affects earnings.
Gains or losses on the termination of ineffective hedges are reported in current earnings. In the event a hedged item is disposed of or the anticipated transaction being hedged is no longer likely to occur, the Companywe will terminate the related derivative and recognize the gain or loss on termination in current earnings.
For a derivative not designated as a hedging instrument, the change in fair value is recognized in earnings during the period of change.
We report changes in the fair values of certain embedded derivatives as realized investment gains and losses during the period of change, as required under the provisions of Statement of Financial Accounting Standards No. 133 Implementation Issue B36 (DIG Issue B36),Embedded Derivatives: Modified Coinsurance Arrangements and Debt Instruments That Incorporate Credit Risk Exposure That Are Unrelated or Only Partially Related to the Creditworthiness of the Obligor Under Those Instruments.
Reinsurance ReceivableRecoverable: The CompanyWe routinely cedescede reinsurance to other insurance companies. For ceded reinsurance agreements wherein the Company iswe are not relieved of itsour legal liability to itsour policyholders, the Company reportswe report assets and liabilities on a gross basis. Reinsurance receivables includeOur reinsurance recoverable includes the balances due from reinsurers under the terms of these reinsurance agreements for ceded policy and contract benefits, ceded future policy and contract benefits, and ceded unearned premiums, less ceded policy loans.
Deferred Policy Acquisition Costs: Certain costs of acquiring new business that vary with and are primarily related to the production of new business have been deferred. Such costs include commissions, other agency compensation, certain selection and policy issue expenses, and certain field expenses. Acquisition costs that do not vary with the production of new business, such as commissions on group products which are generally level throughout the life of the policy, are excluded from deferral. Deferred policy acquisition costs are subject to recoverability testing at the time of policy issue and loss recognition testing subsequent to the year of issue.
Deferred policy acquisition costs related to traditional policies are amortized over the premium paying period of the related policies in proportion to the ratio of the present value of annual expected premium income to the present value of
Index to Financial Statements
NOTES TO CONSOLIDATED FINANCIAL STATEMENTS - Continued
Unum Group and Subsidiaries
Note 1 - Significant Accounting Policies - Continued
total expected premium income. Such amortization is adjusted annually to reflect the actual policy persistency as compared to the anticipated experience.
Deferred policy acquisition costs related to interest-sensitive policies are amortized over the lives of the policies in relation to the present value of estimated gross profits from surrender charges, and mortality margins, investment returns, and expense margins. Adjustments are made each year to reflect actual experience for assumptions which deviate significantly compared to anticipated experience.
Internal replacement transactions wherein the modification does not substantially change the policy are accounted for as continuations of the replaced contracts. Unamortized deferred acquisition costs from the original policy continue to be amortized over the expected life of the new policy, and the costs of replacing the policy are accounted for as policy maintenance costs and expensed as incurred. Internal replacement transactions, principally on group contracts, that result in a policy that is substantially changed are accounted for as an extinguishment of the original policy and the issuance of a new policy. Unamortized deferred acquisition costs on the original policy that was replaced are immediately expensed, and the costs of acquiring the new policy are capitalized and amortized in accordance with our accounting policies for deferred acquisition costs.
Loss recognition is generally performed on an annual basis. Insurance contracts are grouped onfor each major product line within a basis consistent withsegment when we perform the Company’s manner of acquiring, servicing, and measuring profitability of the contracts.loss recognition tests. If loss recognition testing indicates that deferred policy acquisition costs are not recoverable, the deficiency is charged to expense. The assumptions used in loss recognition testing represent management’sour best estimates of future experience.
NOTES TO CONSOLIDATED FINANCIAL STATEMENTS - ContinuedGoodwill: Goodwill is the excess of the amount paid to acquire a business over the fair value of the net assets acquired. We review the carrying amount of goodwill for impairment during the fourth quarter of each year or more frequently if events or changes in circumstances indicate that the carrying amount might not be recoverable. Goodwill impairment testing compares the fair value of a reporting unit with its carrying amount, including goodwill. The fair values of the reporting units are determined using discounted cash flow models. The critical estimates necessary in determining fair value are projected earnings and the discount rate. We set our discount rate assumption based on an expected risk adjusted cost of capital. If the fair value of the reporting unit to which the goodwill relates is less than the carrying amount of the unamortized goodwill, the carrying amount is reduced with a corresponding charge to expense.
UnumProvident CorporationProperty and SubsidiariesEquipment: Property and equipment is reported at cost less accumulated depreciation, which is calculated on the straight-line method over the estimated useful life. The accumulated depreciation for property and equipment was $563.7 million and $539.8 million as of December 31, 2008 and 2007, respectively.
Note 1 - Significant Accounting Policies - Continued
The following table provides the changes in deferred policy acquisition costs:
(in millions of dollars)
| U.S. Brokerage | Unum Limited | Colonial | Individual Income Protection - Closed Block | Corporate and Other | Consolidated | |||||||||||||||||||
Balances at December 31, 2002 | $ | 1,965.8 | $ | 107.0 | $ | 440.6 | $ | 318.3 | $ | 0.8 | $ | 2,832.5 | ||||||||||||
Capitalized | 458.8 | 33.6 | 166.1 | 7.5 | (0.1 | ) | 665.9 | |||||||||||||||||
Amortized | (282.0 | ) | (17.0 | ) | (118.3 | ) | (41.3 | ) | — | (458.6 | ) | |||||||||||||
Foreign Currency and Other | (0.5 | ) | 14.7 | — | (2.3 | ) | 0.2 | 12.1 | ||||||||||||||||
Balances at December 31, 2003 | 2,142.1 | 138.3 | 488.4 | 282.2 | 0.9 | 3,051.9 | ||||||||||||||||||
Capitalized | 346.0 | 37.7 | 173.7 | — | (0.1 | ) | 557.3 | |||||||||||||||||
Amortized | (286.3 | ) | (19.2 | ) | (131.2 | ) | — | — | (436.7 | ) | ||||||||||||||
Impairment | — | — | — | (282.2 | ) | — | (282.2 | ) | ||||||||||||||||
Foreign Currency and Other | (5.6 | ) | (1.9 | ) | — | — | (0.3 | ) | (7.8 | ) | ||||||||||||||
Balances at December 31, 2004 | 2,196.2 | 154.9 | 530.9 | — | 0.5 | 2,882.5 | ||||||||||||||||||
Capitalized | 311.9 | 34.1 | 173.4 | — | — | 519.4 | ||||||||||||||||||
Amortized | (306.9 | ) | (21.6 | ) | (134.7 | ) | — | (0.5 | ) | (463.7 | ) | |||||||||||||
Foreign Currency and Other | — | (24.9 | ) | — | — | — | (24.9 | ) | ||||||||||||||||
Balances at December 31, 2005 | $ | 2,201.2 | $ | 142.5 | $ | 569.6 | $ | — | $ | — | $ | 2,913.3 | ||||||||||||
A change in the Company’s reporting segments during 2004 required the Company to perform, separately for the individual income protection – closed block segment, loss recognition testing for the recoverability of deferred policy acquisition costs. The testing indicated impairment of $282.2 million. See Note 14 for further discussion.
Value of Business Acquired: Value of business acquired represents the present value of future profits recorded in connection with the acquisition of a block of insurance policies. The asset is amortized based upon expected future premium income for traditional insurance policies and estimated future gross profits for interest-sensitive insurance policies, withpolicies. The value of business acquired, which is included in other assets in the accrual of interest added to the unamortizedconsolidated balance sheets, was $50.5 million and $71.2 million at interest rates principally ranging from 5.05 percent to 6.00 percent.December 31, 2008 and 2007, respectively. The accumulated amortization for value of business acquired was $83.8$92.2 million and $75.6$110.9 million as of December 31, 20052008 and 2004,2007, respectively. The Companyamortization of value of business acquired, which is included in other expenses in the consolidated statements of income, was $7.8 million, $7.9 million, and $8.0 million for the years ended December 31, 2008, 2007, and 2006, respectively. We periodically reviewsreview the carrying amount of value of business acquired using the same methods used to evaluate deferred policy acquisition costs.
Policy and Contract Benefits: Policy and contract benefits represent amounts paid and expected to be paid based on reported losses and estimates of incurred but not reported losses for traditional life and accident and health products. For interest-sensitive products, benefits are the amounts paid and expected to be paid on insured claims in excess of the policyholders’ policy fund balances.
Index to Financial Statements
NOTES TO CONSOLIDATED FINANCIAL STATEMENTS - Continued
Unum Group and Subsidiaries
Note 1 - Significant Accounting Policies - Continued
Policy and Contract Benefits Liabilities: Policy reserves represent future policy and contract benefits for claims not yet incurred. Policy reserves for traditional life and accident and health products are determined using the net level premium method. The reserves are calculated based upon assumptions as to interest, persistency, morbidity, and mortality that were appropriate at the date of issue. Interest rate assumptions are based on actual and expected net investment returns. Persistency assumptions are based on our actual historical experience adjusted for future expectations. Morbidity and mortality assumptions are based on actual experience or industry standards adjusted as appropriate to reflect our actual experience and future expectations. The assumptions vary by plan, year of issue, and policy duration and include a provision for adverse deviation.
Policy reserves for group single premium annuities have been provided on a net single premium method. The reserves are calculated based on assumptions as to interest, mortality, and retirement that were appropriate at the date of issue. Mortality assumptions are based upon industry standards adjusted as appropriate to reflect our actual experience and future expectations. The assumptions vary by year of issue.
Policy reserves for interest-sensitive products are principally policyholder account values.
We perform loss recognition tests on our policy reserves annually, or more frequently if appropriate, using best estimate assumptions as of the date of the test, without a provision for adverse deviation. We group the policy reserves for each major product line within a segment when we perform the loss recognition tests. If the policy reserves determined using these best estimate assumptions are higher than our existing policy reserves net of any deferred acquisition cost balance, the existing policy reserves are increased or deferred acquisition costs are reduced to immediately recognize the deficiency.
Claim reserves represent future policy and contract benefits for claims that have been incurred or are estimated to have been incurred but not yet reported to us. Our claim reserves relate primarily to disability policies and are calculated based on assumptions as to interest and claim resolution rates that are currently appropriate. Claim resolution rate assumptions are based on our actual experience. The interest rate assumptions used for discounting claim reserves are based on projected portfolio yield rates, after consideration for defaults and investment expenses, for the assets supporting the liabilities for the various product lines. Unlike policy reserves, claim reserves are subject to revision as current claim experience and projections of future experience change.
Policyholders’ Funds: Policyholders’ funds represent customer deposits plus interest credited at contract rates. We control interest rate risk by investing in quality assets which have an aggregate duration that closely matches the expected duration of the liabilities.
Income Tax: Deferred taxes reflect the net tax effects of temporary differences between the carrying amounts of assets and liabilities for financial statement purposes and the amounts used for income tax purposes. Deferred taxes have been measured using enacted statutory income tax rates and laws that are currently in effect. We record deferred tax assets for tax positions taken in the U.S. and other tax jurisdictions based on our assessment of whether a position is more likely than not to be sustained upon examination based solely on its technical merits. A valuation allowance is established for deferred tax assets when it is more likely than not that an amount will not be realized.
Deferred Gain or Loss on Reinsurance: Where applicable, gains or losses on reinsurance transactions are deferred and amortized into earnings based upon expected future premium income for traditional insurance policies and estimated future gross profits for interest-sensitive insurance policies. The deferred gain on reinsurance included in other liabilities in our consolidated balance sheets at December 31, 2008 and 2007 was $150.0 million and $177.8 million, respectively.
Index to Financial Statements
NOTES TO CONSOLIDATED FINANCIAL STATEMENTS - Continued
Unum Group and Subsidiaries
Note 1 - Significant Accounting Policies - Continued
GoodwillSeparate Accounts: Goodwill isThe separate account amounts shown in our consolidated balance sheets represent contributions by contract holders to variable-benefits and fixed-benefits pension plans. The contract purchase payments and the excessassets of the amount paidseparate accounts are segregated from other funds for both investment and administrative purposes. Contract purchase payments received under variable annuity contracts are subject to acquire a business overdeductions for sales and administrative fees. Also, the fair valuesponsoring companies of the separate accounts receive management fees based on the net assets acquired. The carrying amount of goodwill is reviewed for impairment annually or whenever events or changes in circumstances indicate that the carrying amount might not be recoverable. If the fair valueasset values of the operations to which the goodwill relates is less than the carrying amount of the unamortized goodwill, the carrying amount is reduced with a corresponding charge to expense.separate accounts.
Property and EquipmentTreasury Stock: Property and equipmentTreasury stock is reportedreflected as a reduction of stockholders’ equity at cost less accumulated depreciation, which is calculated on the straight-line method over the estimated useful life. The accumulated depreciation for property and equipment was $477.3 million and $468.6 million as of December 31, 2005 and 2004, respectively.cost.
Revenue Recognition: Traditional life and accident and health products are long duration contracts, and premium income is recognized as revenue when due from policyholders. If the contracts are experience rated, the estimated ultimate premium is recognized as revenue over the period of the contract. The estimated ultimate premium, which is revised to reflect current experience, is based on estimated claim costs, expenses, and profit margins.
NOTES TO CONSOLIDATED FINANCIAL STATEMENTS - Continued
UnumProvident Corporation and Subsidiaries
Note 1 - Significant Accounting Policies - Continued
For interest-sensitive products, the amounts collected from policyholders are considered deposits, and only the deductions during the period for cost of insurance, policy administration, and surrenders are included in revenue. Policyholders’ funds represent funds deposited by contract holders and are not included in revenue.
Policy and Contract BenefitsPremium Tax Expense: Policy and contract accrued benefits, principally related to accident and health insurance policies, are based on reported losses and estimates of incurred but not reported losses for traditional life and accident and health products. For interest-sensitive products, benefits are the amounts paid and expected to be paid on insured claims in excess of the policyholders’ policy fund balances.
Policy and Contract Benefits Liabilities: Active life reserves for future policy and contract benefits on traditional life and accident and health products have been provided on the net level premium method. The reserves are calculated based upon assumptions as to interest, withdrawal, morbidity, and mortality that were appropriate at the date of issue. Interest assumptions for active life reserves may be graded downward over a period of years. Withdrawal assumptions are based on actual Company experience. Morbidity and mortality assumptions are based upon industry standards adjusted as appropriate to reflect actual Company experience. The assumptions vary by plan, year of issue, and policy duration and include a provision for adverse deviation.
Disabled lives reserves for future policy and contract benefits on disability policies are calculated based upon assumptions as to interest and claim resolution rates that are currently appropriate. Claim resolution rate assumptions are based on Company experience. The interest rate assumptions used for discounting claim reserves are based on projected portfolio yield rates, after consideration for defaults and investment expenses, for the assets supporting the liabilities for the various product lines. The assets for each product line are selected according to the specific investment strategy for that product line to produce asset cash flows that follow similar timing and amount patterns to those of the anticipated liability payments.
Reserves for future policy and contract benefits on group single premium annuities have been provided on a net single premium method. The reserves are calculated based on assumptions as to interest, mortality, and retirement that were appropriate at the date of issue. Mortality assumptions are based upon industry standards adjusted as appropriate to reflect actual Company experience. The assumptions vary by year of issue.
Reserves for future policy and contract benefits on interest-sensitive products are principally policyholder account values.
Policyholders’ Funds: Policyholders’ funds represent customer deposits plus interest credited at contract rates. The Company controls its interest rate risk by investing in quality assets which have an aggregate duration that closely matches the expected duration of the liabilities.
Income Tax: Deferred taxes reflect the netPremium tax effects of temporary differences between the carrying amounts of assets and liabilities for financial statement purposes and the amounts used for income tax purposes. Deferred taxes have been measured using enacted statutory income tax rates and laws that are currently in effect. A valuation allowanceexpense is established for deferred tax assets when it is more likely than not that an amount will not be realized.
Deferred Gain or Loss on Reinsurance: The Company is a party to various reinsurance agreements. Where applicable, gains or losses on these transactions are deferred and amortized into earnings based upon expected future premium income for traditional insurance policies and estimated future gross profits for interest-sensitive insurance policies. The deferred gain on reinsurance included in other liabilitiesoperating expenses in the consolidated statements of financial condition atincome. For the years ended December 31, 20052008, 2007, and 20042006, premium tax expense was $204.2$133.2 million, $130.8 million, and $236.4$140.5 million, respectively.
NOTES TO CONSOLIDATED FINANCIAL STATEMENTS - Continued
UnumProvident Corporation and Subsidiaries
Note 1 - Significant Accounting Policies - Continued
Separate Accounts: The separate account amounts shown in the accompanying consolidated financial statements represent contributions by contract holders to variable-benefits and fixed-benefits pension plans. The contract purchase payments and the assets of the separate accounts are segregated from other Company funds for both investment and administrative purposes. Contract purchase payments received under variable annuity contracts are subject to deductions for sales and administrative fees. Also, the sponsoring companies of the separate accounts receive management fees based on the net asset values of the separate accounts.
Translation of Foreign Currency: Revenues and expenses of the Company’s continuing and discontinuedour foreign operations are translated at average exchange rates. Assets and liabilities are translated at the rate of exchange on the balance sheet date. The translation gain or loss is generally reported in accumulated other comprehensive income, net of deferred tax.
Accounting for Participating Individual Life Insurance: Participating policies issued by one of the Company’sour subsidiaries prior to its 1986 conversion from a mutual to a stock life insurance company will remain participating as long as the policies remain in force. A Participation Fund Account (PFA) was established for the benefit of all such individual participating life and annuity policies and contracts. The assets of the PFA provide for the benefit, dividend, and certain expense obligations of the participating individual life insurance policies and annuity contracts. The PFA was $353.1$391.2 million and $353.0$362.0 million at December 31, 20052008 and 2004,2007, respectively, and represented approximately 0.8 and 0.7 percent of consolidated assets and 0.7 and 0.8 percent of consolidated liabilities at December 31, 20052008 and 2004,2007, respectively.
Accounting Pronouncements Adopted:
Effective January 1, 2003, the Company2008, we adopted the fair value recognition provisions of Statement of Financial Accounting Standards No. 123 (SFAS 123),Accounting for Stock-Based Compensation, and selected the prospective method of adoption allowed under the provisions of Statement of Financial Accounting Standards No. 148157 (SFAS 148)157),Fair Value Measurements. SFAS 157 defines fair value, establishes a framework for measuring fair value, and expands disclosures about fair value measurements. The adoption of SFAS 157 did not have a material effect on our financial position or results of operations.
Effective December 31, 2008, we adopted the provisions of Financial Accounting Standards Board (FASB) Staff Position No. EITF 99-20-1, (FSP EITF 99-20-1),Amendments to the Impairment Guidance of EITF Issue No. 99-20. This FSP amends the impairment guidance in Emerging Issues Task Force (EITF) Issue No. 99-20,Recognition of Interest Income and Impairment on Purchased Beneficial Interests and Beneficial Interests That Continue to Be Held by a Transferor in Securitized Financial Assets,” to achieve more consistent determination of whether an other-than-temporary impairment has occurred. The FSP also retains and emphasizes the objective of an other-than-temporary impairment assessment and the related disclosure requirements in Statement of Financial Accounting Standards No. 115,Accounting for Stock-Based Compensation – TransitionCertain Investments in Debt and Disclosure. The recognition provisions were applied to all employee awards granted, modified, or settled after January 1, 2003. Prior to 2003, the Company accounted for various stock-based employee compensation plans under the recognition and measurement principles of Accounting Principles Board Opinion No. 25 (Opinion 25),Accounting for Stock Issued to EmployeesEquity Securities, and other related Interpretations.guidance. The adoption of FSP EITF 99-20-1 did not have a material effect on our financial position or results of operations.
Index to Financial Statements
NOTES TO CONSOLIDATED FINANCIAL STATEMENTS - Continued
UnumProvident CorporationUnum Group and Subsidiaries
Note 1 - Significant Accounting Policies - Continued
Had the Company applied the fair value recognition provisions of SFAS 123 as of its original effective date, pro forma net income (loss) and net income (loss) per share would be as follows:
| Year Ended December 31 | ||||||||||||
| 2005 | 2004 | 2003 | ||||||||||
| (in millions of dollars, except share data) | ||||||||||||
Net Income (Loss), as Reported | $ | 513.6 | $ | (253.0 | ) | $ | (386.4 | ) | ||||
Add: Stock-based Employee Compensation Expense Included in Net Income (Loss) as a Result of the Prospective Application Allowed Under SFAS 148, Net of Tax | 0.7 | 0.8 | 0.6 | |||||||||
Deduct: Stock-based Employee Compensation Expense Determined under SFAS 123, Net of Tax | (1.2 | ) | (4.8 | ) | (12.8 | ) | ||||||
Pro Forma Net Income (Loss) | $ | 513.1 | $ | (257.0 | ) | $ | (398.6 | ) | ||||
Net Income (Loss) Per Share: | ||||||||||||
Basic - as Reported | $ | 1.74 | $ | (0.86 | ) | $ | (1.40 | ) | ||||
Basic - Pro Forma | $ | 1.73 | $ | (0.87 | ) | $ | (1.44 | ) | ||||
Assuming Dilution - as Reported | $ | 1.64 | $ | (0.86 | ) | $ | (1.40 | ) | ||||
Assuming Dilution - Pro Forma | $ | 1.64 | $ | (0.87 | ) | $ | (1.44 | ) | ||||
Effective OctoberJanuary 1, 2003, the Company2007, we adopted the provisions of Statement of Financial Accounting Standards No. 133 Implementation Issue B36 (DIG Issue B36),Embedded Derivatives: Modified Coinsurance Arrangements and Debt Instruments That Incorporate Credit Risk Exposure That Are Unrelated or Only Partially Related to the Creditworthiness of the Obligor Under Those Instruments.DIG Issue B36 addresses financial accounting and reporting for embedded derivatives in modified coinsurance contracts that incorporate credit risk exposure unrelated to the credit risk of the counterparty to the reinsurance contract and requires the bifurcation of any such derivative from the host reinsurance contract. The Company had two reinsurance contracts for which DIG Issue B36 was applicable, one of which was recaptured in 2005.
The adoption of DIG Issue B36 resulted in a $39.9 million cumulative effect of accounting principle change ($0.14 per common share, basic and assuming dilution), net of $21.4 million in tax. The adoption of DIG Issue B36 requires the change in the fair value of the embedded derivatives to be reported as a realized investment gain or loss during the period of change.
Accounting Pronouncements Outstanding:
Statement of Financial Accounting Standards No. 123 (revised 2004) (SFAS 123(R)),Share-Based Payment, requires all stock-based employee compensation, including grants of employee stock options, to be recognized in the financial statements using the fair value based method. SFAS 123(R) is a revision of SFAS 123 and supersedes Opinion 25. The Company will adopt the provisions of SFAS 123(R) effective January 1, 2006. Because the Company adopted the fair value recognition provision of SFAS 123 effective January 1, 2003, the adoption of this pronouncement will have an immaterial effect on the Company’s financial position and results of operations.
NOTES TO CONSOLIDATED FINANCIAL STATEMENTS - Continued
UnumProvident Corporation and Subsidiaries
Note 1 - Significant Accounting Policies - Continued
Compensation costs for awards subject to accelerated vesting upon retirement are currently recognized over the explicit service period (subject to acceleration upon an employee’s actual retirement). The Company will continue to apply this accounting policy to share-based awards issued prior to January 1, 2006 and will apply SFAS 123(R) to awards issued after that date. The effect on the Company’s financial position and results of operations, had these costs had been recognized over the period to the date the employee first became eligible to retire, is immaterial.
Statement of Position 05-1 (SOP 05-1),Accounting by Insurance Enterprises for Deferred Acquisition Costs in Connection withWith Modifications or Exchanges of Insurance Contracts, was issued by the Accounting Standards Executive Committee in September 2005.. SOP 05-1 provides guidance on accounting by insurance enterprises for deferred acquisition costs on internal replacements of insurance and investment contracts other than those specifically described in Statement of Financial Accounting Standards No. 97, (SFAS 97),Accounting and Reporting by Insurance Enterprises for Certain Long-Duration Contracts and for Realized Gains and Losses from the Sale of Investments. An internal replacement is defined as a modification in product benefits, features, or coverages that occurs by the exchange or replacement of an existing insurance policy for a new policy. The cumulative effect of applying the provisions of SOP 05-1 is effectivedecreased our 2007 opening balance of retained earnings $445.2 million.
Effective January 1, 2007, we adopted the provisions of Financial Accounting Standards Board Interpretation No. 48 (FIN 48),Accounting for internal replacements occurringUncertainty in fiscal years beginning after December 15, 2006,Income Taxes, an interpretation of FASB Statement No. 109 (SFAS 109). FIN 48 clarifies the accounting for uncertainty in income taxes recognized in an enterprise’s financial statements in accordance with earlier adoption encouraged.SFAS 109. Unlike SFAS 109, FIN 48 prescribes a recognition threshold and measurement attribute for the financial statement recognition and measurement of a tax position taken or expected to be taken in a tax return. Additionally, FIN 48 provides guidance on derecognition, classification, interest and penalties, accounting in interim periods, disclosure, and transition. The Company has not yet determined thecumulative effect of applying the provisions of FIN 48 increased our 2007 opening balance of retained earnings $22.7 million.
Effective January 1, 2007, we adopted the provisions of Statement of Financial Accounting Standards No. 155 (SFAS 155), Accounting for Certain Hybrid Financial Instruments, an amendment of Statement of Financial Accounting Standards Nos. 133 (SFAS 133) and 140 (SFAS 140). SFAS 155: (a) permits fair value remeasurement for any hybrid financial instrument that contains an embedded derivative that otherwise would require bifurcation; (b) clarifies which interest-only strips and principal-only strips are not subject to the requirements of SFAS 133; (c) establishes a requirement to evaluate beneficial interests in securitized financial assets to identify interests that are freestanding derivatives or that are hybrid financial instruments that contain an embedded derivative requiring bifurcation; (d) clarifies that concentrations of credit risk in the form of subordination are not embedded derivatives; and, (e) eliminates restrictions on a qualifying special-purpose entity’s ability to hold passive derivative financial instruments that pertain to beneficial interests that are or contain a derivative financial instrument. The adoption of SFAS 155 did not have a material effect on our financial position or results of operations.
Effective January 1, 2006, we adopted Statement of Financial Accounting Standards No. 123 (revised 2004) (SFAS 123(R)),Share-Based Payment, which is a revision to Statement of Financial Accounting Standards No. 123 (SFAS 123),Accounting for Stock-Based Compensation. SFAS 123(R) focuses primarily on accounting for transactions in which an entity obtains employee service in exchange for share-based payments. Under SFAS 123(R), share-based awards that do not require future service (i.e., vesting awards) are expensed immediately. Share-based employee awards that require future service are amortized over the relevant service period. We adopted SFAS 123(R) using the modified prospective transition method. In accordance with the modified prospective transition method, the provisions are generally applied only to share-based awards granted subsequent to adoption. Prior to adoption of SFAS 123(R), the unrecognized compensation cost related to nonvested stock awards was reported as additional paid-in capital and deferred compensation, a contra equity account. The value of this contra equity account at the adoption of SOP 05-1SFAS 123(R) was $13.8 million. The adoption of SFAS 123(R) did not have a material effect on itsour financial position or results of operations.
Financial Accounting Standards BoardEffective January 1, 2006, we adopted the provisions of FASB Staff Position No. FAS 115-1 (FSP 115-1),The Meaning of Other-Than-Temporary Impairment and Its Application to Certain Investments, which addresses the determination of when an investment is considered impaired, whether the impairment is other than temporary, and the measurement of an impairment loss. FSP 115-1 also includes accounting considerations subsequent to the recognition of an other-than-temporary impairment and requires certain disclosures about unrealized losses. The Company will adopt the provisionsadoption of FSP 115-1 effective January 1, 2006. The adoption of this pronouncement willdid not have a material effect on our financial position or results of operations.
Index to Financial Statements
NOTES TO CONSOLIDATED FINANCIAL STATEMENTS - Continued
Unum Group and Subsidiaries
Note 1 - Significant Accounting Policies - Continued
Effective December 31, 2006, we adopted the Company’sprovisions of Statement of Financial Accounting Standards No. 158 (SFAS 158),Employers’ Accounting for Defined Benefit Pension and Other Postretirement Plans, an amendment of FASB Statements No. 87, 88, 106, and 132(R). SFAS 158 requires an employer to recognize the overfunded or underfunded status of a defined benefit pension and other postretirement plans as an asset or liability in its balance sheet and to recognize changes in that funded status through comprehensive income. Also, under SFAS 158, defined benefit pension and other postretirement plan assets and obligations are to be measured as of the date of the employer’s fiscal year-end. The adoption of SFAS 158 resulted in the following adjustments to our balance sheet: a decrease in other assets of $55.0 million, a decrease in deferred income tax of $40.3 million, an increase in other liabilities of $69.4 million, and a decrease in accumulated other comprehensive income of $84.1 million. The adoption of SFAS 158 had no effect on our results of operations.
Accounting Pronouncements Outstanding:
Statement of Financial Accounting Standards No. 161 (SFAS 161),Disclosures about Derivative Instruments and Hedging Activities, an amendment of FASB Statement No. 133, was issued in March 2008. SFAS 161 is intended to improve financial reporting about derivative instruments and hedging activities by requiring enhanced disclosures to enable investors to better understand their effects on an entity’s financial position, financial performance, and cash flows. We will adopt the provisions of SFAS 161 effective January 1, 2009. The adoption of SFAS 161 will amend our disclosures but will have no effect on our financial position or results of operations.
FASB Staff Position No. FAS 132(R)-1, (FSP FAS 132(R)-1),Employers’ Disclosures about Postretirement Benefit Plan Assets, was issued December 30, 2008. This FSP amends Statement of Financial Accounting Standards No. 132 (revised 2003),Employers’ Disclosures about Pensions and Other Postretirement Benefits, to provide guidance on an employer’s disclosures about plan assets of a defined benefit pension or other postretirement plan. The disclosures about plan assets required by this FSP are required for fiscal years ending after December 15, 2009. The adoption of FSP FAS 132(R)-1 will amend our disclosures but will have no effect on our financial position or results of operations.
Note 2 - Discontinued Operations
During 2003,As discussed in Note 1, the Company entered into an agreement to sell its Canadian branch. In conjunction with the classificationsale of the Canadian branch as an asset held for sale, the Company tested the goodwill related to the Canadian branch for impairmentGENEX closed effective March 1, 2007, and determined that the balance of $190.9 million was impaired. The Company also recognized a loss of $9.3 million before tax and $6.0 million after tax to write down the value of bonds in the Canadian branch investment portfolio to market value. These two charges, which total $196.9 million after tax, were included in the 2003 loss from discontinued operations. The Companywe recognized an additional lossafter-tax gain of $0.6$6.2 million before tax and $0.4 million after tax in the first quarter of 2004 to further write down the value of bonds in the Canadian branch investment portfolio to market value. The transaction closed April 30, 2004, and in the second quarter of 2004, the Company recognized a loss of $113.0 million before tax and $70.9 million after tax on the sale, which is included in income from discontinued operations in our statements of income. We intend to continue to purchase certain disability management services for a period of up to five years from the effective date of the branch.
The results of GENEX are reported as discontinued operations and excluded from segment results for all applicable periods. Selected results for GENEX are as follows:
| Year Ended December 31 | ||||||
| 2007 | 2006 | |||||
| (in millions of dollars, except share data) | ||||||
Total Revenue | $ | 47.2 | $ | 183.5 | ||
Income Per Common Share | ||||||
Basic | $ | 0.02 | $ | 0.02 | ||
Assuming Dilution | $ | 0.02 | $ | 0.02 | ||
Index to Financial Statements
NOTES TO CONSOLIDATED FINANCIAL STATEMENTS - Continued
UnumProvident CorporationUnum Group and Subsidiaries
Note 2 - Discontinued Operations - Continued
Selected results for the Canadian branch are as follows:
| Year Ended December 31 | ||||||||
| 2004 | 2003 | |||||||
| (in millions of dollars, except share data) | ||||||||
Premium Income | $ | 124.5 | $ | 351.2 | ||||
Total Revenue | $ | 146.2 | $ | 408.1 | ||||
Income Before Income Tax, Excluding Loss on Sale and Write-downs | $ | 16.2 | $ | 54.4 | ||||
Loss on Sale and Write-downs | (113.6 | ) | (200.2 | ) | ||||
Loss Before Income Tax | $ | (97.4 | ) | $ | (145.8 | ) | ||
Income Excluding Loss on Sale and Write-downs | $ | 10.5 | $ | 35.2 | ||||
Loss on Sale and Write-downs, Net of Income Tax | (71.3 | ) | (196.9 | ) | ||||
Loss | $ | (60.8 | ) | $ | (161.7 | ) | ||
Loss per Share | ||||||||
Basic | $ | (0.21 | ) | $ | (0.58 | ) | ||
Assuming Dilution | $ | (0.21 | ) | $ | (0.58 | ) | ||
Note 3 - Fair Values of Financial Instruments
TheWe use the following methods and assumptions are used by the Company in estimating the fair values of itsour financial instruments:
Fixed Maturity Securities: Fair values are based on quoted market prices, where available. For fixed maturity securities not actively traded, fair values are generally estimated using values obtained from independent pricing services or, in the case ofservices. For certain private placements, fair values are estimated by discounting expectedusing internally prepared valuations combining matrix pricing with vendor purchased software programs, including valuations based on estimates of future cash flows using a current market rate applicableprofitability. Additionally, we obtain prices from independent third-party brokers to the yield, credit quality, and maturityestablish valuations for certain of the investments.these securities. See Note 4 for the amortized cost andfurther discussion of fair values of securities by security type and by maturity date.value measurements.
Derivatives:Mortgage Loans: Fair values are estimated using discounted cash flow analyses and interest rates currently being offered for similar loans to borrowers with similar credit ratings and maturities. Loans with similar characteristics are aggregated for purposes of the calculations.
Policy Loans:Fair values for policy loans, net of reinsurance ceded, are estimated using discounted cash flow analyses and interest rates currently being offered to policyholders with similar policies. The carrying amounts of ceded policy loans of $2,555.6 million and $2,422.0 million as of December 31, 2008 and 2007, respectively, are reported on a gross basis in the consolidated balance sheets and approximate fair value.
Other Long-term Investments:Fair values for derivatives other than DIG Issue B36 derivatives are based on market quotes or pricing models and represent the net amount of cash the Companywe would have received if the contracts had been settled or closed as of the last day of the year. We do not net any cash collateral received from our counterparties against the fair value of our derivative instruments. Carrying amounts approximate fair value for other long-term investments.
Policyholders’ Funds:Policyholders’ funds are comprised primarily of deferred annuity products and supplementary contracts without life contingencies. The carrying amounts approximate fair value.
Fair values for insurance contracts other than investment contracts are not required to be disclosed. However, the fair values of liabilities under all insurance contracts are taken into consideration in our overall management of interest rate risk, which minimizes exposure to changing interest rates through the matching of investment maturities with amounts due under insurance contracts.
Short-term and Long-term Debt: Fair values are obtained from independent pricing services or discounted cash flow analyses based on current incremental borrowing rates for similar types of borrowing arrangements.
Other Liabilities: Fair values for derivatives other than DIG Issue B36 derivatives are based on market quotes or pricing models and represent the net amount of cash we would have paid if the contracts had been settled or closed as of the last day of the year.
Fair values for our DIG Issue B36 Embedded Derivatives: Fair valuesembedded derivative are estimated using internal pricing models and represent the hypothetical value of the duration mismatch of assets and liabilities, interest rate risk, and third party credit risk embedded in certain reinsurance agreements entered into by the Company.
Equity Securities:Fair values are based on quoted market prices, or, in the case of private placements, are based on the Company’s share of the investee’s ownership equity.
Mortgage Loans: Fair values are estimated using discounted cash flow analyses, using interest rates currently being offered for similar mortgage loans to borrowers with similar credit ratings and maturities. Mortgage loans with similar characteristics are aggregated for purposes of the calculations.modified coinsurance arrangement.
Index to Financial Statements
NOTES TO CONSOLIDATED FINANCIAL STATEMENTS - Continued
UnumProvident CorporationUnum Group and Subsidiaries
Note 3 - Fair Values of Financial Instruments - Continued
Policy Loans, Short-term Investments, CashThe carrying values of financial instruments such as short-term investments, cash and Bank Deposits,bank deposits, accounts and Deposit Assets:Carrying amountspremiums receivable, accrued investment income, and accounts payable approximate fair value.
Policyholders’ Funds: Carrying amounts for deferred annuity products and other policyholders’ funds, which include guaranteed investment contracts (GICs) and supplementary contracts without life contingencies, approximate fair value.
Fair values for insurance contracts other than investment contracts are not required to be disclosed. However, the fair values of liabilities under all insurance contracts are taken into consideration indue to the Company’s overall management of interest rate risk, which minimizes exposure to changing interest rates through the matching of investment maturities with amounts due under insurance contracts.
Short-term Debt: Fair values are obtained from independent pricing services.
Long-term Debt: Fair values are obtained from independent pricing services or discounted cash flow analyses based on current incremental borrowing rates for similar types of borrowing arrangements.
The carrying amounts and fair valuesshort-term nature of the Company’sinstruments. As such, these financial instruments are presented as follows.not included in the following chart.
| December 31 | |||||||||||||||||||||||||||
| (in millions of dollars) | |||||||||||||||||||||||||||
December 31 (in millions of dollars) | 2008 | 2007 | |||||||||||||||||||||||||
| 2005 | 2004 | Carrying Amount | Fair Value | Carrying Amount | Fair Value | ||||||||||||||||||||||
| Carrying Amount | Fair Value | Carrying Amount | Fair Value | ||||||||||||||||||||||||
Assets | |||||||||||||||||||||||||||
Fixed Maturity Securities | $ | 32,134.1 | $ | 32,134.1 | $ | 35,814.7 | $ | 35,814.7 | |||||||||||||||||||
Available-for-Sale | $ | 34,593.2 | $ | 34,593.2 | $ | 32,019.9 | $ | 32,019.9 | |||||||||||||||||||
Derivatives Hedging Available-for-Sale | 269.8 | 269.8 | 317.8 | 317.8 | |||||||||||||||||||||||
DIG Issue B36 Embedded Derivatives | (6.2 | ) | (6.2 | ) | 150.7 | 150.7 | |||||||||||||||||||||
Equity Securities | 13.6 | 13.6 | 12.9 | 12.9 | |||||||||||||||||||||||
Mortgage Loans | 739.4 | 750.0 | 498.2 | 530.2 | 1,274.8 | 1,224.4 | 1,068.9 | 1,079.8 | |||||||||||||||||||
Policy Loans | 3,201.4 | 3,201.4 | 3,073.6 | 3,073.6 | 2,753.8 | 2,811.0 | 2,617.7 | 2,650.7 | |||||||||||||||||||
Short-term Investments | 417.9 | 417.9 | 410.2 | 410.2 | |||||||||||||||||||||||
Cash and Bank Deposits | 69.4 | 69.4 | 130.7 | 130.7 | |||||||||||||||||||||||
Deposit Assets | — | — | 278.0 | 278.0 | |||||||||||||||||||||||
Other Long-term Investments | |||||||||||||||||||||||||||
Derivatives | 381.8 | 381.8 | 109.2 | 109.2 | |||||||||||||||||||||||
Miscellaneous Long-term Investments | 138.3 | 138.3 | 122.9 | 122.9 | |||||||||||||||||||||||
Liabilities | |||||||||||||||||||||||||||
Policyholders’ Funds | |||||||||||||||||||||||||||
Deferred Annuity Products | 1,149.8 | 1,149.8 | 1,239.9 | 1,239.9 | $ | 746.4 | $ | 746.4 | $ | 855.8 | $ | 855.8 | |||||||||||||||
Other | 550.4 | 550.4 | 623.5 | 623.5 | |||||||||||||||||||||||
Supplementary Contracts without Life Contingencies | 402.5 | 402.5 | 411.5 | 411.5 | |||||||||||||||||||||||
Short-term Debt | — | — | 227.0 | 229.4 | 190.5 | 188.9 | 175.0 | 175.3 | |||||||||||||||||||
Long-term Debt | 3,261.6 | 3,884.7 | 2,862.0 | 3,061.4 | 2,259.4 | 1,677.4 | 2,515.2 | 2,673.8 | |||||||||||||||||||
Other Liabilities | |||||||||||||||||||||||||||
Derivatives | 79.4 | 79.4 | 200.4 | 200.4 | |||||||||||||||||||||||
DIG Issue B36 Embedded Derivative | 360.5 | 360.5 | 68.8 | 68.8 | |||||||||||||||||||||||
Index to Financial Statements
NOTES TO CONSOLIDATED FINANCIAL STATEMENTS - Continued
UnumProvident CorporationUnum Group and Subsidiaries
Note 4 - Investments
Fixed Maturity and Equity Securities
The amortized cost and fair values of securities by security type are shown as follows.
December 31, 2005 (in millions of dollars) | ||||||||||||
| Amortized Cost | Gross Unrealized Gain | Gross Unrealized Loss | Fair Value | |||||||||
Available-for-Sale Securities | ||||||||||||
United States Government and Government Agencies and Authorities | $ | 2,487.9 | $ | 124.3 | $ | 9.6 | $ | 2,602.6 | ||||
States, Municipalities, and Political Subdivisions | 61.0 | 3.2 | — | 64.2 | ||||||||
Foreign Governments | 689.8 | 124.5 | — | 814.3 | ||||||||
Public Utilities | 4,256.2 | 373.2 | 28.5 | 4,600.9 | ||||||||
Mortgage/Asset-Backed Securities | 4,177.3 | 274.3 | 20.3 | 4,431.3 | ||||||||
Derivative Instruments | 15.9 | 377.2 | 129.5 | 263.6 | ||||||||
All Other Corporate Bonds | 20,226.0 | 1,941.9 | 243.4 | 21,924.5 | ||||||||
Redeemable Preferred Stocks | 148.0 | 9.3 | 1.9 | 155.4 | ||||||||
Total Fixed Maturity Securities | 32,062.1 | 3,227.9 | 433.2 | 34,856.8 | ||||||||
Equity Securities | 13.3 | 0.5 | 0.2 | 13.6 | ||||||||
Total | $ | 32,075.4 | $ | 3,228.4 | $ | 433.4 | $ | 34,870.4 | ||||
December 31, 2004 (in millions of dollars) | ||||||||||||
| Amortized Cost | Gross Unrealized Gain | Gross Unrealized Loss | Fair Value | |||||||||
Available-for-Sale Securities | ||||||||||||
United States Government and Government Agencies and Authorities | $ | 1,910.2 | $ | 62.5 | $ | 110.8 | $ | 1,861.9 | ||||
States, Municipalities, and Political Subdivisions | 47.1 | 3.7 | — | 50.8 | ||||||||
Foreign Governments | 831.6 | 110.5 | 1.2 | 940.9 | ||||||||
Public Utilities | 3,602.3 | 369.8 | 17.3 | 3,954.8 | ||||||||
Mortgage/Asset-Backed Securities | 3,847.8 | 361.2 | 2.7 | 4,206.3 | ||||||||
Derivative Instruments | 32.7 | 513.1 | 77.3 | 468.5 | ||||||||
All Other Corporate Bonds | 18,707.8 | 2,322.5 | 134.2 | 20,896.1 | ||||||||
Redeemable Preferred Stocks | 98.4 | 11.3 | 0.6 | 109.1 | ||||||||
Total Fixed Maturity Securities | 29,077.9 | 3,754.6 | 344.1 | 32,488.4 | ||||||||
Equity Securities | 13.7 | 0.1 | 0.9 | 12.9 | ||||||||
Total | $ | 29,091.6 | $ | 3,754.7 | $ | 345.0 | $ | 32,501.3 | ||||
| December 31, 2008 (in millions of dollars) | |||||||||||||
| Amortized Cost | Gross Unrealized Gain | Gross Unrealized Loss | Fair Value | ||||||||||
Available-for-Sale Securities | |||||||||||||
United States Government and Government Agencies and Authorities | $ | 1,591.9 | $ | 194.9 | $ | 62.6 | $ | 1,724.2 | |||||
States, Municipalities, and Political Subdivisions | 167.7 | 3.5 | 6.6 | 164.6 | |||||||||
Foreign Governments | 945.7 | 112.0 | 12.2 | 1,045.5 | |||||||||
Public Utilities | 5,896.2 | 105.1 | 593.9 | 5,407.4 | |||||||||
Mortgage/Asset-Backed Securities | 3,691.7 | 308.9 | 55.1 | 3,945.5 | |||||||||
All Other Corporate Bonds | 21,728.7 | 553.8 | 2,643.7 | 19,638.8 | |||||||||
Redeemable Preferred Stocks | 385.7 | - | 177.6 | 208.1 | |||||||||
Total Fixed Maturity Securities | $ | 34,407.6 | $ | 1,278.2 | $ | 3,551.7 | $ | 32,134.1 | |||||
| December 31, 2007 (in millions of dollars) | |||||||||||||
| Amortized Cost | Gross Unrealized Gain | Gross Unrealized Loss | Fair Value | ||||||||||
Available-for-Sale Securities | |||||||||||||
United States Government and Government Agencies and Authorities | $ | 2,329.0 | $ | 133.5 | $ | 28.6 | $ | 2,433.9 | |||||
States, Municipalities, and Political Subdivisions | 40.4 | 0.9 | - | 41.3 | |||||||||
Foreign Governments | 1,086.4 | 116.2 | 6.4 | 1,196.2 | |||||||||
Public Utilities | 5,113.8 | 239.8 | 117.8 | 5,235.8 | |||||||||
Mortgage/Asset-Backed Securities | 4,006.8 | 237.6 | 6.9 | 4,237.5 | |||||||||
All Other Corporate Bonds | 21,653.3 | 1,152.9 | 521.0 | 22,285.2 | |||||||||
Redeemable Preferred Stocks | 398.4 | 17.7 | 31.3 | 384.8 | |||||||||
Total Fixed Maturity Securities | $ | 34,628.1 | $ | 1,898.6 | $ | 712.0 | $ | 35,814.7 | |||||
Of the $431.3$3,551.7 million in gross unrealized losses on fixed maturity bonds and the derivatives that hedge these bondssecurities at December 31, 2005, $343.52008, $2,883.7 million, or 79.681.2 percent, are related to investment-grade fixed maturity bonds.securities. Unrealized losses on investment-grade fixed maturity securities principally relate to changes in interest rates or changes in market or sector credit spreads which occurred subsequent to the acquisition of the securities.
NOTES TO CONSOLIDATED FINANCIAL STATEMENTS - Continued
UnumProvident Corporation and Subsidiaries
Note 4 - Investments - Continued
The gross unrealized loss on below-investment-grade fixed maturity bonds (securities rated below Baa3 by Moody’s Investors Service or an equivalent internal rating)securities was $87.8$668.0 million at December 31, 2005,2008, or 20.418.8 percent, of the total gross unrealized loss on fixed maturity bonds.securities. Generally, below-investment-grade fixed maturity securities are more likely to develop credit concerns.
Index to Financial Statements
NOTES TO CONSOLIDATED FINANCIAL STATEMENTS - Continued
Unum Group and Subsidiaries
Note 4 - Investments - Continued
The following chart indicatescharts indicate the length of time the Company’s investment-grade and below-investment-gradeour fixed maturity bondssecurities had been in a gross unrealized loss position as of December 31, 2005. The fair value2008 and gross unrealized losses are categorized by the relationship2007.
| December 31, 2008 (in millions of dollars) | ||||||||||||
| Less Than 12 Months | 12 Months or Greater | |||||||||||
| Fair Value | Gross Unrealized Loss | Fair Value | Gross Unrealized Loss | |||||||||
Description | ||||||||||||
United States Government and Government Agencies and Authorities | $ | 341.7 | $ | 29.1 | $ | 300.1 | $ | 33.5 | ||||
States, Municipalities, and Political Subdivisions | 87.7 | 5.2 | 3.6 | 1.4 | ||||||||
Foreign Governments | 325.8 | 12.0 | 11.4 | 0.2 | ||||||||
Public Utilities | 2,209.4 | 264.6 | 1,531.9 | 329.3 | ||||||||
Mortgage/Asset-Backed Securities | 124.7 | 14.2 | 221.4 | 40.9 | ||||||||
All Other Corporate Bonds | 7,805.8 | 1,081.0 | 5,461.6 | 1,562.7 | ||||||||
Redeemable Preferred Stocks | 102.1 | 62.6 | 103.7 | 115.0 | ||||||||
Total | $ | 10,997.2 | $ | 1,468.7 | $ | 7,633.7 | $ | 2,083.0 | ||||
| December 31, 2007 (in millions of dollars) | ||||||||||||
| Less Than 12 Months | 12 Months or Greater | |||||||||||
| Fair Value | Gross Unrealized Loss | Fair Value | Gross Unrealized Loss | |||||||||
Description | ||||||||||||
United States Government and Government Agencies and Authorities | $ | - | $ | - | $ | 840.4 | $ | 28.6 | ||||
Foreign Governments | 128.8 | 1.9 | 337.2 | 4.5 | ||||||||
Public Utilities | 983.7 | 26.0 | 1,521.1 | 91.9 | ||||||||
Mortgage/Asset-Backed Securities | 218.7 | 1.7 | 270.1 | 5.2 | ||||||||
All Other Corporate Bonds | 3,245.0 | 125.8 | 6,273.2 | 395.1 | ||||||||
Redeemable Preferred Stocks | 91.7 | 8.1 | 106.5 | 23.2 | ||||||||
Total | $ | 4,667.9 | $ | 163.5 | $ | 9,348.5 | $ | 548.5 | ||||
As of the current fair value to amortized cost for those securities on December 31, 2005. The fair value to amortized cost relationships are not necessarily indicative2008, we held 644 individual investment-grade fixed maturity securities and 125 individual below-investment-grade fixed maturity securities that were in an unrealized loss position, of the fair value to amortized cost relationships for thewhich 342 investment-grade fixed maturity securities throughout the entire time that theand 68 below-investment-grade fixed maturity securities havehad been in an unrealized loss position nor are they necessarily indicative of the relationships subsequent to December 31, 2005.
December 31, 2005 (in millions of dollars, except issuer data) | ||||||||
| Fair Value | Gross Unrealized Loss | Number of Issuers | ||||||
Investment-Grade | ||||||||
1 year or less | ||||||||
fair value < 100% >= 70% of amortized cost | $ | 4,683.8 | $ | 104.6 | 196 | |||
Over 1 year | ||||||||
fair value < 100% >= 70% of amortized cost | 1,512.6 | 212.5 | 48 | |||||
fair value < 70% >= 40% of amortized cost | 43.9 | 26.4 | 1 | |||||
Subtotal | 1,556.5 | 238.9 | 49 | |||||
Total | $ | 6,240.3 | $ | 343.5 | 245 | |||
Below-Investment-Grade | ||||||||
1 year or less | ||||||||
fair value < 100% >= 70% of amortized cost | $ | 563.1 | $ | 40.4 | 45 | |||
fair value < 70% >= 40% of amortized cost | 24.2 | 15.2 | 2 | |||||
Subtotal | 587.3 | 55.6 | 47 | |||||
Over 1 year | ||||||||
fair value < 100% >= 70% of amortized cost | 305.6 | 27.4 | 16 | |||||
fair value < 70% >= 40% of amortized cost | 5.7 | 4.8 | 1 | |||||
Subtotal | 311.3 | 32.2 | 17 | |||||
Total | $ | 898.6 | $ | 87.8 | 64 | |||
NOTES TO CONSOLIDATED FINANCIAL STATEMENTS - Continued
UnumProvident Corporation and Subsidiaries
Note 4 - Investments - Continued
As of December 31, 2005, the Company held two securities with a gross unrealized loss of $10.0 million or greater, as follows:
December 31, 2005 (in millions of dollars) | ||||||||
| Fair Value | Gross Unrealized Loss | Length of Time in a Loss Position | ||||||
Investment-Grade | ||||||||
Principal Protected Equity Linked Note | $ | 43.9 | $ | 26.4 | > 3 years | |||
Below-Investment-Grade | ||||||||
U.S. Based Automobile Manufacturer | $ | 33.2 | $ | 13.1 | > 270 days <= 1 year | |||
continuously for over one year.
In determining when a decline in fair value below amortized cost of a fixed maturity security is other than temporary, the Company evaluateswe evaluate the following factors:
The probability of recovering principal and interest.
Index to Financial Statements
NOTES TO CONSOLIDATED FINANCIAL STATEMENTS - Continued
Unum Group and Subsidiaries
Note 4 - Investments - Continued
Current and future business prospects and trends of earnings.
If the Company determineswe determine that the decline in value of an investment is other than temporary, the investment is written down to fair value, and an impairment loss is recognized in the current period to the extent of the decline in value. For those fixed maturity securities with an unrealized loss and on which the Company haswe have not recorded an impairment write-down, the Company believeswe believe that the decline in fair value below amortized cost is temporary.
NOTES TO CONSOLIDATED FINANCIAL STATEMENTS - Continued
UnumProvident Corporation and Subsidiaries
Note 4 - Investments - Continued
The amortized cost and fair values of fixed maturity securities by maturity date are shown as follows. The maturity dates have not been adjusted for possible calls or prepayments.
December 31, 2005 (in millions of dollars) | ||||||
| Amortized Cost | Fair Value | |||||
Available-for-Sale Securities | ||||||
1 year or less | $ | 362.5 | $ | 431.4 | ||
Over 1 year through 5 years | 2,513.6 | 2,625.5 | ||||
Over 5 years through 10 years | 5,846.8 | 6,337.4 | ||||
Over 10 years | 19,161.9 | 21,031.2 | ||||
| 27,884.8 | 30,425.5 | |||||
Mortgage/Asset-Backed Securities | 4,177.3 | 4,431.3 | ||||
Total | $ | 32,062.1 | $ | 34,856.8 | ||
| December 31, 2008 | ||||||
| (in millions of dollars) | ||||||
| Amortized Cost | Fair Value | |||||
Available-for-Sale Securities | ||||||
1 year or less | $ | 365.8 | $ | 367.4 | ||
Over 1 year through 5 years | 3,889.9 | 3,752.8 | ||||
Over 5 years through 10 years | 9,232.0 | 8,225.5 | ||||
Over 10 years | 17,228.2 | 15,842.9 | ||||
| 30,715.9 | 28,188.6 | |||||
Mortgage/Asset-Backed Securities | 3,691.7 | 3,945.5 | ||||
Total | $ | 34,407.6 | $ | 32,134.1 | ||
At December 31, 2005,2008, the total investment in below-investment-grade fixed maturity securities was $2,180.7$1,633.9 million or 6.04.6 percent of the fair value of invested assets excluding ceded policy loans. The amortized cost of these securities was $2,157.2$2,300.6 million.
The Company has fourWe are the sole beneficiary of two special purpose entities which support the Company’sour investment objectives and which are consolidated under the provisions of Interpretation No. 46 (FIN 46(R)),Consolidationof Variable Interest Entities, an Interpretation of Accounting Research Bulletin (ARB) No. 51.51. These entities are securitized asset trusts and contain specific financial instruments that do not include the Company’sour common stock or debt. ThreeOne of these entities are trustsis a trust holding forward contracts to purchase unrelated equity securities. Each of these trustsThis trust also holds a defeasance swap contract for highly rated bonds to provide principal protection for the investments. There are no restrictions on the assets held in this trust, and the trust is free to dispose of the assets at any time. We have not previously provided financial or other support to this trust and do not anticipate any need to do so in the future. The fair values of the underlying forward and swap contracts equaled $153.1$50.3 million as of December 31, 2005,2008, and are reported as fixed maturity securities in the consolidated statements of financial condition. balance sheets.
The fourthsecond entity is a trust containing a highly rated bond for principal protection, unrelated equity securities,non-redeemable preferred stock, and several partnership equity investments. The CompanyWe contributed the bond and partnership investments into the trust at
Index to Financial Statements
NOTES TO CONSOLIDATED FINANCIAL STATEMENTS - Continued
Unum Group and Subsidiaries
Note 4 - Investments - Continued
the time it was established. The purpose of this trust wasis to allow the Companyus to maintain itsour investment in the partnerships while at the same time protecting the principal of the investment. There are no restrictions on the assets held in this trust, and the trust is free to dispose of the assets at any time. Because the assets in the trust are not liquid investments, we periodically provide funding to the underlying partnerships in the trust upon satisfaction of contractual notice from the partnerships. At December 31, 2008, we had commitments to fund approximately $1.9 million to the underlying partnerships. These amounts may or may not be funded during the life of the partnerships. The amount of funding provided to the partnerships was $0.6 million in 2006 and de minimis during 2008 and 2007. The fair values of the bond, equity securities,non-redeemable preferred stock, and partnerships were $78.0$85.6 million, $10.3$0.6 million, and $46.1$13.7 million, respectively, as of December 31, 2005.2008. The bonds are reported as fixed maturity securities, and the non-redeemable preferred stock and partnerships are reported as other long-term investments in the consolidated balance sheets.
The Company hasWe have a significant investment in, but isare not the primary beneficiary of, a special purpose entity which is a collateralized bond obligation asset trust (CBO) in which the Company holdswe hold interests in several of the tranches and for which the Company actswe act as investment manager of the underlying securities. This special purpose entity does not meet the consolidation requirements of FIN 46(R). The CompanyWe issued the CBO in 1998, and its purpose is to securitize high yield bonds and earn a spread over the cost of the funds from the different tranches issued. In determining whether we are the primary beneficiary under the consolidation requirements of FIN 46(R), we projected the expected cash flows generated by the underlying assets in the trust using various interest rate and credit quality assumptions and assigned the projected cash flows to the various beneficiaries of the trust in accordance with the legal terms set forth by the trust agreement. Based on our analysis, we determined that we were not the primary beneficiary as we would not absorb the majority of the trust’s expected losses or receive the majority of its expected residual gains. The outstanding balance of all tranches at December 31, 2008 was $178.2$75.7 million, $39.1 million of which is held by third parties with no recourse against us. We provide no financial or other support to the trust, other than acting as investment manager of the underlying securities. The total fair value of the underlying securities in the CBO was $5.5 million at December 31, 2005, of which third parties hold $126.3 million. These third parties have no recourse against the Company.2008. The totalfair value of our investment in the CBO, assets is $117.3and therefore our maximum exposure to loss, was $2.5 million at December 31, 2005. The Company’s maximum exposure to loss for the2008. This investment is reported as a fixed maturity securities is $21.5 million at December 31, 2005.
security in the consolidated balance sheets.
At December 31, 2005, the Company2008, we had capital commitments of approximately $13.1$35.9 million to fund certain of itsour private placement fixed maturity securities. The funds are due upon satisfaction of contractual notice from the issuer. These amounts may or may not be funded during the term of the security.
NOTES TO CONSOLIDATED FINANCIAL STATEMENTS - Continued
UnumProvident Corporation and Subsidiaries
Note 4 - Investments - Continued
Deposit assets in the form of marketable securities held in trust for certain reinsurance contracts are reported in miscellaneous assets in the consolidated statements of financial condition. Under the provisions of DIG Issue B36, the net unrealized gain is attributed to the value of the embedded derivative and is reported as such in fixed maturity securities.
In the normal course of business, we receive collateral from unaffiliated third parties through transactions which include both securities lending and also short-term agreements to purchase securities with the Company both loans securitiesagreement to broker dealers and invests in short-term repurchase agreements.resell them at a later, specified date. For both types of transactions, the Company requireswe require that a minimum of 102 percent of the fair value of the securities loaned or securities purchased under repurchase agreements be maintained as collateral. Generally, cash is received as collateral under these agreements. In the event that securities are received as collateral, the Company iswe are not permitted to sell or repledgere-post them.
We also post our fixed maturity securities as collateral to unaffiliated third parties through transactions including both securities lending and also short-term agreements to sell securities with the agreement to repurchase them at a later, specified date. At December 31, 2008, the carrying value of fixed maturity securities posted as collateral to third parties under these programs was $80.6 million. See Note 5 for discussion of collateral posted to our derivatives counterparties.
Mortgage Loans
At December 31, 2008, mortgage loans were collateralized by office buildings (39.8 percent), industrial buildings (30.5 percent), retail stores (17.6 percent), and other properties (12.1 percent). Our mortgage loan portfolio is geographically dispersed within the United States, with the largest concentrations in California (13.2 percent) and Pennsylvania (11.5 percent).
Index to Financial Statements
NOTES TO CONSOLIDATED FINANCIAL STATEMENTS - Continued
Unum Group and Subsidiaries
Note 4 - Investments - Continued
Mortgage loans are impaired when, based on current information and events, it is probable that the Companywe will be unable to collect all amounts due according to the contractual terms of the loan agreement. The CompanyAt December 31, 2008, impaired mortgage loans totaled $5.2 million. We had no impaired mortgage loans at December 31, 20052007 and no valuation allowance for mortgage loans at December 31, 2008 or 2004.
2007. We had deductions of $0.5 million and increases of $0.5 million to the allowance for mortgage loans during 2007 and 2006, respectively.
At December 31, 2005, the Company2008, we had capital commitments of approximately $58.0$4.1 million for commercial mortgage loan originations. The funds will be due at closing of the mortgage loans.
Investment Valuation Allowances
At December 31, 2005 and 2004 the Company had real estate investment allowances totaling $7.6 million and $9.3 million, respectively. Deductions for allowances released upon disposal or restructuring totaled $1.7 million in 2005 and $10.6 million in 2003. There were no deductions in 2004 and no additions in 2005, 2004, and 2003.
There were no additional investment valuation allowances at December 31, 2005 and 2004.
Net Investment Income
Sources for net investment income are as follows:
| Year Ended December 31 | ||||||||||||||||||
| Year Ended December 31 | 2008 | 2007 | 2006 | |||||||||||||||
| 2005 | 2004 | 2003 | (in millions of dollars) | |||||||||||||||
| (in millions of dollars) | ||||||||||||||||||
Fixed Maturity Securities | $ | 2,151.3 | $ | 2,125.6 | $ | 2,103.8 | $ | 2,277.0 | $ | 2,297.4 | $ | 2,234.5 | ||||||
Equity Securities | — | — | 0.7 | |||||||||||||||
Derivative Financial Instruments | 15.1 | 17.8 | 27.5 | |||||||||||||||
Mortgage Loans | 43.0 | 38.0 | 48.7 | 72.0 | 64.3 | 54.6 | ||||||||||||
Real Estate | 0.4 | 3.1 | 2.6 | |||||||||||||||
Policy Loans | 17.4 | 11.4 | 11.6 | 13.0 | 12.7 | 12.6 | ||||||||||||
Other Long-term Investments | 8.5 | 1.9 | 9.9 | 15.5 | 7.3 | 9.4 | ||||||||||||
Short-term Investments | 10.8 | 8.9 | 10.7 | 40.7 | 49.5 | 21.0 | ||||||||||||
Gross Investment Income | 2,231.4 | 2,188.9 | 2,188.0 | 2,433.3 | 2,449.0 | 2,359.6 | ||||||||||||
Less Investment Expenses | 19.9 | 12.4 | 11.3 | 25.8 | 17.0 | 21.0 | ||||||||||||
Less Investment Income on PFA Assets | 23.2 | 17.8 | 18.3 | 18.5 | 22.1 | 18.0 | ||||||||||||
Net Investment Income | $ | 2,188.3 | $ | 2,158.7 | $ | 2,158.4 | $ | 2,389.0 | $ | 2,409.9 | $ | 2,320.6 | ||||||
Realized Investment Gain and Loss
Realized investment gains (losses) are as follows:
| Year Ended December 31 | |||||||||
| 2008 | 2007 | 2006 | |||||||
| (in millions of dollars) | |||||||||
Fixed Maturity Securities | |||||||||
Gross Gains | $ | 64.9 | $ | 56.0 | $ | 68.3 | |||
Gross Losses | (231.9) | (82.8) | (71.1) | ||||||
Mortgage Loans and Other Invested Assets | (5.3) | 19.0 | 10.3 | ||||||
Change in Fair Value of DIG Issue B36 Derivative | (291.7) | (57.3) | (5.3) | ||||||
Derivatives other than DIG Issue B36 | (1.9) | (0.1) | - | ||||||
Realized Investment Gain (Loss) | $ | (465.9) | $ | (65.2) | $ | 2.2 | |||
Index to Financial Statements
NOTES TO CONSOLIDATED FINANCIAL STATEMENTS - Continued
UnumProvident CorporationUnum Group and Subsidiaries
Note 4 - Investments - Continued
Realized Investment Gain and LossFair Value Measurements
Realized investment gains (losses)Effective January 1, 2008, we adopted the provisions of SFAS 157, which are as follows:
| Year Ended December 31 | ||||||||||||
| 2005 | 2004 | 2003 | ||||||||||
| (in millions of dollars) | ||||||||||||
Fixed Maturity Securities | ||||||||||||
Gross Gains | $ | 74.4 | $ | 64.3 | $ | 127.0 | ||||||
Gross Losses | (95.7 | ) | (141.3 | ) | (334.4 | ) | ||||||
Equity Securities | 1.0 | 6.9 | 4.5 | |||||||||
Mortgage Loans, Real Estate, and Other Invested Assets | 16.6 | 5.9 | 12.3 | |||||||||
Deposit Assets | 5.2 | 4.9 | 15.6 | |||||||||
Change in Fair Value of DIG Issue B36 Derivatives | (7.9 | ) | 88.6 | 0.8 | ||||||||
Other Derivatives | (0.3 | ) | (0.1 | ) | 0.4 | |||||||
Realized Investment Gain (Loss) | $ | (6.7 | ) | $ | 29.2 | $ | (173.8 | ) | ||||
intended to increase consistency and comparability among fair value estimates used in financial reporting. SFAS 157 does not require any new fair value measurements. SFAS 157 clarifies a number of considerations with respect to fair value measurement objectives for financial reporting and expands disclosure about the use of fair value measurements, with particular emphasis on the inputs used to measure fair value. The disclosures required by SFAS 157 are intended to provide users of the financial statements the ability to assess the reliability of an entity’s fair value measurements. The adoption of SFAS 157 did not materially change the approach or methods we utilize for determining fair value measurements or the fair values derived under those methods.
Other Comprehensive IncomeDefinition of Fair Value
Fair value is defined as the price that would be received to sell an asset or paid to transfer a liability in an orderly transaction between market participants at the measurement date and, therefore, represents an exit price, not an entry price. The exit price objective applies regardless of a reporting entity’s intent and/or ability to sell the asset or transfer the liability at the measurement date.
The componentsdegree of judgment utilized in measuring the changefair value of financial instruments generally correlates to the level of pricing observability. Financial instruments with readily available active quoted prices or for which fair value can be measured from actively quoted prices in active markets generally have more pricing observability and less judgment utilized in measuring fair value. An active market for a financial instrument is a market in which transactions for an asset or a similar asset occur with sufficient frequency and volume to provide pricing information on an ongoing basis. A quoted price in an active market provides the net unrealized gain on securitiesmost reliable evidence of fair value and should be used to measure fair value whenever available. Conversely, financial instruments rarely traded or not quoted have less observability and are measured at fair value using valuation techniques that require more judgment. Pricing observability is generally impacted by a number of factors, including the change intype of financial instrument, whether the net gain on cash flow hedges included in other comprehensive income (loss)financial instrument is new to the market and not yet established, the characteristics specific to the transaction, and overall market conditions.
Valuation Techniques
Valuation techniques used for assets and liabilities accounted for at fair value are as follows.generally categorized into three types:
| Year Ended December 31 | ||||||||||||
| 2005 | 2004 | 2003 | ||||||||||
| (in millions of dollars) | ||||||||||||
Change in Net Unrealized Gain Before Reclassification Adjustment | $ | (394.1 | ) | $ | 644.0 | $ | 629.7 | |||||
Reclassification Adjustment for Net Realized Investment (Gain) Loss - Continuing Operations | 6.7 | (29.2 | ) | 173.8 | ||||||||
Reclassification Adjustment for Net Realized Investment (Gain) Loss - Discontinued Operations | — | (139.4 | ) | 12.2 | ||||||||
Cumulative Effect Transition Adjustment for DIG Issue B36 | — | — | (134.5 | ) | ||||||||
Change in Net Gain on Cash Flow Hedges | 56.1 | 121.7 | 113.6 | |||||||||
Change in Net Unrealized Gain on Deposit Assets | — | — | (0.6 | ) | ||||||||
Change in the Adjustment to Reserves for Future Policy and Contract Benefits, Net of Reinsurance | (29.6 | ) | (115.8 | ) | (367.3 | ) | ||||||
Change in Tax Liability | 128.2 | (173.4 | ) | (172.1 | ) | |||||||
Total | $ | (232.7 | ) | $ | 307.9 | $ | 254.8 | |||||
| 1. | Themarket approach uses prices and other relevant information from market transactions involving identical or comparable assets or liabilities. Valuation techniques consistent with the market approach often use market multiples derived from a set of comparables or matrix pricing. Market multiples might lie in ranges with a different multiple for each comparable. The selection of where within the range the appropriate multiple falls requires judgment, considering both quantitative and qualitative factors specific to the measurement. Matrix pricing is a mathematical technique used principally to value certain securities without relying exclusively on quoted prices for the specific securities but comparing the securities to benchmark or comparable securities. |
| 2. | The income approach converts future amounts, such as cash flows or earnings, to a single present amount, or a discounted amount. Income approach techniques rely on current market expectations of future amounts. Examples of income approach valuation techniques include present value techniques, option-pricing models that incorporate present value techniques, and the multi-period excess earnings method. |
Index to Financial Statements
NOTES TO CONSOLIDATED FINANCIAL STATEMENTS - Continued
UnumProvident CorporationUnum Group and Subsidiaries
Note 4 - Investments - Continued
| 3. | Thecost approachis based upon the amount that currently would be required to replace the service capacity of an asset, or the current replacement cost. That is, from the perspective of a market participant (seller), the price that would be received for the asset is determined based on the cost to a market participant (buyer) to acquire or construct a substitute asset of comparable utility. |
We use valuation techniques that are appropriate in the circumstances and for which sufficient data are available that can be obtained without undue cost and effort. In some cases, a single valuation technique will be appropriate (for example, when valuing an asset or liability using quoted prices in an active market for identical assets or liabilities). In other cases, multiple valuation techniques will be appropriate. If we use multiple valuation techniques to measure fair value, we evaluate and weigh the results, as appropriate, considering the reasonableness of the range indicated by those results. A fair value measurement is the point within that range that is most representative of fair value in the circumstances.
The selection of the valuation method(s) to apply considers the definition of an exit price and depends on the nature of the asset or liability being valued. For assets and liabilities accounted for at fair value, we generally use valuation techniques consistent with the market approach, and to a lesser extent, the income approach. We believe the market approach valuation technique provides more observable data than the income approach, considering the type of investments we hold. Our fair value measurements could differ significantly based on the valuation technique and available inputs. When markets are less active, brokers may rely more on models with inputs based on the information available only to the broker. In weighing a broker quote as an input to fair value, we place less reliance on quotes that do not reflect the result of market transactions. We also consider the nature of the quote, particularly whether the quote is an indicative price or a binding offer. If prices in an inactive market do not reflect current prices for the same or similar assets, adjustments may be necessary to arrive at fair value. When relevant market data is unavailable, which may be the case during periods of market uncertainty, the income approach can, in appropriate circumstances, provide a more appropriate fair value. During 2008, we have applied valuation techniques on a consistent basis to similar assets and liabilities and consistent with those techniques used at year end 2007. Due to recent market conditions, the mix and availability of observable inputs for valuation techniques have been volatile, and the risk inherent in the inputs is elevated relative to prior periods.
Inputs to Valuation Techniques
Inputs refer broadly to the assumptions that market participants use in pricing assets or liabilities, including assumptions about risk, for example, the risk inherent in a particular valuation technique used to measure fair value (such as a pricing model) and/or the risk inherent in the inputs to the valuation technique. Inputs may be observable or unobservable.
Observable inputs are inputs that reflect the assumptions market participants would use in pricing the asset or liability developed based on market data obtained from independent sources.
Unobservable inputs are inputs that reflect our own assumptions about the assumptions market participants would use in pricing the asset or liability developed based on the best information available in the circumstances.
Observable inputs which we utilize to determine the fair values of our investments and derivative financial instruments include indicative broker prices and prices obtained from external pricing services. At December 31, 2008, approximately 87.6 percent of our fixed maturity securities were valued based on active trades and/or broker quotes or prices obtained from pricing services that generally use observable inputs in their valuation techniques, with no additional adjustments to the prices. These assets were classified as either Level 1 or Level 2, with the categorization dependent on whether the price was for an actual representative sale, for identical assets actively traded, and/or the quote binding or non-binding. We generally obtain, on average, one quote per financial instrument. We review the prices obtained to ensure they are consistent with a variety of observable market inputs
Index to Financial Statements
NOTES TO CONSOLIDATED FINANCIAL STATEMENTS - Continued
Unum Group and Subsidiaries
Note 4 - Investments - Continued
and to verify the validity of a security’s price. These inputs, along with our knowledge of the financial conditions and industry in which the issuer operates, will be considered in determining whether the quoted or indicated price, as well as the change in price from quarter to quarter, are valid.
On selected securities where there is not an indicated price or where we cannot validate the price, some combination of market inputs may be used to determine a price using a pricing matrix, or we may use pricing inputs from a comparable security. At December 31, 2008, we valued approximately 9.8 percent of our fixed maturity securities using this method. These assets were classified as Level 2. The parameters and inputs used to validate a price on a security may be adjusted for assumptions about risk and current market conditions on a quarter to quarter basis, as certain features may be more significant drivers of valuation at the time of pricing. Changes to inputs in valuations are not changes to valuation methodologies; rather, the inputs are modified to reflect direct or indirect impacts on asset classes from changes in market conditions. We consider transactions in inactive or disorderly markets to be less representative of fair value. We use all available observable inputs when measuring fair value, but when significant other unobservable inputs and adjustments are necessary, we classify these assets as Level 3.
Inputs that may be used include the following:
Benchmark yields (Treasury and swap curves)
Transactional data for new issuance and secondary trades
Broker/dealer quotes and pricing
Security cash flows and structures
Recent issuance/supply
Sector and issuer level spreads
Credit ratings/maturity/weighted average life/seasoning/capital structure
Security optionality
Corporate actions
Underlying collateral
Prepayment speeds/loan performance/delinquencies
Public covenants
Comparative bond analysis
Derivative spreads
Third-party pricing sources
Relevant reports issued by analysts and rating agencies
The overall valuation process for determining fair values may include adjustments to valuations obtained from our pricing sources when they do not represent a valid exit price. These adjustments may be made when, in our judgment, certain features of the financial instrument, such as its complexity or the market in which the financial instrument is traded (such as counterparty, credit, concentration, or liquidity), require that an adjustment be made to the value originally obtained from our pricing sources. Additionally, an adjustment to the price derived from a model typically reflects our judgment of the inputs that other participants in the market for the financial instrument being measured at fair value would consider in pricing that same financial instrument.
Certain of our investments do not have readily determinable market prices and/or observable inputs or may at times be affected by the lack of market liquidity. For these securities, we use internally prepared valuations combining matrix pricing with vendor purchased software programs, including valuations based on estimates of future profitability, to estimate the fair value. Additionally, we may obtain prices from independent third-party brokers to aid in establishing valuations for certain of these securities. Key assumptions used by us to determine fair value for these securities include risk-free interest rates, risk premiums, performance of underlying collateral (if any), and other factors involving significant assumptions which may or may not reflect those of an active market.
Index to Financial Statements
NOTES TO CONSOLIDATED FINANCIAL STATEMENTS - Continued
Unum Group and Subsidiaries
Note 4 - Investments - Continued
The categorization of fair value measurements, by input level, is as follows:
| December 31, 2008 (in millions of dollars) | ||||||||||||
| Quoted Prices in Active Markets for Identical Assets or Liabilities (Level 1) | Significant Other Observable Inputs (Level 2) | Significant Unobservable Inputs (Level 3) | Total | |||||||||
Assets | ||||||||||||
Fixed Maturity Securities | $ | 3,026.0 | $ | 28,362.6 | $ | 745.5 | $ | 32,134.1 | ||||
Other Long-term Investments | ||||||||||||
Derivatives other than DIG Issue B36 | - | 381.8 | - | 381.8 | ||||||||
Miscellaneous Long-term Investments | 33.6 | 0.5 | 1.5 | 35.6 | ||||||||
Liabilities | ||||||||||||
Other Liabilities | ||||||||||||
Derivatives other than DIG Issue B36 | $ | - | $ | 79.4 | $ | - | $ | 79.4 | ||||
DIG Issue B36 Embedded Derivative | - | - | 360.5 | 360.5 | ||||||||
Changes in assets and liabilities measured at fair value on a recurring basis using significant unobservable inputs (Level 3) during the year ended December 31, 2008 are as follows:
| Fixed Maturity Securities | DIG Issue B36 Derivative | Other Long-term Investments | Total | |||||||||
| (in millions of dollars) | ||||||||||||
Balance at January 1, 2008 | $ | 421.0 | $ | (68.8) | $ | 1.5 | $ | 353.7 | ||||
Total Realized and Unrealized Gains (Losses) | ||||||||||||
Included in Earnings | (2.3) | (291.7) | (1.1) | (295.1) | ||||||||
Included in Other Comprehensive Income or Loss | (170.3) | - | 0.1 | (170.2) | ||||||||
Net Purchases and Sales | (15.5) | - | 1.1 | (14.4) | ||||||||
Level 3 Transfers | ||||||||||||
Into | 672.6 | - | - | 672.6 | ||||||||
Out of | (160.0) | - | (0.1) | (160.1) | ||||||||
Balance at December 31, 2008 | $ | 745.5 | $ | (360.5) | $ | 1.5 | $ | 386.5 | ||||
Realized and unrealized investment gains and losses presented in the preceding table represent gains and losses only for the time during which the applicable financial instruments were classified as Level 3. The transfers between
Index to Financial Statements
NOTES TO CONSOLIDATED FINANCIAL STATEMENTS - Continued
Unum Group and Subsidiaries
Note 4 - Investments - Continued
levels resulted primarily from a change in observability of three inputs used to determine fair values of the securities transferred: (1) transactional data for new issuance and secondary trades, (2) broker/dealer quotes and pricing, primarily related to the lack of an active and orderly market, and (3) comparable bond metrics from which to perform an analysis. For fair value measurements of financial instruments that were transferred either into or out of Level 3, we reflect the transfers using the fair value at the beginning of the period. The amount of losses for the year ended December 31, 2008 which is included in earnings and is attributable to the change in unrealized gains or losses relating to assets or liabilities valued using significant unobservable inputs and still held at December 31, 2008 was $291.7 million. This amount relates entirely to the change in fair value of an embedded derivative associated with a modified coinsurance arrangement which is reported as realized investment gains and losses, as required under DIG Issue B36.
Note 5 - Derivative Financial Instruments
The Company usesWe use swaps, forwards, futures, and options to hedge interest rate and currency risks and to match assets with itsour insurance liabilities.
Derivative Risks
The basic types of risks associated with derivatives are market risk (that the value of the derivative will be adversely impacted by changes in the market, primarily the change in interest and exchange rates) and credit risk (that the counterparty will not perform according to the terms of the contract). The market risk of the derivatives should generally offset the market risk associated with the hedged financial instrument or liability.
We analyze credit default swap spreads relative to the average credit spread embedded within the London Interbank Offered Rate (LIBOR) setting syndicate in determining the effect of credit risk on our derivatives’ fair values. If counterparty credit risk for a derivative asset is determined to be material and is not adequately reflected in the LIBOR-based fair value obtained from our pricing sources, we adjust the valuations obtained from our pricing sources. In regards to our own credit risk component, we adjust the valuation of derivative liabilities wherein the counterparty is exposed to our credit risk when the LIBOR-based valuation of our derivatives obtained from pricing sources does not effectively include an adequate credit component for our own credit risk.
To help limit the credit exposure of the derivatives, the Company has enteredwe enter into master netting agreements with itsour counterparties whereby contracts in a gain position can be offset against contracts in a loss position. The CompanyWe also typically entersenter into bilateral, cross-collateralization agreements with itsour counterparties to help limit the credit exposure of the derivatives. These agreements require the counterparty in a loss position to submit acceptable collateral with the other counterparty in the event the net loss position meets or exceeds an agreed upon amount. The Company’sOur current credit exposure on derivatives, which is limited to the value of those contracts in a net gain position less collateral held, was $63.4$37.7 million at December 31, 2005.2008. As of December 31, 2008, we held cash collateral of $174.3 million from our counterparties. This unrestricted cash collateral is included in short-term investments and the associated obligation to return the collateral to our counterparties is included in other liabilities in the consolidated balance sheets. We post fixed maturity securities as collateral to our counterparties rather than cash. The carrying value of fixed maturity securities posted as collateral to our counterparties was $107.9 million at December 31, 2008.
During 2008, we terminated certain of our outstanding derivatives when the credit ratings of the counterparty fell below our internal investment policy guidelines. At the time of termination, the contracts were in a loss position of $39.1 million. Consistent with our collateralization agreement, we had previously posted securities as collateral. As of December 31, 2008, these securities, which had a fair value of $47.6 million, had not been returned to us by the counterparty. As a result, we had not paid the termination amount due to the counterparty. The amount payable to the counterparty is included in other liabilities in our consolidated balance sheets. We believe we will ultimately
Index to Financial Statements
NOTES TO CONSOLIDATED FINANCIAL STATEMENTS - Continued
Unum Group and Subsidiaries
Note 5 - Derivative Financial Instruments - Continued
receive the value of our collateral, net of the termination amount owed, although the timing of the resolution is uncertain.
Hedging Activity
The table below summarizes by notional amounts the activity for each category of derivatives.
| Swaps | |||||||||||||||
| Receive Fixed/Pay Fixed | Receive Fixed/Pay Variable | Forwards | Options | Total | |||||||||||
| (in millions of dollars) | |||||||||||||||
Balance at December 31, 2002 | $ | 5.9 | $ | 966.0 | $ | 410.9 | $ | — | $ | 1,382.8 | |||||
Additions | 52.2 | 2,795.0 | 1,097.8 | — | 3,945.0 | ||||||||||
Terminations | — | 500.0 | 826.6 | — | 1,326.6 | ||||||||||
Balance at December 31, 2003 | 58.1 | 3,261.0 | 682.1 | — | 4,001.2 | ||||||||||
Additions | 688.4 | 15.0 | 218.2 | 785.0 | 1,706.6 | ||||||||||
Terminations | 39.2 | 149.0 | 723.7 | — | 911.9 | ||||||||||
Balance at December 31, 2004 | 707.3 | 3,127.0 | 176.6 | 785.0 | 4,795.9 | ||||||||||
Additions | 400.0 | 560.0 | 278.4 | 31.0 | 1,269.4 | ||||||||||
Terminations | 16.9 | 927.0 | 46.9 | 468.0 | 1,458.8 | ||||||||||
Balance at December 31, 2005 | $ | 1,090.4 | $ | 2,760.0 | $ | 408.1 | $ | 348.0 | $ | 4,606.5 | |||||
NOTES TO CONSOLIDATED FINANCIAL STATEMENTS - Continued
UnumProvident Corporation and Subsidiaries
Note 5 - Derivative Financial Instruments - Continued
| Swaps | |||||||||||||||||||
| Receive Variable/Pay Fixed | Receive Fixed/Pay Fixed | Receive Fixed/Pay Variable | Forwards | Options | Total | ||||||||||||||
| (in millions of dollars) | |||||||||||||||||||
Balance at December 31, 2005 | $ | - | $ | 1,090.4 | $ | 2,760.0 | $ | 408.1 | $ | 348.0 | $ | 4,606.5 | |||||||
Additions | - | - | 1,860.0 | 109.8 | 170.0 | 2,139.8 | |||||||||||||
Terminations | - | 64.2 | 2,435.0 | 125.0 | 348.0 | 2,972.2 | |||||||||||||
Balance at December 31, 2006 | - | 1,026.2 | 2,185.0 | 392.9 | 170.0 | 3,774.1 | |||||||||||||
Additions | - | - | 407.5 | 179.5 | 230.0 | 817.0 | |||||||||||||
Terminations | - | 80.6 | 947.5 | 257.3 | 320.0 | 1,605.4 | |||||||||||||
Balance at December 31, 2007 | - | 945.6 | 1,645.0 | 315.1 | 80.0 | 2,985.7 | |||||||||||||
Additions | 174.0 | 224.0 | 742.0 | 35.0 | - | 1,175.0 | |||||||||||||
Terminations | - | 237.8 | 1,227.0 | 83.8 | 80.0 | 1,628.6 | |||||||||||||
Balance at December 31, 2008 | $ | 174.0 | $ | 931.8 | $ | 1,160.0 | $ | 266.3 | $ | - | $ | 2,532.1 | |||||||
The following table summarizes the timing of anticipated settlements of interest rate swaps outstanding at December 31, 2005,2008, whereby the Company receiveswe receive a fixed rate and payspay a variable rate. The weighted average interest rates assume current market conditions.
| 2006 | 2007 | 2008 | 2009 | 2010 | 2011 | 2012 | 2013 | Total | 2009 | 2010 | 2011 | 2012 | 2013 | Total | ||||||||||||||||||||||||||||||||||||||||
| (in millions of dollars) | (in millions of dollars) | |||||||||||||||||||||||||||||||||||||||||||||||||||||
Receive Fixed/ Pay Variable | ||||||||||||||||||||||||||||||||||||||||||||||||||||||
Receive Fixed/Pay Variable | ||||||||||||||||||||||||||||||||||||||||||||||||||||||
Notional Value | $ | 575.0 | $ | 540.0 | $ | 485.0 | $ | 380.0 | $ | 240.0 | $ | 205.0 | $ | 185.0 | $ | 150.0 | $ | 2,760.0 | $ | 380.0 | $ | 240.0 | $ | 205.0 | $ | 185.0 | $ | 150.0 | $ | 1,160.0 | ||||||||||||||||||||||||
Weighted Average Receive Rate | 6.57 | % | 7.32 | % | 6.70 | % | 6.50 | % | 6.51 | % | 6.58 | % | 6.49 | % | 6.66 | % | 6.73 | % | 5.34% | 5.67% | 5.87% | 6.49% | 6.34% | 5.81% | ||||||||||||||||||||||||||||||
Weighted Average Pay Rate | 4.54 | % | 5.02 | % | 4.54 | % | 4.54 | % | 4.54 | % | 4.54 | % | 4.54 | % | 4.54 | % | 4.63 | % | 1.43% | 1.43% | 1.43% | 1.43% | 1.43% | 1.43% | ||||||||||||||||||||||||||||||
The Company’sOur freestanding derivatives all qualify as hedges under Statement of Financial Accounting Standards No. 133 (SFAS 133),Accounting for Derivative Instruments and Hedging Activities, and have been designated as either cash flow hedges or fair value hedges. The cash flow hedging programs are described as follows.
Cash Flow Hedges
The Company hasWe have executed a series of cash flow hedges in the group income protection, individual income protection – recently issued, group and individualfor certain of our long-term care, and individual income protection – closed blockproduct portfolios using forward starting interest rate swaps. The purpose of these hedges is to lock in the reinvestment rates on future anticipated cash flows through the year 2013 and protect the Companyus from the potential adverse impact of declining interest rates on the associated policy reserves. The Company plansWe plan on terminating these forward interest rate swaps and forward contracts at the time the projected cash flows are used
Index to purchase fixed income securities.The Company has executed a series of cash flow hedges using forward contracts on credit spreads. Forward contracts on credit spreads are used to hedge fluctuations in the credit risk rate. A forward contract on credit spreads is an agreement in which the Company agrees with other parties to settle for cash, at a specified future date, the computed value of the change in credit spreads of a specific bond. The Company intends to purchase this specific bond at its current market value at the same time the forward contract is terminated. By entering into the forward contract, the Company is able to lock in the credit spread component of this specific bond’s purchase yield.
The settlement dates of the forward contracts correspond to the settlement dates of the previously mentioned forward interest rate swap agreements. This combination of derivative instruments allows the Company to lock in the interest rate component and the credit spread component of yields on future bond purchases. The Company did not have any of these derivative contracts outstanding at December 31, 2005.
The Company has entered into an interest rate swap whereby it receives a fixed rate of interest and pays a variable rate of interest. The purpose of this swap is to hedge the variable cash flows associated with a floating rate security owned by the Company. The variable rate the Company pays on the swap is offset by the amount the Company receives on the variable rate security.
The Company has entered into several foreign currency interest rate swaps whereby it receives a fixed rate of interest denominated in U.S. dollars (functional currency) and pays a fixed rate of interest denominated in a foreign currency. The purpose of these derivatives is to eliminate the variability of functional currency cash flows associated with certain foreign currency denominated securities owned by the Company. The fixed rate the Company pays on the swap is offset by the fixed rate it receives on the foreign currency denominated security.
Financial Statements
NOTES TO CONSOLIDATED FINANCIAL STATEMENTS - Continued
UnumProvident CorporationUnum Group and Subsidiaries
Note 5 - Derivative Financial Instruments - Continued
During 2005,projected cash flows are used to purchase fixed income securities. As of December 31, 2008 and 2007, we had $1,160.0 million and $1,645.0 million, respectively, notional amount of the Company entered into several foreign currencyforward starting interest rate swaps outstanding under this program.
As of December 31, 2008 and a2007, we had $634.9 million and $612.1 million, respectively, notional amount of open current and forward foreign currency swaps to hedge fixed income foreign dollar denominated securities.
As of December 31, 2008 and 2007, we had $296.9 million and $333.5 million, respectively, notional amount of currency swaps and $216.3 million notional amount of forward contract in ordercurrency contracts to hedge the foreign currency risk ofassociated with the U.S. dollar denominated debt which will be servicedissued by dividends in British pound sterling from one of the Company’sour U.K. subsidiaries. Under the terms
As of the foreign currencyDecember 31, 2007, we had $80.0 million notional amount of open options on forward interest rate swaps to lock in a reinvestment rate floor for the Company receives a fixed ratereinvestment of interest denominated in U.S. dollars and pays a fixed rate of interest denominated in British pound sterling. Certain of these swaps require an exchange of principal and interest during their term, and certain of them require an exchange of interest only. The foreign currency forward contract requires the Company to receive a fixed amount of U.S. dollars and pay a fixed amount of British pound sterling. This currency forward is scheduled to mature at the same time the hedged debt matures. The purpose of these derivatives is to eliminate the variability of functional currency cash flows, associatedthrough the year 2008, from renewals on policies with the debt payments serviced by British pound sterling dividends.a one to two year minimum premium rate guarantee. We did not have any options outstanding at December 31, 2008.
The Company hasWe have invested in certain structured fixed maturity securities that contain embedded derivatives.derivatives with a notional amount of $50.0 and $98.8 million as of December 31, 2008 and 2007, respectively. These embedded derivatives represent forward contracts and are accounted for as cash flow hedges. The purpose of these forward contracts is to hedge the risk of changes in cash flows related to the anticipated purchase of certain equity securities in the years 2020 throughyear 2022.
During 2005 and 2004, the Company purchased options on forwardAs of December 31, 2006 we had $60.0 million notional amount of an interest rate swaps in orderswap outstanding whereby we received a fixed rate of interest and paid a variable rate of interest. The purpose of this swap was to hedge the interest rate risk on certain insurance liabilities with minimum interest rate guarantees. By purchasing options on the interest rate swaps, the Company is able to lock in the minimum investment yields needed to meet the required interest rate guarantee on these insurance liabilities. If interest rates rise above the option’s strike rate, the Company will not exercise the option, but will instead invest at the higher rates. If interest rates fall below the option’s strike rate, the Company will exercise the option to enter a receive fixed/pay floating forward interest rate swap. In the event the options are exercised, the Company intends to settle for cash the forward interest rate swap agreements prior to commencement of the exchange of interest payments. These cash flows are hedged through the year 2006.
During 2003, the Company entered into a forward treasury lock which, by taking a long position, allowed the Company to lock in the interest rate on the future purchase of a specific U.S. Treasury bond. This derivative was identified as a cash flow hedge and was used to minimize the interest rate risk related to the settlement price on the reinsurance of an existing block of in force business. Because the settlement price of the ceded reinsurance transaction was partially determined by the change in the interest rate of a specific five year U.S. Treasury bond, the forward treasury lock allowed the Company to hedge the interest rate used in the calculation of the settlement price. The Company terminated the treasury lock, for cash, at the same time the reinsurance transaction settled.
During 2005, the Company entered into a forward treasury lock which, by taking a long position, allowed the Company to lock in the interest rate on the future purchase of a specific U.S. Treasury bond. This derivative was identified as a cash flow hedge and was used to minimize the interest rate risk related to the purchase price of a certain fixed maturity security. Because the purchase price of the security was partially determined by the change in the interest rate of a specific twenty year U.S. Treasury bond, the forward treasury lock allowed the Company to hedge the projectedvariable cash flows associated with a floating rate security we owned. The variable rate we paid on the purchase ofswap was offset by the amount we received on the variable rate security. The Company terminated the treasury lock, for cash, at the time theswap and associated security was purchased.
matured in December 2007.
During 2005, the Company2007 and 2006, we entered into a foreign currency forward contract whereby it will receive a fixed amount of U.S. dollars and pay a fixed amount of foreign currency. The purpose of this derivative iscontracts to hedge the variability of functional currency cash flows associated with the anticipated receipt of foreign currency proceeds from the settlement of a bankruptcy claimto be received related to athe disposition of fixed maturity security owned by the Company. The Company intends to terminate this derivative,securities. In 2007 and 2006, we had $12.2 million and $15.2 million, respectively, notional amounts of these derivatives that were terminated, for cash, at the time the bankruptcy claimforeign currency proceeds arewere received.
During 20042006, we completed a program to reset the interest rates of several receive fixed, pay variable forward starting interest rate swaps by terminating various existing swaps and 2003, the Company entered into certain foreign currency forward contracts whereby the Company agreedadding new swaps at current market interest rates and identical cash flow dates. This allowed us to pay its counterpartyincrease our utilization of cash flows as well as reduce our credit exposure to our counterparties. Under this program, we added and terminated swaps with a specific Canadian dollar denominated notional amount in exchange for a specific U.S. dollar denominated notional amount. These derivatives were identified as cash flow hedges and were used to
NOTES TO CONSOLIDATED FINANCIAL STATEMENTS - Continued
UnumProvident Corporation and Subsidiaries
Note 5 - Derivative Financial Instruments - Continued
eliminate the variability of functional currency cash flows associated with the proceeds from the sale of the Canadian branch. The Company terminated these currency forwards, for cash, at the time of the closing of the sale of the branch and recognized$1,515.0 million each, resulting in a gain of $2.4$136.4 million which waswe reported as a component ofin other comprehensive income (loss). The anticipated cash flows hedged by these derivatives are still probable, and the lossgains from discontinued operations.
Asthe terminated swaps along with the replacement swaps continue to be highly effective cash flow hedges. These terminations and the associated gain are included in the hedging activity discussed in Note 1, effective October 1, 2003, the Company adopted the provisions of DIG Issue B36. The Company had two reinsurance contracts for which DIG Issue B36 was applicable, one of which was recaptured during 2005. Prior to recapture, the Company included in miscellaneous assets a deposit asset for the applicable reinsurance contract. At the time of recapture, the receivable in the deposit asset was settled, the derivative was terminated, and the assets were recorded using the market value of $1,621.7 million that existed on that date. The difference in the book value transferred out of the deposit asset account, which was $1,472.7 million, and the market value recorded equaled the embedded derivative market value component of $149.0 million. The time value component of $9.4 million was recognized as a realized investment loss. The fair value of the embedded derivative related to the remaining applicable reinsurance contract was $(6.2) million as of December 31, 2005. The change in fair value of DIG Issue B36 derivatives is reported as a realized investment gain or loss during the period of change.
following paragraph.
During the years ended December 31, 2005, 2004,2008, 2007, and 2003, the Company2006, we recognized net gains of $120.7$82.5 million, $29.1$26.0 million, and $79.6$183.6 million, respectively, on the termination of cash flow hedges and reported $121.0$84.4 million, $29.2$26.1 million, and $79.1$183.6 million, respectively, in other comprehensive income (loss). During the years ended December 31, 2008 and $(0.3) million, $(0.1)2007, we reported a net loss of $1.9 million and $0.5$0.1 million respectively, as a component of realized investment gains and losses. The Companylosses, respectively. We amortized $21.8$20.3 million, $20.2 million, and $30.0 million of net deferred gains into net investment income during 2005, $20.7 million during 2004,2008, 2007, and $17.3 million during 2003.2006, respectively. The estimated amount of net deferred gains to be amortized into operating earnings during 20062009 is $23.8$21.0 million.
Index to Financial Statements
NOTES TO CONSOLIDATED FINANCIAL STATEMENTS - Continued
Unum Group and Subsidiaries
Note 5 - Derivative Financial Instruments - Continued
The notional amount of derivatives outstanding under the hedge programs was $4,606.5 million at December 31, 2005. For the year ended December 31, 2005,2008, there was no material ineffectiveness related to the Company’s derivative holdings,our cash flow hedges, and there was no component of the derivative instruments’ gain or loss excluded from the assessment of hedge effectiveness. Additionally, there wereDuring 2008, we recognized credit impairment losses of $2.5 million as a result of the termination of swap contracts resulting from changes in the credit ratings of the counterparty such that the contract was no longer within our internal investment policy guidelines. During 2008 and 2007, we reclassified $0.6 million of net gains orand $0.1 million of net losses, reclassifiedrespectively, into earnings as a result of the discontinuance of cash flow hedges due to the improbability of the original forecasted transactions occurring asduring the time period originally anticipated.
Note 6 - Acquisitions and Dispositions
AcquisitionsFair Value Hedges
During 2005,2008, we entered into $174.0 million notional amount of receive variable, pay fixed interest rate swaps to hedge the Company acquired Independent Review Services, Inc., a providerchanges in fair value of medical diagnostic networks and independent medical examinations, at a price of $3.5 million.
During 2004,certain fixed rate securities held. These swaps effectively convert our fixed rate securities into floating rate securities, which are used to fund our floating rate long-term debt. These swaps were designated as fair value hedges under SFAS 133. As such, changes in the Company became responsible for the ongoing administration and managementfair value of the United Kingdom portionderivatives, as well as the offsetting change in fair value on the hedged securities attributable to the risk being hedged, are reported as realized investment gains and losses during the period of change in fair value. We did not have any ineffectiveness with these hedges during 2008. No component of our derivatives gain or loss was excluded in the assessment of hedge effectiveness. There were no instances in which we discontinued fair value hedge accounting due to a hedged firm commitment no longer qualifying as a fair value hedge.
DIG Issue B36 Derivative
We also have an embedded derivative in a modified coinsurance contract recognized under DIG Issue B36. DIG Issue B36 requires us to include in our realized investment gains and losses a calculation intended to estimate the value of the group income protection claims portfoliooption of Swiss Life (UK) plc (Swiss Life),our reinsurance counterparty to cancel the reinsurance contract with us. However, neither party can unilaterally terminate the reinsurance agreement except in extreme circumstances resulting from regulatory supervision, delinquency proceedings, or other direct regulatory action. Cash settlements or collateral related to this embedded derivative are not required at any time during the reinsurance contract or at termination of the reinsurance contract, and Swiss Lifeany accumulated embedded derivative gain or loss reduces to zero over time as the reinsured this portfoliobusiness winds down.
Due to the Company. The Company also became a multi-national pooling partner for Swiss Life Insurance & Pension Company with respect to business writtenchange in the United Kingdom. The amount attributable tofair value of business acquired in conjunction with this transaction was $15.4 million.
During 2004, the Company acquired Integrated Benefits Management, a providerembedded derivative, we recognized $291.7 million, $57.3 million, and $5.3 million of case management services, at a price of $0.7 million.
During 2003, the Company acquired the United Kingdom group income protection business of Sun Life Assurance Company of Canada (UK) Ltd, together with the renewal rights to the group life business.net realized investment losses during 2008, 2007, and 2006, respectively. The amount attributable tofair value of business acquired on this block of businessembedded derivative was $36.6 million.$(360.5) million and $(68.8) million at December 31, 2008 and 2007, respectively.
Index to Financial Statements
NOTES TO CONSOLIDATED FINANCIAL STATEMENTS - Continued
UnumProvident CorporationUnum Group and Subsidiaries
Note 6 - Acquisitions and Dispositions - Continued
A reconciliation of value of business acquired is as follows:
| 2005 | 2004 | 2003 | ||||||||||
| (in millions of dollars) | ||||||||||||
Balance at January 1 | $ | 101.5 | $ | 463.5 | $ | 456.2 | ||||||
Acquisition of Business | — | 15.4 | 36.6 | |||||||||
Interest Accrued | 5.2 | 6.3 | 36.4 | |||||||||
Amortization | (20.3 | ) | (22.1 | ) | (73.9 | ) | ||||||
Impairment | — | (367.1 | ) | — | ||||||||
Foreign Currency | (7.9 | ) | 5.5 | 8.2 | ||||||||
Balance at December 31 | $ | 78.5 | $ | 101.5 | $ | 463.5 | ||||||
During 2004, the Company recognized an impairment of $367.1 million for the remaining balance of the individual income protection – closed block value of business acquired. The impairment related to the restructuring of this business and the resulting modification of the Company’s reporting segments. See Note 14 for further discussion.
The estimated net amortization of value of business acquired for each of the next five years is $7.7 million in each of the years 2006, 2007, and 2008, $8.6 million in 2009, and $8.8 million in 2010.
Dispositions
During 2005, Unum Limited completed the sale of its Netherlands branch. The gain on the sale was $5.7 million before tax and $4.0 million after tax.
During 2004, the Company completed the sale of its Canadian branch. See Note 2 for further discussion.
In 2003, the Company entered into an agreement to sell its wholly-owned subsidiary Unum Japan Accident Insurance Co., Ltd. The Company also entered into an agreement with the buyer to reinsure certain existing income protection business and had a continuing presence in the operation throughout 2004. Upon initially entering into the agreement in 2003, the Company recognized a before tax impairment loss of $1.2 million and an after tax gain of $6.0 million. The transaction closed in 2004, at which time the Company received $18.8 million and recorded a receivable of $4.7 million to be paid in 2006, net of indemnification claims, if any. At December 31, 2005, the Company estimated that approximately 75 percent of that amount would be received in 2006. The remainder of the balance of the receivable was expensed.
In 2003, the Company wrote down the book value of its Argentinean operation to the estimated fair value less cost to sell and at that time recognized an impairment loss of $13.5 million before tax and $11.3 million after tax. During 2004, the Company reduced its ownership position in this operation to 40 percent and reported a before-tax loss of $4.7 million and an after-tax gain of $2.7 million. In 2005, the Company disposed of its remaining 40 percent ownership position and recognized an after tax gain of $0.4 million.
NOTES TO CONSOLIDATED FINANCIAL STATEMENTS - Continued
UnumProvident Corporation and Subsidiaries
Note 7 - Liability for Unpaid Claims and Claim Adjustment Expenses
Changes in the liability for unpaid claims and claim adjustment expenses are as follows:
| 2005 | 2004 | 2003 | ||||||||||
| (in millions of dollars) | ||||||||||||
Balance at January 1 | $ | 22,285.1 | $ | 20,397.5 | $ | 17,878.9 | ||||||
Less Reinsurance Receivables | 3,096.2 | 2,654.5 | 2,435.8 | |||||||||
Net Balance at January 1 | 19,188.9 | 17,743.0 | 15,443.1 | |||||||||
Acquisition of Business - Note 6 | — | 267.0 | 285.9 | |||||||||
Recapture of Business - Note 13 | 934.8 | — | — | |||||||||
Incurred Related to | ||||||||||||
Current Year | 5,188.3 | 5,471.5 | 5,241.7 | |||||||||
Prior Years | ||||||||||||
Interest | 1,066.9 | 1,005.0 | 933.0 | |||||||||
Incurred | 442.9 | 335.6 | 1,048.4 | |||||||||
Foreign Currency | (224.2 | ) | 128.7 | 275.0 | ||||||||
Total Incurred | 6,473.9 | 6,940.8 | 7,498.1 | |||||||||
Paid Related to | ||||||||||||
Current Year | (1,692.1 | ) | (1,726.3 | ) | (1,720.7 | ) | ||||||
Prior Years | (4,125.1 | ) | (4,035.6 | ) | (3,763.4 | ) | ||||||
Total Paid | (5,817.2 | ) | (5,761.9 | ) | (5,484.1 | ) | ||||||
Net Balance at December 31 | 20,780.4 | 19,188.9 | 17,743.0 | |||||||||
Plus Reinsurance Receivables | 2,267.3 | 3,096.2 | 2,654.5 | |||||||||
Balance at December 31 | $ | 23,047.7 | $ | 22,285.1 | $ | 20,397.5 | ||||||
| 2008 | 2007 | 2006 | |||||||
| (in millions of dollars) | |||||||||
Balance at January 1 | $ | 24,790.0 | $ | 24,324.4 | $ | 23,047.7 | |||
Less Reinsurance Recoverable | 2,249.8 | 2,257.3 | 2,267.3 | ||||||
Net Balance at January 1 | 22,540.2 | 22,067.1 | 20,780.4 | ||||||
Acquisition or Recapture of Business - Note 12 | 44.2 | 204.3 | - | ||||||
Incurred Related to | |||||||||
Current Year | 4,569.4 | 4,836.9 | 5,204.4 | ||||||
Prior Years | |||||||||
Interest | 1,281.2 | 1,199.9 | 1,149.5 | ||||||
Incurred for Claim Reassessment Process | - | 65.8 | 396.4 | ||||||
All Other Incurred | 144.7 | 174.3 | 228.5 | ||||||
Foreign Currency | (697.0) | 33.7 | 292.2 | ||||||
Total Incurred | 5,298.3 | 6,310.6 | 7,271.0 | ||||||
Paid Related to | |||||||||
Current Year | (1,412.8) | (1,460.5) | (1,597.5) | ||||||
Prior Years | (4,277.2) | (4,581.3) | (4,386.8) | ||||||
Total Paid | (5,690.0) | (6,041.8) | (5,984.3) | ||||||
Net Balance at December 31 | 22,192.7 | 22,540.2 | 22,067.1 | ||||||
Plus Reinsurance Recoverable | 2,226.3 | 2,249.8 | 2,257.3 | ||||||
Balance at December 31 | $ | 24,419.0 | $ | 24,790.0 | $ | 24,324.4 | |||
The majority of the net balances are related to disability claims with long-tail payouts on which interest earned on assets backing liabilities is an integral part of pricing and reserving. Interest accrued on prior year reserves has been calculated on the opening reserve balance less one-half year’s cash payments at theour average reserve discount rate used by the Company during 2005,2008, 2007, and 2006.
Our “Incurred Related to Prior Years” for 2007 and 2006 includes adjustments to reserves for our claim reassessment process. We entered into settlement agreements with various state insurance regulators during 2004 and 2003.
During 2005, the Company implemented the procedural and organizational changes outlined in the multistate2005. In connection with these settlement agreements, we increased our disability claim reserves $396.4 million and resulting from other process improvement initiatives. Implementation$65.8 million in 2006 and 2007, respectively, to reflect our revised estimate for costs associated with the claim reassessment process. “Paid Related to Prior Years” includes $248.0 million and $154.9 million in 2007 and 2006, respectively, for these reserve charges.
“Incurred Related to Prior Years – All Other Incurred” year over year volatility relates primarily to the recent variability in our claim resolution rate experience. Claim resolution rates are very sensitive to operational and environmental changes and can be volatile over short periods of time. During the procedural and organizational changes temporarily reducedyears 2006 to 2008, we improved the operating effectiveness of the Company’s U.S. Brokerageour Unum US and Individual Disability – Closed Block segment claims management performance. This resultedDuring this time period, we gained more stability in our claims management performance, and our claim resolution rates for Unum US and Individual Disability – Closed Block trended towards consistency with our long-term assumptions. The decrease in 2008 relative to 2007 relates primarily to an increaseincreased rate of claim recoveries for our group long-term disability lines of business in the change in the provision during 2005Unum US and 2004 for incurred claims andUnum UK. Our claim adjustment expenses related to prior years. The change in provision for 2005 also includes a portion of the reserve charge recorded in connection with the 2005 California Department of Insurance settlement agreement and related matters. The change in provision for 2004 includes a portion of the reserve charge recorded in conjunction with the 2004 multistate settlement agreements as well as the reserve strengthening for the individual income protection – closed block business. The net increase reported for 2003 includes the $894.0 million for the two reserve strengthenings related to the U.S. Brokerage group income protection business, all of which was related to prior year incurred claims. See further discussion as follows for the reserve strengthenings and Note 15 for further discussion of the settlement agreements.resolution
Index to Financial Statements
NOTES TO CONSOLIDATED FINANCIAL STATEMENTS - Continued
UnumProvident CorporationUnum Group and Subsidiaries
Note 76 - Liability for Unpaid Claims and Claim Adjustment Expenses - Continued
In April 2004, the Company completed an analysisrate assumption used in determining reserves is our expectation of the assumptions related to its individual income protection – closedresolution rate we will experience over the life of the block claim reserves. The analysis was initiated based on the restructuring effective January 1, 2004, which reflected the individual income protection – closed block as a stand-alone segment. Previously these reserves were analyzed for the individual income protection line of business on a combined basis. Includedand will vary from actual experience in the analysis was a review of morbidity assumptions, primarily claim resolution rates,any one period, both favorably and claim reserve discount rate assumptions. Based upon this analysis, the Company lowered the claim reserve discount rate to reflect the segmentation of the investment portfolio between the individual income protection – recently issued business and the individual income protection – closed block business, the duration of the assets and the related policy liabilities. Based on the April 2004 analysis, in the first quarter of 2004 the Company increased its individual income protection – closed block claim reserves by $110.6 million before tax, or $71.9 million after tax, to reflect its current estimate of future benefit obligations. The first quarter 2004 change represented a 1.2 percent increase in total net Individual Income Protection – Closed Block segment reserves as of March 31, 2004, which equaled $9.530 billion prior to this increase. In conjunction with this restructuring of the individual income protection – closed block business and the subsequent reserve strengthening, reinsurance, and other related adjustments, the net increase in the reserve liability reported in the preceding table for 2004 for total incurred claims was $237.9 million, $0.5 million of which was related to current year incurred claims and $237.4 million to prior year incurred claims.
In January 2004, the Company completed its annual review of claim reserves to ensure that its claim reserves make adequate and reasonable provision for future benefits and expenses. Based upon this review, the Company increased its U.S. Brokerage group income protection claim reserves as of December 31, 2003 by $440.0 million before tax, or $286.0 million after tax. Approximately $300.0 million of the reserve strengthening reflected implementation of a lower discount rate for the Company’s group income protection claim reserves. The discount rate was lowered to reflect the Company’s actual change in investment portfolio yield rates during 2003, the expectation of future investment portfolio yield rates, and the Company’s new discount rate management approach of maintaining a wider spread between its group income protection portfolio investment yield rate and its average discount rate. The Company’s new discount rate management approach is intended to better reflect the current investment environment and position the Company to be more responsive with discount rates on new incurred claims as changes to the investment environment emerge. Approximately $140.0 million of the reserve increase related to a strengthening of the morbidity assumptions to reflect the impact of the Company’s view of a continuing jobless economic recovery on claim incidence and severity. Of this amount, approximately $64.0 million was established to reflect higher claim incidence expectations. Claim incidence in the second half of 2003 was 8.4 percent higher than the first half of the year and 5.8 percent above the second half of 2002. Claim incidence was expected to continue at an elevated level for several quarters as the Company believed that early indications of a recovering economy were not yet reflected in improved consumer confidence or job creation. Also included in the $140.0 million strengthening was approximately $76.0 million to reflect higher severity expectations driven primarily by a lengthening of claim duration expectations in those claims that had been open 36 months or longer. The $440.0 million reserve increase represented a 6.6 percent increase in total net U.S. Brokerage group income protection reserves as of December 31, 2003, which totaled $6.674 billion prior to this increase.
In April 2003, the Company completed an analysis of its assumptions related to its U.S. Brokerage group long-term income protection claim reserves. Included in the analysis was a review of active claim reserves, incurred but not reported (IBNR) reserves, and claim reopen reserves. An active claim reserve is established for future benefit payments when a claim is incurred and reported to the Company. IBNR reserves are established on claims which are estimated to have been incurred but not yet reported to the Company. Claim reopen reserves are established for those claimants who have previously recovered but who are anticipated to return to disabled status under the same disability and within a specified period of time, as contractually allowed by the disability policy. The analysis was initiated based on lower claim resolution rates observed during the first quarter of 2003. The claim resolution rate is the rate of probability that a disability claimant will recover, die, or reach maximum benefit limits and no longer receive benefit payments from the Company. Generally, claim resolution rates vary by the age of the claimant at the time of disability, duration or length
NOTES TO CONSOLIDATED FINANCIAL STATEMENTS - Continued
UnumProvident Corporation and Subsidiaries
Note 7 - Liability for Unpaid Claims and Claim Adjustment Expenses - Continued
of time since the disability initially occurred, and claim diagnosis. The claim resolution rates for group long-term income protection during the first quarter of 2003 were below levels anticipated for reserves and were lower than those experienced in the full years 2002, 2001, and 2000. The analysis indicated not only a decrease in overall claim resolution rates, but also a change in claim resolution rates by claim duration. The analysis of emerging claim resolution rates and the reasons driving the changes resulted in a reduction in the Company’s long-term expectations with respect to claim resolution rates. The Company’s long-term expectations applied to all claims incurred regardless of the date of incurral. In addition, the Company reviewed the reserve discount rate, which is the interest rate at which future cash flows for benefits and expenses to be paid are discounted to determine the current value of those cash flows. The Company concluded at that time that a change in its discount rate assumptions was not warranted. Based on the April 2003 analysis, in the first quarter of 2003 the Company increased its U.S. Brokerage group long-term income protection claim reserves by $454.0 million before tax, or $295.1 million after tax, to reflect its current estimate of future benefit obligations. The active claim reserve for claims already reported to the Company and still in open claim status was increased by $516.0 million, the IBNR reserve was decreased by $23.0 million, and the reopen reserve was decreased by $39.0 million before tax. The first quarter 2003 change represented a 7.8 percent increase in total net U.S. Brokerage group income protection reserves as of March 31, 2003, which equaled $5.828 billion prior to this increase.
unfavorably.
A reconciliation of policy and contract benefits and reserves for future policy and contract benefits as reported in the consolidated statements of financial conditionbalance sheets to the liability for unpaid claims and claim adjustment expenseexpenses is as follows:
| December 31 | |||||||||
| 2005 | 2004 | 2003 | |||||||
| (in millions of dollars) | |||||||||
Policy and Contract Benefits | $ | 2,063.4 | $ | 1,841.6 | $ | 1,928.4 | |||
Reserves for Future Policy and Contract Benefits | 34,041.5 | 33,224.8 | 31,112.0 | ||||||
Total | 36,104.9 | 35,066.4 | 33,040.4 | ||||||
Less: | |||||||||
Life Reserves for Future Policy and Contract Benefits | 7,471.3 | 7,280.0 | 7,041.0 | ||||||
Accident and Health Active Life Reserves | 4,464.6 | 4,409.6 | 4,691.1 | ||||||
Unrealized Adjustment to Reserves for Future Policy and Contract Benefits | 1,121.3 | 1,091.7 | 910.8 | ||||||
Liability for Unpaid Claims and Claim Adjustment Expense | $ | 23,047.7 | $ | 22,285.1 | $ | 20,397.5 | |||
| December 31 | |||||||||
| 2008 | 2007 | 2006 | |||||||
| (in millions of dollars) | |||||||||
Policy and Contract Benefits | $ | 1,769.5 | $ | 1,979.7 | $ | 2,220.4 | |||
Reserves for Future Policy and Contract Benefits | 34,581.5 | 35,828.0 | 35,689.4 | ||||||
Total | 36,351.0 | 37,807.7 | 37,909.8 | ||||||
Less: | |||||||||
Life Reserves for Future Policy and Contract Benefits | 7,128.4 | 6,937.2 | 7,753.1 | ||||||
Accident and Health Active Life Reserves | 5,606.7 | 5,221.2 | 4,869.2 | ||||||
Unrealized Adjustment to Reserves for Future Policy and Contract Benefits | (803.1) | 859.3 | 963.1 | ||||||
Liability for Unpaid Claims and Claim Adjustment Expenses | $ | 24,419.0 | $ | 24,790.0 | $ | 24,324.4 | |||
The unrealized adjustment to reserves for future policy and contract benefits reflects the changes that would be necessary to policyholder liabilities if the unrealized investment gains and losses related to the available-for-sale securities had been realized. Changes in these adjustments are reported as a component of other comprehensive income.
Note 7 - Income Tax
Total income tax expense (benefit) is allocated as follows:
| Year Ended December 31 | |||||||||
| 2008 | 2007 | 2006 | |||||||
| (in millions of dollars) | |||||||||
Income from Continuing Operations | $ | 270.8 | $ | 324.8 | $ | 61.8 | |||
Income from Discontinued Operations | - | 10.9 | 5.8 | ||||||
Stockholders’ Equity - Additional Paid-in Capital Stock-Based Compensation | (0.6) | (5.8) | - | ||||||
Stockholders’ Equity - Accumulated Other Comprehensive Income (Loss) | |||||||||
Change in Net Unrealized Gains and Losses on Securities | (636.6) | (100.4) | (273.1) | ||||||
Change in Net Gain on Cash Flow Hedges | 139.0 | (6.0) | (39.8) | ||||||
Change in Foreign Currency Translation Adjustment | - | - | (0.3) | ||||||
Change in Unrecognized Pension and Postretirement Benefit Costs | (112.4) | 16.7 | 11.3 | ||||||
Adjustment to Adopt SFAS 158 | - | - | (40.3) | ||||||
Stockholders’ Equity - Retained Earnings | |||||||||
Adjustment to Adopt SOP 05-1 | - | (232.9) | - | ||||||
Adjustment to Adopt FIN 48 | - | (22.7) | - | ||||||
Total Income Tax Benefit | $ | (339.8) | $ | (15.4) | $ | (274.6) | |||
Index to Financial Statements
NOTES TO CONSOLIDATED FINANCIAL STATEMENTS - Continued
UnumProvident CorporationUnum Group and Subsidiaries
Note 87 - Income Tax - Continued
Total income tax expense (benefit) was allocated as follows:
| Year Ended December 31 | ||||||||||||
| 2005 | 2004 | 2003 | ||||||||||
| (in millions of dollars) | ||||||||||||
Income (Loss) from Continuing Operations | $ | 196.0 | $ | (67.3 | ) | $ | (170.6 | ) | ||||
Income (Loss) from Discontinued Operations | — | (36.6 | ) | 15.9 | ||||||||
Cumulative Effect of Accounting Principle Change | — | — | 21.4 | |||||||||
Stockholders’ Equity - Accumulated Other Comprehensive Income (Loss) | ||||||||||||
Net Unrealized Gain on Securities | (147.9 | ) | 130.8 | 132.3 | ||||||||
Net Gain on Cash Flow Hedges | 19.7 | 42.6 | 39.8 | |||||||||
Foreign Currency Translation Adjustment | (0.2 | ) | (3.3 | ) | 34.0 | |||||||
Minimum Pension Liability Adjustment | (6.7 | ) | (18.3 | ) | 11.0 | |||||||
Stockholders’ Equity - Additional Paid-in Capital Stock Option Compensation | (4.5 | ) | (0.1 | ) | — | |||||||
Total Income Tax Expense | $ | 56.4 | $ | 47.8 | $ | 83.8 | ||||||
A reconciliation of the income tax expense (benefit) attributable to income (loss) from continuing operations before income tax, and cumulative effect of accounting principle change, computed at U.S. federal statutory tax rates, to the income tax expense (benefit) as included in the consolidated statements of operations,income, is as follows.follows:
| Year Ended December 31 | |||||||||
| 2005 | 2004 | 2003 | |||||||
Statutory Income Tax | 35.0 | % | 35.0 | % | 35.0 | % | |||
Goodwill Impairment | — | (28.0 | ) | — | |||||
Prior Year Tax Settlements | (6.4 | ) | 19.3 | 0.1 | |||||
Tax Basis on Sale of Foreign Subsidiaries | — | 2.2 | 1.0 | ||||||
Fines and Penalties | 0.4 | (2.1 | ) | (0.1 | ) | ||||
Tax-exempt Investment Income | (0.8 | ) | 1.7 | 1.8 | |||||
Change in Valuation Allowance | — | — | 1.7 | ||||||
Other Items, Net | (0.6 | ) | (2.2 | ) | (0.3 | ) | |||
Effective Tax | 27.6 | % | 25.9 | % | 39.2 | % | |||
| Year Ended December 31 | |||||||||
| 2008 | 2007 | 2006 | |||||||
Statutory Income Tax | 35.0 | % | 35.0 | % | 35.0 | % | |||
Prior Year Taxes and Interest | 0.6 | (0.2) | (2.1) | ||||||
Tax-exempt Investment Income | (1.0) | (1.0) | (1.6) | ||||||
Foreign Net Operating Losses | - | 0.1 | (17.9) | ||||||
Other Foreign Items | (2.0) | (1.3) | (0.9) | ||||||
Other Items, Net | 0.3 | - | 0.8 | ||||||
Effective Tax | 32.9 | % | 32.6 | % | 13.3 | % | |||
Our deferred income tax assets and liabilities consist of the following:
| December 31 | ||||||
| 2008 | 2007 | |||||
| (in millions of dollars) | ||||||
Deferred Tax Liability | ||||||
Deferred Acquisition Costs | $ | 297.9 | $ | 284.9 | ||
Invested Assets | - | 62.1 | ||||
Other | 99.5 | 84.0 | ||||
Gross Deferred Tax Liability | 397.4 | 431.0 | ||||
Deferred Tax Asset | ||||||
Invested Assets | 561.4 | - | ||||
Employee Benefits | 233.4 | 148.3 | ||||
Other | 45.5 | 36.6 | ||||
Gross Deferred Tax Asset | 840.3 | 184.9 | ||||
Less Valuation Allowance | 4.1 | 5.6 | ||||
Net Deferred Tax Asset | 836.2 | 179.3 | ||||
Total Net Deferred Tax (Asset) Liability | $ | (438.8) | $ | 251.7 | ||
Index to Financial Statements
NOTES TO CONSOLIDATED FINANCIAL STATEMENTS - Continued
UnumProvident CorporationUnum Group and Subsidiaries
Note 87 - Income Tax - Continued
Our consolidated statements of income include amounts subject to both domestic and foreign taxation. The net deferred income and related tax liability consists of the following:expense (benefit) are as follows:
| December 31 | ||||||
| 2005 | 2004 | |||||
| (in millions of dollars) | ||||||
Deferred Tax Liability | ||||||
Deferred Policy Acquisition Costs | $ | 538.3 | $ | 574.5 | ||
Invested Assets | 563.1 | 659.4 | ||||
Other | 153.3 | 229.2 | ||||
Gross Deferred Tax Liability | 1,254.7 | 1,463.1 | ||||
Deferred Tax Asset | ||||||
Loss Carryforwards | 65.6 | 206.7 | ||||
Employee Benefits | 172.4 | 158.1 | ||||
Other | 33.3 | 44.0 | ||||
Gross Deferred Tax Asset | 271.3 | 408.8 | ||||
Less Valuation Allowance | 6.3 | 6.3 | ||||
Net Deferred Tax Asset | 265.0 | 402.5 | ||||
Total Net Deferred Tax Liability | $ | 989.7 | $ | 1,060.6 | ||
| Year Ended December 31 | |||||||||
| 2008 | 2007 | 2006 | |||||||
| (in millions of dollars) | |||||||||
Income Before Tax | |||||||||
United States - Federal | $ | 531.3 | $ | 703.9 | $ | 249.0 | |||
Foreign | 292.7 | 311.1 | 229.6 | ||||||
Total | $ | 824.0 | $ | 1,015.0 | $ | 478.6 | |||
Current Tax Expense | |||||||||
United States - Federal | $ | 297.2 | $ | 214.0 | $ | 110.2 | |||
Foreign | 43.7 | 72.9 | 43.9 | ||||||
Total | 340.9 | 286.9 | 154.1 | ||||||
Deferred Tax Expense (Benefit) | |||||||||
United States - Federal | (106.2) | 38.6 | (21.3) | ||||||
Foreign | 36.1 | 10.2 | (65.2) | ||||||
Total | (70.1) | 48.8 | (86.5) | ||||||
Total Income Tax Expense | $ | 270.8 | $ | 335.7 | $ | 67.6 | |||
UnderDuring 2007, the Life Insurance Company Tax Act of 1959, U.S. stock life insurance companies were required to maintainU.K. enacted a policyholders’ surplus account containing the accumulated portion of income which had not been subjected to income tax in the year earned. The Deficit Reduction Act of 1984 required that no future amounts be added after 1983 to the policyholders’ surplus account and that any future distributions to shareholders from the account would become subject to federal income tax at the general corporate federal income tax rate then in effect. During 2004, the Homeland Investment Act of 2004 was enacted.decrease from 30 percent to 28 percent. The Homeland Investment Act of 2004 provides, in part, that distributions from policyholders’ surplus accounts during 2005 and 2006 will not be taxed.
The amount of the policyholders’ surplus accounts of the Company’s U.S. insurance subsidiaries at December 31, 2004, was approximately $228.8 million. Distributions made during 2005 by these life insurance subsidiaries, including dividend distributions, were deemed to occur first from the policyholders’ surplus accounts. As a result, the Company’s U.S. life insurance subsidiaries distributed as dividends the remaining balance of their policyholders’ surplus account to the holding company during 2005. This resulted in the elimination of a future potential tax of approximately $80.1 million which had not previously been provided for in current or deferred taxes because management considered the conditions under which such a tax would be paid to be remote.
The Homeland Investment Act of 2004 provides a deduction of 85 percent of certain foreign earnings that were repatriated during 2005, up to a maximum of $500.0 million. For the portion of unremitted foreign earnings of its non-U.S. operations that had been considered to be permanently reinvested, the Company had not previously provided U.S. income taxes. During the fourth quarter of 2005, the Company repatriated $454.8 million in unremitted foreign earnings from its U.K. subsidiary. The Company recorded current taxes payable on those previously unremitted foreign earnings of approximately $15.3 million and recorded a tax benefit of approximately $18.6 millionrecognized in operations as a result of this decrease was $1.7 million. We consider the reversalunremitted earnings of the deferredour foreign operations to be permanently invested. The determination of a tax liability related to such unremitted earnings. Remaining amountsthese earnings is not practical.
The cumulative effect of unremitted earnings are considered permanently investedapplying the provisions of FIN 48 as of January 1, 2007 resulted in a $22.7 million decrease in our liability for unrecognized tax benefits, net of associated deferred tax assets. Our consolidated statements of income include the foreign subsidiaries, and no taxes have therefore been provided on those amounts.
| December 31 | ||||||
| 2008 | 2007 | |||||
| (in millions of dollars) | ||||||
Balance at Beginning of Year | $ | 161.0 | $ | 67.4 | ||
Tax Positions Related to Current Year | ||||||
Additions | - | 104.6 | ||||
Subtractions | - | (4.8) | ||||
Tax Positions Related to Prior Years | ||||||
Additions | 0.3 | 4.4 | ||||
Subtractions | (11.5) | (10.6) | ||||
Balance at End of Year | 149.8 | 161.0 | ||||
Less Tax Attributable to Temporary Items Included Above | (134.6) | (145.8) | ||||
Total Unrecognized Tax Benefits that if Recognized Would Affect the | $ | 15.2 | $ | 15.2 | ||
Index to Financial Statements
NOTES TO CONSOLIDATED FINANCIAL STATEMENTS - Continued
UnumProvident CorporationUnum Group and Subsidiaries
Note 87 - Income Tax - Continued
Included at January 1, 2007 are unrecognized tax benefits of approximately $19.2 million that, if recognized, would impact our effective tax rate. Included in the balance at December 31, 2008 and 2007 are $134.6 million and $145.8 million, respectively, of unrecognized tax benefits for tax positions for which the ultimate deductibility is highly certain but for which there is uncertainty about the timing of such deductibility. Other than potential interest and penalties, the disallowance of the shorter deductibility period would not affect our results of operations but would accelerate the payment of cash to the taxing authority to an earlier period.
We recognize interest expense and penalties related to unrecognized tax benefits in tax expense net of federal income tax. The Company’stotal amounts of accrued interest and penalties in the consolidated balance sheets as of December 31, 2008 and 2007 are $13.4 million and $7.5 million, respectively. We recognized interest expense and penalties related to unrecognized tax expense in our consolidated statements of operations includeincome of $5.9 million and $2.0 million during 2008 and 2007, respectively. We had no changes to uncertain tax positions as a result of settlements or lapses in statutes of limitations during 2008 or 2007. We do not expect a significant change in our existing liability for unrecognized tax benefits during the following amounts of income subject to foreign taxation, including the results of the Canadian branch discontinued operations,next 12 months.
We file federal and the related foreignstate income tax expense (benefit):
| Year Ended December 31 | |||||||||||
| 2005 | 2004 | 2003 | |||||||||
| (in millions of dollars) | |||||||||||
Income Before Tax Subject to Foreign Taxation | $ | 179.8 | $ | 61.7 | $ | 168.7 | |||||
Foreign Income Tax Expense (Benefit) | |||||||||||
Current | $ | 50.3 | $ | 75.5 | $ | 48.4 | |||||
Deferred | 0.6 | (69.6 | ) | (3.0 | ) | ||||||
Total Foreign Income Tax Expense | $ | 50.9 | $ | 5.9 | $ | 45.4 | |||||
Duringreturns in the first quarter of 2005,United States and in foreign jurisdictions. We are under continuous examination by the Internal Revenue Service (IRS) with regard to our U.S. federal income tax returns. The current IRS examination covers our tax years 2005 and 2006. During 2008, the IRS completed its examination of tax years 19992002 through 20012004 and issued its revenue agent’s report (RAR) in April 2005. Income tax liabilities of approximately $32.0 million that related primarily. We filed a protest to interest on the timing of expense deductions were released in the first quarter of 2005,RAR with respect to all of which was reflected as a reductionsignificant adverse proposed adjustments and expect an appeal to income tax expense. Subsequently, the Company paidbe heard by the IRS during 2009 on all outstanding issues for proposed adjustments for tax years 1999 through 2001 and recorded an income tax benefit of an additional $2.0 million, net of the payment, pertaining to the items paid. The Company will file claims for refund on disputed issues in the IRS report. The Company also recognized $3.0 million of net investment income as a result of refunds received from the IRS during the year. Additionally, in 2005, the Company recognized an income tax benefit of approximately $10.8 million in connection with the finalization of income tax reviews of the Company’s U.K. subsidiaries.2004.
During 2004, the Company obtained a judgment in refund litigation for tax year 1984, and as a result was entitled to a refund of tax plus interest for 1984 and for taxTax years subsequent to 1984 in which the IRS took inconsistent positions on the deductibility of the insurance tax reserves that were the2006 remain subject of the litigation and for which the Company paid tax based on the IRS’ positions. As a result of the judgment, interest income before taxes was increased by $14.0 million and results from operations were increased by $26.2 million, after taxes.
Also during 2004, the Company recognized tax benefits from settlements of IRS examinations of tax years 1996 through 1998. Under the settlements, the Company resolved issues raised by the IRS pertaining to calculation of insurance tax reserves and the deductibility of losses on notional principal contracts. Tax benefits of $33.1 million are included in 2004 results from operations attributable to the effect of prior year tax settlements.
The Company is under continuous examination by the IRS and other tax authorities in areas wherein the Company has significant business operations. The current IRS examination covers the tax years 2002 through 2004. Management believesU.S. and in major foreign jurisdictions. We believe sufficient provision has been made for all proposed and potential adjustments for years that are not closed by the statute of limitations in all major tax jurisdictions and that any future adjustment willsuch adjustments would not have a material adverse effect on theour financial position, liquidity, or results of operations of the Company althoughoperations. However, it is possible that the resolution of income tax matters could impactproduce quarterly volatility in our results of operations in future periods.
Included in 2008 operating results is a refund of interest of $7.6 million before tax and $4.9 million after tax primarily attributable to tax years 1986 through 1996.
During 2006, we reversed income tax liabilities of approximately $91.9 million related primarily to group relief benefits obtained from the Company’s effectiveuse of net operating losses in a foreign jurisdiction in which our businesses operate as the result of final determinations on those years. Also included in 2006 operating results is income of $2.6 million before tax rate for a particular future period.
and $3.9 million after tax attributable to the receipt of interest and tax refunds on prior year tax items in excess of what was previously provided.
As of December 31, 2005,2008, we had no net operating loss carryforward in the Company’s subsidiaries hadU.S. and $4.1 million net operating loss carryforwards in the U.S. of approximately $144.9 million, and capital loss carryforwards of $7.7 million. The majority of the net operating loss carryforwards will expire in 2019. Capital loss carryforwards of $7.7 million will expire in 2008. As of December 31, 2005, the Company’s foreign subsidiaries had net operating loss carryforwards of $6.0 millionjurisdictions for which a full valuation allowance has been established because, in management’sour judgment, the Companywe will most likely not realize a tax benefit for these losses. The $1.5 million decrease from 2007 in the valuation allowance is due primarily to utilization of loss carryforwards during 2008 as well as the fluctuation in the British pound sterling to dollar exchange rate.
Total income taxes paid during 2008, 2007, and 2006 were $369.0 million, $189.9 million, and $129.2 million, respectively.
Index to Financial Statements
NOTES TO CONSOLIDATED FINANCIAL STATEMENTS - Continued
UnumProvident CorporationUnum Group and Subsidiaries
Note 8 - Income Tax - Continued
Total income taxes paid (refunded) during 2005, 2004, and 2003 were $93.4 million, $91.5 million, and $(3.9) million, respectively.
Note 9 - Debt
At December 31, 2005, the Company had noLong-term and short-term debt. At December 31, 2004, short-term debt consisted of $200.0 million for the 6.375% notes due in 2005 and $27.0 million for the portion of the Company’s medium-term notes due in 2005. The weighted average interest rate for the current portion of the medium-term notes outstanding during 2004 was 7.2 percent.
Long-term debt consists of the following:
| December 31 | December 31 | |||||||||||
| 2005 | 2004 | 2008 | 2007 | |||||||||
| (in millions of dollars) | (in millions of dollars) | |||||||||||
Adjustable Conversion Rate Equity Units @ 8.25% due 2008 | $ | 575.0 | $ | 575.0 | ||||||||
Adjustable Conversion Rate Equity Units @ 8.25% due 2009 | 300.0 | 300.0 | ||||||||||
Notes @ 7.25% due 2032, callable at or above par | 150.0 | 150.0 | ||||||||||
Senior Secured Notes, variable due 2037, callable at or above par | $ | 740.7 | $ | 800.0 | ||||||||
Senior Secured Notes, variable due 2036, callable at or above par | 102.5 | 112.5 | ||||||||||
Notes @ 7.375% due 2032, callable at or above par | 250.0 | 250.0 | 39.5 | 39.5 | ||||||||
Notes @ 6.75% due 2028, callable at or above par | 250.0 | 250.0 | 166.4 | 166.4 | ||||||||
Notes @ 7.25% due 2028, callable at or above par | 200.0 | 200.0 | 200.0 | 200.0 | ||||||||
Notes @ 7.0% due 2018, non-callable | 200.0 | 200.0 | ||||||||||
Notes @ 6.85%, due 2015, callable at or above par | 399.6 | — | 296.7 | 333.2 | ||||||||
Notes @ 7.625% due 2011, callable at or above par | 575.0 | 575.0 | 225.1 | 225.1 | ||||||||
Notes @ 5.859% due 2009 | - | 150.0 | ||||||||||
Notes @ 7.0% due 2018, non-callable | 200.0 | 200.0 | ||||||||||
Medium-term Notes @ 7.0% to 7.2% due 2023 to 2028, non-callable | 62.0 | 62.0 | ||||||||||
Junior Subordinated Debt Securities @ 7.405% due 2038 | 300.0 | 300.0 | 226.5 | 226.5 | ||||||||
Medium-term Notes @ 7.0% to 7.2% due 2023 to 2028, non-callable | 62.0 | 62.0 | ||||||||||
Long-term Debt | 2,259.4 | 2,515.2 | ||||||||||
Notes @ 5.859% due 2009 | 132.2 | - | ||||||||||
Notes @ 5.997% due 2008 | - | 175.0 | ||||||||||
Repurchase Agreements, Weighted Average @ 2.71% due 2009 | 58.3 | - | ||||||||||
Short-term Debt | 190.5 | 175.0 | ||||||||||
Total | $ | 3,261.6 | $ | 2,862.0 | $ | 2,449.9 | $ | 2,690.2 | ||||
Collateralized debt, which consists of the senior secured notes, ranks highest in priority, followed by unsecured notes, which consists of notes and medium-term notes, followed by junior subordinated debt securities. The 7.25% notesjunior subordinated debt securities due 20322038 are redeemable at the Company’s option on or after June 25, 2007.callable under limited, specified circumstances. The remaining callable debt may be redeemed, in whole or in part, at any time.
The aggregate contractual principleprincipal maturities are $575.0 million in 2008, $300.0$190.5 million in 2009, and $2,387.0$225.1 million in 2011, and $2,034.5 million in 2015 and thereafter.
Senior Secured Notes
In 2007, Northwind Holdings, LLC (Northwind Holdings), a wholly-owned subsidiary of Unum Group, issued $800.0 million of insured, senior, secured notes due 2037 (the Northwind notes) in a private offering. The Northwind notes bear interest at a floating rate equal to the three-month LIBOR plus 0.78%.
Northwind Holdings’ ability to meet its obligations to pay principal, interest, and other amounts due on the Northwind notes will be dependent principally on its receipt of dividends from Northwind Reinsurance Company (Northwind Re), the sole subsidiary of Northwind Holdings. Northwind Re reinsured the risks attributable to specified individual disability insurance policies issued by or reinsured by Provident Life and Accident Insurance Company, Unum Life Insurance Company of America (Unum America), and The Paul Revere Life Insurance Company (collectively, the ceding insurers) pursuant to separate reinsurance agreements between Northwind Re and each of the ceding insurers. The ability of Northwind Re to pay dividends to Northwind Holdings will depend on its satisfaction of applicable regulatory requirements and the performance of the reinsured policies.
Index to Financial Statements
NOTES TO CONSOLIDATED FINANCIAL STATEMENTS - Continued
Unum Group and Subsidiaries
Note 8 - Debt - Continued
Recourse for the payment of principal, interest, and other amounts due on the Northwind notes is limited to the collateral for the Northwind notes and the other assets, if any, of Northwind Holdings. The collateral consists of a first priority, perfected security interest in (a) the debt service coverage account (Northwind DSCA) that Northwind Holdings is required to maintain in accordance with the indenture pursuant to which the Northwind notes were issued (the Northwind indenture), (b) the capital stock of Northwind Re and the dividends and distributions on such capital stock, and (c) Northwind Holdings’ rights under the transaction documents related to the Northwind notes to which Northwind Holdings is a party. At December 31, 2008 the amount in the Northwind DSCA was $29.7 million. None of Unum Group, the ceding insurers, Northwind Re, or any other affiliate of Northwind Holdings is an obligor or guarantor with respect to the Northwind notes.
Northwind Holdings is required to repay a portion of the outstanding principal under the Northwind notes at par on the quarterly scheduled payment dates under the Northwind notes in an amount equal to the lesser of (i) a targeted amortization amount as defined in the Northwind indenture and (ii) the amount of the remaining available funds in the Northwind DSCA minus an amount equal to the minimum balance that is required to be maintained in the Northwind DSCA under the Northwind indenture, provided that Northwind Holdings has sufficient funds available to pay its other expenses, including interest payments on the Northwind notes, and to maintain the minimum balance in the Northwind DSCA as required under the Northwind indenture. During 2008, Northwind Holdings made principal payments of $59.3 million on the Northwind notes.
In November 2005,2006, Tailwind Holdings, LLC (Tailwind Holdings), a wholly-owned subsidiary of Unum Group, issued $130.0 million of insured, senior, secured notes due 2036 (the Tailwind notes) in a private offering. The Tailwind notes bear interest at a floating rate equal to the three-month LIBOR plus 0.35%.
Tailwind Holdings’ ability to meet its obligations to pay principal, interest, and other amounts due on the Tailwind notes will be dependent principally on its receipt of dividends from Tailwind Reinsurance Company (Tailwind Re), the sole subsidiary of Tailwind Holdings. Tailwind Re reinsured Unum America’s liability with respect to certain specified long-term disability claims incurred between January 1, 1999 and December 31, 2001 that were in payment status on January 1, 2006 pursuant to a reinsurance agreement between Tailwind Re and Unum America. The ability of Tailwind Re to pay dividends to Tailwind Holdings will depend on its satisfaction of applicable regulatory requirements and the performance of the reinsured claims.
Recourse for the payment of principal, interest, and other amounts due on the Tailwind notes is limited to the collateral for the Tailwind notes and the other assets, if any, of Tailwind Holdings. The collateral consists of a first priority, perfected security interest in (a) the debt service coverage account (Tailwind DSCA) that Tailwind Re is required to maintain in accordance with the indenture pursuant to which the Tailwind notes were issued (the Tailwind indenture), (b) the capital stock of Tailwind Re and the dividends and distributions on such capital stock, and (c) Tailwind Holdings’ rights under the transaction documents related to the Tailwind notes to which Tailwind Holdings is a party. At December 31, 2008 the amount in the Tailwind DSCA was $9.4 million. None of Unum Group, Unum America, Tailwind Re, or any other affiliate of Tailwind Holdings is an obligor or guarantor with respect to the Tailwind notes.
Tailwind Holdings is required to repay a portion of the outstanding principal under the Tailwind notes at par on the quarterly scheduled payment dates under the Tailwind notes in an amount equal to the lesser of (i) a targeted amortization amount as defined in the Tailwind indenture and (ii) the amount of the remaining available funds in the Tailwind DSCA minus an amount equal to the minimum balance that is required to be maintained in the Tailwind DSCA under the Tailwind indenture, provided that Tailwind Holdings has sufficient funds available to pay its other expenses, including interest payments on the Tailwind notes, and to maintain the minimum balance in the Tailwind DSCA as required under the Tailwind indenture. During 2008 and 2007, Tailwind Holdings made principal payments of $10.0 million and $17.5 million, respectively, on the Tailwind notes.
Index to Financial Statements
NOTES TO CONSOLIDATED FINANCIAL STATEMENTS - Continued
Unum Group and Subsidiaries
Note 8 - Debt - Continued
Unsecured Notes
In 2007, we purchased and retired $99.9 million aggregate principal amount of the 7.625% notes due 2011; $210.5 million aggregate principal amount of the 7.375% notes due 2032; and $83.6 million of our outstanding 6.75% notes scheduled to mature in 2028. We also called and retired all $150.0 million principal amount of our outstanding 7.25% notes scheduled to mature in 2032.
In 2006, we purchased and retired $250.0 million aggregate principal amount of our outstanding 7.625% notes due 2011.
In 2008, 2007, and 2006, $36.6 million, $34.5 million, and $32.0 million, respectively, of the 6.85% senior debentures due November 15, 2015 inwere redeemed. These debentures were issued by UnumProvident Finance Company plc, a private offeringwholly-owned subsidiary of Unum Group, and received net proceeds of $399.6 million.are fully and unconditionally guaranteed by Unum Group.
Adjustable Conversion-Rate Equity Security Units
In May 2004, the CompanyUnum Group issued 12.0 million 8.25% adjustable conversion-rate equity security units (units) in a private offering for $300.0 million. The CompanyWe subsequently registered the privately placed securities for resale by the private investors. Each unit hashad a stated amount of $25 and will initially consistconsisted of (a) a contract pursuant to which the holder agrees to purchase, for $25, shares of the Company’sUnum Group common stock on May 15, 2007 and which entitlesentitled the holder to contract adjustment payments at the annual rate of 3.165 percent, payable quarterly, and (b) a 1/40 or 2.5 percent ownership interest in a senior note issued by the CompanyUnum Group due May 15, 2009 with a principal amount of $1,000, on which the Company will paywe paid interest at the initial annual rate of 5.085 percent, payable quarterly. Upon settlement of the common stock purchase contract and successfulThe scheduled remarketing of the senior note element of these units occurred in February 2007, as stipulated by the terms of the original offering, and we reset the interest rate on $300.0 million of senior notes due May 15, 2009 to 5.859%. We purchased $150.0 million of the senior notes in the remarketing which were subsequently retired. In May 2007, we settled the purchase contract element of the units the Company will receiveby issuing 17.7 million shares of common stock. We received proceeds of approximately $300.0 million and will issue between 17.7 million and 20.4 million shares of common stock. The present value offrom the quarterly contract adjustment payments, which is included in other liabilities in the consolidated statements of financial condition, and the related purchase contract issuance costs reduced additional paid-in capital by $27.6 million.
NOTES TO CONSOLIDATED FINANCIAL STATEMENTS - Continued
UnumProvident Corporation and Subsidiaries
Note 9 - Debt - Continued
transaction.
In May 2003, the CompanyUnum Group issued 23.0 million 8.25% adjustable conversion-rate equity security units (units) in a public offering for $575.0 million. Each unit hashad a stated amount of $25 and will initially consistconsisted of (a) a contract pursuant to which the holder agreesagreed to purchase, for $25, shares of the Company’sUnum Group common stock on May 15, 2006 and which entitlesentitled the holder to contract adjustment payments at the annual rate of 2.25 percent, payable quarterly, and (b) a 1/40, or 2.5 percent, ownership interest in a senior note issued by the CompanyUnum Group due May 15, 2008 with a principal amount of $1,000, on which the Company will paywe paid interest at the initial annual rate of 6.00 percent, payable quarterly. Upon settlement of the common stock purchase contract and successful remarketing of the senior note element of the units, the Company will receive proceeds of approximately $575.0 million and will issue between 43.3 million and 52.9 million shares of common stock. The present value of the quarterly contract adjustment payments, which is included in other liabilities in the consolidated statements of financial condition, and the related purchase contract issuance costs reduced additional paid-in capital by $37.4 million.
The scheduled remarketing of the senior note element of thethese units issued in May 2003 occurred in February 2006, as stipulated by the terms of the original offering, and we reset the Company issuedinterest rate on $575.0 million of 5.997% senior notes due May 15, 2008. The Company participated in the remarketing of the units and2008 to 5.997%. We purchased $400.0 million of the senior notes in the remarketing which were subsequently retired. Upon settlement of the common stock purchase contract in May 2006, we received proceeds of approximately $575.0 million and issued 43.3 million shares of common stock.
Junior Subordinated Debt Securities
In 1998, Provident Financing Trust I (the trust) issued $300.0 million of 7.405% capital securities in a public offering. These capital securities, which mature on March 15,in 2038, are fully and unconditionally guaranteed by the Company,Unum Group, have a liquidation value of $1,000 per capital security, and have a mandatory redemption feature under certain circumstances. The CompanyUnum Group issued $300.0 million of 7.405% junior subordinated deferrable interest debentures which mature on March 15, 2038, to the trust in connection with the capital securities offering. The debentures mature in 2038. The sole assets of the trust are the junior subordinated debt securities. In accordance with the provisions2007 and 2006, $23.5 million and $50.0 million of FIN 46(R), the Company reports these securities as long-term debt in the consolidated statements of financial condition.debentures were redeemed, respectively.
Index to Financial Statements
NOTES TO CONSOLIDATED FINANCIAL STATEMENTS - Continued
Unum Group and Subsidiaries
Note 8 - Debt - Continued
Short-term Debt
In 2008, we purchased and retired $17.8 million of our outstanding 5.859% notes and $175.0 million of our 5.997% notes.
Interest and Debt Expense
Interest paid on long-term and short-term debt and related securities during 2008, 2007, and 2006 was $157.3 million, $184.1 million, and $200.7 million, respectively.
The Companycost related to early retirement of debt during 2008, 2007, and 2006 decreased income approximately $0.4 million, $58.8 million, and $25.8 million, respectively, before tax, or $0.3 million, $38.3 million, and $16.9 million, respectively, after tax.
Credit Facility
In 2008, we entered into $250.0 million unsecured revolving credit facility. Borrowings under the facility are for general corporate uses and are subject to financial covenants, negative covenants, and events of default that are customary. The facility has a 364 day tenor and a one year term out option. The facility provides for interest rates based on either the prime rate or LIBOR, as adjusted. Within this facility is a $100.0 million letter of credit sub-limit. At December 31, 2008, there were no amounts outstanding on the facility.
Shelf Registration
We have a shelf registration, which became effective in 2005,December 2008, with the Securities and Exchange Commission to issue various types of securities, including common stock, preferred stock, debt securities, depository shares, stock purchase contracts, units and warrants, or preferred securities of wholly-owned finance trusts up to an aggregate of $1.0 billion.trusts. If utilized, the shelf registration will enable the Companyus to raise funds from the offering of any individual security covered by the shelf registration as well as any combination thereof, subject to market conditions and the Company’sour capital needs.
Note 9 - Pensions and Other Postretirement Benefits
Interest paidWe sponsor several defined benefit pension and postretirement plans for our employees, including non-qualified pension plans. The U.S. plans comprise the majority of our total benefit obligation and benefit cost. We maintain a separate defined benefit plan for eligible employees in our U.K. operation. The U.K. defined benefit pension plan was closed to new entrants on short-termDecember 31, 2002.
Information presented as follows for our non U.S. plans previously included plans for the employees of our Canadian branch operation which was sold in 2004. In the third quarter of 2007, we terminated the Canadian defined benefit pension plans which were frozen in 2004. The termination of these plans resulted in a reduction in our pension assets and long-term debt and related securities during 2005, 2004, and 2003 was $210.7 million, $205.2pension liabilities of $15.1 million and $182.2a settlement cost of $0.3 million respectively.recognized in our net periodic benefit cost for 2007.
As a result of the sale of GENEX, we froze the pension plan benefits for the employees of GENEX during the first quarter of 2007, which resulted in a $7.2 million reduction in our pension liability and a curtailment loss of $0.2 million recognized in our net periodic benefit cost for 2007. The curtailment loss was comprised of a $0.6 million increase in our pension liability related to a termination benefit and a $0.4 million recognition of unamortized prior service credits. As of the date of the curtailment, we remeasured our U.S. pension plan obligation. The weighted average discount rate assumption used in the measurement of our U.S. pension plan benefit obligation changed from
Index to Financial Statements
NOTES TO CONSOLIDATED FINANCIAL STATEMENTS - Continued
UnumProvident CorporationUnum Group and Subsidiaries
Note 109 - Pensions and Other Postretirement Benefits - Continued
6.10 percent as of our December 31, 2006 measurement date to 5.90 percent as of the measurement date of March 1, 2007. No other assumptions were materially changed. As a result of the remeasurement, our pension plan liability increased $35.6 million. The Company sponsors several defined benefitnet effect of the curtailment and remeasurement was an increase in our pension plan liability of $29.0 million, a decrease in deferred income tax of $10.1 million, a decrease in income from discontinued operations of $0.2 million, and postretirement plans for its employees, including non-qualified pension plans. a decrease in accumulated other comprehensive income of $18.7 million.
The following tables provide the changes in the benefit obligation and fair value of plan assets and statements of the funded status of the plans. The Company uses a December 31 measurement date for each plan.
| Pension Benefits | ||||||||||||||||||||||||||||||||||||||||||
| U.S. Plans Pension Benefits | Non-U.S. Plans Pension Benefits | Postretirement Benefits | U.S. Plans | Non U.S. Plans | Postretirement Benefits | |||||||||||||||||||||||||||||||||||||
| 2005 | 2004 | 2005 | 2004 | 2005 | 2004 | 2008 | 2007 | 2008 | 2007 | 2008 | 2007 | |||||||||||||||||||||||||||||||
| (in millions of dollars) | (in millions of dollars) | |||||||||||||||||||||||||||||||||||||||||
Change in Benefit Obligation | ||||||||||||||||||||||||||||||||||||||||||
Benefit Obligation at Beginning of Year | $ | 727.3 | $ | 599.6 | $ | 144.8 | $ | 110.2 | $ | 188.3 | $ | 192.0 | $ | 904.8 | $ | 886.8 | $ | 187.9 | $ | 194.0 | $ | 189.4 | $ | 192.5 | ||||||||||||||||||
Service Cost | 35.2 | 29.4 | 8.3 | 8.6 | 4.2 | 4.1 | 28.7 | 31.9 | 7.8 | 9.2 | 3.3 | 3.6 | ||||||||||||||||||||||||||||||
Interest Cost | 43.7 | 37.1 | 7.5 | 6.5 | 10.4 | 10.9 | 58.2 | 54.2 | 10.3 | 9.7 | 11.5 | 11.0 | ||||||||||||||||||||||||||||||
Plan Participant Contributions | — | — | — | — | 2.8 | 2.7 | - | - | - | - | 3.2 | 3.2 | ||||||||||||||||||||||||||||||
Actuarial (Gain) Loss | 37.7 | (44.1) | (28.8) | (7.8) | (0.9) | (7.0) | ||||||||||||||||||||||||||||||||||||
Benefits and Expenses Paid | (20.1) | (18.6) | (3.9) | (3.7) | (13.9) | (13.9) | ||||||||||||||||||||||||||||||||||||
Plan Amendments | — | — | — | — | — | (8.8 | ) | - | 1.2 | - | - | - | - | |||||||||||||||||||||||||||||
Actuarial (Gain) Loss | 47.6 | 72.9 | 8.8 | 12.8 | (0.4 | ) | 1.4 | |||||||||||||||||||||||||||||||||||
Benefits Paid | (11.9 | ) | (11.7 | ) | (2.6 | ) | (3.2 | ) | (15.5 | ) | (14.0 | ) | ||||||||||||||||||||||||||||||
Curtailment | — | — | — | (1.1 | ) | — | — | - | (7.2) | - | - | - | - | |||||||||||||||||||||||||||||
Divestiture | - | - | - | (2.1) | - | - | ||||||||||||||||||||||||||||||||||||
Settlement | - | - | - | (15.1) | - | - | ||||||||||||||||||||||||||||||||||||
Special Termination Benefit Cost | - | 0.6 | - | - | - | - | ||||||||||||||||||||||||||||||||||||
Change in Foreign Exchange Rates | — | — | (13.9 | ) | 11.0 | — | — | - | - | (46.3) | 3.7 | - | - | |||||||||||||||||||||||||||||
Benefit Obligation at End of Year | $ | 841.9 | $ | 727.3 | $ | 152.9 | $ | 144.8 | $ | 189.8 | $ | 188.3 | $ | 1,009.3 | $ | 904.8 | $ | 127.0 | $ | 187.9 | $ | 192.6 | $ | 189.4 | ||||||||||||||||||
Accumulated Benefit Obligation at December 31 | $ | 723.2 | $ | 630.6 | $ | 135.6 | $ | 128.4 | N/A | N/A | $ | 952.2 | $ | 856.9 | $ | 110.8 | $ | 162.4 | N/A | N/A | ||||||||||||||||||||||
Change in Fair Value of Plan Assets | ||||||||||||||||||||||||||||||||||||||||||
Fair Value of Plan Assets at Beginning of Year | $ | 478.1 | $ | 423.8 | $ | 94.2 | $ | 73.9 | $ | 11.8 | $ | 11.8 | $ | 784.3 | $ | 658.5 | $ | 186.2 | $ | 184.3 | $ | 12.0 | $ | 12.0 | ||||||||||||||||||
Actual Return on Plan Assets | 23.1 | 42.9 | 15.9 | 8.3 | 0.4 | 0.6 | (239.7) | 31.0 | (25.2) | 7.7 | 0.3 | 0.4 | ||||||||||||||||||||||||||||||
Employer Contributions | 26.1 | 23.1 | 8.8 | 9.0 | 12.4 | 10.7 | 133.6 | 113.4 | 7.3 | 11.4 | 10.4 | 10.3 | ||||||||||||||||||||||||||||||
Plan Participant Contributions | — | — | — | — | 2.8 | 2.7 | - | - | - | - | 3.2 | 3.2 | ||||||||||||||||||||||||||||||
Benefits Paid | (11.9 | ) | (11.7 | ) | (2.6 | ) | (3.2 | ) | (15.5 | ) | (14.0 | ) | ||||||||||||||||||||||||||||||
Benefits and Expenses Paid | (20.1) | (18.6) | (3.9) | (3.7) | (13.9) | (13.9) | ||||||||||||||||||||||||||||||||||||
Divestiture | - | - | - | (1.9) | - | - | ||||||||||||||||||||||||||||||||||||
Settlement | - | - | - | (15.1) | - | - | ||||||||||||||||||||||||||||||||||||
Change in Foreign Exchange Rates | — | — | (8.8 | ) | 6.2 | — | — | - | - | (44.3) | 3.5 | - | - | |||||||||||||||||||||||||||||
Fair Value of Plan Assets at End of Year | $ | 515.4 | $ | 478.1 | $ | 107.5 | $ | 94.2 | $ | 11.9 | $ | 11.8 | $ | 658.1 | $ | 784.3 | $ | 120.1 | $ | 186.2 | $ | 12.0 | $ | 12.0 | ||||||||||||||||||
Underfunded Status | $ | (326.5 | ) | $ | (249.2 | ) | $ | (45.4 | ) | $ | (50.6 | ) | $ | (177.9 | ) | $ | (176.5 | ) | ||||||||||||||||||||||||
Unrecognized Net Actuarial Loss | 363.9 | 318.2 | 50.2 | 58.8 | 12.0 | 12.9 | ||||||||||||||||||||||||||||||||||||
Unrecognized Prior Service Cost | (11.4 | ) | (14.2 | ) | — | — | (19.5 | ) | (24.1 | ) | ||||||||||||||||||||||||||||||||
Unrecognized Net Transition Asset | — | — | (0.3 | ) | (0.5 | ) | — | — | ||||||||||||||||||||||||||||||||||
Net Amount Recognized | $ | 26.0 | $ | 54.8 | $ | 4.5 | $ | 7.7 | $ | (185.4 | ) | $ | (187.7 | ) | ||||||||||||||||||||||||||||
Unfunded Liability | $ | 351.2 | $ | 120.5 | $ | 6.9 | $ | 1.7 | $ | 180.6 | $ | 177.4 | ||||||||||||||||||||||||||||||
Index to Financial Statements
NOTES TO CONSOLIDATED FINANCIAL STATEMENTS - Continued
UnumProvident CorporationUnum Group and Subsidiaries
Note 109 - Pensions and Other Postretirement Benefits - Continued
The projected benefit obligation, accumulated benefit obligation, and fair value of plan assets for pension plans with accumulated benefit obligations in excess of plan assets were $979.3 million, $843.4 million, and $607.5 million, respectively, as of December 31, 2005, and $857.9 million, $744.9 million, and $558.6 million, respectively, as of December 31, 2004.
Amountsamounts recognized in the consolidated statements of financial conditionbalance sheets for our pension and postretirement benefit plans at December 31, 2008 and 2007 are as follows:
| Pension Benefits | ||||||||||||||||||
| U.S. Plans | Non U.S. Plans | Postretirement Benefits | ||||||||||||||||
| 2008 | 2007 | 2008 | 2007 | 2008 | 2007 | |||||||||||||
| (in millions of dollars) | ||||||||||||||||||
Current Pension Liability | $ | 3.5 | $ | 3.3 | $ | - | $ | - | $ | 14.3 | $ | 13.5 | ||||||
Noncurrent Pension Liability | 347.7 | 117.2 | 6.9 | 1.7 | 166.3 | 163.9 | ||||||||||||
Unfunded Liability | $ | 351.2 | $ | 120.5 | $ | 6.9 | $ | 1.7 | $ | 180.6 | $ | 177.4 | ||||||
Unrecognized Pension and Postretirement Benefit Costs | ||||||||||||||||||
Net Actuarial Loss | $ | (578.5) | $ | (255.2) | $ | (47.2) | $ | (55.4) | $ | (6.2) | $ | (6.7) | ||||||
Prior Service Credit | 1.4 | 3.6 | - | - | 8.5 | 11.9 | ||||||||||||
Transition Asset | - | - | - | 0.2 | - | - | ||||||||||||
| (577.1) | (251.6) | (47.2) | (55.2) | 2.3 | 5.2 | |||||||||||||
Deferred Income Tax Asset (Liability) | 203.1 | 89.7 | 13.2 | 15.2 | (0.8) | (1.8) | ||||||||||||
Total Included in Accumulated Other Comprehensive Income (Loss) | $ | (374.0) | $ | (161.9) | $ | (34.0) | $ | (40.0) | $ | 1.5 | $ | 3.4 | ||||||
The following table provides the changes recognized in other comprehensive income for the Company’syears ended December 31, 2008 and 2007.
| Pension Benefits | ||||||||||||||||||
| U.S. Plans | Non U.S. Plans | Postretirement Benefits | ||||||||||||||||
| 2008 | 2007 | 2008 | 2007 | 2008 | 2007 | |||||||||||||
| (in millions of dollars) | ||||||||||||||||||
Accumulated Other Comprehensive Income (Loss) at Beginning of Year | $ | (161.9) | $ | (188.4) | $ | (40.0) | $ | (45.3) | $ | 3.4 | $ | 1.5 | ||||||
Net Actuarial Loss | 13.9 | 19.2 | 2.3 | 3.0 | - | - | ||||||||||||
Curtailment | - | 7.2 | - | - | - | - | ||||||||||||
All Other Changes | (337.2) | 16.7 | 5.9 | 6.1 | 0.5 | 6.7 | ||||||||||||
Prior Service Credit | (2.2) | (3.1) | - | - | (3.4) | (3.8) | ||||||||||||
All Other Changes | - | (1.6) | - | - | - | 0.1 | ||||||||||||
Transition Asset | - | - | (0.2) | (0.2) | - | - | ||||||||||||
All Other Changes | - | - | - | 0.1 | - | - | ||||||||||||
Change in Deferred Income Tax | 113.4 | (11.9) | (2.0) | (3.7) | 1.0 | (1.1) | ||||||||||||
Accumulated Other Comprehensive | $ | (374.0) | $ | (161.9) | $ | (34.0) | $ | (40.0) | $ | 1.5 | $ | 3.4 | ||||||
Index to Financial Statements
NOTES TO CONSOLIDATED FINANCIAL STATEMENTS - Continued
Unum Group and Subsidiaries
Note 9 - Pensions and Other Postretirement Benefits - Continued
The weighted average asset allocations, by asset category, for our funded pension plans consistare as follows:
| U.S. Plans | Non U.S. Plans | |||||||||||||||||||||||||||||||
| 2008 | 2007 | 2008 | 2007 | |||||||||||||||||||||||||||||
| Target | Actual | Target | Actual | Target | Actual | Target | Actual | |||||||||||||||||||||||||
Equity Securities | 50-70 | % | 59 | % | 55 - 65 | % | 58 | % | 60 | % | 57 | % | 60 | % | 56 | % | ||||||||||||||||
Fixed Income Securities | 20-40 | 34 | 27 - 33 | 31 | 40 | 43 | 40 | 38 | ||||||||||||||||||||||||
Other | 5-15 | 7 | 8 - 12 | 11 | - | - | - | 6 | ||||||||||||||||||||||||
Total | 100 | % | 100 | % | 100 | % | 100 | % | ||||||||||||||||||||||||
The investment portfolio for our U.S. pension plans contains a diversified blend of domestic and international large cap, mid cap, and small cap equity securities, investment-grade and below-investment-grade fixed income securities, private equity funds of funds, and hedge funds of funds. Assets for our U.K. pension plan are invested in pooled funds, with approximately 57 percent in diversified growth assets including global equities, hedge funds, commodities, below-investment-grade fixed income securities, and currencies. The remainder of the following:assets for our U.K. plan is predominantly invested in U.K. corporate bonds and index linked U.K. government bonds. Assets for life insurance benefits payable to certain former retirees covered under the postretirement benefits plan are invested primarily within life insurance contracts issued by one of our insurance subsidiaries. The terms of these contracts are consistent in all material respects with those the subsidiary offers to unaffiliated parties that are similarly situated. We believe our investment portfolios are well diversified by asset class and sector, with no potential risk concentrations in any one category.
| U.S. Plans Pension Benefits | Non-U.S. Plans Pension Benefits | |||||||||||||||
| 2005 | 2004 | 2005 | 2004 | |||||||||||||
| (in millions of dollars) | ||||||||||||||||
Prepaid Benefit Cost | $ | — | $ | — | $ | 2.0 | $ | 2.5 | ||||||||
Accrued Benefit Liability | (207.6 | ) | (152.2 | ) | (27.6 | ) | (33.9 | ) | ||||||||
Minimum Pension Liability Adjustment in Accumulated Other Comprehensive Income (Loss), Before Tax | 233.6 | 207.0 | 30.1 | 39.1 | ||||||||||||
Net Amount Recognized | $ | 26.0 | $ | 54.8 | $ | 4.5 | $ | 7.7 | ||||||||
Measurement Assumptions
We use a December 31 measurement date for each of our plans. The weighted average assumptions used in the measurement of the Company’sour benefit obligations as of December 31 are as follows:
| U.S. Plans Pension Benefits | Non-U.S. Plans Pension Benefits | Postretirement Benefits | ||||||||||||||||
| 2005 | 2004 | 2005 | 2004 | 2005 | 2004 | |||||||||||||
Discount Rate | 5.80 | % | 6.05 | % | 4.82 | % | 5.25 | % | 5.50 | % | 5.70 | % | ||||||
Rate of Compensation Increase | 4.70 | % | 4.60 | % | 4.70 | % | 4.86 | % | — | — | ||||||||
The weighted average assumptions used to determineand our net periodic benefit costcosts for the years ended December 31 are as follows:
| U.S. Plans Pension Benefits | Non-U.S. Plans Pension Benefits | Postretirement Benefits | Pension Benefits | |||||||||||||||||||||||||||||||||
| 2005 | 2004 | 2005 | 2004 | 2005 | 2004 | U.S. Plans | Non U.S. Plans | Postretirement Benefits | ||||||||||||||||||||||||||||
| 2008 | 2007 | 2008 | 2007 | 2008 | 2007 | |||||||||||||||||||||||||||||||
Benefit Obligations | ||||||||||||||||||||||||||||||||||||
Discount Rate | 6.40 | % | 6.50 | % | 6.40 | % | 5.80 | % | 6.10 | % | 6.30 | % | ||||||||||||||||||||||||
Rate of Compensation Increase | 4.70 | % | 4.70 | % | 5.10 | % | 5.30 | % | - | - | ||||||||||||||||||||||||||
Net Periodic Benefit Cost | ||||||||||||||||||||||||||||||||||||
Discount Rate | 6.05 | % | 6.25 | % | 5.25 | % | 5.61 | % | 5.70 | % | 6.10 | % | 6.50 | % | 5.90-6.10 | % | 5.80 | % | 5.10 | % | 6.30 | % | 5.90 | % | ||||||||||||
Expected Return on Plan Assets | 8.50 | % | 8.50 | % | 7.09 | % | 6.58 | % | 5.75 | % | 6.00 | % | 7.50 | % | 8.00 | % | 6.90 | % | 6.80 | % | 5.75 | % | 5.75 | % | ||||||||||||
Rate of Compensation Increase | 4.60 | % | 4.60 | % | 4.86 | % | 4.77 | % | — | — | 4.70 | % | 4.70 | % | 5.30 | % | 5.00 | % | - | - | ||||||||||||||||
The Company currently setsWe set the discount rate assumption annually for each of its retirement relatedour retirement-related benefit plans at the measurement date to reflect the yield of a portfolio of high quality long-term fixed income securitiesdebt instruments matched against the timing and amounts of projected cash flows for future benefits.
For measurement purposes at December 31, 2005, the annual rate of increase in the per capita cost of covered health care benefits assumed for 2006 was 9.00 percent for benefits payable
Index to retirees prior to Medicare eligibility and 9.80 percent for benefits payable to Medicare eligible retirees. The rate range was assumed to change gradually to a rate of 5.00 percent for 2010 and remain at that level thereafter. For measurement purposes at December 31, 2004, the annual rate of increase in the per capita cost of covered health care benefits assumed for 2005 was 8.75 percent forFinancial Statements
NOTES TO CONSOLIDATED FINANCIAL STATEMENTS - Continued
UnumProvident CorporationUnum Group and Subsidiaries
Note 109 - Pensions and Other Postretirement Benefits - Continued
benefits payable to retirees prior to Medicare eligibility and 11.00 percent for benefits payable to Medicare eligible retirees. The rate range was assumed to change gradually to a rate of 5.00 percent for 2008 and remain at that level thereafter.
A one percent increase or decrease in the assumed health care cost trend rate at December 31, 2005 would have increased (decreased) the service cost and interest cost by $1.2 million and $(1.1) million, respectively, and the postretirement benefit obligation by $8.1 million and $(9.7) million, respectively.
The medical and dental premium used to determine the per retiree employer subsidy are capped. If the cap is not reached by the year 2015, the caps are then set equal to the year 2015 premium. Certain of the current retirees and all future retirees are subject to the cap.
The following table provides the components of the net periodic benefit cost for the plans described above for the years ended December 31.
| U.S. Plans Pension Benefits | Non-U.S. Plans Pension Benefits | Postretirement Benefits | ||||||||||||||||||||||||||||||||||
| 2005 | 2004 | 2003 | 2005 | 2004 | 2003 | 2005 | 2004 | 2003 | ||||||||||||||||||||||||||||
| (in millions of dollars) | ||||||||||||||||||||||||||||||||||||
Service Cost | $ | 35.2 | $ | 29.4 | $ | 21.9 | $ | 8.3 | $ | 8.6 | $ | 6.9 | $ | 4.2 | $ | 4.1 | $ | 4.3 | ||||||||||||||||||
Interest Cost | 43.7 | 37.1 | 33.9 | 7.5 | 6.5 | 4.8 | 10.4 | 10.9 | 14.3 | |||||||||||||||||||||||||||
Expected Return on Plan Assets | (40.5 | ) | (36.1 | ) | (29.5 | ) | (6.6 | ) | (5.2 | ) | (3.6 | ) | (0.7 | ) | (0.7 | ) | (0.7 | ) | ||||||||||||||||||
Net Amortization and Deferral | 16.4 | 13.2 | 15.5 | 2.5 | 2.1 | 1.9 | (3.8 | ) | (3.7 | ) | (1.5 | ) | ||||||||||||||||||||||||
Curtailment | — | — | — | — | 0.7 | — | — | (9.4 | ) | — | ||||||||||||||||||||||||||
Total | $ | 54.8 | $ | 43.6 | $ | 41.8 | $ | 11.7 | $ | 12.7 | $ | 10.0 | $ | 10.1 | $ | 1.2 | $ | 16.4 | ||||||||||||||||||
The following table provides expected benefit payments, which reflect expected future service, as appropriate.
Year | U.S. Plans Pension Benefits | Non-U.S. Plans Pension Benefits | Postretirement Benefits | Medicare Part-D Subsidy | |||||||||
| (in millions of dollars) | |||||||||||||
2006 | $ | 10.9 | $ | 18.1 | $ | 12.8 | $ | (1.3 | ) | ||||
2007 | 12.1 | 2.7 | 13.6 | (0.7 | ) | ||||||||
2008 | 13.6 | 2.9 | 14.0 | (0.7 | ) | ||||||||
2009 | 15.7 | 3.2 | 14.5 | (0.7 | ) | ||||||||
2010 | 18.0 | 3.6 | 14.9 | (0.7 | ) | ||||||||
2011 - 2015 | 149.7 | 22.5 | 76.6 | (2.8 | ) | ||||||||
NOTES TO CONSOLIDATED FINANCIAL STATEMENTS - Continued
UnumProvident Corporation and Subsidiaries
Note 10 - Pensions and Other Postretirement Benefits - Continued
The Company’s funded pension plans’ weighted average asset allocations, by asset category, are as follows:
U.S. Plans Pension Benefits | Non-U.S. Plans Pension Benefits | |||||||||||||||||||||||
| 2005 | 2004 | 2005 | 2004 | |||||||||||||||||||||
| Target | Actual | Target | Actual | Target | Actual | Target | Actual | |||||||||||||||||
Equity Securities | 55 - 65 | % | 63 | % | 55 - 65 | % | 62 | % | 60 | % | 64 | % | 60 | % | 62 | % | ||||||||
Fixed Income Securities | 27 - 33 | 27 | 27 - 33 | 28 | 40 | 35 | 40 | 37 | ||||||||||||||||
Other | 8 - 12 | 10 | 8 - 12 | 10 | — | 1 | — | 1 | ||||||||||||||||
Total | 100 | % | 100 | % | 100 | % | 100 | % | ||||||||||||||||
To determine the net periodic pension cost for the U.S. qualified defined benefit pension plan for the year 2005, an 8.5 percentOur long-term expected rate of return assumption was used. The long-term rate of returnon plan assets assumption is an estimate, based on statistical analysis, of the average annual assumed return that will be produced from the pension trustplan assets until current benefits are paid. The investment portfolio contained a diversified blend of large cap, mid cap, small cap equity securities, convertible securities, as well as both investment-grade and below-investment-grade fixed income securities in 2005. The Company’sOur expectations for the future investment returns of thesethe asset categories were based on a combination of historical market performance and the Company’s evaluations of investment forecasts prepared byobtained from external consultants and economists. The methodology underlying the return assumption examinedincluded the various elements of the expected return for each asset class including:such as long-term rates of return, volatility of returns, and the correlation of returns between various asset classes. The expected return for the total portfolio was calculated based on the plan’s strategic asset allocation. Investment risk is measured and monitored on an ongoing basis through annual liability measurements, periodic asset/liability studies, and quarterly investment portfolio reviews. Risk tolerance is established through careful consideration of plan liabilities, plan funded status, and corporate financial condition.
The expected return assumption for the life insurance reserve for the postretirement benefits plan prohibitswas 5.75 percent, which was based on full investment in fixed income securities with an average book yield of 6.30 percent for both 2008 and 2007.
Our rate of compensation increase assumption is generally based on periodic studies of compensation trends.
For measurement purposes at December 31, 2008 and 2007, the useannual rate of derivative instruments. Duringincrease in the fourth quarterper capita cost of 2005,covered postretirement health care benefits assumed for the Company performed a reviewnext calendar year was 9.00 percent for benefits payable to retirees prior to Medicare eligibility and 9.80 percent for benefits payable to Medicare eligible retirees. The rate was assumed to change gradually to 5.00 percent by the end of the portfoliofifth year and elected to add an international equity allocation. Based on the plan’s new asset allocationremain at that level thereafter.
The medical and changes in capital market assumptions, the Company lowered the expected long-term rate of return assumption to 8.0 percent, which will bedental premium used to determine the 2006per retiree employer subsidy are capped. If the cap is not reached by the year 2015, the caps are then set equal to the year 2015 premium. Certain of the current retirees and all future retirees are subject to the cap.
Net Periodic Benefit Cost
The following table provides the components of the net periodic benefit cost for the plans described above for the years ended December 31.
| Pension Benefits | ||||||||||||||||||||||||||||||||||||
| U.S. Plans | Non U.S. Plans | Postretirement Benefits | ||||||||||||||||||||||||||||||||||
| 2008 | 2007 | 2006 | 2008 | 2007 | 2006 | 2008 | 2007 | 2006 | ||||||||||||||||||||||||||||
| (in millions of dollars) | ||||||||||||||||||||||||||||||||||||
Service Cost | $ | 28.7 | $ | 31.9 | $ | 35.9 | $ | 7.8 | $ | 9.2 | $ | 8.4 | $ | 3.3 | $ | 3.6 | $ | 4.1 | ||||||||||||||||||
Interest Cost | 58.2 | 54.2 | 48.4 | 10.3 | 9.7 | 8.0 | 11.5 | 11.0 | 10.1 | |||||||||||||||||||||||||||
Expected Return on Plan Assets | (59.7 | ) | (58.5 | ) | (44.0 | ) | (12.0 | ) | (12.2 | ) | (10.6 | ) | (0.7 | ) | (0.7 | ) | (0.7 | ) | ||||||||||||||||||
Amortization of: | ||||||||||||||||||||||||||||||||||||
Net Actuarial Loss | 13.9 | 19.2 | 22.4 | 2.3 | 3.0 | 2.3 | - | - | - | |||||||||||||||||||||||||||
Prior Service Credit | (2.2 | ) | (3.1 | ) | (3.1 | ) | - | - | - | (3.4 | ) | (3.8 | ) | (3.8 | ) | |||||||||||||||||||||
Transition Asset | - | - | - | (0.2 | ) | (0.2 | ) | (0.1 | ) | - | - | - | ||||||||||||||||||||||||
Settlement Cost | - | - | - | - | 0.3 | - | - | - | - | |||||||||||||||||||||||||||
Curtailment | - | 0.2 | - | - | - | 0.2 | - | - | - | |||||||||||||||||||||||||||
Total | $ | 38.9 | $ | 43.9 | $ | 59.6 | $ | 8.2 | $ | 9.8 | $ | 8.2 | $ | 10.7 | $ | 10.1 | $ | 9.7 | ||||||||||||||||||
Index to Financial Statements
NOTES TO CONSOLIDATED FINANCIAL STATEMENTS - Continued
Unum Group and Subsidiaries
Note 9 - Pensions and Other Postretirement Benefits - Continued
A one percent increase or decrease in the assumed health care cost trend rate at December 31, 2008 would have increased (decreased) the service cost and interest cost by $0.6 million and $(0.5) million, respectively, and the postretirement benefit obligation by $6.7 million and $(5.8) million, respectively.
The unrecognized net actuarial loss, prior service credit, and transition asset included in accumulated other comprehensive income and expected to be amortized and included in net periodic pension cost.cost during 2009 is $42.8 million before tax and $28.0 million after tax. The prior service credit expected to be amortized and included as a reduction to net periodic cost for postretirement plans during 2009 is $2.9 million before tax and $1.9 million after tax.
Benefit Payments
The following table provides expected benefit payments, which reflect expected future service, as appropriate.
| Pension Benefits | Postretirement | |||||
| Year | U.S. Plans | Non U.S. Plans | Benefits | |||
| (in millions of dollars) | ||||||
2009 | $ 19.6 | $ 3.6 | $ 15.2 | |||
2010 | 22.0 | 4.1 | 16.1 | |||
2011 | 24.5 | 4.5 | 16.6 | |||
2012 | 28.3 | 5.0 | 16.9 | |||
2013 | 32.1 | 5.3 | 16.8 | |||
2014 - 2018 | 245.7 | 29.3 | 80.8 | |||
During 2005, the large cap equity manager of the U.S. qualified defined benefit plan elected to sell the Company’s common stock that was previously held in this plan. The investment managers serve as plan fiduciaries and have authority to execute investments based on the plan’s investment policy statement. At December 31, 2004, equity securities in this plan included $8.1 million of holdings in the Company’s common stock. Dividends paid to the plan during 2005 and 2004 were immaterial.
Funding Policy
The Company’s funding policy for itsour U.S. qualified defined benefit plan is to contribute annually an amount at least equal to the minimum annual contribution required under the Employee Retirement Income Security Act and other applicable laws, but generally not greater than the maximum amount that can be deducted for federal income tax purposes. The CompanyWe had no regulatory contribution requirements for 20052008 and 2004;2007; however, the Companywe elected to make voluntary contributions of $23.0$130.0 million and $20.0$110.0 million, respectively. The Company expectsWe expect to make a voluntary contribution of approximately $42.0$70.0 million to itsour U.S. qualified defined benefit pension plan in 2006,2009, based on current pension funding law. The funding policy for the U.S. non-qualified defined benefit pension plan and postretirement plan is to contribute the amount of the benefit payments made during the year.
The Company’s We are required to contribute to our U.K. operation maintains a separate defined benefit plan (Scheme) for eligible employees. The Scheme assets are invested in pooled funds, with a 64 percent global equity securities allocation. The remainder ofat the assets is predominantly invested in fixed interest bonds and index linked bonds. The long-term rate of returnat least 15.0 percent of employee salaries sufficient to meet the minimum funding requirement under U.K. legislation. We made contributions of $7.3 million and $10.5 million in 2008 and 2007, respectively, or approximately £4.0 million and £5.3 million. We expect to make contributions of £3.5 million during 2009.
Our postretirement benefits plan represents a non-vested, non-guaranteed obligation, and current regulations do not require specific funding levels for these benefits, which are comprised of retiree life, medical, and dental benefits. It is our practice to use general assets to pay medical and dental claims as they come due in lieu of utilizing plan assets for the medical and dental benefit portions of our postretirement benefits plan.
Index to Financial Statements
NOTES TO CONSOLIDATED FINANCIAL STATEMENTS - Continued
UnumProvident CorporationUnum Group and Subsidiaries
Note 10 - Pensions and Other Postretirement Benefits - Continued
assumption is the best estimate of the average annual assumed return that will be produced from the Scheme assets until current benefits are paid. The Company contributes to the Scheme in accordance with a schedule of contributions which requires the Company to contribute to the Scheme at the rate of at least 20.25 percent of eligible salaries less Company input into a separate defined contribution arrangement, sufficient to meet the minimum funding requirement under U.K. legislation. The Company made contributions of $8.8 million and $8.6 million in 2005 and 2004, respectively. The Company made a $44.2 million contribution into the Scheme in January 2006 and expects to make additional contributions of approximately $9.1 million during 2006.
The Company also maintains a reserve for life insurance benefits payable to certain former retirees covered under the postretirement welfare plan. The expected return assumption for this reserve was 5.75 percent, which was based on full investment in fixed income securities with an average book yield of 6.56 percent and 6.72 percent for 2005 and 2004, respectively.
The Medicare Prescription Drug, Improvement and Modernization Act of 2003 (the Medicare Act) was enacted in December 2003 to add a voluntary prescription drug benefit for Medicare-eligible retirees to be effective January 1, 2006. The Medicare Act allows an employer to choose whether to coordinate prescription drug benefits under a retiree medical plan with the Medicare prescription drug benefit or to keep the company plan design as it is and receive a subsidy from the federal government. The Company reviewed the options available as a result of Medicare reform and aligned the options, as appropriate, for each of its designated groups of retirees.
Based on a preliminary analysis conducted in 2004, the Company expected to qualify for the subsidy for retirees covered under prior Company plans and first reflected it in the 2004 net periodic benefit cost. For retiree groups who are covered by the current retiree medical plan design and active employees who meet certain age and service requirements, the Company amended its postretirement medical plan in 2004 to coordinate with the Medicare Act such that Medicare is the primary payer of prescription drug benefits. The Company also amended its postretirement medical plan in 2004 to eliminate the premium subsidy for employees who had not reached a minimum age of 45 and a specified minimum years of service requirement as of December 31, 2003.
During 2005 the Company confirmed, using final regulations issued by the Centers for Medicare & Medicaid Services on January 21, 2005, that all of its retiree medical plans would qualify for a government subsidy under the Medicare Act and chose to defer coordination with the new prescription drug benefit until 2007. For 2006, the Company will maintain its current retiree medical plans and expects to receive the government subsidy for all retirees. This change is reflected in the 2005 net periodic benefit cost.
Note 11 - Stockholders’ Equity and Earnings Per Common Share
Common Stock
During 2007, Unum Group’s board of directors authorized the repurchase of up to $700.0 million of Unum Group common stock. In January 2008, we repurchased approximately 14.0 million shares for $350.0 million, using an accelerated share repurchase agreement. Under the terms of the repurchase agreement, we were to receive, or be required to pay, a price adjustment based on the volume weighted average price of Unum Group common stock during the term of the agreement. Any price adjustment payable to us was to be settled in shares of Unum Group common stock. Any price adjustment we would have been required to pay was to be settled, at our option, in either cash or common stock. A 30 percent partial acceleration of the agreement, 4.2 million shares, occurred on March 26, 2008 and settled on March 28, 2008, with the price adjustment resulting in the delivery to us of approximately 0.5 million additional shares of Unum Group common stock. The remaining 9.8 million shares settled on May 29, 2008, with the price adjustment resulting in the delivery to us of approximately 0.9 million additional shares.
During August 2008, we repurchased approximately 12.5 million shares for $350.0 million, using an accelerated share repurchase agreement with terms similar to the earlier agreement. A 50 percent partial acceleration of the agreement, 6.25 million shares, occurred on October 7, 2008 and settled on October 10, 2008, with the price adjustment resulting in the delivery to us of approximately 1.0 million additional shares of Unum Group common stock. The remaining 6.25 million shares settled on October 14, 2008, with the price adjustment resulting in the delivery to us of approximately 1.0 million additional shares.
In total, we repurchased 29.9 million shares of Unum Group common stock under the share repurchase program. These shares are reflected as treasury stock in our consolidated balance sheets.
We settled the purchase contract element of the 2004 and 2003 the Company issued 52,877,000units in May 2007 and 2006 by issuing 17.7 million and 43.3 million shares of common stock, par value $0.10 per share, in a public offering and received approximately $547.7 million in proceeds after deducting underwriting discounts. Dividends paid per common share were $0.30, $0.30, and $0.3725respectively. See Note 8 for the years ended December 31, 2005, 2004, and 2003, respectively.
further discussion.
Preferred Stock
The CompanyUnum Group has 25,000,000 shares of preferred stock authorized with a par value of $0.10 per share. No preferred stock has been issued to date.
Index to Financial Statements
NOTES TO CONSOLIDATED FINANCIAL STATEMENTS - Continued
UnumProvident CorporationUnum Group and Subsidiaries
Note 1110 - Stockholders’ Equity and Earnings Per Common Share - Continued
Earnings Per Common Share
Net income (loss) per common share is determined as follows:
| Year Ended December 31 | ||||||||||||||||||||
| Year Ended December 31 | 2008 | 2007 | 2006 | |||||||||||||||||
| 2005 | 2004 | 2003 | (in millions of dollars, except share data) | |||||||||||||||||
| (in millions of dollars, except share data) | ||||||||||||||||||||
Numerator | ||||||||||||||||||||
Net Income (Loss) | $ | 513.6 | $ | (253.0 | ) | $ | (386.4 | ) | ||||||||||||
Net Income | $ | 553.2 | $ | 679.3 | $ | 411.0 | ||||||||||||||
Denominator (000s) | ||||||||||||||||||||
Weighted Average Common Shares - Basic | 295,776.4 | 295,224.3 | 276,132.2 | 341,022.8 | 352,969.1 | 324,654.9 | ||||||||||||||
Dilution for the Purchase Contract Element of the Adjustable Conversion-Rate Equity Security Units | 14,297.8 | — | — | - | 1,673.0 | 8,153.0 | ||||||||||||||
Dilution for Assumed Exercises of Stock Options and Other Dilutive Securities | 2,438.4 | — | — | |||||||||||||||||
Dilution for Assumed Exercises of Stock Options | 537.5 | 1,134.4 | 1,553.8 | |||||||||||||||||
Weighted Average Common Shares - Assuming Dilution | 312,512.6 | 295,224.3 | 276,132.2 | 341,560.3 | 355,776.5 | 334,361.7 | ||||||||||||||
Net Income (Loss) Per Common Share | ||||||||||||||||||||
Net Income Per Common Share | ||||||||||||||||||||
Basic | $ | 1.74 | $ | (0.86 | ) | $ | (1.40 | ) | $ | 1.62 | $ | 1.92 | $ | 1.27 | ||||||
Assuming Dilution | $ | 1.64 | $ | (0.86 | ) | $ | (1.40 | ) | $ | 1.62 | $ | 1.91 | $ | 1.23 | ||||||
The Company accountsWe use the treasury stock method to account for the effect on the number of weighted average common shares, assuming dilution, using the treasury stock method. As such, the purchase contract element of the Company’s adjustable conversion-rate equity security units, (units), as described in Note 9, and the Company’s outstanding stock options, as described in Note 12,nonvested stock awards, and performance restricted stock units on the computation of dilutive earnings per share. Under this method, these potential common shares will each have a dilutive effect, onlyas individually measured, when the average market price of the Company’sUnum Group common stock during the period exceeds the threshold appreciation price of the purchase contract element of the units, as described in Note 8, or the exercise price of the stock options. options, the grant price of the nonvested stock awards, and/or the threshold stock price of performance restricted stock units, as described in Note 11.
The purchase contract elementselement of the Company’s units issued in 2004 and 2003 havehad a threshold appreciation price of $16.95 per share and $13.27 per share, respectively. The Company’s outstanding stock options and other dilutive securities have exercise prices ranging from $9.48$12.23 to $58.56.
$58.56, the nonvested stock awards have grant prices ranging from $11.58 to $26.25, and the performance restricted stock units have a threshold stock price of $26.00.
In computing earnings per share assuming dilution, only potential common shares that are dilutive (those that reduce earnings per share) are included. Potential common shares are not used when computingincluded in the computation of dilutive earnings per share assuming dilution if the resultsbecause their impact would be antidilutive, such as when a net loss from continuing operations is reported. For the years ended December 31, 2004 and 2003, approximately 5.6based on current market prices, approximated 8.3 million, 6.2 million, and 2.0 million issuable shares, respectively, related to the purchase contract elements of the units issued in 2003 and approximately 1.4 million and 1.2 million issuable common shares, respectively, for the assumed exercises of stock options and other dilutive securities were not used in the calculation of earnings per share due to the antidilutive effect when a net loss from continuing operations is reported.
Options to purchase approximately 12.1 million, 14.4 million, and 16.48.2 million shares of common stock for the years ended December 31, 2005, 2004,2008, 2007, and 2003, respectively, were outstanding but were not included2006, respectively.
Note 11 - Stock-Based Compensation
Description of Stock Plans
Under the stock incentive plan of 2007, up to 35.00 million shares of common stock are available for awards to our employees, officers, consultants, and directors. Awards may be in the computationform of earnings per share, assuming dilution, because the exercise prices of thestock options, were greaterstock appreciation rights, restricted stock, restricted stock units, performance units, and other stock-based awards. Each full value award, defined as any award other than the average market price of the Company’s common stock. The purchase contract elements of the units issued in 2004 were also excluded from the computation for the year ended December 31, 2004 because the thresholda stock option or stock appreciation price was greater than the average market price of the Company’s common stock.right, shall be counted as 2.7 shares.
Index to Financial Statements
NOTES TO CONSOLIDATED FINANCIAL STATEMENTS - Continued
UnumProvident CorporationUnum Group and Subsidiaries
Note 1211 - IncentiveStock-Based Compensation and Stock Purchase Plans- Continued
Stock Plans
UnderThe exercise price for stock options issued cannot be less than the broad-based stock planfair market value of 2002, the Company had available up to 2,390,000 shares ofunderlying common stock for stock option awards to its employees, officers, consultants, and producers, excluding certain senior officers and directors,as of which 2,007,375 shares were granted. The stock options have a maximum term of ten years after the date of grant and generally vest after three years. The plan of 2002 was terminated in February 2004 for purposes of any further grants.
Under the broad-based stock plan of 2001, the Company has available up to 2,000,000 shares of common stock for stock option awards to its employees, officers, consultants, and producers, excluding certain senior officers and directors. The stockdate. Stock options have a maximum term of ten years after the date of grant and generally vest after three years. At December 31, 2005, 437,5002008, approximately 28.72 million shares were available for future grants.
Under the broad-based stock plan of 2002, up to 2.39 million shares of common stock were available for stock option awards to our employees, officers, consultants, and brokers, excluding certain senior officers and directors. The plan was terminated in February 2004 for purposes of any further grants. The stock options have a maximum term of ten years after the date of grant and generally vest after three years.
Under the broad-based stock plan of 2001, up to 2.00 million shares of common stock were available for stock option awards to our employees, officers, consultants, and brokers, excluding certain senior officers and directors. The plan was terminated in December 2007 for purposes of any further grants, other than reload grants, for which 20,000 shares were available at December 31, 2008. The stock options have a maximum term of ten years after the date of grant and generally vest after three years.
Under the stock plan of 1999, comprised of the Company has availableProvident Companies, Inc. stock plan of 1999 and the UnumProvident Corporation stock plan of 1999, an aggregate of up to 17,500,00017.50 million shares of common stock were available for awards to itsour employees, officers, producers,brokers, and directors. Awards maycould be in the form of stock options, stock appreciation rights, restricted stock awards, dividend equivalent awards, or any other right or interest relating to stock. The plan was terminated in May 2007 for purposes of any further grants, other than reload grants, for which 250,000 shares were available at December 31, 2008. Stock options have a maximum term of ten years after the date of grant and generally vest after three years. The number of shares available to be issued as restricted stock or unrestricted stock awards under the stock plan of 1999 is limited to 6,125,000 shares. The Company granted 1,192,526 shares, 78,594 shares, and 1,347,874 shares of restricted stock during 2005, 2004, and 2003, respectively, to certain employees and directors with a weighted average grant date value of $17.43, $15.14, and $10.64, respectively, per common share. Compensation cost recognized in the consolidated statements of operations for restricted stock awards is $12.7 million, $4.9 million, and $4.3 million for 2005, 2004, and 2003, respectively. These amounts are not included in the pro forma adjustments presented in Note 1. At December 31, 2005, 7,205,842 shares were available for future grants under the stock plan of 1999.
For the stock plan of 1999, the broad-based stock plan of 2001, and the broad-based stock plan of 2002, the exercise price for stock options issued shall not be less than the fair market value of the Company’s stock as of the grant date.
Summaries of the Company’s stock options issued under the various plans are as follows:
| 2005 | 2004 | 2003 | ||||||||||||||||
| Shares (000s) | Weighted Average Exercise Price | Shares (000s) | Weighted Average Exercise Price | Shares (000s) | Weighted Average Exercise Price | |||||||||||||
Outstanding at January 1 | 15,636 | $ | 30.46 | 18,246 | $ | 30.80 | 19,232 | $ | 31.11 | |||||||||
Granted | — | — | — | — | 722 | 17.07 | ||||||||||||
Exercised | (754 | ) | 16.31 | (218 | ) | 13.72 | (88 | ) | 13.90 | |||||||||
Forfeited or Expired | (1,285 | ) | 26.83 | (2,392 | ) | 34.58 | (1,620 | ) | 29.28 | |||||||||
Outstanding at December 31 | 13,597 | 31.58 | 15,636 | 30.46 | 18,246 | 30.80 | ||||||||||||
NOTES TO CONSOLIDATED FINANCIAL STATEMENTS - Continued
UnumProvident Corporation and Subsidiaries
Note 12 - Incentive Compensation and Stock Purchase Plans - Continued
| December 31, 2005 | ||||||||||||
| Options Outstanding | Options Exercisable | |||||||||||
Range of Exercise Prices | Shares (000s) | Weighted Average Remaining Years in Contractual Life | Weighted Average Exercise Price | Shares (000s) | Weighted Average Exercise Price | |||||||
$ 9 to 19 | 1,901 | 4.5 | $ | 14.23 | 1,755 | $ | 14.10 | |||||
20 to 29 | 6,655 | 4.3 | 27.79 | 6,588 | 27.85 | |||||||
30 to 39 | 2,458 | 1.1 | 33.98 | 2,458 | 33.98 | |||||||
40 to 49 | 769 | 2.8 | 45.54 | 769 | 45.54 | |||||||
50 to 59 | 1,812 | 3.1 | 54.57 | 1,812 | 54.57 | |||||||
Total | 13,595 | 3.5 | 31.58 | 13,382 | 31.81 | |||||||
Employee Stock Purchase Plan (ESPP)
Substantially all of the Company’sour employees are eligible to participate in an ESPP.employee stock purchase plan (ESPP). Under the plan, up to 3,460,0003.46 million shares of the Company’s common stock are authorized for issuance.issuance, of which approximately 1.46 million remain available for issuance at December 31, 2008. Stock may be purchased at the end of each financial quarter at a purchase price of 85 percent of the lower of its beginning or end of quarter market prices. The Company sold 154,395
We issue new shares 205,172 shares, and 318,499 shares to employees with a weighted averageof common stock for nonvested stock grants, exercise price of $15.38, $12.88, and $9.73 during the years 2005, 2004, and 2003, respectively.
Compensation Cost under the Fair Value Approach
For the pro forma information presented in Note 1, the fair values of the stock options, and the shares purchased under thepurchase of ESPP were estimatedshares.
Nonvested Stock Awards
Nonvested share activity is summarized as follows:
| Shares (000s) | Weighted Average Grant Date Fair Value | |||
Nonvested at December 31, 2007 | 1,178 | $ 21.65 | ||
Granted | 874 | 23.66 | ||
Vested | (521) | 21.76 | ||
Forfeited | (43) | 22.17 | ||
Nonvested at December 31, 2008 | 1,488 | 22.77 | ||
Stock awards vest over a one to five year service period, beginning at the date of grant, using a Black-Scholes options-pricing model withand the following assumptions:compensation cost is recognized ratably during the vesting period. Compensation cost for stock awards subject to accelerated vesting upon retirement is recognized over the implicit service period. Forfeitable dividend equivalents on nonvested stock awards are accrued in the form of additional restricted stock units. The weighted average grant date fair values per
Index to Financial Statements
NOTES TO CONSOLIDATED FINANCIAL STATEMENTS - Continued
Unum Group and Subsidiaries
Note 11 - Stock-Based Compensation - Continued
| Year Ended December 31 | ||||||||||||
| 2005 | 2004 | 2003 | ||||||||||
Volatility | 16.6 | % | 13.5 | % | 25.3 | % | ||||||
Risk-free Rate of Return | 2.8 | % | 1.2 | % | 2.8 | % | ||||||
Dividend Payout Rate per Share | $ | 0.30 | $ | 0.30 | $ | 0.33 | ||||||
Time of Exercise | ||||||||||||
Stock Option Plan | — | — | 6.0 years | |||||||||
ESPP | 3 months | 3 months | 3 months | |||||||||
Weighted Average Fair Value of Awards Granted During the Year | ||||||||||||
Stock Option Plan | $ | — | $ | — | $ | 2.76 | ||||||
ESPP | $ | 3.29 | $ | 2.65 | $ | 2.17 | ||||||
share for nonvested stock awards granted during 2008, 2007, and 2006 were $23.66, $21.99, and $20.95, respectively.
The total fair value of shares vested during 2008, 2007, and 2006 was $12.2 million, $20.6 million, and $12.6 million, respectively.
At December 31, 2008, we had $15.8 million of unrecognized compensation cost related to nonvested stock awards that will be recognized over a weighted average period of 0.9 years. Prior to adoption of SFAS 123(R), this amount was reported as additional paid-in capital and deferred compensation, a contra equity account. The value of this contra equity account at the adoption of SFAS 123(R) was $13.8 million.
Performance Restricted Stock Units (PRSUs)
PRSU activity is summarized as follows:
| Shares (000s) | Weighted Average Grant Date Fair Value | |||
PRSUs at December 31, 2007 | 1,251 | $ 16.02 | ||
Dividends | 19 | 19.08 | ||
Forfeited | (60) | 16.04 | ||
PRSUs at December 31, 2008 | 1,210 | 16.06 | ||
In September 2007, we issued approximately 1.25 million PRSUs with a grant date fair value of $15.99. Vesting for this grant is contingent upon meeting various company threshold performance and stock price conditions. Forfeitable dividend equivalents on PRSUs are accrued in the form of additional restricted stock units. The weighted average grant date fair values per share for PRSU grants and dividends during 2008 and 2007 were $19.08 and $16.02, respectively. All PRSUs outstanding at December 31, 2008 were nonvested.
At December 31, 2008, we had $9.0 million of unrecognized compensation cost related to PRSUs that will be recognized over a weighted average period of 1.5 years. The PRSU expense and unrecognized compensation cost assume the performance goals are attained at 100 percent. Actual performance may result in zero to 100 percent of the units ultimately being earned. We used the accelerated method of amortization for recognizing compensation expense, which treats each of the three vesting tranches as a separate award over the expected life of the unit.
We estimated the fair value on the date of initial grant using the Monte-Carlo model. The following assumptions were used to value the grant:
Expected volatility of 29 percent, based on our historical daily stock prices.
Expected life of 4.4 years, which equals the maximum term.
Expected dividend yield of 1.24 percent, based on the dividend rate at the date of grant.
Risk-free interest rate of 3.97 percent, based on the yield of treasury bonds at the date of grant.
Index to Financial Statements
NOTES TO CONSOLIDATED FINANCIAL STATEMENTS - Continued
Unum Group and Subsidiaries
Note 11 - Stock-Based Compensation - Continued
Stock Options
Stock option activity is summarized as follows:
| Shares (000s) | Weighted Average Exercise Price | Remaining Contractual Term | Intrinsic Value (000s) | ||||||
Outstanding at December 31, 2007 | 7,703 | $ 32.81 | |||||||
Granted | 458 | 23.74 | |||||||
Exercised | (105) | 14.75 | |||||||
Expired | (615) | 47.66 | |||||||
Outstanding at December 31, 2008 | 7,441 | 31.28 | 1.8 years | $ | 4,833 | ||||
Exercisable at December 31, 2008 | 6,872 | $ 31.94 | 1.4 years | $ | 4,833 | ||||
All outstanding stock options at December 31, 2008 are expected to vest. Stock options vest over a three year service period, beginning at the date of grant, and the compensation cost is recognized ratably during the vesting period. The total intrinsic value of options exercised during 2008, 2007, and 2006 was $1.0 million, $3.9 million, and $0.9 million, respectively. The total fair value of options that vested during 2008 and 2006 was $1.2 million and $0.5 million, respectively. No stock options vested in 2007. At December 31, 2008, we had $1.9 million of unrecognized compensation cost related to stock options that will be recognized over a weighted average period of 1.0 year.
The weighted average grant date fair value of options granted during 2008 and 2007 was $8.84 and $8.61, respectively. No stock options were granted during 2006. We estimated the fair value on the date of grant using the Black-Scholes valuation model. The following assumptions were used to value the 2008 and 2007 grants:
Expected volatility of 43 percent and 44 percent, respectively, based on our historical daily stock prices.
Expected life of 5.0 years, based on historical average years to exercise.
Expected dividend yield of 1.30 percent and 1.57 percent, respectively, based on the dividend rate at the date of grant.
Risk-free interest rate of 2.93 percent and 4.67 percent, respectively, based on the yield of treasury bonds at the date of grant.
ESPP
ESPP activity is summarized as follows:
| Year Ended December 31 | ||||||||||
| 2008 | 2007 | 2006 | ||||||||
Number of Shares Sold | 148,490 | 114,420 | 148,833 | |||||||
Weighted Average Exercise Price | $ | 20.44 | $ | 24.32 | $ | 18.99 | ||||
Weighted Average Grant Date Fair Value | $ | 5.72 | $ | 5.18 | $ | 3.90 | ||||
Index to Financial Statements
NOTES TO CONSOLIDATED FINANCIAL STATEMENTS - Continued
Unum Group and Subsidiaries
Note 1311 - Stock-Based Compensation - Continued
Expense
Compensation expense for the stock plans, as reported in the consolidated statements of income, is as follows:
| Year Ended December 31 | |||||||||
| 2008 | 2007 | 2006 | |||||||
| (in millions of dollars) | |||||||||
Nonvested Stock Awards | $ | 18.3 | $ | 10.7 | $ | 15.3 | |||
Performance Restricted Stock Units | 6.7 | 2.0 | - | ||||||
Stock Options | 2.9 | 0.5 | 0.5 | ||||||
Employee Stock Purchase Plan | 0.9 | 0.5 | 0.6 | ||||||
Total Compensation Expense, Before Income Tax | $ | 28.8 | $ | 13.7 | $ | 16.4 | |||
Total Compensation Expense, Net of Income Tax | $ | 18.7 | $ | 8.9 | $ | 10.7 | |||
Cash received under all share-based payment arrangements for the years ended December 31, 2008, 2007, and 2006 was $4.4 million, $7.8 million, and $5.0 million, respectively.
Note 12 - Reinsurance
In the normal course of business, the Company assumeswe assume reinsurance from and cedescede reinsurance to other insurance companies. The primary purpose of ceded reinsurance is to limit losses from large exposures. However, if the assuming reinsurer is unable to meet its obligations, the Company remainswe remain contingently liable. The Company evaluatesWe evaluate the financial condition of reinsurers and monitorsmonitor concentration of credit risk to minimize this exposure. The CompanyWe may also require assets in trust, letters of credit, or other acceptable collateral to support reinsurance receivablerecoverable balances.
NOTES TO CONSOLIDATED FINANCIAL STATEMENTS - Continued
UnumProvident Corporation and Subsidiaries
Note 13 - Reinsurance - Continued
The reinsurance receivablerecoverable at December 31, 20052008 relates to approximately 10088 companies. Thirteen major companies account for approximately 91 percent of the reinsurance receivablerecoverable at December 31, 2005,2008, and are all companies rated A or better by A.M. Best Company or are fully securitized by letters of credit or investment-grade fixed maturity securities held in trust. Virtually all of the remaining nine percent of the reinsurance receivablerecoverable relates to business reinsured either with companies rated A- or better by A.M. Best Company, with overseas entities with equivalent ratings or backed by letters of credit or trust agreements, or through reinsurance arrangements wherein the Company retainswe retain the assets in itsour general account. Less than one percent of the reinsurance receivablerecoverable is held by companies either rated below A- by A.M. Best Company or not rated.
Reinsurance activity is accounted for on a basis consistent with the terms of the reinsurance contracts and the accounting used for the original policies issued. Premium income and benefits and change in reserves for future benefits are presented in the consolidated statements of operationsincome net of reinsurance ceded.
Reinsurance data is as follows:
| Year Ended December 31 | ||||||||||||
| 2005 | 2004 | 2003 | ||||||||||
| (in millions of dollars) | ||||||||||||
Direct Premium Income | $ | 8,077.0 | $ | 8,168.5 | $ | 7,830.7 | ||||||
Reinsurance Assumed | 395.8 | 396.9 | 445.7 | |||||||||
Reinsurance Ceded | (657.2 | ) | (725.8 | ) | (660.7 | ) | ||||||
Net Premium Income | $ | 7,815.6 | $ | 7,839.6 | $ | 7,615.7 | ||||||
Ceded Benefits and Change in Reserves for Future Benefits | $ | 1,110.6 | $ | 1,149.7 | $ | 1,127.7 | ||||||
During 2005, the Company recaptured its individual income protection – closed block business originally ceded
Index to Centre Life Reinsurance Ltd. in 1996. The recaptured business included approximately $1.6 billion in invested assets and $185.0 million of annual premium. The effective date of the recapture was August 8, 2005. The underlying operating results of the reinsurance contract, prior to recapture, were reflected in other income. The recapture therefore did not have a material impact on operating income for the Individual Income Protection – Closed Block segment.During 2004, the Company restructured its individual income protection – closed block business wherein three of its insurance subsidiaries entered into reinsurance agreements to reinsure approximately 66.7 percent of potential future losses that occur above a specified retention limit. The reinsurance agreements effectively provide approximately 60 percent reinsurance coverage for the Company’s overall consolidated risk above a specified retention limit, which equaled approximately $8.0 billion in existing statutory reserves at the date of the transaction. The maximum risk limit for the reinsurer was approximately $783.0 million initially and grows to approximately $2.6 billion over time, after which any further losses will revert to the Company. These reinsurance transactions were effective as of April 1, 2004. The Company transferred cash equal to $521.6 million of ceded reserves plus an additional $185.8 million in cash for a before-tax prepaid cost of insurance which was deferred and is being amortized into earnings over the expected claim payment period covered under the Company’s retention limit.
During 2003, the Company reinsured on a 100 percent indemnity coinsurance basis for non-New York policies and a 90 percent indemnity coinsurance basis for New York policies certain of its insurance policies, primarily individual income protection, previously sold through trade associations and ceded approximately $121.0 million of reserves to the reinsurer. The transaction had an effective date of April 1, 2003.
Financial Statements
NOTES TO CONSOLIDATED FINANCIAL STATEMENTS - Continued
UnumProvident CorporationUnum Group and Subsidiaries
Note 12 - Reinsurance - Continued
Reinsurance data is as follows:
| Year Ended December 31 | |||||||||
| 2008 | 2007 | 2006 | |||||||
| (in millions of dollars) | |||||||||
Direct Premium Income | $ | 7,817.1 | $ | 7,997.5 | $ | 8,082.6 | |||
Reinsurance Assumed | 264.4 | 289.6 | 324.3 | ||||||
Reinsurance Ceded | (298.2) | (386.0) | (458.7) | ||||||
Net Premium Income | $ | 7,783.3 | $ | 7,901.1 | $ | 7,948.2 | |||
Ceded Benefits and Change in Reserves for Future Benefits | $ | 737.2 | $ | 947.8 | $ | 891.5 | |||
During the second quarter of 2008, Unum UK became responsible for the ongoing administration and management of a closed block of group long-term disability claims through a reinsurance arrangement with Royal London Mutual Insurance Society Limited. As a result of the assumption, Unum UK received cash of £24.5 million, recorded £0.4 million in accrued premiums receivable, assumed reserves of £22.2 million (approximately $44.2 million), and recorded a deferred gain of £2.7 million.
During the third quarter of 2007, we recaptured a closed block of individual disability business, with approximately $204.3 million in reserves and $7.0 million of annual premium. The recapture had an immaterial effect on operating results.
During 2000, we reinsured substantially all of our individual life and corporate-owned life insurance blocks of business, with a resulting gain which was deferred and is being amortized into income. A portion of the ceded corporate-owned life insurance block of business surrendered during 2007. The termination of this fully ceded business, which is reported in our Corporate and Other segment, had no impact on our operating results and will not materially affect the amortization of the deferred gain. The termination resulted in a balance sheet only decrease in reserves for future policy and contract benefits of $1,094.0 million and policy loans of $1,013.7 million, with corresponding offsets to each in the reinsurance recoverable. The termination of this fully ceded business had no impact on our cash flows.
Note 1413 - Segment Information
Effective July 1, 2005, the Company modified its reporting segments to separate its United States business from that of its United Kingdom subsidiary, Unum Limited, due to the continued growth in that subsidiary and to recent organizational changes within the Company which established a separate management team to focus solely on the U.S. Brokerage lines of business. The Company’s newOur reporting segments are comprised of the following: U.S. Brokerage, Unum Limited,US, Unum UK, Colonial Life, Individual Income ProtectionDisability – Closed Block, and Corporate and Other. Effective with the fourth quarter of 2008, we made slight modifications to our reporting segments to better align the debt of our securitizations with the business segments and to align the allocation of capital for Unum UK similar to that of Unum US and Colonial Life. Specifically, we moved the assets, non-recourse debt, and associated capital of Tailwind Holdings and Northwind Holdings from our former Corporate segment to Unum US group disability and Individual Disability – Closed Block, respectively. We transferred excess assets, capital in excess of target, and the associated investment income from Unum UK to our Corporate and Other segment. We also modified the investment income allocation on capital supporting certain of our group disability and Corporate.
long-term care product lines within Unum US and have also aggregated our former Other segment and Corporate segment into one reporting segment. Financial results previously reported have been revised to reflect these reclassifications.
The U.S. BrokerageUnum US segment includes the Company’s U.S. group income protectionlong-term and short-term disability insurance, group life and accidental death and dismemberment products, and supplemental and voluntary lines of business, comprised of individual income protectiondisability – recently issued, group and individual long-term care, and brokerage voluntary workplace benefits products. These products are
Index to Financial Statements
NOTES TO CONSOLIDATED FINANCIAL STATEMENTS - Continued
Unum Group and Subsidiaries
Note 13 - Segment Information - - Continued
marketed through the Company’sour field sales personnel who work in conjunction with independent brokers and consultants. The Company utilizes a distribution model for the sale of individual income protection andEffective in 2009, we will discontinue selling individual long-term care insurance products whereby independent brokers and consultants are provided direct access to a sales support center centrally located in the Company’s corporate offices.
on an active basis.
The Unum LimitedUK segment includes group long-term income protection,disability insurance, group life products, and individual income protectiondisability products sold primarily in the United Kingdom through field sales personnel and independent brokers and consultants.
The Colonial Life segment includes insurance for income protectionaccident, sickness, and disability products, life products, and cancer and critical illness products issued and marketed primarily to employees at the workplace through an agency field sales force and brokers.
The Individual Income ProtectionDisability – Closed Block segment generally consists of those individual income protectiondisability policies that were designed to be distributed to individuals in a non-workplace setting and which were primarily in force prior to the Company’s substantial changes in product offerings, pricing, distribution, and underwriting which generally occurred during the period 1994 through 1998. A minimal amount of new business continued to be sold subsequent to these changes, but the Company ceasedwe stopped selling new policies in this segment at the beginning of 2004 other than update features contractually allowable on existing policies.
The Corporate and Other segment which has been redefinedincludes investment income on corporate assets not specifically allocated to include the disability management servicesa line of business, interest expense on corporate debt other than non-recourse debt, and certain other corporate income and expense not allocated to a line of business. Corporate and Other also includes results from U.S. Brokerage insuredcertain Unum US insurance products not actively marketed, (with the exception of the individual income protection products in the Individual Income Protection – Closed Block segment), including individual life and corporate-owned life insurance, reinsurance pools and management operations, group pension, health insurance, and individual annuities.
The Corporate segment consists of revenue earned on corporate assets not specifically allocated to a line of business, interest expense on corporate debt, and certain corporate income and expense not allocated to a line of business.
The products now reported in the U.S. Brokerage segment and the Unum Limited segment were previously combined and reported in the Income Protection and Life and Accident segments. There were no changes to the Colonial, Individual Income Protection – Closed Block or Corporate segments. The modification of the Company’s reporting segments had no impact on the level at which the Company performs impairment testing for goodwill or loss recognition testing for the recoverability of deferred policy acquisition costs and value of business acquired.
In conjunction with the restructuring of the individual income protection – closed block business during 2004, as discussed in Note 13, the Company at that time modified its reporting segments to include a separate segment for this business. The reporting, monitoring, and management of the closed block of individual income protection business as a discrete segment is consistent with the Company’s financial restructuring and separation of this business from the lines of business which still actively market new products. In the past, this business had been reported in combination with the individual income protection – recently issued line of business. Prior to 2004,
NOTES TO CONSOLIDATED FINANCIAL STATEMENTS - Continued
UnumProvident Corporation and Subsidiaries
Note 14 - Segment Information - Continued
detailed separate financial metrics and models were unavailable to appropriately manage this block of business separately from the recently issued individual income protection block of business.
The separation of the closed block business into a separate reporting segment required the Company to perform, separately for the individual income protection – closed block business and individual income protection – recently issued business, impairment testing for goodwill and loss recognition testing for the recoverability of deferred policy acquisition costs and value of business acquired. As required under GAAP, prior to the change in reporting segments, these tests were performed for the individual income protection line of business on a combined basis. The testing indicated impairment of the individual income protection – closed block deferred policy acquisition costs, value of business acquired, and goodwill balances of $282.2 million, $367.1 million, and $207.1 million, respectively. Also as part of the restructuring, the Company increased its claim reserves for the closed block of individual income protection business $110.6 million before tax. The impairment charges and reserve strengthening, which total $967.0 million before tax, are reported in the Individual Income Protection – Closed Block segment. The after-tax charge of $701.0 million is included in the net loss reported for the year ended December 31, 2004. See Note 7 for further discussion regarding the claim reserve strengthening.
In the following segment financial data, “operating revenue” excludes net realized investment gains and losses. “Operating income” or “operating loss” excludes net realized investment gains and losses, income tax, and results of discontinued operations, and cumulative effect of accounting principle change.operations. These are considered non-GAAP financial measures. These non-GAAP financial measures of “operating revenue” and “operating income” or “operating loss” differ from revenue and income (loss) from continuing operations before income tax and cumulative effect of accounting principle change as presented in the Company’sour consolidated statements of operationsincome prepared in accordance with GAAP reported herein due to the exclusion of before-taxbefore tax realized investment gains and losses. The Company measuresWe measure segment performance for purposes of Statement of Financial Accounting Standards No. 131,Disclosures about Segments of an Enterprise and Related Information, excluding realized investment gains and losses because management believeswe believe that this performance measure is a better indicator of the ongoing businesses and the underlying trends in the businesses. The Company’sOur investment focus is on investment income to support itsour insurance liabilities as opposed to the generation of realized investment gains and losses, and a long-term focus is necessary to maintain profitability over the life of the business. Realized investment gains and losses are dependentdepend on market conditions and do not necessarily relatedrelate to decisions regarding the underlying business of our segments. However, income or loss excluding realized investment gains and losses does not replace net income or net loss as a measure of overall profitability. We may experience realized investment losses, which will affect future earnings levels since our underlying business is long-term in nature and we need to earn the Company’s segments.assumed interest rates in our liabilities.
Selected data by segment is presented as follows. Segment results for prior years have been reclassified to conform to current year reporting.
Index to Financial Statements
NOTES TO CONSOLIDATED FINANCIAL STATEMENTS - Continued
UnumProvident CorporationUnum Group and Subsidiaries
Note 1413 - Segment Information - - Continued
| Year Ended December 31 | |||||||||
| 2005 | 2004 | 2003 | |||||||
| (in millions of dollars) | |||||||||
Premium Income | |||||||||
U.S. Brokerage | |||||||||
Group Income Protection | |||||||||
Group Long-term Income Protection | $ | 1,961.6 | $ | 2,028.6 | $ | 2,031.7 | |||
Group Short-term Income Protection | 566.3 | 616.1 | 630.9 | ||||||
Group Life and Accidental Death & Dismemberment | |||||||||
Group Life | 1,306.8 | 1,441.0 | 1,463.8 | ||||||
Accidental Death & Dismemberment | 156.4 | 182.4 | 198.6 | ||||||
Supplemental and Voluntary | |||||||||
Individual Income Protection - Recently Issued | 425.1 | 415.6 | 392.8 | ||||||
Long-term Care | 473.2 | 444.5 | 404.6 | ||||||
Voluntary Workplace Benefits | 339.6 | 293.4 | 260.0 | ||||||
| 5,229.0 | 5,421.6 | 5,382.4 | |||||||
Unum Limited | |||||||||
Group Long-term Income Protection | 582.9 | 501.8 | 371.2 | ||||||
Group Life | 164.1 | 117.9 | 60.8 | ||||||
Individual Income Protection | 38.3 | 39.4 | 45.0 | ||||||
| 785.3 | 659.1 | 477.0 | |||||||
Colonial | |||||||||
Income Protection | 508.9 | 486.2 | 464.9 | ||||||
Life | 114.0 | 106.9 | 96.7 | ||||||
Cancer and Critical Illness | 164.1 | 147.9 | 131.9 | ||||||
| 787.0 | 741.0 | 693.5 | |||||||
Individual Income Protection – Closed Block | 1,011.7 | 986.6 | 1,028.5 | ||||||
Other | 2.6 | 31.3 | 34.3 | ||||||
| 7,815.6 | 7,839.6 | 7,615.7 | |||||||
Net Investment Income and Other Income | |||||||||
U.S. Brokerage | 1,106.8 | 1,055.6 | 1,044.6 | ||||||
Unum Limited | 160.3 | 142.7 | 116.4 | ||||||
Colonial | 100.4 | 96.8 | 92.5 | ||||||
Individual Income Protection – Closed Block | 865.2 | 899.4 | 920.1 | ||||||
Other | 334.4 | 335.6 | 344.5 | ||||||
Corporate | 61.2 | 66.0 | 31.6 | ||||||
| 2,628.3 | 2,596.1 | 2,549.7 | |||||||
Operating Revenue (Excluding Net Realized Investment Gains and Losses) | |||||||||
U.S. Brokerage | 6,335.8 | 6,477.2 | 6,427.0 | ||||||
Unum Limited | 945.6 | 801.8 | 593.4 | ||||||
Colonial | 887.4 | 837.8 | 786.0 | ||||||
Individual Income Protection – Closed Block | 1,876.9 | 1,886.0 | 1,948.6 | ||||||
Other | 337.0 | 366.9 | 378.8 | ||||||
Corporate | 61.2 | 66.0 | 31.6 | ||||||
| 10,443.9 | 10,435.7 | 10,165.4 | |||||||
Premium income by major line of business within each of our segments is presented as follows:
Year Ended December 31 | |||||||||
2008 | 2007 | 2006 | |||||||
(in millions of dollars) | |||||||||
Unum US | |||||||||
Group Disability | |||||||||
Group Long-term Disability | $ | 1,838.5 | $ | 1,895.7 | $ | 1,953.3 | |||
Group Short-term Disability | 435.1 | 485.6 | 530.2 | ||||||
Group Life and Accidental Death & Dismemberment | |||||||||
Group Life | 1,062.8 | 1,107.4 | 1,248.1 | ||||||
Accidental Death & Dismemberment | 127.6 | 131.0 | 151.6 | ||||||
Supplemental and Voluntary | |||||||||
Individual Disability - Recently Issued | 471.5 | 456.7 | 438.5 | ||||||
Long-term Care | 580.7 | 532.9 | 492.4 | ||||||
Voluntary Benefits | 446.8 | 404.7 | 381.9 | ||||||
| 4,963.0 | 5,014.0 | 5,196.0 | |||||||
Unum UK | |||||||||
Group Long-term Disability | 675.9 | 752.6 | 638.9 | ||||||
Group Life | 174.6 | 177.4 | 171.0 | ||||||
Individual Disability | 38.8 | 38.3 | 32.9 | ||||||
| 889.3 | 968.3 | 842.8 | |||||||
Colonial Life | |||||||||
Accident, Sickness, and Disability | 606.9 | 566.6 | 533.3 | ||||||
Life | 157.4 | 143.5 | 130.5 | ||||||
Cancer and Critical Illness | 213.0 | 197.1 | 178.3 | ||||||
| 977.3 | 907.2 | 842.1 | |||||||
Individual Disability - Closed Block | 952.3 | 1,009.9 | 1,062.8 | ||||||
Corporate and Other | 1.4 | 1.7 | 4.5 | ||||||
Total | $ | 7,783.3 | $ | 7,901.1 | $ | 7,948.2 | |||
Index to Financial Statements
NOTES TO CONSOLIDATED FINANCIAL STATEMENTS - Continued
UnumProvident CorporationUnum Group and Subsidiaries
Note 1413 - Segment Information - - Continued
| Year Ended December 31 | ||||||||||||
| 2005 | 2004 | 2003 | ||||||||||
| (in millions of dollars) | ||||||||||||
Benefits and Expenses | ||||||||||||
U.S. Brokerage | $ | 5,948.1 | $ | 6,141.7 | $ | 6,858.2 | ||||||
Unum Limited | 757.9 | 650.5 | 481.4 | |||||||||
Colonial | 719.3 | 682.2 | 639.3 | |||||||||
Individual Income Protection – Closed Block | 1,797.0 | 2,708.8 | 1,886.1 | |||||||||
Other | 291.3 | 321.5 | 336.7 | |||||||||
Corporate | 214.0 | 219.7 | 225.1 | |||||||||
| 9,727.6 | 10,724.4 | 10,426.8 | ||||||||||
Operating Income (Loss) Before Income Tax and Net Realized Investment Gain (Loss) | ||||||||||||
U.S. Brokerage | 387.7 | 335.5 | (431.2 | ) | ||||||||
Unum Limited | 187.7 | 151.3 | 112.0 | |||||||||
Colonial | 168.1 | 155.6 | 146.7 | |||||||||
Individual Income Protection – Closed Block | 79.9 | (822.8 | ) | 62.5 | ||||||||
Other | 45.7 | 45.4 | 42.1 | |||||||||
Corporate | (152.8 | ) | (153.7 | ) | (193.5 | ) | ||||||
| $ | 716.3 | $ | (288.7 | ) | $ | (261.4 | ) | |||||
A reconciliation of totalSelected operating revenue and operating income (loss)statement data by segment to revenue and net income (loss)is presented as reported in the consolidated statements of operations follows:
| Year Ended December 31 | ||||||||||||
| 2005 | 2004 | 2003 | ||||||||||
| (in millions of dollars) | ||||||||||||
Operating Revenue by Segment | $ | 10,443.9 | $ | 10,435.7 | $ | 10,165.4 | ||||||
Net Realized Investment Gain (Loss) | (6.7 | ) | 29.2 | (173.8 | ) | |||||||
Revenue | $ | 10,437.2 | $ | 10,464.9 | $ | 9,991.6 | ||||||
Operating Income (Loss) by Segment | $ | 716.3 | $ | (288.7 | ) | $ | (261.4 | ) | ||||
Net Realized Investment Gain (Loss) | (6.7 | ) | 29.2 | (173.8 | ) | |||||||
Income Tax (Benefit) | 196.0 | (67.3 | ) | (170.6 | ) | |||||||
Loss from Discontinued Operations, Net of Tax | — | (60.8 | ) | (161.7 | ) | |||||||
Cumulative Effect of Accounting Principle Change, Net of Tax | — | — | 39.9 | |||||||||
Net Income (Loss) | $ | 513.6 | $ | (253.0 | ) | $ | (386.4 | ) | ||||
| Unum US | Unum UK | Colonial Life | Individual Disability - Closed Block | Corporate Other | Total | |||||||||||||
| (in millions of dollars) | ||||||||||||||||||
Year Ended December 31, 2008 | ||||||||||||||||||
Total Premium Income | $ | 4,963.0 | $ | 889.3 | $ | 977.3 | $ | 952.3 | $ | 1.4 | $ | 7,783.3 | ||||||
Net Investment Income | 1,136.4 | 181.9 | 105.7 | 767.5 | 197.5 | 2,389.0 | ||||||||||||
Other Income | 132.7 | 2.0 | 0.4 | 98.6 | 42.2 | 275.9 | ||||||||||||
Operating Revenue | $ | 6,232.1 | $ | 1,073.2 | $ | 1,083.4 | $ | 1,818.4 | $ | 241.1 | $ | 10,448.2 | ||||||
Operating Income (Loss) | $ | 684.1 | $ | 324.0 | $ | 268.1 | $ | 27.7 | $ | (14.0) | $ | 1,289.9 | ||||||
Interest and Debt Expense | $ | 4.2 | $ | - | $ | - | $ | 35.1 | $ | 117.4 | $ | 156.7 | ||||||
Depreciation and Amortization | $ | 368.9 | $ | 43.1 | $ | 177.3 | $ | 4.3 | $ | 3.1 | $ | 596.7 | ||||||
Year Ended December 31, 2007 | ||||||||||||||||||
Total Premium Income | $ | 5,014.0 | $ | 968.3 | $ | 907.2 | $ | 1,009.9 | $ | 1.7 | $ | 7,901.1 | ||||||
Net Investment Income | 1,114.0 | 187.4 | 99.9 | 827.6 | 181.0 | 2,409.9 | ||||||||||||
Other Income | 135.6 | 3.1 | 0.9 | 103.7 | 30.8 | 274.1 | ||||||||||||
Operating Revenue | $ | 6,263.6 | $ | 1,158.8 | $ | 1,008.0 | $ | 1,941.2 | $ | 213.5 | $ | 10,585.1 | ||||||
Operating Income (Loss) | $ | 542.1 | $ | 325.8 | $ | 245.8 | $ | 109.5 | $ | (160.8) | $ | 1,062.4 | ||||||
Interest and Debt Expense | $ | 7.5 | $ | - | $ | - | $ | 8.3 | $ | 226.1 | $ | 241.9 | ||||||
Depreciation and Amortization | $ | 326.9 | $ | 61.6 | $ | 162.9 | $ | 3.2 | $ | 5.2 | $ | 559.8 | ||||||
Year Ended December 31, 2006 | ||||||||||||||||||
Total Premium Income | $ | 5,196.0 | $ | 842.8 | $ | 842.1 | $ | 1,062.8 | $ | 4.5 | $ | 7,948.2 | ||||||
Net Investment Income | 1,057.5 | 170.1 | 93.6 | 828.7 | 170.7 | 2,320.6 | ||||||||||||
Other Income | 108.5 | 0.1 | 1.1 | 105.1 | 49.5 | 264.3 | ||||||||||||
Operating Revenue | $ | 6,362.0 | $ | 1,013.0 | $ | 936.8 | $ | 1,996.6 | $ | 224.7 | $ | 10,533.1 | ||||||
Operating Income (Loss) | $ | 88.7 | $ | 253.3 | $ | 198.7 | $ | 71.3 | $ | (148.8) | $ | 463.2 | ||||||
Interest and Debt Expense | $ | 1.3 | $ | - | $ | - | $ | - | $ | 216.3 | $ | 217.6 | ||||||
Depreciation and Amortization | $ | 351.9 | $ | 45.8 | $ | 154.4 | $ | 4.4 | $ | 6.2 | $ | 562.7 | ||||||
Index to Financial Statements
NOTES TO CONSOLIDATED FINANCIAL STATEMENTS - Continued
UnumProvident CorporationUnum Group and Subsidiaries
Note 1413 - Segment Information - - Continued
IncludedThe following table provides the changes in benefitsdeferred acquisition costs by segment:
| Unum US | Unum UK | Colonial Life | Total | |||||||||
| (in millions of dollars) | ||||||||||||
Year Ended December 31, 2008 | ||||||||||||
Beginning of Year | $ | 1,642.5 | $ | 69.6 | $ | 669.8 | $ | 2,381.9 | ||||
Capitalized | 329.7 | 37.4 | 223.8 | 590.9 | ||||||||
Amortization | (320.3) | (32.4) | (166.4) | (519.1) | ||||||||
Foreign Currency and Other | 9.9 | (19.9) | 28.7 | 18.7 | ||||||||
End of Year | $ | 1,661.8 | $ | 54.7 | $ | 755.9 | $ | 2,472.4 | ||||
Year Ended December 31, 2007 | ||||||||||||
Beginning of Year | $ | 2,205.2 | $ | 165.1 | $ | 612.8 | $ | 2,983.1 | ||||
Cumulative Effect of Accounting Principle Change - Note 1 | (589.8) | (88.3) | - | (678.1) | ||||||||
Capitalized | 304.2 | 41.2 | 210.9 | 556.3 | ||||||||
Amortization | (277.1) | (49.4) | (153.9) | (480.4) | ||||||||
Foreign Currency and Other | - | 1.0 | - | 1.0 | ||||||||
End of Year | $ | 1,642.5 | $ | 69.6 | $ | 669.8 | $ | 2,381.9 | ||||
Year Ended December 31, 2006 | ||||||||||||
Beginning of Year | $ | 2,201.2 | $ | 142.5 | $ | 569.6 | $ | 2,913.3 | ||||
Capitalized | 306.2 | 34.4 | 187.6 | 528.2 | ||||||||
Amortization | (302.2) | (32.0) | (144.4) | (478.6) | ||||||||
Foreign Currency and Other | - | 20.2 | - | 20.2 | ||||||||
End of Year | $ | 2,205.2 | $ | 165.1 | $ | 612.8 | $ | 2,983.1 | ||||
A reconciliation of total operating revenue and expenses is depreciation and amortization, including the 2004 impairment charges of $856.4 million related to the restructuring of the individualoperating income protection – closed block business. These expenses by segment areto revenue and net income as reported in the consolidated statements of income follows:
| Year Ended December 31 | |||||||||
| 2005 | 2004 | 2003 | |||||||
| (in millions of dollars) | |||||||||
U.S. Brokerage | $ | 347.0 | $ | 322.5 | $ | 318.8 | |||
Unum Limited | 42.3 | 39.1 | 27.4 | ||||||
Colonial | 147.4 | 142.9 | 122.8 | ||||||
Individual Income Protection - Closed Block | 4.1 | 860.7 | 79.2 | ||||||
Other | 2.5 | 3.5 | 6.8 | ||||||
Corporate | 8.6 | 7.7 | 7.6 | ||||||
Total | $ | 551.9 | $ | 1,376.4 | $ | 562.6 | |||
| Year Ended December 31 | |||||||||
| 2008 | 2007 | 2006 | |||||||
| (in millions of dollars) | |||||||||
Operating Revenue by Segment | $ | 10,448.2 | $ | 10,585.1 | $ | 10,533.1 | |||
Net Realized Investment Gain (Loss) | (465.9) | (65.2) | 2.2 | ||||||
Revenue | $ | 9,982.3 | $ | 10,519.9 | $ | 10,535.3 | |||
Operating Income by Segment | $ | 1,289.9 | $ | 1,062.4 | $ | 463.2 | |||
Net Realized Investment Gain (Loss) | (465.9) | (65.2) | 2.2 | ||||||
Income Tax | 270.8 | 324.8 | 61.8 | ||||||
Income from Discontinued Operations | - | 6.9 | 7.4 | ||||||
Net Income | $ | 553.2 | $ | 679.3 | $ | 411.0 | |||
Index to Financial Statements
NOTES TO CONSOLIDATED FINANCIAL STATEMENTS - Continued
Unum Group and Subsidiaries
Note 13 - Segment Information - - Continued
Assets by segment are as follows:
| December 31 | ||||||
| 2005 | 2004 | |||||
| (in millions of dollars) | ||||||
U.S. Brokerage | $ | 20,186.1 | $ | 19,492.2 | ||
Unum Limited | 3,335.3 | 3,364.8 | ||||
Colonial | 2,231.6 | 2,111.2 | ||||
Individual Income Protection - Closed Block | 15,792.1 | 15,991.4 | ||||
Other | 9,143.5 | 9,055.8 | ||||
Corporate | 1,178.2 | 816.9 | ||||
Total | $ | 51,866.8 | $ | 50,832.3 | ||
| December 31 | ||||||
| 2008 | 2007 | |||||
| (in millions of dollars) | ||||||
By Segment | ||||||
Unum US | $ | 20,440.9 | $ | 21,150.4 | ||
Unum UK | 2,865.4 | 3,882.4 | ||||
Colonial Life | 2,446.9 | 2,518.5 | ||||
Individual Disability - Closed Block | 14,353.0 | 15,302.3 | ||||
Corporate and Other | 9,311.2 | 9,848.3 | ||||
Total | $ | 49,417.4 | $ | 52,701.9 | ||
The Company’s goodwillRevenue is primarily derived from sources in the United States and the United Kingdom. There are no material revenues or assets attributable to foreign operations other than those reported in the U.S. Brokerage Segment, the Unum Limited Segment,UK.
We report goodwill in our Unum US segment and the Other Segment,in our Unum UK segment, which are the segments expected to benefit from the originating business combinations. Stockholders’ equity is allocated to the operating segments on the basis of an internal allocation formula that reflects the volume and risk components of each operating segment’s business and aligns allocated equity with the Company’sour target capital levels for regulatory and rating agency purposes. ThisWe modify this formula is modified periodically to recognize changes in the views of capital requirements.
Note 1514 - Commitments and Contingent Liabilities
Commitments
We have noncancelable lease obligations on certain office space and equipment. As of December 31, 2008, the aggregate net minimum lease payments were $95.6 million payable as follows: $26.6 million in 2009, $23.0 million in 2010, $14.5 million in 2011, $11.0 million in 2012, $7.0 million in 2013, and $13.5 million thereafter. Rental expense for the years ended December 31, 2008, 2007, and 2006 was $34.5 million, $35.7 million, and $35.8 million, respectively.
Contingent Liabilities
We are a defendant in a number of litigation matters. In some of these matters, no specified amount is sought. In others, very large or indeterminate amounts, including punitive and treble damages, are asserted. There is a wide variation of pleading practice permitted in the United States courts with respect to requests for monetary damages, including some courts in which no specified amount is required and others which allow the plaintiff to state only that the amount sought is sufficient to invoke the jurisdiction of that court. Further, some jurisdictions permit plaintiffs to allege damages well in excess of reasonably possible verdicts. Based on our extensive experience and that of others in the industry with respect to litigating or resolving claims through settlement over an extended period of time, we believe that the monetary damages asserted in a lawsuit or claim bear little relation to the merits of the case, or the likely disposition value. Therefore, the specific monetary relief sought is not stated.
The lawsuits described below are for the most part in very preliminary stages. Thestages, and the outcome of the matters is uncertain,uncertain. On a quarterly and annual basis, we review relevant information with respect to litigation and contingencies to be reflected in our consolidated financial statements. An estimated loss is accrued when it is probable that a liability has been incurred and the Company is unable to estimate a rangeamount of the loss can be reasonably possible losses.estimated. Unless indicated otherwise, reserves have not been established for these matters. An adverse outcome in one or more of these actions could, depending on the nature, scope, and amount of the ruling, materially adversely affect the Company’s consolidated results of operations in a period, encourage other litigation, harm the Company’s reputation and goodwill, and limit the Company’s ability
Index to write new business, particularly if the adverse outcomes negatively impact certain of the Company’s debt and financial strength ratings.Financial Statements
NOTES TO CONSOLIDATED FINANCIAL STATEMENTS - Continued
UnumProvident CorporationUnum Group and Subsidiaries
Note 1514 - Commitments and Contingent Liabilities - Continued
In the disclosures that follow about litigation, we refer to the name of the company specified in the original complaint, following the practice in the courts. Therefore, references to UnumProvident Corporation should be understood as references to Unum Group.
Claims Handling Matters
Multidistrict Litigation
On September 2, 2003, the Judicial Panel on the Multidistrict Litigation entered an order transferring more than twenty putative class actions and derivative suits, described below, filed in various courts against the Company, several of its subsidiaries, and some of their officers to the U.S. District Court for the Eastern District of Tennessee for coordinated or consolidated pretrial proceedings. The defendants strongly deny the allegations in each of these actions and will vigorously defend the substantive and procedural aspects of the litigations.
Shareholder Derivative Actions
OnBetween November 22, 2002, the first of five purported shareholder derivative actions was filed in the Tennessee Chancery Court. Between December 27, 2002 and March 11, 2003 four additionalfive purported derivative actions were filed in state and federal courts in Tennessee. The defendants removed each of the actions that were filed in Tennessee state court to the U.S. District Court for the Eastern District of Tennessee.
Each of these actionsTennessee, and the cases were consolidated. The plaintiffs then filed a single consolidated amended complaint, which purports to be broughtassert claims on behalf of the Company against certain current and past members of itsour Board of Directors and certain executive officers alleging breaches of fiduciary duties and other violations of claims paying law by defendants. Plaintiffs allege, among other things, that the individual defendants breached their duties of good faith and loyalty by establishing or permitting to be established an unlawful policy of denying legitimate disability claims and improper financial reporting, and that certain defendants engaged in insider trading.
On October 17, 2003,August 27, 2008, the district court consolidated these actions underparties entered into a stipulation of settlement to resolve the captionIn re UnumProvident Corporation Derivative Actions. On April 19, 2004,litigation. Under the plaintiffs filed a single consolidated amended complaint. On September 10, 2004,terms of the defendants answered the consolidated amended complaint by denying generally the salient factual allegations in the complaint and by asserting various affirmative defenses.
Federal Securities Law Class Actions
On February 12, 2003, the first of six virtually identical putative securities class actions was filed in the United States District Court for the Eastern District of Tennessee. In two orders dated May 21, 2003, and January 22, 2004, the district court consolidated these actions under the captionIn re UnumProvident Corp. Securities Litigation.
On January 9, 2004, the Lead Plaintiff filed its consolidated amended complaint on behalf of a putative class of purchasers of Company stock between March 30, 2000 and April 24, 2003. The amended complaint alleges,settlement, which is subject to, among other things, that the Company issued misleading financial statements, improperly accounted for certain impaired investments, failed to properly estimate its disability claim reserves, and pursued certain improper claims handling practices. The complaint asserts claims under Sections 10(b) and 20(a)approval of the Securities Exchange Act of 1934court, we agreed to, among other things, implement or continue certain corporate governance measures and Rule 10b-5 thereunder. On March 19, 2004, the defendants filed a motionpay plaintiffs’ attorneys’ fees in an amount to dismiss the consolidated amended complaint.
On September 12, 2005, the court issued a Memorandum and Order denying in part, and granting in part, the motion to dismiss. The court granted the motion with respect to Lead Plaintiff’s claims concerning the Company’s investments and denied the motion challenging the other alleged misstatements. Discovery, which has been stayed in this action pursuant to the Private Securities Litigation Reform Act of 1995, has now begun.
On May 7, 2003 the first of three identical putative securities class actions was filed in the Southern District of New York, which were later consolidated under the captionAzzolini v. CorTs Trust II for Provident Financial Trust, et al. This action alleges claims on behalf of a putative class of purchasers of UnumProvident Corporate-Backed Trust Securities (CorTs) certificates that were issued by certain underwriter defendants unaffiliated with the Company.
NOTES TO CONSOLIDATED FINANCIAL STATEMENTS - Continued
UnumProvident Corporation and Subsidiaries
Note 15 - Commitments and Contingent Liabilities - Continued
Plaintiff alleges that the Company and certain of its officers violated the Securities Exchange Act of 1934 and that the underwriter defendants violated the Securities Act of 1933, all premised on the same factual allegations as the earlier-filed putative securities class action. A fourth action,Bernstein v. CorTs for Provident Financing Trust I, et al., was filed in the Eastern District of New York on July 7, 2003. TheBernstein action makes identical allegations, but with respect to a different series of CorTs securities. These actions all were transferred to the Eastern District of Tennessee for coordinated pre-trial proceedings.
On March 19, 2004, amended complaints were filed in both theAzzolini andBernstein actions. The amended complaints assert claims under Sections 10(b) and 20(a) of the Securities Exchange Act of 1934 and Rule 10b-5 thereunder against UnumProvident and one of its officers. TheAzzolini plaintiff seeks to represent a putative class of purchasers of certain CorTs certificates between March 21, 2001 and March 24, 2003. TheBernstein plaintiff seeks to represent a putative class of purchasers of a different series of CorTs certificates between February 8, 2001 and March 10, 2003. On April 19, 2004, the defendants moved to dismiss the complaints in each of these actions. On September 12, 2005, the court issued a Memorandum and Order granting the motion to dismiss filedbe determined by the Company. On January 12, 2006, plaintiffs filed a noticecourt. We have established adequate reserves for the attorneys’ fees, the payment of appeal from the court’s decision dismissing this action.
which we believe will be an immaterial amount.
Policyholder Class Actions
On July 15, 2002,Rombeiro v. Unum Life Insurance Company of America, et al., was filed in the Superior Court of California and subsequently was removed to federal court, alleging that the plaintiff was wrongfully denied disability benefits under a group long-term disability plan. On January 21, 2003, an Amended Complaintamended complaint was filed on behalf of a putative class of individuals that were denied or terminated from benefits under group long-term disability plans, seeking injunctive and declaratory relief and payment of benefits. On April 30, 2003, the court granted in part and denied in part the defendants’ motion to dismiss the complaint. On May 14, 2003, the plaintiff filed a Second Amended Complaintsecond amended complaint seeking similar relief.
Between November 2002 and November 2003, six additional similar putative class actions were filed in (or later removed to) federal district courts in Illinois, Massachusetts, New York, Pennsylvania, and Tennessee. The complaints alleged that the putative class members’ claims were evaluated improperly and allege that the Companywe and itsour insurance subsidiaries breached certain fiduciary duties owed to the class members under the Employee Retirement Income Security Act (ERISA), Racketeer Influenced Corrupt Organizations Act (RICO), and/or various state laws. The complaints sought various forms of equitable relief and money damages, including punitive damages.
These actions all were transferred to the Eastern District of Tennessee multidistrict litigation. On December 22, 2003, the Tennessee Federal District Court entered an order consolidating all of the above actions for all pretrial purposes under the captionIn re UnumProvident Corp. ERISA Benefit Denial Actions and appointed a lead plaintiff. A consolidated amended complaint was filed on February 20, 2004.
Court ordered mediation has concluded with the settlement of all individual claims brought by seven of the fifteen named plaintiffs. An eighth plaintiff has subsequently resolved her claims through the process established under the regulatory settlement agreements.
Index to Financial Statements
NOTES TO CONSOLIDATED FINANCIAL STATEMENTS - Continued
Unum Group and Subsidiaries
Note 14 - Commitments and Contingent Liabilities - Continued
On MarchJanuary 12, 2009, in a two-to-one decision, the Sixth Circuit Court of Appeals reversed the District Court’s earlier ruling certifying a class. On January 26, 2004,2009, the defendants answered the complaints and simultaneouslyplaintiffs filed a motionpetition for rehearing of this decision by the full court. The District Court has yet to rule on our pending motions for judgment on the pleadings in the ERISA Benefit Denial Actions. The court has not yet ruled upon that motion.
or for summary judgment.
On April 30, 2003, a separate putative class action,Taylor v. UnumProvident Corporation, et al., was filed in the Tennessee Circuit Court and subsequently removed to federal court. The complaint alleges claims against UnumProvidentUnum Group and certain subsidiaries on behalf of a putative class of long-term disability insurance policyholders who did not obtain their coverage through employer sponsored plans and who had a claim denied, terminated, or suspended by a UnumProvidentUnum Group subsidiary after January 1, 1995, seeking equitable and monetary relief. Plaintiff alleges that the defendants violated various state laws by engaging in unfair claim practices and improperly denying claims.
On April 9, 2004, The trial court subsequently dismissed the plaintiffs inTaylorplaintiff’s claims for equitable relief and in theERISA Benefit Denial Actions separately filed motions seekingpunitive damages and, most recently, denied certification of a plaintiff class.class action. On July 1, 2005,September 23, 2008, the defendants also filed motionsSixth Circuit Court of Appeals denied plaintiff’s petition to appeal the denial of class certification; on the following day the District Court dismissed all of the plaintiff’s additional claims except for summary judgment in each action.
NOTES TO CONSOLIDATED FINANCIAL STATEMENTS - Continued
UnumProvident Corporation and Subsidiaries
Note 15 - Commitments and Contingent Liabilities - Continued
On December 14, 2005, the court granted in part the defendants’ motionplaintiff’s individual claims for summary judgment inTaylor, dismissing plaintiff’s request for equitable relief on her breachbreaches of contract claim and dismissing any claim plaintiff may make for punitive damages underfiduciary duty and alleged violations of the Tennessee Consumer Protection Act. The former claim is the principal claim upon which class certification is sought. The court reserved ruling on the remainder of the pending motion for summary judgment pending further mediation of theTaylor andERISA Benefits actions.
Plan Beneficiary Class Actions
On April 29, 2003, the first of two identical putative class actions,Gee v. UnumProvident Corporation, et al., was filed in the Eastern District of Tennessee on behalf of participants and beneficiaries of UnumProvident’s 401(k) Retirement Plan (Plan), and the actions were later consolidated.
On January 9, 2004, plaintiffs filed a consolidated amended complaint against the Company, several of its officers and directors, and several alleged Plan fiduciaries on behalf of a putative class of individuals that held Company stock in their 401(k) retirement accounts subsequent to November 17, 1999. Plaintiffs allege that the defendants violated ERISA by making misrepresentations and omissions regarding investment in Company stock and by acting imprudently in failing to take action to protect participants from losses sustained from investments in the Plan’s UnumProvident Stock Fund.
On February 26, 2004, the defendants filed a motion to dismiss contending that the complaint failed to state a valid claim under ERISA. On January 13, 2005, the court denied that motion. The defendants filed an answer to the complaint denying all material allegations on February 28, 2005.
On March 10, 2005, the plaintiffs filed a motion to certify the class. The defendants filed an opposition on June 10, 2005, and the matter is under submission with the court.
On November 30, 2005, the court entered a schedule providing for the completion of pretrial discovery by October 17, 2006. No trial date has been set for the action.
Examinations and Investigations
The Company experienced increased market conduct examinations by state insurance departments during 2002 and 2003 focused specifically on its disability claims handling policies and practices. On March 19, 2003, the Company consented to the entry of an order by the Georgia Insurance Commissioner that, among other things, ordered four of the Company’s insurance subsidiaries to each pay a monetary penalty of $250,000 and to adhere to certain claims handling practices. The order also placed these four companies on regulatory probation for two years. The Georgia order did not cite any violations of Georgia law or regulations.
The insurance commissioners of Maine, Massachusetts, and Tennessee initiated a multistate targeted market conduct examination in September 2003 that focused on the disability claims handling policies and practices of these subsidiaries. This multistate examination resulted in a report and regulatory settlement agreements that became effective on December 21, 2004, which was agreed to by 48 states and the District of Columbia. The examination report made no findings of violations of law or regulations. The examination identified areas of concern which became the focus of certain changes to the Company’s disability claims handling operations. The settlement agreements also include a reassessment of certain previously denied or closed claims, additional corporate and board governance, and payment of a fine in the amount of $15.0 million that was allocated among the states and jurisdictions participating in the agreements. The agreements will remain in place until the later of January 1, 2007, or the completion of an examination of claims handling practices and an examination of the reassessment process, both of which will be conducted by the lead state regulators. The settlement agreements also provide for a contingent fine up to $145.0 million on the Company’s subsidiaries in the event that they fail to satisfactorily meet the performance standards in the settlement agreements relating to the examinations referred to above, which will be conducted in
NOTES TO CONSOLIDATED FINANCIAL STATEMENTS - Continued
UnumProvident Corporation and Subsidiaries
Note 15 - Commitments and Contingent Liabilities - Continued
approximately one year. The Company believes that the changes it has made to its claims operations to enhance its oversight functions will substantially reduce the likelihood that the Company would fail to meet the performance standards in the agreements when these examinations are concluded.
In addition, the U.S. Department of Labor (DOL), which had been conducting an inquiry relating to certain ERISA plans, joined the settlement agreements. The Office of the New York Attorney General (NYAG), which had engaged in its own investigation of the Company’s claim handling practices, notified the Company that it supported the settlement and closed its investigation on this issue.
In the fourth quarter of 2004, the Company recorded a charge related to the settlement of the multistate market conduct examination of $127.0 million, before tax, or $87.8 million, after tax, comprised of four elements: $27.5 million of incremental direct operating expenses to conduct the two-year reassessment process; $44.0 million for benefit costs and reserves from claims reopened from the reassessment; $40.5 million for additional benefit costs and reserves for claims already incurred and currently in inventory that are anticipated as a result of the claim process changes being implemented; and the $15.0 million fine.
On October 3, 2005, certain of the Company’s insurance subsidiaries entered into a settlement agreement with the California Department of Insurance (DOI), concluding a market conduct examination and investigation of the subsidiaries’ disability claims handling practices. The California DOI had chosen not to join the 2004 multistate settlement agreements.
As part of the settlement with the California DOI, the Company paid a civil penalty of $8.0 million and agreed to change certain practices and policy provisions related to its California business. The settlement also incorporates claims handling practices previously covered by the multistate settlement agreements and includes certain additional claim handling changes. Under the terms of the settlement, the Company will change certain provisions specific to California disability policies, and it received approval from the California DOI for the use of new individual and group disability policy forms. Following the California settlement, the Company also amended the multistate settlement agreements to include mailing a notice of eligibility to participate in the claim reassessment process to approximately 29,500 individuals whose claims were denied or terminated between January 1, 1997 and December 31, 1999. Under the original multistate settlement agreements, claimants during this period could request participation in the reassessment process, but they were not sent a notice.
In entering the settlement, the Company did not agree with the allegations and characterization of the Company’s past claims handling practices made by the California DOI.
Separately, the Company is proceeding with a plan to offer to reassess private label, acquired, and reinsured block claims, as well as claims administered on behalf of certain employers.
Based on the California DOI settlement agreement and related matters described above, in the third quarter of 2005 the Company recorded a charge of $75.0 million before tax, or $51.6 million after tax, comprised of four elements: $14.3 million of incremental direct operating expenses to conduct the reassessment process; $37.3 million for benefit costs and reserves from claims reopened from the reassessment; $15.4 million for additional benefit costs and reserves for claims already incurred and currently in inventory that are anticipated as a result of the claim process changes being implemented; and the $8.0 million fine.
These and other regulatory examinations or investigations could result in, among other things, changes in business practices, including changes in broker compensation and related disclosure practices, changes in the use and oversight of finite reinsurance, changes in governance and other oversight procedures, fines, and other administrative action. Such results, singly or in combination, could injure the Company’s reputation, cause negative publicity, adversely affect the Company’s debt and financial strength ratings, or impair the Company’s ability to sell or retain insurance policies, thereby adversely affecting the Company’s business, and potentially materially adversely affecting the
NOTES TO CONSOLIDATED FINANCIAL STATEMENTS - Continued
UnumProvident Corporation and Subsidiaries
Note 15 - Commitments and Contingent Liabilities - Continued
consolidated results of operations in a period, depending on the results of operations of the Company for the particular period. Determination by regulatory authorities that the Company or its insurance subsidiaries have engaged in improper conduct could also adversely affect the Company’s defense of various lawsuits described herein.
Other Claim Litigation
The CompanyWe and itsour insurance company subsidiaries, as part of theirour normal operations in managing disability claims, are engaged in claim litigation where disputes arise as a result of a denial or termination of benefits. Most typically thosethese lawsuits are filed on behalf of a single claimant or policyholder, and in some of these individual actions punitive damages are sought, such as claims alleging bad faith in the handling of insurance claims. For itsour general claim litigation, the Company and its insurance company subsidiarieswe maintain reserves based on experience to satisfy judgments and settlements in the normal course. Management expectsWe expect that the ultimate liability, if any, with respect to general claim litigation, after consideration of the reserves maintained, will not be material to theour consolidated financial condition of the Company.condition. Nevertheless, given the inherent unpredictability of litigation, it is possible that an adverse outcome in certain claim litigation involving punitive damages could, from time to time, have a material adverse effect on the Company’sour consolidated results of operations in a period, depending on the results of operations of the Company for the particular period. The Company is unable to estimate a range of reasonably possible punitive losses.
On December 20, 2004,June 13, 2005, following a trial in the U.S. District Court of Nevada in the matter ofWeiller v. New YorkG. Clinton Merrick vs. UnumProvident Corporation, Paul Revere Life Insurance Company, et al., judgment was filedentered in New York Supremeplaintiff’s favor on his breach of contract and bad faith claims, and the plaintiff was awarded contract, emotional distress, and punitive damages, as well as attorneys’ fees. We appealed that judgment. The Ninth Circuit Court against, among others, UnumProvident and certain subsidiaries on behalf of a putative class of insureds under policies issued by several third-party insurers on behalf of whom UnumProvident administers claims. The complaint allegesAppeals reversed that the defendants breached the insurance policies by improperly denying or terminating benefits, and seeks equitable relief on behalfportion of the classjudgment that awarded attorneys’ fees and benefitspunitive damages award and remanded for a new trial on behalfthe issue of punitive damages that should be awarded, if any. We thereafter paid the portion of the named plaintiff. On February 18, 2005,verdict that had been upheld and proceeded to a second trial on the defendants filed a motionlimited issue of the amount of punitive damages to dismiss this action. On June 20, 2005, the plaintiff filed a motion seeking certificationbe awarded against Unum Group and one of a putative class, which the defendants opposed. These motions remain pending. The Company denies the allegations and will vigorously defend against the allegations raisedour insurance subsidiaries, if any. A second jury verdict was entered on July 3, 2008, in the complaint.amount of $24.0 million as to one of our insurance subsidiaries and $36.0 million as to Unum Group. Following post trial motions, the trial court affirmed the judgment as to our insurance subsidiary and reduced the judgment as to Unum Group to $26.4 million. We have appealed the amended judgment to the Ninth Circuit. We believe that we have strong legal arguments to raise on appeal that create significant uncertainty regarding the ultimate outcome of this matter. However, since our efforts to reduce or overturn this award are at an early stage in the appeals process, an estimate of the liability to resolve this matter was established in 2008. The accrual was not material to our operating results.
Index to Financial Statements
NOTES TO CONSOLIDATED FINANCIAL STATEMENTS - Continued
Unum Group and Subsidiaries
Note 14 - Commitments and Contingent Liabilities - Continued
From time to time class action allegations are pursued as inWeiller, where the claimant or policyholder purports to represent a larger number of individuals who are similarly situated. Since each insurance claim is evaluated based on its own merits, there is rarely a single act or series of actions, which can properly be addressed by a class action. Nevertheless, the Company monitorswe monitor these cases closely and defends itselfdefend ourselves appropriately where these allegations are made.
Broker Compensation, Quoting Process, and Related Matters
Examinations and Investigations
In June 2004, the Company received a subpoena from the NYAG requesting documents and information relating to compensation arrangements between insurance brokers or intermediaries and the Company and its subsidiaries. The Company has received additional subpoenas or requests for additional information from the NYAG concerning its relations with insurance brokers. The NYAG has filed several lawsuits against brokers arising out of its investigation. Several insurers were cited in the complaints but not named as defendants — one such complaint cited the Company but did not name it as a defendant. The Company is cooperating with the NYAG’s investigations and inquiries.
Since October 2004, the Companywe and/or itsour insurance subsidiaries have received subpoenas or information requests from the Office of the NYAG, a Federal Grand Jury in San Diego, the District Attorney for the County of San Diego, insurance departments, and/or other state regulatory or investigatory agencies of at least eight additionalseven states including California, Connecticut, Florida, Maine, Massachusetts, North Carolina, Oklahoma,South Carolina, and South Carolina.
NOTES TO CONSOLIDATED FINANCIAL STATEMENTS - Continued
UnumProvident Corporation and Subsidiaries
Note 15 - Commitments and Contingent Liabilities - Continued
Tennessee. The subpoenas andand/or information requests sought information regarding,relate to, among other things, compliance with ERISA relating to our interactions with insurance brokers and to regulations concerning insurance information provided by us to plan administrators of ERISA plans, as well as compliance with state and federal laws with respect to quoting processes, producer compensation, solicitation activities, policies sold to state or municipal entities, and information regarding compensation arrangements with brokers, particularly with regard to Universal Life Resources, Inc. The Company is cooperatingbrokers.
We have cooperated fully with all investigations and will continue to do so. However, due to a prolonged period of inactivity, we consider these investigations.
The Company also has had discussions with the DOL regarding compliance with ERISA, relating to the Company’s interactions with insurance brokers and to regulations concerning insurance information provided by the Company to plan administrators of ERISA plans, including specifically the reporting of fees and commissions paid to agents, brokers, and others in accordance with the requirements of Schedule A of Form 5500. The DOL is pursuing an investigation of the Company concerning these issues, both generally and specifically in connection with certain brokers, including Universal Life Resources. The Company is cooperating with the DOL’s investigation.
state investigations dormant.
Broker-Related Litigation
The CompanyWe and certain of itsour subsidiaries, along with many other insurance brokers and insurers, have been named as defendants in a series of putative class actions that have been transferred to the U.S. District Court for the District of New Jersey for coordinated or consolidated pre-trialpretrial proceedings as part of multidistrict litigation (MDL) No. 1663,In re Insurance Brokerage Antitrust Litigation. The plaintiffs in MDL No. 1663 filed a consolidated amended complaint in August 2005, which alleges, among other things, that the defendants violated federal and state antitrust laws, RICO, ERISA, and various state common law requirements by engaging in alleged bid rigging and customer allocation and by paying undisclosed compensation to insurance brokers to steer business to defendant insurers. Defendants filed a motion to dismiss the complaint on November 29, 2005,2005. On April 5, 2007, defendants’ motion to dismiss was granted without prejudice as to all counts except the ERISA counts. Plaintiffs were granted a last opportunity to file an amended complaint, and that motion is pending. Plaintiffsthey did so on May 22, 2007. On June 21, 2007, defendants filed a motion to dismiss and for class certificationsummary judgment on February 13, 2006,all counts. On August 31, 2007 and September 28, 2007, plaintiffs’ federal antitrust and RICO claims were dismissed with prejudice. Defendants’ motion for summary judgment on the Company will oppose class certificationERISA counts was granted on or before AprilJanuary 14, 2006 in accordance2008. All pending state law claims were dismissed without prejudice. Plaintiffs have filed an appeal with the present schedulingThird Circuit Court of Appeals of the order in this matter.dismissing their federal antitrust and RICO claims.
The Company is a defendant in a case brought by the California Insurance Commissioner, styledCalifornia v. Universal Life Resources, et al., pending in California Superior Court. The Complaint purports only to seek injunctive relief under the California Insurance Code based on allegations of undisclosed or inadequately disclosed compensation paid to brokers, steering, bid rigging, and customer allocation similar to the claims asserted in MDL No. 1663. The defendants filed a demurrer to the Second Amended Complaint on July 21, 2005. The demurrer was overruled on December 23, 2005, and the Company filed an answer denying all material allegations on January 18, 2006.
The Company isWe are a defendant in an action styled,Palm Tree Computers Systems, Inc. v. ACE USA, et al., which was filed in the Florida state Circuit Court on February 16, 2005. The complaint is a putative class action and alleges violations ofcontains allegations similar to those made in the Deceptive and Unfair Trade Practices Act of Florida and other states, breach of fiduciary duty, and unjust enrichment. The allegations are brought against numerous broker organizations and insurers and assert the Company and its subsidiaries engaged in illegal and unethical contingent commission arrangements.multidistrict litigation referred to above. The case was removed to federal court and, on October 20, 2005, the case was transferred to the District of New Jersey multidistrict litigation. APlaintiffs’ motion to remand the case to the state court in Florida remainswas dismissed without prejudice along with other pending but no further action has been takenmotions in the case subsequent to the transfer.
The Company is a defendant in an action entitled,Bensley Construction, Inc. v. Marsh & McLennan Companies, Inc., et al., filed in Massachusetts Superior Court by the same counsel as inPalm Tree. The complaint names numerous insurance brokers and insurers and purports to be brought on behalf of Massachusetts insureds, alleging violations of breach of fiduciary duty and unjust enrichment under Massachusetts law. The case was removed to Federal Court and a tag-along notice filed seeking transfer to MDL No. 1663. The Judicial Panel on Multidistrict Litigation has the request to transfer the matter to MDL No. 1663 under advisement, and the District Court in Massachusetts has stayed further proceedings, including a ruling on plaintiff’s motion to remand the matter to state court, pending a ruling on the transfer motion.MDL.
Index to Financial Statements
NOTES TO CONSOLIDATED FINANCIAL STATEMENTS - Continued
UnumProvident CorporationUnum Group and Subsidiaries
Note 1514 - Commitments and Contingent Liabilities - Continued
On December 21, 2004, a putative derivative action styledLeonard v. UnumProvident Corporation, et al., was filed in Tennessee Chancery Court against the Company and various members of its board of directors alleging claims on behalf of the Company against the director defendants for breach of duty, mismanagement, and corporate waste, challenging certain compensation paid to insurance brokers and alleging insider trading against certain director defendants. On April 1, 2005, the defendants moved to dismiss the complaint on the grounds that the plaintiff failed to make a pre-suit demand on the Company’s board of directors and that the complaint fails to state a claim upon which relief could be granted. That motion remains pending. The defendants strongly deny the allegations in the complaint and will vigorously defend both the substantive and procedural aspects of the litigation.
The Company denies the allegations in these matters and intends to vigorously contest them.
Miscellaneous Matters
In September 2003,United States of America ex. rel. Patrick J. Loughren v. UnumProvident Corporation and GENEX Services, Inc., was filed in the United States District Court for the District of Massachusetts. This is a qui tam action to recover damages and civil penalties on behalf of the United States of America alleging violations of the False Claims Act by the Companyus and itsour former GENEX subsidiary. In accordance with the False Claims Act, the action was originally filed under seal to provide the government the opportunity to investigate the allegations and prosecute the action if they believed that the case had merit and warranted their attention. The government declined to prosecute the case, and the case became a matter of public record on December 23, 2004. The complaint alleges that the Company defraudswe defrauded the government by inducing and or assisting disability claimants to apply for disability benefits from the Social Security Administration (SSA) when the Companywe allegedly knowsknew that the claimants arewere not disabled under SSA criteria. On September 13, 2005, the magistrate judgeWe filed a recommended decision grantingmotion for summary judgment which was denied on September 15, 2008. The case proceeded to trial at which seven out of 95 claims were adjudicated. We prevailed on four of the Company’sclaims, the Relator prevailed on two of the claims, and the jury could not reach a verdict on one of the claims. The jury awarded the Relator $850 in damages which can be trebled. The court may also assess a penalty of between $5,000 and $11,000 per claim. The court has not yet set a trial date for the remaining claims. The court must still address the issue of whether, once all the claims are tried, there can be any extrapolation of these results to the larger population of claims we manage. We strongly believe that no such extrapolation can be justified either legally or factually, especially in light of the recent split verdict. On February 24, 2009, the court ruled that the testimony of the Relator’s expert in support of extrapolation would be excluded. We have also filed post trial motions with the trial court seeking to reverse the adverse findings by the jury and, if necessary, we will file an appeal with the First Circuit Court of Appeals if final judgment is entered against us.
In May 2007,Roy Mogel, Todd D. Lindsay and Joseph R. Thorley individually and on behalf of those similarly situated v. Unum Life Insurance Company, was filed in the United States District Court for the District of Massachusetts. This is a putative class action alleging that we breached fiduciary duties owed to certain beneficiaries under certain group life insurance policies when we paid life insurance proceeds by establishing interest-bearing retained asset accounts rather than by mailing checks. Plaintiffs seek to represent a class of beneficiaries under group life insurance contracts that were employee welfare benefit plans under ERISA and under which we paid death benefits pursuant to a retained asset account. Plaintiffs seek to recover on behalf of the class the difference between the interest paid to them and amounts alleged to have been realized by us through our investment of the retained assets. On February 4, 2008, the court granted our motion to dismiss. The plaintiffs appealed that findingdismiss all claims, but on November 6, 2008 the First Circuit Court of Appeals vacated the District Court’s order. Our petition for rehearing in the First Circuit Court of Appeals was denied on January 21, 2009, and the case is now being remanded to the district court, judge. On October 6, 2005,where we intend to answer the district court judge adopted, in full,complaint and contest both the recommended decisionrequest for class certification and the merits of the magistrate judge thereby granting dismissalclaims.
On May 16, 2008, we were added as a party to a case styled,Public Service Company of Colorado; P.S.R. Investments, Inc.; and Xcel Energy, Inc. v. Theodore J. Mallon; Transfinancial Corporation; and Provident Life and Accident Insurance Company, filed in the District Court, County of Boulder, State of Colorado, alleging among other things breach of contract, unjust enrichment, breach of duty of good faith and fair dealing, fraudulent concealment, negligent misrepresentation and non-disclosure, fraud, civil conspiracy, violation of the case. The plaintiffs subsequently amended their pleading,Colorado Consumer Protection Act, violation of the Colorado Organized Crime Control Act, and conspiracy to violate the Colorado Organized Crime Control Act. These claims arise from the sale of corporate-owned life insurance policies to Public Service Company of Colorado by Mallon in 1984 and 1985. These policies were reinsured to Reassure America Life Insurance Company, a subsidiary of Swiss Reinsurance Company, as of July 2000. In response to the complaint, we filed a motion to dismiss all counts of the pleading as complaint asserted against us. On October 22, 2008, the District Court granted in part and denied in part our motion to dismiss, thereby dismissing all claims against us for violation of the Colorado Consumer Protection Act, violation of the Colorado Organized Crime Control Act, and conspiracy to violate the Colorado Organized Crime Control Act. The plaintiff has been granted leave to file an
Index to Financial Statements
NOTES TO CONSOLIDATED FINANCIAL STATEMENTS - Continued
Unum Group and Subsidiaries
Note 14 - Commitments and Contingent Liabilities - Continued
amended for the same reasons that the court dismissed the original pleading. On February 9, 2006, the Court denied thecomplaint, and we will be filing another motion to dismiss. We deny the allegations of the amended complaint and plan to vigorously contest them.
In September 2008, we received service of a complaint, in an adversary proceeding in connection with the bankruptcy caseIn re Quebecor World (USA) Inc., et al. entitledOfficial Committee of Unsecured Creditors of Quebecor World (USA) Inc., et al., v. American United Life Insurance Company, et al., filed in the United States Bankruptcy Court for the Southern District of New York. The Company will proceed forwardcomplaint alleges that we received preference payments relating to answernotes held by certain of our insurance subsidiaries and seeks to avoid and recover such payments plus interest and cost of the action. We deny the allegations in the complaint and otherwise defend the action.will vigorously contest them.
In certain of the Company’s reinsurance businesses there are disputes among the pool members, reinsurance participants, and/or reinsurers concerning the scope of their obligations and liabilities within the reinsurance contracts, including the reinsurance pools for which subsidiaries of the Company acted either as pool managers or underwriting agents, as pool members, or as reinsurers. The Company or the Company’s subsidiaries either have been or may in the future be brought into disputes, arbitration proceedings, or litigation with other pool members or reinsurers in the process of resolving the various claims.
Summary
Various other lawsuits against the Companyus, in addition to those discussed above, have arisen in the normal course of its business. Contingent liabilitiesFurther, state insurance regulatory authorities and other federal and state authorities regularly make inquiries and conduct investigations concerning our compliance with applicable insurance and other laws and regulations.
Given the complexity and scope of our litigation and regulatory matters, it is not possible to predict the ultimate outcome of all pending investigations or legal proceedings or provide reasonable estimates of potential losses, except where noted in connection with specific matters. It is possible that might arise from such other litigation incurred in the normal course of business are not deemed likely to materially adversely affect the consolidated financial position orour results of operations of the Companyor cash flows in a particular period could be materially affected by an ultimate unfavorable outcome of pending litigation or regulatory matters depending, in part, on theour results of operations of the Companyor cash flows for the particular period.
We believe, however, that the ultimate outcome of all pending litigation and regulatory matters, after consideration of applicable reserves and rights to indemnification, should not have a material adverse effect on our financial position.
Note 1615 - Statutory Financial Information
Statutory Net Income, Capital and Surplus, and Dividends
The Company’s insurance subsidiaries’ statutory combinedStatutory net income asfor U.S. life insurance companies is reported in conformity with statutory accounting principles as prescribed by the National Association of Insurance Commissioners (NAIC) and adopted by the applicable domiciliary state laws, forlaws. For the years ended December 31, 2005, 2004,2008, 2007, and 2003,2006, our U.S. insurance subsidiaries’ statutory combined net income, excluding Tailwind Re and Northwind Re, was $641.8$540.8 million, $607.6$530.8 million, and $22.7$307.4 million, respectively. Statutoryrespectively, and statutory combined net gain from operations was $650.0$682.0 million, $662.1
NOTES TO CONSOLIDATED FINANCIAL STATEMENTS - Continued
UnumProvident Corporation and Subsidiaries
Note 16 - Statutory Financial Information - Continued
$589.1 million, and $214.8$371.5 million, respectively. Statutory capital and surplus, excluding Tailwind Re and Northwind Re, was $2,756.0 million and $2,975.3 million at December 31, 2008 and 2007, respectively. Tailwind Re and Northwind Re, our special purpose financial captive U.S. insurance subsidiaries, had a statutory combined net income (loss) of $79.8 million and $(111.5) million and a statutory combined net gain (loss) from operations of $81.2 million and $(111.9) million for the years ended December 31, 2005, 2004,2008 and 2003,2007, respectively. Statutory capital and surplus for Tailwind Re and Northwind Re at December 31, 20052008 and 2004,2007 was $4,270.2$1,300.5 million and $4,105.4$1,378.7 million, respectively.
Tailwind Re had statutory net income and statutory net gain from operations of $14.1 million for the year ended December 31, 2006.
Restrictions under applicable state insurance laws limit the amount of ordinary dividends that can be paid to the Companya parent company from its insurance subsidiaries without prior approval by regulatory authorities. For life insurance companies domiciled in the United States, that limitation typically equals, depending on the state of domicile, either ten percent of an insurer’s statutory surplus with respect to policyholders as of the preceding year end or the
Index to Financial Statements
NOTES TO CONSOLIDATED FINANCIAL STATEMENTS - Continued
Unum Group and Subsidiaries
Note 15 - Statutory Financial Information - Continued
statutory net gain from operations, excluding realized investment gains and losses, of the preceding year. The payment of ordinary dividends to the Companya parent company from its insurance subsidiaries is further limited to the amount of statutory surplus as it relates to policyholders. Based on the restrictions under current law, $621.4$653.3 million is available for the payment of ordinary dividends to the Company from its domesticour U.S. insurance subsidiaries, excluding Tailwind Re and Northwind Re, during 2006.2009. The ability of Tailwind Re and Northwind Re to pay dividends to their parent companies, Tailwind Holdings and Northwind Holdings, wholly-owned subsidiaries of Unum Group, will depend on their satisfaction of applicable regulatory requirements and on the performance of the business reinsured by Tailwind Re and Northwind Re.
The CompanyWe also hashave the ability to draw a dividend from itsour United Kingdom insurance subsidiary, Unum Limited. Such dividends are limited based on insurance company legislation in the United Kingdom, which requires a minimum solvency margin. The amount available under current law for payment of dividends to the Company from Unum Limited during 20062009 is approximately $240.3 million.£145.5 million, subject to regulatory approval. Regulatory restrictions do not limit the amount of dividends available for distribution to the Company from itsour non-insurance subsidiaries.
Deposits
At December 31, 2005, the Company’s2008, our U.S. insurance subsidiaries had on deposit with U.S. regulatory authorities securities with a book value of $289.5$293.7 million held for the protection of policyholders. Additionally, securities with a book value of $99.7 million are on deposit with Canadian regulatory authorities at December 31, 2005.
Note 17 - Quarterly Results of Operations (Unaudited)
The following is a summary of unaudited quarterly results of operations for 2005 and 2004:
| 2005 | ||||||||||||||
| 4th | 3rd | 2nd | 1st | |||||||||||
| (in millions of dollars, except share data) | ||||||||||||||
Premium Income | $ | 1,988.4 | $ | 1,952.2 | $ | 1,940.0 | $ | 1,935.0 | ||||||
Net Investment Income | 564.9 | 547.2 | 548.2 | 528.0 | ||||||||||
Net Realized Investment Gain (Loss) | 2.4 | (71.4 | ) | 65.5 | (3.2 | ) | ||||||||
Total Revenue | 2,664.7 | 2,543.9 | 2,656.7 | 2,571.9 | ||||||||||
Income Before Income Tax | 193.9 | 68.3 | 265.8 | 181.6 | ||||||||||
Net Income | 137.5 | 52.6 | 171.3 | 152.2 | ||||||||||
Net Income Per Common Share | ||||||||||||||
Basic | 0.46 | 0.18 | 0.58 | 0.52 | ||||||||||
Assuming Dilution | 0.43 | 0.17 | 0.55 | 0.49 | ||||||||||
Index to Financial Statements
NOTES TO CONSOLIDATED FINANCIAL STATEMENTS - Continued
UnumProvident CorporationUnum Group and Subsidiaries
Note 1716 - Quarterly Results of Operations (Unaudited) - Continued
The following is a summary of our unaudited quarterly results of operations for 2008 and 2007:
| 2004 | ||||||||||||||
| 4th | 3rd | 2nd | 1st | |||||||||||
| (in millions of dollars, except share data) | ||||||||||||||
Premium Income | $ | 1,964.3 | $ | 1,962.3 | $ | 1,956.8 | $ | 1,956.2 | ||||||
Net Investment Income | 564.5 | 527.2 | 532.9 | 534.1 | ||||||||||
Net Realized Investment Gain (Loss) | 25.8 | 64.5 | (86.5 | ) | 25.4 | |||||||||
Total Revenue | 2,676.6 | 2,655.3 | 2,509.3 | 2,623.7 | ||||||||||
Income (Loss) from Continuing Operations Before Income Tax | 142.8 | 255.8 | 112.1 | (770.2 | ) | |||||||||
Net Income (Loss) | 134.5 | 167.6 | 7.2 | (562.3 | ) | |||||||||
Net Income (Loss) Per Common Share | ||||||||||||||
Basic | ||||||||||||||
Income (Loss) from Continuing Operations | 0.46 | 0.57 | 0.25 | (1.93 | ) | |||||||||
Net Income (Loss) | 0.46 | 0.57 | 0.02 | (1.91 | ) | |||||||||
Assuming Dilution | ||||||||||||||
Income (Loss) from Continuing Operations | 0.45 | 0.55 | 0.25 | (1.93 | ) | |||||||||
Net Income (Loss) | 0.45 | 0.55 | 0.02 | (1.91 | ) | |||||||||
| 2008 | ||||||||||||
| 4th | 3rd | 2nd | 1st | |||||||||
| (in millions of dollars, except share data) | ||||||||||||
Premium Income | $ | 1,917.7 | $ | 1,946.5 | $ | 1,968.6 | $ | 1,950.5 | ||||
Net Investment Income | 589.8 | 594.7 | 613.1 | 591.4 | ||||||||
Net Realized Investment Gain (Loss) | (257.7) | (165.8) | 26.1 | (68.5) | ||||||||
Total Revenue | 2,323.7 | 2,442.7 | 2,675.3 | 2,540.6 | ||||||||
Income Before Income Tax | 52.5 | 159.8 | 367.0 | 244.7 | ||||||||
Net Income | 41.8 | 108.0 | 240.3 | 163.1 | ||||||||
Net Income Per Common Share | ||||||||||||
Basic | 0.13 | 0.32 | 0.70 | 0.47 | ||||||||
Assuming Dilution | 0.13 | 0.32 | 0.69 | 0.46 | ||||||||
| 2007 | ||||||||||||
| 4th | 3rd | 2nd | 1st | |||||||||
| (in millions of dollars, except share data) | ||||||||||||
Premium Income | $ | 1,983.9 | $ | 1,986.5 | $ | 1,986.7 | $ | 1,944.0 | ||||
Net Investment Income | 619.4 | 603.2 | 597.8 | 589.5 | ||||||||
Net Realized Investment Gain (Loss) | (25.8) | (46.1) | 10.4 | (3.7) | ||||||||
Total Revenue | 2,643.5 | 2,610.2 | 2,665.6 | 2,600.6 | ||||||||
Income from Continuing Operations Before Income Tax | 225.4 | 279.0 | 232.9 | 259.9 | ||||||||
Income from Continuing Operations | 160.5 | 187.0 | 153.5 | 171.4 | ||||||||
Income from Discontinued Operations | - | - | - | 6.9 | ||||||||
Net Income | 160.5 | 187.0 | 153.5 | 178.3 | ||||||||
Net Income Per Common Share | ||||||||||||
Basic | ||||||||||||
Income from Continuing Operations | 0.45 | 0.52 | 0.44 | 0.50 | ||||||||
Net Income | 0.45 | 0.52 | 0.44 | 0.52 | ||||||||
Assuming Dilution | ||||||||||||
Income from Continuing Operations | 0.44 | 0.52 | 0.43 | 0.49 | ||||||||
Net Income | 0.44 | 0.52 | 0.43 | 0.51 | ||||||||
Items affecting the comparability of our financial results by quarter are as follows:
During the thirdThe fourth quarter of 2005, the Company recognized a loss2007 includes costs related to early retirement of $75.0debt of $55.6 million before tax and $51.6$36.1 million after tax related to a settlement agreement with the California Department of Insurance. In the third and first quarters of 2005, the Company recognized income tax benefits of $10.8 million and $32.0 million, respectively, related to the reduction of income tax liabilities. See Notes 8 and 15 for further discussion.tax.
During the fourthThe second quarter of 2004, the Company recognized a loss2007 includes claim reassessment charges of $127.0$53.0 million before tax and $87.8$34.5 million after tax related to the settlement of the multistate market conduct examination. During the secondtax.
The first quarter of 2004, the Company recognized a loss2007 income from discontinued operations includes an after-tax gain of $6.2 million on the sale of its Canadian branch discontinued operations of $113.0 million before tax and $70.9 million after tax. Additionally, during the first quarter of 2004, the Company recognized a loss of $967.0 million before tax and $701.0 million after tax related to the restructuring of its individual income protection – closed block business. GENEX.
See Notes 2, 14,6, and 158 for further discussion.discussion of the above items.
Index to Financial StatementsITEM 9. CHANGES IN AND DISAGREEMENTS WITH ACCOUNTANTS ON ACCOUNTING AND FINANCIAL DISCLOSURE |
None
| ITEM 9A. CONTROLS AND PROCEDURES |
Disclosure Controls and Procedures
As of December 31, 2005, an evaluation was performed underUnder the supervision and with the participation of the Company’sour management, including theour Chief Executive Officer and Chief Financial Officer, ofwe have evaluated the effectiveness of the Company’sour disclosure controls and procedures, as defined in Rule 13a-15(e) under the Securities Exchange Act of 1934, as amended.amended, as of the end of the period covered by this report. Based on that evaluation, the Company’s Chief Executive Officer and Chief Financial Officerthese officers concluded that the Company’sour disclosure controls and procedures were effective as of December 31, 2005.2008.
In the ordinary course of business, our internal control over financial reporting changes as we modify and enhance our processes and information technology systems to meet changing needs and increase our efficiency. Any significant changes in internal controls are evaluated prior to implementation to help maintain the continued effectiveness of our internal control. While changes have occurred in our internal controls during the quarter ended December 31, 2008, there were no changes that materially affected, or are reasonably likely to materially affect, our internal control over financial reporting.
Management’s Annual Report on Internal Control over Financial Reporting
The Company’s management is responsible for establishing and maintaining adequate internal control over financial reporting, as defined in Rule 13a-15(f) under the Securities Exchange Act of 1934, as amended. As of December 31, 2005,The Company’s internal control over financial reporting encompasses the processes and procedures management has established to (i) maintain records that, in reasonable detail, accurately and fairly reflect the Company’s managementtransactions and dispositions of assets; (ii) provide reasonable assurance that transactions are recorded as necessary to permit preparation of financial statements in accordance with U.S. generally accepted accounting principles; (iii) provide reasonable assurance that receipts and expenditures are appropriately authorized; and (iv) provide reasonable assurance regarding prevention or timely detection of unauthorized acquisition, use, or disposition of the Company’s assets that could have a material effect on the financial statements.
Because of its inherent limitations, internal control over financial reporting may not prevent or detect misstatements. In addition, any projection of the evaluation of effectiveness to future periods is subject to the risk that controls may become inadequate because of changes in conditions, or that the degree of compliance with the policies or procedures may deteriorate.
We assessed the effectiveness of the Company’sour internal control over financial reporting, based on criteria established inInternal Control – Integrated Framework issued by the Committee of Sponsoring Organizations of the Treadway Commission. The Company’s managementCommission, and concluded that, as of December 31, 2005,2008, we maintained effective internal control over financial reporting.
Attestation Report of the Company’s Registered Public Accounting Firm
Ernst & Young LLP, the independent registered public accounting firm that audited our consolidated financial statements included herein, audited the effectiveness of our internal control over financial reporting, as of December 31, 2008, and issued the attestation report included as follows.
Index to Financial Statements
Report of Independent Registered Public Accounting Firm
The Board of Directors and Stockholders
Unum Group and Subsidiaries
We have audited Unum Group and subsidiaries’ internal control over financial reporting as of December 31, 2008, based on criteria established inInternal Control—Integrated Framework issued by the Committee of Sponsoring Organizations of the Treadway Commission (the COSO criteria). Unum Group and subsidiaries’ management is responsible for maintaining effective internal control over financial reporting, and for its assessment of the effectiveness of internal control over financial reporting included in the accompanying “Management’s Annual Report on Internal Control over Financial Reporting.” Our responsibility is to express an opinion on the company’s internal control over financial reporting based on our audit.
We conducted our audit in accordance with the standards of the Public Company Accounting Oversight Board (United States). Those standards require that we plan and perform the audit to obtain reasonable assurance about whether effective internal control over financial reporting was maintained in all material respects. Our audit included obtaining an understanding of internal control over financial reporting, assessing the risk that a material weakness exists, testing and evaluating the design and operating effectiveness of internal control based on the assessed risk, and performing such other procedures as we considered necessary in the circumstances. We believe that our audit provides a reasonable basis for our opinion.
A company’s internal control over financial reporting is a process designed to provide reasonable assurance regarding the reliability of financial reporting and the preparation of financial statements for external purposes in accordance with generally accepted accounting principles. A company’s internal control over financial reporting includes those policies and procedures that (1) pertain to the maintenance of records that, in reasonable detail, accurately and fairly reflect the transactions and dispositions of the assets of the company; (2) provide reasonable assurance that transactions are recorded as necessary to permit preparation of financial statements in accordance with generally accepted accounting principles, and that receipts and expenditures of the company are being made only in accordance with authorizations of management and directors of the company; and (3) provide reasonable assurance regarding prevention or timely detection of unauthorized acquisition, use, or disposition of the company’s assets that could have a material effect on the financial statements.
Because of its inherent limitations, internal control over financial reporting may not prevent or detect misstatements. Also, projections of any evaluation of effectiveness to future periods are subject to the risk that controls may become inadequate because of changes in conditions, or that the degree of compliance with the policies or procedures may deteriorate.
In our opinion, Unum Group and subsidiaries maintained, in all material respects, effective internal control over financial reporting as statedof December 31, 2008, based on the COSO criteria.
We also have audited, in their report which is included herein in Item 8.
The effectivenessaccordance with the standards of the Company’s internal control over financial reporting and management’s assessment of that effectiveness,Public Company Accounting Oversight Board (United States), the consolidated balance sheets as of December 31, 2005, have been audited by Ernst & Young LLP, an independent registered public accounting firm, as stated in their report which is included herein in Item 8.
There has been no change2008 and 2007,and the related consolidated statements of income, stockholders’ equity, cash flows, and comprehensive income (loss) for each of the three years in the Company’s internal control over financial reporting, as defined in Rule 13a-15(f) under the Securities Exchange Act of 1934, as amended, during the quarterperiod ended December 31, 2005 that has materially affected, or is reasonably likely2008 of Unum Group and subsidiaries, and our report dated February 24, 2009 expressed an unqualified opinion thereon.
/s/ ERNST & YOUNG LLP
Chattanooga, Tennessee
February 24, 2009
Index to materially affect, the Company’s internal control over financial reporting.Financial Statements
| ITEM 9B. OTHER INFORMATION |
None
Index to Financial Statements
| ITEM 10. DIRECTORS, EXECUTIVE OFFICERS AND CORPORATE GOVERNANCE |
Directors
The information required by this Item with respect to a code of ethics for senior financial officers is included under the caption “Code of Business Practices and Ethics” of the Registrant’s Proxy Statement for the Annual Meeting of Stockholders to be held May 17, 2006, and is incorporated herein by reference. The Company will post on its website within the time period required by the rules and regulations of the Securities and Exchange Commission and the New York Stock Exchange any amendment to the code of ethics and any waiver applicable to its senior financial officers and its executive officers and trustees.
Executive Officers
The information required by this Item with respect to directors is included under the captionscaption “Election of Directors”,Directors,” sub-captions “Nominees for Election for Terms Expiring in 2009”,2012” and “Continuing Directors” ofin the Registrant’s Proxy Statement for the 2009 Annual Meeting of Stockholders to be held May 17, 2006, and is incorporated herein by reference.
The information required by this Item with respect to the audit committee and an audit committee financial expert is included under the caption “Audit Committee” of the Registrant’s Proxy Statement for the Annual Meeting of Stockholders to be held May 17, 2006, and is incorporated herein by reference.
The information required by this Item with respect to compliance with Section 16(a) of the Exchange Act is included under the caption “Section 16(a) Beneficial Ownership Reporting Compliance” ofin the Registrant’s Proxy Statement for the 2009 Annual Meeting of Stockholders to be held on May 17, 2006, and is incorporated herein by reference.
Executive OfficersThe information required by this Item with respect to a code of ethics for senior financial officers is included under the Registrant
caption “Corporate Governance,” sub-caption “Code of Business Practices and Ethics” in the Registrant’s Proxy Statement for the 2009 Annual Meeting of Stockholders and is incorporated herein by reference.
The information required by this Item with respect to the audit committee and an audit committee financial expert is included under the caption “Board and Committee Information and Membership” in the Registrant’s Proxy Statement for the 2009 Annual Meeting of Stockholders and is incorporated herein by reference.
The information required by this Item with respect to executive officers of the Company, allregistrant is incorporated by reference to “Executive Officers of whomthe Registrant” contained herein in Item 1.
Corporate Governance
Our internet website address iswww.unum.com. We have adopted corporate governance guidelines, a code of business practices and ethics, and charters for Unum Group’s board of directors’ audit, human capital, governance, finance, and regulatory compliance committees in accordance with NYSE requirements. These documents are alsoavailable free of charge on the website and in print at the request of any stockholder from the Office of the Corporate Secretary, 1 Fountain Square, Chattanooga, Tennessee, 37402, or by calling toll-free 1-800-718-8824. Within the time period required by the Securities and Exchange Commission and the New York Stock Exchange, we will post on our website any amendment to the “Code of Business Practices and Ethics” and any waiver applicable to any executive officers of certain principal subsidiaries,officer, director, or senior financial officer (as defined in the Code).
Changes to Procedures for Recommending Director Nominees
On May 22, 2008, our bylaws were electedamended to serve for one year or until their successors are chosen and qualified.include changes to the procedures by which our stockholders may recommend director nominees. These changes were as follows:
|
| |||
Mr. Watjen became President and Chief Executive Officer in March 2003. He served as Vice Chairman and Chief Operating OfficerThe time period for timely submission by stockholders of notice of director nominations was changed from May 2002 until March 2003. He became Executive Vice President, Finance in June 1999 and assumed the additional Risk Management responsibilities in November 1999. Prior60 to 90 days prior to the merger, heannual meeting of stockholders to 75 to 120 days prior to the first anniversary of the preceding year’s annual meeting of stockholders. In addition, the amended bylaws provide that if the date of the annual meeting is more than 30 days before or more than 70 days after the first anniversary of the preceding year’s annual meeting, such notice will be timely if submitted not earlier than the close of business on the 120th day prior to such annual meeting and not later than the close of business on the later of the 75th day prior to such annual meeting or the 10th day following the day on which we first make public announcement of the date of such meeting. Previously, if less than 75 days’ notice or prior public disclosure of the date of the annual meeting was Vice Chairmangiven or made to stockholders, such notices would have been timely if received not later than the close of business on the 15th day following the day on which notice of the date of the annual meeting was mailed or such public disclosure was first made. Public announcement of an adjournment or postponement of an annual meeting will not commence a new time period (or extend any time period) for the giving of any such stockholder’s notice.
Index to Financial Statements
A similar requirement was added with respect to the timely submission by stockholders of notice of director nominations if we call a special meeting of stockholders for the purpose of electing one or more directors to Unum Group’s board of directors. In this event, notice by a stockholder entitled to vote at such election of any nominees for election to such positions must be submitted not earlier than the close of business on the 120th day prior to such special meeting and Chief Financial Officernot later than the close of Provident, positions he assumed in March 1997. Mr. Watjen became Executive Vice Presidentbusiness on the later of the 75th day prior to such special meeting or the 10th day following the day on which public announcement is first made of the date of the special meeting and Chief Financial Officerof the nominees proposed by Unum Group’s board of directors to be elected at such meeting. Public announcement of an adjournment or postponement of a Provident predecessor companyspecial meeting will not commence a new time period (or extend any time period) for the giving of any such stockholder’s notice.
The information required to be set forth in July 1994.
Mr. Zubretsky became Senior Executive Vice President, Finance, Investments,a stockholder’s notice of a director nomination was expanded and Corporate Development in March 2005. Priorclarified to joininginclude (i) the Company, he served as president and chief executive officerwritten consent of GAB Robins Group and a partner with Brera Capital Partners since 1999. From 1997any such nominee to 1999 he was executive vice president and chief financial officer of MassMutual Financial Group and, from 1996 to 1997 chief financial officer of Healthsource, Inc. Mr. Zubretsky was a partnerbeing named in the Insurance Industry Groupproxy statement as a nominee and to serving as a director if elected; (ii) the name and address of Coopers & Lybrand LLPrecord of any stockholder associated person (as defined in the bylaws) on whose behalf the nomination is made, and the name and address of record of any person that owns and controls, directly or indirectly, 10% or more of any class of securities or interests in such stockholder associated person; (iii) the class and number of our shares which are owned beneficially or of record by the stockholder and any stockholder associated person, including with the notice documentary evidence of any such record and beneficial ownership; (iv) any derivative positions held or beneficially held by the stockholder and any stockholder associated person, and whether and the extent to which any hedging or other transaction or series of transactions has been entered into by or on behalf of, or any other agreement, arrangement or understanding (including any short positions or any borrowing or lending of shares of stock) has been made, the effect or intent of which is to mitigate loss to or manage risk of stock price changes for, or to increase the voting power of, such stockholder or stockholder associated person with respect to any share of our stock; and (v) a representation whether the stockholder or stockholder associated person intends or is part of a group which intends to (a) deliver a proxy statement and/or form of proxy to holders of at least the percentage of our outstanding capital stock required to approve or adopt the proposal and/or (b) otherwise to solicit proxies from 1990the stockholders in support of such proposal.
The addition of a requirement that, unless otherwise required by law, the stockholder or a qualified representative of the stockholder (as defined in the bylaws) appear at the annual or special meeting of stockholders to 1996.
Mr. Glick became Executive Vice President and General Counselpresent a director nomination in September 2005. Priororder for such nomination to joining the Company, he was the principalbe transacted, notwithstanding that we may have received proxies in respect of Orchard Equity, Inc., from 2003 to 2005. Mr. Glick was formerly deputy general counsel for Bank One Corporation from 2001 to 2003 and previously was a founding partner of Hedlund Hanley & John.such vote.
Mr. Best became Executive Vice President, Service Operations and Chief Information Officer in January 2006. Prior to that time, he served as Executive Vice President, The Client Services Center, and Chief Information Officer from May 2003. He served as Senior Vice President, Customer Loyalty Services, and Chief Information Officer from March 2000 until May 2003. Following the merger with Unum he became Senior Vice President, Customer Service in June 1999. Prior to the merger he served as Executive Vice President, Customer Service, and Chief Information Officer of Provident beginning in May 1997. Mr. Best joined a Provident predecessor company as Senior Vice President and Chief Information Officer in July 1994.
Mr. Edgren became Executive Vice President, Field Sales in July 2004. Prior to joining the Company, he served as Branch Manager of Palmer & Cay from April 2004 until July 2004 and Managing Director of Marsh, Inc. from October 1986 until April 2004.
Mr. Greving was named Executive Vice President and Chief Financial Officer in May 2003 and appointed Chief Actuary in August 2005. He served as Senior Vice President and Chief Financial Officer from May 2002 until May 2003. Prior to that time he served as Senior Vice President, Finance from August 2000. He joined Provident as Senior Vice President and Chief Actuary in April 1997. Prior to joining Provident, Mr. Greving was Executive Vice President and Chief Actuary of Southwestern Financial Services, Corp. from June 1990 until March 1997.
Mr. Horn became President and Chief Executive Officer of Colonial Life & Accident Insurance Company in March 2004. Prior to joining the Company, he served as Executive Vice President of Mutual of Omaha Insurance Company from September 1981 until September 2003.
Mr. McCarthy was named Executive Vice President, Risk Operations in January 2006. He previously served as Executive Vice President, Underwriting from May 2003. He served as Senior Vice President, Underwriting from November 2001 until May 2003 and as Senior Vice President, Marketing, Product Development, and International from December 1999 until November 2001. Prior to that time he served as Senior Vice President and Managing Director of Unum Japan. Mr. McCarthy originally joined a Unum predecessor company in 1976.
Ms. Ring was named Chairman and Managing Director of Unum Limited in December 2002. She served as Operations Director from 1999 until 2002 and prior to that time was Director of Risk Management. Ms. Ring joined Unum Limited as Director of Customer Services in 1995. Prior to joining Unum Limited, she served as Head of Customer Services for Private Patients Plan.
| ITEM 11. EXECUTIVE COMPENSATION |
The information required by this Item is included under the captions “Compensation of Directors”,Directors,” “Report of the Board CompensationHuman Capital Committee, on Executive Compensation”, “Executive Compensation”,” “Compensation Discussion and “Company Performance” ofAnalysis,” and “Board and Committee Information and Membership,” sub-captions “Human Capital Committee” and “Human Capital Committee Interlocks and Insider Participation” in the Registrant’s Proxy Statement for the 2009 Annual Meeting of Stockholders to be held May 17, 2006, and is incorporated herein by reference.
Index to Financial StatementsITEM 12. SECURITY OWNERSHIP OF CERTAIN BENEFICIAL OWNERS AND MANAGEMENT AND RELATED STOCKHOLDER MATTERS |
Equity Compensation Plan Information
The following table gives information as of December 31, 20052008 about the common stock that may be issued under all of the Company’s existing equity compensation plans. The table does not include information with respect to shares subject to outstanding options granted under equity compensation plans assumed by the Company in connection with mergers and acquisitions of the companies that originally granted those options (see footnote 5).
Plan Category | (a) Number of securities to be issued upon exercise of outstanding options, warrants and rights | (b) Weighted-average exercise price of outstanding options, warrants and rights | (c) Number of securities remaining available for future issuance under equity compensation plans (excluding securities reflected in column (a)) | (a) Number of securities to be issued upon exercise of outstanding options, warrants and rights | (b) Weighted-average exercise price of outstanding options, warrants and rights | (c) Number of securities remaining available for future issuance under equity compensation plans (excluding securities reflected in column (a)) | |||||||||
Equity Compensation Plans Approved by Stockholders | 8,717,947 | (1) | $ | 31.6784 | 9,132,646 | (2) | 4,620,494(1) | $32.66 | 30,632,745(2) | ||||||
Equity Compensation Plans Not Approved by Stockholders | 3,319,915 | (3) | $ | 26.6230 | 1,479,779 | (4) | 2,482,158(3) | $26.77 | 524,500(4) | ||||||
Total | 12,037,862 | 10,612,425 | 7,102,652 | 31,157,245 | |||||||||||
| (1) | Includes the following plans: (a) |
| (2) | Includes shares under the following plans: (a) Stock Incentive Plan of 2007, (b) Stock Plan of 1999, |
| (3) | Includes the following plans: (a) |
| (4) | Includes the following plans: (a) UnumProvident Corporation Broad Based Stock Plan of 2001, (b) UnumProvident Corporation Broad Based Stock Plan of 2002, (c) Unum Limited Savings-Related Share Option Scheme 2000, |
| (5) | The table does not include information for the following equity compensation plans assumed by the Company in connection with the merger of the company that originally established those plans: the UNUM Corporation 1990 Long-Term Incentive Plan, |
Below is a brief description of the equity compensation plans not approved by stockholders:
Provident Companies, Inc. Employee Stock Option Plan of 1998
This plan provided for the award of stock options to employees not eligible for awards under another incentive compensation plan and, therefore, excluded all officers of the Company from participation. One hundred options and fifty options were granted respectively to each full time and part-time employee participant. The total number of options available for grant under this plan was 255,500. The plan terminated December 31, 1998. The plan was administered by the Compensation Committee of the Board of Directors (Compensation Committee). The stock options issued under the plan are non-qualified for U.S. tax purposes. The exercise price of options awarded under this plan was the fair market value of the stock on the date of grant. There are provisions for early vesting and/or early termination of the options in the event of retirement, death and disability and termination of employment. The options outstanding as of June 30, 1999 vested in accordance with the provision of this plan effective with the merger of Unum Corporation with Provident Companies, Inc. There are provisions for adjustments to the number of shares available for grants, number of shares subject to outstanding grants and the exercise price of outstanding grants in the event of stock splits, stock dividends or other recapitalization.
UnumProvident Corporation Employee Stock Option Plan (1999)
This plan provided for the award of stock options to employees not eligible for awards under the other stock plans of the Company or at or below a position level as determined by the Compensation Committee, and therefore excluded all officers of the Company from participation. One hundred and fifty options and seventy-five options were granted respectively
Index to Financial Statements
to each full time and part-time employee participant.participant, respectively. The total number of options available for grant under this plan was 3,500,000. This plan was terminated in February 2002. This plan was administered by the Compensation Committee. The stock options issued under the plan are non-qualified for U.S. tax purposes. The exercise price of options awarded under this plan was the fair market value of the stock on the date of grant. There are provisions for early vesting and/or early termination of the options in the event of retirement, death, disability and termination of employment. The plan also provides for acceleration of vesting if there is a change in control, subject to certain limitations, and in other circumstances at the Committee’s discretion. There are provisions for adjustments to the number of shares available for grants, number of shares subject to outstanding grants and the exercise price of outstanding grants in the event of stock splits, stock dividends or other recapitalization.
UnumProvident Corporation Broad Based Stock Plan of 2001
This plan provides for the grant of stock options to employees, officers, consultants, producers (as defined in the plan) and directors of the Company. The plan specifically prohibits the granting of any options under the plan to members of the Company’s Board of Directors and to any “officer” of the Company as defined in Rule 16a-1(f) under the 1934 Act or such other definition of the term “officer” as the New York Stock Exchange may subsequently adopt for purposes of its “broad-based” requirements of Rule 312.03 of NYSE Listed Company Manual. No awards have been made under the plan to employees above the level of Vice President. The total number of options available for grant under this plan was 2,000,000. This plan was terminated in December 2007. The stock options are non-qualified for U.S. tax purposes. The exercise price of options awarded under this plan is the fair market value of the stock on the date of grant. The term of any option issued under the plan cannot exceed ten years. There are provisions for early vesting and/or early termination of the options in the event of retirement, death, disability and termination of employment. The plan also provides for acceleration of vesting if there is a change in control, subject to certain limitations, and in other circumstances at the Committee’s discretion. The plan includes provisions for adjustments to the number of shares available for grants, number of shares subject to outstanding grants and the exercise price of outstanding grants in the event of stock splits, stock dividends or other recapitalization.
UnumProvident Corporation Broad Based Stock Plan of 2002
This plan provides for the grant of stock options to employees, officers, consultants, producers (as defined in the plan) and directors of the Company. The plan specifically prohibits the granting of any options under the plan to members of the Company’s Board of Directors and to any “officer” of the Company as defined in Rule 16a-1(f) under the 1934 Act or such other definition of the term “officer” as the New York Stock Exchange may subsequently adopt for purposes of its “broad-based” requirements of Rule 312.03 of NYSE Listed Company Manual. No awards have been made under the plan to employees above the level of Vice President. The total number of options available for grant
under this plan was 2,390,000. The plan was terminated in February 2004. The stock options are non-qualified for U.S. tax purposes. The exercise price of options awarded under this plan is the fair market value of the stock on the date of grant. The term of any option issued under the plan cannot exceed ten years. There are provisions for early vesting and/or early termination of the options in the event of retirement, death, disability and termination of employment. The plan also provides for acceleration of vesting if there is a change in control, subject to certain limitations, and in other circumstances at the Committee’s discretion. The plan includes provisions for adjustments to the number of shares available for grants, number of shares subject to outstanding grants and the exercise price of outstanding grants in the event of stock splits, stock dividends or other recapitalization.
UnumProvident Corporation Stock Award Recognition Plan of 2002
This plan provides for the grant of stock awards
Index to employees of the Company who are at or below the level of Vice President and who are not officers, directors or otherwise considered to be affiliates of the Company within the meaning of Rule 144 of the Securities Act of 1933. The plan is administered by the Chief Executive Officer. The total number of shares available for grant under this plan was 25,000. Stock awarded under the plan may be subject to restrictions. There are provisions for early vesting and/or early termination of restrictions in the event of retirement, death, disability and termination of employment. The plan also provides for restrictions on awards to lapse if there is a change in control, subject to certain limitations, and in other circumstances at the CEO’s discretion. The plan includes provisions for adjustments to the number of shares available for grants, and the number of shares subject to outstanding grants in the event of stock splits, stock dividends or other recapitalization.Financial Statements
Unum Limited Savings-Related Share Option PlanScheme 2000
This plan of the Company’s subsidiary, Unum Limited, in the United Kingdom allows employees of Unum Limited to acquire options for shares of the Company’sUnum Group common stock by making an election to purchase stock at a price of at least 80% of the market value of the stock on the date prior to the date the invitation to apply for the option is made or, if greater, the nominal value of a share (the Acquisition Price). The total number of options available for grant under this plan was 200,000. The maximum contribution per month per employee is £150. Contributions are made for a three year period at the end of which the employee can elect to receive cash plus interest or purchase shares at the Acquisition Price. The directors of Unum Limited are the administrators of the plan. There are provisions for early expiration of options in the event of termination of employment and acceleration of vesting and expiration due to death, disability or retirement. The plan also provides for acceleration of vesting upon a change of control, reconstruction or voluntary winding up of the Company. The plan includes provisions for adjustments to the number of shares available for grants, and the number of shares subject to outstanding grants in the event of capitalization, consolidation sub-division or reduction or other variation of the share capital of the Company.
UNUM Corporation 1998 Goals Stock Option Plan
This plan which was assumed by the Company pursuant to the merger, provided for the grant in 1995 of three hundred options to employees below the level of Vice President. Employees who were hired in 1996 and 1997 automatically received two hundred and one hundred options respectively. The vesting of the options was contingent on meeting specified “1998 Goals”, long term goals established at the time the plan was adopted. The Chief Executive Officer was the administrator of the plan. The total number of options available for grant under this plan was 3,000,000. No new grants could be made under the plan after 1997. The exercise price of options awarded under this plan was the fair market value of the stock on the date of grant. There are provisions for early vesting and/or early termination of the options in the event of retirement, death and disability and termination of employment. The plan also provides for acceleration of vesting if there is a change in control. The plan includes provisions for adjustments to the number of shares available for grants, number of shares subject to outstanding grants and the exercise price of outstanding grants in the event of stock splits, stock dividends or other recapitalization.
UnumProvident Corporation Amended and Restated Non-Employee Director Compensation Plan of 2004
This plan provides for the payment of compensation to the non-employee directors who serve on the Company’s Board. Non-employee directors receive an annual retainer of $80,000, the chair of the Audit Committee receives a supplemental retainer of $15,000 annually, and each of the other chairs of the standing committees receive an additionalannual supplemental retainer of $7,500, and all directors receive $2,000 for each meeting attended in person and $500 for each conference call meeting of the Board and of the committees on which they participate, including special committees.
Under the plan, directors make an irrevocable election each year to receive all or a portion of their retainers and meeting fees in either cash or deferred share rights. A deferred share right is a right to receive one share of common stock on the earlier of (i) the director’s termination ofseparation from service as a director of the Company, or (ii) another designated date at least three years after the date of the deferral election. The number of deferred share rights granted is calculated as the number of whole shares equal to (i) the dollar amount of the annual retainer and/or fees that the director elects to have paid in deferred share rights, divided by (ii) the fair market value per share on the grant date. The aggregate number of shares which can be issued under the plan is 500,000. The plan is administered by the Compensation Committee. The plan includes provisions restricting the transferability of the deferred share rights, provisions for adjustments to the number of shares available for grants, and the number of shares subject to outstanding grants in the event of recapitalization, reclassification, stock split, reverse stock split, reorganization, merger, consolidation, or other similar corporate transaction. There are stock ownership guidelines for participants under the plan.
Other information required by this Item is included under the captions, “Beneficial Ownership of Company Securities,” and “Security Ownership of Directors and Officers” of the Registrant’s Proxy Statement for the Annual Meeting of Stockholders to be held May 17, 2006,21, 2009 and is incorporated herein by reference.
Index to Financial StatementsITEM 13. CERTAIN RELATIONSHIPS AND RELATED TRANSACTIONS AND DIRECTOR INDEPENDENCE The information required by this Item with respect to certain relationships and related transactions and director independence is included under the caption “Corporate Governance,” sub-captions “Independence of Directors,” “Our Related Party Transaction Policy,” and “Transactions with Related Persons” in the Registrant’s Proxy Statement for the 2009 Annual Meeting of Stockholders and is incorporated by reference herein. |
None
Audit Fees
The aggregate fees and expenses related to professional services rendered by Ernst & Young LLP for the fiscal year audit of the Company’sour annual financial statements and internal control over financial reporting, the interim reviews of the financial statements included in the Company’sour quarterly reports on Form 10-Q, and services provided in connection with statutory and regulatory filings were $7,351,793$7,137,250 and $7,483,874,$7,806,624, respectively, for fiscal years 20052008 and 2004.2007.
Audit Related Fees
The aggregate fees and expenses related to professional services rendered by Ernst & Young LLP for audit related services, comprised primarily of accounting consultations, SAS 70 reviews, and audit related services for the Company’sour employee benefit plans, for fiscal years 20052008 and 20042007 were $703,203$477,888 and $689,386,$523,073, respectively.
Tax Services Fees
The aggregate fees and expenses related to professional services rendered by Ernst & Young LLP for tax compliance, tax advice, and tax planning during fiscal years 20052008 and 20042007 were $440,078$48,509 and $39,051,$22,500, respectively.
All Other Fees
There were no fees billed during fiscal years 2008 or 2007 for products or services other than those reported above for audit, audit related, and tax services.
Audit Committee Pre-approval Policies
The audit committee of the Company’sUnum Group’s board of directors is directly responsible for the appointment, compensation, retention, and oversight of the independent auditors. As part of its responsibility, the audit committee has adopted a policy that requires advance approval of all audit, audit-related, tax services, and other services performed by the independent auditor. The policy provides for setting pre-approval limits for specifically defined audit and non-audit services. In pre-approving the services, the audit committee considers whether such services are consistent with SEC rules on auditor independence. Specific approval by the audit committee will be required if fees for any particular service or aggregate fees for services of a similar nature exceed the pre-approved limits. The audit committee has delegated to the chair of the audit committee authority to approve permitted services provided that the chair reports any decisions to the committee at its next scheduled meeting.
Index to Financial Statements
ITEM 15. EXHIBITS AND FINANCIAL STATEMENT SCHEDULES
Index to Financial Statements
Pursuant to the requirements of Section 13 or 15(d) of the Securities Exchange Act of 1934, the Registrant has duly caused this report to be signed on its behalf by the undersigned, thereunto duly authorized.
| ||
| (Registrant) | ||
| By: | /s/ Thomas R. Watjen | |
Thomas R. Watjen | ||
President and Chief Executive Officer | ||
Date: |
| |
Pursuant to the requirements of the Securities Exchange Act of 1934, this report has been signed below by the following persons on behalf of the registrant and in the capacities and on the dates indicated.
Name | Title | Date | ||
/s/ Thomas R. Watjen | President and Chief | |||
| Thomas R. Watjen | Executive Officer and a Director | February 24, 2009 | ||
| (principal executive officer) | ||||
/s/ Robert C. Greving | Executive Vice President, Chief | |||
| Robert C. Greving | Financial Officer and Chief Actuary | February 24, 2009 | ||
| (principal financial officer and | ||||
| principal accounting officer) | ||||
*
| Director | |||
| E. Michael Caulfield | February 24, 2009 | |||
*
| Director | |||
| Jon S. Fossel | February 24, 2009 | |||
*
| Director | |||
| Pamela H. Godwin | February 24, 2009 | |||
*
| Director | |||
| Ronald E. Goldsberry | February 24, 2009 | |||
*
| Director | |||
| Kevin T. Kabat | February 24, 2009 | |||
* | Director | |||
| Thomas Kinser | February 24, 2009 | |||
| Director | |||
| Gloria C. Larson | February 24, 2009 | |||
Index to Financial Statements
Name | Title | Date | ||
*
| Director | |||
| A. S. MacMillan, Jr. | February 24, 2009 | |||
*
| Director | |||
| Edward J. Muhl | February 24, 2009 | |||
*
| Director | |||
| Michael J. Passarella | February 24, 2009 | |||
*
| Director | |||
| William J. Ryan | February 24, 2009 | |||
| ||||
* By: /s/ Susan N. Roth
| For all of the Directors | |||
| Susan N. Roth | February 24, 2009 | |||
| Attorney-in-Fact | ||||
Index to Financial Statements
SCHEDULE I—SUMMARYI--SUMMARY OF INVESTMENTS –
OTHER THAN INVESTMENTS IN RELATED PARTIES
UnumProvident CorporationUnum Group and Subsidiaries
Type of Investment | Cost | Fair Value | Amount at which shown in the balance sheet | Cost or Amortized Cost (1) | Fair Value | Amount at which shown in the balance sheet | ||||||||||||||
| (in millions of dollars) | (in millions of dollars) | |||||||||||||||||||
Available-for-Sale Fixed Maturity Securities: | ||||||||||||||||||||
Fixed Maturity Securities: | ||||||||||||||||||||
Bonds | ||||||||||||||||||||
United States Government and Government Agencies and Authorities | $ | 2,487.9 | $ | 2,602.6 | $ | 2,602.6 | $ | 1,591.9 | $ | 1,724.2 | $ | 1,724.2 | ||||||||
States, Municipalities, and Political Subdivisions | 61.0 | 64.2 | 64.2 | 167.7 | 164.6 | 164.6 | ||||||||||||||
Foreign Governments | 689.8 | 814.3 | 814.3 | 945.7 | 1,045.5 | 1,045.5 | ||||||||||||||
Public Utilities | 4,256.2 | 4,600.9 | 4,600.9 | 5,896.2 | 5,407.4 | 5,407.4 | ||||||||||||||
Mortgage/Asset-Backed Securities | 4,177.3 | 4,431.3 | 4,431.3 | 3,691.7 | 3,945.5 | 3,945.5 | ||||||||||||||
Derivative Instruments | 15.9 | 263.6 | 263.6 | |||||||||||||||||
All Other Corporate Bonds | 20,226.0 | 21,924.5 | 21,924.5 | 21,728.7 | 19,638.8 | 19,638.8 | ||||||||||||||
Redeemable Preferred Stocks | 148.0 | 155.4 | 155.4 | 385.7 | 208.1 | 208.1 | ||||||||||||||
Total | 32,062.1 | $ | 34,856.8 | 34,856.8 | 34,407.6 | $ | 32,134.1 | 32,134.1 | ||||||||||||
Equity Securities: | ||||||||||||||||||||
Common Stocks | 11.2 | $ | 11.5 | 11.5 | ||||||||||||||||
Nonredeemable Preferred Stocks | 2.1 | 2.1 | 2.1 | |||||||||||||||||
Total | 13.3 | $ | 13.6 | 13.6 | ||||||||||||||||
Mortgage Loans | 739.4 | 739.4 | 1,274.8 | 1,274.8 | ||||||||||||||||
Real Estate Acquired in Satisfaction of Debt | 18.9 | 6.5 | * | |||||||||||||||||
Other Real Estate | 16.1 | 11.7 | * | |||||||||||||||||
Policy Loans | 3,201.4 | 3,201.4 | 2,753.8 | 2,753.8 | ||||||||||||||||
Other Long-term Investments | 117.5 | 109.2 | * | |||||||||||||||||
Derivatives | - | 381.8 | (2) | |||||||||||||||||
Miscellaneous Long-term Investments | 121.4 | 138.3 | (3) | |||||||||||||||||
Short-term Investments | 417.9 | 417.9 | 1,183.1 | 1,183.1 | ||||||||||||||||
| $ | 36,586.6 | $ | 39,356.5 | |||||||||||||||||
| $ | 39,740.7 | $ | 37,865.9 | |||||||||||||||||
| Amortized cost for fixed maturity securities and mortgage loans represents original cost reduced by repayments, write-downs from other-than-temporary declines in fair value, amortization of premiums, and accretion of discounts. |
| (2) | Derivatives are carried at fair value. |
| (3) | Difference between cost and carrying value primarily results from |
Index to Financial Statements
SCHEDULE II—CONDENSEDII--CONDENSED FINANCIAL INFORMATION OF REGISTRANT
UnumProvident CorporationUnum Group (Parent Company)
STATEMENTS OF FINANCIAL CONDITIONBALANCE SHEETS
| December 31 | ||||||||
| 2005 | 2004 | |||||||
| (in millions of dollars) | ||||||||
ASSETS | ||||||||
Fixed Maturity Securities Available-for-Sale—at fair value (amortized cost: $400.6; $85.8) | $ | 399.1 | $ | 85.8 | ||||
Short-term Investments | 211.0 | 185.0 | ||||||
Investment in Subsidiaries | 9,678.9 | 10,160.6 | ||||||
Surplus Notes of Subsidiaries | 250.0 | 250.0 | ||||||
Other Assets | 370.9 | 376.9 | ||||||
Total Assets | $ | 10,909.9 | $ | 11,058.3 | ||||
LIABILITIES AND STOCKHOLDERS’ EQUITY | ||||||||
LIABILITIES | ||||||||
Short-term Debt from Subsidiaries | $ | 42.9 | $ | 123.0 | ||||
All Other Short-term Debt | — | 227.0 | ||||||
Long-term Debt | 2,862.0 | 2,862.0 | ||||||
Other Liabilities | 641.1 | 622.2 | ||||||
Total Liabilities | 3,546.0 | 3,834.2 | ||||||
STOCKHOLDERS’ EQUITY | ||||||||
Common Stock | 30.1 | 29.8 | ||||||
Additional Paid-in Capital | 1,627.9 | 1,588.4 | ||||||
Accumulated Other Comprehensive Income | 1,163.5 | 1,481.1 | ||||||
Retained Earnings | 4,610.4 | 4,185.5 | ||||||
Treasury Stock | (54.2 | ) | (54.2 | ) | ||||
Deferred Compensation | (13.8 | ) | (6.5 | ) | ||||
Total Stockholders’ Equity | 7,363.9 | 7,224.1 | ||||||
Total Liabilities and Stockholders’ Equity | $ | 10,909.9 | $ | 11,058.3 | ||||
| December 31 | ||||||
| 2008 | 2007 | |||||
| (in millions of dollars) | ||||||
Assets | ||||||
Fixed Maturity Securities - at fair value (amortized cost: $65.3; $463.2) | $ | 61.9 | $ | 490.0 | ||
Short-term Investments | 254.9 | 361.5 | ||||
Investment in Subsidiaries | 7,537.8 | 8,598.4 | ||||
Surplus Note of Subsidiary | - | 100.0 | ||||
Other Assets | 527.8 | 435.7 | ||||
Total Assets | $ | 8,382.4 | $ | 9,985.6 | ||
Liabilities and Stockholders’ Equity | ||||||
Liabilities | ||||||
Short-term Debt | $ | 132.2 | $ | 175.0 | ||
Long-term Debt | 1,119.5 | 1,269.5 | ||||
Other Liabilities | 732.8 | 501.2 | ||||
Total Liabilities | 1,984.5 | 1,945.7 | ||||
Stockholders’ Equity | ||||||
Common Stock | 36.3 | 36.3 | ||||
Additional Paid-in Capital | 2,546.9 | 2,516.9 | ||||
Accumulated Other Comprehensive Income (Loss) | (958.2) | 463.5 | ||||
Retained Earnings | 5,527.1 | 5,077.4 | ||||
Treasury Stock | (754.2) | (54.2) | ||||
Total Stockholders’ Equity | 6,397.9 | 8,039.9 | ||||
Total Liabilities and Stockholders’ Equity | $ | 8,382.4 | $ | 9,985.6 | ||
See notes to condensed financial information.
Index to Financial Statements
SCHEDULE II—CONDENSEDII--CONDENSED FINANCIAL INFORMATION OF REGISTRANT (Continued)
UnumProvident CorporationUnum Group (Parent Company)
STATEMENTS OF OPERATIONSINCOME
| Year Ended December 31 | ||||||||||||
| 2005 | 2004 | 2003 | ||||||||||
| (in millions of dollars) | ||||||||||||
Dividends from Subsidiaries | $ | 784.2 | $ | 201.1 | $ | 62.6 | ||||||
Interest from Subsidiaries | 21.1 | 21.0 | 20.8 | |||||||||
Other Income | 63.0 | 56.3 | 55.2 | |||||||||
Total Revenue | 868.3 | 278.4 | 138.6 | |||||||||
Interest and Debt Expense | 207.9 | 209.7 | 191.6 | |||||||||
Other Expenses | 14.5 | 24.8 | 45.1 | |||||||||
Total Expenses | 222.4 | 234.5 | 236.7 | |||||||||
Income (Loss) Before Income Tax and Equity in Undistributed Loss of Subsidiaries | 645.9 | 43.9 | (98.1 | ) | ||||||||
Income Tax Benefit | (55.2 | ) | (9.0 | ) | (47.7 | ) | ||||||
Income (Loss) Before Equity in Undistributed Loss of Subsidiaries | 701.1 | 52.9 | (50.4 | ) | ||||||||
Equity in Undistributed Loss of Subsidiaries | (187.5 | ) | (305.9 | ) | (336.0 | ) | ||||||
Net Income (Loss) | $ | 513.6 | $ | (253.0 | ) | $ | (386.4 | ) | ||||
| Year Ended December 31 | |||||||||
| 2008 | 2007 | 2006 | |||||||
| (in millions of dollars) | |||||||||
Dividends from Subsidiaries | $ | 684.2 | $ | 1,839.3 | $ | 387.1 | |||
Interest from Subsidiaries | 6.6 | 11.8 | 24.3 | ||||||
Other Income | 62.5 | 74.6 | 71.9 | ||||||
Total Revenue | 753.3 | 1,925.7 | 483.3 | ||||||
Interest and Debt Expense | 95.6 | 198.2 | 186.4 | ||||||
Other Expenses | 22.7 | 40.1 | 17.8 | ||||||
Total Expenses | 118.3 | 238.3 | 204.2 | ||||||
Income Before Income Tax and Equity in Undistributed Earnings (Loss) of Subsidiaries | 635.0 | 1,687.4 | 279.1 | ||||||
Income Tax (Benefit) | 24.1 | (20.6) | (20.3) | ||||||
Income Before Equity in Undistributed Earnings (Loss) of Subsidiaries | 610.9 | 1,708.0 | 299.4 | ||||||
Equity in Undistributed Earnings (Loss) of Subsidiaries | (57.7) | (1,028.7) | 111.6 | ||||||
Net Income | $ | 553.2 | $ | 679.3 | $ | 411.0 | |||
See notes to condensed financial information.
Index to Financial Statements
SCHEDULE II—CONDENSEDII--CONDENSED FINANCIAL INFORMATION OF REGISTRANT (Continued)
UnumProvident CorporationUnum Group (Parent Company)
STATEMENTS OF CASH FLOWS
| Year Ended December 31 | ||||||||||||
| 2005 | 2004 | 2003 | ||||||||||
| (in millions of dollars) | ||||||||||||
CASH PROVIDED BY OPERATING ACTIVITIES | $ | 767.3 | $ | 168.8 | $ | 25.3 | ||||||
CASH FLOWS FROM INVESTING ACTIVITIES | ||||||||||||
Purchases of Short-term Investments | (26.0 | ) | (104.6 | ) | (80.4 | ) | ||||||
Net Sales (Purchases) of Fixed Maturity Securities | (314.8 | ) | (85.8 | ) | 9.9 | |||||||
Cash Distributions to Subsidiaries | (5.1 | ) | (80.2 | ) | (540.4 | ) | ||||||
Disposition of Business | — | 18.8 | — | |||||||||
Other | (20.8 | ) | (27.6 | ) | (29.6 | ) | ||||||
CASH USED BY INVESTING ACTIVITIES | (366.7 | ) | (279.4 | ) | (640.5 | ) | ||||||
CASH FLOWS FROM FINANCING ACTIVITIES | ||||||||||||
Net Short-term Repayments to Subsidiaries | (80.1 | ) | (78.9 | ) | (371.9 | ) | ||||||
Net Short-term Debt Repayments | (227.0 | ) | — | (20.0 | ) | |||||||
Issuance of Long-term Debt | — | 300.0 | 575.0 | |||||||||
Issuance of Common Stock | 18.1 | 5.7 | 551.9 | |||||||||
Dividends Paid to Stockholders | (88.7 | ) | (88.4 | ) | (98.1 | ) | ||||||
Other | (21.2 | ) | (27.9 | ) | (24.5 | ) | ||||||
CASH PROVIDED (USED) BY FINANCING ACTIVITIES | (398.9 | ) | 110.5 | 612.4 | ||||||||
INCREASE (DECREASE) IN CASH | $ | 1.7 | $ | (0.1 | ) | $ | (2.8 | ) | ||||
| Year Ended December 31 | |||||||||
| 2008 | 2007 | 2006 | |||||||
| (in millions of dollars) | |||||||||
Cash Provided by Operating Activities | $ | 564.7 | $ | 946.0 | $ | 117.4 | |||
Cash Flows from Investing Activities | |||||||||
Proceeds from Sales of Available-for-Sale Securities | 443.6 | 239.7 | 250.4 | ||||||
Proceeds from Maturities of Available-for-Sale Securities | 2.2 | 15.8 | 5.1 | ||||||
Purchases of Available-for-Sale Securities | (1.7) | (15.1) | - | ||||||
Net Sales (Purchases) of Short-term Investments | 106.6 | (287.6) | 137.1 | ||||||
Cash Distributions to Subsidiaries | (123.7) | (288.5) | (340.6) | ||||||
Surplus Note Redeemed by Subsidiary | 45.2 | - | 150.0 | ||||||
Other, Net | (46.8) | (44.1) | (34.3) | ||||||
Cash Provided (Used) by Investing Activities | 425.4 | (379.8) | 167.7 | ||||||
Cash Flows from Financing Activities | |||||||||
Net Short-term Debt Repayments to Subsidiaries | - | - | (42.9) | ||||||
Net Short-term Debt Repayments | (192.8) | - | - | ||||||
Long-term Debt Repayments | - | (717.5) | (700.0) | ||||||
Issuance of Common Stock | 4.4 | 307.8 | 580.0 | ||||||
Dividends Paid to Stockholders | (103.5) | (105.2) | (95.6) | ||||||
Cost Related to Early Retirement of Debt | - | (33.3) | (15.6) | ||||||
Purchases of Treasury Stock | (700.0) | - | - | ||||||
Other, Net | 0.6 | (14.0) | (12.1) | ||||||
Cash Used by Financing Activities | (991.3) | (562.2) | (286.2) | ||||||
Increase (Decrease) in Cash | $ | (1.2) | $ | 4.0 | $ | (1.1) | |||
See notes to condensed financial information.
Index to Financial Statements
SCHEDULE II—CONDENSEDII--CONDENSED FINANCIAL INFORMATION OF REGISTRANT (Continued)
UnumProvident CorporationUnum Group (Parent Company)
NOTES TO CONDENSED FINANCIAL INFORMATION
Note 1 - Basis of Presentation
The accompanying condensed financial statements should be read in conjunction with the consolidated financial statements and notes thereto of UnumProvident CorporationUnum Group and Subsidiaries.
Note 2 - Surplus NotesNote of SubsidiariesSubsidiary
AtThere were no outstanding surplus debentures at December 31, 20052008. Outstanding surplus debentures of $100.0 million at December 31, 2007, which were issued by an insurance subsidiary to Unum Group and 2004, UnumProvident Corporation (Parent Company) held from its insurance subsidiaries a $150.0 million surplus debenture due in 20062027, were redeemed in June 2008. We received cash of $45.2 million and a $100.0 million surplus debenture due in 2027. Semi-annual interest payments are conditional upon the approval by the insurance departmentsfixed maturity securities of the subsidiaries’ states of domicile.$54.8 million. The weighted average interest rate for surplus notes of subsidiaries was 8.48.3 percent, 8.48.3 percent, and 8.38.2 percent in 2005, 2004,2008, 2007, and 2003,2006, respectively.
Note 3 - Debt
Long-term and short-term debt of the Parent Company consists of the following:
| December 31 | December 31 | |||||||||||
| 2005 | 2004 | 2008 | 2007 | |||||||||
| (in millions of dollars) | (in millions of dollars) | |||||||||||
Adjustable Conversion Rate Equity Units @ 8.25% due 2008 | $ | 575.0 | $ | 575.0 | ||||||||
Adjustable Conversion Rate Equity Units @ 8.25% due 2009 | 300.0 | 300.0 | ||||||||||
Notes @ 7.25% due 2032, callable at or above par | 150.0 | 150.0 | ||||||||||
Notes @ 7.375% due 2032, callable at or above par | 250.0 | 250.0 | $ | 39.5 | $ | 39.5 | ||||||
Notes @ 6.75% due 2028, callable at or above par | 250.0 | 250.0 | 166.4 | 166.4 | ||||||||
Notes @ 7.25% due 2028, callable at or above par | 200.0 | 200.0 | 200.0 | 200.0 | ||||||||
Notes @ 7.625% due 2011, callable at or above par | 225.1 | 225.1 | ||||||||||
Notes @ 5.859% due 2009 | - | 150.0 | ||||||||||
Notes @ 7.0% due 2018, non-callable | 200.0 | 200.0 | 200.0 | 200.0 | ||||||||
Notes @ 7.625% due 2011, callable at or above par | 575.0 | 575.0 | ||||||||||
Medium-term Notes @ 7.0% to 7.2% due 2023 to 2028, non-callable | 62.0 | 62.0 | ||||||||||
Junior Subordinated Debt Securities @ 7.405% due 2038 | 300.0 | 300.0 | 226.5 | 226.5 | ||||||||
Medium-term Notes @ 7.0% to 7.2% due 2023 to 2028, non-callable | 62.0 | 62.0 | ||||||||||
Long-term Debt | 1,119.5 | 1,269.5 | ||||||||||
Notes @ 5.859% due 2009 | 132.2 | - | ||||||||||
Notes @ 5.997% due 2008 | - | 175.0 | ||||||||||
Short-term Debt | 132.2 | 175.0 | ||||||||||
Total | $ | 2,862.0 | $ | 2,862.0 | $ | 1,251.7 | $ | 1,444.5 | ||||
The junior subordinated debt securities due 2038 are callable under limited, specified circumstances. The remaining callable debt may be redeemed, in whole or in part, at any time. The aggregate contractual principal maturities are $132.2 million in 2009, $225.1 million in 2011, and $894.4 million in 2018 and thereafter.
Unsecured Notes
In 2007, we purchased and retired $99.9 million aggregate principal amount of the 7.625% notes due 2011; $210.5 million aggregate principal amount of the 7.375% notes due 2032; and $83.6 million of our outstanding 6.75% notes scheduled to mature in 2028. We also called and retired all $150.0 million principal amount of our outstanding 7.25% notes scheduled to mature in 2032.
In 2006, we purchased and retired $250.0 million aggregate principal amount of our outstanding 7.625% notes due 2011.
Index to Financial Statements
SCHEDULE II--CONDENSED FINANCIAL INFORMATION OF REGISTRANT (Continued)
Unum Group (Parent Company)
NOTES TO CONDENSED FINANCIAL INFORMATION - CONTINUED
Note 3 - Debt - Continued
Adjustable Conversion-Rate Equity Security Units
The scheduled remarketing of the senior note element of the adjustable conversionconversion-rate equity security units (units) issued in May 2004 occurred in February 2007, as stipulated by the terms of the original offering, and we reset the interest rate equity securityon $300.0 million of senior notes due May 15, 2009 to 5.859%. We purchased $150.0 million of the senior notes in the remarketing which were subsequently retired.
The scheduled remarketing of the senior note element of the units issued in May 2003 occurred in February 2006, as stipulated by the terms of the original offering, and we reset the Parent Company issuedinterest rate on $575.0 million of 5.997% senior notes due May 15, 2008. The Parent Company participated in the remarketing of the units and2008 to 5.997%. We purchased $400.0 million of the senior notes in the remarketing which were subsequently retired.
Junior Subordinated Debt Securities
In 1998, Provident Financing Trust I (the trust) issued $300.0 million of 7.405% capital securities in a public offering. These capital securities, which mature on March 15,in 2038, are fully and unconditionally guaranteed by the Parent Company,Unum Group, have a liquidation value of $1,000 per capital security, and have a mandatory redemption feature under certain circumstances. The Parent CompanyUnum Group issued $300.0 million of 7.405% junior subordinated deferrable interest debentures which mature on March 15, 2038, to the trust in connection with the capital securities offering. The debentures mature in 2038. The sole assets of the trust are the junior subordinated debt securities.
Of the $2,862.0 In 2007 and 2006, $23.5 million and $50.0 million of these debentures were redeemed, respectively.
Short-term Debt
In 2008, we purchased and retired $17.8 million of our outstanding 5.859% notes and $175.0 million of our 5.997% notes.
Interest and Debt Expense
Interest paid on long-term and short-term debt atand related securities during 2008, 2007, and 2006 was $95.0 million, $144.3 million, and $172.2 million, respectively.
The cost related to early retirement of debt during 2007 and 2006 decreased income approximately $58.0 million and $23.1 million, respectively, before tax, or $37.7 million and $15.0 million, respectively, after tax.
Credit Facility
In 2008, we entered into $250.0 million unsecured revolving credit facility. Borrowings under the facility are for general corporate uses and are subject to financial covenants, negative covenants, and events of default that are customary. The facility has a 364 day tenor and a one year term out option. The facility provides for interest rates based on either the prime rate or the LIBOR, as adjusted. Within this facility is a $100.0 million letter of credit sub-limit. At December 31, 2005, $575.0 million2008, there were no amounts outstanding on the facility.
Shelf Registration
We have a shelf registration, which became effective in December 2008, with the Securities and Exchange Commission to issue various types of securities, including common stock, preferred stock, debt securities, depository shares, stock purchase contracts, units and warrants, or preferred securities of wholly-owned finance trusts. If utilized, the shelf registration will mature in 2008, $300.0 million will mature in 2009, and $1,987.0 million will mature in 2011 and thereafter.enable us to raise funds from the offering of any individual security
Index to Financial Statements
SCHEDULE II—CONDENSEDII--CONDENSED FINANCIAL INFORMATION OF REGISTRANT (Continued)
UnumProvident CorporationUnum Group (Parent Company)
NOTES TO CONDENSED FINANCIAL INFORMATION—INFORMATION - CONTINUED
Note 3 - Debt - Continued
covered by the shelf registration as well as any combination thereof, subject to market conditions and our capital needs.
Note 4 - Guarantees
In November 2005, UnumProvident Finance Company plc, a wholly ownedwholly-owned subsidiary, issued $400.0 million of 6.85% senior debentures due November 15, 2015 in a private offering. These debentures areWe fully and unconditionally guaranteedguarantee these debentures. In 2008, 2007, and 2006, $36.6 million, $34.5 million, and $32.0 million, respectively, of these debentures were redeemed by the Parent Company.
UnumProvident Finance Company plc, respectively.
In connection with the debt issuance, UnumProvident Finance Company plc entered into several foreign currency interest rate swaps and a foreign currency forward contract. The Parent Company hascontracts. We have guaranteed the counterparty will receive required periodic settlement payments and isare required to post collateral in the event the contracts are in a net loss position. At December 31, 2005,2008, the notional amount of the foreign currency interest rate swaps outstanding was $400.0$296.9 million, and the notional amount of the foreign currency forward contractcontracts was $216.3 million. See Note 5 of the “Notes to Consolidated Financial Statements” contained herein in Item 8 for further discussion.
Note 5 - Cash Dividends from Subsidiaries
Cash dividends received from subsidiaries were $626.7 million, $913.6 million, and $387.1 million for the years ended December 31, 2008, 2007, and 2006, respectively.
Index to Financial Statements
SCHEDULE III—SUPPLEMENTARYIII--SUPPLEMENTARY INSURANCE INFORMATION
UnumProvident CorporationUnum Group and Subsidiaries
Segment | Deferred Policy Acquisition Costs | Future Policy Benefits, Losses, Claims, and Loss | Unearned Premiums | Other Policy Claims and Benefits Payable | ||||||||
| (in millions of dollars) | ||||||||||||
Year Ended December 31, 2005 | ||||||||||||
U.S. Brokerage | $ | 2,201.2 | $ | 11,781.2 | $ | 126.6 | $ | 1,207.5 | ||||
Unum Limited | 142.5 | 2,012.5 | 183.7 | 146.8 | ||||||||
Colonial | 569.6 | 1,144.1 | 20.0 | 119.8 | ||||||||
Individual Income Protection - Closed Block | — | 12,248.4 | 143.5 | 210.5 | ||||||||
Other | — | 6,855.3 | 8.0 | 378.8 | ||||||||
Total | $ | 2,913.3 | $ | 34,041.5 | $ | 481.8 | $ | 2,063.4 | ||||
Year Ended December 31, 2004 | ||||||||||||
U.S. Brokerage | $ | 2,196.2 | $ | 10,970.6 | $ | 128.2 | $ | 1,166.9 | ||||
Unum Limited | 154.9 | 2,091.0 | 187.3 | 130.2 | ||||||||
Colonial | 530.9 | 1,062.5 | 18.6 | 105.4 | ||||||||
Individual Income Protection - Closed Block | — | 12,334.6 | 157.7 | 221.0 | ||||||||
Other | 0.5 | 6,766.1 | 9.0 | 218.1 | ||||||||
Total | $ | 2,882.5 | $ | 33,224.8 | $ | 500.8 | $ | 1,841.6 | ||||
| Segment | Deferred Acquisition Costs | Reserves for Future Policy and Contract Benefits | Unearned Premiums | Policy and Contract Benefits | ||||||||
| (in millions of dollars) | ||||||||||||
December 31, 2008 | ||||||||||||
Unum US | $ | 1,661.8 | $ | 13,660.4 | $ | 136.7 | $ | 939.1 | ||||
Unum UK | 54.7 | 1,710.7 | 153.1 | 138.5 | ||||||||
Colonial Life | 755.9 | 1,366.7 | 24.4 | 139.8 | ||||||||
Individual Disability - Closed Block | - | 11,897.4 | 144.1 | 119.8 | ||||||||
Corporate and Other | - | 5,946.3 | 5.6 | 432.3 | ||||||||
Total | $ | 2,472.4 | $ | 34,581.5 | $ | 463.9 | $ | 1,769.5 | ||||
December 31, 2007 | ||||||||||||
Unum US | $ | 1,642.5 | $ | 13,834.8 | $ | 133.7 | $ | 983.3 | ||||
Unum UK | 69.6 | 2,389.4 | 215.5 | 196.5 | ||||||||
Colonial Life | 669.8 | 1,290.8 | 22.6 | 144.9 | ||||||||
Individual Disability - Closed Block | - | 12,306.1 | 144.7 | 209.5 | ||||||||
Corporate and Other | - | 6,006.9 | 6.6 | 445.5 | ||||||||
Total | $ | 2,381.9 | $ | 35,828.0 | $ | 523.1 | $ | 1,979.7 | ||||
Index to Financial Statements
SCHEDULE III—SUPPLEMENTARYIII--SUPPLEMENTARY INSURANCE INFORMATION
UnumProvident CorporationUnum Group and Subsidiaries
(continued from preceding page)
Segment | Premium Income | Net Investment Income (1) | Benefits, Claims, Losses, and Settlement Expenses | Amortization of Deferred Policy Acquisition Costs | Other Operating Expenses (2) | Premiums Written (3) | ||||||||||||
| (in millions of dollars) | ||||||||||||||||||
Year Ended December 31, 2005 | ||||||||||||||||||
U.S. Brokerage | $ | 5,229.0 | $ | 998.2 | $ | 4,419.3 | $ | 306.9 | $ | 1,221.9 | $ | 3,721.0 | ||||||
Unum Limited | 785.3 | 154.2 | 545.8 | 21.6 | 190.5 | 621.3 | ||||||||||||
Colonial | 787.0 | 96.0 | 433.2 | 134.7 | 151.4 | 674.2 | ||||||||||||
Individual Income Protection - Closed Block | 1,011.7 | 770.0 | 1,562.7 | — | 234.3 | 1,003.8 | ||||||||||||
Other | 2.6 | 120.5 | 122.2 | 0.5 | 168.6 | 5.5 | ||||||||||||
Corporate | — | 49.4 | — | — | 214.0 | |||||||||||||
Total | $ | 7,815.6 | $ | 2,188.3 | $ | 7,083.2 | $ | 463.7 | $ | 2,180.7 | ||||||||
Year Ended December 31, 2004 | ||||||||||||||||||
U.S. Brokerage | $ | 5,421.6 | $ | 965.8 | $ | 4,614.4 | $ | 286.3 | $ | 1,241.0 | $ | 3,830.7 | ||||||
Unum Limited | 659.1 | 139.6 | 464.5 | 19.2 | 166.8 | 541.2 | ||||||||||||
Colonial | 741.0 | 94.5 | 408.3 | 131.2 | 142.7 | 636.8 | ||||||||||||
Individual Income Protection - Closed Block | 986.6 | 799.1 | 1,618.9 | — | 1,089.9 | 975.4 | ||||||||||||
Other | 31.3 | 127.3 | 142.3 | — | 179.2 | 23.9 | ||||||||||||
Corporate | — | 32.4 | — | — | 219.7 | |||||||||||||
Total | $ | 7,839.6 | $ | 2,158.7 | $ | 7,248.4 | $ | 436.7 | $ | 3,039.3 | ||||||||
Year Ended December 31, 2003 | ||||||||||||||||||
U.S. Brokerage | $ | 5,382.4 | $ | 974.0 | $ | 5,437.5 | $ | 282.0 | $ | 1,138.7 | $ | 3,752.4 | ||||||
Unum Limited | 477.0 | 106.5 | 344.5 | 17.0 | 119.9 | 416.3 | ||||||||||||
Colonial | 693.5 | 90.0 | 395.4 | 118.3 | 125.6 | 598.3 | ||||||||||||
Individual Income Protection - Closed Block | 1,028.5 | 824.2 | 1,533.6 | 41.3 | 311.2 | 1,039.0 | ||||||||||||
Other | 34.3 | 140.1 | 157.1 | — | 179.6 | 28.2 | ||||||||||||
Corporate | — | 23.6 | — | — | 225.1 | |||||||||||||
Total | $ | 7,615.7 | $ | 2,158.4 | $ | 7,868.1 | $ | 458.6 | $ | 2,100.1 | ||||||||
| Segment | Premium Income | Net Investment Income (1) | Benefits and Change in Reserves for Future Benefits | Amortization of Deferred Acquisition Costs | All Other Expenses (2) | Premiums Written (3) | ||||||||||||
| (in millions of dollars) | ||||||||||||||||||
Year Ended December 31, 2008 | ||||||||||||||||||
Unum US | $ | 4,963.0 | $ | 1,136.4 | $ | 3,998.4 | $ | 320.3 | $ | 1,229.3 | $ | 3,672.8 | ||||||
Unum UK | 889.3 | 181.9 | 511.4 | 32.4 | 205.4 | 714.7 | ||||||||||||
Colonial Life | 977.3 | 105.7 | 464.0 | 166.4 | 184.9 | 821.7 | ||||||||||||
Individual Disability - Closed Block | 952.3 | 767.5 | 1,544.8 | - | 245.9 | 950.9 | ||||||||||||
Corporate and Other | 1.4 | 197.5 | 107.8 | - | 147.3 | 0.6 | ||||||||||||
Total | $ | 7,783.3 | $ | 2,389.0 | $ | 6,626.4 | $ | 519.1 | $ | 2,012.8 | ||||||||
Year Ended December 31, 2007 | ||||||||||||||||||
Unum US | $ | 5,014.0 | $ | 1,114.0 | $ | 4,246.4 | $ | 277.1 | $ | 1,198.0 | $ | 3,705.5 | ||||||
Unum UK | 968.3 | 187.4 | 574.3 | 49.4 | 209.3 | 790.9 | ||||||||||||
Colonial Life | 907.2 | 99.9 | 437.8 | 153.9 | 170.5 | 766.6 | ||||||||||||
Individual Disability - Closed Block | 1,009.9 | 827.6 | 1,614.5 | - | 217.2 | 1,011.5 | ||||||||||||
Corporate and Other | 1.7 | 181.0 | 115.2 | - | 259.1 | 0.9 | ||||||||||||
Total | $ | 7,901.1 | $ | 2,409.9 | $ | 6,988.2 | $ | 480.4 | $ | 2,054.1 | ||||||||
Year Ended December 31, 2006 | ||||||||||||||||||
Unum US | $ | 5,196.0 | $ | 1,057.5 | $ | 4,752.1 | $ | 302.2 | $ | 1,219.0 | $ | 3,728.5 | ||||||
Unum UK | 842.8 | 170.1 | 553.5 | 32.0 | 174.2 | 701.1 | ||||||||||||
Colonial Life | 842.1 | 93.6 | 441.4 | 144.4 | 152.3 | 713.4 | ||||||||||||
Individual Disability - Closed Block | 1,062.8 | 828.7 | 1,709.7 | - | 215.6 | 1,052.9 | ||||||||||||
Corporate and Other | 4.5 | 170.7 | 120.5 | - | 253.0 | 2.1 | ||||||||||||
Total | $ | 7,948.2 | $ | 2,320.6 | $ | 7,577.2 | $ | 478.6 | $ | 2,014.1 | ||||||||
| (1) | Net investment income is allocated based upon segmentation. Each segment has its own specifically identified assets and receives the investment income generated by those assets. |
| (2) | Includes commissions, interest and debt expense, deferral of |
| (3) | Excludes life insurance. |
Certain prior year amounts have been reclassified to conform to current year presentation.
Index to Financial Statements
SCHEDULE IV—REINSURANCEIV--REINSURANCE
UnumProvident CorporationUnum Group and Subsidiaries
Gross Amount | Ceded to Other Companies | Assumed from Other Companies | Net Amount | Percentage Amount Assumed to Net | Gross Amount | Ceded to Other | Assumed from Other Companies | Net Amount | Percentage Amount Assumed to Net | |||||||||||||||||||||
| (in millions of dollars) | (in millions of dollars) | |||||||||||||||||||||||||||||
Year Ended December 31, 2005 | ||||||||||||||||||||||||||||||
Year Ended December 31, 2008 | ||||||||||||||||||||||||||||||
Life Insurance in Force | $ | 832,067.5 | $ | 148,036.9 | $ | 1,295.2 | $ | 685,325.8 | 0.2 | % | $ | 627,126.4 | $ | 38,786.9 | $ | 1,943.0 | $ | 590,282.5 | 0.3 | % | ||||||||||
Premium Income: | ||||||||||||||||||||||||||||||
Life Insurance | $ | 2,130.6 | $ | 356.4 | $ | 12.7 | $ | 1,786.9 | 0.7 | % | $ | 1,820.1 | $ | 212.8 | $ | 12.4 | $ | 1,619.7 | 0.8 | % | ||||||||||
Accident and Health Insurance | 5,946.4 | 300.9 | 383.2 | 6,028.7 | 6.4 | % | 5,997.0 | 85.4 | 252.0 | 6,163.6 | 4.1 | % | ||||||||||||||||||
Total | $ | 8,077.0 | $ | 657.3 | $ | 395.9 | $ | 7,815.6 | 5.1 | % | $ | 7,817.1 | $ | 298.2 | $ | 264.4 | $ | 7,783.3 | 3.4 | % | ||||||||||
Year Ended December 31, 2004 | ||||||||||||||||||||||||||||||
Year Ended December 31, 2007 | ||||||||||||||||||||||||||||||
Life Insurance in Force | $ | 906,498.2 | $ | 150,740.0 | $ | 1,535.7 | $ | 757,293.9 | 0.2 | % | $ | 689,969.3 | $ | 84,861.2 | $ | 2,042.4 | $ | 607,150.5 | 0.3 | % | ||||||||||
Premium Income: | ||||||||||||||||||||||||||||||
Life Insurance | $ | 2,158.1 | $ | 315.8 | $ | 12.4 | $ | 1,854.7 | 0.7 | % | $ | 1,919.2 | $ | 291.3 | $ | 12.6 | $ | 1,640.5 | 0.8 | % | ||||||||||
Accident and Health Insurance | 6,010.4 | 410.0 | 384.5 | 5,984.9 | 6.4 | % | 6,078.3 | 94.7 | 277.0 | 6,260.6 | 4.4 | % | ||||||||||||||||||
Total | $ | 8,168.5 | $ | 725.8 | $ | 396.9 | $ | 7,839.6 | 5.1 | % | $ | 7,997.5 | $ | 386.0 | $ | 289.6 | $ | 7,901.1 | 3.7 | % | ||||||||||
Year Ended December 31, 2003 | ||||||||||||||||||||||||||||||
Year Ended December 31, 2006 | ||||||||||||||||||||||||||||||
Life Insurance in Force | $ | 785,724.7 | $ | 56,526.7 | $ | 1,474.6 | $ | 730,672.6 | 0.2 | % | $ | 770,946.0 | $ | 119,225.3 | $ | 2,123.8 | $ | 653,844.5 | 0.3 | % | ||||||||||
Premium Income: | ||||||||||||||||||||||||||||||
Life Insurance | $ | 2,031.0 | $ | 243.2 | $ | 11.7 | $ | 1,799.5 | 0.7 | % | $ | 2,077.4 | $ | 329.0 | $ | 12.7 | $ | 1,761.1 | 0.7 | % | ||||||||||
Accident and Health Insurance | 5,799.7 | 417.5 | 434.0 | 5,816.2 | 7.5 | % | 6,005.2 | 129.7 | 311.6 | 6,187.1 | 5.0 | % | ||||||||||||||||||
Total | $ | 7,830.7 | $ | 660.7 | $ | 445.7 | $ | 7,615.7 | 5.9 | % | $ | 8,082.6 | $ | 458.7 | $ | 324.3 | $ | 7,948.2 | 4.1 | % | ||||||||||
Index to Financial Statements
SCHEDULE V—VALUATIONV--VALUATION AND QUALIFYING ACCOUNTS
UnumProvident CorporationUnum Group and Subsidiaries
Description | Balance at Beginning of Period | Additions Charged to Costs and Expenses | Additions Charged to Other Accounts | Deductions (1) | Balance at End of Period | ||||||||||
| (in millions of dollars) | |||||||||||||||
Year Ended December 31, 2005 | |||||||||||||||
Real estate reserve | $ | 9.3 | $ | — | $ | — | $ | 1.7 | $ | 7.6 | |||||
Allowance for doubtful accounts (deducted from accounts and premiums receivable and miscellaneous assets) | $ | 30.3 | $ | 20.8 | $ | — | $ | 14.1 | $ | 37.0 | |||||
Year Ended December 31, 2004 | |||||||||||||||
Real estate reserve | $ | 9.3 | $ | — | $ | — | $ | — | $ | 9.3 | |||||
Allowance for doubtful accounts (deducted from accounts and premiums receivable and miscellaneous assets) | $ | 13.3 | $ | 20.1 | $ | 0.9 | $ | 4.0 | $ | 30.3 | |||||
Year Ended December 31, 2003 | |||||||||||||||
Mortgage loan loss reserve | $ | 2.4 | $ | 2.0 | $ | — | $ | 4.4 | $ | — | |||||
Real estate reserve | $ | 19.9 | $ | — | $ | — | $ | 10.6 | $ | 9.3 | |||||
Allowance for doubtful accounts (deducted from accounts and premiums receivable and miscellaneous assets) | $ | 7.9 | $ | 12.5 | $ | — | $ | 7.1 | $ | 13.3 | |||||
| Description | Balance at Beginning of Period | Additions Charged to Costs and Expenses | Additions Charged to Other Accounts (1) | Deductions (2) | Balance at End of Period | ||||||||||
| (in millions of dollars) | |||||||||||||||
Year Ended December 31, 2008 | |||||||||||||||
Real estate reserve (deducted from other long-term investments) | $ | 7.6 | $ | 0.3 | $ | - | $ | 7.6 | $ | 0.3 | |||||
Allowance for doubtful accounts (deducted from accounts and premiums receivable) | $ | 16.9 | $ | 4.6 | $ | - | $ | 6.6 | $ | 14.9 | |||||
Year Ended December 31, 2007 | |||||||||||||||
Mortgage loan loss reserve | $ | 0.5 | $ | - | $ | - | $ | 0.5 | $ | - | |||||
Real estate reserve (deducted from other long-term investments) | $ | 7.6 | $ | - | $ | - | $ | - | $ | 7.6 | |||||
Allowance for doubtful accounts (deducted from accounts and premiums receivable) | $ | 21.2 | $ | 1.2 | $ | 0.2 | $ | 5.7 | $ | 16.9 | |||||
Year Ended December 31, 2006 | |||||||||||||||
Mortgage loan loss reserve | $ | - | $ | 0.5 | $ | - | $ | - | $ | 0.5 | |||||
Real estate reserve (deducted from other long-term investments) | $ | 7.6 | $ | - | $ | - | $ | - | $ | 7.6 | |||||
Allowance for doubtful accounts (deducted from accounts and premiums receivable) | $ | 34.8 | $ | 15.9 | $ | 2.9 | $ | 32.4 | $ | 21.2 | |||||
| (1) | Additions charged to other accounts include amounts related to fluctuations in the foreign currency exchange rate. |
| (2) | Deductions include amounts deemed to reduce exposure of probable losses, amounts applied to specific |
Index to Financial Statements
With regard to applicable cross-references in this report, the Registrant’s Current, Quarterly and Annual Reports dated on or after May 1, 2003 are filed with the Securities and Exchange Commission (SEC) under File No. 1-11294 and such reports dated prior to May 1, 2003 are filed with the SEC under File No. 1-11834, except as otherwise noted below. The Registrant’s Registration Statements have the file numbers noted wherever such statements are identified in this report.
| (2.1) | Asset Purchase Agreement | |
| (2.2) | Transition Services Agreement | |
| (2.3) | TSA Amending Agreement between RBC Life Insurance Company and Provident Life and Accident Insurance Company and UnumProvident Corporation dated April 30, 2004. | |
| (2.4) | TSA Amending Agreement No. 2 between RBC Life Insurance Company and Provident Life and Accident Insurance Company and UnumProvident Corporation dated May 31, 2006. | |
| (2.5) | TSA Amending Agreement No. 3 between RBC Life Insurance Company and Provident Life and Accident Insurance Company and Unum Group dated October 1, 2008. | |
| (3.1) | Restated Certificate of Incorporation of | |
| (3.2) | Amended and Restated Bylaws of the | |
| (4.1) | Indenture for Senior Debt Securities dated as of March 9, 2001 (incorporated by reference to Exhibit 4.1 of the Registrant’s Registration Statement on Form S-3 (Registration No. 333-100953) filed on November 1, 2002). | |
| (4.2) | Purchase Contract Agreement, dated as of May 7, 2003, between the Registrant and JPMorgan Chase Bank, as Purchase Contract Agent | |
| Pledge Agreement, dated as of May 7, 2003, among the Registrant, JPMorgan Chase Bank, as Purchase Contract Agent, and BNY Midwest Trust Company, as Collateral Agent, Custodial Agent and Securities Intermediary | ||
| Form of Normal Unit Certificate (included in Exhibit 4.1). | ||
| Form of Stripped Unit Certificate (included in Exhibit 4.1). | ||
| Subscription Agreement for the 12,000,000 Adjustable Conversion-Rate Equity Security Units (“Units”) dated as of May 6, 2004 (incorporated by reference to Exhibit 4.1 of the | ||
| Registration Rights Agreement for the Units dated as of May 11, 2004 (incorporated by reference to Exhibit 4.2 of the | ||
| Fifth Supplemental Indenture between the | ||
| Purchase Contract Agreement between the | ||
Index to Financial Statements
| Pledge Agreement between the | ||
Certain instruments defining the rights of holders of long-term debt securities of Unum Group and its subsidiaries are omitted pursuant to Item 601(b)(4)(iii) of Regulation S-K. Unum Group hereby undertakes to furnish to the Securities and Exchange Commission, upon request, copies of any such instruments.
| Provident |
| Description of Compensation Plan for Non-Employee Directors | ||
| Amended and Restated Relationship Agreement between Provident Companies, Inc. and Zurich Insurance Company dated as of May 31, 1996 (incorporated by reference to Exhibit 10.16 of | ||
| Amended and Restated Registration Rights Agreement between Provident Companies, Inc. and Zurich Insurance Company dated as of May 31, 1996 (incorporated by reference to Exhibit 10.17 of | ||
| UnumProvident Amended and Restated Stock Plan of | ||
| UnumProvident Non-Employee Director Compensation Plan of 1998, | ||
| Agreement between Provident Companies, Inc. and certain subsidiaries and American General Corporation and certain subsidiaries dated as of December 8, 1997 (incorporated by reference to Exhibit 3.2 of | ||
| Form of Change in Control Severance Agreement, | ||
| Unum Life Insurance Company of America 1996 Deferred Compensation Plan (incorporated by reference to Exhibit 10.1 of | ||
| Unum Corporation Incentive Compensation Plan for Designated Executive Officers (incorporated by reference to Exhibit 10.2 of | ||
| Unum Corporation 1990 | ||
| Unum Corporation 1996 | ||
| Supplemental Executive Retirement Plan (incorporated by reference to Exhibit 10.4 | ||
Index to Financial Statements
| UnumProvident Corporation Supplemental | ||
| Administrative Reinsurance Agreement between Provident Life and Accident Insurance Company and Reassure America Life Insurance Company dated to be effective July 1, 2000 (incorporated by reference to Exhibit 10.1 of the | ||
| UnumProvident Corporation Employee Stock Option Plan (1999) (incorporated by reference to Exhibit 10.32 of the | ||
| UnumProvident Corporation | ||
| UnumProvident Corporation | ||
| UnumProvident Corporation Amended and Restated Non-Employee Director Compensation Plan of 2004, as | ||
| Form of Restricted Stock Award Agreement for awards under the UnumProvident Corporation Stock Plan of 1999, as amended (incorporated by reference to Exhibit 10.2 of the | ||
| California Settlement Agreement (incorporated by reference to Exhibit 10.1 of the | ||
| Amendment to Regulatory Settlement Agreement (incorporated by reference to Exhibit 10.2 of the | ||
| Amendment to Employment Agreement between the | ||
| Amended and Restated Employment Agreement between the | ||
| (10.26) | Unum Group Stock Incentive Plan of 2007, as amended. * | |
| (10.27) | Form of Restricted Stock Agreement with Employee, as amended, for awards under the Unum Group Stock Incentive Plan of 2007. * | |
| (10.28) | Form of Restricted Stock Unit Agreement with Employee, as amended, for awards under the Unum Group Stock Incentive Plan of 2007. * | |
| (10.29) | Form of Performance-Based Restricted Stock Agreement, as amended, for awards under the Unum Group Stock Incentive Plan of 2007. * | |
| (10.30) | Form of Performance-Based Restricted Stock Unit Agreement, as amended, for awards under the Unum Group Stock Incentive Plan of 2007. * | |
| (10.31) | Form of Restricted Stock Agreement with Director, as amended, for awards under the Unum Group Stock Incentive Plan of 2007. * | |
| (10.32) | Form of Restricted Stock Unit Agreement with Director, as amended, for awards under the Unum Group Stock Incentive Plan of 2007. * | |
| (10.33) | Aircraft Time-Sharing Agreement between Thomas R. Watjen and Unum Group dated December | |
| (10.34) | Management Incentive Compensation Plan of 2008 (incorporated by reference to Exhibit 10.1 on the Registrant’s Form 8-K filed on May 29, 2008). | |
| (10.35) | Severance Pay Plan for Executive Vice Presidents (EVPs). * | |
Index to Financial Statements
| (10.36) | Credit Agreement dated as of December 13, 2007, among the Registrant, the lenders named therein, Deutsche Bank AG New York Branch and SunTrust Bank, as documentation agents, Bank of America, N.A., as syndication agent, and Wachovia Bank, National Association, as administrative agent, issuing lender and swingline lender (incorporated by reference to Exhibit 10.40 of the Registrant’s Form 10-K filed for the fiscal year ended December 31, 2007). | |
| (10.37) | Credit Agreement dated as of December 9, 2008, among the Registrant, the lenders named therein, SunTrust Bank, as documentation agent, Bank of America, N.A., as syndication agent, and Wachovia Bank, National Association, as administrative agent, issuing lender and swingline lender. | |
| (10.38) | Agreement dated January 31, 2008 between the Registrant and Morgan Stanley & Co. Incorporated for an Accelerated Share Repurchase Transaction (incorporated by reference to Exhibit 10.1 of the Registrant’s Form 10-Q filed on May 2, 2008). † | |
| (10.39) | Agreement dated July 31, 2008 between the Registrant and Deutsche Bank AG, London Branch for an Accelerated Share Repurchase Transaction (incorporated by reference to Exhibit 10.1 of the Registrant’s Form 10-Q filed on October 31, 2008). † | |
| (11) | Statement Regarding Computation of per Share Earnings (incorporated herein by reference to “Note 11 of the Notes to Consolidated Financial Statements”). | |
| (12.1) | Statement Regarding Computation of Ratio of Earnings to Fixed Charges. | |
| (21) | Subsidiaries of the Registrant. | |
| (23) | Consent of Independent | |
| (24) | Power of Attorney. | |
| (31.1) | Certification of Chief Executive Officer pursuant to Section 302 of the Sarbanes-Oxley Act of 2002. | |
| (31.2) | Certification of Chief Financial Officer pursuant to Section 302 of the Sarbanes-Oxley Act of 2002. | |
| (32.1) | Certification of Chief Executive Officer pursuant to 18 U.S.C. Section 1350 as adopted pursuant to Section 906 of the Sarbanes-Oxley Act of 2002. | |
| (32.2) | Certification of Chief Financial Officer pursuant to 18 U.S.C. Section 1350 as adopted pursuant to Section 906 of the Sarbanes-Oxley Act of 2002. | |
| * | Management contract or compensatory plan required to be filed as an exhibit to this form pursuant to Item 15(c) of Form 10-K. |
The total amount of securities authorized pursuant to any instrument defining rights of holders of long-term debt of the Company does not exceed 10 percent of the total assets of the Company and its consolidated subsidiaries. The Company will furnish copies of any such instrument to the Securities and Exchange Commission upon request.
| † | Confidential treatment has been requested with respect to portions of this document. |
183199