shortages or delays in the availability of drilling rigs or crews and the delivery of equipment.
Our future drilling activities may not be successful and, if unsuccessful, such failure will have an adverse effect on our future results of operations and financial condition. Our overall drilling success rate or our drilling success rate for activity within a particular geographic area may decline. We may ultimately not be able to lease or drill identified or budgeted prospects within our expected time frame, or at all. We may not be able to lease or drill a particular prospect because, in some cases, we identify a prospect or drilling location before seeking an option or lease rights in the prospect or location. Similarly, our drilling schedule may vary from our capital budget. The final determination with respect to the drilling of any scheduled or budgeted wells will be dependent on a number of factors, including:
the results of exploration efforts and the acquisition, review and analysis of the seismic data;
the availability of sufficient capital resources to us and the other participants for the drilling of the prospects;
the approval of the prospects by other participants after additional data has been compiled;
economic and industry conditions at the time of drilling, including prevailing and anticipated prices for natural gas and oil and the availability of drilling rigs and crews;
our financial resources and results; and
the availability of leases and permits on reasonable terms for the prospects.
These projects may not be successfully developed and the wells, if drilled, may not encounter reservoirs of commercially productive natural gas or oil.
Index to Financial Statements
Reserve estimates depend on many assumptions that may prove to be inaccurate.Our proved reserves are estimates. Any material inaccuracies in our reserve estimates or underlying assumptions could cause the quantities and net present value of our reserves to be overstated.overstated or understated.
Reserve engineering is a subjective process of estimating underground accumulations of natural gas and crude oil that cannot be measured in an exact manner. The process of estimating quantities of proved reserves is complex and inherently uncertain,imprecise, and the reserve data included in this document are only estimates. The process relies on interpretations of available geologic, geophysic,geophysical, engineering and production data. As a result, estimates of different engineers may vary. In addition, theThe extent, quality and reliability of this technical data can vary. The degree of uncertainty varies among the three regions in which we operate. The estimation of reserves in the Gulf Coast region requires more estimates than the East and West regions and inherently has more uncertainty surrounding reserve estimation. The differences in the reserve estimation process are substantially due to the geological conditions in which the wells are drilled. The process also requires certain economic assumptions, some of which are mandated by the SEC, such as natural gas and oil prices. Additional assumptions include drilling and operating expenses, capital expenditures, taxes and availability of funds. The accuracy of a reserve estimate is a function of:
Results of drilling, testing and production subsequent to the date of an estimate may justify revising the original
estimate. Accordingly, initial reserve estimates often vary from the quantities of natural gas and crude oil that are ultimately recovered, and such variances may be material. Any significant variance could reduce the estimated quantities and present value of our reserves.
You should not assume that the present value of future net cash flows from our proved reserves is the current market value of our estimated natural gas and oil reserves. In accordance with SEC requirements, we base the estimated discounted future net cash flows from our proved reserves on prices and costs in effect on the date of the estimate, holding the prices and costs constant throughout the life of the properties. Actual future prices and costs may differ materially from those used in the net present value estimate, and future net present value estimates using then current prices and costs may be significantly less than the current estimate. In addition, the 10% discount factor we use when calculating discounted future net cash flows for reporting requirements in compliance with the Financial Accounting Standards Board in Statement of Financial Accounting Standards No. 69 may not be the most appropriate discount factor based on interest rates in effect from time to time and risks associated with us or the natural gas and oil industry in general.
Our future performance depends on our ability to find or acquire additional natural gas and oil reserves that are economically recoverable.
In general, the production rate of natural gas and oil properties declines as reserves are depleted, with the rate of decline depending on reservoir characteristics. Unless we successfully replace the reserves that we produce, our reserves will decline, eventually resulting in a decrease in natural gas and oil production and lower revenues and cash flow from operations. Our future natural gas and oil production is, therefore, highly dependent on our level of success in finding or acquiring additional reserves. We may not be able to replace reserves through our exploration, development and exploitation activities or by acquiring properties at acceptable costs. Low natural gas and oil prices may further limit the kinds of reserves that we can develop economically. Lower prices also decrease our cash flow and may cause us to decrease capital expenditures.
Our reserve report estimates that production from our proved developed producing reserves as of December 31, 2008 will decline at estimated rates of 21%, 17%, 12% and 11% during 2009, 2010, 2011 and 2012, respectively. Future development of proved undeveloped and other reserves currently not classified as proved developed producing will impact these rates of decline. Because of higher initial decline rates from newly developed reserves, we consider this pattern fairly typical.
Exploration, development and exploitation activities involve numerous risks that may result in dry holes, the failure to produce natural gas and oil in commercial quantities and the inability to fully produce discovered reserves.
We are continually identifyingAcquired properties may not be worth what we pay due to uncertainties in evaluating recoverable reserves and evaluating opportunities to acquireother expected benefits, as well as potential liabilities.
Successful property acquisitions require an assessment of a number of factors beyond our control. These factors include exploration potential, future natural gas and oil prices, operating costs, and potential
Index to Financial Statements
environmental and other liabilities. These assessments are complex and inherently imprecise. Our review of the properties we acquire may not reveal all existing or potential problems. In addition, our review may not allow us to fully assess the potential deficiencies of the properties. We do not inspect every well, and even when we inspect a well we may not discover structural, subsurface, or environmental problems that may exist or arise. We may not be entitled to contractual indemnification for pre-closing liabilities, including environmental liabilities, and our contractual indemnification may not be effective. Often, we acquire interests in properties on an “as is” basis with limited remedies for breaches of representations and warranties.
The integration of the properties we acquire could be difficult, and may divert management’s attention away from our existing operations.
The integration of the properties we acquire could be difficult, and may divert management’s attention and financial resources away from our existing operations. These difficulties include:
the challenge of integrating the acquired properties while carrying on the ongoing operations of our business; and
the possibility of faulty assumptions underlying our expectations.
The process of integrating our operations could cause an interruption of, or loss of momentum in, the activities of our business. Members of our management may be required to devote considerable amounts of time to this integration process, which will decrease the time they will have to manage our existing business. If management is not able to successfully consummateeffectively manage the integration process, or if any acquisition, to acquire producing natural gas and oil properties that contain economically recoverable reserves, or to integratesignificant business activities are interrupted as a result of the properties intointegration process, our operations profitably.business could suffer.
We face a variety of hazards and risks that could cause substantial financial losses.
Our business involves a variety of operating risks, including:
well site blowouts, cratering and explosions;
equipment failures;
uncontrolled flows of natural gas, oil or well fluids;
fires;
formations with abnormal pressures;
pollution and other environmental risks; and
natural disasters.
In addition, we conduct operations in shallow offshore areas (largely coastal waters), which are subject to additional hazards of marine operations, such as capsizing, collision and damage from severe weather. Any of these events could result in injury or loss of human life, loss of hydrocarbons, significant damage to or destruction of property, environmental pollution, regulatory investigations and penalties, impairment of our operations and substantial losses to us.
Our operation of natural gas gathering and pipeline systems also involves various risks, including the risk of explosions and environmental hazards caused by pipeline leaks and ruptures. The location of pipelines near populated areas, including residential areas, commercial business centers and industrial sites, could increase these risks. As of December 31, 2005,2008, we owned or operated approximately 3,4003,500 miles of natural gas gathering and pipeline systems. As part of our normal maintenance program, we have identified certain segments of our pipelines that we believe periodically require repair, replacement or additional maintenance.
In accordance with customary industry practice,
Index to Financial Statements
We may not be insured against all of the operating risks to which we are exposed.
We maintain insurance against some, but not all, of these risks and losses. We do not carry business interruption insurance. In addition, pollution and environmental risks generally are not fully insurable. The occurrence of an event not fully covered by insurance could have a material adverse effect on our financial position and results of operations.
We have limited control over the activities on properties we do not operate.
Other companies operate some of the properties in which we have an interest. Non-operated wells represented approximately 15% of our total owned gross wells, or approximately 4.8% of our owned net wells, as of December 31, 2008. We have limited ability to influence or control the operation or future development of these non-operated properties or the amount of capital expenditures that we are required to fund with respect to them. The failure of an operator of our wells to adequately perform operations, an operator’s breach of the applicable agreements or an operator’s failure to act in ways that are in our best interest could reduce our production and revenues. Our dependence on the operator and other working interest owners for these projects and our limited ability to influence or control the operation and future development of these properties could materially adversely affect the realization of our targeted returns on capital in drilling or acquisition activities and lead to unexpected future costs.
Terrorist activities and the potential for military and other actions could adversely affect our business.
The threat of terrorism and the impact of military and other action have caused instability in world financial markets and could lead to increased volatility in prices for natural gas and oil, all of which could adversely affect the markets for our operations. Future acts of terrorism could be directed against companies operating in the United States. The U.S. government has issued public warnings that indicate that energy assets might be specific targets of terrorist organizations. These developments have subjected our operations to increased risk and, depending on their ultimate magnitude, could have a material adverse effect on our business.
Our ability to sell our natural gas and oil production could be materially harmed if we fail to obtain adequate services such as transportation and processing.
The sale of our natural gas and oil production depends on a number of factors beyond our control, including the availability and capacity of transportation and processing facilities. Our failure to obtain these services on acceptable terms could materially harm our business.
Competition in our industry is intense, and many of our competitors have substantially greater financial and technological resources than we do, which could adversely affect our competitive position.
Competition in the natural gas and oil industry is intense. Major and independent natural gas and oil companies actively bid for desirable natural gas and oil properties, as well as for the equipment and labor required to operate and develop these properties. Our competitive position is affected by price, contract terms and quality of service, including pipeline connection times, distribution efficiencies and reliable delivery record. Many of our competitors have financial and technological resources and exploration and development budgets that are substantially greater than ours, particularly in the Rocky Mountains, Mid-Continent and Gulf Coast areas.ours. These companies may be able to pay more for exploratory projects and productive natural gas and oil properties and may be able to define, evaluate, bid for and purchase a greater number of properties and prospects than our financial or human resources permit. In addition, these companies may be able to expend greater resources on the existing and changing technologies that we believe are and will be increasingly important to attaining success in the industry.
Index to Financial Statements
We may have hedging arrangements that expose us to risk of financial loss and limit the benefit to us of increases in prices for natural gas and oil.
From time to time, when we believe that market conditions are favorable, we use certain derivative financial instruments to manage price risks associated with our production in all of our regions. While there are many different types of derivatives available, in 20052008 we primarily employed natural gas and crude oil price collar and swap agreements covering portions of our 2008 production and collar agreementsanticipated 2009 and 2010 production to attempt to manage price risk. The price swaps call for payments to, or receipts from, counterparties based on whether the market price of natural gas or crude oil for the period is greater or less than the fixed price established for that period when the swap is put in place.risk more effectively. The collar arrangements are put and call options used to establish floor and ceiling commodity prices for a fixed volume of production during a certain time period. They provide for payments to counterparties if the index price exceeds the ceiling and payments from the counterparties if the index price isfalls below the floor.
The price swaps call for payments to, or receipts from, counterparties based on whether the market price of natural gas or crude oil for the period is greater or less than the fixed price established for that period when the swap is put in place. These hedging arrangements limit the benefit to us of increases in prices. In addition, these arrangements expose us to risks of financial loss in a variety of circumstances, including when:
a counterparty is unable to satisfy its obligations;
production is less than expected; or
there is an adverse change in the expected differential between the underlying price in the derivative instrument and actual prices received for our production.
We will continue to evaluate the benefit of employing derivatives in the future. Please read “Management’s Discussion and Analysis of Financial Condition and Results of Operations” in Item 7 and “Quantitative and Qualitative Disclosures about Market Risk” in Item 7A for further discussion concerning our use of derivatives.
The loss of key personnel could adversely affect our ability to operate.
Our operations are dependent upon a relatively small group of key management and technical personnel, and one or more of these individuals could leave our employment. The unexpected loss of the services of one or more of these individuals could have a detrimental effect on us. In addition, our drilling success and the success of other activities integral to our operations will depend, in part, on our ability to attract and retain experienced geologists, engineers and other professionals. Competition for experienced geologists, engineers and some other professionals is extremely intense. If we cannot retain our technical personnel or attract additional experienced technical personnel, our ability to compete could be harmed.
We are subject to complex laws and regulations, including environmental regulations, which can adversely affect the cost, manner or feasibility of doing business.
Our operations are subject to extensive federal, state and local laws and regulations, including tax laws and regulations and those relating to the generation, storage, handling, emission, transportation and discharge of materials into the environment. These laws and regulations can adversely affect the cost, manner or feasibility of doing business. Many laws and regulations require permits for the operation of various facilities, and these permits are subject to revocation, modification and renewal. Governmental authorities have the power to enforce compliance with their regulations, and violations could subject us to fines, injunctions or both. These laws and regulations have increased the costs of planning, designing, drilling, installing and operating natural gas and oil facilities. In addition, we may be liable for environmental damages caused by previous owners of property we purchase or lease. Risks of substantial costs and liabilities related to environmental compliance issues are inherent in natural gas and oil operations. It is possible that other developments, such as stricter environmental laws and regulations, and claims for damages to property or persons resulting from natural gas and oil production, would result in substantial costs and liabilities.
Index to Financial Statements
Provisions of Delaware law and our bylaws and charter could discourage change in control transactions and prevent stockholders from receiving a premium on their investment.
Our bylaws provide for a classified boardBoard of directorsDirectors with staggered terms, and our charter authorizes our boardBoard of directorsDirectors to set the terms of preferred stock. In addition, Delaware law contains provisions that impose restrictions on business combinations with interested parties. Our bylaws prohibit stockholder action by written consent and limit stockholder proposals at meetings of stockholders. We also have adopted a stockholder rights plan. Because of our stockholder rights plan and these provisions of our charter, bylaws and Delaware law, persons considering unsolicited tender offers or other unilateral takeover proposals may be more likely to negotiate with our boardBoard of directorsDirectors rather than pursue non-negotiated takeover attempts. As a result, these provisions may make it more difficult for our stockholders to benefit from transactions that are opposed by an incumbent boardBoard of directors.Directors.
The personal liability of our directors for monetary damages for breach of their fiduciary duty of care is limited by the Delaware General Corporation Law and by our certificate of incorporation.
The Delaware General Corporation Law allows corporations to limit available relief for the breach of directors’ duty of care to equitable remedies such as injunction or rescission. Our certificate of incorporation limits the liability of our directors to the fullest extent permitted by Delaware law. Specifically, our directors will not be personally liable for monetary damages for any breach of their fiduciary duty as a director, except for liabilityliability:
for any breach of their duty of loyalty to the company or our stockholders;
for acts or omissions not in good faith or that involve intentional misconduct or a knowing violation of law;
under provisions relating to unlawful payments of dividends or unlawful stock repurchases or redemptions; and
for any transaction from which the director derived an improper personal benefit.
This limitation may have the effect of reducing the likelihood of derivative litigation against directors, and may discourage or deter stockholders or management from bringing a lawsuit against directors for breach of their duty of care, even though such an action, if successful, might otherwise have benefited our stockholders.
The global financial crisis may have impacts on our business and financial condition that we currently cannot predict.
The continued credit crisis and related turmoil in the global financial system may have an impact on our business and our financial condition, and we may face challenges if conditions in the financial markets do not improve. Our ability to access the capital markets may be restricted at a time when we would like, or need, to raise financing, which could have an impact on our flexibility to react to changing economic and business conditions. The economic situation could have an impact on our lenders or customers, causing them to fail to meet their obligations to us. Additionally, market conditions could have an impact on our commodity hedging arrangements if our counterparties are unable to perform their obligations or seek bankruptcy protection. Additionally, the current economic situation could lead to further reduced demand for oil and natural gas, or lower prices for oil and natural gas, or both, which could have a negative impact on our revenues.
ITEM 1B. UNRESOLVED STAFF COMMENTS
| ITEM 1B. | UNRESOLVED STAFF COMMENTS |
None.
| ITEM 2. | PROPERTIES |
See Item 1. Business.“Business.”
Index to Financial Statements
| ITEM 3. | LEGAL PROCEEDINGS |
We are a defendant in various legal proceedings arising in the normal course of our business. All known liabilities are accrued based on management’s best estimate of the potential loss. While the outcome and impact of such legal proceedings on us cannot be predicted with certainty, management believes that the resolution of these proceedings through settlement or adverse judgment will not have a material adverse effect on our consolidated financial position or cash flow. Operating results, however, could be significantly impacted in the reporting periods in which such matters are resolved.
Wyoming Royalty Litigation
In January 2002, we were sued by 13 overriding royalty owners in Wyoming federal district court, as reported in previous filings. The plaintiffs made claims pertaining to deductions from their overriding royalty and claims concerning penalties for improper reporting. As a result of several decisions by the Court favorable to us, the case was settled in September 2005 with no payment from us and a dismissal with prejudice of all claims by plaintiffs. The settlement included provisions for reporting and payment going forward. In the third quarter of 2005, management reversed the reserve we had recorded regarding this case, which did not have a material impact on our consolidated financial statements.
West Virginia Royalty Litigation
In December 2001, we were sued by two royalty owners in West Virginia state court for an unspecified amount of damages. The plaintiffs have requested class certification and allege that we failed to pay royalty based upon the wholesale market value of the gas, that we had taken improper deductions from the royalty and failed to properly inform royalty owners of the deductions. The plaintiffs also claimed that they are entitled to a 1/8th royalty share of the gas sales contract settlement that we reached with Columbia Gas Transmission Corporation in 1995 bankruptcy proceedings.
Discovery and pleadings necessary to place the class certification issue before the state court have been ongoing. The Court entered an order on June 1, 2005 granting the motion for class certification. The parties have negotiated a modification to the order which will result in the dismissal of the claims related to the gas sales contract settlement in connection with the Columbia Gas Transmission bankruptcy proceedings and that will limit the claims to those arising on and after December 17, 1991. The Court has postponed the trial date from April 17, 2006, in light of a case pending before the West Virginia Supreme Court of Appeals which may decide issues of law that may apply to the issue of deductibility of post-production expenses. We intend to challenge the class certification order by filing a Petition for Writ of Prohibition with the West Virginia Supreme Court of Appeals.
We are vigorously defending the case. We have established a reserve that management believes is adequate based on their estimate of the probable outcome of this case.
Texas Title Litigation
On January 6, 2003, we were served with Plaintiffs’ Second Amended Original Petition in Romeo Longoria, et al. v. Exxon Mobil Corporation, et al. in the 79th Judicial District Court of Brooks County, Texas. Plaintiffs filed their Second Supplemental Original Petition on November 12, 2004 and their Third Supplemental Original Petition on February 22, 2005 (which added Wynn-Crosby 1996, Ltd. and Dominion Oklahoma Texas Exploration & Production, Inc.). Plaintiffs allege that they are the owners of a one-half undivided mineral interest in and to certain lands in Brooks County, Texas. Cody Energy, LLC, our subsidiary, acquired certain leases and wells in 1997 and 1998.
The plaintiffs allege that they are entitled to be declared the rightful owners of an undivided interest in minerals and all improvements on the lands on which we acquired these leases. The plaintiffs also assert claims for trespass to try title, action to remove a cloud on the title, failure to properly account for royalty, fraud, trespass, conversion, all for unspecified actual and exemplary damages. Plaintiffs claim that they acquired title to the property by adverse possession. Plaintiffs also assert the discovery rule and a claim of fraudulent concealment to avoid the affirmative defense of limitations. In August 2005, the case was abated until late February 2006, during which time the parties are allowed to amend pleadings or add additional parties to the litigation. Due to the abatement of the case, we have
not had the opportunity to conduct discovery in this matter. We estimate that production revenue from this field since Cody Energy, LLC acquired title is approximately $15.7 million, and that the carrying value of this property is approximately $33.6 million.
Although the investigation into this claim continues, we intend to vigorously defend the case. Should we receive an adverse ruling in this case, an impairment review would be assessed to determine whether the carrying value of the property is recoverable. Management cannot currently determine the likelihood of an unfavorable outcome or range of any potential loss should the outcome be unfavorable. Accordingly, we have not established a reserve for this matter.
Raymondville Area
In April 2004, our wholly owned subsidiary, Cody Energy, LLC, filed suit in state court in Willacy County, Texas against certain of its co-working interest owners in the Raymondville Area, located in Kenedy and Willacy Counties. In early 2003, Cody had proposed a new prospect under the terms of the Joint Operating Agreement. Some of the co-working interest owners elected not to participate. The initial well was successful and subsequent wells have been drilled to exploit the discovery made in the first well.
The working interest owners who elected not to participate notified Cody that they believed that they had the right to participate in wells drilled after the initial well. Cody contends that the working interest owners that elected not to participate are required to assign their interest in the prospect to those who elected to participate. The defendants have filed a counter claim against the Company, and one of the defendants has filed a lien against Cody’s interest in the leases in the Raymondville area.
Cody has signed a settlement agreement with certain of the defendants representing approximately 3% of the interest in the area. Cody and the remaining defendant filed cross motions for summary judgment. In August 2005, the trial judge entered an order granting Cody’s Motion for Summary Judgment requiring the remaining defendant to assign to Cody all of its interest in the prospect and to remove the lien filed against Cody’s interest. The defendant has filed a Motion for Reconsideration and Opposition to Proposed Order. The Court has not yet made a decision on these two motions.
Commitment and Contingency Reserves
We have establishedWhen deemed necessary, we establish reserves for certain legal proceedings. The establishment of a reserve involves an estimation process that includes the advice of legal counsel and subjective judgment of management. While management believes these reserves to be adequate, it is reasonably possible that we could incur approximately $10.2$2.1 million of additional loss with respect to those matters in which reserves have been established. Future changes in the facts and circumstances could result in the actual liability exceeding the estimated ranges of loss and amounts accrued.
While the outcome and impact on us cannot be predicted with certainty, management believes that the resolution of these proceedings through settlement or adverse judgment will not have a material adverse effect on our consolidated financial position or cash flow. Operating results, however, could be significantly impacted in the reporting periods in which such matters are resolved.
ITEM 4. SUBMISSION OF MATTERS TO A VOTE OF SECURITY HOLDERS
| ITEM 4. | SUBMISSION OF MATTERS TO A VOTE OF SECURITY HOLDERS |
No matters were submitted to a vote of security holders during the fourth quarter of 2005.2008.
EXECUTIVE OFFICERS OF THE REGISTRANT
The following table shows certain information as of February 15, 2009 about our executive officers, as of February 17, 2006, as such term is defined in Rule 3b-7 of the Securities Exchange Act of 1934, and certain of our other officers.
Name | Age | Position | Officer Since | Age | Position | Officer Since | ||||||
Dan O. Dinges | 52 | Chairman, President and Chief Executive Officer | 2001 | 55 | Chairman, President and Chief Executive Officer | 2001 | ||||||
Michael B. Walen | 57 | Senior Vice President, Exploration and Production | 1998 | 60 | Senior Vice President, Chief Operating Officer | 1998 | ||||||
Scott C. Schroeder | 43 | Vice President and Chief Financial Officer | 1997 | 46 | Vice President and Chief Financial Officer | 1997 | ||||||
J. Scott Arnold | 52 | Vice President, Land and Associate General Counsel | 1998 | 55 | Vice President, Land and General Counsel | 1998 | ||||||
Robert G. Drake | 58 | Vice President, Information Services and Operational Accounting | 1998 | 61 | Vice President, Information Services and Operational Accounting | 1998 | ||||||
Abraham D. Garza | 59 | Vice President, Human Resources | 1998 | 62 | Vice President, Human Resources | 1998 | ||||||
Jeffrey W. Hutton | 50 | Vice President, Marketing | 1995 | 53 | Vice President, Marketing | 1995 | ||||||
Thomas S. Liberatore | 49 | Vice President, Regional Manager, East Region | 2003 | 52 | Vice President, Regional Manager, East Region | 2003 | ||||||
Lisa A. Machesney | 50 | Vice President, Managing Counsel and Corporate Secretary | 1995 | 53 | Vice President, Managing Counsel and Corporate Secretary | 1995 | ||||||
Henry C. Smyth | 59 | Vice President, Controller and Treasurer | 1998 | 62 | Vice President, Controller and Treasurer | 1998 |
All officers are elected annually by our Board of Directors. Except for the following, allAll of the executive officers have been employed by Cabot Oil & Gas Corporation for at least the last five years.
Dan O. Dinges joined Cabot Oil & Gas Corporation as President and Chief Operating Officer and as a member of the Board of Directors in September 2001. He was promotedIndex to
his current position of Chairman, President and Chief Executive Officer in May 2002. Mr. Dinges came to Cabot after a 20-year career with Samedan Oil Corporation, a subsidiary of Noble Affiliates, Inc. The last three years, Mr. Dinges served as Samedan’s Senior Vice President, as well as Division General Manager for the Offshore Division, a position he held since August 1996. He also served as a member of the Executive Operating Committee for Samedan. Mr. Dinges started his career as a Landman for Mobil Oil Corporation covering Louisiana, Arkansas and the central Gulf of Mexico. After four years of expanding responsibilities at Mobil, he joined Samedan as a Division Landman – Offshore. Over the years, Mr. Dinges held positions of increasing responsibility at Samedan including Division Manager, Vice President and ultimately Senior Vice President. Mr. Dinges received his B.B.A. degree in Petroleum Land Management from The University of Texas.
Thomas S. Liberatorejoined Cabot in January 2002 as Regional Manager, East and was promoted to his current position in July 2003. Prior to joining the Company, Mr. Liberatore served as Vice President, Exploration and Production for North Coast Energy. He began his career as a geologist and has held various positions of increasing responsibility for Presidio Oil Company and Belden & Blake Corporation. Mr. Liberatore received his B.S. in Geology from West Virginia University.
Financial Statements
| ITEM 5. | MARKET FOR REGISTRANT’S COMMON EQUITY, RELATED STOCKHOLDER MATTERS AND ISSUER PURCHASES OF EQUITY SECURITIES |
ITEM 5. MARKET FOR REGISTRANT’S COMMON EQUITY, RELATED STOCKHOLDER MATTERS AND ISSUER PURCHASES OF EQUITY SECURITIES
TheOur common stock is listed and principally traded on the New York Stock Exchange under the ticker symbol “COG.” The following table presents the high and low closing sales prices per share of theour common stock during certain periods, as reported in the consolidated transaction reporting system. Cash dividends paid per share of the common stock are also shown. A regular dividend has been declared each quarter since we became a public company in 1990.
On February 28, 2005, we announced that23, 2007, our Board of Directors had declared a 3-for-22-for-1 split of our common stock in the form of a stock distribution. The stock dividend was distributed on March 31, 200530, 2007 to stockholders of record on March 18, 2005. In lieu of issuing fractional shares, we paid cash based on the closing price of the common stock on the record date.16, 2007. All common stock accounts and per share data, including cash dividends per share, have been retroactively adjusted to give effect to the 3-for-22-for-1 split of our common stock. After the stock split, the dividend was increased to $0.03 per share per quarter, or a 50% increase from pre-split levels.
| High | Low | Cash Dividends | High | Low | Dividends | |||||||||||||
2005 | ||||||||||||||||||
2008 | ||||||||||||||||||
First Quarter | $ | 38.04 | $ | 27.78 | $ | 0.027 | $ | 53.41 | $ | 37.67 | $ | 0.03 | ||||||
Second Quarter | 38.13 | 28.29 | 0.040 | $ | 71.11 | $ | 51.48 | $ | 0.03 | |||||||||
Third Quarter | 50.81 | 36.05 | 0.040 | $ | 68.58 | $ | 33.58 | $ | 0.03 | |||||||||
Fourth Quarter | 51.54 | 40.48 | 0.040 | $ | 33.83 | $ | 21.31 | $ | 0.03 | |||||||||
2004 | ||||||||||||||||||
2007 | ||||||||||||||||||
First Quarter | $ | 21.93 | $ | 19.17 | $ | 0.027 | $ | 35.29 | $ | 28.06 | $ | 0.02 | ||||||
Second Quarter | 28.20 | 20.09 | 0.027 | $ | 41.88 | $ | 34.55 | $ | 0.03 | |||||||||
Third Quarter | 30.05 | 25.87 | 0.027 | $ | 38.39 | $ | 31.55 | $ | 0.03 | |||||||||
Fourth Quarter | 32.25 | 27.27 | 0.027 | $ | 40.90 | $ | 33.59 | $ | 0.03 | |||||||||
As of January 31, 2006,2009, there were 632544 registered holders of the common stock. Shareholders include individuals, brokers, nominees, custodians, trustees, and institutions such as banks, insurance companies and pension funds. Many of these hold large blocks of stock on behalf of other individuals or firms.
Issuer Purchases of Equity SecuritiesISSUER PURCHASES OF EQUITY SECURITIES
Period | Total Number of Shares Purchased | Average Price Paid per Share | Total Number of Shares Purchased as Part of Publicly Announced Plans or Programs | Maximum of Shares that | |||||
October 2005 | — | $ | — | — | 1,918,750 | ||||
November 2005 | 207,400 | $ | 43.10 | 207,400 | 1,711,350 | ||||
December 2005 | 225,200 | $ | 42.95 | 225,200 | 1,486,150 | ||||
Total | 432,600 | $ | 43.02 | ||||||
On August 13, 1998, we announced that ourOur Board of Directors has authorized thea share repurchase of two millionprogram under which we may purchase shares of our common stock in the open market or in negotiated transactions. As a result of the 3-for-2 stock split effected in March 2005, this figure has been adjusted to three million shares. All purchases executed have been through open market transactions. There is no expiration date associated with the authorizationauthorization. During 2008, we did not repurchase any shares of common stock. All purchases executed to repurchasedate have been through open market transactions. The maximum number of shares that may yet be purchased under the plan as of December 31, 2008 was 4,795,300.
Index to Financial Statements
PERFORMANCE GRAPH
The following graph compares our securities.common stock performance (“COG”) with the performance of the Standard & Poors’ 500 Stock Index and the Dow Jones US Exploration & Production Index for the period December 2003 through December 2008. The graph assumes that the value of the investment in our common stock and in each index was $100 on December 31, 2003 and that all dividends were reinvested.
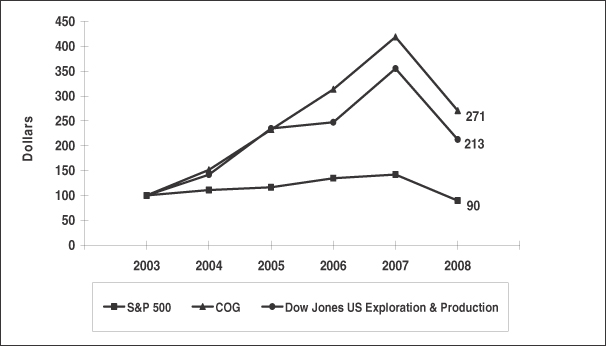
Calculated Values | 2003 | 2004 | 2005 | 2006 | 2007 | 2008 | ||||||
S&P 500 | 100.0 | 110.9 | 116.3 | 134.7 | 142.1 | 89.5 | ||||||
COG | 100.0 | 151.4 | 232.4 | 313.5 | 418.7 | 270.5 | ||||||
Dow Jones US Exploration & Production | 100.0 | 141.9 | 234.5 | 247.1 | 355.1 | 212.6 |
The performance graph above is furnished and not filed for purposes of Section 18 of the Securities Exchange Act of 1934 and will not be incorporated by reference into any registration statement filed under the Securities Act of 1933 unless specifically identified therein as being incorporated therein by reference. The performance graph is not soliciting material subject to Regulation 14A.
Index to Financial Statements
ITEM 6. SELECTED FINANCIAL DATA
| ITEM 6. | SELECTED FINANCIAL DATA |
The following table summarizes our selected consolidated financial data for the periods indicated. This information should be read in conjunction with Management’s Discussion and Analysis of Financial Condition and Results of Operations in Item 7, and the Consolidated Financial Statements and related Notes.Notes in Item 8.
| Year Ended December 31, | |||||||||||||||
| (In thousands, except per share amounts) | 2005 | 2004 | 2003 | 2002 | 2001 | ||||||||||
Statement of Operations Data | |||||||||||||||
Operating Revenues | $ | 682,797 | $ | 530,408 | $ | 509,391 | $ | 353,756 | $ | 447,042 | |||||
Impairment of Oil and Gas Properties (1) | — | 3,458 | 93,796 | 2,720 | 6,852 | ||||||||||
Income from Operations | 258,731 | 160,653 | 66,587 | 49,088 | 95,366 | ||||||||||
Net Income | 148,445 | 88,378 | 21,132 | 16,103 | 47,084 | ||||||||||
Basic Earnings per Share(2)(3) | $ | 3.04 | $ | 1.81 | $ | 0.44 | $ | 0.34 | $ | 1.04 | |||||
Dividends per Common Share(2) | $ | 0.147 | $ | 0.107 | $ | 0.107 | $ | 0.107 | $ | 0.107 | |||||
Balance Sheet Data | |||||||||||||||
Properties and Equipment, Net | $ | 1,238,055 | $ | 994,081 | $ | 895,955 | $ | 971,754 | $ | 981,338 | |||||
Total Assets | 1,495,370 | 1,210,956 | 1,055,056 | 1,100,947 | 1,092,810 | ||||||||||
Current Portion of Long-Term Debt | 20,000 | 20,000 | — | — | — | ||||||||||
Long-Term Debt | 320,000 | 250,000 | 270,000 | 365,000 | 393,000 | ||||||||||
Stockholders’ Equity | 600,211 | 455,662 | 365,197 | 350,657 | 346,552 | ||||||||||
| Year Ended December 31, | ||||||||||||||||
| 2008 | 2007 | 2006 | 2005 | 2004 | ||||||||||||
| (In thousands, except per share amounts) | ||||||||||||||||
Statement of Operations Data | ||||||||||||||||
Operating Revenues | $ | 945,791 | $ | 732,170 | $ | 761,988 | $ | 682,797 | $ | 530,408 | ||||||
Impairment of Oil & Gas Properties and Other Assets(1) | 35,700 | 4,614 | 3,886 | — | 3,458 | |||||||||||
Gain / (Loss) on Sale of Assets(2) | 1,143 | 13,448 | 232,017 | 74 | (124 | ) | ||||||||||
Gain on Settlement of Dispute(3) | 51,906 | — | — | — | — | |||||||||||
Income from Operations | 372,012 | 274,693 | 528,946 | 258,731 | 160,653 | |||||||||||
Net Income | 211,290 | 167,423 | 321,175 | 148,445 | 88,378 | |||||||||||
Basic Earnings per Share(4) | $ | 2.10 | $ | 1.73 | $ | 3.32 | $ | 1.52 | $ | 0.91 | ||||||
Diluted Earnings per Share(4) | $ | 2.08 | $ | 1.71 | $ | 3.26 | $ | 1.49 | $ | 0.90 | ||||||
Dividends per Common Share(4) | $ | 0.120 | $ | 0.110 | $ | 0.080 | $ | 0.074 | $ | 0.054 | ||||||
Balance Sheet Data | ||||||||||||||||
Properties and Equipment, Net | $ | 3,135,828 | $ | 1,908,117 | $ | 1,480,201 | $ | 1,238,055 | $ | 994,081 | ||||||
Total Assets | 3,701,664 | 2,208,594 | 1,834,491 | 1,495,370 | 1,210,956 | |||||||||||
Current Portion of Long-Term Debt | 35,857 | 20,000 | 20,000 | 20,000 | 20,000 | |||||||||||
Long-Term Debt | 831,143 | 330,000 | 220,000 | 320,000 | 250,000 | |||||||||||
Stockholders’ Equity | 1,790,562 | 1,070,257 | 945,198 | 600,211 | 455,662 | |||||||||||
(1) | For discussion of impairment of oil and gas properties and other assets, refer to Note 2 of the Notes to the Consolidated Financial Statements. |
(2) | Gain on Sale of Assets for 2007 and 2006 reflects $12.3 million and $231.2 million, respectively, related to disposition of our offshore portfolio and certain south Louisiana properties (the “2006 south Louisiana and offshore properties sale”), which was substantially completed in the third quarter of 2006. |
(3) | Gain on Settlement of Dispute is associated with the Company’s settlement of a dispute in the fourth quarter of 2008. The dispute settlement includes the value of cash and properties received. See Note 7 of the Notes to the Consolidated Financial Statements. |
(4) | All Earnings per Share and Dividends per Common Share figures have been retroactively adjusted for the 2-for-1 split of our common stock effective March 31, 2007 as well as the 3-for-2 split of our common stock effective March 31, 2005. |
ITEM 7. MANAGEMENT’S DISCUSSION AND ANALYSIS OF FINANCIAL CONDITION AND RESULTS OF OPERATIONS
| ITEM 7. | MANAGEMENT’S DISCUSSION AND ANALYSIS OF FINANCIAL CONDITION AND RESULTS OF OPERATIONS |
The following discussion is intended to assist you in understanding our results of operations and our present financial condition. Our Consolidated Financial Statements and the accompanying Notes to the Consolidated Financial Statements included elsewhere in this Form 10-K contain additional information that should be referred to when reviewing this material.
Statements in this discussion may be forward-looking. These forward-looking statements involve risks and uncertainties, including those discussed below, which could cause actual results to differ from those expressed. Please read “Forward-Looking Information” for further details.
We operate in one segment, natural gas and oil explorationdevelopment, exploitation and exploitation,exploration, exclusively within the United States and Canada.
Index to Financial Statements
OVERVIEW
Cabot Oil & Gas and its subsidiaries are a leading independent oil and gas company engaged in the exploration, development, acquisition, exploitation, exploration, production and marketing of natural gas, and to a lesser extent, crude oil and natural gas liquids from its properties in North America. We also transport, store, gather and produce natural gas for resale. Our exploitation and exploration activities are concentrated in areas with known hydrocarbon resources, which are conducive to multi-well, repeatable drilling programs. Our program is designed to be disciplined and balanced, with a focus on achieving strong financial returns.
At Cabot, there are three types of investment alternatives that constantly compete for available capital: drilling opportunities, acquisition opportunities and financial opportunities such as debt repayment or repurchase of common stock.stock and acquisition opportunities. Depending on circumstances, we allocate capital among the alternatives based on a rate-of-return approach. Our goal is to invest capital in the highest return opportunities available at any given time. At any one time, one or more of these may not be economically feasible.
Our financial results depend upon many factors, particularly the price of natural gas and crude oil and our ability to market our production on economically attractive terms. Price volatility in the commodity markets has remained prevalent in the last few years. Throughout 20042007 and 2005,most of 2008, the futures market reported unprecedentedstrong natural gas and crude oil contract prices. During the fourth quarter of 2008, commodity prices experienced a sharp decline. Our realized natural gas and crude oil price was $6.74$8.39 per Mcf and $44.19$89.11 per Bbl, respectively, in 2005.2008. These realized prices include the realized impact of derivative instruments. In an effort to manage commodity price risk, we entered into a series of crude oil and natural gas price collarsswaps and swaps.collars. These financial instruments are an important element of our risk management strategy but prevented usand assisted in the increase in our realized natural gas price from realizing the full impact of the price environment.2007 to 2008.
Commodity prices are impacted by many factors that are outside of our control. Historically, commodity prices have been volatile and we expect them to remain volatile. Commodity prices are affected by changes in market demands,supply and demand, which are impacted by overall economic activity, weather, pipeline capacity constraints, inventory storage levels, basis differentials and other factors. As a result, we cannot accurately predict future natural gas, natural gas liquidsNGL and crude oil prices and, therefore, we cannot determine with any degree of certainty what effect increases or decreases will have on our capital program, production volumes and future revenues. In addition to production volumes and commodity prices, finding and developing sufficient amounts of crude oil and natural gas reserves at economical costs are critical to our long-term success. See “Risk Factors—Natural gas and oil prices fluctuate widely, and low prices for an extended period of time are likely to have a material adverse impact on our business” and “Risk Factors—Our future performance depends on our ability to find or acquire additional natural gas and oil reserves that are economically recoverable” in Item 1A.
The tables below illustrate how natural gas prices have fluctuated by month over 20042007 and 2005.2008. “Index” represents the first of the month Henry Hub index price per Mmbtu. The “2004”“2007” and “2005”“2008” price is the natural gas price per Mcf realized by us and includes the realized impact of our natural gas price collar and swap arrangements, as applicable:
| (in $ per Mcf) | Natural Gas Prices by Month - 2005 | |||||||||||||||||||||||||||||||||||
| Jan | Feb | Mar | Apr | May | Jun | Jul | Aug | Sep | Oct | Nov | Dec | |||||||||||||||||||||||||
Index | $ | 6.21 | $ | 6.29 | $ | 6.30 | $ | 7.33 | $ | 6.77 | $ | 6.13 | $ | 6.98 | $ | 7.65 | $ | 10.97 | $ | 13.93 | $ | 13.85 | $ | 11.21 | ||||||||||||
2005 | $ | 5.78 | $ | 5.84 | $ | 5.52 | $ | 6.28 | $ | 6.19 | $ | 5.55 | $ | 6.05 | $ | 6.58 | $ | 7.76 | $ | 8.94 | $ | 8.53 | $ | 7.78 | ||||||||||||
| (in $ per Mcf) | Natural Gas Prices by Month - 2004 | |||||||||||||||||||||||||||||||||||
| Jan | Feb | Mar | Apr | May | Jun | Jul | Aug | Sep | Oct | Nov | Dec | |||||||||||||||||||||||||
Index | $ | 6.15 | $ | 5.77 | $ | 5.15 | $ | 5.37 | $ | 5.94 | $ | 6.68 | $ | 6.14 | $ | 6.04 | $ | 5.08 | $ | 5.79 | $ | 7.63 | $ | 7.78 | ||||||||||||
2004 | $ | 5.23 | $ | 5.23 | $ | 5.17 | $ | 4.88 | $ | 4.96 | $ | 5.23 | $ | 5.39 | $ | 5.21 | $ | 4.54 | $ | 5.29 | $ | 5.63 | $ | 5.55 | ||||||||||||
| Natural Gas Prices by Month - 2008 | ||||||||||||||||||||||||||||||||||||
| Jan | Feb | Mar | Apr | May | Jun | Jul | Aug | Sep | Oct | Nov | Dec | |||||||||||||||||||||||||
Index | $ | 7.13 | $ | 8.01 | $ | 8.96 | $ | 9.59 | $ | 11.29 | $ | 11.93 | $ | 13.11 | $ | 9.23 | $ | 8.40 | $ | 7.48 | $ | 6.47 | $ | 6.90 | ||||||||||||
2008 | $ | 7.46 | $ | 7.82 | $ | 8.45 | $ | 9.03 | $ | 9.38 | $ | 9.50 | $ | 9.36 | $ | 8.61 | $ | 8.05 | $ | 7.89 | $ | 7.70 | $ | 7.54 | ||||||||||||
| Natural Gas Prices by Month - 2007 | ||||||||||||||||||||||||||||||||||||
| Jan | Feb | Mar | Apr | May | Jun | Jul | Aug | Sep | Oct | Nov | Dec | |||||||||||||||||||||||||
Index | $ | 5.84 | $ | 6.93 | $ | 7.55 | $ | 7.56 | $ | 7.51 | $ | 7.59 | $ | 6.93 | $ | 6.11 | $ | 5.43 | $ | 6.43 | $ | 7.27 | $ | 7.21 | ||||||||||||
2007 | $ | 7.05 | $ | 7.61 | $ | 7.63 | $ | 7.04 | $ | 7.30 | $ | 7.38 | $ | 7.05 | $ | 6.94 | $ | 6.41 | $ | 7.06 | $ | 7.44 | $ | 7.87 | ||||||||||||
Index to Financial Statements
Prices for crude oil have followed a similar path as the commodity price continued to maintainmaintained strength in 20042007 and rose furtherto record high levels in 2005.2008, but experienced significant declines in the fourth quarter of 2008. The tables below contain the NYMEX monthly average crude oil price (Index) and our realized per barrel (Bbl) crude oil prices by month for 20042007 and 2005.2008. The “2004”“2007” and “2005”“2008” price is the crude oil price per Bbl realized by us and includes the realized impact of our crude oil derivative arrangements:
| (in $ per Bbl) | Crude Oil Prices by Month - 2005 | |||||||||||||||||||||||||||||||||||
| Jan | Feb | Mar | Apr | May | Jun | Jul | Aug | Sep | Oct | Nov | Dec | |||||||||||||||||||||||||
Index | $ | 46.85 | $ | 48.05 | $ | 54.63 | $ | 53.22 | $ | 49.87 | $ | 56.42 | $ | 59.03 | $ | 64.99 | $ | 65.55 | $ | 62.27 | $ | 58.34 | $ | 59.45 | ||||||||||||
2005 | $ | 38.18 | $ | 40.57 | $ | 47.30 | $ | 44.95 | $ | 41.88 | $ | 44.58 | $ | 46.24 | $ | 46.62 | $ | 45.05 | $ | 45.92 | $ | 45.59 | $ | 43.70 | ||||||||||||
| (in $ per Bbl) | Crude Oil Prices by Month - 2004 | |||||||||||||||||||||||||||||||||||
| Jan | Feb | Mar | Apr | May | Jun | Jul | Aug | Sep | Oct | Nov | Dec | |||||||||||||||||||||||||
Index | $ | 34.23 | $ | 34.50 | $ | 36.72 | $ | 36.62 | $ | 40.28 | $ | 38.05 | $ | 40.81 | $ | 44.88 | $ | 45.94 | $ | 53.09 | $ | 48.48 | $ | 43.26 | ||||||||||||
2004 | $ | 30.62 | $ | 30.66 | $ | 31.62 | $ | 30.97 | $ | 30.80 | $ | 31.51 | $ | 31.43 | $ | 33.00 | $ | 31.61 | $ | 32.87 | $ | 33.15 | $ | 30.46 | ||||||||||||
| Crude Oil Prices by Month - 2008 | ||||||||||||||||||||||||||||||||||||
| Jan | Feb | Mar | Apr | May | Jun | Jul | Aug | Sep | Oct | Nov | Dec | |||||||||||||||||||||||||
Index | $ | 92.93 | $ | 95.35 | $ | 105.42 | $ | 112.46 | $ | 125.46 | $ | 134.02 | $ | 133.48 | $ | 116.69 | $ | 103.76 | $ | 76.72 | $ | 57.44 | $ | 42.04 | ||||||||||||
2008 | $ | 83.71 | $ | 85.02 | $ | 90.85 | $ | 92.56 | $ | 99.79 | $ | 103.83 | $ | 102.76 | $ | 101.16 | $ | 93.51 | $ | 87.10 | $ | 69.16 | $ | 62.45 | ||||||||||||
| Crude Oil Prices by Month - 2007 | ||||||||||||||||||||||||||||||||||||
| Jan | Feb | Mar | Apr | May | Jun | Jul | Aug | Sep | Oct | Nov | Dec | |||||||||||||||||||||||||
Index | $ | 54.67 | $ | 59.39 | $ | 60.74 | $ | 64.04 | $ | 63.53 | $ | 67.53 | $ | 74.15 | $ | 72.36 | $ | 79.63 | $ | 85.66 | $ | 94.63 | $ | 91.74 | ||||||||||||
2007 | $ | 51.59 | $ | 53.17 | �� | $ | 55.54 | $ | 61.31 | $ | 63.35 | $ | 61.42 | $ | 70.68 | $ | 70.03 | $ | 71.90 | $ | 83.97 | $ | 84.38 | $ | 82.65 | |||||||||||
We reported earnings of $3.04$2.10 per share, or $148.4$211.3 million, for 2005. This is up2008, an increase from the $1.81$1.73 per share, or $88.4$167.4 million, reported in 2004. The stronger price environment was2007. Natural gas revenues increased from 2007 to 2008 as a primary contributorresult of favorable natural gas hedge settlements, increased commodity market prices and increased natural gas production. Crude oil revenues increased from 2007 to the earnings increase2008 primarily due to the increaseincreased realized prices, partially offset by a reduction in natural gas andcrude oil revenues.production. Prices, including the realized impact of derivative instruments, rose 30%increased by 16% for natural gas and 40%33% for oil.
We drilled 316432 gross wells with a success rate of 95%97% in 20052008 compared to 256461 gross wells with a 95% success rate of 96% in 2004.2007. Total capital and exploration expenditures increased by $166.1$844.8 million to $425.6$1,481.0 million of which $73.1 million was for property acquisitions,(including the east Texas acquisition) in 20052008 compared to $259.5$636.2 million for 2004.in 2007. We believe our cash on hand and operating cash flow in 20062009 will be sufficient to fund our budgeted capital and exploration budgeted spending of approximately $396 million$475 million. Any additional needs will be funded by borrowings from our credit facility. We have reduced, and again provide excess cash flow. Any excess cash flow may be used for acquisitions,continue to pay current debt due, repurchase common stock, expandreduce, our budgeted capital program or other opportunities.and exploration spending to maintain sufficient liquidity.
Our 20062009 strategy will remain consistent with 2005.2008. We will remain focused on our strategies of balancing our capital investments between higher risk projects with the potential for higher returns andpursuing lower risk projects withdrilling opportunities that provide more stable returns, along with balancing longer life investments with impact exploration opportunities.predictable results on our accumulated acreage position. Additionally, we intend to manage our balance sheet in an effort to ensure that we have sufficient liquidity, and we intend to maintain spending discipline. In the current year we have allocated our planned program for capital and exploration expenditures among our various operatingprimarily to the East and Gulf Coast regions. We believe these strategies are appropriate infor our portfolio of projects and the current industry environment and that this activity will continue to add shareholder value over the long term.long-term.
The preceding paragraphs, discussing our strategic pursuits and goals, contain forward-looking information. Please read “Forward-Looking Information” for further details.
FINANCIAL CONDITION
Capital Resources and Liquidity
Our primary sourcesources of cash in 2005 was2008 were from funds generated from operations, as well asthe sale of natural gas and crude oil production, the private placements of debt completed in July and December 2008, the sale of common stock and, to a lesser extent, borrowings onunder our revolving credit facility and asset sales. Cash flows provided by operating activities, borrowings, the sale of common stock and proceeds from asset sales were primarily used to fund our development (including acquisitions) and, to a lesser extent, proceeds from the exerciseexploratory expenditures, in addition to paying dividends and debt issuance costs. See below for additional discussion and analysis of stock options under our stock plans. cash flow.
Index to Financial Statements
We generate cash from the sale of natural gas and crude oil. Operating cash flow fluctuations are substantially driven by commodity prices and changes in our production volumes. Prices for crude oil and natural gas have historically been subject tovolatile, including seasonal influences characterized by peak demand and higher prices in the winter heating season; however, the impact of other risks and uncertainties have also influenced prices throughout the recent years. Working capital is also substantially influenced by these variables. During 2005, approximately 1.4 Bcfe of expected productionCommodity prices have recently experienced increased volatility due to adverse market conditions in our Gulf Coast region was deferred due to the impacts of Hurricanes Katrina and Rita. These hurricanes did not have a material adverse impact on our capital resources nor liquidity. Fluctuationeconomy. In addition, fluctuations in cash flow may result in an increase or decrease in our capital and exploration expenditures. See “Results of Operations” for a review of the impact of prices and volumes on sales. Cash flows provided
Our working capital is also substantially influenced by operating activities were primarily usedvariables discussed above. From time to fund explorationtime, our working capital will reflect a surplus, while at other times it will reflect a deficit. This fluctuation is not unusual. The recent financial and development expenditures, purchase treasury stockcredit crisis has reduced credit availability and pay dividends. Proceeds from the exercise of stock options under stock option plans during 2005 partially offsetliquidity for some companies; however, we believe we have adequate liquidity available to meet our repurchase of 452,300 treasury shares of common stock at a weighted average purchase price of $42.41. See below for additional discussion and analysis of cash flow.working capital requirements.
| Year-Ended December 31, | ||||||||||||
| (In thousands) | 2005 | 2004 | 2003 | |||||||||
Cash Flows Provided by Operating Activities | $ | 364,560 | $ | 273,022 | $ | 241,638 | ||||||
Cash Flows Used by Investing Activities | (412,150 | ) | (255,357 | ) | (151,856 | ) | ||||||
Cash Flows Provided / (Used) by Financing Activities | 48,190 | (8,363 | ) | (90,660 | ) | |||||||
Net Increase / (Decrease) in Cash and Cash Equivalents | $ | 600 | $ | 9,302 | $ | (878 | ) | |||||
| Year Ended December 31, | ||||||||||||
| 2008 | 2007 | 2006 | ||||||||||
| (In thousands) | ||||||||||||
Cash Flows Provided by Operating Activities | $ | 634,447 | $ | 462,137 | $ | 357,104 | ||||||
Cash Flows Used in Investing Activities | (1,452,289 | ) | (589,922 | ) | (187,353 | ) | ||||||
Cash Flows Provided by / (Used in) Financing Activities | 827,445 | 104,429 | (138,523 | ) | ||||||||
Net Increase / (Decrease) in Cash and Cash Equivalents | $ | 9,603 | $ | (23,356 | ) | $ | 31,228 | |||||
Operating Activities. Net cash provided by operating activities in 2005 increased $91.5 million over 2004. This increase is primarily due to higher commodity prices. Key components impacting net operating cash flows are commodity prices, production volumes and operating costs. Net cash provided by operating activities in 2008 increased by $172.3 million over 2007. This increase was mainly due to an increase in net income, the receipt of cash of $20.2 million in 2008 in connection with the settlement of a dispute and an increase of $13.7 million in cash received for income tax refunds. In addition, cash flows from operating activities increased as a result of other working capital changes. Average realized natural gas prices increased 30%by 16% in 2008 over 2004, while2007 and average realized crude oil realized prices increased 40%by 33% over the same period. ProductionEquivalent production volumes declined slightly, with a less than one percent reduction of equivalent productionincreased by 11% in 20052008 compared to 2004. While we believe 2006 commodity production may exceed 2005 levels, we2007 as a result of higher natural gas production. We are unable to predict future commodity prices and, as a result, cannot provide any assurance about future levels of net cash provided by operating activities. Realized prices may be lower in 2009.
Net cash provided by operating activities in 20042007 increased $31.4by $105.0 million over 2003.2006. This increase iswas mainly due to a decrease in cash paid for current income taxes from 2006 to 2007 primarily due to higher commodity prices. Key componentsthe 2006 payment of approximately $102 million related to the 2006 south Louisiana and offshore properties sale, as well as our 2007 tax net operating cash flows are commodity prices, production volumesloss position and operating costs.the receipt in 2007 of $29.6 million in federal tax refunds relating to our 2006 tax return. Average realized natural gas prices increased 15%by one percent in 2007 over 2003, while2006 and average realized crude oil realized prices increased 7%by three percent over the same period. Production volumes declined, with a 5% reduction of equivalentEquivalent production decreased by three percent in 20042007 compared to 2003. 2006 as a result of a decrease in crude oil production, offset in part by an increase in natural gas production.
See “Results of Operations” for a discussion on commodity prices and a review of the impact of prices and volumes on sales revenue.
Investing Activities. The primary uses of cash byin investing activities arewere capital spending (including the east Texas acquisition and new leases in both Pennsylvania and east Texas) and exploration expense.expenses. We establishestablished the budget for these amounts based on our current estimate of future commodity prices. Due to the volatility of commodity prices and new opportunities which may arise, our capital expenditures may be periodically adjusted during any given year. Cash flows used in investing activities increased for the years ended December 31, 2005by $862.4 million from 2007 to 2008 and 2004 in the amounts of $156.8increased by $402.6 million and $103.5 million, respectively.from 2006 to 2007. The increase from 20042007 to 2005 is2008 was due
Index to Financial Statements
to an increase of $866.0 million in capital expenditures, including an increase of approximately $601.8 million primarily due to the $604.0 million east Texas acquisition and an increase of $130.5 million related to unproved leasehold acquisitions primarily in northeast Pennsylvania. In addition, there were $5.0 million of lower proceeds from the sale of assets in 2008 compared to 2007. Partially offsetting these increases to cash used in investing activities were decreased exploration expenditures of $8.6 million in 2008 compared to 2007.
The increase in cash flows used in investing activities from 2006 to 2007 was due to a decrease of $322.4 million in 2007 in proceeds from the sale of assets and an increase of $89.8 million in 2007 in capital expenditures, partially offset by reduced exploration expenses of $9.6 million.
Financing Activities. Cash flows provided by financing activities increased by $723.0 million from 2007 to 2008. This was primarily due to an increase in drilling activity in the East region and the Rocky Mountains areadebt consisting of our West region in response to higher commodity prices. Our continued drilling activity in Canada also contributed to the increase. In addition, we spent $73.1July 2008 and December 2008 private placements of debt ($492 million) and an increase of $45 million in proved property acquisitions, primarily inborrowings under our revolving credit facility. Additionally, net proceeds from the Gulf Coast. The increase from 2003 to 2004 was alsosale of common stock increased by $311.1 million primarily due to the June 2008 issuance of common stock. The tax benefit for stock-based compensation increased by $10.7 million from 2007 to 2008, but was partially offset by an increase in drilling activity in response to higher commodity prices. This increase largely occurred in our East regiondividends and the Rocky Mountains area of our West region. Our initial drilling activity in Canada also contributed to the increase.capitalized debt issuance costs paid.
Financing Activities.Cash flows provided by financing activities were $48.2increased by $243.0 million for the year ended December 31, 2005, resulting from 2006 to 2007 primarily due to a $210.0 million increase in debt, principally related to higher borrowings under theour revolving credit facility, partially offset by the purchasefacility. In addition, $46.5 million of treasury stock and dividend payments. Cash flows usedwas purchased in 2006 compared with none in 2007. Partially offsetting these increases in cash provided by financing activities were a $9.5 million reduction in the tax benefit for the year ended December 31, 2004 were $8.4 million. This is the result ofstock-based compensation, lower proceeds from the exercise of stock options offset by the purchase of treasury shares and higher dividend payments. Cash flows used by financing activities for the year ended December 31, 2003 were $90.7 million. This is substantially due to a net repayment on our revolving credit facility in the amount of $95.0 million. Cash utilized for the repayments was generated from operating cash flows.
At December 31, 2005,2008, we had $90$185 million of debtborrowings outstanding under our credit facility. Theunsecured credit facility providesat a weighted-average interest rate of 3.7%. In December 2008, the revolving credit facility was amended to extend the commitment period for lenders holding approximately 90% of the aggregate commitments from December 2009 to October 2010. The December amendment added an available credit line of $250 million, which can be expanded upaccordion feature to $350 million, either withallow us, if the existing banks or new banks.banks agree, to increase the available credit line from $350 million to $450 million. The available credit line is subject to adjustment on the basis of the present value of estimated future net cash flows from proved oil and gas reserves (as determined by the banks’ petroleum engineer) and other assets. The revolving term of the credit facility ends in December 2009. We strive to manage our debt at a level below the available credit line in order to maintain excess borrowing capacity. Our revolving credit facility includes a covenant limiting our total debt. Management believes that we have the abilitycapacity to finance through new debt or equity offerings, if necessary, our spending plans and maintain our liquidity. At the same time, we will closely monitor the capital requirements, including potential acquisitions.
In August 1998, we announced that our Board of Directors authorized the repurchase of two million shares of our common stock in the open market or in negotiated transactions.markets. As a result of market conditions and our increased level of borrowings, we may experience increased costs associated with future debt.
In July 2008, we completed a private placement of $425 million aggregate principal amount of senior unsecured fixed-rate notes with a weighted-average interest rate of 6.51%, consisting of amounts due in July 2018, 2020 and 2023. In December 2008, we completed a private placement of $67 million aggregate principal amount of senior unsecured 9.78% fixed-rate notes due in December 2018. Please refer to Note 4 of the 3-for-2 stock split effected in March 2005, this figure has been adjustedNotes to three million shares. During 2005,the Consolidated Financial Statements for further details.
In June 2008, we repurchased 452,300entered into an underwriting agreement pursuant to which we sold an aggregate of 5,002,500 shares of our common stock at a weighted averageprice to us of $62.66 per share. This aggregate share amount included 652,500 shares of common stock that were issued as a result of the exercise of the underwriters’ option to purchase additional shares. We received $313.5 million in net proceeds, after deducting underwriting discounts and commissions. These net proceeds were used temporarily to reduce outstanding borrowings under our revolving credit facility prior to funding a portion of the purchase price of $42.41. All purchases executedour east Texas acquisition, which closed in the third quarter of 2008. Immediately prior to date have been through open market transactions. There is no expiration date associated with the authorization(and in connection with) this issuance, we retired 5,002,500 shares of treasury stock, which had a weighted-average purchase price of $16.46.
Index to repurchase our securities. The maximum number of shares that may yet be purchased under the plan as of December 31, 2005 was 1,486,150. See Item 5 “Market for Registrant’s Common Equity, Related Stockholder Matters and Issuer Purchases of Equity Securities” for additional information.Financial Statements
Capitalization
Information about our capitalization is as follows:
| December 31, | ||||||||
| (In millions) | 2005 | 2004 | ||||||
Debt (1) | $ | 340.0 | $ | 270.0 | ||||
Stockholders’ Equity | 600.2 | 455.7 | ||||||
Total Capitalization | $ | 940.2 | $ | 725.7 | ||||
Debt to Capitalization | 36 | % | 37 | % | ||||
Cash and Cash Equivalents | $ | 10.6 | $ | 10.0 | ||||
| December 31, | ||||||||
| 2008 | 2007 | |||||||
| (Dollars in millions) | ||||||||
Debt(1) | $ | 867.0 | $ | 350.0 | ||||
Stockholders’ Equity | 1,790.6 | 1,070.3 | ||||||
Total Capitalization | $ | 2,657.6 | $ | 1,420.3 | ||||
Debt to Capitalization | 33 | % | 25 | % | ||||
Cash and Cash Equivalents | $ | 28.1 | $ | 18.5 | ||||
(1) | Includes $35.9 million and $20.0 million of current portion of long-term debt at |
For the year ended December 31, 2005,2008, we paid dividends of $7.2$12.1 million on our common stock. A regular dividend of $0.04 per share of common stock, or $0.027 per share for dividends prior to the 3-for-2 stock split as adjusted for the split, has been declared for each quarter since we became a public company.company in 1990. After the March 2007 2-for-1 stock split, the dividend was increased to $0.03 per share per quarter, or a 50% increase from pre-split levels.
Capital and Exploration Expenditures
On an annual basis, we generally fund most of our capital and exploration activities, excluding any significant oil and gas property acquisitions, with cash generated from operations and, when necessary, our revolving credit facility. We budget these capital expenditures based on our projected cash flows for the year.
The following table presents major components of our capital and exploration expenditures for the three years ended December 31, 2005.2008.
| (In millions) | 2005 | 2004 | 2003 | |||||||||||||||
| 2008 | 2007 | 2006 | ||||||||||||||||
| (In millions) | ||||||||||||||||||
Capital Expenditures | ||||||||||||||||||
Drilling and Facilities | $ | 249.3 | $ | 174.0 | $ | 102.0 | ||||||||||||
Drilling and Facilities(1) | $ | 624.3 | $ | 539.7 | $ | 405.5 | ||||||||||||
Leasehold Acquisitions | 22.1 | 18.3 | 14.1 | 152.7 | 22.2 | 42.6 | ||||||||||||
Acquisitions | 625.0 | 4.0 | 6.7 | |||||||||||||||
Pipeline and Gathering | 17.9 | 13.5 | 10.6 | 36.9 | 28.2 | 24.2 | ||||||||||||
Other | 1.4 | 1.6 | 1.8 | 10.9 | 2.3 | 9.1 | ||||||||||||
| 290.7 | 207.4 | 128.5 | 1,449.8 | 596.4 | 488.1 | |||||||||||||
Proved Property Acquisitions | 73.1 | 4.0 | 1.5 | |||||||||||||||
Exploration Expense | 61.8 | 48.1 | 58.2 | 31.2 | 39.8 | 49.4 | ||||||||||||
Total | $ | 425.6 | $ | 259.5 | $ | 188.2 | $ | 1,481.0 | $ | 636.2 | $ | 537.5 | ||||||
(1) | Includes Canadian currency translation effects of $(27.7) million, $15.0 million and $(1.4) million in 2008, 2007 and 2006, respectively. |
We plan to drill about 391approximately 148 gross wells (122.3 net) in 20062009 compared with 316432 gross wells (355 net) drilled in 2005.2008. The number of wells we plan to drill in 2009 is down from 2008 in each of our operating regions due to the underlying economic fundamentals, which have significantly reduced commodity prices. This 20062009 drilling program includes approximately $396$475 million in total capital and exploration expenditures, down from $425.6$1,481 million in 2005. Capital and exploration expenditures in 2005 included a layer of $73.1 million in proved property acquisitions as shown in the table above.2008. We will continue to assess the natural gas and crude oil price environment and our liquidity position and may increase or decrease the capital and exploration expenditures accordingly.
Index to Financial Statements
There are many factors that impact our depreciation, depletion and amortization (DD&A) rate. These include reserve additions and revisions, development costs, impairments and changes in anticipated production in a future period.periods. In 20062009, management expects an increase in our depreciation, depletion and amortizationDD&A rate due to negative reserve revisions and higher capital costs.costs, partially as a result of inflationary cost pressures in the industry over the last four years. This change may result in an increase of depreciation, depletion and amortization of 10%is currently estimated to 15%be approximately 13% greater than 20052008 levels. This increase will not have an impact on our cash flows.
Contractual Obligations
Our known material contractual obligations include long-term debt, interest on long-term debt, firm gas transportation agreements, drilling rig commitments and operating leases. We have no off-balance sheet debt or other similar unrecorded obligations, and we have not guaranteed the debt of any other party.obligations.
A summary of our known contractual obligations as of December 31, 20052008 are set forth in the following table:
| Payments Due by Year | |||||||||||||||
| 2007 | 2009 | 2011 & | |||||||||||||
| (In thousands) | Total | 2006 | to 2008 | to 2010 | Beyond | ||||||||||
Long-Term Debt(1) | $ | 340,000 | $ | 20,000 | $ | 40,000 | $ | 110,000 | $ | 170,000 | |||||
Interest on Long-Term Debt (2) | 132,960 | 24,632 | 44,950 | 32,673 | 30,705 | ||||||||||
Firm Gas Transportation Agreements(3) | 93,766 | 11,661 | 19,839 | 6,762 | 55,504 | ||||||||||
Drilling Rig Commitments (3) | 104,315 | 26,055 | 68,585 | 9,675 | — | ||||||||||
Operating Leases | 17,746 | 4,876 | 9,174 | 3,696 | — | ||||||||||
Total Contractual Cash Obligations | $ | 688,787 | $ | 87,224 | $ | 182,548 | $ | 162,806 | $ | 256,209 | |||||
| Total | Payments Due by Year | ||||||||||||||
| 2009 | 2010 to 2011 | 2012 to 2013 | 2014 & Beyond | ||||||||||||
| (In thousands) | |||||||||||||||
Long-Term Debt(1) | $ | 867,000 | $ | 35,857 | $ | 244,143 | $ | 75,000 | $ | 512,000 | |||||
Interest on Long-Term Debt(2) | 460,624 | 63,124 | 99,602 | 82,469 | 215,429 | ||||||||||
Firm Gas Transportation Agreements(3) | 94,670 | 13,218 | 23,935 | 13,374 | 44,143 | ||||||||||
Drilling Rig Commitments(3) | 44,271 | 42,021 | 2,250 | — | — | ||||||||||
Operating Leases(3) | 28,686 | 6,335 | 9,028 | 7,397 | 5,926 | ||||||||||
Total Contractual Cash Obligations | $ | 1,495,251 | $ | 160,555 | $ | 378,958 | $ | 178,240 | $ | 777,498 | |||||
(1) | Including current portion. At December 31, |
(2) | Interest payments have been calculated utilizing the fixed rates of our |
(3) | For further information on our obligations under firm gas transportation agreements, |
Amounts related to our asset retirement obligations are not included in the above table given the uncertainty regarding the actual timing of such expenditures. The total amount of asset retirement obligations at December 31, 2005 is $43.0 million.
Subsequent to2008 was $28.0 million, up from $24.7 million at December 31, 2005, we entered into an agreement for one additional drilling rig in the Gulf Coast. The total commitment over the next four years is $27.42007, primarily due to $1.2 million of which $0.8accretion expense during 2008 as well as $2.2 million $9.1 million, $9.1 million and $8.4 million will be paid out during the years 2006, 2007, 2008 and 2009, respectively.of drilling additions.
Potential Impact of Our Critical Accounting Policies
Readers of this document and users of the information contained in it should be aware of how certain events may impact our financial results based on the accounting policies in place. The most significant policies are discussed below.
Oil and Gas Reserves
The process of estimating quantities of proved reserves is inherently uncertain,imprecise, and the reserve data included in this document are only estimates. The process relies on interpretations of available geologic, geophysic,
Index to Financial Statements
geophysical, engineering and production data. The extent, quality and reliability of this technical data can vary. The degree of uncertainty varies among the three regions in which we operate. The estimation of reserves in the Gulf Coast region requires more estimates than the East and West regions and inherently has more uncertainty surrounding reserve estimation. The differences in the reserve estimation process are substantially due to the geological conditions in which the wells are drilled. The process also requires certain economic assumptions, some of which are mandated by the SEC, such as oil and gas prices. Additional assumptions include drilling and operating expenses, capital expenditures, taxes and availability of funds. The accuracy of a reserve estimate is a function of:
Since 1990, 100% of our reserves have been reviewed by Miller & Lents, Ltd., an independent oil and gas reservoir engineering consulting firm, who in their opinion determined the estimates presented to be reasonable in the aggregate. We have not been required to record a significant reserve revision in the past three years. For more information regarding reserve estimation, including historical reserve revisions, refer to the “Supplemental Oil and Gas Information.”
Our rate of recording depreciation, depletion and amortizationDD&A expense (DD&A) is dependent upon our estimate of proved reserves, which is utilized in our unit-of-production method calculation. If the estimates of proved reserves were to be reduced, the rate at which we record DD&A expense would increase, reducing net income. Such a reduction in reserves may result from lower market prices, which may make it non-economic to drill for and produce higher cost fields. A five percent positive or negative revision to proved reserves throughout the Company would decrease or increase the DD&A rate by approximately $0.05$0.09 to $0.06$0.10 per Mcfe. Revisions in significant fields may individually affect our DD&A rate. It is estimated that a positive or negative reserve revision of 10% in one of our most productive fields would have a $0.01$0.05 to $0.06 impact on our total DD&A rate. These estimated impacts are based on current data, and actual events could require different adjustments to our DD&A.&A rate.
In addition, a decline in proved reserve estimates may impact the outcome of our annual impairment test under Statement of Financial Accounting Standards (SFAS) No. 144, “Accounting for the Impairment or Disposal of Long-Lived AssetsAssets..” Due to the inherent imprecision of the reserve estimation process, risks associated with the operations of proved producing properties and market sensitive commodity prices utilized in our impairment analysis, management cannot determine if an impairment is reasonably likely to occur in the future.
Carrying Value of Oil and Gas Properties
We evaluate the impairment of our oil and gas properties on a lease-by-lease basis whenever events or changes in circumstances indicate an asset’s carrying amount may not be recoverable. We compare expected undiscounted future cash flows to the net book value of the asset. If the future undiscounted expected cash flows, based on our estimate of future crude oil and natural gas prices, operating costs and anticipated production from proved reserves are lower than the net book value of the asset, the capitalized cost is reduced to fair value. Commodity pricing is estimated by using a combination of historical and current prices adjusted for geographical location and quality differentials, as well as other factors that management believes will impact realizable prices. Fair value is calculated by discounting the future cash flows. In 2003, we significantly revisedThe discount factor used (13% at December 31, 2008) is based on management’s belief that this rate is commensurate with the estimated cash flow utilizedrisks inherent in our impairment reviewthe development and production of the Kurten field due to a loss of a reversionary interest in the field.underlying natural gas and oil. In December 2003, our remaining interest in the field was sold. For additional discussion on the Kurten field impairment see Note 2 of the Notes to the Consolidated Financial Statements. In 20042008, 2007 and 2005,2006, there were no unusual or unexpected occurrences that caused significant revisions in estimated cash flows which were utilized in our impairment test. In the event that commodity prices remain low or continue to decline, there could be a significant revision in the future.
Costs attributable to our unproved properties are not subject to the impairment analysis described above; however, a portion of the costs associated with such properties is subject to amortization based on past experience and average property lives. Average property lives are determined on a regional basis and based on the estimated life of unproved property leasehold rights. Historically, the average property liveslife in each of the regions havehas not significantly changed. During the last six months of 2008, commodity prices declined at a significant rate as the global economy struggled with a worldwide recession. This price environment has resulted in reduced capital available for exploration projects as well as development drilling. We have considered these impacts discussed above when assessing the impairment of our undeveloped acreage, especially in exploratory areas. If the average unproved property life decreases or increases by one year, the amortization would increase by approximately $2.7$13.3 million or decrease by approximately $1.6$10.7 million, respectively per year.
Index to Financial Statements
In the past, the average leasehold life in the Gulf Coast region has been shorter than the average life in the East and West regions. Average property lives in the East, Gulf Coast East and West regions have been five, four seven and seven years, respectively. Average property lives in Canada are estimated to be sixfive years. As these properties are developed and reserves are proven, the remaining capitalized costs are subject to depreciation and depletion. If the development of these properties is deemed unsuccessful, the capitalized costs related to the unsuccessful activity is expensed in the year the determination is made. The rate at which the unproved properties are written off depends on the timing and success of our future exploration program.
Accounting for Derivative Instruments and Hedging Activities
Periodically we enter into derivative commodity instruments to hedge our exposure to price fluctuations on natural gas and crude oil production. We follow the accounting prescribed in SFAS No. 133. Under SFAS No. 133, the fair value of each derivative instrument is recorded as either an asset or liability on the balance sheet. At the end of each quarterly period, these instruments are marked-to-market. The gain or loss on the change in fair value is recorded as Accumulated Other Comprehensive Income, a component of equity, to the extent that the derivative instrument is designated as a hedge and is effective. Under SFAS No. 133, effectiveness is a measurement of how closely correlated the hedge instrument is with the underlying physical sale. For example, a natural gas price swap that converts Henry Hub index to a fixed price would be perfectly correlated, and 100% effective, if the underlying gas were sold at the Henry Hub index. AnyThe ineffective portion, if any, of the gains or losses that are considered ineffective underchange in the SFAS No. 133 test arefair value of derivatives designated as hedges, and the change in fair value of all other derivatives, is recorded immediatelycurrently in earnings as a component of Operating Revenue, either in Natural Gas Production orand Crude Oil and Condensate Revenue, onas appropriate in the Consolidated Statement of Operations.
Fair Value Measurements
Effective January 1, 2008, we adopted those provisions of SFAS No. 157, “Fair Value Measurements,” that were required to be adopted. This adoption did not have a material impact on any of our financial statements. As defined in SFAS No. 157, fair value is the price that would be received to sell an asset or paid to transfer a liability in an orderly transaction between market participants at the measurement date (exit price). The transaction is based on a hypothetical transaction in the principal or most advantageous market considered from the perspective of the market participant that holds the asset or owes the liability.
We utilize market data or assumptions that market participants who are independent, knowledgeable and willing and able to transact would use in pricing the asset or liability, including assumptions about risk and the risks inherent in the inputs to the valuation technique. These inputs can be readily observable, market corroborated or generally unobservable. We attempt to utilize valuation techniques that maximize the use of observable inputs and minimize the use of unobservable inputs. We are able to classify fair value balances based on the observability of those inputs. SFAS No. 157 establishes a formal fair value hierarchy based on the inputs used to measure fair value. The hierarchy gives the highest priority to level 1 measurements and the lowest priority to level 3 measurements, and accordingly, level 1 measurements should be used whenever possible.
As of December 31, 2008, we had $355.2 million of assets, or 10% of our total assets, classified as Level 3. This was entirely comprised of our derivative receivable balance from our oil and gas cash flow hedges. During 2008, realized gains of $347.9 million were recognized in other comprehensive income. Derivative settlements during the year totaled $13.0 million. The fair values of our natural gas and crude oil price collars and swaps are valued based upon quotes obtained from counterparties to the agreements and are designated as Level 3. Such quotes have been derived using a Black-Scholes model for the active oil and gas commodities market that considers various inputs including current market and contractual prices for the underlying instruments, quoted forward prices for natural gas and crude oil, volatility factors and interest rates, such as a LIBOR curve for a similar length of time as the derivative contract term. Although we utilize multiple quotes to assess the reasonableness of our values, we have not attempted to obtain sufficient corroborating market evidence to support classifying these derivative contracts as Level 2. We adjust the fair value quotes received by our counterparties to take into account either the counterparties’ nonperformance risk or our own nonperformance
Index to Financial Statements
risk. We measured the nonperformance risk of our counterparties by reviewing credit default swap spreads for the various financial institutions in which we have derivative transactions and made a reduction to our derivative receivable. In times where we have net derivative contract liabilities, our nonperformance risk is evaluated using a market credit spread provided by our bank. Additional disclosures are required for transactions measured at fair value and we have included these disclosures in Note 7 of the Notes to the Consolidated Financial Statements.
Long-Term Employee Benefit Costs
Our costs of long-term employee benefits, particularly pension and postretirement benefits, are incurred over long periods of time, and involve many uncertainties over those periods. The net periodic benefit cost attributable to current periods is based on several assumptions about such future uncertainties, and is sensitive to changes in those assumptions. It is management’s responsibility, often with the assistance of independent experts, to select assumptions that in its judgment represent best estimates of those uncertainties. It also is management’s responsibility to review those assumptions periodically to reflect changes in economic or other factors that affect those assumptions.
The current benefit service costs, as well as the existing liabilities, for pensions and other postretirement benefits are measured on a discounted present value basis. The discount rate is a current rate, related to the rate at which the liabilities could be settled. Our assumed discount rate is based on average rates of return published for a theoretical portfolio of high-quality fixed income securities. In order to select the discount rate, we use benchmarks such as the
Moody’s Aa Corporate Rate, which was 5.48% annualized for 2005,5.54% as of December 31, 2008, and the Citigroup Pension Liability Index, which was 5.55% for 2005.5.87% as of December 31, 2008. We look to these benchmarks as well as considering durations of expected benefit payments. We have determined based on these assumptions that a discount rate of 5.5%5.75% at December 31, 20052008 is reasonable.
In order to value our pension liabilities, we use the RP-2000 mortality table. This is a widely accepted table used for valuing pension liabilities. This table represents a more recent and conservative mortality table than the prior years’ 1983 Group AnnuityCombined Mortality Table and appears to be an appropriate table based on the demographics of our benefit plans. Another consideration that is made is a salary scale selection. We have also assumed that salaries will increase 4%four percent based on our expectation of future salary increases.
The benefit obligation and the periodic cost of postretirement medical benefits also are measured based on assumed rates of future increase in the per capita cost of covered health care benefits. As of December 31, 2005,2008, the assumed rate of increase was 9.0%. The net periodic cost of pension benefits included in expense also is affected by the expected long-term rate of return on plan assets assumption. The expected return on plan assets rate is normally changed less frequently than the assumed discount rate, and reflects long-term expectations, rather than current fluctuations in market conditions. The actual rate of return on plan assets may differ from the expected rate due to the volatility normally experienced in capital markets. Management’s goal is to manage the investments over the long termlong-term to achieve optimal returns with an acceptable level of risk and volatility.
We have established objectives regarding plan assets in the pension plan. We attempt to maximize return over the long-term, subject to appropriate levels of risk. One of our plan objectives is that the performance of the equity portion of the pension plan exceed the Standard and Poors’ 500 Index over the long-term. We also seek to achieve a minimum five percent annual real rate of return (above the rate of inflation) on the total portfolio over the long-term. We establish the long-term expected rate of return by developing a forward-looking long-term expected rate of return assumption for each asset class, taking into account factors such as the expected real return for the specific asset class and inflation. In our pension calculations, we have used 8%eight percent as the expected long-term return on plan assets for 2005, 20042008, 2007 and 2003. However,2006. A Monte Carlo simulation was run using 5,000 simulations based upon our actual asset allocation and liability duration, which has been determined to be approximately 15 years. This model uses historical data for the period of 1926-2007 for stocks, bonds and cash to determine the best estimate range of future returns. The median rate of return, or return that we expect to achieve over 50 percent of the time, is approximately nine percent. We expect to achieve at a minimum 5%approximately 7% annual real rate of return on the total portfolio over the long term.long-term at least 75 percent of the time. We believe that thisthe eight percent chosen is a reasonable estimate based on our actual results. The actual rate of return on plan assets annualized over the past ten years is approximately 10%.
Index to Financial Statements
We generally target a portfolio of assets utilizing equity securities, fixed income securities and cash equivalents that are within a range of approximately 60%50% to 80% for equity securities and approximately 20% to 40% for fixed income securities. Large capitalization equities may make up a maximum of 65% of the portfolio. Small capitalization equities and international equities may make up a maximum of 30% and 15%, respectively, of the portfolio. Fixed income bonds may make up a maximum of 40% of our portfolio. The account will typically be fully invested; however, as a temporary investment or an asset protection measure, part of the account may be invested in money market investments up to 20%. One percent of the portfolio is invested in short-term funds at the designated bank to meet the cash flow needs of the plan. No prohibited investments, including direct or indirect investments in commodities, commodity futures, derivatives, short sales, real estate investment trusts, letter stock, restricted stock or other private placements, are allowed without prior committee approval.
Stock-Based Compensation
Prior to the issuance of SFAS No. 123(R) “Share Based Payment (revised 2004)”, there were two alternative methods that could be used toWe account for stock-based compensation. The firstcompensation under a fair value based method is the Intrinsic Value methodof accounting for stock options and recognizes compensation cost as the excess, if any, of the quoted market price of our stock at the grant date over the amount an employee must pay to acquire the stock. The second method is the Fair Value method.similar equity instruments. Under the fair value method, compensation cost is measured at the grant date based on the value of an award and is recognized over the service period, which is usually the vesting period. As of December 31, 2005, we account for stock-based compensation in accordance with the Intrinsic Value method. SFAS No. 123(R) requires that the fair value of stock options and any other equity-based compensation must be expensed at the grant date. To calculate the fair value, either a binomial or Black-Scholes valuation model may be used. We currently expense performance share awards; however, beginning in the first quarterStock-based compensation cost for all types of 2006, we will be required to expense all stock-based compensation. Further discussion of SFAS No. 123(R) and stock compensationawards is included in “Recently Issued Accounting Pronouncements.”General and Administrative Expense in the Consolidated Statement of Operations.
Stock options and stock appreciation rights (SARs) are granted with an exercise price equal to the average of the high and low trading price of our stock on the grant date. The grant date fair value is calculated by using a Black-Scholes model that incorporations assumptions for stock price volatility, risk free rate of return, expected dividend and expected term. The expected term was derived by reviewing minimum and maximum expected term outputs from the Black-Scholes model based on award type and employee type. This term represents the period of time that awards granted are expected to be outstanding. The stock price volatility was calculated using our historical closing stock price data for the period associated with the expected term through the grant date of each award. The risk free rate of return percentages are based on the continuously compounded equivalent of the US Treasury (Nominal 10) within the expected term as measured on the grant date. The expected dividend percentage assumes that we will continue to pay a consistent level of dividend each quarter. Expense is recorded based on a graded-vesting schedule over a three year service period, with one-third of the award becoming exercisable each year on the anniversary date of the grant. The forfeiture rate is determined based on the forfeiture history by type of award and by the group of individuals receiving the award.
The fair value of restricted stock awards, restricted stock units and certain performance share awards (which contain vesting restrictions based either on operating income or internal performance metrics) are measured based on the average of the high and low trading price of our stock on the grant date. Restricted stock awards primarily vest either at the end of a three year service period, or on a graded-vesting basis of one-third at each anniversary date over a three year service period. The annual forfeiture rate for restricted stock awards ranges from 0% to 7.2% based on approximately ten years of our history for this type of award to various employee groups. Performance shares that vest based on operating income vest on a graded-vesting basis of one-third at each anniversary date over a three year service period and no forfeiture rate is assumed. Performance shares that vest based on internal metrics vest at the end of a three year performance period and an annual forfeiture rate of 4.5% is assumed. Expense for restricted stock units is recorded immediately as these awards vest immediately. Restricted stock units are granted only to our directors and no forfeiture rate is assumed.
We grant another type of performance share award to executive employees that vest at the end of a three year performance period based on the comparative performance of our stock measured against sixteen other companies in our peer group. Depending on our performance, up to 100% of the fair market value of a share of our stock may be payable in stock plus an additional 100% of the fair market value of a share of our stock may be payable in cash. These awards are accounted for by bifurcating the equity and liability components. A Monte
Index to Financial Statements
Carlo model is used to value the liability component as well as the equity portion of the certain awards on the date of grant. The four primary inputs for the Monte Carlo model are the risk-free rate, volatility of returns, correlation in movement of total shareholder return and the expected dividend. The risk-free rate was generated from the Federal Reserve website for constant maturity treasuries for one and two year bonds and is set equal to the yield, for the period over the remaining duration of the performance period, on treasury securities as of the reporting date. Volatility was set equal to the annualized daily volatility measured over a historic one and two year period ending on the reporting date. Correlation in movement of total shareholder return was determined based on a correlation matrix that was created which identifies total shareholder return correlations for each pair of companies in the peer group, including us. The paired returns in the correlation matrix ranged from approximately 71% to approximately 89% for us and our peer group. The expected dividend is calculated using our dividends paid ($0.12 for 2008) divided by the December 31, 2008 closing price of our stock ($26.00). Based on these inputs discussed above, a ranking was projected identifying our rank relative to the peer group. No forfeiture rate is assumed for this type of award. Expense related to these awards can be volatile based on our comparative ranking at the end of each quarter.
We used the shortcut approach to derive our initial windfall tax benefit pool. We chose to use a one-pool approach which combines all awards granted to employees, including non-employee directors.
On October 26, 2005, the Compensation Committee ofJanuary 16, 2008, our Board of Directors approvedadopted a Supplemental Employee Incentive Plan. The plan was intended to provide a compensation tool tied to stock market value creation to serve as an incentive and retention vehicle for full-time non-officer employees by providing for cash payments in the accelerationevent our common stock reached specified trading prices. The bonus payout of a minimum of 50% of an employee’s base salary was triggered if, for any 20 trading days (which need not be consecutive) that fell within a period of 60 consecutive trading days occurring on or before November 1, 2011, the closing price per share of our common stock equaled or exceeded the final price goal of $60 per share. The plan also provided that an interim distribution of 10% of an employee’s base salary would be paid to eligible employees upon achieving the interim price goal of $50 per share prior to December 15, 200531, 2009.
On the January 16, 2008 adoption date of the vestingplan, our closing stock price was $40.71. On April 8, 2008 and subsequently on June 2, 2008, we achieved the interim and final target goals and total distributions of 198,799 unvested stock options awarded$15.7 million were paid in February 20032009. No further distributions will be made under this plan.
On July 24, 2008, our Second Amended and Restated 1994 Long-TermBoard of Directors adopted a second Supplemental Employee Incentive Plan and 24,500 unvested stock options awarded in April 2004 under our 2004(“Plan II”). Plan II is similar to the January 2008 Supplemental Incentive Plan.
The 198,799 shares awarded to employees underPlan; however, the 1994 plan at an exercisefinal target is that the closing price of $15.32 would have vested in February 2006. The 24,500 shares awarded to non-employee directors under the 2004 plan at an exercise price of $23.32 would have vested 12,250 shares in April 2006 and April 2007, respectively. The decision to accelerate the vesting of these unvested options, which we believed to be in the best interestper share of our shareholderscommon stock must equal or exceed the price goal of $105 per share on or before June 20, 2012. Under Plan II, each eligible employee may receive (upon approval by the Compensation Committee) a distribution of 50% of his or her base salary (or 30% of base salary if we paid interim distributions upon the achievement of the interim price goal discussed below). Plan II provides that a distribution of 20% of an eligible employee’s base salary upon achieving the interim price goal of $85 per share on or before June 30, 2010. The Compensation Committee can increase the 50% or 20% payment as it applies to any employee. Payments under this plan will partially be paid within 15 business days after achieving the target and employees, was made solely to reduce compensation expense and administrative burden associated with our adoption ofthe remaining portion will be paid based on a separate payment date as described in Plan II.
These awards under both plans discussed above have been accounted for as liability awards under SFAS No. 123(R).
The accelerated vesting, and the total expense for 2008 was $15.9 million. For further information regarding the supplemental employee incentive plans and our other stock-based compensation awards, please refer to Note 10 of the options did not have an impact on our results of operations or cash flows for 2005. The acceleration of vesting is expectedNotes to reduce our compensation expense related to these options by approximately $0.2 million for 2006.the Consolidated Financial Statements.
OTHER ISSUES AND CONTINGENCIES
Corporate Income Tax.We have benefited in the past and may benefit in the future from the alternative minimum tax (AMT) relief granted under the Comprehensive National Energy Policy Act of 1992 (the Act). The Act repealed provisions of the AMT requiring a taxpayer’s alternative minimum taxable income to be increased on account of certain intangible drilling costs (IDC) and percentage depletion deductions for corporations other than integrated oil companies. The repeal of these provisions generally applies to taxable years beginning after 1992. The repeal of the excess IDC preference can not reduce a taxpayer’s alternative minimum taxable income by more than 40% of the amount of such income determined without regard to the repeal of such preference.
Regulations. Our operations are subject to various types of regulation by federal, state and local authorities. See “Regulation of Oil and Natural Gas Exploration and Production”,Production,” “Natural Gas Marketing, Gathering and Transportation”,
Index to Financial Statements
Transportation,” “Federal Regulation of Petroleum” and “Environmental Regulations” in the “Other Business Matters” section of Item 1 “Business” for a discussion of these regulations.
Restrictive Covenants. Our ability to incur debt and to make certain types of investments is subject to certain restrictive covenants in the Company’sour various debt instruments. Among other requirements, our revolving credit agreement and our senior notes specify a minimum annual coverage ratio of operating cash flow to interest expense for the trailing four quarters of 2.8 to 1.0. Our senior notes require us to maintain a ratio of cash and proved reserves to indebtedness and other liabilities of 1.5 to 1.0. At December 31, 2005,2008, we arewere in compliance in all material respects with all restrictive covenants on both the revolving credit agreement and notes. In the unforeseen event that we fail to comply with these covenants, the Companywe may apply for a temporary waiver with the lender, which, if granted, would allow us a period of time to remedy the situation. See further discussion in Capital“Capital Resources and Liquidity.”
Limited Partnership.As part of the 2001 Cody acquisition, we acquired an interest in certain oil and gas properties in the Kurten field, as general partner of a partnership and as an operator. We had approximately a 25% interest in the field, including a one percent interest in the partnership. Under the partnership agreement, we had the right to a reversionary working interest that would bring our ultimate interest to 50% upon the limited partner reaching payout. Based on the addition of this reversionary interest, and because the field has over a 40-year reserve life, approximately $91 million was allocated to this field under purchase accounting at the time of the acquisition. Additionally, the limited partner had the sole option to trigger a liquidation of the partnership.
Effective February 13, 2003, liquidation of the partnership commenced at the election of the limited partner. The limited partner was a financial entity and not an industry operator. Their decision to liquidate was based upon their perception that the value of their investment in the partnership had increased due to an increase in underlying commodity prices, primarily oil, since their investment in 1999. We proceeded with the liquidation to avoid having a minority interest in a non-operated water flood field for which the new operator was not designated at the time of liquidation. In connection with the liquidation, an appraisal was required to be obtained to allocate the interest in the partnership assets. Additionally, we were required to test the field for recoverability in accordance with SFAS No. 144. Pursuant to the terms of the partnership agreement and based on the appraised value of the partnership assets it was not possible for us to obtain the reversionary interest as part of the liquidation. Due to the impact of the loss of the reversionary interest on future estimated net cash flows of the Kurten field, the limited partner’s decision and our decision to proceed with the liquidation, an impairment review was performed which required an impairment charge in the first quarter of 2003 of $87.9 million ($54.4 million after-tax). This impairment charge is reflected in the 2003 Statement of Operations as an operating expense but did not impact our cash flows.
Operating Risks and Insurance Coverage.Our business involves a variety of operating risks. See “Risk Factors—We face a variety of hazards and risks that could cause substantial financial losses” in Item 1A. In accordance with customary industry practice, we maintain insurance against some, but not all, of these risks and losses. The occurrence of any of these events not fully covered by insurance could have a material adverse effect on our financial position and results of operations. The costs of these insurance policies are somewhat dependent on our historical claims experience and also the areas in which we choose to operate. During the past few years, we have invested a significant portion of our drilling dollars in the Gulf Coast, where insurance rates are significantly higher than in other regions such as the East.
Commodity Pricing and Risk Management Activities.Our revenues, operating results, financial condition and ability to borrow funds or obtain additional capital depend substantially on prevailing prices for natural gas and, to a lesser extent, oil. Declines in oil and gas prices may have a material adverse effect on our financial condition, liquidity, ability to obtain financing and operating results. Lower oil and gas prices also may reduce the amount of oil and gas that we can produce economically. Historically, oil and gas prices and markets have been volatile, with prices fluctuating widely, and they are likely to continue to be volatile. Depressed prices in the future would have a negative impact on our future financial results. In particular, substantially lower prices would significantly reduce revenue and could potentially impact the outcome of our annualtrigger an impairment test under SFAS No. 144, “Accounting for the Impairment or Disposal of Long-Lived Assets.” Because our reserves are predominantly natural gas, changes in natural gas prices may have a particularly large impact on our financial results.
The majority of our production is sold at market responsive prices. Generally, if the commodity indexes fall, the price that we receive for our production will also decline. Therefore, the amount of revenue that we realize is partially determined by factors beyond our control. However, management may mitigate this price risk with the use of derivative financial instruments. Most recently, we have used financial instruments such as price collarcollars and swap arrangements to reduce the impact of declining prices on our revenue. Under both arrangements, there is also a risk that the movement of the index prices willmay result in the Company not being ableour inability to realize the full benefit of aan improvement in market improvement.conditions.
Recently Issued Accounting Pronouncements
In March 2005,December 2008, the SEC issued Release No. 33-8995, “Modernization of Oil and Gas Reporting,” which amends the oil and gas disclosures for oil and gas producers contained in Regulations S-K and S-X, as well as adding a section to Regulation S-K (Subpart 1200) to codify the revised disclosure requirements in Securities Act Industry Guide 2, which is being phased out. The goal of Release No. 33-8995 is to provide investors with a more meaningful and comprehensive understanding of oil and gas reserves. Energy companies affected by Release No. 33-8995 will be required to price proved oil and gas reserves using the unweighted arithmetic average of the price on the first day of each month within the 12-month period prior to the end of the reporting period, unless prices are defined by contractual arrangements, excluding escalations based on future conditions. SEC Release No. 33-8995 is effective beginning January 1, 2010. We are currently evaluating what impact Release No. 33-8995 may have on our financial position, results of operations or cash flows.
Index to Financial Statements
In June 2008, the Financial Accounting Standards Board (FASB) issued FASB Interpretation (FIN)Staff Position (FSP) No. 47, “Accounting for Conditional Asset Retirement Obligations.Emerging Issues Task Force (EITF) 03-6-1, “Determining Whether Instruments Granted in Share-Based Payment Transactions Are Participating Securities.” This Interpretation clarifiesUnder this FSP, unvested share-based payment awards that contain nonforfeitable rights to dividends or dividend equivalents, whether they are paid or unpaid, are considered participating securities and should be included in the definition and treatmentcomputation of conditional asset retirement obligations as discussed in SFASearnings per share pursuant to the two-class method. FSP No. 143, “Accounting for Asset Retirement Obligations.” A conditional asset retirement obligation is defined as an asset retirement activity in which the timing and/or method of settlement are dependent on future events that may be outside the control of the Company. FIN No. 47 states that a company must record a liability when incurred for conditional asset retirement obligations if the fair value of the obligation is reasonably estimable. This Interpretation is intended to provide more information about long-lived assets, more information about future cash outflows for these obligations and more consistent recognition of these liabilities. FIN No. 47EITF 03-6-1 is effective for fiscal years ending after December 15, 2005. Our financial position, results of operations and cash flows were not impacted by this Interpretation, since we currently record all asset retirement obligations.
On April 4, 2005, the FASBstatements issued FASB Staff Position (FSP) FAS 19-1 “Accounting for Suspended Well Costs.” This staff position amends FASB Statement No. 19 “Financial Accounting and Reporting by Oil and Gas Producing Companies” and provides guidance about exploratory well costs to companies who use the successful efforts method of accounting. The position states that exploratory well costs should continue to be capitalized if: 1) a sufficient quantity of reserves are discovered in the well to justify its completion as a producing well and 2) sufficient progress is made in assessing the reserves and the well’s economic and operating feasibility. If the exploratory well costs do not meet both of these criteria, these costs should be expensed, net of any salvage value. Additional annual disclosures are required to provide information about management’s evaluation of capitalized exploratory well costs. In addition, the Staff Position requires the annual disclosure of: 1) net changes from period to period of capitalized exploratory well costs for wells that are pending the determination of proved reserves, 2) the amount of exploratory well costs that have been capitalized for a period greater than one year after the completion of drilling and 3) an aging of exploratory well costs suspended for greater than one year with the number of wells it related to. Further, the disclosures should describe the activities undertaken to evaluate the reserves and the projects, the information still required to classify the associated reserves as proved and the estimated timing for completing the evaluation. For our disclosures, refer to Note 2 of the Notes to the Consolidated Financial Statements.
In May 2005, the FASB issued SFAS No. 154, “Accounting Changes and Error Corrections-A replacement of APB Opinion No. 20 and FASB Statement No. 3.” In order to enhance financial reporting consistency between periods, SFAS No. 154 modifies the requirements for the accounting and reporting of the direct effects of changes in accounting principles. Under APB Opinion No. 20, the cumulative effect of voluntary changes in accounting principle
was recognized in Net Income in the period of the change. Unlike the treatment previously prescribed by APB Opinion No. 20, retrospective application is now required, unless it is not practical to determine the specific effects in each period or the cumulative effect. If the period specific effects cannot be determined, it is required that the new accounting principle must be retrospectively applied in the earliest period possible to the balance sheet accounts and a corresponding adjustment be made to the opening balance of retained earnings or another equity account. If the cumulative effect cannot be determined, it is necessary to apply the new accounting principles prospectively at the earliest practical date. If it is not feasible to retrospectively apply the change in principle, the reason that this is not possible and the method used to report the change is required to be disclosed. The statement also provides that changes in accounting for depreciation, depletion or amortization should be treated as changes in accounting estimate inseparable from a change in accounting principle and that disclosure of the preferability of the change is required. SFAS No. 154 is effective for accounting changes made in fiscal years beginning after December 15, 2005.2008, and interim periods within those years. In addition, all prior period earnings per share data presented should be adjusted retrospectively and early application is not permitted. We do not believe that FSP No. EITF 03-6-1 will have a material impact on our financial position, results of operations or cash flows.
In December 2004,May 2008, the FASB issued SFAS No. 123(R), “Share-Based Payment.162, “The Hierarchy of Generally Accepted Accounting Principles,” which identifies a consistent framework for selecting accounting principles to be used in preparing financial statements for nongovernmental entities that are presented in conformity with United States generally accepted accounting principles (GAAP). The current GAAP hierarchy was criticized due to its complexity, ranking position of FASB Statements of Financial Accounting Concepts and the fact that it is directed at auditors rather than entities. SFAS No. 123(R) revises162 will be effective 60 days following the SEC’s approval of the Public Company Accounting Oversight Board amendments to AU Section 411, “The Meaning of Present Fairly in Conformity with Generally Accepted Accounting Principles.” The FASB does not expect that SFAS No. 123,162 will have a change in current practice, and we do not believe that SFAS No. 162 will have an impact on our financial position, results of operations or cash flows.
In March 2008, the FASB issued SFAS No. 161, “Disclosures about Derivative Instruments and Hedging Activities,” which amends SFAS No. 133, “Accounting for Stock-Based Compensation,Derivative Instruments and Hedging Activities.” Enhanced disclosures to improve financial reporting transparency are required and focuses on accountinginclude disclosure about the location and amounts of derivative instruments in the financial statements, how derivative instruments are accounted for share-based payments for services provided by employee to employer. The statement requires companies to expenseand how derivatives affect an entity’s financial position, financial performance and cash flows. A tabular format including the fair value of employee stock optionsderivative instruments and other equity-based compensationtheir gains and losses, disclosure about credit risk-related derivative features and cross-referencing within the footnotes are also new requirements. SFAS No. 161 is effective for financial statements issued for fiscal years and interim periods beginning after November 15, 2008, with early application and comparative disclosures encouraged, but not required. We have not yet adopted SFAS No. 161. We do not believe that there will be an impact on our financial position, results of operations or cash flows.
In December 2007, the FASB issued SFAS No. 141(R), “Business Combinations.” SFAS No. 141(R) was issued in an effort to continue the movement toward the greater use of fair values in financial reporting and increased transparency through expanded disclosures. It changes how business acquisitions are accounted for and will impact financial statements at the grant date.acquisition date and in subsequent periods. Certain of these changes will introduce more volatility into earnings. The statement does not require a certain typeacquirer must now record all assets and liabilities of valuation model,the acquired business at fair value, and either a binomial or Black-Scholes model mayrelated transaction and restructuring costs will be used. Duringexpensed rather than the first quarterprevious method of 2005,being capitalized as part of the Securities and Exchange Commission (SEC) approved a new rule for public companies to delayacquisition. SFAS No. 141(R) also impacts the adoption of this standard. In April 2005,annual goodwill impairment test associated with acquisitions, including those that close before the SEC took further action to amend Regulation S-X to state that the provisionseffective date of SFAS No. 123(R) will be141(R). The definitions of a “business” and a “business combination” have been expanded, resulting in more transactions qualifying as business combinations. SFAS No. 141(R) is effective beginning with the first annual orfor fiscal years, and interim reporting period of the registrant’s firstperiods within those fiscal yearyears, beginning on or after June 15, 2005 for all non-small business issuers. As a result, we will not adopt this SFAS untilDecember 31, 2008 and earlier adoption is prohibited. We cannot predict the first quarter of 2006. We plan to use the modified prospective application method as detailed in SFAS No. 123(R). At this time, management does not believeimpact that the adoption of SFAS No. 123(R)141(R) will materially impact our operating results, nor will there be any impacthave on our futurefinancial position, results of operations or cash flows. See “Stock-Based Compensation” below for further information.
In October 2005, the FASB issued FSP FAS 123(R)-2, “Practical Accommodationflows with respect to the Application of Grant Date as defined in FASB Statement No. 123(R).” This FSP provides guidance on the definition and practical application of “grant date” as described in SFAS No. 123(R). The grant date is described as the date that the employee and employer have met a mutual understanding of the key terms and conditions of an award. The other elements of the definition of grant date are: 1) the award must be authorized, 2) the employer must be obligated to transfer assets or distribute equity instruments so long as the employee has provided the necessary service and 3) the employee is affected by changes in the company’s stock price. To determine the grant date, we are allowed to use the date the award is approved in accordance with our corporate governance requirements so long as the three elements described above are met. Furthermore, the recipient cannot negotiate the award’s terms and conditions with the employer and the key terms and conditions of the award are communicated to all recipients within a reasonably short time period from the approval date. We will adopt this FSP in conjunction with the adoption of SFAS No. 123(R).
In November 2005, the FASB issued FSP FAS 123(R)-3 “Transition Election Related to Accounting for the Tax Effects of Share-Based Payment Awards,” which provides a simpler, more practical transition election relating to the calculation of the “APIC pool.” The APIC pool is defined as the pool of excess tax benefits available to absorb tax deficiencies occurringany acquisitions completed after the adoption of SFAS No. 123(R). Under this FSP, companies can elect to perform simpler computations to derive the beginning balance of the APIC pool as well as the impact on the APIC pool of fully vested and outstanding awards as of the SFAS No. 123(R) adoption date. The beginning balance can be computed by taking the sum of all tax benefits incurred prior to the adoption of SFAS No. 123(R) from stock-based compensation plans less the tax effected (using a blended statutory rate) pro forma stock-based compensation cost. In addition, increases to the APIC pool for fully vested awards can be calculated by multiplying the tax rate times the tax benefit of the deduction. The calculation of any awards that are partially vested or granted after the SFAS No. 123(R) adoption date will not be affected by this FSP and will be calculated in accordance with SFAS No. 123(R) which requires that only the excess tax benefit or deficiency of the tax deduction over the tax effect of the compensation cost recognized should be considered for the APIC pool. Also under the FSP, all tax benefits recognized on fully vested awards and the excess tax benefits for partially vested and new awards will be reported on the Statement of Cash Flows as a component of financing activities. Companies will have up to one year after adopting SFAS No. 123(R) to decide to elect and disclose whether they plan to use the alternative method or the original method prescribed in SFAS No. 123(R) for the calculation of the APIC pool. We will adopt this FSP in conjunction with the adoption of SFAS No. 123(R).
In February 2006, the FASB issued FSP FAS 123(R)-4, “Classification of Options and Similar Instruments Issued as Employee Compensation That Allow for Cash Settlement upon the Occurrence of a Contingent Event.” Within certain share-based payment plans, a company can be required to settle outstanding options upon the occurrence of certain events, such as a change in control or liquidity of a company or the death or disability of the shareholder. This FSP amends paragraphs 32 and A229 of SFAS No. 123(R) to incorporate a probability assessment by a company. Under SFAS No. 123(R), it is required that options and similar instruments be classified as liabilities if the entity can be required under any circumstances to settle the instrument in cash or other assets. Under the FSP, a cash settlement feature that can be exercised only upon the occurrence of a contingent event that is outside of the employee’s control does not meet the criteria for liability classification, and should remain to be classified in equity, unless it becomes probable that the contingent event will occur. The effective date for the guidance in this FSP is upon the initial adoption of SFAS No. 123(R). We will adopt this FSP in conjunction with the adoption of SFAS No. 123(R).
* * *December 31, 2008.
Forward-Looking Information
The statements regarding future financial and operating performance and results, market prices, future hedging activities, and other statements that are not historical facts contained in this report are forward-looking statements. The words “expect,” “project,” “estimate,” “believe,” “anticipate,” “intend,” “budget,” “plan,” “forecast,
Index to Financial Statements
“forecast,” “predict,” “may,” “should,” “could,” “will” and similar expressions are also intended to identify forward-looking statements. Such statements involve risks and uncertainties, including, but not limited to, market factors, market prices (including regional basis differentials) of natural gas and oil, results for future drilling and marketing activity, future production and costs and other factors detailed herein and in our other Securities and Exchange Commission filings. See “Risk Factors” in Item 1A for additional information about these risks and uncertainties. Should one or more of these risks or uncertainties materialize, or should underlying assumptions prove incorrect, actual outcomes may vary materially from those indicated.
RESULTS OF OPERATIONS
20052008 and 20042007 Compared
We reported net income for the year ended December 31, 20052008 of $148.4$211.3 million, or $3.04$2.10 per share. During 2004,2007, we reported net income of $88.4$167.4 million, or $1.81$1.73 per share. OperatingThis increase of $43.9 million in net income increased by $98.0 million compared to the prior year, from $160.7 million to $258.7 million. The increase in operating income from 2004 to 2005 was principally due to an increase in natural gas and oil production revenues partially offset by an increase in total operating expenses. Net income increased from 2004 to 2005 by $60.0 millionprimarily due to an increase in operating incomerevenues and gains on asset sales and settlements, partially offset by increased operating, interest and income tax expenses. Operating revenues increased by $213.6 million, largely due to increases in both natural gas production revenues and brokered natural gas revenues and crude oil and condensate revenues. Operating expenses increased by $155.9 million between periods due to increases in all categories of operating expenses other than exploration expense. In addition, net income was impacted by an increase in gain on sale of $37.6assets and gain on settlement of dispute of $39.6 million as well as an increase in expenses of $53.4 million resulting from a combination of increased income tax expense.expense and interest and other expenses. Income tax expense was higher in 2008 as a result of higher income before income taxes in 2008 compared to 2007, in addition to an increase in the effective tax rate.
Natural Gas Production Revenues
Our average total company realized natural gas production sales price, including the realized impact of derivative instruments, was $6.74 per Mcf compared to $5.20$8.39 per Mcf for the comparable period of the prior year.2008 compared to $7.23 per Mcf for 2007. These prices include the realized impact of derivative instruments,instrument settlements, which reduced these pricesincreased the price by $1.33$0.20 per Mcf in 20052008 and $0.76by $0.99 per Mcf in 2004. The following table excludes2007. There was no revenue impact from the unrealized gain from the change in natural gas derivative fair value of $1.1 million and $0.9 million for the years ended December 31, 20052008 and 2004, respectively. These unrealized changes in fair value have been included in the Natural Gas Production Revenues line item in the Statement of Operations.
| Year Ended December 31, | Variance | Year Ended December 31, | Variance | |||||||||||||||||||||||
| 2005 | 2004 | Amount | Percent | 2008 | 2007 | Amount | Percent | |||||||||||||||||||
Natural Gas Production (Mmcf) | ||||||||||||||||||||||||||
East | 25,171 | 24,344 | 827 | 3 | % | |||||||||||||||||||||
Gulf Coast | 28,071 | 31,358 | (3,287 | ) | (10 | )% | 34,577 | 26,797 | 7,780 | 29 | % | |||||||||||||||
West | 23,224 | 21,866 | 1,358 | 6 | % | 26,535 | 25,409 | 1,126 | 4 | % | ||||||||||||||||
East | 21,435 | 19,442 | 1,993 | 10 | % | |||||||||||||||||||||
Canada | 1,149 | 167 | 982 | 588 | % | 4,142 | 3,925 | 217 | 6 | % | ||||||||||||||||
Total Company | 73,879 | 72,833 | 1,046 | 1 | % | 90,425 | 80,475 | 9,950 | 12 | % | ||||||||||||||||
Natural Gas Production Sales Price ($/Mcf) | ||||||||||||||||||||||||||
East | $ | 8.54 | $ | 7.78 | $ | 0.76 | 10 | % | ||||||||||||||||||
Gulf Coast | $ | 6.38 | $ | 5.27 | $ | 1.11 | 21 | % | $ | 9.23 | $ | 8.03 | $ | 1.20 | 15 | % | ||||||||||
West | $ | 6.00 | $ | 4.75 | $ | 1.25 | 26 | % | $ | 7.28 | $ | 6.13 | $ | 1.15 | 19 | % | ||||||||||
East | $ | 8.02 | $ | 5.60 | $ | 2.42 | 43 | % | ||||||||||||||||||
Canada | $ | 6.79 | $ | 4.69 | $ | 2.10 | 45 | % | $ | 7.62 | $ | 5.47 | $ | 2.15 | 39 | % | ||||||||||
Total Company | $ | 6.74 | $ | 5.20 | $ | 1.54 | 30 | % | $ | 8.39 | $ | 7.23 | $ | 1.16 | 16 | % | ||||||||||
Natural Gas Production Revenue (in thousands) | ||||||||||||||||||||||||||
Natural Gas Production Revenue(In thousands) | ||||||||||||||||||||||||||
East | $ | 214,852 | $ | 189,392 | $ | 25,460 | 13 | % | ||||||||||||||||||
Gulf Coast | $ | 179,061 | $ | 165,177 | $ | 13,884 | 8 | % | 319,246 | 215,106 | 104,140 | 48 | % | |||||||||||||
West | 139,298 | 103,851 | 35,447 | 34 | % | 193,100 | 155,676 | 37,424 | 24 | % | ||||||||||||||||
East | 171,902 | 108,935 | 62,967 | 58 | % | |||||||||||||||||||||
Canada | 7,802 | 784 | 7,018 | 895 | % | 31,557 | 21,466 | 10,091 | 47 | % | ||||||||||||||||
Total Company | $ | 498,063 | $ | 378,747 | $ | 119,316 | 32 | % | $ | 758,755 | $ | 581,640 | $ | 177,115 | 30 | % | ||||||||||
Price Variance Impact on Natural Gas Production Revenue | ||||||||||||||||||||||||||
(in thousands) | ||||||||||||||||||||||||||
Gulf Coast | $ | 31,200 | ||||||||||||||||||||||||
West | 28,997 | |||||||||||||||||||||||||
East | 51,798 | |||||||||||||||||||||||||
Canada | 2,414 | |||||||||||||||||||||||||
Total Company | $ | 114,409 | ||||||||||||||||||||||||
Volume Variance Impact on Natural Gas Production Revenue (in thousands) | ||||||||||||||||||||||||||
Gulf Coast | $ | (17,317 | ) | |||||||||||||||||||||||
West | 6,448 | |||||||||||||||||||||||||
East | 11,170 | |||||||||||||||||||||||||
Canada | 4,606 | |||||||||||||||||||||||||
Total Company | $ | 4,907 | ||||||||||||||||||||||||
Index to Financial Statements
| Year Ended December 31, | Variance | ||||||||
| 2008 | 2007 | Amount | Percent | ||||||
Price Variance Impact on Natural Gas Production Revenue | |||||||||
(In thousands) | |||||||||
East | $ | 19,029 | |||||||
Gulf Coast | 41,347 | ||||||||
West | 30,524 | ||||||||
Canada | 8,906 | ||||||||
Total Company | $ | 99,806 | |||||||
Volume Variance Impact on Natural Gas Production Revenue | |||||||||
(In thousands) | |||||||||
East | $ | 6,431 | |||||||
Gulf Coast | 62,793 | ||||||||
West | 6,900 | ||||||||
Canada | 1,185 | ||||||||
Total Company | $ | 77,309 | |||||||
The increase in Natural Gas Production Revenue of $177.1 million is due substantially to the increase in realized natural gas sales prices. Inprices in addition the slightto an increase in natural gas production. Natural gas production was due to the successful drilling programs in the East, West and Canada. Partially offsetting this was the decrease in the Gulf Coast production. Theregion increased due to increased production in the Minden field, largely due to the properties we acquired in east Texas in August 2008, as well as increased drilling in the County Line field. In addition, natural gas production increased in the West region associated with an increase in the realized natural gas price combined withdrilling program, increased in the increaseEast region as a result of increased drilling activity in production resultedWest Virginia and northeastern Pennsylvania. Canada increased due to drilling in a net revenue increase of $119.3 million.the Hinton field.
Brokered Natural Gas Revenue and Cost
| Year Ended December 31, | Variance | |||||||||||||
| 2005 | 2004 | Amount | Percent | |||||||||||
Sales Price ($/Mcf) | $ | 9.14 | $ | 6.56 | $ | 2.58 | 39 | % | ||||||
Volume Brokered (Mmcf) | 10,793 | 12,876 | (2,083 | ) | (16 | )% | ||||||||
Brokered Natural Gas Revenues (in thousands) | $ | 98,605 | $ | 84,416 | ||||||||||
Purchase Price ($/Mcf) | $ | 8.08 | $ | 5.84 | $ | 2.24 | 38 | % | ||||||
Volume Brokered (Mmcf) | 10,793 | 12,876 | (2,083 | ) | (16 | )% | ||||||||
Brokered Natural Gas Cost (in thousands) | $ | 87,183 | $ | 75,217 | ||||||||||
Brokered Natural Gas Margin (in thousands) | $ | 11,422 | $ | 9,199 | $ | 2,223 | 24 | % | ||||||
(in thousands) | ||||||||||||||
Sales Price Variance Impact on Revenue | $ | 27,852 | ||||||||||||
Volume Variance Impact on Revenue | (13,664 | ) | ||||||||||||
| $ | 14,188 | |||||||||||||
(in thousands) | ||||||||||||||
Purchase Price Variance Impact on Purchases | $ | (24,130 | ) | |||||||||||
Volume Variance Impact on Purchases | 12,165 | |||||||||||||
| $ | (11,965 | ) | ||||||||||||
| Year Ended December 31, | Variance | |||||||||||||
| 2008 | 2007 | Amount | Percent | |||||||||||
Sales Price($/Mcf) | $ | 10.39 | $ | 8.40 | $ | 1.99 | 24 | % | ||||||
Volume Brokered(Mmcf) | x | 10,996 | x | 11,101 | (105 | ) | (1 | %) | ||||||
Brokered Natural Gas Revenues(In thousands) | $ | 114,220 | $ | 93,215 | ||||||||||
Purchase Price($/Mcf) | $ | 9.14 | $ | 7.37 | $ | 1.77 | 24 | % | ||||||
Volume Brokered(Mmcf) | x | 10,996 | x | 11,101 | (105 | ) | (1 | %) | ||||||
Brokered Natural Gas Cost(In thousands) | $ | 100,449 | $ | 81,819 | ||||||||||
Brokered Natural Gas Margin(In thousands) | $ | 13,771 | $ | 11,396 | $ | 2,375 | 21 | % | ||||||
(In thousands) | ||||||||||||||
Sales Price Variance Impact on Revenue | $ | 21,882 | ||||||||||||
Volume Variance Impact on Revenue | (882 | ) | ||||||||||||
| $ | 21,000 | |||||||||||||
(In thousands) | ||||||||||||||
Purchase Price Variance Impact on Purchases | $ | (19,399 | ) | |||||||||||
Volume Variance Impact on Purchases | 774 | |||||||||||||
| $ | (18,625 | ) | ||||||||||||
The increased brokered natural gas margin of $2.2$2.4 million was driven byis a result of an increasedincrease in sales price that outpaced the increase in purchase cost,price, partially offset in part by a decrease in volume.the volumes brokered in 2008 over 2007.
Index to Financial Statements
Crude Oil and Condensate Revenues
Our average total company realized crude oil sales price for 2005, including the realized impact of derivative instruments, was $44.19 per Bbl compared to $31.55$89.11 per Bbl for 2004.2008 compared to $67.16 per Bbl for 2007. These prices include the realized impact of derivative instruments,instrument settlements, which reduced these pricesdecreased the price by $9.93$6.33 per Bbl in 20052008 and $8.98by $0.97 per Bbl in 2004. The following table excludes2007. There was no revenue impact from the unrealized gain from the change in crude oil and condensate derivative fair value of $5.5 million and the unrealized loss from the change in derivative fair value of $2.9 million for the years ended December 31, 2005 and 2004, respectively. These unrealized changes in fair value have been included in the Crude Oil and Condensate Revenues line item in the Statement of Operations.2008 or 2007.
| Year Ended December 31, | Variance | Year Ended December 31, | Variance | |||||||||||||||||||||||||
| 2005 | 2004 | Amount | Percent | 2008 | 2007 | Amount | Percent | |||||||||||||||||||||
Crude Oil Production (Mbbl) | ||||||||||||||||||||||||||||
East | 23 | 26 | (3 | ) | (12 | %) | ||||||||||||||||||||||
Gulf Coast | 1,528 | 1,805 | (277 | ) | (15 | )% | 578 | 605 | (27 | ) | (4 | %) | ||||||||||||||||
West | 166 | 159 | 7 | 4 | % | 160 | 174 | (14 | ) | (8 | %) | |||||||||||||||||
East | 27 | 27 | — | — | ||||||||||||||||||||||||
Canada | 18 | 4 | 14 | 350 | % | 21 | 18 | 3 | 17 | % | ||||||||||||||||||
Total Company | 1,739 | 1,995 | (256 | ) | (13 | )% | 782 | 823 | (41 | ) | (5 | %) | ||||||||||||||||
Crude Oil Sales Price ($/Bbl) | ||||||||||||||||||||||||||||
East | $ | 92.07 | $ | 66.97 | $ | 25.10 | 37 | % | ||||||||||||||||||||
Gulf Coast | $ | 42.81 | $ | 30.67 | $ | 12.14 | 40 | % | $ | 87.39 | $ | 67.17 | $ | 20.22 | 30 | % | ||||||||||||
West | $ | 55.37 | $ | 40.29 | $ | 15.08 | 37 | % | $ | 95.48 | $ | 67.86 | $ | 27.62 | 41 | % | ||||||||||||
East | $ | 53.84 | $ | 38.28 | $ | 15.56 | 41 | % | ||||||||||||||||||||
Canada | $ | 43.39 | $ | 37.93 | $ | 5.46 | 14 | % | $ | 85.08 | $ | 59.96 | $ | 25.12 | 42 | % | ||||||||||||
Total Company | $ | 44.19 | $ | 31.55 | $ | 12.64 | 40 | % | $ | 89.11 | $ | 67.16 | $ | 21.95 | 33 | % | ||||||||||||
Crude Oil Revenue (in thousands) | ||||||||||||||||||||||||||||
Crude Oil Revenue(In thousands) | ||||||||||||||||||||||||||||
East | $ | 2,101 | $ | 1,734 | $ | 367 | 21 | % | ||||||||||||||||||||
Gulf Coast | $ | 65,427 | $ | 55,357 | $ | 10,070 | 18 | % | 50,540 | 40,673 | 9,867 | 24 | % | |||||||||||||||
West | 9,155 | 6,404 | 2,751 | 43 | % | 15,243 | 11,784 | 3,459 | 29 | % | ||||||||||||||||||
East | 1,463 | 1,049 | 414 | 39 | % | |||||||||||||||||||||||
Canada | 791 | 129 | 662 | 513 | % | 1,827 | 1,052 | 775 | 74 | % | ||||||||||||||||||
Total Company | $ | 76,836 | $ | 62,939 | $ | 13,897 | 22 | % | $ | 69,711 | $ | 55,243 | $ | 14,468 | 26 | % | ||||||||||||
Price Variance Impact on Crude Oil Revenue (in thousands) | ||||||||||||||||||||||||||||
Price Variance Impact on Crude Oil Revenue | ||||||||||||||||||||||||||||
(In thousands) | ||||||||||||||||||||||||||||
East | $ | 573 | ||||||||||||||||||||||||||
Gulf Coast | $ | 18,547 | 11,691 | |||||||||||||||||||||||||
West | 2,496 | 4,409 | ||||||||||||||||||||||||||
East | 423 | |||||||||||||||||||||||||||
Canada | 100 | 600 | ||||||||||||||||||||||||||
Total Company | $ | 21,566 | $ | 17,273 | ||||||||||||||||||||||||
Volume Variance Impact on Crude Oil Revenue (in thousands) | ||||||||||||||||||||||||||||
Volume Variance Impact on Crude Oil Revenue | ||||||||||||||||||||||||||||
(In thousands) | ||||||||||||||||||||||||||||
East | $ | (206 | ) | |||||||||||||||||||||||||
Gulf Coast | $ | (8,492 | ) | (1,824 | ) | |||||||||||||||||||||||
West | 299 | (950 | ) | |||||||||||||||||||||||||
East | — | |||||||||||||||||||||||||||
Canada | 524 | 175 | ||||||||||||||||||||||||||
Total Company | $ | (7,669 | ) | $ | (2,805 | ) | ||||||||||||||||||||||
The increase in the realized crude oil price combined with the declineprices, partially offset by a decrease in production, resulted in a net revenue increase of $13.9$14.4 million. The decrease in oil production is primarilymainly the result of the decreasea natural decline in crude oil production in the Gulf Coast region production dueand West regions.
Index to the continued natural decline of the CL&F lease in south Louisiana, as well as the impact of hurricanes which included the shutting in and deferring of production at the Breton Sound offshore lease, one of our largest areas of offshore oil production.Financial Statements
Impact of Derivative Instruments on Operating Revenues
The following table reflects the realized impact of cash settlements and the net unrealized change in fair value of derivative instruments:
| Year Ended December 31, | Year Ended December 31, | |||||||||||||||||||||||||||||
| 2005 | 2004 | 2008 | 2007 | |||||||||||||||||||||||||||
| Realized | Unrealized | Realized | Unrealized | Realized | Unrealized | Realized | Unrealized | |||||||||||||||||||||||
| (In thousands) | (In thousands) | |||||||||||||||||||||||||||||
Operating Revenues - Increase/(Decrease) to Revenue | ||||||||||||||||||||||||||||||
Cash Flow Hedges | ||||||||||||||||||||||||||||||
Natural Gas Production | $ | (98,223 | ) | $ | 1,114 | $ | (54,564 | ) | $ | 137 | $ | 17,972 | $ | — | $ | 79,838 | $ | — | ||||||||||||
Crude Oil | (2,430 | ) | (6 | ) | — | 6 | (4,951 | ) | — | (796 | ) | — | ||||||||||||||||||
Total Cash Flow Hedges | (100,653 | ) | 1,108 | (54,564 | ) | 143 | $ | 13,021 | $ | — | $ | 79,042 | $ | — | ||||||||||||||||
Other Derivative Financial Instruments | ||||||||||||||||||||||||||||||
Natural Gas Production | — | — | (444 | ) | 777 | |||||||||||||||||||||||||
Crude Oil | (14,842 | ) | 5,518 | (17,908 | ) | (2,923 | ) | |||||||||||||||||||||||
Total Other Derivative Financial Instruments | (14,842 | ) | 5,518 | (18,352 | ) | (2,146 | ) | |||||||||||||||||||||||
| $ | (115,495 | ) | $ | 6,626 | $ | (72,916 | ) | $ | (2,003 | ) | ||||||||||||||||||||
We are exposed to market risk on derivative instruments to the extent of changes in market prices of natural gas and oil. However, the market risk exposure on these derivative contracts is generally offset by the gain or loss recognized upon the ultimate sale of the commodity. Although notional contract amounts are used to express the volume of natural gas price agreements, the amounts that can be subject to credit risk in the event of non-performance by third parties are substantially smaller. We do not anticipate any material impact on our financial results due to non-performance by third parties. Our primary derivative contract counterparties are JPMorgan Chase, Morgan Stanley, BNP Paribas, Goldman Sachs, and Bank of Montreal.
Operating Expenses
Total costs and expenses from operations increased by $155.9 million in 2008 from 2007. The primary reasons for this fluctuation are as follows:
Depreciation, Depletion and Amortization increased by $41.5 million from 2007 to 2008. This is primarily due to the impact on the DD&A rate of higher capital costs and higher natural gas production volumes, including the east Texas acquisition.
Impairment of Oil & Gas Properties and Other Assets increased by $31.1 million from 2007 to 2008 primarily related to impairments of approximately $28.3 million in the Trawick field in Rusk County, Texas in the Gulf Coast region resulting from a decline in natural gas prices and higher well costs as well as $3.0 million in the Corral Creek field in Washakie County, Wyoming in the West region resulting from lower than expected performance from the two well field.
General and Administrative expenses increased by $23.4 million from 2007 to 2008. This is primarily due to increased stock compensation expense related to the payouts of our supplemental employee incentive plan bonuses ($15.7 million) as well as increased expense related to our performance share awards ($5.1 million).
Impairment of Unproved Properties increased by $22.5 million from 2007 to 2008, primarily due to increased lease acquisition costs in several exploratory and developmental areas, as well as a $17.0 million charge for the impairment of three exploratory oil and gas prospects located in Mississippi, Montana and North Dakota. These prospects were impaired as a result of the significant decline in commodity prices in the fourth quarter of 2008 and abandonment of our exploration plans.
Brokered Natural Gas Cost increased by $18.6 million from 2007 to 2008. See the preceding table titled “Brokered Natural Gas Revenue and Cost” for further analysis.
Direct Operations expenses increased by $14.6 million from 2007 to 2008 primarily due to higher personnel and labor expenses, maintenance expenses, treating, compressor, pipeline and workover costs and vehicle and fuel expenses, partially offset by lower insurance costs.
Index to Financial Statements
Taxes Other Than Income increased by $12.8 million from 2007 to 2008 due to higher production taxes as a result of higher operating revenues and, to a lesser extent, higher ad valorem taxes, partially offset by lower franchise taxes.
Exploration expense decreased by $8.6 million from 2007 to 2008 primarily due to fewer dry holes, partially offset by increased geological and geophysical costs.
Interest Expense, Net
Interest expense, net increased by $19.2 million in 2008 compared to 2007 primarily due to increased interest expense related to the debt we issued in our July and December 2008 private placements and, to a lesser extent, higher average credit facility borrowings, offset in part by a lower weighted-average interest rate on our revolving credit facility borrowings and lower outstanding borrowings on our 7.19% fixed rate debt. Weighted-average borrowings under our credit facility based on daily balances were approximately $172 million during 2008 compared to approximately $52 million during 2007. The weighted-average effective interest rate on the credit facility decreased to 4.8% during 2008 from 7.2% during 2007.
Income Tax Expense
Income tax expense increased by $34.2 million due to a comparable increase in our pre-tax income. The effective tax rates for 2008 and 2007 were 37.0% and 35.0%, respectively. The increase in the effective tax rate is primarily due to a one time benefit for state taxes in 2007 of approximately $2.8 million attributable to favorable treatment of the gain from the sale of south Louisiana properties in 2006 and a reduction in special deductions in 2008.
2007 and 2006 Compared
We reported net income for the year ended December 31, 2007 of $167.4 million, or $1.73 per share. During 2006, we reported net income of $321.2 million, or $3.32 per share. This decrease of $153.8 million in net income was primarily due to a decrease in operating income of $254.2 million resulting from the gain on sale of assets of $231.2 million included in 2006 related to the 2006 south Louisiana and offshore properties sale, partially offset by a $99.2 million decrease in income tax expense and a $1.2 million decrease in interest and other expenses in 2007.
The decrease in operating income was primarily the result of a decrease in 2007 of $218.6 million in gain on sale of assets primarily from the 2006 south Louisiana and offshore properties sale. Additionally, there was a $29.8 million decrease in 2007 in operating revenues and an increase of $5.8 million in operating expenses. The decrease in operating revenues was largely the result of lower oil production in the Gulf Coast region primarily as a result of the 2006 south Louisiana and offshore properties sale. The increase in operating expenses was primarily the result of increased DD&A and impairment expenses, offset in part by reduced exploration and general and administrative expenses.
Index to Financial Statements
Natural Gas Production Revenues
Our average total company realized natural gas production sales price, including the realized impact of derivative instruments, was $7.23 per Mcf for 2007 compared to $7.13 per Mcf for 2006. These prices include the realized impact of derivative instrument settlements, which increased the price by $0.99 per Mcf in 2007 and $0.35 per Mcf in 2006. There was no revenue impact from the unrealized change in natural gas derivative fair value for the years ended December 31, 2007 or 2006.
| Year Ended December 31, | Variance | |||||||||||||
| 2007 | 2006 | Amount | Percent | |||||||||||
Natural Gas Production(Mmcf) | ||||||||||||||
East | 24,344 | 23,542 | 802 | 3 | % | |||||||||
Gulf Coast | 26,797 | 29,973 | (3,176 | ) | (11 | %) | ||||||||
West | 25,409 | 23,633 | 1,776 | 8 | % | |||||||||
Canada | 3,925 | 2,574 | 1,351 | 52 | % | |||||||||
Total Company | 80,475 | 79,722 | 753 | 1 | % | |||||||||
Natural Gas Production Sales Price($/Mcf) | ||||||||||||||
East | $ | 7.78 | $ | 7.99 | $ | (0.21 | ) | (3 | %) | |||||
Gulf Coast | $ | 8.03 | $ | 7.37 | $ | 0.66 | 9 | % | ||||||
West | $ | 6.13 | $ | 6.05 | $ | 0.08 | 1 | % | ||||||
Canada | $ | 5.47 | $ | 6.18 | $ | (0.71 | ) | (11 | %) | |||||
Total Company | $ | 7.23 | $ | 7.13 | $ | 0.10 | 1 | % | ||||||
Natural Gas Production Revenue(In thousands) | ||||||||||||||
East | $ | 189,392 | $ | 188,111 | $ | 1,281 | 1 | % | ||||||
Gulf Coast | 215,106 | 221,020 | (5,914 | ) | (3 | %) | ||||||||
West | 155,676 | 143,058 | 12,618 | 9 | % | |||||||||
Canada | 21,466 | 15,908 | 5,558 | 35 | % | |||||||||
Total Company | $ | 581,640 | $ | 568,097 | $ | 13,543 | 2 | % | ||||||
Price Variance Impact on Natural Gas Production Revenue | ||||||||||||||
(In thousands) | ||||||||||||||
East | $ | (5,127 | ) | |||||||||||
Gulf Coast | 17,774 | |||||||||||||
West | 2,121 | |||||||||||||
Canada | (2,792 | ) | ||||||||||||
Total Company | $ | 11,976 | ||||||||||||
Volume Variance Impact on Natural Gas Production Revenue | ||||||||||||||
(In thousands) | ||||||||||||||
East | $ | 6,408 | ||||||||||||
Gulf Coast | (23,688 | ) | ||||||||||||
West | 10,497 | |||||||||||||
Canada | 8,350 | |||||||||||||
Total Company | $ | 1,567 | ||||||||||||
The increase of $13.5 million in Natural Gas Production Revenue is due to an increase in realized natural gas sales prices as well as increased natural gas production. Natural gas revenues increased in all regions except for the Gulf Coast region in 2007 over 2006. After removing from the 2006 results $70.5 million of natural gas revenues and 9,037 Mmcf of natural gas production associated with properties in the Gulf Coast region sold in the 2006 south Louisiana and offshore properties sale, total natural gas revenue would have increased by $84.0 million, or 17%, and natural gas production would have increased by 9,791 Mmcf, or 14%, from 2006 to 2007.
Index to Financial Statements
Brokered Natural Gas Revenue and Cost
| Year Ended December 31, | Variance | |||||||||||||
| 2007 | 2006 | Amount | Percent | |||||||||||
Sales Price($/Mcf) | $ | 8.40 | $ | 8.14 | $ | 0.26 | 3 | % | ||||||
Volume Brokered(Mmcf) | x | 11,101 | x | 11,502 | (401 | ) | (3 | %) | ||||||
Brokered Natural Gas Revenues(In thousands) | $ | 93,215 | $ | 93,651 | ||||||||||
Purchase Price($/Mcf) | $ | 7.37 | $ | 7.25 | $ | 0.12 | 2 | % | ||||||
Volume Brokered(Mmcf) | x | 11,101 | x | 11,502 | (401 | ) | (3 | %) | ||||||
Brokered Natural Gas Cost(In thousands) | $ | 81,819 | $ | 83,375 | ||||||||||
Brokered Natural Gas Margin(In thousands) | $ | 11,396 | $ | 10,276 | $ | 1,120 | 11 | % | ||||||
(In thousands) | ||||||||||||||
Sales Price Variance Impact on Revenue | $ | 2,828 | ||||||||||||
Volume Variance Impact on Revenue | (3,264 | ) | ||||||||||||
| $ | (436 | ) | ||||||||||||
(In thousands) | ||||||||||||||
Purchase Price Variance Impact on Purchases | $ | (1,351 | ) | |||||||||||
Volume Variance Impact on Purchases | 2,907 | |||||||||||||
| $ | 1,556 | |||||||||||||
The increased brokered natural gas margin of approximately $1.1 million is driven by an increase in sales price that outpaced the increase in purchase price, partially offset by a decrease in the volumes brokered in 2007 over 2006.
Index to Financial Statements
Crude Oil and Condensate Revenues
Our average total company realized crude oil sales price was $67.16 per Bbl for 2007. The 2007 price includes the realized impact of derivative instrument settlements which decreased the price by $0.97 per Bbl. Our average total company realized crude oil sales price was $65.03 per Bbl for 2006. There was no realized impact of crude oil derivative instruments in 2006. There was no unrealized impact of crude oil derivative instruments in 2007 or 2006.
| Year Ended December 31, | Variance | |||||||||||||
| 2007 | 2006 | Amount | Percent | |||||||||||
Crude Oil Production(Mbbl) | ||||||||||||||
East | 26 | 24 | 2 | 8 | % | |||||||||
Gulf Coast | 605 | 1,160 | (555 | ) | (48 | %) | ||||||||
West | 174 | 209 | (35 | ) | (17 | %) | ||||||||
Canada | 18 | 12 | 6 | 50 | % | |||||||||
Total Company | 823 | 1,405 | (582 | ) | (41 | %) | ||||||||
Crude Oil Sales Price($/Bbl) | ||||||||||||||
East | $ | 66.97 | $ | 62.03 | $ | 4.94 | 8 | % | ||||||
Gulf Coast | $ | 67.17 | $ | 65.44 | $ | 1.73 | 3 | % | ||||||
West | $ | 67.86 | $ | 63.36 | $ | 4.50 | 7 | % | ||||||
Canada | $ | 59.96 | $ | 60.55 | $ | (0.59 | ) | (1 | %) | |||||
Total Company | $ | 67.16 | $ | 65.03 | $ | 2.13 | 3 | % | ||||||
Crude Oil Revenue(In thousands) | ||||||||||||||
East | $ | 1,734 | $ | 1,474 | $ | 260 | 18 | % | ||||||
Gulf Coast | 40,673 | 75,894 | (35,221 | ) | (46 | %) | ||||||||
West | 11,784 | 13,253 | (1,469 | ) | (11 | %) | ||||||||
Canada | 1,052 | 759 | 293 | 39 | % | |||||||||
Total Company | $ | 55,243 | $ | 91,380 | $ | (36,137 | ) | (40 | %) | |||||
Price Variance Impact on Crude Oil Revenue | ||||||||||||||
(In thousands) | ||||||||||||||
East | $ | 128 | ||||||||||||
Gulf Coast | 1,048 | |||||||||||||
West | 781 | |||||||||||||
Canada | (10 | ) | ||||||||||||
Total Company | $ | 1,947 | ||||||||||||
Volume Variance Impact on Crude Oil Revenue | ||||||||||||||
(In thousands) | ||||||||||||||
East | $ | 132 | ||||||||||||
Gulf Coast | (36,269 | ) | ||||||||||||
West | (2,250 | ) | ||||||||||||
Canada | 303 | |||||||||||||
Total Company | $ | (38,084 | ) | |||||||||||
The decrease in the realized crude oil production, partially offset by the increase in realized prices, resulted in a net revenue decrease of approximately $36.1 million. The decrease in oil production is mainly the result of the 2006 south Louisiana and offshore properties sale in the Gulf Coast region. After removing from the 2006 results $47.4 million of crude oil revenues and 707 Mbbls of crude oil production associated with properties in the Gulf Coast region sold in the 2006 south Louisiana and offshore properties sale, total crude oil revenue would have increased by $11.2 million, or 26%, and crude oil production would have increased by 124 Mbbls, or 18%, from 2006 to 2007.
Index to Financial Statements
Impact of Derivative Instruments on Operating Revenues
The following table reflects the realized impact of cash settlements and the net unrealized change in fair value of derivative instruments:
| Year Ended December 31, | |||||||||||||
| 2007 | 2006 | ||||||||||||
| Realized | Unrealized | Realized | Unrealized | ||||||||||
| (In thousands) | |||||||||||||
Operating Revenues—Increase / (Decrease) to Revenue | |||||||||||||
Cash Flow Hedges | |||||||||||||
Natural Gas Production | $ | 79,838 | $ | — | $ | 28,266 | $ | — | |||||
Crude Oil | (796 | ) | — | — | — | ||||||||
Total Cash Flow Hedges | $ | 79,042 | $ | — | $ | 28,266 | $ | — | |||||
We are exposed to market risk on derivative instruments to the extent of changes in market prices of natural gas and oil. However, the market risk exposure on these derivative contracts is generally offset by the gain or loss recognized upon the ultimate sale of the commodity.
Other Operating Revenues
Other operating revenues decreased $3.6 million. This change was primarily a result of an increase in our payout liability associated with the reduction of our interest due to customary reversionary interest owned by others, which correspondingly decreased other operating revenues. In addition, our revenues from net profits interest declined over the prior year. This revenue variance also results, to a lesser extent, from changes in our wellhead gas imbalances over the previous year.
Operating Expenses
Total costs and expenses from operations increased $54.5by $5.8 million for the year ended December 31, 20052007 compared to the year ended December 31, 2004.2006. The primary reasons for this fluctuation are as follows:
Depreciation, Depletion and Amortization increased by $14.9 million in 2007 over 2006. This is primarily due to the impact on the DD&A rate of negative reserve revisions due to lower prices at the end of 2006, higher capital costs and commencement of production in an east Texas field.
Exploration expense increased $13.7decreased by $9.6 million in 2005,from 2006 to 2007, primarily as a result of increased dry hole expenses partially offset by decreased spending on geological and geophysical expenses. During 2005, we spent $6.8 million less on geological and geophysical activities but incurred an additional $18.9 milliona decrease in dry hole expense. In addition, we spent an additional $0.8 million on delay rentals. The increase intotal dry hole expense is mainlyof $10.3 million, primarily in Canada and, to a lesser extent, in the West and Gulf Coast regions. In addition, there was a decrease in geophysical and geological expenses of $1.8 million, primarily due to expenses incurreda decrease in the Gulf Coast region, offset in part by an increase in Canada. Offsetting part of these decreases was an increase of $2.6 million in land and to a smaller extent, in Canada and the West.lease search expenses during 2007.
Impairment of Unproved Properties increased by $13.3$7.9 million from 2004in 2007 compared to 2005,2006, primarily due to increased production taxeslease acquisition costs during 2005 and 2006 in several exploratory areas.
General and Administrative expense decreased by $7.4 million in 2007 primarily due to decreased stock compensation charges of $5.9 million due to a reduction in performance share expense from a change in the liability component of the awards resulting from the variance in our relative ranking from 2006 to 2007 as well as a reduction in restricted stock awards as a result of increased commodity prices. Additionally, ad valoremawards that vested in 2007. In addition, there was a decrease of $4.2 million related to decreased professional services fees for litigation. Partially offsetting these decreases were increases in employee compensation related expenses and franchise taxes were higher compared to the prior year.bad debt expense.
Direct Operations expense increased by $2.4 million as a result of higher employee compensation charges and disposal, treating, compressor, workover and maintenance costs, partially offset by lower outside operated properties expense and insurance expense.
Brokered Natural Gas Cost increaseddecreased by $12.0$1.6 million from 20042006 to 2005.2007. See the preceding table labeled “Brokered Natural Gas Revenue and Cost” for further analysis.
Taxes Other Than Income decreased by $8.2 million. This is primarily the result of increased expenses$1.5 million for outside operated properties and workovers. In addition, there were increases over the prior year in maintenance charges, equipment expenses and employee related expenses.
Index to Financial Statements
Impairment of Oil and& Gas Properties decreasedand Other Assets increased by $3.5$0.7 million as we incurred nofor the year ended December 31, 2007 compared to the year ended December 31, 2006, due to an impairment expenserecorded in 2007 in the current year. The costs incurredGulf Coast region resulting from two non-commercial development completions in the prior year related to a small field in southnorth Louisiana. Further analysis of this impairment is discussed in Note 2 of the Notes to the Consolidated Financial Statements.
Interest Expense, Net
Interest expense, net increased $0.1 million. Interest expense relateddecreased by $1.1 million in 2007 compared to 2006 due to a lower weighted-average interest rate on borrowings under our revolving credit facility, was highera lower outstanding principal amount of our 7.19% fixed rate debt and lower weighted-average borrowings under our credit facility, as well as increased income related to FIN 48 as discussed below. These decreases to interest expense were offset in part by decreased regulatory capitalized interest on our pipeline in the current year due to higher average borrowings. AverageEast region. Weighted-average borrowings under our credit facility based on month enddaily balances for the 2005 year were approximately $130$52 million during 2007 compared to approximately $95$61 million in the prior year. In addition, theduring 2006. The weighted-average effective interest rate on the credit facility increaseddecreased to 6.9%7.2% during 20052007 from 4.2%7.9% during 2006. In addition, interest expense decreased due to the prior year. Partially offsetting this was an increase inreversal of interest payable on a previous uncertain tax position. During 2007, we recorded net interest income on our short-term investments.related to FIN 48 of $1.3 million, with no amount recorded in 2006.
Income Tax Expense
Income tax expense increased $37.6decreased by $99.2 million due to an increasea comparable decrease in our pre-tax net income.
2004 and 2003 Compared
We reported net income, for the year ended December 31, 2004 of $88.4 million, or $1.81 per share. During 2003, we reported net income of $21.1 million, or $0.44 per share. Operating income increased by $94.1 million compared to the prior year, from $66.6 million to $160.7 million. The increase in net income and operating income was principally due to decreased operating expenses from 2003 to 2004 related to the decrease in impairments of oil and gas properties of $90.3 million related to the loss in 2003 of a reversionary interest in the Kurten field. In addition, the increases in operating income and net income were due to an increase in our realized natural gas and crude oil prices.
Natural Gas Production Revenues
Our average total company realized natural gas production sales price, including the realized impact of derivative instruments, was $5.20 per Mcf compared to $4.51 per Mcf for the comparable period of the prior year. These prices include the realized impact of derivative instruments which reduced these prices by $0.76 per Mcf in 2004 and $0.68 per Mcf in 2003. The following table excludes the unrealized gain from the change in derivative fair value of $0.9 million and the unrealized loss of $1.5 million for the years ended December 31, 2004 and 2003, respectively. These unrealized changes in fair value have been included in the Natural Gas Production Revenues line item in the Statement of Operations.
Natural Gas Production (Mmcf) Gulf Coast West East Canada Total Company Natural Gas Production Sales Price ($/Mcf) Gulf Coast West East Canada Total Company Natural Gas Production Revenue (in thousands) Gulf Coast West East Canada Total Company Price Variance Impact on Natural Gas Production Revenue (in thousands) Gulf Coast West East Canada Total Company Volume Variance Impact on Natural Gas Production Revenue (in thousands) Gulf Coast West East Canada Total Company Year Ended
December 31, Variance 2004 2003 Amount Percent 31,358 29,550 1,808 6 % 21,866 23,776 (1,910 ) (8 )% 19,442 18,580 862 5 % 167 — 167 — 72,833 71,906 927 1 % $ 5.27 $ 4.78 $ 0.49 10 % $ 4.75 $ 3.67 $ 1.08 29 % $ 5.60 $ 5.15 $ 0.45 9 % $ 4.69 $ — $ 4.69 — $ 5.20 $ 4.51 $ 0.69 15 % $ 165,177 $ 141,107 $ 24,070 17 % 103,851 87,245 16,606 19 % 108,935 95,672 13,263 14 % 784 — 784 — $ 378,747 $ 324,024 $ 54,723 17 % $ 15,434 23,613 8,828 784 $ 48,659 $ 8,635 (7,009 ) 4,438 — $ 6,064
The increase in natural gas production revenues was mainly a result of increased sales prices as well as the increase in overall production. Natural gas production was up slightly from the prior year and production revenues also increased from 2003. Natural gas production increased slightly in all regions except the West region, where the decline in production was due to lower capital spending in 2003 and continued natural decline. The increases in both sales price and production resulted in an increase in natural gas production revenues of $54.7 million.
Brokered Natural Gas Revenue and Cost
| Year Ended December 31, | Variance | |||||||||||||
| 2004 | 2003 | Amount | Percent | |||||||||||
Sales Price ($/Mcf) | $ | 6.56 | $ | 5.16 | $ | 1.40 | 27 | % | ||||||
Volume Brokered (Mmcf) | 12,876 | 18,557 | (5,681 | ) | (31 | )% | ||||||||
Brokered Natural Gas Revenues (in thousands) | $ | 84,416 | $ | 95,754 | ||||||||||
Purchase Price ($/Mcf) | $ | 5.84 | $ | 4.64 | $ | 1.20 | 26 | % | ||||||
Volume Brokered (Mmcf) | 12,876 | 18,557 | (5,681 | ) | (31 | )% | ||||||||
Brokered Natural Gas Cost (in thousands) | $ | 75,217 | $ | 86,104 | ||||||||||
Brokered Natural Gas Margin (in thousands) | $ | 9,199 | $ | 9,650 | $ | (451 | ) | (5 | )% | |||||
(in thousands) | ||||||||||||||
Sales Price Variance Impact on Revenue | $ | 18,026 | ||||||||||||
Volume Variance Impact on Revenue | (29,363 | ) | ||||||||||||
| $ | (11,337 | ) | ||||||||||||
(in thousands) | ||||||||||||||
Purchase Price Variance Impact on Purchases | $ | (15,451 | ) | |||||||||||
Volume Variance Impact on Purchases | 26,338 | |||||||||||||
| $ | 10,887 | |||||||||||||
The decrease in brokered natural gas revenues of $11.3 million combined with the decline in brokered natural gas cost of $10.9 million resulted in a decrease to the brokered natural gas margin of $0.5 million.
Crude Oil and Condensate Revenues
Our average total company realized crude oil sales price, including the realized impact of derivative instruments, was $31.55 per Bbl compared to $29.55 per Bbl for 2003. These prices include the realized impact of derivative instruments, which reduced these prices by $8.98 per Bbl in 2004 and $1.41 per Bbl in 2003. The following table excludes the unrealized loss from the change in derivative fair value of $2.9 million and $1.9 million for the years ended December 31, 2004 and 2003, respectively. These unrealized changes in fair value have been included in the Crude Oil and Condensate Revenues line item in the Statement of Operations.
| Year Ended December 31, | Variance | |||||||||||||
| 2004 | 2003 | Amount | Percent | |||||||||||
Crude Oil Production (Mbbl) | ||||||||||||||
Gulf Coast | 1,805 | 2,591 | (786 | ) | (30 | )% | ||||||||
West | 159 | 188 | (29 | ) | (15 | )% | ||||||||
East | 27 | 27 | — | — | ||||||||||
Canada | 4 | — | 4 | — | ||||||||||
Total Company | 1,995 | 2,806 | (811 | ) | (29 | %) | ||||||||
Crude Oil Sales Price ($/Bbl) | ||||||||||||||
Gulf Coast | $ | 30.67 | $ | 29.48 | $ | 1.19 | 4 | % | ||||||
West | $ | 40.29 | $ | 30.11 | $ | 10.18 | 34 | % | ||||||
East | $ | 38.28 | $ | 32.65 | $ | 5.63 | 17 | % | ||||||
Canada | $ | 37.93 | $ | — | $ | 37.93 | — | |||||||
Total Company | $ | 31.55 | $ | 29.55 | $ | 2.00 | 7 | % | ||||||
Crude Oil Revenue (in thousands) | ||||||||||||||
Gulf Coast | $ | 55,357 | $ | 76,375 | $ | (21,018 | ) | (28 | %) | |||||
West | 6,404 | 5,675 | 729 | 13 | % | |||||||||
East | 1,049 | 870 | 179 | 21 | % | |||||||||
Canada | 129 | — | 129 | — | ||||||||||
Total Company | $ | 62,939 | $ | 82,920 | $ | (19,981 | ) | (24 | %) | |||||
Price Variance Impact on Crude Oil Revenue (in thousands) | ||||||||||||||
Gulf Coast | $ | 2,151 | ||||||||||||
West | 1,604 | |||||||||||||
East | 179 | |||||||||||||
Canada | 129 | |||||||||||||
Total Company | $ | 4,063 | ||||||||||||
Volume Variance Impact on Crude Oil Revenue (in thousands) | ||||||||||||||
Gulf Coast | $ | (23,169 | ) | |||||||||||
West | (875 | ) | ||||||||||||
East | — | |||||||||||||
Canada | — | |||||||||||||
Total Company | $ | (24,044 | ) | |||||||||||
The decline in crude oil production is due to emphasis on natural gas in the Gulf Coast drilling program, along with the natural decline of existing production in south Louisiana. The increase in the realized crude oil price combined with the decline in production resulted in a net revenue decrease of $20.0 million.
Impact of Derivative Instruments on Operating Revenues
The following table reflects the realized impact of cash settlements and the net unrealized change in fair value of derivative instruments:
| Year Ended December 31, | ||||||||||||||||
| 2004 | 2003 | |||||||||||||||
| Realized | Unrealized | Realized | Unrealized | |||||||||||||
| (In thousands) | ||||||||||||||||
Operating Revenues - Increase/(Decrease) to Revenue | ||||||||||||||||
Cash Flow Hedges | ||||||||||||||||
Natural Gas Production | $ | (54,564 | ) | $ | 137 | $ | (48,829 | ) | $ | (691 | ) | |||||
Crude Oil | — | 6 | (2,973 | ) | 32 | |||||||||||
Total Cash Flow Hedges | (54,564 | ) | 143 | (51,802 | ) | (659 | ) | |||||||||
Other Derivative Financial Instruments | ||||||||||||||||
Natural Gas Production | (444 | ) | 777 | — | (777 | ) | ||||||||||
Crude Oil | (17,908 | ) | (2,923 | ) | (990 | ) | (1,911 | ) | ||||||||
Total Other Derivative Financial Instruments | (18,352 | ) | (2,146 | ) | (990 | ) | (2,688 | ) | ||||||||
| $ | (72,916 | ) | $ | (2,003 | ) | $ | (52,792 | ) | $ | (3,347 | ) | |||||
We are exposed to market risk to the extent of changes in market prices of natural gas and oil. However, the market risk exposure on these derivative contracts is generally offset by the gain or loss recognized upon the ultimate sale of the commodity.
Other Operating Revenues
Other operating revenues decreased $3.7 million. This change was primarily a result of decreases in natural gas transportation revenue and natural gas liquid revenue for the year ended December 31, 2004.
Operating Expenses
Total costs and expenses from operations decreased $85.3 million for the year ended December 31, 2004 compared to the year ended December 31, 2003. The primary reasons for this fluctuation are as follows:
Interest Expense, Net
Interest expense decreased $1.7 million. This variance is due to a lower average level of outstanding debt on the revolving credit facility offset somewhat by an increase in Prime rates. Average daily borrowings under the revolving credit facility during the year were $0.5 million in 2004 which is a decrease from $0.7 million in 2003. Our other remaining debt is at fixed interest rates.
Income Tax Expense
Income tax expense increased $35.2 million due to an increasereduction in our pre-tax net income.overall state income tax rate for 2007.
| ITEM 7A. | QUANTITATIVE AND QUALITATIVE DISCLOSURES ABOUT MARKET RISK |
Market Risk
Our primary market risk is exposure to oil and natural gas prices. Realized prices are mainly driven by worldwide prices for oil and spot market prices for North American natural gas production. Commodity prices are volatile and unpredictable.
The debt and equity markets have recently experienced unfavorable conditions, which may affect our ability to access those markets. As a result of the volatility and disruption in the capital markets and our increased level of borrowings, we may experience increased costs associated with future borrowings and debt issuances. At this time, we do not believe our liquidity has been materially affected by the recent market events. We will continue to monitor events and circumstances surrounding each of our lenders in our revolving credit facility.
Derivative Instruments and Hedging Activity
Our hedging strategy is designed to reduce the risk of price volatility for our production in the natural gas and crude oil markets. A hedging committee that consists of members of senior management oversees our hedging activity. Our hedging arrangements apply to only a portion of our production and provide only partial price protection. These hedging arrangements limit the benefit to us of increases in prices, but offer protection in the event of price declines. Further, if our counterparties defaulted, this protection might be limited as we might not receive the benefits of the hedges. Please read the discussion below as well as Note 1011 of the Notes to the Consolidated Financial Statements for a more detailed discussion of our hedging arrangements.
Periodically, we enter into derivative commodity instruments to hedge our exposure to price fluctuations on natural gas and crude oil production. Under our revolvingOur credit agreement the aggregate level ofrestricts our ability to enter into commodity hedging musthedges other than to hedge or mitigate risks to which we have actual or projected exposure or as permitted under our risk
Index to Financial Statements
management policies and not exceed 100% of the anticipated future equivalent production during the period covered by these cash flow hedges.subjecting us to material speculative risks. At December 31, 2005,2008, we had nine26 cash flow hedges open: eight14 natural gas price collar arrangements, 10 natural gas price swap arrangements and onetwo crude oil price collar arrangement.swap arrangements. At December 31, 2005,2008, a $20.7$355.2 million ($12.9223.1 million, net of tax) unrealized lossgain was recorded toin Accumulated Other Comprehensive Income / (Loss), along with a $22.4 million short-term derivative liability and a $1.7$264.7 million short-term derivative receivable which is shown in Other Current Assets on the Balance Sheet. and a $90.5 million long-term derivative receivable.
The change in the fair value of derivatives designated as hedges that is effective is initially recorded to Accumulated Other Comprehensive Income.Income / (Loss). The ineffective portion if any, of the change in the fair value of derivatives designated as hedges, and the change in fair value of all other derivatives, isare recorded currently in earnings as a component of Natural Gas Production and Crude Oil and Condensate Revenue, as appropriate.
Assuming no change in commodity prices, after For the years ended December 31 20052008, 2007 and 2006, there was no ineffectiveness recorded in the Consolidated Statement of Operations.
During the second quarter of 2008, in anticipation of the east Texas acquisition, we entered into 12 contracts for natural gas price swaps and three contracts for crude oil swaps (2009 and 2010 contracts included in the amounts discussed above) for the remainder of 2008 and extending through 2010 for the purpose of reducing commodity price risk associated with anticipated production after the transaction closing.
Based upon estimates at December 31, 2008, we would expect to reclassify to the Consolidated Statement of Operations, over the next 12 months, $12.9$166.2 million in after-tax chargesincome associated with commodity hedges. This reclassification represents the net liabilityshort-term receivable associated with open positions currently not reflected in earnings at December 31, 20052008 related to anticipated 20062009 production.
Hedges on Production - Production—Swaps
From time to time, we enter into natural gas and crude oil swap agreements with counterparties to hedge price risk associated with a portion of our production. These derivativescash flow hedges are not held for trading purposes. Under these price swaps, we receive a fixed price on a notional quantity of natural gas andor crude oil in exchange for paying a variable price based on a market-based index, such as the NYMEX gas and crude oil futures.
During 2005,2008, natural gas price swaps covered 20,5579,821 Mmcf, or 28%11%, of our 2008 gas production fixing the sales price of this gas at an average price of $5.14$10.27 per Mcf. During 2008, we entered into natural gas price swaps covering a portion of our anticipated 2008, 2009 and 2010 production, including production related to the east Texas acquisition.
At December 31, 2005,2008, we had no open natural gas price swap contracts covering 2006 production.a portion of our anticipated 2009 and 2010 production as follows:
From time to time, we enter into natural gas and
| Natural Gas Price Swaps | ||||||||
Contract Period | Volume in Mmcf | Weighted-Average Contract Price (per Mcf) | Net Unrealized Gain (In thousands) | |||||
Year Ended December 31, 2009 | 16,079 | $ | 12.18 | $ | 90,267 | |||
Year Ended December 31, 2010 | 19,295 | $ | 11.43 | $ | 70,345 | |||
We had one crude oil derivative arrangements that do not qualify for hedge accounting under SFAS No. 133. These financial instruments are recordedprice swap covering 92 Mbbl, or 12%, of our 2008 production at fair value at the balance sheet date. a price of $127.15 per Bbl. During 2008, we entered into crude oil price swaps covering a portion of our anticipated 2008, 2009 and 2010 production.
Index to Financial Statements
At December 31, 2005,2008, we did not have anyhad open crude oil price swap contracts covering a portion of these types of arrangements.
| Crude Oil Price Swaps | ||||||||
Contract Period | Volume in Mbbl | Contract Price (per Bbl) | Net Unrealized Gain (In thousands) | |||||
Year Ended December 31, 2009 | 365 | $ | 125.25 | $ | 25,656 | |||
Year Ended December 31, 2010 | 365 | $ | 125.00 | $ | 21,840 | |||
Hedges on Production - Production—Options
From time to time, we enter into natural gas and crude oil collar agreements with counterparties to hedge price risk associated with a portion of our production. These cash flow hedges are not held for trading purposes. Under the collar arrangements, if the index price rises above the ceiling price, we pay the counterparty. If the index price falls below the floor price, the counterparty pays us. During 2005,2008, natural gas price collars covered 15,15754,173 Mmcf, or 60%, of our gas production, or 21% of our2008 gas production, with a weighted averageweighted-average floor of $5.59$8.53 per Mcf and a weighted averageweighted-average ceiling of $8.61$10.70 per Mcf. During 2005, an oil price collar covered 365 Mbbl of our crude oil production, or 21% of our crude oil production with a weighted average floor of $40.00 per Mbbl and a weighted average ceiling of $50.50 per Mbbl.
At December 31, 2005,2008, we had open natural gas price collar contracts covering a portion of our 2006anticipated 2009 production as follows:
| Natural Gas Price Collars | |||||||||
Contract Period | Volume in Mmcf | Weighted Average Ceiling / Floor | Net Unrealized (In thousands) | ||||||
As of December 31, 2005 | |||||||||
First Quarter 2006 | 6,702 | $ | 12.74 / $8.25 | ||||||
Second Quarter 2006 | 6,776 | 12.74 / 8.25 | |||||||
Third Quarter 2006 | 6,850 | 12.74 / 8.25 | |||||||
Fourth Quarter 2006 | 6,851 | 12.74 / 8.25 | |||||||
Full Year 2006 | 27,179 | $ | 12.74 / $8.25 | $ | (20,425 | ) | |||
| Natural Gas Price Collars | ||||||||
Contract Period | Volume in Mmcf | Weighted-Average Ceiling / Floor (per Mcf) | Net Unrealized Gain (In thousands) | |||||
Year Ended December 31, 2009 | 47,253 | $ | 12.39/$9.40 | $ | 152,191 | |||
At December 31, 2005, we had one open crudeDuring 2008, an oil price collar contract coveringcovered 366 Mbbls, or 47%, of our 20062008 crude oil production, as follows:with a floor of $60.00 per Bbl and a ceiling of $80.00 per Bbl.
| Crude Oil Price Collar | |||||||||
Contract Period | Volume in Mbbl | Weighted Average Ceiling / Floor | Net Unrealized (In thousands) | ||||||
As of December 31, 2005 | |||||||||
First Quarter 2006 | 90 | $ | 76.00 / $50.00 | ||||||
Second Quarter 2006 | 91 | 76.00 / 50.00 | |||||||
Third Quarter 2006 | 92 | 76.00 / 50.00 | |||||||
Fourth Quarter 2006 | 92 | 76.00 / 50.00 | |||||||
Full Year 2006 | 365 | $ | 76.00 / $50.00 | $ | (317 | ) | |||
| �� | |||||||||
We are exposed to market risk on these open contracts, to the extent of changes in market prices of natural gas and crude oil. However, the market risk exposure on these hedged contracts is generally offset by the gain or loss recognized upon the ultimate sale of the commodity that is hedged.
The amounts set forth under the net unrealized gain columns in the tables above represent our total unrealized gain position at December 31, 2008. Also impacting the total unrealized net gain (reflecting the net receivable position) in accumulated other comprehensive income / (loss) in the Consolidated Balance Sheet is a reduction of $5.1 million related to our assessment of our counterparties’ nonperformance risk. This risk was evaluated by reviewing credit default swap spreads for the various financial institutions in which we have derivative transactions.
The preceding paragraphs contain forward-looking information concerning future production and projected gains and losses, which may be impacted both by production and by changes in the future market prices of energy commodities. See “Forward-Looking Information” for further details.
Fair Market Value of Financial Instruments
The estimated fair value of financial instruments is the amount at which the instrument could be exchanged currently between willing parties. The carrying amounts reported in the consolidated balance sheetConsolidated Balance Sheet for cash and cash equivalents, accounts receivable, and accounts payable approximate fair value. The Company usesfair value of long-term debt is the estimated cost to acquire the debt, including a credit spread for the difference between the issue rate
Index to Financial Statements
and the year- end market rate. The credit spread is our default or repayment risk. The credit spread (premium or discount) is determined by comparing our fixed-rate notes to new issues (secured and unsecured) and secondary trades of similar size and credit statistics for both public and private debt. The fair value of all of the fixed-rate notes, excluding the credit facility, are based on interest rates currently available to us. The credit facility approximates fair value because this instrument bears interest at rates based on current market rates.
We use available marketing data and valuation methodologies to estimate the fair value of debt. This disclosure is presented in accordance with SFAS No. 107, “Disclosures about Fair Value of Financial Instruments” and does not impact our financial position, results of operations or cash flows.
Long-Term Debt
| December 31, 2005 | December 31, 2004 | |||||||||||
(In thousands) | Carrying Amount | Estimated Fair Value | Carrying Amount | Estimated Fair Value | ||||||||
Debt | ||||||||||||
7.19% Notes | $ | 60,000 | $ | 62,938 | $ | 80,000 | $ | 87,770 | ||||
7.26% Notes | 75,000 | 81,713 | 75,000 | 85,849 | ||||||||
7.36% Notes | 75,000 | 83,990 | 75,000 | 87,111 | ||||||||
7.46% Notes | 20,000 | 23,083 | 20,000 | 23,804 | ||||||||
Credit Facility | 90,000 | 90,000 | — | — | ||||||||
| $ | 320,000 | $ | 341,724 | $ | 250,000 | $ | 284,534 | |||||
| December 31, 2008 | December 31, 2007 | |||||||||||||||
| Carrying Amount | Estimated Fair Value | Carrying Amount | Estimated Fair Value | |||||||||||||
| (In thousands) | ||||||||||||||||
Long-Term Debt | $ | 867,000 | $ | 807,508 | $ | 350,000 | $ | 364,500 | ||||||||
Current Maturities | (35,857 | ) | (35,796 | ) | (20,000 | ) | (20,466 | ) | ||||||||
Long-Term Debt, excluding Current Maturities | $ | 831,143 | $ | 771,712 | $ | 330,000 | $ | 344,034 | ||||||||
Index to Financial Statements
| ITEM 8. | FINANCIAL STATEMENTS AND SUPPLEMENTARY DATA |
ITEM 8. FINANCIAL STATEMENTS AND SUPPLEMENTARY DATA
INDEX TO CONSOLIDATED FINANCIAL STATEMENTS
| Page | ||
| 57 | ||
| 58 | ||
Consolidated Balance Sheet at December 31, | ||
| 59 | ||
| 60 | ||
| 61 | ||
| 62 | ||
| 63 | ||
| 105 | ||
Index to Financial Statements
REPORT OF INDEPENDENT REGISTERED PUBLIC ACCOUNTING FIRM
To the Board of Directors and Stockholders of Cabot Oil & Gas Corporation:
We have completed integrated audits of Cabot Oil & Gas Corporation’s 2005 and 2004 consolidated financial statements and of its internal control over financial reporting as of December 31, 2005, and an audit of its 2003 consolidated financial statements in accordance with the standards of the Public Company Accounting Oversight Board (United States). Our opinions, based on our audits, are presented below.
Consolidated financial statements
In our opinion, the consolidated financial statements listed in the accompanying index present fairly, in all material respects, the financial position of Cabot Oil & Gas Corporation and its subsidiaries (the “Company”) at December 31, 20052008 and 2004,2007, and the results of their operations and their cash flows for each of the three years in the period ended December 31, 20052008 in conformity with accounting principles generally accepted in the United States of America. TheseAlso in our opinion, the Company maintained, in all material respects, effective internal control over financial reporting as of December 31, 2008, based on criteria established inInternal Control—Integrated Framework issued by the Committee of Sponsoring Organizations of the Treadway Commission (COSO). The Company’s management is responsible for these financial statements, are the responsibilityfor maintaining effective internal control over financial reporting and for its assessment of the Company’s management.effectiveness of internal control over financial reporting, included in Management’s Report on Internal Control over Financial Reporting appearing under Item 9A. Our responsibility is to express an opinionopinions on these financial statements and on the Company’s internal control over financial reporting based on our integrated audits. We conducted our audits of these statements in accordance with the standards of the Public Company Accounting Oversight Board (United States). Those standards require that we plan and perform the auditaudits to obtain reasonable assurance about whether the financial statements are free of material misstatement. An auditmisstatement and whether effective internal control over financial reporting was maintained in all material respects. Our audits of the financial statements includesincluded examining, on a test basis, evidence supporting the amounts and disclosures in the financial statements, assessing the accounting principles used and significant estimates made by management, and evaluating the overall financial statement presentation. Our audit of internal control over financial reporting included obtaining an understanding of internal control over financial reporting, assessing the risk that a material weakness exists, and testing and evaluating the design and operating effectiveness of internal control based on the assessed risk. Our audits also included performing such other procedures as we considered necessary in the circumstances. We believe that our audits provide a reasonable basis for our opinion.opinions.
As discussed in Note 11 to the consolidated financial statements, the Company adopted Statement of Financial Accounting Standards No. 143, “Accountingchanged the manner in which it accounts for Asset Retirement Obligations” effective January 1, 2003.
Internal control overand reports fair value measurements in 2008. As discussed in Note 5 to the consolidated financial reporting
Also, in our opinion, management’s assessment, included in Management’s Report on Internal Control Over Financial Reporting appearing under Item 9A, thatstatements, the Company maintained effective internal control over financial reporting as of December 31, 2005 based on criteria establishedchanged the manner inInternal Control – Integrated Framework issued by the Committee of Sponsoring Organizations of the Treadway Commission (“COSO”), is fairly stated, in all material respects, based on those criteria. Furthermore, in our opinion, the Company maintained, in all material respects, effective internal control over financial reporting as of December 31, 2005, based on criteria established inInternal Control – Integrated Framework issued by the COSO. The Company’s management is responsible for maintaining effective internal control over financial reporting and which it accounts for its assessment of the effectiveness of internal control over financial reporting. Our responsibility is to express opinions on management’s assessmentdefined benefit pension and on the effectiveness of the Company’s internal control over financial reporting based on our audit. We conducted our audit of internal control over financial reportingother postretirement plans in accordance with the standards of the Public Company Accounting Oversight Board (United States). Those standards require that we plan and perform the audit to obtain reasonable assurance about whether effective internal control over financial reporting was maintained in all material respects. An audit of internal control over financial reporting includes obtaining an understanding of internal control over financial reporting, evaluating management’s assessment, testing and evaluating the design and operating effectiveness of internal control, and performing such other procedures as we consider necessary in the circumstances. We believe that our audit provides a reasonable basis for our opinions.2006.
A company’s internal control over financial reporting is a process designed to provide reasonable assurance regarding the reliability of financial reporting and the preparation of financial statements for external purposes in accordance with generally accepted accounting principles. A company’s internal control over financial reporting includes those policies and procedures that (i) pertain to the maintenance of records that, in reasonable detail, accurately and fairly reflect the transactions and dispositions of the assets of the company; (ii) provide reasonable assurance that transactions are recorded as necessary to permit preparation of financial statements in accordance with generally accepted accounting principles, and that receipts and expenditures of the company are being made only in accordance with authorizations of management and directors of the company; and (iii) provide reasonable assurance regarding prevention or timely detection of unauthorized acquisition, use, or disposition of the company’s assets that could have a material effect on the financial statements.
Because of its inherent limitations, internal control over financial reporting may not prevent or detect misstatements. Also, projections of any evaluation of effectiveness to future periods are subject to the risk that controls may become inadequate because of changes in conditions, or that the degree of compliance with the policies or procedures may deteriorate.
/s/ PricewaterhouseCoopers LLP
Houston, Texas
March6, 2006February 27, 2009
Index to Financial Statements
CONSOLIDATED STATEMENT OF OPERATIONS
(In thousands, except per share amounts)
| Year Ended December 31, | Year Ended December 31, | |||||||||||||||||||
| 2005 | 2004 | 2003 | 2008 | 2007 | 2006 | |||||||||||||||
OPERATING REVENUES | ||||||||||||||||||||
Natural Gas Production | $ | 499,177 | $ | 379,661 | $ | 322,556 | $ | 758,755 | $ | 581,640 | $ | 568,097 | ||||||||
Brokered Natural Gas | 98,605 | 84,416 | 95,816 | 114,220 | 93,215 | 93,651 | ||||||||||||||
Crude Oil and Condensate | 82,348 | 60,022 | 81,040 | 69,711 | 55,243 | 91,380 | ||||||||||||||
Other | 2,667 | 6,309 | 9,979 | 3,105 | 2,072 | 8,860 | ||||||||||||||
| 682,797 | 530,408 | 509,391 | 945,791 | 732,170 | 761,988 | |||||||||||||||
OPERATING EXPENSES | ||||||||||||||||||||
Brokered Natural Gas Cost | 87,183 | 75,217 | 86,162 | 100,449 | 81,819 | 83,375 | ||||||||||||||
Direct Operations - Field and Pipeline | 61,750 | 53,581 | 50,399 | |||||||||||||||||
Direct Operations—Field and Pipeline | 91,839 | 77,170 | 74,790 | |||||||||||||||||
Exploration | 61,840 | 48,130 | 58,119 | 31,200 | 39,772 | 49,397 | ||||||||||||||
Depreciation, Depletion and Amortization | 108,458 | 103,343 | 94,903 | 185,403 | 143,951 | 128,975 | ||||||||||||||
Impairment of Unproved Properties | 12,966 | 10,145 | 9,348 | 41,512 | 19,042 | 11,117 | ||||||||||||||
Impairment of Oil & Gas Properties (Note 2) | — | 3,458 | 93,796 | |||||||||||||||||
Impairment of Oil & Gas Properties and Other Assets (Note 2) | 35,700 | 4,614 | 3,886 | |||||||||||||||||
General and Administrative | 37,650 | 34,735 | 25,112 | 74,185 | 50,775 | 58,168 | ||||||||||||||
Taxes Other Than Income | 54,293 | 41,022 | 37,138 | 66,540 | 53,782 | 55,351 | ||||||||||||||
| 424,140 | 369,631 | 454,977 | 626,828 | 470,925 | 465,059 | |||||||||||||||
Gain / (Loss) on Sale of Assets | 74 | (124 | ) | 12,173 | ||||||||||||||||
Gain on Sale of Assets | 1,143 | 13,448 | 232,017 | |||||||||||||||||
Gain on Settlement of Dispute (Note 7) | 51,906 | — | — | |||||||||||||||||
INCOME FROM OPERATIONS | 258,731 | 160,653 | 66,587 | 372,012 | 274,693 | 528,946 | ||||||||||||||
Interest Expense and Other | 22,497 | 22,029 | 23,545 | 36,389 | 17,161 | 18,441 | ||||||||||||||
Income Before Income Taxes and Cumulative Effect of Accounting Change | 236,234 | 138,624 | 43,042 | |||||||||||||||||
Income Before Income Taxes | 335,623 | 257,532 | 510,505 | |||||||||||||||||
Income Tax Expense | 87,789 | 50,246 | 15,063 | 124,333 | 90,109 | 189,330 | ||||||||||||||
INCOME BEFORE CUMULATIVE EFFECT OF ACCOUNTING CHANGE | 148,445 | 88,378 | 27,979 | |||||||||||||||||
CUMULATIVE EFFECT OF ACCOUNTING CHANGE (Note 11) | — | — | (6,847 | ) | ||||||||||||||||
NET INCOME | $ | 148,445 | $ | 88,378 | $ | 21,132 | $ | 211,290 | $ | 167,423 | $ | 321,175 | ||||||||
Basic Earnings Per Share - Before Accounting Change | $ | 3.04 | $ | 1.81 | $ | 0.58 | ||||||||||||||
Diluted Earnings Per Share - Before Accounting Change | $ | 2.99 | $ | 1.79 | $ | 0.58 | ||||||||||||||
Basic Loss Per Share - Accounting Change | $ | — | $ | — | $ | (0.14 | ) | |||||||||||||
Diluted Loss Per Share - Accounting Change | $ | — | $ | — | $ | (0.14 | ) | |||||||||||||
Basic Earnings Per Share | $ | 3.04 | $ | 1.81 | $ | 0.44 | $ | 2.10 | $ | 1.73 | $ | 3.32 | ||||||||
Diluted Earnings Per Share | $ | 2.99 | $ | 1.79 | $ | 0.44 | $ | 2.08 | $ | 1.71 | $ | 3.26 | ||||||||
| — | ||||||||||||||||||||
Weighted Average Common Shares Outstanding | 48,856 | 48,733 | 48,074 | |||||||||||||||||
Diluted Common Shares (Note 12) | 49,725 | 49,339 | 48,435 | |||||||||||||||||
Weighted-Average Common Shares Outstanding | 100,737 | 96,978 | 96,803 | |||||||||||||||||
Diluted Common Shares (Note 13) | 101,726 | 98,130 | 98,601 | |||||||||||||||||
The accompanying notes are an integral part of these consolidated financial statements.
Index to Financial Statements
CONSOLIDATED BALANCE SHEET
(In thousands, except share amounts)
| December 31, | ||||||||
| 2005 | 2004 | |||||||
ASSETS | ||||||||
Current Assets | ||||||||
Cash and Cash Equivalents | $ | 10,626 | $ | 10,026 | ||||
Accounts Receivable | 168,248 | 125,754 | ||||||
Inventories | 24,616 | 24,049 | ||||||
Deferred Income Taxes | 15,674 | 21,345 | ||||||
Other | 11,148 | 13,505 | ||||||
Total Current Assets | 230,312 | 194,679 | ||||||
Properties and Equipment, Net (Successful Efforts Method) | 1,238,055 | 994,081 | ||||||
Deferred Income Taxes | 19,587 | 14,855 | ||||||
Other Assets | 7,416 | 7,341 | ||||||
| $ | 1,495,370 | $ | 1,210,956 | |||||
LIABILITIES AND STOCKHOLDERS’ EQUITY | ||||||||
Current Liabilities | ||||||||
Accounts Payable | $ | 140,006 | $ | 104,969 | ||||
Current Portion of Long-Term Debt | 20,000 | 20,000 | ||||||
Deferred Income Taxes | 941 | 944 | ||||||
Derivative Contracts | 22,478 | 38,368 | ||||||
Accrued Liabilities | 35,159 | 32,608 | ||||||
Total Current Liabilities | 218,584 | 196,889 | ||||||
Long-Term Debt | 320,000 | 250,000 | ||||||
Deferred Income Taxes | 289,381 | 247,376 | ||||||
Other Liabilities | 67,194 | 61,029 | ||||||
Commitments and Contingencies (Note 7) | ||||||||
Stockholders’ Equity | ||||||||
Common Stock: | ||||||||
Authorized — 80,000,000 Shares of $.10 Par Value Issued — 50,081,983 Shares and 49,680,915 Shares in 2005 and 2004, respectively | 5,008 | 4,968 | ||||||
Additional Paid-in Capital | 397,349 | 380,125 | ||||||
Retained Earnings | 252,167 | 110,935 | ||||||
Accumulated Other Comprehensive Loss | (15,115 | ) | (20,351 | ) | ||||
Less Treasury Stock, at Cost: | ||||||||
1,513,850 and 1,061,550 Shares in 2005 and 2004, respectively | (39,198 | ) | (20,015 | ) | ||||
Total Stockholders’ Equity | 600,211 | 455,662 | ||||||
| $ | 1,495,370 | $ | 1,210,956 | |||||
The accompanying notes are an integral part of these condensed consolidated financial statements.
CONSOLIDATED STATEMENT OF CASH FLOWS
(In thousands)
| Year Ended December 31, | ||||||||||||
| 2005 | 2004 | 2003 | ||||||||||
CASH FLOWS FROM OPERATING ACTIVITIES | ||||||||||||
Net Income | $ | 148,445 | $ | 88,378 | $ | 21,132 | ||||||
Adjustments to Reconcile Net Income to Cash Provided by Operating Activities: | ||||||||||||
Cumulative Effect of Accounting Change | — | — | 6,847 | |||||||||
Depreciation, Depletion and Amortization | 108,458 | 103,343 | 94,903 | |||||||||
Impairment of Unproved Properties | 12,966 | 10,145 | 9,348 | |||||||||
Impairment of Oil & Gas Properties | — | 3,458 | 93,796 | |||||||||
Deferred Income Tax Expense | 39,628 | 31,769 | (9,837 | ) | ||||||||
(Gain) / Loss on Sale of Assets | (74 | ) | 124 | (12,173 | ) | |||||||
Exploration Expense | 61,840 | 48,130 | 58,119 | |||||||||
Unrealized Change in Derivative Fair Value | (6,626 | ) | 2,003 | 3,347 | ||||||||
Performance Share Compensation | 3,357 | 3,429 | — | |||||||||
Stock-Based Compensation Expense and Other | 6,446 | 3,475 | 885 | |||||||||
Changes in Assets and Liabilities: | ||||||||||||
Accounts Receivable | (42,494 | ) | (39,404 | ) | (17,397 | ) | ||||||
Inventories | (567 | ) | (5,808 | ) | (2,989 | ) | ||||||
Other Current Assets | 1,188 | 3,255 | (9,208 | ) | ||||||||
Other Assets | (192 | ) | (491 | ) | 163 | |||||||
Accounts Payable and Accrued Liabilities | 29,803 | 17,231 | 7,041 | |||||||||
Other Liabilities | 2,382 | 3,985 | (2,339 | ) | ||||||||
Net Cash Provided by Operating Activities | 364,560 | 273,022 | 241,638 | |||||||||
CASH FLOWS FROM INVESTING ACTIVITIES | ||||||||||||
Capital Expenditures | (351,306 | ) | (207,346 | ) | (122,018 | ) | ||||||
Proceeds from Sale of Assets | 996 | 119 | 28,281 | |||||||||
Exploration Expense | (61,840 | ) | (48,130 | ) | (58,119 | ) | ||||||
Net Cash Used by Investing Activities | (412,150 | ) | (255,357 | ) | (151,856 | ) | ||||||
CASH FLOWS FROM FINANCING ACTIVITIES | ||||||||||||
Increase in Debt | 265,000 | 187,000 | 248,655 | |||||||||
Decrease in Debt | (195,000 | ) | (187,000 | ) | (341,000 | ) | ||||||
Sale of Common Stock Proceeds | 4,586 | 12,474 | 6,728 | |||||||||
Purchase of Treasury Stock | (19,183 | ) | (15,631 | ) | — | |||||||
Dividends Paid | (7,213 | ) | (5,206 | ) | (5,043 | ) | ||||||
Net Cash Provided / (Used) by Financing Activities | 48,190 | (8,363 | ) | (90,660 | ) | |||||||
Net Increase / (Decrease) in Cash and Cash Equivalents | 600 | 9,302 | (878 | ) | ||||||||
Cash and Cash Equivalents, Beginning of Period | 10,026 | 724 | 1,602 | |||||||||
Cash and Cash Equivalents, End of Period | $ | 10,626 | $ | 10,026 | $ | 724 | ||||||
The accompanying notes are an integral part of these condensed consolidated financial statements.
CONSOLIDATED STATEMENT OF STOCKHOLDERS’ EQUITY
(In thousands)
| Common Shares | Stock Par | Treaury Shares | Treasury Stock | Paid-In Capital | Accumulated (Loss) | Retained Earnings | Total | |||||||||||||||||||
Balance at December 31, 2002 | 48,200 | $ | 4,820 | 454 | $ | (4,384 | ) | $ | 351,486 | $ | (12,939 | ) | $ | 11,674 | $ | 350,657 | ||||||||||
Net Income | 21,132 | 21,132 | ||||||||||||||||||||||||
Exercise of Stock Options | 517 | 52 | 7,716 | 7,768 | ||||||||||||||||||||||
Cash Dividends at $0.16 per Share | (5,043 | ) | (5,043 | ) | ||||||||||||||||||||||
Other Comprehensive Loss | (10,196 | ) | (10,196 | ) | ||||||||||||||||||||||
Stock Grant Vesting | 90 | 9 | 870 | 879 | ||||||||||||||||||||||
Balance at December 31, 2003 | 48,807 | $ | 4,881 | 454 | $ | (4,384 | ) | $ | 360,072 | $ | (23,135 | ) | $ | 27,763 | $ | 365,197 | ||||||||||
Net Income | 88,378 | 88,378 | ||||||||||||||||||||||||
Exercise of Stock Options | 794 | 79 | 15,034 | 15,113 | ||||||||||||||||||||||
Purchase of Treasury Stock | 608 | (15,631 | ) | (15,631 | ) | |||||||||||||||||||||
Performance Share Awards | 2,394 | 2,394 | ||||||||||||||||||||||||
Stock Grant Vesting | 80 | 8 | 2,625 | 2,633 | ||||||||||||||||||||||
Cash Dividends at $0.16 per Share | (5,206 | ) | (5,206 | ) | ||||||||||||||||||||||
Other Comprehensive Income | 2,784 | 2,784 | ||||||||||||||||||||||||
Balance at December 31, 2004 | 49,681 | $ | 4,968 | 1,062 | $ | (20,015 | ) | $ | 380,125 | $ | (20,351 | ) | $ | 110,935 | $ | 455,662 | ||||||||||
Net Income | 148,445 | 148,445 | ||||||||||||||||||||||||
Exercise of Stock Options | 300 | 30 | 8,217 | 8,247 | ||||||||||||||||||||||
Purchase of Treasury Stock | 452 | (19,183 | ) | (19,183 | ) | |||||||||||||||||||||
Performance Share Awards | 4,147 | 4,147 | ||||||||||||||||||||||||
Stock Grant Vesting | 101 | 10 | 4,860 | 4,870 | ||||||||||||||||||||||
Cash Dividends at $0.16 per Share | (7,213 | ) | (7,213 | ) | ||||||||||||||||||||||
Other Comprehensive Income | 5,236 | 5,236 | ||||||||||||||||||||||||
Balance at December 31, 2005 | 50,082 | $ | 5,008 | 1,514 | $ | (39,198 | ) | $ | 397,349 | $ | (15,115 | ) | $ | 252,167 | $ | 600,211 | ||||||||||
| December 31, | ||||||||
| 2008 | 2007 | |||||||
ASSETS | ||||||||
Current Assets | ||||||||
Cash and Cash Equivalents | $ | 28,101 | $ | 18,498 | ||||
Accounts Receivable, Net (Note 3) | 109,087 | 109,306 | ||||||
Income Taxes Receivable | 526 | 3,832 | ||||||
Inventories (Note 3) | 45,677 | 27,353 | ||||||
Deferred Income Taxes | — | 22,526 | ||||||
Derivative Contracts (Note 11) | 264,660 | 12,655 | ||||||
Other Current Assets (Note 3) | 12,500 | 23,313 | ||||||
Total Current Assets | 460,551 | 217,483 | ||||||
Properties and Equipment, Net (Successful Efforts Method) (Note 2) | 3,135,828 | 1,908,117 | ||||||
Derivative Contracts (Note 11) | 90,542 | — | ||||||
Other Assets (Note 3) | 14,743 | 31,217 | ||||||
| $ | 3,701,664 | $ | 2,156,817 | |||||
LIABILITIES AND STOCKHOLDERS’ EQUITY | ||||||||
Current Liabilities | ||||||||
Accounts Payable (Note 3) | $ | 222,985 | $ | 173,497 | ||||
Current Portion of Long-Term Debt | 35,857 | 20,000 | ||||||
Deferred Income Taxes | 63,985 | — | ||||||
Income Taxes Payable | 5,535 | 1,391 | ||||||
Derivative Contracts (Note 11) | — | 5,383 | ||||||
Accrued Liabilities (Note 3) | 50,551 | 48,065 | ||||||
Total Current Liabilities | 378,913 | 248,336 | ||||||
Long-Term Liability for Pension and Postretirement Benefits (Note 5) | 54,714 | 26,947 | ||||||
Long-Term Debt (Note 4) | 831,143 | 330,000 | ||||||
Deferred Income Taxes | 599,106 | 433,923 | ||||||
Other Liabilities (Note 3) | 47,226 | 47,354 | ||||||
Commitments and Contingencies (Note 7) | ||||||||
Stockholders’ Equity | ||||||||
Common Stock: | ||||||||
Authorized—120,000,000 Shares of $0.10 Par Value | ||||||||
Issued—103,561,268 Shares and 102,681,468 Shares in 2008 and 2007, respectively | 10,356 | 10,268 | ||||||
Additional Paid-in Capital | 675,568 | 424,229 | ||||||
Retained Earnings | 921,561 | 722,344 | ||||||
Accumulated Other Comprehensive Income / (Loss) (Note 14) | 186,426 | (894 | ) | |||||
Less Treasury Stock, at Cost: (Note 9) | (3,349 | ) | (85,690 | ) | ||||
Total Stockholders’ Equity | 1,790,562 | 1,070,257 | ||||||
| $ | 3,701,664 | $ | 2,156,817 | |||||
The accompanying notes are an integral part of these consolidated financial statements.
Index to Financial Statements
CONSOLIDATED STATEMENT OF COMPREHENSIVE INCOMECASH FLOWS
(In thousands)
| Year Ended December 31, | ||||||||||||
| 2005 | 2004 | 2003 | ||||||||||
Net Income | $ | 148,445 | $ | 88,378 | $ | 21,132 | ||||||
Other Comprehensive Income / (Loss) | ||||||||||||
Reclassification Adjustment for Settled Contracts | 100,653 | 53,516 | 47,926 | |||||||||
Changes in Fair Value of Hedge Positions | (92,559 | ) | (48,494 | ) | (63,014 | ) | ||||||
Minimum Pension Liability | (205 | ) | (1,404 | ) | (1,333 | ) | ||||||
Foreign Currency Translation Adjustment | 808 | 662 | (5 | ) | ||||||||
Deferred Income Tax | (3,461 | )(1) | (1,496 | )(2) | 6,230 | (3) | ||||||
Total Other Comprehensive Income / (Loss) | 5,236 | 2,784 | (10,196 | ) | ||||||||
Comprehensive Income | $ | 153,681 | $ | 91,162 | $ | 10,936 | ||||||
| Year Ended December 31, | ||||||||||||
| 2008 | 2007 | 2006 | ||||||||||
CASH FLOWS FROM OPERATING ACTIVITIES | ||||||||||||
Net Income | $ | 211,290 | $ | 167,423 | $ | 321,175 | ||||||
Adjustments to Reconcile Net Income to Cash Provided by Operating Activities: | ||||||||||||
Depreciation, Depletion and Amortization | 185,403 | 143,951 | 128,975 | |||||||||
Impairment of Unproved Properties | 41,512 | 19,042 | 11,117 | |||||||||
Impairment of Oil & Gas Properties and Other Assets | 35,700 | 4,614 | 3,886 | |||||||||
Deferred Income Tax Expense | 120,851 | 95,152 | 52,011 | |||||||||
Gain on Sale of Assets | (1,143 | ) | (13,448 | ) | (232,017 | ) | ||||||
Gain on Settlement of Dispute | (31,706 | ) | — | — | ||||||||
Exploration Expense | 31,200 | 39,772 | 49,397 | |||||||||
Stock-Based Compensation Expense and Other | 15,623 | 16,241 | 21,271 | |||||||||
Changes in Assets and Liabilities: | ||||||||||||
Accounts Receivable, Net | (3,928 | ) | 6,854 | 39,463 | ||||||||
Income Taxes Receivable | 34,521 | 14,456 | (11,198 | ) | ||||||||
Inventories | (18,324 | ) | 5,644 | (8,381 | ) | |||||||
Other Current Assets | 10,816 | (14,908 | ) | 1,007 | ||||||||
Other Assets | 5,698 | (29,795 | ) | (733 | ) | |||||||
Accounts Payable and Accrued Liabilities | 3,321 | 1,052 | (29,694 | ) | ||||||||
Income Taxes Payable | 3,580 | (1,281 | ) | 18,398 | ||||||||
Other Liabilities | 724 | 7,368 | 1,912 | |||||||||
Stock-Based Compensation Tax Benefit | (10,691 | ) | — | (9,485 | ) | |||||||
Net Cash Provided by Operating Activities | 634,447 | 462,137 | 357,104 | |||||||||
CASH FLOWS FROM INVESTING ACTIVITIES | ||||||||||||
Capital Expenditures | (817,440 | ) | (553,229 | ) | (460,742 | ) | ||||||
Acquisitions | (605,748 | ) | (3,982 | ) | (6,688 | ) | ||||||
Proceeds from Sale of Assets | 2,099 | 7,061 | 329,474 | |||||||||
Exploration Expense | (31,200 | ) | (39,772 | ) | (49,397 | ) | ||||||
Net Cash Used in Investing Activities | (1,452,289 | ) | (589,922 | ) | (187,353 | ) | ||||||
CASH FLOWS FROM FINANCING ACTIVITIES | ||||||||||||
Increase in Debt | 892,000 | 175,000 | 205,000 | |||||||||
Decrease in Debt | (375,000 | ) | (65,000 | ) | (305,000 | ) | ||||||
Net Proceeds from Sale of Common Stock | 316,230 | 5,099 | 6,235 | |||||||||
Stock-Based Compensation Tax Benefit | 10,691 | — | 9,485 | |||||||||
Purchase of Treasury Stock | — | — | (46,492 | ) | ||||||||
Dividends Paid | (12,073 | ) | (10,670 | ) | (7,751 | ) | ||||||
Capitalized Debt Issuance Costs | (4,403 | ) | — | — | ||||||||
Net Cash Provided by / (Used in) Financing Activities | 827,445 | 104,429 | (138,523 | ) | ||||||||
Net Increase / (Decrease) in Cash and Cash Equivalents | 9,603 | (23,356 | ) | 31,228 | ||||||||
Cash and Cash Equivalents, Beginning of Year | 18,498 | 41,854 | 10,626 | |||||||||
Cash and Cash Equivalents, End of Year | $ | 28,101 | $ | 18,498 | $ | 41,854 | ||||||
The accompanying notes are an integral part of these consolidated financial statements.
Index to Financial Statements
CABOT OIL & GAS CORPORATION
CONSOLIDATED STATEMENT OF STOCKHOLDERS’ EQUITY
(In thousands, except per share amounts)
| Common Shares | Stock Par | Treasury Shares | Treasury Stock | Paid-In Capital | Accumulated Other Comprehensive Income / (Loss)(1) | Retained Earnings | Total | |||||||||||||||||||||||
Balance at December 31, 2005 | 100,164 | $ | 10,016 | 3,028 | $ | (39,198 | ) | $ | 392,341 | $ | (15,115 | ) | $ | 252,167 | $ | 600,211 | ||||||||||||||
Net Income | — | — | — | — | — | — | 321,175 | 321,175 | ||||||||||||||||||||||
Exercise of Stock Options | 876 | 88 | — | — | 6,127 | — | — | 6,215 | ||||||||||||||||||||||
Purchase of Treasury Stock | — | — | 2,177 | (46,492 | ) | — | — | — | (46,492 | ) | ||||||||||||||||||||
Tax Benefit of Stock-Based Compensation | — | — | — | — | 9,485 | — | — | 9,485 | ||||||||||||||||||||||
Stock Amortization and Vesting | 378 | 38 | — | — | 10,042 | — | — | 10,080 | ||||||||||||||||||||||
Cash Dividends at $0.08 per Share | — | — | — | — | — | — | (7,751 | ) | (7,751 | ) | ||||||||||||||||||||
Effect of Adoption of SFAS No. 158 | — | — | — | — | — | (14,079 | ) | — | (14,079 | ) | ||||||||||||||||||||
Other Comprehensive Income | — | — | — | — | — | 66,354 | — | 66,354 | ||||||||||||||||||||||
Balance at December 31, 2006 | 101,418 | $ | 10,142 | 5,205 | $ | (85,690 | ) | $ | 417,995 | $ | 37,160 | $ | 565,591 | $ | 945,198 | |||||||||||||||
Net Income | — | — | — | — | — | — | 167,423 | 167,423 | ||||||||||||||||||||||
Exercise of Stock Options | 619 | 62 | — | — | 5,005 | — | — | 5,067 | ||||||||||||||||||||||
Stock Amortization and Vesting | 430 | 43 | — | — | 7,503 | — | — | 7,546 | ||||||||||||||||||||||
Stock Held in Rabbi Trust | 214 | 21 | — | — | (6,274 | ) | — | — | (6,253 | ) | ||||||||||||||||||||
Cash Dividends at $0.11 per Share | — | — | — | — | — | — | (10,670 | ) | (10,670 | ) | ||||||||||||||||||||
Other Comprehensive Income | — | — | — | — | — | (38,054 | ) | — | (38,054 | ) | ||||||||||||||||||||
Balance at December 31, 2007 | 102,681 | $ | 10,268 | 5,205 | $ | (85,690 | ) | $ | 424,229 | $ | (894 | ) | $ | 722,344 | $ | 1,070,257 | ||||||||||||||
Net Income | — | — | — | — | — | — | 211,290 | 211,290 | ||||||||||||||||||||||
Exercise of Stock Options | 328 | 33 | — | — | 2,692 | — | — | 2,725 | ||||||||||||||||||||||
Retirement of Treasury Stock | (5,003 | ) | (500 | ) | (5,003 | ) | 82,341 | (81,841 | ) | — | — | — | ||||||||||||||||||
Tax Benefit of Stock-Based Compensation | — | — | — | — | 10,691 | — | — | 10,691 | ||||||||||||||||||||||
Stock Amortization and Vesting | 418 | 42 | — | — | 6,545 | — | — | 6,587 | ||||||||||||||||||||||
Stock Held in Rabbi Trust | 64 | 6 | — | — | (3,198 | ) | — | — | (3,192 | ) | ||||||||||||||||||||
Stock Issued for Drilling Company Acquisition | 70 | 7 | — | — | 3,493 | — | — | 3,500 | ||||||||||||||||||||||
Issuance of Common Stock | 5,003 | 500 | — | — | 312,957 | — | — | 313,457 | ||||||||||||||||||||||
Cash Dividends at $0.12 per Share | — | — | — | — | — | — | (12,073 | ) | (12,073 | ) | ||||||||||||||||||||
Other Comprehensive Income | — | — | — | — | — | 187,320 | — | 187,320 | ||||||||||||||||||||||
Balance at December 31, 2008 | 103,561 | $ | 10,356 | 202 | $ | (3,349 | ) | $ | 675,568 | $ | 186,426 | $ | 921,561 | $ | 1,790,562 | |||||||||||||||
(1) | For further details on the |
The accompanying notes are an integral part of these consolidated financial statements.
Index to Financial Statements
CONSOLIDATED STATEMENT OF COMPREHENSIVE INCOME
(In thousands)
| Year Ended December 31, | ||||||||||||||||||||
| 2008 | 2007 | 2006 | ||||||||||||||||||
Net Income | $ | 211,290 | $ | 167,423 | $ | 321,175 | ||||||||||||||
Other Comprehensive Income / (Loss), net of taxes: | ||||||||||||||||||||
Reclassification Adjustment for Settled Contracts, net of taxes of $4,844, $29,801 and $10,686, respectively | (8,177 | ) | (49,241 | ) | (17,580 | ) | ||||||||||||||
Changes in Fair Value of Hedge Positions, net of taxes of $(134,259), $(1,777) and $(49,311), respectively | 226,692 | 2,555 | 81,679 | |||||||||||||||||
Defined Benefit Pension and Postretirement Plans: | ||||||||||||||||||||
Net Loss Arising During the Year, net of taxes of $10,445 and $1,034, respectively | $ | (17,629 | ) | $ | (1,733 | ) | ||||||||||||||
Amortization of Net Obligation at Transition, net of taxes of $(234) and $(238), respectively | 398 | 394 | ||||||||||||||||||
Amortization of Prior Service Cost, net of taxes of $(373) and $(413), respectively | 630 | 681 | ||||||||||||||||||
Amortization of Net Loss, net of taxes of $(603) and $(483), respectively | 1,020 | (15,581 | ) | 799 | 141 | 3,081 | ||||||||||||||
Foreign Currency Translation Adjustment, net of taxes of $9,292, $(5,072) and $507, respectively | (15,614 | ) | 8,491 | (826 | ) | |||||||||||||||
Total Other Comprehensive Income / (Loss) | 187,320 | (38,054 | ) | 66,354 | ||||||||||||||||
Comprehensive Income | $ | 398,610 | $ | 129,369 | $ | 387,529 | ||||||||||||||
The accompanying notes are an integral part of these consolidated financial statements.
Index to Financial Statements
CABOT OIL & GAS CORPORATION
NOTES TO THE CONSOLIDATED FINANCIAL STATEMENTS
1. Summary of Significant Accounting Policies
Basis of Presentation and Nature of Operations
Cabot Oil & Gas Corporation and its subsidiaries are engaged in the development, exploitation, exploration, development, production and marketing of natural gas and, to a lesser extent, crude oil and natural gas liquids. The Company also transports, stores, gathers and purchases natural gas for resale. The Company operates in one segment, natural gas and oil explorationdevelopment, exploitation and exploitation,exploration, exclusively within the continental United States and Canada. The Company’s exploration activities are concentrated in areas with known hydrocarbon resources, which are conducive to multi-well, repeatable drilling programs. The Company’s program is designed to be disciplined and balanced with a focus on achieving strong financial returns.
The consolidated financial statements contain the accounts of the Company and its majority-owned subsidiaries after eliminating all significant intercompany balances and transactions. Certain prior year amounts have been reclassified to conform to the current year presentation.
On February 28, 2005, the Company announced that23, 2007, the Board of Directors had declared a 3-for-22-for-1 split of the Company’s common stock in the form of a stock distribution. The stock dividend was distributed on March 31, 200530, 2007 to stockholders of record on March 18, 2005. In lieu of issuing fractional shares, the Company paid cash based on the closing price of the common stock on the record date.16, 2007. All common stock accounts and per share data have been retroactively adjusted to give effect to the 3-for-22-for-1 split of the Company’s common stock.
Recently Issued Accounting Pronouncements
In March 2005,December 2008, the Securities and Exchange Commission (SEC) issued Release No. 33-8995, “Modernization of Oil and Gas Reporting,” which amends the oil and gas disclosures for oil and gas producers contained in Regulations S-K and S-X, as well as adding a section to Regulation S-K (Subpart 1200) to codify the revised disclosure requirements in Securities Act Industry Guide 2, which is being phased out. The goal of Release No. 33-8995 is to provide investors with a more meaningful and comprehensive understanding of oil and gas reserves. Energy companies affected by Release No. 33-8995 will be required to price proved oil and gas reserves using the unweighted arithmetic average of the price on the first day of each month within the 12-month period prior to the end of the reporting period, unless prices are defined by contractual arrangements, excluding escalations based on future conditions. SEC Release No. 33-8995 is effective beginning January 1, 2010. The Company is currently evaluating what impact Release No. 33-8995 may have on its financial position, results of operations or cash flows.
In June 2008, the Financial Accounting Standards Board (FASB) issued FASB Interpretation (FIN)Staff Position (FSP) No. 47, “AccountingEmerging Issues Task Force (EITF) 03-6-1, “Determining Whether Instruments Granted in Share-Based Payment Transactions Are Participating Securities.” Under this FSP, unvested share-based payment awards that contain nonforfeitable rights to dividends or dividend equivalents, whether they are paid or unpaid, are considered participating securities and should be included in the computation of earnings per share pursuant to the two-class method. FSP No. EITF 03-6-1 is effective for Conditional Asset Retirement Obligations.” This Interpretation clarifiesfinancial statements issued for fiscal years beginning after December 15, 2008, and interim periods within those years. In addition, all prior period earnings per share data presented should be adjusted retrospectively and early application is not permitted. The Company does not believe that FSP No. EITF 03-6-1 will have a material impact on its financial position, results of operations or cash flows.
In May 2008, the definition and treatment of conditional asset retirement obligations as discussed inFASB issued Statement of Financial Accounting Standards (SFAS) No. 143,162, “The Hierarchy of Generally Accepted Accounting Principles,” which identifies a consistent framework for selecting accounting principles to be used in preparing financial statements for nongovernmental entities that are presented in conformity with United States generally accepted accounting principles (GAAP). The current GAAP hierarchy
Index to Financial Statements
was criticized due to its complexity, ranking position of FASB Statements of Financial Accounting Concepts and the fact that it is directed at auditors rather than entities. SFAS No. 162 will be effective 60 days following the SEC’s approval of the Public Company Accounting Oversight Board amendments to AU Section 411, “The Meaning of Present Fairly in Conformity with Generally Accepted Accounting Principles.” The FASB does not expect that SFAS No. 162 will have a change in current practice, and the Company does not believe that SFAS No. 162 will have an impact on its financial position, results of operations or cash flows.
In March 2008, the FASB issued SFAS No. 161, “Disclosures about Derivative Instruments and Hedging Activities,” which amends SFAS No. 133, “Accounting for Asset Retirement Obligations.Derivative Instruments and Hedging Activities.” Enhanced disclosures to improve financial reporting transparency are required and include disclosure about the location and amounts of derivative instruments in the financial statements, how derivative instruments are accounted for and how derivatives affect an entity’s financial position, financial performance and cash flows. A conditional asset retirement obligation is defined as an asset retirement activity in which the timing and/or method of settlement are dependent on future events that may be outside the control of the Company. FIN No. 47 states that a company must record a liability when incurred for conditional asset retirement obligations iftabular format including the fair value of derivative instruments and their gains and losses, disclosure about credit risk-related derivative features and cross-referencing within the obligationfootnotes are also new requirements. SFAS No. 161 is reasonably estimable. This Interpretation is intendedeffective for financial statements issued for fiscal years and interim periods beginning after November 15, 2008, with early application and comparative disclosures encouraged, but not required. The Company has not yet adopted SFAS No. 161. It does not believe that there will be an impact on our financial position, results of operations or cash flows.
In December 2007, the FASB issued SFAS No. 141(R), “Business Combinations.” SFAS No. 141(R) was issued in an effort to provide more information about long-lived assets, more information about future cash outflowscontinue the movement toward the greater use of fair values in financial reporting and increased transparency through expanded disclosures. It changes how business acquisitions are accounted for these obligations and more consistent recognitionwill impact financial statements at the acquisition date and in subsequent periods. Certain of these liabilities. FINchanges will introduce more volatility into earnings. The acquirer must now record all assets and liabilities of the acquired business at fair value, and related transaction and restructuring costs will be expensed rather than the previous method of being capitalized as part of the acquisition. SFAS No. 47141(R) also impacts the annual goodwill impairment test associated with acquisitions, including those that close before the effective date of SFAS No. 141(R). The definitions of a “business” and a “business combination” have been expanded, resulting in more transactions qualifying as business combinations. SFAS No. 141(R) is effective for fiscal years, ending after December 15, 2005. The Company’s financial position, results of operations and cash flows were not impacted by this Interpretation, since all asset retirement obligations are currently recorded.
On April 4, 2005, the FASB issued FASB Staff Position (FSP) FAS 19-1 “Accounting for Suspended Well Costs.” This staff position amends FASB Statement No. 19 “Financial Accounting and Reporting by Oil and Gas Producing Companies” and provides guidance about exploratory well costs to companies who use the successful efforts method of accounting. The position states that exploratory well costs should continue to be capitalized if: 1) a sufficient quantity of reserves are discovered in the well to justify its completion as a producing well and 2) sufficient progress is made in assessing the reserves and the well’s economic and operating feasibility. If the exploratory well costs do not meet both of these criteria, these costs should be expensed, net of any salvage value. Additional annual disclosures are required to provide information about management’s evaluation of capitalized exploratory well costs. In addition, the Staff Position requires the annual disclosure of: 1) net changes from period to period of capitalized exploratory well costs for wells that are pending the determination of proved reserves, 2) the amount of exploratory well costs that have been capitalized for a period greater than one year after the completion of drilling and 3) an aging of exploratory well costs suspended for greater than one year with the number of wells it related to. Further, the disclosures should describe the activities undertaken to evaluate the reserves and the projects, the information still required to classify the associated reserves as proved and the estimated timing for completing the evaluation. For the Company’s disclosures, refer to Note 2 of the Notes to the Consolidated Financial Statements.
In May 2005, the FASB issued SFAS No. 154, “Accounting Changes and Error Corrections-A replacement of APB Opinion No. 20 and FASB Statement No. 3.” In order to enhance financial reporting consistency betweeninterim periods SFAS No. 154 modifies the requirements for the accounting and reporting of the direct effects of changes in accounting principles. Under APB Opinion No. 20, the cumulative effect of voluntary changes in accounting principle was recognized in Net Income in the period of the change. Unlike the treatment previously prescribed by APB Opinion No. 20, retrospective application is now required, unless it is not practical to determine the specific effects in each period or the cumulative effect. If the period specific effects cannot be determined, it is required that the new accounting principle must be retrospectively applied in the earliest period possible to the balance sheet accounts and a corresponding adjustment be made to the opening balance of retained earnings or another equity account. If the cumulative effect cannot be determined, it is necessary to apply the new accounting principles prospectively at the earliest practical date. If it is not feasible to retrospectively apply the change in principle, the reason that this is not possible and the method used to report the change is required to be disclosed. The statement also provides that changes in accounting for depreciation, depletion or amortization should be treated as changes in accounting estimate inseparable from a change in accounting principle and that disclosure of the preferability of the change is required. SFAS No. 154 is effective for accounting changes made inwithin those fiscal years, beginning after December 15, 2005.
In December 2004, the FASB issued SFAS No. 123(R), “Share-Based Payment.” SFAS No. 123(R) revises SFAS No. 123, “Accounting for Stock-Based Compensation,” and focuses on accounting for share-based payments for services provided by employee to employer. The statement requires companies to expense the fair value of employee stock options and other equity-based compensation at the grant date. The statement does not require a certain type of valuation model, and either a binomial or Black-Scholes model may be used. During the first quarter of 2005, the Securities and Exchange Commission (SEC) approved a new rule for public companies to delay the adoption of this standard. In April 2005, the SEC took further action to amend Regulation S-X to state that the provisions of SFAS No. 123(R) will be effective beginning with the first annual or interim reporting period of the registrant’s first fiscal year beginning on or after June 15, 2005 for all non-small business issuers. As a result, the Company will not adopt this SFAS until the first quarter of 2006.December 31, 2008 and earlier adoption is prohibited. The Company plans to usecannot predict the modified prospective application method as detailed in SFAS No. 123(R). At this time, management does not believeimpact that the adoption of SFAS No. 123(R) will materially impact the Company’s operating results, nor will there be any impact on future cash flows. See “Stock-Based Compensation” below for further information.
In October 2005, the FASB issued FSP FAS 123(R)-2, “Practical Accommodation to the Application of Grant Date as defined in FASB Statement No. 123(R).” This FSP provides guidance on the definition and practical application of “grant date” as described in SFAS No. 123(R). The grant date is described as the date that the employee and employer have met a mutual understanding of the key terms and conditions of an award. The other elements of the definition of grant date are: 1) the award must be authorized, 2) the employer must be obligated to transfer assets or distribute equity instruments so long as the employee has provided the necessary service and 3) the employee is affected by changes in the company’s stock price. To determine the grant date, the Company is allowed to use the date the award is approved in accordance with its corporate governance requirements so long as the three elements described above are met. Furthermore, the recipient cannot negotiate the award’s terms and conditions with the employer and the key terms and conditions of the award are communicated to all recipients within a reasonably short time period from the approval date. The Company will adopt this FSP in conjunction with the adoption of SFAS No. 123(R).
In November 2005, the FASB issued FSP FAS 123(R)-3 “Transition Election Related to Accounting for the Tax Effects of Share-Based Payment Awards,” which provides a simpler, more practical transition election relating to the calculation of the “APIC pool.” The APIC pool is defined as the pool of excess tax benefits available to absorb tax deficiencies occurring after the adoption of SFAS No. 123(R). Under this FSP, companies can elect to perform simpler computations to derive the beginning balance of the APIC pool as well as the impact on the APIC pool of fully vested and outstanding awards as of the SFAS No. 123(R) adoption date. The beginning balance can be computed by taking the sum of all tax benefits incurred prior to the adoption of SFAS No. 123(R) from stock-based compensation plans less the tax effected (using a blended statutory rate) pro forma stock-based compensation cost. In addition, increases to the APIC pool for fully vested awards can be calculated by multiplying the tax rate times the tax benefit of the deduction. The calculation of any awards that are partially vested or granted after the SFAS No. 123(R) adoption date will not be affected by this FSP and will be calculated in accordance with SFAS No. 123(R)
which requires that only the excess tax benefit or deficiency of the tax deduction over the tax effect of the compensation cost recognized should be considered for the APIC pool. Also under the FSP, all tax benefits recognized on fully vested awards and the excess tax benefits for partially vested and new awards will be reported on the Statement of Cash Flows as a component of financing activities. Companies141(R) will have upon its financial position, results of operations or cash flows with respect to one yearany acquisitions completed after adopting SFAS No. 123(R) to decide to elect and disclose whether they plan to use the alternative method or the original method prescribed in SFAS No. 123(R) for the calculation of the APIC pool. The Company will adopt this FSP in conjunction with the adoption of SFAS No. 123(R).
In February 2006, the FASB issued FSP FAS 123(R)-4, “Classification of Options and Similar Instruments Issued as Employee Compensation That Allow for Cash Settlement upon the Occurrence of a Contingent Event.” Within certain share-based payment plans, a company can be required to settle outstanding options upon the occurrence of certain events, such as a change in control or liquidity of a company or the death or disability of the shareholder. This FSP amends paragraphs 32 and A229 of SFAS No. 123(R) to incorporate a probability assessment by a company. Under SFAS No. 123(R), it is required that options and similar instruments be classified as liabilities if the entity can be required under any circumstances to settle the instrument in cash or other assets. Under the FSP, a cash settlement feature that can be exercised only upon the occurrence of a contingent event that is outside of the employee’s control does not meet the criteria for liability classification, and should remain to be classified in equity, unless it becomes probable that the contingent event will occur. The effective date for the guidance in this FSP is upon the initial adoption of SFAS No. 123(R). The Company will adopt this FSP in conjunction with the adoption of SFAS No. 123(R).December 31, 2008.
Inventories
Inventories are comprised of natural gas and oil in storage, tubular goods and well equipment and pipeline imbalances. All inventory balances are carried at the lower of cost or market. Natural gas and oil in storage is valued at average cost. Tubular goods and well equipment isare valued at historical cost.
Natural gas gathering and pipeline operations normally include imbalance arrangements with the pipeline. The volumes of natural gas due to or from the Company under imbalance arrangements are recorded at actual selling or purchase prices, as the case may be, and are adjusted monthly to reflect market changes. The net value of the natural gas imbalance is included in inventory in the consolidated balance sheet.Consolidated Balance Sheet.
Properties and Equipment
The Company uses the successful efforts method of accounting for oil and gas producing activities. Under this method, acquisition costs for proved and unproved properties are capitalized when incurred. Exploration costs, including geological and geophysical costs, the costs of carrying and retaining unproved properties and exploratory dry hole drilling costs, are expensed. Development costs, including the costs to drill and equip development wells, and successful exploratory drilling costs to locate proved reserves are capitalized.
Index to Financial Statements
Exploratory drilling costs are capitalized when incurred pending the determination of whether a well has found proved reserves. A determination of whether a well has found proved reserves is made shortly after drilling is completed. The determination is based on a process which relies on interpretations of available geologic, geophysic,geophysical, and engineering data. If a well is determined to be successful, the capitalized drilling costs will be reclassified as part of the cost of the well. If a well is determined to be unsuccessful, the capitalized drilling costs will be charged to expense in the period the determination is made. If an exploratory well requires a major capital expenditure before production can begin, the cost of drilling the exploratory well will continue to be carried as an asset pending determination of whether proved reserves have been found only as long as: i) the well has found a sufficient quantity of reserves to justify its completion as a producing well if the required capital expenditure is made and ii) drilling of the additional exploratory wells is under way or firmly planned for the near future. If drilling in the area is not under way or firmly planned, or if the well has not found a commercially producible quantity of reserves, the exploratory well is assumed to be impaired, and its costs are charged to expense. For a discussion of the Company’s suspended wells, see Note 2 of the Notes to the Consolidated Financial Statements.
In the absenceThe Company determines if an impairment has occurred through either adverse changes or as a result of a determination as to whether the reserves that have been found can be classified as proved, the costsreview of drilling such an exploratory well is not carried as an asset for more than one year following completion of drilling. If, after that year has passed, a determination that proved reserves exist cannot be made, the well is assumed
to be impaired, and its costs are charged to expense. Its costs can, however, continue to be capitalized if a sufficient quantity of reserves are discovered in the well to justify its completion as a producing well and sufficient progress is made in assessing the reserves and the well’s economic and operating feasibility.
all fields. The impairment of unamortized capital costs is measured at a lease level and is reduced to fair value if it is determined that the sum of expected future net cash flows is less than the net book value. The Company determines if an impairment has occurred through either adverse changes or as a result of the annual review of all fields. In 2003, the Company recorded impairments related to the loss of a reversionary interest in its Kurten fieldDuring 2008, 2007 and a field in the East region. These impairments totaled $93.8 million. During 2004,2006, the Company recorded total impairments of $3.5 million. During 2005,$31.3 million (excluding the Company did not record any impairments.impairment of $4.4 million of goodwill), $4.6 million and $3.9 million, respectively.
Development costs of proved oil and gas properties, including estimated dismantlement, restoration and abandonment costs and acquisition costs, are depreciated and depleted on a field basis by the units-of-production method using proved developed and proved reserves, respectively. The costs of unproved oil and gas properties are generally combined and impaired over a period that is based on the average holding period for such properties and the Company’s experience of successful drilling. Properties related to gathering and pipeline systems and equipment are depreciated using the straight-line method based on estimated useful lives ranging from 10 to 25 years. Generally pipeline and transmission systems are amortizeddepreciated over 12 to 25 years, gathering and compression equipment is amortizeddepreciated over 10 years and storage equipment and facilities are amortizeddepreciated over 10 to 16 years. Certain other assets are depreciated on a straight-line basis over 3 to 10 years. Buildings are depreciated on a straight-line basis over 25 years.
Costs of retired, sold or abandoned properties that make up a part of an amortization base (partial field) are charged to accumulated depreciation, depletion and amortization if the units-of-production rate is not significantly affected. Accordingly, a gain or loss, if any, is recognized only when a group of proved properties (entire field) that make up the amortization base has been retired, abandoned or sold. See Note 2 of the Notes to the Consolidated Financial Statements for a discussion of the disposition of the Company’s offshore portfolio and certain south Louisiana properties to a third party, which was substantially completed in 2006 (the 2006 south Louisiana and offshore properties sale).
Revenue Recognition and Gas Imbalances
The Company applies the sales method of accounting for natural gas revenue. Under this method, revenues are recognized based on the actual volume of natural gas sold to purchasers. Natural gas production operations may include joint owners who take more or less than the production volumes entitled to them on certain properties. Production volume is monitored to minimize these natural gas imbalances. A natural gas imbalance liability is recorded at the actual price realized upon the gas sale in accounts payable in the consolidated balance sheetConsolidated Balance Sheet if the Company’s excess takes of natural gas exceed its estimated remaining proved developed reserves for these properties. See Note 3 of the Notes to the Consolidated Financial Statements for the Company’s wellhead gas imbalances.
Index to Financial Statements
Brokered Natural Gas Margin
The revenues and expenses related to brokering natural gas are reported gross as part of Operating Revenues and Operating Expenses. The Company realizes brokered margin as a result of buying and selling natural gas in back-to-back transactions.transactions with separate counterparties. The Company realized $13.8 million, $11.4 million $9.2 million, and $9.7$10.3 million of brokered natural gas margin in 2005, 2004,2008, 2007 and 2003,2006, respectively.
Income Taxes
The Company follows the asset and liability method of accounting for income taxes. Under this method, deferred tax assets and liabilities are recorded for the estimated future tax consequences attributable to the differences between the financial carrying amounts of existing assets and liabilities and their respective tax basis. Deferred tax assets and liabilities are measured using the tax rate in effect for the year in which those temporary differences are expected to turn around. The effect of a change in tax rates on deferred tax assets and liabilities is recognized in the year of the enacted rate change. A valuation allowance is established to reduce deferred tax assets if it is more likely than not that the related tax benefits will not be realized.
The Company is required to make judgments, including estimating reserves for potential adverse outcomes regarding tax positions that the Company has taken. The Company accounts for uncertainty in income taxes using a recognition and measurement threshold for tax positions taken or expected to be taken in a tax return. The effective tax rate and the tax basis of assets and liabilities reflect management’s estimates of the ultimate outcome of various tax uncertainties.
Natural Gas Measurement
The Company records estimated amounts for natural gas revenues and natural gas purchase costs based on volumetric calculations under its natural gas sales and purchase contracts. Variances or imbalances resulting from such calculations are inherent in natural gas sales, production, operation, measurement, and administration. Management does not believe that differences between actual and estimated natural gas revenues or purchase costs attributable to the unresolved variances or imbalances are material.
Accounts Payable
This account may include credit balances from outstanding checks in zero balance cash accounts. These credit balances are referred to as book overdrafts, as a component of Accounts Payable on the Balance Sheet. There were no credit balances from outstanding checks in zero balance cash accounts included in accounts payable at December 31, 20052008 and 20042007 as sufficient cash was available for offset.
Allowance for Doubtful Accounts
The Company records an allowance for doubtful accounts for receivables that the Company feels maydetermines to be uncollectible based on the specific identification basis. The allowance for doubtful accounts, which is netted against the accounts receivable line on the Consolidated Balance Sheet, was $5.6$3.5 million and $5.3$4.0 million at December 31, 20052008 and 2004,2007, respectively.
Risk Management Activities
From time to time, the Company enters into derivative contracts, such as natural gas and crude oil price swaps or costlesszero-cost price collars, as a hedging strategy to manage commodity price risk associated with its inventories, production or other contractual commitments. All hedge transactions are subject to the Company’s risk management policy which does not permit speculative trading activities. Gains or losses on these hedging activities are generally recognized over the period that its inventories, production or other underlying commitment is hedged
Index to Financial Statements
as an offset to the specific hedged item. Cash flows related to any recognized gains or losses associated with these hedges are reported as cash flows from operations. If a hedge is terminated prior to expected maturity, gains or losses are deferred and included in income in the same period that the underlying production or other contractual commitment is delivered. Unrealized gains or losses associated with any derivative contract not considered a hedge would beare recognized currently in the results of operations.
When the designated item associated with a derivative instrument matures or is sold, extinguished or terminated, derivative gains or losses are recognized as part of the gain or loss on the sale or settlement of the underlying item. For example, in the case of natural gas price hedges, the gain or loss is reflected in natural gas revenue. When a derivative instrument is associated with an anticipated transaction that is no longer expected to occur or if the hedge is no longer effective, the gain or loss on the derivative is recognized currently in the results of operations to the extent the market value changes in the derivative have not been offset by the effects of the price changes on the hedged item since the inception of the hedge. See Note 1011 of the Notes to the Consolidated Financial Statements for further discussion.
Stock BasedStock-Based Compensation
The Company accounts for stock-based compensation in accordance withfollows the intrinsic value based method prescribed by Accounting Principles Board Opinion No. 25, “Accounting for Stock Issued to Employees.” Under the intrinsic value based method, the Company records no compensation expense for stock options granted when the exercise price for options granted is equal to the fair value of the Company’s common stock on the date of the grant.
SFAS No. 123, “Accounting for Stock-Based Compensation”, as amended by SFAS No. 148, “Accounting for Stock-Based Compensation – Transition and Disclosure”, outlines a fair value based method of accounting for stock options or similar equity instruments.
The following table illustrates the effect on net income and earnings per share if the Company had applied the fair value recognition provisions of SFAS No. 123123(R), “Share Based Payment (revised 2004).” The tax benefit for stock-based compensation is included as both a cash inflow from financing activities and a cash outflow from operating activities in the Consolidated Statement of Cash Flows. In accordance with SFAS No. 123(R), the Company recognizes a tax benefit only to stock-based employee compensation. The Earnings per Share amounts for prior periods have been retroactively adjusted to reflect the 3-for-2 split ofextent it reduces the Company’s common stock effective Marchincome taxes payable. For the years ended December 31, 2005.
| Year Ended December 31, | |||||||||
| (In thousands, except per share amounts) | 2005 | 2004 | 2003 | ||||||
Net Income, as reported | $ | 148,445 | $ | 88,378 | $ | 21,132 | |||
Deduct: Total stock-based employee compensation expense determined under fair value based method for all awards, net of tax, previously not included in Net Income | 967 | 1,571 | 1,950 | ||||||
Pro forma Net Income | $ | 147,478 | $ | 86,807 | $ | 19,182 | |||
Earnings per Share: | |||||||||
Basic - as reported | $ | 3.04 | $ | 1.81 | $ | 0.44 | |||
Basic - pro forma | $ | 3.02 | $ | 1.78 | $ | 0.40 | |||
Diluted - as reported | $ | 2.99 | $ | 1.79 | $ | 0.44 | |||
Diluted - pro forma | $ | 2.97 | $ | 1.76 | $ | 0.40 | |||
Weighted Average Common Shares Outstanding | 48,856 | 48,733 | 48,074 | ||||||
Diluted Common Shares | 49,725 | 49,339 | 48,435 | ||||||
The fair value of stock options included in the pro forma results for each of the three years is not necessarily indicative of future effects on net income2008 and earnings per share. As of January 1, 2006, the Company will adopt SFAS No. 123(R),realized tax benefits of $10.7 million and $9.5 million, respectively. For the year ended December 31, 2007, the Company did not recognize a tax benefit for stock-based compensation as discussed above in the “Recently Issued Accounting Pronouncements” section.
On October 26, 2005, the Compensation Committeea result of the Board of Directorstax net operating loss position for the year under the Alternative Minimum Tax system. See Note 10 of the Company approvedNotes to the acceleration to December 15, 2005 of the vesting of 198,799 unvested stock options awarded in February 2003 under the Company’s Second Amended and Restated 1994 Long-Term Incentive Plan and 24,500 unvested stock options awarded in April 2004 under the Company’s 2004 Incentive Plan.
The 198,799 shares awarded to employees under the 1994 plan at an exercise price of $15.32 would have vested in February 2006. The 24,500 shares awarded to non-employee directors under the 2004 plan at an exercise price of $23.32 would have vested 12,250 shares in April 2006 and April 2007, respectively. The decision to accelerate the vesting of these unvested options, which the Company believed to be in the best interest of its shareholders and employees, was made solely to reduce compensation expense and administrative burden associated with the Company’s adoption of SFAS No. 123(R). The accelerated vesting of the options did not have an impact on the Company’s results of operations or cash flows in 2005. The acceleration of vesting is expected to reduce the Company’s compensation expense related to these options by approximately $0.2 millionConsolidated Financial Statements for 2006.
The assumptions used in the fair value method calculation as well as additional stock based compensation information are disclosed in the following table.details.
| Year Ended December 31, | |||||||||||
| (In thousands, except per share amounts) | 2005 | 2004 | 2003 | ||||||||
Compensation Expense in Net Income, as reported(1) | $ | 5,965 | $ | 4,043 | $ | 1,001 | |||||
Weighted Average Value per Option Granted During the Period (2) (3) | $ | — | $ | 11.31 | $ | 6.77 | |||||
Assumptions (3) | |||||||||||
Stock Price Volatility | — | 38.4 | % | 35.3 | % | ||||||
Risk Free Rate of Return | — | 3.3 | % | 2.5 | % | ||||||
Dividend Rate (per year) | $ | 0.147 | $ | 0.107 | $ | 0.107 | |||||
Expected Term (in years) | 4 | 4 | 4 | ||||||||
Cash and Cash Equivalents
The Company considers all highly liquid short-term investments with original maturities of three months or less to be cash equivalents. At December 31, 2005,2008 and 2004,2007, the cash and cash equivalents are primarily concentrated in two financial institutions. The Company periodically assesses the financial condition of these institutions and believes thatconsiders any possible credit risk to be minimal. Excluded from cash and cash equivalents at December 31, 2007 is minimal.$11.6 million of restricted cash. See Note 7 of the Notes to the Consolidated Financial Statements for further details.
Environmental Matters
Environmental expenditures are expensed or capitalized, as appropriate, depending on their future economic benefit. Expenditures that relate to an existing condition caused by past operations, and that do not have future economic benefit are expensed. Liabilities related to future costs are recorded on an undiscounted basis when environmental assessments and/or remediation activities are probable and the costs can be reasonably estimated. Any insurance recoveries are recorded as assets when received.
Use of Estimates
In preparing financial statements, the Company follows generally accepted accounting principles. These principles require management to make estimates and assumptions that affect the reported amounts of assets and liabilities, the disclosure of contingent assets and liabilities at the date of the financial statements, and the reported amounts of revenues and expenses during the reporting period. The most significant estimates pertain to proved natural gas, natural gas liquids and crude oil reserves and related cash flow estimates used in impairment tests of oil and gas properties, natural gas, natural gas liquids and crude oil revenues and expenses, current values of derivative instruments, as well as estimates of expenses related to legal, environmental and other
Index to Financial Statements
contingencies, depreciation, depletion and amortization, pension and postretirement obligations, stock-based compensation and deferred income taxes. Actual results could differ from those estimates.
2. Properties and Equipment, Net
Properties and equipment, net are comprised of the following:
| December 31, | December 31, | |||||||||||||||
| (In thousands) | 2005 | 2004 | ||||||||||||||
| 2008 | 2007 | |||||||||||||||
| (In thousands) | ||||||||||||||||
Unproved Oil and Gas Properties | $ | 107,787 | $ | 94,795 | $ | 315,782 | $ | 108,868 | ||||||||
Proved Oil and Gas Properties | 1,970,407 | 1,646,841 | 3,813,014 | 2,627,346 | ||||||||||||
Gathering and Pipeline Systems | 178,876 | 160,951 | 274,192 | 235,127 | ||||||||||||
Land, Building and Improvements | 4,892 | 4,860 | ||||||||||||||
Other | 33,077 | 31,261 | ||||||||||||||
Land, Building and Other Equipment | 68,606 | 41,602 | ||||||||||||||
| 2,295,039 | 1,938,708 | 4,471,594 | 3,012,943 | |||||||||||||
Accumulated Depreciation, Depletion and Amortization | (1,056,984 | ) | (944,627 | ) | (1,335,766 | ) | (1,104,826 | ) | ||||||||
| $ | 1,238,055 | $ | 994,081 | $ | 3,135,828 | $ | 1,908,117 | |||||||||
AsThe provisions of January 1, 2005, the Company adopted FSP FAS 19-1, “Accounting for Suspended Well Costs.Costs,” Upon adoptionrequire that, in order for costs to be capitalized, a sufficient quantity of reserves must be discovered in the FSP,well to justify its completion as a producing well and that sufficient progress must be made in assessing the Company evaluated all existing capitalized exploratory wellwell’s economic and operating feasibility. If both of these requirements are not met, the costs under the provisions of the FSP. For further details on the provisions of this FSP, see Note 1 of the Notes to the Consolidated Financial Statements.should be expensed. The following table reflects the net changes in capitalized exploratory well costs during 2005, 20042008, 2007 and 2003.2006.
| December 31, | December 31, | |||||||||||||||||||||||
| (In thousands) | 2005 | 2004 | 2003 | |||||||||||||||||||||
| 2008 | 2007 | 2006 | ||||||||||||||||||||||
| (In thousands) | ||||||||||||||||||||||||
Beginning balance at January 1 | $ | 8,591 | $ | 3,681 | $ | 3,757 | $ | 2,161 | $ | 8,428 | $ | 6,132 | ||||||||||||
Additions to capitalized exploratory well costs pending the determination of proved reserves | 6,132 | 8,591 | 3,681 | 5,990 | 2,161 | 8,317 | ||||||||||||||||||
Reclassifications to wells, facilities, and equipment based on the determination of proved reserves | (1,069 | ) | (3,395 | ) | (2,881 | ) | (1,259 | ) | (8,011 | ) | (5,926 | ) | ||||||||||||
Capitalized exploratory well costs charged to expense | (7,522 | ) | (286 | ) | (876 | ) | (902 | ) | (417 | ) | (95 | ) | ||||||||||||
Ending balance at December 31 | $ | 6,132 | $ | 8,591 | $ | 3,681 | $ | 5,990 | $ | 2,161 | $ | 8,428 | ||||||||||||
At December 31, 2008 and 2007, the Company did not have any projects that had exploratory well costs that were capitalized for a period of greater than one year after drilling. At December 31, 2006, the Company had four projects that had exploratory well costs that were capitalized for a period greater than one year.
The following table provides an aging of capitalized exploratory well costs based on the date the drilling was completed and the number of wells for which exploratory well costs have been capitalized for a period greater than one year since the completion of drilling:
| December 31, | December 31, | |||||||||||||||||
| (In thousands) | 2005 | 2004 | 2003 | |||||||||||||||
| 2008 | 2007 | 2006 | ||||||||||||||||
| (In thousands) | ||||||||||||||||||
Capitalized exploratory well costs that have been capitalized for a period of one year or less | $ | 6,132 | $ | 8,591 | $ | 3,681 | $ | 5,990 | $ | 2,161 | $ | 8,317 | ||||||
Capitalized exploratory well costs that have been capitalized for a period greater than one year | — | — | — | — | — | 111 | ||||||||||||
Balance at December 31 | $ | 6,132 | $ | 8,591 | $ | 3,681 | $ | 5,990 | $ | 2,161 | $ | 8,428 | ||||||
Number of projects that have exploratory well costs that have been capitalized for a period greater than one year | — | — | — | — | — | 4 | ||||||||||||
Index to Financial Statements
At December 31, 2005 and 2003,2006, the Company had notwo wells that had completedwhere the drilling andwas complete, but a determination of whether proved reserves existed could not be made.
At December 31, 2004, the Company had 3 Costs associated with these wells that hadhave been capitalized for less than one year. One well, located in Canada, completed drilling and a determinationin September 2006. Subsequent well completion attempts were halted until mid-November 2006, waiting for acceptable weather conditions. The well was completed in the first quarter of whether proved reserves existed could not be made. One2007. The second well wasis in the Rocky Mountains area and reached total depth in November 2004. It could not be completed2006. Completion attempts were postponed due to the Bureau of Land Management stipulation which prohibited activity until the summer of 2007. Subsequent completion attempts proved unsuccessful and the costs were expensed in the second quarter of 2007.
Included in the December 31, 2006 amount of exploratory well costs that have been capitalized for a period greater than one year are $0.1 million of costs that have been capitalized since 2005. Two wellsThis amount relates to three projects comprised of preliminary costs incurred in Canadathe preparation of well sites where drilling has not commenced as of December 31, 2006. In 2007, it was determined not to drill these projects and associated costs were expensed. Also included in the December 31, 2006 amount was another well that had completed drilling in OctoberJanuary 2007 and December 2004. These wells werewas awaiting completion or sidetracking whichresults before confirmation of proved reserves could be made. That well was anticipatedcompleted in 2007 and proved reserves were recorded in the first quarter of 2007.
During 2008, the Company recorded $31.3 million of impairments of oil and gas properties. The Company recorded an impairment of approximately $3.0 million in the Corral Creek field in Washakie County, Wyoming in the West region resulting from lower than expected performance from the two well field and $28.3 million in the Trawick field in Rusk County, Texas in the Gulf Coast region resulting from a decline in natural gas prices and higher well costs. These fields were reduced to commence by May 2005. Additional operations were performed on each of these wells,fair market value (using discounted future cash flows) and all were determined to be unsuccessful. In 2005, $8.0 million was charged to expense for these wells, which was made up of $3.1 millionremain as developmental opportunities for the Rocky Mountains area well and $4.9 million for the two wells in Canada.
Company. During 2005, the Company did not record any impairments. During 2004,2007, the Company recorded an impairment of $3.5approximately $4.6 million in the Castor field in Bienville Parish, Louisiana in the Gulf Coast region resulting from two non-commercial development completions. During 2006, the Company recorded an impairment of $3.9 million. The impairment was recorded on a two-well fieldmarginally productive gas well in south Louisiana and was due to production performance issues related to water encroachment. ThisColorado County, Texas in the Gulf Coast region. These impairment charge was recorded due to the capitalized cost of the field exceeding the future undiscounted cash flows. This charge ischarges were reflected in the operating results of the Company for each respective period
During 2008, 2007 and was measured based on discounted cash flows utilizing a discount rate appropriate for risks associated with2006, the Company recorded impairments of unproved properties of $41.5 million, $19.0 million and $11.1 million, respectively. Included in 2008 impairments were $17.0 million related field.
As partto the impairment of the 2001 Cody acquisition, we acquired an interest in certainthree exploratory oil and gas propertiesprospects located in Mississippi, Montana and North Dakota. These prospects were impaired as a result of the significant decline in commodity prices in the Kurten field, as general partnerfourth quarter of 2008 and abandonment of the Company’s exploration plans.
In April 2008, the Company acquired a small oilfield services business for total consideration of $21.6 million, comprised of the conversion of a partnership$15.6 million note receivable, the issuance of 70,168 shares of Company common stock, and the payment of $2.5 million in cash. The transaction was accounted for as an operator. We had approximately a 25% interest in the field, including a one percent interest in the partnership. Under the partnership agreement, we had the right to a reversionary working interest that would bring our ultimate interest to 50% upon the limited partner reaching payout. Based on the addition of this reversionary interest,business combination, and because the field has over a 40-year reserve life, approximately $91 million was allocated to this field under purchase accounting at the time of the acquisition. Additionally, the limited partner had the sole option to trigger a liquidation of the partnership.
Effective February 13, 2003, liquidation of the partnership commenced at the election of the limited partner. In connection with the liquidation, an appraisal was required to be obtained to allocate the interest in the partnership assets. Additionally, the Company was required to testrecorded approximately $4.4 million of goodwill. In December 2008, the field for recoverability in accordance with SFAS No. 144. Pursuant toCompany fully impaired the terms of the partnership agreement and based on the appraised value of the partnership assets it was not possible for us to obtain the reversionary interest as part of the liquidation. Duegoodwill due to the impact of the lossbroad economic downturn and the related reductions in future drilling programs.
East Texas Property Acquisition
On August 15, 2008, the Company completed the acquisition of certain producing oil and gas properties located in Panola and Rusk counties, Texas in order to expand its position in the Minden field. Total net cash consideration paid by the Company in the transaction was approximately $604.0 million, which reflects the total gross purchase price of $604.4 million adjusted by $0.4 million comprised of a $1.8 million decrease for the impact of purchase price adjustments, including adjustments based on each party’s share of production proceeds received, expenses paid and capital costs incurred for periods before and after the effective date of the reversionaryacquisition of May 1, 2008, and a $1.4 million increase for the impact of transaction costs, which were primarily legal and accounting costs.
Index to Financial Statements
The $604.0 million purchase price was allocated to Properties and Equipment and Other Liabilities (for the asset retirement obligation) as follows:
| (In thousands) | ||||
Proved Oil and Gas Properties(1) | $ | 528,813 | ||
Unproved Oil and Gas Properties | 52,897 | |||
Gathering and Pipeline Systems | 22,814 | |||
Total Assets Acquired | 604,524 | |||
Less: | ||||
Asset Retirement Obligations | (488 | ) | ||
| $ | 604,036 | |||
(1) | Proved oil and gas properties were determined based on estimated reserves. |
The acquired properties are comprised of approximately 25,000 gross leasehold acres with a 97% average working interest on future estimated net cash flowsnear the Company’s existing Minden field. Most of the Kurten field,producing properties were operated by the limited partner’s decisionsellers. In addition, the acquisition included a natural gas gathering infrastructure of 31 miles of pipeline, 5,400 horsepower of compression and our decisionfour water disposal wells. The Company estimates that proved reserves included in the acquisition were approximately 182 Bcfe as of August 1, 2008 (allocated mainly to proceedthe Cotton Valley formation).
The east Texas acquisition was recorded using the purchase method of accounting. Financial results for the period from the closing date on August 15, 2008 to December 31, 2008 are included within the Company’s 2008 Consolidated Statement of Operations. The following table presents the unaudited pro forma results of operations for the years ended December 31, 2008 and 2007, as if the acquisition was made at the beginning of each period. These pro forma results are not necessarily indicative of future results, nor do they purport to represent the actual financial results that would have occurred had the acquisition been in effect for the periods presented.
| Year Ended December 31, | ||||||
| 2008 | 2007 | |||||
| (Unaudited) | (Unaudited) | |||||
| (In thousands, except per share amounts) | ||||||
Revenues | $ | 1,009,412 | $ | 746,089 | ||
Net Income | $ | 218,290 | $ | 135,992 | ||
Earnings Per Share: | ||||||
Basic | $ | 2.12 | $ | 1.33 | ||
Diluted | $ | 2.10 | $ | 1.32 | ||
Weighted-Average Common Shares Outstanding: | ||||||
Basic | 103,142 | 101,981 | ||||
Diluted | 104,131 | 103,133 | ||||
The Company funded the acquisition with a combination of the net proceeds from its June 2008 sale of approximately five million shares of common stock (see Note 9 of the Notes to the Consolidated Financial Statements) and the net proceeds from its July 2008 private placement of senior unsecured fixed rate notes (see Note 4 of the Notes to the Consolidated Financial Statements). Additionally, in order to mitigate the exposure to price fluctuations of natural gas and crude oil, the Company entered into 12 contracts for natural gas price swaps and three contracts for crude oil swaps in the second quarter of 2008 covering production associated with the liquidation, an impairment review was performed which required an impairment chargeacquired properties for the second half of 2008 through 2010 (see Note 11 of the Notes to the Consolidated Financial Statements).
Index to Financial Statements
Disposition of Assets
On September 29, 2006, the Company substantially completed the 2006 south Louisiana and offshore properties sale to Phoenix Exploration Company LP for a gross sales price of $340.0 million. The Company received approximately $333.3 million in 2003net proceeds from the sale. In addition to the net gain of $87.9$231.2 million ($54.4144.5 million, after-tax). This impairment charge is reflectednet of tax) recorded for the year ended December 31, 2006, the Company recorded a net gain of $12.3 million ($7.7 million, net of tax) in the 2003Consolidated Statement of Operations as an operating expense but did not impact ourfor the year ended December 31, 2007, which included cash flows.
During 2003 the Company divestedproceeds of $5.8 million, $2.1 million in purchase price adjustments and $4.4 million that had been deferred until legal title to certain non-strategic assets. The primary assets sold included properties in Pennsylvania that were sold for $16.1 million, and resulted in a gain of $6.9 million. Additionally, the Company divested of a water treatment facility in the amount of $3.4 million, which resulted in a gain of $2.5 million.could be assigned.
3. ADDITIONAL BALANCE SHEET INFORMATIONAdditional Balance Sheet Information
Certain balance sheet amounts are comprised of the following:
| December 31, | December 31, | |||||||||||||||
| (In thousands) | 2005 | 2004 | ||||||||||||||
Accounts Receivable | ||||||||||||||||
| 2008 | 2007 | |||||||||||||||
| (In thousands) | ||||||||||||||||
ACCOUNTS RECEIVABLE, NET | ||||||||||||||||
Trade Accounts | $ | 147,016 | $ | 105,378 | $ | 94,164 | $ | 94,550 | ||||||||
Joint Interest Accounts | 14,319 | 13,554 | 16,454 | 16,443 | ||||||||||||
Current Income Tax Receivable | 12,239 | 10,796 | ||||||||||||||
Other Accounts | 315 | 1,312 | 1,987 | 2,291 | ||||||||||||
| 173,889 | 131,040 | 112,605 | 113,284 | |||||||||||||
Allowance for Doubtful Accounts | (5,641 | ) | (5,286 | ) | (3,518 | ) | (3,978 | ) | ||||||||
| $ | 168,248 | $ | 125,754 | $ | 109,087 | $ | 109,306 | |||||||||
Inventories | ||||||||||||||||
Natural Gas and Oil in Storage | $ | 18,279 | $ | 17,631 | ||||||||||||
INVENTORIES | ||||||||||||||||
Natural Gas in Storage | $ | 27,478 | $ | 20,472 | ||||||||||||
Tubular Goods and Well Equipment | 7,161 | 6,387 | 16,439 | 5,953 | ||||||||||||
Pipeline Imbalances | (824 | ) | 31 | 1,760 | 928 | |||||||||||
| $ | 24,616 | $ | 24,049 | $ | 45,677 | $ | 27,353 | |||||||||
Other Current Assets | ||||||||||||||||
Derivative Contracts | $ | 1,736 | $ | 2,906 | ||||||||||||
OTHER CURRENT ASSETS | ||||||||||||||||
Drilling Advances | 2,169 | 6,180 | $ | 4,869 | $ | 2,475 | ||||||||||
Prepaid Balances | 6,939 | 4,173 | 7,631 | 8,900 | ||||||||||||
Restricted Cash | — | 11,600 | ||||||||||||||
Other Accounts | 304 | 246 | — | 338 | ||||||||||||
| $ | 11,148 | $ | 13,505 | $ | 12,500 | $ | 23,313 | |||||||||
Accounts Payable | ||||||||||||||||
OTHER ASSETS | ||||||||||||||||
Note Receivable | $ | — | $ | 13,375 | ||||||||||||
Rabbi Trust Deferred Compensation Plan | 8,651 | 9,744 | ||||||||||||||
Other Accounts | 6,092 | 8,098 | ||||||||||||||
| $ | 14,743 | $ | 31,217 | |||||||||||||
ACCOUNTS PAYABLE | ||||||||||||||||
Trade Accounts | $ | 18,227 | $ | 12,808 | $ | 44,088 | $ | 27,678 | ||||||||
Natural Gas Purchases | 12,208 | 8,669 | 5,346 | 6,465 | ||||||||||||
Royalty and Other Owners | 49,312 | 35,369 | 42,349 | 37,023 | ||||||||||||
Capital Costs | 37,489 | 26,203 | 117,029 | 83,754 | ||||||||||||
Taxes Other Than Income | 10,329 | 5,634 | 5,617 | 6,416 | ||||||||||||
Drilling Advances | 5,760 | 7,102 | 1,289 | 1,528 | ||||||||||||
Wellhead Gas Imbalances | 2,175 | 1,991 | 3,354 | 3,227 | ||||||||||||
Other Accounts | 4,506 | 7,193 | 3,913 | 7,406 | ||||||||||||
| $ | 140,006 | $ | 104,969 | $ | 222,985 | $ | 173,497 | |||||||||
Accrued Liabilities | ||||||||||||||||
Employee Benefits | $ | 9,020 | $ | 10,123 | ||||||||||||
Taxes Other Than Income | 16,188 | 14,191 | ||||||||||||||
Interest Payable | 6,818 | 6,569 | ||||||||||||||
Other Accounts | 3,133 | 1,725 | ||||||||||||||
| $ | 35,159 | $ | 32,608 | |||||||||||||
Other Liabilities | ||||||||||||||||
Postretirement Benefits Other Than Pension | $ | 6,517 | $ | 4,717 | ||||||||||||
Accrued Pension Cost | 5,904 | 5,089 | ||||||||||||||
Rabbi Trust Deferred Compensation Plan | 4,883 | 4,199 | ||||||||||||||
Accrued Plugging and Abandonment Liability | 42,991 | 40,375 | ||||||||||||||
Other Accounts | 6,899 | 6,649 | ||||||||||||||
| $ | 67,194 | $ | 61,029 | |||||||||||||
Index to Financial Statements
| December 31, | ||||||
| 2008 | 2007 | |||||
| (In thousands) | ||||||
ACCRUED LIABILITIES | ||||||
Employee Benefits | $ | 10,807 | $ | 13,699 | ||
Current Liability for Pension Benefits | 245 | 116 | ||||
Current Liability for Postretirement Benefits | 642 | 642 | ||||
Taxes Other Than Income | 16,582 | 13,216 | ||||
Interest Payable | 20,684 | 6,518 | ||||
Litigation | — | 11,600 | ||||
Other Accounts | 1,591 | 2,274 | ||||
| $ | 50,551 | $ | 48,065 | |||
OTHER LIABILITIES | ||||||
Rabbi Trust Deferred Compensation Plan | $ | 14,531 | $ | 16,018 | ||
Accrued Plugging and Abandonment Liability | 27,978 | 24,724 | ||||
Other Accounts | 4,717 | 6,612 | ||||
| $ | 47,226 | $ | 47,354 | |||
4. Debt and Credit Agreements
The Company’s debt consisted of the following:
| December 31, 2008 | December 31, 2007 | |||||||
| (In thousands) | ||||||||
Long-Term Debt | ||||||||
7.19% Notes | $ | 20,000 | $ | 40,000 | ||||
7.33% Weighted-Average Fixed Rate Notes | 170,000 | 170,000 | ||||||
6.51% Weighted-Average Fixed Rate Notes | 425,000 | — | ||||||
9.78% Notes | 67,000 | — | ||||||
Credit Facility | 185,000 | 140,000 | ||||||
Current Maturities | ||||||||
7.19% Notes | (20,000 | ) | (20,000 | ) | ||||
Credit Facility | (15,857 | ) | — | |||||
Long-Term Debt, excluding Current Maturities | $ | 831,143 | $ | 330,000 | ||||
7.19% Notes
In November 1997, the Company issued an aggregate principal amount of $100 million of its 12-year 7.19% Notes (7.19% Notes) to a group of six institutional investors in a private placement offering.placement. The 7.19% Notes require five annual $20 million principal payments startingwhich started in November 2005 and the Company made its first $20 million payment during 2005.are concluding in November 2009. The Company may prepay all or any portion of the indebtedness on any date with a prepayment penalty. The 7.19% Notes contain restrictions on the merger of the Company or any subsidiary with a third party other than under certain limited conditions. There are also various other restrictive covenants customarily found in such debt instruments. These covenants include a required asset coverage ratio (present value of proved reserves to debt and other liabilities) that must be at least 1.5 to 1.0, and a minimum annual coverage ratio of operating cash flow to interest expense for the trailing four quarters of 2.8 to 1.0.
Index to Financial Statements
7.33% Weighted AverageWeighted-Average Fixed Rate Notes
To partially fund the cash portion of the acquisition of Cody Company in AugustIn July 2001, the Company issued $170 million of Notes to a group of seven institutional investors in a private placement transaction in July 2001.placement. Prior to the determination of the Note’sNotes’ interest rates, the Company entered into a treasury lock in order to reduce the risk of rising interest rates. Interest rates rose during the pricing period, resulting in a $0.7 million gain that is being amortized over the life of the Notes, and thereby reducing the effective interest rate by 5.5 basis points. All of theThe Notes have bullet maturities and were issued in three separate tranches as follows:
| Principal | Term | Maturity Date | Coupon | Principal | Term | Maturity Date | Coupon | |||||||||||||
Tranche 1 | $ | 75,000,000 | 10-year | July 2011 | 7.26 | % | $ | 75,000,000 | 10-year | July 2011 | 7.26 | % | ||||||||
Tranche 2 | $ | 75,000,000 | 12-year | July 2013 | 7.36 | % | $ | 75,000,000 | 12-year | July 2013 | 7.36 | % | ||||||||
Tranche 3 | $ | 20,000,000 | 15-year | July 2016 | 7.46 | % | $ | 20,000,000 | 15-year | July 2016 | 7.46 | % | ||||||||
The Notes7.33% weighted-average fixed rate notes were issued under the same Note Purchase Agreementa substantially similar note purchase agreement as the 7.19% notes and contain the same covenants as discussed above for the 7.19% notes.
6.51% Weighted-Average Fixed Rate Notes
In July 2008, the Company issued $425 million of senior unsecured fixed-rate notes to a group of 41 institutional investors in a private placement. The Notes have bullet maturities and were issued in three separate tranches as follows:
| Principal | Term | Maturity Date | Coupon | |||||||
Tranche 1 | $ | 245,000,000 | 10-year | July 2018 | 6.44 | % | ||||
Tranche 2 | $ | 100,000,000 | 12-year | July 2020 | 6.54 | % | ||||
Tranche 3 | $ | 80,000,000 | 15-year | July 2023 | 6.69 | % | ||||
Interest on each series of the 6.51% weighted-average fixed rate notes is payable semi-annually. The Company may prepay all or any portion of the Notes of each series on any date at a price equal to the principal amount thereof plus accrued and unpaid interest plus a make-whole premium. The Notes contain restrictions on the merger of the Company with a third party other than under certain limited conditions. There are also various other restrictive covenants customarily found in such debt instruments. These covenants include a required asset coverage ratio (present value of proved reserves plus adjusted cash (as defined in the note purchase agreement) to debt and other liabilities), of at least 1.5 to 1.0, and a minimum annual coverage ratio of operating cash flow to interest expense for the trailing four quarters of 2.8 to 1.0. The Notes also are subject to customary events of default. The Company is required to offer to prepay the Notes upon specified change in control events accompanied by a ratings decline below investment grade.
9.78% Notes
In December 2008, the Company issued $67 million aggregate principal amount of its 10-year 9.78% Series G Senior Notes to a group of four institutional investors in a private placement. Interest on the Notes is payable semi-annually. The Company may prepay all or any portion of the Notes on any date at a price equal to the principal amount thereof plus accrued and unpaid interest plus a make-whole premium. The other terms of the Notes are substantially similar to the terms of the 6.51% Weighted-Average Fixed Rate Notes.
Revolving Credit Agreement
On December 10, 2004,16, 2008, the Company amended its Revolving Credit Agreement (credit facility) with a group of nine banks.six banks (Class A lenders). Under the amendment, the commitment period for Class A lenders holding approximately 90% of the aggregate commitments of all lenders was extended from December 2009 to October
Index to Financial Statements
2010. The outstanding balance under the credit facility allows for the one lender that is not a Class A lender is reflected in the current portion of long-term debt on the balance sheet. In June 2008, the Company amended the credit facility to increase the borrowings ofcapacity from $250 million of which $90 million was outstanding at December 31, 2005. The facility can be expanded up to $350 million either withunder the existing accordion feature. At December 31, 2008 and 2007, borrowings outstanding under the credit facility were $185 million and $140 million, respectively. The December 2008 amendment added an accordion feature to allow the Company, if the existing banks or new banks. Thisbanks agree, to increase the available credit line from $350 million to $450 million.
The credit facility is unsecured. The term of the credit facility expires in December 2009. The available credit line is subject to adjustment from time to time on the basis of the projected present value (as determined by the banks’ petroleum engineer) of estimated future net cash flows from certain proved oil and gas reserves and other assets of the Company. While the Company does not expect a reduction in the available credit line, in the event that it is adjusted below the outstanding level of borrowings, the Company has a period of six months either to reduce its outstanding debt to the adjusted credit line available with a requirement to provide additional borrowing base assets or to pay down one-sixth of the excess during each of the six months.
Interest rates under the credit facility are based on Euro-Dollars (LIBOR) or Base Rate (Prime) indications, plus a margin. These associated margins increase if the total indebtedness is greater than 50% or greater,, greater than 75% or greater than 90% of the Company’s debt limit of $530 million, which can be expanded up to $630 million,$1.2 billion, as shown below.below for Class A lenders holding approximately 90% of the aggregate commitments of all lenders:
| Debt Percentage | Debt Percentage | |||||||||||||||||||||||
| Lower than 50% | 50% or higher but not exceeding 75% | Higher than 75% but not exceeding 90% | Higher than 90% | Less than or equal to 50% | Greater than 50% and less than or equal to 75% | Greater than 75% and less than or equal to 90% | Greater than 90% | |||||||||||||||||
Euro-Dollar margin | 1.000 | % | 1.250 | % | 1.500 | % | 1.750 | % | 1.750 | % | 2.000 | % | 2.250 | % | 2.500 | % | ||||||||
Base Rate margin | 0.000 | % | 0.000 | % | 0.250 | % | 0.500 | % | 0.500 | % | 0.750 | % | 1.000 | % | 1.250 | % | ||||||||
Commitment Fee Rate | 0.375 | % | 0.375 | % | 0.500 | % | 0.500 | % | ||||||||||||||||
The Company’s effective interest rates for the credit facility in the years ended December 31, 2005, 2004, and 2003 were 6.9%, 4.2% and 1.9%, respectively. As of December 31, 2005, the weighted average interest rate on the Company’s credit facility was 7.25%. As of December 31, 2004, the Company had no borrowings outstanding on its credit facility. The credit facility provides for a commitment fee on the unused available balance at an annual rates as shown above.
The Company’s weighted-average effective interest rates for the credit facility during the years ended December 31, 2008, 2007 and 2006 were approximately 4.8%, 7.2% and 7.9%, respectively. As of December 31, 2008, the weighted-average interest rate of one-quarter of 1%on the Company’s credit facility was approximately 3.7%.
The credit facility also contains various customary restrictions, which include the following:
| (a) | Maintenance of a minimum annual coverage ratio of operating cash flow to interest expense for the trailing four quarters of 2.8 to 1.0. |
| (b) | Prohibition on the merger or sale of all, or substantially all, of the Company’s or any subsidiary’s assets to a third party, except under certain limited conditions. |
In addition, the credit facility includes a customary condition to the Company’s borrowings under the facility that there has not occurred a material adverse change with respect to the Company.
The Company believes it was in compliance in all material respects with allits covenants contained in its various debt agreements at December 31, 20052008 and 20042007 and during the years then ended.
Index to Financial Statements
5. Employee Benefit Plans
Pension Plan
The Company has aan underfunded non-contributory, defined benefit pension plan for all full-time employees. Plan benefits are based primarily on years of service and salary level near retirement. Plan assets are mainly equity securities and fixed income investments and equity securities.investments. The Company complies with the Employee Retirement Income Security Act (ERISA) of 1974 and Internal Revenue Code limitations when funding the plan. The measurement date used to measure pension benefit amounts is December 31, 2005.
The Company has aan unfunded non-qualified equalization plan to ensure payments to certain executive officers of amounts to which they are already entitled under the provisions of the pension plan, but which are subject to limitations imposed by federal tax laws. This plan is unfunded.
Components of Net Periodic Benefit Cost
Net periodic pension cost of the Company during the last three years is comprised of the following:
| (In thousands) | 2005 | 2004 | 2003 | |||||||||
Qualified | ||||||||||||
Current Year Service Cost | $ | 2,485 | $ | 1,619 | $ | 1,481 | ||||||
Interest Cost | 1,896 | 1,697 | 1,515 | |||||||||
Expected Return on Plan Assets | (1,507 | ) | (1,474 | ) | (999 | ) | ||||||
Amortization of Prior Service Cost | 99 | 88 | 88 | |||||||||
Recognized Net Actuarial Loss | 921 | 383 | 415 | |||||||||
Net Periodic Pension Cost | $ | 3,894 | $ | 2,313 | $ | 2,500 | ||||||
| (In thousands) | 2005 | 2004 | 2003 | |||||||||
Non-Qualified | ||||||||||||
Current Year Service Cost | $ | (682 | ) | $ | 395 | $ | 280 | |||||
Interest Cost | 85 | 381 | 163 | |||||||||
Amortization of Prior Service Cost | 77 | 77 | 77 | |||||||||
Recognized Net Actuarial (Gain) / Loss | (22 | ) | 428 | 187 | ||||||||
Net Periodic Pension (Income) / Cost | $ | (542 | ) | $ | 1,281 | $ | 707 | |||||
Obligations and Funded Status
The following table illustratesfunded status represents the funded statusdifference between the projected benefit obligation of the Company’s qualified and non-qualified pension plans and the fair value of the qualified pension plan’s assets at December 31:31.
| 2005 | 2004 | |||||||||||||||
| (In thousands) | Qualified | Non-Qualified | Qualified | Non-Qualified | ||||||||||||
Actuarial Present Value of: | ||||||||||||||||
Accumulated Benefit Obligation | $ | 29,669 | $ | 1,204 | $ | 23,181 | $ | 3,579 | ||||||||
Projected Benefit Obligation | $ | 39,449 | $ | 1,762 | $ | 29,809 | $ | 6,257 | ||||||||
Fair Value of Plan Assets | 23,765 | — | 18,092 | — | ||||||||||||
Projected Benefit Obligation in Excess of Plan Assets | 15,684 | 1,762 | 11,717 | 6,257 | ||||||||||||
Unrecognized Net Actuarial Loss | (14,899 | ) | (498 | ) | (9,846 | ) | (4,374 | ) | ||||||||
Unrecognized Prior Service Cost | (269 | ) | (245 | ) | (248 | ) | (322 | ) | ||||||||
Adjustment to Recognize Minimum Liability | 5,388 | 185 | 3,466 | 2,018 | ||||||||||||
Accrued Pension Cost | $ | 5,904 | $ | 1,204 | $ | 5,089 | $ | 3,579 | ||||||||
The change in the combined projected benefit obligation of the Company’s qualified and non-qualified pension plans duringand the last three years is explained as follows:
| (In thousands) | 2005 | 2004 | 2003 | |||||||||
Beginning of Year | $ | 36,066 | $ | 33,547 | $ | 26,042 | ||||||
Service Cost | 1,803 | 2,014 | 1,761 | |||||||||
Interest Cost | 1,981 | 2,078 | 1,678 | |||||||||
Actuarial Loss | 1,852 | 1,798 | 4,679 | |||||||||
Plan Amendments | 120 | — | — | |||||||||
Benefits Paid | (611 | ) | (3,371 | ) | (613 | ) | ||||||
End of Year | $ | 41,211 | $ | 36,066 | $ | 33,547 | ||||||
The change in the Company’s qualified plan assets at fair value of the Company’s pension plan during the last three years is explainedare as follows:
| (In thousands) | 2005 | 2004 | 2003 | |||||||||
Beginning of Year | $ | 18,092 | $ | 18,683 | $ | 10,279 | ||||||
Actual Return on Plan Assets | 1,544 | 957 | 2,446 | |||||||||
Employer Contribution | 5,000 | 2,000 | 6,735 | |||||||||
Benefits Paid | (611 | ) | (3,371 | ) | (613 | ) | ||||||
Expenses Paid | (260 | ) | (177 | ) | (164 | ) | ||||||
End of Year | $ | 23,765 | $ | 18,092 | $ | 18,683 | ||||||
| 2008 | 2007 | 2006 | ||||||||||
| (In thousands) | ||||||||||||
Change in Benefit Obligation | ||||||||||||
Benefit Obligation at Beginning of Year | $ | 51,603 | $ | 45,475 | $ | 41,211 | ||||||
Service Cost | 3,313 | 2,931 | 2,720 | |||||||||
Interest Cost | 3,272 | 2,769 | 2,333 | |||||||||
Actuarial Loss | 5,683 | 1,314 | 5 | |||||||||
Plan Amendments | — | — | (3 | ) | ||||||||
Benefits Paid | (863 | ) | (886 | ) | (791 | ) | ||||||
Benefit Obligation at End of Year | 63,008 | 51,603 | 45,475 | |||||||||
Change in Plan Assets | ||||||||||||
Fair Value of Plan Assets at Beginning of Year | 44,744 | 38,189 | 23,765 | |||||||||
Actual Return on Plan Assets | (13,682 | ) | 3,179 | 3,587 | ||||||||
Employer Contributions | 5,000 | 5,000 | 12,008 | |||||||||
Benefits Paid | (863 | ) | (886 | ) | (791 | ) | ||||||
Expenses Paid | (904 | ) | (738 | ) | (380 | ) | ||||||
Fair Value of Plan Assets at End of Year | 34,295 | 44,744 | 38,189 | |||||||||
Funded Status at End of Year | $ | (28,713 | ) | $ | (6,859 | ) | $ | (7,286 | ) | |||
Amounts Recognized in the Balance Sheet
The reconciliationAmounts recognized in the balance sheet at December 31 consist of the combined funded statusfollowing:
| 2008 | 2007 | 2006 | ||||||||||
| (In thousands) | ||||||||||||
Current Liabilities | $ | (245 | ) | $ | (116 | ) | $ | (67 | ) | |||
Long-Term Liabilities | (28,468 | ) | (6,743 | ) | (7,219 | ) | ||||||
| $ | (28,713 | ) | $ | (6,859 | ) | $ | (7,286 | ) | ||||
Index to Financial Statements
Amounts Recognized in Accumulated Other Comprehensive Income
Amounts recognized in accumulated other comprehensive income at December 31 consist of the Company’s qualified and non-qualified pension plans at the end of the last three years is explained as follows:following:
| (In thousands) | 2005 | 2004 | 2003 | |||||||||
Funded Status(1) | $ | 17,446 | $ | 17,974 | $ | 14,864 | ||||||
Unrecognized Net Actuarial Loss | (15,397 | ) | (14,220 | ) | (12,540 | ) | ||||||
Unrecognized Net Prior Service Cost | (514 | ) | (570 | ) | (735 | ) | ||||||
Net Amount Recognized | $ | 1,535 | $ | 3,184 | $ | 1,589 | ||||||
Accrued Benefit Liability - Qualified Plan | $ | 5,904 | $ | 5,089 | $ | 2,664 | ||||||
Accrued Benefit Liability - Non-Qualified Plan | 1,204 | 3,579 | 3,171 | |||||||||
Intangible Asset | (454 | ) | (570 | ) | (735 | ) | ||||||
Accumulated Other Comprehensive Income | (5,119 | ) | (4,914 | ) | (3,511 | ) | ||||||
Net Amount Recognized | $ | 1,535 | $ | 3,184 | $ | 1,589 | ||||||
| 2008 | 2007 | 2006 | |||||||
| (In thousands) | |||||||||
Prior Service Cost | $ | 143 | $ | 194 | $ | 336 | |||
Net Actuarial Loss | 36,373 | 13,744 | 12,946 | ||||||
| $ | 36,516 | $ | 13,938 | $ | 13,282 | ||||
Additional Information for Pension Plans with an Accumulated Benefit Obligation in Excess of Plan Assets
The amounts included
| 2008 | 2007 | 2006 | |||||||
| (In thousands) | |||||||||
Projected Benefit Obligation | $ | 63,008 | $ | 51,603 | $ | 45,475 | |||
Accumulated Benefit Obligation | $ | 48,050 | $ | 39,544 | $ | 34,824 | |||
Fair Value of Plan Assets | $ | 34,295 | $ | 44,744 | $ | 38,189 | |||
Components of Net Periodic Benefit Cost and Other Amounts Recognized in Other Comprehensive Income as a result of increases in the minimum liability of the Company’s pension plans are as follows as of December 31:
Combined Qualified and Non-Qualified Pension Plans
| (In thousands) | 2005 | 2004 | 2003 | |||||||||
Qualified Plan | $ | 1,900 | $ | 2,199 | $ | (870 | ) | |||||
Non-Qualified Plan | (1,695 | ) | (795 | ) | 2,203 | |||||||
| 2008 | 2007 | 2006 | ||||||||||
| (In thousands) | ||||||||||||
Components of Net Periodic Benefit Cost | ||||||||||||
Current Year Service Cost | $ | 3,313 | $ | 2,931 | $ | 2,721 | ||||||
Interest Cost | 3,272 | 2,769 | 2,333 | |||||||||
Expected Return on Plan Assets | (3,535 | ) | (3,015 | ) | (1,962 | ) | ||||||
Amortization of Prior Service Cost | 51 | 142 | 175 | |||||||||
Amortization of Net Loss | 1,175 | 1,089 | 1,210 | |||||||||
Net Periodic Pension Cost | $ | 4,276 | $ | 3,916 | $ | 4,477 | ||||||
Other Changes in Qualified Plan Assets and Benefit Obligations Recognized in Other Comprehensive Income | ||||||||||||
Net Loss | $ | 23,804 | $ | 1,887 | N/A | |||||||
Amortization of Net Loss | (1,175 | ) | (1,089 | ) | N/A | |||||||
Amortization of Prior Service Cost | (51 | ) | (142 | ) | N/A | |||||||
Total Recognized in Other Comprehensive Income | 22,578 | 656 | N/A | |||||||||
Total Recognized in Net Periodic Benefit Cost and Other Comprehensive Income | $ | 26,854 | $ | 4,572 | N/A | |||||||
The estimated prior service cost and net loss for the qualified defined benefit pension plan that will be amortized from accumulated other comprehensive income into net periodic benefit cost over the next fiscal year are less than $0.1 million and $2.7 million, respectively.
The estimated prior service cost and net loss for the defined benefit non-qualified pension plan that will be amortized from accumulated other comprehensive income into net periodic benefit cost over the next fiscal year are less than $0.1 million and $0.1 million, respectively.
Index to Financial Statements
Assumptions
AssumptionsWeighted-average assumptions used to determine projected pension benefit obligations areat December 31 were as follows:
| 2005 | 2004 | 2003 | 2008 | 2007 | 2006 | |||||||||||||
Discount Rate | 5.50 | % | 5.75 | % | 6.25 | % | 5.75 | % | 6.00 | % | 5.75 | % | ||||||
Rate of Compensation Increase | 4.00 | % | 4.00 | % | 4.00 | % | 4.00 | % | 4.00 | % | 4.00 | % | ||||||
AssumptionsWeighted-average assumptions used to determine net periodic pension costs at December 31 are as follows:
| 2005 | 2004 | 2003 | 2008 | 2007 | 2006 | |||||||||||||
Discount Rate | 5.75 | % | 6.25 | % | 6.50 | % | 6.00 | % | 5.75 | % | 5.50 | % | ||||||
Expected Long-Term Return on Plan Assets | 8.00 | % | 8.00 | % | 8.00 | % | 8.00 | % | 8.00 | % | 8.00 | % | ||||||
Rate of Compensation Increase | 4.00 | % | 4.00 | % | 4.00 | % | 4.00 | % | 4.00 | % | 4.00 | % | ||||||
The long-term expected rate of return on plan assets used in 2005,2008, as shown above, is eight percent. The Company establishes the long-term expected rate of return by developing a forward looking long-term expected rate of return assumption for each asset class, taking into account factors such as the expected real return for the specific asset class and inflation. One of the plan objectives is that performance of the equity portion of the pension plan exceed the Standard and Poors’ 500 Index over the long-term. The Company also seeks to achieve a minimum five percent annual real rate of return (above the rate of inflation) on the total portfolio over the long-term. In the Company’s pension calculations, the Company has used eight percent as the expected long-term return on plan assets for 2008, 2007 and 2006. In order to derive this return, a Monte Carlo simulation was run using 5,000 simulations based upon the Company’s actual asset allocation and liability duration, which has been determined to be approximately 15 years. This model uses historical data for the period of 1926-2007 for stocks, bonds and cash to determine the best estimate range of future returns. The median rate of return, or return that the Company expects to achieve over 50 percent of the time, is approximately nine percent. The Company expects to achieve at a minimum approximately seven percent annual real rate of return on the total portfolio over the long-term at least 75 percent of the time. The Company believes that the eight percent chosen is a reasonable estimate based on its actual results.
Plan Assets
At December 31, 20052008 and 2004,2007, the non-qualified pension plan did not have plan assets. The plan assets of the Company’s qualified pension plan at December 31, 20052008 and 2004,2007, by asset category are as follows:
| 2005 | 2004 | |||||||||||
| (In thousands) | Amount | Percent | Amount | Percent | ||||||||
Equity securities | $ | 19,556 | 82 | % | $ | 13,934 | 77 | % | ||||
Debt securities | 840 | 4 | % | 3,226 | 18 | % | ||||||
Other(1) | 3,369 | 14 | % | 932 | 5 | % | ||||||
Total | $ | 23,765 | �� | 100 | % | $ | 18,092 | 100 | % | |||
| 2008 | 2007 | |||||||||||
| Amount | Percent | Amount | Percent | |||||||||
| (In thousands) | (In thousands) | |||||||||||
Equity securities | $ | 23,585 | 69 | % | $ | 31,220 | 70 | % | ||||
Debt securities | 10,398 | 30 | % | 12,684 | 28 | % | ||||||
Other(1) | 312 | 1 | % | 840 | 2 | % | ||||||
Total | $ | 34,295 | 100 | % | $ | 44,744 | 100 | % | ||||
(1) | Primarily consists of cash and cash equivalents. |
The Company’s investment strategy for benefit plan assets is to invest in funds to maximize the return over the long-term, subject to an appropriate level of risk. Additionally, the objective is for each class of investments to outperform its representative benchmark over the long term.long-term. The Company generally targets a portfolio of assets utilizing equity securities, debt securities and cash equivalents that are within a range of approximately 60%50% to 80% for equity securities and approximately 20% to 40% for fixed income securities. Large capitalization
Index to Financial Statements
equities may make up a maximum of 65% of the portfolio. Small capitalization equities and international equities may make up a maximum of 30% and 15%, respectively, of the portfolio. Fixed income bonds may make up a maximum of 40% of the portfolio. The account will typically be fully invested; however, as a temporary investment or an asset protection measure, part of the account may be invested in money market investments up to 20%. One percent of the portfolio is invested in short-term funds at the designated bank to meet the cash flow needs of the plan. No prohibited investments, including direct or indirect investments in commodities, commodity futures, derivatives, short sales, real estate investment trusts, letter stock, restricted stock or other private placements, are allowed without prior committee approval.
Cash Flows
Contributions
The funding levels of the pension plans are in compliance with standards set by applicable law or regulation. In 20052008, the Company did not have any required minimum funding obligations; however, it chose to fund $5 million into the qualified plan. In 20062009, the Company does not have any required minimum funding obligations for the qualified pension plan. The Company will fund less than $0.1contribute $0.3 million, as shown below, for the non-qualified pension plan. Currently, management has not determined if any additional discretionary funding will be made in 2006.2009.
Estimated Future Benefit Payments
The following estimated benefit payments under the Company’s qualified and non-qualified pension plans, which reflect expected future service, as appropriate, are expected to be paid as follows:
| (In thousands) | Qualified | Non-Qualified | Total | ||||||
2006 | $ | 828 | $ | 42 | $ | 870 | |||
2007 | 848 | 54 | 902 | ||||||
2008 | 916 | 74 | 990 | ||||||
2009 | 1,106 | 85 | 1,191 | ||||||
2010 | 1,256 | 176 | 1,432 | ||||||
Years 2011 - 2015 | 10,878 | 1,418 | 12,296 | ||||||
| Qualified | Non-Qualified | Total | |||||||
| (In thousands) | |||||||||
2009 | $ | 1,303 | $ | 252 | $ | 1,555 | |||
2010 | 1,373 | 414 | 1,787 | ||||||
2011 | 1,599 | 322 | 1,921 | ||||||
2012 | 2,079 | 738 | 2,817 | ||||||
2013 | 2,482 | 1,374 | 3,856 | ||||||
Years 2014 - 2018 | 19,531 | 2,232 | 21,763 | ||||||
Postretirement Benefits Other than Pensions
In addition to providing pension benefits, the Company provides certain health care and life insurance benefits for retired employees, including their spouses, eligible dependents and surviving spouses (retirees). These benefits are commonly called postretirement benefits. The health care plans are contributory, with participants’ contributions adjusted annually. The life insurance plans were non-contributory. As of January 1, 2006, the Company no longer provides postretirement life insurance coverage. Most employees become eligible for these benefits if they meet certain age and service requirements at retirement. The Company was providing postretirement benefits to 245234 retirees and their dependantsdependents at the end of 20052008 and 251235 retirees and their dependantsdependents at the end of 2004. The measurement date used to measure postretirement benefits other than pensions is December 31, 2005.2007.
When the Company adopted SFAS No. 106, “Employers’ Accounting for Postretirement Benefits Other Than Pension”,Pension,” in 1992, it began amortizing the $16.9 million accumulated postretirement benefit, known as the Transition Obligation,transition obligation, over a period of 20 years, or $0.8 million per year which is included in the annual expense of the plan. Included in the amortization benefit of the unrecognized transition obligation amount below are the effects of plan amendments during 1996, 2000 and 2004. TheAs a result of the adoption of SFAS No. 158, the remaining unamortized balance at December 31, 2006 of $3.2 million is $3.9 million whichnow recognized in accumulated other comprehensive income. Additionally, a portion of this amount will be amortized overand reclassified from the next six years.balance sheet to the income statement as expense each year.
Components of Net Periodic Benefit Cost
Postretirement benefit costs recognized during the last three years are as follows:
| (In thousands) | 2005 | 2004 | 2003 | |||||||||
Current Year Service Cost | $ | 675 | $ | 671 | $ | 265 | ||||||
Interest Cost | 605 | 784 | 385 | |||||||||
Recognized Net Actuarial Gain | (79 | ) | (59 | ) | (155 | ) | ||||||
Amortization of Prior Service Cost | 910 | 1,211 | — | |||||||||
Amortization of Net Obligation at Transition | 648 | 662 | 662 | |||||||||
Total Postretirement Benefit Cost | $ | 2,759 | $ | 3,269 | $ | 1,157 | ||||||
Index to Financial Statements
Obligations and Funded Status
The funded status represents the difference between the accumulated benefit obligation of the Company’s postretirement benefit obligationplan and the fair value of plan assets at December 31, 2005, 2004 and 200331. The postretirement plan does not have any plan assets; therefore, the funded status is comprisedequal to the amount of the following:December 31 accumulated benefit obligation.
| (In thousands) | 2005 | 2004 | 2003 | |||||||||
Beginning of Year (1) | $ | 14,101 | $ | 6,181 | $ | 6,185 | ||||||
Service Cost | 675 | 671 | 265 | |||||||||
Interest Cost | 605 | 784 | 386 | |||||||||
Amendments | (1,434 | ) | 6,901 | — | ||||||||
Actuarial (Gain) / Loss | (876 | ) | 864 | 221 | ||||||||
Benefits Paid | (1,278 | ) | (1,300 | ) | (876 | ) | ||||||
End of Year(1) | $ | 11,793 | $ | 14,101 | $ | 6,181 | ||||||
The change in the accumulatedCompany’s postretirement benefit obligation during the last three years, as well as the funded status at the end of the last three years, is presented as follows:
| (In thousands) | 2005 | 2004 | 2003 | |||||||||
Fair Value of Plan Assets | $ | — | $ | — | $ | — | ||||||
Funded Status | 11,793 | 14,101 | 6,181 | |||||||||
Unrecognized Net Gain | 2,475 | 814 | 1,736 | |||||||||
Unrecognized Net Prior Service Cost | (3,366 | ) | (5,691 | ) | — | |||||||
Unrecognized Net Transition Obligation | (3,888 | ) | (4,631 | ) | (5,293 | ) | ||||||
Accrued Postretirement Benefit Liability | $ | 7,014 | $ | 4,593 | $ | 2,624 | ||||||
| 2008 | 2007 | 2006 | ||||||||||
| (In thousands) | ||||||||||||
Change in Benefit Obligation | ||||||||||||
Benefit Obligation at Beginning of Year | $ | 20,846 | $ | 18,781 | $ | 11,793 | ||||||
Service Cost | 1,083 | 871 | 789 | |||||||||
Interest Cost | 1,380 | 1,076 | 877 | |||||||||
Actuarial Loss | 4,270 | 880 | 6,337 | |||||||||
Plan Amendments | — | — | (153 | ) | ||||||||
Benefits Paid | (691 | ) | (762 | ) | (862 | ) | ||||||
Benefit Obligation at End of Year | 26,888 | 20,846 | 18,781 | |||||||||
Change in Plan Assets | ||||||||||||
Fair Value of Plan Assets at End of Year | N/A | N/A | N/A | |||||||||
Funded Status at End of Year | $ | (26,888 | ) | $ | (20,846 | ) | $ | (18,781 | ) | |||
Amounts Recognized in the Balance Sheet
Amounts recognized in the balance sheet at December 31 consist of the following:
| 2008 | 2007 | 2006 | ||||||||||
| (In thousands) | ||||||||||||
Current Liabilities | $ | (642 | ) | $ | (642 | ) | $ | (577 | ) | |||
Long-Term Liabilities | (26,246 | ) | (20,204 | ) | (18,204 | ) | ||||||
| $ | (26,888 | ) | $ | (20,846 | ) | $ | (18,781 | ) | ||||
Amounts Recognized in Accumulated Other Comprehensive Income
Amounts recognized in accumulated other comprehensive income at December 31 consist of the following:
| 2008 | 2007 | 2006 | |||||||
| (In thousands) | |||||||||
Transition Obligation | $ | 1,895 | $ | 2,527 | $ | 3,159 | |||
Prior Service Cost | 666 | 1,618 | 2,570 | ||||||
Net Actuarial Loss | 8,214 | 4,392 | 3,705 | ||||||
| $ | 10,775 | $ | 8,537 | $ | 9,434 | ||||
The estimated net obligation at transition, prior service cost and net loss for the defined benefit postretirement plan that will be amortized from accumulated other comprehensive income into net periodic postretirement cost over the next fiscal year are $0.6 million, $0.7 million and $0.5 million, respectively.
Index to Financial Statements
Components of Net Periodic Benefit Cost
| 2008 | 2007 | 2006 | ||||||||||
| (In thousands) | ||||||||||||
Components of Net Periodic Postretirement Benefit Cost | ||||||||||||
Current Year Service Cost | $ | 1,083 | $ | 871 | $ | 789 | ||||||
Interest Cost | 1,380 | 1,076 | 877 | |||||||||
Amortization of Prior Service Cost | 952 | 952 | 952 | |||||||||
Amortization of Net Obligation at Transition | 632 | 632 | 632 | |||||||||
Amortization of Net Loss | 448 | 193 | 32 | |||||||||
SFAS 106 Net Periodic Postretirement Cost | 4,495 | 3,724 | 3,282 | |||||||||
Recognized Curtailment Gain | — | — | (86 | ) | ||||||||
SFAS 88 Cost | — | — | (86 | ) | ||||||||
Total SFAS 106 and SFAS 88 Cost | $ | 4,495 | $ | 3,724 | $ | 3,196 | ||||||
Other Changes in Benefit Obligations Recognized in Other Comprehensive Income | ||||||||||||
Net Loss | $ | 4,270 | $ | 880 | N/A | |||||||
Amortization of Prior Service Cost | (952 | ) | (952 | ) | N/A | |||||||
Amortization of Net Obligation at Transition | (632 | ) | (632 | ) | N/A | |||||||
Amortization of Net Loss | (448 | ) | (193 | ) | N/A | |||||||
Total Recognized in Other Comprehensive Income | 2,238 | (897 | ) | N/A | ||||||||
Total Recognized in Qualified Net Periodic Benefit Cost and Other Comprehensive Income | $ | 6,733 | $ | 2,827 | N/A | |||||||
Assumptions
Assumptions used to determine projected postretirement benefit obligations and postretirement costs are as follows:
| 2005 | 2004 | 2003 | |||||||
Discount Rate(1) | 5.50 | % | 5.75 | % | 6.25 | % | |||
Health Care Cost Trend Rate for Medical Benefits Assumed for Next Year | 9.00 | % | 10.00 | % | 8.00 | % | |||
Rate to which the cost trend rate is assumed to decline (the Ultimate Trend Rate) | 5.00 | % | 5.00 | % | N/A | ||||
Year that the rate reaches the Ultimate Trend Rate | 2010 | 2009 | 2009 |
| 2008 | 2007 | 2006 | |||||||
Discount Rate(1) | 5.75 | % | 6.00 | % | 5.75 | % | |||
Health Care Cost Trend Rate for Medical Benefits Assumed for Next Year | 9.00 | % | 9.00 | % | 8.00 | % | |||
Rate to which the cost trend rate is assumed to decline (the Ultimate Trend Rate) | 5.00 | % | 5.00 | % | 5.00 | % | |||
Year that the rate reaches the Ultimate Trend Rate | 2013 | 2012 | 2010 |
(1) | Represents the year end rates used to determine the projected benefit obligation. To compute postretirement cost in |
The health care cost trend rate used to measure the expected cost from 2000 to 2003 for medical benefits to retirees was 8%. Provisions of the plan existing at that time would have prevented significant future increases in employer cost after 2000. During the years ended December 31, 2005 and 2004, the plan was amended in several areas effective January 1, 2006. As of January 1, 2006, coverageCoverage provided to participants age 65 and older will beis under a fully-insured arrangement which replaces the former self-funded plan. Benefits under this new arrangement are expected to be comparable to benefits under the self-funded plan.arrangement. The Company subsidy will beis limited to 60% of the expected annual fully-insured premium.premium for participants age 65 and older. For all participants of anyunder age 65, the Company subsidy for all retiree medical and prescription drug benefits, beginning January 1, 2006, iswas limited to an aggregate annual amount not to exceed $648,000. This limit will increaseincreases by 3.5% annually thereafter. Additionally, in February 2005,The Company prepaid the Company purchased individual life insurance policies on a fully insured basispremiums for all retirees retiring before January 1, 2006. Effective January 1, 2006 postretirementeliminating all future premiums for retiree life insurance. A life insurance benefits will not be providedproduct is offered to new retirees.employees allowing employees to continue coverage into retirement by paying the premiums directly to the life insurance provider.
Index to Financial Statements
Assumed health care cost trend rates may have a significant effect on the amounts reported for the health care plans. A one-percentage-point change in assumed health care cost trend rates would have the following effects:
| (In thousands) | 1-Percentage- Point Increase | 1-Percentage- Point Decrease | ||||||||||||
| 1-Percentage- Point Increase | 1-Percentage- Point Decrease | |||||||||||||
| (In thousands) | ||||||||||||||
Effect on total of service and interest cost | $ | 12 | $ | (13 | ) | $ | 453 | $ | (366 | ) | ||||
Effect on postretirement benefit obligation | 131 | (147 | ) | 4,145 | (3,403 | ) | ||||||||
Cash Flows
Contributions
The Company expects to contribute approximately $0.6$0.8 million to the postretirement benefit plan in 2006.2009.
Estimated Future Benefit Payments
The following estimated benefit payments under the Company’s postretirement plans, which reflect expected future service, as appropriate, are expected to be paid as follows:
| (In thousands) | |||
2006 | $ | 571 | |
2007 | 579 | ||
2008 | 580 | ||
2009 | 594 | ||
2010 | 616 | ||
Years 2011 - 2015 | 3,894 | ||
| (In thousands) | |||
2009 | $ | 824 | |
2010 | 883 | ||
2011 | 974 | ||
2012 | 1,089 | ||
2013 | 1,245 | ||
Years 2014 - 2018 | 8,724 | ||
On December 8, 2003, theThe Medicare Prescription Drug, Improvement and Modernization Act of 2003 (the Act) was signed into law. The Act introducesintroduced a prescription drug benefit under Medicare as well as a federal subsidy to sponsors of retiree health care benefit plans that provide a benefit that is at least actuarially equivalent to certain Medicare benefits. In accordance with FSP No. FAS 106-2, “Accounting and Disclosure Requirements Related to the Medicare Prescription Drug, Improvement and Modernization Act of 2003”, any measures of the accumulated plan benefit obligation or net periodic postretirement benefit cost in the financial statements or accompanying notes do not reflect the effects of the Act on the Company’s plan. As amended by the Company has amendedon January 1, 2006, the postretirement benefit plan to excludeexcludes prescription drug benefits to participants age 65 and older effective January 1, 2006, management believesolder. Due to this amendment, FSP willNo. 106-2 did not have an impact on operating results, financial position or cash flows of the Company.
Savings Investment Plan
The Company has a Savings Investment Plan (SIP), which is a defined contribution plan. The Company matches a portion of employees’ contributions in cash. Participation in the SIP is voluntary, and all regular employees of the Company are eligible to participate. The Company charged to expense plan contributions of $1.6$2.2 million, $1.4$2.0 million and $1.4$1.8 million in 2005, 2004,2008, 2007 and 2003,2006, respectively. The Company matches employee contributions dollar-for-dollar on the first 6%six percent of an employee’s pretax earnings. The Company’s common stock is an investment option within the SIP.
Deferred Compensation Plan
In 1998, the Company established a Deferred Compensation Plan. This plan is available to officers of the Company and acts as a supplement to the Savings Investment Plan. If the employee’s base salary and bonus deferrals cause the employee to not receive the full 6%six percent company match to the Savings Investment Plan,
Index to Financial Statements
the Company will make a contribution annually into the Deferred Compensation Plan to ensure that the employee receives a full matching contribution from the Company. Unlike the SIP, the Deferred Compensation Plan does not have dollar limits on tax deferred contributions. However, the assets of this plan are held in a rabbi trust and are subject to additional risk of loss in the event of bankruptcy or insolvency of the Company. At December 31, 2005, the balance in the Deferred Compensation Plan’s rabbi trust was $4.9 million.
The employeeofficer participants guide the diversification of trust assets. The trust assets are invested in either mutual funds that cover the investment spectrum from equity to money market. Thesemarket, or may include holdings of the Company’s common stock, which is funded by the issuance of shares to the trust. The mutual funds are publicly quotedtraded, have market prices that are readily available and are reported at market value. No shares of the Company’s stock are held by the trust. Settlement payments are made to participants in cash, either in a lump sum or in periodic installments. The market value of the trust assets, is recorded onexcluding the Company’s balance sheet as a component ofcommon stock, was $8.7 million and $9.7 million at December 31, 2008 and 2007, respectively, and is included within Other Assets in the Consolidated Balance Sheet. Related liabilities, including the Company’s common stock, totaled $14.5 million and $16.0 million at December 31, 2008 and 2007, respectively, and are included within Other Liabilities in the corresponding liability is recorded as a component of Other Liabilities.
Consolidated Balance Sheet. There is no impact on earnings or earnings per share from the changes in market value of the deferred compensation plan assets, for two reasons. First,excluding the Company’s common stock, because the changes in market value of the trust assets are offset completely by changes in the value of the liability, which represents trust assets belonging to plan participants. Second, no
The Company’s common stock held in the rabbi trust is recorded at the market value on the date of deferral, which totaled $9.5 million and $6.3 million at December 31, 2008 and 2007, respectively and is included within Additional Paid-in Capital in Stockholders’ Equity in the Consolidated Balance Sheet. As of December 31 2008, 256,400 shares of the Company’s stock arerepresenting vested performance share awards were deferred into the rabbi trust. During 2008, a reduction to the rabbi trust deferred compensation liability of $4.8 million was recognized, representing the decrease in the closing price of the shares held in the trust.rabbi trust from December 31, 2007 to December 31, 2008. This reduction in stock-based compensation expense was included in General and Administrative expense in the Consolidated Statement of Operations. The Company common stock issued to the trust is not considered outstanding for purposes of calculating basic earnings per share, but is considered a common stock equivalent in the calculation of diluted earnings per share.
The Company charged to expense plan contributions of less than $20,000 in each year presented.of 2008, 2007 and 2006.
6. Income Taxes
Income tax expense / (benefit) is summarized as follows:
| Year Ended December 31, | Year Ended December 31, | ||||||||||||||||||||
| (In thousands) | 2005 | 2004 | 2003 | ||||||||||||||||||
| 2008 | 2007 | 2006 | |||||||||||||||||||
| (In thousands) | |||||||||||||||||||||
Current | |||||||||||||||||||||
Federal | $ | 42,976 | $ | 14,767 | $ | 22,826 | $ | 2,631 | $ | (1,424 | ) | $ | 123,155 | ||||||||
State | 5,185 | 3,710 | 2,075 | 30 | (3,619 | ) | 14,164 | ||||||||||||||
Total | 48,161 | 18,477 | 24,901 | 2,661 | (5,043 | ) | 137,319 | ||||||||||||||
Deferred | |||||||||||||||||||||
Federal | 37,565 | 31,779 | (8,549 | ) | 116,127 | 91,257 | 49,911 | ||||||||||||||
State | 2,063 | (10 | ) | (1,289 | ) | 5,545 | 3,895 | 2,100 | |||||||||||||
Total | 39,628 | 31,769 | (9,838 | ) | 121,672 | 95,152 | 52,011 | ||||||||||||||
Total Income Tax Expense | $ | 87,789 | $ | 50,246 | $ | 15,063 | $ | 124,333 | $ | 90,109 | $ | 189,330 | |||||||||
Index to Financial Statements
Total income taxes were different than the amounts computed by applying the statutory federal income tax rate as follows:
| Year Ended December 31, | ||||||||||||
| (In thousands) | 2005 | 2004 | 2003 | |||||||||
Statutory Federal Income Tax Rate | 35 | % | 35 | % | 35 | % | ||||||
Computed “Expected” Federal Income Tax | $ | 82,682 | $ | 48,518 | $ | 15,065 | ||||||
State Income Tax, Net of Federal Income Tax Benefit | 7,030 | 4,353 | 1,334 | |||||||||
Other, Net | (1,923 | )(1) | (2,625 | )(2) | (1,336 | )(3) | ||||||
Total Income Tax Expense | $ | 87,789 | $ | 50,246 | $ | 15,063 | ||||||
| Year Ended December 31, | ||||||||||||
| 2008 | 2007 | 2006 | ||||||||||
| (Dollars in thousands) | ||||||||||||
Statutory Federal Income Tax Rate | 35 | % | 35 | % | 35 | % | ||||||
Computed “Expected” Federal Income Tax | $ | 117,468 | $ | 90,137 | $ | 178,818 | ||||||
State Income Tax, Net of Federal Income Tax Benefit | 6,581 | 5,452 | 14,494 | |||||||||
Qualified Production Activities Deduction(1) | 1,174 | — | (2,327 | ) | ||||||||
Benefit Related to Favorable State Tax Determination(2) | — | (2,831 | ) | — | ||||||||
Deferred Tax Benefit Related to Reduction in Overall State Tax Rate | (1,453 | ) | (1,378 | ) | (2,605 | ) | ||||||
Other, Net | 563 | (1,271 | ) | 950 | ||||||||
Total Income Tax Expense | $ | 124,333 | $ | 90,109 | $ | 189,330 | ||||||
(1) | Carryback of |
(2) | In November 2007, the Company received a favorable ruling letter related to the |
The tax effects of temporary differences that resulted in significant portions of the deferred tax liabilities and deferred tax assets as of December 31 were as follows:
| Year Ended December 31, | Year Ended December 31, | |||||||||||
| (In thousands) | 2005 | 2004 | ||||||||||
| 2008 | 2007 | |||||||||||
| (In thousands) | ||||||||||||
Deferred Tax Liabilities | ||||||||||||
Property, Plant and Equipment | $ | 288,602 | $ | 246,962 | $ | 644,347 | $ | 472,444 | ||||
Items Accrued for Financial Reporting Purposes | 1,720 | 1,358 | 6,540 | 5,395 | ||||||||
Other Comprehensive Income | 132,474 | 7,861 | ||||||||||
Total | 290,322 | 248,320 | 783,361 | 485,700 | ||||||||
Deferred Tax Assets | ||||||||||||
Net Operating Loss Carryforwards | 2,591 | 2,045 | ||||||||||
Alternative Minimum Tax Credit | 17,764 | 8,587 | ||||||||||
Net Operating Loss | 40,339 | 22,170 | ||||||||||
Items Accrued for Financial Reporting Purposes | 22,840 | 21,290 | 40,472 | 35,193 | ||||||||
Other Comprehensive Income | 9,830 | 12,865 | 21,695 | 8,353 | ||||||||
Total | 35,261 | 36,200 | 120,270 | 74,303 | ||||||||
Net Deferred Tax Liabilities | $ | 255,061 | $ | 212,120 | $ | 663,091 | $ | 411,397 | ||||
As of December 31, 2005,2008, the Company had aincurred net operating losses for regular income tax reporting purposes of $153.4 million that it expects to utilize against 2006 taxable income. These losses include $36.1 million of excess tax deductions pursuant to SFAS No. 123(R) not included as deferred tax assets, the benefit of which cannot be recognized until the deductions reduce taxes payable. The Company also had net operating loss carryforwardcarryforwards of $50.3$170.7 million for state income tax reporting purposes, the majority of which will expire between 20132016 and 2025 and none available for regular federal income tax purposes.2028. It is expectedmore likely than not that these deferred tax benefits will be utilized prior to their expiration.
Uncertain Tax Positions
In June 2006, the FASB issued FIN 48, “Accounting for Uncertainty in Income Taxes—an Interpretation of FASB Statement No. 109.” This Interpretation provides guidance for recognizing and measuring uncertain tax
Index to Financial Statements
positions as defined in SFAS No. 109, “Accounting for Income Taxes.” FIN 48 prescribes a two-step process for accounting for income tax uncertainties. First, a threshold condition of “more likely than not” should be met to determine whether any of the benefit of the uncertain tax position should be recognized in the financial statements. If the recognition threshold is met, FIN 48 provides additional guidance on measuring the amount of the uncertain tax position. Under FIN 48, the Company may recognize the tax benefit from an uncertain tax position only if it is more likely than not that the tax position will be sustained on examination by the taxing authorities, based on the technical merits of the position. The tax benefits recognized in the financial statements from such a position should be measured based on the largest benefit that has a greater than fifty percent likelihood of being realized upon ultimate settlement. Guidance is also provided regarding derecognition, classification, interest and penalties, interim period accounting, transition and increased disclosure of these uncertain tax position. FIN 48 is effective for fiscal years beginning after December 15, 2006.
The Company adopted the provisions of FIN 48 on January 1, 2007. As a result of the implementation of FIN 48, the Company recognized no change to the liability for unrecognized tax benefits.
The Company recognizes accrued interest related to uncertain tax positions in Interest Expense and Other and accrued penalties related to such positions in General and Administrative expense in the Consolidated Statement of Operations, which is consistent with the recognition of these items in prior reporting periods. As of December 31, 2008, the Company determined that no accrual for penalties was required.
As of December 31, 2008 and 2007, the Company’s unrecognized tax benefits were $0.5 million and $2.4 million, respectively. These amounts, if recognized, would not have a significant impact on the effective tax rate.
A reconciliation of the beginning and ending amount of unrecognized tax benefits is as follows:
| Year Ended December 31, | ||||||||
| 2008 | 2007 | |||||||
| (In thousands) | ||||||||
Unrecognized tax benefit balance at beginning of year | $ | 2,425 | $ | 1,029 | ||||
Additions based on tax positions related to the current year | — | — | ||||||
Additions for tax positions of prior years | — | 1,415 | ||||||
Reductions for tax positions of prior years | (1,925 | ) | (19 | ) | ||||
Settlements | — | — | ||||||
Unrecognized tax benefit balance at end of year | $ | 500 | $ | 2,425 | ||||
During 2008, the Company executed a final settlement agreement with the Internal Revenue Service that reduced unrecognized tax benefits by $1.9 million. This reduction did not affect the effective tax rate. The amount of remaining unrecognized tax benefits as of December 31, 2008, if recognized, would not have a significant impact on the effective tax rate. It is possible that the amount of unrecognized tax benefits will change in the next twelve months. The Company does not expect that a change would have a significant impact on its results of operations, financial position or cash flows.
The Company files income tax returns in the U.S. federal jurisdiction, various states and Canada. The Company is no longer subject to examinations by state authorities before 2001. The Company is currently under examination by the Internal Revenue Service for 2006.
7. Commitments and Contingencies
Firm Gas Transportation Agreements and Drilling Rig Commitments
The Company has incurred, and will incur over the next several years, demand charges on firm gas transportation agreements. These agreements provide firm transportation capacity rights on pipeline systems in
Index to Financial Statements
Canada, the West and the East.East regions. The remaining terms on these agreements range from 2less than one year to 22approximately 20 years and require the Company to pay transportation demand charges regardless of the amount of pipeline capacity utilized by the Company. If the Company does not utilize the capacity, it can release it to others, thus reducing its potential liability.
Future obligations under firm gas transportation agreements in effect at December 31, 20052008 are as follows:
| (In thousands) | |||
2006 | $ | 11,661 | |
2007 | 11,626 | ||
2008 | 8,213 | ||
2009 | 3,381 | ||
2010 | 3,381 | ||
Thereafter | 55,504 | ||
| $ | 93,766 | ||
| (In thousands) | |||
2009 | $ | 13,218 | |
2010 | 12,335 | ||
2011 | 11,600 | ||
2012 | 10,024 | ||
2013 | 3,350 | ||
Thereafter | 44,143 | ||
| $ | 94,670 | ||
Drilling Rig Commitments
The Company also has threeeight drilling rigs in the Gulf Coast under contract that are not yet delivered and two existing rigs in the Gulf Coast under contract through 2008.contracts with initial terms of greater than one year. As of December 31, 2005,2008, the Company is obligated under these contracts to pay $44.3 million over the next 4two years to pay $104.3 million as follows:
| (In thousands) | |||
2006 | $ | 26,055 | |
2007 | 41,245 | ||
2008 | 27,340 | ||
2009 | 9,675 | ||
| $ | 104,315 | ||
Subsequent to December 31, 2005, the Company entered into an agreement for one additional drilling rig in the Gulf Coast. The total commitment over the next four years is $27.4 million, of which $0.8 million, $9.1 million, $9.1 million and $8.4 million will be paid out during the years 2006, 2007, 2008 and 2009, respectively.
2009 2010 (In thousands) $ 42,021 2,250 $ 44,271
Lease Commitments
The Company leases certain transportation vehicles, warehouse facilities, office space, and machinery and equipment under cancelable and non-cancelable leases. The lease for the Company’s existing office in Houston runsexpires in 2009. During 2008, the Company entered into a lease for new office space in Houston. The new lease will commence in August 2009 and will expire approximately four more years. Most of the Company’ssix years from commencement. All other operating leases expire within the next five years, and some of these leases may be renewed. Rent expense under such arrangements totaled $9.1$14.6 million, $8.7$12.3 million and $8.5$10.7 million for the years ended December 31, 2005, 2004,2008, 2007 and 2003,2006, respectively.
Future minimum rental commitments under non-cancelable leases in effect at December 31, 20052008 are as follows:
| (In thousands) | |||
2006 | $ | 4,876 | |
2007 | 4,633 | ||
2008 | 4,541 | ||
2009 | 3,207 | ||
2010 | 489 | ||
Thereafter | — | ||
| $ | 17,746 | ||
| (In thousands) | |||
2009 | $ | 6,335 | |
2010 | 4,859 | ||
2011 | 4,169 | ||
2012 | 3,863 | ||
2013 | 3,534 | ||
Thereafter | 5,926 | ||
| $ | 28,686 | ||
Index to Financial Statements
Contingencies
The Company is a defendant in various legal proceedings arising in the normal course of ourits business. All known liabilities are accrued based on management’s best estimate of the potential loss. While the outcome and impact of such legal proceedings on the Company cannot be predicted with certainty, management believes that the resolution of these proceedings through settlement or adverse judgment will not have a material adverse effect on the Company’s consolidated financial position or cash flow. Operating results, however, could be significantly impacted in the reporting periods in which such matters are resolved.
Wyoming Royalty Litigation
In January 2002, 13 overriding royalty owners sued the Company in Wyoming federal district court, as reported in previous filings. The plaintiffs made claims pertaining to deductions from their overriding royalty and claims concerning penalties for improper reporting. As a result of several decisions by the Court favorable to the Company, the case was settled in September 2005 with no payment from the Company and a dismissal with prejudice of all claims by plaintiffs. The settlement included provisions for reporting and payment going forward. Management has reversed the reserve it had recorded regarding this case, which had an immaterial impact on the Company’s consolidated financial statements.
West Virginia Royalty Litigation
In December 2001, the Company was sued by two royalty owners in West Virginia state court for an unspecified amount of damages. The plaintiffs have requested class certification and allegealleged that the Company failed to pay royalty based upon the wholesale market value of the gas, that itthe Company had taken improper deductions from the royalty and that it failed to properly inform royalty owners of the deductions. The plaintiffs also claimed that they are entitled to a 1/8th royalty share of the gas sales contract settlement that the Company reached with Columbia Gas Transmission Corporation in 1995 bankruptcy proceedings.
Discovery and pleadings necessary to place the class certification issue before the state court have been ongoing. The Court entered an order on June 1, 2005 granting the motion for class certification.
The parties have negotiatedreached a modificationtentative settlement pursuant to the order which will result in the dismissal of the claims related to the gas sales contract settlement in connection with the Columbia Gas Transmission bankruptcy proceedings and that will limit the claims to those arising on and after December 17, 1991. The Court has postponed the trial date from April 17, 2006, in light of a case pending before the West Virginia Supreme Court of Appeals which may decide issues of law that may apply to the issue of deductibility of post-production expenses. The Company intends to challenge the class certification order by filing a Petition for Writ of Prohibition with the West Virginia Supreme Court of Appeals.
The Company is vigorously defending the case. A reserve has been established that management believes is adequate based on its estimate of the probable outcome of this case.
Texas Title Litigation
On January 6, 2003, the Company was served with Plaintiffs’ Second Amended Original Petition in Romeo Longoria, et al. v. Exxon Mobil Corporation, et al. in the 79th Judicial District Court of Brooks County, Texas. Plaintiffs filed their Second Supplemental Original Petition on November 12, 2004 and their Third Supplemental Original Petition on February 22, 2005 (which added Wynn-Crosby 1996, Ltd. and Dominion Oklahoma Texas Exploration & Production, Inc.). Plaintiffs allege that they are the owners of a one-half undivided mineral interest in and to certain lands in Brooks County, Texas. Cody Energy, LLC, a subsidiary of the Company, acquired certain leases and wells in 1997 and 1998.
The plaintiffs allege that they are entitled to be declared the rightful owners of an undivided interest in minerals and all improvements on the lands on which the Company acquired these leases. The plaintiffs also assert claimspaid a total of $12.0 million into a trust fund for trespass to try title, action to remove a cloud on the title, failure to properly account for royalty, fraud, trespass, conversion, all for unspecified actual and exemplary damages. Plaintiffs claim that they acquired titledisbursement to the propertyclass members upon final approval of the settlement by adverse possession. Plaintiffs also assert the discovery ruleCourt. The court held the final fairness hearing on February 12, 2008 and a claimapproved the settlement, authorized the distribution of fraudulent concealment to avoid the affirmative defense of limitations. In August 2005, the case was abated until late February 2006, during which time the parties are allowed to amend pleadings or add additional partiesfunds to the litigation. Due to the abatement of the case, the Company has not had the opportunity to conduct discovery in this matter. The Company estimates that production revenue from this field since Cody Energy, LLC acquired title is approximately $15.7 million,class members and that the carrying value of this property is approximately $33.6 million.
Although the investigation into this claim continues, the Company intends to vigorously defend the case. Should the Company receive an adverse ruling in this case, an impairment review would be assessed to determine whether the carrying value of the property is recoverable. Management cannot currently determine the likelihood of an unfavorable outcome or range of any potential loss should the outcome be unfavorable. Accordingly, there has been no reserve established for this matter.
Raymondville Area
In April 2004, the Company’s wholly owned subsidiary, Cody Energy, LLC, filed suit in state court in Willacy County, Texas against certain of its co-working interest owners in the Raymondville Area, located in Kenedy and Willacy Counties. In early 2003, Cody had proposed a new prospect under the terms of the Joint Operating Agreement. Some of the co-working interest owners elected not to participate. The initial well was successful and subsequent wells have been drilled to exploit the discovery made in the first well.
The working interest owners who elected not to participate notified Cody that they believed that they had the right to participate in wells drilled after the initial well. Cody contends that the working interest owners that elected not to participate are required to assign their interest in the prospect to those who elected to participate. The defendants have filed a counter claimdismissed all claims against the Company and onewith prejudice. These funds were disbursed in April 2008. Prior to the date of the defendants has filedCourt’s final order approving the settlement, these restricted cash funds were held by a lien against Cody’s interestfinancial institution in West Virginia under the joint custody of the plaintiffs and the Company. The Company had provided a reserve sufficient to cover the amount agreed upon to settle this litigation. As of June 30, 2008, these funds had been paid out to the class members or were controlled by the Court. Accordingly, the Company had reduced Other Current Assets in the leases inConsolidated Balance Sheet. In the Raymondville area.
Cody has signed a settlement, agreement with certain of the defendants representing approximately 3% of the interest in the area. CodyCompany and the remaining defendant filed cross motionsclass members also agreed to a methodology for summary judgment. In August 2005,payment of future royalties and the trial judge entered an order granting Cody’s Motion for Summary Judgment requiring the remaining defendant to assign to Cody all of its interest in the prospect and to remove the lien filed against Cody’s interest. The defendant has filed a Motion for Reconsideration and Opposition to Proposed Order. The Court has not yet made a decision on these two motions.reporting format such methodology will take.
Commitment and Contingency Reserves
TheWhen deemed necessary, the Company has establishedestablishes reserves for certain legal proceedings. The establishment of a reserve involves an estimation process that includes the advice of legal counsel and subjective judgment of management. While management believes these reserves to be adequate, it is reasonably possible that the Company could incur approximately $10.2$2.1 million of additional loss with respect to those matters in which reserves have been established. Future changes in the facts and circumstances could result in the actual liability exceeding the estimated ranges of loss and amounts accrued.
While the outcome and impact on the Company cannot be predicted with certainty, management believes that the resolution of these proceedings through settlement or adverse judgment will not have a material adverse effect on the consolidated financial position or cash flow of the Company. Operating results, however, could be significantly impacted in the reporting periods in which such matters are resolved.
Settlement of Dispute
In December 2008, the Company settled a dispute with a third party resulting in the Company’s recording a gain of $51.9 million, comprised of $20.2 million in cash paid by the third party to the Company and $31.7 million related to the fair value of unproved property rights received.
Index to Financial Statements
8. Cash Flow Information
Cash paid / (received) for interest and income taxes is as follows:
| Year Ended December 31, | |||||||||
| (In thousands) | 2005 | 2004 | 2003 | ||||||
Interest | $ | 17,366 | $ | 16,415 | $ | 18,298 | |||
Income Taxes | 47,142 | 29,861 | 19,267 | ||||||
The Company recorded benefits of $3.7 million, $2.6 million and $1.0 million for the years ended December 31, 2005, 2004 and 2003, respectively, for tax deductions taken due to employee stock option exercises and restricted stock grant vesting.
| Year Ended December 31, | |||||||||||
| 2008 | 2007 | 2006 | |||||||||
| (In thousands) | |||||||||||
Interest | $ | 23,089 | $ | 20,257 | $ | 24,088 | |||||
Income Taxes | (33,753 | ) | (20,099 | ) | 128,752 | ||||||
9. Capital Stock
On February 28, 2005, the Company announced that the Board of Directors had declared a 3-for-2 split of the Company’s common stock in the form of a stock distribution. The stock dividend was distributed on March 31, 2005 to stockholders of record on March 18, 2005. In lieu of issuing fractional shares, the Company paid cash based on the closing price of the common stock on the record date. All common stock accounts and per share data have been retroactively adjusted to give effect to the 3-for-2 split of the Company’s common stock.
Incentive Plans
On April 29, 2004,Under the 2004 Incentive Plan was approved by the shareholders. Under theCompany’s 2004 Incentive Plan, incentive and non-statutory stock options, stock appreciation rights (SARs), stock awards, cash awards and performance awards may be granted to key employees, consultants and officers of the Company. Non-employee directors of the Company may be granted discretionary awards under the 2004 Incentive Plan consisting of stock options or stock awards, in addition toawards. In the first quarter of 2007, the Board of Directors eliminated the automatic award of an option to purchase 15,00030,000 shares of common stock on the date the non-employee directors first join the boardBoard of directors.Directors. In its place, the Board of Directors considers an annual fixed dollar stock award which is competitive with the Company’s peer group. A total of 2,550,0005,100,000 shares of common stock may be issued under the 2004 Incentive Plan. In addition, shares remaining available for award under the 1994 Long-Term Incentive Plan and the Second Amended and Restated 1994 Non-Employee Director Stock Option Plan (herein “Prior Plans”) were subsumed into the 2004 Incentive Plan (342,597 shares post-split). Under the 2004 Incentive Plan, no more than 900,0001,800,000 shares may be used for stock awards that are not subject to the achievement of performance based goals, and no more than 1,500,0003,000,000 shares may be issued pursuant to incentive stock options. Awards
Stock Issuance
On June 20, 2008, the Company entered into an underwriting agreement, pursuant to which the Company sold an aggregate of 5,002,500 shares of common stock at a price to the Company of $62.66 per share. This aggregate share amount included 652,500 shares of common stock that were issued as a result of the exercise of the underwriters’ option to purchase additional shares. On June 25, 2008, the Company closed the public offering and received $313.5 million in net proceeds, after deducting underwriting discounts and commissions. These net proceeds were used temporarily to reduce outstanding borrowings under the Prior Plans will remain outstandingCompany’s revolving credit facility prior to funding a portion of the purchase price of the Company’s east Texas acquisition, which closed in the third quarter of 2008.
Immediately prior to (and in connection with) this issuance, the Company retired 5,002,500 shares of its treasury stock, which had a weighted-average purchase price of $16.46, representing $82.3 million. In accordance with their original terms and conditions.the Company’s policy, the excess of cost of the treasury stock over its par value was charged entirely to additional paid-in capital.
During 2005,Stock Split
On February 23, 2007, the Board of Directors granteddeclared a series of 110,200 performance share awards to the executives of the Company. These awards are earned based on the comparative performance2-for-1 split of the Company’s common stock measured against sixteen other companies in the Company’s peer group overform of a three year vesting period endingstock distribution. The stock dividend was distributed on
April March 30, 2008. Depending2007 to stockholders of record on the Company’s performance, employees may earn up to 100% of the award inMarch 16, 2007. All common stock accounts and an additional 100% of the award in cash. The performance shares qualify for variable accounting, and accordingly, are recorded at their fair value with compensation expense recognized over the performance period.
During 2005, the Company granted 19,600 restricted stock unitsper share data have been retroactively adjusted to give effect to the non-employee Directors of the Company. These units immediately vest and will be paid out whenever the Director ceases to be a Director of the Company. For all restricted stock units, the Company recognized compensation expense equal to the market value2-for-1 split of the Company’s common stock onstock.
Increase in Authorized Shares
On May 4, 2006, the grant datestockholders of the respective awards.Company approved an increase in the authorized number of shares of common stock from 80 million to 120 million shares. The Company correspondingly increased the number of shares of Series A Junior Participating Preferred Stock reserved for issuance from 800,000 to 1,200,000. The shares of Series A Junior Participating Preferred Stock are issuable pursuant to the Preferred Stock Purchase Rights Plan described below.
Information regarding
Index to Financial Statements
Treasury Stock
The Board of Directors has authorized a share repurchase program under which the Company may purchase shares of common stock optionsin the open market or in negotiated transactions. The timing and amount of these stock purchases are determined at the discretion of management. The Company may use the repurchased shares to fund stock compensation programs presently in existence, or for other corporate purposes. All purchases executed to date have been through open market transactions. There is no expiration date associated with the authorization to repurchase securities of the Company.
During the year ended December 31, 2008, the Company did not repurchase any shares of common stock. Since the authorization date, the Company has repurchased 5,204,700 shares, or 52% of the 10 million total shares authorized for repurchase at December 31, 2008, for a total cost of approximately $85.7 million. The repurchased shares were held as treasury stock. No treasury shares have been delivered or sold by the Company subsequent to the repurchase. In connection with the June 2008 common stock issuance, the Company retired 5,002,500 shares of its treasury stock as discussed above under the Company’s 2004 Incentive Plan and the Prior Plans is summarized below:heading “Stock Issuance.”
| December 31, | ||||||
| 2005 | 2004 | 2003 | ||||
Shares Under Option at Beginning of Period | 1,217,534 | 2,024,252 | 1,931,744 | |||
Granted | — | 36,750 | 700,500 | |||
Exercised | 300,493 | 793,775 | 518,079 | |||
Surrendered or Expired | 3,693 | 49,693 | 89,913 | |||
Shares Under Option at End of Period | 913,348 | 1,217,534 | 2,024,252 | |||
Options Exercisable at End of Period | 895,848 | 565,994 | 767,579 | |||
For each of the three most recent years, the price range for outstanding options was $11.63 to $23.32 per share. The following tables provide more information about the options by exercise price and year.
Options with exercise prices between $11.63 and $15.00 per share:
| December 31, | |||||||||
| 2005 | 2004 | 2003 | |||||||
Options Outstanding | |||||||||
Number of Options | 225,575 | 344,945 | 667,002 | ||||||
Weighted Average Exercise Price | $ | 12.84 | $ | 12.85 | $ | 12.81 | |||
Weighted Average Contractual Term (in years) | 1.1 | 2.0 | 2.6 | ||||||
Options Exercisable | |||||||||
Number of Options | 225,575 | 183,737 | 306,344 | ||||||
Weighted Average Exercise Price | $ | 12.84 | $ | 12.86 | $ | 12.69 | |||
Options with exercise prices between $15.01 and $23.32 per share:
| December 31, | |||||||||
| 2005 | 2004 | 2003 | |||||||
Options Outstanding | |||||||||
Number of Options | 687,773 | 872,589 | 1,357,250 | ||||||
Weighted Average Exercise Price | $ | 16.14 | $ | 16.16 | $ | 16.46 | |||
Weighted Average Contractual Term (in years) | 1.9 | 2.7 | 3.4 | ||||||
Options Exercisable | |||||||||
Number of Options | 670,273 | 382,257 | 461,235 | ||||||
Weighted Average Exercise Price | $ | 16.13 | $ | 16.29 | $ | 17.61 | |||
Dividend Restrictions
The Board of Directors of the Company determines the amount of future cash dividends, if any, to be declared and paid on the common stock depending on, among other things, the Company’s financial condition, funds from operations, the level of its capital and exploration expenditures, and its future business prospects. None of the note or credit agreements in place have a restricted payment provision.
Treasury Stock
In August 1998, the Board of Directors authorized the Company to repurchase up to two million shares of outstanding common stock at market prices. As a result of the 3-for-2 split of the Company’s common stock in March 2005, this figure has been adjusted to three million shares. The timing and amount of these stock purchases are determined at the discretion of management. The Company may use the repurchased shares to fund stock compensation programs presently in existence,provision or for other corporate purposes. During the year ended December 31, 2005, the Company repurchased 452,300 shares for a total cost of approximately $19.2 million. The repurchased shares are held as treasury stock. Since the authorization date, the Company has repurchased 1,513,850 shares, or 50% of the total shares authorized for repurchase, for a total cost of approximately $39.2 million. In 2005, the stock repurchase plan was funded from cash flow from operations. No treasury shares have been delivered or sold by the Company subsequent to the repurchase.provision limiting dividends.
Purchase Rights
On January 21, 1991, the Board of Directors adopted the Preferred Stock Purchase Rights Plan and declared a dividend distribution of one right for each outstanding share of common stock. On December 8, 2000, the rights agreement for the plan was amended and restated to extend the term of the plan to 2010 and to make other changes. Each right becomes exercisable when any person or group has acquired or made a tender or exchange offer for beneficial ownership of 15% or more of the Company’s outstanding common stock. Each right entitles the holder, other than the acquiring person or group, to purchase a fraction of a share of Series A Junior Participating Preferred Stock (Junior Preferred Stock). After a person or group acquires beneficial ownership of 15% of the common stock, each right entitles the holder to purchase common stock or other property having a market value (as defined in the plan) of twice the exercise price of the right. An exception to this triggering event applies in the case of a tender or exchange offer for all outstanding shares of common stock determined to be fair and in the best interests of the Company and its stockholders by a majority of the independent directors. Under certain circumstances, the Board of Directors may opt to exchange one share of common stock for each exercisable right. If there is a 15% holder and the Company is acquired in a merger or other business combination in which it is not the survivor, or 50% or more of the Company’s assets or earning power are sold or transferred, each right entitles the holder to purchase common stock of the acquiring company with a market value (as defined in the plan) equal to twice the exercise price of each right. At December 31, 20052008 there were no shares of Junior Preferred Stock issued or outstanding.
The rights expire on January 21, 2010, and may be redeemed by the Company at any time before a person or group acquires beneficial ownership of 15% of the common stock.
The 3-for-2 split of the Company’s common stock was consummated in the form of a stock distribution. The stock dividend was distributed on March 31, 2005 to stockholders of record on March 18, 2005. In lieu of issuing fractional shares, the Company paid cash based on the closing price of the common stock on the record date. As a result of the stock split,splits in 2005 and 2007, each share of common stock continues to include one right under the Company’s Preferred Stock Purchase Rights Plan, and each right now provides for the purchase, upon the occurrence of the conditions set forth in the plan, of two-thirdsone-third of one one-hundredth of a share of preferred stock at a purchase price of approximately $36.67$18.33 per two-thirdsone-third of one one-hundredth of a share.share (or $55 for each one one-hundredth of a share). The redemption price of each right is now two-thirdsone-third of a cent. All common
Index to Financial Statements
10. Stock-Based Compensation
Adoption of SFAS No. 123(R)
Beginning January 1, 2006, the Company began accounting for stock-based compensation under SFAS No. 123(R), which applies to new awards and to awards modified, repurchased or cancelled after December 31, 2005. The Company recorded compensation expense based on the fair value of awards as described below.
Compensation expense charged against income for stock-based awards (including the supplemental employee incentive plans discussed below) for the years ended December 31, 2008, 2007 and 2006 was $34.5 million, $15.3 million and $21.2 million, pre-tax, respectively, and is included in General and Administrative Expense in the Consolidated Statement of Operations. The $0.6 million ($0.4 million, net of tax) cumulative effect charge at adoption that was recorded in the first quarter of 2006 was due primarily to the recording of the liability component of the Company’s performance share awards at fair value, rather than intrinsic value.
For the year ended December 31, 2008, the Company realized a $10.7 million tax benefit related to the 2007 federal tax deduction in excess of book compensation cost related to employee stock-based compensation. In accordance with SFAS No. 123(R), the Company is able to recognize this tax benefit only to the extent it reduces the Company’s income taxes payable. Such income tax benefit related to the stock-based compensation was recorded in 2008 as the Company carried back net operating losses concurrent with the 2007 tax return filing. For regular tax purposes, the Company was in a net operating loss position in 2008; thus the entire tax benefit related to 2008 employee stock-based compensation will be recorded only when the tax net operating loss is utilized to reduce income taxes payable or claim a refund of taxes paid in prior years. The Company did not recognize a tax benefit related to stock-based compensation in 2007 as a result of the tax net operating loss position for the year under the Alternative Minimum Tax system. A benefit of $9.5 million was recorded for the year ended December 31, 2006 for tax deductions taken due to employee stock accountsoption exercises and restricted stock grant vesting. Under SFAS No. 123(R), the tax benefits resulting from tax deductions in excess of expense are reported as an operating cash outflow and a financing cash inflow. For the years ended December 31, 2008 and 2006, $10.7 million and $9.5 million were reported in these two separate line items in the Consolidated Statement of Cash Flows.
During the third quarter of 2006, the Company adopted the provisions outlined under FSP FAS No. 123(R)-3, “Transition Election Related to Accounting for the Tax Effects of Share-Based Payment Awards,” which discusses accounting for taxes for stock awards using the APIC Pool concept. The Company was not required to adopt this provision until January 1, 2007, one year from the adoption of 123(R); however, it chose early adoption. The Company made a one time election as prescribed under the FSP to use the shortcut approach to derive the initial windfall tax benefit pool. The Company chose to use a one-pool approach which combines all awards granted to employees, including non-employee directors.
Restricted Stock Awards
Most restricted stock awards vest either at the end of a three year service period, or on a graded-vesting basis of one-third at each anniversary date over a three year service period. Under the graded-vesting approach, the Company recognizes compensation cost over the three year requisite service period for each separately vesting tranche as though the awards are, in substance, multiple awards. For awards that vest at the end of the three year service period, expense is recognized ratably using a straight-line expensing approach over three years. A new award issued in 2008 partially vests at the end of a one year service period, with the remainder vesting at the end of four years. For all restricted stock awards, vesting is dependant upon the employees’ continued service with the Company, with the exception of employment termination due to death, disability or retirement.
The fair value of restricted stock grants is based on the average of the high and low stock price on the grant date. The maximum contractual term is four years. In accordance with SFAS No. 123(R), the Company accelerated the vesting period for retirement-eligible employees for purposes of recognizing compensation
Index to Financial Statements
expense in accordance with the vesting provisions of the Company’s stock-based compensation programs for awards issued after the adoption of SFAS No. 123(R). The Company used an annual forfeiture rate ranging from 0% to 7.2% based on approximately ten years of the Company’s history for this type of award to various employee groups.
The following table is a summary of restricted stock award activity for the year ended December 31, 2008:
Restricted Stock Awards | Shares | Weighted- Average Grant Date Fair Value per share | Weighted- Average Remaining Contractual Term (in years) | Aggregate Intrinsic Value (in thousands)(1) | |||||||
Non-vested shares outstanding at December 31, 2007 | 483,494 | $ | 18.44 | ||||||||
Granted | 13,000 | 40.93 | |||||||||
Vested | (400,454 | ) | 16.24 | ||||||||
Forfeited | (5,100 | ) | 25.94 | ||||||||
Non-vested shares outstanding at December 31, 2008 | 90,940 | $ | 30.92 | 2.3 | $ | 2,364 | |||||
(1) | The aggregate intrinsic value of restricted stock awards is calculated by multiplying the closing market price of the Company’s stock on December 31, 2008 by the number of non-vested restricted stock awards outstanding. |
As shown in the table above, there were 13,000 shares of restricted stock granted to employees during 2008. Awards totaling 8,000 shares vest at the end of a one year service period, and awards totaling 5,000 shares vest at the end of a four year service period, both commencing in September 2008. This grant is amortized using a graded-vesting schedule. During the year ended December 31, 2007, 51,900 shares of restricted stock were granted to employees with a weighted-average grant date fair value per share data have been retroactively adjusted to give effectof $32.92. During 2006, 93,700 restricted stock awards were granted with a weighted-average grant date fair value per share of $23.80. The total fair value of shares vested during 2008, 2007 and 2006 was $6.5 million, $5.2 million and $5.0 million, respectively.
Compensation expense recorded for all unvested restricted stock awards for the years ended December 31, 2008, 2007 and 2006 was $1.5 million, $3.4 million and $6.1 million, respectively. Included in 2007 and 2006 restricted stock expense was $0.1 million and $0.6 million, respectively related to the 3-for-2 splitimmediate expensing of shares granted to retirement-eligible employees. Unamortized expense as of December 31, 2008 for all outstanding restricted stock awards was $1.2 million and will be recognized over the next 2.3 years.
Restricted Stock Units
Restricted stock units are granted from time to time to non-employee directors of the Company. The fair value of these units is measured at the average of the high and low stock price on grant date and compensation expense is recorded immediately. These units immediately vest and are paid out when the director ceases to be a director of the Company. Due to the immediate vesting of the units and the unknown term of each director, the weighted-average remaining contractual term in years has been omitted from the table below.
Index to Financial Statements
The following table is a summary of restricted stock unit activity for the year ended December 31, 2008:
Restricted Stock Units | Shares | Weighted- Average Grant Date Fair Value per share | Aggregate Intrinsic Value (in thousands)(1) | ||||||
Outstanding at December 31, 2007 | 85,052 | $ | 23.97 | ||||||
Granted and fully vested | 16,565 | 49.17 | |||||||
Issued | (19,602 | ) | 26.02 | ||||||
Forfeited | — | — | |||||||
Outstanding at December 31, 2008 | 82,015 | $ | 28.57 | $ | 2,132 | ||||
(1) | The intrinsic value of restricted stock units is calculated by multiplying the closing market price of the Company’s stock on December 31, 2008 by the number of outstanding restricted stock units. |
As shown in the table above, 16,565 restricted stock units were granted during 2008. During 2007, 24,654 restricted stock units were granted with a weighted-average grant date fair value per share of $35.49. During 2006, 34,440 restricted stock units were granted with a weighted-average grant date fair value per share of $25.41.
The compensation cost, which reflects the total fair value of these units, recorded in 2008 was $0.8 million. Compensation expense recorded during the years ended December 31, 2007 and 2006 for restricted stock units was $0.9 million for both years.
Stock Options
Stock option awards are granted with an exercise price equal to the market price (defined as the average of the high and low trading prices of the Company’s stock at the date of grant) of the Company’s stock on the date of grant. During the years ended December 31, 2008 and 2007, there were no stock options granted. During 2006, 60,000 stock options, with an exercise price of $23.80 per share, were granted to two incoming non-employee directors of the Company in the first quarter of 2006.
Compensation cost is recorded based on a graded-vesting schedule as the options vest over a service period of three years, with one-third of the award becoming exercisable each year on the anniversary date of the grant. Stock options have a maximum contractual term of five years. No forfeiture rate is assumed for stock options granted to directors due to the forfeiture rate history for these types of awards for this group of individuals. Compensation expense recorded during 2008, 2007 and 2006 for these stock options was $0.1 million, $0.1 million and $0.3 million, respectively. Unamortized expense as of December 31, 2008 for all outstanding stock options was less than $0.1 million. The weighted-average period over which this compensation will be recognized is approximately 0.2 years.
Index to Financial Statements
The grant date fair value of a stock option is calculated by using a Black-Scholes model. The assumptions used in the Black-Scholes fair value calculation for stock options are as follows:
| Year Ended December 31, | ||||||||||
| 2008 | 2007 | 2006 | ||||||||
Weighted-Average Value per Option Granted | ||||||||||
During the Period(1) | $ | — | $ | — | $ | 7.32 | ||||
Assumptions | ||||||||||
Stock Price Volatility | — | — | 31.5 | % | ||||||
Risk Free Rate of Return | — | — | 4.6 | % | ||||||
Expected Dividend | — | — | 0.3 | % | ||||||
Expected Term (in years) | — | — | 4.0 | |||||||
(1) | Calculated using the Black-Scholes fair value based method. |
The expected term was derived by reviewing minimum and maximum expected term outputs from the Black-Scholes model based on award type and employee type. This term represents the period of time that awards granted are expected to be outstanding. The stock price volatility was calculated using historical closing stock price data for the Company for the period associated with the expected term through the grant date of each award. The risk free rate of return percentages are based on the continuously compounded equivalent of the US Treasury (Nominal 10) within the expected term as measured on the grant date. The expected dividend percentage assumes that the Company will continue to pay a consistent level of dividend each quarter.
The following table is a summary of stock option activity for the years ended December 31, 2008, 2007 and 2006:
| 2008 | 2007 | 2006 | ||||||||||||||||
Stock Options | Shares | Weighted- Average Exercise Price | Shares | Weighted- Average Exercise Price | Shares | Weighted- Average Exercise Price | ||||||||||||
Outstanding at Beginning of Year | 388,950 | $ | 10.38 | 1,007,950 | $ | 9.03 | 1,826,696 | $ | 7.66 | |||||||||
Granted | — | — | — | — | 60,000 | 23.80 | ||||||||||||
Exercised | (328,450 | ) | 8.30 | (619,000 | ) | 8.18 | (876,946 | ) | 7.20 | |||||||||
Forfeited or Expired | — | — | — | — | (1,800 | ) | 9.10 | |||||||||||
Outstanding at December 31(1) | 60,500 | $ | 21.69 | 388,950 | $ | 10.38 | 1,007,950 | $ | 9.03 | |||||||||
Options Exercisable at December 31(2) | 40,500 | $ | 20.65 | 348,950 | $ | 8.84 | 947,950 | $ | 8.09 | |||||||||
(1) | The intrinsic value of a stock option is the amount by which the current market value of the underlying stock exceeds the exercise price of the option. The aggregate intrinsic value of options outstanding at December 31, 2008 was $0.3 million. The weighted-average remaining contractual term is 1.8 years. |
(2) | The aggregate intrinsic value of options exercisable at December 31, 2008 was $0.2 million. The weighted-average remaining contractual term is 1.7 years. |
The total intrinsic value of options exercised during the years ended December 31, 2008, 2007 and 2006 was $12.2 million, $19.9 million and $17.7 million, respectively.
Stock Appreciation Rights
Beginning in 2006, the Compensation Committee has granted SARs to employees. These awards allow the employee to receive any intrinsic value over the grant date market price that may result from the price
Index to Financial Statements
appreciation on a set number of common shares during the contractual term of seven years. All of these awards have graded-vesting features and will vest over a service period of three years, with one-third of the award becoming exercisable each year on the anniversary date of the grant. As these SARs are paid out in stock, rather than in cash, the Company calculates the fair value in the same manner as stock options, by using a Black-Scholes model.
The assumptions used in the Black-Scholes fair value calculation for SARs are as follows:
| Year Ended December 31, | ||||||||||||
| 2008 | 2007 | 2006 | ||||||||||
Weighted-Average Value per Stock Appreciation Right | ||||||||||||
Granted During the Period(1) | $ | 15.18 | $ | 11.26 | $ | 7.09 | ||||||
Assumptions | ||||||||||||
Stock Price Volatility | 34.4 | % | 32.6 | % | 31.6 | % | ||||||
Risk Free Rate of Return | 2.8 | % | 4.6 | % | 4.6 | % | ||||||
Expected Dividend | 0.2 | % | 0.2 | % | 0.3 | % | ||||||
Expected Term (in years) | 4.25 | 4.00 | 3.75 | |||||||||
(1) | Calculated using the Black-Scholes fair value based method. |
These assumptions were derived using the same process as described in the “Stock Options” section above.
The following table is a summary of SAR activity for the years ended December 31, 2008, 2007 and 2006:
| 2008 | 2007 | 2006 | |||||||||||||
Stock Appreciation Rights | Shares | Weighted- Average Exercise Price | Shares | Weighted- Average Exercise Price | Shares | Weighted- Average Exercise Price | |||||||||
Outstanding at Beginning of Year | 372,800 | $ | 27.08 | 265,600 | $ | 23.80 | — | $ | — | ||||||
Granted | 119,130 | 48.48 | 107,200 | 35.22 | 265,600 | 23.80 | |||||||||
Exercised | — | — | — | — | — | — | |||||||||
Forfeited or Expired | — | — | — | — | — | — | |||||||||
Outstanding at December 31(1) | 491,930 | $ | 32.26 | 372,800 | $ | 27.08 | 265,600 | $ | 23.80 | ||||||
SARs Exercisable at December 31(2) | 212,790 | $ | 25.72 | 88,526 | $ | 23.80 | — | $ | — | ||||||
(1) | The intrinsic value of a SAR is the amount by which the current market value of the underlying stock exceeds the exercise price of the SAR. The aggregate intrinsic value of SARs outstanding at December 31, 2008 was $0.6 million. The weighted-average remaining contractual term is 4.9 years. |
(2) | The aggregate intrinsic value of SARs exercisable at December 31, 2008 was $0.4 million. The weighted-average remaining contractual term is 4.3 years. |
As shown in the table above, the Compensation Committee granted 119,130 SARs to employees during 2008 with an exercise price equal to the grant date market price of $48.48. The grant date fair value of these SARs was $15.18 per share. Compensation expense recorded during the years ended December 31, 2008, 2007 and 2006 for all outstanding SARs was $1.7 million, $1.5 million and $1.0 million, respectively. Included in both 2008 and 2007 expense was $0.5 million related to the immediate expensing of shares granted to retirement-eligible employees. Unamortized expense as of December 31, 2008 for all outstanding SARs was $0.7 million. The weighted-average period over which this compensation will be recognized is approximately 1.9 years.
Index to Financial Statements
Performance Share Awards
During 2008, the Compensation Committee granted three types of performance share awards to employees for a total of 383,065 performance shares. The performance period for two of the three types of these awards commenced on January 1, 2008 and ends December 31, 2010. Both of these types of awards vest at the end of the three year performance period.
Awards totaling 101,830 performance shares are earned, or not earned, based on the comparative performance of the Company’s common stock measured against sixteen other companies in the Company’s peer group over a three year performance period. The grant date per share value of the equity portion of this award was $41.53. Depending on the Company’s performance, employees may receive an aggregate of up to 100% of the fair market value of a share of common stock payable in common stock plus up to 100% of the fair market value of a share of common stock payable in cash.
Awards totaling 191,400 performance shares were granted and are earned, or not earned, based on the Company’s internal performance metrics rather than performance compared to a peer group. As of December 31, 2008, 175,500 shares of this award are outstanding. The grant date per share value of this award was $48.48. These awards represent the right to receive up to 100% of the award in shares of common stock. The actual number of shares issued at the end of the performance period will be determined based on the Company’s performance against three performance criteria set by the Company’s Compensation Committee. An employee will earn one-third of the award granted for each internal performance metric that the Company meets at the end of the performance period. These performance criteria measure the Company’s average production, average finding costs and average reserve replacement over three years. Based on the Company’s probability assessment at December 31, 2008, it is considered probable that these three criteria will be met.
The third type of performance share award, totaling 89,835 performance shares, with a grant date per share value of $48.48, has a three-year graded vesting schedule, vesting one-third on each anniversary date following the date of grant, provided that the Company has positive operating income for the year preceding the vesting date. If the Company does not have positive operating income for the year preceding a vesting date, then the portion of the performance shares that would have vested on that date will be forfeited. As of December 31, 2008, it is considered probable that this performance metric will be met.
For all awards granted to employees after January 1, 2006, an annual forfeiture rate ranging from 0% to 4.5% has been assumed based on the Company’s history for this type of award to various employee groups.
For awards that are based on the internal metrics (performance condition) of the Company and for awards that were granted prior to the adoption of SFAS No. 123(R) on January 1, 2006, fair value is measured based on the average of the high and low stock price of the Company on grant date and expense is amortized over the three year vesting period. To determine the fair value for awards that were granted after January 1, 2006 that are based on the Company’s comparative performance against a peer group (market condition), the equity and liability components are bifurcated. On the grant date, the equity component was valued using a Monte Carlo binomial model and is amortized on a straight-line basis over three years. The liability component is valued at each reporting period by using a Monte Carlo binomial model.
The four primary inputs for the Monte Carlo model are the risk-free rate, volatility of returns, correlation in movement of total shareholder return and the expected dividend. The risk-free rate was generated from the Federal Reserve website for constant maturity treasuries for one and two year bonds and is set equal to the yield, for the period over the remaining duration of the performance period, on treasury securities as of the reporting date. Volatility was set equal to the annualized daily volatility measured over a historic one and two year period ending on the reporting date. Correlation in movement of total shareholder return was determined based on a correlation matrix that was created which identifies total shareholder return correlations for each pair of companies in the peer group, including the Company. The paired returns in the correlation matrix ranged from approximately 71% to approximately 89% for the Company and its peer group. The expected dividend is calculated using the total Company dividends paid ($0.12 for 2008) divided by the December 31, 2008 closing
Index to Financial Statements
price of the Company’s stock ($26.00). Based on these inputs discussed above, a ranking was projected identifying the Company’s rank relative to the peer group for each award period.
The following assumptions were used as of December 31, 2008 for the Monte Carlo model to value the liability components of the peer group measured performance share awards. The equity portion of the award was valued on the date of grant using the Monte Carlo model and this portion was not marked to market.
| December 31, 2008 | ||
Risk Free Rate of Return | 0.4% - 0.8% | |
Stock Price Volatility | 61.8% - 81.9% | |
Expected Dividend | 0.5% |
The Monte Carlo value per share for the liability component for all outstanding market condition performance share awards ranged from $9.84 to $17.42 at December 31, 2008. The long-term liability for all market condition performance share awards, included in Other Liabilities in the Consolidated Balance Sheet, at December 31, 2008 and 2007 was $0.3 million and $0.2 million, respectively. The short-term liability, included in Accrued Liabilities in the Consolidated Balance Sheet, at December 31, 2008 and 2007, for certain market condition performance share awards was $2.5 million and $5.5 million, respectively.
On December 31, 2008, the performance period ended for two types of performance shares awarded in 2006, including 155,800 shares measured based on internal performance metrics of the Company and 105,800 shares measured based on the Company’s performance against a peer group. For the internal performance metric awards, the calculation of the average of the three years of the Company’s three internal performance metrics was completed in the first quarter of 2009 and was certified by the Compensation Committee in February 2009. As the Company achieved the three internal performance metrics, 100% of the award, valued at $3.7 million based on the average of the high and low stock price on the grant date, was payable in 155,800 shares of common stock. For the peer group awards, due to the ranking of the Company compared to its peers in its predetermined peer group, 100% of the award, valued at $1.7 million based on the Monte Carlo value on the grant date, was payable in 105,800 shares of common stock and an additional 67%, equal to two-thirds of the total value of the award, calculated by using the high and low stock price on December 31, 2008 multiplied by the number of performance shares earned, or $1.8 million, was payable in cash. This cash amount was paid in January 2009. The calculation of the award payout was certified by the Compensation Committee on January 5, 2009. The vesting of both types of shares discussed above will be reported in the first quarter of 2009.
The following table is a summary of performance share award activity for the year ended December 31, 2008:
Performance Share Awards | Shares | Weighted-Average Grant Date Fair Value per share(1) | Weighted-Average Remaining Contractual Term (in years) | Aggregate Intrinsic Value (in thousands)(2) | |||||||
Non-vested shares outstanding at December 31, 2007 | 867,700 | $ | 25.38 | ||||||||
Granted | 383,065 | 46.63 | |||||||||
Vested | (249,990 | ) | 18.55 | ||||||||
Forfeited | (37,000 | ) | 36.60 | ||||||||
Non-vested shares outstanding at December 31, 2008 | 963,775 | $ | 35.17 | 1.6 | $ | 25,058 | |||||
(1) | The fair value figures in this table represent the fair value of the equity component of the performance share awards. |
(2) | The aggregate intrinsic value of performance share awards is calculated by multiplying the closing market price of the Company’s stock on December 31, 2008 by the number of non-vested performance share awards outstanding. |
Index to Financial Statements
Of the performance shares that vested during 2008 shown in the table above, 207,800 shares were granted in 2005 and were market condition awards which provided that employees may receive an aggregate of up to 100% of a share of common stock payable in common stock plus up to 100% of the fair market value of a share of common stock payable in cash. As a result of the Company’s ranking on the vesting date, 100% of the shares were paid in common stock and an additional 67% of the fair market value of each share of common stock, or $7.9 million, was paid in cash during the second quarter of 2008. Another 30,790 shares vested during 2008 and represent one-third of the three-year graded vesting schedule performance share awards granted in 2007 with a grant date per share value of $35.22. These awards met the performance criteria that the Company had positive operating income for the 2007 year. The remaining 11,400 shares vested as a result of the death of an employee of the Company.
During the year ended December 31, 2007, 387,100 performance share awards were granted with a weighted-average grant date fair value per share of $34.08. During the year ended December 31, 2006, 285,500 performance share awards were granted with a weighted-average grant date fair value per share of $21.07. During the year ended December 31, 2007, 450,000 performance shares vested related to the performance period commencing on January 1, 2004 and ending on December 31, 2007. During the year ended December 31, 2006, 30,600 performance shares vested as a result of the death of one of the Company’s officers. During 2007 and 2006, 9,500 and 7,100 performance shares, respectively, were forfeited.
Total unamortized compensation cost related to the equity component of performance shares at December 31, 2008 was $13.5 million and will be recognized over the next 1.6 years, computed by using the weighted-average of the time in years remaining to recognize unamortized expense. Total compensation cost recognized for both the equity (including the cumulative effect) and liability components of performance share awards during the years ended December 31, 2008, 2007 and 2006 was $14.5 million, $9.4 million and $12.9 million, respectively.
10.Supplemental Employee Incentive Plans
On January 16, 2008, the Company’s Board of Directors adopted a Supplemental Employee Incentive Plan. The plan was intended to provide a compensation tool tied to stock market value creation to serve as an incentive and retention vehicle for full-time non-officer employees by providing for cash payments in the event the Company’s common stock reaches a specified trading price.
The bonus payout was triggered if, for any 20 trading days (which need not be consecutive) that fell within a period of 60 consecutive trading days occurring on or before November 1, 2011, the closing price per share of the Company’s common stock equaled or exceeded the price goal of $60 per share. In such event, the 20th trading day on which such price condition was attained is the “Final Trigger Date.” Under the plan, each eligible employee would receive a minimum distribution of 50% of his or her base salary as of the Final Trigger Date, as adjusted for persons hired after December 31, 2007 to reflect calendar quarters of service, reduced by any interim distribution previously paid to such employee upon the achievement of the interim price goal discussed below. The Committee was authorized, in its discretion, to allocate to eligible employees additional distributions, subject to limitations of the plan.
The plan also provided that an interim distribution would be paid to eligible employees upon achieving the interim price goal of $50 per share prior to December 31, 2009. Interim distributions were determined as described above except that interim distributions were based on 10%, rather than 50%, of salary.
On the January 16, 2008 adoption date of the plan, the Company’s closing stock price was $40.71. On April 8, 2008 and subsequently on June 2, 2008, the Company achieved the interim and final target goals and total distributions of $15.7 million were paid in 2009. No further distributions will be made under this plan.
Index to Financial Statements
On July 24, 2008, the Company’s Board of Directors adopted a second Supplemental Employee Incentive Plan (“Plan II”). Plan II is also intended to provide a compensation tool tied to stock market value creation to serve as an incentive and retention vehicle for full-time non-officer employees by providing for cash payments in the event the Company’s common stock reaches a specified trading price.
Plan II provides for a final payout if, for any 20 trading days (which need not be consecutive) that fall within a period of 60 consecutive trading days ending on or before June 20, 2012, the closing price per share of the Company’s common stock equals or exceeds the price goal of $105 per share. In such event, the 20th trading day on which such price condition is attained is the “Final Trigger Date.” The price goal is subject to adjustment by the Compensation Committee to reflect any stock splits, stock dividends or extraordinary cash distributions to stockholders. Under Plan II, each eligible employee may receive (upon approval by the Compensation Committee) a distribution of 50% of his or her base salary as of the Final Trigger Date (or 30% of base salary if the Company paid interim distributions upon the achievement of the interim price goal discussed below).
Plan II provides that a distribution of 20% of an eligible employee’s base salary as of the Interim Trigger Date will be made (upon approval by the Compensation Committee) upon achieving the interim price goal of $85 per share on or before June 30, 2010. Interim distributions are determined as described above except that interim distributions will be based on 20%, rather than 50%, of salary. The Compensation Committee can increase the 50% or 20% payment as it applies to any employee.
Payments under either the interim or final distribution will occur as follows:
• | 25% of the total distribution paid on the 15th business day following the interim or final trigger date, as applicable, and |
75% of the total distribution paid based on the following deferred payment dates in the table below:
Period During which the Trigger Date Occurs | Deferred Payment Date | |
July 1, 2008 to June 30, 2009 | The business day on or next following the 18 month anniversary of the applicable Trigger Date | |
July 1, 2009 to June 30, 2010 | The business day on or next following the 12 month anniversary of the applicable Trigger Date | |
July 1, 2010 to December 31, 2010 | The business day on or next following the 6 month anniversary of the applicable Trigger Date | |
January 1, 2011 to June 30, 2012 | No deferral; entire payment is made on the 15th business day following the applicable Trigger Date |
Any deferred portion will only be paid if the participant is employed by the Company, or has terminated employment by reason of retirement, death or disability (as provided in Plan II). Payments are subject to certain other restrictions contained in Plan II.
These awards under both plans discussed above have been accounted for as liability awards under SFAS No. 123(R), and the total expense for 2008 was $15.9 million.
11. Financial Instruments
Adoption of SFAS No. 157
In September 2006, the FASB issued SFAS No. 157, “Fair Value Measurements,” which establishes a formal framework for measuring fair values of assets and liabilities in financial statements that are already required by United States generally accepted accounting principles to be measured at fair value. SFAS No. 157 clarifies guidance in FASB Concepts Statement (CON) No. 7 which discusses present value techniques in measuring fair value. Additional disclosures are also required for transactions measured at fair value. SFAS
Index to Financial Statements
No. 157 is effective for fiscal years beginning after November 15, 2007, and interim periods within those fiscal years. In February 2008, the FASB issued FSP No. FAS 157-2, “Effective Date of FASB Statement No. 157,” which granted a one year deferral (to fiscal years beginning after November 15, 2008, and interim periods within those fiscal years) for certain non-financial assets and liabilities to comply with SFAS No. 157. The Company adopted the provisions of FAS No. 157 covered under FSP No. 157-2 on January 1, 2009. The Company is currently evaluating the impact of implementation with respect to nonfinancial assets and liabilities measured on a nonrecurring basis on its consolidated financial statements, which will primarily be limited to asset impairments including goodwill, other long-lived assets, asset retirement obligations and assets acquired and liabilities assumed in a business combination, if any. Additionally, in February 2008, the FASB issued FSP No. FAS 157-1, “Application of FASB Statement No. 157 to FASB Statement No. 13 and Other Accounting Pronouncements That Address Fair Value Measurements for Purposes of Lease Classification or Measurement under Statement 13,” which amends SFAS No. 157 to exclude SFAS No. 13 and related pronouncements that address fair value measurements for purposes of lease classification and measurement. FSP No. FAS 157-1 is effective upon the initial adoption of SFAS No. 157. The Company has adopted SFAS No. 157 and FSP No. FAS 157-1 discussed above, and there was no impact on its financial position or results of operations for the year ended December 31, 2008.
In October 2008, the FASB issued FSP No. FAS 157-3, “Estimating the Fair Value of a Financial Asset in a Market That Is Not Active” to amend SFAS No. 157 to provide guidance regarding how to determine the fair value of a financial asset when there is no active market for the asset at the measurement date. FSP No. FAS 157-3 clarifies how management’s internal assumptions, such as internal cash flow and discount rate assumptions, should be considered in measuring fair value when observable data are not present. In addition, observable market information from an inactive market should be considered to determine fair value, and it is inappropriate to conclude that all market activity represents forced liquidations or distressed sales or to conclude that any transaction price can determine fair value. The use of broker quotes and pricing services should also be considered to assess the relevance of observable and unobservable data. When valuing financial assets, significant judgment is required. FSP No. FAS 157-3 was effective upon issuance and has been considered in conjunction with the Company’s 2008 financial reporting and results; there was no material impact on the Company’s financial position or results of operations for the year ended December 31, 2008.
As defined in SFAS No. 157, fair value is the price that would be received to sell an asset or paid to transfer a liability in an orderly transaction between market participants at the measurement date (exit price). The transaction is based on a hypothetical transaction in the principal or most advantageous market considered from the perspective of the market participant that holds the asset or owes the liability.
The valuation techniques that can be used under SFAS No. 157 are the market approach, income approach or cost approach. The market approach uses prices and other information for market transactions involving identical or comparable assets or liabilities, such as matrix pricing. The income approach uses valuation techniques to convert future amounts to a single discounted present value amount based on current market conditions about those future amounts, such as present value techniques, option pricing models (i.e. Black-Scholes model) and binomial models (i.e. Monte-Carlo model). The cost approach is based on current replacement cost to replace an asset.
The Company utilizes market data or assumptions that market participants who are independent, knowledgeable and willing and able to transact would use in pricing the asset or liability, including assumptions about risk and the risks inherent in the inputs to the valuation technique. These inputs can be readily observable, market corroborated or generally unobservable. The Company attempts to utilize valuation techniques that maximize the use of observable inputs and minimize the use of unobservable inputs. The Company is able to classify fair value balances based on the observability of those inputs. SFAS No. 157 establishes a formal fair value hierarchy based on the inputs used to measure fair value. The hierarchy gives the highest priority to level 1 measurements and the lowest priority to level 3 measurements, and accordingly, level 1 measurements should be used whenever possible.
Index to Financial Statements
The three levels of the fair value hierarchy as defined by SFAS No. 157 are as follows:
Level 1: Valuations utilizing quoted, unadjusted prices for identical assets or liabilities in active markets that the Company has the ability to access. This is the most reliable evidence of fair value and does not require a significant degree of judgment. Examples include exchange-traded derivatives and listed equities that are actively traded.
Level 2: Valuations utilizing quoted prices in markets that are not considered to be active or financial instruments for which all significant inputs are observable, either directly or indirectly for substantially the full term of the asset or liability. Financial instruments that are valued using models or other valuation methodologies are included. Models used should primarily be industry-standard models that consider various assumptions and economic measures, such as interest rates, yield curves, time value, volatilities, contract terms, current market prices, credit risk or other market-corroborated inputs. Examples include most over-the-counter derivatives (non-exchange traded), physical commodities, most structured notes and municipal and corporate bonds.
Level 3: Valuations utilizing significant, unobservable inputs. This provides the least objective evidence of fair value and requires a significant degree of judgment. Inputs may be used with internally developed methodologies and should reflect an entity’s assumptions using the best information available about the assumptions that market participants would use in pricing an asset or liability. Examples include certain corporate loans, real-estate and private equity investments and long-dated or complex over-the-counter derivatives.
Depending on the particular asset or liability, input availability can vary depending on factors such as product type, longevity of a product in the market and other particular transaction conditions. In some cases, certain inputs used to measure fair value may be categorized into different levels of the fair value hierarchy. For disclosure purposes under SFAS No. 157, the lowest level that contains significant inputs used in valuation should be chosen. Per SFAS No. 157, the Company has classified its assets and liabilities into these levels depending upon the data relied on to determine the fair values. The fair values of the Company’s natural gas and crude oil price collars and swaps are designated as Level 3.
The following fair value hierarchy table presents information about the Company’s assets and liabilities measured at fair value on a recurring basis as of December 31, 2008:
| Quoted Prices in Active Markets for Identical Assets (Level 1) | Significant Other Observable Inputs (Level 2) | Significant Unobservable Inputs (Level 3) | Balance as of December 31, 2008 | |||||||||
| (In thousands) | ||||||||||||
Assets | ||||||||||||
Rabbi Trust Deferred Compensation Plan | $ | 8,651 | $ | — | $ | — | $ | 8,651 | ||||
Derivative Contracts | — | — | 355,202 | 355,202 | ||||||||
Total Assets | $ | 8,651 | $ | — | $ | 355,202 | $ | 363,853 | ||||
Liabilities | ||||||||||||
Rabbi Trust Deferred Compensation Plan | $ | 14,531 | $ | — | $ | — | $ | 14,531 | ||||
Derivative Contracts | — | — | — | — | ||||||||
Total Liabilities | $ | 14,531 | $ | — | $ | — | $ | 14,531 | ||||
The determination of the fair values above incorporates various factors required under SFAS No. 157. These factors include not only the credit standing of the counterparties involved in transactions with the Company resulting in receivables on the Company’s Consolidated Balance Sheet, but also the impact of the Company’s nonperformance risk on its liabilities.
Index to Financial Statements
The following table sets forth a reconciliation of changes for year ended December 31, 2008 in the fair value of financial assets and liabilities classified as Level 3 in the fair value hierarchy:
| (In thousands) | ||||
Balance as of December 31, 2007 | $ | 7,272 | (1) | |
Total Gains or (Losses) (Realized or Unrealized): | ||||
Included in Earnings(2) | 13,021 | |||
Included in Other Comprehensive Income | 347,930 | |||
Purchases, Issuances and Settlements | (13,021 | ) | ||
Transfers In and/or Out of Level 3 | — | |||
Balance as of December 31, 2008 | $ | 355,202 | ||
(1) | Net derivatives for Level 3 at December 31, 2007 included derivative assets of $12.7 million and derivative liabilities of $5.4 million. |
(2) | All gains included in earnings were realized. |
The derivative contracts were measured based on quotes from the Company’s counterparties. Such quotes have been derived using a Black-Scholes model that considers various inputs including current market and contractual prices for the underlying instruments, quoted forward prices for natural gas and crude oil, volatility factors and interest rates, such as a LIBOR curve for a similar length of time as the derivative contract term. Although the Company utilizes multiple quotes to assess the reasonableness of its values, the Company has not attempted to obtain sufficient corroborating market evidence to support classifying these derivative contracts as Level 2. The Company measured the nonperformance risk of its counterparties by reviewing credit default swap spreads for the various financial institutions in which it has derivative transactions. The resulting reduction to the net receivable derivative contract position was $5.1 million. In times where the Company has net derivative contract liabilities, the nonperformance risk of the Company is evaluated using a market credit spread provided by the Company’s bank.
Fair Market Value of Financial Instruments
The estimated fair value of financial instruments is the amount at which the instrument could be exchanged currently between willing parties. The carrying amounts reported in the consolidated balance sheetConsolidated Balance Sheet for cash and cash equivalents, accounts receivable and accounts payable approximate fair value. The fair value of long-term debt is the estimated cost to acquire the debt, including a credit spread for the difference between the issue rate and the year end market rate. The credit spread is the Company’s default or repayment risk. The credit spread (premium or discount) is determined by comparing the Company’s fixed-rate notes to new issues (secured and unsecured) and secondary trades of similar size and credit statistics for both public and private debt. The fair value of all of the notes, excluding the credit facility, are based on interest rates currently available to the Company. The credit facility approximates fair value because this instrument bears interest at rates based on current market rates.
The Company uses available marketingmarket data and valuation methodologies to estimate the fair value of debt. This disclosure is presented in accordance with SFAS No. 107, “Disclosures about Fair Value of Financial Instruments” as well as SFAS No. 157, “Fair Value Measurements” and does not impact the Company’s financial position, results of operations or cash flows.
Long-Term Debt
| December 31, 2005 | December 31, 2004 | |||||||||||
| (In thousands) | Carrying Amount | Estimated Fair Value | Carrying Amount | Estimated Fair Value | ||||||||
Debt | ||||||||||||
7.19% Notes | $ | 60,000 | $ | 62,938 | $ | 80,000 | $ | 87,770 | ||||
7.26% Notes | 75,000 | 81,713 | 75,000 | 85,849 | ||||||||
7.36% Notes | 75,000 | 83,990 | 75,000 | 87,111 | ||||||||
7.46% Notes | 20,000 | 23,083 | 20,000 | 23,804 | ||||||||
Credit Facility | 90,000 | 90,000 | — | — | ||||||||
| $ | 320,000 | $ | 341,724 | $ | 250,000 | $ | 284,534 | |||||
The fair value of long-term debt is the estimated cost
Index to acquire the debt, including a premium or discount for the difference between the issue rate and the year end market rate. The fair value of the 7.19% Notes, the 7.26% Notes, the 7.36% Notes and the 7.46% Notes is based on interest rates currently available to the Company. The credit facility approximates fair value because this instrument bears interest at rates based on current market rates.Financial Statements
| December 31, 2008 | December 31, 2007 | |||||||||||||||
| Carrying Amount | Estimated Fair Value | Carrying Amount | Estimated Fair Value | |||||||||||||
| (In thousands) | ||||||||||||||||
Long-Term Debt | $ | 867,000 | $ | 807,508 | $ | 350,000 | $ | 364,500 | ||||||||
Current Maturities | (35,857 | ) | (35,796 | ) | (20,000 | ) | (20,466 | ) | ||||||||
Long-Term Debt, excluding Current Maturities | $ | 831,143 | $ | 771,712 | $ | 330,000 | $ | 344,034 | ||||||||
Derivative Instruments and Hedging Activity
The Company periodically enters into derivative commodity instruments to hedge its exposure to price fluctuations on natural gas and crude oil production. UnderThe Company’s credit agreement restricts the ability of the Company to enter into commodity hedges other than to hedge or mitigate risks to which the Company has actual or projected exposure or as permitted under the Company’s revolving credit agreement,risk management policies and not subjecting the aggregate level of commodity hedging must not exceed 100% of the anticipated future equivalent production during the period covered by these cash flow hedges.Company to material speculative risks. At December 31, 2005,2008, the Company had nine26 cash flow hedges open: eight14 natural gas price collar arrangements, 10 natural gas price swap arrangements and onetwo crude oil collar arrangement.price swap arrangements. At December 31, 2005,2008, a $20.7$355.2 million ($12.9223.1 million, net of tax) unrealized lossgain was recorded toin Accumulated Other Comprehensive Income / (Loss), along with a $22.4 million short-term derivative liability and a $1.7$264.7 million short-term derivative receivable which is shown in Other Current Assets on the Balance Sheet.and a $90.5 million long-term derivative receivable. The change in the fair value of derivatives designated as hedges that is effective is initially recorded to Accumulated Other Comprehensive Income.Income / (Loss). The ineffective portion if any, of the change in the fair value of derivatives designated as hedges, and the change in fair value of all other derivatives, isare recorded currently in earnings as a component of Natural Gas Production and Crude Oil and Condensate Revenue, as appropriate.
Assuming no change in commodity prices, after For the years ended December 31, 20052008, 2007 and 2006, there was no ineffectiveness recorded in the Consolidated Statement of Operations.
During the second quarter of 2008, in anticipation of the east Texas acquisition, the Company entered into 12 contracts for natural gas price swaps and three contracts for crude oil swaps (2009 and 2010 contracts included in the amounts discussed above) for the remainder of 2008 and extending through 2010 for the purpose of reducing commodity price risk associated with anticipated production after the transaction closing.
Based upon estimates at December 31, 2008, the Company would expect to reclassify to the Consolidated Statement of Operations, over the next 12 months, $12.9$166.2 million in after-tax chargesincome associated with commodity hedges. This reclassification represents the net liabilityshort-term receivable associated with open positions currently not reflected in earnings at December 31, 20052008 related to anticipated 20062009 production.
Hedges on Production - Production—Swaps
From time to time, the Company enters into natural gas and crude oil swap agreements with counterparties to hedge price risk associated with a portion of its production. These derivativescash flow hedges are not held for trading purposes. Under these price swaps, the Company receives a fixed price on a notional quantity of natural gas andor crude oil in exchange for paying a variable price based on a market-based index, such as the NYMEX gas and crude oil futures.
During 2005,2008, natural gas price swaps covered 20,5579,821 Mmcf, or 28%11%, of the Company’s 2008 gas production fixing the sales price of this gas at an average price of $5.14$10.27 per Mcf. During 2008, the Company entered into natural gas price swaps covering a portion of its anticipated 2008, 2009 and 2010 production, including production related to the east Texas acquisition.
Index to Financial Statements
At December 31, 2005,2008, the Company had no open natural gas price swap contracts covering 2006 production.a portion of its anticipated 2009 and 2010 production as follows:
From time to time,
| Natural Gas Price Swaps | ||||||||
Contract Period | Volume in Mmcf | Weighted- Average Contract Price (per Mcf) | Net Unrealized Gain (In thousands) | |||||
Year Ended December 31, 2009 | 16,079 | $ | 12.18 | $ | 90,267 | |||
Year Ended December 31, 2010 | 19,295 | $ | 11.43 | $ | 70,345 | |||
The Company had one crude oil price swap covering 92 Mbbl, or 12%, of its 2008 production at a price of $127.15 per Bbl. During 2008, the Company entersentered into natural gas and crude oil derivative arrangements that do not qualify for hedge accounting under SFAS No. 133. These financial instruments are recorded at fair value at the balance sheet date.price swaps covering a portion of its anticipated 2008, 2009 and 2010 production. At December 31, 2005,2008, the Company did not have anyhad open crude oil price swap contracts covering a portion of these types of arrangements.its anticipated 2009 and 2010 production as follows:
| Crude Oil Price Swaps | ||||||||
Contract Period | Volume in Mbbl | Contract Price (per Bbl) | Net Unrealized Gain (In thousands) | |||||
Year Ended December 31, 2009 | 365 | $ | 125.25 | $ | 25,656 | |||
Year Ended December 31, 2010 | 365 | $ | 125.00 | $ | 21,840 | |||
Hedges on Production - Production—Options
From time to time, the Company enters into natural gas and crude oil collar agreements with counterparties to hedge price risk associated with a portion of its production. These cash flow hedges are not held for trading purposes. Under the collar arrangements, if the index price rises above the ceiling price, the Company pays the counterparty. If the index price falls below
the floor price, the counterparty pays the Company. During 2005,2008, natural gas price collars covered 15,15754,173 Mmcf of the Company’s gas production, or 21%60% of gas production with a weighted averageweighted-average floor of $5.59$8.53 per Mcf and a weighted averageweighted-average ceiling of $8.61$10.70 per Mcf. During 2005, an oil price collar covered 365 Mbbl of the Company’s crude oil production, or 21% of crude oil production with a weighted average floor of $40.00 per Mbbl and a weighted average ceiling of $50.50 per Mbbl.
At December 31, 2005,2008, the Company had open natural gas price collar contracts covering a portion of its 2006anticipated 2009 production as follows:
| Natural Gas Price Collars | |||||||||
Contract Period | Volume in Mmcf | Weighted Ceiling / Floor | Net Unrealized (In thousands) | ||||||
As of December 31, 2005 | |||||||||
First Quarter 2006 | 6,702 | $ | 12.74 /$8.25 | ||||||
Second Quarter 2006 | 6,776 | 12.74 / 8.25 | |||||||
Third Quarter 2006 | 6,850 | 12.74 / 8.25 | |||||||
Fourth Quarter 2006 | 6,851 | 12.74 / 8.25 | |||||||
Full Year 2006 | 27,179 | $ | 12.74 /$8.25 | $ | (20,425 | ) | |||
At December 31, 2005, the Company had one open crude
| Natural Gas Price Collars | ||||||||
Contract Period | Volume in Mmcf | Weighted- Average Ceiling/ Floor (per Mcf) | Net Unrealized Gain (In thousands) | |||||
Year Ended December 31, 2009 | 47,253 | $ | 12.39 / $9.40 | $ | 152,191 | |||
During 2008, an oil price collar contract coveringcovered 366 Mbbls of the Company’s crude oil production, or 47% of its 2006crude oil production, as follows:with a floor of $60.00 per Bbl and a ceiling of $80.00 per Bbl.
| Crude Oil Price Collar | |||||||||
Contract Period | Volume in Mbbl | Weighted Average Ceiling /Floor | Net (In thousands) | ||||||
As of December 31, 2005 | |||||||||
First Quarter 2006 | 90 | $ | 76.00 /$50.00 | ||||||
Second Quarter 2006 | 91 | 76.00 / 50.00 | |||||||
Third Quarter 2006 | 92 | 76.00 / 50.00 | |||||||
Fourth Quarter 2006 | 92 | 76.00 / 50.00 | |||||||
Full Year 2006 | 365 | $ | 76.00 /$50.00 | $ | (317 | ) | |||
The Company is exposed to market risk on these open contracts, to the extent of changes in market prices of natural gas and crude oil. However, the market risk exposure on these hedged contracts is generally offset by the gain or loss recognized upon the ultimate sale of the commodity that is hedged.
The amounts set forth under the net unrealized gain columns in the tables above represent the Company’s total unrealized gain position at December 31, 2008. Also impacting the total unrealized net gain (reflecting the net receivable position) in accumulated other comprehensive income / (loss) in the Consolidated Balance Sheet is a reduction of $5.1 million related to the Company’s assessment of its counterparties’ nonperformance risk. This risk was evaluated by reviewing credit default swap spreads for the various financial institutions in which the Company has derivative transactions.
Index to Financial Statements
The preceding paragraphs contain forward-looking information concerning future production and projected gains and losses, which may be impacted both by production and by changes in the future market prices of energy commodities. See “Forward-Looking Information” for further details.
Market Risk
The Company’s primary market risk is exposure to oil and natural gas prices. Realized prices are mainly driven by worldwide prices for oil and spot market prices for North American natural gas production. Commodity prices are volatile and unpredictable.
The debt and equity markets have recently experienced unfavorable conditions, which may affect the Company’s ability to access those markets. As a result of the volatility and disruption in the capital markets and the Company’s increased level of borrowings, it may experience increased costs associated with future borrowings and debt issuances. At this time, the Company does not believe its liquidity has been materially affected by the recent market events. The Company will continue to monitor events and circumstances surrounding each of its lenders in its revolving credit facility.
Credit Risk
Although notional contract amounts are used to express the volume of natural gas price agreements, the amounts that can be subject to credit risk in the event of non-performance by third parties are substantially smaller. The Company does not anticipate any material impact on its financial results due to non-performance by the third parties.
In each of 2005, 2004 and 2003,2008, one customer accounted for approximately 11%16% of the Company’s total sales were made to onesales. In 2007 and 2006, no customer accounted for more than 10% of the Company’s total sales.
11. Adoption of SFAS 143, “Accounting for12. Asset Retirement Obligations”
Effective January 1, 2003, theThe Company adopted SFAS No. 143, “Accounting for Asset Retirement Obligations.” SFAS No. 143 requires thatrecords the fair value of a liability for an asset retirement obligation be recognized in the period in which it is incurred if a reasonable estimate of fair value can be made. The associated asset retirement cost is capitalized as part of the carrying amount of the long-lived asset. Subsequently, the asset retirement cost is allocated to expense using a systematic and rational method over the assets useful life. The adoption of SFAS No. 143 resulted in an increase of total liabilities because additional retirement obligations are required to be recognized, an increase in the recognized cost of assets because the retirement costs are added to the carrying amount of the long-lived
asset and an increase in operating expense because of the accretion of the retirement obligation and additional depreciation and depletion. The majority of the asset retirement obligations recorded by the Company relate to the plugging and abandonment of oil and gas wells. However, liabilities willare also be recorded for meter stations, pipelines, processing plants and compressors. At December 31, 20052008, there arewere no assets legally restricted for purposes of settling asset retirement obligations. The Company recorded a net-of-tax charge for the cumulative effect of change in accounting principle, in January of 2003, of approximately $6.8 million ($11.0 million before tax) and recorded a retirement obligation of approximately $35.2 million. There was no impact on the Company’s cash flows as a result of adopting SFAS No. 143.
Additional retirement obligations increase the liability associated with new oil and gas wells and other facilities as these obligations are incurred. Accretion expense for the years ended December 31, 2005, 20042008, 2007 and 20032006 was $1.2 million, $1.1 million and $1.4 million, $1.7 millionrespectively, and $2.1 million, respectively.was included within Depreciation, Depletion and Amortization expense on the Company’s Consolidated Statement of Operations.
The following table reflects the changes of the asset retirement obligations during the current period.
| (In thousands) | ||||
Carrying amount of asset retirement obligations at December 31, 2004 | $ | 40,375 | ||
Liabilities added during the current period | 1,364 | |||
Liabilities settled during the current period | (110 | ) | ||
Current period accretion expense | 1,419 | |||
Revisions to estimated cash flows | (57 | ) | ||
Carrying amount of asset retirement obligations at December 31, 2005 | $ | 42,991 | ||
| (In thousands) | ||||
Carrying amount of asset retirement obligations at December 31, 2007 | $ | 24,724 | ||
Liabilities added during the current period | 2,157 | |||
Liabilities settled during the current period | (101 | ) | ||
Current period accretion expense | 1,198 | |||
Carrying amount of asset retirement obligations at December 31, 2008 | $ | 27,978 | ||
Index to Financial Statements
12.13. Earnings per Common Share
Basic earnings per common share (EPS) is computed by dividing net income (the numerator) by the weighted averageweighted-average number of common shares outstanding for the period (the denominator). Diluted EPS is similarly calculated using the treasury stock method except that the denominator is increased using the treasury stock method to reflect the potential dilution that could occur if outstanding stock options and stock awards outstanding at the end of the applicable period were exercised for common stock.
The following is a calculation of basic and diluted weighted averageweighted-average shares outstanding for the yearyears ended December 31, 2005, 20042008, 2007 and 2003:2006:
| December 31, | ||||||
| 2005 | 2004 | 2003 | ||||
Shares - basic | 48,856,491 | 48,732,504 | 48,074,496 | |||
Dilution effect of stock options and awards at end of period | 868,904 | 606,297 | 360,932 | |||
Shares - diluted | 49,725,395 | 49,338,801 | 48,435,428 | |||
Stock awards and shares excluded from diluted earnings per share due to the anti-dilutive effect | — | — | 1,448,666 | |||
| December 31, | ||||||
| 2008 | 2007 | 2006 | ||||
Weighted-Average Shares—Basic | 100,736,562 | 96,977,634 | 96,803,283 | |||
Dilution Effect of Stock Options and Awards at End of Period | 989,936 | 1,152,673 | 1,797,700 | |||
Weighted-Average Shares—Diluted | 101,726,498 | 98,130,307 | 98,600,983 | |||
Weighted-Average Stock Awards and Shares | ||||||
Excluded from Diluted Earnings per Share due to the Anti-Dilutive Effect | 258,074 | 21,639 | — | |||
14. Accumulated Other Comprehensive Income / (Loss)
Changes in the components of accumulated other comprehensive income / (loss), net of taxes, for the years ended December 31, 2008, 2007 and 2006 were as follows:
Accumulated Other Comprehensive Income / (Loss), net of taxes | Net Gains /(Losses) on Cash Flow Hedges | Defined Benefit Pension and Postretirement Plans | Foreign Currency Translation Adjustment | Total | ||||||||||||
Balance at December 31, 2005 | $ | (12,860 | ) | $ | (3,170 | ) | $ | 915 | $ | (15,115 | ) | |||||
Net change in unrealized gains on cash flow hedges, net of taxes of $(38,625) | 64,099 | — | — | 64,099 | ||||||||||||
Net change in minimum pension liability, net of taxes of $(1,848) | — | 3,081 | — | 3,081 | ||||||||||||
Effect of adoption of SFAS No. 158, net of taxes of $8,447 | — | (14,079 | ) | — | (14,079 | ) | ||||||||||
Change in foreign currency translation adjustment, net of taxes of $507 | — | — | (826 | ) | (826 | ) | ||||||||||
Balance at December 31, 2006 | $ | 51,239 | $ | (14,168 | ) | $ | 89 | $ | 37,160 | |||||||
Net change in unrealized gains on cash flow hedges, net of taxes of $28,024 | (46,686 | ) | — | — | (46,686 | ) | ||||||||||
Net change in defined benefit pension and postretirement plans, net of taxes of $(100) | — | 141 | — | 141 | ||||||||||||
Change in foreign currency translation adjustment, net of taxes of $(5,072) | — | — | 8,491 | 8,491 | ||||||||||||
Balance at December 31, 2007 | $ | 4,553 | $ | (14,027 | ) | $ | 8,580 | $ | (894 | ) | ||||||
Net change in unrealized gain on cash flow hedges, net of taxes of $(129,415) | 218,515 | — | — | 218,515 | ||||||||||||
Net change in defined benefit pension and postretirement plans, net of taxes of $9,235 | — | (15,581 | ) | — | (15,581 | ) | ||||||||||
Change in foreign currency translation adjustment, net of taxes of $9,292 | — | — | (15,614 | ) | (15,614 | ) | ||||||||||
Balance at December 31, 2008 | $ | 223,068 | $ | (29,608 | ) | $ | (7,034 | ) | $ | 186,426 | ||||||
Index to Financial Statements
SUPPLEMENTAL OIL AND GAS INFORMATION (UNAUDITED)
Oil and Gas Reserves
Users of this information should be aware that the process of estimating quantities of “proved” and “proved developed” natural gas and crude oil reserves is very complex, requiring significant subjective decisions in the evaluation of all available geological, engineering and economic data for each reservoir. The data for a given reservoir may also change substantially over time as a result of numerous factors including, but not limited to, additional development activity, evolving production history and continual reassessment of the viability of production under varying economic conditions. As a result, revisions to existing reserve estimates may occur from time to time. Although every reasonable effort is made to ensure that reserve estimates reported represent the most accurate assessments possible, the subjective decisions and variances in available data for various reservoirs make these estimates generally less precise than other estimates included in the financial statement disclosures.
Proved reserves represent estimated quantities of natural gas, crude oil and condensate that geological and engineering data demonstrate, with reasonable certainty, to be recoverable in future years from known reservoirs under economic and operating conditions in effect when the estimates were made.
Proved developed reserves are proved reserves expected to be recovered through wells and equipment in place and under operating methods used when the estimates were made.
Estimates of proved and proved developed reserves at December 31, 2005, 2004,2008, 2007, and 20032006 were based on studies performed by the Company’s petroleum engineering staff. The estimates were computed based on year end prices for oil, natural gas, and natural gas liquids. The estimates were reviewed by Miller and Lents, Ltd., who indicated in their letter dated February 3, 2006,January 30, 2009, that based on their investigation and subject to the limitations described in their letter, they believe the results of those estimates and projections were reasonable in the aggregate.
No major discovery or other favorable or unfavorable event after December 31, 2005,2008, is believed to have caused a material change in the estimates of proved or proved developed reserves as of that date.
The following table illustrates the Company’s net proved reserves, including changes, and proved developed reserves for the periods indicated, as estimated by the Company’s engineering staff.
| Natural Gas | Natural Gas | |||||||||||||||||
| December 31, | December 31, | |||||||||||||||||
| (Millions of cubic feet) | 2005 | 2004 | 2003 | |||||||||||||||
| 2008 | 2007 | 2006 | ||||||||||||||||
| (Millions of cubic feet) | ||||||||||||||||||
Proved Reserves | ||||||||||||||||||
Beginning of Year | 1,134,081 | 1,069,484 | 1,060,959 | 1,559,953 | 1,368,293 | 1,262,096 | ||||||||||||
Revisions of Prior Estimates | (1,543 | ) | (7,850 | ) | (6,122 | ) | ||||||||||||
Revisions of Prior Estimates(1) | (47,745 | ) | 2,604 | (17,675 | ) | |||||||||||||
Extensions, Discoveries and Other Additions | 185,884 | 140,986 | 105,497 | 297,089 | 265,830 | 246,197 | ||||||||||||
Production | (73,879 | ) | (72,833 | ) | (71,906 | ) | (90,425 | ) | (80,475 | ) | (79,722 | ) | ||||||
Purchases of Reserves in Place | 17,567 | 5,384 | 1,590 | 167,262 | 3,701 | 1,946 | ||||||||||||
Sales of Reserves in Place | (14 | ) | (1,090 | ) | (20,534 | ) | (141 | ) | — | (44,549 | ) | |||||||
End of Year | 1,262,096 | 1,134,081 | 1,069,484 | 1,885,993 | 1,559,953 | 1,368,293 | ||||||||||||
Proved Developed Reserves | 944,897 | 857,834 | 812,280 | 1,308,155 | 1,133,937 | 996,850 | ||||||||||||
Percentage of Reserves Developed | 74.9 | % | 75.6 | % | 76.0 | % | 69.4 | % | 72.7 | % | 72.9 | % | ||||||
(1) | The majority of the revisions were the result of the decrease in the natural gas price. |
Beginning of Year Revisions of Prior Estimates Extensions, Discoveries and Other Additions Production Purchases of Reserves in Place Sales of Reserves in Place End of Year Proved Developed Reserves Percentage of Reserves Developed Liquids December 31, (Thousands of barrels) 2005 2004 2003 Proved Reserves 11,384 12,103 18,393 1,073 185 307 334 1,074 1,723 (1,747 ) (2,002 ) (2,846 ) 419 24 — — — (5,474 ) 11,463 11,384 12,103 9,127 8,652 9,405 79.6 % 76.0 % 77.7 %
Index to Financial Statements
| Liquids | |||||||||
| December 31, | |||||||||
| 2008 | 2007 | 2006 | |||||||
| (Thousands of barrels) | |||||||||
Proved Reserves | |||||||||
Beginning of Year | 9,328 | 7,973 | 11,463 | ||||||
Revisions of Prior Estimates(1) | (1,593 | ) | 771 | 673 | |||||
Extensions, Discoveries and Other Additions | 1,134 | 1,381 | 1,066 | ||||||
Production | (794 | ) | (830 | ) | (1,415 | ) | |||
Purchases of Reserves in Place | 1,268 | 33 | 38 | ||||||
Sales of Reserves in Place | (2 | ) | — | (3,852 | ) | ||||
End of Year | 9,341 | 9,328 | 7,973 | ||||||
Proved Developed Reserves | 6,728 | 7,026 | 5,895 | ||||||
Percentage of Reserves Developed | 72.0 | % | 75.3 | % | 73.9 | % | |||
(1) | The majority of the revisions were the result of the decrease in the crude oil price. |
Capitalized Costs Relating to Oil and Gas Producing Activities
The following table illustrates the total amount of capitalized costs relating to natural gas and crude oil producing activities and the total amount of related accumulated depreciation, depletion and amortization.
| December 31, | December 31, | |||||||||||||||||
| (In thousands) | 2005 | 2004 | 2003 | |||||||||||||||
| 2008 | 2007 | 2006 | ||||||||||||||||
| (In thousands) | ||||||||||||||||||
Aggregate Capitalized Costs Relating to Oil and Gas Producing Activities | $ | 2,290,147 | $ | 1,933,848 | $ | 1,732,236 | $ | 4,465,630 | $ | 3,007,849 | $ | 2,462,693 | ||||||
Aggregate Accumulated Depreciation, Depletion and Amortization | 1,052,654 | 940,447 | 837,060 | 1,331,243 | 1,100,369 | 983,079 | ||||||||||||
Costs Incurred in Oil and Gas Property Acquisition, Exploration and Development Activities
Costs incurred in property acquisition, exploration and development activities were as follows:
| Year Ended December 31, | |||||||||
| (In thousands) | 2005 | 2004 | 2003 | ||||||
Property Acquisition Costs, Proved | $ | 73,127 | $ | 3,953 | $ | 1,524 | |||
Property Acquisition Costs, Unproved | 22,126 | 18,250 | 14,056 | ||||||
Exploration and Extension Well Costs(1) | 102,957 | 85,415 | 83,147 | ||||||
Development Costs | 208,124 | 136,311 | 77,006 | ||||||
Total Costs | $ | 406,334 | $ | 243,929 | $ | 175,733 | |||
| Year Ended December 31, | |||||||||
| 2008 | 2007 | 2006 | |||||||
| (In thousands) | |||||||||
Property Acquisition Costs, Proved | $ | 605,860 | $ | 3,982 | $ | 6,688 | |||
Property Acquisition Costs, Unproved | 152,666 | 22,186 | 42,551 | ||||||
Exploration Costs(1) | 89,020 | 70,242 | 109,525 | ||||||
Development Costs | 594,221 | 494,204 | 346,787 | ||||||
Total Costs | $ | 1,441,767 | $ | 590,614 | $ | 505,551 | |||
(1) | Includes administrative exploration costs of |
Index to Financial Statements
Historical Results of Operations from Oil and Gas Producing Activities
The results of operations for the Company’s oil and gas producing activities were as follows:
| Year Ended December 31, | |||||||||
| (In thousands) | 2005 | 2004 | 2003 | ||||||
Operating Revenues | $ | 581,849 | $ | 439,988 | $ | 404,503 | |||
Costs and Expenses | |||||||||
Production | 103,477 | 84,015 | 77,315 | ||||||
Other Operating | 30,120 | 27,787 | 20,090 | ||||||
Exploration(1) | 61,840 | 48,130 | 58,119 | ||||||
Depreciation, Depletion and Amortization | 119,122 | 114,906 | 195,659 | ||||||
Total Costs and Expenses | 314,559 | 274,838 | 351,183 | ||||||
Income Before Income Taxes | 267,290 | 165,150 | 53,320 | ||||||
Provision for Income Taxes | 100,353 | 60,361 | 18,662 | ||||||
Results of Operations | $ | 166,937 | $ | 104,789 | $ | 34,658 | |||
| Year Ended December 31, | |||||||||
| 2008 | 2007 | 2006 | |||||||
| (In thousands) | |||||||||
Operating Revenues | $ | 829,208 | $ | 637,195 | $ | 659,884 | |||
Costs and Expenses | |||||||||
Production | 140,763 | 116,020 | 115,786 | ||||||
Other Operating | 59,348 | 40,620 | 46,212 | ||||||
Exploration(1) | 31,200 | 39,772 | 49,397 | ||||||
Depreciation, Depletion and Amortization | 259,399 | 164,613 | 139,207 | ||||||
Total Costs and Expenses | 490,710 | 361,025 | 350,602 | ||||||
Income Before Income Taxes | 338,498 | 276,170 | 309,282 | ||||||
Provision for Income Taxes | 124,528 | 100,755 | 113,355 | ||||||
Results of Operations | $ | 213,970 | $ | 175,415 | $ | 195,927 | |||
(1) | Includes administrative exploration costs of |
Standardized Measure of Discounted Future Net Cash Flows Relating to Proved Oil and Gas Reserves
The following information has been developed utilizing SFAS No. 69,“Disclosures about Oil and Gas Producing Activities”Activities,”, procedures and based on natural gas and crude oil reserve and production volumes estimated by the Company’s engineering staff. It can be used for some comparisons, but should not be the only method used to evaluate the Company or its performance. Further, the information in the following table may not represent realistic assessments of future cash flows, nor should the Standardized Measure of Discounted Future Net Cash Flows be viewed as representative of the current value of the Company.
The Company believes that the following factors should be taken into account when reviewing the following information:
Future costs and selling prices will probably differ from those required to be used in these calculations.
Due to future market conditions and governmental regulations, actual rates of production in future years may vary significantly from the rate of production assumed in the calculations.
Selection of a 10% discount rate is arbitrary and may not be a reasonable measure of the relative risk that is part of realizing future net oil and gas revenues.
Future net revenues may be subject to different rates of income taxation.
Under the Standardized Measure, future cash inflows were estimated by applying year end oil and gas prices to the estimated future production of year end proved reserves.
The average prices related to proved reserves at December 31, 2005, 2004,2008, 2007 and 20032006 for natural gas ($ per Mcf) were $9.53, $6.26$5.66, $6.91 and $5.96,$5.54, respectively, and for oil ($ per Bbl) were $58.48, $41.24$40.15, $94.94 and $30.94,$59.50, respectively. Future cash inflows were reduced by estimated future development and production costs based on year end costs to arrive at net cash flow before tax. Future income tax expense was computed by applying year end statutory tax rates to future pretax net cash flows, less the tax basis of the properties involved. SFAS No. 69 requires the use of a 10% discount rate.
Index to Financial Statements
Management does not use only the following information when making investment and operating decisions. These decisions are based on a number of factors, including estimates of probable as well as proved reserves, and varying price and cost assumptions considered more representative of a range of anticipated economic conditions.
Standardized Measure is as follows:
| Year Ended December 31, | ||||||||||||
| (In thousands) | 2005 | 2004 | 2003 | |||||||||
Future Cash Inflows | $ | 12,700,390 | $ | 7,561,728 | $ | 6,742,214 | ||||||
Future Production Costs | (2,271,917 | ) | (1,577,787 | ) | (1,390,398 | ) | ||||||
Future Development Costs | (536,333 | ) | (396,431 | ) | (310,923 | ) | ||||||
Future Income Tax Expenses | (3,588,877 | ) | (2,009,644 | ) | (1,800,519 | ) | ||||||
Future Net Cash Flows | 6,303,263 | 3,577,866 | 3,240,374 | |||||||||
10% Annual Discount for Estimated Timing of Cash Flows | (3,652,030 | ) | (1,997,509 | ) | (1,760,966 | ) | ||||||
Standardized Measure of Discounted Future Net Cash Flows(1) | $ | 2,651,233 | $ | 1,580,357 | $ | 1,479,408 | ||||||
| Year Ended December 31, | ||||||||||||
| 2008 | 2007 | 2006 | ||||||||||
| (In thousands) | ||||||||||||
Future Cash Inflows | $ | 11,050,932 | $ | 11,671,078 | $ | 8,054,737 | ||||||
Future Production Costs | (3,018,154 | ) | (2,690,695 | ) | (2,000,993 | ) | ||||||
Future Development Costs | (1,354,780 | ) | (909,374 | ) | (688,955 | ) | ||||||
Future Income Tax Expenses | (1,891,928 | ) | (2,684,271 | ) | (1,763,458 | ) | ||||||
Future Net Cash Flows | 4,786,070 | 5,386,738 | 3,601,331 | |||||||||
10% Annual Discount for Estimated Timing of Cash Flows | (2,726,115 | ) | (3,216,087 | ) | (2,125,081 | ) | ||||||
Standardized Measure of Discounted Future Net Cash Flows(1) | $ | 2,059,955 | $ | 2,170,651 | $ | 1,476,250 | ||||||
(1) | The standardized measures of discounted future net cash flows before taxes were |
Changes in Standardized Measure of Discounted Future Net Cash Flows Relating to Proved Oil and Gas Reserves
The following is an analysis of the changes in the Standardized Measure:
| Year Ended December 31, | Year Ended December 31, | |||||||||||||||||||||||
| (In thousands) | 2005 | 2004 | 2003 | |||||||||||||||||||||
| 2008 | 2007 | 2006 | ||||||||||||||||||||||
| (In thousands) | ||||||||||||||||||||||||
Beginning of Year | $ | 1,580,357 | $ | 1,479,408 | $ | 1,255,353 | $ | 2,170,651 | $ | 1,476,250 | $ | 2,651,233 | ||||||||||||
Discoveries and Extensions, Net of Related Future Costs | 494,773 | 321,026 | 235,079 | 341,156 | 430,918 | 278,258 | ||||||||||||||||||
Net Changes in Prices and Production Costs | 1,278,303 | (17,976 | ) | 475,026 | (692,803 | ) | 864,630 | (1,843,272 | ) | |||||||||||||||
Accretion of Discount | 235,843 | 219,604 | 171,590 | 300,766 | 201,023 | 400,177 | ||||||||||||||||||
Revisions of Previous Quantity Estimates, Timing and Other | (49,550 | ) | (46,115 | ) | (35,691 | ) | ||||||||||||||||||
Revisions of Previous Quantity Estimates | (69,788 | ) | 13,452 | (19,362 | ) | |||||||||||||||||||
Timing and Other | (157,194 | ) | (136,360 | ) | (86,891 | ) | ||||||||||||||||||
Development Costs Incurred | 61,802 | 32,940 | 27,529 | 157,194 | 136,781 | 85,993 | ||||||||||||||||||
Sales and Transfers, Net of Production Costs | (471,638 | ) | (357,939 | ) | (330,800 | ) | (688,657 | ) | (521,558 | ) | (544,650 | ) | ||||||||||||
Net Purchases (Sales) of Reserves in Place | 91,180 | 10,853 | (62,596 | ) | ||||||||||||||||||||
Net Purchases / (Sales) of Reserves in Place | 166,873 | 8,548 | (261,795 | ) | ||||||||||||||||||||
Net Change in Income Taxes | (569,837 | ) | (61,444 | ) | (256,082 | ) | 531,757 | (303,033 | ) | 816,559 | ||||||||||||||
End of Year | $ | 2,651,233 | $ | 1,580,357 | $ | 1,479,408 | $ | 2,059,955 | $ | 2,170,651 | $ | 1,476,250 | ||||||||||||
Index to Financial Statements
SELECTED DATA (UNAUDITED)
SELECTED DATA (UNAUDITED)
QUARTERLY FINANCIAL INFORMATION (UNAUDITED)
| (In thousands, except per share amounts) | First | Second | Third | Fourth | Total | ||||||||||
2005 | |||||||||||||||
Operating Revenues | $ | 144,074 | $ | 151,884 | $ | 161,757 | $ | 225,082 | $ | 682,797 | |||||
Impairment of Oil and Gas Properties (1) | — | — | — | — | — | ||||||||||
Operating Income | 38,044 | 61,722 | 59,023 | 99,942 | 258,731 | ||||||||||
Net Income | 20,762 | 35,422 | 33,756 | 58,505 | 148,445 | ||||||||||
Basic Earnings per Share (2) | 0.43 | 0.72 | 0.69 | 1.20 | 3.04 | ||||||||||
Diluted Earnings per Share (2) | 0.42 | 0.71 | 0.68 | 1.18 | 2.99 | ||||||||||
2004 | |||||||||||||||
Operating Revenues | $ | 136,604 | $ | 119,742 | $ | 119,423 | $ | 154,639 | $ | 530,408 | |||||
Impairment of Oil and Gas Properties (1) | — | — | 3,458 | — | 3,458 | ||||||||||
Operating Income | 36,090 | 36,439 | 34,278 | 53,846 | 160,653 | ||||||||||
Net Income | 19,011 | 19,318 | 17,822 | 32,227 | 88,378 | ||||||||||
Basic Earnings per Share (2) | 0.39 | 0.40 | 0.37 | 0.66 | 1.81 | ||||||||||
Diluted Earnings per Share (2) | 0.39 | 0.39 | 0.36 | 0.65 | 1.79 | ||||||||||
| First | Second | Third | Fourth | Total | |||||||||||
| (In thousands, except per share amounts) | |||||||||||||||
2008 | |||||||||||||||
Operating Revenues | $ | 219,651 | $ | 248,854 | $ | 244,820 | $ | 232,466 | $ | 945,791 | |||||
Impairment of Oil & Gas Properties and Other Assets(1) | — | — | — | 35,700 | 35,700 | ||||||||||
Operating Income | 76,072 | 94,086 | 114,717 | 87,137 | 372,012 | ||||||||||
Net Income | 45,975 | 54,625 | 66,990 | 43,700 | 211,290 | ||||||||||
Basic Earnings per Share | 0.47 | 0.55 | 0.65 | 0.42 | 2.10 | ||||||||||
Diluted Earnings per Share | 0.46 | 0.55 | 0.64 | 0.42 | 2.08 | ||||||||||
2007 | |||||||||||||||
Operating Revenues | $ | 191,573 | $ | 175,832 | $ | 170,848 | $ | 193,917 | $ | 732,170 | |||||
Impairment of Oil & Gas Properties and Other Assets(1) | — | — | 4,614 | — | 4,614 | ||||||||||
Operating Income(2) | 79,185 | 70,245 | 55,521 | 69,742 | 274,693 | ||||||||||
Net Income(2) | 48,547 | 41,376 | 35,453 | 42,047 | 167,423 | ||||||||||
Basic Earnings per Share | 0.50 | 0.43 | 0.37 | 0.43 | 1.73 | ||||||||||
Diluted Earnings per Share | 0.50 | 0.42 | 0.36 | 0.43 | 1.71 | ||||||||||
(1) | For discussion of impairment of oil and gas properties, refer to Note 2 of the Notes to the Consolidated Financial Statements. |
(2) | Operating Income and Net Income in the |
ITEM 9. CHANGES IN AND DISAGREEMENTS WITH ACCOUNTANTS ON ACCOUNTING AND FINANCIAL DISCLOSURE
| ITEM 9. | CHANGES IN AND DISAGREEMENTS WITH ACCOUNTANTS ON ACCOUNTING AND FINANCIAL DISCLOSURE |
None.
ITEM 9A. CONTROLS AND PROCEDURES
| ITEM 9A. | CONTROLS AND PROCEDURES |
Conclusion Regarding the Effectiveness of Disclosure Controls and Procedures and Changes in Internal Control over Financial Reporting
As of the end of December 31, 2005,2008, the Company carried out an evaluation, under the supervision and with the participation of the Company’s management, including the Company’s Chief Executive Officer and Chief Financial Officer, of the effectiveness of the design and operation of the Company’s disclosure controls and procedures pursuant to Rules 13a-15 and 15d-15 of the Securities Exchange Act of 1934 (the “Exchange Act”). Based upon that evaluation, the Chief Executive Officer and Chief Financial Officer concluded that the Company’s disclosure controls and procedures are effective, in all material respects, with respect to the recording, processing, summarizing and reporting, within the time periods specified in the Commission’s rules and forms, of information required to be disclosed by the issuerCompany in the reports that it files or submits under the Exchange Act.
There were no significant changes in the Company’s internal control over financial reporting that occurred during the fourth quarter that has materially affected, or is reasonably likely to materially effect, the Company’s internal control over financial reporting.
Index to Financial Statements
Management’s Report on Internal Control over Financial Reporting
The management of Cabot Oil & Gas Corporation is responsible for establishing and maintaining adequate internal control over financial reporting. Cabot Oil & Gas Corporation’s internal control over financial reporting is a process designed to provide reasonable assurance regarding the reliability of financial reporting and the preparation of financial statements for external purposes in accordance with generally accepted accounting principles. Because of its inherent limitations, internal control over financial reporting may not prevent or detect misstatements. Also, projections of any evaluation of effectiveness to future periods are subject to the risk that controls may become inadequate because of changes in conditions, or that the degree of compliance with the policies or procedures may deteriorate.
Cabot Oil & Gas Corporation’s management assessed the effectiveness of the Company’s internal control over financial reporting as of December 31, 2005.2008. In making this assessment, it used the criteria set forth by the Committee of Sponsoring Organizations of the Treadway Commission (COSO) in Internal Control-Integrated Framework. Based on our assessment we have concluded that, as of December 31, 2005,2008, the Company’s internal control over financial reporting is effective based on those criteria.
The effectiveness of Cabot Oil & Gas Corporation’s independent registered public accounting firm has audited management’s assessment of the effectiveness of the Company’s internal control over financial reporting as of December 31, 20052008, has been audited by Pricewaterhouse Coopers LLP, an independent registered public accounting firm, as stated in their report entitled “Report of Independent Registered Public Accounting Firm” which appears herein.
| ITEM 9B. | OTHER INFORMATION |
None.
ITEM 10. DIRECTORS AND EXECUTIVE OFFICERS OF THE REGISTRANT
| ITEM 10. | DIRECTORS, EXECUTIVE OFFICERS AND CORPORATE GOVERNANCE |
The information under the captions “Election of Directors”, “Audit Committee” and “Code of Business Conduct” inrequired by this Item is incorporated by reference to the Company’s definitive Proxy Statement in connection with the 20062009 annual stockholders’ meeting are incorporated by reference.meeting. In addition, the information set forth under the caption “Business—Other Business Matters—Corporate Governance Matters” in Item 1 regarding our Code of Business Conduct is incorporated by reference in response to this item.Item.
ITEM 11. EXECUTIVE COMPENSATION
| ITEM 11. | EXECUTIVE COMPENSATION |
The information under the caption “Executive Compensation” inrequired by this Item is incorporated by reference to the Company’s definitive Proxy Statement in connection with the 20062009 annual stockholders’ meeting is incorporated by reference.meeting.
ITEM 12. SECURITY OWNERSHIP OF CERTAIN BENEFICIAL OWNERS AND MANAGEMENT AND RELATED STOCKHOLDER MATTERS
| ITEM 12. | SECURITY OWNERSHIP OF CERTAIN BENEFICIAL OWNERS AND MANAGEMENT AND RELATED STOCKHOLDER MATTERS |
The information under the captions “Beneficial Ownership of Over Five Percent of Common Stock”, “Beneficial Ownership of Directors and Executive Officers”, and “Equity Compensation Plan Information” inrequired by this Item is incorporated by reference to the Company’s definitive Proxy Statement in connection with the 20062009 annual stockholders’ meeting aremeeting.
| ITEM 13. | CERTAIN RELATIONSHIPS AND RELATED TRANSACTIONS, AND DIRECTOR INDEPENDENCE |
The information required by this Item is incorporated by reference.reference to the Company’s definitive Proxy Statement in connection with the 2009 annual stockholders’ meeting.
Index to Financial Statements
ITEM 13. CERTAIN RELATIONSHIPS AND RELATED TRANSACTIONS
None.
ITEM 14. PRINCIPAL ACCOUNTING FEES AND SERVICES
| ITEM 14. | PRINCIPAL ACCOUNTANT FEES AND SERVICES |
The information under the caption “Fees Billedrequired by Independent Public Accountants for Services in 2005 and 2004” inthis Item is incorporated by reference to the Company’s definitive Proxy Statement in connection with the 20062009 annual stockholders’ meeting is incorporated by reference.meeting.
| ITEM 15. | EXHIBITS AND FINANCIAL STATEMENT SCHEDULES |
ITEM 15. EXHIBITS AND FINANCIAL STATEMENT SCHEDULES
| A. | INDEX |
A. INDEX
1. Consolidated Financial Statements
| 1. | Consolidated Financial Statements |
See Index on page 53.56.
2. Financial Statement Schedules
| 2. | Financial Statement Schedules |
None.
3. Exhibits
| 3. | Exhibits |
The following instruments are included as exhibits to this report. Those exhibits below incorporated by reference herein are indicated as such by the information supplied in the parenthetical thereafter. If no parenthetical appears after an exhibit, copies of the instrument have been included herewith. Our commission file number is 1-10447.
Exhibit | Description | |||
| 3.1 | Certificate of Incorporation of the Company (Registration Statement No. | |||
| 3.2 | Amended and Restated Bylaws of the Company amended | |||
| 3.3 | Certificate of Amendment of Certificate of Incorporation (Form 8-K for July | |||
| 3.4 | Certificate of Increase of Shares Designated Series A Junior Participating Preferred Stock (Form 8-K for July | |||
| 3.5 | Certificate of Amendment of Certificate of Incorporation (Form 8-K for June 1, 2006). | |||
| 3.6 | Certificate of Increase of Shares Designated Series A Junior Participating Preferred Stock (Form 8-K for June 1, 2006). | |||
| 4.1 | Form of Certificate of Common Stock of the Company (Registration Statement No. | |||
| 4.2 | Certificate of Designation for Series A Junior Participating Preferred Stock (Form 10-K for 1994). | |||
| 4.3 | Rights Agreement, dated as of March 28, 1991, | |||
(a) | Amendment | |||
(b) | Amendment | |||
| 4.4 | ||||
| Note Purchase Agreement dated November 14, 1997, among the Company and the purchasers named therein (Form 10-K for 1997). | ||||
Index to Financial Statements
Exhibit | Description | |||
| 4.5 | Note Purchase Agreement dated as of July 26, 2001 among Cabot Oil & Gas Corporation and the Purchasers listed therein (Form 8-K for August 30, 2001). | |||
| Credit Agreement dated as of October 28, 2002 among the Company, the Banks Parties | ||||
(a) | Amendment No. 1 to Credit Agreement dated December 10, 2004 (Form 10-K for 2004). | |||
(b) Amendment No. 2 to Credit Agreement dated June 18, 2008 (Form 10-Q for the quarter ended June 30, 2008). | ||||
(c) Amendment No. 3 to Credit Agreement dated June 18, 2008 (Form 10-Q for the quarter ended June 30, 2008). | ||||
(d) Amendment No. 4 to Credit Agreement dated December 4, 2008 (Form 8-K for December 16, 2008). | ||||
| 4.7 | Note Purchase Agreement dated as of July 16, 2008 among Cabot Oil & Gas Corporation and the Purchasers named therein (Form 8-K for July 16, 2008). | |||
| 4.8 | Note Purchase Agreement dated as of December 1, 2008 among Cabot Oil & Gas Corporation and the Purchasers named therein. | |||
| *10.1 | Form of Change in Control Agreement between the Company and Certain | |||
| *10.2 | Form of | |||
| *10.3 | ||||
|
| |||
| 1990 Non-employee Director Stock Option Plan of the Company (Form | ||||
(a) | First Amendment to 1990 Non-employee Director Stock Option Plan (Post-Effective Amendment No. 2 to Form | |||
(b) | Second Amendment to 1990 Non-employee Director Stock Option Plan (Form 10-K for 1995). | |||
| * | Second Amended and Restated 1994 Long-Term Incentive Plan of the Company (Form 10-K for 2001). | |||
| * | Second Amended and Restated 1994 Non-Employee Director Stock Option Plan (Form 10-K for 2001). | |||
| * | Form of Indemnity Agreement between the Company and Certain Officers (Form 10-K for 1997). | |||
| * | Deferred Compensation Plan of the Company, as Amended | |||
| Trust Agreement dated September 2000 between Harris Trust and Savings Bank and the Company (Form 10-K for 2001). | ||||
| Lease Agreement between the Company and DNA COG, Ltd. dated April 24, 1998 (Form 10-K for 1998). | ||||
| Credit Agreement dated as of December 17, 1998, between the Company and the banks named therein (Form 10-K for 1998). | ||||
| * | Employment Agreement between the Company and Dan O. Dinges dated August 29, 2001 (Form 10-K for 2001). | |||
(a) Amendment to Employment Agreement between the Company and Dan O. Dinges, effective December 31, 2008. | ||||
| * | 2004 Incentive Plan (Form 10-Q for the quarter ended June 30, 2004). | |||
(a) First Amendment to the 2004 Incentive Plan effective February 23, 2007 (Form 10-Q for the quarter ended March 31, 2007). | ||||
(b) Second Amendment to the 2004 Incentive Plan Amendment, effective as of January 1, 2009. | ||||
Index to Financial Statements
Exhibit | Description | |||
| * | 2004 Performance Award Agreement (Form 10-Q for the quarter ended June 30, 2004). | |||
| * | 2004 Annual Target Cash Incentive Plan Measurement Criteria for Cabot Oil & Gas Corporation (Form 8-K for February 10, 2005). | |||
| * | Form of Restricted Stock Awards Terms and Conditions for Cabot Oil & Gas Corporation (Form 8-K for February 10, 2005). | |||
| * | 2005 Form of Non-Employee Director Restricted Stock Unit Award Agreement (Form 8-K for May 24, 2005). | |||
| * | Savings Investment Plan of the Company, as amended and restated effective January 1, 2001 (Form 10-K for 2005). | |||
(a) | First Amendment to the Savings Investment Plan effective January 1, 2002 (Form 10-K for 2005). | |||
(b) | Second Amendment to the Savings Investment Plan effective January 1, 2003 (Form 10-K for 2005). | |||
(c) | Third Amendment to the Savings Investment Plan effective January 1, 2005 (Form 10-K for 2005). | |||
| *10.18 | Forms of Award Agreements for Executive Officers under 2004 Incentive Plan (Form 10-K for 2006). | |||
(a) Form of Restricted Stock Award Agreement (Form 10-K for 2006). | ||||
(b) Form of Stock Appreciation Rights Award Agreement (Form 10-K for 2006). | ||||
(c) Form of Performance Share Award Agreement (Form 10-K for 2006). | ||||
| 10.19 | Cabot Oil & Gas Corporation Mineral, Royalty and Overriding Royalty Interest Plan (Registration Statement No. 333-135365). | |||
(a) Form of Conveyance of Mineral and/or Royalty Interest (Registration Statement No. 333-135365). | ||||
(b) Form of Conveyance of Overriding Royalty Interest (Registration Statement No. 333-135365). | ||||
| 10.20 | Purchase and Sale Agreement dated August 25, 2006 between Cabot Oil & Gas Corporation, a Delaware corporation, Cody Energy LLC, a Colorado limited liability company, and Phoenix Exploration Company LP, a Delaware limited partnership (Form 8-K for September 29, 2006). | |||
| *10.21 | Form of Amendment of Employee Award Agreements (Form 8-K for December 19, 2006). | |||
| *10.22 | Savings Investment Plan of the Company, as amended and restated effective January 1, 2006 (Form 10-K for 2006). | |||
(a) First Amendment to the Savings Investment Plan of the Company effective January 1, 2006 (Form 10-K for 2007). | ||||
(b) Second Amendment to the Savings Investment Plan of the Company effective April 23, 2008 (Form 10-Q for the quarter ended March 31, 2008). | ||||
(c) Third Amendment to the Savings Investment Plan of the Company effective July 1, 2008. | ||||
(d) Fourth Amendment to the Savings Investment Plan of the Company effective January 1, 2008. | ||||
| *10.23 | Pension Plan of the Company, as amended and restated effective January 1, 2006 (Form 10-K for 2006). | |||
(a) First Amendment to the Pension Plan of the Company effective January 1, 2006 (Form 10-K for 2007). | ||||
(b) Second Amendment to the Pension Plan of the Company effective April 23, 2008 (Form 10-Q for the quarter ended March 31, 2008). | ||||
(c) Third Amendment to the Pension Plan of the Company effective July 1, 2008. | ||||
(d) Fourth Amendment to the Pension Plan of the Company effective January 1, 2008. | ||||
Index to Financial Statements
Exhibit | Description | |
| 10.24 | Purchase and Sale Agreement dated June 3, 2008 by and among Enduring Resources, LLC, Mustang Drilling, Inc., Minden Gathering Services, LLC and Cabot Oil & Gas Corporation (Form 10-Q for the quarter ended June 30, 2008). | |
| 14.1 | Amendment of Code of Business Conduct (as amended on July 28, 2005 to revise Section III. F. relating to Transactions in Securities and Article V. relating to Safety, Health and the Environment) (Form 10-Q for the quarter ended June 30, 2005). | |
| 16.1 | Letter, dated March 12, 2007, from UHY Mann Frankfort Stein & Lipp CPAs, LLP to the Securities and Exchange Commission (Form 8-K for March 8, 2007). | |
| 21.1 | Subsidiaries of Cabot Oil & Gas Corporation. | |
| 23.1 | Consent of PricewaterhouseCoopers LLP. | |
| 23.2 | Consent of Miller and Lents, Ltd. | |
| 31.1 | 302 | |
| |||
| 31.2 | 302 | ||
| 32.1 | 906 Certification. | ||
| 99.1 | Miller and Lents, Ltd. Review Letter. | ||
| * | Compensatory plan, contract or arrangement. |
Index to Financial Statements
SIGNATURES
Pursuant to the requirements of Section 13 and 15 (d) of the Securities Exchange Act of 1934, the registrant has duly caused this report to be signed on its behalf by the undersigned, thereunto duly authorized, in the City of Houston, State of Texas, on the6th 27th of March 2006.February 2009.
CABOT OIL & GAS CORPORATION | ||
By: | / | |
Dan O. Dinges | ||
Chairman, President and Chief Executive Officer | ||
Pursuant to the requirements of the Securities Exchange Act of 1934, this report has been signed below by the following persons on behalf of the registrant and in the capacities and on the dates indicated.
Signature | Title | Date | ||
/ Dan O. Dinges
| Chairman, President and Chief Executive Officer
| |||
/ Scott C. Schroeder
| Vice President and Chief Financial Officer
| |||
/ Henry C. Smyth
| Vice President, Controller and Treasurer
| |||
/
| Director | |||
/
| Director | |||
/
| Director | |||
/
| Director | |||
/
| Director | |||
/
| Director | |||
| ||||
| ||||
| ||||
99115