the emergence of newer, more competitive technologies and products.
We have no experience manufacturing our products on a large-scale commercial basis and may be unable to do so.
To date, we have focused primarily on research, development and low volumelow-volume manufacturing and have no experience manufacturing our products on a large-scale commercial basis. In 2000, we completed construction of our 50,000 square foot manufacturing facility, and have continued to develop our manufacturing capabilities and processes. We do not know whether or when we will be able to develop efficient, low-cost manufacturing capabilities and processes that will enable us to manufacture our products in commercial quantities while meeting the quality, price, engineering, design and production standards required to successfully market our products. Our failure to develop such manufacturing processes and capabilities could have a material adverse effect on our business, financial condition and results of operations. Even if we are successful in developing our manufacturing capabilities and processes, we do not know whether we will do so in time to meet our product commercialization schedule or to satisfy the requirements of our distributors or customers.
We have not developed andor produced the products that we have agreed to sell to GE Fuel Cell Systems.
Our distribution agreement with GEFCS has been amended on a numbersome of occasions, most recently in April 2005. The amendments to our distribution agreement permit us the ability to sell directly or negotiate nonexclusive distribution rights to third parties for our GenCore® back-up power product line, our GenSite™ hydrogen generation product line and our GenSys® prime power product line (for telecommunication and broadband applications). In exchange, starting in the fourth quarter of 2005 we are required to pay a 5% commission for GenCore®, and starting in the fourth quarter of 2005 we are required to pay a 5% commission for GenSite™, in each case based on sales price, to GEFCS. We are also required to pay a 5% commission for GenSys® sales beginning in the fourth quarter of 2006. The distribution agreement expires on December 31, 2014.distributors.
We have not developed or produced certain products meeting all specificationsthat are required by the GEFCSsome of our distribution agreement.agreements, including those with Smartlink, IST, Tyco, and Logan Energy Systems. There can be no assurance that we will complete development of products meeting specifications required by GEFCSthese distributor agreements and deliver them on schedule. Pursuant to these distribution agreements, the distribution agreement, GEFCS hasdistributors have the right to provide notice to us if, in its good faiththeir judgment, we have materially deviated from the multi-generation product plan in the distribution agreement. Should GEFCSa distributor provide such notice, and we cannot mutually agree to a modification to the multi-generation product plan,distributor agreement, then GEFCSthe distributor has the right to terminate the distribution agreement for cause, subjectcause.
Our orders may not ship or convert to revenue.
We have accepted orders from our rightsdistributors, which include firm orders, stocking orders and orders that require certain conditions or contingencies to cure. In addition, GEFCS has the rightbe satisfied prior to terminate the distribution agreement for cause if we fail to provide GEFCS with products that, in GEFCS’ reasonable judgment,shipment, some of which are materially competitive with alternative PEM fuel cell-powered generator sets, subject to our rights to cure.
GE Energy, the operating business of General Electric Company, which controls GEFCS through GE MicroGen, has agreed not to sell or distribute PEM fuel cell systems and related components manufactured by parties other than us through any entity other than GEFCS. GE Energy is not, however, prohibited from developing non-PEM fuel cell systems and other distributed energy systems and products that would compete directly or indirectly against our PEM fuel cell systems or other products we may manufacture. GE Energy is not required to provide us with any information concerning the developments of such products, or plans or intentions to manufacture such products by GE Energy. The development of different energy product solutions by GE Energy could harm the marketabilityoutside of our technologycontrol. Historically, shipments made against these orders can occur between thirty (30) days and twenty-four (24) months from the date of acceptance of the order. Orders received during the year ended December 31, 2006 were 539. Backlog on December 31, 2006 was 572 units. Of the unit orders in backlog on December 31, 2006, orders for 103 units were older than 12 months. The time periods from receipt of an order to shipment date and installation date vary widely and are determined by providing potential customers with an alternative to our products.
As discussed above in “Distribution, Marketing and Strategic Relationships” we are currently in discussion with GE to restructure our agreements,a number of factors, including the distribution agreement,terms of the customer contract and cannot predict the outcomecustomer’s deployment plan. Orders include firm orders, stocking orders and orders that require certain conditions or contingencies and certain redesign elements to be satisfied prior to shipment, some of those discussions.which are outside of the Company’s control. Some or all of our current and future orders may not result in an actual shipment and therefore not convert to revenue.
Delays in our product development wouldcould have a material impact on our commercialization schedule.
If we experience delays in meeting our development goals, or if our products exhibit technical defects or if we are unable to meet cost or performance goals, including power output, useful life and reliability, our commercialization schedule will be delayed. In this event, potential purchasers of our products may choose alternative technologies, and any delays could allowallowing potential competitors to gain market advantages. We cannot assure you that we will successfully meet our commercialization schedule in the future.
We may need to secure additional funding to complete our product development and commercialization plans and we may be unable to raise additional capital.
Our cash requirements depend on numerous factors, including completion of our product development activities, ability to commercialize our products and market acceptance of our products. We expect to devote substantial capital resources to continue development programs, establish a manufacturing infrastructure and develop manufacturing processes. Additionally, we expect to devote substantial capital resources to expand our marketing organization and establish a sales organization. Weorganizations. Despite the infusion of equity capital from our transaction with Smart Hydrogen Inc. in June 2006, we may need to raise additional funds to achieve commercialization of our products. However, we do not know whether we will be able to secure additional funding or funding on acceptable terms to pursue
our commercialization plans. If additional funds are raised through the issuance of equity securities, the percentage ownership of our then current stockholders will be reduced. If adequate funds are not available to satisfy either short-term or long-term capital requirements, we may be required to limit operations in a manner inconsistent with our development and commercialization plans, which could affect operations in future periods.
We may be unable to establish relationships, or we may lose existing relationships, with third parties for certain aspects of product development, manufacturing, distribution and servicing and the supply of key components for our products.
We will need to enter into additional strategic relationships in order to complete our current product development and commercialization plans. We will also require partners to assist in the distribution, servicing and supply of components for our anticipated back-up power and on-site hydrogen generation products, both of which are in development. If we are unable to identify or enter into satisfactory agreements with potential partners, including those relating to the distribution of and service and support for our anticipated back-up power and on-site hydrogen generation products, we may not be able to complete our product development and commercialization plans on schedule, or at all. We may also need to scale back these plans in the absence of needed partners, which would adversely affect our future prospects for development and commercialization of future products. In addition, any arrangement with a strategic partner may require us to issue a significant amount of equity securities to the partner, provide the partner with representation on our board of directors and/or commit significant financial resources to fund our product development efforts in exchange for their assistance or the contribution to us of intellectual property. Any such issuance of equity securities would reduce the percentage ownership of our then current stockholders. While we have entered into relationships with suppliers of some key components for our products, we do not know when or whether we will secure supply relationships for all required components and subsystems for our products, or whether such relationships will be on terms that will allow us to achieve our objectives. Our business, prospects, results of operations and financial condition could be harmed if we fail to secure relationships with entities which can develop or supply the required components for our products and provide the required distribution and servicing support. Additionally, the agreements governing our current relationships allow for termination by our partners under certain circumstances. If any of our current strategic partners was to terminate any of its agreements with us, there could be a material adverse impact on the development and commercialization of our products and the operation of our business, financial condition, results of operations and prospects.
We will rely on our partners to develop and provide components for our products.
A supplier’s failure to develop and supply components in a timely manner, or at all, or to develop or supply components that meet our quality, quantity or cost requirements, or our inability to obtain substitute sources of these components on a timely basis or on terms acceptable to us, could harm our ability to manufacture our products. In addition, to the extent that our supply partners use technology or manufacturing processes that are proprietary, we may be unable to obtain comparable components from alternative sources.
We face intense competition and may be unable to compete successfully.
The markets for on-site energy products are intensely competitive. There are a number of companies located in the United States, Canada and abroad that are developing PEM and other fuel cell technologies and energy products that compete with our products. Some of our competitors in the fuel cell sector are much larger than we are and may have the manufacturing, marketing and sales capabilities to complete research, development and commercialization of commercially viable fuel cell products more quickly and effectively than we can.
In addition, there are many companies engaged in all areas of traditional and alternative energy generation in the United States, Canada and abroad, including, among others, major electric, oil, chemical, natural gas, batteries, generatorsbattery, generator and specialized electronics firms, as well as universities, research institutions and foreign government-sponsored companies. These firms are engaged in forms of power generation such as solar and wind
power, reciprocating engines and microturbines, as well as traditional grid-supplied electric power. Many of these entities have substantially greater financial, research and development, manufacturing and marketing resources than we do.
We must lower the cost of our products and demonstrate their reliability.
Our initial fuel cell systems currently cost significantly more than many established competing technologies. If we are unable to develop products that are competitive with competing technologies in terms of price, reliability and longevity, consumers will be unlikely to buy our products. The price of our products depends largely on material and manufacturing costs. We cannot guarantee that we will be able to lower these costs to the level where we will be able to produce a competitive product or that any product produced using lower cost materials and manufacturing processes will not suffer from a reduction in performance, reliability and longevity.
Failure of our field tests could negatively impact demand for our products.
We are currently field-testing a number of our products and we plan to conduct additional field tests in the future. We may encounter problems and delays during these field tests for a number of reasons, including the failure of our technology or the technology of third parties, as well as our failure to maintain and service our products properly. Many of these potential problems and delays are beyond our control. Any problem or perceived problem with our field tests could materially harm our reputation and impair market acceptance of, and demand for, our products.
Further regulatory changes and electric utility industry restructuring may affect demand for our products.
The market for electric power generation products is heavily influenced by federal and state governmental regulations and policies concerning the electric utility industry.and telecommunications industries. A change in the current regulatory policies could deter further investment in the research and development of alternative energy sources, including fuel cells, and could result in a significant reduction in the demand for our products. We cannot predict how deregulation or restructuring of the industry will affect the market for our products.
Our business may become subject to future government regulation, which may impact our ability to market our products.
Our products will be subject to federal, local, and non-U.S. laws and regulations, including, for example, state and local ordinances relating to building codes, public safety, electrical and gas pipeline connections, hydrogen transportation and siting and related matters. Further, as products are introduced into the market commercially, governments may impose new regulations. We do not know the extent to which any such regulations may impact our ability to distribute, install and service our products. Any regulation of our products, whether at the federal, state, local or foreign level, including any regulations relating to installation and servicing of our products, may increase our costs and the price of our products.
Utility companies could place barriers on our entry into the marketplace where customers depend on traditional grid supplied energy.
Utility companies often charge fees to industrial companies for disconnecting from the grid, for using less electricity or for having the capacity to use power from the grid for back-up purposes and may charge similar fees to residential customers in the future. The imposition of such fees could increase the cost to grid-connected customers of using our products and could make our products less desirable, thereby harming our revenue and profitability.
Alternatives to our technology or improvements to traditional energy technologies could make our products less attractive or render them obsolete.
Our products are among a number of alternative energy products being developed. A significant amount of public and private funding is currently directed toward development of microturbines, solar power, wind power and other types of fuel cell technologies. Improvements are also being made to the existing electric transmission system. Technological advances in alternative energy products, improvements in the electric power grid or other fuel cell technologies may make our products less attractive or render them obsolete.
The hydrocarbon fuels and other raw materials on which our products rely may not be readily available or available on a cost-effective basis.
Our products depend largely on the availability of natural gas, liquid propane and hydrogen gas. If these fuels are not readily available, or if their prices are such that energy produced by our products costs more than energy provided by other sources, our products could be less attractive to potential users.
In addition, platinum is a key material in our PEM fuel cells. Platinum is a scarce natural resource and we are dependent upon a sufficient supply of this commodity. Any shortages could adversely affect our ability to produce commercially viable fuel cell systems and significantly raise our cost of producing our fuel cell systems.
Our products use flammable fuels that are inherently dangerous substances.
Our fuel cell systems use natural gas, liquid propane and hydrogen gas in catalytic reactions, which produce less heat than a typical gas furnace. While our products do not use this fuel in a combustion process, natural gas, liquid propane and hydrogen gas are flammable fuels that could leak in a home or office and combust if ignited by another source. Further, while we are not aware of any accidents involving our products, any such accidents involving our products or other products using similar flammable fuels could materially suppress demand for, or heighten regulatory scrutiny of, our products.
Product liability or defects could negatively impact our results of operations.
Any liability for damages resulting from malfunctions or design defects could be substantial and could materially adversely affect our business, financial condition, results of operations and prospects. In addition, a
well-publicized actual or perceived problem could adversely affect the market’s perception of our products resulting in a decline in demand for our products and could divert the attention of our management, which may materially and adversely affect our business, financial condition, results of operations and prospects.
Future acquisitions may disrupt our business, distract our management and reduce the percentage ownership of our stockholders.
As part of our business strategy we may engage in acquisitions that we believe will provide us with complementary technologies, products, channels, revenue streams, expertise and/or other valuable assets. However, we may not be able to identify suitable acquisition candidates. If we do identify suitable candidates, we may not be able to acquire them on commercially acceptable terms, or at all. If we acquire another company, we may not be able to successfully integrate the acquired business into our existing business in a timely and non-disruptive manner. We may have to devote a significant amount of time and management and financial resources to do so. Even with this investment of management and financial resources, an acquisition may not produce the desired revenues, earnings or business synergies. In addition, an acquisition may reduce the percentage ownership of our then current stockholders. If we fail to integrate the acquired business effectively, or if key employees of that business leave, the anticipated benefits of the acquisition would be jeopardized. The time, capital and management and other resources spent on an acquisition that fails to meet our expectations could cause our business and financial condition to be materially and adversely affected. In addition, from an accounting perspective, acquisitions can involve non-recurring charges and amortization or impairment of significant amounts of intangible assets that could adversely affect our results of operations.
We may not be able to protect important intellectual property, and we could incur substantial costs defending against claims that our products infringe on the proprietary rights of others.
PEM fuel cell technology was first developed in the 1950s, and fuel processing technology has been practiced on a large scale in the petrochemical industry for decades. Accordingly, we do not believe that we can establish a significant proprietary position in the fundamental component technologies in these areas. However, our ability to compete effectively will depend, in part, on our ability to protect our proprietary system-level technologies, systems designs and manufacturing processes. We rely on patents, trademarks, and other policies and procedures related to confidentiality to protect our intellectual property. However, some of our intellectual property is not covered by any patent or patent application. Moreover, we do not know whether any of our pending patent applications will issuebe issued or, in the case of patents issued or to be issued, that the claims allowed are or will be sufficiently broad to protect our technology or processes. Even if all of our patent applications are issued and are sufficiently broad, our patents may be challenged or invalidated. We could incur substantial costs in prosecuting or defending patent infringement suits or otherwise protecting our intellectual property rights. While we have attempted to safeguard and maintain our proprietary rights, we do not know whether we have been or will be completely successful in doing so. Moreover, patent applications filed in foreign countries may be subject to laws, rules and procedures that are substantially different from those of the United States, and any resulting foreign patents may be difficult and expensive to enforce. In addition, we do not know whether the U.S. Patent & Trademark Office will grant federal registrations based on our pending trademark applications. Even if federal registrations are granted to us, our trademark rights may be challenged. It is also possible that our competitors or others will adopt trademarks similar to ours, thus impeding our ability to build brand identity and possibly leading to customer confusion. We could incur substantial costs in prosecuting or defending trademark infringement suits.
Further, our competitors may independently develop or patent technologies or processes that are substantially equivalent or superior to ours. If we are found to be infringing third party patents, we could be required to pay substantial royalties and/or damages, and we do not know whether we will be able to obtain licenses to use such patents on acceptable terms, if at all. Failure to obtain needed licenses could delay or prevent the development, manufacture or sale of our products and could necessitate the expenditure of significant resources to develop or acquire non-infringing intellectual property.
Asserting, defending and maintaining our intellectual property rights could be difficult and costly, and failure to do so may diminish our ability to compete effectively and may harm our operating results. We may need to pursue lawsuits or legal action in the future to enforce our intellectual property rights, to protect our trade secrets and domain names and to determine the validity and scope of the proprietary rights of others. If third parties prepare and file applications for trademarks used or registered by us, we may oppose those applications and be required to participate in proceedings to determine the priority of rights to the trademark. Similarly, competitors may have filed applications for patents, may have received patents and may obtain additional patents and proprietary rights relating to products or technology that block or compete with ours. We may have to participate in interference proceedings to determine the priority of invention and the right to a patent for the technology. Litigation and interference proceedings, even if they are successful, are expensive to pursue and time consuming, and we could use a substantial amount of our financial resources in either case.
We rely, in part, on contractual provisions to protect our trade secrets and proprietary knowledge.
Confidentiality agreements to which we are party may be breached, and we may not have adequate remedies for any breach. Our trade secrets may also be known without breach of such agreements or may be independently developed by competitors. Our inability to maintain the proprietary nature of our technology and processes could allow our competitors to limit or eliminate any competitive advantages we may have.
We may have difficulty managing change in our operations.
We continue to undergo rapid change in the scope and breadth of our operations as we advance the development of our products. Such rapid change is likely to place a significant strain on our senior management
team and other resources. We will be required to make significant investments in our engineering, logistics, financial and management information systems and to motivate and effectively manage our employees. Our business, prospects, results of operations and financial condition could be harmed if we encounter difficulties in effectively managing the budgeting, forecasting and other process control issues presented by such a rapid change.
We face risks associated with our plans to market, distribute and service our products internationally.
We intend to market, distribute and service our products internationally. We have limited experience developing and no experience manufacturing our products to comply with the commercial and legal requirements of international markets. Our success in international markets will depend, in part, on our ability and that of our partners to secure relationships with foreign sub-distributors, and our ability to manufacture products that meet foreign regulatory and commercial requirements. Additionally, our planned international operations are subject to other inherent risks, including potential difficulties in enforcing contractual obligations and intellectual property rights in foreign countries and fluctuations in currency exchange rates. Also, to the extent our operations and assets are located in foreign countries, they are potentially subject to nationalization actions over which we will have no control.
Our international sales and operations may be adversely affected.
Our international sales and operations are subject to risks associated with changes in local government laws, regulations and policies, including those related to tariffs and trade barriers, investments, taxation, exchange controls, employment regulations and repatriation of earnings. Our international sales and operations are also sensitive to changes in foreign national priorities, including government budgets, as well as to political and economic instability. International transactions may involve increased financial and legal risks due to differing legal systems and customs in foreign countries. For example, as a condition of sale or to the awarding of a contract, some international customers may require us to agree to offset arrangements, which may include in-country purchases, manufacturing and financial support arrangements. The contract may provide for penalties in the event we fail to perform in accordance with the offset requirements. In addition, as part of our globalization strategy, we have invested in certain countries, including Venezuela, Brazil, China, India, Russia and South Africa, which carry high levels of currency, political and economic risk. While these factors or the impact of these factors are difficult to predict, any one or more of them could adversely affect our business, financial condition or operating results.
Our government contracts could restrict our ability to effectively commercialize our technology.
Some of our technology has been developed under government funding by the United States and by other countries. The United States government has a non-exclusive, royalty-free, irrevocable world-wide license to practice or have practiced any of our technology developed under contracts funded by the government. In some cases, government agencies in the United States can require us to obtain or produce components for our systems from sources located in the United States rather than foreign countries. Our contracts with government agencies are also subject to the risk of termination at the convenience of the contracting agency, potential disclosure of our confidential information to third parties and the exercise of “march-in” rights by the government. March-in rights refer to the right of the United States government or government agency to license to others any technology developed under contracts funded by the government if the contractor fails to continue to develop the technology. The implementation of restrictions on our sourcing of components or the exercise of march-in rights could harm our business, prospects, results of operations and financial condition. In addition, under the Freedom of
Information Act, any documents that we have submitted to the government or to a contractor under a government funding arrangement are subject to public disclosure that could compromise our intellectual property rights unless such documents are exempted as trade secrets or as confidential information and treated accordingly by such government agencies.
Our future plans could be harmed if we are unable to attract or retain key personnel.
We have attracted a highly skilled management team and specialized workforce, including scientists, engineers, researchers and manufacturing, marketing and sales professionals. Our future success will depend, in part, on our ability to attract and retain qualified management and technical personnel. We do not know whether we will be successful in hiring or retaining qualified personnel. Our inability to hire qualified personnel on a timely basis, or the departure of key employees, could materially and adversely affect our development and commercialization plans and, therefore, our business, prospects, results of operations and financial condition.
GE MicroGen, Inc.Smart Hydrogen will have substantial control over us and DTE Energy Technologies, Inc. have representatives on our board of directors.
Under our agreement with GE MicroGen, we are requiredcould limit your ability to use our best efforts to cause one individual nominated by GE Energy, an operating business of General Electric Company, to be elected to our board of directors for as long as our distribution agreement with GEFCS remains in effect. Currently, Richard R. Stewart serves on our board of directors as GE Energy’s nominee. In addition, a current employee of DTE, Robert J. Buckler, and a former employee of DTE, Larry G. Garberding, currently serve on our board of directors. Both GEFCS and DTE have entered into distribution agreements with us. As discussed above in “Distribution, Marketing and Strategic Relationships” we are currently in discussion with GE to restructure certain agreements, including the distribution agreement, and cannot predictinfluence the outcome of those discussions.key transactions, including a change of control.
Smart Hydrogen and its affiliates beneficially own approximately 35.1% of the outstanding shares of our common stock. As a result, these stockholders will significantly influence or control certain matters requiring approval by our stockholders, including the approval of mergers or other extraordinary transactions. The interests of these stockholders may differ from yours and these stockholders may vote in a way with which you disagree and which may be adverse to your interests. This concentration of ownership may have the effect of delaying, preventing or deterring a change of control of our company, could deprive our stockholders of an opportunity to receive a premium for their common stock as part of a sale of our company and might ultimately affect the market price of our common stock.
If a substantial number of shares of the Company’s common stock become available for sale and are sold in a short period of time, the market price of our common stock could decline.
After its recently-completed investment in the Company, Smart Hydrogen holds approximately 35.1% of the Company’s outstanding common stock on a fully-diluted basis. If Smart Hydrogen or its affiliates sell substantial amounts of our common stock in the public market following this investment, the market price of our common stock could decrease significantly. The perception in the public market that Smart Hydrogen might sell shares of common stock could also depress the trading price of our common stock. Smart Hydrogen and its affiliates are subject to an Investor Rights Agreement with the Company pursuant to which Smart Hydrogen and its affiliates are prohibited from selling shares of the Company’s common stock until at least December 31, 2007. The market price of shares of our common stock may drop significantly when the restrictions on resale by Smart Hydrogen and its affiliates lapse. A decline in the price of shares of our common stock might impede our ability to raise capital through the issuance of additional shares of our common stock or other equity securities.
Provisions in our charter documents and Delaware law may prevent or delay an acquisition of us, which could decrease the value of our common stock.
Our certificate of incorporation and bylaws and Delaware law contain provisions that could make it hardermore difficult for a third party to acquire us without the consent of our board of directors. These provisions include those that:
authorize the issuance of up to 5,000,000 shares of preferred stock in one or more series without a stockholder vote;
limit stockholders’ ability to call special meetings;
establish advance notice requirements for nominations for election to our board of directors or for proposing matters that can be acted on by stockholders at stockholder meetings; and
provide for staggered terms for our directors.
In addition, in certain circumstances Delaware law also imposes restrictions on mergers and other business combinations between us and any holder of 15% or more of our outstanding common stock.
Our stock price has been and could remain volatile.
The market price of our common stock has historically experienced and may continue to experience significant volatility. Since our initial public offering in October 1999, the market price of our common stock has fluctuated from a high of $156.50 per share in the first quarter of 2000 to a low of $3.39$2.79 per share in the fourth quarter of 2002.March 2007. Our progress in developing and commercializing our products, our quarterly operating results, announcements of new products by us or our competitors, our perceived prospects, changes in securities’securities analysts’ recommendations or earnings’earnings estimates, changes in general conditions in the economy or the financial markets, adverse events related to our strategic relationships, significant sales of our common stock by existing stockholders including one or more of our strategic partners and other developments affecting us or our
competitors could cause the market price of our common stock to fluctuate substantially. In addition, in recent years, the stock market, and in particular the market for technology-related stocks, has experienced significant price and volume fluctuations. This volatility has affected the market prices of securities issued by many companies for reasons unrelated to their operating performance and may adversely affect the price of our common stock. In addition, we may be subject to additional securities class action litigation as a result of volatility in the price of our common stock, which could result in substantial costs and diversion of management’s attention and resources and could harm our stock price, business, prospects, results of operations and financial condition.
Our failure to comply with Nasdaq’sNASDAQ’s listing standards could result in the delisting of our common stock by NasdaqNASDAQ from the Nasdaq NationalNASDAQ Global Market and severely limit the ability to sell our common stock.
Our common stock is currently traded on the Nasdaq NationalNASDAQ Global Market. Under Nasdaq’sNASDAQ’s listing maintenance standards, if the closing bid price of our common stock is under $1.00 per share for 30 consecutive trading days, NasdaqNASDAQ will notify us that we may be delisted from the Nasdaq NationalNASDAQ Global Market. If the closing bid price of our common stock does not thereafter regain compliance for a minimum of 10 consecutive trading days during the 90 days following notification by Nasdaq, NasdaqNASDAQ, NASDAQ may delist our common stock from trading on the Nasdaq NationalNASDAQ Global Market. There can be no assurance that our common stock will remain eligible for trading on the Nasdaq NationalNASDAQ Global Market. In addition, if our common stock is delisted, our stockholders would not be able to sell our common stock on the Nasdaq NationalNASDAQ Global Market, and their ability to sell any of our common stock would be severely, if not completely, limited.
| Item 1B. | Unresolved Staff Comments |
We have not received written comments from the Securities and Exchange Commission regarding our periodic or current reports under the Securities Exchange Act of 1934, as amended, that were received 180 days or more before December 31, 2005 and remain unresolved.None.
| Item 2. | Properties |
Our principal executive offices are located in Latham, New York. At our 36-acre campus, we own a 56,000 square foot research and development center, a 32,000 square foot office building and a 50,000 square foot manufacturing facility and believe that these facilities are sufficient to accommodate our anticipated production volumes for at least the next two years.
| Item 3. | Legal Proceedings |
None.
| Item 4. | Submission of Matters to a Vote of Security Holders |
None.
PART II
| Item 5. | Market for Registrant’s Common Equity, |
Market Information. Our common stock is traded on the Nasdaq NationalNASDAQ Global Market under the symbol “PLUG.” As of March 1, 2006,2007, there were approximately 2,600 record holders of our common stock. However, management believes that a significant number of shares are held by brokers under a “nominee name” and that the number of beneficial shareholders of our common stock exceeds 80,000. The following table sets forth high and low last reported sale prices for our common stock as reported by the Nasdaq NationalNASDAQ Global Market for the periods indicated:
| Sales prices | Sales prices | |||||||||||
| High | Low | High | Low | |||||||||
2004 | ||||||||||||
2006 | ||||||||||||
1st Quarter | $ | 10.65 | $ | 6.75 | $ | 6.09 | $ | 4.59 | ||||
2nd Quarter | $ | 10.24 | $ | 6.85 | $ | 6.43 | $ | 4.64 | ||||
3rd Quarter | $ | 7.55 | $ | 4.62 | $ | 4.85 | $ | 3.64 | ||||
4th Quarter | $ | 7.27 | $ | 5.45 | $ | 4.49 | $ | 3.77 | ||||
2005 | ||||||||||||
1st Quarter | $ | 8.20 | $ | 5.11 | $ | 8.20 | $ | 5.11 | ||||
2nd Quarter | $ | 7.63 | $ | 5.21 | $ | 7.63 | $ | 5.21 | ||||
3rd Quarter | $ | 7.73 | $ | 5.85 | $ | 7.73 | $ | 5.85 | ||||
4th Quarter | $ | 7.12 | $ | 4.84 | $ | 7.12 | $ | 4.84 | ||||
Dividend Policy. We have never declared or paid cash dividends on our common stock and do not anticipate paying cash dividends in the foreseeable future. Any future determination as to the payment of dividends will depend upon capital requirements and limitations imposed by our credit agreements, if any, and such other factors as our board of directors may consider.
Five-Year Performance Graph. Below is a line graph comparing the percentage change in the cumulative total return on the Company’s Common Stock, based on the market price of the Company’s Common Stock, with the total return of companies included within the NASDAQ Market Index and the companies included within the Russell 3000 Technology Composite for the period commencing December 31, 2001 and ending December 31, 2006. The calculation of the cumulative total return assumes a $100 investment in the Company’s Common Stock, the NASDAQ Market Index and the Russell 3000 Technology Composite on December 31, 2001 and the reinvestment of all dividends.
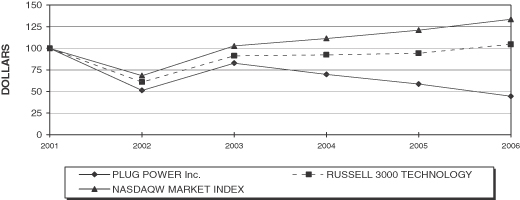
Index | 2001 | 2002 | 2003 | 2004 | 2005 | 2006 | ||||||
PLUG POWER INC. | 100.00 | 51.37 | 82.95 | 69.91 | 58.70 | 44.51 | ||||||
RUSSELL 3000 TECHNOLOGY | 100.00 | 60.94 | 91.42 | 92.51 | 94.35 | 104.62 | ||||||
NASDAQW MARKET INDEX | 100.00 | 68.47 | 102.71 | 111.54 | 121.11 | 133.55 |
| Item 6. | Selected Financial Data |
The following tables set forth selected financial data and other operating information of the Company. The selected statement of operations and balance sheet data for 2006, 2005, 2004, 2003, 2002, and 20012002 as set forth below are derived from the audited financial statements of the Company. The information is only a summary and you should read it in conjunction with the Company’s audited financial statements and related notes and other financial information included herein and “Management’s Discussion and Analysis of Financial Condition and Results of Operations.”
| Years Ended December 31, | Years Ended December 31, | |||||||||||||||||||||||||||||||||||||||
| 2005 | 2004 | 2003 | 2002 | 2001 | 2006 | 2005 | 2004 | 2003 | 2002 | |||||||||||||||||||||||||||||||
| (in thousands, except per share data) | (in thousands, except per share data) | |||||||||||||||||||||||||||||||||||||||
Statement Of Operations: | ||||||||||||||||||||||||||||||||||||||||
Product and service revenue | $ | 4,881 | $ | 5,306 | $ | 7,517 | $ | 9,427 | $ | 2,574 | $ | 2,657 | $ | 4,881 | $ | 5,306 | $ | 7,517 | $ | 9,427 | ||||||||||||||||||||
Research and development contract revenue | 8,606 | 10,835 | 4,985 | 2,391 | 3,168 | 5,179 | 8,606 | 10,835 | 4,985 | 2,391 | ||||||||||||||||||||||||||||||
Total revenue | 13,487 | 16,141 | 12,502 | 11,818 | 5,742 | 7,836 | 13,487 | 16,141 | 12,502 | 11,818 | ||||||||||||||||||||||||||||||
Cost of product and service revenues | 4,098 | 5,368 | 7,150 | 7,602 | 5,080 | 4,833 | 4,098 | 5,368 | 7,150 | 7,602 | ||||||||||||||||||||||||||||||
Cost of research and development contract revenues | 12,076 | 13,474 | 7,010 | 3,739 | 6,211 | 7,637 | 12,076 | 13,474 | 7,010 | 3,739 | ||||||||||||||||||||||||||||||
In-process research and development | — | — | 3,000 | — | — | — | — | — | 3,000 | — | ||||||||||||||||||||||||||||||
Research and development expense | 36,319 | 35,203 | 40,070 | 40,289 | 60,600 | 41,577 | 36,319 | 35,203 | 40,070 | 40,289 | ||||||||||||||||||||||||||||||
General and administrative expense | 8,973 | 8,423 | 7,183 | 6,956 | 7,492 | 12,268 | 8,973 | 8,423 | 7,183 | 6,956 | ||||||||||||||||||||||||||||||
Other expense (income), net | 3764 | 412 | 1,128 | 450 | (529 | ) | ||||||||||||||||||||||||||||||||||
Other income (expense), net | 8,169 | (3,764 | ) | (412 | ) | (1,128 | ) | (450 | ) | |||||||||||||||||||||||||||||||
Net loss | $ | (51,743 | ) | $ | (46,739 | ) | $ | (53,039 | ) | $ | (47,218 | ) | $ | (73,112 | ) | $ | (50,310 | ) | $ | (51,743 | ) | $ | (46,739 | ) | $ | (53,039 | ) | $ | (47,218 | ) | ||||||||||
Loss per share, basic and diluted | $ | (0.66 | ) | $ | (0.64 | ) | $ | (0.88 | ) | $ | (0.93 | ) | $ | (1.56 | ) | $ | (0.58 | ) | $ | (0.66 | ) | $ | (0.64 | ) | $ | (0.88 | ) | $ | (0.93 | ) | ||||||||||
Weighted average number of common shares outstanding | 78,463 | 73,126 | 60,146 | 50,645 | 46,840 | 86,100 | 78,463 | 73,126 | 60,146 | 50,645 | ||||||||||||||||||||||||||||||
Balance Sheet Data: | ||||||||||||||||||||||||||||||||||||||||
(at end of the period) | ||||||||||||||||||||||||||||||||||||||||
Unrestricted cash, cash equivalents and marketable securities | $ | 97,563 | $ | 66,849 | $ | 102,004 | $ | 55,848 | $ | 92,682 | ||||||||||||||||||||||||||||||
Unrestricted cash, cash equivalents and available-for-sale securities | $ | 269,123 | $ | 97,563 | $ | 66,849 | $ | 102,004 | $ | 55,848 | ||||||||||||||||||||||||||||||
Total assets | 139,784 | 117,997 | 160,589 | 108,683 | 151,374 | 307,920 | 139,784 | 117,997 | 160,589 | 108,683 | ||||||||||||||||||||||||||||||
Current portion of long-term obligations | 527 | 427 | 545 | 530 | 530 | — | 527 | 427 | 545 | 530 | ||||||||||||||||||||||||||||||
Long-term obligations | 4,659 | 4,996 | 5,306 | 5,727 | 6,172 | 1,112 | 4,659 | 4,996 | 5,306 | 5,727 | ||||||||||||||||||||||||||||||
Stockholders’ equity | 124,955 | 102,113 | 144,286 | 92,697 | 135,003 | 294,528 | 124,955 | 102,113 | 144,286 | 92,697 | ||||||||||||||||||||||||||||||
Working capital | 95,511 | 64,073 | 99,286 | 56,876 | 90,366 | 267,002 | 95,511 | 64,073 | 99,286 | 56,876 | ||||||||||||||||||||||||||||||
| Item 7. | Management’s Discussion and Analysis of Financial Condition and Results of Operations |
The following discussion should be read in conjunction with our accompanying Financial Statements and Notes thereto included within this Annual Report on Form 10-K. In addition to historical information, this Annual Report on Form 10-K and the following discussion contain statements that are not historical facts and are considered forward-looking within the meaning of the Private Securities Litigation Reform Act of 1995. These forward-looking statements contain projections of our future results of operations or of our financial position or state other forward-looking information. In some cases you can identify these statements by forward-looking words such as “anticipate,” “believe,” “could,” “estimate,” “expect,” “intend,” “may,” “should,” “will” and “would” or similar words. We believe that it is important to communicate our future expectations to our investors. However, there may be events in the future that we are not able to accurately predict or control and that may cause our actual results to differ materially from the expectations we describe in our forward-looking statements. Investors are cautioned not to rely on forward-looking statements because they involve risks and uncertainties, and actual results may differ materially from those discussed as a result of various factors,
including, but not limited to: the risk that orders will not ship or convert to revenue, in whole or in part; our ability to develop commercially viable on-site energy products; the cost and timing of developing our on-site energy products; market acceptance of our on-site energy products; our ability to manufacture on-site energy products on a large-scale commercial basis; competitive factors, such as price competition and competition from other traditional and alternative energy companies; the cost and availability of components and parts for our on-site energy products; the ability to raise and provide the necessary capital to develop, manufacture and market our on-site energy products; our ability to establish relationships with third parties with respect to product development, manufacturing, distribution and servicing and the supply of key product components; our ability to protect our intellectual property; our ability to lower the cost of our on-site energy products and demonstrate their reliability; the cost of complying with current and future governmental regulations; the impact of deregulation and restructuring of the electric utility industry on demand for our on-site energy products; fluctuations in the trading price and volume of our common stock and other risks and uncertainties discussed under Item IA—Risk Factors. Readers should not place undue reliance on our forward-looking statements. These forward-looking statements speak only as of the date on which the statements were made and are not guarantees of future performance. Except as may be required by applicable law, we do not undertake or intend to update any forward-looking statements after the date of this Annual Report on Form 10-K.
Overview
We design and develop on-site energy systems based on proton exchange membrane fuel cell technology, for commercial and residential energy consumers worldwide. We are focused on a platform-based systems, architecture, which includesinclude proton exchange membrane, (PEM)or PEM, fuel cell and fuel processing technologies, from which we are offering or developing multiple products. We are currently offering our GenCore® product for commercial sale. Our GenCore® product is a back-up power product for telecommunications, broadband, utility and industrial uninterruptible power supply, (UPS)or UPS, applications. We are also developing additional products for continuous run power applications, with optional combined heat and power capability for remote small commercial and remote residential applications.
We are a development stage enterprise in the early period of field-testing and marketing our initial commercial products to a limited number of customers, including telecommunications companies, utilities, government entities and our distribution partners. Our initial commercial product, the GenCore® 5T, is designed to provide direct-current (DC) backup power for the targeted application described above. See “Product Development and Commercialization.” The GenCore® 5T is fueled by hydrogen and does not require a fuel processor.
Our sales and marketing strategy is to build a network of leading distributors who have established relationships, and sub-distributor networks, that can distribute and service our products in specifictargeted geographic and/or market segments. We have distribution agreements in place with 4 domestic16 distributors, including Tyco, Electronics Power Systems, Inc., (Tyco) our largest North American distribution partner and 13 international distributors, including IST, Holdings Ltd. (IST) our distribution partner in South Africa with whom we recently jointly received a $3 million customer buy-down grant from the International Finance Corporation to install 400 fuel cell systems over the next three years.in 2005. We also form relationships with customers and enter into development and demonstration programs with telecommunications companies, electric utilities, government agencies and other energy providers. Many of our initial sales of GenSys® and GenCore® 5T are contract specificcontract-specific arrangements containing multiple obligations that may include a combination of fuel cell systems, continued service, maintenance and other support. While contract terms require payment upon delivery and installation of the fuel cell system and are not contingent on the achievement of specific milestones or other substantive performance, theThe multiple obligations within our contractual arrangements are not accounted for separately based on our limited commercial experience and available evidence of fair value. As a result, we defer recognition of product and service revenue and recognize revenue on a straight linestraight-line basis over the stated contractual terms as the continued service, maintenance and other support obligations expire, which are generally for periods of twelve to twenty-seventhirty months. However, if the warranty or service period is expected to exceed the contractual warranty/service period the deferred revenue would be recognized over that expected longer warranty/service period and may not begin until units are installed. See “Critical Accounting Policies and Estimates—Revenue Recognition.”
As we gain commercial experience, including field experience relative to service and warranty of our initial products, the fair values for the multiple elements within our future contracts may become determinable and we
may, in future periods, recognize product revenue upon delivery or installation of the product, or we may continue to defer recognition, based on application of appropriate guidance within EITF 00-21, “Accounting for Revenue Arrangements with Multiple Deliverables,” or changes in the manner in which we structure contractual agreements, including our agreements with distribution partners.
Our cash requirements depend on numerous factors, including completion of our product development activities, ability to commercialize our fuel cell systems, market acceptance of our systems and other factors. We expect to pursue the expansion of our operations through internal growth and strategic acquisitions. As of December 31, 2005,2006, we had unrestricted cash and cash equivalents and marketableavailable-for-sale securities totaling $97.6$269.1 million and working capital of $95.5$267.0 million. Additionally, we have restricted cash in the amount of $4.0 million, which is escrowed to secure the mortgage on our headquarters facility.
During the year ended December 31, 2005,2006, cash used by operating activities was $39.9$46.1 million, consisting primarily of a net loss of $51.7$50.3 million offset, in part, by non-cash expenses in the amount of $12.7$8.1 million, including $3.4$3.2 million for amortization and depreciation $2.9and $4.9 million for stock based compensation, $688,000 for amortization of intangible assets and $5.8 million for equity losses in affiliates.compensation. Cash used in investing activities for the year ended December 31, 20052006 was $28.6$163.6 million, consisting of $27.6$161.3 million of net of purchases of marketable securities, and $1.0$1.3 million used to purchase property, plant and equipment.equipment and a $1.0 million loan made to a potential investee. Cash provided by financing activities was $71.4$214.8 million, consisting primarily of net proceeds, in the amount of $70.6$214.4 million, from the issuancesale of commonour Class B capital stock duringto Smart Hydrogen and payment of $4.0 million to settle our debt obligation related to the Company’s public offeringpurchase of the facilities in the third quarter of 2005.1999.
We have financed our operations through December 31, 20052006, primarily from the sale of equity, which has provided cash in the amount of $420.8$635.7 million since inception. Additionally cumulativeCumulative net cash used in operating activities has been $302.2$348.4 million, and cash used in investing activities has been $90.0$253.6 million, including our purchase of property, plant and equipment of $32.7$34.0 million and our net investments in marketable securities in the amount of $75.9$237.3 million offset, in part, by net proceeds from acquisition of $29.5 million.
Product Development and Commercialization
We are focused on a fuel cell technology platform from which we believe we can offer multiple products. We currently have one commercial product line, GenCore®, which we continue to enhance and broaden:
GenCore®—Back-up Power for Telecommunication, Broadband, Utility and UPS Applications—We currently offer the GenCore® product line which is focused on providing direct-current (DC) backup power in a power range of 1-12 kilowatts for applications in the telecom, broadband, utility and industrial UPS market applications. Our GenCore® products are fueled by hydrogen and do not require a fuel processor. In the fourth quarter of 2003, we began initial shipments of the GenCore® 5T product, and have shipped 233 units through December 31, 2005. See “Distribution, Marketing and Strategic Relationships” for additional information regarding product development and commercialization.
Additionally, we continue to advance the development of our other technology platforms:
GenSys®—Remote Continuous Power for Light Commercial and Residential Applications—We plan to continue to develop GenSys® into a platform that is expected to support a number of products, including systems fueled by liquefied petroleum gas, (LPG)or LPG, for remote applications and, eventually, both grid independent and grid-connected light commercial and residential applications fueled by LPG or natural gas. In connection with the development of our GenSys® platform, we are developing combined heat and power (CHP) fuel cell systems for light commercial and residential applications that provide supplemental heat as electricity is produced. We began field-testing of the next generation GenSys®, our continuous run product, in the third quarter of 2005. See “Distribution, Marketing and Strategic Relationships” for additional information regarding product development and commercialization.
Home Energy Station—We have been developing technology in support of the automotive fuel cell market under a series of agreements with Honda R&D Co Ltd. of Japan (Honda), a subsidiary of Honda Motor Co., Ltd., under which we have exclusivelydeveloped, on a joint and jointly developedexclusive basis, and tested three phases of prototype fuel cell systems that provide electricity and heat to a home or business, while also providing
hydrogen fuel for a fuel cell vehicle (the “Home(named the Home Energy Station”)Station). In OctoberSince 2003, we have successfully demonstrated three successive prototype generations of the first prototype Home Energy Station at Honda R&D Americas’ facility in Torrance, California. In September 2004, underCalifornia and at Plug Power’s facility in Latham, NY. The companies are currently collaborating on the second phase of our work with Honda, we successfully demonstrated a second-generationfourth generation prototype Home Energy Station pursuant to the latest agreement signed in early 2006. Across each generation of the Home Energy Station, at our Latham NY headquarters. In September 2005, Plug Power and Honda installed our third-generation Home Energy Station in Torrance, California. Honda now utilizes the systems in both New York and California for refueling prototype Honda FCX fuel cell vehicles in their test programs. Across each generation of the HES, we have significantly reduced size and weight, as well as improved performance. We are currently negotiating a contract with Honda funding our joint development of the fourth generation system during 2006, as well as a separate agreement funding joint research & development, in 2006, of technology that may be utilized in future systems.
We also have longer-term product development plans that potentially include GenSite™ a product which supplies on-site hydrogen, and GenDrive™ a product offering battery replacement for material handling equipment.
GenSite™—On-Site Hydrogen Generation—We expect to combine our proprietary fuel processor technology with existing components for gas compression, purification and storage as the basis for GenSite™, an on-site hydrogen gas generator. This product is expected to target certain applications now served by packaged hydrogen gas (cylinders or tube trailers) or electrolyzers. We presently have a prototype system in our research and product development facilities in Apeldoorn, Holland, and another system at our Latham, NY headquarters.
GenDrive™—Battery Replacement for Material Handling—The GenCore® platform is expected to provide the basis for our development of the GenDrive™ product, a hydrogen-fueled battery-replacement module for material handling equipment. We continue to explore the potential for partnerships with end users of this product to develop the GenDrive™ product.
Results of Operations
Comparison of the Years Ended December 31, 2006 and December 31, 2005.
Product and service revenue. Product and service revenue decreased to $2.7 million for the year ended December 31, 2006, from $4.9 million for the year ended December 31, 2005, primarily due to a decrease in the amount of revenue recognized for units shipped prior to 2006. We defer recognition of product and service revenue at the time of delivery and recognize revenue as the continued service, maintenance and other support obligations expire. However, if the warranty or service period is expected to exceed the contractual warranty/service period the deferred revenue would be recognized over that expected longer warranty/service period and may not begin until units are installed. The costs associated with the product, service and other obligations are expensed as they are incurred.
Many of our initial sales of GenSys® and GenCore® 5T products contain multiple obligations that may include a combination of fuel cell systems, continued service, maintenance and other support. While contract terms generally require payment shortly after delivery and installation of the fuel cell system and are not contingent on the achievement of specific milestones or other substantive performance, the multiple obligations within our contractual arrangements are not accounted for separately based on our limited commercial experience and available evidence of fair value of the different components. As a result, we defer recognition of product and service revenue and recognize revenue on a straight-line basis as the continued service, maintenance and other support obligations expire, which are generally for periods of twelve to thirty months. However, if the warranty or service period is expected to exceed the contractual warranty/service period the deferred revenue would be recognized over that expected longer warranty/service period and recognition of revenue may not begin until units are installed. See “Critical Accounting Policies and Estimates—Revenue Recognition.”
During the year ended December 31, 2006, we shipped 152 fuel cell systems and recognized product and service revenue against these current year deliveries in the amount of $779,000. We also recognized $1.9 million of revenue originally deferred at December 31, 2005. This compares to 134 fuel cell systems shipped for the year ended December 31, 2005, during which we recognized $940,000 of product and service revenue against 2005 deliveries and $4.0 million of revenue originally deferred at December 31, 2004. Of the 2006 shipments, 43 units were on a consignment basis and no revenues were recorded in 2006. Total installations for the year ended December 31, 2006 were 94 units compared with the 91 units for the comparable 2005 period. Units shipped and not installed at December 31, 2006 were 149 (including units shipped on consignment), compared with 99 at the end of 2005.
During 2006 and 2005, we invoiced $2.3 million and $2.5 million, respectively, for the delivery of fuel cell systems and recognized revenue of $2.7 million and $4.9 million, respectively. Any differences between the amounts invoiced and the recognized revenue is a result of deferred revenue recognized in accordance with our revenue recognition policy as described above.
Research and development contract revenue. Research and development contract revenue decreased to $5.2 million for the year ended December 31, 2006 from $8.6 million for the year ended December 31, 2005. The decrease is the result of spending levels decreasing for material purchases and subcontractor activity as the U.S. Department of Energy, or DOE, and the U.S. Department of Defense, or DOD, programs wind down and decreased activity under our contract with the National Institute of Standards and Technology, or NIST, and with
Honda R&D Co., Ltd. of Japan. We expect to continue certain research and development contract work that is directly related to our current product development efforts. Research and development contract revenue primarily relates to cost reimbursement research and development contracts associated with the development of PEM fuel cell technology. We generally share in the cost of these programs with our cost-sharing percentages being from 20% to 51% of total project costs. Revenue from “time and material” contracts is recognized on the basis of hours expended plus other reimbursable contract costs incurred during the period. We expect to continue certain research and development contract work that is directly related to our current product development efforts.
Cost of product and service revenue. Cost of product and service revenue increased to $4.8 million for the year ended December 31, 2006 from $4.1 million for the year ended December 31, 2005. Cost of product and service revenue includes the direct material cost incurred in the manufacture of the products we sell as well as the labor and material costs incurred for product maintenance, replacement parts and service under our contractual obligations. These costs consist primarily of production materials and fees paid to outside suppliers for subcontracted components and services. The year over year increase to cost of product and service revenue is primarily the result of an increase in warranty costs resulting from a greater number of units placed in the field during 2006. For the year ended December 31, 2006 installations were 94 units compared with 91 units for the year ended December 31, 2005.
Cost of research and development contract revenue. Cost of research and development contract revenue decreased to $7.6 million for the year ended December 31, 2006 from $12.1 million for the year ended December 31, 2005. Cost of research and development contract revenue includes costs associated with research and development contracts including: compensation and benefits for engineering and related support staff, fees paid to outside suppliers for subcontracted components and services, fees paid to consultants for services provided, materials and supplies used and other directly allocable general overhead costs allocated to specific research and development contracts. The decrease in these costs is directly related to the decreased activity under the development agreements described above under research and development contract revenue.
Noncash research and development expense.Noncash research and development expense increased to $2.8 million for the year ended December 31, 2006 from $1.6 million for the year ended December 31, 2005. Noncash research and development expense represents the fair value of vested stock grants and vested stock options to employees, consultants and others in exchange for services provided. The increase is primarily the result of the Company’s adoption of SFAS 123R during the first quarter of fiscal 2006 (see Note 2 in the Notes to Consolidated Financial Statements).
Other research and development expense. Other research and development expense increased to $38.8 million for the year ended December 31, 2006 from $34.7 million for the year ended December 31, 2005. The increase in other research and development expense is primarily the result of our accelerated efforts to advance the development of our next generation continuous run product combined with continued research and development activities related to future product initiatives. We also had fewer resources allocated to research and development programs reflected in cost of revenues for research and development under DOE, NIST and Honda research and development contracts (as discussed above). Other research and development expense includes: materials to build development and prototype units, cash compensation and benefits for the engineering and related staff, expenses for contract engineers, fees paid to outside suppliers for subcontracted components and services, fees paid to consultants for services provided, materials and supplies consumed, facility related costs such as computer and network services and other general overhead costs.
Other research and development expense also includes amortization in the amount of $0 and $700,000 for the years ended December 31, 2006 and 2005, respectively, related to the portion of the H Power purchase price that represented capitalized technology and was recorded on our balance sheet under the caption “Intangible assets”. As of December 31, 2005, the carrying value of these intangible assets had been fully amortized.
Noncash general and administrative expense.Noncash general and administrative expense was $1.4 million for the year ended December 31, 2006 compared to $1.5 million for the year ended December 31, 2005. Noncash
general and administrative expense represents the fair value of vested stock grants and vested stock options to employees, consultants and others in exchange for services provided. The year over year expense remained relatively flat as the increase in expenses resulting from the adoption of SFAS 123R (see Note 2 in the Notes to Consolidated Financial Statements) was offset by a decrease in expenses for consultants.
Other general and administrative expense. Other general and administrative expenses increased to $10.8 million for the year ended December 31, 2006 from $7.4 million for the year ended December 31, 2005. Other general and administrative expense includes cash compensation, benefits and related costs in support of our general corporate functions, including general management, finance and accounting, human resources, marketing, information technology and legal services. The increase in other general and administrative expenses is primarily a result of increased headcount, charges related to severance packages for departing employees and payments made to strategic consultants.
Interest income and net realized gains/losses from the sale of available-for-sale securities.Interest income and net realized gains/losses from the sale of available-for-sale securities, consisting primarily of interest earned on our cash, cash equivalents and available-for-sale securities, increased to $8.3 million for the year ended December 31, 2006 from $2.2 million for the year ended December 31, 2005. The increase was the result of higher cash and marketable securities balances as a result of the sale of our Class B capital stock to Smart Hydrogen Inc. in 2006 and slightly higher yields on our investment portfolio. Total net realized gains/losses from available-for-sale securities was approximately a $68 thousand gain and a $74 thousand loss for the years ended December 31, 2006 and 2005, respectively.
Interest expense. Interest expense consists of interest on a long-term obligation related to the purchase of our facilities and interest paid on capital lease obligations. Interest expense was $171,000 for the year ended December 31, 2006, compared to $146,000 for the year ended December 31, 2005. As of December 31, 2006 the debt associated with the purchase of the facility was paid for in full. The long-term debt accrued interest at a variable rate that was approximately 4.44% for the year ended December 31, 2005.
Equity in losses of affiliates. Equity in losses of affiliates was $0 for the year ended December 31, 2006 and $5.8 million for the year ended December 31, 2005. Equity in losses of affiliates, which we accounted for under the equity method of accounting, was our proportionate share of the amount of the net loss of GE Fuel Cell Systems, or GEFCS, and the amortization of our original investments. During the quarter ended December 31, 2005, the Company recorded an impairment loss equal to 100% of the remaining carrying value of the Company’s investment in GEFCS due to the changes in the relationship that eventually resulted in GEFCS being dissolved in the first quarter of fiscal 2006.
Income taxes. We did not report a benefit for federal and state income taxes in the consolidated financial statements as the deferred tax asset generated from our net operating loss has been offset by a full valuation allowance because it is more likely than not that the tax benefits of the net operating loss carry forward will not be realized.
Comparison of the Years Ended December 31, 2005 and December 31, 2004.
Product and service revenue. Product and service revenue decreased to $4.9 million for the year ended December 31, 2005, from $5.3 million for the year ended December 31, 2004. We defer recognition of product and service revenue at the time of delivery and recognize revenue as the continued service, maintenance and other support obligations expire. The costs associated with the product, service and other obligations are expensed as they are incurred.
Many of our initial sales of GenSys® and GenCore® 5T products are contract specific arrangements containing multiple obligations that may include a combination of fuel cell systems, continued service, maintenance and other support. While contract terms require payment upon delivery and installation of the fuel cell system and are not contingent on the achievement of specific milestones or other substantive performance, the multiple obligations within our contractual arrangements are not accounted for separately based on our limited commercial experience and available evidence of fair value. As a result, we defer recognition of product and service revenue and recognize revenue on a straight-line basis over the stated contractual terms, as the continued service, maintenance and other support obligations expire, which are generally for periods of twelve to twenty-seven months. See “Critical Accounting Policies and Estimates—Revenue Recognition.”
During the year ended December 31, 2005, we delivered 135134 fuel cell systems and recognized product and service revenue against these current year deliveries in the amount of $940,000 combined with the recognition of
$4.0 $4.0 million of revenue originally deferred at December 31, 2004. This compares to 150 fuel cell systems delivered for the year ended December 31, 2004, during which we recognized $1.4 million of product and service revenue against 2004 deliveries combined with the recognition of $3.9 million of revenue originally deferred at December 31, 2005.2003.
During 2005 and 2004, we invoiced $2.5 million and $5.7 million, respectively, for the delivery of fuel cell systems and recognized revenue of $4.9 million and $5.3 million in 2005 and 2004, respectively. The difference between the amounts invoiced and the recognized revenue in 2005 and 2004 represents a component of deferred revenue at December 31, 2005 and 2004. During 2006, we expect to recognize substantially all of the deferred revenue as of December 31, 2005.
Research and development contract revenue. Research and development contract revenue decreased to $8.6 million for the year ended December 31, 2005 from $10.8 million for the year ended December 31, 2004. The decrease is the result of prior spending levels dropping off for material purchases and subcontractor activity as the U.S. Department of Energy (DOE) programs wind down and decreased activity under our contract with National Institute of Standards and Technology (NIST) and with Honda R&D Co., Ltd. of Japan. We expect to continue certain research and development contract work that is directly related to our current product development efforts. Research and development contract revenue primarily relates to cost reimbursement research and development contracts associated with the development of PEM fuel cell technology. We generally share in the cost of these programs with cost-sharing percentages between 20% and 60%. Revenue from “time and material” contracts is recognized on the basis of hours utilized, plus other reimbursable contract costs incurred during the period.
Cost of product and service revenue. Cost of product and service revenue decreased to $4.1 million for the year ended December 31, 2005 from $5.4 million for the year ended December 31, 2004. Cost of product and service revenue includes the direct material cost incurred in the manufacture of the products we sell, as well as the labor and material costs incurred for product maintenance, replacement parts and service under our contractual obligations. These costs consist primarily of production materials and fees paid to outside suppliers for subcontracted components and services. The year over year decrease to cost of product and service revenue is directly related to an increased proportion of our fuel cell system deliveries coming from GenCore® product which has a lower direct materials cost per unit than our GenSys® product. Our GenCore® products are fueled by hydrogen and do not require a fuel processor, thereby eliminating certain costs. For the year ended December 31, 2005 we shipped 121120 GenCore® units and 14 GenSys® units compared to 93 and 56 GenCore® and GenSys® units, respectively, in 2004.
Cost of research and development contract revenue. Cost of research and development contract revenue decreased to $12.1 million for the year ended December 31, 2005 from $13.5 million for the year ended December 31, 2004. Cost of research and development contract revenue includes costs associated with research and development contracts including: compensation and benefits for engineering and related support staff, fees paid to outside suppliers for subcontracted components and services, fees paid to consultants for services, and materials and supplies and other directly allocable general overhead costs allocated to specific research and development contracts. The decrease in these costs is directly related to the decreased activity under the development agreements described above under research and development contract revenue.
Noncash research and development expense.Noncash research and development expense decreased to $1.6 million for the year ended December 31, 2005 from $2.6 million for the year ended December 31, 2004. Noncash research and development expense represents the fair value of vested stock grants to employees, consultants and others in exchange for services provided. The decrease is primarily the result of fully expensing amortization of stock based compensation associated with restricted stock issued in June 2003 under our employee stock option exchange program.2003. In 2004 we had a full year of such amortization.
Other research and development expense. Other research and development expense increased to $34.7 million for the year ended December 31, 2005 from $32.6 million for the year ended December 31, 2004.
The increase in research and development expense is primarily the result of our accelerated efforts to advance the development of our next generation continuous run product combined with continued research and development activities related to future product initiatives. We also had fewer resources allocated to research and development programs reflected in cost of revenues for research and development under DOE, NIST and Honda research and development contracts (as discussed above).
Other research and development expense also includesincluded amortization in the amount of $700,000 and $3.5 million for the years ended December 31, 2005 and 2004, respectively. For the year ended December 31, 2005, amortization expense included $700,000 related to the portion of the H Power purchase price that was capitalized and recorded on our balance sheet under the caption “Intangible assets”. For the year ended
December 31, 2004, other research and development expense included amortization expense of $2.8 million related to the H Power intangible asset and $708,000 for amortization of prepaid development costs under our joint development program with Engelhard, recorded on our balance sheet under the caption “Prepaid development costs”.
Capitalized technology acquired as a result of our merger with H Power, is recorded on our balance sheet under the caption “Intangible assets” and at December 31, 2005, the carrying value of these intangible assets have been fully amortized. Prepaid development costs under our joint development program with Engelhard, is recorded on our balance sheet under the caption “Prepaid development costs” became fully amortized in the year ended December 31, 2004.
Noncash general and administrative expense.Noncash general and administrative expense was $1.5 million for the year ended December 31, 2005 compared to $1.4 million for the year ended December 31, 2004. Noncash general and administrative expense represents the fair value of vested stock grants to employees, consultants and others in exchange for services provided.
Other general and administrative expense. Other general and administrative expenses increased to $7.4 million for the year ended December 31, 2005 from $7.0 million for the year ended December 31, 2004. Other general and administrative expense includes compensation, benefits and related costs in support of our general corporate functions including general management, finance and accounting, human resources, marketing, information technology and legal services. The increase in other general and administrative expenses is the result of our increase in sales and marketing expenses for the year ending December 31, 2005, in support of commercialization of our products. Based on our current level of operations, no significant increase in other general and administrative expenses is anticipated in 2006.
Interest income.income and net realized gains/losses from the sale of available-for-sale securities. Interest income, consisting of interest earned on our cash, cash equivalents and marketableavailable-for-sale securities, increased to $2.2 million for the year ended December 31, 2005, from $1.4$1.5 million for the year ended December 31, 2004. The increase was primarily due to an increase in our investment portfolio forfrom funds received as a result of our public offering of 12,000,000 shares of common stock in August, 2005. See “Liquidity and Capital Resources.” Total net realized gains/losses from available-for-sale securities was approximately a $74 thousand loss and a $348 thousand gain for the years ended December 31, 2005 and 2004, respectively.
Interest expense. Interest expense consists of interest on a long-term obligation related to our facilities and interest paid on capital lease obligations. Interest expense was $146,000 for the year ended December 31, 2005, compared to $61,000 for the year ended December 31, 2004. The long-term debt accrues interest at a variable rate that was approximately 4.44% and 2.37% at December 31, 2005 and 2004, respectively.
Equity in losses of affiliates. Equity in losses of affiliates was $5.8 million for the year ended December 31, 2005 and $1.8 million for the year ended December 31, 2004. Equity in losses of affiliates, which we accountaccounted for under the equity method of accounting, iswas our proportionate share of the losses of GEFCS in the amount of $10,000 and amortization of intangible assets in the amount of $1.8 million. Additionally, during the fourth quarter of 2005 we recorded an other than temporary impairment of our investment in GEFCS, in the amount of $4.0 million, in accordance with APB 18,The Equity Method of Accounting for Investments in Common Stock, primarily due to a
shift in the Company’s business strategy away from residential fuel cells, for which GEFCS was well suited as a distribution partner, to back-up power generation, for which GEFCS is not a natural partner. Based upon this shift in strategy it was determined that GEFCS lacked the ability to sustain an earning capacity which would justify the carrying amount of the investment.
Income taxes. We did not report a benefit for federal and state income taxes in the consolidated financial statements as the deferred tax asset generated from our net operating loss has been offset by a full valuation allowance because it is more likely than not that the tax benefits of the net operating loss carry forward may not be realized.
Comparison of the Years Ended December 31, 2004 and December 31, 2003.
Product and service revenue. Product and service revenue decreased to $5.3 million for the year ended December 31, 2004, from $7.5 million for the year ended December 31, 2003. We defer recognition of product and service revenue at the time of delivery and recognize revenue as the continued service, maintenance and other support obligations expire. The costs associated with the product, service and other obligations are expensed as they are incurred.
Our initial sales of GenSys® and GenCore® 5T are contract specific arrangements containing multiple obligations, that may include a combination of fuel cell systems, continued service, maintenance and other support. While contract terms require payment upon delivery and installation of the fuel cell system and are not contingent on the achievement of specific milestones or other substantive performance, the multiple obligations within our contractual arrangements are not accounted for separately based on our limited commercial experience and available evidence of fair value. As a result, we defer recognition of product and service revenue and recognize revenue on a straight-line basis over the stated contractual terms, as the continued service, maintenance and other support obligations expire, which are generally for periods of twelve to twenty-seven months.
As we gain commercial experience, including field experience relative to service and warranty based on the sales of our initial products, the fair values for the multiple elements within our future contracts may become determinable and we may, in future periods, recognize revenue upon delivery of the product or we may continue to defer recognition, based on application of appropriate guidance within EITF 00-21, “Accounting for Revenue Arrangements with Multiple Deliverables,” or changes in the manner in which we structure contractual agreements, including our agreements with distribution partners.
During the year ended December 31, 2004, we delivered 150 fuel cell systems and recognized product and service revenue against these current year deliveries in the amount of $1.4 million combined with the recognition of $3.9 million of revenue originally deferred at December 31, 2003. This compares to 145 fuel cell systems delivered for the year ended December 31, 2003, during which we recognized $2.1 million of product and service revenue against 2002 deliveries combined with the recognition of $5.4 million of revenue originally deferred at December 31, 2002.
During 2004 and 2003, we invoiced $5.7 million and $6.8 million, respectively, for the delivery of fuel cell systems and recognized revenue of $5.3 million and $4.7 million in 2004 and 2003, respectively. The difference between the amounts invoiced and the recognized revenue in 2004 and 2003 represents a component of deferred revenue at December 31, 2004 and 2003.
Research and development contract revenue. Research and development contract revenue increased to $10.8 million for the year ended December 31, 2004 from $5.0 million for the year ended December 31, 2003. The increase is due to the addition of development agreements with the U.S. Department of Defense (DOD) and increased activity under U.S. Department of Energy (DOE), National Institute of Standards and Technology (NIST), New York State Energy Research and Development Authority (NYSERDA) and Honda R&D Co., Ltd. of Japan research and development contracts. We expect to continue certain research and development contract
work that is directly related to our current product development efforts. Research and development contract revenue primarily relates to cost reimbursement research and development contracts associated with the development of PEM fuel cell technology. We generally share in the cost of these programs with cost-sharing percentages between 20% and 60%. Revenue from “time and material” contracts is recognized on the basis of hours utilized, plus other reimbursable contract costs incurred during the period.
Cost of product and service revenue. Cost of product and service revenue decreased to $5.4 million for the year ended December 31, 2004 from $7.2 million for the year ended December 31, 2003. Cost of product and service revenue includes the direct material cost incurred in the manufacture of the products we sell, as well as the labor and material costs incurred for product maintenance, replacement parts and service under our contractual obligations. These costs consist primarily of production materials and fees paid to outside suppliers for subcontracted components and services. This decrease is primarily related to the decrease in the cost of production materials for the units shipped, offset, in part by an increase in the service costs as a result of the increase in operational field units.
Cost of research and development contract revenue. Cost of research and development contract revenue increased to $13.5 million for the year ended December 31, 2004 from $7.0 million for the year ended December 31, 2003. Cost of research and development contract revenue includes costs associated with research and development contracts including: compensation and benefits for engineering and related support staff, fees paid to outside suppliers for subcontracted components and services, fees paid to consultants for services, and materials and supplies and other directly allocable general overhead costs allocated to specific research and development contracts. The increase in these costs relates primarily to the additional activity under the development agreements described above under research and development contract revenue.
Noncash research and development expense. Noncash research and development expense increased to $2.6 million for the year ended December 31, 2004 from $1.8 million for the year ended December 31, 2003. Noncash research and development expense represents the fair value of stock grants to employees, consultants and others in exchange for services provided. The increase is primarily the result of stock based compensation associated with the amortization of restricted stock issued in June 2003 under our employee stock option exchange program.
Other research and development expense. Other research and development expense decreased to $32.6 million for the year ended December 31, 2004 from $38.3 million for the year ended December 31, 2003. The decline in research and development expense is primarily the result of an increase in resources allocated to research and development programs reflected in cost of revenues for research and development under DOE, NYSERDA and Honda R&D Co., Ltd. of Japan research and development contracts (as discussed above). Our approach to the design of our next generation fuel cell system uses advanced modeling and system simulation techniques, which result in lower research and development costs because we build fewer systems for internal test and evaluation.
Other research and development expense also includes amortization in the amount of $3.5 million and $4.4 million for the years ended December 31, 2004 and 2003, respectively. For the year ended December 31, 2004, amortization expense includes amortization of prepaid development costs in the amount of $708,000 under our joint development program with Engelhard, recorded on our balance sheet under the caption “Prepaid development costs”, and amortization in the amount of $2.8 million related to the portion of the H Power purchase price which has been capitalized and recorded on our balance sheet under the caption “Intangible assets”. For the year ended December 31, 2003, other research and development expense included amortization of prepaid development costs in the amount of $1.8 million under our joint development program with Engelhard, amortization in the amount of $515,000 related to our purchase of certain fuel processing from Gastec and $2.1 million related to the portion of the H Power purchase price that has been capitalized.
Amortization of capitalized technology acquired as a result of our merger with H Power, is recorded on our balance sheet under the caption “Intangible assets”. At December 31, 2004, the carrying value of intangible assets acquired from H Power was $688,000, and the joint development program with Engelhard was fully amortized.
Noncash general and administrative expense. Noncash general and administrative expense increased to $1.4 million for the year ended December 31, 2004 from $896,000 for the year ended December 31, 2003. Noncash general and administrative expense represents the fair value of stock grants to employees, consultants and others in exchange for services provided. The increase is primarily the result of stock based compensation associated with the amortization of restricted stock issued in June 2003 under our employee stock option exchange program.
Other general and administrative expense. Other general and administrative expenses increased to $7.0 million for the year ended December 31, 2004 from $6.3 million for the year ended December 31, 2003. Other general and administrative expense includes compensation, benefits and related costs in support of our general corporate functions including general management, finance and accounting, human resources, marketing, information technology and legal services. The increase in other general and administrative expenses is the result of our increase in sales and marketing expenses for the year ending December 31, 2004, in support of commercialization of our products.
Interest income. Interest income, consisting of interest earned on our cash, cash equivalents and marketable securities, increased to $1.5 million for the year ended December 31, 2004, from $833,000 for the year ended December 31, 2003. The increase was primarily due to an increase in our investment portfolio for funds received as a result of our March 2003 acquisition of H Power and our common stock offering in November 2003.
Interest expense. Interest expense consists of interest on a long-term obligation related to our facilities and interest paid on capital lease obligations. Interest expense was $61,000 for the year ended December 31, 2004, compared to $62,000 for the year ended December 31, 2003. The debt accrues interest at a variable rate of interest that was approximately 2.37% and 1.30% at December 31, 2004 and 2003, respectively.
Equity in losses of affiliates. Equity in losses of affiliates decreased to $1.8 million for the year ended December 31, 2004 from $1.9 million during the year ended December 31, 2003. Equity in losses of affiliates, which we account for under the equity method of accounting, is our proportionate share of the losses of GEFCS in the amount of $12,000 and amortization of intangible assets in the amount of $1.8 million.
Income taxes. We did not report a benefit for federal and state income taxes in the consolidated financial statements as the deferred tax asset generated from our net operating loss has been offset by a full valuation allowance because it is more likely than not that the tax benefits of the net operating loss carry forward may not be realized.
Critical Accounting Policies and Estimates
The preparation of financial statements in conformity with generally accepted accounting principles and related disclosure requires management to make estimates and assumptions that affect:
the amounts reported for assets and liabilities;
the disclosure of contingent assets and liabilities at the date of the financial statements; and
the amounts reported for revenues and expenses during the reporting period.
Specifically, we must use estimates in determining the economic useful lives of assets, including identifiable intangibles, and various other recorded or disclosed amounts. Therefore, our financial statements and related disclosure are necessarily affected by these estimates. We evaluate these estimates on an ongoing basis, utilizing
historical experience and other methods considered reasonable in the particular circumstances. Nevertheless, actual results may differ significantly from estimates. To the extent that actual outcomes differ from estimates, or additional facts and circumstances cause management to revise estimates, our financial position as reflected in itsour financial statements will be affected. Any effects on business, financial position or results of operations resulting from revisions to these estimates are recorded in the period in which the facts that give rise to the revision become known.
We believe that the following are our most critical accounting policies affected by the estimates and assumptions the Company must make in the preparation of its financial statements and related disclosure:
Revenue recognition: We are a development stage enterprise in the stages of performing field testing and marketing our initial commercial productsproduct to a limited number of customers, including telecom, utilities, government entities and our distribution partners. This initial product is a limited edition fuel cell system that is intended to offer complementary, quality power while demonstrating the market value of fuel cells as a preferred form of alternative distributed power generation. Subsequent enhancements to our initial product are expected to expand the market opportunity for fuel cells by lowering the installed cost, decreasing operating and maintenance costs, increasing efficiency, improving reliability, and adding features such as grid independence and co-generation and UPS applications.
We apply the guidance within Staff Accounting Bulletin No. 104, “Revenue Recognition in Financial Statements” (SAB 104) to our initial sales contracts to determine when to properly recognize revenue. We defer recognition of product and service revenue at the time of delivery and recognize revenue as the continued service, maintenance and other support obligations expire. The costs associated with the product, service and other obligations are expensed as they are incurred.
Our initial sales of GenSys® and GenCore® 5T products are contract specific arrangements containingcontain multiple obligations that may include a combination of fuel cell systems, continued service, maintenance and other support. While contract terms generally require payment uponshortly after delivery and installation of the fuel cell system and are not contingent on the achievement of specific milestones or other substantive performance, the multiple obligations within our contractual arrangements are not accounted for separately based on our limited commercial experience and available evidence of fair value. As a result, we defer recognition of product and service revenue and recognize revenue on a straight-line basis over the stated contractual terms, as the continued service maintenance and other support obligations expire,period, which areis generally for periods of twelve to twenty-seven months.thirty months, or over the anticipated service period if expected to exceed the contractual service period. In these instances when it is anticipated that the actual service period will exceed the contractual service period, the accretion of the deferred product and service revenue may not begin until the installation of the unit and will continue through the expected service period. The costs associated with the product, service and other obligations are expensed as they are incurred.
As we gain commercial experience, including field experience relative to service and warranty based on the sales of our initial products, the fair values for the multiple elements within our future contracts may become determinable and we may, in future periods, recognize revenue upon delivery of the product or we may continue to defer recognition, based on application of appropriate guidance within EITF 00-21, “Accounting for Revenue Arrangements with Multiple Deliverables,” or changes in the manner in which we structure contractual agreements, including our agreements with distribution partners.
Valuation of long-lived assets: We assess the impairment of identifiable intangible, long-lived assets and goodwill, if any, whenever events or changes in circumstances indicate that the carrying value may not be recoverable.recoverable and, for goodwill, at least annually. Factors we consider important which could trigger an impairment review include, but are not limited to, the following:
significant underperformance relative to expected historical expectations or projected future operating results;
significant changes in the manner of our use of the acquired assets or the strategy for our overall business;
significant negative industry or economic trends;
our market capitalization relative to net book value.
When we determine that the carrying value of intangible assets, long-lived assets or goodwill, if any, may not be recoverable based upon the existence of one or more of the above indicators of impairment, we would measure any impairment based upon the provisions of Statement of Financial Accounting Standards, (SFAS)or SFAS, No. 142, “Goodwill and Other Intangible Assets” and SFAS No. 144, “Accounting for the Impairment or Disposal of Long-Lived Assets,” as appropriate. Any resulting impairment loss could have a material adverse impact on our financial condition and results of operations. Based on the review during the year ended December 31, 2005,2006, we do not believe that there were any triggering events or that an impairment charge is required.
Accounting for income taxes: As part of the process of preparing our consolidated financial statements, we are required to estimate our income taxes in each of the jurisdictions in which we operate. This process involves the estimation of our actual current tax exposure together with assessing temporary differences resulting from differing treatment of items for tax and accounting purposes. Included in this assessment is the determination of the net operating loss carry forward that has resulted from our cumulative net operating loss since inception. These differences, primarily net operating loss carryforwards, result in a net deferred tax asset. We must assess the likelihood that our deferred tax assets will be recovered from future taxable income, and to the extent that we believe that recovery is not likely, we must establish a valuation allowance. To the extent we establish a valuation allowance or increase this allowance in a period, we must include an expense or forego a benefit within the tax provisionincome taxes in the consolidated statement of operations.
Under Section 382 of the Internal Revenue Code (IRC), the use of loss carryforwards may be limited if a change in ownership of a company, as defined by the IRC, occurs. The Company has determined that due to transactions involving the Company’s shares by significant shareholders, a change of ownership has occurred under the provisions of IRC Section 382. As a result of this change of ownership, the usage of a portion, which may be substantial, of the net operating loss amounts, has become limited. The Company is in the process of determining the impact of this limitation. Once determined, the deferred tax asset related to the net operating loss and an equivalent amount of valuation allowance will be adjusted accordingly.
Significant management judgment is required in determining our provision for income taxes, our deferred tax assets and liabilities and any valuation allowance recorded against our net deferred tax assets. As of December 31, 2005,2006, we have recorded a valuation allowance due to uncertainties related to our ability to utilize the net deferred tax assets, primarily consisting of net operating losses and credits which may be carried forward, before they expire. In the event that actual results differ from these estimates or we adjust these estimates in future periods, we may need to adjust the recorded valuation allowance, which could materially impact our financial position and results of operations. At December 31, 2005,2006, our net deferred tax assets have been offset in full by a valuation allowance. As a result, the net provision for income taxes is zero for the year ended December 31, 2005.2006.
Stock Based Compensation: Our adoption of SFAS No. 123 (revised 2004), “Share-Based Payment”, or SFAS 123(R), in the first quarter of 2006 required that we recognize stock-based compensation expense associated with the vesting of share based instruments in the statement of operations. Determining the amount of stock-based compensation to be recorded requires us to develop estimates to be used in calculating the grant-date fair value of stock options. We calculate the grant-date fair values using the Black-Scholes valuation model. The Black-Scholes model requires us to make estimates of the following assumptions:
Expected volatility—The estimated stock price volatility was derived based upon a blend of implied volatility (i.e. management’s expectation of volatility) and the Company’s actual historic stock prices over the expected life of the options, which represents the Company’s best estimate of expected volatility.
Expected option life—The Company’s estimate of an expected option life was calculated in accordance with the Staff Accounting Bulletin No. 107 (“SAB 107”) simplified method for calculating the expected term assumption. The simplified method is a calculation based on the contractual life of the associated options. The Company will be required to utilize actual historical data to determine the expected option life beginning in 2008.
Risk-free interest rate—We used the yield on zero-coupon U.S. Treasury securities for a period that is commensurate with the expected life assumption as the risk-free interest rate.
The amount of stock-based compensation recognized during a period is based on the value of the portion of the awards that are ultimately expected to vest. SFAS 123(R) requires forfeitures to be estimated at the time of grant and revised, if necessary, in subsequent periods if actual forfeitures differ from those estimates. The term “forfeitures” is distinct from “cancellations” or “expirations” and represents only the unvested portion of the surrendered option. We reviewed historical forfeiture data and determined the appropriate forfeiture rate based on that data. We will re-evaluate this analysis periodically and adjust the forfeiture rate as necessary. Ultimately, we will recognize the actual expense over the vesting period only for the shares that vest.
Recent Accounting Pronouncements: In November 2004,July 2006, the FASB issued SFAS No. 151 “Inventory Costs, an amendment of ARB No. 43”, to clarify the accounting for abnormal amounts of idle facility expense, freight, handling costs, and wasted material (spoilage). SFAS No. 151 requires that those items be recognized as current-period charges regardless of whether they meet the criterion of “so abnormal.” In addition, this Statement requires that allocation of fixed production overheads to the costs of conversion be based on the normal capacity of the production facilities. SFAS No. 151 is effective for inventory costs incurred during fiscal years beginning after June 15, 2005.
In December 2004, the FASB issued SFAS No. 123R, “Share-Based Payment.�� SFAS No. 123R requires employee stock options and rights to purchase shares under stock participation plans to be accounted for under the fair value method, and eliminates the ability to account for these instruments under the intrinsic value method prescribed by APB Opinion No. 25, and allowed under the original provisions of SFAS No. 123. SFAS No. 123R requires the use of an option pricing model for estimating fair value, which is amortized to expense over the service periods. The requirements of SFAS No. 123R are effective for fiscal periods beginning after June 15, 2005. If the Company had applied the provisions of SFAS No. 123R to the financial statements for the period ending December 31, 2005, net loss would have been increased by approximately $4.2 million. SFAS No. 123R allows for either prospective recognition of compensation expenseFinancial Accounting Standards Board, or retrospective recognition, which may be back to the original issuance of SFAS No. 123 or only to interim periods in the year of adoption. The Company is currently evaluating these transition methods.
In March 2005, the FASB, issued FASB Interpretation No. (“FIN”) 47,48, “Accounting for Conditional Asset Retirement Obligations.Uncertainty in Income Taxes-an interpretation of FASB Statement No. 109,” or FIN 4748, which clarifies the accounting for uncertainty in tax positions. This Interpretation requires that the term conditional asset retirement obligation, as usedCompany recognize in SFAS
No. 143, “Accounting for Asset Retirement Obligations,” refersits financial statements the impact of a tax position, if that position is more likely than not to a legal obligation to perform an asset retirement activity in whichbe sustained on audit, based on the timing and (or) method of settlement are conditional on a future event that may or may not be within controltechnical merits of the entity. The obligation to perform the asset retirement activity is unconditional even though uncertainty exists about the timing and (or) method of settlement. Uncertainty about the timing and (or) method of settlement of a conditional asset retirement obligation should be factored into the measurement of the liability when sufficient information exists. FIN 47 also clarifies when an entity would have sufficient information to reasonably estimate the fair value of an asset retirement obligation. Theposition. This Interpretation is effective no later than the end of fiscal years ending after December 15, 2005. The Company’s adoption of the standard did not have a material effect on the Company’s financial position, cash flows or results of operations for the year ending December 31, 2005.
In May 2005, the FASB issued SFAS No. 154, “Accounting Changes and Error Corrections”, a replacement of Accounting Principles Board Opinion No. 20, “Accounting Changes”, and SFAS No. 3, “Reporting Accounting Changes in Interim Financial Statements” (“SFAS 154”). SFAS 154 changes the requirements for the accounting for, and reporting of, a change in accounting principle. Previously, voluntary changes in accounting principles were generally required to be recognized by way of a cumulative effect adjustment within net income during the period of the change. SFAS 154 requires retrospective application to prior periods’ financial statements, unless it is impracticable to determine either the period-specific effects or the cumulative effect of the change. SFAS 154 is effective for accounting changes made in fiscal years beginning after December 15, 2005; however,2006, with the statementcumulative effect of the change in accounting principle recorded as an adjustment to opening retained earnings. The Company does not changeexpect the transitionadoption of this statement to have a material impact on its consolidated financial statements.
In September 2006, the FASB issued SFAS No. 158, “Employers’ Accounting for Defined Benefit Pension and Other Postretirement Plans-an amendment of FASB Statements No. 87, 88, 106, and 132(R)”, or SFAS 158, which requires the recognition of the over funded or under funded status of a defined benefit postretirement plan in a company’s balance sheet. This portion of the new guidance is effective on December 31, 2006. Additionally, the pronouncement eliminates the option for companies to use a measurement date prior to their fiscal year-end effective December 31, 2008. The adoption of the recognition provisions of anySFAS 158 did not have a material impact on the Company’s consolidated financial statements.
In September 2006, the FASB issued SFAS No. 157, “Fair Value Measurements”, or SFAS No. 157. This new standard establishes a framework for measuring the fair value of assets and liabilities and is intended to provide increased consistency in how fair value determinations are made under various existing accounting pronouncements.standards that permit, or in some cases require, estimates of fair market value. SFAS No. 157 also expands financial statement disclosure requirements about a company’s use of fair value measurements, including the effect of such measures on earnings. This standard is effective for fiscal years beginning after November 15, 2007 and interim periods within those fiscal years. The Company is currently evaluating the provisions of SFAS No. 157.
Liquidity and Capital Resources
Our cash requirements depend on numerous factors, including completion of our product development activities, ability to commercialize our on-site energy products, market acceptance of our systems and other factors. We expect to devote substantial capital resources to continue our development programs directed at commercializing our on-site energy products for worldwide use, hiring and training our production staff, develop and expand our manufacturing capacity and continue expanding our production and our research and development activities. We expect to pursue the expansion of our operations through internal growth and strategic acquisitions and expect that such activities will be funded from existing cash and cash equivalents, issuance of additional equity or debt securities or additional borrowings subject to market and other conditions. The failure to raise the funds necessary to finance our future cash requirements or consummate future acquisitions could adversely affect our ability to pursue our strategy and could negatively affect our operations in future periods. We anticipate incurring substantial additional losses over at least the next several years and believe that our current cash, cash equivalents and marketableavailable-for-sale securities balances will provide sufficient capitalliquidity to fund operations for at least the next twelve months.
Several key indicators of liquidity are summarized in the following table:
| Years ended December 31, | Years ended December 31, | |||||||||||||||||
| 2005 | 2004 | 2003 | ||||||||||||||||
Unrestricted cash, cash equivalents and marketable securities | $ | 97,563,000 | $ | 66,849,000 | $ | 102,004,000 | ||||||||||||
| (in thousands) | 2006 | 2005 | 2004 | |||||||||||||||
Unrestricted cash, cash equivalents and available-for-sale securities | $ | 269,123 | $ | 97,563 | $ | 66,849 | ||||||||||||
Working capital | 95,511,000 | 64,073,000 | 99,285,000 | 267,002 | 95,511 | 64,073 | ||||||||||||
Net loss | 51,743,000 | 46,739,000 | 53,039,000 | 50,310 | 51,743 | 46,739 | ||||||||||||
Net cash used in operating activities | 39,869,000 | 33,896,000 | 38,017,000 | 46,107 | 39,869 | 33,896 | ||||||||||||
Purchase of property, plant and equipment | 1,000,000 | 1,617,000 | 627,000 | 1,275 | 1,000 | 1,617 | ||||||||||||
We have financed our operations through December 31, 20052006 primarily from the sale of equity, which has provided cash in the amount of $420.8$635.7 million. As of December 31, 2005,2006, we had unrestricted cash, cash equivalents and marketableavailable-for-sale securities totaling $97.6$269.1 million and working capital of $95.5$267.0 million. In addition, we
have restricted cash of $4.0 million in cash which is escrowed to secure the mortgage on our headquarters facility. Since inception, net cash used in operating activities has been $302.2$348.4 million and cash used in investing activities has been $90.0$253.6 million.
During the year ended December 31, 2005,2006, the Company used $39.9$46.1 million in cash for operating activities, used $28.6$163.6 million in cash for investing activities and received $71.4$214.8 million from financing activities. Net cash used in operating activities consisted primarily of a net loss of $51.7$50.3 million offset, in part, by non-cash items which include $3.4$3.2 million for depreciation and amortization $2.9and $4.9 million in stock based compensation, $688,000 amortization of intangible assets and $5.8 million in equity losses in affiliates.compensation. Cash used in investing activities consisted of $27.6$161.3 million of net purchases of marketableavailable-for-sale securities, and $1.0$1.3 million for the purchase of property, plant and equipment.equipment and a $1.0 million loan to a potential investee. Cash provided by financing activities in the amount of $71.4$214.8 million consisted primarily of $70.6 million,the net of $4.4 million for expenses and placement fees, related toproceeds from the issuance and distribution of the securities relatingClass B Capital Stock, a class of preferred stock, to our public offering of 12,000,000 shares of common stock, completedSmart Hydrogen in the thirdsecond quarter of 2005.2006.
Other significant transactions impacting our liquidity and capital resources arehave been as follows:
Mergers & Acquisitions
On March 25, 2003, we consummated a merger transaction with H Power pursuant to which we acquired H Power in a stock-for-stock exchange valued at approximately $46.3 million. In connection with the transaction, H Power stockholders received 0.8305 shares of our common stock for each share of H Power common stock held immediately prior to the transaction. Immediately following the transaction H Power became a wholly owned subsidiary of the Company. As part of the acquisition, we acquired intellectual property and certain other assets including cash, cash equivalents and marketable securities of H Power worth approximately $29.6 million, after payment of $7.1 million of certain costs and expenses associated with the consummation of the merger which were accounted for as additional purchase price.
Public Offerings
In November 1999, we completed an initial public offering of 6,782,900 shares of common stock, which includes additional shares purchased pursuant to exercise of the underwriters’ over allotment option. We received proceeds of $93.0 million, which was net of $8.7 million of expenses and underwriting discounts relating to the issuance and distribution of the securities.
In July 2001, we completed a follow-on public offering of 4,575,000 shares of common stock, which includes additional shares purchased pursuant to exercise of the underwriters’ over allotment option. We received proceeds of $51.6 million, which was net of $3.3 million of expenses and underwriting discounts relating to the issuance and distribution of the securities.
In November 2003, the Company completed a public offering of 11,700,000 shares of common stock. We received proceeds of $55.0 million, net of $3.5 million of expenses and placement fees relating to the issuance and distribution of the securities.
In August 2005, the Company completed a public offering of 12,000,000 shares of common stock. We received proceeds of $70.6 million, net of expenses and placement fees relating to the issuance and distribution of the securities.
Private Placements
In July 2001, simultaneous with the closing of the follow-on public offering, we closed a private equity financing of 416,666 shares of common stock to GE Power Systems Equities, Inc., an indirect wholly owned
subsidiary of General Electric Company, and 416,666 shares of common stock to Edison Development Corporation, an indirect wholly owned subsidiary of DTE Energy Company, raising an additional $9.6 million in net proceeds.
In June 2006, the Company completed a private placement with Smart Hydrogen Inc. whereby the Company sold 395,000 shares of Class B Capital Stock, a class of preferred stock of the Company, which are convertible into 39,500,000 shares of common stock of the Company, and 11,240 shares of common stock of the Company to Smart Hydrogen for an aggregate net purchase price of approximately $214.4 million. The purchase price per share of the shares sold to Smart Hydrogen, on an as-converted into common stock basis, was $5.50. The Buyer also contemporaneously purchased 1,825,000 shares of common stock of the Company from DTE Energy Foundation. Following the closing of these transactions, the Buyer owned approximately 35% of the Company’s outstanding common stock on an if-converted basis.
Initial Capital Contributions
We were formed in June 1997 as a joint venture between Mechanical Technology Incorporated and Edison Development Corporation, an indirect wholly owned subsidiary of DTE Energy Company. At formation, Mechanical Technology Incorporated contributed assets related to its fuel cell program, including intellectual property, 22 employees, equipment and the right to receive government contracts for research and development of PEM fuel cell systems, if awarded. Edison Development Corporation contributed or committed to contribute $9.0 million in cash, expertise in distributed power generation and marketplace presence to distribute and sell stationary fuel cell systems.
In aggregate, Mechanical Technology Incorporated has made cash contributions of $27.0 million plus noncash contributions of $14.2 million, while Edison Development Corporation has made aggregate cash contributions of $46.2 million, including $5.0 million in connection with the closing of a private placement of our common stock in July, 2001. Mechanical Technology Incorporated and Edison Development Corporation have not made any additional cash or noncash contributions since October 1999 and July 2001, respectively.
GE Fuel Cell Systems
In February 1999, we entered into a joint venture agreement withMarch 2006, the Company, GE MicroGen, Inc. (a wholly owneda wholly-owned subsidiary of General Electric Company, or GE, and GE restructured their service and equity relationships by terminating the joint venture, GEFCS, and the associated distributor and other agreements, and entering into a new development collaboration agreement. Under the new agreement, the Company and GE (through its Global Research unit) have agreed to collaborate on programs including but not limited to development of tools, materials and components that operates within the GE Energy business)can be applied to form GE Fuel Cell Systems, LLC (GEFCS), to exclusively market, sell, install and service certainvarious types of our PEM fuel cell systems. In connection withproducts. The specific programs to be undertaken under the original formation of GEFCS, we issued 2,250,000 shares of our common stockagreement, and the detailed terms and conditions thereof, remain subject to GE MicroGen, Inc. in exchangeagreement by both parties. It is anticipated that such programs could also include collaboration on sales and marketing opportunities for a 25% interest in GEFCS and we capitalized $11.3 million, the fair valueCompany’s products. Under the terms of the shares issued, undernew development collaboration agreement, the caption “Investment in affiliates” in our consolidated financial statements. We also issued a warrant to GE MicroGen, Inc.Company is obligated to purchase 3,000,000 additional shares$1 million of common stock at a price of $12.50 per share. GEFCS exercised this option immediatelyservices from GE prior to our initial public offering for a total exercise price of $37.5 million in cash.
Subsequently, in August 2001, we amended our agreements with GE Microgen, Inc. and GEFCS to expand GEFCS’ exclusive distribution rights in exchange for an increase to our ownership interest in GEFCS from 25% to 40% and an extension to the term of the agreement to December 31, 2014. In return, we granted GE Power Systems Equities, Inc. an option2008. The development collaboration agreement is scheduled to purchase 725,000 sharesterminate on the earlier of our common stock at any time prior to August 21, 2006 at an exercise price(i) December 31, 2014 or (ii) upon completion of $15.00 per share. In connection with the amendment, we capitalized $5 million, the fair valuea certain level of the option to purchase 725,000 shares of Plug Power common stock, under the caption “Investment in affiliates” in our consolidated financial statements.
Additionally, we are currently in discussion with GE to restructure our existing agreements. See further information regarding this discussion under Item 1, “Distribution, Marketing and Strategic Relationships.”program activity.
Grant Agreements
Since our inception we have been awarded, or participated in, federal and state government contracts related to research, development, test and demonstration of our PEM fuel cell technology. These contracts are primarily cost reimbursement contracts associated with the development of our PEM fuel cell technology. We have recognized “Research and development contract revenue” of approximately $57.1$62.3 million related to federal and state government contracts, and commercial contracts. We generally share in the cost of these programs, with cost-sharing percentages between 20% and 60%51%. We expect to continue certain research and development contract work that is directly related to our current product development efforts.
Contractual Obligations
The following is a summary of our contractual obligations, which consist of non-cancelable operating leases, as of December 31, 2005.2006.
| Total | 2006 | 2007-2008 | 2009-2010 | 2011+ | |||||||||||
Long-term debt | $ | 3,989,000 | $ | 385,000 | $ | 845,000 | $ | 945,000 | $ | 1,814,000 | |||||
Capital lease obligations | 142,000 | 142,000 | — | — | — | ||||||||||
Operating leases | 2,456,000 | 679,000 | 1,356,000 | 421,000 | — | ||||||||||
Other | 1,700,000 | — | 1,700,000 | — | — | ||||||||||
Total | $ | 8,287,000 | $ | 1,206,000 | $ | 3,901,000 | $ | 1,366,000 | $ | 1,814,000 | |||||
Year ending December 31 | Operating leases | ||
2007 | $ | 201,000 | |
2008 | 186,000 | ||
2009 | 182,000 | ||
2010 | 156,000 | ||
2011 | 154,000 | ||
Thereafter | — | ||
Total minimum lease payments | $ | 879,000 | |
Other obligations include future payments under our agreement with General Electric CompanyGE to source technical support services for our product development effort as described in Note 3 of the Notes to Consolidated Financial Statements.above.
| Item 7A. | Quantitative and Qualitative Disclosures about Market Risk |
We invest our excess cash in government, government backed and interest-bearing investment-grade securities that we generally hold for the duration of the term of the respective instrument. We do not utilize derivative financial instruments, derivative commodity instruments or other market risk sensitive instruments, positions or transactions in any material fashion. Accordingly, we believe that, while the investment-grade securities we hold are subject to changes in the financial standing of the issuer of such securities, we are not subject to any material risks arising from changes in interest rates, foreign currency exchange rates, commodity prices, equity prices or other market changes that affect market risk sensitive instruments.
A portion of the Company’s total revenue was attributable to our foreign operations. Our exposure to changes in foreign currency rates primarily arises from short-term inter-company transactions with our foreign
subsidiaries and from client receivables in different currencies. Foreign sales are mostly made by our foreign subsidiaries in their respective countries and are typically denominated in the local currency of each country. Our foreign subsidiaries incur most of their expenses in their local currency as well, which helps minimize our risk of exchange rate fluctuations. Accordingly, the Company’s financial results are affected by risks typical of global business such as currency fluctuations, particularly between the U.S. dollar and the E.U. euro. As exchange rates vary, the Company’s results can be materially affected.
In addition, the Company may source inventory among its worldwide operations. This practice can give rise to foreign exchange risk resulting from the varying cost of inventory to the receiving location as well as from the revaluation of intercompany balances. The Company mitigates this risk through local sourcing efforts.
| Item 8. | Financial Statements and Supplementary Data |
The Company’s Consolidated Financial Statements included in this Report beginning at page F-1 are incorporated in this Item 8 by reference.
| Item 9. | Changes in and Disagreements with Accountants on Accounting and Financial Disclosure |
None.
| Item 9A. | Controls and Procedures |
(a) Conclusion Regarding the Effectiveness of Disclosure Controls and Procedures.
Under the supervision and with the participation of our management, including our principal executive officer and principal financial officer, we conducted an evaluation of the effectiveness of our disclosure controls and procedures, as such term is defined under Rule 13a-15(e) promulgated under the Securities Exchange Act of 1934, as amended (the Exchange Act). Based on this evaluation, our principal executive officer and our principal financial officer concluded that, as of the end of the period covered by this annual report, our disclosure controls and procedures were effective, in that they provide reasonable assurance that information required to be disclosed by us in the reports we file or submit, under the Exchange Act, is recorded, processed, summarized and reported within the time period specified in the Securities and Exchange Commission’s rules and forms.
Changes in Controls and Procedures: No change in our internal control over financial reporting occurred during the quarterly period ended December 31, 20052006 that has materially affected, or is reasonably likely to materially affect, our internal control over financial reporting.
(b) Management’s Report on Internal Control Over Financial Reporting
Our management is responsible for establishing and maintaining adequate internal control over financial reporting, as such term is defined in Exchange Act Rules 13a-15(f) and 15d-15(f). Under the supervision and with the participation of our management, including our principal executive officer and principal financial officer, we conducted an evaluation of the effectiveness of our internal control over financial reporting based on the framework inInternal Control—Integrated Frameworkissued by the Committee of Sponsoring Organization of the Treadway Commission. Based on our evaluation under the framework inInternal Control—Integrated Framework, our management concluded that the Company maintained effective internal control over financial reporting as of December 31, 2005.2006.
Our management’s assessment of the effectiveness of our internal control over financial reporting as of December 31, 20052006 has been audited by KPMG LLP, an independent registered public accounting firm, as stated in their attestation report which appears herein.
| Item 9B. | Other Information |
Not applicable.
PART III
| Item 10. | Directors, |
(a) Directors
Incorporated herein by reference is the information appearing under the captions “Information about our Directors” and “Compliance with Section 16(a) of the Securities Exchange Act of 1934” in the Company’s definitive Proxy Statement for its 20062007 Annual Meeting of Stockholders to be filed with the Security and Exchange Commission.
(b) Executive Officers
Incorporated herein by reference is the information appearing under the captions “Executive Officers” and “Compliance with Section 16(a) of the Securities Exchange Act of 1934” in the Company’s definitive Proxy Statement for its 20062007 Annual Meeting of Stockholders to be filed with the Security and Exchange Commission.
Code of Business Conduct and Ethics
We have adopted a Code of Business Conduct and Ethics that applies to all officers, directors, employees and consultants of the Company. The Code of Business Conduct and Ethics is intended to comply with Item 406 of Regulation S-K of the Securities Exchange Act of 1934 and with applicable rules of The NASDAQ Stock Market, Inc. Our Code of Business Conduct and Ethics is posted on our Internet website under the “Investor” page. Our Internet website address is www.plugpower.com. To the extent required or permitted by the rules of the SEC and Nasdaq,NASDAQ, we will disclose amendments and waivers relating to our Code of Business Conduct and Ethics in the same place as our website.
| Item 11. | Executive Compensation |
Incorporated herein by reference is the information appearing under the caption “Executive Compensation” in the Company’s definitive Proxy Statement for its 20062007 Annual Meeting of Stockholders to be filed with the Security and Exchange Commission.
| Item 12. | Security Ownership of Certain Beneficial Owners and Management and Related Stockholder Matters |
Incorporated herein by reference is the information appearing under the caption “Principal and Management Stockholders” in the Company’s definitive Proxy Statement for its 20062007 Annual Meeting of Stockholders to be filed with the Securities and Exchange Commission.
Equity Compensation Plan Information
The following table gives information about the shares of Common Stock that may be issued upon the exercise of options under the Plug Power, L.L.C. Second Amendment and Restatement of the Membership Option Plan (1997 Plan), the Company’s 1999 Stock Option and Incentive Plan, as amended (1999 Stock Option Plan) and the Company’s 1999 Employee Stock Purchase Plan, as of December 31, 2005.2006.
Plan Category | Number of shares to be issued upon exercise of outstanding options, warrants and rights(a) | Weighted average exercise price of outstanding options, warrants and rights(b) | Number of shares remaining available for future issuance under equity compensation plans (excluding shares reflected in column(a))(c) | Number of shares to be issued upon exercise of outstanding options, warrants and rights(a) | Weighted average exercise price of outstanding options, warrants and rights(b) | Number of shares remaining available for future issuance under equity compensation plans (excluding shares reflected in column(a))(c) | ||||||||||||
Equity compensation plans approved by security holders | 5,504,729 | (1) | $ | 10.20 | 3,049,357 | (2) | 6,511,563 | (1) | $ | 9.40 | 3,438,565 | (2) | ||||||
Equity compensation plans not approved by security holders(3) | — | — | — | — | — | — | ||||||||||||
Total | 5,504,729 | (1) | $ | 10.20 | 3,049,357 | (2) | 6,511,563 | (1) | $ | 9.40 | 3,438,565 | (2) | ||||||
| (1) | Represents |
| (2) | Includes |
| (3) | There are no equity compensation plans in place not approved by shareholders. |
| Item 13. | Certain Relationships and Related Transactions and Director Independence |
Incorporated herein by reference is the information appearing under the caption “Certain Relationships and Related Transactions” in the Company’s definitive Proxy Statement for its 20062007 Annual Meeting of Stockholders to be filed with the Securities and Exchange Commission.
| Item 14. | Principal |
Incorporated herein by reference is the information appearing under the caption “Independent Auditors Fees” in the Company’s definitive Proxy Statement for its 20062007 Annual Meeting of Stockholders to be filed with the Securities and Exchange Commission.
PART IV
| Item 15. | Exhibits and Financial Statement Schedules |
15(a)(1) Financial Statements
The financial statements and notes are listed in the Index to Consolidated Financial Statements on page F-1 of this Report.
15(a)(2) Financial Statement Schedules
Consolidated financial statement schedules not filed herein have been omitted as they are not applicable or the required information or equivalent information has been included in the consolidated financial statements or the notes thereto.
15(a)(3) Exhibits
Exhibits are as set forth in the “List of Exhibits” which immediately precedes the Index to Consolidated Financial Statements on page F-1 of this Report.
SIGNATURES
Pursuant to the requirements of Section 13 or 15(d) of the Securities Exchange Act of 1934, the registrant has duly caused this report to be signed on its behalf by the undersigned, thereunto duly authorized.
| PLUG POWER INC. | ||||||
| By: | /S/ ROGER B. SAILLANT | |||||
Roger B. Saillant,
| ||||||
| ||||||
Date: March 16, 2007
Pursuant to the requirements of the Securities Exchange Act of 1934, this report has been signed below by the following persons on behalf of the registrant and in the capacities and on the dates indicated.
Signature | Title | Date | ||
/S/ ROGER B. SAILLANT Roger B. Saillant |
| March | ||
|
| |||
/S/ ROBERT Robert P. Powers | Corporate Controller | March 16, 2007 | ||
/S/ SERGEY L. B Robert J. Buckler | Director | March | ||
/S/ LARRY G. GARBERDING Larry G. Garberding | Director | March | ||
/S/ J. DOUGLAS GRANT J. Douglas Grant | Director | March | ||
/S/ JOEL D. GROSS Joel D. Gross | Director | March 16, 2007 | ||
/S/ MAUREEN O. HELMER Maureen O. Helmer | Director | March | ||
|
| |||
/S/ GEORGE C. MCNAMEE George C. McNamee | Director | March | ||
/S/
| Director | March | ||
/S/
| Director | March | ||
/S/ GARY K. WILLIS Gary K. Willis | Director | March | ||
/S/ PETER WOICKE Peter Woicke | Director | March | ||
List of Exhibits
Certain exhibits indicated below are incorporated by reference to documents of Plug Power on file with the Commission. Exhibits nos. 10.1, 10.2, 10.3, 10.5, 10.7,10.6, 10.8, 10.14, 10.15, 10.28, 10.2910.9, 10.11, 10.12 and 10.3110.16 through 10.40 represent the management contracts and compensation plans and arrangements required to be filed as exhibits to this Annual Report on Form 10-K.
| Exhibit No. and Description | ||
| 3.1 | Amended and Restated Certificate of Incorporation of Plug | |
| 3.2 | Certificate of Designations of Class B Capital Stock, a series of preferred stock, of Plug Power Inc.(2) | |
| Amended and Restated By-laws of Plug | ||
| Certificate of Amendment to Amended and Restated Certificate of Incorporation of Plug Power(3) | ||
| 4.1 | Specimen certificate for shares of common stock, $.01 par value, of Plug Power. | |
| 10.1 | ||
| 10.2 | ||
| 10.3 | ||
| 10.4 | ||
| Registration Rights Agreement to be entered into by the Registrant and the stockholders of the Registrant. | ||
| Agreement, dated as of December 15, 2000, between Plug Power Inc. and Roger Saillant.(3) | ||
| Amendment dated September 19, 2000 to agreement, dated as of August 6, 1999, between Plug Power Inc. and Gregory A. Silvestri.(3) | ||
| Joint Development Agreement, dated as of June 2, 2000, between Plug Power Inc. and Engelhard Corporation(3) | |||
| Executive Severance Agreement, dated as of August 29, 2002, between Plug Power Inc. and Mark Sperry. | |||
| Executive Severance Agreement, dated as of August 29, 2002, between Plug Power Inc. and John Elter. | |||
| 10.10 | Stock Purchase Agreement dated as of April 10, 2006, by and between Plug Power Inc. and Smart Hydrogen(7) | ||
| 10.11 | Employment Agreement dated March 20, 2000, between Plug Power Inc. and Mark Sperry(8) | ||
| 10.12 | Employment Agreement dated March 2, 2001, between Plug Power Inc. and John Elter(8) | ||
| 10.13 | Investor Rights Agreement, dated as of June 29, 2006, by and among Plug Power Inc., Smart Hydrogen Inc. and the other parties named therein(2) | ||
| 10.14 | Registration Rights Agreement, dated as of June 29, 2006, by and between Plug Power Inc. and Smart Hydrogen Inc.(2) | ||
| 10.15 | Form of Indemnification Agreement entered into with each director (2) | ||
| 10.16 | Executive Severance Agreement, dated as of June 29, 2006, by and between Tom Hutchison and Plug Power Inc. (2) | ||
| 10.17 | Executive Severance Agreement, dated as of July 31, 2006, by and between Joe Millington and Plug Power Inc.(9) | ||
| Exhibit No. and Description | ||
| 10.18 | Separation and Release Agreement dated as of May 25, 2006, by and between David A. Neumann and Plug Power Inc.(10) | |
| 10.19 | Executive Severance Agreement dated as of January 11, 2006, by and between Gerard L. Conway, Jr. and Plug Power Inc.(10) | |
| 10.20 | Executive Severance Agreement dated as of January 11, 2006, by and between Allen K. Bucknam and Plug Power Inc.(10) | |
| 10.21 | Executive Severance Agreement dated as of January 11, 2006, by and between William D. Ernst and Plug Power Inc.(10) | |
| 10.22 | Executive Severance Agreement dated as of January 11, 2006, by and between Paul J. Burton and Plug Power Inc.(10) | |
| 10.23 | Executive Severance Agreement dated as of January 11, 2006, by and between Jos van der Hyden and Plug Power Inc.(10) | |
| 10.24 | Form of Incentive Stock Option Agreement(10) | |
| 10.25 | Form of Non-Qualified Stock Option Agreement for Employees(10) | |
| 10.26 | Form of Non-Qualified Stock Option Agreement for Independent Directors(10) | |
| 10.27 | Form of Restricted Stock Award Agreement(10) | |
| 10.28 | Amendment No. 1 to the 1999 Stock Option and Incentive Plan(10) | |
| 10.29 | First Amendment to Executive Severance Agreement, dated as of June 29, 2006, by and between Mark A. Sperry and Plug Power Inc.(10) | |
| 10.30 | First Amendment to Executive Severance Agreement, dated | |
| 10.31 | First Amendment to Executive Severance Agreement, dated as of | |
| 10.32 | First Amendment to Executive Severance Agreement, dated as of June 29, 2006, by and | |
| 10.33 | First Amendment to Executive Severance Agreement, dated as of June 29, 2006, by and between William D. Ernst and Plug Power Inc.(10) | |
| 10.34 | First Amendment to Executive Severance Agreement, dated as of June 29, 2006, by and between Paul J. Burton and Plug Power Inc. (10) | |
| 10.35 | First Amendment to Executive Severance Agreement, dated as of June 29, 2006, by and between Jos Van der Hyden and Plug Power Inc.(10) | |
| 10.36 | Executive Severance Agreement, dated as of October 30, 2006, by and between Allan Greenberg and Plug Power Inc.(11) | |
| 10.37 | Severance Agreement, dated as of November 27, 2006, by and between Jean M. Nelson and Plug Power Inc.(12) | |
| 10.38 | Executive Severance Agreement, dated as of November 27, 2006, by and between Jean M. Nelson and Plug Power Inc.(12) | |
| 10.39 | Indemnification Agreement, dated as of November 27, 2006, by and between Jean M. Nelson and Plug Power Inc.(12) | |
| 10.40 | Plug Power Executive Incentive Plan(13) | |
| Exhibit No. and Description | ||
| 23.1 | Consent of KPMG | |
| 31.1 and 31.2 | Certifications pursuant to Section 302 of the Sarbanes-Oxley Act of | |
| 32.1 and 32.2 | Certifications pursuant to 18 U.S.C. Section 1350, adopted pursuant to Section 906 of the Sarbanes-Oxley Act of | |
| (1) |
| Incorporated by reference to the Company’s Form 10-K for the period ended December 31, 1999. |
| (2) | Incorporated by reference to the Company’s current Report on Form 8-K dated June 29, 2006. |
| (3) | Incorporated by reference to the Company’s Form 10-K for the period ended December 31, 2000. |
| (4) | Incorporated by reference to the Company’s Registration Statement on Form |
| (5) | Incorporated by reference to the Company’s Registration Statement on Form S-1/A (File Number 333-86089). |
| (6) | Incorporated by reference to the Company’s Form 10-K for the period ended December 31, 2002. |
| Incorporated by reference to the Company’s current Report on Form 8-K dated April 11, 2006. |
| (8) | Incorporated by reference to the Company’s Form |
| Incorporated by reference to the Company’s current Report on Form 8-K dated August 4, 2006. |
| (10) | Incorporated by reference to the Company’s Form 10-Q for the period ended June 30, 2006. |
| (11) | Incorporated by reference to the Company’s current Report on Form 8-K dated November 17, 2006. |
| (12) | Incorporated by reference to the Company’s current Report on Form 8-K dated November 27, 2006. |
| (13) | Incorporated by reference to the Company’s current Report on Form 8-K dated February 22, 2007. |
| (14) | Filed herewith. |
INDEX TO CONSOLIDATED FINANCIAL STATEMENTS
| Page | ||
| F-2 | ||
Consolidated balance sheets as of December 31, | F-4 | |
| F-5 | ||
| F-6 | ||
| F-7 | ||
| F-9 | ||
Report of Independent Registered Public Accounting Firm
The Board of Directors and Stockholders
Plug Power Inc.:
We have audited the accompanying consolidated balance sheets of Plug Power Inc. and subsidiaries (a development stage enterprise) as of December 31, 20052006 and 2004,2005, and the related consolidated statements of operations, stockholders’ equity and comprehensive loss, and cash flows for each of the years in the three-year period ended December 31, 2005,2006, and for the period June 27, 1997 (inception) to December 31, 2005.2006. These consolidated financial statements are the responsibility of the Company’s management. Our responsibility is to express an opinion on these consolidated financial statements based on our audits. The consolidated statements of operations, stockholders’ equity and comprehensive loss, and cash flows for the period June 27, 1997 (inception) to December 31, 20052006 include amounts for the period from June 27, 1997 to December 31, 1997, and for each of the years in the three-year period ending December 31, 2000, which were audited by other auditors whose report has been furnished to us, and our opinion, insofar as it relates to the amounts included for the period June 27, 1997 through December 31, 2000, is based solely on the report of other auditors.
We conducted our audits in accordance with the standards of the Public Company Accounting Oversight Board (United States). Those standards require that we plan and perform the audits to obtain reasonable assurance about whether the financial statements are free of material misstatement. An audit includes examining, on a test basis, evidence supporting the amounts and disclosures in the financial statements. An audit also includes assessing the accounting principles used and significant estimates made by management, as well as evaluating the overall financial statement presentation. We believe that our audits provide a reasonable basis for our opinion.
In our opinion, the consolidated financial statements referred to above present fairly, in all material respects, the financial position of Plug Power Inc. and subsidiaries (a development stage enterprise) as of December 31, 20052006 and 2004,2005, and the results of their operations and their cash flows for each of the years in the three-year period ended December 31, 2005,2006, and for the period June 27, 1997 (inception) to December 31, 2005,2006, in conformity with U.S. generally accepted accounting principles.
As discussed in Note 1 to the consolidated financial statements, effective January 1, 2006, the Company adopted Financial Accounting Standards Board Statement of Financial Accounting Standards No. 123 (Revised),Share-Based Payment.
We also have audited, in accordance with the standards of the Public Company Accounting Oversight Board (United States), the effectiveness of Plug Power Inc.’s internal control over financial reporting as of December 31, 2005,2006, based on criteria established inInternal Control—Integrated Frameworkissued by the Committee of Sponsoring Organizations of the Treadway Commission (COSO), and our report dated March 14, 2006,15, 2007, expressed an unqualified opinion on management’s assessment of, and the effective operation of, internal control over financial reporting.
/s/ KPMG LLP
Albany, New York
March 14, 200615, 2007
Report of Independent Registered Public Accounting Firm
The Board of Directors and Stockholders
Plug Power Inc.:
We have audited management’s assessment, included in the accompanying Management’s Report on Internal Control Over Financial Reporting, that Plug Power Inc. and subsidiaries (a development stage enterprise) maintained effective internal control over financial reporting as of December 31, 2005,2006, based on criteria established in Internal Control—Integrated Frameworkissued by the Committee of Sponsoring Organizations of the Treadway Commission (COSO). The Company’s management is responsible for maintaining effective internal control over financial reporting and for its assessment of the effectiveness of internal control over financial reporting. Our responsibility is to express an opinion on management’s assessment and an opinion on the effectiveness of the Company’s internal control over financial reporting based on our audit.
We conducted our audit in accordance with the standards of the Public Company Accounting Oversight Board (United States). Those standards require that we plan and perform the audit to obtain reasonable assurance about whether effective internal control over financial reporting was maintained in all material respects. Our audit included obtaining an understanding of internal control over financial reporting, evaluating management’s assessment, testing and evaluating the design and operating effectiveness of internal control, and performing such other procedures as we considered necessary in the circumstances. We believe that our audit provides a reasonable basis for our opinion.
A company’s internal control over financial reporting is a process designed to provide reasonable assurance regarding the reliability of financial reporting and the preparation of financial statements for external purposes in accordance with generally accepted accounting principles. A company’s internal control over financial reporting includes those policies and procedures that (1) pertain to the maintenance of records that, in reasonable detail, accurately and fairly reflect the transactions and dispositions of the assets of the company; (2) provide reasonable assurance that transactions are recorded as necessary to permit preparation of financial statements in accordance with generally accepted accounting principles, and that receipts and expenditures of the company are being made only in accordance with authorizations of management and directors of the company; and (3) provide reasonable assurance regarding prevention or timely detection of unauthorized acquisition, use, or disposition of the company’s assets that could have a material effect on the financial statements.
Because of its inherent limitations, internal control over financial reporting may not prevent or detect misstatements. Also, projections of any evaluation of effectiveness to future periods are subject to the risk that controls may become inadequate because of changes in conditions, or that the degree of compliance with the policies or procedures may deteriorate.
In our opinion, management’s assessment that Plug Power Inc. and subsidiaries (a development stage enterprise) maintained effective internal control over financial reporting as of December 31, 2005,2006, is fairly stated, in all material respects, based on criteria established inInternal Control—Integrated Frameworkissued by COSO. Also, in our opinion, Plug Power Inc. and subsidiaries (a development stage enterprise) maintained, in all material respects, effective internal control over financial reporting as of December 31, 2005,2006, based on criteria established inInternal Control—Integrated Frameworkissued by COSO.
We also have audited, in accordance with the standards of the Public Company Accounting Oversight Boardboard (United States), the consolidated balance sheets of Plug Power Inc. and subsidiaries as of December 31, 20052006 and 2004,2005, and related consolidated statements of operations, stockholders’ equity and comprehensive loss, and cash flows for each of the years in the three-year period ended December 31, 2005,2006, and for the period June 27, 1997 (inception) to December 31, 2005,2006, and our report dated March 14, 2006,15, 2007, expressed an unqualified opinion on those consolidated financial statements.
/s/ KPMG LLP
Albany, New York
March 14, 200615, 2007
PLUG POWER INC. AND SUBSIDIARIES
(A DEVELOPMENT STAGE ENTERPRISE)
| December 31, 2005 | December 31, 2004 | December 31, 2006 | December 31, 2005 | |||||||||||||
Assets | ||||||||||||||||
Current assets: | ||||||||||||||||
Cash and cash equivalents | $ | 21,877,726 | $ | 18,976,767 | $ | 26,899,866 | $ | 21,877,726 | ||||||||
Restricted cash | 385,000 | 365,000 | — | 385,000 | ||||||||||||
Marketable securities | 75,685,634 | 47,872,662 | ||||||||||||||
Accounts receivable | 1,516,969 | 2,989,481 | ||||||||||||||
Available-for-sale securities | 242,223,202 | 75,685,634 | ||||||||||||||
Accounts receivable, less allowance of $35,670 in 2006 and $0 in 2005 | 892,641 | 1,516,969 | ||||||||||||||
Inventory | 4,692,515 | 3,527,140 | 5,558,710 | 4,692,515 | ||||||||||||
Prepaid expenses and other current assets | 1,524,004 | 1,230,713 | 3,706,400 | 1,524,004 | ||||||||||||
Total current assets | 105,681,848 | 74,961,763 | 279,280,819 | 105,681,848 | ||||||||||||
Restricted cash | 3,580,274 | 3,965,274 | — | 3,580,274 | ||||||||||||
Property, plant and equipment, net | 19,826,111 | 21,829,254 | 18,048,254 | 19,826,111 | ||||||||||||
Intangible asset | — | 687,500 | ||||||||||||||
Investment in affiliate | — | 5,785,358 | ||||||||||||||
Goodwill | 10,388,980 | 10,388,980 | 10,388,980 | 10,388,980 | ||||||||||||
Other assets | 307,164 | 379,361 | 201,859 | 307,164 | ||||||||||||
Total assets | $ | 139,784,377 | $ | 117,997,490 | $ | 307,919,912 | $ | 139,784,377 | ||||||||
Liabilities and Stockholders’ Equity | ||||||||||||||||
Current liabilities: | ||||||||||||||||
Due to broker for security purchase | $ | 5,000,000 | $ | — | ||||||||||||
Accounts payable | $ | 2,660,130 | $ | 2,339,143 | 1,989,983 | 2,660,130 | ||||||||||
Accrued expenses | 3,835,973 | 2,447,316 | 2,596,990 | 3,835,973 | ||||||||||||
Deferred revenue | 3,148,048 | 5,675,227 | 2,692,320 | 3,148,048 | ||||||||||||
Current portion of capital lease obligation and long-term debt | 526,806 | 427,238 | — | 526,806 | ||||||||||||
Total current liabilities | 10,170,957 | 10,888,924 | 12,279,293 | 10,170,957 | ||||||||||||
Long-term debt | 3,603,641 | 3,998,391 | — | 3,603,641 | ||||||||||||
Other liabilities | 1,054,888 | 997,349 | 1,112,427 | 1,054,888 | ||||||||||||
Total liabilities | 14,829,486 | 15,884,664 | 13,391,720 | 14,829,486 | ||||||||||||
Stockholders’ equity: | ||||||||||||||||
Preferred stock, $0.01 par value per share; 5,000,000 shares authorized; none issued and outstanding | — | — | ||||||||||||||
Common stock, $0.01 par value per share; 245,000,000 shares authorized; 85,835,248 shares issued and outstanding at December 31, 2005 and 73,350,878 shares issued and outstanding at December 31, 2004 | 858,353 | 733,509 | ||||||||||||||
Class B Capital stock, a class of preferred stock, $0.01 par value per share; 5,000,000 shares authorized; 395,000 shares issued and outstanding at December 31, 2006 and 0 shares issued and outstanding at December 31, 2005 | 3,950 | — | ||||||||||||||
Common stock, $0.01 par value per share; 245,000,000 shares authorized; 86,794,915 shares issued and outstanding at December 31, 2006 and 85,835,248 shares issued and outstanding at December 31, 2005 | 867,952 | 858,353 | ||||||||||||||
Additional paid-in capital | 531,435,616 | 457,880,663 | 751,118,315 | 531,435,616 | ||||||||||||
Unamortized value of restricted stock | — | (680,459 | ) | |||||||||||||
Accumulated other comprehensive loss | (257,120 | ) | (482,391 | ) | (70,480 | ) | (257,120 | ) | ||||||||
Deficit accumulated during the development stage | (407,081,958 | ) | (355,338,496 | ) | (457,391,545 | ) | (407,081,958 | ) | ||||||||
Total stockholders’ equity | 124,954,891 | 102,112,826 | 294,528,192 | 124,954,891 | ||||||||||||
Total liabilities and stockholders’ equity | $ | 139,784,377 | $ | 117,997,490 | $ | 307,919,912 | $ | 139,784,377 | ||||||||
The accompanying notes are an integral part of the consolidated financial statements.
PLUG POWER INC. AND SUBSIDIARIES
(A DEVELOPMENT STAGE ENTERPRISE)
CONSOLIDATED STATEMENTS OF OPERATIONS
For the years ended December 31, 2006, 2005 and 2004 and Cumulative Amounts from Inception
| December 31, 2006 | December 31, 2005 | December 31, 2004 | Cumulative Amounts from Inception | |||||||||||||
Product and service revenue | $ | 2,656,475 | $ | 4,880,505 | $ | 5,305,648 | $ | 32,359,925 | ||||||||
Research and development contract revenue | 5,179,275 | 8,605,900 | 10,835,655 | 62,278,566 | ||||||||||||
Total revenue | 7,835,750 | 13,486,405 | 16,141,303 | 94,638,491 | ||||||||||||
Cost of product and service revenue | 4,832,994 | 4,097,647 | 5,367,897 | 34,130,437 | ||||||||||||
Cost of research and development contract revenue | 7,636,662 | 12,075,731 | 13,474,090 | 88,789,638 | ||||||||||||
In-process research and development | — | — | — | 12,026,640 | ||||||||||||
Research and development expense: | ||||||||||||||||
Noncash stock-based compensation | 2,819,368 | 1,574,101 | 2,591,156 | 11,625,544 | ||||||||||||
Other research and development | 38,757,866 | 34,745,181 | 32,611,633 | 334,776,660 | ||||||||||||
General and administrative expense: | ||||||||||||||||
Noncash stock-based compensation | 1,446,762 | 1,526,166 | 1,398,377 | 17,847,327 | ||||||||||||
Other general and administrative | 10,821,100 | 7,446,840 | 7,025,063 | 62,927,555 | ||||||||||||
Operating loss | (58,479,002 | ) | (47,979,261 | ) | (46,326,913 | ) | (467,485,310 | ) | ||||||||
Interest income and net realized gains/losses from the sale of available-for-sale securities | 8,340,250 | 2,166,740 | 1,452,593 | 30,019,650 | ||||||||||||
Interest expense | (170,835 | ) | (145,583 | ) | (60,974 | ) | (1,348,135 | ) | ||||||||
Loss before equity in losses of affiliates | (50,309,587 | ) | (45,958,104 | ) | (44,935,294 | ) | (438,813,795 | ) | ||||||||
Equity in losses of affiliates | — | (5,785,358 | ) | (1,803,533 | ) | (18,577,750 | ) | |||||||||
Net loss | $ | (50,309,587 | ) | $ | (51,743,462 | ) | $ | (46,738,827 | ) | $ | (457,391,545 | ) | ||||
Loss per share: | ||||||||||||||||
Basic and diluted | $ | (0.58 | ) | $ | (0.66 | ) | $ | (0.64 | ) | |||||||
Weighted average number of common shares outstanding | 86,100,326 | 78,463,236 | 73,125,957 | |||||||||||||
The accompanying notes are an integral part of the consolidated financial statements.
PLUG POWER INC. AND SUBSIDIARIES
(A DEVELOPMENT STAGE ENTERPRISE)
CONSOLIDATED STATEMENTS OF CASH FLOWS
For the years ended December 31, 2006, 2005 and 2004 and cumulative amounts from inception
| December 31, 2006 | December 31, 2005 | December 31, 2004 | Cumulative Amounts from Inception | |||||||||||||
Cash Flows From Operating Activities: | ||||||||||||||||
Net loss | $ | (50,309,587 | ) | $ | (51,743,462 | ) | $ | (46,738,827 | ) | $ | (457,391,545 | ) | ||||
Adjustments to reconcile net loss to net cash used in operating activities: | ||||||||||||||||
Depreciation and amortization | 3,219,790 | 3,358,938 | 4,206,578 | 30,183,551 | ||||||||||||
Equity in losses of affiliates | — | 5,785,358 | 1,803,533 | 18,577,750 | ||||||||||||
Amortization of intangible asset | — | 687,500 | 2,750,000 | 15,124,501 | ||||||||||||
Noncash prepaid development costs | — | — | 708,481 | 10,000,000 | ||||||||||||
(Gain) loss on disposal of property, plant and equipment | — | (5,000 | ) | — | 27,493 | |||||||||||
In-kind services | — | — | — | 1,340,000 | ||||||||||||
Stock-based compensation | 4,266,130 | 2,888,685 | 4,137,202 | 29,295,113 | ||||||||||||
Allowance for bad debts | 35,670 | — | — | 35,670 | ||||||||||||
Amortization of deferred grant revenue | — | — | (200,000 | ) | (1,000,000 | ) | ||||||||||
Amortization and write-off of deferred rent | — | — | — | 2,000,000 | ||||||||||||
In-process research and development | — | — | — | 7,042,640 | ||||||||||||
Changes in assets and liabilities, net of effects of acquisition in 2003: | ||||||||||||||||
Accounts receivable | 588,658 | 1,472,512 | 318,146 | (708,970 | ) | |||||||||||
Inventory | (866,195 | ) | (1,165,375 | ) | (863,399 | ) | (5,204,137 | ) | ||||||||
Prepaid expenses and other current assets | (1,186,691 | ) | (330,693 | ) | (27,767 | ) | (4,784,568 | ) | ||||||||
Accounts payable and accrued expenses | (1,399,159 | ) | 1,709,644 | (680,497 | ) | 3,417,710 | ||||||||||
Deferred revenue | (455,728 | ) | (2,527,179 | ) | 690,295 | 3,692,320 | ||||||||||
Net cash used in operating activities | (46,107,112 | ) | (39,869,072 | ) | (33,896,255 | ) | (348,352,472 | ) | ||||||||
Cash Flows From Investing Activities: | ||||||||||||||||
Proceeds from acquisition | — | — | — | 36,521,491 | ||||||||||||
Integration costs and expenses associated with acquisition | — | — | — | (7,055,750 | ) | |||||||||||
Note receivable | (1,000,000 | ) | — | — | (1,000,000 | ) | ||||||||||
Purchase of property, plant and equipment | (1,274,794 | ) | (999,582 | ) | (1,616,525 | ) | (33,979,175 | ) | ||||||||
Proceeds from disposal of property, plant and equipment | — | 5,000 | — | 315,666 | ||||||||||||
Purchase of intangible asset | — | — | — | (9,624,500 | ) | |||||||||||
Investment in affiliate | — | — | — | (1,500,000 | ) | |||||||||||
Proceeds from maturities and sales of available-for-sale securities | 852,968,512 | 177,351,026 | 41,181,267 | 1,772,784,710 | ||||||||||||
Purchases of available-for-sale securities | (1,014,319,441 | ) | (204,938,727 | ) | (76,217,470 | ) | (2,010,078,393 | ) | ||||||||
Net cash used in investing activities | (163,625,723 | ) | (28,582,283 | ) | (36,652,728 | ) | (253,615,951 | ) | ||||||||
Cash Flows From Financing Activities: | ||||||||||||||||
Proceeds from issuance of common and preferred stock | 217,311,820 | 70,875,000 | — | 428,529,602 | ||||||||||||
Proceeds from initial public offering, net | — | — | — | 201,911,705 | ||||||||||||
Stock issuance costs | (2,869,691 | ) | (294,264 | ) | — | (5,548,027 | ) | |||||||||
Proceeds from stock option exercises and employee stock purchase plan | 396,019 | 890,835 | 910,721 | 10,761,696 | ||||||||||||
Cash released from escrow | 3,965,274 | 365,000 | 345,000 | — | ||||||||||||
Principal payments on long-term debt and capital lease obligations | (4,048,447 | ) | (484,257 | ) | (415,226 | ) | (6,786,687 | ) | ||||||||
Net cash provided by financing activities | 214,754,975 | 71,352,314 | 840,495 | 628,868,289 | ||||||||||||
Increase (decrease) in cash and cash equivalents | 5,022,140 | 2,900,959 | (69,708,488 | ) | 26,899,866 | |||||||||||
Cash and cash equivalents, beginning of period | 21,877,726 | 18,976,767 | 88,685,255 | — | ||||||||||||
Cash and cash equivalents, end of period | $ | 26,899,866 | $ | 21,877,726 | $ | 18,976,767 | $ | 26,899,866 | ||||||||
The accompanying notes are an integral part of the consolidated financial statements.
PLUG POWER INC. AND SUBSIDIARIES
(A DEVELOPMENT STAGE ENTERPRISE)
CONSOLIDATED STATEMENTS OF STOCKHOLDERS’ EQUITY AND COMPREHENSIVE LOSS
For the years ended December 31, 2006, 2005 and 2004
| Preferred stock | Common stock | Additional Paid-in Capital | Accumulated other comprehensive loss | Unamortized Value of Restricted Stock | Deficit Accumulated During the Development Stage | Total Stockholders’ Equity | |||||||||||||||||||||||
| Shares | Amount | Shares | Amount | ||||||||||||||||||||||||||
December 31, 2003 | — | — | 72,850,709 | $ | 728,506 | $ | 454,399,857 | — | $ | (2,242,573 | ) | $ | (308,599,669 | ) | $ | 144,286,121 | |||||||||||||
Stock based compensation | — | — | 290,200 | 2,904 | 2,353,582 | — | — | — | 2,356,486 | ||||||||||||||||||||
Issuance of restricted stock | — | — | 42,300 | 422 | 218,180 | — | (218,602 | ) | — | — | |||||||||||||||||||
Amortization of restricted stock | — | — | — | — | — | — | 1,780,716 | — | 1,780,716 | ||||||||||||||||||||
Stock option exercises | — | — | 95,960 | 960 | 500,348 | — | — | — | 501,308 | ||||||||||||||||||||
Stock issued under employee stock purchase plan | — | — | 71,709 | 717 | 408,696 | — | — | — | 409,413 | ||||||||||||||||||||
Net loss | — | — | — | — | — | — | — | (46,738,827 | ) | (46,738,827 | ) | ||||||||||||||||||
Change in unrealized loss on available-for-sale securities | — | — | — | — | — | (482,391 | ) | — | — | (482,391 | ) | ||||||||||||||||||
December 31, 2004 | — | — | 73,350,878 | 733,509 | 457,880,663 | (482,391 | ) | (680,459 | ) | (355,338,496 | ) | 102,112,826 | |||||||||||||||||
Public offering, net | — | — | 12,000,000 | 120,000 | 70,460,736 | 70,580,736 | |||||||||||||||||||||||
Stock based compensation | — | — | 323,586 | 3,236 | 2,204,990 | — | — | — | 2,208,226 | ||||||||||||||||||||
Stock option exercises | — | — | 82,082 | 821 | 515,865 | — | — | — | 516,686 | ||||||||||||||||||||
Amortization of restricted stock | — | — | — | — | — | — | 680,459 | — | 680,459 | ||||||||||||||||||||
Stock issued under employee stock purchase plan | — | — | 78,702 | 787 | 373,362 | — | — | — | 374,149 | ||||||||||||||||||||
Net loss | — | — | — | — | — | — | — | (51,743,462 | ) | (51,743,462 | ) | ||||||||||||||||||
Change in unrealized loss on available-for-sale securities | — | — | — | — | — | 225,271 | — | — | 225,271 | ||||||||||||||||||||
December 31, 2005 | — | — | 85,835,248 | 858,353 | 531,435,616 | (257,120 | ) | — | (407,081,958 | ) | 124,954,891 | ||||||||||||||||||
Private placement, net | 395,000 | 3,950 | 11,240 | 112 | 214,438,067 | — | — | — | 214,442,129 | ||||||||||||||||||||
Stock based compensation | — | — | 839,800 | 8,401 | 4,849,699 | — | — | — | 4,858,100 | ||||||||||||||||||||
Stock option exercises | — | — | 7,958 | 80 | 31,271 | — | — | — | 31,351 | ||||||||||||||||||||
Stock issued under employee stock purchase plan | — | — | 100,669 | 1,006 | 363,662 | — | — | — | 364,668 | ||||||||||||||||||||
Net loss | — | — | — | — | — | — | — | (50,309,587 | ) | (50,309,587 | ) | ||||||||||||||||||
Change in unrealized loss on available-for-sale securities | — | — | — | — | — | 186,640 | — | — | 186,640 | ||||||||||||||||||||
December 31, 2006 | 395,000 | $ | 3,950 | 86,794,915 | $ | 867,952 | $ | 751,118,315 | $ | (70,480 | ) | $ | — | $ | (457,391,545 | ) | $ | 294,528,192 | |||||||||||
The accompanying notes are an integral part of the consolidated financial statements.
PLUG POWER INC. AND SUBSIDIARIES
(A DEVELOPMENT STAGE ENTERPRISE)
CONSOLIDATED STATEMENTS OF OPERATIONSSTOCKHOLDERS’ EQUITY AND COMPREHENSIVE LOSS
For the years ended December 31, 2006, 2005 and 2004
Comprehensive loss for the years ended December 31, 2006, 2005 and 2004 and 2003 and Cumulative Amounts from Inceptionis as follows:
| December 31, 2005 | December 31, 2004 | December 31, 2003 | Cumulative Amounts from Inception | |||||||||||||
Product and service revenue | $ | 4,880,505 | $ | 5,305,648 | $ | 7,517,060 | $ | 29,703,450 | ||||||||
Research and development contract revenue | 8,605,900 | 10,835,655 | 4,985,157 | 57,099,291 | ||||||||||||
Total revenue | 13,486,405 | 16,141,303 | 12,502,217 | 86,802,741 | ||||||||||||
Cost of product and service revenue | 4,097,647 | 5,367,897 | 7,150,192 | 29,297,443 | ||||||||||||
Cost of research and development contract revenue | 12,075,731 | 13,474,090 | 7,009,752 | 81,152,976 | ||||||||||||
In-process research and development | — | — | 3,000,000 | 12,026,640 | ||||||||||||
Research and development expense: | ||||||||||||||||
Noncash stock-based compensation | 1,574,101 | 2,591,156 | 1,752,276 | 8,806,176 | ||||||||||||
Other research and development | 34,745,181 | 32,611,633 | 38,317,462 | 296,018,794 | ||||||||||||
General and administrative expense: | ||||||||||||||||
Noncash stock-based compensation | 1,526,166 | 1,398,377 | 896,018 | 16,400,565 | ||||||||||||
Other general and administrative | 7,446,840 | 7,025,063 | 6,286,894 | 52,106,455 | ||||||||||||
Operating loss | (47,979,261 | ) | (46,326,913 | ) | (51,910,377 | ) | (409,006,308 | ) | ||||||||
Interest income | 2,166,740 | 1,452,593 | 833,014 | 21,679,400 | ||||||||||||
Interest expense | (145,583 | ) | (60,974 | ) | (61,568 | ) | (1,177,300 | ) | ||||||||
Loss before equity in losses of affiliates | (45,958,104 | ) | (44,935,294 | ) | (51,138,931 | ) | (388,504,208 | ) | ||||||||
Equity in losses of affiliates | (5,785,358 | ) | (1,803,533 | ) | (1,899,871 | ) | (18,577,750 | ) | ||||||||
Net loss | $ | (51,743,462 | ) | $ | (46,738,827 | ) | $ | (53,038,802 | ) | $ | (407,081,958 | ) | ||||
Loss per share: | ||||||||||||||||
Basic and diluted | $ | (0.66 | ) | $ | (0.64 | ) | $ | (0.88 | ) | |||||||
Weighted average number of common shares outstanding | 78,463,236 | 73,125,957 | 60,145,940 | |||||||||||||
| 2006 | 2005 | 2004 | ||||||||||
Net loss | $ | (50,309,587 | ) | $ | (51,743,462 | ) | $ | (46,738,827 | ) | |||
Other comprehensive income (loss) | 186,640 | 225,271 | (482,391 | ) | ||||||||
Total comprehensive loss | $ | (50,122,947 | ) | $ | (51,518,191 | ) | $ | (47,221,218 | ) | |||
The accompanying notes are an integral part of the consolidated financial statements.
PLUG POWER INC. AND SUBSIDIARIES
(A DEVELOPMENT STAGE ENTERPRISE)
CONSOLIDATED STATEMENTS OF CASH FLOWS
For the years ended December 31, 2005, 2004 and 2003 and cumulative amounts from inception
| December 31, 2005 | December 31, 2004 | December 31, 2003 | Cumulative Amounts from Inception | |||||||||||||
Cash Flows From Operating Activities: | ||||||||||||||||
Net loss | $ | (51,743,462 | ) | $ | (46,738,827 | ) | $ | (53,038,802 | ) | $ | (407,081,958 | ) | ||||
Adjustments to reconcile net loss to net cash used in operating activities: | ||||||||||||||||
Depreciation and amortization | 3,358,938 | 4,206,578 | 4,092,050 | 26,963,761 | ||||||||||||
Equity in losses of affiliates | 5,785,358 | 1,803,533 | 1,899,871 | 18,577,750 | ||||||||||||
Amortization of intangible asset | 687,500 | 2,750,000 | 2,577,347 | 15,124,501 | ||||||||||||
Noncash prepaid development costs | — | 708,481 | 1,436,784 | 10,000,000 | ||||||||||||
Loss (gain) on disposal of property, plant and equipment | (5,000 | ) | — | — | 27,493 | |||||||||||
In-kind services | — | — | — | 1,340,000 | ||||||||||||
Stock-based compensation | 2,888,685 | 4,137,202 | 2,966,797 | 25,028,983 | ||||||||||||
Amortization of deferred grant revenue | — | (200,000 | ) | (200,000 | ) | (1,000,000 | ) | |||||||||
Amortization and write-off of deferred rent | — | — | — | 2,000,000 | ||||||||||||
In-process research and development | — | — | 3,000,000 | 7,042,640 | ||||||||||||
Changes in assets and liabilities, net of effects of acquisition in 2003: | ||||||||||||||||
Accounts receivable | 1,472,512 | 318,146 | 1,057,043 | (1,297,628 | ) | |||||||||||
Inventory | (1,165,375 | ) | (863,399 | ) | (277,173 | ) | (4,337,942 | ) | ||||||||
Prepaid expenses and other current assets | (330,693 | ) | (27,767 | ) | (621,701 | ) | (3,597,877 | ) | ||||||||
Accounts payable and accrued expenses | 1,709,644 | (680,497 | ) | (215,144 | ) | 4,816,869 | ||||||||||
Deferred revenue | (2,527,179 | ) | 690,295 | (693,852 | ) | 4,148,048 | ||||||||||
Net cash used in operating activities | (39,869,072 | ) | (33,896,255 | ) | (38,016,780 | ) | (302,245,360 | ) | ||||||||
Cash Flows From Investing Activities: | ||||||||||||||||
Proceeds from acquisition | — | — | 36,521,491 | 36,521,491 | ||||||||||||
Integration costs and expenses associated with acquisition | — | — | (7,055,750 | ) | (7,055,750 | ) | ||||||||||
Purchase of property, plant and equipment | (999,582 | ) | (1,616,525 | ) | (627,348 | ) | (32,704,381 | ) | ||||||||
Proceeds from disposal of property, plant and equipment | 5,000 | — | — | 315,666 | ||||||||||||
Purchase of intangible asset | — | — | — | (9,624,500 | ) | |||||||||||
Investment in affiliate | — | — | — | (1,500,000 | ) | |||||||||||
Proceeds from sale of marketable securities | 177,351,026 | 41,181,267 | 306,179,105 | 919,816,198 | ||||||||||||
Purchases of marketable securities | (204,938,727 | ) | (76,217,470 | ) | (209,907,577 | ) | (995,758,952 | ) | ||||||||
Net cash provided by (used in) investing activities | (28,582,283 | ) | (36,652,728 | ) | 44,109,921 | (89,990,228 | ) | |||||||||
Cash Flows From Financing Activities: | ||||||||||||||||
Proceeds from issuance of common stock | 70,875,000 | — | 55,282,500 | 211,217,782 | ||||||||||||
Proceeds from initial public offering, net | — | — | — | 201,911,705 | ||||||||||||
Stock issuance costs | (294,264 | ) | — | (315,296 | ) | (2,678,336 | ) | |||||||||
Proceeds from stock option exercises and employee stock purchase plan | 890,835 | 910,721 | 433,578 | 10,365,677 | ||||||||||||
Cash placed in escrow | 365,000 | 345,000 | 325,000 | (3,965,274 | ) | |||||||||||
Principal payments on long-term debt and capital lease obligations | (484,257 | ) | (415,226 | ) | (391,309 | ) | (2,738,240 | ) | ||||||||
Net cash provided by financing activities | 71,352,314 | 840,495 | 55,334,473 | 414,113,314 | ||||||||||||
Increase (decrease) in cash and cash equivalents | 2,900,959 | (69,708,488 | ) | 61,427,614 | 21,877,726 | |||||||||||
Cash and cash equivalents, beginning of period | 18,976,767 | 88,685,255 | 27,257,641 | — | ||||||||||||
Cash and cash equivalents, end of period | $ | 21,877,726 | $ | 18,976,767 | $ | 88,685,255 | $ | 21,877,726 | ||||||||
The accompanying notes are an integral part of the consolidated financial statements.
PLUG POWER INC. AND SUBSIDIARIES
(A DEVELOPMENT STAGE ENTERPRISE)
CONSOLIDATED STATEMENTS OF STOCKHOLDERS’ EQUITY AND COMPREHENSIVE LOSS
For the years ended December 31, 2005, 2004 and 2003
| Common stock | |||||||||||||||||||||||||
| Shares | Amount | Additional Paid-in Capital | Accumulated other comprehensive loss | Unamortized Value of Restricted Stock | Deficit Accumulated During the Development Stage | Total Stockholders’ Equity | |||||||||||||||||||
December 31, 2002 | 50,997,073 | 509,971 | 347,747,664 | — | — | (255,560,867 | ) | 92,696,768 | |||||||||||||||||
Public offering, net | 11,700,000 | 117,000 | 54,850,204 | 54,967,204 | |||||||||||||||||||||
Stock issued in acquisition of H Power | 9,063,080 | 90,631 | 46,169,945 | 46,260,576 | |||||||||||||||||||||
Stock based compensation | 356,829 | 3,567 | 2,026,020 | 2,029,587 | |||||||||||||||||||||
Issuance of restricted stock | 608,304 | 6,083 | 3,173,700 | (3,179,783 | ) | — | |||||||||||||||||||
Amortization of restricted stock | 937,210 | 937,210 | |||||||||||||||||||||||
Stock option exercises | 35,033 | 350 | 84,623 | 84,973 | |||||||||||||||||||||
Stock issued under employee stock purchase plan | 90,380 | 904 | 347,701 | 348,605 | |||||||||||||||||||||
Net loss | (53,038,802 | ) | (53,038,802 | ) | |||||||||||||||||||||
December 31, 2003 | $ | 72,850,709 | $ | 728,506 | $ | 454,399,857 | $ | (2,242,573 | ) | $ | (308,599,669 | ) | $ | 144,286,121 | |||||||||||
Stock based compensation | 290,200 | 2,904 | 2,353,582 | 2,356,486 | |||||||||||||||||||||
Issuance of restricted stock | 42,300 | 422 | 218,180 | (218,602 | ) | — | |||||||||||||||||||
Amortization of restricted stock | 1,780,716 | 1,780,716 | |||||||||||||||||||||||
Stock option exercises | 95,960 | 960 | 500,348 | 501,308 | |||||||||||||||||||||
Stock issued under employee stock purchase plan | 71,709 | 717 | 408,696 | 409,413 | |||||||||||||||||||||
Net loss | (46,738,827 | ) | (46,738,827 | ) | |||||||||||||||||||||
Change in unrealized loss on marketable securities | (482,391 | (482,391 | ) | ||||||||||||||||||||||
December 31, 2004 | 73,350,878 | 733,509 | 457,880,663 | (482,391 | ) | (680,459 | ) | (355,338,496 | ) | 102,112,826 | |||||||||||||||
Public offering, net | 12,000,000 | 120,000 | 70,460,736 | 70,580,736 | |||||||||||||||||||||
Stock based compensation | 323,586 | 3,236 | 2,204,990 | 2,208,226 | |||||||||||||||||||||
Stock option exercises | 82,082 | 821 | 515,865 | 516,686 | |||||||||||||||||||||
Amortization of restricted stock | 680,459 | 680,459 | |||||||||||||||||||||||
Stock issued under employee stock purchase plan | 78,702 | 787 | 373,362 | 374,149 | |||||||||||||||||||||
Net loss | (51,743,462 | ) | (51,743,462 | ) | |||||||||||||||||||||
Change in unrealized loss on marketable securities | 225,271 | 225,271 | |||||||||||||||||||||||
December 31, 2005 | 85,835,248 | $ | 858,353 | $ | 531,435,616 | $ | (257,120 | ) | — | $ | (407,081,958 | ) | $ | 124,954,891 | |||||||||||
The accompanying notes are an integral part of the consolidated financial statements.
PLUG POWER INC. AND SUBSIDIARIES
(A DEVELOPMENT STAGE ENTERPRISE)
Comprehensive loss for the years ended December 31, 2005 and 2004 is as follows:
| 2005 | 2004 | |||||||
Net loss | $ | (51,743,462 | ) | $ | (46,738,827 | ) | ||
Other comprehensive income (loss) | 225,271 | (482,391 | ) | |||||
Total comprehensive loss | $ | (51,518,191 | ) | $ | (47,221,218 | ) | ||
Comprehensive loss for 2003 was equal to net loss.
PLUG POWER INC. AND SUBSIDIARIES
NOTES TO CONSOLIDATED FINANCIAL STATEMENTS
1. Nature of Operations
Description of Business
Plug Power Inc. and subsidiaries (Company) was originally formed as a joint venture between Edison Development Corporation (EDC) and Mechanical Technology Incorporated (MTI) in the State of Delaware on June 27, 1997 and succeeded by merger to all of the assets, liabilities and equity of Plug Power, L.L.C. on November 3, 1999.
The Company is a development stage enterprise involved in the design, development and manufacture of on-site energy systems for energy consumers worldwide. The Company’s focus is on a platform-based systems architecture, which includes proton exchange membrane (PEM) fuel cell and fuel processing technologies, from which multiple products are being offered or are under development. A fuel cell is an electrochemical device that combines hydrogen and oxygen to produce electric power without combustion. Hydrogen is derived from hydrocarbon fuels such as natural gas, propane, methanol or gasoline and can also be obtained from the electrolysis of water, stored hydrogen or a hydrogen pipeline.
The Company is currently offering its GenCore® product for commercial sale. The GenCore® product is a back-up power product initially targeted for telecommunications, broadband, utility and industrial uninterruptible power supply (UPS) applications. We are also developing additional products for continuous run power applications, with optional combined heat and power capability for remote small commercial and remote residential applications.
Liquidity
The Company’s cash requirements depend on numerous factors, including completion of our product development activities, ability to commercialize our on-site energy products, market acceptance of our systems and other factors. The Company expects to continue to devote substantial capital resources to continue its development programs directed at commercializing on-site energy products for worldwide use, hiring and training our production staff, developing and expanding our manufacturing capacity, and continuing expansion of our production and our research and development activities. The Company will pursue the expansion of its operations through internal growth and strategic acquisitions and expectexpects that such activities will be funded from existing cash and cash equivalents and available-for-sale securities and to a lesser extent, issuance of additional equity or debt securities or additional borrowings subject to market and other conditions. The failure to raise the funds necessary to finance our future cash requirements or consummate future acquisitions could adversely affect itsthe Company’s ability to pursue its strategy and could negatively affect its operations in future periods. The Company anticipates incurring additional losses over at least the next several years and believes that its current cash, cash equivalents and marketableavailable-for-sale securities balances will provide sufficient capital to fund operations for at least the next twelve months. At December 31, 2006, the Company had unrestricted cash, cash equivalents and available-for-sale securities in the amount of $269.1 million and working capital of $267.0 million.
In June 2006, the Company completed a private placement with Smart Hydrogen Inc. (the “Buyer”) whereby the Company sold 395,000 shares of Class B Capital Stock, a class of preferred stock of the Company, which are convertible into 39,500,000 shares of common stock, and 11,240 shares of common stock to the Buyer for a net purchase price of approximately $214.4 million, after payment of expenses relating to the issuance. The purchase price per share of the shares sold to the Buyer, on an as if-converted into common stock basis, was $5.50. The Buyer also contemporaneously purchased 1,825,000 shares of common stock of the Company from DTE Energy Foundation. Following the closing of these transactions, the Buyer owned approximately 35% of the Company’s outstanding common stock on an as if-converted basis.
PLUG POWER INC. AND SUBSIDIARIES
(A DEVELOPMENT STAGE ENTERPRISE)
NOTES TO CONSOLIDATED FINANCIAL STATEMENTS—(Continued)
In August 2005, the Company completed a public offering of 12.0 million shares of common stock. The Company received net proceeds of $70.6 million after payment of expenses and placement fees relating to the issuance and distribution of the securities.
At December 31, 2005, the Company had unrestricted cash, cash equivalents and marketable securities in the amount of $97.6 million and working capital of $95.5 million. Management believes that the Company’s current available cash, cash equivalents and marketable securities will provide sufficient capital to fund operations for at least the next twelve months.
PLUG POWER INC. AND SUBSIDIARIES
NOTES TO CONSOLIDATED FINANCIAL STATEMENTS—(Continued)
2. Summary of Significant Accounting Policies
Principles of Consolidation
The consolidated financial statements include the financial statements of Plug Power Inc. and its wholly ownedwholly-owned subsidiaries. All significant intercompany balances and transactions have been eliminated in consolidation.
Cash Equivalents and Restricted Cash
Cash equivalents consist of money market accounts, overnight repurchase agreements and certificates of deposit with an initial term of less than three months. For purposes of the consolidated statements of cash flows, the Company considers all highly liquidhighly-liquid debt instruments with original maturities of three months or less to be cash equivalents.
At December 31, 2005, and 2004, the Company hashad restricted cash of $4.0 million and $4.3 million, respectively, that iswas required to be placed in escrow to collateralize debt related to the purchase of real estate. The escrowed amounts arewere recorded under the captions “Restricted cash” in the accompanying consolidated balance sheets. This debt was repaid during 2006 and the restriction on this cash was eliminated.
MarketableAvailable-for-sale Securities
MarketableManagement determines the appropriate classification of its investments in available-for-sale securities at the time of purchase and reevaluates such determinations at each balance sheet date. Available-for-sale securities include investments in equitydebt obligations and debt obligations,mortgage-backed securities, which are carried at estimated fair value. These investments are considered available for sale,available-for-sale, and the difference between the amortized cost and the estimated fair value of these securities is reflected in accumulated other changes in unrealized loss on marketable securities andcomprehensive income as a separate component of stockholders’ equity. At December 31, 2005The Company has had no investments that qualify as trading or held to maturity. The cost of securities sold is based on the specific identification method. Security transactions are recognized on a trade date basis. Premiums and 2004,discounts on securities are amortized and accredited over the Company recordedterm of the security using the interest method. When a comprehensive loss of $225,000 and $482,000, respectively. There was no significant difference between cost and fairdecline in market value of these investments at December 31, 2003.
The amortizeda security is considered other-than-temporary, the cost andbasis of the individual security is written down to estimated fair value ofas the Company’s available-for-sale investment securities as of December 31, 2005 were as follows:
| Amortized Cost | Gross Unrealized Gains | Gross Unrealized Losses | Estimated Fair Value | |||||||||
Corporate Debt Securities | $ | 19,653,727 | $ | 12,369 | $ | 181,998 | $ | 19,484,098 | ||||
Debt Securities-US/Political Subdivisions | 35,450,000 | — | — | 35,450,000 | ||||||||
Mortgage-backed Securities | 20,839,027 | 12,126 | 99,617 | 20,751,536 | ||||||||
| $ | 75,942,754 | $ | 24,495 | $ | 281,615 | $ | 75,685,634 | |||||
The amortizednew cost and estimated fair value of the Company’s available-for-sale investment securities as of December 31, 2004 were as follows:
| Amortized Cost | Gross Unrealized Gains | Gross Unrealized Losses | Estimated Fair Value | |||||||||
Corporate Debt Securities | $ | 16,632,072 | $ | 123 | $ | 299,489 | $ | 16,332,706 | ||||
Mortgage-backed Securities | 20,922,981 | 118 | 183,143 | 20,739,956 | ||||||||
Equity Securities | 10,800,000 | — | — | 10,800,000 | ||||||||
| $ | 48,355,053 | $ | 241 | $ | 482,632 | $ | 47,872,662 | |||||
PLUG POWER INC. AND SUBSIDIARIES
NOTES TO CONSOLIDATED FINANCIAL STATEMENTS—(Continued)
The following are estimated fair value ofbasis and the gross unrealized lossesloss is charged to net security gains (losses) in the consolidated statement of the Company’s available-for-sale debt securities as of December 31, 2005:operations.
| Less than 12 months | More than 12 months | |||||||||||
| Estimated Fair Value | Gross Unrealized Losses | Estimated Fair Value | Gross Unrealized Losses | |||||||||
Corporate Debt Securities | $ | 17,309,793 | $ | 31,701 | $ | 2,343,933 | $ | 150,299 | ||||
Debt Securities-US/Political Subdivisions | 35,450,000 | — | — | — | ||||||||
Mortgage-backed Securities | 11,855,725 | 43,048 | 8,983,303 | 56,567 | ||||||||
| $ | 64,615,518 | $ | 74,749 | $ | 11,327,236 | $ | 206,866 | |||||
The following represents contractual maturities of investments in available for sale debt securities at December 31, 2005:
Due in | Amortized Cost | Estimated Fair Value | ||||
2006 | $ | 62,687,826 | $ | 63,227,184 | ||
2007-2009 | 9,139,928 | 8,343,450 | ||||
2010-2014 | — | — | ||||
2015 and later | 4,115,000 | 4,115,000 | ||||
Inventory
Inventory is stated at the lower of average cost or market value and generally consists primarily of raw materials. At December 31, 2006, inventory includes 43 completed units shipped on a consignment basis, valued at approximately $573,000.
Goodwill and Other Intangible Assets
Goodwill and intangible assets acquired in a purchase business combination and determined to have an indefinite useful life are not amortized, but instead tested for impairment at least annually in accordance with the provisions of Statement of Financial Accounting Standards (SFAS) No. 142, “Goodwill and Other Intangible Assets.” SFAS No. 142 also requires that intangible assets with estimable useful lives be amortized over their respective estimated useful lives to their estimated residual values, and reviewed for impairment in accordance with SFAS No. 144, “Accounting for Impairment or Disposal of Long-Lived Assets”.
PLUG POWER INC. AND SUBSIDIARIES
(A DEVELOPMENT STAGE ENTERPRISE)
NOTES TO CONSOLIDATED FINANCIAL STATEMENTS—(Continued)
Goodwill represents the excess of costs over fair value of H Power net assets acquired.acquired during 2003. Amortized intangible assets, including purchased technology and other intangible assets, arewere carried at cost less accumulated amortization. The Company amortizes these intangibleThese assets on a straight-line basis over their estimated useful lives. The range of estimated useful lives on the Company’s identifiable intangible assets is two to ten years.became fully amortized during 2005.
Product and Service Revenue
The Company applies the guidance within SEC Staff Accounting Bulletin No. 104, “Revenue Recognition in Financial Statements” (SAB 104) in the evaluation of its contracts to determine when to properly recognize revenue. Under SAB 104 revenue is recognized when title and risk of loss have passed to the customer, there is persuasive evidence of an arrangement, delivery has occurred or services have been rendered, the sales price is determinable, and collectibility is reasonably assured.
The Company’s initial sales of GenSys® and GenCore® 5T are contract specific arrangements containingproducts contain multiple obligations that may include a combination of fuel cell systems, continued service, maintenance and other support. While contract terms require payment upon delivery and installation of the fuel cell system and are
PLUG POWER INC. AND SUBSIDIARIES
NOTES TO CONSOLIDATED FINANCIAL STATEMENTS—(Continued)
not contingent on the achievement of specific milestones or other substantive performance, the multiple obligations within contractual arrangements are not accounted for separately based on the Company’s limited commercial experience and available evidence of fair value. The Company’s contractual arrangements under its initial commercial sales are with a limited numbervalue of customers and the arrangements are separately negotiated and not combined.different components. As a result, the Company defers recognition of product and service revenue and recognizes revenue on a straight-line basis over the stated contractual terms,term, or over the expected term if it is probable that the contractual term will be extended, as the continued service, maintenance and other support obligations expire, which are generally for periods of twelve to twenty-seventhirty months. The costs associated with the product, service and other obligations are expensed as they are incurred. At both December 31, 20052006 and 2004,2005, the Company had deferred product and service revenue in the amount of $2.9 million and $5.3 million, respectively.$2.2 million.
As the Company gains commercial experience, including field experience relative to service and warranty based on the sales of initial products, the fair values for the multiple elements within future contracts may become determinable and the Company may, in future periods, recognize revenue upon delivery of the product or may continue to defer recognition, based on application of appropriate guidance within EITFEmerging Issues Task Force (EITF) Issue No. 00-21, “Accounting for Revenue Arrangements with Multiple Deliverables”, or changes in the manner contractual agreements are structured, including agreements with distribution partners..
Research and Development Contract Revenue
Research and development contract revenue primarily relates to cost reimbursement research and development contracts associated with the development of PEM fuel cell technology. The Company generally shares in the cost of these programs with cost sharing percentages between 20% and 60%51%. Revenue from “time and material” contracts is recognized on the basis of hours utilized, plus other reimbursable contract costs incurred during the period. At December 31, 2006 and 2005, the Company had deferred research and development contract revenue in the amount of $461,000 and $216,000, and $200,000 as of December 31, 2004.respectively.
Property, Plant and Equipment
Property, plant and equipment are originally recorded at cost. Machinery and equipment under capital leases are originally recorded at the present value of minimum lease payments. Maintenance and repairs are expensed as costs are incurred.
Depreciation on plant and equipment is calculated on the straight-line method over the estimated useful lives of the assets. Machinery and equipment under capital leases are amortized straight linestraight-line over the shorter of the lease term or estimated useful life of the asset.
PLUG POWER INC. AND SUBSIDIARIES
(A DEVELOPMENT STAGE ENTERPRISE)
NOTES TO CONSOLIDATED FINANCIAL STATEMENTS—(Continued)
The Company provides forrecords depreciation and amortization of buildings, building improvements and machinery and equipment over the following estimated useful lives:
Buildings | 20 years | |
Building improvements | 5–20 years | |
Machinery and equipment | 3–15 years |
Investment in Affiliate
The Company’s investment in GE Fuel Cell Systems LLC iswas accounted for under the equity method. The Company would recognizerecognized a loss when there iswas an other than temporary decline in value in the investment in accordance with APB 18, “The Equity Method of Accounting for Investments in Common Stock.”
PLUG POWER INC. AND SUBSIDIARIES
NOTES TO CONSOLIDATED FINANCIAL STATEMENTS—(Continued)
Impairment of Long-Lived Assets
Long-lived assets, such as property, plant, and equipment, and purchased intangibles subject to amortization, are reviewed for impairment whenever events or changes in circumstances indicate that the carrying amount of an asset may not be recoverable. Recoverability of assets to be held and used is measured by a comparison of the carrying amount of an asset to estimated undiscounted future cash flows expected to be generated by the asset. If the carrying amount of an asset exceeds its estimated future cash flows, an impairment charge is recognized by the amount by which the carrying amount of the asset exceeds the fair value of the asset. Assets to be disposed of would be separately presented in the balance sheet and reported at the lower of the carrying amount or fair value less costs to sell, and are no longer depreciated. The assets and liabilities of a disposeddisposal group classified as held for sale would be presented separately in the appropriate asset and liability sections of the balance sheet.
Income Taxes
Income taxes are accounted for under the asset and liability method. Deferred tax assets and liabilities are recognized for the future tax consequences attributable to differences between the financial statement carrying amounts of existing assets and liabilities and their respective tax bases and operating loss and tax credit carryforwards. Deferred tax assets and liabilities are measured using enacted tax rates expected to apply to taxable income in the years in which those temporary differences are expected to be recovered or settled. The effect on deferred tax assets and liabilities of a change in tax rates is recognized in income in the period that includes the enactment date. A valuation allowance is recorded to reduce the carrying amounts of deferred tax assets if it is more likely than not that such assets will not be realized. We did not report a benefit for federal and state income taxes in the consolidated financial statements as the deferred tax asset generated from our net operating loss has been offset by a full valuation allowance because it is more likely than not that the tax benefits of the net operating loss carryforward will not be realized.
Research and Development
Costs incurred in the research and development ofby the Company’s fuel cell systemsCompany are expensed as incurred.
Stock-Based Compensation
The Company applieshas two stock-based employee compensation plans, which are described more fully in Note 10, Employee Benefit Plans.
In December 2004, the Financial Accounting Standards Board (FASB) issued SFAS No. 123 Revised (FAS 123R), “Share-Based Payment”, which establishes accounting for share-based awards exchanged for employee services and requires companies to expense the estimated fair value of these awards over the requisite employee
PLUG POWER INC. AND SUBSIDIARIES
(A DEVELOPMENT STAGE ENTERPRISE)
NOTES TO CONSOLIDATED FINANCIAL STATEMENTS—(Continued)
service period. The accounting provisions of FAS 123R have been adopted by the Company as of January 1, 2006. In March 2005, the SEC issued Staff Accounting Bulletin No. 107 (SAB 107) to assist filers by simplifying some of the implementation challenges of SFAS 123R. In particular, SAB 107 provides supplemental implementation guidance on FAS 123R, including guidance on valuation methods, classification of compensation expense, inventory capitalization of share-based compensation cost, income tax effects, disclosures in Management’s Discussion and Analysis and several other issues. The Company has applied the principles of SAB 107 in conjunction with its adoption of FAS 123R.
Under FAS 123R, share-based compensation cost is measured at the grant date, based on the estimated fair value of the award, and is recognized as expense over the employee’s requisite service period. The Company adopted the provisions of FAS 123R on January 1, 2006, the first day of the Company’s fiscal year, using the modified prospective application, which provides for certain changes to the method for valuing share-based compensation. Under the modified prospective application, prior periods are not revised for comparative purposes. The valuation provisions of FAS 123R apply to new awards and to awards that are outstanding on the effective date and subsequently modified or cancelled. Estimated compensation expense for awards outstanding at the effective date will be recognized over the remaining service period using the compensation cost calculated for pro forma disclosure purposes under the original FASB Statement No. 123, “Accounting for Stock-Based Compensation” (FAS 123).
Prior to the adoption of FAS 123R, the Company accounted for stock-based awards to employees and directors using the intrinsic value-basedvalue method of accounting prescribed byin accordance with Accounting Principles Board (APB) Opinion No. 25, “Accounting for Stock Issued to Employees,”Employees”, and related interpretations including Financial Accounting Standards Board (FASB) Interpretation No. 44, “Accounting for Certain Transactions involving Stock Compensation an interpretationInterpretations as permitted under FAS 123. Under the intrinsic value method, stock-based compensation was only recognized by the Company due to modifications in option provisions, since the exercise price of APB Opinion No. 25”,the Company’s stock options granted to account for its fixed planemployees and directors usually equaled the fair market value of the underlying stock options. Under this method,at the date of grant.
Stock-based compensation represents the cost related to stock-based awards granted to employees and directors. The Company measures stock-based compensation cost at grant date, based on the estimated fair value of the award, and recognizes the cost as expense on a straight-line basis (net of estimated forfeitures) over the option’s requisite service period.
The Company estimates the fair value of stock-based awards using a Black-Scholes valuation model. Stock-based compensation expense is recorded in “Research and development expense—Noncash stock-based compensation” and “General and administrative expense—Noncash stock-based compensation” in the consolidated statements of operations based on the dateemployees’ respective function.
The Company records deferred tax assets for awards that result in deductions on the Company’s income tax returns, unless the Company cannot recognize the deduction (i.e. the Company is in a net operating loss (NOL) position), based on the amount of grant onlycompensation cost recognized and the Company’s statutory tax rate. Differences between the deferred tax assets recognized for financial reporting purposes and the actual tax deduction reported on the Company’s income tax return are recorded in additional paid-in capital if the currenttax deduction exceeds the deferred tax asset or in the consolidated statements of operations if the deferred tax asset exceeds the tax deduction and no additional paid-in capital exists from previous awards. No tax benefit or expense for stock-based compensation has been recorded during the years ended December 31, 2006, 2005 and 2004 since the Company remains in a NOL position.
The Company continues to record the fair market pricevalue of the underlying stock exceeded the exercise price. SFASoptions granted to non-employees and non-directors in exchange for services in accordance with EITF Issue No. 123,96-18, “Accounting for Stock-Based Compensation”, established accounting and disclosure requirements using a fair value-based method of accounting for stock-based employee compensation plans. As allowed by SFAS No. 123, the Company has elected to continue to apply the intrinsic value-based method of accounting described above, and has adopted the disclosure requirements of SFAS No. 123. The following table illustrates the effect on net loss if the fair-value-based method had been applied to all outstanding and unvested awards in each period:Equity
| Year Ended December 31, | ||||||||||||
| 2005 | 2004 | 2003 | ||||||||||
Net loss, as reported | $ | (51,743,462 | ) | $ | (46,738,827 | ) | $ | (53,038,802 | ) | |||
Add: Stock-based employee compensation expense included in reported net loss | 3,100,267 | 3,989,533 | 2,648,294 | |||||||||
Deduct: Total stock-based employee compensation expense determined under fair value-based method for all awards | (7,292,499 | ) | (11,450,940 | ) | (12,140,641 | ) | ||||||
Proforma net loss | $ | (55,935,694 | ) | $ | (54,200,234 | ) | $ | (62,531,149 | ) | |||
Loss per share: | ||||||||||||
Basic and diluted—as reported | $ | (0.66 | ) | $ | (0.64 | ) | $ | (0.88 | ) | |||
Basic and diluted—pro forma | $ | (0.71 | ) | $ | (0.74 | ) | $ | (1.04 | ) | |||
PLUG POWER INC. AND SUBSIDIARIES
(A DEVELOPMENT STAGE ENTERPRISE)
NOTES TO CONSOLIDATED FINANCIAL STATEMENTS—(Continued)
Instruments That Are Issued to Other Than Employees for Acquiring, or in Conjunction with Selling, Goods or Services”, in the consolidated statements of operations.
Per Share Amounts
The Company reports net loss per basic and diluted common share in accordance with SFAS No. 128, “Earnings Per Share”, which establishes standards for computing and presenting loss per share. Basic earnings per common share excludes dilution and isare computed by dividing income (loss)net loss available to common stockholders by the weighted average number of common shares outstanding forduring the reporting period. Diluted earnings per share reflects the potential dilution that could occur if securities or other contracts to issue common stock (such as stock options and warrants) were exercised or converted into common stock or resulted in the issuance of common stock that then shared in the earnings of the Company, (such asif any, computed by dividing net earnings by the combination of dilutive common share equivalents, comprised of shares issuable under outstanding investment rights, warrants and the Company’s share-based compensation plans, and the weighted average number of common shares outstanding during the reporting period. Since the Company is in a net loss position, all common stock optionsequivalents would be considered to be anti-dilutive and warrants).are, therefore, not included in the determination of diluted earnings per share. Accordingly, basic and diluted loss per share are the same.
The following table provides the components of the calculations of basic and diluted earnings per share:
| Year Ended December 31, | Year Ended December 31, | |||||||||||||||||||||||
| 2005 | 2004 | 2003 | 2006 | 2005 | 2004 | |||||||||||||||||||
Numerator: | ||||||||||||||||||||||||
Net loss | $ | (51,743,462 | ) | $ | (46,738,827 | ) | $ | (53,038,802 | ) | $ | (50,309,587 | ) | $ | (51,743,462 | ) | $ | (46,738,827 | ) | ||||||
Denominator: | ||||||||||||||||||||||||
Weighted average number of common shares | 78,463,236 | 73,125,957 | 60,145,940 | 86,100,326 | 78,463,236 | 73,125,957 | ||||||||||||||||||
No options, warrants, securities convertible into common stock (such as the Company’s preferred stock), or warrantsunvested restricted stock outstanding were included in the calculation of diluted loss per share because their impact would have been anti-dilutive. These dilutive potential common shares are summarized below:as follows:
Number of dilutive potential common shares | 6,229,729 | 6,163,971 | 6,522,164 | |||
| Year Ended December 31, | ||||||
| 2006 | 2005 | 2004 | ||||
Stock options | 6,511,563 | 5,504,729 | 4,712,064 | |||
Unvested restricted stock | 430,623 | — | — | |||
Preferred stock(1) | 39,500,000 | — | — | |||
Warrants | — | 725,000 | 725,000 | |||
Number of dilutive potential common shares | 46,442,186 | 6,229,729 | 5,437,064 | |||
| (1) | The preferred stock amount represents the dilutive potential common shares of the 395,000 shares of Class B capital stock issued on June 29, 2006. |
Use of Estimates
The consolidated financial statements of the Company have been prepared in conformity with accounting principlesU.S. generally accepted in the United States of America,accounting principles, which require management to make estimates and assumptions that affect the reported amounts of assets and liabilities and disclosure of contingent assets and liabilities at the date of the financial statements and the reported amounts of revenues and expenses during the reporting period. Actual results could differ from those estimates.
Recent Accounting Pronouncements
In November 2004, the FASB issued SFAS No. 151 “Inventory Costs, an amendment of ARB No. 43”, to clarify the accounting for abnormal amounts of idle facility expense, freight, handling costs, and wasted material (spoilage). SFAS No. 151 requires that those items be recognized as current-period charges regardless of whether they meet the criterion of “so abnormal.” In addition, this Statement requires that allocation of fixed production overheads to the costs of conversion be based on the normal capacity of the production facilities. SFAS No. 151 is effective for inventory costs incurred during fiscal years beginning after June 15, 2005. The Company is currently evaluating the effect of the statement on the consolidated financial statements.
In December 2004, the FASB issued SFAS No. 123R, “Share-Based Payment.” SFAS No. 123R requires employee stock options and rights to purchase shares under stock participation plans to be accounted for under the fair value method, and eliminates the ability to account for these instruments under the intrinsic value method prescribed by APB Opinion No. 25, and allowed under the original provisions of SFAS No. 123. SFAS No. 123R requires the use of an option pricing model for estimating fair value, which is amortized to expense over the service periods. The requirements of SFAS No. 123R are effective for fiscal periods beginning after June 15,
PLUG POWER INC. AND SUBSIDIARIES
(A DEVELOPMENT STAGE ENTERPRISE)
NOTES TO CONSOLIDATED FINANCIAL STATEMENTS—(Continued)
2005. If the Company had applied the provisions of SFAS No. 123R to the financial statements for the period ending December 31, 2004, net loss would have been increased by approximately $4.2 million. SFAS No. 123R allows for either prospective recognition of compensation expense or retrospective recognition, which may be back to the original issuance of SFAS No. 123 or only to interim periods in the year of adoption. The Company is currently evaluating these transition methods.Recent Accounting Pronouncements
In March 2005,July 2006, the FASB issued FASB Interpretation No. (“FIN”) 47,No.48, “Accounting for Conditional Asset Retirement Obligations.” FIN 47Uncertainty in Income Taxes-an interpretation of FASB Statement No.109” (FIN 48), which clarifies the accounting for uncertainty in tax positions. This Interpretation requires that the term conditional asset retirement obligation, as usedCompany recognize in SFAS No. 143, “Accounting for Asset Retirement Obligations,” refers toits financial statements the impact of a legal obligation to perform an asset retirement activity in whichtax position, if that position is more likely than not of being sustained on audit, based on the timing and (or) method of settlement are conditional on a future event that may or may not be within controltechnical merits of the entity. The obligation to perform the asset retirement activity is unconditional even though uncertainty exists about the timing and (or) method of settlement. Uncertainty about the timing and (or) method of settlement of a conditional asset retirement obligation should be factored into the measurement of the liability when sufficient information exists. FIN 47 also clarifies when an entity would have sufficient information to reasonably estimate the fair value of an asset retirement obligation. Theposition. This Interpretation is effective no later than the end of fiscal years ending after December 15, 2005. The Company’s adoption of the Interpretation did not have a material effect on the Company’s financial position, cash flows or results of operations for the year ending December 31, 2005.
In May 2005, the FASB issued SFAS No. 154, “Accounting Changes and Error Corrections”, a replacement of Accounting Principles Board Opinion No. 20, “Accounting Changes”, and SFAS No. 3, “Reporting Accounting Changes in Interim Financial Statements” (“SFAS 154”). SFAS 154 changes the requirements for the accounting for, and reporting of, a change in accounting principle. Previously, voluntary changes in accounting principles were generally required to be recognized by way of a cumulative effect adjustment within net income during the period of the change. SFAS 154 requires retrospective application to prior periods’ financial statements, unless it is impracticable to determine either the period-specific effects or the cumulative effect of the change. SFAS 154 is effective for accounting changes made in fiscal years beginning after December 15, 2005; however,2006, with the statement does notcumulative effect of the change the transition provisions of any existingin accounting pronouncements.principle recorded as an adjustment to opening retained earnings. The Company does not believe thatexpect the adoption of SFAS 154 on January 1, 2006 willthis statement to have a material effectimpact on its consolidated financial position, cash flowsstatements.
In September 2006, the FASB issued SFAS No. 158, “Employers’ Accounting for Defined Benefit Pension and Other Postretirement Plans-an amendment of FASB Statements No. 87, 88, 106, and 132(R),” (FAS 158), which requires the recognition of the over funded or resultsunder funded status of operations.a defined benefit postretirement plan in a company’s balance sheet. This portion of the new guidance is effective on December 31, 2006. Additionally, the pronouncement eliminates the option for companies to use a measurement date prior to their fiscal year-end effective December 31, 2008. The adoption of FAS 158 did not have a material impact on our consolidated financial statements.
In September 2006, the FASB issued SFAS No. 157, “Fair Value Measurements” (FAS No. 157). This new standard establishes a framework for measuring the fair value of assets and liabilities. This framework is intended to provide increased consistency in how fair value determinations are made under various existing accounting standards which permit, or in some cases require, estimates of fair market value. FAS No. 157 also expands financial statement disclosure requirements about a company’s use of fair value measurements, including the effect of such measures on earnings. This standard is effective for fiscal years beginning after November 15, 2007, and interim periods within those fiscal years. The Company is currently evaluating the provisions of FAS No. 157.
3. Available-for-sale Securities
The amortized cost and estimated fair value of the Company’s available-for-sale securities as of December 31, 2006 were as follows:
Amortized Cost | Gross Unrealized Gains | Gross Unrealized Losses | Estimated Fair Value | ||||||||||
Corporate Debt Securities | $ | 110,413,628 | $ | 66,072 | $ | (45,221 | ) | $ | 110,434,479 | ||||
Auction Rate Debt Securities-US/Political Subdivisions | 49,900,000 | — | — | 49,900,000 | |||||||||
Mortgage-backed Securities | 81,980,054 | 12,234 | (103,565 | ) | 81,888,723 | ||||||||
| $ | 242,293,682 | $ | 78,306 | $ | (148,786 | ) | $ | 242,223,202 | |||||
The amortized cost and estimated fair value of the Company’s available-for-sale securities as of December 31, 2005 were as follows:
| Amortized Cost | Gross Unrealized Gains | Gross Unrealized Losses | Estimated Fair Value | ||||||||||
Corporate Debt Securities | $ | 19,653,727 | $ | 12,369 | $ | (181,998 | ) | $ | 19,484,098 | ||||
Auction Rate Debt Securities-US/Political Subdivisions | 35,450,000 | — | — | 35,450,000 | |||||||||
Mortgage-backed Securities | 20,839,027 | 12,126 | (99,617 | ) | 20,751,536 | ||||||||
| $ | 75,942,754 | $ | 24,495 | $ | (281,615 | ) | $ | 75,685,634 | |||||
PLUG POWER INC. AND SUBSIDIARIES
(A DEVELOPMENT STAGE ENTERPRISE)
NOTES TO CONSOLIDATED FINANCIAL STATEMENTS—(Continued)
The following are estimated fair values and unrealized losses of the Company’s available-for-sale securities that are in an unrealized loss position as of December 31, 2006:
| Less than 12 months | More than 12 months | |||||||||||||
| Estimated Fair Value | Unrealized Losses | Estimated Fair Value | Unrealized Losses | |||||||||||
Corporate Debt Securities | $ | 24,802,577 | $ | (20,394 | ) | $ | 8,934,835 | $ | (24,827 | ) | ||||
Auction Rate Debt Securities-US/Political Subdivisions | — | — | — | — | ||||||||||
Mortgage-backed Securities | 4,882,653 | (23,854 | ) | 55,896,040 | (79,711 | ) | ||||||||
| $ | 29,685,230 | $ | (44,248 | ) | $ | 64,830,875 | $ | (104,538 | ) | |||||
The following are estimated fair values and unrealized losses of the Company’s available-for-sale securities that are in an unrealized loss position as of December 31, 2005:
| Less than 12 months | More than 12 months | |||||||||||||
| Estimated Fair Value | Unrealized Losses | Estimated Fair Value | Unrealized Losses | |||||||||||
Corporate Debt Securities | $ | 5,009,703 | $ | (31,701 | ) | $ | 2,343,933 | $ | (150,297 | ) | ||||
Auction Rate Debt Securities-US/Political Subdivisions | — | — | — | — | ||||||||||
Mortgage-backed Securities | 8,391,001 | (43,048 | ) | 8,983,303 | (56,567 | ) | ||||||||
| $ | 13,400,704 | $ | (74,749 | ) | $ | 11,327,236 | $ | (206,864 | ) | |||||
The above tables represent 23 and 21 securities where the current fair value is less than the related amortized cost at December 31, 2006 and 2005, respectively. These unrealized losses do not reflect any deterioration of the credit worthiness of the issuers of the securities. All securities are of investment grade. The unrealized losses on these temporarily impaired securities are a result of changes in interest rates for fixed-rate securities where the interest rate received is less than the current rate available for new offerings of similar securities and changes in market spreads as a result of shifts in supply and demand. The Company has the ability and intent to hold these securities to maturity at which time full recovery of the investment is expected.
The following represents contractual maturities of available-for-sale securities at December 31, 2006. Actual maturities will differ from contractual maturities because certain issuers have the right to call or prepay their obligations:
Due in | Amortized Cost | Estimated Fair Value | ||||
2007 | $ | 145,313,710 | $ | 141,287,822 | ||
2008-2011 | 92,999,972 | 97,955,380 | ||||
2012-2016 | — | — | ||||
2017 and thereafter | 3,980,000 | 2,980,000 | ||||
| $ | 242,293,682 | $ | 242,223,202 | |||
The Company recognized gross gains, gross losses and proceeds on available-for-sale securities for each of the years ended December 31 as follows:
| 2006 | 2005 | 2004 | |||||||
Proceeds on sales | $ | 29,284,989 | $ | 802,878 | $ | 17,084,436 | |||
Proceeds on maturities | 823,683,523 | 176,548,148 | 24,096,831 | ||||||
Gross realized gains | 80,318 | 313 | 349,058 | ||||||
Gross realized losses | 12,396 | 74,536 | 1,476 | ||||||
PLUG POWER INC. AND SUBSIDIARIES
(A DEVELOPMENT STAGE ENTERPRISE)
NOTES TO CONSOLIDATED FINANCIAL STATEMENTS—(Continued)
4. Investment in Affiliate
In February 1999, the Company entered into an agreement with GE MicroGen, Inc. to form GE Fuel Cell Systems, LLC (GEFCS), to exclusively market, distribute, install and service certain of its PEM fuel cell systems under 35 kW designed for use in residential, commercial and industrial stationary power applications on a global basis, with the exception of the states of Illinois, Indiana, Michigan and Ohio, in which DTE Energy Technologies, Inc. (“DTE”)(DTE), has exclusive distribution rights. GE MicroGen, Inc. is a wholly owned subsidiary of General Electric Company that operates within the GE Energy.
In connection with the original formation of GEFCS, the Company issued 2,250,000 shares of its common stock to GE MicroGen, Inc. in exchange for a 25% interest in GEFCS. As of the date of issuance of such shares, the Company capitalized $11.3 million, the fair value of the shares issued, under the caption “Investment in affiliates” in the accompanying consolidated financial statements. In accordance with the terms of the agreement, General Electric Company willagreed to provide capital in the form of a loan not to exceed $8.0 million, to fund the operations of GEFCS.
In August 2001, the Company amended its agreements with GE Microgen,MicroGen, Inc. and GEFCS to expand GEFCS’ exclusive worldwide distribution rights to include all of its stationary PEM fuel cell systems. In addition, the Company increased its ownership interest in GEFCS from 25% to 40%. In return, the Company
PLUG POWER INC. AND SUBSIDIARIES
NOTES TO CONSOLIDATED FINANCIAL STATEMENTS—(Continued)
granted GE Power Systems Equities, Inc. an option to purchase 725,000 shares of its common stock at any time prior to August 21, 2006 at an exercise price of $15.00 per share. The Company also replaced the product specifications, prices and delivery schedule in their distribution agreement with a high-level, multi-generation product plan, with subsequent modifications being subject to mutual agreement, and extended the term of the agreement to December 31, 2014. In connection with these transactions, the Company capitalized $5.0 million, the fair value, calculated using the Black-Scholes pricing model, of the option to purchase 725,000 shares of Plug Power common stock, under the caption “Investment in affiliates” in the accompanying consolidated financial statements, and is amortizing this amount over the remaining term of the original distribution agreement.
The Company accountsaccounted for its interest in GEFCS on the equity method of accounting and adjustsadjusted its investment by its proportionate share of income or losses under the caption “Equity in losses of affiliates” in the accompanying consolidated statements of operations. GEFCS had an operating and net loss of $24,000 for the year ended December 31, 2005. Additionally, during the fourth quarter of fiscal 2005 the Company recorded an other than temporary impairment of its investment in GEFCS in accordance with APB 18,The “The Equity Method of Accounting for Investments in Common StockStock”. The charge was recorded to fully write-off our investment primarily as a result of a shift in the Company’s business strategy away from residential fuel cells, for which GEFCS was well suited as a distribution partner, to back-up power generation, for which GEFCS is not a natural partner. Accordingly, an other than temporary impairment in the amount of $4.0 million was recorded and is included in the caption “equity“Equity in losses of affiliates” in the consolidated statementstatements of operations for the year endended December 31, 2005. For the years ended December 31, 2006, 2005 2004 and 2003,2004, equity in losses of affiliates related to GEFCS, including the other than temporary impairment in 2005 was $0, $5.8 million and $1.8 million, and $1.9 million, respectively. Accumulated amortization at December 31, 2005 and 2004 was $16.3 million and $10.5 million, respectively.
Under a separate agreement with the General Electric Company, for our product development effort,On March 24, 2006, the Company, has agreed to source technical support services, including engineering, testing, manufacturingGE MicroGen, Inc., and quality control services.GE restructured their service and equity relationships by terminating the joint venture and the associated distributor and other agreements, and entering into a new development collaboration agreement. Under the initialnew agreement, the Company was committedand GE (through its Global Research unit) have agreed to purchase a minimumcollaborate on programs including but not limited to development of $12.0 milliontools, materials and components that can be applied to various types of fuel cell products. The specific programs to be undertaken under the agreement, and the detailed terms and conditions thereof, remain subject to agreement by both parties. It is anticipated that such services over a five-year period, which began September 30, 1999. During 2004,programs could also include continued collaboration on sales and
PLUG POWER INC. AND SUBSIDIARIES
(A DEVELOPMENT STAGE ENTERPRISE)
NOTES TO CONSOLIDATED FINANCIAL STATEMENTS—(Continued)
marketing opportunities for the Company’s products between the Company and General ElectricGE. Under the terms of the new development collaboration agreement, the Company extendedis obligated to purchase $1 million of services from GE in connection with this period through September 2007. Atcollaboration prior to December 31, 2005 and 2004, approximately $98,000 and $262,000, respectively, was payable2008. The development collaboration agreement is scheduled to General Electric Company under this arrangement. Throughterminate on the earlier of (i) December 31, 2005,2014 or (ii) upon completion of a certain level of program activity.
The Company and GE agreed that GEFCS was not an effective entity for marketing the Company’s products. Accordingly, the exclusive product distribution and service rights that had been granted by the Company had purchased approximately $10.3 millionto GEFCS reverted back to the Company and, in the case of such services.
Additionally, General Electriccertain products, the Company has agreedwill no longer be required to act aspay commissions to GE on third-party sales. The Company may now freely sell its products to the agentpartners and customers it determines are most effective in procuring certain equipment, parts and components and is providing training servicesexecuting its business plan, with no further obligations to our employees regarding procurement activities pursuant to this agreement.GE.
4.5. Property, Plant and Equipment
Property, plant and equipment at December 31, 20052006 and 20042005 consist of the following:
| December 31, 2005 | December 31, 2004 | |||||||
Land | $ | 90,000 | $ | 90,000 | ||||
Buildings | 14,557,080 | 14,557,080 | ||||||
Building improvements | 6,701,412 | 7,450,936 | ||||||
Machinery and equipment | 23,060,530 | 22,293,614 | ||||||
| 44,409,022 | 44,391,630 | |||||||
Less accumulated depreciation and amortization | (24,582,911 | ) | (22,562,376 | ) | ||||
Property, plant, and equipment, net | $ | 19,826,111 | $ | 21,829,254 | ||||
PLUG POWER INC. AND SUBSIDIARIES
NOTES TO CONSOLIDATED FINANCIAL STATEMENTS—(Continued)
| December 31, 2006 | December 31, 2005 | |||||||
Land | $ | 90,000 | $ | 90,000 | ||||
Buildings | 14,557,080 | 14,557,080 | ||||||
Building improvements | 6,705,606 | 6,701,412 | ||||||
Machinery and equipment | 24,326,713 | 23,060,530 | ||||||
| 45,679,399 | 44,409,022 | |||||||
Less accumulated depreciation and amortization | (27,631,145 | ) | (24,582,911 | ) | ||||
Property, plant, and equipment, net | $ | 18,048,254 | $ | 19,826,111 | ||||
Depreciation expense was $3.1 million, $4.0$3.1 million and $3.9$4.0 million for the years ended December 31, 2006, 2005 and 2004, respectively, and 2003, respectively.is included in other research and development and other general and administrative expenses on the accompanying consolidated statements of operations.
5.6. Goodwill and Other Intangible Assets
No changes in the carrying amount of goodwill occurred during the year ended December 31, 2005. The gross carrying amount and accumulated amortization of the Company’s acquired intangible assets as of December 31, 2005 and December 31, 2004 were as follows:2006.
| December 31, 2005 | December 31, 2004 | |||||||||||||
| Weighted Average Amortization Period | Gross Carrying Amount | Accumulated Amortization | Gross Carrying Amount | Accumulated Amortization | ||||||||||
Distribution Agreement | 10 years | $ | 16,250,000 | $ | 16,250,000 | $ | 16,250,000 | $ | 10,464,642 | |||||
Purchased Technology—H Power | 2 years | 5,500,000 | 5,500,000 | 5,500,000 | 4,812,500 | |||||||||
Total | $ | 21,750,000 | $ | 21,750,000 | $ | 21,750,000 | $ | 15,277,142 | ||||||
Amortization expense, including the other than temporary impairment noted above, for acquired intangible assets during the years ended December 31, 2006, 2005 and 2004 and 2003 was $0 million, $6.5 million, $4.5 million, and $4.4$4.5 million, respectively. All acquired identifiable intangible assets have beenwere fully amortized as of December 31, 2005.
6.7. Debt
In connection with the Company’s purchase of real estate in July, 1999, the Company assumed a $6.2 million letter of credit issued by KeyBank National Association for the express purpose of servicing $6.2 million of debt related to Industrial Development
Revenue Bonds issued by the Town of Colonie Industrial Development Agency in favor of the acquired property. The debt matures in 2013 and accrues interest at a variable rate of interest which was approximately 4.44% at December 31, 2005. Simultaneous with the assumption,repaid by the Company was required to escrow $6.2 million to collateralize the debt. This debt also contains a subjective acceleration clause based on adverse financial conditions. The bank has provided the Company with a waiver through January 1, 2007 for any adverse changes in financial condition occurring prior to December 31, 2005.November 2006.
The outstanding balance of the debt as of December 31, 2006 and 2005 was $0 and $4.0 million, respectively and the amount of the corresponding escrow requirement as of December 31, 2006 and 2005 was $0 and $4.0 million, respectively, and iswas recorded under the balance sheet caption “Restricted cash.” Principal payments due on long-term debt are: 2006, $385,000; 2007, $410,000; 2008, $435,000; 2009, $460,000; 2010, $485,000 and thereafter, $1.7 million.
7. Accrued Expenses
Accrued expenses at December 31, 2005 and 2004 consist of:
| 2005 | 2004 | |||||
Accrued payroll and compensation related costs | $ | 1,330,475 | $ | 681,056 | ||
Accrual for closure of H Power facilities | 642,650 | 451,620 | ||||
Other accrued liabilities | 1,862,848 | 1,314,640 | ||||
| $ | 3,835,973 | $ | 2,447,316 | |||
PLUG POWER INC. AND SUBSIDIARIES
(A DEVELOPMENT STAGE ENTERPRISE)
NOTES TO CONSOLIDATED FINANCIAL STATEMENTS—(Continued)
8. Accrued Expenses
Accrued expenses at December 31, 2006 and 2005 consist of:
| 2006 | 2005 | |||||
Accrued payroll and compensation related costs | $ | 1,097,387 | $ | 1,330,475 | ||
Accrual for closure of H Power facilities | — | 642,650 | ||||
Other accrued liabilities | 1,499,603 | 1,862,848 | ||||
| $ | 2,596,990 | $ | 3,835,973 | |||
9. Income Taxes
There was no current income tax expense for the years ended December 31, 2006, 2005 2004 and 2003.2004. The Company was a Limited Liability Company (LLC) until its merger into Plug Power Inc. effective November 3, 1999. From inception through November 3, 1999, the Company was treated as a partnership for federal and state income tax purposes and accordingly the Company’s income taxes or credits resulting from earnings or losses were payable by, or accrued to its members. Therefore, no provision for income taxes has been made prior to November 3, 1999.
Effective November 3, 1999, the Company is taxed as a corporation for Federal and State income tax purposes and the effect of deferred taxes recognized as a result of the change in tax status of the Company have been included in operations. Deferred tax assets and liabilities are determined based on the temporary differences between the financial statement and tax bases of assets and liabilities as measured by the enacted tax rates.
The significant components of deferred income tax (benefit) expense (benefit) for the years ended December 31, 2006, 2005 2004 and 20032004 are as follows:
| Years ended December 31, | Years ended December 31, | |||||||||||||||||||||||
| 2005 | 2004 | 2003 | 2006 | 2005 | 2004 | |||||||||||||||||||
Deferred tax expense/(benefit) | $ | (2,045,729 | ) | $ | 420,106 | $ | 2,083,500 | |||||||||||||||||
Deferred tax (benefit)/expense | $ | (2,615,824 | ) | $ | (2,045,729 | ) | $ | 420,106 | ||||||||||||||||
Net operating loss carry forward | (10,872,793 | ) | (17,250,973 | ) | (20,904,800 | ) | (17,361,668 | ) | (10,872,793 | ) | (17,250,973 | ) | ||||||||||||
Valuation allowance | 12,918,522 | 16,830,867 | 18,821,300 | 19,977,492 | 12,918,522 | 16,830,867 | ||||||||||||||||||
Provision for income taxes | $ | — | $ | — | $ | — | $ | — | $ | — | $ | — | ||||||||||||
The Company’s effective income tax rate differed from the Federal statutory rate as follows:
| Years ended December 31, | Years ended December 31, | |||||||||||||||||
| 2005 | 2004 | 2003 | 2006 | 2005 | 2004 | |||||||||||||
Federal statutory tax rate | (35.0 | )% | (35.0 | )% | (35.0 | )% | (35.0 | )% | (35.0 | )% | (35.0 | )% | ||||||
Deferred state taxes, net of federal benefit | (2.9 | ) | (4.9 | ) | (4.9 | ) | (3.0 | ) | (2.9 | ) | (4.9 | ) | ||||||
Other, net | 0.0 | 0.1 | 0.1 | 1.1 | 0.0 | 0.1 | ||||||||||||
Adjustment to opening deferred tax balance | 16.5 | 7.1 | — | .7 | 16.5 | 7.1 | ||||||||||||
Tax credits | (3.6 | ) | (3.3 | ) | (1.8 | ) | (3.0 | ) | (3.6 | ) | (3.3 | ) | ||||||
Change in valuation allowance | 25.0 | 36.0 | 41.6 | 39.2 | 25.0 | 36.0 | ||||||||||||
| 0.0 | % | 0.0 | % | 0.0 | % | 0.0 | % | 0.0 | % | 0.0 | % | |||||||
PLUG POWER INC. AND SUBSIDIARIES
(A DEVELOPMENT STAGE ENTERPRISE)
NOTES TO CONSOLIDATED FINANCIAL STATEMENTS—(Continued)
The deferred tax assets and liabilities as of December 31, 20052006 and 20042005 consist of the following tax effects relating to temporary differences and carryforwards:
| Years ended December 31, | Years ended December 31, | |||||||||||||||
| 2005 | 2004 | 2006 | 2005 | |||||||||||||
Deferred tax assets: | ||||||||||||||||
Intangible assets | $ | 927,342 | $ | 1,090,709 | $ | 557,260 | $ | 927,342 | ||||||||
Stock-based compensation | 365,484 | 1,471,893 | 365,484 | 365,484 | ||||||||||||
Deferred income | 1,196,258 | 2,270,091 | ||||||||||||||
Deferred revenue | 1,275,131 | 1,196,258 | ||||||||||||||
Investment in affiliates | 6,168,889 | 3,838,368 | — | 6,168,889 | ||||||||||||
Other reserves and accruals | 277,160 | 315,508 | 355,143 | 277,160 | ||||||||||||
Capital loss carryforwards | 884,545 | 931,100 | 6,768,435 | 884,545 | ||||||||||||
Tax credit carryforwards | 12,791,495 | 10,936,817 | 13,976,769 | 12,791,495 | ||||||||||||
Property, plant and equipment | 340,496 | 51,455 | 529,330 | 340,496 | ||||||||||||
Amortization of stock-based compensation | 1,739,941 | — | ||||||||||||||
Net operating loss | 168,796,699 | 157,923,906 | 186,158,367 | 168,796,699 | ||||||||||||
Total deferred tax assets | 191,748,368 | 178,829,847 | 211,725,860 | 191,748,368 | ||||||||||||
Less valuation allowances | (191,748,368 | ) | (178,829,847 | ) | (211,725,860 | ) | (191,748,368 | ) | ||||||||
Net deferred tax assets and liabilities | $ | — | $ | — | $ | — | $ | — | ||||||||
The Company has recorded a valuation allowance, as a result of uncertainties related to the realization of its net deferred tax asset, at December 31, 20052006 and 20042005 of approximately $191.7$211.7 million and $178.8$191.7 million, respectively. The increase of approximately $12.9$20.0 million during 20052006 relates primarily to $19.0$17.4 million net operating losses incurred in 2005 reduced by $8.5 million due to a reduction in the Company’s effective state tax rate resulting from a change in 2005 state legislation.2006. The deferred tax assets have been offset by a full valuation allowance because it is more likely than not that the tax benefits of the net operating loss carryforwards may not be realized. Included in the valuation allowance as of December 31, 2006 and 2005 and 2004 are $14.9$14.2 million and $14.9 million, respectively, of deferred tax assets resulting from the exercise of employee stock options, which upon subsequent realization of the tax benefits, will be allocated directly to paid-in capital.
At December 31, 2006, the Company has unused Federal and State net operating loss carryforwards of approximately $489.9 million, of which $81.6 million was generated from the operations of H Power during the period May 31, 1989, through the date of the H Power acquisition and $408.3 million was generated by the Company during the period October 1, 1999 through December 31, 2006. The net operating loss carryforwards if unused will expire at various dates from 2007 through 2026. In 2006, net operating loss carryforwards of $406,000 acquired as part of the H Power transaction expired.
Under Section 382 of the Internal Revenue Code, the use of loss carryforwards may be limited if a change in ownership of a company occurs. The H Power transaction constitutedCompany has determined that due to transactions involving the Company’s shares by significant shareholders, a change of ownership forhas occurred under the related H Power tax attributes underprovisions of IRC Section 382 and will382. As a result in limitation toof this change of ownership, the utilizationusage of H Power’sa portion, which may be substantial, of the above net operating loss carryforwards.
At December 31, 2005,amounts, has become limited. The Company is in the Company has unused Federal and Stateprocess of determining the impact of this limitation. Once determined, the deferred tax asset related to the net operating loss carryforwardsand an equivalent amount of approximately $444.9 million, of which $80.9 million was generated fromvaluation allowance in the operations of H Power during the period May 31, 1989, through the date of the H Power acquisition and $364.0 million was generated by the Company during the period October 1, 1999table above will be adjusted accordingly.
PLUG POWER INC. AND SUBSIDIARIES
(A DEVELOPMENT STAGE ENTERPRISE)
NOTES TO CONSOLIDATED FINANCIAL STATEMENTS—(Continued)
10. Stockholders’ Equity
From inception through December 31, 2005.2006, our stockholders in the aggregate have contributed $635.7 million in cash to the Company, including a net $214.4 million as a result of our June 29, 2006 transaction with Smart Hydrogen Inc. (the “Buyer”). The net operating loss carryforwards if unused will expire at various dates from 2005 through 2025. In 2005, net operating loss carryforwardsCompany sold 395,000 shares of $666,000 acquired as partClass B Capital Stock, a class of preferred stock of the H Power transaction expired.Company, which are convertible into 39,500,000 shares of common stock of the Company, and 11,240 shares of common stock of the Company to the Buyer. The purchase price of the shares sold to the Buyer, on an as-converted into common stock basis, was $5.50 per common share.
9. Stockholders’ EquityPreferred Stock
The Company has authorized 5.0 million shares of preferred stock, par value $.01 per share. The Company’s certificate of incorporation provides that shares of preferred stock may be issued from time to time in one or more series. The Company’s Board of Directors is authorized to fix the voting rights, if any, designations, powers, preferences, qualifications, limitations and restrictions thereof, applicable to the shares of each series. As of December 31, 2006, there were 395,000 shares of preferred stock issued and outstanding.
Common Stock
The Company has one class of common stock, par value $.01 per share. Each share of the Company’s common stock is entitled to one vote on all matters submitted to stockholders. As of December 31, 20052006 there were 85,835,24886,794,915 shares of common stock issued and outstanding.
PLUG POWER INC. AND SUBSIDIARIES
NOTES TO CONSOLIDATED FINANCIAL STATEMENTS—(Continued)
From inception through December 31, 2005, our stockholders in the aggregate have contributed $418.8 million in cash to the Company, including $70.6 million as a result of our August 2005 offering. Additionally, in the first quarter of 2003, we issued approximately 9.0 million shares of common stock in connection with a merger transaction with H Power Corp. which increased our consolidated cash, cash equivalents and marketable securities by approximately $29.5 million, after payment of certain integration costs and expenses associated with the consummation of the merger of approximately $7.1 million.
The following represents a summary of the issuances of shares of common stock since inception.
| No. of Common Shares | Cash Contribution | Noncash Contribution | Total Capital Contribution | No. of Common Shares | Cash Contribution | Noncash Contribution | Total Capital | |||||||||||||||||
1997 | ||||||||||||||||||||||||
DTE Energy Company | 4,750,000 | $ | 4,750,000 | $ | — | $ | 4,750,000 | 4,750,000 | $ | 4,750,000 | $ | — | $ | 4,750,000 | ||||||||||
Mechanical Technology Incorporated | 4,750,000 | — | 4,750,000 | (a) | 4,750,000 | 4,750,000 | — | 4,750,000 | (a) | 4,750,000 | ||||||||||||||
| 9,500,000 | 4,750,000 | 4,750,000 | 9,500,000 | 9,500,000 | 4,750,000 | 4,750,000 | 9,500,000 | |||||||||||||||||
1998 | ||||||||||||||||||||||||
DTE Energy Company | 4,950,000 | 7,750,000 | — | 7,750,000 | 4,950,000 | 7,750,000 | — | 7,750,000 | ||||||||||||||||
Mechanical Technology Incorporated | 2,700,000 | 3,000,000 | 550,000 | (a) | 3,550,000 | 2,700,000 | 3,000,000 | 550,000 | (a) | 3,550,000 | ||||||||||||||
Stock based compensation and other noncash transactions | — | — | 212,000 | (c) | 212,000 | — | — | 212,000 | (c) | 212,000 | ||||||||||||||
| 7,650,000 | 10,750,000 | 762,000 | 11,512,000 | 7,650,000 | 10,750,000 | 762,000 | 11,512,000 | |||||||||||||||||
1999 | ||||||||||||||||||||||||
Edison Development Corporation | 4,004,315 | 28,697,782 | — | 28,697,782 | 4,004,315 | 28,697,782 | — | 28,697,782 | ||||||||||||||||
Mechanical Technology Incorporated | 6,254,315 | 24,000,000 | 8,897,782 | (a) | 32,897,782 | 6,254,315 | 24,000,000 | 8,897,782 | (a) | 32,897,782 | ||||||||||||||
General Electric Company | 5,250,000 | 37,500,000 | 11,250,000 | (b) | 48,750,000 | 5,250,000 | 37,500,000 | 11,250,000 | (b) | 48,750,000 | ||||||||||||||
Other private investors | 3,549,850 | 25,045,000 | — | 25,045,000 | 3,549,850 | 25,045,000 | — | 25,045,000 | ||||||||||||||||
Initial public offering-net | 6,782,900 | 92,971,878 | — | 92,971,878 | 6,782,900 | 92,971,878 | — | 92,971,878 | ||||||||||||||||
Stock option exercises | 24,128 | 41,907 | — | 41,907 | 24,128 | 41,907 | — | 41,907 | ||||||||||||||||
Stock based compensation and other noncash transactions | — | — | 978,800 | (c) | 978,800 | — | — | 978,800 | (c) | 978,800 | ||||||||||||||
| 25,865,508 | 208,256,567 | 21,126,582 | 229,383,149 | 25,865,508 | 208,256,567 | 21,126,582 | 229,383,149 | |||||||||||||||||
2000 | ||||||||||||||||||||||||
Stock option exercises | 632,378 | 3,793,028 | — | 3,793,028 | ||||||||||||||||||||
Stock issued under employee stock purchase plan | 32,717 | 408,452 | — | 408,452 | ||||||||||||||||||||
Stock issued for development agreement | 104,869 | — | 5,000,000 | (d) | 5,000,000 | |||||||||||||||||||
Stock issued for equity in affiliate | 7,000 | — | 827,750 | (e) | 827,750 | |||||||||||||||||||
Stock based compensation and other noncash transactions | 3,041 | — | 8,936,779 | (c) | 8,936,779 | |||||||||||||||||||
| 780,005 | 4,201,480 | 14,764,529 | 18,966,009 | |||||||||||||||||||||
2001 | ||||||||||||||||||||||||
Edison Development Corporation | 416,666 | 4,800,000 | — | 4,800,000 | ||||||||||||||||||||
General Electric Company | 416,666 | 4,800,000 | — | 4,800,000 | ||||||||||||||||||||
Public offering-net | 4,575,000 | 51,588,551 | — | 51,588,551 | ||||||||||||||||||||
Stock option exercises | 760,531 | 2,051,954 | — | 2,051,954 | ||||||||||||||||||||
PLUG POWER INC. AND SUBSIDIARIES
(A DEVELOPMENT STAGE ENTERPRISE)
NOTES TO CONSOLIDATED FINANCIAL STATEMENTS—(Continued)
| No. of Common Shares | Cash Contribution | Noncash Contribution | Total Capital Contribution | No. of Common Shares | Cash Contribution | Noncash Contribution | Total Capital Contribution | ||||||||||||||
2000 | |||||||||||||||||||||
Stock option exercises | 632,378 | 3,793,028 | — | 3,793,028 | |||||||||||||||||
Stock issued under employee stock purchase plan | 32,717 | 408,452 | — | 408,452 | |||||||||||||||||
Stock issued for development agreement | 104,869 | — | 5,000,000 | (d) | 5,000,000 | ||||||||||||||||
Stock issued for equity in affiliate | 7,000 | — | 827,750 | (e) | 827,750 | ||||||||||||||||
Stock based compensation and other noncash transactions | 3,041 | — | 8,936,779 | (c) | 8,936,779 | ||||||||||||||||
| 780,005 | 4,201,480 | 14,764,529 | 18,966,009 | ||||||||||||||||||
2001 | |||||||||||||||||||||
Edison Development Corporation | 416,666 | 4,800,000 | — | 4,800,000 | |||||||||||||||||
General Electric Company | 416,666 | 4,800,000 | — | 4,800,000 | |||||||||||||||||
Public offering-net | 4,575,000 | 51,588,551 | — | 51,588,551 | |||||||||||||||||
Stock option exercises | 760,531 | 2,051,954 | — | 2,051,954 | |||||||||||||||||
Stock issued under employee stock purchase plan | 73,132 | 730,592 | — | 730,592 | 73,132 | 730,592 | — | 730,592 | |||||||||||||
Stock issued for development agreement | 96,336 | — | 3,000,000 | (d) | 3,000,000 | 96,336 | — | 3,000,000 | (d) | 3,000,000 | |||||||||||
Stock option issued to affiliate | — | — | 5,000,000 | (f) | 5,000,000 | — | — | 5,000,000 | (f) | 5,000,000 | |||||||||||
Stock based compensation and other noncash transactions | 189,084 | — | 2,013,177 | (c) | 2,013,177 | 189,084 | — | 2,013,177 | (c) | 2,013,177 | |||||||||||
| 6,527,415 | 63,971,097 | 10,013,177 | 73,984,274 | 6,527,415 | 63,971,097 | 10,013,177 | 73,984,274 | ||||||||||||||
2002 | |||||||||||||||||||||
Stock option exercises | 138,567 | 708,931 | — | 708,931 | 138,567 | 708,931 | — | 708,931 | |||||||||||||
Stock issued under employee stock purchase plan | 78,208 | 395,679 | — | 395,679 | 78,208 | 395,679 | — | 395,679 | |||||||||||||
Stock issued for development agreement | 243,383 | — | 2,000,000 | (d) | 2,000,000 | 243,383 | — | 2,000,000 | (d) | 2,000,000 | |||||||||||
Stock based compensation and other noncash transactions | 213,987 | — | 1,807,593 | (c) | 1,807,593 | 213,987 | — | 1,807,593 | (c) | 1,807,593 | |||||||||||
| 674,145 | 1,104,610 | 3,807,593 | 4,912,203 | 674,145 | 1,104,610 | 3,807,593 | 4,912,203 | ||||||||||||||
2003 | |||||||||||||||||||||
Public offering, net | 11,700,000 | 54,967,204 | — | 54,967,204 | 11,700,000 | 54,967,204 | — | 54,967,204 | |||||||||||||
Stock option exercises | 35,033 | 84,973 | — | 84,973 | 35,033 | 84,973 | — | 84,973 | |||||||||||||
Stock issued under employee stock purchase plan | 90,380 | 348,605 | — | 348,605 | 90,380 | 348,605 | — | 348,605 | |||||||||||||
Stock issued in acquisition of H Power | 9,063,080 | — | 46,260,576 | (g) | 46,260,576 | 9,063,080 | — | 46,260,576 | (g) | 46,260,576 | |||||||||||
Stock based compensation | 965,143 | — | 2,966,797 | (c) | 2,966,797 | 965,143 | — | 2,966,797 | (c) | 2,966,797 | |||||||||||
| 21,853,636 | 55,400,782 | 49,227,373 | 104,628,155 | 21,853,636 | 55,400,782 | 49,227,373 | 104,628,155 | ||||||||||||||
2004 | |||||||||||||||||||||
Stock option exercises | 95,960 | 501,308 | — | 501,308 | 95,960 | 501,308 | — | 501,308 | |||||||||||||
Stock issued under employee stock purchase plan | 71,709 | 409,413 | — | 409,413 | 71,709 | 409,413 | — | 409,413 | |||||||||||||
Stock based compensation | 332,500 | — | 4,137,202 | (c) | 4,137,202 | 332,500 | — | 4,137,202 | (c) | 4,137,202 | |||||||||||
| 500,169 | 910,721 | 4,137,202 | 5,047,923 | 500,169 | 910,721 | 4,137,202 | 5,047,923 | ||||||||||||||
2005 | |||||||||||||||||||||
Public offering, net | 12,000,000 | 70,580,736 | — | 70,580,736 | 12,000,000 | 70,580,736 | — | 70,580,736 | |||||||||||||
Stock option exercises | 82,082 | 516,686 | — | 516,686 | 82,082 | 516,686 | — | 516,686 | |||||||||||||
Stock issued under employee stock purchase plan | 78,702 | 374,149 | 374,149 | 78,702 | 374,149 | 374,149 | |||||||||||||||
Stock based compensation | 323,586 | — | 2,888,685 | (c) | 2,888,685 | 323,586 | — | 2,888,685 | (c) | 2,888,685 | |||||||||||
Total as of December 31, 2005 | 85,835,248 | $ | 420,816,828 | $ | 111,477,141 | $ | 532,293,969 | ||||||||||||||
| 12,484,370 | 71,471,571 | 2,888,685 | 74,360,256 | ||||||||||||||||||
PLUG POWER INC. AND SUBSIDIARIES
(A DEVELOPMENT STAGE ENTERPRISE)
NOTES TO CONSOLIDATED FINANCIAL STATEMENTS—(Continued)
| No. of Preferred Shares | No. of Common Shares | Cash Contribution | Noncash Contribution | Total Capital | |||||||||||
2006 | |||||||||||||||
Stock offering, net | 395,000 | 11,240 | 214,442,129 | (h) | — | 214,442,129 | |||||||||
Stock option exercises | — | 7,958 | 31,351 | — | 31,351 | ||||||||||
Stock issued under employee stock purchase plan | — | 100,669 | 364,668 | 364,668 | |||||||||||
Stock based compensation | — | 839,800 | — | 4,858,100 | (c) | 4,858,100 | |||||||||
| 395,000 | 959,667 | 214,838,148 | 4,858,100 | 219,696,248 | |||||||||||
Total as of December 31, 2006 | 395,000 | 86,794,915 | $ | 635,654,976 | $ | 116,335,241 | $ | 751,990,217 | |||||||
| a. | Since inception, Mechanical Technology Incorporated has contributed in-process research and development of $4,042,640; certain net assets at inception of $707,360; $2,000,000 of deferred rent related to a below market lease for office and manufacturing facilities; $500,000 of in-kind services; land and buildings valued at approximately $4,697,782; and research contracts valued at approximately $2,250,000. |
PLUG POWER INC. AND SUBSIDIARIES
NOTES TO CONSOLIDATED FINANCIAL STATEMENTS—(Continued)
| b. | In February 1999, the Company issued 2,250,000 shares of common stock to GE MicroGen, Inc. in exchange for a 25% interest in GE Fuel Cell Systems, LLC. The fair value of the shares issued of $11,250,000 was recorded under the balance sheet caption “Investment in affiliates”. See |
| c. | These issuances primarily represent stock based compensation issued to employees, consultants and others for services performed. These amounts are recorded at the fair value of the issuance on the date the compensation is awarded. |
| d. | Represents the fair value of shares issued to Engelhard Corporation for the development and supply of advanced catalysts as part of a development agreement discussed in |
| e. | Represents the fair value of shares issued along with cash for a 28% ownership interest in Advanced Energy Incorporated. |
| f. | Represents the fair value of an option to purchase 725,000 shares of the Company’s common stock issued to GE Power Systems Equities, Inc. as part of the amendment to the GE Fuel Cell Systems LLC distribution agreement. See |
| g. | Represents the fair value of shares issued related to the acquisition of H Power. |
| h. | On June 29, 2006, Smart Hydrogen, Inc. purchased 395,000 shares of Class B Capital Stock, a class of preferred stock, along with the 11,240 shares of common stock, for net proceeds of $214,438,179. |
Preferred Stock
The Company has authorized 5.0 million shares of preferred stock, par value $.01 per share. Our certificate of incorporation provides that shares of preferred stock may be issued from time to time in one or more series. Our Board of Directors is authorized to fix the voting rights, if any, designations, powers, preferences, qualifications, limitations and restrictions thereof, applicable to the shares of each series. As of December 31, 2005, there was no preferred stock outstanding.
10.11. Employee Benefit Plans
1999 Employee Stock Purchase Plan
In 1999, the Company adopted the 1999 Employee Stock Purchase Plan (the “Plan”) under which employees will beare eligible to purchase shares of the Company’s common stock at a discount through periodic payroll deductions. The Plan is intended to meet the requirements of Section 423 of the Internal Revenue Code. Purchases occur at the end of six month offering periods at a purchase price equal to 85% of the market value of the Company’s common stock at either the beginning of the offering period or the end of the offering period, whichever is lower. Participants may elect to have from 1%up to 10% of their pay withheld for purchase of common stock at the end of the offering period, up to a maximum of $12,500 within any offering period. The Company has reserved 1,000,000 shares of common stock for issuance under the Plan. The Company issued 100,669, 78,702 71,709 and 90,38071,709 shares of stock under the Plan during 2006, 2005, and 2004, respectively.
PLUG POWER INC. AND SUBSIDIARIES
(A DEVELOPMENT STAGE ENTERPRISE)
NOTES TO CONSOLIDATED FINANCIAL STATEMENTS—(Continued)
Under SFAS No. 123(R), the 15% discount and 2003, respectively.the look-back feature are considered compensatory items for which expense must be recognized. The Company values Plan shares as a combination position consisting of 15% of a share of nonvested stock and 85% of a six-month stock option. The value of the nonvested stock is estimated based on the fair market value of the Company’s common stock at the beginning of the offering period, and an expected life of six months. The resulting per-share value is multiplied by the shares estimated to be purchased during the offering period based on historical experience to arrive at a total estimated compensation cost for the offering period. The estimated compensation cost is recognized on a straight-line basis over the offering period.
Stock Option Plans (the “Option Plans”)
1997 Stock Option Plan
Effective July 1, 1997, the Company established a stock option plan to provide employees, consultants, and members of the Board of Directors the ability to acquire an ownership interest in the Company (“1997 Stock Option Plan”). Options for employees issued under this plan generally vested 20% per year and expire ten years after issuance. Options granted to members of the Board generally vested 50% upon grant and 25% per year thereafter. Options granted to consultants generally vested one-third on the expiration of the consultant’s initial contract term, with an additional one-third vesting on each anniversaryof the next two anniversaries thereafter. At December 31, 2005,2006, there were a total of 865,764841,801 options granted, outstanding and vested under this plan. Although no further options will be granted under this plan, the options previously granted will continue to vest in accordance with this plan and vested options will be exercisable for shares of common stock.
PLUG POWER INC. AND SUBSIDIARIES1999 Stock Option and Incentive Plan
NOTES TO CONSOLIDATED FINANCIAL STATEMENTS—(Continued)
Effective August 16, 1999, the Company established a stock option plan to encourage and enable the officers, employees, independent directors and other key persons (including consultants) of the Company and its subsidiaries upon whose judgment, initiative and efforts the Company largely depends for the successful conduct of its business to acquire a proprietary interest in the Company (“1999 Stock Option Plan”).
At December 31, 20052006 there were 4,638,965approximately 5.7 million options granted and outstanding, and an additional 2,872,7802,964,082 options available to be issued under the 1999 Stock Option and Incentive Plan (“1999 Stock Option Plan”).Plan. The number of shares of common stock available for issuance under the Plan will increase by the amount of any forfeitures under the 1999 Stock Option Plan and under the 1997 Stock Option Plan. The number of shares of common stock under the 1999 Stock Option Plan will further increase January 1 and July 1 of each year by an amount equal to 16.4%16.45% of any net increase in the total number of common shares of stock outstanding. The 1999 Stock Option Plan permits the Company to: grant incentive stock options; grant non-qualified stock options; grant stock appreciation rights; issue or sell common stock with vesting or other restrictions, or without restrictions; grant rights to receive common stock in the future with or without vesting; grant common stock upon the attainment of specified performance goals; and grant dividend rights in respect of common stock. Options for employees issued under this plan generally vest annuallyin equal annual installments over periods of three or four years and expire ten years after issuance. Options granted to members of the Board generally vest one year after issuance. Options granted to consultants generally vested one-third on the expiration of the consultant’s initial contract term, with an additional one-third vesting on each anniversaryof the next two anniversaries thereafter. To date, options granted under the 1999 Stock Option Plan have vesting provisions ranging from immediate vesting to five years in duration and expire ten years after issuance. These grants may be made
Prior to officers, employees, non-employee directors, consultants, advisorsJanuary 1, 2006, the Company had elected to follow APB Opinion No. 25, “Accounting for Stock Issued to Employees” and other key personsrelated interpretations including FASB Interpretation No. 44, “Accounting for Certain
PLUG POWER INC. AND SUBSIDIARIES
(A DEVELOPMENT STAGE ENTERPRISE)
NOTES TO CONSOLIDATED FINANCIAL STATEMENTS—(Continued)
Transactions involving Stock Compensation an interpretation of APB Opinion No. 25”, in accounting for employee stock-based compensation and to provide the disclosures required under FAS 123. APB Opinion No. 25 required no recognition of compensation expense for most of the stock-based compensation arrangements provided by the Company, namely, broad-based employee option grants where the exercise price is equal to or not less than 85 percent of the market value at the date of grant. However, APB Opinion No. 25 required recognition of compensation expense for variable award plans and options issued to non-employees over the vesting periods of such plans, based upon the then-current market values of the underlying stock.
As discussed in Note 2, “Summary of Significant Accounting Policies”, effective January 1, 2006, the Company adopted the fair value recognition provisions for stock-based awards granted to employees using the modified prospective application method provided by FAS 123R. Stock-based compensation cost is measured at grant date, based on the fair value of the award, and is recognized as expense over the employee requisite service period. For the year ended December 31, 2006, the Company recorded expense of approximately $4.3 million in connection with its share-based payment awards. Prior period financial information has not been restated.
Compensation cost associated with employee stock options represented approximately $2.2 million of the total share-based payment expense recorded for the year ended December 31, 2006. The Company estimates the fair value of stock options and shares issued under the employee stock purchase plan using a Black-Scholes valuation model consistent with the provisions of FAS 123R and SAB 107, and the resulting fair value is recorded as compensation cost on a straight-line basis over the option vesting period. Key inputs and assumptions used to estimate the fair value of stock options include the grant price of the award, the expected option term, volatility of the Company’s stock, an appropriate risk-free rate, and the Company’s dividend yield. Estimates of fair value are not intended to predict actual future events or the value ultimately realized by employees who receive equity awards, and subsequent events are not indicative of the reasonableness of the original estimates of fair value made by the Company. The assumptions made for purposes of estimating fair value under the Black-Scholes model for the 1,168,450 and 1,101,600 options granted during the years ended December 31, 2006 and 2005, respectively were as follows:
| 2006 | 2005 | 2004 | ||||
Dividend yield: | 0% | 0% | 0% | |||
Expected term of options (years): | 6 | 5 | 5 | |||
Risk free interest rate: | 4.37% -5.045% | 3.71%-4.45% | 3.07%-3.93% | |||
Volatility: | 60%-65% | 56% | 56% |
The Company’s estimate of an expected option term was calculated in accordance with the SAB 107 simplified method for calculating the expected term assumption. The estimated stock price volatility was derived based upon a blend of implied volatility and the Company’s actual historic stock prices over the past six years, which represents the Company’s best estimate of expected volatility.
PLUG POWER INC. AND SUBSIDIARIES
(A DEVELOPMENT STAGE ENTERPRISE)
NOTES TO CONSOLIDATED FINANCIAL STATEMENTS—(Continued)
A summary of stock option activity for the year December 31, 2006 is as follows:
| Shares | Weighted Average Exercise Price | Weighted- Average Remaining Contractual Term (years) | Aggregate Intrinsic Value | ||||||||
Options outstanding at December 31, 2005 | 5,544,110 | $ | 10.24 | 5.80 | |||||||
Granted | 1,168,450 | 5.05 | |||||||||
Exercised | (7,958 | ) | 3.94 | ||||||||
Forfeited or expired | (193,039 | ) | 7.32 | ||||||||
Options outstanding at December 31, 2006 | 6,511,563 | $ | 9.40 | 5.8 | $ | 1,377,952 | |||||
Options exercisable at December 31, 2006 | 4,864,713 | $ | 10.78 | 4.81 | $ | 1,334,952 | |||||
Options fully vested at December 31, 2006 and those expected to vest beyond December 31, 2006 | 6,412,752 | $ | 9.45 | 5.78 | $ | 1,335,676 | |||||
The weighted average grant date fair value of options granted during the years ended December 31, 2006, 2005 and 2004 was $3.00, $2.74 and $3.53, respectively. The total intrinsic value of options exercised and cash received by the Company from option exercises during the year ended December 31, 2006 was approximately $13,200 and $33,500, respectively. As of December 31, 2006, there was approximately $3.2 million of unrecognized compensation cost related to stock option awards that is expected to be recognized as expense over a weighted average period of 2.1 years. The total fair value of stock options that vested during years ended December 31, 2006 and 2005 was approximately $2.2 million and $2.2 million, respectively.
The following table summarizes information about the stock options outstanding and exercisable under the Option Plans at December 31, 2005:2006:
| Options Outstanding | Options Exercisable | |||||||||||
Exercise Price range | Shares | Average Remaining Life | Weighted Average Exercise Price | Shares | Weighted Average Exercise Price | |||||||
$ 0.00 – 1.00 | 461,787 | 1.5 | $ | 1.00 | 461,787 | $ | 1.00 | |||||
1.01 – 5.00 | 165,072 | 3.8 | 4.79 | 155,822 | 4.79 | |||||||
5.01 – 10.00 | 3,343,695 | 7.2 | 6.77 | 2,206,144 | 6.77 | |||||||
10.01 – 15.00 | 1,136,510 | 4.2 | 11.83 | 1,134,885 | 11.83 | |||||||
15.01 – 20.00 | 102,625 | 4.4 | 18.18 | 102,625 | 18.18 | |||||||
20.01 – 25.00 | 86,000 | 4.7 | 24.48 | 86,000 | 24.48 | |||||||
25.01 – 50.00 | 91,000 | 3.8 | 44.02 | 91,000 | 44.02 | |||||||
50.01 – 75.00 | 21,200 | 3.6 | 66.39 | 21,200 | 66.39 | |||||||
75.01 – 100.00 | 79,240 | 3.6 | 94.29 | 79,240 | 94.29 | |||||||
100.01 – 140.00 | 17,600 | 3.3 | 106.75 | 17,600 | 106.75 | |||||||
| 5,504,729 | 5.8 | 10.20 | 4,356,303 | 11.36 | ||||||||
| Options Outstanding | Options Exercisable | |||||||||||
Exercise Price range | Shares | Average Remaining Life | Weighted Average Exercise Price | Shares | Weighted Average Exercise Price | |||||||
$ 0.00 – 14.00 | 5,902,118 | 6.1 | $ | 6.61 | 4,255,268 | $ | 7.11 | |||||
14.01 – 28.00 | 392,705 | 3.4 | 17.90 | 392,705 | 17.90 | |||||||
28.01 – 42.00 | — | — | — | — | — | |||||||
42.01 – 56.00 | 99,000 | 3.4 | 44.41 | 99,000 | 44.41 | |||||||
56.01 – 70.00 | 21,200 | 3.4 | 66.39 | 21,200 | 66.39 | |||||||
70.01 – 84.00 | 11,700 | 3.1 | 83.50 | 11,700 | 83.50 | |||||||
84.01 – 98.00 | 67,240 | 3.5 | 96.22 | 67,240 | 96.22 | |||||||
98.01 – 112.00 | 17,600 | 3.2 | 106.75 | 17,600 | 106.75 | |||||||
| 6,511,563 | 5.8 | 9.40 | 4,864,713 | 10.78 | ||||||||
PLUG POWER INC. AND SUBSIDIARIES
(A DEVELOPMENT STAGE ENTERPRISE)
NOTES TO CONSOLIDATED FINANCIAL STATEMENTS—(Continued)
The following table summarizesA summary of restricted stock activity underfor the Option Plans:year ended December 31, 2006 is as follows:
Option Activity | Number of Shares Subject to Option | Weighted Average Exercise Price per Share | ||||
January 1, 2003 | 5,797,164 | 21.83 | ||||
Granted at fair value | 1,245,245 | 6.12 | ||||
Options exchanged for restricted stock | (1,810,048 | ) | 39.48 | |||
Forfeited or terminated | (366,161 | ) | 23.92 | |||
Exercised | (35,033 | ) | 2.41 | |||
December 31, 2003 | 4,831,167 | 12.46 | ||||
Granted at fair value | 337,500 | 8.03 | ||||
Forfeited or terminated | (360,643 | ) | 23.22 | |||
Exercised | (95,960 | ) | 5.22 | |||
December 31, 2004 | 4,712,064 | 11.17 | ||||
Granted at fair value | 1,155,041 | 5.64 | ||||
Forfeited or terminated | (292,021 | ) | 9.17 | |||
Exercised | (70,355 | ) | 6.55 | |||
December 31, 2005 | 5,504,729 | $ | 10.20 | |||
| Shares | Aggregate Intrinsic Value | ||||||
Granted | 458,473 | $ | 2,307,816 | ||||
Forfeited | (6,850 | ) | (38,223 | ) | |||
Vested | (21,000 | ) | (117,180 | ) | |||
Unvested restricted stock outstanding at December 31, 2006 | 430,623 | $ | 2,152,413 | ||||
At December 31, 2005, 2,474,385 sharesThe restricted stock awards generally vest in equal installments over a period of commonthree years. The restricted stock awards were reserved for issuance under future stock option exercises.
The per share weighted average fair valuevalued based on the closing price of the options granted during 2005, 2004 and 2003 was $2.78, $8.16 and $5.85, respectively, using the Black-Scholes pricing model with the assumptions outlined below.
The dividend yield was assumed to be zero for all periods. The risk free interest rate ranged from 3.7% to 4.5% in 2005, 2.8% to 3.9% in 2004 and 2.3% to 3.4% in 2003. An expected life of 5 years was assumed for each year. Expected volatility of 56% in 2005, 57% in 2004 and 69% in 2003 was used in determining fair value under the Black-Scholes pricing model.
On June 20, 2003, the Company issued 607,804 shares of restricted common stock and cancelled 1,810,048 options to purchase common stock in connection with the Company’s offer to eligible employees to exchange options to purchase shares of common stock with an exercise price of $8.53 or greater per share for shares of restricted common stock on a three for one basis. The sharesthe date of restricted common stock received in this exchange became fully vested on September 20, 2005. During the years ended December 31, 2005, 2004grant, and 2003, the Companycompensation cost is recorded employee compensation expense of $680,000, $1.8 million, and $937,000, respectively, relating to the issuance of the restricted stock awards. These amounts represent recognition of compensation expense on a straight-line basis over the share vesting periodsperiod. The Company recorded expense of approximately $500,000 associated with its restricted stock awards in the twelve months ended December 31, 2006. As of December 31, 2006, there was approximately $1.6 million of unrecognized compensation cost related to restricted stock awards that will be recognized as expense over a remaining weighted average period of 2.6 years.
The following table illustrates the effect on net loss and loss per share as if the Company had applied the fair value recognition provisions of SFAS No. 123, “Accounting for Stock Based Compensation,” to its stock-based employee compensation for the each of the restricted stock.years ended:
| Year Ended December 31, | ||||||||
| 2005 | 2004 | |||||||
Net loss, as reported | $ | (51,743,462 | ) | $ | (46,738,827 | ) | ||
Add: Stock-based employee compensation expense included in reported net loss | 3,100,267 | 3,989,533 | ||||||
Deduct: Total stock-based employee compensation expense determined under fair value-based method for all awards | (7,292,499 | ) | (11,450,940 | ) | ||||
Proforma net loss | $ | (55,935,694 | ) | $ | (54,200,234 | ) | ||
Loss per share: | ||||||||
Basic and diluted—as reported | $ | (0.66 | ) | $ | (0.64 | ) | ||
Basic and diluted—pro forma | $ | (0.71 | ) | $ | (0.74 | ) | ||
401(k) Savings & Retirement Plan
The Company offers a 401(k) Savings & Retirement Plan to eligible employees meeting certain age and service requirements. This plan permits participants to contribute up to 15%25% of their salary, up to the maximum allowable by the Internal Revenue Service regulations. Participants are immediately vested in their voluntary contributions plus actual earnings or less actual losses thereon. Participants are vested in the Company’s matching contribution based on the years of service completed. Participants are fully vested upon completion of three years of service. During
PLUG POWER INC. AND SUBSIDIARIES
NOTES TO CONSOLIDATED FINANCIAL STATEMENTS—(Continued)
2002, the Company began funding its matching contribution in common stock. Accordingly, the Company has issued 199,124, 147,294 139,190 and 158,522139,190 shares of common stock to the Plug Power Inc. 401(k) Savings & Retirement Plan during 2006, 2005 2004 and 2003,2004, respectively.
The Company’s expense for this plan, including the issuance of shares, was approximately $915,000, $908,000 $950,000 and $867,000$950,000 for years ended December 31, 2006, 2005 and 2004, and 2003, respectively.
PLUG POWER INC. AND SUBSIDIARIES
11.(A DEVELOPMENT STAGE ENTERPRISE)
NOTES TO CONSOLIDATED FINANCIAL STATEMENTS—(Continued)
12. Other Related Party Transactions
The Company has an exclusive distribution agreement with DTE Energy Technologies, Inc. (an affiliate of EDCEdison Development Company and DTE Energy Corporation) for the states of Michigan, Ohio, Illinois, and Indiana. Under the agreement the Company can sell directly or negotiate nonexclusive distribution rights to third parties for the GenCore® backup power product line, and the GenSite™GenSite™ hydrogen generation product line. Starting in the fourth quarter of 2004 for GenCore® and in the fourth quarter of 2004 for GenSite™GenSite™, the Company has agreed to pay a 5% commission to DTE Energy Technologies, Inc., based on sales price of units shipped to the above noted states. The distribution agreement expires on December 31, 2014.
As of December 31, 2005, the Company had no outstanding receivable from DTE Energy Technologies. In December 31, 2004 the receivable from DTE Energy Technologies was $51,000.
12.13. Fair Value of Financial Instruments
The following disclosure of the estimated fair value of financial instruments is made in accordance with the provision of SFAS No. 107, “Disclosures About Fair Value of Financial Instruments”. Although the estimated fair value amounts have been determined by the Company using available market information and appropriate valuation methodologies, the estimates presented are not necessarily indicative of the amounts that the Company could realize in current market exchanges.
The following methods and assumptions were used by the Company in estimating its fair value disclosures for financial instruments:
Cash and cash equivalents, restricted cash, accounts receivables, accounts payables,accrued interest receivable and accrued expenses:payable, and notes receivable: The carrying amounts reported in the consolidated balance sheets approximate fair value because of the short maturities of these instruments.
MarketableAvailable-for-sale securities: MarketableAvailable-for-sale securities includes investments in equitydebt and debtmortgage-backed securities which are carried at estimated fair value. At December 31, 2006 and 2005, the companyCompany recorded an accumulated comprehensive loss of $257,000.$70,000 and $257,000, respectively.
Long-term debt: The fair value of the Company’s long-term debt in the consolidated balance sheets approximates the carrying value at December 31, 2005 and 2004.2005. The debt accruesaccrued interest at a variable rate of interest which was approximately 4.44% and 2.37% at December 31, 2005 and 2004, respectively.2005.
13.14. Supplemental Disclosures of Cash Flows Information
The following represents required supplemental disclosures of cash flows information and noncash financing and investing activities which occurred during the years ended December 31, 2006, 2005 2003 and 2002:2004:
| 2005 | 2004 | 2003 | |||||||
Cash paid for interest | $ | 133,805 | $ | 63,384 | $ | 62,805 | |||
Equipment financed under capital lease obligations | 189,075 | 129,900 | — | ||||||
Net assets acquired, excluding cash, cash equivalents and marketable securities | — | — | 6,106,293 | ||||||
Cash paid for interest Equipment financed under capital lease obligations Stock-based compensation accrual impact Change in unrealized gain/loss on available-for-sale securities Due to broker for security purchase 2006 2005 2004 $ 160,124 $ 133,805 $ 63,384 — 189,075 129,900 591,970 (211,582 ) 147,669 186,640 225,271 (482,391 ) 5,000,000 — —
PLUG POWER INC. AND SUBSIDIARIES
NOTES TO CONSOLIDATED FINANCIAL STATEMENTS—(Continued)
14.15. Commitments and Contingencies
Alliances and development agreements:
Pemeas:Pemeas In April 2000, the Company entered into a: Our joint development agreement with Pemeas to develop, on an exclusive basis for certain applications, a high temperature membrane electrode unit (MEU) for stationary fuel cell systems with net electrical output of 750 watts upexpired on June 30, 2006. We continue to 25 kilowatts. Additionally, the Company will work with Pemeas on a non-exclusivenonexclusive basis under a project funded by the
PLUG POWER INC. AND SUBSIDIARIES
(A DEVELOPMENT STAGE ENTERPRISE)
NOTES TO CONSOLIDATED FINANCIAL STATEMENTS—(Continued)
European Commission. During 2006, Pemeas was acquired by BASF. This acquisition is not expected to develop a high-temperature membrane electrode unit for stationary fuel cell systems with net electrical output of less than 750 watts and greater than 25 kilowatts. Undermaterially modify the agreement the Company and Pemeas will each fund their own development efforts.has with them.
Engelhard: In September 2000, the Company finalized a joint development agreement and a supplyWe have an agreement with Engelhard Corporation for the development and supply of advanced catalysts to increase the overall performance and efficiency of the Company’sour fuel processor. OverThe supply agreement with Engelhard specifies the course ofrights and obligations for Engelhard to supply products to us until 2013. During 2006, Engelhard was acquired by BASF. This acquisition is not expected to materially modify the joint development agreement the Company has contributed $10.0 million to fund Engelhard’s development efforts, and Engelhard in turn has acquired $10.0 million of the Company’s common stock. At December 31, 2004, the $10.0 million has been fully expensed.with them.
Home Energy Station: We have been developing technology in support of the automotive fuel cell market under a series of agreements with Honda R&D Co Ltd. of Japan (Honda), a subsidiary of Honda Motor Co., Ltd., under which we have exclusively and jointly developed and tested three phases of prototype fuel cell systems that provide electricity and heat to a home or business, while also providing hydrogen fuel for a fuel cell vehicle (the “Home Energy Station”). In OctoberSince 2003, we have successfully demonstrated three successive prototype generations of the first prototype Home Energy Station at Honda R&D Americas’ facility in Torrance, California. In September 2004, underCalifornia and at Plug Power’s facility in Latham, NY. The companies are currently collaborating on the second phase of our work with Honda, we successfully demonstrated a second-generationfourth generation prototype of the Home Energy Station at our Latham NY headquarters. In September 2005, Plug Power and Honda installed our third-generation Home Energy Stationpursuant to the latest agreement signed in Torrance, California. Honda now utilizes the systems in both New York and California for refueling prototype Honda FCX fuel cell vehicles in their test programs.early 2006. Across each generation of the HES, we have significantly reduced size and weight, as well as improved performance. During
General Electric Company (GE) Entities: On March 24, 2006, we signedthe Company, GE MicroGen, Inc., and GE restructured their service and equity relationships by terminating the joint venture and the associated distributor and other agreements, and entering into a contract with Honda funding our jointnew development collaboration agreement. Under the new agreement, the Company and GE (through its Global Research unit) have agreed to collaborate on programs including but not limited to development of tools, materials and components that can be applied to various types of fuel cell products. The specific programs to be undertaken under the fourth generation system, as well asagreement, and the detailed terms and conditions thereof, remain subject to agreement by both parties. It is anticipated that such programs could also include continued collaboration on sales and marketing opportunities for the Company’s products between the Company and GE. Under the terms of the new development collaboration agreement, the Company is obligated to purchase $1 million of services from GE in connection with this collaboration prior to December 31, 2008. The development collaboration agreement is scheduled to terminate on the earlier of (i) December 31, 2014 or (ii) upon the completion of a separate agreement funding joint research & developmentcertain level of technology that may be utilized in future systems.program activity.
Leases:
In 2005 and 2004, the Company leased certain equipment under capital lease transactions with an original cost of $189,075 which had a net book value atand $129,900, respectively. As of December 31, 2005 of $141,806. Inand 2004 the Company leased certain equipmentthere were no lease payments due under these capital lease transactions with an original cost of $129,900, which was completed in November 30, 2005.transactions. The Company also has several noncancelable operating leases, primarily for warehouse facilities and office space that expire over the next five years. Rental expense for operating leases (except those with lease terms of a month or less that were not renewed) during 2006, 2005, and 2004 was $350,000, $369,000 and 2003 was $369,000, $283,000, and $188,000, respectively.
PLUG POWER INC. AND SUBSIDIARIES
(A DEVELOPMENT STAGE ENTERPRISE)
NOTES TO CONSOLIDATED FINANCIAL STATEMENTS—(Continued)
Future minimum lease payments under noncancelable operating leases (with initial or remaining lease terms in excess of one year) and future minimum capital lease payments as of December 31, 20052006 are:
Year ending December 31 | Operating leases | ||
2006 | 679,000 | ||
2007 | 462,000 | ||
2008 | 447,000 | ||
2009 | 447,000 | ||
2010 | 422,000 | ||
Thereafter | — | ||
Total minimum lease payments | $ | 2,457,000 | |
At December 31, 2005 the future minimum lease payments due on capital lease obligations were $141,806 in 2006.
Year ending December 31 | Operating leases | ||
2007 | $ | 201,000 | |
2008 | 186,000 | ||
2009 | 182,000 | ||
2010 | 156,000 | ||
2011 | 154,000 | ||
Thereafter | — | ||
Total minimum lease payments | $ | 879,000 | |
Concentrations of credit risk:
Concentrations of credit risk with respect to receivables exist due to the limited number of select customers that the Company has initial commercial sales arrangements. To mitigate credit risk, the Company applies standard credit approvals and performs appropriate evaluation of a prospective customer’s financial condition. At December 31, 2006, five customers comprise approximately 78.6% of the total accounts receivable balance, with each customer individually representing 42.2%, 15.4%, 8.5%, 6.3% and 6.2% of total accounts receivable, respectively.
At December 31, 2005, five customers comprisecomprised approximately 71.3% of the total accounts receivable balance, with each customer individually representing 26.7%, 17.0%, 16.5%, 6.8% and 4.3% of total accounts receivable, respectively. For the year ended December 31, 2005, product and service revenue recognized on sales arrangements with two customers represented approximately 61.5% of total product and service revenue, with each customer individually representing 37.7% and 24.0% of recognized product and service revenue, respectively.
The Company has cash deposits in excess of federally insured limits. The amount of such deposits is approximately $15.9 millionessentially all cash at December 31, 2005.2006.
Employment Agreements
The Company is party to employment agreements with certain executives which provide for compensation and certain other benefits. The agreements also provide for severance payments under certain circumstances.
PLUG POWER INC. AND SUBSIDIARIES
(A DEVELOPMENT STAGE ENTERPRISE)
NOTES TO CONSOLIDATED FINANCIAL STATEMENTS—(Continued)
16. Subsequent Event
On March 15, 2007, the Company and Cellex Power Products Inc. (Cellex) entered into a Stock Purchase Agreement pursuant to which the Company is purchasing all of the outstanding shares and options of Cellex. The purchase price is $45 million cash upon close and the transaction is expected to close April 2007, subject to customary closing conditions. Cellex, based in Richmond, British Columbia, develops and commercializes fuel cell solutions that replace the industrial lead acid battery system used today in powering large electric lift truck fleets in large-scale distribution centers.
17. Unaudited Quarterly Financial Data (in thousands, except per share data)
| Quarters Ended | Quarters Ended | |||||||||||||||||||||||||||||||
| March 31, 2005 | June 30, 2005 | September 30, 2005 | December 31, 2005 | March 31, 2006 | June 30, 2006 | September 30, 2006 | December 31, 2006 | |||||||||||||||||||||||||
Product and service revenue | $ | 1,056 | $ | 1,474 | $ | 1,309 | $ | 1,041 | $ | 857 | $ | 743 | $ | 676 | $ | 381 | ||||||||||||||||
Contract revenue | 2,164 | 2,183 | 2,571 | 1,688 | 1,419 | 2,021 | 1,079 | 660 | ||||||||||||||||||||||||
Net loss | (12,535 | ) | (10,887 | ) | (11,868 | ) | (16,453 | )(a) | (12,126 | ) | (13,025 | ) | (11,877 | ) | (13,282 | ) | ||||||||||||||||
Loss per share: | ||||||||||||||||||||||||||||||||
Basic and diluted | (0.17 | ) | (0.15 | ) | (0.16 | ) | (0.21 | ) | (0.14 | ) | (0.15 | ) | (0.14 | ) | (0.15 | ) | ||||||||||||||||
| Quarters Ended | ||||||||||||||||||||||||||||||||
| March 31, 2005 | June 30, 2005 | September 30, 2005 | December 31, 2005 | |||||||||||||||||||||||||||||
Product and service revenue | $ | 1,056 | $ | 1,474 | $ | 1,309 | $ | 1,041 | ||||||||||||||||||||||||
Contract revenue | 2,164 | 2,183 | 2,571 | 1,688 | ||||||||||||||||||||||||||||
Net loss | (12,535 | ) | (10,887 | ) | (11,868 | ) | (16,453 | )(a) | ||||||||||||||||||||||||
Loss per share: | ||||||||||||||||||||||||||||||||
Basic and diluted | (0.17 | ) | (0.15 | ) | (0.15 | ) | (0.19 | ) | ||||||||||||||||||||||||
| (a) | See Note |
| Quarters Ended | ||||||||||||||||
| March 31, 2004 | June 30, 2004 | September 30, 2004 | December 31, 2004 | |||||||||||||
Product and service revenue | $ | 1,351 | $ | 1,508 | $ | 1,335 | $ | 1,112 | ||||||||
Contract revenue | 1,935 | 2,177 | 3,293 | 3,430 | ||||||||||||
Net loss | (11,952 | ) | (11,299 | ) | (11,684 | ) | (11,804 | ) | ||||||||
Loss per share: | ||||||||||||||||
Basic and diluted | (0.17 | ) | (0.15 | ) | (0.16 | ) | (0.16 | ) | ||||||||
F-27F-31