(3) | Pursuant to American Institute of Certified Public Accountants (AICPA) Statement of Position No. 03-3 “Accounting for Certain Loans or seven percent. GrowthDebt Securities Acquired in deposits, a low cost source of funding, positively impacted Net Interest Income. Average Deposits increased $22.6 billion, or eight percent, driven byTransfer” (SOP 03-3) the impact of FleetBoston customers, deepening existing relationshipsCorporation decreased held net charge-offs forCard Services and our focus on attracting new customers. Partially offsetting this growth was the migration of account balances of $28.1 billion fromGlobal Consumer and Small Business Banking toGlobal Wealth and Investment Management. Net Interest Income was also positively impacted by the $21.9 billion, or 18 percent, increase in Average Loans and Leases. This increase was driven by higher average balances on home equity loans and lines of credit and average held credit card outstandings. The growth$288 million or 30 bps and $152 million or 21 bps in held2006. Managed net losses forCard Services and credit card outstandings was due to the impact of FleetBoston, increases in purchase volumes, the addition of more than 5 million new accounts primarily through our branch network and direct marketing programs, and new advances on accounts for which previous loan balances were sold to the securitization trusts. Noninterest Income increased $2.6 billion, or 28 percent, in 2005. The increase was primarily due to increases of $1.1 billion, or 26 percent, in Card Income, $667decreased $288 million or 15 percent, in Service Chargesbps and $423 million in Mortgage Banking Income. Card Income increased mainly due to higher purchase volumes for credit and debit cards, the impact of the NPC acquisition in the fourth quarter of 2004, and increases in average managed credit card outstandings. The increases in card purchase volumes and average managed credit card outstandings were due to continued growth in our card business as we more effectively leveraged our branch network. The increase in Service Charges was due primarily
to the growth in new accounts. Mortgage Banking Income increased primarily due to a $400 million decrease in the impairment of MSRs. Also impacting these increases was the impact of FleetBoston.
The Provision for Credit Losses increased $938$152 million or 28 percent, to $4.3 billion in 2005 mainly due to credit card. For further discussion of the increased Provision for Credit Losses related to credit card, see the following section, Card Services.
Noninterest Expense grew $885 million, or seven percent in 2005. The majority of the increase was due to the impact of FleetBoston and NPC.
Card Services
Card Services, which excludes debit cards, provides a broad offering of credit cards to an array of customers including consumers and small businesses. Our products include traditional credit cards, and a variety of co-branded and affinity card products. We also provide processing services for merchant card receipts, a business where we are a market leader, due in part to our acquisition of NPC during the fourth quarter of 2004.
We evaluate our Card Services business on both a held and managed basis (a non-GAAP measure). Managed basis treats securitized loan receivables as if they were still on the balance sheet and presents the earnings on the sold loan receivables as if they were not sold. We evaluate credit card operations on a managed basis as the receivables that have been securitized are subject to the same underwriting standards and ongoing monitoring as the held loans. The credit performance of the managed portfolio is important to understanding the results of card operations.
The following table reconciles the credit card portfolio on a held basis to a managed basis to reflect the impact of securitizations. For assets that have been securitized, we record Noninterest Income, rather than Net Interest Income and Provision for Credit Losses, as we are compensated for servicing income and gains or losses on securitizations. In a securitization, the credit card receivables, not the ongoing relationships, are sold to the trust. After the revolving period of the securitization, assuming no new securitizations, the newly generated credit card receivables arising from these relationships are recorded on our balance sheet. This has the effect of increasing Loans and Leases and increasing Net Interest Income and the Provision for Credit Losses (including net charge-offs), with a reduction in Noninterest Income.
Credit Card Services
| | | | | | | | | | (Dollars in millions) | | 2005
| | | 2004
| | Income Statement Data | | | | | | | | | | | | Held net interest income(1) | | $ | 4,984 | | | $ | 4,283 | | Securitizations impact | | | 572 | | | | 799 | | | | |
|
|
| |
|
|
| Managed net interest income | | | 5,556 | | | | 5,082 | | | | |
|
|
| |
|
|
| Held noninterest income(1) | | | 3,951 | | | | 3,243 | | Securitizations impact | | | (115 | ) | | | (185 | ) | | | |
|
|
| |
|
|
| Managed noninterest income | | | 3,836 | | | | 3,058 | | | | |
|
|
| |
|
|
| Held total revenue(1) | | | 8,935 | | | | 7,526 | | Securitizations impact | | | 457 | | | | 614 | | | | |
|
|
| |
|
|
| Managed total revenue | | | 9,392 | | | | 8,140 | | | | |
|
|
| |
|
|
| Held provision for credit losses(1) | | | 3,999 | | | | 3,112 | | Securitizations impact | | | 434 | | | | 524 | | | | |
|
|
| |
|
|
| Managed credit impact | | | 4,433 | | | | 3,636 | | | | |
|
|
| |
|
|
| Balance Sheet Data | | | | | | | | | | | | Average held credit card outstandings(1) | | $ | 53,997 | | | $ | 43,435 | | Securitizations impact | | | 5,051 | | | | 6,861 | | | | |
|
|
| |
|
|
| Average managed credit card outstandings | | $ | 59,048 | | | $ | 50,296 | | | | |
|
|
| |
|
|
| Ending held credit card outstandings(1) | | $ | 58,548 | | | $ | 51,726 | | Securitizations impact | | | 2,237 | | | | 6,903 | | | | |
|
|
| |
|
|
| Ending managed credit card outstandings | | $ | 60,785 | | | $ | 58,629 | | | | |
|
|
| |
|
|
| Credit Quality Statistics | | | | | | | | | | | | Held net charge-offs(1) | | $ | 3,652 | | | $ | 2,305 | | Securitizations impact | | | 434 | | | | 524 | | | | |
|
|
| |
|
|
| Managed credit card net losses | | $ | 4,086 | | | $ | 2,829 | | | | |
|
|
| |
|
|
| Held net charge-offs(1) | | | 6.76 | % | | | 5.31 | % | Securitizations impact | | | 0.16 | | | | 0.31 | | | | |
|
|
| |
|
|
| Managed credit card net losses | | | 6.92 | % | | | 5.62 | % | | | |
|
|
| |
|
|
|
(1) | | Held basis is a GAAP measure. |
Strong credit card growth drove Card Services revenue in 2005. Held credit card revenue increased $1.4 billion, or 19 percent, to $8.9 billion. Contributing to this increase was the $701 million increase in held Net Interest Income, due to a $10.6 billion, or 24 percent, increase in average held credit card outstandings. The increase in average held credit card outstandings was due to the impact of FleetBoston, increases in purchase volumes, the addition of more than 5 million new accounts primarily through our branch network and direct marketing programs, and new advances on accounts for which previous loan balances were sold to the securitization trusts.
Also driving Card Services held revenue was an increase in Noninterest Income of $708 million, or 22 percent, in 2005. The increase resulted from higher merchant discount fees, interchange fees, cash advance fees and late fees. Merchant discount fees increased $418 million primarily due to the acquisition of NPC. Interchange fees increased $87 million mainly due to a $10.4 billion, or 13 percent, increase in consumer credit card purchase volumes. Cash advance fees increased $64 million due to higher balance transfers. Late fees increased $62 million in 2005.
Held Provision for Credit Losses increased $887 million to $4.0 billion in 2005, driven primarily by higher net charge-offs. Consumer card net charge-offs were $3.7 billion, or 6.76 percent in 2005 compared to $2.3 billion, or 5.31 percent in 2004. Higher credit card net charge-offs were driven by an increase in bankruptcy related charge-offs of $578 million as card customers “rushed to file” ahead of the new bankruptcy law. Also impacting net charge-offs were organic portfolio growth and seasoning, increases effective in 2004 in credit card minimum payment requirements, the impact of FleetBoston and new advances on accounts for which previous loan balances were sold to the securitization trusts. We estimate that approximately 70 percent of the increased bankruptcy-related charge-offs represent acceleration from 2006. Excluding bankruptcy-related charge-offs representing acceleration from 2006 and charge-offs associated with the 2004 changes in credit card minimum payment requirements that were provided for in late 2004, the increased net charge-offs were the primary driver of the higher Provision for Credit Losses. In addition, the Provision for Credit Losses was impacted by new advances on accounts for which previous loan balances were sold to the securitization trusts, and the establishment of reserves in 2005 for additional changes made in late 2005 in credit card minimum payment requirements.
Managed card revenue increased $1.3 billion, or 15 percent, to $9.4 billion in 2005, driven by a $474 million, or nine percent, increase in managed Net Interest Income, and a $778 million, or 25 percent increase, in managed Noninterest Income. Average managed credit card outstandings were $59.0 billion in 2005 compared to $50.3 billion in 2004. The impact of FleetBoston and organic growth drove the increases in 2005.
Managed consumer credit card net losses were $4.1 billion, or 6.92 percent of total average managed credit card loans in 2005, compared to $2.8 billion, or 5.62 percent in 2004. Higher managed credit card net losses were driven by an increase in bankruptcy net losses resulting from the change in the bankruptcy law, continued growth and seasoning, increases effective in 2004 in credit card minimum payment requirements and the impact of FleetBoston.9 bps. For more information, seerefer to the discussion of SOP 03-3 in the Consumer Portfolio Credit Risk Management section beginning on page 49.
Consumer Real Estate53.
Consumer Real Estate generates revenue by providing an extensive line of mortgage products and services to customers nationwide. Consumer Real Estate products are available to our customers through a retail network of personal bankers located in 5,873 banking centers, dedicated sales account executives in over 150 locations and through a dedicated sales force offering our customers direct telephone and online access to our products. Additionally, we serve our customers through a partnership with more than 6,600 mortgage brokers in 49 states. The mortgage product offerings for home purchase and refinancing needs include fixed and adjustable rate loans, and home equity lines of credit. To manage this portfolio, these products are either sold into the secondary mortgage market to investors while retaining Bank of America customer relationships or are held on our balance sheet for ALM purposes.
Consumer Real Estate is managed with a focus on its two primary businesses, first mortgage and home equity. The first mortgage business includes the origination, fulfillment and servicing of first mortgage loan products. Servicing activities primarily include collecting cash for principal, interest and escrow payments from borrowers, and accounting for and remitting principal and interest payments to investors. Servicing income includes ancillary income derived in connection with these activities, such as late fees. The home equity business includes lines of credit and second mortgages. These two businesses provide us with a business model that meets customer real estate borrowing needs in various interest rate cycles.
Total revenue for the Consumer Real Estate business increased $558 million to $3.2 billion in 2005. The following table shows theGlobal Consumer and Small Business Banking revenue components of the Consumer Real Estate business.
Consumer Real Estate Revenue
| | | | | | | | | (Dollars in millions) | | 2005
| | 2004
| | Net Interest Income | | | | | | | | Home equity | | $ | 1,340 | | $ | 1,108 | | Residential first mortgage | | | 806 | | | 1,140 | | | | |
|
| |
|
|
| Net interest income | | | 2,146 | | | 2,248 | | | | |
|
| |
|
|
| Mortgage banking income(1) | | | 1,012 | | | 589 | | Trading account profits | | | — | | | (349 | ) | Other income | | | 66 | | | 178 | | | | |
|
| |
|
|
| Total consumer real estate revenue | | $ | 3,224 | | $ | 2,666 | | | | |
|
| |
|
|
|
(1) | | For more information, see the following Mortgage Banking Income table. |
(4) | Includes U.S. Consumer Card and Foreign Credit Card. Does not include Business Card. |
Managed Basis ManagedCard Services Net Interest Income increased $10.9 billion to $16.4 billion in 2006 compared to 2005. This increase was driven by the addition of MBNA and organic growth which contributed to an increase in total average managed outstandings. ManagedCard ServicesNoninterest Income increased $4.9 billion to $8.5 billion in 2006 compared to 2005, largely resulting from the MBNA merger and organic growth including increases in interchange income, cash advance fees and late fees. ManagedCard Services net losses increased $3.0 billion to $7.2 billion or 3.78 percent of average ManagedCard Servicesoutstandings in 2006 compared to $4.2 billion, or 6.86 percent in 2005, primarily driven by the addition of the MBNA portfolio and portfolio seasoning, partially offset by lower bankruptcy-related losses. The 308 bps decrease in the net loss ratio for ManagedCard Services was driven by lower net losses resulting from bankruptcy reform and the beneficial impact of the higher credit quality of the MBNA portfolio compared to the legacy Bank of America portfolio. We expect managed net losses to trend towards more normalized levels in 2007. ManagedCard Services total average outstandings increased $130.4 billion to $191.5 billion in 2006 compared to 2005. This increase was driven by the addition of MBNA and organic growth. Held Basis Net Income increased $4.6 billion to $5.6 billion in 2006 compared to 2005 due to revenue growth, partially offset by increases in Noninterest Expense and Provision for Credit Losses. Held Total Revenue increased $12.9 billion to $21.5 billion in 2006 compared to 2005 primarily due to the addition of MBNA and organic growth. The MBNA merger increased excess servicing income, cash advance fees, late fees, interchange income and all other income. Excess servicing income benefited from lower net losses on the securitized loan portfolio resulting from bankruptcy reform. Held Provision for Credit Losses increased $728 million to $4.7 billion. This increase was primarily driven by the addition of the MBNA portfolio and seasoning of the business card portfolio, partially offset by reduced credit-related costs on the domestic consumer credit card portfolio. On the domestic consumer credit card portfolio lower bankruptcy charge-offs resulting from bankruptcy reform and the absence of the $210 million provision recorded in 2005 to establish reserves for changes in credit card minimum payment requirements were partially offset by portfolio seasoning. Card Services held net charge-offs were $3.9 billion, $112 million higher than 2005, driven by the addition of the MBNA portfolio partially offset by lower bankruptcy-related credit card net charge-offs. Credit card held net charge-offs were $3.3 billion, or 4.55 percent of total average held credit card loans, compared to $3.7 billion, or 6.76 percent, for 2005. This decrease was primarily driven by lower bankruptcy-related charge-offs as 2005 included accelerated charge-offs resulting from bankruptcy reform. The decrease was partially offset by the addition of the MBNA portfolio, new advances on accounts for which previous loan balances were sold to the securitization trusts and portfolio seasoning. Held total Noninterest Expense increased $4.9 billion to $7.8 billion compared to the same period in 2005 primarily driven by the MBNA merger which increased most expense items including Personnel, Marketing, and Amortization of Intangibles. In connection with MasterCard’s initial public offering on May 24, 2006, the Corporation’s previous investment in MasterCard was exchanged for new restricted shares. The Corporation recognized a net pre-tax gain of approximately $36 million in all other income relating to the shares that were required to be redeemed by MasterCard for cash and no gain was recorded associated with the unredeemed shares. For shares acquired as part of the MBNA merger, a purchase accounting adjustment of $71 million was recorded as a reduction of Goodwill to record the fair value of both the redeemed and unredeemed MasterCard shares. At December 31, 2006, the Corporation had approximately 3.5 million restricted shares of MasterCard that are accounted for at cost. Net Interest Income decreased $102 million primarily driven by the impact of spread compression due to flattening of the yield curve and the $2.3 billion decrease in average residential first mortgage balances. This decrease was partially offset by higher average balances in the home equity portfolio, which grew $11.2 billion, or 31 percent, to $47.7 billion which was attributable to account growth and larger line sizes resulting from enhanced product offerings, the expanding home equity market and the impact of FleetBoston.
In 2005, home equity average balances across all business lines grew $18.8 billion, or 42 percent, to $63.9 billion and home equity production improved $15.3 billion, or 27 percent, to $72.0 billion compared to 2004.
In 2005, there were no Trading Account Profits compared to a loss of $349 million in 2004, related to the Certificates. Effective June 1, 2004, the Certificates were converted to MSRs. Prior to the conversion, changes in the value of the Certificates, MSRs and derivatives used for risk management were recognized as Trading Account Profits. In 2004, Trading Account Profits included $342 million of downward adjustments for changes to valuation assumptions and prepayment adjustments.
| Mortgage Banking Income increased $423 million to $1.0 billion in 2005. The following summarizes the components of Mortgage Banking Income which include production income from loans sold in the secondary market and servicing income that reflects the performance of the servicing portfolio.Mortgage Banking Income
| | | | | | | | | | (Dollars in millions) | | 2005
| | | 2004
| | Production income(1) | | $ | 674 | | | $ | 765 | | | | |
|
|
| |
|
|
| Servicing income: | | | | | | | | | Servicing fees and ancillary income | | | 848 | | | | 615 | | Amortization of MSRs | | | (613 | ) | | | (345 | ) | Gains on sales of MSRs | | | 14 | | | | — | | Net MSR and SFAS 133 derivative hedge adjustments(2) | | | 167 | | | | 18 | | Losses on derivatives(3) | | | (15 | ) | | | (1 | ) | Impairment of MSRs | | | (63 | ) | | | (463 | ) | | | |
|
|
| |
|
|
| Total net servicing income | | | 338 | | | | (176 | ) | | | |
|
|
| |
|
|
| Total mortgage banking income(4) | | $ | 1,012 | | | $ | 589 | | | | |
|
|
| |
|
|
|
(1) | | Includes $(14) million and $2 million related to hedge ineffectiveness of cash flow hedges on our mortgage warehousefor 2005 and 2004. |
(2) | | Represents derivative hedge losses of $124 million under SFAS 133, offset by an increase in the value of the MSRs of $291 million for 2005, and derivative hedge gains of $228 million offset by a decrease in the value of the MSRs of $210 million for 2004. For additional information on MSRs, see Note 9 of the Consolidated Financial Statements. |
(3) | | Net losses on derivatives used as economic hedges of MSRs not designated as SFAS 133 hedges. |
(4) | | Includes revenue for mortgage services provided to other segments that are eliminated in consolidation (inAll Other) of $207 million and $175 million for 2005 and 2004. |
Production for residential first mortgages, withinGlobal Consumer and Small Business Banking, was $74.7 billion in 2005 compared to $80.2 billion in 2004, a decrease of seven percent. In 2005, production income decreased $91 million to $674 million due to lower production volume and margin compression. The volume reduction resulted in lower loan sales to the secondary market in 2005 of $65.1 billion, an eight percent decrease from 2004.
Across all segments, residential first mortgage production was $86.8 billion in 2005 compared to $87.5 billion in 2004. Of the volume across all segments during 2005, $60.3 billion was originated through retail channels, and $26.5 billion was originated through the wholesale channel. This compares to $57.6 billion and $30.0 billion during 2004. Refinance activity in 2005 was approximately 49 percent of the production compared to 57 percent in 2004.
The Consumer Real Estate servicing portfolio includes originated and retained residential mortgages, loans serviced for others and home equity loans. The servicing portfolio at December 31, 2005 was $368.4 billion, $35.9 billion higher than December 31, 2004, driven primarily by production, home equity account growth and lower prepayment rates.
Net servicing income rose $514 million in 2005, primarily driven by a $400 million decrease in impairment of MSRs. Impairment charges in 2004 included a $261 million adjustment for changes in valuation assumptions and prepayment adjustments to align with changing market conditions and customer behavioral trends.
As of December 31, 2005, the MSR balance was $2.7 billion, an increase of $300 million, or 13 percent, from December 31, 2004. This value represented 122 bps of the related unpaid principal balance, a three percent increase from December 31, 2004. The following table outlines our MSR statistical information:
Consumer Real Estate Mortgage Servicing Rights(1)
| | | | | | | | | | | | December 31
| | | (Dollars in millions) | | 2005
| | | 2004
| | MSR data: | | | | | | | | | Balance | | $ | 2,658 | | | $ | 2,358 | | Capitalization value | | | 1.22 | % | | | 1.19 | % | Unpaid balance(2) | | $ | 218,172 | | | $ | 197,795 | | Number of customers (in thousands) | | | 1,619 | | | | 1,582 | |
(1) | | Excludes MSRs inGlobal Capital Markets and Investment Banking at December 31, 2005 and 2004 of $148 million and $123 million. |
(2) | | Represents the portion of our servicing portfolio for which a MSR asset has been recorded. |
MSRs are accounted for at the lower of cost or market with impairment recognized as a reduction to Mortgage Banking Income. A combination of derivatives and AFS securities (e.g. mortgage-backed securities) is utilized to hedge the changes in value associated with the MSRs. At December 31, 2005, $2.3 billion of MSRs were hedged using a SFAS 133 strategy and $250 million of MSRs were economically hedged using AFS securities. During 2005, Net Interest Income included $18 million on these AFS securities. At December 31, 2005, the unrealized loss on AFS securities used to economically hedge the MSRs was $29 million compared to an unrealized gain of $21 million at December 31, 2004. For more information on MSRs, see Notes 1 and 9
Mortgage generates revenue by providing an extensive line of mortgage products and services to customers nationwide.Mortgage products are available to our customers through a retail network of personal bankers located in 5,747 banking centers, sales account executives in nearly 200 locations and through a sales force offering our customers direct telephone and online access to our products. Additionally, we serve our customers through a partnership with more than 6,500 mortgage brokers in all 50 states. The mortgage product offerings for home purchase and refinancing needs include fixed and adjustable rate loans. To manage this portfolio, these products are either sold into the secondary mortgage market to investors, while retaining the Bank of America customer relationships, or are held on our balance sheet for ALM purposes. The mortgage business includes the origination, fulfillment, sale and servicing of first mortgage loan products. Servicing activities primarily include collecting cash for principal, interest and escrow payments from borrowers, and accounting for and remitting principal and interest payments to investors and escrow payments to third parties. Servicing income includes ancillary income derived in connection with these activities such as late fees. Mortgageproduction withinGlobal Consumer and Small Business Banking was $76.7 billion in 2006 compared to $74.7 billion in 2005. Net Income forMortgage declined $116 million, or 29 percent, due to a decrease in Total Revenue of $265 million to $1.4 billion, partially offset by an $87 million decrease in Noninterest Expense. The decline in Total Revenue was due to a decrease of $146 million in Net Interest Income and a decrease of $142 million in Mortgage Banking Income. The reduction in Net Interest Income was primarily driven by the impact of spread compression. The decline in Mortgage Banking Income was primarily due to margin compression which negatively impacted the pricing of loans. This was partially offset by the favorable performance of the Mortgage Servicing Rights (MSRs) net of the derivatives used to economically hedge changes in the fair values of the MSRs.Mortgage was not impacted by the Corporation’s decision to retain a larger share of mortgage production on the Corporation’s Balance Sheet, asMortgage was compensated for the decision on a management accounting basis with a corresponding offset inAll Other. The Mortgage servicing portfolio includes loans serviced for others and originated and retained residential mortgages. The servicing portfolio at December 31, 2006 was $333.0 billion, $36.2 billion higher than December 31, 2005, primarily driven by production and lower prepayment rates. Included in this amount was $229.9 billion of loans serviced for others. At December 31, 2006, the consumer MSR balance was $2.9 billion, an increase of $211 million, or eight percent, from December 31, 2005. This value represented 125 bps of the related unpaid principal balance, a 3 bps increase from December 31, 2005. For additional information, see Note 8 of the Consolidated Financial Statements. | Consumer Deposit and Debit ProductsHome EquityConsumer Deposit and Debit Products provides a comprehensive range of products to consumers and small businesses. Our products include traditional savings accounts, money market savings accounts, CDs and IRAs, regular and interest-checking accounts, debit cards and a variety of business checking options.
In 2005, we added approximately 2.3 million net new retail checking accounts and 1.9 million net new retail savings accounts. This growth resulted from continued improvement in sales and service results in the Banking Center Channel, the introduction of new products, the addition of 99 new stores and the impact of FleetBoston. In the FleetBoston franchise, we opened 431,000 net new retail checking and 348,000 net new retail savings accounts since the FleetBoston Merger on April 1, 2004.
Consumer deposit products provide a relatively stable and inexpensive source of liquidity. We earn net interest spread revenues from investing this liquidity in earning assets through client facing lending activity and our ALM process. The revenue streams from these activities are allocated to our deposit products using our funds transfer pricing process which takes into account the interest rates and maturity characteristics of the deposits. Deposits also generate account fees while debit cards generate interchange income. The following table shows the components of Total Revenue for Consumer Deposit and Debit Products.
Consumer Deposit and Debit Products Revenue
|
Home Equitygenerates revenue by providing an extensive line of home equity products and services to customers nationwide.Home Equity products include lines of credit and home equity loans and are also available to our customers through our retail network and our partnership with mortgage brokers. Net Income forHome Equity increased $69 million, or 16 percent, in 2006 compared to 2005. Driving this increase in Net Income was Net Interest Income, which increased $115 million to $1.4 billion in 2006 compared to 2005, primarily attributable to account growth and larger line sizes resulting from enhanced product offerings and the expanding home equity market. TheHome Equity servicing portfolio at December 31, 2006 was $86.5 billion, $14.9 billion higher than December 31, 2005, driven primarily by increased production.Home Equity production withinGlobal Consumer and Small Business Banking increased $9.5 billion to $65.4 billion in 2006 compared to 2005. | | | | | | | | (Dollars in millions) | | 2005
| | 2004
| Net interest income | | $ | 8,380 | | $ | 6,982 | | | |
|
| |
|
| Deposit service charges | | | 4,986 | | | 4,321 | Debit card income | | | 1,629 | | | 1,232 | | | |
|
| |
|
| Total noninterest income | | | 6,615 | | | 5,553 | | | |
|
| |
|
| Total deposit and debit revenue | | $ | 14,995 | | $ | 12,535 | | | |
|
| |
|
|
Total deposit and debit revenue grew $2.5 billion, or 20 percent, in 2005. Driving this growth was an increase of $1.4 billion, or 20 percent, in Net Interest Income resulting from higher levels of deposits. Also impacting the growth in Net Interest Income was our pricing strategy and the positive impact of the FleetBoston Merger.
Deposit service charges increased $665 million, or 15 percent, in 2005. The increase was primarily due to the growth of new accounts across our franchise and the impact of the FleetBoston Merger.
Debit card income, which is included in Card Income on the Consolidated Statement of Income, increased $397 million, or 32 percent, in 2005. Driving the increase was growth in transaction activity as purchase volumes increased 29 percent due to new accounts, growth in average ticket size and the positive impact of the FleetBoston Merger, as well as higher interchange rates on debit card transactions.
| Global Business and Financial ServicesALM/Other |
ALM/Other is comprised primarily of the allocation of a portion of the Corporation’s Net Interest Income from ALM activities, the residual of the funds transfer pricing allocation process associated with recordingCard Services securitizations and the results of other consumer-related businesses (e.g., insurance). Net Income decreased $898 million for 2006 compared to 2005. The decrease was primarily a result of a lower contribution from ALM activities and the impact of the residual of the funds transfer pricing allocation process associated withCard Services securitizations. | Global Business and Financial Services serves mid-sized domestic and international business clients providing financial services, specialized industry expertise and local delivery through a global team of client managers and a variety of businesses including Global Treasury Services, Middle Market Banking, Business Banking, Commercial Real Estate Banking, Leasing, Business Capital,and Dealer Financial Services. It also includes our businesses inLatin America.During the third quarter of 2005, our operations in Mexico were realigned and are now included in the results ofGlobal Business and Financial Services, rather thanGlobal Capital Markets and Investment Banking. Also during the third quarter of 2005, we announced the future combination ofGlobal Business and Financial Services andGlobal Capital Markets and Investment Bankingthat was effective on January 1, 2006. This new segment is calledGlobal Corporate and Investment Banking |
| | | | | | | | | | | | | | | | | | | | | | | | | | 2006 | | | (Dollars in millions) | | Total | | | | | Business
Lending | | | Capital
Markets
and
Advisory
Services | | | Treasury
Services | | | ALM/
Other | | Net interest income(1) | | $ | 10,693 | | | | | $ | 4,605 | | | $ | 1,651 | | | $ | 3,880 | | | $ | 557 | | Noninterest income | | | | | | | | | | | | | | | | | | | | | | | Service charges | | | 2,777 | | | | | | 501 | | | | 120 | | | | 1,995 | | | | 161 | | Investment and brokerage services | | | 1,027 | | | | | | 15 | | | | 867 | | | | 33 | | | | 112 | | Investment banking income | | | 2,477 | | | | | | — | | | | 2,476 | | | | — | | | | 1 | | Trading account profits | | | 3,028 | | | | | | 54 | | | | 2,748 | | | | 48 | | | | 178 | | All other income | | | 2,689 | | | | | | 507 | | | | 338 | | | | 734 | | | | 1,110 | | Total noninterest income | | | 11,998 | | | | | | 1,077 | | | | 6,549 | | | | 2,810 | | | | 1,562 | | Total revenue(1) | | | 22,691 | | | | | | 5,682 | | | | 8,200 | | | | 6,690 | | | | 2,119 | | | | | | | | | Provision for credit losses | | | (6 | ) | | | | | 3 | | | | 14 | | | | (2 | ) | | | (21 | ) | Gains on sales of debt securities | | | 53 | | | | | | 13 | | | | 22 | | | | — | | | | 18 | | Noninterest expense | | | 11,998 | | | | | | 2,153 | | | | 5,524 | | | | 3,248 | | | | 1,073 | | Income before income taxes(1) | | | 10,752 | | | | | | 3,539 | | | | 2,684 | | | | 3,444 | | | | 1,085 | | Income tax expense | | | 3,960 | | | | | | 1,310 | | | | 993 | | | | 1,274 | | | | 383 | | Net income | | $ | 6,792 | | | | | $ | 2,229 | | | $ | 1,691 | | | $ | 2,170 | | | $ | 702 | | | | | | | | | Shareholder value added | | $ | 2,349 | | | | | $ | 623 | | | $ | 517 | | | $ | 1,431 | | | $ | (222 | ) | Net interest yield(1) | | | 1.71 | % | | | | | 2.00 | % | | | n/m | | | | 2.85 | % | | | n/m | | Return on average equity | | | 16.21 | | | | | | 14.23 | | | | 15.76 | % | | | 30.76 | | | | n/m | | Efficiency ratio(1) | | | 52.87 | | | | | | 37.89 | | | | 67.36 | | | | 48.55 | | | | n/m | | Period end—total assets(2) | | $ | 689,248 | | | | | $ | 246,414 | | | $ | 384,151 | | | $ | 166,503 | | | | n/m | | | | | 2005 | | | (Dollars in millions) | | Total | | | | | Business
Lending | | | Capital
Markets
and
Advisory
Services | | | Treasury
Services | | | ALM/
Other | | Net interest income(1) | | $ | 11,156 | | | | | $ | 4,825 | | | $ | 1,938 | | | $ | 3,375 | | | $ | 1,018 | | Noninterest income | | | | | | | | | | | | | | | | | | | | | | | Service charges | | | 2,618 | | | | | | 474 | | | | 111 | | | | 1,866 | | | | 167 | | Investment and brokerage services | | | 1,046 | | | | | | 17 | | | | 876 | | | | 28 | | | | 125 | | Investment banking income | | | 1,892 | | | | | | — | | | | 1,891 | | | | — | | | | 1 | | Trading account profits | | | 1,770 | | | | | | (28 | ) | | | 1,618 | | | | 63 | | | | 117 | | All other income | | | 2,118 | | | | | | 769 | | | | 329 | | | | 676 | | | | 344 | | Total noninterest income | | | 9,444 | | | | | | 1,232 | | | | 4,825 | | | | 2,633 | | | | 754 | | Total revenue(1) | | | 20,600 | | | | | | 6,057 | | | | 6,763 | | | | 6,008 | | | | 1,772 | | | | | | | | | Provision for credit losses | | | (291 | ) | | | | | 67 | | | | (27 | ) | | | (4 | ) | | | (327 | ) | Gains on sales of debt securities | | | 263 | | | | | | 62 | | | | 55 | | | | — | | | | 146 | | Noninterest expense | | | 11,133 | | | | | | 2,010 | | | | 4,754 | | | | 3,149 | | | | 1,220 | | Income before income taxes(1) | | | 10,021 | | | | | | 4,042 | | | | 2,091 | | | | 2,863 | | | | 1,025 | | Income tax expense | | | 3,637 | | | | | | 1,448 | | | | 745 | | | | 1,030 | | | | 414 | | Net income | | $ | 6,384 | | | | | $ | 2,594 | | | $ | 1,346 | | | $ | 1,833 | | | $ | 611 | | | | | | | | | Shareholder value added | | $ | 1,966 | | | | | $ | 1,031 | | | $ | 265 | | | $ | 1,128 | | | $ | (458 | ) | Net interest yield(1) | | | 2.03 | % | | | | | 2.36 | % | | | n/m | | | | 2.37 | % | | | n/m | | Return on average equity | | | 15.28 | | | | | | 16.92 | | | | 13.61 | % | | | 27.06 | | | | n/m | | Efficiency ratio(1) | | | 54.04 | | | | | | 33.18 | | | | 70.30 | | | | 52.41 | | | | n/m | | Period end—total assets(2) | | $ | 633,362 | | | | | $ | 227,523 | | | $ | 338,190 | | | $ | 170,601 | | | | n/m | |
(1) | Fully taxable-equivalent basis |
(2) | Total Assets include asset allocations to match liabilities (i.e., deposits). |
n/m = not meaningful | | | | | | | | | | | | | | | | December 31 | | Average Balance | | (Dollars in millions) | | 2006 | | 2005 | | 2006 | | 2005 | Total loans and leases | | $ | 246,490 | | $ | 232,631 | | $ | 243,282 | | $ | 214,818 | Total trading-related assets | | | 309,321 | | | 291,267 | | | 338,364 | | | 314,568 | Total market-based earning assets(1) | | | 347,572 | | | 305,374 | | | 369,164 | | | 322,236 | Total earning assets(2) | | | 605,153 | | | 553,390 | | | 625,212 | | | 550,620 | Total assets(2) | | | 689,248 | | | 633,362 | | | 706,906 | | | 633,253 | Total deposits | | | 216,875 | | | 198,352 | | | 205,652 | | | 189,860 | Allocated equity | | | 40,025 | | | 43,985 | | | 41,892 | | | 41,773 |
(1) | Total market-based earning assets represents earning assets from theGlobal Treasury Services provides integrated working capital management and treasury solutions to clients across the U.S. and 50 countries through our network of proprietary offices and clearing arrangements with other financial institutions. Our clients include multinationals, middle-market companies, correspondent banks, commercial real estate firms and governments. Our services include treasury management, trade finance, foreign exchange, short-term credit facilities and short-term investing. The revenues and operating results are reflected in this segment as well asGlobal Consumer and Small Business Banking andGlobal Capital Markets and Investment Banking,Advisory Servicesbased upon where customersbusiness. |
(2) | Total earning assets and clients are serviced.Total Assets include asset allocations to match liabilities (i.e., deposits). |
Global Corporate and Investment Banking provides a wide range of financial services to both our issuer and investor clients that range from business banking clients to large international corporate and institutional investor clients using a strategy to deliver value-added financial products and advisory solutions.Global Corporate and Investment Banking’s products and services are delivered from three primary businesses:Business Lending, Capital Markets and Advisory Services, andTreasury Services, and are provided to our clients through a global team of client relationship managers and product partners. In addition,ALM/Other includes the results of ALM activities and our Latin America and Hong Kong based retail and commercial banking businesses, parts of which were sold in 2006. Our clients are supported through offices in 26 countries that are divided into four distinct geographic regions: U.S. and Canada; Asia; Europe, Middle East, and Africa; and Latin America. For more information on our foreign operations, see Foreign Portfolio beginning on page 65. Net Income increased $408 million, or six percent, in 2006. Driving the increase were Trading Account Profits, Investment Banking Income, and gains from the sale of our Brazilian operations and Asia Commercial Banking business. These increases were partially offset by declines in Net Interest Income and Gains on Sales of Debt Securities and increases in Provision for Credit Losses and Noninterest Expense. AlthoughGlobal Corporate and Investment Bankingexperienced overall growth in Average Loans and Leases of $28.5 billion, or 13 percent, and an increase in Average Deposits of $15.8 billion, or eight percent, Net Interest Income declined primarily due to the impact of ALM activities, spread compression in the loan portfolio and the impact of the sale of our Brazilian operations in the third quarter of 2006. This decline was partially offset by wider spreads in ourTreasury Services deposit base as we effectively managed pricing in a rising interest rate environment. Noninterest Income increased $2.6 billion, or 27 percent, in 2006. The increase in Noninterest Income was driven largely by the increase in Trading Account Profits, Investment Banking Income, and the gain on the sale of our Brazilian operations and Asia Commercial Banking business. The increases in Trading Account Profits and Investment Banking Income were driven by continued strength in debt underwriting, sales and trading, and a favorable market environment. The sale of our Brazilian operations and Asia Commercial Banking business generated $720 million and $165 million gains (pre-tax), respectively, and were reflected in all other income. Provision for Credit Losses was negative $6 million in 2006 compared to negative $291 million in 2005. The change in the Provision for Credit Losses was primarily due to the absence in 2006 of benefits from the release of reserves in 2005 related to an improved risk profile in Latin America and reduced uncertainties associated with the FleetBoston Financial Corporation (FleetBoston) credit integration as well as lower commercial recoveries in 2006. This increase was partially offset by benefits in 2006 from reductions in commercial reserves as a stable economic environment throughout 2006 drove sustained favorable commercial credit market conditions. Noninterest Expense increased $865 million, or eight percent, mainly due to higher Personnel expense, including performance-based incentive compensation primarily inCapital Markets and Advisory Services and Other General Operating costs. Business Lending provides a wide range of lending-related products and services to our clients through client relationship teams along with various product partners. Products include commercial and corporate bank loans and commitment facilities which cover our business banking clients, middle market commercial clients and our large multinational corporate clients. Real estate lending products are issued primarily to public and private developers, homebuilders and commercial real estate firms. Leasing and asset-based lending products offer our clients innovative financing solutions. Products also include indirect consumer loans which allow us to offer financing through automotive, marine, motorcycle and recreational vehicle dealerships across the U.S.Business Lending also contains the results for the economic hedging of our risk to certain credit counterparties utilizing various risk mitigation tools such as Credit Default Swaps (CDS) and may also include the results of other products to help reduce hedging costs. Net Income decreased $365 million, or 14 percent, primarily due to decreases in Net Interest Income and Noninterest Income, combined with an increase in Noninterest Expense. These items were partially offset by a decrease in the Provision for Credit Losses. The decrease in Net Interest Income of $220 million or five percent, was driven by the impact of lower spreads on all loan products which was partially offset by loan growth. Average Loans and Leases increased 12 percent primarily due to growth in the commercial and indirect consumer loan portfolio. The decrease in Noninterest Income was due to an increase in credit mitigation costs as spreads continued to tighten and lower equity gains in all other income. Provision for Credit Losses was $3 million in 2006 compared to $67 million in 2005. The low level of Provision for Credit Losses in 2006 was driven by benefits in 2006 from reductions in commercial reserves as a stable economic environment throughout 2006 drove sustained favorable commercial credit market conditions. These benefits were in part offset by lower commercial recoveries in 2006. Benefits from the release of reserves related to reduced uncertainties associated with the FleetBoston credit integration contributed to the low level of Provision for Credit Losses in 2005. The increase in Noninterest Expense was primarily driven by increased expenses associated with Personnel, technology, and Professional Fees. Middle Market Banking provides commercial lending, treasury management products, investment banking, capital markets, and insurance services to middle-market companies across the U.S.
Business Banking offers our client-managed small business customers a variety of business solutions to grow and manage their businesses. Products and services include a wide range of credit and treasury management solutions, advisory services such as merchant services, card products, payroll and employee benefits.
Commercial Real Estate Banking, with offices in more than 60 cities across the U.S., provides project financing and treasury management solutions to private developers, homebuilders and commercial real estate firms. This business also includes community development banking, which provides lending and investing services to low- and moderate-income communities.
Leasingprovides leasing solutions to small businesses, middle-market and large corporations in the U.S. and internationally, offering expertise in the municipal, corporate aircraft, healthcare and vendor markets.
Business Capital provides asset-based lending financing solutions that are customized to meet the capital needs of our clients by leveraging their assets on a primarily secured basis in the U.S., Canada and European markets.
Dealer Financial Services provides indirect and direct lending and investing services, including floor plan programs and consumer financing for marine, recreational vehicle and auto dealerships through more than 10,000 dealer clients across the U.S.
Latin America includes our full-service Latin American operations in Brazil, Chile, Argentina, and Uruguay, and our commercial and wealth and investment management operations in Mexico. These businesses primarily service indigenous and multinational corporations, small businesses and affluent consumers. On October 13, 2005, we announced an agreement to sell our asset management business in Mexico with $1.8 billion of assets under management to an entity in which we have a 24.9 percent investment. The sale will be completed in 2006. In December 2005, we entered into a definitive agreement for the sale of BankBoston Argentina assets and assumption of liabilities. The transaction is subject to obtaining all necessary regulatory approvals. For more information on our Latin American operations, see Foreign Portfolio beginning on page 56.
Global Business and Financial Services
| | | | | | | | | | (Dollars in millions) | | 2005
| | | 2004
| | Net interest income (FTE basis) | | $ | 7,788 | | | $ | 6,534 | | Noninterest income: | | | | | | | | | Service charges | | | 1,469 | | | | 1,287 | | Investment and brokerage services | | | 221 | | | | 168 | | All other income | | | 1,682 | | | | 1,262 | | | | |
|
|
| |
|
|
| Total noninterest income | | | 3,372 | | | | 2,717 | | | | |
|
|
| |
|
|
| Total revenue (FTE basis) | | | 11,160 | | | | 9,251 | | Provision for credit losses | | | (49 | ) | | | (442 | ) | Gains on sales of debt securities | | | 146 | | | | — | | Noninterest expense | | | 4,162 | | | | 3,598 | | | | |
|
|
| |
|
|
| Income before income taxes | | | 7,193 | | | | 6,095 | | Income tax expense | | | 2,631 | | | | 2,251 | | | | |
|
|
| |
|
|
| Net income | | $ | 4,562 | | | $ | 3,844 | | | | |
|
|
| |
|
|
| Shareholder value added | | $ | 1,486 | | | $ | 1,297 | | Net interest yield (FTE basis) | | | 4.05 | % | | | 4.06 | % | Return on average equity | | | 15.63 | | | | 15.89 | | Efficiency ratio (FTE basis) | | | 37.29 | | | | 38.90 | | Average: | | | | | | | | | Total loans and leases | | $ | 180,557 | | | $ | 151,725 | | Total assets | | | 222,584 | | | | 184,771 | | Total deposits | | | 106,951 | | | | 93,254 | | Common equity/Allocated equity | | | 29,182 | | | | 24,193 | | Year end: | | | | | | | | | Total loans and leases | | | 192,532 | | | | 170,698 | | Total assets | | | 237,679 | | | | 214,045 | | Total deposits | | | 114,241 | | | | 107,838 | |
Net Interest Income increased $1.3 billion, or 19 percent in 2005. The increase was largely due to growth in commercial loans and leases, deposit balances, and the impact of FleetBoston earning assets offset by spread compression driven by a flattening yield curve. Average outstanding Loans and Leases increased $28.8 billion, or 19 percent, in 2005 due to loan growth inMiddle Market Banking, Dealer Financial Services (primarily due to consumer bulk purchases), Commercial Real Estate Banking, Leasingand Business Banking. Average commercial deposits, which are a lower cost source of funding, increased $13.7 billion, or 15 percent, in 2005, driven by deposit growth in Middle Market Banking, Business Banking, Latin America andCommercial Real Estate Banking.
Noninterest Income increased $655 million, or 24 percent, in 2005. The increase was driven by a $420 million increase in other noninterest income to $1.7 billion, primarily due to the FleetBoston Merger and gains on early lease terminations. Higher Service Charges impacted the increase in Noninterest Income, primarily driven by the FleetBoston Merger.
The Provision for Credit Losses increased $393 million to negative $49 million in 2005 compared to negative $442 million in 2004. The negative provision reflects continued improvement in commercial credit quality although at a slower rate than experienced in 2004. An improved risk profile in Latin America and reduced uncertainties resulting from the completion of credit-related integration activities for FleetBoston also contributed to the negative provision. For more information, see Credit Risk Management beginning on page 49.
Noninterest Expense increased $564 million, or 16 percent. The increase was primarily due to higher Personnel expense as a result of increased performance based incentive compensation, higher processing costs and the FleetBoston Merger.
| Global Capital Markets and Investment BankingOur strategy is to align our resources with sectors where we can deliver value-added financial solutions to our issuer and investor clients. This segment provides a broad range of financial services to large corporate domestic and international clients, financial institutions, and government entities. It also provides significant resources and capabilities to our investor clients providing them with financial solutions as well as allowing greater access to market liquidity and risk management capabilities through various distribution channels. Clients are supported through offices in 27 countries that are divided into three distinct geographic regions: U.S. and Canada; Asia; and Europe, Middle East
and Africa. Our products and services include loan originations, mergers and acquisitions advisory, debt and equity underwriting, distribution and trading, cash management, derivatives, foreign exchange, leveraged finance, structured finance and trade services. During the third quarter of 2005, our operations in Mexico were realigned and are now included in the results ofGlobal Business and FinancialAdvisory Services, rather thanGlobal Capital Markets and Investment Banking. Also during the third quarter of 2005, we announced the future combination ofGlobal Business and Financial Services andGlobal Capital Markets and Investment Banking that was effective on January 1, 2006. This new segment is calledGlobal Corporate and Investment Banking.
During the fourth quarter of 2004, we announced a strategic initiative to invest approximately $675 million inGlobal Capital Markets and Investment Banking to expand on opportunities in the business’s platform. These investments were primarily focused on expanding our fixed income activities with both the issuer and investor client sectors. As of December 31, 2005, approximately 80 percent of this investment had been invested on personnel, technology and other infrastructure costs, which are all in various phases of execution. We remain committed to the build out of this business and believe that in time we will be well-positioned in the markets where we choose to compete.
This segment offers clients a comprehensive range of global capabilities through the following three financial services:Global Investment Banking, Global Credit Products andGlobal Treasury Services.
Global Investment Banking is comprised ofCorporate and Investment Banking, andGlobal Capital Markets.Global Investment Banking underwrites and makes markets in equity and equity-linked securities, high-grade and high-yield corporate debt securities, commercial paper, and mortgage-backed and asset-backed securities. We also provide debt and equity securities research, loan syndications, mergers and acquisitions advisory services, and private placements. Further, we provide risk management solutions for customers using interest rate, equity, credit and commodity derivatives, foreign exchange, fixed income and mortgage-related products. In support of these activities, the businesses may take positions in these products and participate in market-making activities. TheGlobal Investment Banking business is a primary dealer in the U.S. and in several international locations.
Global Credit Products provides credit and lending services for our corporate clients and institutional investors.Global Credit Products is also responsible for actively managing loan and counterparty risk in our large corporate portfolio using risk mitigation techniques including credit default swaps (CDS).
Global Treasury Services provides the technology, strategies and integrated solutions to help financial institutions, government agencies and corporate clients manage their cash flows. For additional information onGlobal Treasury Services, seeGlobal Business and Financial Services on page 34.
Global Capital Markets and Investment Banking
| | | | | | | | | | (Dollars in millions) | | 2005
| | | 2004
| | Net interest income (FTE basis): | | | | | | | | | Core net interest income | | $ | 1,854 | | | $ | 2,019 | | Trading-related net interest income | | | 1,444 | | | | 2,039 | | | | |
|
|
| |
|
|
| Total net interest income | | | 3,298 | | | | 4,058 | | | | |
|
|
| |
|
|
| Noninterest income: | | | | | | | | | Service charges | | | 1,146 | | | | 1,287 | | Investment and brokerage services | | | 806 | | | | 705 | | Investment banking income | | | 1,749 | | | | 1,783 | | Trading account profits | | | 1,664 | | | | 1,023 | | All other income | | | 346 | | | | 190 | | | | |
|
|
| |
|
|
| Total noninterest income | | | 5,711 | | | | 4,988 | | | | |
|
|
| |
|
|
| Total revenue (FTE basis) | | | 9,009 | | | | 9,046 | | Provision for credit losses | | | (244 | ) | | | (445 | ) | Gains (losses) on sales of debt securities | | | 117 | | | | (10 | ) | Noninterest expense | | | 6,678 | | | | 6,581 | | | | |
|
|
| |
|
|
| Income before income taxes | | | 2,692 | | | | 2,900 | | Income tax expense | | | 956 | | | | 976 | | | | |
|
|
| |
|
|
| Net income | | $ | 1,736 | | | $ | 1,924 | | | | |
|
|
| |
|
|
| Shareholder value added | | $ | 642 | | | $ | 873 | | Net interest yield (FTE basis) | | | 0.92 | % | | | 1.47 | % | Return on average equity | | | 16.73 | | | | 19.34 | | Efficiency ratio (FTE basis) | | | 74.13 | | | | 72.76 | | Average: | | | | | | | | | Total loans and leases | | $ | 34,353 | | | $ | 33,891 | | Trading-related earning assets | | | 299,374 | | | | 227,230 | | Total assets | | | 410,979 | | | | 321,743 | | Total deposits | | | 84,979 | | | | 74,738 | | Common equity/Allocated equity | | | 10,372 | | | | 9,946 | | Period end: | | | | | | | | | Total loans and leases | | | 40,213 | | | | 33,387 | | Trading-related earning assets | | | 282,456 | | | | 189,596 | | Total assets | | | 395,900 | | | | 303,897 | | Total deposits | | | 86,144 | | | | 76,986 | |
Net Interest Income declined $760 million, or 19 percent, in 2005. Driving the decrease was lower trading-related Net Interest Income of $595 million, or 29 percent. Despite the growth in average trading-related earning assets of $70.9 billion, or 33 percent, the contribution to Net Interest Income decreased due to a flattening yield curve. In 2005, core net interest income decreased $165 million to $1.9 billion primarily due to spread compression. Average Deposits increased $10.2 billion, or 14 percent, due to higher foreign deposits and escrow balances.
Noninterest Income increased $723 million, or 14 percent, in 2005. Driving the increase were higher Trading Account Profits of $641 million, Equity Investment Gains (included in all other income) of $123 million and Investment and Brokerage Services of $101 million. The increase in Trading Account Profits was due to growth in average trading-related earning assets as a result of increased client activity as we continued to invest in the business. These increases were partially offset by declines in Service Charges of $141 million due to effects of rising earnings credits on balances required for services and lower Investment Banking Income of $34 million.
Provision for Credit Losses increased $201 million to negative $244 million in 2005, compared to negative $445 million in 2004, driven by a slower rate of improvement in commercial credit quality. Net charge-offs declined $245 million from the prior year, driven partially by increased recoveries. For more information, see Credit Risk Management beginning on page 49.
Noninterest Expense remained relatively unchanged in 2005. Other general operating expense decreased primarily due to the segment’s share of the mutual fund settlement and other litigation reserves recorded in 2004. This decrease was offset by higher Personnel expense, including costs associated with the strategic initiative.
Trading-related revenue and equity commissions, both key measures reviewed by management, are presented in the following table.
Trading-related Revenue and Equity Commissions
| | | | | | | | | (Dollars in millions) | | 2005
| | 2004
| | Trading-related net interest income(1) | | $ | 1,444 | | $ | 2,039 | | Trading account profits(2) | | | 1,664 | | | 1,023 | | | | |
|
| |
|
|
| Total trading-related revenue(2) | | | 3,108 | | | 3,062 | | Equity commissions(1,3) | | | 794 | | | 667 | | | | |
|
| |
|
|
| Total trading-related revenue and equity commissions | | $ | 3,902 | | $ | 3,729 | | | | |
|
| |
|
|
| | | | Trading-related Revenue by Product and Equity Commissions | | | | | | | | Fixed income | | $ | 1,054 | | $ | 1,547 | | Interest rate(1) | | | 767 | | | 667 | | Foreign exchange | | | 744 | | | 752 | | Equities and equity commissions(1) | | | 1,201 | | | 862 | | Commodities | | | 87 | | | 45 | | | | |
|
| |
|
|
| Market-based trading-related revenue and equity commissions | | | 3,853 | | | 3,873 | | Credit portfolio hedges(4) | | | 49 | | | (144 | ) | | | |
|
| |
|
|
| Total trading-related revenue and equity commissions(2) | | $ | 3,902 | | $ | 3,729 | | | | |
|
| |
|
|
|
(2) | | Total corporate Trading Account Profits were $1,812 million and $869 million in 2005 and 2004. Totalcorporate trading-related revenue was $3,256 million and $2,908 million in 2005 and 2004. |
(3) | | Equity commissions are included in Investment and Brokerage Services in the Consolidated Statement of Income. |
(4) | | Includes CDS and related products used for credit risk management. For additional information on CDS, seeConcentrations of Commercial Credit Risk beginning on page 53. |
Capital Markets and Advisory Services provides products, advisory services and financing globally to our institutional investor clients in support of their investing and trading activities. We also work with our commercial and corporate issuer clients to provide debt and equity underwriting and distribution capabilities, merger-related advisory services and risk management solutions using interest rate, equity, credit and commodity derivatives, foreign exchange, fixed income and mortgage-related products. In support of these activities, the business may take positions in these products and participate in market-making activities dealing in government securities, equity and equity-linked securities, high-grade and high-yield corporate debt securities, commercial paper, and mortgage-backed and asset-backed securities. Underwriting debt and equity, securities research and certain market-based activities are executed throughBanc of America Securities, LLC which is a primary dealer in the U.S. and several other countries. Capital Markets and Advisory Servicesmarket-based revenue includes Net Interest Income, Noninterest Income, including equity income, and Gains (Losses) on Sales of Debt Securities. We evaluate our trading results and strategies based on market-based revenue. The following table presents further detail regarding market-based revenue. Sales and trading revenue is segregated into fixed income from liquid products (primarily interest rate and commodity derivatives, foreign exchange contracts and public finance), credit products (primarily investment and noninvestment grade corporate debt obligations and credit derivatives), and structured products (primarily commercial mortgage-backed securities, residential mortgage-backed securities, and collateralized debt obligations), and equity income from equity-linked derivatives and cash equity activity. | | | | | | | | (Dollars in millions) | | 2006 | | 2005 | Investment banking income | | | | | | | Advisory fees | | $ | 338 | | $ | 295 | Debt underwriting | | | 1,822 | | | 1,323 | Equity underwriting | | | 316 | | | 273 | Total investment banking income | | | 2,476 | | | 1,891 | Sales and trading | | | | | | | Fixed income: | | | | | | | Liquid products | | | 2,021 | | | 1,890 | Credit products | | | 825 | | | 634 | Structured products | | | 1,449 | | | 1,033 | Total fixed income | | | 4,295 | | | 3,557 | Equity income | | | 1,451 | | | 1,370 | Total sales and trading(1) | | | 5,746 | | | 4,927 | Total Capital Markets and Advisory Services market-based revenue(1) | | $ | 8,222 | | $ | 6,818 |
In 2005, market-based trading-related revenue was $3.9 billion, relatively unchanged from the prior year. Fixed income revenue decreased $493(1)
| Includes Gains on Sales of Debt Securities of $22 million due to increased spread volatility in certain industries and lack of investor demand. Offsetting this decline were increases in equities$55 million for 2006 and equity commissions, interest rate-related revenues and commodities. Trading-related revenue from equities and equity commissions increased $339 million due to higher customer activity and the absence of net losses on a stock position that occurred in 2004. Interest rate-related revenues increased $100 million primarily related to higher sales activity. In 2005, commodities revenue increased $42 million as the prior year included losses related to positions in gas and jet fuel.2005. |
Net Income increased $345 million, or 26 percent, market-based revenue increased $1.4 billion, or 21 percent, driven primarily by increased sales and trading fixed income activity of $738 million, or 21 percent, due to a favorable market environment as well as benefits from previous investments in personnel and trading infrastructure. Market-based revenue also benefited from an increase in Investment Banking Income of $585 million, or 31 percent, primarily driven by increased market activity and continued strength in debt underwriting. Noninterest Expense increased $770 million, or 16 percent, due to higher Personnel expense, including performance-based incentive compensation, and Other General Operating costs. Total trading-related revenue and equity commissions included net gains of $49 million associated with credit portfolio hedges, an improvement of $193 million from 2004. The improvement was primarily due to widening of spreads on CDS in certain industries.
Treasury Services provides integrated working capital management and treasury solutions to clients worldwide through our network of proprietary offices and special clearing arrangements. Our clients include multinationals, middle-market companies, correspondent banks, commercial real estate firms and governments. Our products and services include treasury management, trade finance, foreign exchange, short-term credit facilities and short-term investing options. Net Interest Income is derived from interest and noninterest-bearing deposits, sweep investments, and other liability management products. Deposit products provide a relatively stable source of funding and liquidity. We earn net interest spread revenues from investing this liquidity in earning assets through client facing lending activity and our ALM activities. The revenue is attributed to the deposit products using our funds transfer pricing process which takes into account the interest rates and maturity characteristics of the deposits. Noninterest Income is generated from payment and receipt products, merchant services, wholesale card products, and trade services and is comprised primarily of service charges which are net of market-based earnings credit rates applied against noninterest-bearing deposits. Net Income increased $337 million, or 18 percent, primarily due to an increase in Net Interest Income, higher Service Charges and all other income, partially offset by increased Noninterest Expense. Net Interest Income fromTreasury Services increased $505 million, or 15 percent, driven primarily by wider spreads associated with higher short-term interest rates as we effectively managed pricing in a rising interest rate environment. This was partially offset by the impact of a four percent decrease inTreasury Services average deposit balances driven primarily by the slowdown in the mortgage and title business reducing real estate escrow and demand deposit balances. Service Charges and wholesale card products increased seven percent and 14 percent benefiting from increased client penetration and both market and product expansion. Noninterest Expense increased $99 million, or three percent, due to higher Personnel expense and Other General Operating costs. The following table presents the detail of Investment Banking Income within the segment.
Investment Banking Income
| | | | | | | | (Dollars in millions) | | 2005
| | 2004
| Securities underwriting | | $ | 787 | | $ | 920 | Syndications | | | 528 | | | 521 | Advisory services | | | 409 | | | 310 | Other | | | 25 | | | 32 | | | |
|
| |
|
| Total investment banking income(1) | | $ | 1,749 | | $ | 1,783 | | | |
|
| |
|
|
| (1) | | Investment Banking Income recorded in other business units in 2005 and 2004 was $107 million and $103 million. |
Investment Banking Income decreased $34 million, or two percent, in 2005. The decrease was due primarily to a decline in securities underwriting as the overall market contracted and private placement activity declined. This decline was partially offset by market share gains in certain debt issuance markets and higher advisory services income due to increased merger and advisory activity.
ALM/Other |
ALM/Otheris comprised primarily of our Latin American operations in Brazil, Chile, Argentina and Uruguay, and our commercial operations in Mexico, as well as our Asia Commercial Banking business. These operations primarily service indigenous and multinational corporations, small businesses and affluent consumers. Brazilian operations were included through September 1, 2006, and the Asia Commercial Banking business was included through December 29, 2006, the effective dates of the sales of these operations.ALM/Other also includes an allocation of a portion of the Corporation’s Net Interest Income from ALM activities. For more information on our Latin American and Asian operations, see Foreign Portfolio beginning on page 65. Net Income increased $91 million, or 15 percent, which included the $720 million gain (pre-tax) recorded on the sale of our Brazilian operations. The Corporation sold its operations in exchange for approximately $1.9 billion in equity of Banco Itaú, Brazil’s second largest nongovernment-owned banking company. The $1.9 billion equity investment in Banco Itaú is recorded in Other Assets in Strategic Investments. For more information on our Strategic Investments, seeAll Other beginning on page 41. The Corporation also completed the sale of its Asia Commercial Banking business to CCB for cash resulting in a $165 million gain (pre-tax) that was recorded in all other income. Partially offsetting these increases was a decrease in Net Interest Income of $461 million driven by the impact of ALM activities and the impact of the sale of our Brazilian operations in the third quarter of 2006. The Provision for Credit losses was negative $21 million, compared to negative $327 million in 2005. The change in the Provision for Credit Losses was driven by the benefits from the release of reserves in 2005 related to an improved risk profile in Latin America. Gains on Sales of Debt Securities decreased $128 million to $18 million in 2006. Noninterest expense decreased $147 million, or 12 percent, primarily driven by lower expenses after the sale of our Brazilian operations in the third quarter of 2006. In December 2005, we entered into a definitive agreement with a consortium led by Johannesburg-based Standard Bank Group Limited for the sale of our assets and the assumption of liabilities in Argentina. This transaction is expected to close in early 2007. In August, 2006, we announced a definitive agreement to sell our operations in Chile and Uruguay for equity in Banco Itaú and other consideration totaling approximately $615 million. These transactions are expected to close in early 2007. | | Global Wealth and Investment Management |
| | | | | | | | | | | | | | | | | | | | | | | | 2006 | | | (Dollars in millions) | | Total | | | Private
Bank | | | Columbia
Management | | | Premier
Banking and
Investments | | | ALM/
Other | | Net interest income(1) | | $ | 3,881 | | | $ | 1,000 | | | $ | (37 | ) | | $ | 2,000 | | | $ | 918 | | Noninterest income | | | | | | | | | | | | | | | | | | | | | Investment and brokerage services | | | 3,449 | | | | 1,014 | | | | 1,532 | | | | 752 | | | | 151 | | All other income | | | 449 | | | | 84 | | | | 43 | | | | 126 | | | | 196 | | Total noninterest income | | | 3,898 | | | | 1,098 | | | | 1,575 | | | | 878 | | | | 347 | | Total revenue(1) | | | 7,779 | | | | 2,098 | | | | 1,538 | | | | 2,878 | | | | 1,265 | | | | | | | | Provision for credit losses | | | (40 | ) | | | (52 | ) | | | — | | | | 13 | | | | (1 | ) | Noninterest expense | | | 4,005 | | | | 1,273 | | | | 1,007 | | | | 1,361 | | | | 364 | | Income before income taxes(1) | | | 3,814 | | | | 877 | | | | 531 | | | | 1,504 | | | | 902 | | Income tax expense | | | 1,411 | | | | 324 | | | | 196 | | | | 556 | | | | 335 | | Net income | | $ | 2,403 | | | $ | 553 | | | $ | 335 | | | $ | 948 | | | $ | 567 | | | | | | | | Shareholder value added | | $ | 1,340 | | | $ | 302 | | | $ | 196 | | | $ | 574 | | | $ | 268 | | Net interest yield(1) | | | 3.29 | % | | | 3.20 | % | | | n/m | | | | 2.93 | % | | | n/m | | Return on average equity | | | 23.20 | | | | 22.46 | | | | 20.66 | % | | | 26.89 | | | | n/m | | Efficiency ratio(1) | | | 51.48 | | | | 60.69 | | | | 65.49 | | | | 47.29 | | | | n/m | | Period end—total assets (2) | | $ | 137,739 | | | $ | 34,047 | | | $ | 3,082 | | | $ | 105,460 | | | | n/m | | | | | | | 2005 | | | (Dollars in millions) | | Total | | | Private
Bank | | | Columbia
Management | | | Premier
Banking and
Investments | | | ALM/
Other | | Net interest income(1) | | $ | 3,820 | | | $ | 1,008 | | | $ | 6 | | | $ | 1,732 | | | $ | 1,074 | | Noninterest income | | | | | | | | | | | | | | | | | | | | | Investment and brokerage services | | | 3,140 | | | | 1,014 | | | | 1,321 | | | | 670 | | | | 135 | | All other income | | | 356 | | | | 65 | | | | 32 | | | | 148 | | | | 111 | | Total noninterest income | | | 3,496 | | | | 1,079 | | | | 1,353 | | | | 818 | | | | 246 | | Total revenue(1) | | | 7,316 | | | | 2,087 | | | | 1,359 | | | | 2,550 | | | | 1,320 | | | | | | | | Provision for credit losses | | | (7 | ) | | | (23 | ) | | | — | | | | 18 | | | | (2 | ) | Noninterest expense | | | 3,710 | | | | 1,237 | | | | 902 | | | | 1,266 | | | | 305 | | Income before income taxes(1) | | | 3,613 | | | | 873 | | | | 457 | | | | 1,266 | | | | 1,017 | | Income tax expense | | | 1,297 | | | | 314 | | | | 165 | | | | 456 | | | | 362 | | Net income | | $ | 2,316 | | | $ | 559 | | | $ | 292 | | | $ | 810 | | | $ | 655 | | | | | | | | Shareholder value added | | $ | 1,263 | | | $ | 337 | | | $ | 142 | | | $ | 461 | | | $ | 323 | | Net interest yield(1) | | | 3.19 | % | | | 3.37 | % | | | n/m | | | | 2.53 | % | | | n/m | | Return on average equity | | | 22.52 | | | | 25.28 | | | | 16.95 | % | | | 24.52 | | | | n/m | | Efficiency ratio(1) | | | 50.72 | | | | 59.27 | | | | 66.37 | | | | 49.65 | | | | n/m | | Period end—total assets (2) | | $ | 129,232 | | | $ | 31,736 | | | $ | 2,686 | | | $ | 102,090 | | | | n/m | |
(1) | Fully taxable-equivalent basis |
(2) | Total Assets include asset allocations to match liabilities (i.e., deposits). |
n/m = not meaningful | | | | | | | | | | | | | | | | December 31 | | Average Balance | | (Dollars in millions) | | 2006 | | 2005 | | 2006 | | 2005 | Total loans and leases | | $ | 66,034 | | $ | 58,380 | | $ | 61,497 | | $ | 54,102 | Total earning assets(1) | | | 129,589 | | | 121,269 | | | 117,916 | | | 119,607 | Total assets(1) | | | 137,739 | | | 129,232 | | | 125,663 | | | 127,394 | Total deposits | | | 125,622 | | | 115,454 | | | 115,071 | | | 117,338 | Allocated equity | | | 11,007 | | | 12,813 | | | 10,358 | | | 10,284 |
(1) | Total earning assets and Total Assets include asset allocations to match liabilities (i.e., deposits). |
Global Wealth and Investment Management provides a wide offering of customized banking and investment services tailored to meet the changing wealth management goals of our individual and institutional customer base. Our clients have access to a range of services offered through three primary businesses:The Private Bank,Columbia Management (Columbia), andPremier Banking and Investments (PB&I). In addition,ALM/Other includes the impact of Banc of America Specialist, the results of ALM activities and the impact of migrating qualifying affluent customers fromGlobal Consumer and Small Business Banking to ourPB&Icustomer service model. Net Income increased $87 million, or four percent, due to higher Total Revenue partially offset by higher Noninterest Expense. Net Interest Income increased $61 million, or two percent, due to increases in deposit spreads and higher Average Loans and Leases, largely offset by a decline in ALM activities and loan spread compression.Global Wealth and Investment Management also benefited from the migration of deposits fromGlobal Consumer and Small Business Banking. Noninterest Income increased $402 million, or 11 percent, due to increases in Investment and Brokerage Services driven by higher levels of assets under management. Noninterest Income also benefited from nonrecurring items in 2006. Provision for Credit Losses decreased $33 million due to a credit loss recovery in 2006. Noninterest expense increased $295 million, or eight percent, primarily due to increases in Personnel expense driven by the addition of sales associates and revenue generating expenses. Client Assets Client Assets consist of Assets under management, Client brokerage assets, and Assets in Custody. Assets under management generate fees based on a percentage of their market value. They consist largely of mutual funds and separate accounts, which are comprised of taxable and nontaxable money market products, equities, and taxable and nontaxable fixed income securities. Client brokerage assets represent a source of commission revenue and fees for the Corporation. Assets in custody represent trust assets administered for customers. Trust assets encompass a broad range of asset types including real estate, private company ownership interest, personal property and investments. | | | | | | | | | | Client Assets | | December 31 | | | (Dollars in millions) | | 2006 | | | 2005 | | Assets under management | | $ | 542,977 | | | $ | 482,394 | | Client brokerage assets(1) | | | 203,799 | | | | 176,822 | | Assets in custody | | | 100,982 | | | | 94,184 | | Less: Client brokerage assets and Assets in custody included in Assets under management | | | (57,446 | ) | | | (44,931 | ) | Total net client assets | | $ | 790,312 | | | $ | 708,469 | |
(1) | Client brokerage assets include non-discretionary brokerage and fee-based assets. Previously, the Corporation reported Client brokerage assets excluding fee-based assets. The 2005 amounts have been reclassified to reflect this adjustment. |
Assets under management increased $60.6 billion, or 13 percent, and was driven by net inflows in both money market and equity products as well as market appreciation. Client brokerage assets increased by $27.0 billion, or 15 percent, reflecting growth in full service assets from higher broker productivity, as well as growth in self directed assets which benefited from new pricing strategies including $0 Online Equity Trades which were offered beginning in the fourth quarter of 2006. Assets in custody increased $6.7 billion, or seven percent, due to market appreciation partially offset by net outflows. The Private Bank provides integrated wealth management solutions to high net-worth individuals, middle-market institutions and charitable organizations with investable assets greater than $3 million.The Private Bank provides investment, trust and banking services as well as specialty asset management services (oil and gas, real estate, farm and ranch, timberland, private businesses and tax advisory).The Private Bank also provides integrated wealth management solutions to ultra high-net-worth individuals and families with investable assets greater than $50 million through itsFamily Wealth Advisors unit.Family Wealth Advisors provides a higher level of contact, tailored service and wealth management solutions addressing the complex needs of their clients. Net Income decreased $6 million, or one percent, primarily due to increased Noninterest Expense and a decrease in Net Interest Income, partially offset by higher Noninterest Income and a credit loss recovery. The decrease in Net Interest Income of $8 million, or one percent, was primarily attributable to lower average deposit balances as client money flowed to equities, partially offset by wider deposit spreads. The increase in Noninterest Income of $19 million, or two percent, was a result of nonrecurring items. The Provision for Credit Losses decreased $29 million as a result of a credit loss recovery in 2006. The increase in Noninterest Expense of $36 million, or three percent, was driven by higher personnel and other operating costs. In November 2006, the Corporation announced a definitive agreement to acquire U.S. Trust for $3.3 billion in cash. U.S. Trust is one of the largest and most respected U.S. firms which focuses exclusively on managing wealth for high net-worth and ultra high net-worth individuals and families. The acquisition will significantly increase the size and capabilities of the Corporation’s wealth business and position it as one of the largest financial services companies managing private wealth in the U.S. The transaction is expected to close in the third quarter of 2007. | This segment provides tailored investment services to individual and institutional clients in various stages and economic cycles. Our clients are offered specific products and services based on their needs through five major businesses:Columbia Management |
Columbia is an asset management business serving the needs of both institutional clients and individual customers.Columbia provides asset management services, including mutual funds, liquidity strategies and separate accounts.Columbia mutual fund offerings provide a broad array of investment strategies and products including equities, fixed income (taxable and non-taxable) and money market (taxable and non-taxable) funds.Columbia distributes its products and services directly to institutional clients, and distributes to individuals throughThe Private Bank,Family Wealth Advisors, Premier Banking and Investments, and nonproprietary channels including other brokerage firms. Net Income increased $43 million, or 15 percent, primarily as a result of an increase in Investment and Brokerage Services of $211 million, or 16 percent, in 2006. This increase is due to higher assets under management driven by net inflows in money market and equity funds, and market appreciation. Noninterest Expense increased $105 million, or 12 percent, primarily due to higher Personnel costs including revenue-based compensation and other operating costs. | Premier Banking and Investments (PB&I), The Private Bank, Family Wealth Advisors (FWA), Columbia Management Group (Columbia)and Other Services.PB&I
|
Premier Banking and InvestmentsincludesBancClient Assets Client Assets consist of America Investments (BAI), our full-service retailAssets under management, Client brokerage businessassets, and ourPremier Banking channel.PB&I brings personalized bankingAssets in Custody. Assets under management generate fees based on a percentage of their market value. They consist largely of mutual funds and investment expertise through priorityseparate accounts, which are comprised of taxable and nontaxable money market products, equities, and taxable and nontaxable fixed income securities. Client brokerage assets represent a source of commission revenue and fees for the Corporation. Assets in custody represent trust assets administered for customers. Trust assets encompass a broad range of asset types including real estate, private company ownership interest, personal property and investments. | | | | | | | | | | Client Assets | | December 31 | | | (Dollars in millions) | | 2006 | | | 2005 | | Assets under management | | $ | 542,977 | | | $ | 482,394 | | Client brokerage assets(1) | | | 203,799 | | | | 176,822 | | Assets in custody | | | 100,982 | | | | 94,184 | | Less: Client brokerage assets and Assets in custody included in Assets under management | | | (57,446 | ) | | | (44,931 | ) | Total net client assets | | $ | 790,312 | | | $ | 708,469 | |
(1) | Client brokerage assets include non-discretionary brokerage and fee-based assets. Previously, the Corporation reported Client brokerage assets excluding fee-based assets. The 2005 amounts have been reclassified to reflect this adjustment. |
Assets under management increased $60.6 billion, or 13 percent, and was driven by net inflows in both money market and equity products as well as market appreciation. Client brokerage assets increased by $27.0 billion, or 15 percent, reflecting growth in full service with client-dedicated teams.PB&I provides a high-touch client experience through a network of more than 2,100 client managers to our affluent customers with a personal wealth profile that includes investable assets plus a mortgage that exceeds $250,000 or they have at least $100,000 of investable assets.BAI is the third largest bank-owned brokerage companyfrom higher broker productivity, as well as growth in self directed assets which benefited from new pricing strategies including $0 Online Equity Trades which were offered beginning in the U.S. with $151fourth quarter of 2006. Assets in custody increased $6.7 billion, in client assets.BAI serves approximately 1.6 million accounts through a network of approximately 1,895 financial advisors throughout the U.S. or seven percent, due to market appreciation partially offset by net outflows. The Private Bank provides integrated wealth management solutions to high-net-worthhigh net-worth individuals, middle marketmiddle-market institutions and charitable organizations with investable assets greater than $3 million. Services includeThe Private Bank provides investment, trust banking and lendingbanking services as well as specialty asset management services (oil and gas, real estate, farm and ranch, timberland, private businesses and tax advisory). FWA at theThe Private Bank is designedalso provides integrated wealth management solutions to serve the needs of ultra high-net-worth individuals and families. This new businessfamilies with investable assets greater than $50 million through itsFamily Wealth Advisors unit.Family Wealth Advisors provides a higher level of contact, and tailored service and wealth management solutions that addressaddressing the complex needs of clients with investable assets greater than $50 million.FWAtheir clients.
Net Income decreased $6 million, or one percent, primarily due to increased Noninterest Expense and a decrease in Net Interest Income, partially offset by higher Noninterest Income and a credit loss recovery. The decrease in Net Interest Income of $8 million, or one percent, was rolled out duringprimarily attributable to lower average deposit balances as client money flowed to equities, partially offset by wider deposit spreads. The increase in Noninterest Income of $19 million, or two percent, was a result of nonrecurring items. The Provision for Credit Losses decreased $29 million as a result of a credit loss recovery in 2006. The increase in Noninterest Expense of $36 million, or three percent, was driven by higher personnel and other operating costs. In November 2006, the firstCorporation announced a definitive agreement to acquire U.S. Trust for $3.3 billion in cash. U.S. Trust is one of the largest and most respected U.S. firms which focuses exclusively on managing wealth for high net-worth and ultra high net-worth individuals and families. The acquisition will significantly increase the size and capabilities of the Corporation’s wealth business and position it as one of the largest financial services companies managing private wealth in the U.S. The transaction is expected to close in the third quarter of 2005. 2007. Columbia is an asset management organization primarilybusiness serving the needs of both institutional clients and individual customers.Columbia provides asset management services, including mutual funds, liquidity strategies and separate accounts.Columbia also provides mutual funds offeringfund offerings provide a full rangebroad array of investment styles across an array ofstrategies and products including equities, fixed income (taxable and nontaxable)non-taxable) and cash productsmoney market (taxable and nontaxable). In addition to servicing institutional clients,non-taxable) funds.Columbia distributes its products and services directly to institutional clients, and distributes to individuals throughThe Private Bank PB&I, FWA,Family Wealth Advisors, Premier Banking and Investments, and nonproprietary channels including other brokerage firms. Other Services include theInvestment Services Group, which provides products and services from traditional capital markets products to alternative investments andBanc of America Specialist, a New York Stock Exchange market-maker.
Global Wealth and Investment Management
| | | | | | | | | | (Dollars in millions) | | 2005
| | | 2004
| | Net interest income (FTE basis) | | $ | 3,770 | | | $ | 2,869 | | Noninterest income: | | | | | | | | | Investment and brokerage services | | | 3,122 | | | | 2,728 | | All other income | | | 501 | | | | 336 | | | | |
|
|
| |
|
|
| Total noninterest income | | | 3,623 | | | | 3,064 | | | | |
|
|
| |
|
|
| Total revenue (FTE basis) | | | 7,393 | | | | 5,933 | | Provision for credit losses | | | (5 | ) | | | (20 | ) | Noninterest expense | | | 3,672 | | | | 3,431 | | | | |
|
|
| |
|
|
| Income before income taxes | | | 3,726 | | | | 2,522 | | Income tax expense | | | 1,338 | | | | 917 | | | | |
|
|
| |
|
|
| Net income | | $ | 2,388 | | | $ | 1,605 | | | | |
|
|
| |
|
|
| Shareholder value added | | $ | 1,337 | | | $ | 754 | | Net interest yield (FTE basis) | | | 3.21 | % | | | 3.36 | % | Return on average equity | | | 23.34 | | | | 19.35 | | Efficiency ratio (FTE basis) | | | 49.66 | | | | 57.83 | | Average: | | | | | | | | | Total loans and leases | | $ | 54,021 | | | $ | 44,057 | | Total assets | | | 125,289 | | | | 91,889 | | Total deposits | | | 115,301 | | | | 83,053 | | Common equity/Allocated equity | | | 10,232 | | | | 8,296 | | Year end: | | | | | | | | | Total loans and leases | | | 58,277 | | | | 49,783 | | Total assets | | | 127,156 | | | | 122,587 | | Total deposits | | | 113,389 | | | | 111,107 | |
Net Interest Income increased $901$43 million, or 3115 percent, in 2005. Thisprimarily as a result of an increase was due to growth in deposits and loans inPB&I andThe Private Bank. Average Deposits increased $32.2 billion, or 39 percent, in 2005 primarily due to the migration of $28.1 billion of account balances fromGlobal Consumer and Small Business Banking toPB&I, and organic growth inPB&I andThe Private Bank. Average Loans and Leases increased $10.0 billion, or 23 percent, due to higher loan volume inPB&I andThe Private Bank. The secondary driver of the increase in Average Deposits, and Loans and Leases was the impact of the FleetBoston portfolio. Noninterest Income increased $559 million, or 18 percent, in 2005. Noninterest Income consists primarily of Investment and Brokerage Services which represents fees earned on client assets and brokerage commissions. The Investment and Brokerage Services revenueof $211 million, or 16 percent, in 2006. This increase in 2005, compared to 2004, was mainlyis due to the impact of FleetBoston.higher assets under management driven by net inflows in money market and equity funds, and market appreciation. Noninterest Expense increased $105 million, or 12 percent, primarily due to higher Personnel costs including revenue-based compensation and other operating costs.
| | Premier Banking and Investments |
Premier Banking and InvestmentsincludesClient Assets | | | | | | | | | | December 31
| | (Dollars in billions) | | 2005
| | 2004
| Assets under management | | $ | 482.4 | | $ | 451.5 | Client brokerage assets | | | 161.7 | | | 149.9 | Assets in custody | | | 94.2 | | | 107.0 | | | |
|
| |
|
| Total client assets | | $ | 738.3 | | $ | 708.4 | | | |
|
| |
|
|
Total client assets increased $29.9 billion, or four percent, in 2005. This increase was due to the $30.9 billion increase in assetsClient Assets consist of Assets under management, in 2005, which was driven by net inflows primarily in short-term money marketClient brokerage assets, and an increaseAssets in overall market valuations.Custody. Assets under management generate fees based on a percentage of their market value. They consist largely of mutual funds and separate accounts, which are comprised of taxable and nontaxable money market products, equities, and taxable and nontaxable fixed income securities. Client brokerage assets represent a source of commission revenue and fees for the Corporation. Assets in custody represent trust assets administered for customers. Trust assets encompass a broad range of asset types including real estate, private company ownership interest, personal property and investments.
| | | | | | | | | | Client Assets | | December 31 | | | (Dollars in millions) | | 2006 | | | 2005 | | Assets under management | | $ | 542,977 | | | $ | 482,394 | | Client brokerage assets(1) | | | 203,799 | | | | 176,822 | | Assets in custody | | | 100,982 | | | | 94,184 | | Less: Client brokerage assets and Assets in custody included in Assets under management | | | (57,446 | ) | | | (44,931 | ) | Total net client assets | | $ | 790,312 | | | $ | 708,469 | |
(1) | Client brokerage assets include non-discretionary brokerage and fee-based assets. Previously, the Corporation reported Client brokerage assets excluding fee-based assets. The 2005 amounts have been reclassified to reflect this adjustment. |
Assets under management increased $60.6 billion, or 13 percent, and was driven by net inflows in both money market and equity products as well as market appreciation. Client brokerage assets increased by $27.0 billion, or 15 percent, reflecting growth in full service assets from higher broker productivity, as well as growth in self directed assets which benefited from new pricing strategies including $0 Online Equity Trades which were offered beginning in the fourth quarter of 2006. Assets in custody increased $6.7 billion, or seven percent, due to market appreciation partially offset by net outflows. The Private Bank provides integrated wealth management solutions to high net-worth individuals, middle-market institutions and charitable organizations with investable assets greater than $3 million.The Private Bank provides investment, trust and banking services as well as specialty asset management services (oil and gas, real estate, farm and ranch, timberland, private businesses and tax advisory).The Private Bank also provides integrated wealth management solutions to ultra high-net-worth individuals and families with investable assets greater than $50 million through itsFamily Wealth Advisors unit.Family Wealth Advisors provides a higher level of contact, tailored service and wealth management solutions addressing the complex needs of their clients. Net Income decreased $6 million, or one percent, primarily due to increased Noninterest Expense and a decrease in Net Interest Income, partially offset by higher Noninterest Income and a credit loss recovery. The decrease in Net Interest Income of $8 million, or one percent, was primarily attributable to lower average deposit balances as client money flowed to equities, partially offset by wider deposit spreads. The increase in Noninterest Income of $19 million, or two percent, was a result of nonrecurring items. The Provision for Credit Losses decreased $29 million as a result of a credit loss recovery in 2006. The increase in Noninterest Expense of $36 million, or three percent, was driven by higher personnel and other operating costs. In November 2006, the Corporation announced a definitive agreement to acquire U.S. Trust for $3.3 billion in cash. U.S. Trust is one of the largest and most respected U.S. firms which focuses exclusively on managing wealth for high net-worth and ultra high net-worth individuals and families. The acquisition will significantly increase the size and capabilities of the Corporation’s wealth business and position it as one of the largest financial services companies managing private wealth in the U.S. The transaction is expected to close in the third quarter of 2007. Columbia is an asset management business serving the needs of both institutional clients and individual customers.Columbia provides asset management services, including mutual funds, liquidity strategies and separate accounts.Columbia mutual fund offerings provide a broad array of investment strategies and products including equities, fixed income (taxable and non-taxable) and money market (taxable and non-taxable) funds.Columbia distributes its products and services directly to institutional clients, and distributes to individuals throughThe Private Bank,Family Wealth Advisors, Premier Banking and Investments, and nonproprietary channels including other brokerage firms. Net Income increased $43 million, or 15 percent, primarily as a result of an increase in Investment and Brokerage Services of $211 million, or 16 percent, in 2006. This increase is due to higher assets under management driven by net inflows in money market and equity funds, and market appreciation. Noninterest Expense increased $241$105 million, or 12 percent, primarily due to higher Personnel costs including revenue-based compensation and other operating costs. | | Premier Banking and Investments |
Premier Banking and InvestmentsincludesBanc of America Investments, our full-service retail brokerage business and ourPremier Banking channel.PB&Ibrings personalized banking and investment expertise through priority service with client-dedicated teams.PB&I provides a high-touch client experience through a network of approximately 4,400 client advisors to our affluent customers with a personal wealth profile that includes investable assets plus a mortgage that exceeds $500,000 or at least $100,000 of investable assets. Net Income increased $138 million, or 17 percent, primarily due to an increase in Net Interest Income. The increase in Net Interest Income of $268 million, or 15 percent, was primarily driven by higher deposit spreads partially offset by lower average deposit balances. Deposit spreads increased 40 bps to 2.34 percent. Net Interest Income also benefited from higher Average Loans and Leases, mainly residential mortgages and home equity. Noninterest Income increased $60 million, or seven percent, in 2005. The increase was due primarily to increased Personnel expenses driven by higher Investment and Brokerage Services. Noninterest Expense increased $95 million, or eight percent, primarily due to increases in Personnel expense driven by thePB&Iexpansion of Client Managers and Financial Advisors and higher performance-based compensation. We migrate qualifying affluent customers, and their related deposit balances and associated Net Interest Income from theGlobal Consumer and Small Business Banking segment to ourPB&I customer service model. In order to provide a view of organic growth inPB&I,we allocate the Northeast andoriginal migrated deposit balances, including attrition, as well as the impact of FleetBoston. This increase wascorresponding Net Interest Income at original spreads fromPB&I toALM/Other. Net Income decreased $88 million, or 13 percent, primarily due to a decrease in Net Interest Income partially offset by lower other general operating expensesan increase in Noninterest Income. Net Interest Income decreased $156 million driven by a significant reduction from ALM activities, partially offset by higher Net Interest Income on deposits due to the segment’s sharemigration of certain banking relationships fromGlobal Consumer and Small Business Banking. During 2006 and 2005, $10.7 billion and $16.9 billion of average deposit balances were migrated from the mutual fund settlement recordedGlobal Consumer and Small Business Banking segment toGlobal Wealth and Investment Management.The total cumulative average impact of migrated balances was $48.5 billion in 2004.2006 compared to $39.3 billion for 2005. Noninterest Income increased $101 million primarily reflecting nonrecurring items in 2006. All Other
| | | | | | | | | | (Dollars in millions) | | 2006 | | | 2005 | | Net interest income(1) | | $ | 141 | | | $ | (305 | ) | Noninterest income | | | | | | | | | Equity investment gains | | | 2,866 | | | | 1,964 | | All other income | | | (921 | ) | | | (975 | ) | Total noninterest income | | | 1,945 | | | | 989 | | Total revenue(1) | | | 2,086 | | | | 684 | | Provision for credit losses | | | (116 | ) | | | 69 | | Gains (losses) on sales of debt securities | | | (495 | ) | | | 823 | | Merger and restructuring charges (2) | | | 805 | | | | 412 | | All other noninterest expense | | | (41 | ) | | | 302 | | Income before income taxes(1) | | | 943 | | | | 724 | | Income tax expense (benefit) | | | 176 | | | | (20 | ) | Net income | | $ | 767 | | | $ | 744 | | Shareholder value added | | $ | (306 | ) | | $ | (953 | ) |
(1) | Fully taxable-equivalent basis |
(2) | For more information on Merger and Restructuring Charges, see Note 2 of the Consolidated Financial Statements. |
Included inAll Other are ourEquity Investments businesses andOther. Equity Investments includeincludes Principal Investing, Corporate Investments and corporate investments.Strategic Investments. Principal Investing is comprised of a diversified portfolio of investments in privately-held and publicly-traded companies at all stages of their life cycle from start-up to buyout. These investments are made either directly in a company or held through a fund and are accounted for at fair value. See Note 1 of the Consolidated Financial Statements for more information on the accounting for the Principal Investing portfolio. Corporate Investments primarily includes investments includein publicly-traded equity securities and funds and are accounted for as AFS marketable equity securities. Strategic Investments includes the Corporation’s strategic investments such as CCB, Grupo Financiero Santander Serfin (Santander), Banco Itaú and various other investments. The restricted shares of CCB and Banco Itaú are currently carried at cost but, as required by GAAP, will be accounted for as AFS marketable equity securities and carried at fair value with an offset to Accumulated Other Comprehensive Income (OCI) starting one year prior to the lapse of their restrictions. See Note 5 of the Consolidated Financial Statements for more information on our strategic investments. Our investment in Santander is accounted for under the equity method of accounting. Income associated withEquity Investments is recorded in Equity Investment Gains and includes gains (losses) on sales of these equity investments, dividends, and valuations that primarily relate to the Principal Investing portfolio. The following table presents the components ofAll Other’s Equity Investment Gains and a reconciliation to the total consolidated Equity Investment Gains for 2006 and 2005. Components of Equity Investment Gains | | | | | | | | (Dollars in millions) | | 2006 | | 2005 | Principal Investing | | $ | 1,894 | | $ | 1,500 | Corporate and Strategic Investments | | | 972 | | | 464 | Total equity investment gains included in All Other | | | 2,866 | | | 1,964 | Total equity investment gains included in the business segments | | | 323 | | | 248 | Total consolidated equity investment gains | | $ | 3,189 | | $ | 2,212 |
TheOther component ofAll Other includes the residual impact of the allowance for credit losses process,and the cost allocation processes, Merger and Restructuring Charges, intersegment eliminations, and the results of certain consumer finance and commercial lending businesses that are being liquidated.Other also includes certain amounts associated with the ALM process,activities, including the residual impact of funds transfer pricing allocation methodologies, amounts associated with the change in the value of derivatives used as economic hedges of interest rate and foreign exchange rate fluctuations that do not qualify for SFAS 133 hedge accounting treatment, certain gains or losses on sales of whole mortgage loans, and Gains (Losses) on Sales of Debt Securities. The objective of the funds transfer pricing allocation methodology is to neutralize the business segmentsbusinesses from changes in interest rate and foreign exchange fluctuations. Accordingly, for segment reporting purposes, the business segments receivebusinesses received in 2005 the neutralizing benefit to Net Interest Income related to certain of the economic hedges previously mentioned, with the offset recorded inOther. All Other also includes adjustments in Noninterest Income and Income Tax Expense to remove the FTE impact of items (primarily low-income housing tax credits) that have been grossed up within Noninterest Income to a fully taxable equivalent amount in the other segments.
| | | | | | | | | | (Dollars in millions) | | 2005
| | | 2004
(Restated)
| | Net interest income (FTE basis)(1) | | $ | (340 | ) | | $ | (695 | ) | Noninterest income: | | | | | | | | | Equity investment gains | | | 1,646 | | | | 750 | | All other income(1) | | | (821 | ) | | | 241 | | | | |
|
|
| |
|
|
| Total noninterest income | | | 825 | | | | 991 | | | | |
|
|
| |
|
|
| Total revenue (FTE basis) | | | 485 | | | | 296 | | Provision for credit losses | | | 41 | | | | 343 | | Gains on sales of debt securities(1) | | | 823 | | | | 1,617 | | Merger and restructuring charges | | | 412 | | | | 618 | | All other noninterest expense | | | 317 | | | | 229 | | | | |
|
|
| |
|
|
| Income before income taxes | | | 538 | | | | 723 | | Income tax expense (benefit) | | | (85 | ) | | | 120 | | | | |
|
|
| |
|
|
| Net income | | $ | 623 | | | $ | 603 | | | | |
|
|
| |
|
|
| Shareholder value added | | $ | (884 | ) | | $ | (531 | ) |
(1) | | Included in these amounts are impacts related to derivatives designated as economic hedges which do not qualify for SFAS 133 hedge accounting treatment of $(419) million and $(834) million in Net Interest Income and $(256) million and $920 million in Noninterest Income. The impact, including $0 and a loss of $(399) million in Gains on Sales of Debt Securities, totaled $(675) million and $(313) million in 2005 and 2004. For additional information, see Note 1 of the Consolidated Financial Statements. |
Total Revenue forAll Other increased $189$23 million, or three percent, primarily due to $485 million in 2005, primarily driven by an increaseincreases in Equity Investment Gains, Net Interest Income, decreases in 2005. Offsetting thisProvision for Credit Losses, and all other noninterest expense. These changes were largely offset by a decrease in Gains (Losses) on Sales of Debt Securities and an increase in Merger and Restructuring Charges. The increase in Net Interest Income of $446 million is due primarily to the $419 million negative impact to 2005 results retained inAll Other relating to funds transfer pricing that was not allocated to the decline in fair value of derivative instruments which were used as economic hedges of interest and foreign exchange rates as part of the ALM process. Changes in value of these derivative instruments werebusinesses. Equity Investment Gains increased $902 million due to interest rate fluctuations duringfavorable market conditions driving liquidity in the year.Principal Investing portfolio as well as a $341 million gain recorded on the liquidation of a strategic European investment.
Provision for Credit Losses decreased $302$185 million to $41 million ina negative $116 million. In 2005 resulting from changes to components of the formula and other factors effective in 2004, and reduced credit costs in 2005 associated with previously exited businesses. These decreases were offset in part by the establishment of a $50 million reserve for estimated losses associated with Hurricane Katrina.Katrina was established. We did not incur significant losses from Hurricane Katrina and, therefore, released the previously established reserve in 2006. The decrease in Gains (Losses) on Sales of Debt Securities decreased $794 million primarily due to lower gains realized in 2005of $1.3 billion resulted from a loss on the sale of mortgage-backed securities, and corporate bonds thanwhich was driven by a decision to hold a lower level of investments in 2004. Securitiessecurities relative to loans (see “Interest Rate Risk Management – Securities” on page 77 for further discussion), compared with gains arerecorded on the resultsales of the repositioning of themortgage-backed securities portfolio to manage interest rate fluctuations and mortgage prepayment risk. The Corporation utilized a forward purchase agreement to hedge the variability of cash flows from the anticipated purchase of securities. The Corporation subsequently sold the related securities and did not originally reclassify the loss from Accumulated OCI at the time the related securities were sold. in 2005. Merger and Restructuring Charges decreased $206were $805 million in 2006 compared to $412 million in 2005. The charge in 2006 was due to the MBNA merger whereas the 2005 ascharge was primarily related to the FleetBoston integration is nearing completion and the infrastructure initiative was completed in the first quarter of 2005. For more information on Merger and Restructuring Charges, seemerger. See Note 2 of the Consolidated Financial Statements.Statements for further information associated with the MBNA merger. The decline in all other noninterest expense of $343 million is due to decreases in unallocated residual general operating expenses. The Income Tax Expense (Benefit) was a benefit of $85$176 million in 2005,2006 compared to an expense of $120$(20) million in 2004. The2005. This change in Income Tax Expense (Benefit) was driven by an increaseboth a $175 million cumulative tax charge in 2006 resulting from the change in tax benefits for low-income housing credits. These tax benefits are allocated toGlobal Consumer and Small Business Banking as FTE Noninterest Income through our segment reporting process.All Other includes an offset to this FTE impact.
Equity Investments
Equity Investments reported Net Income of $796 million in 2005, a $594 million improvement compared to 2004. The improvements were primarily due to higher revenues in Principal Investing driven by increasing liquidity in the private equity markets. When comparedlegislation relating to the prior year, Principal Investing revenue increased $966 million to $1.4 billion. The increased revenues were drivenextraterritorial income and foreign sales corporation regimes and by higher realized gains and reduced impairments compared to the prior year.pre-tax income.
The following table presents the carrying value of equity investments in the Principal Investing portfolio by major industry at December 31, 2005 and 2004:
| | Off- and On-Balance Sheet Financing Entities |
Equity Investments in the Principal Investing Portfolio
| | | | | | | | | | December 31
| | (Dollars in millions) | | 2005
| | 2004
| Consumer discretionary | | $ | 1,607 | | $ | 2,058 | Information technology | | | 1,131 | | | 1,089 | Industrials | | | 1,017 | | | 1,118 | Telecommunication services | | | 708 | | | 769 | Financials | | | 632 | | | 606 | Healthcare | | | 560 | | | 576 | Materials | | | 288 | | | 421 | Consumer staples | | | 213 | | | 230 | Real estate | | | 188 | | | 229 | Energy | | | 56 | | | 81 | Individual trusts, nonprofits, government | | | 43 | | | 49 | Utilities | | | 19 | | | 24 | | | |
|
| |
|
| Total | | $ | 6,462 | | $ | 7,250 | | | |
|
| |
|
|
On- and Off-balance Sheet Financing Entities
Off-balance Sheet Commercial Paper Conduits
| | Off-Balance Sheet Commercial Paper Conduits |
In addition to traditional lending, we also support our customers’ financing needs by facilitating their access to the commercial paper markets. These markets provide an attractive, lower-cost financing alternative for our customers. Our customers sell or otherwise transfer assets, such as high-grade trade or other receivables or leases, to a commercial paper financing entity, which in turn issues high-grade short-term commercial paper that is collateralized by the underlying assets. Additionally, some customers receive the benefit of commercial paper financing rates related to certain lease arrangements. We facilitate these transactions and collect fees from the financing entity for the services it provides including administration, trust services and marketing the commercial paper. We receive fees for providing combinations of liquidity and standby letters of credit (SBLCs) or similar loss protection commitments and derivatives to the commercial paper financing entities. These forms of asset support are senior to the first layer of asset support provided by customers through over-collateralization or by support provided by third parties. The rating agencies require that a certain percentage of the commercial paper entity’s assets be supported by the seller’s over-collateralization and our SBLC in order to receive their respective investment rating. The SBLC would be drawn on only when the over-collateralization provided by the seller is not sufficient to cover losses of the related asset. Liquidity commitments made to the commercial paper entity are designed to fund scheduled redemptions of commercial paper if there is a market disruption or the new commercial paper cannot be issued to fund the redemption of the maturing commercial paper. The liquidity facility has the same legal priority as the commercial paper. We do not enter into any other form of guarantee with these entities. We manage our credit risk on these commitments by subjecting them to our normal underwriting and risk management processes. At December 31, 20052006 and 2004,2005, we had off-balance sheet liquidity commitments and SBLCs to these entities of $25.9$36.7 billion and $23.8$25.9 billion. Substantially all of these liquidity commitments and SBLCs mature within one year. These amounts are included in Table 6.9. Net revenues earned from fees associated with these off-balance sheet financing entities were approximately $71$91 million and $80$72 million in 20052006 and 2004. 2005. From time to time, we may purchase some of the commercial paper issued by certain of these entities for our own account or acting as a dealer on behalf of third parties. Derivative instruments related to these entities are marked to market through the Consolidated Statement of Income. SBLCs are initially recorded at fair value in accordance with Financial Accounting Standards Board (FASB) Interpretation No. 45, “Guarantor’s Accounting and Disclosure Requirements for Guarantees” (FIN 45). Liquidity commitments and SBLCs subsequent to inception are accounted for pursuant to SFAS No. 5, “Accounting for Contingencies” (SFAS 5), and are discussed further in Note 13 of the Consolidated Financial Statements. The commercial paper conduits are variable interest entities (VIEs) as defined in FASB Interpretation No. 46 (Revised December 2003), “Consolidation of Variable Interest Entities, an interpretation of ARB No. 51” (FIN 46R), which provides a framework for identifying VIEs and determining when a company should include the assets, liabilities, non-controlling interests and results of activities of a VIE in its consolidated financial statements. In accordance with FIN 46R, the primary beneficiary is the party that consolidates a VIE based on its assessment that it will absorb a majority of the expected losses or expected residual returns of the entity, or both. We have determined that we are not the primary beneficiary of the commercial paper conduits described above and, therefore, have not included the assets and liabilities or results of operations of these conduits in the Consolidated Financial Statements of the Corporation. On-balance Sheet Commercial Paper Conduits
| | On-Balance Sheet Commercial Paper Conduits |
In addition to the off-balance sheet financing entities previously described, we also utilize commercial paper conduits that have been consolidated based on our determination that we are the primary beneficiary of the entities in accordance with FIN 46R. At December 31, 20052006 and 2004,2005, the consolidated assets and liabilities of these conduits were reflected in AFS Securities, Other Assets, and Commercial Paper and Other Short-term Borrowings inGlobal Capital MarketsCorporate and Investment Banking. At December 31, 20052006 and 2004,2005, we held $6.6$10.5 billion and $7.7$6.6 billion of assets of these entities while our maximum loss exposure associated with these entities, including unfunded lending commitments, was approximately $8.0$12.9 billion and $9.4$8.3 billion. We manage our credit risk on the on-balance sheet commitments by subjecting them to the same processes as the off-balance sheet commitments. | | Commercial Paper Qualified Special Purpose Entities |
Qualified Special Purpose Entities
In addition, to controlTo manage our capital position and diversify funding sources, and provide customers with commercial paper investments, we will, from time to time, sell assets to off-balance sheet entities that obtain financing by issuing commercial paper entities. The commercial paperor notes with similar repricing characteristics to investors. These entities are Qualified Special Purpose Entities (QSPEs) that have been isolated beyond our reach or that of our creditors, even in the event of bankruptcy or other receivership. The accounting for these entities is governed by SFAS 140, “Accounting for Transfers and Servicing of Financial Assets and Extinguishments of Liabilities—a replacement of FASB Statement No. 125,” (SFAS 140) which provides that QSPEs are not included in the consolidated financial statements of the seller. Assets sold to the entities consist of high-grade corporate or municipal bonds, collateralized debt obligations and asset-backed securities. These entities issue collateralized commercial paper or notes with similar repricing characteristics to third party market participants and enter into passive derivative instruments towith us. Assets sold to thethese entities typically have an investment rating ranging from Aaa/AAA to Aa/AA. We may provide liquidity, SBLCs or similar loss protection commitments to the entity,these entities, or we may enter into derivatives with the entitythese entities in which we assume certain risks. The liquidity facility and derivatives have the same legal standing with the commercial paper.
The derivatives provide interest rate, currency and a pre-specified amount of credit protection to the entity in exchange for the commercial paper rate. These derivatives are provided for in the legal documents and help to alleviate any cash flow mismatches. In some cases, if an asset’s rating declines below a certain investment quality as evidenced by its investment rating or defaults, we are no longer exposed to the risk of loss. At that time, the commercial paper holders assume the risk of loss. In other cases, we agree to assume all of the credit exposure related to the referenced asset. Legal documents for each entity specify asset quality levels that require the entity to automatically dispose of the asset once the asset falls below the specified quality rating. At the time the asset is disposed, we are required to reimburse the entity for any credit-related losses depending on the pre-specified level of protection provided. We manage any credit or market risk on commitments or derivatives through normal underwriting and risk management processes. At December 31, 20052006 and 2004,2005, we had off-balance sheet liquidity commitments, SBLCs and other financial guarantees to these entities of $7.6 billion and $7.1 billion, for which we received fees of $9 million and $7.4 billion.$10 million for 2006 and 2005. Substantially all of these commitments mature within one year and are included in Table 6.9. Derivative activity related to these entities is included in Note 54 of the Consolidated Financial Statements. Net revenues earned from fees associated with these entities were $86 million and $61 million in 2005 and 2004. We generally do not purchase any of the commercial paper issued by these types of financing entities other than during the underwriting process when we act as issuing agent nor do we purchase any of the commercial paper for our own account. Derivative instruments related to these entities are marked to market through the Consolidated Statement of Income. SBLCs are initially recorded at fair value in accordance with FIN 45. Liquidity commitments and SBLCs subsequent to inception are accounted for pursuant to SFAS 5 and are discussed further in Note 13 of the Consolidated Financial Statements. In addition, as a result of the MBNA merger on January 1, 2006, the Corporation acquired interests in off-balance sheet credit card securitization vehicles which issue both commercial paper and medium-term notes. We hold subordinated interests issued by these entities, which are QSPEs, but do not otherwise provide liquidity or other forms of loss protection to these vehicles. For additional information on credit card securitizations, see Note 9 of the Consolidated Financial Statements. | | Credit and Liquidity Risks |
Because we provide liquidity and credit support to the commercial paper conduits and QSPEs described above, our credit ratings and changes thereto will affect the borrowing cost and liquidity of these entities. In addition, significant changes in counterparty asset valuation and credit standing may also affect the liquidity of the commercial paper issuance. Disruption in the commercial paper markets may result in our credit ratings and changes thereto will affect the borrowing cost and liquidity of these entities. In addition, significant changes in counterparty asset valuation and credit standing may also affect the liquidity of the commercial paper issuance. Disruption in the commercial paper markets may result in the Corporation having to fund under these commitments and SBLCs discussed above. We seek to manage these risks, along with all other credit and liquidity risks, within our policies and practices. See Notes 1 and 9 of the Consolidated Financial Statements for additional discussion of off-balance sheet financing entities. | Other Off-balanceOff-Balance Sheet Financing EntitiesTo improve our capital position and diversify funding sources, we also sell assets, primarily loans, to other off-balance sheet QSPEs that obtain financing primarily by issuing term notes. We may retain a portion of the investment grade notes issued by these entities, and we may also retain subordinated interests in the entities which reduce the credit risk of the senior investors. We may provide liquidity support in the form of foreign exchange or interest rate swaps. We generally do not provide other forms of credit support to these entities, which are described more fully in Note 9 of the Consolidated Financial Statements. In addition to the above, we had significant involvement with variable interest entities (VIEs)
|
To improve our capital position and diversify funding sources, we also sell assets, primarily loans, to other off-balance sheet QSPEs that obtain financing primarily by issuing term notes. We may retain a portion of the investment grade notes issued by these entities, and we may also retain subordinated interests in the entities which reduce the credit risk of the senior investors. We may provide liquidity support in the form of foreign exchange or interest rate swaps.We generally do not provide other forms of credit support to these entities, which are described more fully in Note 9 of the Consolidated Financial Statements. In addition to the above, we had significant involvement with VIEs other than the commercial paper conduits. These VIEs were not consolidated because we will not absorb a majority of the expected losses or expected residual returns and are therefore not the primary beneficiary of the VIEs. These entities are described more fully in Note 9 of the Consolidated Financial Statements. | | Obligations and Commitments |
We have contractual obligations to make future payments on debt and lease agreements. Additionally, in the normal course of business, we enter into contractual arrangements whereby we commit to future purchases of products or services from unaffiliated parties. Obligations that are legally binding agreements whereby we agree to purchase products or services with a specific minimum quantity defined at a fixed, minimum or variable price over a specified period of time are defined as purchase obligations. Included in purchase obligations are vendor contracts of $6.3 billion, commitments to purchase securities of $9.1 billion and commitments to purchase loans of $43.3 billion. The most significant of our vendor contracts include communication services, processing services and software contracts. Other long-term liabilities include our obligations related to the Qualified Pension Plans, Nonqualified Pension Plans and Postretirement Health and Life Plans (the Plans) as well as amounts accrued for cardholder reward agreements. Obligations to the Plans are based on the current and projected obligations of the Plans, performance of the Plans’ assets and any participant contributions, if applicable. During 2006 and 2005, we contributed $2.6 billion and $1.1 billion to the Plans, and we expect to make at least $192 million of contributions during 2007. Debt, lease and other obligations are more fully discussed in Notes 12 and 13 of the Consolidated Financial Statements. Table 8 presents total long-term debt and other obligations at December 31, 2006. Table 8 Long-term Debt and Other Obligations(1) | | | | | | | | | | | | | | | | | December 31, 2006 | | | | | | | | | | | | | | | | | (Dollars in millions) | | Due in 1 year or
less | | Due after 1 year
through 3 years | | Due after 3
years through 5
years | | Due after 5
years | | Total | Long-term debt and capital leases | | $ | 17,194 | | $ | 44,962 | | $ | 20,799 | | $ | 63,045 | | $ | 146,000 | Purchase obligations(2) | | | 23,918 | | | 22,578 | | | 11,234 | | | 1,005 | | | 58,735 | Operating lease obligations | | | 1,375 | | | 2,410 | | | 1,732 | | | 5,951 | | | 11,468 | Other long-term liabilities | | | 464 | | | 676 | | | 290 | | | 835 | | | 2,265 | Total | | $ | 42,951 | | $ | 70,626 | | $ | 34,055 | | $ | 70,836 | | $ | 218,468 |
(1) | This table does not include the obligations associated with the Corporation’s Deposits. For more information on Deposits, see Note 11 of the Consolidated Financial Statements. |
(2) | Obligations that are legally binding agreements whereby we agree to purchase products or services with a specific minimum quantity defined at a fixed, minimum or variable price over a specified period of time are defined as purchase obligations. Included in purchase obligations are vendor contracts of $4.0 billion, commitments to purchase securities of $34.2 billion and commitments to purchase loans of $51.7 billion. The most significant of our vendor contracts include communication services, processing services and software contracts. Other long-term liabilities include our obligations related to the Qualified Pension Plans, Nonqualified Pension Plans and Postretirement Health and Life Plans (the Plans). Obligations to the Plans are based on the current and projected obligations of the Plans, performance of the Plans’ assets and any participant contributions, if applicable. During 2005 and 2004, we contributed $1.1 billion and $303 million to the Plans, and we expect to make at least $134 million of contributions during 2006. Management believes the effect of the Plans on liquidity is not significant to our overall financial condition. Debt, lease and other obligations are more fully discussed in Notes 12 |
Many of our lending relationships contain funded and unfunded elements. The funded portion is reflected on our balance sheet. The unfunded component of these commitments is not recorded on our balance sheet until a draw is made under the credit facility; however, a reserve is established for probable losses. These commitments, as well as guarantees, are more fully discussed in Note 13 of the Consolidated Financial Statements. The following table summarizes the total unfunded, or off-balance sheet, credit extension commitment amounts by expiration date. At December 31, 2006, charge cards (nonrevolving card lines) to individuals and government entities guaranteed by the U.S. government in the amount of $9.6 billion (related outstandings of $193 million) were not included in credit card line commitments in the table below. Table 9 Credit Extension Commitments | | | | | | | | | | | | | | | | | December 31, 2006 | | | | | | | | | | | | | | | | | (Dollars in millions) | | Expires in 1 year
or less | | Expires after 1
year through 3
years | | Expires after 3
years through
5 years | | Expires after 5
years | | Total | Loan commitments(1) | | $ | 151,604 | | $ | 60,660 | | $ | 90,988 | | $ | 34,953 | | $ | 338,205 | Home equity lines of credit | | | 1,738 | | | 1,801 | | | 2,742 | | | 91,919 | | | 98,200 | Standby letters of credit and financial guarantees | | | 29,213 | | | 10,712 | | | 6,744 | | | 6,337 | | | 53,006 | Commercial letters of credit | | | 3,880 | | | 180 | | | 27 | | | 395 | | | 4,482 | Legally binding commitments | | | 186,435 | | | 73,353 | | | 100,501 | | | 133,604 | | | 493,893 | Credit card lines(2) | | | 840,215 | | | 13,377 | | | — | | | — | | | 853,592 | Total | | $ | 1,026,650 | | $ | 86,730 | | $ | 100,501 | | $ | 133,604 | | $ | 1,347,485 |
Table 5 presents total long-term debt and other obligations(1)
| Included at December 31, 2005.2006, are equity commitments of $2.8 billion related to obligations to further fund equity investments. |
Table 5(2)
| As part of the MBNA merger, on January 1, 2006, the Corporation acquired $588.4 billion of unused credit card lines. Long-term Debt and Other Obligations
| | | | | | | | | | | | | | | | | December 31, 2005 | | | | | | | | | | | | (Dollars in millions) | | Due in
1 year
or less
| | Due after
1 year
through
3 years
| | Due after
3 years
through
5 years
| | Due after
5 years
| | Total
| Long-term debt and capital leases(1) | | $ | 11,188 | | $ | 24,065 | | $ | 20,689 | | $ | 44,906 | | $ | 100,848 | Purchase obligations(2) | | | 44,635 | | | 21,235 | | | 22,989 | | | 1,076 | | | 89,935 | Operating lease obligations | | | 1,324 | | | 2,202 | | | 1,449 | | | 3,477 | | | 8,452 | Other long-term liabilities | | | 134 | | | — | | | — | | | — | | | 134 | | | |
|
| |
|
| |
|
| |
|
| |
|
| Total | | $ | 57,281 | | $ | 47,502 | | $ | 45,127 | | $ | 49,459 | | $ | 199,369 | | | |
|
| |
|
| |
|
| |
|
| |
|
|
(1) | | Includes principal payments and capital lease obligations of $40 million. |
(2) | | Obligations that are legally binding agreements whereby we agree to purchase products or services with a specific minimum quantity defined at a fixed, minimum or variable price over a specified period of time are defined as purchase obligations. |
Many of our lending relationships contain funded and unfunded elements. The funded portion is reflected on our balance sheet. The unfunded component of these commitments is not recorded on our balance sheet until a draw is made under the loan facility; however, a reserve is established for probable losses. These commitments, as well as guarantees, are more fully discussed in Note 13 of the Consolidated Financial Statements.
The following table summarizes the total unfunded, or off-balance sheet, credit extension commitment amounts by expiration date. At December 31, 2005, charge cards (nonrevolving card lines) to individuals and government entities guaranteed by the U.S. government in the amount of $9.4 billion (related outstandings of $171 million) were not included in credit card line commitments in the table below.
| Table 6Managing RiskCredit Extension Commitments
| | | | | | | | | | | | | | | | | December 31, 2005 | | | | | | | | | | | | (Dollars in millions) | | Expires in 1
year or less
| | Expires after 1
year through 3 years
| | Expires after 3
years through 5 years
| | Expires after 5
years
| | Total
| Loan commitments(1) | | $ | 112,829 | | $ | 55,840 | | $ | 80,748 | | $ | 28,340 | | $ | 277,757 | Home equity lines of credit | | | 1,317 | | | 714 | | | 1,673 | | | 74,922 | | | 78,626 | Standby letters of credit and financial guarantees | | | 22,320 | | | 8,661 | | | 5,361 | | | 6,753 | | | 43,095 | Commercial letters of credit | | | 4,627 | | | 29 | | | 17 | | | 481 | | | 5,154 | | | |
|
| |
|
| |
|
| |
|
| |
|
| Legally binding commitments | | | 141,093 | | | 65,244 | | | 87,799 | | | 110,496 | | | 404,632 | Credit card lines | | | 180,694 | | | 12,274 | | | — | | | — | | | 192,968 | | | |
|
| |
|
| |
|
| |
|
| |
|
| Total | | $ | 321,787 | | $ | 77,518 | | $ | 87,799 | | $ | 110,496 | | $ | 597,600 | | | |
|
| |
|
| |
|
| |
|
| |
|
|
(1) | | At December 31, 2005, there were equity commitments of $1.4 billion related to obligations to further fund Principal Investing equity investments. |
Managing Risk
Our management governance structure enables us to manage all major aspects of our business through an integrated planning and review process that includes strategic, financial, associate, customer and risk planning. We derive much of our revenue from managing risk from customer transactions for profit. In addition to qualitative factors, we utilize quantitative measures to optimize risk and reward trade offs in order to achieve growth targets and financial objectives while reducing the variability of earnings and minimizing unexpected losses. Risk metrics that allow us to measure performance include economic capital targets, SVA targets and corporate risk limits. By allocating economic capital to a business unit, we effectively define that unit’s ability to take on risk. Review and approval of business plans incorporates approval of economic capital allocation, and economic capital usage is monitored through financial and risk reporting. Country, trading, asset allocation and other limits supplement the allocation of economic capital. These limits are based on an analysis of risk and reward in each business unit and management is responsible for tracking and reporting performance measurements as well as any exceptions to guidelines or limits. Our risk management process continually evaluates risk and appropriate metrics needed to measure it. Our business exposes us to the following major risks: strategic, liquidity, credit, market and operational. Strategic Risk is the risk that adverse business decisions, ineffective or inappropriate business plans or failure to respond to changes in the competitive environment, business cycles, customer preferences, product obsolescence, execution and/or other intrinsic risks of business will impact our ability to meet our objectives. Liquidity risk is the inability to accommodate liability maturities and deposit withdrawals, fund asset growth and meet contractual obligations through unconstrained access to funding at reasonable market rates. Credit risk is the risk of loss arising from a borrower’s or counterparty’s inability to meet its obligations. Market risk is the risk that values of assets and liabilities or revenues will be adversely affected by changes in market conditions, such as interest rate movements. Operational risk is the risk of loss resulting from inadequate or failed internal processes, people and systems or external events. The following sections, Strategic Risk Management, Liquidity Risk and Capital Management, Credit Risk Management beginning on page 48, Market Risk Management beginning on page 72 and Operational Risk Management beginning on page 80, address in more detail the specific procedures, measures and analyses of the major categories of risk that we manage. Our management governance structure enables us to manage all major aspects of our business through an integrated planning and review process that includes strategic, financial, associate, customer and risk planning. We derive much of our revenue from managing risk from customer transactions for profit. In addition to qualitative factors, we utilize quantitative measures to optimize risk and reward trade offs in order to achieve growth targets and financial objectives while reducing the variability of earnings and minimizing unexpected losses. Risk metrics that allow us to measure performance include economic capital targets, SVA targets and corporate risk limits. By allocating capital to a business unit, we effectively define that unit’s ability to take on risk. Country, trading, asset allocation and other limits supplement the allocation of economic capital. These limits are based on an analysis of risk and reward in each business unit and management is responsible for tracking and reporting performance measurements as well as any exceptions to guidelines or limits. Our risk management process continually evaluates risk and appropriate metrics needed to measure it. Our business exposes us to the following major risks: strategic, liquidity, credit, market and operational.
Strategic Risk is the risk that adverse business decisions, ineffective or inappropriate business plans or failure to respond to changes in the competitive environment, business cycles, customer preferences, product obsolescence, execution and/or other intrinsic risks of business will impact our ability to meet our objectives. Liquidity risk is the inability to accommodate liability maturities and deposit withdrawals, fund asset growth and meet contractual obligations through unconstrained access to funding at reasonable market rates. Credit risk is the risk of loss arising from a borrower’s or counterparty’s inability to meet its obligations. Market risk is the risk that values of assets and liabilities or revenues will be adversely affected by changes in market conditions, such as interest rate movements. Operational risk is the risk of loss resulting from inadequate or failed internal processes, people and systems or external events.
| | Risk Management Processes and Methods We have established control processes and use various methods to align risk-taking and risk management throughout our organization. These control processes and methods are designed around “three lines of defense”: lines of business; support units (including Risk Management, Compliance, Finance, Human Resources and Legal); and Corporate Audit.
Management is responsible for identifying, quantifying, mitigating and managing all risks within their lines of business, while certain enterprise-wide risks are managed centrally. For example, except for trading-related business activities, interest rate risk associated with our business activities is managed in the Corporate Treasury and Corporate Investment functions. Line of business management makes and executes the business plan and is closest to the changing nature of risks and, therefore, we believe is best able to take actions to manage and mitigate those risks. Our lines of business prepare quarterly self-assessment reports to identify the status of risk issues, including mitigation plans, if
appropriate. These reports roll up to executive management to ensure appropriate risk management and oversight, and to identify enterprise-wide issues. Our management processes, structures and policies aid us in complying with laws and regulations and provide clear lines for decision-making and accountability. Wherever practical, we attempt to house decision-making authority as close to the transaction as possible while retaining supervisory control functions from both in and outside of the lines of business.
The Risk Management organization translates approved business plans into approved limits, approves requests for changes to those limits, approves transactions as appropriate, and works closely with lines of business to establish and monitor risk parameters. Risk Management has assigned a Risk Executive to each of the lines of business who is responsible for the oversight of all risks associated with that line of business. In addition, Risk Management has assigned Risk Executives to monitor enterprise-wide credit, market and operational risks.
Corporate Audit provides an independent assessment of our management and internal control systems. Corporate Audit activities are designed to provide reasonable assurance that resources are adequately protected; significant financial, managerial and operating information is materially complete, accurate and reliable; and employees’ actions are in compliance with corporate policies, standards, procedures, and applicable laws and regulations.
We use various methods to manage risks at the line of business levels and corporate-wide. Examples of these methods include planning and forecasting, risk committees and forums, limits, models, and hedging strategies. Planning and forecasting facilitates analysis of actual versus planned results and provides an indication of unanticipated risk levels. Generally, risk committees and forums are comprised of lines of business, risk management, treasury, compliance, legal and finance personnel, among others, who actively monitor performance against plan, limits, potential issues, and introduction of new products. Limits, the amount of exposure that may be taken in a product, relationship, region or industry, seek to align risk goals with those of each line of business and are part of our overall risk management process to help reduce the volatility of market, credit and operational losses. Models are used to estimate market value and net interest income
|
We have established control processes and use various methods to align risk-taking and risk management throughout our organization. These control processes and methods are designed around “three lines of defense”: lines of business; enterprise functions (including Risk Management, Compliance, Finance, Human Resources and Legal); and Corporate Audit. The lines of business are the first line of defense and are responsible for identifying, quantifying, mitigating and managing all risks within their lines of business, while certain enterprise-wide risks are managed centrally. For example, except for trading-related business activities, interest rate risk associated with our business activities is managed in the Corporate Treasury and Corporate Investment functions. Line of business management makes and executes the business plan and is closest to the changing nature of risks and, therefore, we believe is best able to take actions to manage and mitigate those risks. Our lines of business prepare periodic self-assessment reports to identify the status of risk issues, including mitigation plans, if appropriate. These reports roll up to executive management to ensure appropriate risk management and oversight, and to identify enterprise-wide issues. Our management processes, structures and policies aid us in complying with laws and regulations and provide clear lines for decision-making and accountability. Wherever practical, we attempt to house decision-making authority as close to the transaction as possible while retaining supervisory control functions from both in and outside of the lines of business. The key elements of the second line of defense are Risk Management, Compliance, Finance, Global Technology and Operations, Human Resources, and Legal functions. These groups are independent of the lines of businesses and are organized on both a line of business and enterprise-wide basis. For example, for Risk Management, a senior risk executive is assigned to each of the lines of business and is responsible for the oversight of all the risks associated with that line of business. Enterprise-level risk executives have responsibility to develop and implement polices and practices to assess and manage enterprise-wide credit, market and operational risks. Corporate Audit, the third line of defense, provides an independent assessment of our management and internal control systems. Corporate Audit activities are designed to provide reasonable assurance that resources are adequately protected; significant financial, managerial and operating information is materially complete, accurate and reliable; and employees’ actions are in compliance with corporate policies, standards, procedures, and applicable laws and regulations. We use various methods to manage risks at the line of business levels and corporate-wide. Examples of these methods include planning and forecasting, risk committees and forums, limits, models, and hedging strategies. Planning and forecasting facilitates analysis of actual versus planned results and provides an indication of unanticipated risk levels. Generally, risk committees and forums are composed of lines of business, risk management, treasury, compliance, legal and finance personnel, among others, who actively monitor performance against plan, limits, potential issues, and introduction of new products. Limits, the amount of exposure that may be taken in a product, relationship, region or industry, seek to align corporate-wide risk goals with those of each line of business and are part of our overall risk management process to help reduce the volatility of market, credit and operational losses. Models are used to estimate market value and Net Interest Income sensitivity, and to estimate expected and unexpected losses for each product and line of business, where appropriate. Hedging strategies are used to manage the risk of borrower or counterparty concentration risk and to manage market risk in the portfolio. The formal processes used to manage risk represent only one portion of our overall risk management process. Corporate culture and the actions of our associates are also critical to effective risk management. Through our Code of Ethics, we set a high standard for our associates. The Code of Ethics provides a framework for all of our associates to conduct themselves with the highest integrity in the delivery of our products or services to our customers. We instill a risk-conscious culture through communications, training, policies, procedures, and organizational roles and responsibilities. Additionally, we continue to strengthen the linkage between the associate performance management process and individual compensation to encourage associates to work toward corporate-wide risk goals. | | Oversight The Board evaluates risk through the Chief Executive Officer (CEO) and three committees. The Finance Committee, a committee appointed by the Board, establishes policies and strategies for managing the strategic, liquidity, credit, market and operational risks to corporate earnings and capital. The Asset Quality Committee, a Board committee, reviews credit and selected market risks; and the Audit Committee, a Board committee, provides direct oversight of the corporate audit function and the independent registered public accounting firm. Additionally, senior management oversight of our risk-taking and risk management activities is conducted through four senior management committees: the Risk and Capital Committee (RCC), the Asset and Liability Committee (ALCO), the Compliance and Operational Risk Committee (CORC) and the Credit Risk Committee (CRC). The RCC, a senior management committee, reviews corporate strategies and corporate objectives, evaluates business performance, and reviews business plans, including capital allocation, for the Corporation and for major businesses. The ALCO, a subcommittee of the Finance Committee, provides oversight for Corporate Treasury’s and Corporate Investment’s process of managing interest rate risk, otherwise known as the ALM process, and reviews ALM and credit hedging activities. ALCO also approves limits for trading activities and manages the risk of loss of value and related Net Interest Income of our trading activities. The CORC, a subcommittee of the Finance Committee, provides oversight and consistent communication of operational and compliance issues. The CRC, a subcommittee of the Finance Committee, establishes corporate credit practices and limits, including industry and country concentration limits and approval requirements. The CRC also reviews asset quality results versus plan, portfolio management, and the adequacy of the allowance for credit losses. Each committee and subcommittee has the ability to delegate authority to officers of subcommittees to manage specific risks.
Management continues to direct corporate-wide efforts to address the Basel Committee on Banking Supervision’s new risk-based capital standards (Basel II). The Finance Committee and the Audit Committee provide oversight of management’s plans including the Corporation’s preparedness and compliance with Basel II. For additional information, see Basel II on page 49
|
The Board oversees the risk management of the Corporation through its committees, management committees and the Chief Executive Officer. The Board’s Audit Committee monitors (1) the effectiveness of our internal controls, (2) the integrity of our Consolidated Financial Statements and (3) compliance with legal and regulatory requirements. In addition, the Audit Committee oversees the internal audit function and the independent registered public accountant. The Board’s Asset Quality Committee oversees credit risks and related topics that may impact our assets and earnings. The Finance Committee, a management committee, oversees the development and performance of the policies and strategies for managing the strategic, credit, market, and operational risks to our earnings and capital. The Asset Liability Committee (ALCO), a subcommittee of the Finance Committee, oversees our policies and processes designed to assure sound market risk and balance sheet management. The Compliance and Operational Risk Committee, a subcommittee of the Finance Committee, oversees our policies and processes designed to assure sound operational and compliance risk management. The Credit Risk Committee (CRC), a subcommittee of the Finance Committee, oversees and approves our adherence to sound credit risk management policies and practices. Certain CRC approvals are subject to the oversight of the Board’s Asset Quality Committee. The Risk and Capital Committee, a management committee, reviews our corporate strategies and objectives, evaluates business performance, and reviews business plans including economic capital allocations to the Corporation and business lines. Management continues to direct corporate-wide efforts to address the Basel Committee on Banking Supervision’s new risk-based capital standards (Basel II). The Audit Committee and Finance Committee oversee management’s plans to comply with Basel II. For additional information, see Basel II on page 51 and Note 15 of the Consolidated Financial Statements. The following sections,
| | Strategic Risk Management |
We use an integrated planning process to help manage strategic risk. A key component of the planning process aligns strategies, goals, tactics and resources throughout the enterprise. The process begins with the creation of a corporate-wide business plan which incorporates an assessment of the strategic risks. This business plan establishes the corporate strategic direction. The planning process then cascades through the business units, creating business unit plans that are aligned with the Corporation’s strategic direction. At each level, tactics and metrics are identified to measure success in achieving goals and assure adherence to the plans. As part of this process, the business units continuously evaluate the impact of changing market and business conditions, and the overall risk in meeting objectives. See the Operational Risk Management section on page 80 for a further description of this process. Corporate Audit in turn monitors, and independently reviews and evaluates, the plans and measurement processes. One of the key tools we use to manage strategic risk is economic capital allocation. Through the economic capital allocation process, we effectively manage each business unit’s ability to take on risk. Review and approval of business plans incorporates approval of economic capital allocation, and economic capital usage is monitored through financial and risk reporting. Economic capital allocation plans for the business units are incorporated into the Corporation’s operating plan that is approved by the Board on an annual basis. | Liquidity Risk and Capital Management Credit Risk Management beginning on page 49, Market Risk Management beginning on page 65 and Operational Risk Managementbeginning on page 73, address in more detail the specific procedures, measures and analyses of the major categories of risk that we manage.
|
Strategic Risk Management
The Board provides oversight for strategic risk through the CEO and the Finance Committee. We use an integrated business planning process to help manage strategic risk. A key component of the planning process aligns strategies, goals, tactics and resources. The process begins with an assessment that creates a plan for the Corporation, setting the corporate strategic direction. The planning process then cascades through the business units, creating business unit plans that are aligned with the Corporation’s direction. Tactics and metrics are monitored to ensure adherence to the plans. As part of this monitoring, business units perform a quarterly self-assessment further described in the Operational Risk Management section beginning on page 73. This assessment looks at changing market and business conditions, and the overall risk in meeting objectives. Corporate Audit in turn monitors, and independently reviews and evaluates, the plans and self-assessments.
One of the key tools for managing strategic risk is capital allocation. Through allocating capital, we effectively manage each business segment’s ability to take on risk. Review and approval of business plans incorporates approval of capital allocation, and economic capital usage is monitored through financial and risk reporting.
Liquidity Risk and Capital Management
Liquidity is the ongoing ability to accommodate liability maturities and deposit withdrawals, fund asset growth and business operations, and meet contractual obligations through unconstrained access to funding at reasonable market rates. Liquidity management involves forecasting funding requirements and maintaining sufficient capacity to meet the needs and accommodate fluctuations in asset and liability levels due to changes in our business operations or unanticipated events. Sources of liquidity include deposits and other customer-based funding, and wholesale market-based funding. We manage liquidity at two levels. The first is the liquidity of the parent company, which is the holding company that owns the banking and nonbanking subsidiaries. The second is the liquidity of the banking subsidiaries. The management of liquidity at both levels is essential because the parent company and banking subsidiaries each have different funding needs and sources, and each are subject to certain regulatory guidelines and requirements. Through ALCO, the Finance Committee is responsible for establishing our liquidity policy as well as approving operating and contingency procedures, and monitoring liquidity on an ongoing basis. Corporate Treasury is responsible for planning and executing our funding activities and strategy. Liquidity is the ongoing ability to accommodate liability maturities and deposit withdrawals, fund asset growth and business operations, and meet contractual obligations through unconstrained access to funding at reasonable market rates. Liquidity management involves forecasting funding requirements and maintaining sufficient capacity to meet the needs and accommodate fluctuations in asset and liability levels due to changes in our business operations or unanticipated events. Sources of liquidity include deposits and other customer-based funding, wholesale market-based funding, and liquidity provided by the sale or securitization of assets.
We manage liquidity at two levels. The first is the liquidity of the parent company, which is the holding company that owns the banking and nonbanking subsidiaries. The second is the liquidity of the banking subsidiaries. The management of liquidity at both levels is essential because the parent company and banking subsidiaries each have different funding needs and sources, and each are subject to certain regulatory guidelines and requirements. Through ALCO, the Finance Committee is responsible for establishing our liquidity policy as well as approving operating and contingency procedures, and monitoring liquidity on an ongoing basis. Corporate Treasury is responsible for planning and executing our funding activities and strategy.
In order to ensure adequate liquidity through the full range of potential operating environments and market conditions, we conduct our liquidity management and business activities in a manner that will preserve and enhance funding stability, flexibility, and diversity. Key components of this operating strategy include a strong focus on customer-based funding, maintaining direct relationships with wholesale market funding providers, and maintaining the ability to liquefy certain assets when, and if, requirements warrant. We develop and maintain contingency funding plans for both the parent company and bank liquidity positions. These plans evaluate our liquidity position under various operating circumstances and allow us to ensure that we would be able to operate though a period of stress when access to normal sources of funding is constrained. The plans project funding requirements during a potential period of stress, specify and quantify sources of liquidity, outline actions and procedures for effectively managing through the problem period, and define roles and responsibilities. They are reviewed and approved annually by ALCO. Our borrowing costs and ability to raise funds are directly impacted by our credit ratings. The credit ratings of Bank of America Corporation and Bank of America, N.A. are reflected in the table below. Table 10 Credit Ratings | | | | | | | | | | | | | December 31, 2006 | | | Bank of America Corporation and | | Bank of America, National Association (BankN.A. | | | Senior Debt | | Subordinated Debt | | Commercial Paper | | Short-term Borrowings | | Long-term Debt | Moody’s | | Aa2 | | Aa3 | | P-1 | | P-1 | | Aa1 | Standard & Poor’s(1) | | AA- | | A+ | | A-1+ | | A-1+ | | AA | Fitch, Inc.(2) | | AA- | | A+ | | F1+ | | F1+ | | AA- |
(1) | On February 14, 2007, Standard & Poor’s Rating Services raised their ratings on Bank of America N.A.) are reflected in the table below.Corporation’s Senior Debt to AA and Subordinated Debt to AA- while Bank of America, N. A.’s Long-term Debt rating was raised to AA+. |
Table 7(2)
| On February 15, 2007, Fitch, Inc. raised their ratings on Bank of America Corporation’s Senior Debt to AA and Subordinated Debt to AA- while Bank of America, N. A.’s Long-term Debt rating was raised to AA. |
Under normal business conditions, primary sources of funding for the parent company include dividends received from its banking and nonbanking subsidiaries, and proceeds from the issuance of senior and subordinated debt, as well as commercial paper and equity. Primary uses of funds for the parent company include repayment of maturing debt and commercial paper, share repurchases, dividends paid to shareholders, and subsidiary funding through capital or debt. The parent company maintains a cushion of excess liquidity that would be sufficient to fully fund holding company and nonbank affiliate operations for an extended period during which funding from normal sources is disrupted. The primary measure used to assess the parent company’s liquidity is the “Time to Required Funding” during such a period of liquidity disruption. This measure assumes that the parent company is unable to generate funds from debt or equity issuance, receives no dividend income from subsidiaries, and no longer pays dividends to shareholders while continuing to meet nondiscretionary uses needed to maintain bank operations and repayment of contractual principal and interest payments owed by the parent company and affiliated companies. Under this scenario, the amount of time the parent company and its nonbank subsidiaries can operate and meet all obligations before the current liquid assets are exhausted is considered the “Time to Required Funding.” ALCO approves the target range set for this metric, in months, and monitors adherence to the target. Maintaining excess parent company cash ensures that “Time to Required Funding” remains in the target range of 21 to 27 months and is the primary driver of the timing and amount of the Corporation’s debt issuances. As of December 31, 2006 “Time to Required Funding” was 24 months compared to 29 months at December 31, 2005. The reduction reflects the funding in 2005 in anticipation of the $5.2 billion cash payment related to the MBNA merger that was paid on January 1, 2006 combined with an increase in share repurchases. The primary sources of funding for our banking subsidiaries include customer deposits and wholesale market–based funding. Primary uses of funds for the banking subsidiaries include growth in the core asset portfolios, including loan demand, and in the ALM portfolio. We use the ALM portfolio primarily to manage interest rate risk and liquidity risk. One ratio that can be used to monitor the stability of funding composition is the “loan to domestic deposit” ratio. This ratio reflects the percent of Loans and Leases that are funded by domestic core deposits, a relatively stable funding source. A ratio below 100 percent indicates that our loan portfolio is completely funded by domestic core deposits. The ratio was 118 percent at December 31, 2006 compared to 102 percent at December 31, 2005. The increase was primarily attributable to the addition of MBNA, organic growth in the loan and lease portfolio, and a decision to retain a larger share of mortgage production on the Corporation’s balance sheet. The strength of our balance sheet is a result of rigorous financial and risk discipline. Our core deposit base, which is a low cost funding source, is often used to fund the purchase of incremental assets (primarily loans and securities), the composition of which impacts our loan to deposit ratio. Mortgage-backed securities and mortgage loans have prepayment risk which must be managed. Repricing of deposits is a key variable in this process. The capital generated in excess of capital adequacy targets and to support business growth, is available for the payment of dividends and share repurchases. ALCO determines prudent parameters for wholesale market-based borrowing and regularly reviews the funding plan for the bank subsidiaries to ensure compliance with these parameters. The contingency funding plan for the banking subsidiaries evaluates liquidity over a 12-month period in a variety of business environment scenarios assuming different levels of earnings performance and credit ratings as well as public and investor relations factors. Funding exposure related to our role as liquidity provider to certain off-balance sheet financing entities is also measured under a stress scenario. In this analysis, ratings are downgraded such that the off-balance sheet financing entities are not able to issue commercial paper and backup facilities that we provide are drawn upon. In addition, potential draws on credit facilities to issuers with ratings below a certain level are analyzed to assess potential funding exposure. We originate loans for retention on our balance sheet and for distribution. As part of our “originate to distribute” strategy, commercial loan originations are distributed through syndication structures, and residential mortgages originated byMortgage andHome Equity are frequently distributed in the secondary market. In connection with our balance sheet management activities, we may retain mortgage loans originated as well as purchase and sell loans based on our assessment of market conditions. Credit Ratings
| | | | | | | | | | | | | December 31, 2005
| | | Bank of America Corporation
| | Bank of America, N.A.
| | | Senior
Debt
| | Subordinated
Debt
| | Commercial
Paper
| | Short-term
Borrowings
| | Long-term
Debt
| Moody’s
| | Aa2 | | Aa3 | | P-1 | | P-1 | | Aa1 | Standard & Poor’s
| | AA- | | A+ | | A-1+ | | A-1+ | | AA | Fitch, Inc.
| | AA- | | A+ | | F1+ | | F1+ | | AA- |
Under normal business conditions, primary sources of funding for the parent company include dividends received from its banking and nonbanking subsidiaries, and proceeds from the issuance of senior and subordinated debt, as well as commercial paper and equity. Primary uses of funds for the parent company include repayment of maturing debt and commercial paper, share repurchases, dividends paid to shareholders, and subsidiary funding through capital or debt.
The parent company maintains a cushion of excess liquidity that would be sufficient to fully fund holding company and nonbank affiliate operations for an extended period during which funding from normal sources is disrupted. The primary measure used to assess the parent company’s liquidity is the “Time to Required Funding” during such a period of liquidity disruption. This measure assumes that the parent company is unable to generate funds from debt or equity issuance, receives no dividend income from subsidiaries, and no longer pays dividends to shareholders while continuing to meet nondiscretionary uses needed to maintain bank operations and repayment of contractual principal and interest payments owed by the parent company and affiliated companies. Under this scenario, the amount of time the parent company and its nonbank subsidiaries can operate and meet all obligations before the current liquid assets are exhausted is considered the “Time to Required Funding”. ALCO approves the target range set for this metric, in months, and monitors adherence to the target. Maintaining excess parent company cash that ensures that “Time to Required Funding” remains in the target range is the primary driver of the timing and amount of the Corporation’s debt issuances. As of December 31, 2005 “Time to Required Funding” was 29 months.
The primary sources of funding for our banking subsidiaries include customer deposits, wholesale market–based funding, and asset securitizations. Primary uses of funds for the banking subsidiaries include growth in the core asset portfolios, including loan demand, and in the ALM portfolio. We use the ALM portfolio primarily to manage interest rate risk and liquidity risk.
The strength of our balance sheet is a result of rigorous financial and risk discipline. Our excess deposits, which are a low cost of funding source, fund the purchase of additional securities and result in a lower loan to deposit ratio. Mortgage-backed securities and mortgage loans have prepayment risk which has to be actively managed. Repricing of deposits is a key variable in this process. The capital generated in excess of capital adequacy targets and to support business growth, is available for the payment of dividends and share repurchases.
ALCO determines prudent parameters for wholesale market-based borrowing and regularly reviews the funding plan for the bank subsidiaries to ensure compliance with these parameters. The contingency funding plan for the banking subsidiaries evaluates liquidity over a 12-month period in a variety of business environment scenarios assuming different levels of earnings performance and credit ratings as well as public and investor relations factors. Funding exposure related to our role as liquidity provider to certain off-balance sheet financing entities is also measured under a stress scenario. In this analysis, ratings are downgraded such that the off-balance sheet financing entities are not able to issue commercial paper and backup facilities that we provide are drawn upon. In addition, potential draws on credit facilities to issuers with ratings below a certain level are analyzed to assess potential funding exposure.
One ratio used to monitor the stability of our funding composition is the “loan to domestic deposit” (LTD) ratio. This ratio reflects the percent of Loans and Leases that are funded by domestic customer deposits, a relatively stable funding source. A ratio below 100 percent indicates that our loan portfolio is completely funded by domestic customer deposits. The ratio was 102 percent at December 31, 2005 compared to 93 percent at December 31, 2004. The increase was primarily attributable to organic growth in the loan and lease portfolio.
We originate loans for retention on our balance sheet and for distribution. As part of our “originate to distribute” strategy, commercial loan originations are distributed through syndication structures, and residential mortgages originated by Consumer Real Estate are frequently distributed in the secondary market. In connection with our balance sheet management activities, we may retain mortgage loans originated as well as purchase and sell loans based on our assessment of market conditions.
Regulatory Capital As a regulated financial services company, we are governed by certain regulatory capital requirements. Presented in Note 15 of the Consolidated Financial Statements are the regulatory capital ratios, actual capital amounts and minimum required capital amounts for the Corporation, Bank of America, N.A., Fleet National Bank and Bank of America, N.A. (USA) at December 31, 2005 and 2004. On June 13, 2005, Fleet National Bank merged with and into Bank of America, N.A., with Bank of America, N.A. as the surviving entity. As of December 31, 2005, the entities were classified as “well-capitalized” for regulatory purposes, the highest classification.
|
At December 31, 2006, the Corporation operated its banking activities primarily under two charters: Bank of America, N.A. and FIA Card Services, N.A. (the surviving entity of the MBNA America Bank N.A. and the Bank of America, N.A. (USA) merger) As a regulated financial services company, we are governed by certain regulatory capital requirements. At December 31, 2006, the Corporation, Bank of America, N.A. and FIA Card Services, N.A. were classified as “well-capitalized” for regulatory purposes, the highest classification. At December 31, 2005, the Corporation, Bank of America, N.A. and Bank of America. N.A. (USA) were also classified as “well-capitalized” for regulatory purposes. There have been no conditions or events since December 31, 2006 that management believes have changed the Corporation’s, Bank of America, N.A.’s and FIA Card Services, N.A.’s capital classifications. Certain corporate sponsored trust companies which issue trust preferred securities (Trust Securities) are deconsolidated under FIN 46R. As a result, the Trust Securities are not included on our Consolidated Balance Sheets. On March 1, 2005, the FRB issued Risk-Based Capital Standards: Trust Preferred Securities and the Definition of Capital (the Final Rule) which allows Trust Securities to continue to qualify as Tier 1 Capital with revised quantitative limits that would be effective after a five-year transition period. As a result, we continue to include Trust Securities in Tier 1 Capital. The Final Rule limits restricted core capital elements to 15 percent for internationally active bank holding companies. In addition, the FRB revised the qualitative standards for capital instruments included in regulatory capital. Internationally active bank holding companies are those with consolidated assets greater than $250 billion or on-balance sheet exposure greater than $10 billion. At December 31, 2006, our restricted core capital elements comprised 17.3 percent of total core capital elements. We expect to be fully compliant with the revised limits prior to the implementation date of March 31, 2009. Table 11 reconciles the Corporation’s Total Shareholders’ Equity to Tier 1 and Total Capital as defined by the regulations issued by the FRB, the FDIC, and the OCC at December 31, 2006 and 2005. Table 11 | | | | | | | | | | Reconciliation of Tier 1 and Total Capital | | December 31 | | | (Dollars in millions) | | 2006 | | | 2005 | | Tier 1 Capital | | | | | | | | | Total Shareholders’ equity | | $ | 135,272 | | | $ | 101,533 | | Goodwill | | | (65,662 | ) | | | (45,354 | ) | Nonqualifying intangible assets(1) | | | (3,782 | ) | | | (2,642 | ) | Effect of net unrealized losses on AFS debt and marketable equity securities and net losses on derivatives recorded in Accumulated OCI, net of tax | | | 6,430 | | | | 7,316 | | Accounting change for implementation of FASB Statement No. 158 | | | 1,428 | | | | — | | Trust securities(2) | | | 15,942 | | | | 12,446 | | Other | | | 1,436 | | | | 1,076 | | Tier 1 Capital | | | 91,064 | | | | 74,375 | | Long-term debt qualifying as Tier 2 Capital | | | 24,546 | | | | 16,848 | | Allowance for loan and lease losses | | | 9,016 | | | | 8,045 | | Reserve for unfunded lending commitments | | | 397 | | | | 395 | | Other | | | 203 | | | | 238 | | Total Capital | | $ | 125,226 | | | $ | 99,901 | |
(1) | Nonqualifying intangible assets of the Corporation are comprised of certain core deposit intangibles, affinity relationships, and other intangibles. |
(2) | Trust Securities are not included on our Consolidated Balance Sheets. On March 1, 2005, the FRB issued Risk-Based Capital Standards: Trust Preferred Securities and the Definitionnet of Capital (the Final Rule) which allows Trust Securities to continue to qualify as Tier 1 Capital with revised quantitative limits that would be effective after a five-year transition period. As a result, we continue to include Trust Securities in Tier 1 Capital.unamortized discounts. The FRB’s Final Rule limits restricted core capital elements to 15 percent for internationally active bank holding companies. In addition, the FRB revised the qualitative standards for capital instruments included in regulatory capital. Internationally active bank holding companies are those with consolidated assets greater than $250 billion or on-balance sheet exposure greater than $10 billion. At December 31, 2005, our restricted core capital elements comprised 16.6 percent of total core capital elements. We expect to be fully compliant with the revised limits prior to the implementation date of March 31, 2009.
|
See Note 15 of the Consolidated Financial Statements for more information on the Corporation’s regulatory requirements and restrictions. The Corporation anticipates that the implementation, of FASB Staff Position No. FAS 13-2, “Accounting for a Change or Projected Change in the Timing of Cash Flows Relating to Income Taxes Generated by a Leveraged Lease Transaction,” will reduce Retained Earnings and associated regulatory capital by approximately $1.4 billion after-tax as of January 1, 2007. The amount of the charge initially recorded will be recognized as income over the remaining terms, generally 15 to 30 years, of the affected leases. Further, this change in accounting will also result in an adverse impact on earnings in the first two years subsequent to the change. The Corporation expects that Net Income will be negatively impacted by approximately $105 million in 2007. The Corporation anticipates that its Tier 1 and Total Capital Ratios will be negatively impacted by approximately 13 bps and its Tier 1 Leverage Ratio will be negatively impacted by approximately 10 bps as a result of the initial adoption. In November 2006, the Corporation announced a definitive agreement to acquire U.S. Trust for $3.3 billion in cash. The transaction is expected to close in the third quarter of 2007. The Corporation anticipates that its Tier 1 and Total Capital Ratios will be negatively impacted by approximately 35 bps and its Tier 1 Leverage Ratio will be negatively impacted by approximately 25 bps upon the acquisition of U.S. Trust. In June 2004, Basel II was published with the intent of more closely aligning regulatory capital requirements with underlying risks. Similar to economic capital measures, Basel II seeks to address credit risk, market risk, and operational risk. While economic capital is measured to cover unexpected losses, the Corporation also maintains a certain threshold in terms of regulatory capital to adhere to legal standards of capital adequacy. These thresholds or leverage ratios will continue to be utilized for the foreseeable future. U.S. banks are required to implement Basel II within three years of the date the final rules are published. Banks must successfully complete four consecutive quarters of parallel calculations to be considered compliant and to enter a three-year implementation period. The three-year implementation period is subject to capital relief floors (limits) that are set to help mitigate substantial decreases in an institution’s capital levels when compared to current regulatory capital rules. On September 25, 2006, the Agencies officially published several documents providing updates to the Basel II Risk-Based Capital Standards for the U.S. as well as new regulatory reporting requirements related to these Risk-Based Capital Standards for review and comment by U.S.-based banks and trade associations. These publications included previously published regulations and guidance as well as revised market risk rules and a proposal including several new regulatory reporting templates. These Capital Standards are expected to be finalized in 2007. The Corporation continues its execution efforts to ensure preparedness with Basel II requirements. The goal is to achieve full compliance within the three-year implementation period. Further, the Corporation anticipates being ready for all international reporting requirements that occur before that time. In June 2004, Basel II was published with the intent of more closely aligning regulatory capital requirements with underlying risks. Similar to economic capital measures, Basel II seeks to address credit risk, market risk and operational risk.
While economic capital is measured to cover unexpected losses, we also maintain a certain threshold in terms of regulatory capital to adhere to legal standards of capital adequacy. With recent updates to the U.S. implementation, these thresholds or leverage ratios, will continue to be utilized for the foreseeable future. Maintaining capital adequacy with our regulatory capital under Basel II, does not impact internal profitability or pricing.
In the U.S., Basel II will not be implemented until January 1, 2008, which will serve as our parallel test year, followed by full implementation in 2009. The impact on our capital management processes and capital requirements continues to be evaluated. As Basel II is an international regulation, U.S. regulatory agencies are drafting a U.S. oriented measure which follows the Basel II construct.
Recently, an assessment of the potential effect on regulatory capital known as Quantitative Impact Study 4 was completed, which generated disparate results among participants. In order to address the potential changes in capital levels, regulators have established floors or limits as to how much capital can decrease from period to period after full implementation through at least 2011. We are committed to working with the regulators and continue to proactively monitor their efforts towards achieving a successful implementation of Basel II.
Implementation of Basel II requires a significant enterprise-wide effort. During 2005, our dedicated Basel II Program Management Office, supported by a number of business segment specialists and technologists, completed major planning activities required to achieve Basel II preparedness. During 2006, we are aggressively moving forward with policy, process and technology changes required to achieve full compliance by the start of parallel processing in 2008. We continue to work closely with the regulatory agencies in this process.
Effective for the third quarter 2006 dividend, the Board increased the quarterly cash dividend 12 percent from $0.50 to $0.56 per share. In October 2006, the Board declared a fourth quarter cash dividend of $0.56 which was paid on December 22, 2006 to common shareholders of record on December 1, 2006. In January 2007, the Board declared a quarterly cash dividend of $0.56 per common share payable on March 23, 2007 to shareholders of record on March 2, 2007. In January 2007, the Board also declared three dividends in regards to preferred stock. The first was a $1.75 regular cash dividend on the Cumulative Redeemable Preferred Stock, Series B, payable April 25, 2007 to shareholders of record on April 11, 2007. The second was a regular quarterly cash dividend of $0.38775 per depositary share on the Series D Preferred Stock, payable March 14, 2007 to shareholders of record on February 28, 2007. The third declared dividend was a regular quarterly cash dividend of $0.40106 per depositary share of the Floating Rate Non-Cumulative Preferred Stock, Series E, payable February 15, 2007 to shareholders of record on January 31, 2007. Effective for the third quarter 2005 dividend, the Board increased the quarterly cash dividend 11 percent from $0.45 to $0.50 per common share. In October 2005, the Board declared a fourth quarter cash dividend which was paid on December 23, 2005 to common shareholders of record on December 2, 2005. In January 2006, the Board declared a quarterly cash dividend of $0.50 per common share payable on March 24, 2006 to shareholders of record on March 3, 2006.
| | Common Share Repurchases We will continue to repurchase shares, from time to time, in the open market or in private transactions through our approved repurchase programs. We repurchased 126.4 million shares of common stock in 2005, which more than offset the 79.6
|
We will continue to repurchase shares, from time to time, in the open market or in private transactions through our approved repurchase programs. We repurchased approximately 291.1 million shares of common stock in 2006 which more than offset the 118.4 million shares issued under our company’s employee stock plans. During 2006 we expect to use available excess capital to repurchase shares in excess of shares issued under our employee stock plans. In April 2006, the Board authorized a stock repurchase program of up to 200 million shares of the Corporation’s common stock at an aggregate cost not to exceed $12.0 billion to be completed within a period of 12 to 18 months of which the lesser of approximately $4.9 billion, or 63.1 million shares, remains available for repurchase under the program at December 31, 2006. In January 2007, the Board authorized a stock repurchase program of an additional 200 million shares of the Corporation’s common stock at an aggregate cost not to exceed $14.0 billion to be completed within a period of 12 to 18 months. For additional information on common share repurchases, see Note 14 of the Consolidated Financial Statements. | Credit Risk ManagementPreferred StockCredit risk is the risk of loss arising from a borrower’s or counterparty’s inability to meet its obligations. Credit risk can also arise from operational failures that result in an advance, commitment or investment of funds. We define the credit exposure to a borrower or counterparty as the loss potential arising from all product classifications, including loans and leases, derivatives, trading account assets, assets held-for-sale, and unfunded lending commitments that include loan commitments, letters of credit and financial guarantees. For derivative positions, our credit risk is measured as the net replacement cost in the event the counterparties with contracts in a gain position to us completely fail to perform under the terms of those contracts. We use the current mark-to-market value to represent credit exposure without giving consideration to future mark-to-market changes. The credit risk amounts take into consideration the effects of legally enforceable master netting agreements. Our consumer and commercial credit extension and review procedures take into account credit exposures that are funded or unfunded. For additional information on derivatives and credit extension commitments, see Notes 5 and 13
|
In November 2006, the Corporation authorized 85,100 shares and issued 81,000 shares, or $2.0 billion, of Bank of America Corporation Floating Rate Non-Cumulative Preferred Stock, Series E with a par value of $0.01 per share. In September 2006, the Corporation authorized 34,500 shares and issued 33,000 shares, or $825 million, of Series D Preferred Stock with a par value of $0.01 per share. During July 2006, the Corporation redeemed its 6.75% Perpetual Preferred Stock with a stated value of $250 per share and its Fixed/Adjustable Rate Cumulative Preferred Stock with a stated value of $250 per share. For additional information on the issuance and redemption of preferred stock, see Note 14 of the Consolidated Financial Statements. We manage credit risk based on the risk profile of the borrower or counterparty, repayment sources, the nature of underlying collateral, and other support given current events, conditions and expectations. We classify our Loans and Leases
Credit risk is the risk of loss arising from the inability of a borrower or counterparty to meet its obligations. Credit risk can also arise from operational failures that result in an advance, commitment or investment of funds. We define the credit exposure to a borrower or counterparty as the loss potential arising from all product classifications including loans and leases, derivatives, trading account assets, assets held-for-sale, and unfunded lending commitments that include loan commitments, letters of credit and financial guarantees. For derivative positions, our credit risk is measured as the net replacement cost in the event the counterparties with contracts in a gain position to us fail to perform under the terms of those contracts. We use the current mark-to-market value to represent credit exposure without giving consideration to future mark-to-market changes. The credit risk amounts take into consideration the effects of legally enforceable master netting agreements and cash collateral. Our consumer and commercial credit extension and review procedures take into account funded and unfunded credit exposures. For additional information on derivatives and credit extension commitments, see Notes 4 and 13 of the Consolidated Financial Statements. For credit risk purposes, we evaluate our consumer businesses on both a held and managed basis (a non-GAAP measure). Managed basis treats securitized loan receivables as if they were still on the balance sheet. We evaluate credit performance on a managed basis as the receivables that have been securitized are subject to the same underwriting standards and ongoing monitoring as the held loans. In addition to the discussion of credit quality statistics of both held and managed loans included in this section, refer to theCard Services discussion beginning on page 28. For additional information on our managed portfolio and securitizations, refer to Note 9 of the Consolidated Financial Statements. We manage credit risk based on the risk profile of the borrower or counterparty, repayment sources, the nature of underlying collateral, and other support given current events, conditions and expectations. We classify our portfolios as either consumer or commercial and monitor their credit risk separately as discussed below. | | Consumer Portfolio Credit Risk Management |
Credit risk management for the consumer portfolio begins with initial underwriting and continues throughout a borrower’s credit cycle. Statistical techniques in conjunction with experiential judgment are used in all aspects of portfolio management including product pricing, risk appetite, setting credit limits, operating processes and metrics to quantify and balance risks and returns. In addition, credit decisions are statistically based with tolerances set to decrease the percentage of approvals as the risk profile increases. Statistical models are built using detailed behavioral information from external sources such as credit bureaus and/or internal historical experience. These models are a critical component of our consumer credit risk management process and are used in the determination of both new and existing credit decisions, portfolio management strategies including authorizations and line management, collection practices and strategies, determination of the allowance for credit losses, and economic capital allocations for credit risk. For information on our accounting policies regarding delinquencies, nonperforming status and charge-offs for the consumer portfolio, see Note 1 of the Consolidated Financial Statements. | Management of Consumer Credit risk management for the consumer portfolio begins with initial underwriting and continues throughout a borrower’s credit cycle. Statistical techniques are used to establish product pricing, risk appetite, operating processes and metrics to balance risks and returns. Risk Concentrations |
Consumer credit risk exposure is managed geographically and through our various product offerings with a goal that concentrations of credit exposure do not result in undesirable levels of risk. We purchase credit protection on certain portions of our portfolio that is designed to enhance our overall risk management strategy. At December 31, 2006 and 2005, we had mitigated a portion of our credit risk on approximately $131.0 billion and $110.4 billion of consumer loans, including both residential mortgage and indirect automotive loans, through the purchase of credit protection. Our regulatory risk-weighted assets were reduced as a result of these transactions because we transferred a portion of our credit risk to unaffiliated parties. At December 31, 2006 and 2005, these transactions had the cumulative effect of reducing our risk-weighted assets by $36.4 billion and $30.6 billion, and resulted in increases of 30 bps and 28 bps in our Tier 1 Capital ratio at December 31, 2006 and 2005. | Consumer exposure is grouped by product and other attributes for purposesCredit Portfolio |
Table 12 presents our held and managed consumer loans and leases and related asset quality information for 2006 and 2005. Overall, consumer credit quality remained sound in 2006 as performance was favorably impacted by lower bankruptcy-related charge-offs. Table 12 Consumer Loans and Leases | | | | | | | | | | | | | | | | | | | | | | | | | | | | | | | | | | | December 31 | | | Year Ended December 31 | | | | | Outstandings | | Nonperforming (1) | | Accruing Past
Due 90 Days or
More (2) | | | Net Charge-
offs / Losses | | Net Charge-off /
Loss Ratios(3) | | | (Dollars in millions) | | 2006 | | 2005 | | 2006 | | 2005 | | 2006 | | 2005 | | | 2006 | | 2005 | | 2006 | | | 2005 | | Held basis | | | | | | | | | | | | | | | | | | | | | | | | | | | | | | | | Residential mortgage | | $ | 241,181 | | $ | 182,596 | | $ | 660 | | $ | 570 | | $ | 118 | | $ | — | | | $ | 39 | | $ | 27 | | 0.02 | % | | 0.02 | % | Credit card—domestic | | | 61,195 | | | 58,548 | | | n/a | | | n/a | | | 1,991 | | | 1,197 | | | | 3,094 | | | 3,652 | | 4.85 | | | 6.76 | | Credit card—foreign | | | 10,999 | | | — | | | n/a | | | n/a | | | 184 | | | — | | | | 225 | | | — | | 2.46 | | | — | | Home equity lines | | | 74,888 | | | 62,098 | | | 249 | | | 117 | | | — | | | — | | | | 51 | | | 31 | | 0.07 | | | 0.05 | | Direct/Indirect consumer(4) | | | 68,224 | | | 45,490 | | | 44 | | | 37 | | | 347 | | | 75 | | | | 524 | | | 248 | | 0.88 | | | 0.55 | | Other consumer (5) | | | 9,218 | | | 6,725 | | | 77 | | | 61 | | | 38 | | | 15 | | | | 303 | | | 275 | | 2.83 | | | 3.99 | | Total consumer loans and leases—held | | | 465,705 | | | 355,457 | | | 1,030 | | | 785 | | | 2,678 | | | 1,287 | | | | 4,236 | | | 4,233 | | 1.01 | | | 1.26 | | Securitizations impact(6) | | | 110,151 | | | 12,523 | | | 2 | | | — | | | 2,407 | | | 23 | | | | 3,371 | | | 434 | | 3.22 | | | 3.34 | | Total consumer loans and leases—managed | | $ | 575,856 | | $ | 367,980 | | $ | 1,032 | | $ | 785 | | $ | 5,085 | | $ | 1,310 | | | $ | 7,607 | | $ | 4,667 | | 1.45 | % | | 1.34 | % | Managed basis | | | | | | | | | | | | | | | | | | | | | | | | | | | | | | | | Residential mortgage | | $ | 245,840 | | $ | 188,380 | | $ | 660 | | $ | 570 | | $ | 118 | | $ | — | | | $ | 39 | | $ | 27 | | 0.02 | % | | 0.02 | % | Credit card—domestic | | | 142,599 | | | 60,785 | | | n/a | | | n/a | | | 3,828 | | | 1,217 | | | | 5,395 | | | 4,086 | | 3.89 | | | 6.92 | | Credit card—foreign | | | 27,890 | | | — | | | n/a | | | n/a | | | 608 | | | — | | | | 980 | | | — | | 3.95 | | | — | | Home equity lines | | | 75,197 | | | 62,546 | | | 251 | | | 117 | | | — | | | 3 | | | | 51 | | | 31 | | 0.07 | | | 0.05 | | Direct/Indirect consumer | | | 75,112 | | | 49,544 | | | 44 | | | 37 | | | 493 | | | 75 | | | | 839 | | | 248 | | 1.23 | | | 0.53 | | Other consumer | | | 9,218 | | | 6,725 | | | 77 | | | 61 | | | 38 | | | 15 | | | | 303 | | | 275 | | 2.83 | | | 3.99 | | Total consumer loans and leases—managed | | $ | 575,856 | | $ | 367,980 | | $ | 1,032 | | $ | 785 | | $ | 5,085 | | $ | 1,310 | | | $ | 7,607 | | $ | 4,667 | | 1.45 | % | | 1.34 | % |
(1) | The definition of evaluating credit risk. Statistical models are built using detailed behavioral information from external sources such as credit bureaus as well as internal historical experience. These models are essential to ournonperforming does not include consumer credit risk management processcard and consumer non-real estate loans and leases. |
(2) | Accruing past due 90 days or more as a percentage of outstanding held and managed consumer loans and leases was 0.58 percent and 0.88 percent at December 31, 2006 and 0.36 percent and 0.36 percent at December 31, 2005. |
(3) | Net charge-off/loss ratios are used incalculated as held net charge-offs or managed net losses divided by average outstanding held or managed loans and leases during the determination of credit decisions, collections management strategies, portfolio management decisions, determination of the allowanceyear for consumereach loan and lease losses,category. |
(4) | Outstandings include home equity loans of $12.8 billion and economic capital allocations for credit risk.$8.1 billion at December 31, 2006 and 2005. |
(5) | Outstandings include foreign consumer loans of $6.2 billion and $3.8 billion and consumer finance loans of $2.8 billion and $2.8 billion at December 31, 2006 and 2005. |
(6) | For additional information on our managed portfolio and securitizations, refer to Note 9 of the Consolidated Financial Statements. |
n/a = not applicable Residential Mortgage The residential mortgage portfolio makes up the largest percentage of our consumer loan portfolio at 52 percent of held consumer loans and leases and 43 percent of managed consumer loans and leases at December 31, 2006. Residential mortgages are originated for the home purchase and refinancing needs of our customers inGlobal Consumer and Small Business Bankingand Global Wealth and Investment Managementand represent 22 percent of the managed residential portfolio. The remaining 78 percent of the managed portfolio is inAll Other, which includes Corporate Treasury and Corporate Investments, and is comprised of purchased or originated residential mortgage loans used to manage our overall ALM activities. On a held basis, outstanding loans and leases increased $58.6 billion in 2006 compared to 2005 driven by retained mortgage production and bulk purchases. Nonperforming balances increased $90 million due to portfolio seasoning. Loans past due 90 days or more and still accruing interest of $118 million is related to repurchases pursuant to our servicing agreements with Government National Mortgage Association (GNMA) mortgage pools whose repayments are insured by the Federal Housing Administration or guaranteed by the Department of Veterans Affairs. This past due GNMA portfolio of $161 million was included in loans held-for-sale at December 31, 2005 and was not reclassified to conform to current presentation. Credit Card – Domestic and Foreign The consumer credit card portfolio is managed inCard Services withinGlobal Consumer and Small Business Banking. Outstandings in the held domestic loan portfolio increased $2.6 billion in 2006 compared to 2005 due to the MBNA merger and organic growth partially offset by an increase in net securitization activity. The $794 million increase in held domestic loans past due 90 days or more and still accruing interest was driven by portfolio seasoning, the trend toward more normalized delinquency levels following bankruptcy reform and the addition of the MBNA portfolio, including the adoption of MBNA collection practices and policies that have historically led to higher delinquencies but lower losses. Net charge-offs for the held domestic portfolio decreased $558 million to $3.1 billion, or 4.85 percent (5.00 percent excluding the impact of SOP 03-3) of total average held credit card – domestic loans compared to 6.76 percent in 2005 primarily due to bankruptcy reform which accelerated charge-offs into 2005. This decrease in net charge-offs was partially offset by new advances on accounts for which previous loan balances were sold to the securitization trusts, portfolio seasoning and the addition of the MBNA portfolio. See below for a discussion of the impact of SOP 03-3 on the MBNA portfolio. Managed domestic credit card outstandings increased $81.8 billion to $142.6 billion at December 31, 2006, primarily due to the MBNA merger. Managed net losses increased $1.3 billion to $5.4 billion, or 3.89 percent of total average managed domestic loans compared to 6.92 percent in 2005. Managed net losses were higher primarily due to the addition of the MBNA portfolio and portfolio seasoning, partially offset by lower bankruptcy-related losses as a result of bankruptcy reform. The 303 bps decrease in the managed net loss ratio was driven by lower bankruptcy-related losses and the beneficial impact of the higher credit quality of the MBNA portfolio compared to the legacy Bank of America portfolio. Held and managed outstandings in the foreign credit card portfolio of $11.0 billion and $27.9 billion at December 31, 2006, as well as delinquencies, held net charge-offs and managed net losses, are related to the addition of the MBNA portfolio. Net charge-offs for the held foreign portfolio were $225 million, or 2.46 percent (3.05 percent excluding the impact of SOP 03-3) of total average held credit card – foreign loans in 2006. Net losses for the managed foreign portfolio were $980 million, or 3.95 percent, of total average managed credit card – foreign loans. The foreign credit card portfolio experienced increasing net charge-off and managed net loss trends throughout the year resulting from seasoning of the European portfolio and higher personal insolvencies in the United Kingdom. See below for a discussion of the impact of SOP 03-3 on the MBNA portfolio. Home Equity Lines At December 31, 2006, approximately 73 percent of the managed home equity portfolio was included in Global Consumer and Small Business Banking, while the remainder of the portfolio is inGlobal Wealth and Investment Management.This portfolio consists of revolving first and second lien residential mortgage lines of credit. On a held basis, outstanding home equity lines increased $12.8 billion, or 21 percent, in 2006 compared to 2005 due to enhanced product offerings and the expanding home equity market. Nonperforming home equity lines increased $132 million in 2006 due to portfolio seasoning. Direct/Indirect Consumer At December 31, 2006, approximately 49 percent of the managed direct/indirect portfolio was included inBusiness Lending withinGlobal Corporate and Investment Banking (automotive, marine, motorcycle and recreational vehicle loans); 41 percent was included inGlobal Consumer and Small Business Banking (home equity loans, student and other non-real estate secured and unsecured personal loans) and the remainder was included inGlobal Wealth and Investment Management (home equity loans and other non-real estate secured and unsecured personal loans) andAll Other (home equity loans). On a held basis, outstanding loans and leases increased $22.7 billion in 2006 compared to 2005 due to the addition of the MBNA portfolio, purchases of retail automotive loans and reduced securitization activity. Loans past due 90 days or more and still accruing interest increased $272 million due to the addition of MBNA and growth in the portfolio. Net charge-offs increased $276 million to 0.88 percent (1.01 percent excluding the impact of SOP 03-3) of total average held direct/indirect loans, driven by the addition of the MBNA unsecured lending portfolio and seasoning of the automotive loan portfolio.Card Services unsecured lending portfolio charge-offs increased throughout 2006 as charge-offs trended toward more normalized loss levels post bankruptcy reform. Portfolio seasoning and reduced securitization activity also contributed to the increasing charge-off trend. Net losses for the managed loan portfolio increased $591 million to 1.23 percent of total average managed direct/indirect loans compared to 0.53 percent in 2005, primarily due to the addition of MBNA. See below for a discussion of the impact of SOP 03-3 on the MBNA portfolio. Other Consumer At December 31, 2006, approximately 67 percent of the other consumer portfolio consists of the foreign consumer loan portfolio which was included inCard Services withinGlobal Consumer and Small Business Bankingand inALM/Other withinGlobal Corporate and Investment Banking. The remainder of the portfolio was associated with our previously exited consumer finance businesses and was included inAll Other. Other consumer outstanding loans and leases increased $2.5 billion at December 31, 2006 compared to December 31, 2005 driven primarily by the addition of the MBNA portfolio. Net charge-offs as a percentage of total average other consumer loans declined by 116 bps due primarily to growth in the foreign portfolio from the MBNA acquisition. See below for a discussion of the impact of SOP 03-3 on the MBNA portfolio. SOP 03-3 SOP 03-3 addresses accounting for differences between contractual cash flows and cash flows expected to be collected from an investor’s initial investment in loans acquired in a transfer if those differences are attributable, at least in part, to credit quality. SOP 03-3 requires impaired loans be recorded at fair value and prohibits “carrying over” or the creation of valuation allowances in the initial accounting of loans acquired in a transfer that are within the scope of this SOP (categories of loans for which it is probable, at the time of acquisition, that all amounts due according to the contractual terms of the loan agreement will not be collected). The prohibition of the valuation allowance carryover applies to the purchase of an individual loan, a pool of loans, a group of loans, and loans acquired in a purchase business combination. In accordance with SOP 03-3, certain acquired loans of MBNA that were considered impaired were written down to fair value at the acquisition date. Therefore, reported net charge-offs and managed net losses were lower since these impaired loans that would have been charged off during the period were reduced to fair value as of the acquisition date. SOP 03-3 does not apply to the acquired loans that have been securitized as they are not held on the Corporation’s Balance sheet. Consumer net charge-offs, managed net losses, and associated ratios as reported and excluding the impact of SOP 03-3 for 2006 are presented in Table 13. Management believes that excluding the impact of SOP 03-3 provides a more accurate reflection of portfolio credit quality. Table 13 Consumer Net Charge-offs and Managed Net Losses (Excluding the Impact of SOP 03-3) | | | | | | | | | | | | | | | | | | | | | | | | | | | | 2006 | | | | | As Reported | | | Excluding Impact(1) | | | | | Held | | | Managed | | | Held | | | Managed | | | (Dollars in millions) | | Amount | | Percent | | | Amount | | Percent | | | Amount | | Percent | | | Amount | | Percent | | Residential mortgage | | $ | 39 | | 0.02 | % | | $ | 39 | | 0.02 | % | | $ | 39 | | 0.02 | % | | $ | 39 | | 0.02 | % | Credit card – domestic | | | 3,094 | | 4.85 | | | | 5,395 | | 3.89 | | | | 3,193 | | 5.00 | | | | 5,494 | | 3.96 | | Credit card – foreign | | | 225 | | 2.46 | | | | 980 | | 3.95 | | | | 278 | | 3.05 | | | | 1,033 | | 4.17 | | Home equity lines | | | 51 | | 0.07 | | | | 51 | | 0.07 | | | | 51 | | 0.07 | | | | 51 | | 0.07 | | Direct/Indirect consumer | | | 524 | | 0.88 | | | | 839 | | 1.23 | | | | 602 | | 1.01 | | | | 917 | | 1.35 | | Other consumer | | | 303 | | 2.83 | | | | 303 | | 2.83 | | | | 344 | | 3.21 | | | | 344 | | 3.21 | | | | | | | | | | | | | | | | | | | | | | | | | | | | Total consumer | | $ | 4,236 | | 1.01 | % | | $ | 7,607 | | 1.45 | % | | $ | 4,507 | | 1.07 | % | | $ | 7,878 | | 1.50 | % |
Table 8 presents(1)
| Excluding the impact of SOP 03-3 is a non-GAAP financial measure. Net charge-offs and managed net losses exclude the impact of SOP 03-3 which decreased net charge-offs and managed net losses on credit card – domestic $99 million, credit card – foreign $53 million, direct/indirect consumer $78 million, and other consumer $41 million for 2006. The impact of SOP 03-3 on average outstanding held and managed consumer loans and leases for each year in the five-year period ending at December 31, 2005. Table 8
Outstanding Consumer Loans and Leases
| | | | | | | | | | | | | | | | | | | | | | | | | | | | | | | | | | December 31
| | | | | 2005
| | | 2004 (Restated)
| | | 2003 (Restated)
| | | 2002 (Restated)
| | | 2001 (Restated)
| | | (Dollars in millions) | | Amount
| | Percent
| | | Amount
| | Percent
| | | Amount
| | Percent
| | | Amount
| | Percent
| | | Amount
| | Percent
| | Residential mortgage | | $ | 182,596 | | 51.3 | % | | $ | 178,079 | | 54.3 | % | | $ | 140,483 | | 58.5 | % | | $ | 108,332 | | 54.8 | % | | $ | 78,203 | | 47.3 | % | Credit card | | | 58,548 | | 16.5 | | | | 51,726 | | 15.8 | | | | 34,814 | | 14.5 | | | | 24,729 | | 12.5 | | | | 19,884 | | 12.0 | | Home equity lines | | | 62,098 | | 17.5 | | | | 50,126 | | 15.3 | | | | 23,859 | | 9.9 | | | | 23,236 | | 11.8 | | | | 22,107 | | 13.4 | | Direct/Indirect consumer | | | 45,490 | | 12.8 | | | | 40,513 | | 12.3 | | | | 33,415 | | 13.9 | | | | 31,068 | | 15.7 | | | | 30,317 | | 18.4 | | Other consumer(1) | | | 6,725 | | 1.9 | | | | 7,439 | | 2.3 | | | | 7,558 | | 3.2 | | | | 10,355 | | 5.2 | | | | 14,744 | | 8.9 | | | | |
|
| |
|
| |
|
| |
|
| |
|
| |
|
| |
|
| |
|
| |
|
| |
|
| Total consumer loans and leases | | $ | 355,457 | | 100.0 | % | | $ | 327,883 | | 100.0 | % | | $ | 240,129 | | 100.0 | % | | $ | 197,720 | | 100.0 | % | | $ | 165,255 | | 100.0 | % | | | |
|
| |
|
| |
|
| |
|
| |
|
| |
|
| |
|
| |
|
| |
|
| |
|
|
(1) | | Includes consumer finance of $2,849 million, $3,395 million, $3,905 million, $4,438 million, and $5,331 million at December 31, 2005, 2004, 2003, 2002, and 2001, respectively; foreign consumer of $3,841 million, $3,563 million, $1,969 million, $1,970 million, and $2,092 million at December 31, 2005, 2004, 2003, 2002, and 2001, respectively; and consumer lease financing of $35 million, $481 million, $1,684 million, $3,947 million, and $7,321 million at December 31, 2005, 2004, 2003, 2002, and 2001, respectively. |
Concentrations of Consumer Credit Risk
Our consumer credit risk is diversified both geographically and through our various product offerings. In addition, credit decisions are statistically based with tolerances set to decrease the percentage of approvals as the risk profile increases.
From time to time, we purchase credit protection on certain portions of our consumer portfolio. This protection is designed to enhance our overall risk management strategy. At December 31, 2005 and 2004, we have mitigated a portion of our credit risk on approximately $110.4 billion and $88.7 billion of residential mortgage and indirect automobile loans through the purchase of credit protection. Our regulatory risk-weighted assets were reduced as a result of these transactions because we transferred a portion of our credit risk to unaffiliated parties. These transactions had the cumulative effect of reducing our risk-weighted assets by $30.6 billion and $25.5 billion at December 31, 2005 and 2004, and resulted in 28 bp and 26 bp increases in our Tier 1 Capital ratio.
Consumer Portfolio Credit Quality Performance
Credit quality continued to be strong and consistent with performance from a year ago with the exception of the credit card portfolio.
Managed credit card performance2006 was impacted by increased bankruptcy filings prior to legislation which became effective October 17, 2005, continued growth and seasoning of the portfolio, and increased minimum payment requirements implemented in April 2004. The year 2005 compared to 2004 was also impacted by the FleetBoston credit card portfolio.
The entire balance of an account is contractually delinquent if the minimum payment is not received by the specified date on the customer’s billing statement. Interest and fees continue to accrue on our past due loans until the date the loan goes into nonaccrual status, if applicable. Delinquency is reported on accruing loans that are 30 days or more past due.material.
Credit card loans are generally charged off at 180 days past due or 60 days from notification of bankruptcy filing and are not classified as nonperforming. Unsecured consumer loans and deficiencies in non-real estate secured loans and leases are charged off at 120 days past due and are generally not classified as nonperforming. Real estate secured consumer loans are placed on nonaccrual and are classified as nonperforming no later than 90 days past due. The amount deemed uncollectible on real estate secured loans is charged off at 180 days past due.
Table 9 presents consumer net charge-offs and net charge-off ratios on the held portfolio for 2005 and 2004.
Consumer Net Charge-offs and Net Charge-off Ratios(1)
| | | | | | | | | | | | | | | | 2005
| | | 2004 (Restated)
| | | (Dollars in millions) | | Amount
| | Percent
| | | Amount
| | Percent
| | Residential mortgage | | $ | 27 | | 0.02 | % | | $ | 36 | | 0.02 | % | Credit card | | | 3,652 | | 6.76 | | | | 2,305 | | 5.31 | | Home equity lines | | | 31 | | 0.05 | | | | 15 | | 0.04 | | Direct/Indirect consumer | | | 248 | | 0.55 | | | | 208 | | 0.55 | | Other consumer | | | 275 | | 3.99 | | | | 193 | | 2.51 | | | | |
|
| | | | |
|
| | | | Total consumer | | $ | 4,233 | | 1.26 | % | | $ | 2,757 | | 0.93 | % | | | |
|
| |
|
| |
|
| |
|
|
(1) | | Percentage amounts are calculated as net charge-offs divided by average outstandingloans and leases during the year for each loan category. |
As presented in Table 9, consumer net charge-offs from on-balance sheet loans increased $1.5 billion to $4.2 billion in 2005. Of these increased amounts, $1.3 billion was related to credit card net charge-offs. Higher credit card net charge-offs were driven by an increase in bankruptcy net charge-offs of $578 million resulting from changes in bankruptcy legislation, organic portfolio growth and seasoning, increases effective in 2004 in credit card minimum payment requirements, the impact of the FleetBoston portfolio and new advances on accounts for which previous loan balances were sold to the securitization trusts. The increase in direct/indirect consumer charge-offs was driven primarily by the growth and seasoning of the auto loan portfolio. The increase in other consumer charge-offs was primarily driven by an increase in charge-offs for checking account overdraft balances due to deposit growth and a change in the fourth quarter of 2005 in our charge-off policy for overdraft balances from 120 days to 60 days.
Net losses for the managed credit card portfolio increased $1.3 billion to $4.1 billion, or 6.92 percent of total average managed credit card loans in 2005, compared to 5.62 percent of total average managed credit card loans in 2004. Higher managed credit card net losses were driven by an increase in bankruptcy net losses resulting from the change in bankruptcy law, continued portfolio growth and seasoning, increases effective in 2004 in credit card minimum payment requirements and the impact of the FleetBoston portfolio.
As presented in Table 10, nonperforming consumer assets increased $39 million from December 31, 2004 to $846 million at December 31, 2005. The increase was due to a $47 million increase in nonperforming consumer loans and leases to $785 million, representing 0.22 percent of outstanding consumer loans and leases at December 31, 2005 compared to $738 million, representing 0.23 percent of outstanding consumer loans and leases at December 31, 2004. Nonperforming residential mortgages increased $16 million primarily due to modest portfolio growth, partially offset by sales of $112 million in 2005. Nonperforming home equity lines increased $51 million due to the seasoning of the portfolio. Other consumer nonperforming loans and leases fell $24 million due to the continued liquidation of the portfolios in our previously exited consumer businesses and a decline in foreign nonperforming loans and leases. Broad-based loan growth offset the increase in nonperforming consumer loans resulting in an improvement in the nonperforming ratios.
Table 10
Nonperforming Consumer Assets
| | | | | | | | | | | | | | | | | | | | | | | | December 31
| | | (Dollars in millions) | | 2005
| | | 2004
| | | 2003
| | | 2002
| | | 2001
| | Nonperforming consumer loans and leases | | | | | | | | | | | | | | | | | | | | | Residential mortgage | | $ | 570 | | | $ | 554 | | | $ | 531 | | | $ | 612 | | | $ | 556 | | Home equity lines | | | 117 | | | | 66 | | | | 43 | | | | 66 | | | | 80 | | Direct/Indirect consumer | | | 37 | | | | 33 | | | | 28 | | | | 30 | | | | 27 | | Other consumer | | | 61 | | | | 85 | | | | 36 | | | | 25 | | | | 16 | | | | |
|
|
| |
|
|
| |
|
|
| |
|
|
| |
|
|
| Total nonperforming consumer loans and leases(1) | | | 785 | | | | 738 | | | | 638 | | | | 733 | | | | 679 | | Consumer foreclosed properties | | | 61 | | | | 69 | | | | 81 | | | | 99 | | | | 334 | | | | |
|
|
| |
|
|
| |
|
|
| |
|
|
| |
|
|
| Total nonperforming consumer assets(2) | | $ | 846 | | | $ | 807 | | | $ | 719 | | | $ | 832 | | | $ | 1,013 | | | | |
|
|
| |
|
|
| |
|
|
| |
|
|
| |
|
|
| Nonperforming consumer loans and leases as a percentage of outstanding consumer loans and leases (Restated) | | | 0.22 | % | | | 0.23 | % | | | 0.27 | % | | | 0.37 | % | | | 0.41 | % | Nonperforming consumer assets as a percentage of outstanding consumer loans, leases and foreclosed properties (Restated) | | | 0.24 | | | | 0.25 | | | | 0.30 | | | | 0.42 | | | | 0.61 | | | | |
|
|
| |
|
|
| |
|
|
| |
|
|
| |
|
|
|
(1) | | In 2005, $50 million in Interest Income was estimated to be contractually due on nonperforming consumer loans and leases classified as nonperforming at December 31, 2005 provided that these loans and leases had been paid according to their terms and conditions. Of this amount, approximately $9 million was received and included in Net Income for 2005. |
(2) | | Balances do not include $5 million, $28 million, $16 million, $41 million, and $646 million of nonperforming consumer loans held-for-sale, included in Other Assets at December 31, 2005, 2004, 2003, 2002, and 2001, respectively. |
Table 11 presents the additions and reductions to nonperforming assets in the consumer portfolio during 2005 and 2004. Net additions to nonperforming loans and leases in 2005 were $47 million compared to $100 million in 2004.
Table 11
Nonperforming Consumer Assets Activity Table 14 presents the additions and reductions to nonperforming assets in the held consumer portfolio during 2006 and 2005. Net additions to nonperforming loans and leases in 2006 were $245 million compared to $47 million in 2005. The increase in 2006 was driven by seasoning of the residential mortgage and home equity portfolios. The nonperforming consumer loans and leases ratio was unchanged compared to 2005 as the addition of the MBNA portfolio and broad-based loan growth offset the impact of the increase in nonperforming consumer loan levels. | | | | | | | | | | (Dollars in millions) | | 2005
| | | 2004
| | Nonperforming loans and leases | | | | | | | | | Balance, January 1 | | $ | 738 | | | $ | 638 | | | | |
|
|
| |
|
|
| Additions to nonperforming loans and leases: | | | | | | | | | FleetBoston balance, April 1, 2004 | | | — | | | | 122 | | New nonaccrual loans and leases | | | 1,108 | | | | 1,443 | | | | | Reductions in nonperforming loans and leases: | | | | | | | | | Paydowns and payoffs | | | (223 | ) | | | (363 | ) | Sales | | | (112 | ) | | | (96 | ) | Returns to performing status(1) | | | (531 | ) | | | (793 | ) | Charge-offs(2) | | | (121 | ) | | | (128 | ) | Transfers to foreclosed properties | | | (69 | ) | | | (86 | ) | Transfers to loans held-for-sale | | | (5 | ) | | | 1 | | | | |
|
|
| |
|
|
| Total net additions to nonperforming loans and leases | | | 47 | | | | 100 | | | | |
|
|
| |
|
|
| Total nonperforming loans and leases, December 31 | | | 785 | | | | 738 | | | | |
|
|
| |
|
|
| Foreclosed properties | | | | | | | | | Balance, January 1 | | | 69 | | | | 81 | | | | |
|
|
| |
|
|
| Additions to foreclosed properties: | | | | | | | | | FleetBoston balance, April 1, 2004 | | | — | | | | 5 | | New foreclosed properties | | | 125 | | | | 119 | | | | | Reductions in foreclosed properties: | | | | | | | | | Sales | | | (108 | ) | | | (123 | ) | Writedowns | | | (25 | ) | | | (13 | ) | | | |
|
|
| |
|
|
| Total net reductions in foreclosed properties | | | (8 | ) | | | (12 | ) | | | |
|
|
| |
|
|
| Total foreclosed properties, December 31 | | | 61 | | | | 69 | | | | |
|
|
| |
|
|
| Nonperforming consumer assets, December 31 | | $ | 846 | | | $ | 807 | | | | |
|
|
| |
|
|
|
Table 14 Nonperforming Consumer Assets Activity | | | | | | | | | | (Dollars in millions) | | 2006 | | | 2005 | | Nonperforming loans and leases | | | | | | | | | Balance, January 1 | | $ | 785 | | | $ | 738 | | Additions to nonperforming loans and leases: | | | | | | | | | New nonaccrual loans and leases | | | 1,432 | | | | 1,108 | | Reductions in nonperforming loans and leases: | | | | | | | | | Paydowns and payoffs | | | (157 | ) | | | (223 | ) | Sales | | | (117 | ) | | | (112 | ) | Returns to performing status(1) | | | (698 | ) | | | (531 | ) | Charge-offs(2) | | | (150 | ) | | | (121 | ) | Transfers to foreclosed properties | | | (65 | ) | | | (69 | ) | Transfers to loans held-for-sale | | | — | | | | (5 | ) | Total net additions to nonperforming loans and leases | | | 245 | | | | 47 | | Total nonperforming loans and leases, December 31(3) | | | 1,030 | | | | 785 | | Foreclosed properties | | | | | | | | | Balance, January 1 | | | 61 | | | | 69 | | Additions to foreclosed properties: | | | | | | | | | New foreclosed properties | | | 159 | | | | 125 | | Reductions in foreclosed properties: | | | | | | | | | Sales | | | (76 | ) | | | (108 | ) | Writedowns | | | (85 | ) | | | (25 | ) | Total net reductions in foreclosed properties | | | (2 | ) | | | (8 | ) | Total foreclosed properties, December 31 | | | 59 | | | | 61 | | Nonperforming consumer assets, December 31(4) | | $ | 1,089 | | | $ | 846 | | Nonperforming consumer loans and leases as a percentage of outstanding consumer loans and leases | | | 0.22 | % | | | 0.22 | % | Nonperforming consumer assets as a percentage of outstanding consumer loans, leases and foreclosed properties | | | 0.23 | % | | | 0.24 | % |
(1) | | Consumer loans and leases are generally returned to performing status when principal or interest is less than 90 days past due. |
(2) | | Our policy is not to classify consumer credit card and consumer non-real estate loans and leases as nonperforming;therefore, the charge-offs on these loans arehave no impact on nonperforming activity. |
(3) | In 2006, $69 million in Interest Income was estimated to be contractually due on nonperforming consumer loans and leases classified as nonperforming at December 31, 2006 of which $17 million was received and included in Net Income for 2006. |
(4) | Balances do not include nonperforming loans held for sale included above.in Other Assets of $30 million and $24 million at December 31, 2006 and 2005. |
| | Commercial Portfolio Credit Risk Management |
On-balance sheet consumer loans and leases 90 days or more past due and still accruing interest totaled $1.3 billion at December 31, 2005, and were up $131 million from December 31, 2004, primarily driven by a $122 million increase in credit card past due loans due to continued seasoning and growth.
Commercial Portfolio Credit Risk Management
Credit risk management for the commercial portfolio begins with an assessment of the credit risk profile of the borrower or counterparty based on an analysis of the borrower’sfinancial position of a borrower or counterparty’s financial position.counterparty. As part of the overall credit risk assessment of a borrower or counterparty, eachmost of our commercial credit exposure or transaction istransactions are assigned a risk rating and isare subject to approval based on defined credit approval standards. Subsequent to loan origination, risk ratings are monitored on an ongoing basis. If necessary, risk ratings are adjusted to reflect changes in the borrower’s or counterparty’s financial condition, cash flow or financial situation.situation of a borrower or counterparty. We use risk rating aggregations to measure and evaluate concentrations within portfolios. Risk ratings are a factor in determining the level of assigned economic capital and the allowance for credit losses. In making credit decisions, regarding credit, we consider risk rating, collateral, country, industry and single name concentration limits while also balancing the total borrower or counterparty relationship and SVA. Our lines of business and Risk Management personnel use a variety of tools to continuously monitor the ability of a borrower’sborrower or counterparty’s abilitycounterparty to perform under its obligations. Additionally, we utilize syndication of exposure to other entities, loan sales For information on our accounting policies regarding delinquencies, nonperforming status and other risk mitigation techniques to managecharge-offs for the size and risk profilecommercial portfolio, see Note 1 of the loan portfolio.Consolidated Financial Statements. Table 12 presents outstanding commercial loans and leases for each year in the five-year period ending December 31, 2005.
Table 12
Outstanding Commercial Loans and Leases
| | | | | | | | | | | | | | | | | | | | | | | | | | | | | | | | | | December 31
| | | | | 2005
| | | 2004
| | | 2003
| | | 2002
| | | 2001
| | | (Dollars in millions) | | Amount
| | Percent
| | | Amount
| | Percent
| | | Amount
| | Percent
| | | Amount
| | Percent
| | | Amount
| | Percent
| | Commercial—domestic | | $ | 140,533 | | 64.3 | % | | $ | 122,095 | | 62.9 | % | | $ | 91,491 | | 69.7 | % | | $ | 99,151 | | 68.3 | % | | $ | 110,981 | | 67.7 | % | Commercial real estate(1) | | | 35,766 | | 16.4 | | | | 32,319 | | 16.7 | | | | 19,367 | | 14.7 | | | | 20,205 | | 13.9 | | | | 22,655 | | 13.8 | | Commercial lease financing | | | 20,705 | | 9.5 | | | | 21,115 | | 10.9 | | | | 9,692 | | 7.4 | | | | 10,386 | | 7.2 | | | | 11,404 | | 7.0 | | Commercial—foreign | | | 21,330 | | 9.8 | | | | 18,401 | | 9.5 | | | | 10,754 | | 8.2 | | | | 15,428 | | 10.6 | | | | 18,858 | | 11.5 | | | | |
|
| |
|
| |
|
| |
|
| |
|
| |
|
| |
|
| |
|
| |
|
| |
|
| Total commercial loans and leases | | $ | 218,334 | | 100.0 | % | | $ | 193,930 | | 100.0 | % | | $ | 131,304 | | 100.0 | % | | $ | 145,170 | | 100.0 | % | | $ | 163,898 | | 100.0 | % | | | |
|
| |
|
| |
|
| |
|
| |
|
| |
|
| |
|
| |
|
| |
|
| |
|
|
(1) | | Includes domestic commercial real estate loansManagement of $35,181 million, $31,879 million, $19,043 million, $19,910 million, and $22,272 million at December 31, 2005, 2004, 2003, 2002, and 2001,respectively; and foreign commercial real estate loans of $585 million, $440 million, $324 million, $295 million, and $383 million at December 31, 2005, 2004, 2003, 2002, and 2001, respectively.Commercial Credit Risk Concentrations |
Concentrations of Commercial Credit Risk
Portfolio credit risk is evaluated and managed with a goal that concentrations of credit exposure do not result in undesirable levels of risk. We review, measure, and manage concentrations of credit exposure by industry, product, geography and customer relationship. Distribution of loans and leases by loan size is an additional measure of the portfolio risk diversification. We also review, measure, and manage commercial real estate loans by geographic location and property type. In addition, within our international portfolio, we evaluate borrowings by region and by country. Tables 1318 and 20 and Tables 23 through 1925 summarize these concentrations. Additionally, we utilize syndication of exposure to third parties, loan sales and other risk mitigation techniques to manage the size and risk profile of the loan portfolio. From the perspective of portfolio risk management, customer concentration management is most relevant inGlobal Capital MarketsCorporate and Investment Banking. Within that portfolio,segment’sBusiness Lending andCapital Markets and Advisory Services businesses, we facilitate bridge financing to fund acquisitions and other short-term needs as well as provide syndicated financing for our clients. These concentrations are managed in part through our established “originate to distribute” strategy. These client transactions are sometimes large and leveraged. They can also have a higher degree of risk as we are providing offers or commitments for various components of the clients’ capital structures, including lower rated unsecured and subordinated debt tranches. In many cases, these offers to finance will not be accepted. If accepted, these highly conditioned commitments are often retired prior to or shortly following funding via the placement of securities, syndication or the client’s decision to terminate. Where we have a binding commitment and there is a market disruption or other unexpected event, there may be heightened exposure in the portfolios, an increase in criticized assets and higher potential for loss, unless an orderly disposition of the exposure can be made. InGlobal Corporate and Investment Banking, concentrations are actively managed through the underwriting and ongoing monitoring processes, the established strategy of “originate to distribute”, strategy and partly through the purchaseutilization of credit protection through credit derivatives. We utilize various risk mitigation tools, such as credit derivatives, to economically hedge our risk to certain credit counterparties. Credit derivatives are financial instruments that we purchase for protection against the deterioration of credit quality. Earnings volatility increases due to accounting asymmetry as we mark to marketmark-to-market the CDS,credit derivatives, as required by SFAS 133, whilewhereas the loansexposures being hedged, including the funding commitments, are recordedaccounted for on an accrual basis. Once funded, these exposures are accounted for at historical cost less an allowance for credit losses or, if held-for-sale, at the lower of cost or market. | | Commercial Credit Portfolio |
Commercial credit quality continued to be stable in 2006. At December 31, 20052006, the loans and 2004, we had aleases net notional amount of credit default protection purchased in our credit derivatives portfolio of $14.7 billion and $10.8 billion. Our credit portfolio hedges, including the impact of mark-to-market, resulted in net gains of $49 million in 2005 and net losses of $144 million in 2004. Gains for 2005 primarily reflected the impact of spread widening in certain industries in the first half of the year.charge-off ratio declined to 0.13 percent from 0.16 percent at December 31, 2005. The nonperforming loan ratio declined to 0.31 percent from 0.33 percent. Table 13 shows commercial utilized credit exposure by industry based on Standard & Poor’s industry classifications and includes15 presents our commercial loans and leases SBLCs and financial guarantees, derivative assets, assets held-for-sale,related asset quality information for 2006 and commercial letters of credit. These amounts exclude the impact of our credit hedging activities, which are separately included in the table. To lessen the cost of obtaining our desired credit protection levels, credit exposure may be added within an industry, borrower or counterparty group by selling protection. A negative notional amount indicates a net amount of protection purchased in a particular industry; conversely, a positive notional amount indicates a net amount of protection sold in a particular industry. Credit protection is purchased to cover the funded portion as well as the unfunded portion of credit exposure. As shown in the table below, commercial utilized credit exposure is diversified across a range of industries. 2005. Table 1315 Commercial Loans and Leases | | | | | | | | | | | | | | | | | | | | | | | | | | | | | | | | | | | | December 31 | | | Year Ended December 31 | | | | Outstandings | | Nonperforming | | Accruing
Past Due 90
Days or
More (1) | | | Net Charge-
offs(2) | | | Net Charge-off
Ratios(3) | | (Dollars in millions) | | 2006 | | 2005 | | 2006 | | 2005 | | 2006 | | 2005 | | | 2006 | | | 2005 | | | 2006 | | | 2005 | Commercial loans and leases | | | | | | | | | | | | | | | | | | | | | | | | | | | | | | | | | Commercial – domestic | | $ | 161,982 | | $ | 140,533 | | $ | 584 | | $ | 581 | | $ | 265 | | $ | 117 | | | $ | 336 | | | $ | 170 | | | 0.22 | % | | 0.13 % | Commercial real estate(4) | | | 36,258 | | | 35,766 | | | 118 | | | 49 | | | 78 | | | 4 | | | | 3 | | | | — | | | 0.01 | | | — | Commercial lease financing | | | 21,864 | | | 20,705 | | | 42 | | | 62 | | | 26 | | | 15 | | | | (28 | ) | | | 231 | | | (0.14 | ) | | 1.13 | Commercial – foreign | | | 20,681 | | | 21,330 | | | 13 | | | 34 | | | 9 | | | 32 | | | | (8 | ) | | | (72 | ) | | (0.04 | ) | | (0.39) | Total commercial loans and leases | | $ | 240,785 | | $ | 218,334 | | $ | 757 | | $ | 726 | | $ | 378 | | $ | 168 | | | $ | 303 | | | $ | 329 | | | 0.13 | % | | 0.16 % |
(1) | Accruing past due 90 days or more as a percentage of outstanding commercial loans and leases was 0.16 percent and 0.08 percent at December 31, 2006 and 2005. |
(2) | Includes a reduction in net charge-offs on commercial – domestic of $17 million as a result of the impact of SOP 03-3 for 2006. The impact of SOP 03-3 on average outstanding commercial – domestic loans and leases for 2006 was not material. See discussion of SOP 03-3 in the Consumer Credit Portfolio section. |
(3) | Net charge-off ratios are calculated as net charge-offs divided by average outstanding loans and leases during the year for each loan and lease category. |
(4) | Includes domestic commercial real estate loans of $35.7 billion and $35.2 billion at December 31, 2006 and 2005, and foreign commercial real estate loans of $578 million and $585 million at December 31, 2006 and 2005. |
Table 16 presents commercial credit exposure by type for utilized, unfunded and total committed credit exposure. Table 16 Commercial Utilized Credit Exposure and Net Credit Default Protection by IndustryType | | | | | | | | | | | | | | | | | | Commercial Utilized Credit Exposure(1)
| | Net Credit Default Protection(2)
| | | | | December 31
| | December 31
| | | (Dollars in millions) | | 2005
| | 2004
| | 2005
| | | 2004
| | Real estate(3) | | $ | 41,665 | | $ | 36,672 | | $ | (788 | ) | | $ | (268 | ) | Banks | | | 26,514 | | | 25,265 | | | 31 | | | | 61 | | Diversified financials | | | 25,859 | | | 25,932 | | | (543 | ) | | | (1,177 | ) | Retailing | | | 23,913 | | | 23,149 | | | (1,124 | ) | | | (829 | ) | Education and government | | | 22,331 | | | 17,429 | | | — | | | | — | | Individuals and trusts | | | 17,237 | | | 16,110 | | | (30 | ) | | | — | | Materials | | | 16,477 | | | 14,123 | | | (1,149 | ) | | | (469 | ) | Consumer durables and apparel | | | 14,988 | | | 13,427 | | | (772 | ) | | | (406 | ) | Capital goods | | | 13,640 | | | 12,633 | | | (751 | ) | | | (819 | ) | Commercial services and supplies | | | 13,605 | | | 11,944 | | | (472 | ) | | | (175 | ) | Transportation | | | 13,449 | | | 13,234 | | | (392 | ) | | | (143 | ) | Healthcare equipment and services | | | 13,294 | | | 12,196 | | | (709 | ) | | | (354 | ) | Leisure and sports, hotels and restaurants | | | 13,005 | | | 13,331 | | | (874 | ) | | | (357 | ) | Food, beverage and tobacco | | | 11,578 | | | 11,687 | | | (621 | ) | | | (226 | ) | Energy | | | 9,992 | | | 7,579 | | | (559 | ) | | | (457 | ) | Media | | | 6,608 | | | 6,232 | | | (1,790 | ) | | | (801 | ) | Religious and social organizations | | | 6,340 | | | 5,710 | | | — | | | | — | | Utilities | | | 4,858 | | | 5,615 | | | (899 | ) | | | (402 | ) | Insurance | | | 4,692 | | | 5,851 | | | (1,453 | ) | | | (643 | ) | Food and staples retailing | | | 3,802 | | | 3,610 | | | (334 | ) | | | (258 | ) | Technology hardware and equipment | | | 3,737 | | | 3,398 | | | (563 | ) | | | (301 | ) | Telecommunication services | | | 3,461 | | | 3,030 | | | (1,205 | ) | | | (808 | ) | Software and services | | | 2,668 | | | 3,292 | | | (299 | ) | | | (131 | ) | Automobiles and components | | | 1,681 | | | 1,894 | | | (679 | ) | | | (1,431 | ) | Pharmaceuticals and biotechnology | | | 1,647 | | | 1,441 | | | (470 | ) | | | (202 | ) | Household and personal products | | | 379 | | | 371 | | | 75 | | | | 8 | | Other | | | 2,587 | | | 3,132 | | | 1,677 | (4) | | | (260 | )(4) | | | |
|
| |
|
| |
|
|
| |
|
|
| Total | | $ | 320,007 | | $ | 298,287 | | $ | (14,693 | ) | | $ | (10,848 | ) | | | |
|
| |
|
| |
|
|
| |
|
|
|
| | | | | | | | | | | | | | | | | | | | | | December 31 | | | | Commercial
Utilized (1) | | Commercial
Unfunded (2) | | Total Commercial
Committed | | (Dollars in millions) | | 2006 | | 2005 | | 2006 | | 2005 | | 2006 | | 2005 | Loans and leases | | $ | 240,785 | | $ | 218,334 | | $ | 269,937 | | $ | 246,629 | | $ | 510,722 | | $ | 464,963 | Standby letters of credit and financial guarantees | | | 46,772 | | | 43,096 | | | 6,234 | | | 5,033 | | | 53,006 | | | 48,129 | Derivative assets(3) | | | 23,439 | | | 23,712 | | | — | | | — | | | 23,439 | | | 23,712 | Assets held-for-sale | | | 21,936 | | | 16,867 | | | 1,136 | | | 848 | | | 23,072 | | | 17,715 | Commercial letters of credit | | | 4,258 | | | 5,154 | | | 224 | | | 818 | | | 4,482 | | | 5,972 | Bankers’ acceptances | | | 1,885 | | | 1,643 | | | 1 | | | 1 | | | 1,886 | | | 1,644 | Securitized assets | | | 1,292 | | | 1,914 | | | — | | | — | | | 1,292 | | | 1,914 | Foreclosed properties | | | 10 | | | 31 | | | — | | | — | | | 10 | | | 31 | Total | | $ | 340,377 | | $ | 310,751 | | $ | 277,532 | | $ | 253,329 | | $ | 617,909 | | $ | 564,080 |
(1) | Exposure includes standby letters of credit, financial guarantees, commercial letters of credit and bankers’ acceptances for which the bank is legally bound to advance funds under prescribed conditions, during a specified period. Although funds have not been advanced, most of these exposure types are considered utilized for credit risk management purposes. |
(2) | Excludes unused business card lines which are not legally binding. |
(3) | Derivative assetsAssets are reported on a mark-to-market basis, reflect the effects of legally enforceable master netting agreements, and have not been reduced by the amountcash collateral of collateral applied. Derivative assetcollateral totaled $17.1$7.3 billion and $17.7$9.3 billion at December 31, 20052006 and 2004. |
(2) | | Represents notional amounts2005. Commercial utilized credit exposure at December 31, 2005 has been reclassified to reflect cash collateral applied to Derivative Assets. In addition to cash collateral, Derivative Assets are also collateralized by $7.6 billion and 2004. |
(3) | | Industries are viewed from a variety$7.8 billion of perspectives to best isolate the perceived risks. For purposes of this table, the real estate industry isdefined based upon the borrowers’ or counterparties’ primary business activity using operating cash flow and primary source of repayment as key factors. |
(4) | | Represents net CDS index positions, which were principally investment grade. Indices are comprised of corporate credit derivatives that trade as an aggregate index value. Generally, they are grouped into portfolios based on specific ratings of credit quality or global geographic location. As ofother marketable securities at December 31, 2006 and 2005 CDS index positions were sold to reflect a short-term positive view offor which the credit markets.risk has not been reduced. |
Table 14 shows17 presents commercial utilized criticized exposure by product type and as a percentage of total commercial utilized exposure for each category presented. Bridge exposure of $550 million as of December 31, 2006 and $442 million as of December 31, 2005, are excluded from the maturity profiletable below. These exposures are carried at the lower of cost or market and are managed in part through our “originate to distribute” strategy (see page 58 for more information on bridge financing). Had this exposure been included, the ratio of commercial utilized criticized exposure to total commercial utilized exposure would have been 2.25 percent and 2.42 percent as of December 31, 2006 and December 31, 2005, respectively. Table 17 Commercial Utilized Criticized Exposure(1,2) | | | | | | | | | | | | | | | | December 31, 2006 | | | December 31, 2005 | | | (Dollars in millions) | | Amount | | Percent (3) | | | Amount | | Percent (3,4) | | Commercial – domestic | | $ | 5,210 | | 2.41 | % | | $ | 4,954 | | 2.59 | % | Commercial real estate | | | 815 | | 1.78 | | | | 723 | | 1.63 | | Commercial lease financing | | | 504 | | 2.31 | | | | 611 | | 2.95 | | Commercial – foreign | | | 582 | | 1.05 | | | | 797 | | 1.48 | | Total commercial utilized criticized exposure | | $ | 7,111 | | 2.09 | % | | $ | 7,085 | | 2.28 | % |
(1) | Criticized exposure corresponds to the Special Mention, Substandard and Doubtful asset categories defined by regulatory authorities. |
(2) | Exposure includes standby letters of credit, financial guarantees, commercial letters of credit and bankers’ acceptances for which the bank is legally bound to advance funds under prescribed conditions, during a specified period. Although funds have not been advanced, most of these exposure types are considered utilized for credit risk management purposes. |
(3) | Ratios are calculated as commercial utilized criticized exposure divided by total commercial utilized exposure for each exposure category. |
(4) | Commercial – domestic and Total commercial criticized exposure ratios for December 31, 2005 have been reclassified to reflect cash collateral applied to Derivative Assets that are in total commercial utilized credit exposure. |
Commercial – Domestic At December 31, 2006, approximately 80 percent of the net credit default protectioncommercial—domestic portfolio was included inBusiness Lending (business banking, middle market and large multinational corporate loans and leases) andCapital Markets and Advisory Services (acquisition and bridge financing), both withinGlobal Corporate and Investment Banking. Outstanding loans and leases inGlobal Corporate and Investment Banking increased $11.6 billion to $130.0 billion at December 31, 2006 compared to December 31, 2005 driven by organic growth. Nonperforming loans and 2004. leases declined by $45 million to $460 million driven by overall improvements in the portfolio. Net charge-offs were up $72 million from 2005 due to a lower level of recoveries. Criticized utilized exposure, excluding bridge exposure, remained essentially flat at $4.6 billion. Table 14
Net Credit Default Protection by Maturity Profile
| | | | | | | | | | December 31
| | | | | 2005
| | | 2004
| | Less than or equal to one year | | — | % | | 3 | % | Greater than one year and less than or equal to five years | | 65 | | | 87 | | Greater than five years | | 35 | | | 10 | | | | |
|
| |
|
| Total | | 100 | % | | 100 | % | | | |
|
| |
|
|
Table 15 shows our net credit default protectionThe remaining 20 percent of the commercial—domestic portfolio by credit exposure debt ratingis inGlobal Wealth and Investment Management (business-purpose loans for wealthy individuals) andGlobal Consumer and Small Business Banking (business card and small business loans). Outstanding loans and leases increased $9.8 billion to $32.0 billion at December 31, 2006 compared to December 31, 2005 driven primarily by growth inGlobal Consumer and 2004.
Small Business Banking. Growth was centered in the business card portfolio, including the addition of MBNA, and the small business portfolio. Nonperforming loans and leases increased $48 million to $124 million due to seasoning of the small business portfolio and the addition of MBNA, both withinGlobal Consumer and Small Business Banking. Loans past due 90 days or more and still accruing interest increased $153 million to $215 million primarily attributable to the business card portfolio. The increase was driven by the adoption of MBNA collection practices that have historically led to higher delinquencies but lower losses, the addition of the MBNA business card portfolio and portfolio seasoning. Net charge-offs were up $94 million from 2005 due to a $134 million increase inGlobal Consumer and Small Business Banking, partially offset by a 2006 credit loss recovery inGlobal Wealth and Investment Management. The increase in net charge-offs inGlobal Consumer and Small Business Banking was due to the addition of MBNA and seasoning of the small business and business card portfolios. Criticized utilized exposure increased $265 million to $561 million driven by an increase in the business card portfolio resulting primarily from the addition of MBNA. Table 15Commercial Real Estate
Net Credit Default ProtectionThe commercial real estate portfolio is managed inBusiness Lending withinGlobal Corporate and Investment Banking and consists of loans issued primarily to public and private developers, homebuilders and commercial real estate firms. Outstanding loans and leases increased $492 million in 2006 compared to 2005. The increase was driven by Credit Exposure Debt Ratingbusiness generated predominantly with existing clients across multiple property types.Utilized criticized exposure increased $92
| | | | | | | | | | | | | | | (Dollars in millions) | | December 31
| | | | | 2005
| | | 2004
| | Ratings
| | Net Notional
| | | Percent
| | | Net Notional
| | Percent
| | AAA | | $ | 22 | | | 0.2 | % | | $ | 89 | | 0.8 | % | AA | | | 523 | | | 3.6 | | | | 340 | | 3.1 | | A | | | 4,861 | | | 33.1 | | | | 2,884 | | 26.6 | | BBB | | | 8,572 | | | 58.2 | | | | 5,777 | | 53.3 | | BB | | | 1,792 | | | 12.2 | | | | 1,233 | | 11.4 | | B | | | 424 | | | 2.9 | | | | 250 | | 2.3 | | CCC and below | | | 149 | | | 1.0 | | | | 15 | | 0.1 | | NR(1) | | | (1,650 | ) | | (11.2 | ) | | | 260 | | 2.4 | | | | |
|
|
| |
|
| |
|
| |
|
| Total | | $ | 14,693 | | | 100.0 | % | | $ | 10,848 | | 100.0 | % | | | |
|
|
| |
|
| |
|
| |
|
|
(1) | | In addition to unrated names, “NR” includes $1,677 million in net CDS index positions. While index positions are principally investment grade, CDS indices include names in and across each of the ratings categories. |
million to $815 million driven by a $147 million increase in the utilized criticized loan and lease portfolio, attributable to the deterioration of a number of relatively small credits in a variety of property types, the largest of which is residential. The increase was partially offset by improvements centered in hotels/motels and multiple use commercial properties. Table 1618 presents outstanding commercial real estate loans and theby geographic region and property type diversification. The amounts outstanding excludediversification, excluding those commercial loans and leases secured by owner-occupied real estate. Commercial loans and leases secured by owner-occupied real estate are made on the general creditworthiness of the borrower where real estate is obtained as additional security and the ultimate repayment of the credit is not dependent on the sale, lease and rental, or refinancing of the real estate. For purposes of this table, commercial real estate reflects loans dependent on the sale lease and rental, or refinancing of the real estate as the primary source of repayment. The increase in residential property type loans was driven by higher utilizations in the for-sale housing sector due to increased construction and land cost. Table 1618 Outstanding Commercial Real Estate Loans | | | | | | | | | | December 31
| | (Dollars in millions) | | 2005
| | 2004
| By Geographic Region(1) | | | | | | | California | | $ | 7,615 | | $ | 6,293 | Northeast | | | 6,337 | | | 6,700 | Florida | | | 4,507 | | | 3,562 | Southeast | | | 4,370 | | | 3,448 | Southwest | | | 3,658 | | | 3,265 | Midwest | | | 2,595 | | | 1,860 | Northwest | | | 2,048 | | | 2,038 | Midsouth | | | 1,485 | | | 1,379 | Other | | | 873 | | | 1,184 | Geographically diversified(2) | | | 1,693 | | | 2,150 | Non-U.S. | | | 585 | | | 440 | | | |
|
| |
|
| Total | | $ | 35,766 | | $ | 32,319 | | | |
|
| |
|
| By Property Type | | | | | | | Residential | | $ | 7,601 | | $ | 5,992 | Office buildings | | | 4,984 | | | 5,434 | Apartments | | | 4,461 | | | 4,940 | Shopping centers/retail | | | 4,165 | | | 4,490 | Land and land development | | | 3,715 | | | 2,388 | Industrial/warehouse | | | 3,031 | | | 2,263 | Multiple use | | | 996 | | | 744 | Hotels/motels | | | 790 | | | 909 | Resorts | | | 183 | | | 252 | Other(3) | | | 5,840 | | | 4,907 | | | |
|
| |
|
| Total | | $ | 35,766 | | $ | 32,319 | | | |
|
| |
|
|
| | | | | | | | | | December 31 | | (Dollars in millions) | | 2006 | | 2005 | By Geographic Region(1) | | | | | | | California | | $ | 7,781 | | $ | 7,615 | Northeast | | | 6,368 | | | 6,337 | Southeast | | | 5,097 | | | 4,370 | Florida | | | 3,898 | | | 4,507 | Southwest | | | 3,787 | | | 3,658 | Midwest | | | 2,271 | | | 2,595 | Northwest | | | 2,053 | | | 2,048 | Midsouth | | | 2,006 | | | 1,485 | Other | | | 870 | | | 873 | Geographically diversified(2) | | | 1,549 | | | 1,693 | Non-U.S. | | | 578 | | | 585 | Total | | $ | 36,258 | | $ | 35,766 | By Property Type | | | | | | | Residential | | $ | 8,151 | | $ | 7,601 | Office buildings | | | 4,823 | | | 4,984 | Apartments | | | 4,277 | | | 4,461 | Land and land development | | | 3,956 | | | 3,715 | Shopping centers/retail | | | 3,955 | | | 4,165 | Industrial/warehouse | | | 3,247 | | | 3,031 | Multiple use | | | 1,257 | | | 996 | Hotels/motels | | | 1,185 | | | 790 | Resorts | | | 180 | | | 183 | Other(3) | | | 5,227 | | | 5,840 | Total | | $ | 36,258 | | $ | 35,766 |
(1) | | Distribution is based on geographic location of collateral. Geographic regions are in the U.S. unless otherwise noted. |
(2) | | The geographically diversified category is comprised primarily of unsecured outstandings to real estate investment trusts and national homebuilders whose portfolios of properties span multiple geographic regions. |
(3) | | Represents loans to borrowers whose primary business is commercial real estate, but the exposure is not secured by the listed property types. |
Commercial Lease Financing The commercial lease financing portfolio is managed inForeign PortfolioBusiness Lending withinGlobal Corporate and Investment Banking. Outstanding loans and leases increased $1.2 billion in 2006 compared to 2005 due to organic growth. Net charge-offs decreased $259 million compared to the prior year as 2005 included a higher level of airline industry charge-offs. Commercial—Foreign Table 17 sets forth total The commercial—foreign exposure broken outportfolio is managed primarily inBusiness Lending andCapital Markets and Advisory Services, both withinGlobal Corporate and Investment Banking. Outstanding loans and leases declined by region$649 million at
December 31, 2006 compared to December 31, 2005 and 2004. Total foreign exposure is defined to include credit exposure, net of local liabilities, plus securities and other investments for all exposure with a country of risk other thandriven by the United States. Table 17
Regional Foreign Exposure(1)
| | | | | | | | | | December 31
| | (Dollars in millions) | | 2005
| | 2004
| Europe | | $ | 61,953 | | $ | 62,428 | Asia Pacific(2) | | | 14,113 | | | 10,736 | Latin America(3) | | | 10,651 | | | 10,948 | Middle East | | | 616 | | | 527 | Africa | | | 110 | | | 238 | Other(4) | | | 4,778 | | | 5,327 | | | |
|
| |
|
| Total | | $ | 92,221 | | $ | 90,204 | | | |
|
| |
|
|
(1) | | Reflects the subtraction of local funding or liabilities from local exposures asallowed by the Federal Financial Institutions Examination Council (FFIEC). |
(2) | | Includes Australia and New Zealand. |
(3) | | Includes Bermuda and Cayman Islands. |
(4) | | Other includes Canada and supranational entities. |
Our total foreign exposure was $92.2 billion at December 31, 2005, an increase of $2.0 billion from December 31, 2004. Our foreign exposure was concentrated in Europe, which accounted for $62.0 billion, or 67 percent, of total foreign exposure. The European exposure was mostly in Western Europe and was distributed across a variety of industries with the largest concentration in the banking sector that accounted for 47 percent of the total exposure in Europe. At December 31, 2005, the United Kingdom and Germany were the only countries whose total cross-border outstandings exceeded 0.75 percentsale of our total assets.
Our second largest foreign exposure of $14.1 billion, or 15 percent, was inBrazilian operations and Asia Pacific as growth in the total foreign exposure during 2005 was concentrated in that region. Our $3.0 billion equity investment in CCB was the most significant driver of the growth. Latin America accounted for $10.7 billion, or 12 percent, of total foreign exposure. The decline in exposure in Latin America during 2005 was primarily due to the sales of branch assets in Peru, Colombia and Panama as well as the reduction of exposure in Argentina,Commercial Banking business, partially offset by an increase in Mexico. For more information on our Asia Pacific and Latin America exposure, see discussion in the foreign exposure to selected countries defined as emerging markets on page 58.
As shown in Table 18, at December 31, 2005 and 2004, the United Kingdom had total cross-border exposure of $22.9 billion and $11.9 billion, representing 1.78 percent and 1.07 percent of total assets. At December 31, 2005 and 2004, Germany had total cross-border exposure of $12.5 billion and $12.0 billion, representing 0.97 percent and 1.08 percent of total assets. At December 31, 2005, the largest concentration of the exposure to these countries was in the private sector.
Table 18
Total Cross-border Exposure Exceeding One Percent of Total Assets(1,2)
| | | | | | | | | | | | | | | | | | | (Dollars in millions) | | December 31
| | Public
Sector
| | Banks
| | Private
Sector
| | Cross-
border
Exposure
| | Exposure as a Percentage
of Total Assets
(Restated)
| | United Kingdom | | 2005 | | $ | 298 | | $ | 8,915 | | $ | 13,727 | | $ | 22,940 | | 1.78 | % | | | | 2004 | | | 74 | | | 3,239 | | | 8,606 | | | 11,919 | | 1.07 | | | | | 2003 | | | 143 | | | 3,426 | | | 6,552 | | | 10,121 | | 1.41 | | | | | | | | | Germany | | 2005 | | $ | 285 | | $ | 5,751 | | $ | 6,484 | | $ | 12,520 | | 0.97 | % | | | | 2004 | | | 659 | | | 6,251 | | | 5,081 | | | 11,991 | | 1.08 | | | | | 2003 | | | 441 | | | 3,436 | | | 2,978 | | | 6,855 | | 0.95 | |
(1) | | Exposure includes cross-border claims by our foreign offices as follows: loans, accrued interest receivable, acceptances, time deposits placed, trading account assets, securities, derivative assets, other interest-earning investments and other monetary assets. Amounts also include unused commitments, SBLCs, commercial letters of credit and formal guarantees. Sector definitions are based on the FFIEC instructions for preparing the Country Exposure Report. |
(2) | | The total cross-border exposure for the United Kingdom and Germany at December 31, 2005 includes derivatives exposure of $2.3 billion and $3.4 billion, against which we hold collateral totaling $1.9 billion and $2.6 billion. |
As shown in Table 19, at December 31, 2005, foreign exposure to borrowers or counterparties in emerging markets increased by $1.6 billion to $17.2 billion compared to $15.6 billion at December 31, 2004, and represented 19 percent and 17 percent of total foreign exposure at December 31, 2005 and 2004.
At December 31, 2005, 51 percent of the emerging markets exposure was in Asia Pacific, compared to 40 percent at December 31, 2004. Asia Pacific emerging markets exposure increased by $2.4 billionincreases due to our $3.0 billion equity investmentorganic growth, principally in CCB partially offset by declines in other countries.
At December 31, 2005, 48 percent of the emerging marketsWestern Europe. Nonperforming loans and criticized utilized exposure, was in Latin America compared to 58 percent at December 31, 2004. Driving the decrease in Latin America were mostly lower exposures in Other Latin Americaexcluding bridge exposure, decreased $21 million and Argentina, partially offset by an increase in Mexico. Lower exposures in Other Latin America were$215 million, respectively, primarily attributable to the salessale of branch assetsour Brazilian operations. Commercial—foreign net charge-offs were in Peru, Colombiaa net recovery position in both 2006 and Panama,2005. The lower net recovery position in 2006 was driven by higher net charge-offs in Brazil as well as lower securities trading exposurerecoveries in Venezuela. The reduction in Argentina was mostly in cross-border exposure. Our 24.9 percent investment in Grupo Financiero Santander Serfin accounted for $2.1 billion and $1.9 billion of reported exposure in Mexico at December 31, 2005 and 2004.
Our largest exposure in Latin America was in Brazil. Our exposure in Brazil at December 31, 2005 and 2004 included $1.2 billion and $1.6 billion of traditional cross-border credit exposure (Loans and Leases, letters of credit, etc.), and $2.2 billion and $1.8 billion of local country exposure net of local liabilities.
We had risk mitigation instruments associated with certain exposures in Brazil, including structured trade related transfer risk mitigation of $830 million and $950 million, third party funding of $313 million and $286 million, and
linked certificates of deposit of $59 million and $125 million at December 31, 2005 and 2004. The resulting total foreign exposure net of risk mitigation for Brazil was $2.3 billion and $2.2 billion at December 31, 2005 and 2004.
On October 13, 2005, we announced an agreement to sell our asset management business in Mexico with $1.8 billion of assets under management to an entity in which we have a 24.9 percent investment. The sale will be completed in 2006.
In December 2005, we entered into a definitive agreement with a consortium led by Johannesburg-based Standard Bank Group Ltd for the sale of BankBoston Argentina assets and the assumption of liabilities. The transaction is subject to obtaining all necessary regulatory approvals.
Table 19 sets forth regional foreign exposure to selected countries defined as emerging markets.
Table 19
Selected Emerging Markets(1)
| | | | | | | | | | | | | | | | | | | | | | | | | | | (Dollars in millions) | | Loans and
Leases, and
Loan
Commitments
| | Other
Financing(2)
| | Derivative
Assets(3)
| | Securities/
Other
Investments(4)
| | Total
Cross- border
Exposure(5)
| | Local
Country
Exposure
Net of Local
Liabilities(6)
| | Total
Foreign
Exposure
December 31,
2005
| | Increase/
(Decrease)
from
December 31,
2004
| | Region/Country | | | | | | | | | | | | | | | | | | | | | | | | | | Asia Pacific | | | | | | | | | | | | | | | | | | | | | | | | | | China(7) | | $ | 172 | | $ | 91 | | $ | 110 | | $ | 3,031 | | $ | 3,404 | | $ | — | | $ | 3,404 | | $ | 3,296 | | India | | | 547 | | | 176 | | | 341 | | | 482 | | | 1,546 | | | 45 | | | 1,591 | | | 99 | | South Korea | | | 267 | | | 474 | | | 52 | | | 305 | | | 1,098 | | | 57 | | | 1,155 | | | (228 | ) | Taiwan | | | 266 | | | 77 | | | 84 | | | 48 | | | 475 | | | 448 | | | 923 | | | (404 | ) | Hong Kong | | | 216 | | | 76 | | | 99 | | | 216 | | | 607 | | | — | | | 607 | | | (512 | ) | Singapore | | | 209 | | | 7 | | | 45 | | | 209 | | | 470 | | | — | | | 470 | | | 130 | | Other Asia Pacific(8) | | | 46 | | | 88 | | | 43 | | | 248 | | | 425 | | | 170 | | | 595 | | | 49 | | | | |
|
| |
|
| |
|
| |
|
| |
|
| |
|
| |
|
| |
|
|
| Total Asia Pacific | | | 1,723 | | | 989 | | | 774 | | | 4,539 | | | 8,025 | | | 720 | | | 8,745 | | | 2,430 | | | | |
|
| |
|
| |
|
| |
|
| |
|
| |
|
| |
|
| |
|
|
| Latin America | | | | | | | | | | | | | | | | | | | | | | | | | | Brazil | | | 1,008 | | | 187 | | | — | | | 44 | | | 1,239 | | | 2,232 | | | 3,471 | | | (79 | ) | Mexico | | | 821 | | | 176 | | | 58 | | | 2,271 | | | 3,326 | | | — | | | 3,326 | | | 460 | | Chile | | | 236 | | | 19 | | | — | | | 8 | | | 263 | | | 717 | | | 980 | | | (200 | ) | Argentina | | | 68 | | | 24 | | | — | | | 102 | | | 194 | | | — | | | 194 | | | (197 | ) | Other Latin America(8) | | | 126 | | | 134 | | | 7 | | | 84 | | | 351 | | | 8 | | | 359 | | | (716 | ) | | | |
|
| |
|
| |
|
| |
|
| |
|
| |
|
| |
|
| |
|
|
| Total Latin America | | | 2,259 | | | 540 | | | 65 | | | 2,509 | | | 5,373 | | | 2,957 | | | 8,330 | | | (732 | ) | | | |
|
| |
|
| |
|
| |
|
| |
|
| |
|
| |
|
| |
|
|
| Central and Eastern Europe(8) | | | 26 | | | 42 | | | 9 | | | 65 | | | 142 | | | — | | | 142 | | | (99 | ) | | | |
|
| |
|
| |
|
| |
|
| |
|
| |
|
| |
|
| |
|
|
| Total | | $ | 4,008 | | $ | 1,571 | | $ | 848 | | $ | 7,113 | | $ | 13,540 | | $ | 3,677 | | $ | 17,217 | | $ | 1,599 | | | | |
|
| |
|
| |
|
| |
|
| |
|
| |
|
| |
|
| |
|
|
|
(1) | | There is no generally accepted definition of emerging markets. The definition that we use includes all countries in Latin America excluding Cayman Islands and Bermuda; all countries in Asia Pacific excluding Japan, Australia and New Zealand; and all countries in Central and Eastern Europe excluding Greece. |
(2) | | Includes acceptances, SBLCs, commercial letters of credit and formal guarantees. |
(3) | | Derivative assets are reported on a mark-to-market basis and have not been reduced by the amount of collateral applied. Derivative asset collateral totaled $58 million and $361 million at December 31, 2005 and 2004. |
(4) | | Generally, cross-border resale agreements are presented basedAsia. For additional information on the domicile of the counterparty because the counterparty has the legal obligation for repayment except where the underlying securities are U.S. Treasuries, in which case the domicile is the U.S., and therefore, excluded from this presentation. For regulatory reporting under FFIEC guidelines, cross-border resale agreements are presented based on the domicile of the issuer of the securities that are held as collateral. |
(5) | | Cross-border exposure includes amounts payable to us by borrowers or counterparties with a country of residence other than the one in which the credit is booked, regardless of the currency in which the claim is denominated, consistent with FFIEC reporting rules. |
(6) | | Local country exposure includes amounts payable to us by borrowers with a country of residence in which the credit is booked, regardless of the currency in which the claim is denominated. Management subtracts local funding or liabilities from local exposures as allowed by the FFIEC. Total amount of available local liabilities funding local country exposure at December 31, 2005 was $24.2 billion compared to $17.2 billion at December 31, 2004. Local liabilities at December 31, 2005 in Asia Pacific and Latin America were $13.6 billion and $10.6 billion of which $8.4 billion were in Hong Kong, $5.3 billion in Brazil, $3.1 billion in Singapore, $1.7 billion in Argentina, $1.6 billion in Chile, $1.2 billion in Mexico, $782 million in India and $718 million in Uruguay. There were no other countries with available local liabilities funding local country exposure greater than $500 million. |
(7) | | Securities/Other Investments includes equity investment of $3.0 billion in CCB. |
(8) | | Other Asia Pacific, Other Latin America, and Central and Eastern Europe include countries each with total foreign exposure of less than $300 million. |
Commercial Portfolio Credit Quality Performance
Overall commercial credit quality continued to improve in 2005; however, the rate of improvement slowed in the second half of the year.
Table 20 presents commercial net charge-offs and net charge-off ratios for 2005 and 2004.
Table 20
Commercial Net Charge-offs and Net Charge-off Ratios(1)
| | | | | | | | | | | | | | | | | | 2005
| | | 2004
| | | (Dollars in millions) | | Amount
| | | Percent
| | | Amount
| | | Percent
| | Commercial—domestic | | $ | 170 | | | 0.13 | % | | $ | 177 | | | 0.15 | % | Commercial real estate | | | — | | | — | | | | (3 | ) | | (0.01 | ) | Commercial lease financing | | | 231 | | | 1.13 | | | | 9 | | | 0.05 | | Commercial—foreign | | | (72 | ) | | (0.39 | ) | | | 173 | | | 1.05 | | | | |
|
|
| | | | |
|
|
| | | | Total commercial | | $ | 329 | | | 0.16 | % | | $ | 356 | | | 0.20 | % | | | |
|
|
| |
|
| |
|
|
| |
|
|
(1) | | Percentage amounts are calculated as net charge-offs divided by average outstanding loans and leases during the year for each loan category. |
Commercial net charge-offs were $329 million for 2005 compared to $356 million for 2004. Commercial lease financing net charge-offs increased $222 million in 2005 compared to 2004 primarily due to the domestic airline industry. Commercial—foreign net recoveries were $72 million in 2005 compared to net charge-offs of $173 million in 2004. Recoveries were centered in Bermuda, Latin America, India and the United Kingdom. Commercial—foreign net charge-offs of $173 million in 2004 were primarily related to one borrower in the food products industry.
As presented in Table 21, commercial criticized credit exposure decreased $2.7 billion, or 27 percent, to $7.5 billion at December 31, 2005. The net decrease was driven by $9.9 billion of paydowns, payoffs, credit quality improvements, charge-offs principally related to the domestic airline industry, and loan sales. Reductions were distributed across many industries of which the largest were airlines, utilities and media. These decreases were partially offset by $7.2 billion of newly criticized exposure.Global Business and Financial Services accounted for 54 percent, or $1.5 billion, of the decrease in commercial criticized exposure centered inCommercial Aviation,Latin America andMiddle Market Banking,which comprised 20 percent, 15 percent and 9 percent of the total decrease.Global Capital Markets and Investment Banking accounted for 33 percent, or $896 million, of the decrease in criticized exposure.
Table 21
Commercial Criticized Exposure(1)
| | | | | | | | | | | | | | | | December 31
| | | | | 2005
| | | 2004
| | | (Dollars in millions) | | Amount
| | Percent(2)
| | | Amount
| | Percent(2)
| | Commercial—domestic | | $ | 5,259 | | 2.62 | % | | $ | 6,340 | | 3.38 | % | Commercial real estate | | | 723 | | 1.63 | | | | 1,028 | | 2.54 | | Commercial lease financing | | | 611 | | 2.95 | | | | 1,347 | | 6.38 | | Commercial—foreign | | | 934 | | 1.73 | | | | 1,534 | | 3.12 | | | | |
|
| | | | |
|
| | | | Total commercial criticized exposure | | $ | 7,527 | | 2.35 | % | | $ | 10,249 | | 3.44 | % | | | |
|
| |
|
| |
|
| |
|
|
(1) | | Criticized exposure corresponds to the Special Mention, Substandard and Doubtful asset categories defined by regulatory authorities. Exposure amounts include loans and leases, SBLCs and financial guarantees, derivative assets, assets held-for-sale and commercial letters of credit. |
(2) | | Commercial criticized exposure is taken as a percentage of total commercial utilized exposure. |
We routinely review the loan and lease portfolio to determine if any credit exposure should be placed on nonperforming status. An asset is placed on nonperforming status when it is determined that full collection of principal and/or interest in accordance with its contractual terms is not probable. As presented in Table 22, nonperforming commercial assets decreased $891 million to $757 million at December 31, 2005 due primarily to the $749 million decrease in nonperforming commercial loans and leases.
The decrease in total nonperforming commercial loans and leases primarily resulted from paydowns and payoffs of $686 million, gross charge-offs of $669 million, returns to performing status of $152 million and loan sales of $108 million. These decreases were partially offset by new nonaccrual loans of $929 million.
Nonperforming commercial—domestic loans and leases decreased by $274 million and represented 0.41 percent of commercial—domestic loans and leases at December 31, 2005 compared to 0.70 percent at December 31, 2004. The improvement in the percentage of nonperforming commercial—domestic to total commercial—domestic was driven by a broad-based decrease in nonperforming loans and leases across several industries, the largest of which were utilities, and metals and mining. Nonperforming commercial lease financing decreased $204 million primarily due to the previously mentioned charge-offs associated with the domestic airline industry, and represented 0.30 percent of commercial lease financing at December 31, 2005 compared to 1.26 percent at December 31, 2004. Nonperforming commercial—foreign decreased $233 million and represented 0.16 percent of commercial—foreign at December 31, 2005 comparedportfolio, refer to 1.45 percent at December 31, 2004. The improvement in the percentage of nonperforming commercial—foreign to total commercial—foreign was attributable to Latin America.Foreign Portfolio discussion beginning on page 65.
The $140 million decrease in nonperforming securities from December 31, 2004 was primarily driven by an exchange of nonperforming securities for performing securities in Argentina that resulted from the completion of a government mandated securities exchange program.
Table 22 presents nonperforming commercial assets for each year in the five-year period ending December 31, 2005.
Table 22
Nonperforming Commercial Assets
| | | | | | | | | | | | | | | | | | | | | | | | December 31
| | | (Dollars in millions) | | 2005
| | | 2004
| | | 2003
| | | 2002
| | | 2001
| | Nonperforming commercial loans and leases | | | | | | | | | | | | | | | | | | | | | Commercial—domestic | | $ | 581 | | | $ | 855 | | | $ | 1,388 | | | $ | 2,621 | | | $ | 2,991 | | Commercial real estate | | | 49 | | | | 87 | | | | 142 | | | | 164 | | | | 243 | | Commercial lease financing | | | 62 | | | | 266 | | | | 127 | | | | 160 | | | | 134 | | Commercial—foreign | | | 34 | | | | 267 | | | | 578 | | | | 1,359 | | | | 459 | | | | |
|
|
| |
|
|
| |
|
|
| |
|
|
| |
|
|
| Total nonperforming commercial loans and leases(1) | | | 726 | | | | 1,475 | | | | 2,235 | | | | 4,304 | | | | 3,827 | | Nonperforming securities(2) | | | — | | | | 140 | | | | — | | | | — | | | | — | | Commercial foreclosed properties | | | 31 | | | | 33 | | | | 67 | | | | 126 | | | | 68 | | | | |
|
|
| |
|
|
| |
|
|
| |
|
|
| |
|
|
| Total nonperforming commercial assets(3) | | $ | 757 | | | $ | 1,648 | | | $ | 2,302 | | | $ | 4,430 | | | $ | 3,895 | | | | |
|
|
| |
|
|
| |
|
|
| |
|
|
| |
|
|
| Nonperforming commercial loans and leases as a percentage of outstanding commercial loans and leases | | | 0.33 | % | | | 0.76 | % | | | 1.70 | % | | | 2.96 | % | | | 2.33 | % | Nonperforming commercial assets as a percentage of outstanding commercial loans, leases and foreclosed properties | | | 0.35 | | | | 0.85 | | | | 1.75 | | | | 3.05 | | | | 2.38 | | | | |
|
|
| |
|
|
| |
|
|
| |
|
|
| |
|
|
|
(1) | | In 2005, $51 million in Interest Income was estimated to be contractually due on nonperforming commercial loans and leases classified as nonperforming at December 31, 2005, including troubled debt restructured loans of which $31 million were performing at December 31, 2005 and not included in the table above. Approximately $15 million of the estimated $51 million in contractual interest was received and included in net income for 2005. |
(2) | | Primarily related to international securities held in the AFS portfolio. |
(3) | | Balances do not include $45 million, $123 million, $186 million, $73 million, and $289 million of nonperforming commercial assets, primarily commercial loans held-for-sale, included in Other Assets at December 31, 2005, 2004, 2003, 2002, and 2001, respectively. |
Table 23 presents the additions and reductions to nonperforming assets in the commercial portfolio during 2005 and 2004.
Table 23
Nonperforming Commercial Assets Activity Table 19 presents the additions and reductions to nonperforming assets in the commercial portfolio during 2006 and 2005. | | | | | | | | | | (Dollars in millions) | | 2005
| | | 2004
| | Nonperforming loans and leases | | | | | | | | | Balance, January 1 | | $ | 1,475 | | | $ | 2,235 | | | | |
|
|
| |
|
|
| Additions to nonperforming loans and leases: | | | | | | | | | FleetBoston balance, April 1, 2004 | | | — | | | | 948 | | New nonaccrual loans and leases | | | 892 | | | | 1,272 | | Advances | | | 37 | | | | 82 | | | | | Reductions in nonperforming loans and leases: | | | | | | | | | Paydowns and payoffs | | | (686 | ) | | | (1,392 | ) | Sales | | | (108 | ) | | | (515 | ) | Returns to performing status(1) | | | (152 | ) | | | (348 | ) | Charge-offs(2) | | | (669 | ) | | | (640 | ) | Transfers to loans held-for-sale | | | (44 | ) | | | (145 | ) | Transfers to foreclosed properties | | | (19 | ) | | | (22 | ) | | | |
|
|
| |
|
|
| Total net reductions in nonperforming loans and leases | | | (749 | ) | | | (760 | ) | | | |
|
|
| |
|
|
| Total nonperforming loans and leases, December 31 | | | 726 | | | | 1,475 | | | | |
|
|
| |
|
|
| Nonperforming securities | | | | | | | | | Balance, January 1 | | | 140 | | | | — | | | | |
|
|
| |
|
|
| Additions to nonperforming securities: | | | | | | | | | FleetBoston balance, April 1, 2004 | | | — | | | | 135 | | New nonaccrual securities | | | 15 | | | | 56 | | Reductions in nonperforming securities: | | | | | | | | | Paydowns, payoffs, and exchanges | | | (144 | ) | | | (39 | ) | Sales | | | (11 | ) | | | (12 | ) | | | |
|
|
| |
|
|
| Total net additions to (reductions in) nonperforming securities | | | (140 | ) | | | 140 | | | | |
|
|
| |
|
|
| Total nonperforming securities, December 31 | | | — | | | | 140 | | | | |
|
|
| |
|
|
| Foreclosed properties | | | | | | | | | Balance, January 1 | | | 33 | | | | 67 | | | | |
|
|
| |
|
|
| Additions to foreclosed properties: | | | | | | | | | FleetBoston balance, April 1, 2004 | | | — | | | | 9 | | New foreclosed properties | | | 32 | | | | 44 | | Reductions in foreclosed properties: | | | | | | | | | Sales | | | (24 | ) | | | (74 | ) | Writedowns | | | (8 | ) | | | (13 | ) | Charge-offs | | | (2 | ) | | | — | | | | |
|
|
| |
|
|
| Total net reductions in foreclosed properties | | | (2 | ) | | | (34 | ) | | | |
|
|
| |
|
|
| Total foreclosed properties, December 31 | | | 31 | | | | 33 | | | | |
|
|
| |
|
|
| Nonperforming commercial assets, December 31 | | $ | 757 | | | $ | 1,648 | | | | |
|
|
| |
|
|
|
Table 19 Nonperforming Commercial Assets Activity(1) | | | | | | | | | | (Dollars in millions) | | 2006 | | | 2005 | | Nonperforming loans and leases | | | | | | | | | Balance, January 1 | | $ | 726 | | | $ | 1,475 | | Additions to nonperforming loans and leases: | | | | | | | | | New nonaccrual loans and leases | | | 980 | | | | 892 | | Advances | | | 32 | | | | 37 | | Reductions in nonperforming loans and leases: | | | | | | | | | Paydowns and payoffs | | | (403) | | | | (686 | ) | Sales | | | (152) | | | | (108 | ) | Returns to performing status(2) | | | (80) | | | | (152 | ) | Charge-offs(3) | | | (331) | | | | (669 | ) | Transfers to foreclosed properties | | | (3) | | | | (19 | ) | Transfers to loans held-for-sale | | | (12) | | | | (44 | ) | Total net additions to (reductions in) nonperforming loans and leases | | | 31 | | | | (749 | ) | Total nonperforming loans and leases, December 31(4) | | | 757 | | | | 726 | | Foreclosed properties | | | | | | | | | Balance, January 1 | | | 31 | | | | 33 | | Additions to foreclosed properties: | | | | | | | | | New foreclosed properties | | | 6 | | | | 32 | | Reductions in foreclosed properties: | | | | | | | | | Sales | | | (18) | | | | (24 | ) | Writedowns | | | (9) | | | | (8 | ) | Charge-offs | | | — | | | | (2 | ) | Total net reductions in foreclosed properties | | | (21) | | | | (2 | ) | Total foreclosed properties, December 31 | | | 10 | | | | 31 | | Nonperforming commercial assets, December 31(5) | | $ | 767 | | | $ | 757 | | Nonperforming commercial loans and leases as a percentage of outstanding commercial loans and leases | | | 0.31 | % | | | 0.33 | % | Nonperforming commercial assets as a percentage of outstanding commercial loans, leases and foreclosed properties | | | 0.32 | % | | | 0.35 | % |
(1) | During 2005, nonperforming securities were reduced by $140 million primarily through exchanges resulting in a zero balance at December 31, 2005. |
(2) | Commercial loans and leases may be restored to performing status when all principal and interest is current and full repayment of the remaining contractual principal and interest is expected, or when the loan otherwise becomes well securedwell-secured and is in the process of collection. |
(2)(3) | | Certain loan and lease products, including commercial creditbusiness card, are not classified as nonperforming; therefore, the charge-offs on these loans arehave no impact on nonperforming activity. |
(4) | In 2006, $85 million in Interest Income was estimated to be contractually due on nonperforming commercial loans and leases classified as nonperforming at December 31, 2006, including troubled debt restructured loans of which $2 million were performing at December 31, 2006 and not included in the table above. Approximately $38 million of the estimated $85 million in contractual interest was received and included in Net Income for 2006. |
(5) | Balances do not include nonperforming loans held-for-sale included in Other Assets of $50 million and $45 million at December 31, 2006 and 2005. |
Table 20 presents commercial committed credit exposure and the net credit default protection portfolio by industry. Our commercial credit exposure is diversified across a broad range of industries. Total commercial credit exposure increased by $53.8 billion, or 10 percent, in 2006 compared to 2005. Banks increased by $5.9 billion, or 19 percent due to increased activity inCapital Markets and Advisory Services withinGlobal Corporate and Investment Banking, primarily in Australia and the United Kingdom. Government and public education increased $5.9 billion, or 18 percent, due primarily to growth concentrated in U.S. state and local entities, including both government and public education, consistent with our growth strategy for this sector. Healthcare equipment and services, and media increased $5.6 billion, or 22 percent, and $3.8 billion, or 25 percent, respectively, of which $2.3 billion and $2.5 billion was attributable to bridge and/or syndicated loan commitments, most of which are expected to be distributed in the normal course of executing our “originate to distribute” strategy. MBNA also contributed to growth in a number of industries, including healthcare equipment and services, and individuals and trusts. Credit protection is purchased to cover the funded portion as well as the unfunded portion of certain credit exposure. To lessen the cost of obtaining our desired credit protection levels, credit exposure may be added within an industry, borrower or counterparty group by selling protection. Since December 31, 2005, our net credit default protection purchased has been reduced by $6.4 billion reflecting our view of the underlying risk in our credit portfolio and our near term outlook on the credit environment. At December 31, 2006 and 2005, Other Assets included commercial loans held-for-salewe had net notional credit default protection purchased in our credit derivatives portfolio of $7.3$8.3 billion and $14.7 billion. The net cost of credit default protection, including mark-to-market impacts, resulted in net losses of $241 million in 2006 compared to net gains of $49 million in 2005. Losses in 2006 primarily reflected the impact of credit spreads tightening across most of our hedge positions. The average Value-at-Risk (VAR) for these credit derivative hedges was $54 million and $69 million for the twelve months ended December 31, 2006 and 2005. The decrease in VAR was driven by a decrease in the average amount of credit protection outstanding during the period. There is a diversification effect between the credit derivative hedges and the market-based trading portfolio such that their combined average VAR was $57 million and $62 million for the twelve months ended December 31, 2006 and 2005. Refer to the discussion on page 73 for a description of our VAR calculation for the market-based trading portfolio. Table 20 Commercial Credit Exposure and Net Credit Default Protection by Industry(1) | | | | | | | | | | | | | | | | | | | | | | | | | | | | December 31 | | | | Commercial Utilized | | Total Commercial
Committed | | | | Net Credit Default
Protection(2) | | (Dollars in millions) | | 2006 | | 2005 | | 2006 | | 2005 | | | | 2006 | | | 2005 | Real estate (3) | | $ | 49,208 | | $ | 47,580 | | $ | 73,493 | | $ | 70,373 | | | | $ | (704 | ) | | $ | (1,305 | ) | | | Diversified financials | | | 24,802 | | | 24,975 | | | 67,027 | | | 64,073 | | | | | (121 | ) | | | (250 | ) | | | Retailing | | | 27,226 | | | 25,189 | | | 44,064 | | | 41,967 | | | | | (581 | ) | | | (1,134 | ) | | | Government and public education | | | 22,495 | | | 19,041 | | | 39,254 | | | 33,350 | | | | | (25 | ) | | | — | | | | Capital goods | | | 16,804 | | | 15,337 | | | 37,337 | | | 33,004 | | | | | (402 | ) | | | (741 | ) | | | Banks | | | 26,405 | | | 21,755 | | | 36,735 | | | 30,811 | | | | | (409 | ) | | | (315 | ) | | | Consumer services | | | 19,108 | | | 17,481 | | | 32,651 | | | 29,495 | | | | | (433 | ) | | | (788 | ) | | | Healthcare equipment and services | | | 15,787 | | | 13,455 | | | 31,095 | | | 25,494 | | | | | (249 | ) | | | (709 | ) | | | Individuals and trusts | | | 18,792 | | | 16,754 | | | 29,167 | | | 24,348 | | | | | 3 | | | | (30 | ) | | | Materials | | | 15,882 | | | 16,754 | | | 28,693 | | | 28,893 | | | | | (630 | ) | | | (1,119 | ) | | | Commercial services and supplies | | | 15,204 | | | 13,038 | | | 23,512 | | | 21,152 | | | | | (372 | ) | | | (472 | ) | | | Food, beverage and tobacco | | | 11,341 | | | 11,194 | | | 21,081 | | | 20,590 | | | | | (319 | ) | | | (580 | ) | | | Media | | | 8,659 | | | 6,701 | | | 19,056 | | | 15,250 | | | | | (871 | ) | | | (1,790 | ) | | | Energy | | | 9,350 | | | 9,061 | | | 18,405 | | | 17,099 | | | | | (236 | ) | | | (589 | ) | | | Utilities | | | 4,951 | | | 5,507 | | | 17,221 | | | 15,182 | | | | | (362 | ) | | | (899 | ) | | | Transportation | | | 11,451 | | | 11,297 | | | 17,189 | | | 16,980 | | | | | (219 | ) | | | (323 | ) | | | Insurance | | | 6,573 | | | 4,745 | | | 14,121 | | | 13,868 | | | | | (446 | ) | | | (1,493 | ) | | | Religious and social organizations | | | 7,840 | | | 7,426 | | | 10,507 | | | 10,022 | | | | | — | | | | — | | | | Consumer durables and apparel | | | 4,820 | | | 5,142 | | | 9,117 | | | 9,318 | | | | | (170 | ) | | | (475 | ) | | | Technology hardware and equipment | | | 3,279 | | | 3,116 | | | 8,046 | | | 7,171 | | | | | (38 | ) | | | (402 | ) | | | Telecommunication services | | | 3,513 | | | 3,520 | | | 7,929 | | | 9,193 | | | | | (1,104 | ) | | | (1,205 | ) | | | Pharmaceuticals and biotechnology | | | 2,530 | | | 1,675 | | | 6,289 | | | 4,906 | | | | | (181 | ) | | | (470 | ) | | | Software and services | | | 2,757 | | | 2,573 | | | 6,206 | | | 5,708 | | | | | (126 | ) | | | (299 | ) | | | Automobiles and components | | | 1,529 | | | 1,602 | | | 5,098 | | | 5,878 | | | | | (483 | ) | | | (679 | ) | | | Food and staples retailing | | | 2,153 | | | 2,258 | | | 4,222 | | | 4,241 | | | | | (116 | ) | | | (324 | ) | | | Household and personal products | | | 720 | | | 536 | | | 2,205 | | | 1,669 | | | | | 50 | | | | 75 | | | | Semiconductors and semiconductor equipment | | | 802 | | | 536 | | | 1,364 | | | 1,119 | | | | | (18 | ) | | | (54 | ) | | | Other | | | 6,396 | | | 2,503 | | | 6,825 | | | 2,926 | | | | | 302 | (4) | | | 1,677 | (4) | | | Total | | $ | 340,377 | | $ | 310,751 | | $ | 617,909 | | $ | 564,080 | | | | $ | (8,260 | ) | | $ | (14,693 | ) | | |
(1) | December 31, 2005 industry balances have been reclassified to reflect the realignment of industry codes utilizing Standard & Poor’s industry classifications and internal industry management. |
(2) | Net notional credit default protection purchased is shown as negative amounts and the net notional credit protection sold is shown as positive amounts. |
(3) | Industries are viewed from a variety of perspectives to best isolate the perceived risks. For purposes of this table, the real estate industry is defined based upon the borrowers’ or counterparties’ primary business activity using operating cash flow and primary source of repayment as key factors. |
(4) | Represents net credit default swaps index positions, including tranched index exposure, which were principally investment grade. Indices are comprised of corporate credit derivatives that trade as an aggregate index value. Generally, they are grouped into portfolios based on specific ratings of credit quality or global geographic location. As of December 31, 2006 and 2005, credit default swap index positions were sold to reflect our view of the credit markets. |
Tables 21 and 22 present the maturity profiles and the credit exposure debt ratings of the net credit default protection portfolio at December 31, 2006 and 2005. Table 21 Net Credit Default Protection by Maturity Profile | | | | | | | | | | December 31 | | | | | 2006 | | | 2005 | | Less than or equal to one year | | 7 | % | | — | % | Greater than one year and less than or equal to five years | | 46 | | | 65 | | Greater than five years | | 47 | | | 35 | | Total | | 100 | % | | 100 | % |
Table 22 Net Credit Default Protection by Credit Exposure Debt Rating (1) | | | | | | | | | | | | | | | | (Dollars in millions) | | December 31, 2006 | | | December 31, 2005 | | | Ratings | | Net Notional | | | Percent | | | Net Notional | | | Percent | | AAA | | $ | (23 | ) | | 0.3 | % | | $ | (22 | ) | | 0.2 | % | AA | | | (237 | ) | | 2.9 | | | | (523 | ) | | 3.6 | | A | | | (2,598 | ) | | 31.5 | | | | (4,861 | ) | | 33.1 | | BBB | | | (3,968 | ) | | 48.0 | | | | (8,572 | ) | | 58.2 | | BB | | | (1,341 | ) | | 16.2 | | | | (1,792 | ) | | 12.2 | | B | | | (334 | ) | | 4.0 | | | | (424 | ) | | 2.9 | | CCC and below | | | (50 | ) | | 0.6 | | | | (149 | ) | | 1.0 | | NR(2) | | | 291 | | | (3.5 | ) | | | 1,650 | | | (11.2 | ) | Total | | $ | (8,260 | ) | | 100.0 | % | | $ | (14,693 | ) | | 100.0 | % |
(1) | In order to mitigate the cost of purchasing credit protection, credit exposure can be added by selling credit protection. The distribution of debt rating for net notional credit default protection purchased is shown as negative amounts and the net notional credit protection sold is shown as positive amounts. |
(2) | In addition to unrated names, “NR” includes $302 million and $1.7 billion in net credit default swaps index positions at December 31, 2006 and 2005. While index positions are principally investment grade, credit default swaps indices include names in and across each of the ratings categories. |
Our foreign credit and trading portfolio is subject to country risk. We define country risk as the risk of loss from unfavorable economic and political developments, currency fluctuations, social instability and changes in government policies. A risk management framework is in place to measure, monitor and manage foreign risk and exposures. Management oversight of country risk including cross-border risk is provided by the Country Risk Committee. Table 23 presents total foreign exposure broken out by region at December 31, 2006 and 2005. Total foreign exposure includes credit exposure net of local liabilities, securities, and other investments domiciled in countries other than the United States. Credit card exposure is reported on a funded basis. Total foreign exposure can be adjusted for externally guaranteed outstandings and certain collateral types. Outstandings which $45 millionare assigned external guarantees are reported under the country of the guarantor. Outstandings with tangible collateral are reflected in the country where the collateral is held. For securities received, other than cross-border resale agreements, outstandings are assigned to the domicile of the issuer of the securities. In regulatory reports under Federal Financial Institutions Examination Council (FFIEC) guidelines, cross-border resale agreements are presented based on the domicile of the issuer of the securities that are held as collateral. However, for the purpose of the following tables, resale agreements are generally presented based on the domicile of the counterparty because the counterparty has the legal obligation for repayment. Table 23 Regional Foreign Exposure(1,2) | | | | | | | | | | December 31 | | (Dollars in millions) | | 2006 | | 2005 | Europe | | $ | 85,279 | | $ | 55,068 | Asia Pacific(3) | | | 27,403 | | | 13,938 | Latin America(4) | | | 8,998 | | | 10,551 | Middle East | | | 811 | | | 616 | Africa | | | 317 | | | 86 | Other(5) | | | 7,131 | | | 4,550 | Total | | $ | 129,939 | | $ | 84,809 |
(1) | Generally, cross-border resale agreements are presented based on the domicile of the counterparty because the counterparty has the legal obligation for repayment except where the underlying securities are U.S. Treasuries, in which case the domicile is the U.S., and are therefore excluded from this presentation. For regulatory reporting under FFIEC guidelines, cross-border resale agreements are presented based on the domicile of the issuer of the securities that are held as collateral. |
(2) | Derivative assets are reported on a mark-to-market basis and have been reduced by the amount of cash collateral applied of $4.3 billion and $7.4 billion at December 31, 2006 and 2005. |
(3) | Includes Australia and New Zealand. |
(4) | Includes Bermuda and Cayman Islands. |
(5) | Other includes Canada and supranational entities. |
Our total foreign exposure was nonperforming,$129.9 billion at December 31, 2006, an increase of $45.1 billion from December 31, 2005. The growth in our foreign exposure during 2006 was concentrated in Europe, which accounted for $85.3 billion, or 66 percent, of total foreign exposure. The European exposure was mostly in Western Europe and leveraged lease partnership interestswas distributed across a variety of $183 million.industries with the largest concentration in the private sector which accounted for approximately 67 percent of the total exposure in Europe. The growth in Western Europe was due to the organic growth of $20.1 billion primarily driven by ourGlobal Corporate and Investment Banking business, as well as the $10.0 billion addition of MBNA exposures in the United Kingdom, Ireland and Spain. Asia Pacific was our second largest foreign exposure at $27.4 billion, or 21 percent, of total foreign exposure at December 31, 2006. The growth in Asia Pacific was driven by higher securities trading exposure primarily in Japan, South Korea and Australia. Loans and Leases, loan commitments, and other financing in Australia also contributed to the increase in Asia Pacific. Latin America accounted for $9.0 billion, or seven percent of total foreign exposure at December 31, 2006, a decline of $1.6 billion, or 15 percent, from December 31, 2005. The decline in exposure in Latin America was primarily due to the sale of our Brazilian operations, partially offset by the equity in Banco Itaú received in exchange for the sale, and a decline in local country exposure in Chile. These decreases were partially offset by an increase in cross-border exposure in Mexico. For more information on our Asia Pacific and Latin America exposure, see discussion on foreign exposure to selected countries defined as emerging markets on page 67. As presented in Table 24, at December 31, 2006 and 2005, the United Kingdom had total cross-border exposure of $17.3 billion and $21.2 billion, representing 1.18 percent and 1.64 percent of Total Assets. At December 31, 2006 and 2005, there were no nonperforming leveraged lease partnership interests.the United Kingdom was the only country whose total cross-border outstandings exceeded one percent of our total assets. At December 31, 2004, Other Assets included $1.32006, the largest concentration of the cross-border exposure to the United Kingdom was in the banking sector. At December 31, 2006 and 2005, Germany was the only country whose total cross-border outstandings of $12.6 billion and $198 million$10.0 billion were between 0.75 percent and one percent of commercial loans held-for-sale and leveraged lease partnership interests,total assets. Table 24 Total Cross-border Exposure Exceeding One Percent of which, $100 million and $23 million were nonperforming.Total Assets(1,2) | | | | | | | | | | | | | | | | | | | (Dollars in millions) | | December 31 | | Public Sector | | Banks | | Private Sector | | Cross-border
Exposure | | Exposure as a
Percentage of
Total Assets | | United Kingdom | | 2006 | | $ | 53 | | $ | 9,172 | | $ | 8,059 | | $ | 17,284 | | 1.18 | % | | | 2005 | | | 298 | | | 7,272 | | | 13,616 | | | 21,186 | | 1.64 | | | | | 2004 | | | 74 | | | 1,585 | | | 8,481 | | | 10,140 | | 0.91 | |
Commercial loans and leases 90 days
(1) | Exposure includes cross-border claims by our foreign offices as follows: loans, accrued interest receivable, acceptances, time deposits placed, trading account assets, securities, derivative assets, other interest-earning investments and other monetary assets. Amounts also include unused commitments, SBLCs, commercial letters of credit and formal guarantees. Sector definitions are based on the FFIEC instructions for preparing the Country Exposure Report. |
(2) | Derivative assets are reported on a mark-to-market basis and have been reduced by the amount of cash collateral applied of $1.2 billion, $1.8 billion, and $1.8 billion at December 31, 2006, 2005, and 2004, respectively. |
As presented in Table 25, foreign exposure to borrowers or more past due and still accruing interest, were $168 millioncounterparties in emerging markets increased $3.0 billion to $20.9 billion at December 31, 2005, an increase of $30 million2006, compared to $17.9 billion at December 31, 2004.2005. The increase was driven by commercial —foreign loansprimarily due to higher sovereign and corporate securities trading exposures in the U.K. See Note 1Asia Pacific. Foreign exposure to borrowers or counterparties in emerging markets represented 16 percent and 21 percent of the Consolidated Financial Statements for additional information on past due commercial loanstotal foreign exposure at December 31, 2006 and leases. 2005. Provision for Credit LossesTable 25
Selected Emerging Markets(1) | | | | | | | | | | | | | | | | | | | | | | | | | | | (Dollars in millions) | | Loans and
Leases, and
Loan
Commitments | | Other
Financing (2) | | Derivative
Assets(3) | | Securities/
Other
Investments (4) | | Total
Cross-
border
Exposure (5) | | Local
Country
Exposure
Net of Local
Liabilities (6) | | Total
Foreign
Exposure
December 31
2006 | | Increase/
(Decrease)
From
December 31
2005 | | Region/Country | | | | | | | | | | | | | | | | | | | | | | | | | | Asia Pacific | | | | | | | | | | | | | | | | | | | | | | | | | | China | | $ | 236 | | $ | 48 | | $ | 88 | | $ | 3,193 | | $ | 3,565 | | $ | 49 | | $ | 3,614 | | $ | 210 | | South Korea | | | 254 | | | 546 | | | 84 | | | 2,493 | | | 3,377 | | | — | | | 3,377 | | | 2,222 | | India | | | 560 | | | 423 | | | 313 | | | 739 | | | 2,035 | | | — | | | 2,035 | | | 444 | | Singapore | | | 226 | | | 9 | | | 116 | | | 521 | | | 872 | | | — | | | 872 | | | 402 | | Hong Kong | | | 345 | | | 36 | | | 56 | | | 427 | | | 864 | | | — | | | 864 | | | 305 | | Taiwan | | | 305 | | | 52 | | | 52 | | | 40 | | | 449 | | | 293 | | | 742 | | | (176 | ) | Other Asia Pacific | | | 77 | | | 22 | | | 10 | | | 482 | | | 591 | | | — | | | 591 | | | (4 | ) | Total Asia Pacific | | | 2,003 | | | 1,136 | | | 719 | | | 7,895 | | | 11,753 | | | 342 | | | 12,095 | | | 3,403 | | Latin America | | | | | | | | | | | | | | | | | | | | | | | | | | Mexico | | | 924 | | | 195 | | | 204 | | | 2,608 | | | 3,931 | | | — | | | 3,931 | | | 607 | | Brazil | | | 153 | | | 84 | | | 26 | | | 1,986 | | | 2,249 | | | 402 | | | 2,651 | | | (820 | ) | Chile | | | 221 | | | 13 | | | — | | | 9 | | | 243 | | | 83 | | | 326 | | | (654 | ) | Argentina | | | 32 | | | 17 | | | — | | | 76 | | | 125 | | | 127 | | | 252 | | | 58 | | Other Latin America | | | 108 | | | 131 | | | 10 | | | 18 | | | 267 | | | 15 | | | 282 | | | (77 | ) | Total Latin America | | | 1,438 | | | 440 | | | 240 | | | 4,697 | | | 6,815 | | | 627 | | | 7,442 | | | (886 | ) | Middle East and Africa | | | 484 | | | 261 | | | 140 | | | 231 | | | 1,116 | | | — | | | 1,116 | | | 414 | | Central and Eastern Europe | | | — | | | 68 | | | 21 | | | 126 | | | 215 | | | — | | | 215 | | | 73 | | Total | | $ | 3,925 | | $ | 1,905 | | $ | 1,120 | | $ | 12,949 | | $ | 19,899 | | $ | 969 | | $ | 20,868 | | $ | 3,004 | |
(1) | There is no generally accepted definition of emerging markets. The definition that we use includes all countries in Latin America excluding Cayman Islands and Bermuda; all countries in Asia Pacific excluding Japan, Australia and New Zealand; all countries in Middle East and Africa; and all countries in Central and Eastern Europe excluding Greece. |
(2) | Includes acceptances, standby letters of credit, commercial letters of credit and formal guarantees. |
(3) | Derivative Assets are reported on a mark-to-market basis and have been reduced by the amount of cash collateral applied of $9 million and $80 million at December 31, 2006 and 2005. There are less than $1 million of other marketable securities collateralizing derivative assets as of December 31, 2006. Derivative Assets were collateralized by $4 million of other marketable securities at December 31, 2005. |
(4) | Generally, cross-border resale agreements are presented based on the domicile of the counterparty because the counterparty has the legal obligation for repayment except where the underlying securities are U.S. Treasuries, in which case the domicile is the U.S., and are therefore excluded from this presentation. For regulatory reporting under FFIEC guidelines, cross-border resale agreements are presented based on the domicile of the issuer of the securities that are held as collateral. |
(5) | Cross-border exposure includes amounts payable to us by borrowers or counterparties with a country of residence other than the one in which the credit is booked, regardless of the currency in which the claim is denominated, consistent with FFIEC reporting rules. |
(6) | Local country exposure includes amounts payable to us by borrowers with a country of residence in which the credit is booked, regardless of the currency in which the claim is denominated. Local funding or liabilities are subtracted from local exposures as allowed by the FFIEC. Total amount of available local liabilities funding local country exposure at December 31, 2006 was $20.7 billion compared to $24.2 billion at December 31, 2005. Local liabilities at December 31, 2006 in Asia Pacific and Latin America were $14.1 billion and $6.6 billion of which $6.6 billion were in Singapore, $3.6 billion in Hong Kong, $2.5 billion in Chile, $1.9 billion in Argentina, $1.4 billion in Mexico, $1.2 billion in South Korea, $829 million in India, $784 million in Uruguay, and $669 million in China. There were no other countries with available local liabilities funding local country exposure greater than $500 million. |
At December 31, 2006, 58 percent of the emerging markets exposure was in Asia Pacific, compared to 49 percent at December 31, 2005. Asia Pacific emerging markets exposure increased by $3.4 billion. Growth was driven by higher cross-border sovereign and corporate securities trading exposure, primarily in South Korea, India and Singapore, as well as higher other financing exposure in India. Our exposure in China was primarily related to our investment in CCB at both December 31, 2006 and 2005. In December 2006, the Corporation completed the sale of its Asia Commercial Banking business to CCB. Our corporate banking and wholesale franchises are not impacted by this sale. At December 31, 2006, 36 percent of the emerging markets exposure was in Latin America compared to 47 percent at December 31, 2005. Lower exposures in Brazil and Chile were partially offset by an increase in Mexico. The decline in Brazil was related to the sale of our Brazilian operations in September 2006 in exchange principally for equity in Banco Itaú. As of December 31, 2006, our investment in Banco Itaú accounted for $1.9 billion of exposure in Brazil. The decline in Chile was due to higher local liabilities which reduced our local exposure. In August 2006, we announced a definitive agreement to sell our operations in Chile and Uruguay for equity in Banco Itaú. These transactions are expected to close in early 2007. Subsequent to the sale of our Brazilian operations and the closing of the Chile and Uruguay transactions, the Corporation will hold approximately seven percent of the equity of Banco Itaú through voting and non-voting shares. The increased exposures in Mexico were attributable to higher cross-border corporate securities trading exposure. Our 24.9 percent investment in Santander accounted for $2.3 billion and $2.1 billion of exposure in Mexico at December 31, 2006 and 2005. In December 2005, we announced a definitive agreement with a consortium led by Johannesburg-based Standard Bank Group Limited for the sale of our assets and the assumption of our liabilities in Argentina. This transaction is expected to close in early 2007. | | Provision for Credit Losses |
The Provision for Credit Losses was $4.0$5.0 billion, a 45$996 million, or 25 percent, increase over 2004. 2005. The consumer portion of the Provision for Credit Losses increased $992$367 million to $4.4$4.8 billion in 2005,compared to 2005. This increase was primarily driven by the addition of MBNA, partially offset by lower bankruptcy-related costs on the domestic consumer netcredit card portfolio. On the domestic consumer credit card portfolio, lower bankruptcy charge-offs of $4.2 billion. Credit card net charge-offs increased $1.3 billionresulting from 2004 to $3.7 billion with an estimated $578 million related tobankruptcy reform and the increase in bankruptcy filings as customers rushed to file aheadabsence of the new law. Also contributing$210 million provision recorded in 2005 to the increase in credit card net charge-offs were organic growth and seasoning of the portfolio, increases effective in 2004 in credit card minimum payment requirements, the impact of the FleetBoston portfolio and the impact of new advances on accountsestablish reserves for which previous loan balances were sold to the securitization trusts. We estimate that approximately 70 percent of the bankruptcy-related charge-offs represent acceleration of charge-offs from 2006. Excluding bankruptcy-related charge-offs representing acceleration from 2006 and charge-offs associated with the 2004 changes in credit card minimum payment requirements that were provided forpartially offset by portfolio seasoning. Consumer provision expense increased throughout the year as most products trended toward more normalized credit cost levels due to portfolio seasoning and an upward trend in late 2004,bankruptcy-related charge-offs from the unusually low levels experienced post bankruptcy reform. Credit costs in Europe increased throughout the year due to seasoning of the credit card net charge-offs wereportfolio and higher personal insolvencies in the primary driverUnited Kingdom. For discussions of higher Provision forthe impact of SOP 03-3, see Consumer Portfolio Credit Losses. In addition, the Provision for Credit Losses was impacted by new advancesRisk Management beginning on accounts for which previous loan balances were sold to the securitization trusts, and the establishment of reserves in 2005 for additional changes made in late 2005 in credit card minimum payment requirements. The establishment of a $50 million reserve associated with Hurricane Katrina for estimated losses on residential mortgage, home equity and indirect automobile products also contributed to the provision increase.page 53. The commercial portion of the Provision for Credit Losses increased $161for 2006 was $243 million compared to negative $370 million.million in 2005. The negative provisionincrease was driven by the absence in 2006 inGlobal Corporate and Investment Banking of benefits from the release of reserves in 2005 reflects continued improvement in commercial credit quality, although at a slower pace than experienced in 2004. Anrelated to an improved risk profile in Latin America and reduced uncertainties resulting fromassociated with the completionFleetBoston credit integration. Also contributing to the increase were both the addition of credit-related integration activities for FleetBoston alsoMBNA and seasoning of the business card and small business portfolios inGlobal Consumer and Small Business Banking, as well as lower recoveries in 2006 inGlobal Corporate and Investment Banking. Partially offsetting these increases were reductions inGlobal Corporate and Investment Banking commercial reserves in 2006 as a stable economic environment throughout 2006 drove the negative provision. sustained favorable commercial credit market conditions. The Provision for Credit Losses related to unfunded lending commitments increased $92was $9 million in 2006 compared to negative $7 million as the rate of improvement in commercial credit quality slowed.2005. | | Allowance for Credit Losses |
| Allowance for Credit LossesAllowance for Loan and Lease Losses |
The Allowance for Loan and Lease Losses is allocated based on two components. We evaluate the adequacy of the Allowance for Loan and Lease Losses based on the combined total of these two components. The first component of the Allowance for Loan and Lease Losses covers those commercial loans that are either nonperforming or impaired. An allowance is allocated when the discounted cash flows (or collateral value or observable market price) are lower than the carrying value of that loan. For purposes of computing the specific loss component of the allowance, larger impaired loans are evaluated individually and smaller impaired loans are evaluated as a pool using historical loss experience for the respective product type and risk rating of the loans. The second component of the Allowance for Loan and Lease Losses covers performing commercial loans and leases, and consumer loans. The allowance for commercial loan and lease losses is established by product type after analyzing historical loss experience by internal risk rating, current economic conditions, industry performance trends, geographic or obligor concentrations within each portfolio segment, and any other pertinent information. The commercial historical loss experience is updated quarterly to incorporate the most recent data reflective of the current economic environment. As of December 31, 2006, quarterly updating of historical loss experience did not have a material impact on the Allowance for Loan and Lease Losses. The allowance for consumer and certain homogeneous commercial loan and lease products is based on aggregated portfolio segment evaluations, generally by product type. Loss forecast models are utilized that consider a variety of factors including, but not limited to, historical loss experience, estimated defaults or foreclosures based on portfolio trends, delinquencies, economic trends and credit scores. These loss forecast models are updated on a quarterly basis in order to incorporate information reflective of the current economic environment. As of December 31, 2006, quarterly updating of the loss forecast models increased the Allowance for Loan and Lease Losses due to portfolio seasoning and the trend toward more normalized loss levels. Included within this second component of the Allowance for Loan and Lease Losses and determined separately from the procedures outlined above are reserves which are maintained to cover uncertainties that affect our estimate of probable losses including the imprecision inherent in the forecasting methodologies, as well as domestic and global economic uncertainty, large single name defaults and event risk. During 2006, commercial reserves were released as a stable economic environment throughout 2006 drove sustained favorable commercial credit market conditions. We monitor differences between estimated and actual incurred loan and lease losses. This monitoring process includes periodic assessments by senior management of loan and lease portfolios and the models used to estimate incurred losses in those portfolios. Additions to the Allowance for Loan and Lease Losses are made by charges to the Provision for Credit Losses. Credit exposures deemed to be uncollectible are charged against the Allowance for Loan and Lease Losses. Recoveries of previously charged off amounts are credited to the Allowance for Loan and Lease Losses. The Allowance for Loan and Lease Losses for the consumer portfolio as presented in Table 27 was $5.6 billion at December 31, 2006, an increase of $1.0 billion from December 31, 2005. This increase was primarily attributable to the addition of MBNA. The allowance for commercial loan and lease losses was $3.5 billion at December 31, 2006, a $74 million decrease from December 31, 2005. Commercial – foreign allowance levels decreased due to the sale of our Brazilian operations. The increase in commercial – domestic allowance levels was primarily attributable to the addition of MBNA partially offset by the above mentioned reductions in commercial reserves in 2006. Within the individual consumer and commercial product categories, credit card – domestic allowance levels include reductions throughout 2006 from new securitizations and reductions as reserves established in 2005 for changes in minimum payment requirements were utilized to absorb associated net charge-offs. Direct/indirect consumer allowance levels increased as the Corporation discontinued new sales of receivables into theCard Services unsecured lending securitization trusts. Commercial – domestic allowance levels also increased as reserves were established for new advances on business card accounts for which previous loan balances were sold to the securitization trusts. | | Reserve for Unfunded Lending Commitments |
In addition to the Allowance for Loan and Lease Losses, we also estimate probable losses related to unfunded lending commitments, such as letters of credit and financial guarantees, and binding unfunded loan commitments. Unfunded lending commitments are subject to individual reviews and are analyzed and segregated by risk according to our internal risk rating scale. These risk classifications, in conjunction with an analysis of historical loss experience, utilization assumptions, current economic conditions and performance trends within specific portfolio segments, and any other pertinent information result in the estimation of the reserve for unfunded lending commitments. The reserve for unfunded lending commitments is included in Accrued Expenses and Other Liabilities on the Consolidated Balance Sheet. We monitor differences between estimated and actual incurred credit losses upon draws of the commitments. This monitoring process includes periodic assessments by senior management of credit portfolios and the models used to estimate incurred losses in those portfolios. Changes to the reserve for unfunded lending commitments are made through the Provision for Credit Losses. The reserve for unfunded lending commitments at December 31, 2006 was $397 million, relatively flat with December 31, 2005. Table 26 presents a rollforward of the allowance for credit losses for 2006 and 2005. Table 26 Allowance for Credit Losses | | | | | | | | | | (Dollars in millions) | | 2006 | | | 2005 | | Allowance for loan and lease losses, January 1 | | $ | 8,045 | | | $ | 8,626 | | MBNA balance, January 1, 2006 | | | 577 | | | | — | | Loans and leases charged off | | | | | | | | | Residential mortgage | | | (74 | ) | | | (58 | ) | Credit card—domestic | | | (3,546 | ) | | | (4,018 | ) | Credit card—foreign | | | (292 | ) | | | — | | Home equity lines | | | (67 | ) | | | (46 | ) | Direct/Indirect consumer | | | (748 | ) | | | (380 | ) | Other consumer | | | (436 | ) | | | (376 | ) | Total consumer | | | (5,163 | ) | | | (4,878 | ) | Commercial—domestic | | | (597 | ) | | | (535 | ) | Commercial real estate | | | (7 | ) | | | (5 | ) | Commercial lease financing | | | (28 | ) | | | (315 | ) | Commercial—foreign | | | (86 | ) | | | (61 | ) | Total commercial | | | (718 | ) | | | (916 | ) | Total loans and leases charged off | | | (5,881 | ) | | | (5,794 | ) | Recoveries of loans and leases previously charged off | | | | | | | | | Residential mortgage | | | 35 | | | | 31 | | Credit card—domestic | | | 452 | | | | 366 | | Credit card—foreign | | | 67 | | | | — | | Home equity lines | | | 16 | | | | 15 | | Direct/Indirect consumer | | | 224 | | | | 132 | | Other consumer | | | 133 | | | | 101 | | Total consumer | | | 927 | | | | 645 | | Commercial—domestic | | | 261 | | | | 365 | | Commercial real estate | | | 4 | | | | 5 | | Commercial lease financing | | | 56 | | | | 84 | | Commercial—foreign | | | 94 | | | | 133 | | Total commercial | | | 415 | | | | 587 | | Total recoveries of loans and leases previously charged off | | | 1,342 | | | | 1,232 | | Net charge-offs | | | (4,539 | ) | | | (4,562 | ) | Provision for loan and lease losses | | | 5,001 | | | | 4,021 | | Other | | | (68 | ) | | | (40 | ) | Allowance for loan and lease losses, December 31 | | | 9,016 | | | | 8,045 | | Reserve for unfunded lending commitments, January 1 | | | 395 | | | | 402 | | Provision for unfunded lending commitments | | | 9 | | | | (7 | ) | Other | | | (7 | ) | | | — | | Reserve for unfunded lending commitments, December 31 | | | 397 | | | | 395 | | Total | | $ | 9,413 | | | $ | 8,440 | | Loans and leases outstanding at December 31 | | $ | 706,490 | | | $ | 573,791 | | Allowance for loan and lease losses as a percentage of loans and leases outstanding at December 31 | | | 1.28 | % | | | 1.40 | % | Consumer allowance for loan and lease losses as a percentage of consumer loans and leases outstanding at December 31 | | | 1.19 | | | | 1.27 | | Commercial allowance for loan and lease losses as a percentage of commercial loans and leases outstanding at December 31 | | | 1.44 | | | | 1.62 | | Average loans and leases outstanding during the year | | $ | 652,417 | | | $ | 537,218 | | Net charge-offs as a percentage of average loans and leases outstanding during the year(1) | | | 0.70 | % | | | 0.85 | % | Allowance for loan and lease losses as a percentage of total nonperforming loans and leases at December 31 | | | 505 | | | | 532 | | Ratio of the allowance for loan and lease losses at December 31 to net charge-offs(1) | | | 1.99 | | | | 1.76 | |
(1) | For 2006, the impact of SOP 03-3 decreased net charge-offs by $288 million. Excluding the impact of SOP 03-3, net charge-offs as a percentage of average loans and leases outstanding for 2006 was 0.74 percent, and the ratio of the Allowance for Loan and Lease Losses based on the combined total of these two components.to net charge-offs was 1.87 at December 31, 2006. |
For reporting purposes, we allocate the allowance for credit losses across products. However, the allowance is available to absorb any credit losses without restriction. Table 27 presents our allocation by product type. Table 27 Allocation of the Allowance for Credit Losses by Product Type | | | | | | | | | | | | | | | | | | December 31 | | | | 2006 | | | 2005 | | (Dollars in millions) | | Amount | | Percent | | | Amount | | Percent | | | | Allowance for loan and lease losses | | | | | | | | | | | | | | | Residential mortgage | | $ | 248 | | 2.8 | % | | $ | 277 | | 3.4 | % | | | Credit card—domestic | | | 3,176 | | 35.2 | | | | 3,301 | | 41.0 | | | | Credit card—foreign | | | 336 | | 3.7 | | | | — | | — | | | | Home equity lines | | | 133 | | 1.5 | | | | 136 | | 1.7 | | | | Direct/Indirect consumer | | | 1,200 | | 13.3 | | | | 421 | | 5.2 | | | | Other consumer | | | 467 | | 5.2 | | | | 380 | | 4.8 | | | | Total consumer | | | 5,560 | | 61.7 | | | | 4,515 | | 56.1 | | | | Commercial—domestic | | | 2,162 | | 24.0 | | | | 2,100 | | 26.1 | | | | Commercial real estate | | | 588 | | 6.5 | | | | 609 | | 7.6 | | | | Commercial lease financing | | | 217 | | 2.4 | | | | 232 | | 2.9 | | | | Commercial—foreign | | | 489 | | 5.4 | | | | 589 | | 7.3 | | | | Total commercial(1) | | | 3,456 | | 38.3 | | | | 3,530 | | 43.9 | | | | Allowance for loan and lease losses | | | 9,016 | | 100.0 | % | | | 8,045 | | 100.0 | % | | | Reserve for unfunded lending commitments | | | 397 | | | | | | 395 | | | | | | Total | | $ | 9,413 | | | | | $ | 8,440 | | | | | |
The first component of the Allowance for Loan and Lease Losses covers those commercial loans that are either nonperforming or impaired. An(1)
| Includes allowance is allocated when the discounted cash flows (or collateral value or observable market price) are lower than the carrying value of that loan. For purposes of computing the specific loss component of the allowance, larger impaired loans are evaluated individually and smaller impaired loans are evaluated as a pool using historical loss experience for the respective product type and risk rating of the loans. The second component of the Allowance for Loan and Lease Losses covers performing commercial loans and leases, and consumer loans. The allowance for commercial loan and lease losses is established by product type after analyzing historical loss experience by internal risk rating, current economic conditions, industry performance trends, geographic or obligor concentrations within each portfolio segment,of commercial impaired loans of $43 million and any other pertinent information. The commercial historical loss experience is updated quarterly to incorporate the most recent data reflective of the current economic environment. As of December 31, 2005, quarterly updating of historical loss experience did not have a material impact to the allowance for commercial loan and lease losses. The allowance for consumer loan and lease losses is based on aggregated portfolio segment evaluations, generally by product type. Loss forecast models are utilized for consumer products that consider a variety of factors including, but not limited to, historical loss experience, estimated defaults or foreclosures based on portfolio trends, delinquencies, economic trends and credit scores. These consumer loss forecast models are updated on a quarterly basis in order to incorporate information reflective of the current economic environment. As of December 31, 2005, quarterly updating of the loss forecast models to reflect estimated bankruptcy-related net charge-offs accelerated from 2006 resulted in a decrease in the allowance for consumer loan and lease losses.
Included within the second component of the Allowance for Loan and Lease Losses are previously unallocated reserves maintained to cover uncertainties that affect our estimate of probable losses including the imprecision inherent in the forecasting methodologies, domestic and global economic uncertainty, large single name defaults and event risk. In the fourth quarter of 2005, we assigned these reserves to our individual products to better reflect our view of risk in these portfolios.
We monitor differences between estimated and actual incurred loan and lease losses. This monitoring process includes periodic assessments by senior management of loan and lease portfolios and the models used to estimate incurred losses in those portfolios.
Additions to the Allowance for Loan and Lease Losses are made by charges to the Provision for Credit Losses. Credit exposures deemed to be uncollectible are charged against the Allowance for Loan and Lease Losses. Recoveries of previously charged off amounts are credited to the Allowance for Loan and Lease Losses.
The Allowance for Loan and Lease Losses for the consumer portfolio as presented in Table 25 increased $137$55 million from December 31, 2004 to $4.5 billion at December 31, 2005. Credit card accounted for $153 million of this increase2006 and was primarily driven by new advances on accounts for which previous loan balances were sold to the securitization trusts, organic growth and continued seasoning which resulted in higher loss expectations. These increases were mostly offset by the use of reserves to absorb the estimated bankruptcy net charge-off acceleration from 2006. Increases in the allowance for non-credit card consumer products were driven by broad-based loan growth and seasoning, with the exception of the other consumer product category which decreased as a result of the run-off portfolios from our previously exited consumer businesses.2005.
|
The allowance for commercial loan and lease losses was $3.5 billion at December 31, 2005, a $718 million decrease from December 31, 2004. This decrease resulted from continued improvement in commercial credit quality, including reduced exposure and an improved risk profile in Latin America, the use of reserves to absorb a portion of domestic airline charge-offs and a reduction of reserves due to reduced uncertainties resulting from the completion of credit-related integration activities for FleetBoston during 2005.
Reserve for Unfunded Lending Commitments
In addition to the Allowance for Loan and Lease Losses, we also estimate probable losses related to unfunded lending commitments, such as letters of credit and financial guarantees, and binding unfunded loan commitments. Unfunded lending commitments are subject to individual reviews, and are analyzed and segregated by risk according to our internal risk rating scale. These risk classifications, in conjunction with an analysis of historical loss experience, current economic conditions and performance trends within specific portfolio segments, and any other pertinent information result in the estimation of the reserve for unfunded lending commitments. The reserve for unfunded lending commitments is included in Accrued Expenses and Other Liabilities on the Consolidated Balance Sheet.
We monitor differences between estimated and actual incurred credit losses upon draws of the commitments. This monitoring process includes periodic assessments by senior management of credit portfolios and the models used to estimate incurred losses in those portfolios.
Changes to the reserve for unfunded lending commitments are made through the Provision for Credit Losses. The reserve for unfunded lending commitments at December 31, 2005 was $395 million, a decrease of $7 million from December 31, 2004.
Table 24 presents a rollforward of the allowance for credit losses for five years ending December 31, 2005.
| Table 24Allowance for Credit Losses
| | | | | | | | | | | | | | | | | | | | | | (Dollars in millions) | | 2005
| | | 2004
| | | 2003
| | | 2002
| | | 2001
| | Allowance for loan and lease losses, January 1 | | $ | 8,626 | | | $ | 6,163 | | | $ | 6,358 | | | $ | 6,278 | | | $ | 6,365 | | | | |
|
|
| |
|
|
| |
|
|
| |
|
|
| |
|
|
| FleetBoston balance, April 1, 2004 | | | — | | | | 2,763 | | | | — | | | | — | | | | — | | Loans and leases charged off | | | | | | | | | | | | | | | | | | | | | Residential mortgage | | | (58 | ) | | | (62 | ) | | | (64 | ) | | | (56 | ) | | | (39 | ) | Credit card | | | (4,018 | ) | | | (2,536 | ) | | | (1,657 | ) | | | (1,210 | ) | | | (753 | ) | Home equity lines | | | (46 | ) | | | (38 | ) | | | (38 | ) | | | (40 | ) | | | (32 | ) | Direct/Indirect consumer | | | (380 | ) | | | (344 | ) | | | (322 | ) | | | (355 | ) | | | (389 | ) | Other consumer(1) | | | (376 | ) | | | (295 | ) | | | (343 | ) | | | (395 | ) | | | (1,216 | ) | | | |
|
|
| |
|
|
| |
|
|
| |
|
|
| |
|
|
| Total consumer | | | (4,878 | ) | | | (3,275 | ) | | | (2,424 | ) | | | (2,056 | ) | | | (2,429 | ) | | | |
|
|
| |
|
|
| |
|
|
| |
|
|
| |
|
|
| Commercial—domestic | | | (535 | ) | | | (504 | ) | | | (857 | ) | | | (1,625 | ) | | | (2,021 | ) | Commercial real estate | | | (5 | ) | | | (12 | ) | | | (46 | ) | | | (45 | ) | | | (46 | ) | Commercial lease financing | | | (315 | ) | | | (39 | ) | | | (132 | ) | | | (168 | ) | | | (99 | ) | Commercial—foreign | | | (61 | ) | | | (262 | ) | | | (408 | ) | | | (566 | ) | | | (249 | ) | | | |
|
|
| |
|
|
| |
|
|
| |
|
|
| |
|
|
| Total commercial | | | (916 | ) | | | (817 | ) | | | (1,443 | ) | | | (2,404 | ) | | | (2,415 | ) | | | |
|
|
| |
|
|
| |
|
|
| |
|
|
| |
|
|
| Total loans and leases charged off | | | (5,794 | ) | | | (4,092 | ) | | | (3,867 | ) | | | (4,460 | ) | | | (4,844 | ) | | | |
|
|
| |
|
|
| |
|
|
| |
|
|
| |
|
|
| Recoveries of loans and leases previously charged off | | | | | | | | | | | | | | | | | | | | | Residential mortgage | | | 31 | | | | 26 | | | | 24 | | | | 14 | | | | 13 | | Credit card | | | 366 | | | | 231 | | | | 143 | | | | 116 | | | | 81 | | Home equity lines | | | 15 | | | | 23 | | | | 26 | | | | 14 | | | | 13 | | Direct/Indirect consumer | | | 132 | | | | 136 | | | | 141 | | | | 145 | | | | 139 | | Other consumer | | | 101 | | | | 102 | | | | 88 | | | | 99 | | | | 135 | | | | |
|
|
| |
|
|
| |
|
|
| |
|
|
| |
|
|
| Total consumer | | | 645 | | | | 518 | | | | 422 | | | | 388 | | | | 381 | | | | |
|
|
| |
|
|
| |
|
|
| |
|
|
| |
|
|
| Commercial—domestic | | | 365 | | | | 327 | | | | 224 | | | | 314 | | | | 167 | | Commercial real estate | | | 5 | | | | 15 | | | | 5 | | | | 7 | | | | 7 | | Commercial lease financing | | | 84 | | | | 30 | | | | 8 | | | | 9 | | | | 4 | | Commercial—foreign | | | 133 | | | | 89 | | | | 102 | | | | 45 | | | | 41 | | | | |
|
|
| |
|
|
| |
|
|
| |
|
|
| |
|
|
| Total commercial | | | 587 | | | | 461 | | | | 339 | | | | 375 | | | | 219 | | | | |
|
|
| |
|
|
| |
|
|
| |
|
|
| |
|
|
| Total recoveries of loans and leases previously charged off | | | 1,232 | | | | 979 | | | | 761 | | | | 763 | | | | 600 | | | | |
|
|
| |
|
|
| |
|
|
| |
|
|
| |
|
|
| Net charge-offs | | | (4,562 | ) | | | (3,113 | ) | | | (3,106 | ) | | | (3,697 | ) | | | (4,244 | ) | | | |
|
|
| |
|
|
| |
|
|
| |
|
|
| |
|
|
| Provision for loan and lease losses(2) | | | 4,021 | | | | 2,868 | | | | 2,916 | | | | 3,801 | | | | 4,163 | | Transfers | | | (40 | ) | | | (55 | ) | | | (5 | ) | | | (24 | ) | | | (6 | ) | | | |
|
|
| |
|
|
| |
|
|
| |
|
|
| |
|
|
| Allowance for loan and lease losses, December 31 | | | 8,045 | | | | 8,626 | | | | 6,163 | | | | 6,358 | | | | 6,278 | | | | |
|
|
| |
|
|
| |
|
|
| |
|
|
| |
|
|
| Reserve for unfunded lending commitments, January 1 | | | 402 | | | | 416 | | | | 493 | | | | 597 | | | | 473 | | FleetBoston balance, April 1, 2004 | | | — | | | | 85 | | | | — | | | | — | | | | — | | Provision for unfunded lending commitments | | | (7 | ) | | | (99 | ) | | | (77 | ) | | | (104 | ) | | | 124 | | | | |
|
|
| |
|
|
| |
|
|
| |
|
|
| |
|
|
| Reserve for unfunded lending commitments, December 31 | | | 395 | | | | 402 | | | | 416 | | | | 493 | | | | 597 | | | | |
|
|
| |
|
|
| |
|
|
| |
|
|
| |
|
|
| Total | | $ | 8,440 | | | $ | 9,028 | | | $ | 6,579 | | | $ | 6,851 | | | $ | 6,875 | | | | |
|
|
| |
|
|
| |
|
|
| |
|
|
| |
|
|
| Loans and leases outstanding at December 31 (Restated) | | $ | 573,791 | | | $ | 521,813 | | | $ | 371,433 | | | $ | 342,890 | | | $ | 329,153 | | Allowance for loan and lease losses as a percentage of loans and leases outstanding at December 31 (Restated) | | | 1.40 | % | | | 1.65 | % | | | 1.66 | % | | | 1.85 | % | | | 1.91 | % | Consumer allowance for loan and lease losses as a percentage of consumer loans and leases outstanding at December 31 (Restated)(3) | | | 1.27 | | | | 1.34 | | | | 1.25 | | | | 0.95 | | | | 1.12 | | Commercial allowance for loan and lease losses as a percentage of commercial loans and leases outstanding at December 31(3) | | | 1.62 | | | | 2.19 | | | | 2.40 | | | | 2.43 | | | | 2.16 | | Average loans and leases outstanding during the year (Restated) | | $ | 537,218 | | | $ | 472,617 | | | $ | 356,220 | | | $ | 336,820 | | | $ | 365,447 | | Net charge-offs as a percentage of average loans and leases outstanding during the year (Restated) | | | 0.85 | % | | | 0.66 | % | | | 0.87 | % | | | 1.10 | % | | | 1.16 | % | Allowance for loan and lease losses as a percentage of nonperforming loans and leases at December 31 | | | 532 | | | | 390 | | | | 215 | | | | 126 | | | | 139 | | Ratio of the allowance for loan and lease losses at December 31 to net charge-offs | | | 1.76 | | | | 2.77 | | | | 1.98 | | | | 1.72 | | | | 1.48 | | | | |
|
|
| |
|
|
| |
|
|
| |
|
|
| |
|
|
|
(1) | | Includes $635 million related to the exit of the subprime real estate lending business in 2001. |
(2) | | Includes $395 million related to the exit of the subprime real estate lending business in 2001. |
(3) | | The 2004 and 2003 data presented in the table have been reclassified to reflect the assignment of general reserves to individual products. |
For reporting purposes, we allocate the allowance for credit losses across products. However, the allowance is available to absorb any credit losses without restriction. Table 25 presents our allocation by product type.
Table 25
Allocation of the Allowance for Credit Losses by Product Type
| | | | | | | | | | | | | | | | | | | | | | | | | | | | | | | | | | December 31
| | | | | 2005
| | | 2004
| | | 2003
| | | 2002
| | | 2001
| | | (Dollars in millions) | | Amount
| | Percent
| | | Amount
| | Percent
| | | Amount
| | Percent
| | | Amount
| | Percent
| | | Amount
| | Percent
| | Allowance for loan and lease losses | | | | | | | | | | | | | | | | | | | | | | | | | | | | | | | Residential mortgage | | $ | 277 | | 3.4 | % | | $ | 240 | | 2.8 | % | | $ | 185 | | 3.0 | % | | $ | 108 | | 1.7 | % | | $ | 145 | | 2.3 | % | Credit card | | | 3,301 | | 41.0 | | | | 3,148 | | 36.5 | | | | 1,947 | | 31.6 | | | | 1,031 | | 16.2 | | | | 821 | | 13.1 | | Home equity lines | | | 136 | | 1.7 | | | | 115 | | 1.3 | | | | 72 | | 1.2 | | | | 49 | | 0.8 | | | | 83 | | 1.3 | | Direct/Indirect consumer | | | 421 | | 5.2 | | | | 375 | | 4.3 | | | | 347 | | 5.6 | | | | 361 | | 5.7 | | | | 367 | | 5.8 | | Other consumer | | | 380 | | 4.8 | | | | 500 | | 5.9 | | | | 456 | | 7.4 | | | | 332 | | 5.2 | | | | 443 | | 7.1 | | | | |
|
| |
|
| |
|
| |
|
| |
|
| |
|
| |
|
| |
|
| |
|
| |
|
| Total consumer | | | 4,515 | | 56.1 | | | | 4,378 | | 50.8 | | | | 3,007 | | 48.8 | | | | 1,881 | | 29.6 | | | | 1,859 | | 29.6 | | | | |
|
| |
|
| |
|
| |
|
| |
|
| |
|
| |
|
| |
|
| |
|
| |
|
| Commercial—domestic | | | 2,100 | | 26.1 | | | | 2,101 | | 24.3 | | | | 1,756 | | 28.5 | | | | 2,231 | | 35.1 | | | | 1,901 | | 30.3 | | Commercial real estate | | | 609 | | 7.6 | | | | 644 | | 7.5 | | | | 484 | | 7.9 | | | | 439 | | 6.9 | | | | 905 | | 14.4 | | Commercial lease financing | | | 232 | | 2.9 | | | | 442 | | 5.1 | | | | 235 | | 3.8 | | | | n/a | | n/a | | | | n/a | | n/a | | Commercial—foreign | | | 589 | | 7.3 | | | | 1,061 | | 12.3 | | | | 681 | | 11.0 | | | | 855 | | 13.4 | | | | 730 | | 11.6 | | | | |
|
| |
|
| |
|
| |
|
| |
|
| |
|
| |
|
| |
|
| |
|
| |
|
| Total commercial(1) | | | 3,530 | | 43.9 | | | | 4,248 | | 49.2 | | | | 3,156 | | 51.2 | | | | 3,525 | | 55.4 | | | | 3,536 | | 56.3 | | | | |
|
| |
|
| |
|
| |
|
| |
|
| |
|
| |
|
| |
|
| |
|
| |
|
| General(2) | | | — | | — | | | | — | | — | | | | — | | — | | | | 952 | | 15.0 | | | | 883 | | 14.1 | | | | |
|
| |
|
| |
|
| |
|
| |
|
| |
|
| |
|
| |
|
| |
|
| |
|
| Allowance for loan and lease losses | | | 8,045 | | 100.0 | % | | | 8,626 | | 100.0 | % | | | 6,163 | | 100.0 | % | | | 6,358 | | 100.0 | % | | | 6,278 | | 100.0 | % | | | |
|
| |
|
| |
|
| |
|
| |
|
| |
|
| |
|
| |
|
| |
|
| |
|
| Reserve for unfunded lending commitments | | | 395 | | | | | | 402 | | | | | | 416 | | | | | | 493 | | | | | | 597 | | | | | | |
|
| | | | |
|
| | | | |
|
| | | | |
|
| | | | |
|
| | | | Total | | $ | 8,440 | | | | | $ | 9,028 | | | | | $ | 6,579 | | | | | $ | 6,851 | | | | | $ | 6,875 | | | | | | |
|
| | | | |
|
| | | | |
|
| | | | |
|
| | | | |
|
| | | |
(1) | | Includes allowance for loan and lease losses of commercial impaired loans of $55 million, $202 million, $391 million, $919 million, and $763 million at December 31, 2005, 2004, 2003, 2002, and 2001, respectively. |
(2) | | At December 31, 2005, general reserves were assigned to individual product types to better reflect our view of risk in these portfolios. The 2004 and 2003 data presented in the table have been reclassified to reflect the assignment of general reserves. Information was not available to assign general reserves by product types prior to 2003. |
n/a = Not available; included in commercial—domestic at December 31, 2002 and 2001.
Market Risk Management Market risk is the risk that values of assets and liabilities or revenues will be adversely affected by changes in market conditions such as market movements. This risk is inherent in the financial instruments associated with our operations and/or activities including loans, deposits, securities, short-term borrowings, long-term debt, trading account assets and liabilities, and derivatives. Market-sensitive assets and liabilities are generated through loans and deposits associated with our traditional banking business, our customer and proprietary trading operations, our ALM process, credit risk mitigation activities, and mortgage banking activities.
Our traditional banking loan and deposit products are nontrading positions and are reported at amortized cost for assets or the amount owed for liabilities (historical cost). While the accounting rules require a historical cost view of traditional banking assets and liabilities, these positions are still subject to changes in economic value based on varying market conditions. Interest rate risk is the effect of changes in the economic value of our loans and deposits, as well as our other interest rate sensitive instruments, and is reflected in the levels of future income and expense produced by these positions versus levels that would be generated by current levels of interest rates. We seek to mitigate interest rate risk as part of the ALM process.
We seek to mitigate trading risk within our prescribed risk appetite using hedging techniques. Trading positions are reported at estimated market value with changes reflected in income. Trading positions are subject to various risk factors, which include exposures to interest rates and foreign exchange rates, as well as equity, mortgage, commodity and issuer risk factors. We seek to mitigate these risk exposures by utilizing a variety of financial instruments.
|
Market risk is the risk that values of assets and liabilities or revenues will be adversely affected by changes in market conditions such as market movements. This risk is inherent in the financial instruments associated with our operations and/or activities including loans, deposits, securities, short-term borrowings, long-term debt, trading account assets and liabilities, and derivatives. Market-sensitive assets and liabilities are generated through loans and deposits associated with our traditional banking business, customer and proprietary trading operations, ALM process, credit risk mitigation activities and mortgage banking activities. Our traditional banking loan and deposit products are nontrading positions and are reported at amortized cost for assets or the amount owed for liabilities (historical cost). The accounting rules require a historical cost view of traditional banking assets and liabilities. However, these positions are still subject to changes in economic value based on varying market conditions, primarily changes in the levels of interest rates. The risk of adverse changes in the economic value of our nontrading positions is managed through our ALM activities. Trading positions are reported at estimated market value with changes reflected in income. Trading positions are subject to various risk factors, which include exposures to interest rates and foreign exchange rates, as well as equity, mortgage, commodity and issuer risk factors. We seek to mitigate these risk exposures by using techniques that encompass a variety of financial instruments in both the cash and derivatives markets. The following discusses the key risk components along with respective risk mitigation techniques. Interest rate risk represents exposures we have to instruments whose values vary with the level or volatility of interest rates. These instruments include, but are not limited to, loans, debt securities, certain trading-related assets and liabilities, deposits, borrowings and derivative instruments. We seek to mitigate risks associated with the exposures in a variety of ways that typically involve taking offsetting positions in cash or derivative markets. The cash and derivative instruments. Hedging instruments used to mitigate these risks include related derivatives such as options, futures, forwards and swaps. instruments allow us to seek to mitigate risks by reducing the effect of movements in the level of interest rates, changes in the shape of the yield curve as well as changes in interest rate volatility. Hedging instruments used to mitigate these risks include related derivatives such as options, futures, forwards and swaps.
Foreign exchange risk represents exposures to changes in the values of current holdings and future cash flows denominated in other currencies. The types of instruments exposed to this risk include investments in foreign subsidiaries, foreign currency-denominated loans, foreign currency-denominated securities, future cash flows in foreign currencies arising from foreign exchange transactions, foreign-currency denominated debt and various foreign exchange derivative instruments whose values fluctuate with changes in the level or volatility of currency exchange rates or foreign interest rates. Hedging instruments used to mitigate this risk include foreign exchange options, currency swaps, futures, forwards and deposits. Foreign exchange risk represents exposures we have to changes in the values of current holdings and future cash flows denominated in other currencies. The types
Mortgage risk represents exposures to changes in the value of mortgage-related instruments. The values of these instruments are sensitive to prepayment rates, mortgage rates, default, other interest rates and interest rate volatility. Our exposure to these instruments takes several forms. First, we trade and engage in market-making activities in a variety of mortgage securities including whole loans, pass-through certificates, commercial mortgages, and collateralized mortgage obligations. Second, we originate a variety of mortgage-backed securities which involves the accumulation of mortgage-related loans in anticipation of eventual securitization. Third, we may hold positions in mortgage securities and residential mortgage loans as part of the ALM portfolio. Fourth, we create MSRs as part of our mortgage activities. See Notes 1 and 8 of the Consolidated Financial Statements for additional information on MSRs. Hedging instruments used to mitigate this risk include options, futures, forwards, swaps, swaptions and securities. Equity market risk represents exposures to securities that represent an ownership interest in a corporation in the form of domestic and foreign common stock or other equity-linked instruments. Instruments that would lead to this exposure include, but are not limited to, the following: common stock, exchange traded funds, American Depositary Receipts (ADRs), convertible bonds, listed equity options (puts and calls), over-the-counter equity options, equity total return swaps, equity index futures and other equity derivative products. Hedging instruments exposed to this risk include investments in foreign subsidiaries, foreign currency-denominated loans, foreign currency-denominated securities, future cash flows in foreign currencies arising from foreign exchange transactions, and various foreign exchange derivative instruments whose values fluctuate with changes in currency exchange rates or foreign interest rates. Instruments used to mitigate this risk are foreign exchange options, currency swaps, futures, forwards and deposits. These instruments help insulate us against losses that may arise due to volatile movements in foreign exchange rates or interest rates. Mortgage Risk
Our exposure to mortgage risk takes several forms. First, we trade and engage in market-making activities in a variety of mortgage securities, including whole loans, pass-through certificates, commercial mortgages, and collateralized mortgage obligations. Second, we originate a variety of asset-backed securities, which involves the accumulation of mortgage-related loans in anticipation of eventual securitization. Third, we may hold positions in mortgage securities and residential mortgage loans as part of the ALM portfolio. Fourth, we create MSRs as part of our mortgage activities. See Notes 1 and 9 of the Consolidated Financial Statements for additional information on MSRs. These activities generate market risk since these instruments are sensitive to changes in the level of market interest rates, changes in mortgage prepayments and interest rate volatility. Options, futures, forwards, swaps, swaptions and mortgage-backed securities are used to hedge mortgage risk by seeking to mitigate the effects of changes in interest rates.
Equity Market Risk
Equity market risk arises from exposure to securities that represent an ownership interest in a corporation in the form of common stock or other equity-linked instruments. The instruments held that would lead to this exposure include, but are not limited to, the following: common stock, listed equity options (puts and calls), over-the-counter equity options, equity total return swaps, equity index futures and convertible bonds. We seek to mitigate the risk associated with these securities via hedging on a portfolio or name basis that focuses on reducing volatility from changes in stock prices. Instruments used for risk mitigation include options, futures, swaps, convertible bonds and cash positions.
Commodity risk represents exposures we have to products traded in the petroleum, natural gas, metals and power markets. Our principal exposure to these markets emanates from customer-driven transactions. These transactions consist primarily of futures, forwards, swaps and options. We seek to mitigate exposure to the commodity markets with instruments including, but not limited to instruments traded in the petroleum, natural gas, power, and metals markets. These instruments consist primarily of futures, forwards, swaps and options. Hedging instruments used to mitigate this risk include options, futures and swaps in the same or similar commodity product, as well as cash positions. Issuer credit risk represents exposures to changes in the creditworthiness of individual issuers or groups of issuers. Our portfolio is exposed to issuer credit risk where the value of an asset may be adversely impacted by changes in the levels of credit spreads, by credit migration, or by defaults. Hedging instruments used to mitigate this risk include bonds, credit default swaps and other credit fixed income instruments. Trading-related revenues represent the amount earned from trading positions which are taken in a diverse range of financial instruments and markets. Trading account assets and liabilities and derivative positions are reported at fair value. For more information on fair value, see Complex Accounting Estimates beginning on page 81. Trading Account Profits represent the net amount earned from our trading positions and, as reported in the Consolidated Statement of Income, do not include the Net Interest Income recognized on trading positions, or the related funding charge or benefit. Trading Account Profits can be volatile and are largely driven by general market conditions and customer demand. Trading Account Profits are dependent on the volume and type of transactions, the level of risk assumed, and the volatility of price and rate movements at any given time within the ever-changing market environment. The histogram of daily revenue or loss below is a graphic depiction of trading volatility and illustrates the daily level of trading-related revenue for 2006. Trading-related revenue encompasses proprietary trading and customer-related activities. During 2006, positive trading-related revenue was recorded for 96 percent of the trading days. Furthermore, there were no trading days with losses greater than $10 million and the largest loss was $10 million. This can be compared to 2005, where positive trading-related revenue was recorded for 86 percent of the trading days and only four percent of the total trading days had losses greater than $10 million and the largest loss was $55 million. 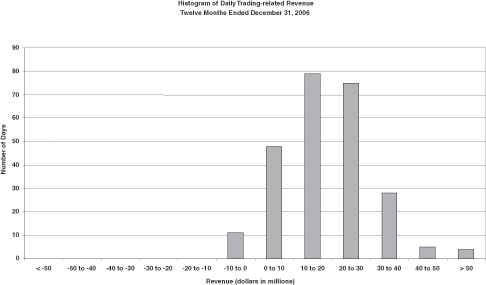
To evaluate risk in our trading activities, we focus on the actual and potential volatility of individual positions as well as portfolios. At a portfolio and corporate level, we use VAR modeling and stress testing. VAR is a key statistic used to measure market risk. In order to manage day-to-day risks, VAR is subject to trading limits both for our overall trading portfolio and within individual businesses. Senior management reviews and evaluates the results of these limit excesses. A VAR model simulates the value of a portfolio under a range of hypothetical scenarios in order to generate a distribution of potential gains and losses. The VAR represents the worst loss the portfolio is expected to experience with a given level of confidence. VAR depends on the volatility of the positions in the portfolio and on how strongly their risks are correlated. Within any VAR model, there are significant and numerous assumptions that will differ from company to company. Our VAR model uses a historical simulation approach based on three years of historical data and assumes a 99 percent confidence level. Statistically, this means that losses will exceed VAR, on average, one out of 100 trading days, or two to three times each year. Actual losses did not exceed VAR in 2006 and exceeded VAR twice in 2005. The assumptions and data underlying our VAR model are updated on a regular basis. In addition, the predictive accuracy of the model is periodically tested by comparing actual losses for individual businesses with the losses predicted by the VAR model. Senior management reviews and evaluates the results of these tests. The following graph shows daily trading-related revenue and VAR for 2006. 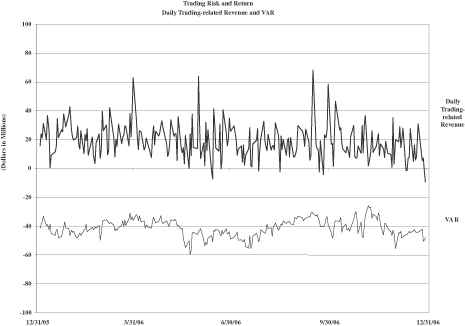
Table 28 presents average, high and low daily VAR for the twelve months ended December 31, 2006 and 2005. Table 28 Trading Activities Market Risk | | | | | | | | | | | | | | | | | | | | | | | | Twelve Months Ended December 31 | | | | 2006 | | 2005 | | | | VAR | | VAR | | (Dollars in millions) | | Average | | | High (1) | | Low (1) | | Average | | | High (1) | | Low (1) | Foreign exchange | | $ | 8.2 | | | $ | 22.9 | | $ | 3.1 | | $ | 5.6 | | | $ | 12.1 | | $ | 2.6 | Interest rate | | | 18.5 | | | | 50.0 | | | 7.3 | | | 24.7 | | | | 58.2 | | | 10.8 | Credit | | | 26.8 | | | | 36.7 | | | 18.4 | | | 22.7 | | | | 33.4 | | | 14.4 | Real estate/mortgage | | | 8.4 | | | | 12.7 | | | 4.7 | | | 11.4 | | | | 20.7 | | | 6.5 | Equities | | | 18.8 | | | | 39.6 | | | 9.9 | | | 18.1 | | | | 35.1 | | | 9.6 | Commodities | | | 6.1 | | | | 9.9 | | | 3.4 | | | 6.6 | | | | 10.6 | | | 3.5 | Portfolio diversification | | | (45.5 | ) | | | — | | | — | | | (47.3 | ) | | | — | | | — | Total market-based trading portfolio(2) | | $ | 41.3 | | | $ | 59.8 | | $ | 26.0 | | $ | 41.8 | | | $ | 67.0 | | $ | 26.8 |
Our(1)
| The high and low for the total portfolio is exposed to issuer credit risk wheremay not equal the valuesum of an assetthe individual components as the highs or lows of the individual portfolios may be adversely impactedhave occurred on different trading days. |
(2) | See Commercial Portfolio Credit Risk Management on page 57 for various reasons directlya discussion of the VAR related to the issuer, such as management performance, financial leverage or reduced demand forcredit derivatives that economically hedge the issuer’s goods or services. Perceived changes in the creditworthiness of a particular debtor or sector can have significant effects on the replacement costs of cash and derivative positions. We seek to mitigate the impact of credit spreads, credit migration and default risks on the market value of the trading portfolio with the use of CDS, and credit fixed income and similar securities.loan portfolio. Trading Risk Management
Trading-related revenues represent the amount earned from our trading positions, which include trading account assets and liabilities, as well as derivative positions and, prior to the conversion of the Certificates into MSRs, market value adjustments to the Certificates and the MSRs. Trading positions are taken in a diverse range of financial instruments and markets. Trading account assets and liabilities, and derivative positions are reported at fair value. MSRs are reported at the lower of cost or market. For more information on fair value, see Complex Accounting Estimates beginning on page 74. For additional information on MSRs, see Notes 1 and 9 of the Consolidated Financial Statements. Trading Account Profits represent the net amount earned from our trading positions and, as reported in the
Consolidated Statement of Income, do not include the Net Interest Income recognized on trading positions, or the related funding charge or benefit. Trading Account Profits can be volatile and are largely driven by general market conditions and customer demand. Trading Account Profits are dependent on the volume and type of transactions, the level of risk assumed, and the volatility of price and rate movements at any given time within the ever-changing market environment.
The histogram of daily revenue or loss below is a graphic depiction of trading volatility and illustrates the daily level of trading-related revenue for 2005. Trading-related revenue encompasses proprietary trading and customer-related activities. During 2005, positive trading-related revenue was recorded for 81 percent of the trading days. Furthermore, only six percent of the total trading days had losses greater than $10 million, and the largest loss was $41 million. This can be compared to 2004, where positive trading-related revenue was recorded for 87 percent of the trading days and only five percent of the total trading days had losses greater than $10 million, and the largest loss was $27 million.
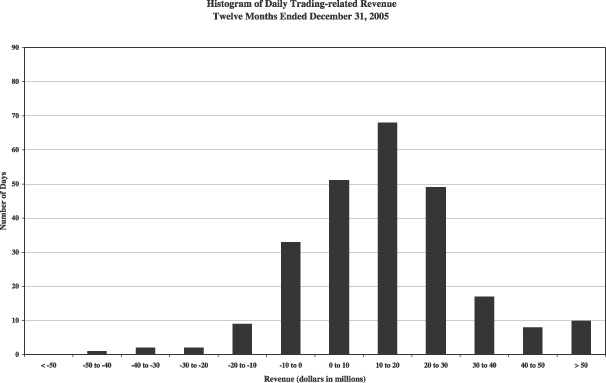
To evaluate risk in our trading activities, we focus on the actual and potential volatility of individual positions as well as portfolios. At a portfolio and corporate level, we use Value-at-Risk (VAR) modeling and stress testing. VAR is a key statistic used to measure and manage market risk. Trading limits and VAR are used to manage day-to-day risks and are subject to testing where we compare expected performance to actual performance. This testing provides us a view of our models’ predictive accuracy. All limit excesses are communicated to senior management for review.
A VAR model estimates a range of hypothetical scenarios to calculate a potential loss which is not expected to be exceeded with a specified confidence level. These estimates are impacted by the nature of the positions in the portfolio and the correlation within the portfolio. Within any VAR model, there are significant and numerous assumptions that will differ from company to company. Our VAR model assumes a 99 percent confidence level. Statistically, this means that losses will exceed VAR, on average, one out of 100 trading days, or two to three times each year. Actual losses did not exceed VAR in 2005 or 2004.
In addition to reviewing our underlying model assumptions, we seek to mitigate the uncertainties related to these assumptions and estimates through close monitoring and by updating the assumptions and estimates on an ongoing basis. If the results of our analysis indicate higher than expected levels of risk, proactive measures are taken to adjust risk levels.
The following graph shows actual losses did not exceed VAR in 2005.
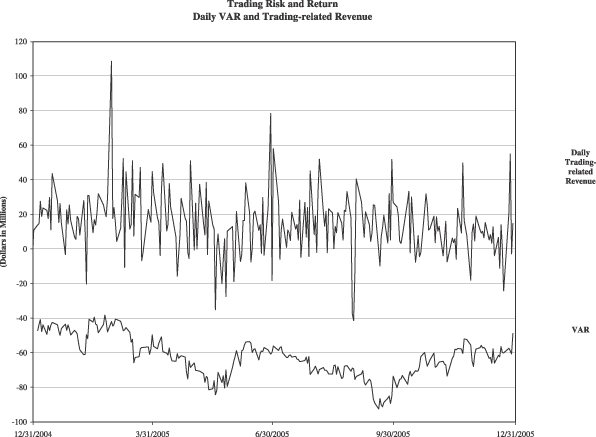
Table 26 presents average, high and low daily VAR for 2005 and 2004.
Table 26
Trading Activities Market Risk
| | | | | | | | | | | | | | | | | | | | | | | | Twelve Months Ended December 31
| | | | 2005
| | 2004
| | | | VAR
| | VAR
| | (Dollars in millions) | | Average
| | | High(1)
| | Low(1)
| | Average
| | | High(1)
| | Low(1)
| Foreign exchange | | $ | 5.6 | | | $ | 12.1 | | $ | 2.6 | | $ | 3.6 | | | $ | 8.1 | | $ | 1.4 | Interest rate | | | 24.7 | | | | 58.2 | | | 10.8 | | | 26.2 | | | | 51.5 | | | 10.7 | Credit(2) | | | 55.4 | | | | 77.3 | | | 35.9 | | | 35.7 | | | | 61.4 | | | 21.9 | Real estate/mortgage(3) | | | 11.4 | | | | 20.7 | | | 6.5 | | | 10.5 | | | | 26.0 | | | 4.6 | Equities | | | 18.1 | | | | 35.1 | | | 9.6 | | | 21.8 | | | | 51.5 | | | 7.9 | Commodities | | | 6.6 | | | | 10.6 | | | 3.5 | | | 6.5 | | | | 10.2 | | | 3.8 | Portfolio diversification | | | (59.6 | ) | | | — | | | — | | | (56.3 | ) | | | — | | | — | | | |
|
|
| | | | | | | |
|
|
| | | | | | | Total trading portfolio | | $ | 62.2 | | | $ | 92.4 | | $ | 38.0 | | $ | 48.0 | | | $ | 78.5 | | $ | 29.4 | | | |
|
|
| |
|
| |
|
| |
|
|
| |
|
| |
|
| Total market-based trading portfolio(4) | | $ | 40.7 | | | $ | 66.4 | | $ | 26.4 | | $ | 44.1 | | | $ | 79.0 | | $ | 23.7 | | | |
|
|
| |
|
| |
|
| |
|
|
| |
|
| |
|
|
(1) | | The high and low for the total portfolio may not equal the sum of the individual components as the highs or lows of the individual portfolios may have occurred on different trading days. |
(2) | | Credit includes credit fixed income and CDS used for credit risk management. Average VAR for CDS was $69.0 million and $23.5 million in 2005 and 2004. In 2005, the Credit VAR was less than VAR for CDS used for credit risk management as the positions in credit fixed income typically offset the risk of CDS. The relationship between overall Credit VAR and the VAR for CDS can change over time as a result of changes in the relative sizes of the credit fixed income and CDS exposures. |
(3) | | Real estate/mortgage includes capital market real estate and the Certificates. Effective June 1, 2004, Real estate/mortgage no longer includes the Certificates. For additional information on the Certificates, see Note 1 of the Consolidated Financial Statements. |
(4) | | Total market-based trading portfolio excludes CDS used for credit risk management, net of the effect of diversification. |
The increase in average VAR of the trading portfolio for 2005 was primarily due to increases in the average risk taken in credit due to an increase in credit protection purchased to hedge the credit risk in our commercial loan portfolio.
Because the very nature of a VAR model suggests results can exceed our estimates, we also “stress test” our portfolio. Stress testing estimates the value change in our trading portfolio that may result from abnormal market movements. Various types of stress tests are run regularly against the overall trading portfolio and individual businesses. Historical scenarios simulate the impact of price changes which occurred during a set of extended historical market events. The results of these scenarios are reported daily to senior management. During 2006, the largest losses among these scenarios ranged from $7 million to $591 million. Hypothetical scenarios evaluate the potential impact of extreme but plausible events. These scenarios are developed to address perceived vulnerabilities in the market and in our portfolios, and are periodically updated. Senior management reviews and evaluates results of these scenarios monthly. During 2006, the largest losses among these scenarios ranged from $441 million to $734 million. Worst-case losses, which represent the most extreme losses in our daily VAR calculation, are reported daily. Finally, desk-level stress tests are performed daily for individual businesses. These stress tests evaluate the potential adverse impact of large moves in the market risk factors to which those businesses are most sensitive. Because the very nature of a VAR model suggests results can exceed our estimates, we “stress test” our portfolio. Stress testing estimates the value change in our trading portfolio due to abnormal market movements. Various stress scenarios are run regularly against the trading portfolio to verify that, even under extreme market moves, we will preserve our capital; to determine the effects of significant historical events; and to determine the effects of specific, extreme hypothetical, but plausible events. The results of the stress scenarios are calculated daily and reported to senior management as part of the regular reporting process. The results of certain specific, extreme hypothetical scenarios are presented to the Asset and Liability Committee.
| | Interest Rate Risk Management for Nontrading Activities Interest rate risk represents the most significant market risk exposure to our nontrading financial instruments. Our overall goal is to manage interest rate risk so that movements in interest rates do not adversely affect Net Interest Income. Interest rate risk is measured as the potential volatility in our Net Interest Income
|
Interest rate risk represents the most significant market risk exposure to our nontrading exposures. Our overall goal is to manage interest rate risk so that movements in interest rates do not adversely affect core net interest income – managed basis. Interest rate risk is measured as the potential volatility in our core net interest income – managed basis caused by changes in market interest rates. Client facing activities, primarily lending and deposit-taking, create interest rate sensitive positions on our balance sheet. Interest rate risk from these activities, as well as the impact of changing market conditions, is managed through our ALM activities. Simulations are used to estimate the impact on core net interest income – managed basis using numerous interest rate scenarios, balance sheet trends and strategies. These simulations evaluate how the above mentioned scenarios impact core net interest income – managed basis on short-term financial instruments, debt securities, loans, deposits, borrowings and derivative instruments. In addition, these simulations incorporate assumptions about balance sheet dynamics such as loan and deposit growth and pricing, changes in funding mix, and asset and liability repricing and maturity characteristics. The Balance Sheet Management group analyzes core net interest income – managed basis forecasts utilizing different rate scenarios, with the base case utilizing forward interest rates. The Balance Sheet Management group frequently updates the core net interest income – managed basis forecast for changing assumptions and differing outlooks based on economic trends and market conditions. Thus, we continually monitor our balance sheet position in an effort to maintain an acceptable level of exposure to interest rate changes. We prepare forward-looking forecasts of core net interest income – managed basis. These baseline forecasts take into consideration expected future business growth, ALM positioning, and the direction of interest rate movements as implied by forward interest rates. We then measure and evaluate the impact that alternative interest rate scenarios have to these baseline forecasts in order to assess interest rate sensitivity under varied conditions. The spot and 12-month forward monthly average rates used in our respective baseline forecasts at December 31, 2006 and 2005 were as follows: Table 29 Forward Rates | | | | | | | | | | | | | | | | | | December 31 | | | | | 2006 | | | | | 2005 | | | | | Federal Funds | | | Ten-Year Swap | | | | | Federal Funds | | | Ten-Year Swap | | Spot rates | | 5.25 | % | | 5.18 | % | | | | 4.25 | % | | 4.94 | % | 12-month forward average rates | | 4.85 | | | 5.19 | | | | | 4.75 | | | 4.97 | |
The following table reflects the pre-tax dollar impact to forecasted core net interest income – managed basis over the next twelve months from December 31, 2006 and 2005, resulting from a 100 bp gradual parallel increase, a 100 bp gradual parallel decrease, a 100 bp gradual curve flattening (increase in short-term rates or decrease in long-term rates) and a 100 bp gradual curve steepening (decrease in short-term rates or increase in long-term rates) from the forward market curve. For further discussion of core net interest income – managed basis see page 24. Table 30 Estimated Core Net Interest Income – Managed Basis at Risk | | | | | | | | | | | | | | (Dollars in millions) | | | | | | December 31 | | | Curve Change | | Short Rate | | Long Rate | | 2006 | | | 2005 | | +100 Parallel shift | | +100 | | +100 | | $ | (557 | ) | | $ | (357 | ) | -100 Parallel shift | | -100 | | -100 | | | 770 | | | | 244 | | Flatteners | | | | | | | | | | | | | Short end | | +100 | | — | | | (687 | ) | | | (523 | ) | Long end | | — | | -100 | | | (192 | ) | | | (298 | ) | Steepeners | | | | | | | | | | | | | Short end | | -100 | | — | | | 971 | | | | 536 | | Long end | | — | | +100 | | | 138 | | | | 168 | |
The sensitivity analysis above assumes that we take no action in response to these rate shifts over the indicated years. The estimated exposure is reported on a managed basis and reflects impacts that may be realized primarily in Net Interest Income and Card Income. This sensitivity analysis excludes any impact that could occur in the valuation of retained interests in the Corporation’s securitizations due to changes in interest rate levels. See Note 9 of the Consolidated Financial Statements for additional information on Securitizations. Beyond what is already implied in the forward market curve, the interest rate risk position has become modestly more exposed to rising rates since December 31, 2005. This exposure is primarily driven by the addition of MBNA. Conversely, over a 12-month horizon, we would benefit from falling rates or a steepening of the yield curve beyond what is already implied in the forward market curve. As part of our ALM activities, primarily lending and deposit-taking, create interest rate sensitive positions on our balance sheet. Interest rate risk from these activities as well as the impact of changing market conditions is managed through the ALM process. Sensitivity simulations are used to estimate the impact on Net Interest Income of numerous interest rate scenarios, balance sheet trends and strategies. These simulations estimate levels of short-term financial instruments, debt securities, loans, deposits, borrowings and derivative instruments. In addition, these simulations incorporate assumptions about balance sheet dynamics such as loan and deposit growth and pricing, changes in funding mix, and asset and liability repricing and maturity characteristics. In addition to Net Interest Income sensitivity simulations, market value sensitivity measures are also utilized.
The Balance Sheet Management group maintains a Net Interest Income forecast utilizing different rate scenarios, with the base case utilizing the forward market curve. The Balance Sheet Management group constantly updates the Net Interest Income forecast for changing assumptions and differing outlooks based on economic trends and market conditions. Thus, we continually monitor our balance sheet position in an effort to maintain an acceptable level of exposure to volatile interest rate changes.
We prepare forward looking forecasts of Net Interest Income. These baseline forecasts take into consideration expected future business growth, ALM positioning, and the direction of interest rate movements as implied by the markets’ forward interest rate curve. We then measure and evaluate the impact that alternative interest rate scenarios have to these static baseline forecasts in order to assess interest rate sensitivity under varied conditions. The spot and 12-month forward rates used in our respective baseline forecasts at December 31, 2005 and 2004 were as follows:
Table 27
Forward Rates
| | | | | | | | | | | | | | | | December 31
| | | | | 2005
| | | 2004
| | | | | Federal
Funds
| | | Ten-Year
Constant
Maturity Swap
| | | Federal
Funds
| | | Ten-Year
Constant
Maturity Swap
| | Spot rates | | 4.25 | % | | 4.94 | % | | 2.25 | % | | 4.64 | % | 12-month forward rates | | 4.75 | | | 4.97 | | | 3.25 | | | 4.91 | |
The following table reflects the pre-tax dollar impact to forecasted Core Net Interest Income over the next twelve months from December 31, 2005 and 2004, resulting from a 100 bp gradual parallel increase, a 100 bp gradual parallel decrease, a 100 bp gradual curve flattening (increase in short-term rates) and a 100 bp gradual curve steepening (increase in long-tem rates) from the forward curve.
Table 28
Estimated Net Interest Income at Risk
| | | | | | | | | | | | | | (Dollars in millions) | | | | | | December 31
| | | Curve Change | | Short
Rate
| | Long
Rate
| | 2005
| | | 2004
(Restated)
| | +100 Parallel shift | | +100 | | +100 | | $ | (357 | ) | | $ | (183 | ) | -100 Parallel shift | | -100 | | -100 | | | 244 | | | | (126 | ) | | | | | | Flatteners | | | | | | | | | | | | | Short end | | +100 | | — | | | (523 | ) | | | (462 | ) | Long end | | — | | -100 | | | (298 | ) | | | (677 | ) | Steepeners | | | | | | | | | | | | | Short end | | -100 | | — | | | 536 | | | | 497 | | Long end | | — | | +100 | | | 168 | | | | 97 | |
The sensitivity analysis above assumes that we take no action in response to these rate shifts over the indicated years.
Beyond what is already implied in the forward curve, we are modestly exposed to rising rates primarily due to increased funding costs. Conversely, we would benefit from falling rates or a steepening of the yield curve beyond what is already implied in the forward curve.
As part of the ALM process, we use securities, residential mortgages, and interest rate and foreign exchange derivatives in managing interest rate sensitivity.
The securities portfolio is an integral part of our ALM position. During the third quarter of 2006, we made a strategic shift in our balance sheet composition strategy to reduce the level of mortgage-backed securities and thereby reduce the level of investments in debt securities relative to loans. Accordingly, management targeted a reduction of mortgage-backed debt securities of approximately $100 billion over the next couple of years in order to achieve a balance sheet composition that would be consistent with management’s revised risk-reward profile. Management expects the total targeted reduction will result from the third quarter sale of $43.7 billion in mortgage-backed securities combined with expected maturities and paydowns of mortgage-backed securities over the next couple of years. For those securities that are in an unrealized loss position we have the intent and ability to hold these securities to recovery. The securities portfolio also includes investments to a lesser extent in corporate, municipal and other investment grade debt securities. The strategic shift in the balance sheet composition strategy did not impact these holdings. For those securities that are in an unrealized loss position we have the intent and ability to hold these securities to recovery. During 2006 and 2005, we purchased AFS debt securities of $40.9 billion and $204.5 billion, sold $55.1 billion and $133.4 billion, and had maturities and received paydowns of $22.4 billion and $39.5 billion. We realized $(443) million and $1.1 billion in Gains (Losses) on Sales of Debt Securities during 2006 and 2005. The value of our Accumulated OCI related to AFS debt securities increased (improved) by $131 million (pre-tax) during 2006 which was driven by the realized loss on the securities sale partially offset by an increase in interest rates. Accumulated OCI includes $2.9 billion in after-tax losses at December 31, 2006, related to after-tax unrealized losses associated with our AFS securities portfolio, including $3.1 billion of after-tax unrealized losses related to AFS debt securities and $249 million of after-tax unrealized gains related to AFS equity securities. Total market value of the AFS debt securities was $192.8 billion at December 31, 2006, with a weighted average duration of 4.1 years and primarily relates to our mortgage-backed securities portfolio. Changes to the Accumulated OCI amounts for the AFS securities portfolio going forward will be driven by further interest rate or price fluctuations, the collection of cash flows including prepayment and maturity activity, and the passage of time. The securities portfolio is integral to our ALM process. The decision to purchase or sell securities is based upon the current assessment of economic and financial conditions, including the interest rate environment, liquidity and regulatory requirements, and the relative mix of our cash and derivative positions. During 2005, we purchased securities of $204.5 billion, sold $134.5 billion, and received paydowns of $37.7 billion. During 2004, we purchased securities of $243.6 billion, sold $117.7 billion, and received paydowns of $31.8 billion. During the year, we continuously monitored our interest rate risk position and effected changes in the securities portfolio in order to manage prepayment risk and interest rate risk. Through sales in the securities portfolio, we realized $1.1 billion in Gains on Sales of Debt Securities during 2005 and $1.7 billion during 2004. The decrease was primarily due to lower gains realized on mortgage-backed securities and corporate bonds.
| | Residential Mortgage Portfolio |
During 2006 and 2005, we purchased $42.3 billion and $32.0 billion of residential mortgages related to ALM activities and sold $11.0 billion and $10.1 billion. We added $51.9 billion and $18.3 billion of originated residential mortgages to the balance sheet for 2006 and 2005. Additionally, we received paydowns of $24.7 billion and $35.8 billion for 2006 and 2005. The ending balance at December 31, 2006 was $241.2 billion, compared to $182.6 billion at December 31, 2005. During 2005, we purchased $32.0 billion of residential mortgages related to the ALM process. We had whole mortgage loan sales of $10.1 billion during 2005. During 2004, we purchased $65.9 billion of residential mortgages related to the ALM process and had minimal sales of whole mortgage loans. Additionally, we received paydowns of $35.8 billion and $44.4 billion for 2005 and 2004. Through sales of whole mortgage loans, we recognized gains that were recorded as Other Income of $45 million for 2005, compared to losses of $2 million in 2004.
| | Interest Rate and Foreign Exchange Derivative Contracts Interest rate and foreign exchange derivative contracts are utilized in our ALM process and serve as an efficient tool to mitigate our risk. We use derivatives to hedge the changes in cash flows or market values of our balance sheet. See Note 5 of the Consolidated Financial Statements for additional information on our hedging activities.
Our interest rate contracts are generally nonleveraged generic interest rate and basis swaps, options, futures, and forwards. In addition, we use foreign currency contracts to mitigate the foreign exchange risk associated with foreign currency-denominated assets and liabilities, as well as our equity investments in foreign subsidiaries. Table 29
|
Interest rate and foreign exchange derivative contracts are utilized in our ALM activities and serve as an efficient tool to mitigate our interest rate and foreign exchange risk. We use derivatives to hedge the changes in cash flows or changes in market values on our balance sheet due to interest rate and foreign exchange components. See Note 4 of the Consolidated Financial Statements for additional information on our hedging activities. Our interest rate contracts are generally non-leveraged generic interest rate and foreign exchange basis swaps, options, futures and forwards. In addition, we use foreign exchange contracts, including cross-currency interest rate swaps and foreign currency forward contracts, to mitigate the foreign exchange risk associated with foreign currency-denominated assets and liabilities, as well as certain equity investments in foreign subsidiaries. Table 31 reflects the notional amounts, fair value, weighted average receive fixed and pay fixed rates, expected maturity, and estimated duration of our open ALM derivatives at December 31, 2006 and 2005. The changes in our derivatives portfolio reflect actions taken for interest rate and foreign exchange rate risk management. The decisions to reposition our derivative portfolio are based upon the current assessment of economic and financial conditions including the interest rate environment, balance sheet composition and trends, and the relative mix of our cash and derivative positions. The notional amount of our net receive fixed swap position (including foreign exchange contracts) decreased $10.5 billion to $12.3 billion at December 31, 2006 compared to $22.8 billion at December 31, 2005. The decrease in the net receive fixed position is primarily due to terminations and maturities within the portfolio during the year. The notional amount of our foreign exchange basis swaps increased $14.1 billion to $31.9 billion at December 31, 2006 compared to $17.8 billion at December 31, 2005. The notional amount of our option position increased $186.0 billion to $243.3 billion at December 31, 2006, compared to December 31, 2005. The increase in the notional amount of options was due to the addition of caps used to reduce the sensitivity of Net Interest Income to changes in market interest rates. Futures and forward rate contracts are comprised primarily of $8.5 billion of forward purchase contracts of mortgage loans at December 31, 2006 and $35.0 billion of forward purchase contracts of mortgage-backed securities and mortgage loans at December 31, 2005. The forward purchase contracts outstanding at December 31, 2006, settled in January 2007 with an average yield of 5.67 percent. The forward purchase contracts outstanding at December 31, 2005, settled from January 2006 to April 2006, with an average yield of 5.46 percent. The following table includes derivatives utilized in our ALM activities, including those designated as SFAS 133 accounting hedges and those used as economic hedges. The fair value of net ALM contracts increased from a loss of $386 million at December 31, 2005 to a gain of $1.5 billion at December 31, 2006. The increase was primarily attributable to gains from changes in the value of foreign exchange basis swaps of $2.6 billion and receive fixed and pay fixed interest rate swaps of $1.3 billion, partially offset by losses from changes in the values of foreign exchange contracts of $1.2 billion, and option products of $1.0 billion. The increase in the value of foreign exchange basis swaps was due to the strengthening of most foreign currencies against the dollar during 2006. The increases in the value of receive fixed interest rate swaps was due to terminations partially offset by losses as a result of increases in market interest rates. The increase in the value of pay fixed interest rate swaps was due to gains from increases in market interest rates partially offset by terminations. The decrease in the value of foreign exchange contracts was due primarily to increases in foreign interest rates during 2006. The decrease in the value of option products was primarily due to changes in the composition of the option portfolio. Table 31 Asset and Liability Management Interest Rate and Foreign Exchange Contracts | | | | | | | | | | | | | | | | | | | | | | | | | | | | | | | | | | | December 31, 2006 | | | | | | | | | | | | | | | | | | | | | Expected Maturity | | | Average
Estimated
Duration | (Dollars in millions, average
estimated duration in years) | | Fair
Value | | | Total | | | 2007 | | | 2008 | | | 2009 | | | 2010 | | | 2011 | | | Thereafter | | | Receive fixed interest rate swaps (1) | | $ | (748 | ) | | | | | | | | | | | | | | | | | | | | | | | | | | | | | | 4.42 | Notional amount | | | | | | $ | 91,502 | | | $ | 2,795 | | | $ | 7,844 | | | $ | 48,900 | | | $ | 3,252 | | | $ | 1,630 | | | $ | 27,081 | | | | Weighted average fixed rate | | | | | | | 4.90 | % | | | 4.80 | % | | | 4.41 | % | | | 4.90 | % | | | 4.35 | % | | | 4.50 | % | | | 5.14 | % | | | Pay fixed interest rate swaps (1) | | | 261 | | | | | | | | | | | | | | | | | | | | | | | | | | | | | | | 2.93 | Notional amount | | | | | | $ | 100,217 | | | $ | 15,000 | | | $ | 2,500 | | | $ | 44,000 | | | $ | — | | | $ | 250 | | | $ | 38,467 | | | | Weighted average fixed rate | | | | | | | 4.98 | % | | | 5.12 | % | | | 5.11 | % | | | 4.86 | % | | | — | % | | | 5.43 | % | | | 5.06 | % | | | Foreign exchange basis swaps (2) | | | 1,992 | | | | | | | | | | | | | | | | | | | | | | | | | | | | | | | | Notional amount | | | | | | $ | 31,916 | | | $ | 174 | | | $ | 2,292 | | | $ | 3,012 | | | $ | 5,351 | | | $ | 3,962 | | | $ | 17,125 | | | | Option products(3) | | | 317 | | | | | | | | | | | | | | | | | | | | | | | | | | | | | | | | Notional amount | | | | | | | 243,280 | | | | 200,000 | | | | 43,176 | | | | — | | | | 70 | | | | — | | | | 34 | | | | Foreign exchange contracts(4) | | | (319 | ) | | | | | | | | | | | | | | | | | | | | | | | | | | | | | | | Notional amount(5) | | | | | | | 20,319 | | | | (753 | ) | | | 1,588 | | | | 1,901 | | | | 3,850 | | | | 1,104 | | | | 12,629 | | | | Futures and forward rate contracts (6) | | | (46 | ) | | | | | | | | | | | | | | | | | | | | | | | | | | | | | | | Notional amount(5) | | | | | | | 8,480 | | | | 8,480 | | | | — | | | | — | | | | — | | | | — | | | | — | | | | | | | | | | | | | | | | | | | | | | | | | | | | | | | | | | | | | | | Net ALM contracts | | $ | 1,457 | | | | | | | | | | | | | | | | | | | | | | | | | | | | | | | | | | | | | | | | | | | | | | | | | | | | | | | | | | | | | | | | | | | December 31, 2005 | | | | | | | | | | | | | | | | | | | | | | | | | | | | | | | | | | | | | | | | | Expected Maturity | | | Average
Estimated
Duration | (Dollars in millions, average
estimated duration in years) | | Fair
Value | | | Total | | | 2006 | | | 2007 | | | 2008 | | | 2009 | | | 2010 | | | Thereafter | | | Receive fixed interest rate swaps (1) | | $ | (1,390 | ) | | | | | | | | | | | | | | | | | | | | | | | | | | | | | | 4.17 | Notional amount | | | | | | $ | 108,985 | | | $ | 4,337 | | | $ | 13,080 | | | $ | 6,144 | | | $ | 39,107 | | | $ | 10,387 | | | $ | 35,930 | | | | Weighted average fixed rate | | | | | | | 4.62 | % | | | 4.75 | % | | | 4.66 | % | | | 4.02 | % | | | 4.51 | % | | | 4.43 | % | | | 4.77 | % | | | Pay fixed interest rate swaps (1) | | | (408 | ) | | | | | | | | | | | | | | | | | | | | | | | | | | | | | | 3.85 | Notional amount | | | | | | $ | 102,281 | | | $ | 5,100 | | | $ | 55,925 | | | $ | 10,152 | | | $ | — | | | $ | — | | | $ | 31,104 | | | | Weighted average fixed rate | | | | | | | 4.61 | % | | | 3.23 | % | | | 4.46 | % | | | 4.24 | % | | | — | % | | | — | % | | | 5.21 | % | | | Foreign exchange basis swaps (2) | | | (644 | ) | | | | | | | | | | | | | | | | | | | | | | | | | | | | | | | Notional amount | | | | | | $ | 17,806 | | | $ | 514 | | | $ | 174 | | | $ | 884 | | | $ | 2,839 | | | $ | 3,094 | | | $ | 10,301 | | | | Option products(3) | | | 1,349 | | �� | | | | | | | | | | | | | | | | | | | | | | | | | | | | | | Notional amount | | | | | | | 57,246 | | | | — | | | | — | | | | 57,246 | | | | — | | | | — | | | | — | | | | Foreign exchange contracts(4) | | | 909 | | | | | | | | | | | | | | | | | | | | | | | | | | | | | | | | Notional amount(5) | | | | | | | 16,061 | | | | 1,335 | | | | 51 | | | | 1,436 | | | | 1,826 | | | | 3,485 | | | | 7,928 | | | | Futures and forward rate contracts | | | (202 | ) | | | | | | | | | | | | | | | | | | | | | | | | | | | | | | | Notional amount(5) | | | | | | | 34,716 | | | | 34,716 | | | | — | | | | — | | | | — | | | | — | | | | — | | | | | | | | | | | | | | | | | | | | | | | | | | | | | | | | | | | | | | | Net ALM contracts | | $ | (386 | ) | | | | | | | | | | | | | | | | | | | | | | | | | | | | | | |
(1) | At December 31, 2006, $4.2 billion of the receive fixed and $52.5 billion of the pay fixed swap notional represented forward starting swaps that will not be effective until their respective contractual start dates. At December 31, 2005, $46.6 billion of the receive fixed swap notional and $41.9 billion of the pay fixed swap notional represented forward starting swaps that will not be effective until their respective contractual start dates. |
(2) | Foreign exchange basis swaps consist of cross-currency variable interest rate swaps used separately or in conjunction with receive fixed interest rate swaps. |
(3) | Option products include $225.1 billion in caps and $18.2 billion in swaptions at December 31, 2006. Amounts at December 31, 2005 totaled $5.0 billion in caps and 2004. The changes$52.2 billion in our swap and option positions reflect actions taken associated withswaptions.
|
(4) | Foreign exchange contracts include foreign-denominated receive fixed interest rate risk management. The decisions to reposition our derivative portfolio are based upon the current assessment of economic and financial conditions including theswaps, cross-currency receive fixed interest rate environment, balance sheet compositionswaps and trends, and the relative mix of our cash and derivative positions. Theforeign currency forward rate contracts. Total notional amount of our net receive fixed swap position (including foreign exchange contracts) decreased $328 million to $22.8 billion at December 31, 2005 compared to December 31, 2004. The notional amount2006 was comprised of our net option position decreased $266.6$21.0 billion to $57.2 billion at December 31, 2005 compared to December 31, 2004. The vast majority of the decrease in the option notional amount was related to terminationsforeign-denominated and maturities of short duration options which were hedging short-term repricing risk of our liabilities. Includedcross currency receive fixed swaps and $697 million in the futures andforeign currency forward rate contract amounts are $35.0 billion of forward purchase contracts of mortgage-backed securities and mortgage loans at December 31, 2005 settling from January 2006 to April 2006 with an average yield of 5.46 percent and $46.7 billion of forward purchase contracts of mortgage-backed securities and mortgage loans at December 31, 2004 that settled from January 2005 to February 2005 with an average yield of 5.26 percent. There were no forward sale contracts of mortgage-backed securities at December 31, 2005, compared to $25.8 billion at December 31, 2004 that settled from January 2005 to February 2005 with an average yield of 5.47 percent.
The following table includes derivatives utilized in our ALM process, including those designated as SFAS 133 hedges and those used as economic hedges that do not qualify for SFAS 133 hedge accounting treatment. The fair value of net ALM contracts decreased from $3.4 billion at December 31, 2004 to $(386) million at December 31, 2005. The decrease was attributable to decreases in the value of options, foreign exchange contracts and futures and forward rate contracts, partially offset by increases in the value of interest rate swaps. The decrease in the value of options was due to reduction in outstanding option positions due to terminations, maturities and decreases in the values of remaining open options positions. The decrease in the value of foreign exchange contracts was due to the strengthening of the U.S. dollar against most foreign currencies during 2005. The decrease in the value of futures and forward rate contracts was due to the impact of increases in interest rates during 2005 on long futures and forward rate contracts.
Table 29
Asset and Liability Management Interest Rate and Foreign Exchange Contracts
| | | | | | | | | | | | | | | | | | | | | | | | | | | | | | | | | | | | December 31, 2005 | | | | | | | | | | | | | | | | | | | | | | | | | | | | | | | | | Expected Maturity
| | | Average Estimated
Duration
| (Dollars in millions, average
estimated duration in years) | | Fair
Value
| | | Total
| | | 2006
| | | 2007
| | | 2008
| | | 2009
| | | 2010
| | | Thereafter
| | | Receive fixed interest rate swaps(1) | | $ | (1,390 | ) | | | | | | | | | | | | | | | | | | | | | | | | | | | | | | 4.17 | Notional amount | | | | | | $ | 108,985 | | | $ | 4,337 | | | $ | 13,080 | | | $ | 6,144 | | | $ | 39,107 | | | $ | 10,387 | | | $ | 35,930 | | | | Weighted average fixed rate | | | | | | | 4.62 | % | | | 4.75 | % | | | 4.66 | % | | | 4.02 | % | | | 4.51 | % | | | 4.43 | % | | | 4.77 | % | | | Pay fixed interest rate swaps(1) | | | (408 | ) | | | | | | | | | | | | | | | | | | | | | | | | | | | | | | 3.85 | Notional amount | | | | | | $ | 102,281 | | | $ | 5,100 | | | $ | 55,925 | | | $ | 10,152 | | | $ | — | | | $ | — | | | $ | 31,104 | | | | Weighted average fixed rate | | | | | | | 4.61 | % | | | 3.23 | % | | | 4.46 | % | | | 4.24 | % | | | — | % | | | — | % | | | 5.21 | % | | | Basis swaps | | | (644 | ) | | | | | | | | | | | | | | | | | | | | | | | | | | | | | | | Notional amount(3) | | | | | | $ | 17,806 | | | $ | 514 | | | $ | 174 | | | $ | 884 | | | $ | 2,839 | | | $ | 3,094 | | | $ | 10,301 | | | | Option products(2) | | | 1,349 | | | | | | | | | | | | | | | | | | | | | | | | | | | | | | | | Notional amount(3) | | | | | | | 57,246 | | | | — | | | | — | | | | 57,246 | | | | — | | | | — | | | | — | | | | Foreign exchange contracts | | | 909 | | | | | | | | | | | | | | | | | | | | | | | | | | | | | | | | Notional amount | | | | | | | 16,061 | | | | 1,335 | | | | 51 | | | | 1,436 | | | | 1,826 | | | | 3,485 | | | | 7,928 | | | | Futures and forward rate contracts(4) | | | (202 | ) | | | | | | | | | | | | | | | | | | | | | | | | | | | | | | | Notional amount(3) | | | | | | | 34,716 | | | | 34,716 | | | | — | | | | — | | | | — | | | | — | | | | — | | | | | | |
|
|
| | | | | | | | | | | | | | | | | | | | | | | | | | | | | | | Net ALM contracts | | $ | (386 | ) | | | | | | | | | | | | | | | | | | | | | | | | | | | | | | | | | |
|
|
| | | | | | | | | | | | | | | | | | | | | | | | | | | | | | | | | | | | | | | | | | December 31, 2004 | | | | | | | | | | | | | | | | | | | | | | | | | | | | | | | | | Expected Maturity
| | | Average Estimated
Duration
| (Dollars in millions, average
estimated duration in years) | | Fair
Value
| | | Total
| | | 2005
| | | 2006
| | | 2007
| | | 2008
| | | 2009
| | | Thereafter
| | | Receive fixed interest rate swaps(1) | | $ | (880 | ) | | | | | | | | | | | | | | | | | | | | | | | | | | | | | | 4.43 | Notional amount | | | | | | $ | 167,324 | | | $ | 2,580 | | | $ | 7,290 | | | $ | 23,598 | | | $ | 46,917 | | | $ | 25,601 | | | $ | 61,338 | | | | Weighted average fixed rate | | | | | | | 4.04 | % | | | 4.78 | % | | | 4.52 | % | | | 3.11 | % | | | 3.47 | % | | | 3.83 | % | | | 4.83 | % | | | Pay fixed interest rate swaps(1) | | | (2,248 | ) | | | | | | | | | | | | | | | | | | | | | | | | | | | | | | 4.77 | Notional amount | | | | | | $ | 157,837 | | | $ | 39 | | | $ | 6,320 | | | $ | 62,584 | | | $ | 16,136 | | | $ | 10,289 | | | $ | 62,469 | | | | Weighted average fixed rate | | | | | | | 4.24 | % | | | 5.01 | % | | | 3.54 | % | | | 3.58 | % | | | 3.91 | % | | | 3.85 | % | | | 5.13 | % | | | Basis swaps | | | (4 | ) | | | | | | | | | | | | | | | | | | | | | | | | | | | | | | | Notional amount(3) | | | | | | $ | 6,700 | | | $ | 500 | | | $ | 4,400 | | | $ | — | | | $ | — | | | $ | — | | | $ | 1,800 | | | | Option products(2) | | | 3,492 | | | | | | | | | | | | | | | | | | | | | | | | | | | | | | | | Notional amount(3) | | | | | | | 323,835 | | | | 145,200 | | | | 90,000 | | | | 17,500 | | | | 58,404 | | | | — | | | | 12,731 | | | | Foreign exchange contracts | | | 2,748 | | | | | | | | | | | | | | | | | | | | | | | | | | | | | | | | Notional amount | | | | | | | 13,606 | | | | 71 | | | | 1,529 | | | | 55 | | | | 1,587 | | | | 2,091 | | | | 8,273 | | | | Futures and forward rate contracts(4) | | | 287 | | | | | | | | | | | | | | | | | | | | | | | | | | | | | | | | Notional amount(3) | | | | | | | (10,889 | ) | | | 10,111 | | | | (21,000 | ) | | | — | | | | — | | | | — | | | | — | | | | | | |
|
|
| | | | | | | | | | | | | | | | | | | | | | | | | | | | | | | Net ALM contracts | | $ | 3,395 | | | | | | | | | | | | | | | | | | | | | | | | | | | | | | | | | | |
|
|
| | | | | | | | | | | | | | | | | | | | | | | | | | | | | | |
(1) | | At December 31, 2005, $46.6 billion of the receive fixed swap notional amount and $41.9 billion of the pay fixed swap notional amount represented forward starting swaps that will not be effective until their respective contractual start dates. At December 31, 2004, $39.9 billion of the receive fixed swap notional amount and $75.9 billion of the pay fixed swap notional amount represented forward starting swaps that will not be effective until their respective contractual start dates. |
(2) | | Option products include caps, floors, swaptions and exchange-traded options on index futures contracts. These strategies may include option collars or spread strategies, which involve the buying and selling of options on the same underlying security or interest rate index. |
(3) | | Reflects the net of long and short positions. |
(4) | | Futures and forward rate contracts include Eurodollar futures, U.S. Treasury futures, and forward purchase and sale contracts. |
The Corporation uses interest rate and foreign exchange rate derivative instruments to hedge the variability in the cash flows of its variable rate assets and liabilities, and other forecasted transactions (cash flow hedges). The net losses on both open and closed derivative instruments recorded in Accumulated OCI net-of-tax at December 31, 2005 was $(4.3) billion. These net losses are expected to be reclassified into earnings in the same period when the hedged item affects earnings and will decrease income or increase expense on the respective hedged items. Assuming no change in open cash flow derivative hedge positions and no changes to interest and foreign exchange rates beyond what is implied in forward yield curves at December 31, 2005, the net losses are expected to be reclassified into earnings as follows: 9 percent within the next year, 57 percent within five years, 82 percent within 10 years, with the remaining 18 percent thereafter. For more information on derivatives designated as cash flow hedges, see Note 5 of the Consolidated Financial Statements.
The amount included in Accumulated OCI for terminated derivative contracts was a loss of $2.5 billion and a gain of $143 million, net-of-tax, at December 31, 2005 and 2004. The decrease was due primarily to the termination of derivative contracts with previously unrealized losses caused by interest rate fluctuations.
Mortgage Banking Risk Management
Interest rate lock commitments (IRLCs) on loans intended to be sold are subject to interest rate risk between the date of the IRLC and the date the loan is funded. Loans held-for-sale are subject to interest rate risk from the date of funding until the loans are sold to the secondary market. To hedge interest rate risk, we utilize forward loan sale commitments and other derivative instruments including purchased options. These instruments are used either as an economic hedge of IRLCs and loans held-for-sale, or designated as a cash flow hedge of loans held-for-sale, in which case their net-of-tax unrealized gains and losses are included in Accumulated OCI. At December 31, 2005, the notional amountbalance consisted entirely of derivatives hedging$16.1 billion in foreign-denominated and cross-currency fixed swaps.
|
(5) | Reflects the IRLCsnet of long and loans held-for-sale was $26.9 billion. The related net-of-tax unrealized loss on the derivatives designated as cash flow hedges included in Accumulated OCI at December 31, 2005 was $3 million. The notional amount of the IRLCs adjusted for fallout in the pipeline at December 31, 2005 was $4.3 billion. The amount of loans held-for-sale at December 31, 2005 was $6.1 billion.short positions. |
(6) | We manage changes in the value of MSRs by entering into derivative financial instruments and by purchasing and selling securities. MSRs are an intangible asset created when the underlying mortgage loan is sold to investors and we retain the right to service the loan. As of December 31, 2005, the MSR balance in Consumer Real Estate was $2.7 billion, or 13 percent higher than December 31, 2004. For more information on Consumer Real Estate MSRs, refer to page 31.
We designate certain derivatives such as purchased options and interest rate swaps as fair value hedges of specified MSRs under SFAS 133. At December 31, 2005,2006, the amountposition was comprised of MSRs identified as being hedged by derivatives$8.5 billion in accordance with SFAS 133 was approximately $2.3 billion. The notional amount of the derivativeforward purchase contracts designated as SFAS 133 hedges of MSRs at December 31, 2005 was $33.7 billion. The changesthat settled in the fair values of the derivative contracts are substantially offset by changes in the fair values of the MSRs that are hedged by these derivative contracts. During 2005, the change in value attributed to SFAS 133 hedged MSRs was $291 million, offset by derivative hedge losses of $124 million.January 2007.
|
The Corporation uses interest rate derivative instruments to hedge the variability in the cash flows of its assets and liabilities, and other forecasted transactions (cash flow hedges). The net losses on both open and closed derivative instruments recorded in Accumulated OCI net-of-tax at December 31, 2006 was $3.7 billion. These net losses are expected to be reclassified into earnings in the same period when the hedged cash flows affect earnings and will decrease income or increase expense on the respective hedged cash flows. Assuming no change in open cash flow derivative hedge positions and no changes to interest rates beyond what is implied in forward yield curves at December 31, 2006, the net losses are expected to be reclassified into earnings as follows: $1.0 billion (pre-tax), or 18 percent, within the next year, 58 percent within five years, 83 percent within 10 years, with the remaining 17 percent thereafter. For more information on derivatives designated as cash flow hedges, see Note 4 of the Consolidated Financial Statements. The amount included in Accumulated OCI for terminated derivative contracts were losses of $3.2 billion and $2.5 billion, net-of-tax, at December 31, 2006 and 2005. The increase in losses can be attributable primarily to losses in the value of interest rate derivatives that were terminated during the year. Losses on these terminated derivative contracts are reclassified into earnings in the same period or periods during which the hedged forecasted transaction affects earnings. In addition, we hold additional derivatives and certain securities (i.e. mortgage-backed securities) as economic hedges of MSRs, which are not designated as SFAS 133 accounting hedges. During 2005, Interest Income from securities used as an economic hedge of MSRs of $18 million was recognized. At December 31, 2005, the amount of MSRs covered by such economic hedges was $250 million. At December 31, 2005, the unrealized loss on AFS Securities held as economic hedges of MSRs was $29 million compared to an unrealized gain of $21 million on December 31, 2004.
| | Mortgage Banking Risk Management |
Interest rate lock commitments (IRLCs) on loans intended to be sold are subject to interest rate risk between the date of the IRLC and the date the loan is funded. Residential first mortgage loans held-for-sale are subject to interest rate risk from the date of funding until the loans are sold to the secondary market. To hedge interest rate risk, we utilize forward loan sale commitments and other derivative instruments including purchased options. These instruments are used either as an economic hedge of IRLCs and residential first mortgage loans held-for-sale, or designated as a cash flow hedge of residential first mortgage loans held-for-sale, in which case their net-of-tax unrealized gains and losses are included in Accumulated OCI. At December 31, 2006, the notional amount of derivatives economically hedging the IRLCs and residential first mortgage loans held-for-sale was $15.0 billion. We manage changes in the value of MSRs by entering into derivative financial instruments. MSRs are a nonfinancial asset created when the underlying mortgage loan is sold to investors and we retain the right to service the loan. We use certain derivatives such as options and interest rate swaps as economic hedges of MSRs. At December 31, 2006, the amount of MSRs identified as being hedged by derivatives was approximately $2.9 billion. The notional amount of the derivative contracts designated as economic hedges of MSRs at December 31, 2006 was $44.9 billion. The changes in the fair values of the derivative contracts are substantially offset by changes in the values of the MSRs that are hedged by these derivative contracts. During 2006, the increase in value attributed to economically hedged MSRs was $414 million offset by derivative hedge losses of $200 million. The Corporation adopted SFAS No. 156 “Accounting for Servicing of Financial Assets” and accounts for consumer-related MSRs using the fair value measurement method on January 1, 2006. See Note 1 of the Consolidated Financial Statements for additional information as it relates to this accounting standard. See Note 8 of the Consolidated Financial Statements for additional information on MSRs. See Notes 1 and 9 of the Consolidated Financial Statements for additional information.
| | Operational Risk Management Operational risk is the risk of loss resulting from inadequate or failed internal processes, people and systems, including system conversions and integration, and external events. Successful operational risk management is particularly important to a diversified financial services company like ours because of the very nature, volume and complexity of our various businesses.
In keeping with our management governance structure, the lines of business are responsible for all the risks within the business including operational risks. Such risks are managed through corporate-wide or line of business specific
|
Operational risk is the risk of loss resulting from inadequate or failed internal processes, people and systems, including system conversions and integration, and external events. Successful operational risk management is particularly important to diversified financial services companies because of the nature, volume and complexity of the financial services business. We approach operational risk from two perspectives: enterprise-wide and line of business-specific. The Compliance and Operational Risk Committee provides oversight of significant company-wide operational and compliance issues. Within Global Risk Management, Enterprise Compliance and Operational Risk Management develops policies, and procedures, controls, and monitoring tools. Examples of these include personnel management practices, data reconciliation processes, fraud management units, transaction processing monitoring and analysis, business recovery planning, and new product introduction processes. We approach operational risk from two perspectives, enterprise-wide and line of business-specific. The Compliance and Operational Risk Committee, chartered in 2005 as a subcommittee of the Finance Committee, provides consistent communication and oversight of significant operational and compliance issues and oversees the adoption of best practices. Two groups within Risk Management, Compliance Risk Management and Enterprise Operational Risk
Management, facilitate the consistency of effective policies, industry best practices, controls and monitoring tools for assessing and managing and assessing operational risks across the Corporation. We also mitigate operational risk through a broad-based approach to process management and process improvement. Improvement efforts are focused on reduction of variation in outputs. We have a dedicated Quality and Productivity team to manage and certify the process management and improvement efforts. For selected risks, we use specialized support groups, such as Information Security
and Supply Chain Management, to develop corporate-wide risk management practices, such as an information security program and a supplier program to ensure that suppliers adopt appropriate policies and procedures when performing work on behalf of the Corporation. These specialized groups also assist the lines of business in the development and implementation of risk management practices specific to the needs of the individual businesses. These groups also work with the line of business executives and their Risk Management counterparts to implement appropriate policies, processes and assessments at the line of business level and support groups. Compliance and operational risk awareness is also driven across the Corporation through training and strategic communication efforts. For selected risks, we establish specialized support groups, for example, Information Security and Supply Chain Management. These specialized groups develop corporate-wide risk management practices, such as an information security program and a supplier program to ensure suppliers adopt appropriate policies and procedures when performing work on behalf of the Corporation. These specialized groups also assist the lines of business in the development and implementation of risk management practices specific to the needs of the individual businesses. At the line of business level, the Line of Business Risk Executives are responsible for adherence to corporate practices and oversight of all operational risks in the line of business they support. Operational and compliance risk management, working in conjunction with senior line of business executives, have developed key tools to help manage, monitor and summarize operational risk. One tool the businesses and executive management utilize is a corporate-wide self-assessment process, which helps to identify and evaluate the status of risk issues, including mitigation plans, if appropriate. Its goal is to continuously assess changing market and business conditions and evaluate all operational risks impacting the line of business. The self-assessment process assists in identifying emerging operational risk issues and determining at the line of business or corporate level how they should be managed. In addition to information gathered from the self-assessment process, key operational risk indicators have been developed and are used to help identify trends and issues on both a corporate and a line of business executives and risk executives to develop appropriate policies, practices, controls and monitoring tools for each line of business. Through training and communication efforts, compliance and operational risk awareness is driven across the Corporation.
The lines of business are responsible for all the risks within the business line, including operational risks. Operational and Compliance Risk executives, working in conjunction with senior line of business executives, have developed key tools to help manage, monitor and report operational risk in each business line. Examples of these include personnel management practices, data reconciliation processes, fraud management units, transaction processing monitoring and analysis, business recovery planning, and new product introduction processes. In addition, the lines of business are responsible for monitoring adherence to corporate practices. Management uses a self-assessment process, which helps to identify and evaluate the status of risk issues, including mitigation plans, as appropriate. The goal of the self-assessment process is to periodically assess changing market and business conditions and to evaluate key operational risks impacting each line of business. In addition to information gathered from the self-assessment process, key operational risk indicators have been developed and are used to help identify trends and issues on both a corporate and a business line level. More generally, we mitigate operational risk through a broad-based approach to process management and process improvement. Improvement efforts are focused on reduction of variation in outputs. We have a dedicated Quality and Productivity team to manage and certify the process management and improvement efforts.
| | Recent Accounting and Reporting Developments |
See Note 1 of the Consolidated Financial Statements for a discussion of recently issued or proposed accounting pronouncements. | | Complex Accounting Estimates Our significant accounting principles as described in Note 1 of the Consolidated Financial Statements, are essential in understanding Management’s Discussion and Analysis of Results of Operations and Financial Condition. Many of our significant accounting principles require complex judgments to estimate values of assets and liabilities. We have procedures and processes to facilitate making these judgments.
The more judgmental estimates are summarized below. We have identified and described the development of the variables most important in the estimation process that, with the exception of accrued taxes, involves
|
Our significant accounting principles, as described in Note 1 of the Consolidated Financial Statements, are essential in understanding Management’s Discussion and Analysis of Financial Condition and Results of Operations. Many of our significant accounting principles require complex judgments to estimate values of assets and liabilities. We have procedures and processes to facilitate making these judgments. The more judgmental estimates are summarized below. We have identified and described the development of the variables most important in the estimation process that, with the exception of accrued taxes, involve mathematical models to derive the estimates. In many cases, there are numerous alternative judgments that could be used in the process of determining the inputs to the model. Where alternatives exist, we have used the factors that we believe represent the most reasonable value in developing the inputs. Actual performance that differs from our estimates of the key variables could impact Net Income. Separate from the possible future impact to Net Income from input and model variables, the value of our lending portfolio and market sensitive assets and liabilities may change subsequent to the balance sheet measurement, often significantly, due to the nature and magnitude of future credit and market conditions. Such credit and market conditions may change quickly and in unforeseen ways and the resulting volatility could have a significant, negative effect on future operating results. These fluctuations would not be indicative of deficiencies in our models or inputs. | | Allowance for Credit Losses The allowance for credit losses is our estimate of probable losses in the loans and leases portfolio and within our unfunded lending commitments. Changes to the allowance for credit losses are reported in the Consolidated Statement of Income in the Provision for Credit Losses. Our process for determining the allowance for credit losses is discussed in the Credit Risk Management section beginning on page 49 and Note 1 of the Consolidated Financial Statements. Due to the variability in the drivers of the assumptions made in this process, estimates of the portfolio’s inherent risks and overall collectibility change with changes in the economy, individual industries, countries and individual borrowers’ or counterparties’ ability and willingness to repay their obligations. The degree to which any particular assumption affects the allowance for credit losses depends on the severity of the change and its relationship to the other assumptions.
Key judgments used in determining the allowance for credit losses include: (i) risk ratings for pools of commercial loans and leases, (ii) market and collateral values and discount rates for individually evaluated loans, (iii) product type classifications for consumer and commercial loans and leases, (iv) loss rates used for consumer and commercial loans and leases, (v) adjustments made to assess current events and conditions, (vi) considerations regarding domestic and global economic uncertainty, and (vii) overall credit conditions.
Our Allowance for Loan and Lease Losses is sensitive to the risk rating assigned to commercial loans and leases and to the loss rates used for the consumer and commercial portfolios.
|
The allowance for credit losses is our estimate of probable losses in the loans and leases portfolio and within our unfunded lending commitments. Changes to the allowance for credit losses are reported in the Consolidated Statement of Income in the Provision for Credit Losses. Our process for determining the allowance for credit losses is discussed in the Credit Risk Management section beginning on page 53 and Note 1 of the Consolidated Financial Statements. Due to the variability in the drivers of the assumptions made in this process, estimates of the portfolio’s inherent risks and overall collectibility change with changes in the economy, individual industries, countries and individual borrowers’ or counterparties’ ability and willingness to repay their obligations. The degree to which any particular assumption affects the allowance for credit losses depends on the severity of the change and its relationship to the other assumptions. Key judgments used in determining the allowance for credit losses include: (i) risk ratings for pools of commercial loans and leases, (ii) market and collateral values and discount rates for individually evaluated loans, (iii) product type classifications for consumer and commercial loans and leases, (iv) loss rates used for consumer and commercial loans and leases, (v) adjustments made to assess current events and conditions, (vi) considerations regarding domestic and global economic uncertainty, and (vii) overall credit conditions. Our Allowance for Loan and Lease Losses is sensitive to the risk rating assigned to commercial loans and leases. Assuming a downgrade of one level in the internal risk rating for commercial loans and leases rated under the internal risk rating scale, except loans and leases already risk rated Doubtful as defined by regulatory authorities, the Allowance for Loan and Lease Losses would increase by approximately $830 million at December 31, 2006. The Allowance for Loan and Lease Losses as a percentage of loan and lease outstandings at December 31, 2006 was 1.28 percent and this hypothetical increase in the allowance would raise the ratio to approximately 1.39 percent. Our Allowance for Loan and Lease Losses is also sensitive to the loss rates used for the consumer and commercial portfolios. A 10 percent increase in the loss rates used on the consumer and commercial loan and lease portfolios would increase the Allowance for Loan and Lease Losses at December 31, 2006 by approximately $610 million, of which $515 million would relate to consumer and $95 million to commercial. These sensitivity analyses do not represent management’s expectations of the deterioration in risk ratings or the increases in loss rates but are provided as hypothetical scenarios to assess the sensitivity of the Allowance for Loan and Lease Losses to changes in key inputs. We believe the risk ratings and loss severities currently in use are appropriate and that the probability of a downgrade of one level of the internal risk rating for commercial loans and leases, except loans already risk rated Doubtful as defined by regulatory authorities, the Allowance for Loan and Lease Losses for the commercial portfolio would increase by approximately $894 million at December 31, 2005. The Allowance for Loan and Lease Losses as a percentage of loan and lease outstandings at December 31, 2005 was 1.40 percent and this hypothetical increase in the allowance would raise the ratio to approximately 1.56 percent. A 10 percent increase in the loss rates used on the consumer and commercial loan and lease portfolios would increase the Allowance for Loan and Lease Losses at December 31, 2005 by approximately $348 million, of which $283 million would relate to consumer and $65 million to commercial. These sensitivity analyses do not represent management’s expectations of the deterioration in risk ratings or the increases in loss rates but are provided as hypothetical scenarios to assess the sensitivity of the Allowance for Loan and Lease Losses to changes in key inputs. We believe the risk ratings and loss severities currently in use are appropriate and that the probability of a downgrade of one level of the internal credit ratings for commercial loans and leases within a short period of time is remote.
The process of determining the level of the allowance for credit losses requires a high degree of judgment. It is possible that others, given the same information, may at any point in time reach different reasonable conclusions. | | Fair Value of Financial Instruments Trading Account Assets and Liabilities are recorded at fair value, which is primarily based on actively traded markets where prices are based on either direct market quotes or observed transactions. Liquidity is a significant factor in the determination of the fair value of Trading Account Assets or Liabilities. Market price quotes may not be readily available for some positions, or positions within a market sector where trading activity has slowed significantly or ceased. Situations of illiquidity generally are triggered by the market’s perception of credit uncertainty regarding a single company or a specific market sector. In these instances, fair value is determined based on limited available market information and other factors, principally from reviewing the issuer’s financial statements and changes in credit ratings made by one or more rating agencies. At December 31, 2005, $4.9 billion, or four percent, of Trading Account Assets were fair valued using these alternative approaches. An immaterial amount of Trading Account Liabilities were fair valued using these alternative approaches at December 31, 2005.
Trading Account Profits, which represent the net amount earned from our trading positions, can be volatile and are largely driven by general market conditions and customer demand. Trading Account Profits are dependent on the volume and type of transactions, the level of risk assumed, and the volatility of price and rate movements at any given time. To evaluate risk in our trading activities, we focus on the actual and potential volatility of individual positions as well as portfolios. At a portfolio and corporate level, we use trading limits, stress testing and tools such as VAR modeling, which estimates a potential loss which is not expected to be exceeded with a specified confidence level, to measure and manage market risk. At December 31, 2005, the amount of our VAR was $61 million based on a 99 percent confidence level. For more information on VAR, see pages 67 through 69.
The fair values of Derivative Assets and Liabilities include adjustments for market liquidity, counterparty credit quality, future servicing costs and other deal specific factors, where appropriate. To ensure the prudent application of estimates and management judgment in determining the fair value of Derivative Assets and Liabilities, various processes and controls have been adopted, which include: a Model Validation Policy that requires a review and approval of quantitative models used for deal pricing, financial statement fair value determination and risk quantification; a Trading Product Valuation Policy that requires verification of all traded product valuations; and a periodic review and substantiation of daily profit and loss reporting for all traded products. These processes and controls are performed independently of the business segment.
The fair values of Derivative Assets and Liabilities traded in the over-the-counter market are determined using quantitative models that require the use of multiple market inputs including interest rates, prices, and indices to generate continuous yield or pricing curves and volatility factors, which are used to value the position. The predominance of market inputs are actively quoted and can be validated through external sources, including brokers, market transactions and third-party pricing services. Estimation risk is greater for derivative asset and liability positions that are either option-based or have longer maturity dates where observable market inputs are less readily available or are unobservable, in which case quantitative based extrapolations of rate, price or index scenarios are used in determining fair values. At December 31, 2005, the fair values of Derivative Assets and Liabilities determined by these quantitative models were $10.5 billion and $6.4 billion. These amounts reflect the full fair value of the derivatives and do not isolate the discrete value associated with the subjective valuation variable. Further, they represent four percent and three percent of Derivative Assets and Liabilities, before the impact of legally enforceable master netting agreements. For the year ended December 31, 2005, there were no changes to the quantitative models, or uses of such models, that resulted in a material adjustment to the income statement.
The Corporation recognizes gains and losses at inception of a derivative contract only if the fair value of the contract is evidenced by a quoted market price in an active market, an observable price or other market transaction, or other observable data supporting a valuation model. For those gains and losses not evidenced by the above mentioned market data, the transaction price is used as the fair value of the derivative contract. Any difference between the transaction price and the model fair value is considered an unrecognized gain or loss at inception of the contract. Previously unrecognized gains and losses are recorded in income using the straight line method of amortization over the contractual life of the derivative contract. Earlier recognition of the full unrecognized gain or loss is permitted if the trade is terminated early, subsequent market activity is observed which supports the model fair value of the contract, or significant inputs used in the valuation model become observable.
|
Trading Account Assets and Liabilities are recorded at fair value, which is primarily based on actively traded markets where prices are based on either direct market quotes or observed transactions. Liquidity is a significant factor in the determination of the fair value of Trading Account Assets or Liabilities. Market price quotes may not be readily available for some positions, or positions within a market sector where trading activity has slowed significantly or ceased. Situations of illiquidity generally are triggered by the market’s perception of credit uncertainty regarding a single company or a specific market sector. In these instances, fair value is determined based on limited available market information and other factors, principally from reviewing the issuer’s financial statements and changes in credit ratings made by one or more rating agencies. At December 31, 2006, $8.4 billion, or six percent, of Trading Account Assets were fair valued using these alternative approaches. An immaterial amount of Trading Account Liabilities were fair valued using these alternative approaches at December 31, 2006. The fair values of Derivative Assets and Liabilities include adjustments for market liquidity, counterparty credit quality, future servicing costs and other deal specific factors, where appropriate. To ensure the prudent application of estimates and management judgment in determining the fair value of Derivative Assets and Liabilities, various processes and controls have been adopted, which include: a Model Validation Policy that requires a review and approval of quantitative models used for deal pricing, financial statement fair value determination and risk quantification; a Trading Product Valuation Policy that requires verification of all traded product valuations; and a periodic review and substantiation of daily profit and loss reporting for all traded products. These processes and controls are performed independently of the business segments. The fair values of Derivative Assets and Liabilities traded in the over-the-counter market are determined using quantitative models that require the use of multiple market inputs including interest rates, prices, and indices to generate continuous yield or pricing curves and volatility factors, which are used to value the position. The predominance of market inputs are actively quoted and can be validated through external sources, including brokers, market transactions and third- party pricing services. Estimation risk is greater for derivative asset and liability positions that are either option-based or have longer maturity dates where observable market inputs are less readily available or are unobservable, in which case quantitative based extrapolations of rate, price or index scenarios are used in determining fair values. At December 31, 2006, the fair values of Derivative Assets and Liabilities determined by these quantitative models were $29.0 billion and $27.7 billion. These amounts reflect the full fair value of the derivatives and do not isolate the discrete value associated with the subjective valuation variable. Further, they represent 12.3 percent and 12.2 percent of Derivative Assets and Liabilities, before the impact of legally enforceable master netting agreements. For the year ended December 31, 2006, there were no changes to the quantitative models, or uses of such models, that resulted in a material adjustment to the Consolidated Statement of Income. Trading Account Profits, which represent the net amount earned from our trading positions, can be volatile and are largely driven by general market conditions and customer demand. Trading Account Profits are dependent on the volume and type of transactions, the level of risk assumed, and the volatility of price and rate movements at any given time within the ever-changing market environment. To evaluate risk in our trading activities, we focus on the actual and potential volatility of individual positions as well as portfolios. At a portfolio and corporate level, we use trading limits, stress testing and tools such as VAR modeling, which estimates a potential daily loss which is not expected to be exceeded with a specified confidence level, to measure and manage market risk. At December 31, 2006, the amount of our VAR was $48 million based on a 99 percent confidence level. For more information on VAR, see Trading Risk Management beginning on page 73. The Corporation recognizes gains and losses at inception of a derivative contract only if the fair value of the contract is evidenced by a quoted market price in an active market, an observable price or other market transaction, or other observable data supporting a valuation model in accordance with Emerging Issues Task Force (EITF) Issue No. 02-3, “Issues Involved in Accounting for Derivative Contracts Held for Trading Purposes and Contracts Involved in Energy Trading and Risk Management Activities” (EITF 02-3). For those gains and losses not evidenced by the above mentioned market data, the transaction price is used as the fair value of the derivative contract. Any difference between the transaction price and the model fair value is considered an unrecognized gain or loss at inception of the contract. These unrecognized gains and losses are recorded in income using the straight line method of amortization over the contractual life of the derivative contract. Earlier recognition of the full unrecognized gain or loss is permitted if the trade is terminated early, subsequent market activity is observed which supports the model fair value of the contract, or significant inputs used in the valuation model become observable in the market. As of December 31, 2006, the balance of the above unrecognized gains and losses was not material. SFAS No. 157, “Fair Value Measurements” which defines fair value, establishes a framework for measuring fair value under GAAP and enhances disclosures about fair value measurements, will nullify certain guidance in EITF 02-3 when adopted and as a result, a portion of the above unrecognized gains and losses will be accounted for as a cumulative-effect adjustment to the opening balance of Retained Earnings. AFS Securities are recorded at fair value, which is generally based on direct market quotes from actively traded markets. | | Principal Investing Principal Investing is included withinEquity Investments and is discussed in more detail in Business Segment Operations beginning on page 26. Principal Investing is comprised of a diversified portfolio of investments in privately-held and publicly-traded companies at all stages, from start-up to buyout. These investments are made either directly in a company or held through a fund. Some of these companies may need access to additional cash to support their long-term business models. Market conditions and company performance may impact whether funding is available from private investors or the capital markets.
Investments with active market quotes are carried at estimated fair value; however, the majority of our investments do not have publicly available price quotations. At December 31, 2005, we had nonpublic investments of $6.1
|
Principal Investing is included withinEquity Investments included inAll Other and is discussed in more detail beginning on page 41. Principal Investing is comprised of a diversified portfolio of investments in privately-held and publicly-traded companies at all stages of their life cycle, from start-up to buyout. These investments are made either directly in a company or held through a fund. Some of these companies may need access to additional cash to support their long-term business models. Market conditions and company performance may impact whether funding is available from private investors or the capital markets. Investments with active market quotes are carried at estimated fair value; however, the majority of our investments do not have publicly available price quotations. At December 31, 2006, we had nonpublic investments of $5.1 billion, or approximately 95 percent of the total portfolio. Valuation of these investments requires significant management judgment. Management determines values of the underlying investments based on multiple methodologies including in-depth semi-annual reviews of the investee’s financial statements and financial condition, discounted cash flows, the prospects of the investee’s industry and current overall market conditions for similar investments. In addition, on a quarterly basis as events occur or information comes to the attention of management that indicates a change in the value of an investment is warranted, investments are adjusted from their original invested amount to estimated fair values at the balance sheet date with changes being recorded in Equity Investment Gains in the Consolidated Statement of Income. Investments are not adjusted above the original amount invested unless there is clear evidence of a fair value in excess of the original invested amount to estimated fair values at the balance sheet date with changes being recorded in Equity Investment Gains in the Consolidated Statement of Income. Investments are not adjusted above the original amount invested unless there is clear evidence of a fair value in excess of the original invested amount. This evidence is often in the form of a recent transaction in the investment. As part of the valuation process, senior management reviews the portfolio and determines when an impairment needs to be recorded. The Principal Investing portfolio is not material to our Consolidated Balance Sheet, but the impact of the valuation adjustments may be material to our operating results for any particular quarter. As more fully described in Notes 1 and 18 of the Consolidated Financial Statements, we account for income taxes in accordance with SFAS No. 109, “Accounting for Income Taxes” (SFAS 109). Accrued income taxes, reported as a component of Accrued Expenses and Other Liabilities on our Consolidated Balance Sheet, represents the net amount of current income taxes we expect to pay to or receive from various taxing jurisdictions attributable to our operations to date. We currently file income tax returns in more than 100 jurisdictions and consider many factors—including statutory, judicial and regulatory guidance—in estimating the appropriate accrued income taxes for each jurisdiction. In applying the principles of SFAS 109, we monitor relevant tax authorities and change our estimate of accrued income taxes due to changes in income tax laws and their interpretation by the courts and regulatory authorities. These revisions of our estimate of accrued income taxes, which also may result from our own income tax planning and from the resolution of income tax controversies, may be material to pay to or receive from various taxing jurisdictions attributable to our operations to date. We currently file income tax returns in more than 100 jurisdictions and consider many factors—including statutory, judicial and regulatory guidance—in estimating the appropriate accrued income taxes for each jurisdiction. In applying the principles of SFAS 109, we monitor relevant tax authorities and change our estimate of accrued income taxes due to changes in income tax laws and their interpretation by the courts and regulatory authorities. These revisions of our estimate of accrued income taxes, which also may result from our own income tax planning and from the resolution of income tax controversies, can materially affect our operating results for any given quarter.
| Goodwill and Other Intangibles AssetsThe nature of and accounting for Goodwill and Other Intangibles is discussed in detail in Notes 1 and 10 of the Consolidated Financial Statements. Goodwill is reviewed for potential impairment at the reporting unit level on an annual basis, or in interim periods if events or circumstances indicate a potential impairment. The reporting units utilized for this test were those that are one level below the business segments identified on page 26.
|
The nature of and accounting for Goodwill and Intangible Assets is discussed in detail in Notes 1 and 10 of the Consolidated Financial Statements. Goodwill is reviewed for potential impairment at the reporting unit level on an annual basis, or in interim periods if events or circumstances indicate a potential impairment. The reporting units utilized for this test were those that are one level below the business segments identified on page 25. The impairment test is performed in two steps. The first step of the Goodwill impairment test compares the fair value of the reporting unit with its carrying amount, including Goodwill. If the fair value of the reporting unit exceeds its carrying amount, Goodwill of the reporting unit is considered not impaired; however, if the carrying amount of the reporting unit exceeds its fair value, the second step must be performed. The second step compares the implied fair value of the reporting unit’s Goodwill, as defined in SFAS No. 142, “Goodwill and Other Intangible Assets” (SFAS 142), with the carrying amount of that Goodwill. An impairment loss is recorded to the extent that the carrying amount of Goodwill exceeds its implied fair value. For Intangible Assets subject to amortization, impairment exists when the carrying amount of the Intangible Asset exceeds its fair value. An impairment loss will be recognized only if the carrying amount of the Intangible Asset is not recoverable and exceeds its fair value. The carrying amount of the Intangible Asset is not recoverable if it exceeds the sum of the undiscounted cash flows expected to result from it. An Intangible Asset subject to amortization shall be tested for recoverability whenever events or changes in circumstances, such as a significant or adverse change in the business climate that could affect the value of the Intangible Asset, indicate that its carrying amount may not be recoverable. An impairment loss is recorded to the extent the carrying amount of the Intangible Asset exceeds its fair value. The fair values of the reporting units were determined using a combination of valuation techniques consistent with the income approach and the market approach and the fair values of the Intangible Assets were determined using the income approach. For purposes of the income approach, discounted cash flows were calculated by taking the net present value of estimated cash flows using a combination of historical results, estimated future cash flows and an appropriate price to earnings multiple. We use our internal forecasts to estimate future cash flows and actual results may differ from forecasted results. However, these differences have not been material and we believe that this methodology provides a reasonable means to determine fair values. Cash flows were discounted using a discount rate based on expected equity return rates, which was 11 percent for 2006. Expected rates of equity returns were estimated based on historical market returns and risk/return rates for similar industries of the reporting unit. For purposes of the market approach, valuations of reporting units were based on actual comparable market transactions and market earnings multiples for similar industries of the reporting unit. Our evaluations for the year ended December 31, 2006 indicated there was no impairment of Goodwill or Intangible Assets. For Intangible Assets subject to amortization, impairment exists when the carrying amount of the Intangible Asset exceeds its fair value. An impairment loss shall be recognized only if the carrying amount of the Intangible Asset is not recoverable and exceeds its fair value. The carrying amount of the Intangible Asset is not recoverable if it exceeds the sum of the undiscounted cash flows expected to result from it. An Intangible Asset subject to amortization shall be tested for recoverability whenever events or changes in circumstances, such as a significant or adverse change in the business climate that could affect the value of the Intangible Asset, indicate that its carrying amount may not be recoverable. An impairment loss shall be measured as the amount by which the carrying amount of the Intangible Asset exceeds its fair value.
The fair values of the reporting units were determined using a combination of valuation techniques consistent with the income approach and the market approach and the fair values of the Intangible Assets were determined using the income approach. For purposes of the income approach, discounted cash flows were calculated by taking the net present value of estimated cash flows using a combination of historical results, estimated future cash flows and an appropriate price to earnings multiple. We use our internal forecasts to estimate future cash flows and actual results may differ from forecasted results. However, these differences have not been material and we believe that this methodology provides a reasonable means to determine fair values. Cash flows were discounted using a discount rate based on expected equity return rates, which was 11 percent for 2005. Expected rates of equity returns were estimated based on historical market returns and risk/return rates for similar industries of the reporting unit. For purposes of the market approach, valuations of reporting units were based on actual comparable market transactions and market earnings multiples for similar industries of the reporting unit.
Our evaluations for the year ended December 31,
| 2005 indicated there was no impairment of Goodwill and Other Intangibles.2004 Compared to 20032004
The following discussion and analysis provides a comparison of our results of operations for 2004 and 2003. This discussion should be read in conjunction with the Consolidated Financial Statements and related notes on pages 89 through 165. In addition, Tables 2 and 3
|
The following discussion and analysis provides a comparison of our results of operations for 2005 and 2004. This discussion should be read in conjunction with the Consolidated Financial Statements and related Notes. Tables 5 and 6 contain financial data to supplement this discussion. Net Income totaled $16.5 billion, or $4.04 per diluted common share, in 2005 compared to $13.9 billion, or $3.64 per diluted common share, in 2004. The return on average common shareholders’ equity was 16.51 percent in 2005 compared to 16.47 percent in 2004. These earnings provided sufficient cash flow to allow us to return $10.6 billion and $9.0 billion in 2005 and 2004, compared to $10.8 billion, or $3.55 per diluted common share, in 2003. The return on average common shareholders’ equity was 16.47 percent in 2004 compared to 21.50 percent in 2003. These earnings provided sufficient cash flow to allow us to return $8.8 billion and $9.8 billion in 2004 and 2003, in capital to shareholders in the form of dividends and share repurchases, net of employee stock options exercised. Net Interest Income on a FTE basis increased $2.9 billion to $31.6 billion in 2005 compared to 2004. The primary drivers of the increase were the impact of FleetBoston, organic growth in consumer (primarily credit card and home equity) and commercial loans, higher domestic deposit levels and a larger ALM portfolio (primarily securities). Partially offsetting these increases was the adverse impact of spread compression due to the flattening of the yield curve, which contributed to lower Net Interest Income. The net interest yield on a FTE basis declined 33 bps to 2.84 percent in 2005, primarily due to the adverse impact of an increase in lower-yielding, trading-related balances and spread compression, which was partially offset by growth in core deposit and consumer loans. Net Interest Income on a FTE basis increased $7.5 billion to $28.7 billion in 2004. This increase was driven by the impact of the FleetBoston Merger, higher ALM portfolio levels (primarily consisting of securities and whole loan mortgages), the impact of higher rates, growth in consumer loan levels (primarily credit card and home equity) and higher core deposit funding levels. Partially offsetting these increases were reductions in the large corporate and foreign loan balances, lower trading-related contributions, lower mortgage warehouse levels and the continued runoff of previously exited consumer businesses. The net interest yield on a FTE basis declined nine bps to 3.17 percent in 2004 due to the adverse impact of increased trading-related balances, which have a lower yield than other earning assets.
Noninterest Income increased $4.3 billion to $25.4 billion in 2005, due primarily to increases in Card Income of $1.2 billion, Equity Investment Gains of $1.2 billion, Trading Account Profits of $750 million, Service Charges of $715 million, Investment and Brokerage Services of $570 million and Mortgage Banking Income of $391 million. Card Income increased due to increased interchange income and merchant discount fees driven by growth in debit and credit purchase volumes and the acquisition of National Processing, Inc. (NPC). Equity Investment Gains increased as liquidity in the private equity markets increased. Trading Account Profits increased due to increased customer activity and the absence of a writedown of the Excess Spread Certificates that occurred in 2004. Service Charges grew driven by organic account growth. Investment and Brokerage Services increased due to higher asset management fees and mutual fund fees. Mortgage Banking Income grew due to lower MSR impairment charges, partially offset by lower production income. Offsetting these increases was lower Other Income of $396 million primarily related to losses on derivative instruments designated as economic hedges in ALM activities that did not qualify for SFAS 133 hedge accounting treatment. Noninterest Income increased $3.7 billion to $21.0 billion in 2004, due primarily to increases in Card Income of $1.5 billion, Service Charges of $1.4 billion, Investment and Brokerage Services of $1.2 billion, Equity Investment Gains of $648 million, and Trading Account Profits of $461 million. Card Income increased due to increased fees and interchange income, including the impact of the FleetBoston card portfolio. Investment and Brokerage Services increased due to the impact of the FleetBoston business as well as market appreciation. Service Charges grew driven by organic account growth and the impact of FleetBoston customers. Offsetting these increases was lower Mortgage Banking Income of $1.5 billion due to lower production levels, a decrease in the gains on sales of loans to the secondary market and writedowns of the value of MSRs.
| | Provision for Credit Losses The Provision for Credit Losses declined $70 million to $2.8 billion in 2004 driven by lower commercial net charge-offs of $748 million and continued improvements in credit quality in the commercial loan portfolio. Offsetting
|
The Provision for Credit Losses increased $1.2 billion to $4.0 billion in 2005. Domestic consumer credit card drove the increase, the result of higher bankruptcy related credit costs resulting from bankruptcy reform, portfolio seasoning, the impact of the FleetBoston portfolio and new advances on accounts for which previous loan balances were sold to the securitization trusts. The provision also increased as the rate of credit quality improvement slowed in the commercial portfolio and a reserve was established for estimated losses associated with Hurricane Katrina. Partially offsetting these decreases were increases in the Provision for Credit Losses in our consumer credit card portfolio. These increases were reductions in the reserves due to an improved risk profile in Latin America as well as reduced uncertainties associated with the FleetBoston credit integration. reflected higher credit card net charge-offs of $791 million in part due to the impact of the FleetBoston credit card portfolio, organic growth and continued seasoning of accounts, and new advances on accounts for which previous loan balances were sold to the securitization trusts. Also contributing to the consumer provision was the establishment of reserves for changes made to card minimum payment requirements.
| | Gains on Sales of Debt Securities |
Gains on Sales of Debt Securities in 2005 and 2004, were $1.1 billion and $1.7 billion. The decrease was primarily due to lower gains realized on mortgage-backed securities and corporate bonds. Gains on Sales of Debt Securities in 2004 and 2003, were $1.7 billion and $941 million, as we continued to reposition the ALM portfolio in response to interest rate fluctuations and to manage mortgage prepayment risk.
Noninterest Expense increased $1.7 billion in 2005 from 2004, primarily due to the impact of FleetBoston and increases in personnel-related costs. Noninterest Expense increased $6.9 billion in 2004 from 2003, due primarily to higher Personnel Expense, increased Other General Operating Expense, and higher Merger and Restructuring Charges. Personnel Expense increased $3.0 billion primarily due to the impact of FleetBoston associates. Other General Operating Expense increased $1.5 billion related to the impact of FleetBoston, $370 million of litigation expenses incurred during 2004 and the $285 million related to the mutual fund settlement. Merger and Restructuring Charges were $618 million in connection with the integration of FleetBoston’s operations.
Income Tax Expense was $8.0 billion in 2005 compared to $7.0 billion in 2004, resulting in an effective tax rate of 32.7 percent in 2005 and 33.3 percent in 2004. The difference in the effective tax rate between years resulted primarily from a tax benefit of $70 million related to the special one-time deduction associated with the repatriation of certain foreign earnings under the American Jobs Creation Act of 2004. Income Tax Expense was $7.0 billion, reflecting an effective tax rate of 33.3 percent, in 2004 compared to $5.0 billion and 31.8 percent, in 2003. The difference in the effective tax rate between years resulted primarily from the application of purchase accounting to certain leveraged leases acquired in the FleetBoston Merger, an increase in state tax expense generally related to higher tax rates in the Northeast and the reduction in 2003 of Income Tax Expense resulting from a tax settlement with the Internal Revenue Service.
| | Business Segment Operations |
| | Global Consumer and Small Business Banking |
Net Income increased $1.3 billion, or 22 percent, to $7.0 billion in 2005 compared to 2004. Total Revenue rose $3.6 billion, or 15 percent, in 2005 compared to 2004, driven by increases in Net Interest Income and Noninterest Income. Growth in Average Deposits and Average Loans and Leases contributed to the $1.1 billion, or seven percent, increase in Net Interest Income. Increases in Card Income of $1.0 billion, Service Charges of $665 million and Mortgage Banking Income of $423 million drove the $2.5 billion, or 28 percent, increase in Noninterest Income. These increases were offset by increases in the Provision for Credit Losses and Noninterest Expense. The Provision for Credit Losses increased $912 million to $4.2 billion in 2005 mainly due to higher credit card net charge-offs driven by an increase in bankruptcy-related net charge-offs. In addition, the provision was impacted by new advances on accounts for which previous loan balances were sold to the securitization trusts. Noninterest Expense increased $680 million, or five percent, primarily due to the impact of FleetBoston and NPC. Total Revenue increased $5.6 billion, or 28 percent, in 2004 compared to 2003, primarily due to the impact of FleetBoston. Overall loan and deposit growth from the impact of FleetBoston customers contributed to the $4.9 billion, or 44 percent, increase in Net Interest Income. This increase was largely due to the net effect of growth in consumer loans and leases, deposit balances and ALM activities. Increases in Card Income of 51 percent, and Service Charges of 26 percent drove the $703 million, or eight percent, increase in Noninterest Income. FleetBoston also contributed to the increase in Noninterest Income. Partially offsetting these increases was a decrease in Mortgage Banking Income of 72 percent. Net Income rose $642 million, or 12 percent, due to the increases in Net Interest Income and Noninterest Income discussed above, offset by increases in the Provision for Credit Losses and Noninterest Expense. Higher credit card net charge-offs, the impact of the FleetBoston credit card portfolio, organic growth and seasoning of credit card accounts, new advances on accounts for which previous loan balances were sold to the securitization trusts, and increases in card minimum payment requirements resulted in a $1.6 billion, or 97 percent, increase in the Provision for Credit Losses. Noninterest Expense increased $3.0 billion, or 31 percent, due to increases in Processing Costs, Personnel Expense and Other General Operating Expense related to the impact of FleetBoston.
| Global Business and Financial ServicesTotal Revenue increased $3.4 billion, or 58 percent, in 2004 compared to 2003. Net Interest Income increased $2.3 billion, or 54 percent, largely due to the increase in commercial loans and leases, deposit balances driven by the impact of FleetBoston earning assets and the net results of ALM activities. Noninterest Income increased $1.1 billion, or 68 percent due to increases in Other Noninterest Income and increases in Service Charges, driven by the impact of FleetBoston. Noninterest Expense increased $1.5 billion, or 70 percent, due to the impact of FleetBoston. Net Income rose $1.8 billion, or 85 percent, due to the increases discussed above. Also impacting Net Income was the Provision for Credit Losses which declined $968 million to negative $442 million, driven by a notable improvement in credit quality and a $395 million decrease in net charge-offs.
Global Capital MarketsCorporate and Investment Banking
Total Revenue increased $695 million, or eight percent, in 2004 compared to 2003 driven by an increase in Noninterest Income. Net Interest Income decreased $175 million, or four percent, driven by a $196 million, or nine percent decrease in trading-related Net Interest Income. Noninterest Income increased $870 million, or 21
|
Net Income increased $468 million, or eight percent, to $6.4 billion in 2005 compared to 2004. Total Revenue increased $1.9 billion, or 10 percent, in 2005 compared to 2004, driven by increases in Net Interest Income and Noninterest Income. Net Interest Income rose $486 million, or five percent, due to growth in Average Loans and Leases and Average Deposits, wider spreads on the deposit portfolio due to higher short-term interest rates, and the impact of FleetBoston earning assets offset by spread compression and a flattening yield curve in 2005. Noninterest Income increased $1.5 billion, or 18 percent, resulting from higher other noninterest income, Trading Account Profits and Investment and Brokerage Services. Net Income was also impacted by higher Gains on Sales of Debt Securities. These increases were partially offset by an increase in Noninterest Expense and a reduced benefit from increases in Trading Account Profits, Investment Banking Income, and Service Charges. In 2004, Net Income increased $174 million, or 10 percent, due to the increase in Noninterest Income and lower Provision for Credit Losses. The Provision for Credit Losses increased $595 million to negative $291 million in 2005. The negative provision reflected continued improvement in commercial credit quality although at a slower pace than experienced in 2004. An improved risk profile in Latin America and reduced uncertainties resulting from the completion of credit-related integration activities for FleetBoston also contributed to the negative provision. Noninterest Expense increased by $832 million, or eight percent, driven by higher performance-based incentive compensation, processing costs and the impact of FleetBoston, partially offset by nonrecurring charges recognized in 2004 for the segment’s share of the mutual fund settlement and other litigation expenses. Losses offset by an increase in Noninterest Expense. Provision for Credit Losses declined $753 million to negative $445 million due to a notable improvement in credit quality in the large corporate portfolio and a $312 million reduction in net charge-offs. Noninterest Expense increased by $1.2 billion, or 22 percent, driven by an increase in litigation-related charges, higher incentive compensation for market-based activities, and this segment’s allocation of the mutual fund settlement.
| | Global Wealth and Investment Management |
Net Income increased $684 million, or 42 percent, to $2.3 billion in 2005 compared to 2004. Total Revenue increased $1.3 billion, or 22 percent, in 2005. Net Interest Income increased $899 million, or 31 percent, driven by the addition of the FleetBoston portfolio and organic growth in deposits and loans inPB&I andThe Private Bank.Global Wealth andInvestment Management also benefited from the migration of deposits fromGlobal Consumer and Small Business Banking. The total cumulative average impact of migrated balances was $39.3 billion in 2005 compared to $11.1 billion in 2004. Noninterest Income increased $417 million, or 14 percent, driven by increased Investment and Brokerage Services revenue primarily due to the impact of FleetBoston. These increases were offset by higher Noninterest Expense. Noninterest Expense increased $252 million, or seven percent, related to higher Personnel expense driven byPB&I growth in the Northeast and the impact of FleetBoston, partially offset by nonrecurring charges recognized in 2004 for the segment’s share of the mutual fund settlement and other litigation expenses. Net Income increased $112 million, or 18 percent, to $744 million in 2005 compared to 2004. In 2005 compared to 2004, Total Revenue rose $379 million to $684 million, primarily driven by an increase in Equity Investment Gains in 2005. Offsetting this increase was a decline in the fair value of derivative instruments which were used as economic hedges of interest and foreign exchange rates as part of our ALM activities. Provision for Credit Losses decreased $277 million to $69 million in 2005, resulting from changes to components of the formula and other factors effective in 2004, and reduced credit costs in 2005 associated with previously exited businesses. These decreases were offset in part by the establishment of a $50 million reserve for estimated losses associated with Hurricane Katrina. Gains on Sales of Debt Securities decreased $794 million to $823 million primarily due to lower gains realized in 2005 on mortgage-backed securities and corporate bonds than in 2004. Merger and Restructuring Charges decreased $206 million as the FleetBoston integration was nearing completion and the infrastructure initiative was completed in the first quarter of 2005. Income Tax Expense decreased $155 million in 2005, driven by an increase in tax benefits for low-income housing credits. Total Revenue increased $1.9
Table I Year-to-date Average Balances and Interest Rates – FTE Basis | | | | | | | | | | | | | | | | | | | | | | | | | | | | | | | | | | | 2006 | | | | | 2005 | | | | | 2004 | | | (Dollars in millions) | | Average
Balance | | Interest
Income/
Expense | | Yield/
Rate | | | | | Average
Balance | | Interest
Income/
Expense | | Yield/
Rate | | | | | Average
Balance | | Interest
Income/
Expense | | Yield/
Rate | | Earning assets | | | | | | | | | | | | | | | | | | | | | | | | | | | | | | | | Time deposits placed and other short-term investments | | $ | 15,611 | | $ | 646 | | 4.14 | % | | | | $ | 14,286 | | $ | 472 | | 3.30 | % | | | | $ | 14,254 | | $ | 362 | | 2.54 | % | Federal funds sold and securities purchased under agreements to resell | | | 175,334 | | | 7,823 | | 4.46 | | | | | | 169,132 | | | 5,012 | | 2.96 | | | | | | 128,981 | | | 1,940 | | 1.50 | | Trading account assets | | | 145,321 | | | 7,552 | | 5.20 | | | | | | 133,502 | | | 5,883 | | 4.41 | | | | | | 104,616 | | | 4,092 | | 3.91 | | Debt securities(1) | | | 225,219 | | | 11,845 | | 5.26 | | | | | | 219,843 | | | 11,047 | | 5.03 | | | | | | 150,171 | | | 7,320 | | 4.88 | | Loans and leases(2): | | | | | | | | | | | | | | | | | | | | | | | | | | | | | | | | Residential mortgage | | | 207,879 | | | 11,608 | | 5.58 | | | | | | 173,773 | | | 9,424 | | 5.42 | | | | | | 167,270 | | | 9,056 | | 5.42 | | Credit card – domestic | | | 63,838 | | | 8,638 | | 13.53 | | | | | | 53,997 | | | 6,253 | | 11.58 | | | | | | 43,435 | | | 4,653 | | 10.71 | | Credit card – foreign | | | 9,141 | | | 1,147 | | 12.55 | | | | | | — | | | — | | — | | | | | | — | | | — | | — | | Home equity lines | | | 68,696 | | | 5,105 | | 7.43 | | | | | | 56,289 | | | 3,412 | | 6.06 | | | | | | 39,400 | | | 1,835 | | 4.66 | | Direct/Indirect consumer(3) | | | 59,597 | | | 4,552 | | 7.64 | | | | | | 44,981 | | | 2,589 | | 5.75 | | | | | | 38,078 | | | 2,093 | | 5.50 | | Other consumer(4) | | | 10,713 | | | 1,089 | | 10.17 | | | | | | 6,908 | | | 667 | | 9.67 | | | | | | 7,717 | | | 594 | | 7.70 | | Total consumer | | | 419,864 | | | 32,139 | | 7.65 | | | | | | 335,948 | | | 22,345 | | 6.65 | | | | | | 295,900 | | | 18,231 | | 6.16 | | Commercial – domestic | | | 151,231 | | | 10,897 | | 7.21 | | | | | | 128,034 | | | 8,266 | | 6.46 | | | | | | 114,644 | | | 6,978 | | 6.09 | | Commercial real estate(5) | | | 36,939 | | | 2,740 | | 7.42 | | | | | | 34,304 | | | 2,046 | | 5.97 | | | | | | 28,085 | | | 1,263 | | 4.50 | | Commercial lease financing | | | 20,862 | | | 995 | | 4.77 | | | | | | 20,441 | | | 992 | | 4.85 | | | | | | 17,483 | | | 819 | | 4.68 | | Commercial – foreign | | | 23,521 | | | 1,674 | | 7.12 | | | | | | 18,491 | | | 1,292 | | 6.99 | | | | | | 16,505 | | | 850 | | 5.15 | | Total commercial | | | 232,553 | | | 16,306 | | 7.01 | | | | | | 201,270 | | | 12,596 | | 6.26 | | | | | | 176,717 | | | 9,910 | | 5.61 | | Total loans and leases | | | 652,417 | | | 48,445 | | 7.43 | | | | | | 537,218 | | | 34,941 | | 6.50 | | | | | | 472,617 | | | 28,141 | | 5.95 | | Other earning assets | | | 55,242 | | | 3,498 | | 6.33 | | | | | | 38,013 | | | 2,103 | | 5.53 | | | | | | 34,634 | | | 1,815 | | 5.24 | | Total earning assets(6) | | | 1,269,144 | | | 79,809 | | 6.29 | | | | | | 1,111,994 | | | 59,458 | | 5.35 | | | | | | 905,273 | | | 43,670 | | 4.82 | | Cash and cash equivalents | | | 34,052 | | | | | | | | | | | 33,199 | | | | | | | | | | | 28,511 | | | | | | | Other assets, less allowance for loan and lease losses | | | 163,485 | | | | | | | | | | | 124,699 | | | | | | | | | | | 110,847 | | | | | | | Total assets | | $ | 1,466,681 | | | | | | | | | | $ | 1,269,892 | | | | | | | | | | $ | 1,044,631 | | | | | | | Interest-bearing liabilities | | | | | | | | | | | | | | | | | | | | | | | | | | | | | | | | Domestic interest-bearing deposits: | | | | | | | | | | | | | | | | | | | | | | | | | | | | | | | | Savings | | $ | 34,608 | | $ | 269 | | 0.78 | % | | | | $ | 36,602 | | $ | 211 | | 0.58 | % | | | | $ | 33,959 | | $ | 119 | | 0.35 | % | NOW and money market deposit accounts | | | 218,077 | | | 3,923 | | 1.80 | | | | | | 227,722 | | | 2,839 | | 1.25 | | | | | | 214,542 | | | 1,921 | | 0.90 | | Consumer CDs and IRAs | | | 144,738 | | | 6,022 | | 4.16 | | | | | | 124,385 | | | 4,091 | | 3.29 | | | | | | 94,770 | | | 2,540 | | 2.68 | | Negotiable CDs, public funds and other time deposits | | | 12,195 | | | 483 | | 3.97 | | | | | | 6,865 | | | 250 | | 3.65 | | | | | | 5,977 | | | 290 | | 4.85 | | Total domestic interest-bearing deposits | | | 409,618 | | | 10,697 | | 2.61 | | | | | | 395,574 | | | 7,391 | | 1.87 | | | | | | 349,248 | | | 4,870 | | 1.39 | | Foreign interest-bearing deposits: | | | | | | | | | | | | | | | | | | | | | | | | | | | | | | | | Banks located in foreign countries | | | 34,985 | | | 1,982 | | 5.67 | | | | | | 22,945 | | | 1,202 | | 5.24 | | | | | | 18,426 | | | 679 | | 3.68 | | Governments and official institutions | | | 12,674 | | | 586 | | 4.63 | | | | | | 7,418 | | | 238 | | 3.21 | | | | | | 5,327 | | | 97 | | 1.82 | | Time, savings and other | | | 38,544 | | | 1,215 | | 3.15 | | | | | | 31,603 | | | 661 | | 2.09 | | | | | | 27,739 | | | 275 | | 0.99 | | Total foreign interest-bearing deposits | | | 86,203 | | | 3,783 | | 4.39 | | | | | | 61,966 | | | 2,101 | | 3.39 | | | | | | 51,492 | | | 1,051 | | 2.04 | | Total interest-bearing deposits | | | 495,821 | | | 14,480 | | 2.92 | | | | | | 457,540 | | | 9,492 | | 2.08 | | | | | | 400,740 | | | 5,921 | | 1.48 | | Federal funds purchased, securities sold under agreements to repurchase and other short-term borrowings | | | 411,132 | | | 19,840 | | 4.83 | | | | | | 326,408 | | | 11,615 | | 3.56 | | | | | | 227,565 | | | 4,072 | | 1.79 | | Trading account liabilities | | | 64,689 | | | 2,640 | | 4.08 | | | | | | 57,689 | | | 2,364 | | 4.10 | | | | | | 35,326 | | | 1,317 | | 3.73 | | Long-term debt | | | 130,124 | | | 7,034 | | 5.41 | | | | | | 97,709 | | | 4,418 | | 4.52 | | | | | | 92,303 | | | 3,683 | | 3.99 | | Total interest-bearing liabilities(6) | | | 1,101,766 | | | 43,994 | | 3.99 | | | | | | 939,346 | | | 27,889 | | 2.97 | | | | | | 755,934 | | | 14,993 | | 1.98 | | Noninterest-bearing sources: | | | | | | | | | | | | | | | | | | | | | | | | | | | | | | | | Noninterest-bearing deposits | | | 177,174 | | | | | | | | | | | 174,892 | | | | | | | | | | | 150,819 | | | | | | | Other liabilities | | | 57,278 | | | | | | | | | | | 55,793 | | | | | | | | | | | 53,063 | | | | | | | Shareholders’ equity | | | 130,463 | | | | | | | | | | | 99,861 | | | | | | | | | | | 84,815 | | | | | | | Total liabilities and shareholders’ equity | | $ | 1,466,681 | | | | | | | | | | $ | 1,269,892 | | | | | | | | | | $ | 1,044,631 | | | | | | | Net interest spread | | | | | | | | 2.30 | % | | | | | | | | | | 2.38 | % | | | | | | | | | | 2.84 | % | Impact of noninterest-bearing sources | | | | | | | | 0.52 | | | | | | | | | | | 0.46 | | | | | | | | | | | 0.33 | | Net interest income/yield on earning assets(7) | | | | | $ | 35,815 | | 2.82 | % | | | | | | | $ | 31,569 | | 2.84 | % | | | | | | | $ | 28,677 | | 3.17 | % |
(1) | Yields on AFS debt securities are calculated based on fair value rather than historical cost balances. The use of fair value does not have a material impact on net interest yield. |
(2) | Nonperforming loans are included in the respective average loan balances. Income on these nonperforming loans is recognized on a cash basis. |
(3) | Includes home equity loans of $9.6 billion, or 47 percent,$7.6 billion and $5.6 billion in 2004. Net 2006, 2005 and 2004, respectively. |
(4) | Includes consumer finance loans of $2.9 billion, $3.1 billion and $3.7 billion in 2006, 2005 and 2004, respectively; and foreign consumer loans of $7.8 billion, $3.6 billion and $3.0 billion in 2006, 2005 and 2004, respectively. |
(5) | Includes domestic commercial real estate loans of $36.2 billion, $33.8 billion and $27.7 billion in 2006, 2005 and 2004, respectively. |
(6) | Interest Income increased $915 million, or 47 percent, due to growth in Deposits, loan growth andincome includes the impact of FleetBoston earninginterest rate risk management contracts, which increased (decreased) interest income on the underlying assets to the portfolio. Noninterest Income increased $986$(372) million, or 47 percent, driven by increased Investment$704 million and Brokerage Services revenue primarily due to$2.1 billion in 2006, 2005 and 2004, respectively. Interest expense includes the impact of FleetBoston. Net Incomeinterest rate risk management contracts, which increased $366interest expense on the underlying liabilities $106 million, or 30 percent. This increase was due$1.3 billion and $1.5 billion in 2006, 2005 and 2004, respectively. For further information on interest rate contracts, see “Interest Rate Risk Management for Nontrading Activities” beginning on page 76. |
(7) | Interest income (FTE basis) in 2006 does not include the cumulative tax charge resulting from a change in tax legislation relating to the increases inextraterritorial tax income and foreign sales corporation regimes. The FTE impact to Net Interest Income and Noninterestnet interest yield on earning assets of this retroactive tax adjustment was a reduction of $270 million and 2 bps, respectively, in 2006. Management has excluded this one-time impact to provide a more comparative basis of presentation for Net Interest Income offset by higher Noninterest Expense. Noninterest Expense increased $1.3and net interest yield on earning assets on a FTE basis. The impact on any given future period is not expected to be material. |
Table II Analysis of Changes in Net Interest Income—FTE Basis | | | | | | | | | | | | | | | | | | | | | | | | | | | | | From 2005 to 2006 | | | | From 2004 to 2005 | | | | | Due to Change in (1) | | | Net Change | | | | Due to Change in (1) | | | Net Change | | | (Dollars in millions) | | Volume | | | Rate | | | | | Volume | | | Rate | | | Increase (decrease) in interest income | | | | | | | | | | | | | | | | | | | | | | | | | | Time deposits placed and other short-term investments | | $ | 43 | | | $ | 131 | | | $ | 174 | | | | $ | 1 | | | $ | 109 | | | $ | 110 | | Federal funds sold and securities purchased under agreements to resell | | | 178 | | | | 2,633 | | | | 2,811 | | | | | 597 | | | | 2,475 | | | | 3,072 | | Trading account assets | | | 526 | | | | 1,143 | | | | 1,669 | | | | | 1,128 | | | | 663 | | | | 1,791 | | Debt securities | | | 282 | | | | 516 | | | | 798 | | | | | 3,408 | | | | 319 | | | | 3,727 | | Loans and leases: | | | | | | | | | | | | | | | | | | | | | | | | | | Residential mortgage | | | 1,843 | | | | 341 | | | | 2,184 | | | | | 362 | | | | 6 | | | | 368 | | Credit card—domestic | | | 1,139 | | | | 1,246 | | | | 2,385 | | | | | 1,130 | | | | 470 | | | | 1,600 | | Credit card—foreign | | | 1,147 | | | | — | | | | 1,147 | | | | | — | | | | — | | | | — | | Home equity lines | | | 751 | | | | 942 | | | | 1,693 | | | | | 788 | | | | 789 | | | | 1,577 | | Direct/Indirect consumer | | | 838 | | | | 1,125 | | | | 1,963 | | | | | 381 | | | | 115 | | | | 496 | | Other consumer | | | 369 | | | | 53 | | | | 422 | | | | | (62 | ) | | | 135 | | | | 73 | | Total consumer | | | | | | | | | | | 9,794 | | | | | | | | | | | | | 4,114 | | Commercial—domestic | | | 1,504 | | | | 1,127 | | | | 2,631 | | | | | 819 | | | | 469 | | | | 1,288 | | Commercial real estate | | | 159 | | | | 535 | | | | 694 | | | | | 281 | | | | 502 | | | | 783 | | Commercial lease financing | | | 20 | | | | (17 | ) | | | 3 | | | | | 138 | | | | 35 | | | | 173 | | Commercial—foreign | | | 352 | | | | 30 | | | | 382 | | | | | 102 | | | | 340 | | | | 442 | | Total commercial | | | | | | | | | | | 3,710 | | | | | | | | | | | | | 2,686 | | Total loans and leases | | | | | | | | | | | 13,504 | | | | | | | | | | | | | 6,800 | | Other earning assets | | | 952 | | | | 443 | | | | 1,395 | | | | | 177 | | | | 111 | | | | 288 | | Total interest income | | | | | | | | | | $ | 20,351 | | | | | | | | | | | | $ | 15,788 | | Increase (decrease) in interest expense | | | | | | | | | | | | | | | | | | | | | | | | | | Domestic interest-bearing deposits: | | | | | | | | | | | | | | | | | | | | | | | | | | Savings | | $ | (10 | ) | | $ | 68 | | | $ | 58 | | | | $ | 9 | | | $ | 83 | | | $ | 92 | | NOW and money market deposit accounts | | | (113 | ) | | | 1,197 | | | | 1,084 | | | | | 128 | | | | 790 | | | | 918 | | Consumer CDs and IRAs | | | 671 | | | | 1,260 | | | | 1,931 | | | | | 781 | | | | 770 | | | | 1,551 | | Negotiable CDs, public funds and other time deposits | | | 195 | | | | 38 | | | | 233 | | | | | 43 | | | | (83 | ) | | | (40 | ) | Total domestic interest-bearing deposits | | | | | | | | | | | 3,306 | | | | | | | | | | | | | 2,521 | | Foreign interest-bearing deposits: | | | | | | | | | | | | | | | | | | | | | | | | | | Banks located in foreign countries | | | 631 | | | | 149 | | | | 780 | | | | | 165 | | | | 358 | | | | 523 | | Governments and official institutions | | | 169 | | | | 179 | | | | 348 | | | | | 38 | | | | 103 | | | | 141 | | Time, savings and other | | | 145 | | | | 409 | | | | 554 | | | | | 38 | | | | 348 | | | | 386 | | Total foreign interest-bearing deposits | | | | | | | | | | | 1,682 | | | | | | | | | | | | | 1,050 | | Total interest-bearing deposits | | | | | | | | | | | 4,988 | | | | | | | | | | | | | 3,571 | | Federal funds purchased, securities sold under agreements to repurchase and other short-term borrowings | | | 3,021 | | | | 5,204 | | | | 8,225 | | | | | 1,771 | | | | 5,772 | | | | 7,543 | | Trading account liabilities | | | 288 | | | | (12 | ) | | | 276 | | | | | 835 | | | | 212 | | | | 1,047 | | Long-term debt | | | 1,464 | | | | 1,152 | | | | 2,616 | | | | | 216 | | | | 519 | | | | 735 | | Total interest expense | | | | | | | | | | | 16,105 | | | | | | | | | | | | | 12,896 | | Net increase in net interest income(2) | | | | | | | | | | $ | 4,246 | | | | | | | | | | | | $ | 2,892 | |
(1) | The changes for each category of interest income and expense are divided between the portion of change attributable to the variance in volume and the portion of change attributable to the variance in rate for that category. The unallocated change in rate or volume variance has been allocated between the rate and volume variances. |
(2) | Interest income (FTE basis) in 2006 does not include the cumulative tax charge resulting from a change in tax legislation relating to extraterritorial tax income and foreign sales corporation regimes. The FTE impact to Net Interest Income of this retroactive tax adjustment is a reduction of $270 million from 2005 to 2006. Management has excluded this one-time impact to provide a more comparative basis of presentation for Net Interest Income and net interest yield on earning assets on a FTE basis. The impact on any given future period is not expected to be material. |
Table III Outstanding Loans and Leases | | | | | | | | | | | | | | | | | | | December 31 | | (Dollars in millions) | | 2006 | | 2005 | | 2004 | | 2003 | | 2002 | Consumer | | | | | | | | | | | | | | | | Residential mortgage | | $ | 241,181 | | $ | 182,596 | | $ | 178,079 | | $ | 140,483 | | $ | 108,332 | Credit card—domestic | | | 61,195 | | | 58,548 | | | 51,726 | | | 34,814 | | | 24,729 | Credit card—foreign | | | 10,999 | | | — | | | — | | | — | | | — | Home equity lines | | | 74,888 | | | 62,098 | | | 50,126 | | | 23,859 | | | 23,236 | Direct/Indirect consumer(1) | | | 68,224 | | | 45,490 | | | 40,513 | | | 33,415 | | | 31,068 | Other consumer(2) | | | 9,218 | | | 6,725 | | | 7,439 | | | 7,558 | | | 10,355 | Total consumer | | | 465,705 | | | 355,457 | | | 327,883 | | | 240,129 | | | 197,720 | Commercial | | | | | | | | | | | | | | | | Commercial—domestic | | | 161,982 | | | 140,533 | | | 122,095 | | | 91,491 | | | 99,151 | Commercial real estate(3) | | | 36,258 | | | 35,766 | | | 32,319 | | | 19,367 | | | 20,205 | Commercial lease financing | | | 21,864 | | | 20,705 | | | 21,115 | | | 9,692 | | | 10,386 | Commercial—foreign | | | 20,681 | | | 21,330 | | | 18,401 | | | 10,754 | | | 15,428 | Total commercial | | | 240,785 | | | 218,334 | | | 193,930 | | | 131,304 | | | 145,170 | Total loans and leases | | $ | 706,490 | | $ | 573,791 | | $ | 521,813 | | $ | 371,433 | | $ | 342,890 |
(1) | Includes home equity loans of $12.8 billion, or 64 percent,$8.1 billion, $7.3 billion, $7.3 billion, and $3.6 billion at December 31, 2006, 2005, 2004, 2003, and 2002, respectively. |
(2) | Includes foreign consumer loans of $6.2 billion, $3.8 billion, $3.6 billion, $2.0 billion, and $2.0 billion at December 31, 2006, 2005, 2004, 2003, and 2002, respectively; consumer finance loans of $2.8 billion, $2.8 billion, $3.4 billion, $3.9 billion, and $4.4 billion at December 31, 2006, 2005, 2004, 2003, and 2002, respectively; and consumer lease financing of $481 million, $1.7 billion, and $3.9 billion at December 31, 2004, 2003, and 2002, respectively. |
(3) | Includes domestic commercial real estate loans of $35.7 billion, $35.2 billion, $31.9 billion, $19.0 billion, and $19.9 billion at December 31, 2006, 2005, 2004, 2003, and 2002, respectively; and foreign commercial real estate loans of $578 million, $585 million, $440 million, $324 million, and $295 million at December 31, 2006, 2005, 2004, 2003, and 2002, respectively. |
Table IV Nonperforming Assets | | | | | | | | | | | | | | | | | | | December 31 | | (Dollars in millions) | | 2006 | | 2005 | | 2004 | | 2003 | | 2002 | Consumer | | | | | | | | | | | | | | | | Residential mortgage | | $ | 660 | | $ | 570 | | $ | 554 | | $ | 531 | | $ | 612 | Home equity lines | | | 249 | | | 117 | | | 66 | | | 43 | | | 66 | Direct/Indirect consumer | | | 44 | | | 37 | | | 33 | | | 28 | | | 30 | Other consumer | | | 77 | | | 61 | | | 85 | | | 36 | | | 25 | Total consumer(1) | | | 1,030 | | | 785 | | | 738 | | | 638 | | | 733 | Commercial | | | | | | | | | | | | | | | | Commercial—domestic | | | 584 | | | 581 | | | 855 | | | 1,388 | | | 2,621 | Commercial real estate | | | 118 | | | 49 | | | 87 | | | 142 | | | 164 | Commercial lease financing | | | 42 | | | 62 | | | 266 | | | 127 | | | 160 | Commercial—foreign | | | 13 | | | 34 | | | 267 | | | 578 | | | 1,359 | Total commercial(2) | | | 757 | | | 726 | | | 1,475 | | | 2,235 | | | 4,304 | Total nonperforming loans and leases | | | 1,787 | | | 1,511 | | | 2,213 | | | 2,873 | | | 5,037 | Foreclosed properties | | | 69 | | | 92 | | | 102 | | | 148 | | | 225 | Nonperforming securities(3) | | | — | | | — | | | 140 | | | — | | | — | Total nonperforming assets(4) | | $ | 1,856 | | $ | 1,603 | | $ | 2,455 | | $ | 3,021 | | $ | 5,262 |
(1) | In 2006, $69 million in Interest Income was estimated to be contractually due on nonperforming consumer loans and leases classified as nonperforming at December 31, 2006 provided that these loans and leases had been paid according to their terms and conditions. Of this amount, approximately $17 million was received and included in Net Income for 2006. |
(2) | In 2006, $85 million in Interest Income was estimated to be contractually due on nonperforming commercial loans and leases classified as nonperforming at December 31, 2006, including troubled debt restructured loans of which $2 million were performing at December 31, 2006 and not included in the table above. Approximately $38 million of the estimated $85 million in contractual interest was received and included in net income for 2006. |
(3) | Primarily related to international securities held in the AFS portfolio. |
(4) | Balances do not include $30 million, $24 million, $28 million, $16 million, and $41 million of nonperforming consumer loans held-for-sale, included in Other Assets at December 31, 2006, 2005, 2004, 2003, and 2002, respectively, and $50 million, $45 million, $123 million, $186 million, and $73 million of nonperforming commercial loans held-for-sale, included in Other Assets at December 31, 2006, 2005, 2004, 2003, and 2002, respectively. |
Table V Accruing Loans and Leases Past Due 90 Days or More | | | | | | | | | | | | | | | | | | | December 31 | | (Dollars in millions) | | 2006 | | 2005 | | 2004 | | 2003 | | 2002 | Consumer | | | | | | | | | | | | | | | | Residential mortgage(1) | | $ | 118 | | $ | — | | $ | — | | $ | — | | $ | — | Credit card—domestic | | | 1,991 | | | 1,197 | | | 1,075 | | | 616 | | | 424 | Credit card—foreign | | | 184 | | | — | | | — | | | — | | | — | Direct/Indirect consumer | | | 347 | | | 75 | | | 58 | | | 47 | | | 56 | Other consumer | | | 38 | | | 15 | | | 23 | | | 35 | | | 61 | Total consumer | | | 2,678 | | | 1,287 | | | 1,156 | | | 698 | | | 541 | Commercial | | | | | | | | | | | | | | | | Commercial—domestic | | | 265 | | | 117 | | | 121 | | | 110 | | | 132 | Commercial real estate | | | 78 | | | 4 | | | 1 | | | 23 | | | 91 | Commercial lease financing | | | 26 | | | 15 | | | 14 | | | n/a | | | n/a | Commercial—foreign | | | 9 | | | 32 | | | 2 | | | 29 | | | — | Total commercial | | | 378 | | | 168 | | | 138 | | | 162 | | | 223 | Total accruing loans and leases past due 90 days or more | | $ | 3,056 | | $ | 1,455 | | $ | 1,294 | | $ | 860 | | $ | 764 |
(1) | Balance at December 31, 2006 is related to repurchases pursuant to our servicing agreements with GNMA mortgage pools, which were included in loans held-for-sale in previous years. |
Table VI Allowance for Credit Losses | | | | | | | | | | | | | | | | | | | | | | (Dollars in millions) | | 2006 | | | 2005 | | | 2004 | | | 2003 | | | 2002 | | Allowance for loan and lease losses, January 1 | | $ | 8,045 | | | $ | 8,626 | | | $ | 6,163 | | | $ | 6,358 | | | $ | 6,278 | | FleetBoston balance, April 1, 2004 | | | — | | | | — | | | | 2,763 | | | | — | | | | — | | MBNA balance, January 1, 2006 | | | 577 | | | | — | | | | — | | | | — | | | | — | | Loans and leases charged off | | | | | | | | | | | | | | | | | | | | | Residential mortgage | | | (74 | ) | | | (58 | ) | | | (62 | ) | | | (64 | ) | | | (56 | ) | Credit card—domestic | | | (3,546 | ) | | | (4,018 | ) | | | (2,536 | ) | | | (1,657 | ) | | | (1,210 | ) | Credit card—foreign | | | (292 | ) | | | — | | | | — | | | | — | | | | — | | Home equity lines | | | (67 | ) | | | (46 | ) | | | (38 | ) | | | (38 | ) | | | (40 | ) | Direct/Indirect consumer | | | (748 | ) | | | (380 | ) | | | (344 | ) | | | (322 | ) | | | (355 | ) | Other consumer | | | (436 | ) | | | (376 | ) | | | (295 | ) | | | (343 | ) | | | (395 | ) | Total consumer | | | (5,163 | ) | | | (4,878 | ) | | | (3,275 | ) | | | (2,424 | ) | | | (2,056 | ) | Commercial—domestic | | | (597 | ) | | | (535 | ) | | | (504 | ) | | | (857 | ) | | | (1,625 | ) | Commercial real estate | | | (7 | ) | | | (5 | ) | | | (12 | ) | | | (46 | ) | | | (45 | ) | Commercial lease financing | | | (28 | ) | | | (315 | ) | | | (39 | ) | | | (132 | ) | | | (168 | ) | Commercial—foreign | | | (86 | ) | | | (61 | ) | | | (262 | ) | | | (408 | ) | | | (566 | ) | Total commercial | | | (718 | ) | | | (916 | ) | | | (817 | ) | | | (1,443 | ) | | | (2,404 | ) | Total loans and leases charged off | | | (5,881 | ) | | | (5,794 | ) | | | (4,092 | ) | | | (3,867 | ) | | | (4,460 | ) | Recoveries of loans and leases previously charged off | | | | | | | | | | | | | | | | | | | | | Residential mortgage | | | 35 | | | | 31 | | | | 26 | | | | 24 | | | | 14 | | Credit card—domestic | | | 452 | | | | 366 | | | | 231 | | | | 143 | | | | 116 | | Credit card—foreign | | | 67 | | | | — | | | | — | | | | — | | | | — | | Home equity lines | | | 16 | | | | 15 | | | | 23 | | | | 26 | | | | 14 | | Direct/Indirect consumer | | | 224 | | | | 132 | | | | 136 | | | | 141 | | | | 145 | | Other consumer | | | 133 | | | | 101 | | | | 102 | | | | 88 | | | | 99 | | Total consumer | | | 927 | | | | 645 | | | | 518 | | | | 422 | | | | 388 | | Commercial—domestic | | | 261 | | | | 365 | | | | 327 | | | | 224 | | | | 314 | | Commercial real estate | | | 4 | | | | 5 | | | | 15 | | | | 5 | | | | 7 | | Commercial lease financing | | | 56 | | | | 84 | | | | 30 | | | | 8 | | | | 9 | | Commercial—foreign | | | 94 | | | | 133 | | | | 89 | | | | 102 | | | | 45 | | Total commercial | | | 415 | | | | 587 | | | | 461 | | | | 339 | | | | 375 | | Total recoveries of loans and leases previously charged off | | | 1,342 | | | | 1,232 | | | | 979 | | | | 761 | | | | 763 | | Net charge-offs | | | (4,539 | ) | | | (4,562 | ) | | | (3,113 | ) | | | (3,106 | ) | | | (3,697 | ) | Provision for loan and lease losses | | | 5,001 | | | | 4,021 | | | | 2,868 | | | | 2,916 | | | | 3,801 | | Other | | | (68 | ) | | | (40 | ) | | | (55 | ) | | | (5 | ) | | | (24 | ) | Allowance for loan and lease losses, December 31 | | | 9,016 | | | | 8,045 | | | | 8,626 | | | | 6,163 | | | | 6,358 | | Reserve for unfunded lending commitments, January 1 | | | 395 | | | | 402 | | | | 416 | | | | 493 | | | | 597 | | FleetBoston balance, April 1, 2004 | | | — | | | | — | | | | 85 | | | | — | | | | — | | Provision for unfunded lending commitments | | | 9 | | | | (7 | ) | | | (99 | ) | | | (77 | ) | | | (104 | ) | Other | | | (7 | ) | | | — | | | | — | | | | — | | | | — | | Reserve for unfunded lending commitments, December 31 | | | 397 | | | | 395 | | | | 402 | | | | 416 | | | | 493 | | Total | | $ | 9,413 | | | $ | 8,440 | | | $ | 9,028 | | | $ | 6,579 | | | $ | 6,851 | | Loans and leases outstanding at December 31 | | $ | 706,490 | | | $ | 573,791 | | | $ | 521,813 | | | $ | 371,433 | | | $ | 342,890 | | Allowance for loan and lease losses as a percentage of loans and leases outstanding at December 31 | | | 1.28 | % | | | 1.40 | % | | | 1.65 | % | | | 1.66 | % | | | 1.85 | % | Consumer allowance for loan and lease losses as a percentage of consumer loans and leases outstanding at December 31 | | | 1.19 | | | | 1.27 | | | | 1.34 | | | | 1.25 | | | | 0.95 | | Commercial allowance for loan and lease losses as a percentage of commercial loans and leases outstanding at December 31 | | | 1.44 | | | | 1.62 | | | | 2.19 | | | | 2.40 | | | | 2.43 | | Average loans and leases outstanding during the year | | $ | 652,417 | | | $ | 537,218 | | | $ | 472,617 | | | $ | 356,220 | | | $ | 336,820 | | Net charge-offs as a percentage of average loans and leases outstanding during the year(1) | | | 0.70 | % | | | 0.85 | % | | | 0.66 | % | | | 0.87 | % | | | 1.10 | % | Allowance for loan and lease losses as a percentage of total nonperforming loans and leases at December 31 | | | 505 | | | | 532 | | | | 390 | | | | 215 | | | | 126 | | Ratio of the allowance for loan and lease losses at December 31 to net charge-offs(1) | | | 1.99 | | | | 1.76 | | | | 2.77 | | | | 1.98 | | | | 1.72 | |
(1) | For 2006, the impact of FleetBostonSOP 03-3 decreased net charge-offs by $288 million. Excluding the impact of SOP 03-3, net charge-offs as a percentage of average loans and this segment’s allocationleases outstanding for 2006 was 0.74 percent, and the ratio of the mutual fund settlement.Allowance for Loan and Lease Losses to net charge-offs was 1.87 at December 31, 2006. |
Table VII Allocation of the Allowance for Credit Losses by Product Type | | | | | | | | | | | | | | | | | | | | | | | | | | | | | | | | | | December 31 | | | | | 2006 | | | 2005 | | | 2004 | | | 2003 | | | 2002 | | | (Dollars in millions) | | Amount | | Percent | | | Amount | | Percent | | | Amount | | Percent | | | Amount | | Percent | | | Amount | | Percent | | Allowance for loan and lease losses | | | | | | | | | | | | | | | | | | | | | | | | | | | | | | | Residential mortgage | | $ | 248 | | 2.8 | % | | $ | 277 | | 3.4 | % | | $ | 240 | | 2.8 | % | | $ | 185 | | 3.0 | % | | $ | 108 | | 1.7 | % | Credit card—domestic | | | 3,176 | | 35.2 | | | | 3,301 | | 41.0 | | | | 3,148 | | 36.5 | | | | 1,947 | | 31.6 | | | | 1,031 | | 16.2 | | Credit card—foreign | | | 336 | | 3.7 | | | | — | | — | | | | — | | — | | | | — | | — | | | | — | | — | | Home equity lines | | | 133 | | 1.5 | | | | 136 | | 1.7 | | | | 115 | | 1.3 | | | | 72 | | 1.2 | | | | 49 | | 0.8 | | Direct/Indirect consumer | | | 1,200 | | 13.3 | | | | 421 | | 5.2 | | | | 375 | | 4.3 | | | | 347 | | 5.6 | | | | 361 | | 5.7 | | Other consumer | | | 467 | | 5.2 | | | | 380 | | 4.8 | | | | 500 | | 5.9 | | | | 456 | | 7.4 | | | | 332 | | 5.2 | | Total consumer | | | 5,560 | | 61.7 | | | | 4,515 | | 56.1 | | | | 4,378 | | 50.8 | | | | 3,007 | | 48.8 | | | | 1,881 | | 29.6 | | Commercial—domestic | | | 2,162 | | 24.0 | | | | 2,100 | | 26.1 | | | | 2,101 | | 24.3 | | | | 1,756 | | 28.5 | | | | 2,231 | | 35.1 | | Commercial real estate | | | 588 | | 6.5 | | | | 609 | | 7.6 | | | | 644 | | 7.5 | | | | 484 | | 7.9 | | | | 439 | | 6.9 | | Commercial lease financing | | | 217 | | 2.4 | | | | 232 | | 2.9 | | | | 442 | | 5.1 | | | | 235 | | 3.8 | | | | n/a | | n/a | | Commercial—foreign | | | 489 | | 5.4 | | | | 589 | | 7.3 | | | | 1,061 | | 12.3 | | | | 681 | | 11.0 | | | | 855 | | 13.4 | | Total commercial (1) | | | 3,456 | | 38.3 | | | | 3,530 | | 43.9 | | | | 4,248 | | 49.2 | | | | 3,156 | | 51.2 | | | | 3,525 | | 55.4 | | General(2) | | | — | | — | | | | — | | — | | | | — | | — | | | | — | | — | | | | 952 | | 15.0 | | Allowance for loan and lease losses | | | 9,016 | | 100.0 | % | | | 8,045 | | 100.0 | % | | | 8,626 | | 100.0 | % | | | 6,163 | | 100.0 | % | | | 6,358 | | 100.0 | % | Reserve for unfunded lending commitments | | | 397 | | | | | | 395 | | | | | | 402 | | | | | | 416 | | | | | | 493 | | | | Total | | $ | 9,413 | | | | | $ | 8,440 | | | | | $ | 9,028 | | | | | $ | 6,579 | | | | | $ | 6,851 | | | |
All Other(1)
| Includes allowance for loan and lease losses of commercial impaired loans of $43 million, $55 million, $202 million, $391 million, and $919 million at December 31, 2006, 2005, 2004, 2003, and 2002, respectively. |
(2) | At December 31, 2005, general reserves were assigned to individual product types to better reflect our view of risk in these portfolios. Information was not available to assign general reserves by product types prior to 2003. |
n/a= Not available; included in commercial – domestic at December 31, 2002. Table VIII Selected Loan Maturity Data(1) | | | | | | | | | | | | | | | | | | | | December 31, 2006 | | | (Dollars in millions) | | Due in One
Year or Less | | | Due After
One Year
Through
Five Years | | | Due After
Five Years | | | Total | | Commercial—domestic | | $ | 57,067 | | | $ | 66,351 | | | $ | 38,564 | | | $ | 161,982 | | Commercial real estate—domestic | | | 14,562 | | | | 17,774 | | | | 3,344 | | | | 35,680 | | Foreign and other(2) | | | 22,509 | | | | 4,432 | | | | 496 | | | | 27,437 | | Total selected loans | | $ | 94,138 | | | $ | 88,557 | | | $ | 42,404 | | | $ | 225,099 | | Percent of total | | | 41.8 | % | | | 39.3 | % | | | 18.9 | % | | | 100.0 | % | Sensitivity of selected loans to changes in interest rates for loans due after one year: | | | | | | | | | | | | | | | | | Fixed interest rates | | | | | | $ | 8,588 | | | $ | 19,793 | | | | | | Floating or adjustable interest rates | | | | | | | 79,969 | | | | 22,611 | | | | | | Total | | | | | | $ | 88,557 | | | $ | 42,404 | | | | | |
In 2004 compared(1)
| Loan maturities are based on the remaining maturities under contractual terms. |
(2) | Loan maturities include other consumer, commercial – foreign and commercial real estate loans. |
Table IX Short-term Borrowings | | | | | | | | | | | | | | | | | | | | | | 2006 | | | 2005 | | | 2004 | | | (Dollars in millions) | | Amount | | Rate | | | Amount | | Rate | | | Amount | | Rate | | Federal funds purchased | | | | | | | | | | | | | | | | | | | At December 31 | | $ | 12,232 | | 5.35 | % | | $ | 2,715 | | 4.06 | % | | $ | 3,108 | | 2.23 | % | Average during year | | | 5,292 | | 5.11 | | | | 3,670 | | 3.09 | | | | 3,724 | | 1.31 | | Maximum month-end balance during year | | | 12,232 | | — | | | | 5,964 | | — | | | | 7,852 | | — | | | | | | | | | Securities sold under agreements to repurchase | | | | | | | | | | | | | | | | | | | At December 31 | | | 205,295 | | 4.94 | | | | 237,940 | | 4.26 | | | | 116,633 | | 2.23 | | Average during year | | | 281,611 | | 4.66 | | | | 227,081 | | 3.62 | | | | 161,494 | | 1.86 | | Maximum month-end balance during year | | | 312,955 | | — | | | | 273,544 | | — | | | | 191,899 | | — | | | | | | | | | Commercial paper | | | | | | | | | | | | | | | | | | | At December 31 | | | 41,223 | | 5.34 | | | | 24,968 | | 4.21 | | | | 25,379 | | 2.09 | | Average during year | | | 33,942 | | 5.15 | | | | 26,335 | | 3.22 | | | | 21,178 | | 1.45 | | Maximum month-end balance during year | | | 42,511 | | — | | | | 31,380 | | — | | | | 26,486 | | — | | | | | | | | | Other short-term borrowings | | | | | | | | | | | | | | | | | | | At December 31 | | | 100,077 | | 5.43 | | | | 91,301 | | 4.58 | | | | 53,219 | | 2.48 | | Average during year | | | 90,287 | | 5.21 | | | | 69,322 | | 3.51 | | | | 41,169 | | 1.73 | | Maximum month-end balance during year | | | 104,555 | | — | | | | 91,301 | | — | | | | 53,756 | | — | |
Table X Non-exchange Traded Commodity Contracts | | | | | | | | | | (Dollars in millions) | | Asset
Positions | | | Liability
Positions | | Net fair value of contracts outstanding, January 1, 2006 | | $ | 3,021 | | | $ | 2,279 | | Effects of legally enforceable master netting agreements | | | 5,636 | | | | 5,636 | | Gross fair value of contracts outstanding, January 1, 2006 | | | 8,657 | | | | 7,915 | | Contracts realized or otherwise settled | | | (2,797 | ) | | | (2,792 | ) | Fair value of new contracts | | | 1,182 | | | | 1,127 | | Other changes in fair value | | | (3,431 | ) | | | (2,781 | ) | Gross fair value of contracts outstanding, December 31, 2006 | | | 3,611 | | | | 3,469 | | Effects of legally enforceable master netting agreements | | | (2,339 | ) | | | (2,339 | ) | Net fair value of contracts outstanding, December 31, 2006 | | $ | 1,272 | | | $ | 1,130 | |
Table XI Non-exchange Traded Commodity Contract Maturities | | | | | | | | | | | | December 31, 2006 | | | (Dollars in millions) | | Asset
Positions | | | Liability
Positions | | Maturity of less than 1 year | | $ | 1,244 | | | $ | 1,165 | | Maturity of 1-3 years | | | 1,963 | | | | 1,878 | | Maturity of 4-5 years | | | 321 | | | | 346 | | Maturity in excess of 5 years | | | 83 | | | | 80 | | Gross fair value of contracts | | | 3,611 | | | | 3,469 | | Effects of legally enforceable master netting agreements | | | (2,339 | ) | | | (2,339 | ) | Net fair value of contracts outstanding | | $ | 1,272 | | | $ | 1,130 | |
Table XII Selected Quarterly Financial Data | | | | | | | | | | | | | | | | | | | | | | | | | | | | | | | | | | | | 2006 Quarters | | | 2005 Quarters | | (Dollars in millions, except per
share information) | | Fourth | | | Third | | | Second | | | First | | | Fourth | | | Third | | | Second | | | First | | Income statement | | | | | | | | | | | | | | | | | | | | | | | | | | | | | | | | | Net interest income | | $ | 8,599 | | | $ | 8,586 | | | $ | 8,630 | | | $ | 8,776 | | | $ | 7,859 | | | $ | 7,735 | | | $ | 7,637 | | | $ | 7,506 | | Noninterest income | | | 9,866 | | | | 10,067 | | | | 9,598 | | | | 8,901 | | | | 5,951 | | | | 6,416 | | | | 6,955 | | | | 6,032 | | Total revenue | | | 18,465 | | | | 18,653 | | | | 18,228 | | | | 17,677 | | | | 13,810 | | | | 14,151 | | | | 14,592 | | | | 13,538 | | Provision for credit losses | | | 1,570 | | | | 1,165 | | | | 1,005 | | | | 1,270 | | | | 1,400 | | | | 1,159 | | | | 875 | | | | 580 | | Gains (losses) on sales of debt securities | | | 21 | | | | (469 | ) | | | (9 | ) | | | 14 | | | | 71 | | | | 29 | | | | 325 | | | | 659 | | Noninterest expense | | | 9,093 | | | | 8,863 | | | | 8,717 | | | | 8,924 | | | | 7,320 | | | | 7,285 | | | | 7,019 | | | | 7,057 | | Income before income taxes | | | 7,823 | | | | 8,156 | | | | 8,497 | | | | 7,497 | | | | 5,161 | | | | 5,736 | | | | 7,023 | | | | 6,560 | | Income tax expense | | | 2,567 | | | | 2,740 | | | | 3,022 | | | | 2,511 | | | | 1,587 | | | | 1,895 | | | | 2,366 | | | | 2,167 | | Net income | | | 5,256 | | | | 5,416 | | | | 5,475 | | | | 4,986 | | | | 3,574 | | | | 3,841 | | | | 4,657 | | | | 4,393 | | Average common shares issued and outstanding (in thousands) | | | 4,464,110 | | | | 4,499,704 | | | | 4,534,627 | | | | 4,609,481 | | | | 3,996,024 | | | | 4,000,573 | | | | 4,005,356 | | | | 4,032,550 | | Average diluted common shares issued and outstanding (in thousands) | | | 4,536,696 | | | | 4,570,558 | | | | 4,601,169 | | | | 4,666,405 | | | | 4,053,859 | | | | 4,054,659 | | | | 4,065,355 | | | | 4,099,062 | | Performance ratios | | | | | | | | | | | | | | | | | | | | | | | | | | | | | | | | | Return on average assets | | | 1.39 | % | | | 1.43 | % | | | 1.51 | % | | | 1.43 | % | | | 1.09 | % | | | 1.18 | % | | | 1.46 | % | | | 1.49 | % | Return on average common shareholders’ equity | | | 15.76 | | | | 16.64 | | | | 17.26 | | | | 15.44 | | | | 14.21 | | | | 15.09 | | | | 18.93 | | | | 17.97 | | Total ending equity to total ending assets | | | 9.27 | | | | 9.22 | | | | 8.85 | | | | 9.41 | | | | 7.86 | | | | 8.12 | | | | 8.13 | | | | 8.16 | | Total average equity to total average assets | | | 8.97 | | | | 8.63 | | | | 8.75 | | | | 9.26 | | | | 7.66 | | | | 7.82 | | | | 7.74 | | | | 8.28 | | Dividend payout | | | 47.49 | | | | 46.82 | | | | 41.76 | | | | 46.75 | | | | 56.24 | | | | 52.60 | | | | 38.90 | | | | 41.71 | | Per common share data | | | | | | | | | | | | | | | | | | | | | | | | | | | | | | | | | Earnings | | $ | 1.17 | | | $ | 1.20 | | | $ | 1.21 | | | $ | 1.08 | | | $ | 0.89 | | | $ | 0.96 | | | $ | 1.16 | | | $ | 1.09 | | Diluted earnings | | | 1.16 | | | | 1.18 | | | | 1.19 | | | | 1.07 | | | | 0.88 | | | | 0.95 | | | | 1.14 | | | | 1.07 | | Dividends paid | | | 0.56 | | | | 0.56 | | | | 0.50 | | | | 0.50 | | | | 0.50 | | | | 0.50 | | | | 0.45 | | | | 0.45 | | Book value | | | 29.70 | | | | 29.52 | | | | 28.17 | | | | 28.19 | | | | 25.32 | | | | 25.28 | | | | 25.16 | | | | 24.45 | | Average balance sheet | | | | | | | | | | | | | | | | | | | | | | | | | | | | | | | | | Total loans and leases | | $ | 683,598 | | | $ | 673,477 | | | $ | 635,649 | | | $ | 615,968 | | | $ | 563,589 | | | $ | 539,497 | | | $ | 520,415 | | | $ | 524,921 | | Total assets | | | 1,495,150 | | | | 1,497,987 | | | | 1,456,004 | | | | 1,416,373 | | | | 1,305,057 | | | | 1,294,754 | | | | 1,277,478 | | | | 1,200,859 | | Total deposits | | | 680,245 | | | | 676,851 | | | | 674,796 | | | | 659,821 | | | | 628,922 | | | | 632,771 | | | | 640,593 | | | | 627,420 | | Long-term debt | | | 140,756 | | | | 136,769 | | | | 125,620 | | | | 117,018 | | | | 99,601 | | | | 98,326 | | | | 96,697 | | | | 96,167 | | Common shareholders’ equity | | | 132,004 | | | | 129,098 | | | | 127,102 | | | | 130,881 | | | | 99,677 | | | | 100,974 | | | | 98,558 | | | | 99,130 | | Total shareholders’ equity | | | 134,047 | | | | 129,262 | | | | 127,373 | | | | 131,153 | | | | 99,948 | | | | 101,246 | | | | 98,829 | | | | 99,401 | | Asset Quality | | | | | | | | | | | | | | | | | | | | | | | | | | | | | | | | | Allowance for credit losses | | $ | 9,413 | | | $ | 9,260 | | | $ | 9,475 | | | $ | 9,462 | | | $ | 8,440 | | | $ | 8,716 | | | $ | 8,702 | | | $ | 8,707 | | Nonperforming assets | | | 1,856 | | | | 1,656 | | | | 1,641 | | | | 1,680 | | | | 1,603 | | | | 1,597 | | | | 1,895 | | | | 2,338 | | Allowance for loan and lease losses as a percentage of total loans and leases outstanding | | | 1.28 | % | | | 1.33 | % | | | 1.36 | % | | | 1.46 | % | | | 1.40 | % | | | 1.50 | % | | | 1.57 | % | | | 1.57 | % | Allowance for loan and lease losses as a percentage of total nonperforming loans and leases | | | 505 | | | | 562 | | | | 579 | | | | 572 | | | | 532 | | | | 556 | | | | 470 | | | | 401 | | Net charge-offs | | $ | 1,417 | | | $ | 1,277 | | | $ | 1,023 | | | $ | 822 | | | $ | 1,648 | | | $ | 1,145 | | | $ | 880 | | | $ | 889 | | Annualized Net charge-offs as a percentage of average loans and leases | | | 0.82 | % | | | 0.75 | % | | | 0.65 | % | | | 0.54 | % | | | 1.16 | % | | | 0.84 | % | | | 0.68 | % | | | 0.69 | % | Nonperforming loans and leases as a percentage of total loans and leases outstanding | | | 0.25 | | | | 0.24 | | | | 0.23 | | | | 0.26 | | | | 0.26 | | | | 0.27 | | | | 0.33 | | | | 0.39 | | Nonperforming assets as a percentage of total loans, leases, and foreclosed properties | | | 0.26 | | | | 0.25 | | | | 0.25 | | | | 0.27 | | | | 0.28 | | | | 0.29 | | | | 0.36 | | | | 0.44 | | Ratio of the allowance for loan and lease losses at period end to annualized net charge-offs | | | 1.60 | | | | 1.75 | | | | 2.21 | | | | 2.72 | | | | 1.23 | | | | 1.83 | | | | 2.36 | | | | 2.30 | | Capital ratios (period end) | | | | | | | | | | | | | | | | | | | | | | | | | | | | | | | | | Risk-based capital: | | | | | | | | | | | | | | | | | | | | | | | | | | | | | | | | | Tier 1 | | | 8.64 | % | | | 8.48 | % | | | 8.33 | % | | | 8.45 | % | | | 8.25 | % | | | 8.27 | % | | | 8.16 | % | | | 8.26 | % | Total | | | 11.88 | | | | 11.46 | | | | 11.25 | | | | 11.32 | | | | 11.08 | | | | 11.19 | | | | 11.23 | | | | 11.52 | | Tier 1 Leverage | | | 6.36 | | | | 6.16 | | | | 6.13 | | | | 6.18 | | | | 5.91 | | | | 5.90 | | | | 5.66 | | | | 5.86 | | Market capitalization | | $ | 238,021 | | | $ | 240,966 | | | $ | 217,794 | | | $ | 208,633 | | | $ | 184,586 | | | $ | 168,950 | | | $ | 183,202 | | | $ | 177,958 | | Market price per share of common stock | | | | | | | | | | | | | | | | | | | | | | | | | | | | | | | | | Closing | | $ | 53.39 | | | $ | 53.57 | | | $ | 48.10 | | | $ | 45.54 | | | $ | 46.15 | | | $ | 42.10 | | | $ | 45.61 | | | $ | 44.10 | | High closing | | | 54.90 | | | | 53.57 | | | | 50.47 | | | | 47.08 | | | | 46.99 | | | | 45.98 | | | | 47.08 | | | | 47.08 | | Low closing | | | 51.66 | | | | 47.98 | | | | 45.48 | | | | 43.09 | | | | 41.57 | | | | 41.60 | | | | 44.01 | | | | 43.66 | |
Table XIII Quarterly Average Balances and Interest Rates - FTE Basis | | | | | | | | | | | | | | | | | | | | | | | | Fourth Quarter 2006 | | | | | Third Quarter 2006 | | | (Dollars in millions) | | Average
Balance | | Interest
Income/
Expense | | Yield/
Rate | | | | | Average
Balance | | Interest
Income/
Expense | | Yield/
Rate | | Earning assets | | | | | | | | | | | | | | | | | | | | | Time deposits placed and other short-term investments | | $ | 15,760 | | $ | 166 | | 4.19 | % | | | | $ | 15,629 | | $ | 173 | | 4.39 | % | Federal funds sold and securities purchased under agreements to resell | | | 174,167 | | | 2,068 | | 4.73 | | | | | | 173,381 | | | 2,146 | | 4.94 | | Trading account assets | | | 167,163 | | | 2,289 | | 5.46 | | | | | | 146,817 | | | 1,928 | | 5.24 | | Debt securities(1) | | | 193,601 | | | 2,504 | | 5.17 | | | | | | 236,033 | | | 3,136 | | 5.31 | | Loans and leases(2): | | | | | | | | | | | | | | | | | | | | | Residential mortgage | | | 225,985 | | | 3,202 | | 5.66 | | | | | | 222,889 | | | 3,151 | | 5.65 | | Credit card—domestic | | | 59,802 | | | 2,101 | | 13.94 | | | | | | 62,508 | | | 2,189 | | 13.90 | | Credit card—foreign | | | 10,375 | | | 305 | | 11.66 | | | | | | 9,455 | | | 286 | | 12.02 | | Home equity lines | | | 73,218 | | | 1,411 | | 7.65 | | | | | | 70,075 | | | 1,351 | | 7.65 | | Direct/Indirect consumer(3) | | | 65,158 | | | 1,316 | | 8.00 | | | | | | 61,361 | | | 1,193 | | 7.74 | | Other consumer(4) | | | 10,606 | | | 225 | | 8.47 | | | | | | 11,075 | | | 298 | | 10.66 | | Total consumer | | | 445,144 | | | 8,560 | | 7.65 | | | | | | 437,363 | | | 8,468 | | 7.71 | | Commercial—domestic | | | 158,604 | | | 2,907 | | 7.27 | | | | | | 153,007 | | | 2,805 | | 7.28 | | Commercial real estate(5) | | | 36,851 | | | 704 | | 7.58 | | | | | | 37,471 | | | 724 | | 7.67 | | Commercial lease financing | | | 21,159 | | | 254 | | 4.80 | | | | | | 20,875 | | | 232 | | 4.46 | | Commercial—foreign | | | 21,840 | | | 337 | | 6.12 | | | | | | 24,761 | | | 454 | | 7.27 | | Total commercial | | | 238,454 | | | 4,202 | | 7.00 | | | | | | 236,114 | | | 4,215 | | 7.09 | | Total loans and leases | | | 683,598 | | | 12,762 | | 7.42 | | | | | | 673,477 | | | 12,683 | | 7.49 | | Other earning assets | | | 65,172 | | | 1,058 | | 6.46 | | | | | | 57,029 | | | 914 | | 6.38 | | Total earning assets(6) | | | 1,299,461 | | | 20,847 | | 6.39 | | | | | | 1,302,366 | | | 20,980 | | 6.41 | | Cash and cash equivalents | | | 32,816 | | | | | | | | | | | 33,495 | | | | | | | Other assets, less allowance for loan and lease losses | | | 162,873 | | | | | | | | | | | 162,126 | | | | | | | Total assets | | $ | 1,495,150 | | | | | | | | | | $ | 1,497,987 | | | | | | | Interest-bearing liabilities | | | | | | | | | | | | | | | | | | | | | Domestic interest-bearing deposits: | | | | | | | | | | | | | | | | | | | | | Savings | | $ | 32,965 | | $ | 48 | | 0.58 | % | | | | $ | 34,268 | | $ | 69 | | 0.81 | % | NOW and money market deposit accounts | | | 211,055 | | | 966 | | 1.81 | | | | | | 212,690 | | | 1,053 | | 1.96 | | Consumer CDs and IRAs | | | 154,621 | | | 1,794 | | 4.60 | | | | | | 147,607 | | | 1,658 | | 4.46 | | Negotiable CDs, public funds and other time deposits | | | 13,052 | | | 140 | | 4.30 | | | | | | 14,105 | | | 150 | | 4.19 | | Total domestic interest-bearing deposits | | | 411,693 | | | 2,948 | | 2.84 | | | | | | 408,670 | | | 2,930 | | 2.84 | | Foreign interest-bearing deposits: | | | | | | | | | | | | | | | | | | | | | Banks located in foreign countries | | | 38,648 | | | 507 | | 5.21 | | | | | | 38,588 | | | 562 | | 5.78 | | Governments and official institutions | | | 14,220 | | | 168 | | 4.70 | | | | | | 12,801 | | | 156 | | 4.83 | | Time, savings and other | | | 41,328 | | | 366 | | 3.50 | | | | | | 40,444 | | | 328 | | 3.22 | | Total foreign interest-bearing deposits | | | 94,196 | | | 1,041 | | 4.38 | | | | | | 91,833 | | | 1,046 | | 4.52 | | Total interest-bearing deposits | | | 505,889 | | | 3,989 | | 3.13 | | | | | | 500,503 | | | 3,976 | | 3.15 | | Federal funds purchased, securities sold under agreements to repurchase and other short-term borrowings | | | 405,748 | | | 5,222 | | 5.11 | | | | | | 429,882 | | | 5,467 | | 5.05 | | Trading account liabilities | | | 75,261 | | | 800 | | 4.21 | | | | | | 69,462 | | | 727 | | 4.15 | | Long-term debt | | | 140,756 | | | 1,881 | | 5.34 | | | | | | 136,769 | | | 1,916 | | 5.60 | | Total interest-bearing liabilities(6) | | | 1,127,654 | | | 11,892 | | 4.19 | | | | | | 1,136,616 | | | 12,086 | | 4.23 | | Noninterest-bearing sources: | | | | | | | | | | | | | | | | | | | | | Noninterest-bearing deposits | | | 174,356 | | | | | | | | | | | 176,348 | | | | | | | Other liabilities | | | 59,093 | | | | | | | | | | | 55,761 | | | | | | | Shareholders’ equity | | | 134,047 | | | | | | | | | 129,262 | | | | | | | Total liabilities and shareholders’ equity | | $ | 1,495,150 | | | | | | | | $ | 1,497,987 | | | | | | | Net interest spread | | | | | | | | 2.20 | | | | | | | | | | | 2.18 | | Impact of noninterest-bearing sources | | | | | | | | 0.55 | | | | | | | | | | | 0.55 | | Net interest income/yield on earning assets(7) | | | | | $ | 8,955 | | 2.75 | % | | | | | | | $ | 8,894 | | 2.73 | % |
(1) | Yields on AFS debt securities are calculated based on fair value rather than historical cost balances. The use of fair value does not have a material impact on net interest yield. |
(2) | Nonperforming loans are included in the respective average loan balances. Income on these nonperforming loans is recognized on a cash basis. |
(3) | Includes home equity loans of $11.7 billion, $9.9 billion, $8.7 billion and $8.2 billion in the fourth, third, second and first quarters of 2006, respectively, and $8.0 billion in the fourth quarter of 2005. |
(4) | Includes consumer finance loans of $2.8 billion, $2.9 billion, $3.0 billion and $3.0 billion in the fourth, third, second and first quarters of 2006, respectively, and $2.9 billion in the fourth quarter of 2005; and foreign consumer loans of $7.8 billion, $8.1 billion, $7.8 billion and $7.3 billion in the fourth, third, second and first quarters of 2006, respectively, and $3.7 billion in the fourth quarter of 2005. |
(5) | Includes domestic commercial real estate loans of $36.1 billion, $36.7 billion, $36.0 billion and $36.0 billion in the fourth, third, second and first quarters of 2006, respectively, and $35.4 billion in the fourth quarter of 2005. |
(6) | Interest income includes the impact of interest rate risk management contracts, which increased (decreased) interest income on the underlying assets $(198) million, $(128) million, $(54) million and $8 million in the fourth, third, second and first quarters of 2006, respectively, and $29 million in the fourth quarter of 2005. Interest expense includes the impact of interest rate risk management contracts, which increased (decreased) interest expense on the underlying liabilities $(69) million, $(48) million, $87 million and $136 million in the fourth, third, second and first quarters of 2006, respectively, and $254 million in the fourth quarter of 2005. For further information on interest rate contracts, see “Interest Rate Risk Management for Nontrading Activities” beginning on page 76. |
(7) | Interest income (FTE basis) for the three months ended June 30, 2006, does not include the cumulative tax charge resulting from a change in tax legislation relating to 2003, Total Revenue decreased $339 million, or 53 percent.extraterritorial tax income and foreign sales corporation regimes. The FTE impact to Net Interest Income decreased $352 million to negative $695 million primarily due toand net interest yield on earning assets of this retroactive tax adjustment was a reduction of capital inOther as$270 million and 9 bps, respectively, for the three months ended June 30, 2006. Management has excluded this one-time impact to provide a more capital was deployedcomparative basis of presentation for Net Interest Income and net interest yield on earning assets on a FTE basis. The impact on any given future period is not expected to be material. |
| | | | | | | | | | | | | | | | | | | | | | | | | | | | | | | | | | | Second Quarter 2006 | | | | | First Quarter 2006 | | | | | Fourth Quarter 2005 | | | (Dollars in millions) | | Average
Balance | | Interest
Income/
Expense | | Yield/
Rate | | | | | Average
Balance | | Interest
Income/
Expense | | Yield/
Rate | | | | | Average
Balance | | Interest
Income/
Expense | | Yield/
Rate | | Earning assets | | | | | | | | | | | | | | | | | | | | | | | | | | | | | | | | Time deposits placed and other short-term investments | | $ | 16,691 | | $ | 168 | | 4.05 | % | | | | $ | 14,347 | | $ | 139 | | 3.92 | % | | | | $ | 14,619 | | $ | 133 | | 3.59 | % | Federal funds sold and securities purchased under agreements to resell | | | 179,104 | | | 1,900 | | 4.25 | | | | | | 174,711 | | | 1,709 | | 3.94 | | | | | | 165,908 | | | 1,477 | | 3.55 | | Trading account assets | | | 133,556 | | | 1,712 | | 5.13 | | | | | | 133,361 | | | 1,623 | | 4.89 | | | | | | 139,441 | | | 1,648 | | 4.72 | | Debt securities(1) | | | 236,967 | | | 3,162 | | 5.34 | | | | | | 234,606 | | | 3,043 | | 5.19 | | | | | | 221,411 | | | 2,842 | | 5.13 | | Loans and leases(2): | | | | | | | | | | | | | | | | | | | | | | | | | | | | | | | | Residential mortgage | | | 197,228 | | | 2,731 | | 5.54 | | | | | | 184,796 | | | 2,524 | | 5.48 | | | | | | 178,764 | | | 2,427 | | 5.42 | | Credit card—domestic | | | 64,980 | | | 2,168 | | 13.38 | | | | | | 68,169 | | | 2,180 | | 12.97 | | | | | | 56,858 | | | 1,748 | | 12.19 | | Credit card—foreign | | | 8,305 | | | 269 | | 12.97 | | | | | | 8,403 | | | 287 | | 13.86 | | | | | | — | | | — | | — | | Home equity lines | | | 67,182 | | | 1,231 | | 7.35 | | | | | | 64,198 | | | 1,112 | | 7.02 | | | | | | 60,571 | | | 1,011 | | 6.63 | | Direct/Indirect consumer(3) | | | 56,715 | | | 1,057 | | 7.46 | | | | | | 55,025 | | | 986 | | 7.24 | | | | | | 47,181 | | | 703 | | 5.91 | | Other consumer(4) | | | 10,804 | | | 294 | | 10.95 | | | | | | 10,357 | | | 272 | | 10.59 | | | | | | 6,653 | | | 182 | | 11.01 | | Total consumer | | | 405,214 | | | 7,750 | | 7.66 | | | | | | 390,948 | | | 7,361 | | 7.60 | | | | | | 350,027 | | | 6,071 | | 6.90 | | Commercial—domestic | | | 148,445 | | | 2,695 | | 7.28 | | | | | | 144,693 | | | 2,490 | | 6.97 | | | | | | 137,224 | | | 2,279 | | 6.59 | | Commercial real estate(5) | | | 36,749 | | | 680 | | 7.41 | | | | | | 36,676 | | | 632 | | 6.99 | | | | | | 36,017 | | | 597 | | 6.58 | | Commercial lease financing | | | 20,896 | | | 262 | | 5.01 | | | | | | 20,512 | | | 247 | | 4.82 | | | | | | 20,178 | | | 241 | | 4.79 | | Commercial—foreign | | | 24,345 | | | 456 | | 7.52 | | | | | | 23,139 | | | 427 | | 7.48 | | | | | | 20,143 | | | 379 | | 7.45 | | Total commercial | | | 230,435 | | | 4,093 | | 7.12 | | | | | | 225,020 | | | 3,796 | | 6.83 | | | | | | 213,562 | | | 3,496 | | 6.50 | | Total loans and leases | | | 635,649 | | | 11,843 | | 7.47 | | | | | | 615,968 | | | 11,157 | | 7.32 | | | | | | 563,589 | | | 9,567 | | 6.75 | | Other earning assets | | | 51,928 | | | 808 | | 6.24 | | | | | | 46,618 | | | 718 | | 6.22 | | | | | | 40,582 | | | 594 | | 5.83 | | Total earning assets(6) | | | 1,253,895 | | | 19,593 | | 6.26 | | | | | | 1,219,611 | | | 18,389 | | 6.08 | | | | | | 1,145,550 | | | 16,261 | | 5.65 | | Cash and cash equivalents | | | 35,070 | | | | | | | | | | | 34,857 | | | | | | | | | | | 33,693 | | | | | | | Other assets, less allowance for loan and lease losses | | | 167,039 | | | | | | | | | | | 161,905 | | | | | | | | | | | 125,814 | | | | | | | Total assets | | $ | 1,456,004 | | | | | | | | | | $ | 1,416,373 | | | | | | | | | | $ | 1,305,057 | | | | | | | Interest-bearing liabilities | | | | | | | | | | | | | | | | | | | | | | | | | | | | | | | | Domestic interest-bearing deposits: | | | | | | | | | | | | | | | | | | | | | | | | | | | | | | | | Savings | | $ | 35,681 | | $ | 76 | | 0.84 | % | | | | $ | 35,550 | | $ | 76 | | 0.87 | % | | | | $ | 35,535 | | $ | 68 | | 0.76 | % | NOW and money market deposit accounts | | | 221,198 | | | 996 | | 1.81 | | | | | | 227,606 | | | 908 | | 1.62 | | | | | | 224,122 | | | 721 | | 1.28 | | Consumer CDs and IRAs | | | 141,408 | | | 1,393 | | 3.95 | | | | | | 135,068 | | | 1,177 | | 3.53 | | | | | | 120,321 | | | 1,028 | | 3.39 | | Negotiable CDs, public funds and other time deposits | | | 13,005 | | | 123 | | 3.80 | | | | | | 8,551 | | | 70 | | 3.30 | | | | | | 5,085 | | | 27 | | 2.13 | | Total domestic interest-bearing deposits | | | 411,292 | | | 2,588 | | 2.52 | | | | | | 406,775 | | | 2,231 | | 2.22 | | | | | | 385,063 | | | 1,844 | | 1.90 | | Foreign interest-bearing deposits: | | | | | | | | | | | | | | | | | | | | | | | | | | | | | | | | Banks located in foreign countries | | | 32,456 | | | 489 | | 6.05 | | | | | | 30,116 | | | 424 | | 5.71 | | | | | | 24,451 | | | 356 | | 5.77 | | Governments and official institutions | | | 13,428 | | | 155 | | 4.63 | | | | | | 10,200 | | | 107 | | 4.25 | | | | | | 7,579 | | | 74 | | 3.84 | | Time, savings and other | | | 37,178 | | | 276 | | 2.98 | | | | | | 35,136 | | | 245 | | 2.83 | | | | | | 32,624 | | | 202 | | 2.46 | | Total foreign interest-bearing deposits | | | 83,062 | | | 920 | | 4.44 | | | | | | 75,452 | | | 776 | | 4.17 | | | | | | 64,654 | | | 632 | | 3.87 | | Total interest-bearing deposits | | | 494,354 | | | 3,508 | | 2.85 | | | | | | 482,227 | | | 3,007 | | 2.53 | | | | | | 449,717 | | | 2,476 | | 2.18 | | Federal funds purchased, securities sold under agreements to repurchase and other short-term borrowings | | | 408,734 | | | 4,842 | | 4.75 | | | | | | 399,896 | | | 4,309 | | 4.37 | | | | | | 364,140 | | | 3,855 | | 4.20 | | Trading account liabilities | | | 61,263 | | | 596 | | 3.90 | | | | | | 52,466 | | | 517 | | 3.99 | | | | | | 56,880 | | | 619 | | 4.32 | | Long-term debt | | | 125,620 | | | 1,721 | | 5.48 | | | | | | 117,018 | | | 1,516 | | 5.18 | | | | | | 99,601 | | | 1,209 | | 4.85 | | Total interest-bearing liabilities (6) | | | 1,089,971 | | | 10,667 | | 3.92 | | | | | | 1,051,607 | | | 9,349 | | 3.60 | | | | | | 970,338 | | | 8,159 | | 3.34 | | Noninterest-bearing sources: | | | | | | | | | | | | | | | | | | | | | | | | | | | | | | | | Noninterest-bearing deposits | | | 180,442 | | | | | | | | | | | 177,594 | | | | | | | | | | | 179,205 | | | | | | | Other liabilities | | | 58,218 | | | | | | | | | | | 56,019 | | | | | | | | | | | 55,566 | | | | | | | Shareholders’ equity | | | 127,373 | | | | | | | | | | | 131,153 | | | | | | | | | | | 99,948 | | | | | | | Total liabilities and shareholders’ equity | | $ | 1,456,004 | | | | | | | | | | $ | 1,416,373 | | | | | | | | | | $ | 1,305,057 | | | | | | | Net interest spread | | | | | | | | 2.34 | | | | | | | | | | | 2.48 | | | | | | | | | | | 2.31 | | Impact of noninterest-bearing sources | | | | | | | | 0.51 | | | | | | | | | | | 0.50 | | | | | | | | | | | 0.51 | | Net interest income/yield on earning assets(7) | | | | | $ | 8,926 | | 2.85 | % | | | | | | | $ | 9,040 | | 2.98 | | | | | | | | $ | 8,102 | | 2.82 | % |
Assets in Custody — Consist largely of custodial and non-discretionary trust assets administered for customers excluding brokerage assets. Trust assets encompass a broad range of asset types including real estate, private company ownership interest, personal property and investments. Assets Under Management (AUM)— The total market value of assets under the investment advisory and discretion ofGlobal Wealth and Investment Management which generate asset management fees based on a percentage of the assets’ market value. AUM reflects assets that are generally managed for institutional, high net-worth and retail clients and are distributed through various investment products including mutual funds, other commingled vehicles and separate accounts. Bridge Loan — A short-term loan or security which is expected to be replaced by permanent financing (debt or equity securities, loan syndication or asset sales) prior to the maturity date of the loan. Bridge loans may include an unfunded commitment, as well as funded amounts, and are generally expected to be retired in one year or less. Client Brokerage Assets— Include client assets which are held in brokerage accounts. This includes non-discretionary brokerage and fee-based assets which generate brokerage income and asset management fee revenue. Co-branding Affinity Agreements — Contracts with our endorsing partners outlining specific marketing rights, compensation and other terms and conditions mutually agreed to by the Corporation and its partners. Committed Credit Exposure — Committed credit exposure includes any funded portion of a facility plus the unfunded portion of a facility on which the Corporation is legally bound to advance funds during a specified period under prescribed conditions. Core Net Interest Income -Managed Basis — Net Interest Income on a fully taxable-equivalent basis excluding the impact of market-based activities and certain securitizations. Credit Derivatives/ Credit Default Swaps (CDS) — A derivative contract that provides protection against the deterioration of credit quality and would allow one party to receive payment in the event of default by a third party under a borrowing arrangement. Derivative — A contract or agreement whose value is derived from changes in an underlying index such as interest rates, foreign exchange rates or prices of securities. Derivatives utilized by the Corporation include swaps, financial futures and forward settlement contracts, and option contracts. Excess Servicing Income — For certain assets that have been securitized, interest income, fee revenue and recoveries in excess of interest paid to the investors, gross credit losses and other trust expenses related to the securitized receivables are all reclassified into excess servicing income, which is a component of Card Income. Excess servicing income also includes the fair market value adjustments related to the Corporation’s interest-only strips as a result of changes in the estimated future net cash flows expected to be earned in future periods and changes in projected loan payment rates. Interest-only (IO) Strip — A residual interest in a securitization trust representing the right to receive future net cash flows from securitized assets after payments to third party investors and net credit losses. These arise when assets are transferred to a special purpose entity as part of an asset securitization transaction qualifying for sale treatment under GAAP. Letter of Credit — A document issued by the Corporation on behalf of a customer to a third party promising to pay that third party upon presentation of specified documents. A letter of credit effectively substitutes the Corporation’s credit for that of the Corporation’s customer. Managed Basis —Managed basis presentation includes results from both on-balance sheet loans and off-balance sheet loans, and excludes the impact of securitization activity, with the exception of the mark-to-market adjustment on residual interests from securitization and the impact of the gains recognized on securitized loan principal receivables. Managed basis disclosures assume that securitized loans have not been sold and present the results of the securitized loans in the same manner as the Corporation’s held loans. Managed credit impact represents the Corporation’s held Provision for Credit Losses combined with credit losses associated with the securitized loan portfolio. Mortgage Servicing Right (MSR) — The right to service a mortgage loan retained when the underlying loan is sold or securitized. Servicing includes collections for principal, interest and escrow payments from borrowers and accounting for and remitting principal and interest payments to investors. Net Interest Yield — Net Interest Income divided by average total interest-earning assets. Operating Basis — A basis of presentation not defined by GAAP that excludes merger and restructuring charges. Return on Common Equity (ROE) — Measures the earnings contribution of a unit as a percentage of the Shareholders’ Equity allocated to that unit. Securitize / Securitization — A process by which financial assets are sold to a special purpose entity, which then issues securities collateralized by those underlying assets, and the return on the securities issued is based on the principal and interest cash flow of the underlying assets. Shareholder Value Added (SVA) — Cash basis earnings on an operating basis less a charge for the use of capital. Value-at-Risk (VAR) — A VAR model estimates a range of hypothetical scenarios to calculate a potential loss which is not expected to be exceeded with a specified confidence level. VAR is a key statistic used to measure and manage market risk. Variable Interest Entities (VIE) — An entity whose equity investors do not have a controlling financial interest. The entity may not have sufficient equity at risk to finance its activities without additional subordinated financial support from third parties. The equity investors may lack the ability to make significant decisions about the entity’s activities, or they may not absorb the losses or receive the residual returns generated by the assets and other contractual arrangements of the VIE. A VIE must be consolidated by its primary beneficiary, if any, which is the party that will absorb the majority of the expected losses or expected residual returns of the VIE or both. | | | | AFS | | Available-for-sale | | AICPA | | American Institute of Certified Public Accountants | | ALCO | | Asset and Liability Committee | | ALM | | Asset and liability management | | EPS | | Earnings per share | | FASB | | Financial Accounting Standards Board | | FDIC | | Federal Deposit and Insurance Corporation | | FFIEC | | Federal Financial Institutions Examination Council | | FRB | | Board of Governors of the business segments. Offsetting this decrease was a $166 million increase in total revenue associated with the changeFederal Reserve System | | FSP | | Financial Accounting Standards Board Staff Position | | FTE | | Fully taxable-equivalent | | GAAP | | Generally accepted accounting principles in the fair value derivatives used as economic hedgesUnited States | | OCC | | Office of interestthe Comptroller of the Currency | | OCI | | Other Comprehensive Income | | QSPE | | Qualified Special Purpose Entity | | RCC | | Risk and foreign exchange rate fluctuations that do not qualify for SFAS 133 hedge accounting. Provision for Credit Losses increased $43 million, or 14 percent. Gains on SalesCapital Committee | | SBLCs | | Standby letters of Debt credit | | SEC | | Securities increased $675 million to $1.6 billion in 2004 as we continued to reposition the ALM portfolio in response to changes in interest rates and to manage mortgage prepayment risk. Other Noninterest Expense decreased $78 million and included Merger and Restructuring Charges of $618 million in 2004. As a result, Net Income improved $232 million. Total Revenue in Equity Investments increased $704 million in 2004 compared to 2003 due to an improvement in Equity Investment Gains (Losses). Equity Investments had Net Income of $202 million in 2004 compared to a Net Loss of $246 million in 2003. In 2004, Principal Investing revenue increased as a result of increased realized gains compared to the prior year. Noninterest Income primarily consists of Equity Investment Gains.Exchange Commission Table I
Average Balances and Interest Rates—FTE Basis
| | | | | | | | | | | | | | | | | | | | | | | | | | | | | | | 2005
| | | 2004 (Restated)
| | | 2003 (Restated)
| | | (Dollars in millions) | | Average
Balance
| | Interest
Income/
Expense
| | Yield/
Rate
| | | Average
Balance
| | Interest
Income/
Expense
| | Yield/
Rate
| | | Average
Balance
| | Interest
Income/
Expense
| | Yield/
Rate
| | Earning assets | | | | | | | | | | | | | | | | | | | | | | | | | | | | Time deposits placed and other short-term investments | | $ | 14,286 | | $ | 472 | | 3.30 | % | | $ | 14,254 | | $ | 362 | | 2.54 | % | | $ | 9,056 | | $ | 172 | | 1.90 | % | Federal funds sold and securities purchased under agreements to resell | | | 169,132 | | | 5,012 | | 2.96 | | | | 128,981 | | | 1,940 | | 1.50 | | | | 78,857 | | | 1,266 | | 1.61 | | Trading account assets | | | 133,502 | | | 5,883 | | 4.41 | | | | 104,616 | | | 4,092 | | 3.91 | | | | 97,222 | | | 4,005 | | 4.12 | | Securities | | | 219,843 | | | 11,047 | | 5.03 | | | | 150,171 | | | 7,320 | | 4.88 | | | | 70,644 | | | 3,135 | | 4.44 | | Loans and leases(1): | | | | | | | | | | | | | | | | | | | | | | | | | | | | Residential mortgage | | | 173,773 | | | 9,424 | | 5.42 | | | | 167,270 | | | 9,056 | | 5.42 | | | | 127,131 | | | 6,873 | | 5.41 | | Credit card | | | 53,997 | | | 6,253 | | 11.58 | | | | 43,435 | | | 4,653 | | 10.71 | | | | 28,210 | | | 2,886 | | 10.23 | | Home equity lines | | | 56,289 | | | 3,412 | | 6.06 | | | | 39,400 | | | 1,835 | | 4.66 | | | | 22,890 | | | 1,040 | | 4.55 | | Direct/Indirect consumer | | | 44,981 | | | 2,589 | | 5.75 | | | | 38,078 | | | 2,093 | | 5.50 | | | | 32,593 | | | 1,964 | | 6.03 | | Other consumer(2) | | | 6,908 | | | 667 | | 9.67 | | | | 7,717 | | | 594 | | 7.70 | | | | 8,865 | | | 588 | | 6.63 | | | | |
|
| |
|
| | | | |
|
| |
|
| | | | |
|
| |
|
| | | | Total consumer | | | 335,948 | | | 22,345 | | 6.65 | | | | 295,900 | | | 18,231 | | 6.16 | | | | 219,689 | | | 13,351 | | 6.08 | | | | |
|
| |
|
| | | | |
|
| |
|
| | | | |
|
| |
|
| | | | Commercial—domestic | | | 128,034 | | | 8,266 | | 6.46 | | | | 114,644 | | | 6,978 | | 6.09 | | | | 93,458 | | | 6,441 | | 6.89 | | Commercial real estate | | | 34,304 | | | 2,046 | | 5.97 | | | | 28,085 | | | 1,263 | | 4.50 | | | | 20,042 | | | 862 | | 4.30 | | Commercial lease financing | | | 20,441 | | | 992 | | 4.85 | | | | 17,483 | | | 819 | | 4.68 | | | | 10,061 | | | 395 | | 3.92 | | Commercial—foreign | | | 18,491 | | | 1,292 | | 6.99 | | | | 16,505 | | | 850 | | 5.15 | | | | 12,970 | | | 460 | | 3.55 | | | | |
|
| |
|
| | | | |
|
| |
|
| | | | |
|
| |
|
| | | | Total commercial | | | 201,270 | | | 12,596 | | 6.26 | | | | 176,717 | | | 9,910 | | 5.61 | | | | 136,531 | | | 8,158 | | 5.98 | | | | |
|
| |
|
| | | | |
|
| |
|
| | | | |
|
| |
|
| | | | Total loans and leases | | | 537,218 | | | 34,941 | | 6.50 | | | | 472,617 | | | 28,141 | | 5.95 | | | | 356,220 | | | 21,509 | | 6.04 | | | | |
|
| |
|
| | | | |
|
| |
|
| | | | |
|
| |
|
| | | | Other earning assets | | | 38,013 | | | 2,103 | | 5.53 | | | | 34,634 | | | 1,815 | | 5.24 | | | | 37,599 | | | 1,729 | | 4.60 | | | | |
|
| |
|
| | | | |
|
| |
|
| | | | |
|
| |
|
| | | | Total earning assets(3) | | | 1,111,994 | | | 59,458 | | 5.35 | | | | 905,273 | | | 43,670 | | 4.82 | | | | 649,598 | | | 31,816 | | 4.90 | | | | |
|
| |
|
| | | | |
|
| |
|
| | | | |
|
| |
|
| | | | Cash and cash equivalents | | | 33,199 | | | | | | | | | 28,511 | | | | | | | | | 22,637 | | | | | | | Other assets, less allowance for loan and lease losses | | | 124,699 | | | | | | | | | 110,847 | | | | | | | | | 76,869 | | | | | | | | | |
|
| | | | | | | |
|
| | | | | | | |
|
| | | | | | | Total assets | | $ | 1,269,892 | | | | | | | | $ | 1,044,631 | | | | | | | | $ | 749,104 | | | | | | | | | |
|
| | | | | | | |
|
| | | | | | | |
|
| | | | | | | Interest-bearing liabilities | | | | | | | | | | | | | | | | | | | | | | | | | | | | Domestic interest-bearing deposits: | | | | | | | | | | | | | | | | | | | | | | | | | | | | Savings | | $ | 36,602 | | $ | 211 | | 0.58 | % | | $ | 33,959 | | $ | 119 | | 0.35 | % | | $ | 24,538 | | $ | 108 | | 0.44 | % | NOW and money market deposit accounts | | | 227,722 | | | 2,839 | | 1.25 | | | | 214,542 | | | 1,921 | | 0.90 | | | | 148,896 | | | 1,236 | | 0.83 | | Consumer CDs and IRAs | | | 124,385 | | | 4,091 | | 3.29 | | | | 94,770 | | | 2,540 | | 2.68 | | | | 70,246 | | | 2,556 | | 3.64 | | Negotiable CDs, public funds and other time deposits | | | 6,865 | | | 250 | | 3.65 | | | | 5,977 | | | 290 | | 4.85 | | | | 7,627 | | | 130 | | 1.70 | | | | |
|
| |
|
| | | | |
|
| |
|
| | | | |
|
| |
|
| | | | Total domestic interest-bearing deposits | | | 395,574 | | | 7,391 | | 1.87 | | | | 349,248 | | | 4,870 | | 1.39 | | | | 251,307 | | | 4,030 | | 1.60 | | | | |
|
| |
|
| | | | |
|
| |
|
| | | | |
|
| |
|
| | | | Foreign interest-bearing deposits(4): | | | | | | | | | | | | | | | | | | | | | | | | | | | | Banks located in foreign countries | | | 22,945 | | | 1,202 | | 5.24 | | | | 18,426 | | | 679 | | 3.68 | | | | 13,959 | | | 285 | | 2.04 | | Governments and official institutions | | | 7,418 | | | 238 | | 3.21 | | | | 5,327 | | | 97 | | 1.82 | | | | 2,218 | | | 31 | | 1.40 | | Time, savings and other | | | 31,603 | | | 661 | | 2.09 | | | | 27,739 | | | 275 | | 0.99 | | | | 19,027 | | | 216 | | 1.14 | | | | |
|
| |
|
| | | | |
|
| |
|
| | | | |
|
| |
|
| | | | Total foreign interest-bearing deposits | | | 61,966 | | | 2,101 | | 3.39 | | | | 51,492 | | | 1,051 | | 2.04 | | | | 35,204 | | | 532 | | 1.51 | | | | |
|
| |
|
| | | | |
|
| |
|
| | | | |
|
| |
|
| | | | Total interest-bearing deposits | | | 457,540 | | | 9,492 | | 2.08 | | | | 400,740 | | | 5,921 | | 1.48 | | | | 286,511 | | | 4,562 | | 1.59 | | | | |
|
| |
|
| | | | |
|
| |
|
| | | | |
|
| |
|
| | | | Federal funds purchased, securities sold under agreements to repurchase and other short-term borrowings | | | 326,408 | | | 11,615 | | 3.56 | | | | 227,565 | | | 4,072 | | 1.79 | | | | 140,458 | | | 1,871 | | 1.33 | | Trading account liabilities | | | 57,689 | | | 2,364 | | 4.10 | | | | 35,326 | | | 1,317 | | 3.73 | | | | 37,176 | | | 1,286 | | 3.46 | | Long-term debt | | | 97,709 | | | 4,418 | | 4.52 | | | | 92,303 | | | 3,683 | | 3.99 | | | | 67,077 | | | 2,948 | | 4.40 | | | | |
|
| |
|
| | | | |
|
| |
|
| | | | |
|
| |
|
| | | | Total interest-bearing liabilities(3) | | | 939,346 | | | 27,889 | | 2.97 | | | | 755,934 | | | 14,993 | | 1.98 | | | | 531,222 | | | 10,667 | | 2.01 | | | | |
|
| |
|
| | | | |
|
| |
|
| | | | |
|
| |
|
| | | | Noninterest-bearing sources: | | | | | | | | | | | | | | | | | | | | | | | | | | | | Noninterest-bearing deposits | | | 174,892 | | | | | | | | | 150,819 | | | | | | | | | 119,722 | | | | | | | Other liabilities | | | 55,793 | | | | | | | | | 53,063 | | | | | | | | | 48,069 | | | | | | | Shareholders’ equity | | | 99,861 | | | | | | | | | 84,815 | | | | | | | | | 50,091 | | | | | | | | | |
|
| | | | | | | |
|
| | | | | | | |
|
| | | | | | | Total liabilities and shareholders’ equity | | $ | 1,269,892 | | | | | | | | $ | 1,044,631 | | | | | | | | $ | 749,104 | | | | | | | | | |
|
| | | | | | | |
|
| | | | | | | |
|
| | | | | | | Net interest spread | | | | | | | | 2.38 | | | | | | | | | 2.84 | | | | | | | | | 2.89 | | Impact of noninterest-bearing sources | | | | | | | | 0.46 | | | | | | | | | 0.33 | | | | | | | | | 0.37 | | | | | | | |
|
| |
|
| | | | |
|
| |
|
| | | | |
|
| |
|
| Net interest income/yield on earning assets | | | | | $ | 31,569 | | 2.84 | % | | | | | $ | 28,677 | | 3.17 | % | | | | | $ | 21,149 | | 3.26 | % | | | | | | |
|
| |
|
| | | | |
|
| |
|
| | | | |
|
| |
|
|
(1) | | Nonperforming loans are included in the respective average loan balances. Income on these nonperforming loans is recognized on a cash basis. |
(2) | | Includes consumer finance of $3,137 million, $3,735 million and $4,137 million in 2005, 2004 and 2003, respectively; foreign consumer of $3,565 million, $3,020 million and $1,977 million in 2005, 2004 and 2003, respectively; and consumer lease financing of $206 million, $962 million and $2,751 million in 2005, 2004 and 2003, respectively. |
(3) | | Interest income includes the impact of interest rate risk management contracts, which increased interest income on the underlying assets $704 million, $2,130 million and $2,581 million in 2005, 2004 and 2003, respectively. Interest expense includes the impact of interest rate risk management contracts, which increased interest expense on the underlying liabilities $1,335 million, $1,452 million and $873 million in 2005, 2004 and 2003, respectively. For further information on interest rate contracts, see “Interest Rate Risk Management” beginning on page 69. |
(4) | | Primarily consists of time deposits in denominations of $100,000 or more. | | SPE | | Special Purpose Entity |
Table II
Analysis of Changes in Net Interest Income—FTE Basis
| | | | | | | | | | | | | | | | | | | | | | | | | | | | From 2004 to 2005
| | | From 2003 to 2004
| | | | | (Restated)
| | | (Restated)
| | | | | Due to Change in(1)
| | | Net Change
| | | Due to Change in(1)
| | | Net Change
| | | (Dollars in millions) | | Volume
| | | Rate
| | | | Volume
| | | Rate
| | | Increase (decrease) in interest income | | | | | | | | | | | | | | | | | | | | | | | | | Time deposits placed and other short-term investments | | $ | 1 | | | $ | 109 | | | $ | 110 | | | $ | 99 | | | $ | 91 | | | $ | 190 | | Federal funds sold and securities purchased under agreements to resell | | | 597 | | | | 2,475 | | | | 3,072 | | | | 811 | | | | (137 | ) | | | 674 | | Trading account assets | | | 1,128 | | | | 663 | | | | 1,791 | | | | 305 | | | | (218 | ) | | | 87 | | Securities | | | 3,408 | | | | 319 | | | | 3,727 | | | | 3,533 | | | | 652 | | | | 4,185 | | Loans and leases: | | | | | | | | | | | | | | | | | | | | | | | | | Residential mortgage | | | 362 | | | | 6 | | | | 368 | | | | 2,176 | | | | 7 | | | | 2,183 | | Credit card | | | 1,130 | | | | 470 | | | | 1,600 | | | | 1,557 | | | | 210 | | | | 1,767 | | Home equity lines | | | 788 | | | | 789 | | | | 1,577 | | | | 753 | | | | 42 | | | | 795 | | Direct/Indirect consumer | | | 381 | | | | 115 | | | | 496 | | | | 332 | | | | (203 | ) | | | 129 | | Other consumer | | | (62 | ) | | | 135 | | | | 73 | | | | (76 | ) | | | 82 | | | | 6 | | | | |
|
|
| |
|
|
| |
|
|
| |
|
|
| |
|
|
| |
|
|
| Total consumer | | | | | | | | | | | 4,114 | | | | | | | | | | | | 4,880 | | | | | | | | | | | | |
|
|
| | | | | | | | | |
|
|
| Commercial—domestic | | | 819 | | | | 469 | | | | 1,288 | | | | 1,458 | | | | (921 | ) | | | 537 | | Commercial real estate | | | 281 | | | | 502 | | | | 783 | | | | 346 | | | | 55 | | | | 401 | | Commercial lease financing | | | 138 | | | | 35 | | | | 173 | | | | 290 | | | | 134 | | | | 424 | | Commercial—foreign | | | 102 | | | | 340 | | | | 442 | | | | 126 | | | | 264 | | | | 390 | | | | |
|
|
| |
|
|
| |
|
|
| |
|
|
| |
|
|
| |
|
|
| Total commercial | | | | | | | | | | | 2,686 | | | | | | | | | | | | 1,752 | | | | | | | | | | | | |
|
|
| | | | | | | | | |
|
|
| Total loans and leases | | | | | | | | | | | 6,800 | | | | | | | | | | | | 6,632 | | | | | | | | | | | | |
|
|
| | | | | | | | | |
|
|
| Other earning assets | | | 177 | | | | 111 | | | | 288 | | | | (136 | ) | | | 222 | | | | 86 | | | | |
|
|
| |
|
|
| |
|
|
| |
|
|
| |
|
|
| |
|
|
| Total interest income | | | | | | | | | | $ | 15,788 | | | | | | | | | | | $ | 11,854 | | | | | | | | | | | | |
|
|
| | | | | | | | | |
|
|
| Increase (decrease) in interest expense | | | | | | | | | | | | | | | | | | | | | | | | | Domestic interest-bearing deposits: | | | | | | | | | | | | | | | | | | | | | | | | | Savings | | $ | 9 | | | $ | 83 | | | $ | 92 | | | $ | 41 | | | $ | (30 | ) | | $ | 11 | | NOW and money market deposit accounts | | | 128 | | | | 790 | | | | 918 | | | | 545 | | | | 140 | | | | 685 | | Consumer CDs and IRAs | | | 781 | | | | 770 | | | | 1,551 | | | | 894 | | | | (910 | ) | | | (16 | ) | Negotiable CDs, public funds and other time deposits | | | 43 | | | | (83 | ) | | | (40 | ) | | | (28 | ) | | | 188 | | | | 160 | | | | |
|
|
| |
|
|
| |
|
|
| |
|
|
| |
|
|
| |
|
|
| Total domestic interest-bearing deposits | | | | | | | | | | | 2,521 | | | | | | | | | | | | 840 | | | | | | | | | | | | |
|
|
| | | | | | | | | |
|
|
| Foreign interest-bearing deposits: | | | | | | | | | | | | | | | | | | | | | | | | | Banks located in foreign countries | | | 165 | | | | 358 | | | | 523 | | | | 91 | | | | 303 | | | | 394 | | Governments and official institutions | | | 38 | | | | 103 | | | | 141 | | | | 44 | | | | 22 | | | | 66 | | Time, savings and other | | | 38 | | | | 348 | | | | 386 | | | | 100 | | | | (41 | ) | | | 59 | | | | |
|
|
| |
|
|
| |
|
|
| |
|
|
| |
|
|
| |
|
|
| Total foreign interest-bearing deposits | | | | | | | | | | | 1,050 | | | | | | | | | | | | 519 | | | | | | | | | | | | |
|
|
| | | | | | | | | |
|
|
| Total interest-bearing deposits | | | | | | | | | | | 3,571 | | | | | | | | | | | | 1,359 | | | | | | | | | | | | |
|
|
| | | | | | | | | |
|
|
| Federal funds purchased, securities sold under agreements to repurchase and other short-term borrowings | | | 1,771 | | | | 5,772 | | | | 7,543 | | | | 1,156 | | | | 1,045 | | | | 2,201 | | Trading account liabilities | | | 835 | | | | 212 | | | | 1,047 | | | | (64 | ) | | | 95 | | | | 31 | | Long-term debt | | | 216 | | | | 519 | | | | 735 | | | | 1,113 | | | | (378 | ) | | | 735 | | | | |
|
|
| |
|
|
| |
|
|
| |
|
|
| |
|
|
| |
|
|
| Total interest expense | | | | | | | | | | | 12,896 | | | | | | | | | | | | 4,326 | | | | | | | | | | | | |
|
|
| | | | | | | | | |
|
|
| Net increase in net interest income | | | | | | | | | | $ | 2,892 | | | | | | | | | | | $ | 7,528 | | | | | | | | | | | | |
|
|
| | | | | | | | | |
|
|
|
| (1) | | The changes for each category of interest income and expense are divided between the portion of change attributable to the variance in volume or rate for that category. The unallocated change in rate or volume variance has been allocated between the rate and volume variances. |
Table III
Selected Loan Maturity Data(1)
| | | | | | | | | | | | | | | | | | | | December 31, 2005
| | | (Dollars in millions) | | Due in
One Year
or Less
| | | Due After
One Year
Through
Five Years
| | | Due After
Five Years
| | | Total
| | Commercial—domestic | | $ | 52,186 | | | $ | 56,557 | | | $ | 31,790 | | | $ | 140,533 | | Commercial real estate—domestic | | | 13,830 | | | | 17,976 | | | | 3,375 | | | | 35,181 | | Foreign(2) | | | 20,801 | | | | 4,518 | | | | 437 | | | | 25,756 | | | | |
|
|
| |
|
|
| |
|
|
| |
|
|
| Total selected loans | | $ | 86,817 | | | $ | 79,051 | | | $ | 35,602 | | | $ | 201,470 | | | | |
|
|
| |
|
|
| |
|
|
| |
|
|
| Percent of total | | | 43.1 | % | | | 39.2 | % | | | 17.7 | % | | | 100.0 | % | | | |
|
|
| |
|
|
| |
|
|
| |
|
|
| Sensitivity of loans to changes in interest rates for loans due after one year: | | | | | | | | | | | | | | | | | Fixed interest rates | | | | | | $ | 8,927 | | | $ | 14,737 | | | | | | Floating or adjustable interest rates | | | | | | | 70,124 | | | | 20,865 | | | | | | | | | | | | |
|
|
| |
|
|
| | | | | Total | | | | | | $ | 79,051 | | | $ | 35,602 | | | | | | | | | | | | |
|
|
| |
|
|
| | | | |
(1) | | Loan maturities are based on the remaining maturities under contractual terms. |
(2) | | Loan maturities include other consumer, commercial—foreign and commercial real estate loans. |
Table IV
Short-term Borrowings
| | | | | | | | | | | | | | | | | | | | | | 2005
| | | 2004
| | | 2003
| | | | | | | | (Restated)
| | | (Restated)
| | | (Dollars in millions) | | Amount
| | Rate
| | | Amount
| | Rate
| | | Amount
| | Rate
| | Federal funds purchased | | | | | | | | | | | | | | | | | | | At December 31 | | $ | 2,715 | | 4.06 | % | | $ | 3,108 | | 2.23 | % | | $ | 2,356 | | 0.92 | % | Average during year | | | 3,670 | | 3.09 | | | | 3,724 | | 1.31 | | | | 5,736 | | 1.10 | | Maximum month-end balance during year | | | 5,964 | | — | | | | 7,852 | | — | | | | 7,877 | | — | | | | | | | | | Securities sold under agreements to repurchase | | | | | | | | | | | | | | | | | | | At December 31 | | | 237,940 | | 4.26 | | | | 116,633 | | 2.23 | | | | 75,690 | | 1.12 | | Average during year | | | 227,081 | | 3.62 | | | | 161,494 | | 1.86 | | | | 102,074 | | 1.15 | | Maximum month-end balance during year | | | 273,544 | | — | | | | 191,899 | | — | | | | 124,746 | | — | | | | | | | | | Commercial paper | | | | | | | | | | | | | | | | | | | At December 31 | | | 24,968 | | 4.21 | | | | 25,379 | | 2.09 | | | | 7,605 | | 1.09 | | Average during year | | | 26,335 | | 3.22 | | | | 21,178 | | 1.45 | | | | 2,976 | | 1.29 | | Maximum month-end balance during year | | | 31,380 | | — | | | | 26,486 | | — | | | | 9,136 | | — | | | | | | | | | Other short-term borrowings | | | | | | | | | | | | | | | | | | | At December 31 | | | 91,301 | | 4.58 | | | | 53,219 | | 2.48 | | | | 27,375 | | 1.98 | | Average during year | | | 69,322 | | 3.51 | | | | 41,169 | | 1.73 | | | | 29,672 | | 2.02 | | Maximum month-end balance during year | | | 91,301 | | — | | | | 53,756 | | — | | | | 46,635 | | — | |
Table V
Non-exchange Traded Commodity Contracts
| | | | | | | | | | (Dollars in millions) | | Asset
Positions
| | | Liability
Positions
| | Net fair value of contracts outstanding, January 1, 2005 | | $ | 2,195 | | | $ | 1,452 | | Effects of legally enforceable master netting agreements | | | 4,449 | | | | 4,449 | | | | |
|
|
| |
|
|
| Gross fair value of contracts outstanding, January 1, 2005 | | | 6,644 | | | | 5,901 | | Contracts realized or otherwise settled | | | (1,990 | ) | | | (1,947 | ) | Fair value of new contracts | | | 1,763 | | | | 1,887 | | Other changes in fair value | | | 2,240 | | | | 2,074 | | | | |
|
|
| |
|
|
| Gross fair value of contracts outstanding, December 31, 2005 | | | 8,657 | | | | 7,915 | | Effects of legally enforceable master netting agreements | | | (5,636 | ) | | | (5,636 | ) | | | |
|
|
| |
|
|
| Net fair value of contracts outstanding, December 31, 2005 | | $ | 3,021 | | | $ | 2,279 | | | | |
|
|
| |
|
|
|
Table VI
Non-exchange Traded Commodity Contract Maturities
| | | | | | | | | | | | December 31, 2005
| | | (Dollars in millions) | | Asset
Positions
| | | Liability
Positions
| | Maturity of less than 1 year | | $ | 4,295 | | | $ | 4,190 | | Maturity of 1-3 years | | | 3,798 | | | | 3,196 | | Maturity of 4-5 years | | | 373 | | | | 441 | | Maturity in excess of 5 years | | | 191 | | | | 88 | | | | |
|
|
| |
|
|
| Gross fair value of contracts | | | 8,657 | | | | 7,915 | | Effects of legally enforceable master netting agreements | | | (5,636 | ) | | | (5,636 | ) | | | |
|
|
| |
|
|
| Net fair value of contracts outstanding | | $ | 3,021 | | | $ | 2,279 | | | | |
|
|
| |
|
|
|
Table VII
Selected Quarterly Financial Data
| | | | | | | | | | | | | | | | | | | | | | | | | | | | | | | | | | | | 2005 Quarters
| | | 2004 Quarters
| | (Dollars in millions, except per
share information) | | Fourth(2)
| | | Third
(Restated)
| | | Second
(Restated)
| | | First
(Restated)
| | | Fourth
(Restated)
| | | Third
(Restated)
| | | Second
(Restated)
| | | First
(Restated)
| | Income statement | | | | | | | | | | | | | | | | | | | | | | | | | | | | | | | | | Net interest income | | $ | 7,859 | | | $ | 7,735 | | | $ | 7,637 | | | $ | 7,506 | | | $ | 7,550 | | | $ | 7,515 | | | $ | 7,366 | | | $ | 5,529 | | Noninterest income | | | 5,951 | | | | 6,416 | | | | 6,955 | | | | 6,032 | | | | 6,174 | | | | 6,012 | | | | 4,870 | | | | 3,949 | | Total revenue | | | 13,810 | | | | 14,151 | | | | 14,592 | | | | 13,538 | | | | 13,724 | | | | 13,527 | | | | 12,236 | | | | 9,478 | | Provision for credit losses | | | 1,400 | | | | 1,159 | | | | 875 | | | | 580 | | | | 706 | | | | 650 | | | | 789 | | | | 624 | | Gains on sales of debt securities | | | 71 | | | | 29 | | | | 325 | | | | 659 | | | | 101 | | | | 333 | | | | 795 | | | | 495 | | Noninterest expense | | | 7,320 | | | | 7,285 | | | | 7,019 | | | | 7,057 | | | | 7,333 | | | | 7,021 | | | | 7,228 | | | | 5,430 | | Income before income taxes | | | 5,161 | | | | 5,736 | | | | 7,023 | | | | 6,560 | | | | 5,786 | | | | 6,189 | | | | 5,014 | | | | 3,919 | | Income tax expense | | | 1,587 | | | | 1,895 | | | | 2,366 | | | | 2,167 | | | | 1,931 | | | | 2,086 | | | | 1,673 | | | | 1,271 | | Net income | | | 3,574 | | | | 3,841 | | | | 4,657 | | | | 4,393 | | | | 3,855 | | | | 4,103 | | | | 3,341 | | | | 2,648 | | Average common shares issued and outstanding (in thousands) | | | 3,996,024 | | | | 4,000,573 | | | | 4,005,356 | | | | 4,032,550 | | | | 4,032,979 | | | | 4,052,304 | | | | 4,062,384 | | | | 2,880,306 | | Average diluted common shares issued and outstanding (in thousands) | | | 4,053,859 | | | | 4,054,659 | | | | 4,065,355 | | | | 4,099,062 | | | | 4,106,040 | | | | 4,121,375 | | | | 4,131,290 | | | | 2,933,402 | | | | |
|
|
| |
|
|
| |
|
|
| |
|
|
| |
|
|
| |
|
|
| |
|
|
| |
|
|
| Performance ratios | | | | | | | | | | | | | | | | | | | | | | | | | | | | | | | | | Return on average assets | | | 1.09 | % | | | 1.18 | % | | | 1.46 | % | | | 1.49 | % | | | 1.33 | % | | | 1.49 | % | | | 1.23 | % | | | 1.28 | % | Return on average common shareholders’ equity | | | 14.21 | | | | 15.09 | | | | 18.93 | | | | 17.97 | | | | 15.57 | | | | 16.94 | | | | 14.26 | | | | 21.58 | | Return on average tangible common shareholders’ equity(1) | | | 29.29 | | | | 30.71 | | | | 39.27 | | | | 37.34 | | | | 32.95 | | | | 35.84 | | | | 31.36 | | | | 29.37 | | Total ending equity to total ending assets | | | 7.86 | | | | 8.12 | | | | 8.13 | | | | 8.16 | | | | 9.03 | | | | 9.19 | | | | 9.37 | | | | 6.23 | | Total average equity to total average assets | | | 7.64 | | | | 7.80 | | | | 7.72 | | | | 8.25 | | | | 8.54 | | | | 8.78 | | | | 8.59 | | | | 5.92 | | Dividend payout | | | 56.24 | | | | 52.60 | | | | 38.90 | | | | 41.71 | | | | 47.36 | | | | 44.72 | | | | 49.10 | | | | 43.74 | | | | |
|
|
| |
|
|
| |
|
|
| |
|
|
| |
|
|
| |
|
|
| |
|
|
| |
|
|
| Per common share data | | | | | | | | | | | | | | | | | | | | | | | | | | | | | | | | | Earnings | | $ | 0.89 | | | $ | 0.96 | | | $ | 1.16 | | | $ | 1.09 | | | $ | 0.95 | | | $ | 1.01 | | | $ | 0.82 | | | $ | 0.92 | | Diluted earnings | | | 0.88 | | | | 0.95 | | | | 1.14 | | | | 1.07 | | | | 0.94 | | | | 0.99 | | | | 0.81 | | | | 0.90 | | Dividends paid | | | 0.50 | | | | 0.50 | | | | 0.45 | | | | 0.45 | | | | 0.45 | | | | 0.45 | | | | 0.40 | | | | 0.40 | | Book value | | | 25.32 | | | | 25.28 | | | | 25.16 | | | | 24.45 | | | | 24.70 | | | | 24.29 | | | | 23.54 | | | | 17.23 | | | | |
|
|
| |
|
|
| |
|
|
| |
|
|
| |
|
|
| |
|
|
| |
|
|
| |
|
|
| Average balance sheet | | | | | | | | | | | | | | | | | | | | | | | | | | | | | | | | | Total loans and leases | | $ | 563,589 | | | $ | 539,497 | | | $ | 520,415 | | | $ | 524,921 | | | $ | 515,437 | | | $ | 503,049 | | | $ | 497,129 | | | $ | 374,047 | | Total assets | | | 1,305,057 | | | | 1,294,754 | | | | 1,277,478 | | | | 1,200,859 | | | | 1,152,524 | | | | 1,096,653 | | | | 1,094,427 | | | | 833,161 | | Total deposits | | | 628,922 | | | | 632,771 | | | | 640,593 | | | | 627,420 | | | | 609,936 | | | | 587,879 | | | | 582,305 | | | | 425,075 | | Long-term debt | | | 99,601 | | | | 98,326 | | | | 96,697 | | | | 96,167 | | | | 98,556 | | | | 98,116 | | | | 94,655 | | | | 77,751 | | Common shareholders’ equity | | | 99,677 | | | | 100,974 | | | | 98,558 | | | | 99,130 | | | | 98,452 | | | | 96,268 | | | | 94,024 | | | | 49,314 | | Total shareholders’ equity | | | 99,948 | | | | 101,246 | | | | 98,829 | | | | 99,401 | | | | 98,723 | | | | 96,540 | | | | 94,347 | | | | 49,368 | | | | |
|
|
| |
|
|
| |
|
|
| |
|
|
| |
|
|
| |
|
|
| |
|
|
| |
|
|
| Capital ratios (period end) | | | | | | | | | | | | | | | | | | | | | | | | | | | | | | | | | Risk-based capital: | | | | | | | | | | | | | | | | | | | | | | | | | | | | | | | | | Tier 1 | | | 8.25 | % | | | 8.27 | % | | | 8.16 | % | | | 8.26 | % | | | 8.20 | % | | | 8.18 | % | | | 8.26 | % | | | 7.89 | % | Total | | | 11.08 | | | | 11.19 | | | | 11.23 | | | | 11.52 | | | | 11.73 | | | | 11.81 | | | | 12.02 | | | | 11.62 | | Leverage | | | 5.91 | | | | 5.90 | | | | 5.66 | | | | 5.86 | | | | 5.89 | | | | 6.00 | | | | 5.87 | | | | 5.55 | | | | |
|
|
| |
|
|
| |
|
|
| |
|
|
| |
|
|
| |
|
|
| |
|
|
| |
|
|
| Market price per share of common stock | | | | | | | | | | | | | | | | | | | | | | | | | | | | | | | | | Closing | | $ | 46.15 | | | $ | 42.10 | | | $ | 45.61 | | | $ | 44.10 | | | $ | 46.99 | | | $ | 43.33 | | | $ | 42.31 | | | $ | 40.49 | | High closing | | | 46.99 | | | | 45.98 | | | | 47.08 | | | | 47.08 | | | | 47.44 | | | | 44.98 | | | | 42.72 | | | | 41.38 | | Low closing | | | 41.57 | | | | 41.60 | | | | 44.01 | | | | 43.66 | | | | 43.62 | | | | 41.81 | | | | 38.96 | | | | 39.15 | | | | |
|
|
| |
|
|
| |
|
|
| |
|
|
| |
|
|
| |
|
|
| |
|
|
| |
|
|
|
(1) | | Return on average tangible common shareholders’ equity equals net income available to common shareholders plus amortization of intangibles, divided by average common shareholders’ equity less goodwill, core deposit intangibles and other intangibles. |
(2) | | The Corporation provided unaudited financial information relating to the fourth quarter of 2005 in the current report on Form 8-K filed on January 23, 2006. |
Table VIII
Quarterly Average Balances and Interest Rates—FTE Basis
| | | | | | | | | | | | | | | | | | | | | | Fourth Quarter 2005(5)
| | | Third Quarter 2005 (Restated)
| | | (Dollars in millions) | | Average
Balance
| | Interest
Income/
Expense
| | Yield/
Rate
| | | Average
Balance
| | Interest
Income/
Expense
| | Yield/
Rate
| | Earning assets | | | | | | | | | | | | | | | | | | | Time deposits placed and other short-term investments | | $ | 14,619 | | $ | 132 | | 3.59 | % | | $ | 14,498 | | $ | 125 | | 3.43 | % | Federal funds sold and securities purchased under agreements to resell | | | 165,908 | | | 1,477 | | 3.55 | | | | 176,650 | | | 1,382 | | 3.12 | | Trading account assets | | | 139,441 | | | 1,648 | | 4.72 | | | | 142,287 | | | 1,578 | | 4.42 | | Securities | | | 221,411 | | | 2,842 | | 5.13 | | | | 225,952 | | | 2,820 | | 4.99 | | Loans and leases(1): | | | | | | | | | | | | | | | | | | | Residential mortgage | | | 178,764 | | | 2,424 | | 5.42 | | | | 171,012 | | | 2,298 | | 5.37 | | Credit card | | | 56,858 | | | 1,747 | | 12.19 | | | | 55,271 | | | 1,651 | | 11.85 | | Home equity lines | | | 60,571 | | | 1,012 | | 6.63 | | | | 58,046 | | | 910 | | 6.22 | | Direct/Indirect consumer | | | 47,181 | | | 703 | | 5.91 | | | | 47,900 | | | 702 | | 5.81 | | Other consumer(2) | | | 6,653 | | | 184 | | 11.01 | | | | 6,715 | | | 170 | | 10.05 | | | | |
|
| |
|
| | | | |
|
| |
|
| | | | Total consumer | | | 350,027 | | | 6,070 | | 6.90 | | | | 338,944 | | | 5,731 | | 6.73 | | | | |
|
| |
|
| | | | |
|
| |
|
| | | | Commercial—domestic | | | 137,224 | | | 2,280 | | 6.59 | | | | 127,044 | | | 2,095 | | 6.54 | | Commercial real estate | | | 36,017 | | | 597 | | 6.58 | | | | 34,663 | | | 542 | | 6.20 | | Commercial lease financing | | | 20,178 | | | 241 | | 4.79 | | | | 20,402 | | | 239 | | 4.69 | | Commercial—foreign | | | 20,143 | | | 378 | | 7.45 | | | | 18,444 | | | 349 | | 7.51 | | | | |
|
| |
|
| | | | |
|
| |
|
| | | | Total commercial | | | 213,562 | | | 3,496 | | 6.50 | | | | 200,553 | | | 3,225 | | 6.38 | | | | |
|
| |
|
| | | | |
|
| |
|
| | | | Total loans and leases | | | 563,589 | | | 9,566 | | 6.75 | | | | 539,497 | | | 8,956 | | 6.60 | | | | |
|
| |
|
| | | | |
|
| |
|
| | | | Other earning assets | | | 40,582 | | | 596 | | 5.83 | | | | 38,745 | | | 542 | | 5.57 | | | | |
|
| |
|
| | | | |
|
| |
|
| | | | Total earning assets(3) | | | 1,145,550 | | | 16,261 | | 5.65 | | | | 1,137,629 | | | 15,403 | | 5.39 | | | | |
|
| |
|
| | | | |
|
| |
|
| | | | Cash and cash equivalents | | | 33,693 | | | | | | | | | 32,969 | | | | | | | Other assets, less allowance for loan and lease losses | | | 125,814 | | | | | | | | | 124,156 | | | | | | | | | |
|
| | | | | | | |
|
| | | | | | | Total assets | | $ | 1,305,057 | | | | | | | | $ | 1,294,754 | | | | | | | | | |
|
| | | | | | | |
|
| | | | | | | Interest-bearing liabilities | | | | | | | | | | | | | | | | | | | Domestic interest-bearing deposits: | | | | | | | | | | | | | | | | | | | Savings | | $ | 35,535 | | $ | 68 | | 0.76 | % | | $ | 35,853 | | $ | 56 | | 0.62 | % | NOW and money market deposit accounts | | | 224,122 | | | 721 | | 1.28 | | | | 224,341 | | | 743 | | 1.31 | | Consumer CDs and IRAs | | | 120,321 | | | 1,029 | | 3.39 | | | | 130,975 | | | 1,094 | | 3.31 | | Negotiable CDs, public funds and other time deposits | | | 5,085 | | | 27 | | 2.13 | | | | 4,414 | | | 47 | | 4.23 | | | | |
|
| |
|
| | | | |
|
| |
|
| | | | Total domestic interest-bearing deposits | | | 385,063 | | | 1,845 | | 1.90 | | | | 395,583 | | | 1,940 | | 1.95 | | | | |
|
| |
|
| | | | |
|
| |
|
| | | | Foreign interest-bearing deposits(4): | | | | | | | | | | | | | | | | | | | Banks located in foreign countries | | | 24,451 | | | 355 | | 5.77 | | | | 19,707 | | | 292 | | 5.89 | | Governments and official institutions | | | 7,579 | | | 73 | | 3.84 | | | | 7,317 | | | 62 | | 3.37 | | Time, savings and other | | | 32,624 | | | 203 | | 2.46 | | | | 32,024 | | | 177 | | 2.19 | | | | |
|
| |
|
| | | | |
|
| |
|
| | | | Total foreign interest-bearing deposits | | | 64,654 | | | 631 | | 3.87 | | | | 59,048 | | | 531 | | 3.57 | | | | |
|
| |
|
| | | | |
|
| |
|
| | | | Total interest-bearing deposits | | | 449,717 | | | 2,476 | | 2.18 | | | | 454,631 | | | 2,471 | | 2.16 | | | | |
|
| |
|
| | | | |
|
| |
|
| | | | Federal funds purchased, securities sold under agreements to repurchase and other short-term borrowings | | | 364,140 | | | 3,855 | | 4.20 | | | | 339,980 | | | 3,190 | | 3.72 | | Trading account liabilities | | | 56,880 | | | 619 | | 4.32 | | | | 68,132 | | | 707 | | 4.12 | | Long-term debt | | | 99,601 | | | 1,209 | | 4.85 | | | | 98,326 | | | 1,102 | | 4.48 | | | | |
|
| |
|
| | | | |
|
| |
|
| | | | Total interest-bearing liabilities(3) | | | 970,338 | | | 8,159 | | 3.34 | | | | 961,069 | | | 7,470 | | 3.09 | | | | |
|
| |
|
| | | | |
|
| |
|
| | | | Noninterest-bearing sources: | | | | | | | | | | | | | | | | | | | Noninterest-bearing deposits | | | 179,205 | | | | | | | | | 178,140 | | | | | | | Other liabilities | | | 55,566 | | | | | | | | | 54,299 | | | | | | | Shareholders’ equity | | | 99,948 | | | | | | | | | 101,246 | | | | | | | | | |
|
| | | | | | | |
|
| | | | | | | Total liabilities and shareholders’ equity | | $ | 1,305,057 | | | | | | | | $ | 1,294,754 | | | | | | | | | |
|
| | | | | | | |
|
| | | | | | | Net interest spread | | | | | | | | 2.31 | | | | | | | | | 2.30 | | Impact of noninterest-bearing sources | | | | | | | | 0.51 | | | | | | | | | 0.48 | | | | | | | |
|
| |
|
| | | | |
|
| |
|
| Net interest income/yield on earning assets | | | | | $ | 8,102 | | 2.82 | % | | | | | $ | 7,933 | | 2.78 | % | | | | | | |
|
| |
|
| | | | |
|
| |
|
|
(1) | | Nonperforming loans are included in the respective average loan balances. Income on these nonperforming loans is recognized on a cash basis. |
(2) | | Includes consumer finance of $2,916 million, $3,063 million, $3,212 million and $3,362 million in the fourth, third, second and first quarters of 2005, respectively, and $3,473 million in the fourth quarter of 2004; foreign consumer of $3,682 million, $3,541 million, $3,505 million and $3,532 million in the fourth, third, second and first quarters of 2005, respectively, and $3,523 million in the fourth quarter of 2004; and consumer lease financing of $55 million, $111 million, $251 million and $411 million in the fourth, third, second and first quarters of 2005, respectively, and $561 million in the fourth quarter of 2004. |
| | | | | | | | | | | | | | | | | | | | | | | | | | | | | | | Second Quarter 2005 (Restated)
| | | First Quarter 2005 (Restated)
| | | Fourth Quarter 2004 (Restated)
| | | (Dollars in millions) | | Average
Balance
| | Interest
Income/
Expense
| | Yield/
Rate
| | | Interest
Average
Balance
| | Income/
Expense
| | Yield/
Rate
| | | Average
Balance
| | Interest
Income/
Expense
| | Yield/
Rate
| | Earning assets | | | | | | | | | | | | | | | | | | | | | | | | | | | | Time deposits placed and other short-term investments | | $ | 13,696 | | $ | 113 | | 3.31 | % | | $ | 14,327 | | $ | 101 | | 2.87 | % | | $ | 15,620 | | $ | 128 | | 3.24 | % | Federal funds sold and securities purchased under agreements to resell | | | 185,835 | | | 1,249 | | 2.69 | | | | 147,855 | | | 904 | | 2.46 | | | | 149,226 | | | 699 | | 1.87 | | Trading account assets | | | 134,196 | | | 1,454 | | 4.34 | | | | 117,748 | | | 1,203 | | 4.10 | | | | 110,585 | | | 1,067 | | 3.85 | | Securities | | | 227,182 | | | 2,825 | | 4.98 | | | | 204,574 | | | 2,559 | | 5.01 | | | | 171,173 | | | 2,082 | | 4.86 | | Loans and leases(1): | | | | | | | | | | | | | | | | | | | | | | | | | | | | Residential mortgage | | | 167,263 | | | 2,285 | | 5.47 | | | | 178,075 | | | 2,415 | | 5.44 | | | | 178,853 | | | 2,447 | | 5.46 | | Credit card | | | 52,474 | | | 1,481 | | 11.32 | | | | 51,310 | | | 1,373 | | 10.85 | | | | 49,366 | | | 1,351 | | 10.88 | | Home equity lines | | | 54,941 | | | 799 | | 5.83 | | | | 51,477 | | | 692 | | 5.45 | | | | 48,336 | | | 609 | | 5.01 | | Direct/Indirect consumer | | | 43,132 | | | 612 | | 5.69 | | | | 41,620 | | | 573 | | 5.58 | | | | 39,526 | | | 551 | | 5.55 | | Other consumer(2) | | | 6,968 | | | 155 | | 8.96 | | | | 7,305 | | | 158 | | 8.75 | | | | 7,557 | | | 153 | | 8.07 | | | | |
|
| |
|
| | | | |
|
| |
|
| | | | |
|
| |
|
| | | | Total consumer | | | 324,778 | | | 5,332 | | 6.58 | | | | 329,787 | | | 5,211 | | 6.38 | | | | 323,638 | | | 5,111 | | 6.29 | | | | |
|
| |
|
| | | | |
|
| |
|
| | | | |
|
| |
|
| | | | Commercial—domestic | | | 123,927 | | | 1,938 | | 6.27 | | | | 123,803 | | | 1,954 | | 6.40 | | | | 121,412 | | | 1,883 | | 6.17 | | Commercial real estate | | | 33,484 | | | 477 | | 5.72 | | | | 33,016 | | | 430 | | 5.29 | | | | 31,355 | | | 392 | | 4.98 | | Commercial lease financing | | | 20,446 | | | 252 | | 4.93 | | | | 20,745 | | | 260 | | 5.01 | | | | 20,204 | | | 254 | | 5.01 | | Commercial—foreign | | | 17,780 | | | 306 | | 6.90 | | | | 17,570 | | | 259 | | 5.97 | | | | 18,828 | | | 272 | | 5.76 | | | | |
|
| |
|
| | | | |
|
| |
|
| | | | |
|
| |
|
| | | | Total commercial | | | 195,637 | | | 2,973 | | 6.09 | | | | 195,134 | | | 2,903 | | 6.03 | | | | 191,799 | | | 2,801 | | 5.81 | | | | |
|
| |
|
| | | | |
|
| |
|
| | | | |
|
| |
|
| | | | Total loans and leases | | | 520,415 | | | 8,305 | | 6.40 | | | | 524,921 | | | 8,114 | | 6.25 | | | | 515,437 | | | 7,912 | | 6.12 | | | | |
|
| |
|
| | | | |
|
| |
|
| | | | |
|
| |
|
| | | | Other earning assets | | | 37,194 | | | 512 | | 5.52 | | | | 35,466 | | | 455 | | 5.19 | | | | 35,937 | | | 457 | | 5.08 | | | | |
|
| |
|
| | | | |
|
| |
|
| | | | |
|
| |
|
| | | | Total earning assets(3) | | | 1,118,518 | | | 14,458 | | 5.18 | | | | 1,044,891 | | | 13,336 | | 5.14 | | | | 997,978 | | | 12,345 | | 4.93 | | | | |
|
| |
|
| | | | |
|
| |
|
| | | | |
|
| |
|
| | | | Cash and cash equivalents | | | 34,731 | | | | | | | | | 31,382 | | | | | | | | | 31,028 | | | | | | | Other assets, less allowance for loan and lease losses | | | 124,229 | | | | | | | | | 124,586 | | | | | | | | | 123,518 | | | | | | | | | |
|
| | | | | | | |
|
| | | | | | | |
|
| | | | | | | Total assets | | $ | 1,277,478 | | | | | | | | $ | 1,200,859 | | | | | | | | $ | 1,152,524 | | | | | | | | | |
|
| | | | | | | |
|
| | | | | | | |
|
| | | | | | | Interest-bearing liabilities | | | | | | | | | | | | | | | | | | | | | | | | | | | | Domestic interest-bearing deposits: | | | | | | | | | | | | | | | | | | | | | | | | | | | | Savings | | $ | 38,043 | | $ | 52 | | 0.54 | % | | $ | 37,000 | | $ | 35 | | 0.39 | % | | $ | 36,927 | | $ | 36 | | 0.39 | % | NOW and money market deposit accounts | | | 229,174 | | | 723 | | 1.27 | | | | 233,392 | | | 651 | | 1.13 | | | | 234,596 | | | 589 | | 1.00 | | Consumer CDs and IRAs | | | 127,169 | | | 1,004 | | 3.17 | | | | 118,989 | | | 965 | | 3.29 | | | | 109,243 | | | 721 | | 2.63 | | Negotiable CDs, public funds and other time deposits | | | 7,751 | | | 82 | | 4.22 | | | | 10,291 | | | 95 | | 3.73 | | | | 7,563 | | | 81 | | 4.27 | | | | |
|
| |
|
| | | | |
|
| |
|
| | | | |
|
| |
|
| | | | Total domestic interest-bearing deposits | | | 402,137 | | | 1,861 | | 1.86 | | | | 399,672 | | | 1,746 | | 1.77 | | | | 388,329 | | | 1,427 | | 1.46 | | | | |
|
| |
|
| | | | |
|
| |
|
| | | | |
|
| |
|
| | | | Foreign interest-bearing deposits(4): | | | | | | | | | | | | | | | | | | | | | | | | | | | | Banks located in foreign countries | | | 25,546 | | | 294 | | 4.61 | | | | 22,085 | | | 260 | | 4.77 | | | | 17,953 | | | 200 | | 4.43 | | Governments and official institutions | | | 7,936 | | | 59 | | 2.97 | | | | 6,831 | | | 43 | | 2.58 | | | | 5,843 | | | 33 | | 2.21 | | Time, savings and other | | | 30,973 | | | 149 | | 1.94 | | | | 30,770 | | | 133 | | 1.75 | | | | 30,459 | | | 104 | | 1.36 | | | | |
|
| |
|
| | | | |
|
| |
|
| | | | |
|
| |
|
| | | | Total foreign interest-bearing deposits | | | 64,455 | | | 502 | | 3.13 | | | | 59,686 | | | 436 | | 2.96 | | | | 54,255 | | | 337 | | 2.47 | | | | |
|
| |
|
| | | | |
|
| |
|
| | | | |
|
| |
|
| | | | Total interest-bearing deposits | | | 466,592 | | | 2,363 | | 2.03 | | | | 459,358 | | | 2,182 | | 1.93 | | | | 442,584 | | | 1,764 | | 1.59 | | | | |
|
| |
|
| | | | |
|
| |
|
| | | | |
|
| |
|
| | | | Federal funds purchased, securities sold under agreements to repurchase and other short-term borrowings | | | 323,916 | | | 2,582 | | 3.20 | | | | 276,483 | | | 1,988 | | 2.91 | | | | 252,413 | | | 1,452 | | 2.29 | | Trading account liabilities | | | 60,987 | | | 611 | | 4.02 | | | | 44,507 | | | 427 | | 3.89 | | | | 37,387 | | | 352 | | 3.74 | | Long-term debt | | | 96,697 | | | 1,074 | | 4.45 | | | | 96,167 | | | 1,033 | | 4.30 | | | | 98,556 | | | 1,020 | | 4.14 | | | | |
|
| |
|
| | | | |
|
| |
|
| | | | |
|
| |
|
| | | | Total interest-bearing liabilities(3) | | | 948,192 | | | 6,630 | | 2.80 | | | | 876,515 | | | 5,630 | | 2.60 | | | | 830,940 | | | 4,588 | | 2.20 | | | | |
|
| |
|
| | | | |
|
| |
|
| | | | |
|
| |
|
| | | | Noninterest-bearing sources: | | | | | | | | | | | | | | | | | | | | | | | | | | | | Noninterest-bearing deposits | | | 174,001 | | | | | | | | | 168,062 | | | | | | | | | 167,352 | | | | | | | Other liabilities | | | 56,456 | | | | | | | | | 56,881 | | | | | | | | | 55,509 | | | | | | | Shareholders’ equity | | | 98,829 | | | | | | | | | 99,401 | | | | | | | | | 98,723 | | | | | | | | | |
|
| | | | | | | |
|
| | | | | | | |
|
| | | | | | | Total liabilities and shareholders’ equity | | $ | 1,277,478 | | | | | | | | $ | 1,200,859 | | | | | | | | $ | 1,152,524 | | | | | | | | | |
|
| | | | | | | |
|
| | | | | | | |
|
| | | | | | | Net interest spread | | | | | | | | 2.38 | | | | | | | | | 2.54 | | | | | | | | | 2.73 | | Impact of noninterest-bearing sources | | | | | | | | 0.42 | | | | | | | | | 0.42 | | | | | | | | | 0.37 | | | | | | | |
|
| |
|
| | | | |
|
| |
|
| | | | |
|
| |
|
| Net interest income/yield on earning assets | | | | | $ | 7,828 | | 2.80 | % | | | | | $ | 7,706 | | 2.96 | % | | | | | $ | 7,757 | | 3.10 | % | | | | | | |
|
| |
|
| | | | |
|
| |
|
| | | | |
|
| |
|
|
(3) | | Interest income includes the impact of interest rate risk management contracts, which increased interest income on the underlying assets $29 million, $86 million, $168 million and $421 million in the fourth, third, second and first quarters of 2005, respectively, and $439 million in the fourth quarter of 2004. Interest expense includes the impact of interest rate risk management contracts, which increased interest expense on the underlying liabilities $254 million, $274 million, $303 million and $504 million in the fourth, third, second and first quarters of 2005, respectively, and $295 million in the fourth quarter of 2004. For further information on interest rate contracts, see “Interest Rate Risk Management” beginning on page 69. |
(4) | | Primarily consists of time deposits in denominations of $100,000 or more. |
(5) | | The Corporation provided unaudited financial information relating to the fourth quarter of 2005 in its current report on Form 8-K filed on January 23, 2006. |
Item 7A. QUANTITATIVE AND QUALITATIVE DISCLOSURES ABOUT MARKET RISK See “Market Risk Management” in the MD&A beginning on page 65
|
See “Market Risk Management” in the MD&A beginning on page 72 which is incorporated herein by reference. | | Item 8. FINANCIAL STATEMENTS AND SUPPLEMENTARY DATA |
| | Report of Management on Internal Control Over Financial Reporting |
The management of Bank of America Corporation is responsible for establishing and maintaining adequate internal control over financial reporting. The Corporation’s internal control over financial reporting is a process designed to provide reasonable assurance regarding the reliability of financial reporting and the preparation of financial statements for external purposes in accordance with accounting principles generally accepted in the United States of America. The Corporation’s internal control over financial reporting includes those policies and procedures that (i) pertain to the maintenance of records that, in reasonable detail, accurately and fairly reflect the transactions and dispositions of the assets of the company; (ii) provide reasonable assurance that transactions are recorded as necessary to permit preparation of financial statements in accordance with accounting principles generally accepted in the United States of America, and that receipts and expenditures of the company are being made only in accordance with authorizations of management and directors of the company; and (iii) provide reasonable assurance regarding prevention or timely detection of unauthorized acquisition, use, or disposition of the company’s assets that could have a material effect on the financial statements. Because of its inherent limitations, internal control over financial reporting may not prevent or detect misstatements. Also, projections of any evaluation of effectiveness to future periods are subject to the risk that controls may become inadequate because of changes in conditions, or that the degree of compliance with the policies or procedures may deteriorate. Management assessed the effectiveness of the Corporation’s internal control over financial reporting as of December 31, 2006, based on the framework set forth by the Committee of Sponsoring Organizations of the Treadway Commission in Internal Control – Integrated Framework. Based on that assessment, management concluded that, as of December 31, 2006, the Corporation’s internal control over financial reporting is effective based on the criteria established in Internal Control – Integrated Framework. Management’s assessment of the effectiveness of the Corporation’s internal control over financial reporting as of December 31, 2006, has been audited by PricewaterhouseCoopers, LLP, an independent registered public accounting firm. | | | | | | | |  | | | |  | The management of Bank of America Corporation is responsible for establishingKenneth D. Lewis
Chairman, Chief Executive Officer and maintaining adequate internal control over financial reporting.President | | | | The Corporation’s internal control over financial reporting is a process designed to provide reasonable assurance regarding the reliability of financial reporting and the preparation of financial statements for external purposes in accordance with accounting principles generally accepted in the United States of America. The Corporation’s internal control over financial reporting includes those policies and procedures that (i) pertain to the maintenance of records that, in reasonable detail, accurately and fairly reflect the transactions and dispositions of the assets of the company; (ii) provide reasonable assurance that transactions are recorded as necessary to permit preparation of financial statements in accordance with accounting principles generally accepted in the United States of America, and that receipts and expenditures of the company are being made only in accordance with authorizations of management and directors of the company; and (iii) provide reasonable assurance regarding prevention or timely detection of unauthorized acquisition, use, or disposition of the company’s assets that could have a material effect on the financial statements.
Because of its inherent limitations, internal control over financial reporting may not prevent or detect misstatements. Also, projections of any evaluation of effectiveness to future periods are subject to the risk that controls may become inadequate because of changes in conditions, or that the degree of compliance with the policies or procedures may deteriorate.
Management assessed the effectiveness of the Corporation’s internal control over financial reporting as of December 31, 2005, based on the framework set forth by the Committee of Sponsoring Organizations of the Treadway Commission in Internal Control—Integrated Framework. Based on that assessment, management concluded that, as of December 31, 2005, the Corporation’s internal control over financial reporting is effective based on the criteria established in Internal Control—Integrated Framework.
Management’s assessment of the effectiveness of the Corporation’s internal control over financial reporting as of December 31, 2005, has been audited by PricewaterhouseCoopers, LLP, an independent registered public accounting firm, as stated in their report appearing on page 88.
| | |  | |  | Kenneth D. Lewis
Chairman, President and Chief Executive Officer
| | Alvaro G. de MolinaJoe L. Price
Chief Financial Officer |
| | Report of Independent Registered Public Accounting Firm To the Board of Directors and Shareholders of Bank of America Corporation:
We have completed integrated audits of Bank of America Corporation’s 2005 and 2004 Consolidated Financial Statements and of its internal control over financial reporting as of December 31, 2005, and an audit of its 2003 Consolidated Financial Statements in accordance with the standards of the Public Company Accounting Oversight Board (United States). Our opinions, based on our audits, are presented below.
Consolidated Financial Statements
In our opinion, the accompanying Consolidated Balance Sheet and the related Consolidated Statement of Income, Consolidated Statement of Changes in Shareholders’ Equity and Consolidated Statement of Cash Flows present
|
Tothe Board of Directors and Shareholders of Bank of America Corporation: We have completed integrated audits of Bank of America Corporation’s Consolidated Financial Statements and of its internal control over financial reporting as of December 31, 2006, in accordance with the standards of the Public Company Accounting Oversight Board (United States). Our opinions, based on our audits, are presented below. Consolidated Financial Statements In our opinion, the accompanying Consolidated Balance Sheet and the related Consolidated Statement of Income, Consolidated Statement of Changes in Shareholders’ Equity and Consolidated Statement of Cash Flowspresent fairly, in all material respects, the financial position of Bank of America Corporation and its subsidiaries at December 31, 2006 and 2005, and the results of theiroperations and their cash flows for each of the three years in the period ended December 31, 2006in conformity with accounting principles generally accepted in the United States of America. These Consolidated Financial Statements are the responsibility of the Corporation’s management. Our responsibility is to express an opinion on these Consolidated Financial Statements based on our audits. We conducted our audits of these Consolidated Financial Statements in accordance with the standards of the Public Company Accounting Oversight Board (United States). Those standards require that we plan and perform the audit to obtain reasonable assurance about whether the financial statements are free of material misstatement. An audit of financial statements includes examining, on a test basis, evidence supporting the amounts and disclosures in the financial statements, assessing the accounting principles used and significant estimates made by management, and evaluating the overall financial statement presentation. We believe that our audits provide a reasonable basis for our opinion. Internal control over financial reporting Also, in our opinion, management’s assessment, included in the Report of Management on Internal Control Over Financial Reporting, that the Corporation maintained effective internal control over financial reporting as of December 31, 2006 based on criteria established inInternal Control—Integrated Framework issued by the Committee of Sponsoring Organizations of the Treadway Commission (COSO), is fairly stated, in all material respects, based on those criteria. Furthermore, in our opinion, the Corporation maintained, in all material respects, effective internal control over financial reporting as of December 31, 2006, based on criteria established inInternal Control—Integrated Framework issued by the COSO. The Corporation’s management is responsible for maintaining effective internal control over financial reporting and for its assessment of the effectiveness of internal control over financial reporting. Our responsibility is to express opinions on management’s assessment and on the effectiveness of the Corporation’s internal control over financial reporting based on our audit. We conducted our audit of internal control over financial reporting in accordance with the standards of the Public Company Accounting Oversight Board (United States). Those standards require that we plan and perform the audit to obtain reasonable assurance about whether effective internal control over financial reporting was maintained in all material respects. An audit of internal control over financial reporting includes obtaining an understanding of internal control over financial reporting, evaluating management’s assessment, testing and evaluating the design and operating effectiveness of internal control, and performing such other procedures as we consider necessary in the circumstances. We believe that our audit provides a reasonable basis for our opinions. A company’s internal control over financial reporting is a process designed to provide reasonable assurance regarding the reliability of financial reporting and the preparation of financial statements for external purposes in accordance with generally accepted accounting principles. A company’s internal control over financial reporting includes those policies and procedures that (i) pertain to the maintenance of records that, in reasonable detail, accurately and fairly reflect the transactions and dispositions of the assets of the company; (ii) provide reasonable assurance that transactions are recorded as necessary to permit preparation of financial statements in accordance with generally accepted accounting principles, and that receipts and expenditures of the company are being made only in accordance with authorizations of management and directors of the company; and (iii) provide reasonable assurance regarding prevention or timely detection of unauthorized acquisition, use, or disposition of the company’s assets that could have a material effect on the financial statements. Because of its inherent limitations, internal control over financial reporting may not prevent or detect misstatements. Also, projections of any evaluation of effectiveness to future periods are subject to the risk that controls may become inadequate because of changes in conditions, or that the degree of compliance with the policies or procedures may deteriorate. 
Charlotte, North Carolina February 22, 2007 | Bank of America Corporation and its subsidiaries at December 31, 2005 and 2004, and the results of their operations and their cash flows for each of the three years in the period ended December 31, 2005 in conformity with accounting principles generally accepted in the United States of America. These Consolidated Financial Statements are the responsibility of the Corporation’s management. Our responsibility is to express an opinion on these Consolidated Financial Statements based on our audits. We conducted our audits of these Consolidated Financial Statements in accordance with the standards of the Public Company Accounting Oversight Board (United States). Those standards require that we plan and perform the audit to obtain reasonable assurance about whether the financial statements are free of material misstatement. An audit of financial statements includes examining, on a test basis, evidence supporting the amounts and disclosures in the financial statements, assessing the accounting principles used and significant estimates made by management, and evaluating the overall financial statement presentation. We believe that our audits provide a reasonable basis for our opinion. As discussed in Note 1 of the Consolidated Financial Statements, the Corporation has restated its 2004 and 2003 Consolidated Financial Statements.
Internal Control Over Financial ReportingSubsidiaries
Also, in our opinion, management’s assessment, included in the Report of Management on Internal Control Over Financial Reporting appearing on page 87 of the Annual Report, that the Corporation maintained effective internal control over financial reporting as of December 31, 2005 based on criteria established inInternal Control—Integrated Framework issued by the Committee of Sponsoring Organizations of the Treadway Commission (COSO), is fairly stated, in all material respects, based on those criteria. Furthermore, in our opinion, the Corporation maintained, in all material respects, effective internal control over financial reporting as of December 31, 2005, based on criteria established inInternal Control—Integrated Framework issued by the COSO. The Corporation’s management is responsible for maintaining effective internal control over financial reporting and for its assessment of the effectiveness of internal control over financial reporting. Our responsibility is to express opinions on management’s assessment and on the effectiveness of the Corporation’s internal control over financial reporting based on our audit. We conducted our audit of internal control over financial reporting in accordance with the standards of the Public Company Accounting Oversight Board (United States). Those standards require that we plan and perform the audit to obtain reasonable assurance about whether effective internal control over financial reporting was maintained in all material respects. An audit of internal control over financial reporting includes obtaining an understanding of internal control over financial reporting, evaluating management’s assessment, testing and evaluating the design and operating effectiveness of internal control, and performing such other procedures as we consider necessary in the circumstances. We believe that our audit provides a reasonable basis for our opinions.
A company’s internal control over financial reporting is a process designed to provide reasonable assurance regarding the reliability of financial reporting and the preparation of financial statements for external purposes in accordance with generally accepted accounting principles. A company’s internal control over financial reporting includes those policies and procedures that (i) pertain to the maintenance of records that, in reasonable detail, accurately and fairly reflect the transactions and dispositions of the assets of the company; (ii) provide reasonable assurance that transactions are recorded as necessary to permit preparation of financial statements in accordance with generally accepted accounting principles, and that receipts and expenditures of the company are being made only in accordance with authorizations of management and directors of the company; and (iii) provide reasonable assurance regarding prevention or timely detection of unauthorized acquisition, use, or disposition of the company’s assets that could have a material effect on the financial statements.
Because of its inherent limitations, internal control over financial reporting may not prevent or detect misstatements. Also, projections of any evaluation of effectiveness to future periods are subject to the risk that controls may become inadequate because of changes in conditions, or that the degree of compliance with the policies or procedures may deteriorate.

Charlotte, North Carolina
March 14, 2006
BANK OF AMERICA CORPORATION AND SUBSIDIARIES
Consolidated Statement of Income |
| | | | | | | | | | | | | | Year Ended December 31 | | (Dollars in millions, except per share information) | | 2006 | | | 2005 | | 2004 | Interest income | | | | | | | | | | | Interest and fees on loans and leases | | $ | 48,274 | | | $ | 34,843 | | $ | 28,051 | Interest and dividends on securities | | | 11,655 | | | | 10,937 | | | 7,256 | Federal funds sold and securities purchased under agreements to resell | | | 7,823 | | | | 5,012 | | | 1,940 | Trading account assets | | | 7,232 | | | | 5,743 | | | 4,016 | Other interest income | | | 3,601 | | | | 2,091 | | | 1,690 | Total interest income | | | 78,585 | | | | 58,626 | | | 42,953 | Interest expense | | | | | | | | | | | Deposits | | | 14,480 | | | | 9,492 | | | 5,921 | Short-term borrowings | | | 19,840 | | | | 11,615 | | | 4,072 | Trading account liabilities | | | 2,640 | | | | 2,364 | | | 1,317 | Long-term debt | | | 7,034 | | | | 4,418 | | | 3,683 | Total interest expense | | | 43,994 | | | | 27,889 | | | 14,993 | Net interest income | | | 34,591 | | | | 30,737 | | | 27,960 | | | | | Noninterest income | | | | | | | | | | | Card income | | | 14,293 | | | | 5,753 | | | 4,592 | Service charges | | | 8,224 | | | | 7,704 | | | 6,989 | Investment and brokerage services | | | 4,456 | | | | 4,184 | | | 3,614 | Investment banking income | | | 2,317 | | | | 1,856 | | | 1,886 | Equity investment gains | | | 3,189 | | | | 2,212 | | | 1,024 | Trading account profits | | | 3,166 | | | | 1,763 | | | 1,013 | Mortgage banking income | | | 541 | | | | 805 | | | 414 | Other income | | | 2,246 | | | | 1,077 | | | 1,473 | Total noninterest income | | | 38,432 | | | | 25,354 | | | 21,005 | Total revenue | | | 73,023 | | | | 56,091 | | | 48,965 | | | | | Provision for credit losses | | | 5,010 | | | | 4,014 | | | 2,769 | | | | | Gains (losses) on sales of debt securities | | | (443 | ) | | | 1,084 | | | 1,724 | | | | | Noninterest expense | | | | | | | | | | | Personnel | | | 18,211 | | | | 15,054 | | | 13,435 | Occupancy | | | 2,826 | | | | 2,588 | | | 2,379 | Equipment | | | 1,329 | | | | 1,199 | | | 1,214 | Marketing | | | 2,336 | | | | 1,255 | | | 1,349 | Professional fees | | | 1,078 | | | | 930 | | | 836 | Amortization of intangibles | | | 1,755 | | | | 809 | | | 664 | Data processing | | | 1,732 | | | | 1,487 | | | 1,330 | Telecommunications | | | 945 | | | | 827 | | | 730 | Other general operating | | | 4,580 | | | | 4,120 | | | 4,457 | Merger and restructuring charges | | | 805 | | | | 412 | | | 618 | Total noninterest expense | | | 35,597 | | | | 28,681 | | | 27,012 | Income before income taxes | | | 31,973 | | | | 24,480 | | | 20,908 | Income tax expense | | | 10,840 | | | | 8,015 | | | 6,961 | Net income | | $ | 21,133 | | | $ | 16,465 | | $ | 13,947 | Net income available to common shareholders | | $ | 21,111 | | | $ | 16,447 | | $ | 13,931 | Per common share information | | | | | | | | | | | Earnings | | $ | 4.66 | | | $ | 4.10 | | $ | 3.71 | Diluted earnings | | $ | 4.59 | | | $ | 4.04 | | $ | 3.64 | Dividends paid | | $ | 2.12 | | | $ | 1.90 | | $ | 1.70 | Average common shares issued and outstanding (in thousands) | | | 4,526,637 | | | | 4,008,688 | | | 3,758,507 | Average diluted common shares issued and outstanding (in thousands) | | | 4,595,896 | | | | 4,068,140 | | | 3,823,943 |
| | | | | | | | | | | | | Year Ended December 31
| | (Dollars in millions, except per share information) | | 2005
| | 2004
(Restated)
| | 2003
(Restated)
| Interest income | | | | | | | | | | Interest and fees on loans and leases | | $ | 34,843 | | $ | 28,051 | | $ | 21,381 | Interest and dividends on securities | | | 10,937 | | | 7,256 | | | 3,071 | Federal funds sold and securities purchased under agreements to resell | | | 5,012 | | | 1,940 | | | 1,266 | Trading account assets | | | 5,743 | | | 4,016 | | | 3,947 | Other interest income | | | 2,091 | | | 1,690 | | | 1,507 | | | |
|
| |
|
| |
|
| Total interest income | | | 58,626 | | | 42,953 | | | 31,172 | | | |
|
| |
|
| |
|
| Interest expense | | | | | | | | | | Deposits | | | 9,492 | | | 5,921 | | | 4,562 | Short-term borrowings | | | 11,615 | | | 4,072 | | | 1,871 | Trading account liabilities | | | 2,364 | | | 1,317 | | | 1,286 | Long-term debt | | | 4,418 | | | 3,683 | | | 2,948 | | | |
|
| |
|
| |
|
| Total interest expense | | | 27,889 | | | 14,993 | | | 10,667 | | | |
|
| |
|
| |
|
| Net interest income | | | 30,737 | | | 27,960 | | | 20,505 | | | | | Noninterest income | | | | | | | | | | Service charges | | | 7,704 | | | 6,989 | | | 5,618 | Investment and brokerage services | | | 4,184 | | | 3,614 | | | 2,371 | Mortgage banking income | | | 805 | | | 414 | | | 1,922 | Investment banking income | | | 1,856 | | | 1,886 | | | 1,736 | Equity investment gains | | | 2,040 | | | 863 | | | 215 | Card income | | | 5,753 | | | 4,592 | | | 3,052 | Trading account profits | | | 1,812 | | | 869 | | | 408 | Other income | | | 1,200 | | | 1,778 | | | 2,007 | | | |
|
| |
|
| |
|
| Total noninterest income | | | 25,354 | | | 21,005 | | | 17,329 | | | |
|
| |
|
| |
|
| Total revenue | | | 56,091 | | | 48,965 | | | 37,834 | | | | | Provision for credit losses | | | 4,014 | | | 2,769 | | | 2,839 | | | | | Gains on sales of debt securities | | | 1,084 | | | 1,724 | | | 941 | | | | | Noninterest expense | | | | | | | | | | Personnel | | | 15,054 | | | 13,435 | | | 10,446 | Occupancy | | | 2,588 | | | 2,379 | | | 2,006 | Equipment | | | 1,199 | | | 1,214 | | | 1,052 | Marketing | | | 1,255 | | | 1,349 | | | 985 | Professional fees | | | 930 | | | 836 | | | 844 | Amortization of intangibles | | | 809 | | | 664 | | | 217 | Data processing | | | 1,487 | | | 1,330 | | | 1,104 | Telecommunications | | | 827 | | | 730 | | | 571 | Other general operating | | | 4,120 | | | 4,457 | | | 2,930 | Merger and restructuring charges | | | 412 | | | 618 | | | — | | | |
|
| |
|
| |
|
| Total noninterest expense | | | 28,681 | | | 27,012 | | | 20,155 | | | |
|
| |
|
| |
|
| Income before income taxes | | | 24,480 | | | 20,908 | | | 15,781 | Income tax expense | | | 8,015 | | | 6,961 | | | 5,019 | | | |
|
| |
|
| |
|
| Net income | | $ | 16,465 | | $ | 13,947 | | $ | 10,762 | | | |
|
| |
|
| |
|
| Net income available to common shareholders | | $ | 16,447 | | $ | 13,931 | | $ | 10,758 | | | |
|
| |
|
| |
|
| Per common share information | | | | | | | | | | Earnings | | $ | 4.10 | | $ | 3.71 | | $ | 3.62 | | | |
|
| |
|
| |
|
| Diluted earnings | | $ | 4.04 | | $ | 3.64 | | $ | 3.55 | | | |
|
| |
|
| |
|
| Dividends paid | | $ | 1.90 | | $ | 1.70 | | $ | 1.44 | | | |
|
| |
|
| |
|
| Average common shares issued and outstanding (in thousands) | | | 4,008,688 | | | 3,758,507 | | | 2,973,407 | | | |
|
| |
|
| |
|
| Average diluted common shares issued and outstanding (in thousands) | | | 4,068,140 | | | 3,823,943 | | | 3,030,356 | | | |
|
| |
|
| |
|
|
See accompanying Notes to Consolidated Financial Statements. | BANK OF AMERICA CORPORATION AND SUBSIDIARIESBank of America Corporation and Subsidiaries
Consolidated Balance Sheet |
| | | | | | | | | | | | December 31 | | | (Dollars in millions) | | 2006 | | | 2005 | | Assets | | | | | | | | | Cash and cash equivalents | | $ | 36,429 | | | $ | 36,999 | | Time deposits placed and other short-term investments | | | 13,952 | | | | 12,800 | | Federal funds sold and securities purchased under agreements to resell (includes$135,409 and $148,299 pledged as collateral) | | | 135,478 | | | | 149,785 | | Trading account assets (includes$92,274and $68,223 pledged as collateral) | | | 153,052 | | | | 131,707 | | Derivative assets | | | 23,439 | | | | 23,712 | | Debt Securities: | | | | | | | | | Available-for-sale (includes$83,785 and $116,659 pledged as collateral) | | | 192,806 | | | | 221,556 | | Held-to-maturity, at cost (market value—$40 and $47) | | | 40 | | | | 47 | | Total debt securities | | | 192,846 | | | | 221,603 | | Loans and leases | | | 706,490 | | | | 573,791 | | Allowance for loan and lease losses | | | (9,016 | ) | | | (8,045 | ) | Loans and leases, net of allowance | | | 697,474 | | | | 565,746 | | Premises and equipment, net | | | 9,255 | | | | 7,786 | | Mortgage servicing rights (includes$2,869 measured at fair value at December 31, 2006) | | | 3,045 | | | | 2,806 | | Goodwill | | | 65,662 | | | | 45,354 | | Intangible assets | | | 9,422 | | | | 3,194 | | Other assets | | | 119,683 | | | | 90,311 | | Total assets | | $ | 1,459,737 | | | $ | 1,291,803 | | Liabilities | | | | | | | | | Deposits in domestic offices: | | | | | | | | | Noninterest-bearing | | $ | 180,231 | | | $ | 179,571 | | Interest-bearing | | | 418,100 | | | | 384,155 | | Deposits in foreign offices: | | | | | | | | | Noninterest-bearing | | | 4,577 | | | | 7,165 | | Interest-bearing | | | 90,589 | | | | 63,779 | | Total deposits | | | 693,497 | | | | 634,670 | | Federal funds purchased and securities sold under agreements to repurchase | | | 217,527 | | | | 240,655 | | Trading account liabilities | | | 67,670 | | | | 50,890 | | Derivative liabilities | | | 16,339 | | | | 15,000 | | Commercial paper and other short-term borrowings | | | 141,300 | | | | 116,269 | | Accrued expenses and other liabilities (includes$397 and $395 of reserve for unfunded lending commitments) | | | 42,132 | | | | 31,938 | | Long-term debt | | | 146,000 | | | | 100,848 | | Total liabilities | | | 1,324,465 | | | | 1,190,270 | | | | | Commitments and contingencies (Notes 9 and 13) | | | | | | | | | | | | Shareholders’ equity | | | | | | | | | Preferred stock, $0.01 par value; authorized—100,000,000 shares; issued and outstanding—121,739 and 1,090,189 shares | | | 2,851 | | | | 271 | | Common stock and additional paid-in capital, $0.01 par value; authorized—7,500,000,000 shares; issued and outstanding—4,458,151,391 and 3,999,688,491 shares | | | 61,574 | | | | 41,693 | | Retained earnings | | | 79,024 | | | | 67,552 | | Accumulated other comprehensive income (loss) | | | (7,711 | ) | | | (7,556 | ) | Other | | | (466 | ) | | | (427 | ) | Total shareholders’ equity | | | 135,272 | | | | 101,533 | | Total liabilities and shareholders’ equity | | $ | 1,459,737 | | | $ | 1,291,803 | |
| | | | | | | | | | | | December 31
| | | (Dollars in millions) | | 2005
| | | 2004
(Restated)
| | Assets | | | | | | | | | Cash and cash equivalents | | $ | 36,999 | | | $ | 28,936 | | Time deposits placed and other short-term investments | | | 12,800 | | | | 12,361 | | Federal funds sold and securities purchased under agreements to resell (includes$148,299 and $91,243 pledged as collateral) | | | 149,785 | | | | 91,360 | | Trading account assets (includes$68,223and $38,929 pledged as collateral) | | | 131,707 | | | | 93,587 | | Derivative assets | | | 23,712 | | | | 30,235 | | Securities: | | | | | | | | | Available-for-sale (includes$116,659 and $45,127 pledged as collateral) | | | 221,556 | | | | 194,743 | | Held-to-maturity, at cost (market value—$47 and $329) | | | 47 | | | | 330 | | | | |
|
|
| |
|
|
| Total securities | | | 221,603 | | | | 195,073 | | | | |
|
|
| |
|
|
| Loans and leases | | | 573,791 | | | | 521,813 | | Allowance for loan and lease losses | | | (8,045 | ) | | | (8,626 | ) | | | |
|
|
| |
|
|
| Loans and leases, net of allowance | | | 565,746 | | | | 513,187 | | | | |
|
|
| |
|
|
| Premises and equipment, net | | | 7,786 | | | | 7,517 | | Mortgage servicing rights | | | 2,806 | | | | 2,481 | | Goodwill | | | 45,354 | | | | 45,262 | | Core deposit intangibles and other intangibles | | | 3,194 | | | | 3,887 | | Other assets | | | 90,311 | | | | 86,546 | | | | |
|
|
| |
|
|
| Total assets | | $ | 1,291,803 | | | $ | 1,110,432 | | | | |
|
|
| |
|
|
| Liabilities | | | | | | | | | Deposits in domestic offices: | | | | | | | | | Noninterest-bearing | | $ | 179,571 | | | $ | 163,833 | | Interest-bearing | | | 384,155 | | | | 396,645 | | Deposits in foreign offices: | | | | | | | | | Noninterest-bearing | | | 7,165 | | | | 6,066 | | Interest-bearing | | | 63,779 | | | | 52,026 | | | | |
|
|
| |
|
|
| Total deposits | | | 634,670 | | | | 618,570 | | | | |
|
|
| |
|
|
| Federal funds purchased and securities sold under agreements to repurchase | | | 240,655 | | | | 119,741 | | Trading account liabilities | | | 50,890 | | | | 36,654 | | Derivative liabilities | | | 15,000 | | | | 17,928 | | Commercial paper and other short-term borrowings | | | 116,269 | | | | 78,598 | | Accrued expenses and other liabilities (includes$395 and $402 of reserve for unfunded lending commitments) | | | 31,938 | | | | 41,590 | | Long-term debt | | | 100,848 | | | | 97,116 | | | | |
|
|
| |
|
|
| Total liabilities | | | 1,190,270 | | | | 1,010,197 | | | | |
|
|
| |
|
|
| Commitments and contingencies (Notes 9 and 13) | | | | | | | | | | | | Shareholders’ equity | | | | | | | | | Preferred stock, $0.01 par value; authorized—100,000,000 shares; issued and outstanding—1,090,189 shares | | | 271 | | | | 271 | | Common stock and additional paid-in capital, $0.01 par value; authorized—7,500,000,000 shares; issued and outstanding—3,999,688,491and 4,046,546,212 shares | | | 41,693 | | | | 44,236 | | Retained earnings | | | 67,552 | | | | 58,773 | | Accumulated other comprehensive income (loss) | | | (7,556 | ) | | | (2,764 | ) | Other | | | (427 | ) | | | (281 | ) | | | |
|
|
| |
|
|
| Total shareholders’ equity | | | 101,533 | | | | 100,235 | | | | |
|
|
| |
|
|
| Total liabilities and shareholders’ equity | | $ | 1,291,803 | | | $ | 1,110,432 | | | | |
|
|
| |
|
|
|
See accompanying Notes to Consolidated Financial Statements. | BANK OF AMERICA CORPORATION AND SUBSIDIARIESBank of America Corporation and Subsidiaries
Consolidated Statement of Changes in Shareholders’ Equity |
| | | | | | | | | | | | | | | | | | | | | | | | | | | | | | | | | (Dollars in millions, shares in thousands) | | Preferred
Stock | | | Common Stock and
Additional Paid-in
Capital | | | Retained
Earnings | | | Accumulated
Other
Comprehensive
Income
(Loss)(1) | | | Other | | | Total
Shareholders’
Equity | | | Comprehensive
Income | | | | | Shares | | | Amount | | | | | | | Balance, December 31, 2003 | | $ | 54 | | | 2,882,288 | | | $ | 29 | | | $ | 51,162 | | | $ | (2,434 | ) | | $ | (154 | ) | | $ | 48,657 | | | | | | Net income | | | | | | | | | | | | | | 13,947 | | | | | | | | | | | | 13,947 | | | $ | 13,947 | | Net unrealized losses on available-for-sale debt and marketable equity securities | | | | | | | | | | | | | | | | | | (127 | ) | | | | | | | (127 | ) | | | (127 | ) | Net unrealized gains on foreign currency translation adjustments | | | | | | | | | | | | | | | | | | 13 | | | | | | | | 13 | | | | 13 | | Net losses on derivatives | | | | | | | | | | | | | | | | | | (185 | ) | | | | | | | (185 | ) | | | (185 | ) | Cash dividends paid: | | | | | | | | | | | | | | | | | | | | | | | | | | | | | | | | Common | | | | | | | | | | | | | | (6,452 | ) | | | | | | | | | | | (6,452 | ) | | | | | Preferred | | | | | | | | | | | | | | (16 | ) | | | | | | | | | | | (16 | ) | | | | | Common stock issued under employee plans and related tax benefits | | | | | | 121,149 | | | | 4,066 | | | | | | | | | | | | (127 | ) | | | 3,939 | | | | | | Stock issued in acquisition(2) | | | 271 | | | 1,186,728 | | | | 46,480 | | | | | | | | | | | | | | | | 46,751 | | | | | | Common stock repurchased | | | | | | (147,859 | ) | | | (6,375 | ) | | | 89 | | | | | | | | | | | | (6,286 | ) | | | | | Conversion of preferred stock | | | (54 | ) | | 4,240 | | | | 54 | | | | | | | | | | | | | | | | | | | | | | Other | | | | | | | | | | (18 | ) | | | 43 | | | | (31 | ) | | | | | | | (6 | ) | | | (31 | ) | Balance, December 31, 2004 | | | 271 | | | 4,046,546 | | | | 44,236 | | | | 58,773 | | | | (2,764 | ) | | | (281 | ) | | | 100,235 | | | | 13,617 | | Net income | | | | | | | | | | | | | | 16,465 | | | | | | | | | | | | 16,465 | | | | 16,465 | | Net unrealized losses on available-for-sale debt and marketable equity securities | | | | | | | | | | | | | | | | | | (2,781 | ) | | | | | | | (2,781 | ) | | | (2,781 | ) | Net unrealized gains on foreign currency translation adjustments | | | | | | | | | | | | | | | | | | 32 | | | | | | | | 32 | | | | 32 | | Net losses on derivatives | | | | | | | | | | | | | | | | | | (2,059 | ) | | | | | | | (2,059 | ) | | | (2,059 | ) | Cash dividends paid: | | | | | | | | | | | | | | | | | | | | | | | | | | | | | | | | Common | | | | | | | | | | | | | | (7,665 | ) | | | | | | | | | | | (7,665 | ) | | | | | Preferred | | | | | | | | | | | | | | (18 | ) | | | | | | | | | | | (18 | ) | | | | | Common stock issued under employee plans and related tax benefits | | | | | | 79,579 | | | | 3,222 | | | | | | | | | | | | (145 | ) | | | 3,077 | | | | | | Common stock repurchased | | | | | | (126,437 | ) | | | (5,765 | ) | | | | | | | | | | | | | | | (5,765 | ) | | | | | Other | | | | | | | | | | | | | | (3 | ) | | | 16 | | | | (1 | ) | | | 12 | | | | 16 | | Balance, December 31, 2005 | | | 271 | | | 3,999,688 | | | | 41,693 | | | | 67,552 | | | | (7,556 | ) | | | (427 | ) | | | 101,533 | | | | 11,673 | | Net income | | | | | | | | | | | | | | 21,133 | | | | | | | | | | | | 21,133 | | | | 21,133 | | Net unrealized gains on available-for-sale debt and marketable equity securities | | | | | | | | | | | | | | | | | | 245 | | | | | | | | 245 | | | | 245 | | Net unrealized gains on foreign currency translation adjustments | | | | | | | | | | | | | | | | | | 269 | | | | | | | | 269 | | | | 269 | | Net gains on derivatives | | | | | | | | | | | | | | | | | | 641 | | | | | | | | 641 | | | | 641 | | Adjustment to initially apply FASB Statement No. 158 (3) | | | | | | | | | | | | | | | | | | (1,308 | ) | | | | | | | (1,308 | ) | | | | | Cash dividends paid: | | | | | | | | | | | | | | | | | | | | | | | | | | | | | | | | Common | | | | | | | | | | | | | | (9,639 | ) | | | | | | | | | | | (9,639 | ) | | | | | Preferred | | | | | | | | | | | | | | (22 | ) | | | | | | | | | | | (22 | ) | | | | | Issuance of preferred stock | | | 2,850 | | | | | | | | | | | | | | | | | | | | | | | 2,850 | | | | | | Redemption of preferred stock | | | (270 | ) | | | | | | | | | | | | | | | | | | | | | | (270 | ) | | | | | Common stock issued under employee plans and related tax benefits | | | | | | 118,418 | | | | 4,863 | | | | | | | | | | | | (39 | ) | | | 4,824 | | | | | | Stock issued in acquisition(4) | | | | | | 631,145 | | | | 29,377 | | | | | | | | | | | | | | | | 29,377 | | | | | | Common stock repurchased | | | | | | (291,100 | ) | | | (14,359 | ) | | | | | | | | | | | | | | | (14,359 | ) | | | | | Other | | | | | | | | | | | | | | | | | | (2 | ) | | | | | | | (2 | ) | | | (2 | ) | Balance, December 31, 2006 | | $ | 2,851 | | | 4,458,151 | | | $ | 61,574 | | | $ | 79,024 | | | $ | (7,711 | ) | | $ | (466 | ) | | $ | 135,272 | | | $ | 22,286 | |
| | | | | | | | | | | | | | | | | | | | | | | | | | | | | | | | (Dollars in millions, shares in
thousands) | | Preferred
Stock
| | | Common Stock
and Additional
Paid-in Capital
| | | Retained
Earnings
| | | Accumulated
Other
Comprehensive
Income (Loss)(1,2)
| | | Other
| | | Total
Share- holders’
Equity
| | | Compre- hensive
Income
| | | | | Shares
| | | Amount
| | | | | | | Balance, December 31, 2002 (As previously reported) | | $ | 58 | | | 3,001,382 | | | $ | 496 | | | $ | 48,517 | | | $ | 1,232 | | | $ | 16 | | | $ | 50,319 | | | | | | Restatement adjustments(3) | | | | | | | | | | | | | | 1,011 | | | | (131 | ) | | | | | | | 880 | | | | | | | | |
|
|
| |
|
| |
|
|
| |
|
|
| |
|
|
| |
|
|
| |
|
|
| | | | | Balance, December 31, 2002 (Restated) | | | 58 | | | 3,001,382 | | | | 496 | | | | 49,528 | | | | 1,101 | | | | 16 | | | | 51,199 | | | | | | | | |
|
|
| |
|
| |
|
|
| |
|
|
| |
|
|
| |
|
|
| |
|
|
| | | | | Net income | | | | | | | | | | | | | | 10,762 | | | | | | | | | | | | 10,762 | | | $ | 10,762 | | Net unrealized losses on available-for-sale debt and marketable equity securities | | | | | | | | | | | | | | | | | | (564 | ) | | | | | | | (564 | ) | | | (564 | ) | Net unrealized gains on foreign currency translation adjustments | | | | | | | | | | | | | | | | | | 2 | | | | | | | | 2 | | | | 2 | | Net losses on derivatives | | | | | | | | | | | | | | | | | | (2,959 | ) | | | | | | | (2,959 | ) | | | (2,959 | ) | Cash dividends paid: | | | | | | | | | | | | | | | | | | | | | | | | | | | | | | | | Common | | | | | | | | | | | | | | (4,277 | ) | | | | | | | | | | | (4,277 | ) | | | | | Preferred | | | | | | | | | | | | | | (4 | ) | | | | | | | | | | | (4 | ) | | | | | Common stock issued under employee plans and related tax benefits | | | | | | 139,298 | | | | 4,372 | | | | | | | | | | | | (123 | ) | | | 4,249 | | | | | | Common stock repurchased | | | | | | (258,686 | ) | | | (4,936 | ) | | | (4,830 | ) | | | | | | | | | | | (9,766 | ) | | | | | Conversion of preferred stock | | | (4 | ) | | 294 | | | | 4 | | | | | | | | | | | | | | | | | | | | | | Other | | | | | | | | | | 93 | | | | (17 | ) | | | (14 | ) | | | (47 | ) | | | 15 | | | | (14 | ) | | | |
|
|
| |
|
| |
|
|
| |
|
|
| |
|
|
| |
|
|
| |
|
|
| |
|
|
| Balance, December 31, 2003 (Restated) | | | 54 | | | 2,882,288 | | | | 29 | | | | 51,162 | | | | (2,434 | ) | | | (154 | ) | | | 48,657 | | | | 7,227 | | | | |
|
|
| |
|
| |
|
|
| |
|
|
| |
|
|
| |
|
|
| |
|
|
| |
|
|
| Net income | | | | | | | | | | | | | | 13,947 | | | | | | | | | | | | 13,947 | | | | 13,947 | | Net unrealized losses on available-for-sale debt and marketable equity securities | | | | | | | | | | | | | | | | | | (127 | ) | | | | | | | (127 | ) | | | (127 | ) | Net unrealized gains on foreign currency translation adjustments | | | | | | | | | | | | | | | | | | 13 | | | | | | | | 13 | | | | 13 | | Net losses on derivatives | | | | | | | | | | | | | | | | | | (185 | ) | | | | | | | (185 | ) | | | (185 | ) | Cash dividends paid: | | | | | | | | | | | | | | | | | | | | | | | | | | | | | | | | Common | | | | | | | | | | | | | | (6,452 | ) | | | | | | | | | | | (6,452 | ) | | | | | Preferred | | | | | | | | | | | | | | (16 | ) | | | | | | | | | | | (16 | ) | | | | | Common stock issued under employee plans and related tax benefits | | | | | | 121,149 | | | | 4,066 | | | | | | | | | | | | (127 | ) | | | 3,939 | | | | | | Stock issued in acquisition(4) | | | 271 | | | 1,186,728 | | | | 46,480 | | | | | | | | | | | | | | | | 46,751 | | | | | | Common stock repurchased | | | | | | (147,859 | ) | | | (6,375 | ) | | | 89 | | | | | | | | | | | | (6,286 | ) | | | | | Conversion of preferred stock | | | (54 | ) | | 4,240 | | | | 54 | | | | | | | | | | | | | | | | | | | | | | Other | | | | | | | | | | (18 | ) | | | 43 | | | | (31 | ) | | | | | | | (6 | ) | | | (31 | ) | | | |
|
|
| |
|
| |
|
|
| |
|
|
| |
|
|
| |
|
|
| |
|
|
| |
|
|
| Balance, December 31, 2004 (Restated) | | | 271 | | | 4,046,546 | | | | 44,236 | | | | 58,773 | | | | (2,764 | ) | | | (281 | ) | | | 100,235 | | | | 13,617 | | | | |
|
|
| |
|
| |
|
|
| |
|
|
| |
|
|
| |
|
|
| |
|
|
| |
|
|
| Net income | | | | | | | | | | | | | | 16,465 | | | | | | | | | | | | 16,465 | | | | 16,465 | | Net unrealized losses on available-for-sale debt and marketable equity securities | | | | | | | | | | | | | | | | | | (2,781 | ) | | | | | | | (2,781 | ) | | | (2,781 | ) | Net unrealized gains on foreign currency translation adjustments | | | | | | | | | | | | | | | | | | 32 | | | | | | | | 32 | | | | 32 | | Net losses on derivatives | | | | | | | | | | | | | | | | | | (2,059 | ) | | | | | | | (2,059 | ) | | | (2,059 | ) | Cash dividends paid: | | | | | | | | | | | | | | | | | | | | | | | | | | | | | | | | Common | | | | | | | | | | | | | | (7,665 | ) | | | | | | | | | | | (7,665 | ) | | | | | Preferred | | | | | | | | | | | | | | (18 | ) | | | | | | | | | | | (18 | ) | | | | | Common stock issued under employee plans and related tax benefits | | | | | | 79,579 | | | | 3,222 | | | | | | | | | | | | (145 | ) | | | 3,077 | | | | | | Common stock repurchased | | | | | | (126,437 | ) | | | (5,765 | ) | | | | | | | | | | | | | | | (5,765 | ) | | | | | Other | | | | | | | | | | | | | | (3 | ) | | | 16 | | | | (1 | ) | | | 12 | | | | 16 | | | | |
|
|
| |
|
| |
|
|
| |
|
|
| |
|
|
| |
|
|
| |
|
|
| |
|
|
| Balance, December 31, 2005 | | $ | 271 | | | 3,999,688 | | | $ | 41,693 | | | $ | 67,552 | | | $ | (7,556 | ) | | $ | (427 | ) | | $ | 101,533 | | | $ | 11,673 | | | | |
|
|
| |
|
| |
|
|
| |
|
|
| |
|
|
| |
|
|
| |
|
|
| |
|
|
|
(1) | | At December 31, 2005, 2004 and 2003, Accumulated Other Comprehensive Income (Loss) includes Net Unrealized Gains (Losses) on Available-for-sale (AFS) Debt and Marketable Equity Securities of $(2,978) million, $(197) million and $(70) million, respectively; Net Unrealized Gains (Losses) on Foreign Currency Translation Adjustments of $(122) million, $(155) million and $(168) million, respectively; Net Gains (Losses) on Derivatives of $(4,338) million, $(2,279) million and $(2,094) million, respectively; and Other of $(118) million, $(133) million and $(102) million, respectively. |
(2) | (1) | At December 31, 2006, Accumulated Other Comprehensive Income (Loss) (OCI), net of tax, includes Net Gains (Losses) on Derivatives of $(3,697) million, Net Unrealized Gains (Losses) on Available-for-sale (AFS) Debt and Marketable Equity Securities of $(2,733) million, the accumulated adjustment to apply FASB Statement No. 158 of $(1,428) million, and Net Unrealized Gains (Losses) on Foreign Currency Translation Adjustments of $147 million. For additional information on Accumulated OCI, see Note 14 of the Consolidated Financial Statements. |
(3) | | For additional information on the restatement adjustments, see Note 1 of the Consolidated Financial Statements. |
(4) | | Includes adjustment for the fair value of outstanding FleetBoston Financial Corporation (FleetBoston) stock options of $862 million. |
See accompanying Notes to Consolidated Financial Statements.
|
(2) | Includes adjustment for the fair value of outstanding FleetBoston Financial Corporation (FleetBoston) stock options of $862 million. |
(3) | Includes accumulated adjustment to apply FASB Statement No. 158 of $(1,428) million, net of tax, and the reversal of the additional minimum liability adjustment of $120 million, net of tax. |
(4) | Includes adjustment for the fair value of outstanding MBNA Corporation (MBNA) stock options of $435 million. |
See accompanying Notes to Consolidated Financial Statements. | BANK OF AMERICA CORPORATION AND SUBSIDIARIESBank of America Corporation and Subsidiaries
Consolidated Statement of Cash Flows |
| | | | | | | | | | | | | | | | Year Ended December 31 | | | (Dollars in millions) | | 2006 | | | 2005 | | | 2004 | | Operating activities | | | | | | | | | | | | | Net income | | $ | 21,133 | | | $ | 16,465 | | | $ | 13,947 | | Reconciliation of net income to net cash provided by (used in) operating activities: | | | | | | | | | | | | | Provision for credit losses | | | 5,010 | | | | 4,014 | | | | 2,769 | | (Gains) losses on sales of debt securities | | | 443 | | | | (1,084 | ) | | | (1,724 | ) | Depreciation and premises improvements amortization | | | 1,114 | | | | 959 | | | | 972 | | Amortization of intangibles | | | 1,755 | | | | 809 | | | | 664 | | Deferred income tax expense (benefit) | | | 1,850 | | | | 1,695 | | | | (519 | ) | Net increase in trading and derivative instruments | | | (3,870 | ) | | | (18,911 | ) | | | (13,944 | ) | Net increase in other assets | | | (17,070 | ) | | | (104 | ) | | | (11,928 | ) | Net increase (decrease) in accrued expenses and other liabilities | | | 4,517 | | | | (8,205 | ) | | | 4,594 | | Other operating activities, net | | | (373 | ) | | | (7,861 | ) | | | 1,647 | | Net cash provided by (used in) operating activities | | | 14,509 | | | | (12,223 | ) | | | (3,522 | ) | Investing activities | | | | | | | | | | | | | Net increase in time deposits placed and other short-term investments | | | (3,053 | ) | | | (439 | ) | | | (1,147 | ) | Net (increase) decrease in federal funds sold and securities purchased under agreements to resell | | | 13,020 | | | | (58,425 | ) | | | (3,880 | ) | Proceeds from sales of available-for-sale securities | | | 53,446 | | | | 134,490 | | | | 117,672 | | Proceeds from paydowns and maturities of available-for-sale securities | | | 22,417 | | | | 39,519 | | | | 26,973 | | Purchases of available-for-sale securities | | | (40,905 | ) | | | (204,476 | ) | | | (243,573 | ) | Proceeds from maturities of held-to-maturity securities | | | 7 | | | | 283 | | | | 153 | | Proceeds from sales of loans and leases | | | 37,812 | | | | 14,458 | | | | 4,416 | | Other changes in loans and leases, net | | | (145,779 | ) | | | (71,078 | ) | | | (32,350 | ) | Net purchases of premises and equipment | | | (748 | ) | | | (1,228 | ) | | | (863 | ) | Proceeds from sales of foreclosed properties | | | 93 | | | | 132 | | | | 198 | | Investment in China Construction Bank | | | — | | | | (3,000 | ) | | | — | | (Acquisition) divestiture of business activities, net | | | (2,388 | ) | | | (49 | ) | | | 4,936 | | Other investing activities, net | | | (2,226 | ) | | | (632 | ) | | | (89 | ) | Net cash used in investing activities | | | (68,304 | ) | | | (150,445 | ) | | | (127,554 | ) | Financing activities | | | | | | | | | | | | | Net increase in deposits | | | 38,340 | | | | 16,100 | | | | 64,423 | | Net increase (decrease) in federal funds purchased and securities sold under agreements to repurchase | | | (22,454 | ) | | | 120,914 | | | | 35,752 | | Net increase in commercial paper and other short-term borrowings | | | 23,709 | | | | 37,671 | | | | 37,437 | | Proceeds from issuance of long-term debt | | | 49,464 | | | | 21,958 | | | | 21,289 | | Retirement of long-term debt | | | (17,768 | ) | | | (15,107 | ) | | | (16,904 | ) | Proceeds from issuance of preferred stock | | | 2,850 | | | | — | | | | — | | Redemption of preferred stock | | | (270 | ) | | | — | | | | — | | Proceeds from issuance of common stock | | | 3,117 | | | | 2,846 | | | | 3,712 | | Common stock repurchased | | | (14,359 | ) | | | (5,765 | ) | | | (6,286 | ) | Cash dividends paid | | | (9,661 | ) | | | (7,683 | ) | | | (6,468 | ) | Excess tax benefits of share-based payments | | | 477 | | | | — | | | | — | | Other financing activities, net | | | (312 | ) | | | (117 | ) | | | (91 | ) | Net cash provided by financing activities | | | 53,133 | | | | 170,817 | | | | 132,864 | | Effect of exchange rate changes on cash and cash equivalents | | | 92 | | | | (86 | ) | | | 64 | | Net increase (decrease) in cash and cash equivalents | | | (570 | ) | | | 8,063 | | | | 1,852 | | Cash and cash equivalents at January 1 | | | 36,999 | | | | 28,936 | | | | 27,084 | | Cash and cash equivalents at December 31 | | $ | 36,429 | | | $ | 36,999 | | | $ | 28,936 | | Supplemental cash flow disclosures | | | | | | | | | | | | | Cash paid for interest | | $ | 42,355 | | | $ | 26,239 | | | $ | 13,765 | | Cash paid for income taxes | | | 7,210 | | | | 7,049 | | | | 6,088 | |
The fair values of noncash assets acquired and liabilities assumed in the MBNA merger were $83.3 billion and $50.4 billion. Approximately 631 million shares of common stock, valued at approximately $28.9 billion were issued in connection with the MBNA merger. Net transfers of Loans and Leases to loans held-for-sale (included in Other Assets) from the loan portfolio for Asset and Liability Management purposes amounted to $73 million in 2005. Net transfers of Loans and Leases from loans held-for-sale to the loan portfolio for Asset and Liability Management purposes amounted to $1.1 billion in 2004. In 2004, the fair values of noncash assets acquired and liabilities assumed in the merger with FleetBoston were $224.5 billion and $182.9 billion. In 2004, approximately 1.2 billion shares of common stock, valued at approximately $45.6 billion, were issued in connection with the merger with FleetBoston. See accompanying Notes to Consolidated Financial Statements. | | | | | | | | | | | | | | | | Year Ended December 31
| | | (Dollars in millions) | | 2005
| | | 2004 (Restated)
| | | 2003 (Restated)
| | Operating activities | | | | | | | | | | | | | Net income | | $ | 16,465 | | | $ | 13,947 | | | $ | 10,762 | | Reconciliation of net income to net cash provided by (used in) operating activities: | | | | | | | | | | | | | Provision for credit losses | | | 4,014 | | | | 2,769 | | | | 2,839 | | Gains on sales of debt securities | | | (1,084 | ) | | | (1,724 | ) | | | (941 | ) | Depreciation and premises improvements amortization | | | 959 | | | | 972 | | | | 890 | | Amortization of intangibles | | | 809 | | | | 664 | | | | 217 | | Deferred income tax expense (benefit) | | | 1,695 | | | | (519 | ) | | | (295 | ) | Net increase in trading and derivative instruments | | | (18,911 | ) | | | (13,944 | ) | | | (13,639 | ) | Net (increase) decrease in other assets | | | (104 | ) | | | (11,928 | ) | | | 10,647 | | Net increase (decrease) in accrued expenses and other liabilities | | | (8,205 | ) | | | 4,594 | | | | 12,067 | | Other operating activities, net | | | (7,861 | ) | | | 1,647 | | | | 439 | | | | |
|
|
| |
|
|
| |
|
|
| Net cash provided by (used in) operating activities | | | (12,223 | ) | | | (3,522 | ) | | | 22,986 | | | | |
|
|
| |
|
|
| |
|
|
| Investing activities | | | | | | | | | | | | | Net increase in time deposits placed and other short-term investments | | | (439 | ) | | | (1,147 | ) | | | (1,238 | ) | Net increase in federal funds sold and securities purchased under agreements to resell | | | (58,425 | ) | | | (3,880 | ) | | | (31,614 | ) | Proceeds from sales of available-for-sale securities | | | 134,490 | | | | 117,672 | | | | 171,711 | | Proceeds from maturities of available-for-sale securities | | | 39,519 | | | | 26,973 | | | | 26,953 | | Purchases of available-for-sale securities | | | (204,476 | ) | | | (243,573 | ) | | | (195,852 | ) | Proceeds from maturities of held-to-maturity securities | | | 283 | | | | 153 | | | | 779 | | Proceeds from sales of loans and leases | | | 14,458 | | | | 4,416 | | | | 32,672 | | Other changes in loans and leases, net | | | (71,078 | ) | | | (32,350 | ) | | | (74,037 | ) | Additions to mortgage servicing rights, net | | | (736 | ) | | | (1,075 | ) | | | (1,690 | ) | Net purchases of premises and equipment | | | (1,228 | ) | | | (863 | ) | | | (209 | ) | Proceeds from sales of foreclosed properties | | | 132 | | | | 198 | | | | 247 | | Investment in China Construction Bank | | | (3,000 | ) | | | — | | | | — | | Investment in Grupo Financiero Santander Serfin | | | — | | | | — | | | | (1,600 | ) | Net cash (paid for) acquired in business acquisitions | | | (49 | ) | | | 4,936 | | | | (141 | ) | Other investing activities, net | | | 104 | | | | 986 | | | | 898 | | | | |
|
|
| |
|
|
| |
|
|
| Net cash used in investing activities | | | (150,445 | ) | | | (127,554 | ) | | | (73,121 | ) | | | |
|
|
| |
|
|
| |
|
|
| Financing activities | | | | | | | | | | | | | Net increase in deposits | | | 16,100 | | | | 64,423 | | | | 27,655 | | Net increase in federal funds purchased and securities sold under agreements to repurchase | | | 120,914 | | | | 35,752 | | | | 12,967 | | Net increase in commercial paper and other short-term borrowings | | | 37,671 | | | | 37,437 | | | | 13,917 | | Proceeds from issuance of long-term debt | | | 21,958 | | | | 21,289 | | | | 16,963 | | Retirement of long-term debt | | | (15,107 | ) | | | (16,904 | ) | | | (9,282 | ) | Proceeds from issuance of common stock | | | 2,846 | | | | 3,712 | | | | 3,970 | | Common stock repurchased | | | (5,765 | ) | | | (6,286 | ) | | | (9,766 | ) | Cash dividends paid | | | (7,683 | ) | | | (6,468 | ) | | | (4,281 | ) | Other financing activities, net | | | (117 | ) | | | (91 | ) | | | (72 | ) | | | |
|
|
| |
|
|
| |
|
|
| Net cash provided by financing activities | | | 170,817 | | | | 132,864 | | | | 52,071 | | | | |
|
|
| |
|
|
| |
|
|
| Effect of exchange rate changes on cash and cash equivalents | | | (86 | ) | | | 64 | | | | 175 | | | | |
|
|
| |
|
|
| |
|
|
| Net increase in cash and cash equivalents | | | 8,063 | | | | 1,852 | | | | 2,111 | | Cash and cash equivalents at January 1 | | | 28,936 | | | | 27,084 | | | | 24,973 | | | | |
|
|
| |
|
|
| |
|
|
| Cash and cash equivalents at December 31 | | $ | 36,999 | | | $ | 28,936 | | | $ | 27,084 | | | | |
|
|
| |
|
|
| |
|
|
| Supplemental cash flow disclosures | | | | | | | | | | | | | Cash paid for interest | | $ | 26,239 | | | $ | 13,765 | | | $ | 10,214 | | Cash paid for income taxes | | | 7,049 | | | | 6,088 | | | | 3,870 | | | | |
|
|
| |
|
|
| |
|
|
|
| AssetsBank of America Corporation and liabilities of a certain multi-seller asset-backed commercial paper conduit that was consolidated amounted to $4,350 million in 2003.
Net transfers of Loans and Leases to loans held-for-sale (included in Other Assets) from the loan portfolio for Asset and Liability Management purposes amounted to $73 million in 2005.
Net transfers of Loans and Leases from loans held-for-sale to the loan portfolio for Asset and Liability Management purposes amounted to $1,106 million and $9,683 million in 2004 and 2003.
In 2004, the fair values of noncash assets acquired and liabilities assumed in the merger with FleetBoston were $224,492 million and $182,862 million.
In 2004, approximately 1.2 billion shares of common stock, valued at approximately $45,622 million, were issued in connection with the merger with FleetBoston.
See accompanying Notes to Consolidated Financial Statements.Subsidiaries
BANK OF AMERICA CORPORATION AND SUBSIDIARIES
Notes to Consolidated Financial Statements Bank of America Corporation and its subsidiaries (the Corporation) through its banking and nonbanking subsidiaries, provide
|
On January 1, 2006, Bank of America Corporation and its subsidiaries (the Corporation) acquired 100 percent of the outstanding stock of MBNA Corporation (MBNA). On April 1, 2004, the Corporation acquired all of the outstanding stock of FleetBoston Financial Corporation (FleetBoston). Both mergers were accounted for under the purchase method of accounting. Consequently, both MBNA and FleetBoston’s results of operations were included in the Corporation’s results from their dates of acquisition. The Corporation, through its banking and nonbanking subsidiaries, provides a diverse range of financial services and products throughout the U.S. and in selected international markets. At December 31, 2006, the Corporation operated its banking activities primarily under two charters: Bank of America, National Association (Bank of America, N.A.) and FIA Card Services, N.A. Bank of America, N.A. was the surviving entity after the U.S. and in selected international markets. At December 31, 2005, the Corporation operated its banking activities primarily under two charters: Bank of America, National Association (Bank of America, N.A.) and Bank of America, N.A. (USA). On June 13, 2005, Fleet National Bank merged with and into Bank of America, N.A., with Bank of America, N.A. as the surviving entity. This merger of Fleet National Bank on June 13, 2005. Effective June 10, 2006, MBNA America Bank N.A. was renamed FIA Card Services, N.A., and on October 20, 2006, Bank of America, N.A. (USA) merged into FIA Card Services, N.A. These mergers had no impact on the Consolidated Financial Statements of the Corporation. On June 30, 2005, the Corporation announced a definitive agreement to acquire all outstanding shares of MBNA Corporation (MBNA) (the MBNA Merger). The transaction was effective January 1, 2006. On April 1, 2004, the Corporation acquired all of the outstanding stock of FleetBoston Financial Corporation (FleetBoston) (the FleetBoston Merger). | Note 1—NOTE 1 – Summary of Significant Accounting Principles
Restatement
The Corporation is restating its historical financial statements for the years 2004 and 2003, for the quarters in 2005 and 2004, and other selected financial data for the years 2002 and 2001. These restatements and resulting revisions relate to the accounting treatment for certain derivative transactions under the Statement of Financial Accounting Standards (SFAS) No. 133, “Accounting for Derivative Instruments and Hedging Activities, as amended” (SFAS 133).
As a result of an internal review completed in the first quarter of 2006 of the hedge accounting treatment of certain derivatives, the Corporation concluded that certain hedging relationships did not adhere to the requirements of SFAS 133. The derivatives involved were used as hedges principally against changes in interest rates and foreign currency rates in the Asset and Liability Management (ALM) process.
A number of the transactions included in the restatement did not meet the strict requirements of the “shortcut” method of accounting under SFAS 133. Although these hedging relationships would have qualified for hedge accounting if the “long haul” method had been applied, SFAS 133 does not permit the use of the “long haul” method retroactively. Consequently, the restatement assumes hedge accounting was not applied to these derivatives and the related hedged item during the periods under review. A majority of these transactions related to internal interest rate swaps whereby the Corporation used its centralized trading desk to execute these trades to achieve operational effectiveness and cost efficiency. These interest rate swap trades were executed internally between the Corporation’s treasury operations and the centralized trading desk. It has been the Corporation’s long standing policy to lay these internal swaps off to an external party within a three-day period. In almost all cases, cash was exchanged (either paid or received) with the external counterparty to compensate for market rate movements between the time that the internal swap and the matching trade with the external counterparty were executed. Although the overall external trade, including the cash exchanged, was transacted at a fair market value of zero, the cash exchanged offset the fair market value of the external swap which was other than zero. Swaps with a fair market value other than zero at the inception of the hedge cannot qualify for hedge accounting under the shortcut method. Accordingly, the shortcut method was incorrectly applied for such derivative instruments.
The Corporation also entered into certain cash flow hedges which utilized the centralized trading desk to lay off the internal trades with an external party. The key attributes, including interest rates and maturity dates, of the internal and external trades were not properly matched. The Corporation performed the effectiveness assessment and measure of ineffectiveness on the internal trades instead of the external trades. As a result, such tests were not performed in accordance with the requirements of SFAS 133. Accordingly, hedge accounting was incorrectly applied for such derivative instruments.
The Corporation used various derivatives in other hedging relationships to hedge changes in fair value or cash flows attributable to either interest or foreign currency rates. Although these transactions were documented as hedging relationships at inception of the hedge, the upfront and ongoing effectiveness testing was either not performed, documented or assessed in accordance with SFAS 133. In addition, for one cash flow hedge transaction relating to the anticipated purchase of securities, which impacted the third quarter of 2004 by $399 million, the timing of an amount reclassified from Accumulated OCI to earnings upon the subsequent sale of such securities was adjusted. Adjustments to correct the accounting for those hedging relationships are included in the restated results. We do not believe that these adjustments are material individually or in the aggregate to our financial results for any reported period.
BANK OF AMERICA CORPORATION AND SUBSIDIARIES
Notes to Consolidated Financial Statements—(Continued)
The following table sets forth the effects of the adjustments on Net Income for the years 2004 and 2003. Since we could not apply hedge accounting for those transactions, the derivative transactions have been marked to market through the Consolidated Statement of Income with no related offset for hedge accounting.
Increase (Decrease) in Net Income(1)
| | | | | | | | | | | | Year Ended December 31
| | | (Dollars in millions) | | 2004
| | | 2003
| | As Previously Reported net income | | $ | 14,143 | | | $ | 10,810 | | | | | Internal fair value hedges | | | (190 | ) | | | (144 | ) | Internal cash flow hedges | | | (281 | ) | | | 104 | | Other, net | | | 275 | | | | (9 | ) | | | |
|
|
| |
|
|
| Total adjustment | | | (196 | ) | | | (49 | ) | | | |
|
|
| |
|
|
| Restated net income | | $ | 13,947 | | | $ | 10,762 | | Percent change | | | (1.4 | )% | | | (0.5 | )% |
(1) | | For presentation purposes, certain numbers have been rounded. |
The following tables set forth the effects of the restatement adjustments on affected line items within our previously reported Consolidated Statement of Income for the years 2004 and 2003, Consolidated Balance Sheet as of December 31, 2004, Consolidated Statement of Changes in Shareholders’ Equity for the years 2004 and 2003, and Consolidated Statement of Cash Flows for the years 2004 and 2003.
| Bank of America Corporation and Subsidiaries
Consolidated Statement of Income
| | | | | | | | | | | | | | | | Year Ended December 31
| | | | 2004
| | 2003
| | (Dollars in millions, except per share information) | | As
Previously
Reported
| | Restated
| | As
Previously
Reported
| | Restated
| Interest and fees on loans and leases | | $ | 28,213 | | $ | 28,051 | | $ | 21,668 | | $ | 21,381 | Interest and dividends on securities | | | 7,262 | | | 7,256 | | | 3,068 | | | 3,071 | Federal funds sold and securities purchased under agreements to resell | | | 2,043 | | | 1,940 | | | 1,373 | | | 1,266 | Total interest income | | | 43,224 | | | 42,953 | | | 31,563 | | | 31,172 | Deposits | | | 6,275 | | | 5,921 | | | 4,908 | | | 4,562 | Short-term borrowings | | | 4,434 | | | 4,072 | | | 1,871 | | | 1,871 | Long-term debt | | | 2,404 | | | 3,683 | | | 2,034 | | | 2,948 | Total interest expense | | | 14,430 | | | 14,993 | | | 10,099 | | | 10,667 | Net interest income | | | 28,794 | | | 27,960 | | | 21,464 | | | 20,505 | | | | | | Trading account profits | | | 869 | | | 869 | | | 409 | | | 408 | Other income | | | 858 | | | 1,778 | | | 1,127 | | | 2,007 | Total noninterest income | | | 20,085 | | | 21,005 | | | 16,450 | | | 17,329 | Total revenue | | | 48,879 | | | 48,965 | | | 37,914 | | | 37,834 | Gains on sales of debt securities | | | 2,123 | | | 1,724 | | | 941 | | | 941 | | | | | | Income before income taxes | | | 21,221 | | | 20,908 | | | 15,861 | | | 15,781 | Income tax expense | | | 7,078 | | | 6,961 | | | 5,051 | | | 5,019 | Net income | | $ | 14,143 | | $ | 13,947 | | $ | 10,810 | | $ | 10,762 | Net income available to common shareholders | | $ | 14,127 | | $ | 13,931 | | $ | 10,806 | | $ | 10,758 | | | | | | Per common share information | | | | | | | | | | | | | Earnings | | $ | 3.76 | | $ | 3.71 | | $ | 3.63 | | $ | 3.62 | Diluted earnings | | $ | 3.69 | | $ | 3.64 | | $ | 3.57 | | $ | 3.55 |
BANK OF AMERICA CORPORATION AND SUBSIDIARIES
Notes to Consolidated Financial Statements—(Continued)
Bank of America Corporation and Subsidiaries
Consolidated Balance Sheet
| | | | | | | | | | | | December 31, 2004
| | | (Dollars in millions) | | As
Previously
Reported
| | | Restated
| | Loans and leases, net of allowance for loan and lease losses | | $ | 513,211 | | | $ | 513,187 | | Total assets | | | 1,110,457 | | | | 1,110,432 | | | | | Accrued expenses and other liabilities | | | 41,243 | | | | 41,590 | | Long-term debt | | | 98,078 | | | | 97,116 | | Total liabilities | | | 1,010,812 | | | | 1,010,197 | | | | | Retained earnings | | | 58,006 | | | | 58,773 | | Accumulated other comprehensive income (loss) | | | (2,587 | ) | | | (2,764 | ) | Total shareholders’ equity | | | 99,645 | | | | 100,235 | | Total liabilities and shareholders’ equity | | $ | 1,110,457 | | | $ | 1,110,432 | |
Bank of America Corporation and Subsidiaries
Consolidated Statement of Changes in Shareholders’ Equity
| | | | | | | | | | | | | | | | | | | | | | | | | | | | | | | | | | | | | | | | | | Retained Earnings(1)
| | Accumulated Other Comprehensive Income (Loss)
| | | Other
| | | Total Shareholders’ Equity
| | | Comprehensive Income
| | | (Dollars in millions) | | As Previously
Reported
| | Restated
| | As Previously
Reported
| | | Restated
| | | As Previously
Reported
| | | Restated
| | | As Previously
Reported
| | | Restated
| | | As Previously
Reported
| | | Restated
| | Balance, December 31, 2002 | | $ | 48,517 | | $ | 49,528 | | $ | 1,232 | | | $ | 1,101 | | | $ | 16 | | | $ | 16 | | | $ | 50,319 | | | $ | 51,199 | | | $ | — | | | $ | — | | Net income | | | 10,810 | | | 10,762 | | | | | | | | | | | | | | | | | | | 10,810 | | | | 10,762 | | | | 10,810 | | | | 10,762 | | Net gains (losses) on derivatives | | | | | | | | | (2,803 | ) | | | (2,959 | ) | | | | | | | | | | | (2,803 | ) | | | (2,959 | ) | | | (2,803 | ) | | | (2,959 | ) | Balance, December 31, 2003 | | | 50,198 | | | 51,162 | | | (2,148 | ) | | | (2,434 | ) | | | (153 | ) | | | (154 | ) | | | 47,980 | | | | 48,657 | | | | 7,430 | | | | 7,227 | | Net income | | | 14,143 | | | 13,947 | | | | | | | | | | | | | | | | | | | 14,143 | | | | 13,947 | | | | 14,143 | | | | 13,947 | | Net gains (losses) on derivatives | | | | | | | | | (294 | ) | | | (185 | ) | | | | | | | | | | | (294 | ) | | | (185 | ) | | | (294 | ) | | | (185 | ) | Balance, December 31, 2004 | | $ | 58,006 | | $ | 58,773 | | $ | (2,587 | ) | | $ | (2,764 | ) | | $ | (281 | ) | | $ | (281 | ) | | $ | 99,645 | | | $ | 100,235 | | | $ | 13,704 | | | $ | 13,617 | |
(1) | | The cumulative effect of the restatement adjustments on Retained Earnings as of December 31, 2002 was approximately $1.0 billion. |
Bank of America Corporation and Subsidiaries
Consolidated Statement of Cash Flows
| | | | | | | | | | | | | | | | | | | | Year Ended December 31
| | | | | 2004
| | | 2003
| | | (Dollars in millions) | | As Previously
Reported
| | | Restated
| | | As Previously
Reported
| | | Restated
| | Operating activities | | | | | | | | | | | | | | | | | Net income | | $ | 14,143 | | | $ | 13,947 | | | $ | 10,810 | | | $ | 10,762 | | Gains on sales of debt securities | | | (2,123 | ) | | | (1,724 | ) | | | (941 | ) | | | (941 | ) | Deferred income tax benefit | | | (402 | ) | | | (519 | ) | | | (263 | ) | | | (295 | ) | Net increase in trading and derivative instruments | | | (13,180 | ) | | | (13,944 | ) | | | (13,153 | ) | | | (13,639 | ) | Other operating activities, net | | | 564 | | | | 1,647 | | | | 38 | | | | 439 | | Net cash provided by (used in) operating activities | | | (3,927 | ) | | | (3,522 | ) | | | 23,151 | | | | 22,986 | | | | | | | Investing activities | | | | | | | | | | | | | | | | | Proceeds from sales of available-for-sale securities | | $ | 107,107 | | | $ | 117,672 | | | $ | 171,711 | | | $ | 171,711 | | Purchases of available-for-sale securities | | | (232,609 | ) | | | (243,573 | ) | | | (195,852 | ) | | | (195,852 | ) | Other changes in loans and leases, net | | | (32,344 | ) | | | (32,350 | ) | | | (74,202 | ) | | | (74,037 | ) | Net cash used in investing activities | | | (127,149 | ) | | | (127,554 | ) | | | (73,286 | ) | | | (73,121 | ) |
BANK OF AMERICA CORPORATION AND SUBSIDIARIES
Notes to Consolidated Financial Statements—(Continued)
Principles of Consolidation and Basis of Presentation |
The Consolidated Financial Statements include the accounts of the Corporation and its majority-owned subsidiaries, and those variable interest entities (VIEs) where the Corporation is the primary beneficiary. All significant intercompany accounts and transactions have been eliminated. Results of operations of companies purchased are included from the dates of acquisition. Assets held in an agency or fiduciary capacity are not included in the Consolidated Financial Statements. The Corporation accounts for investments in companies in which it owns a voting interest of 20 percent to 50 percent and for which it has the ability to exercise significant influence over operating and financing decisions using the equity method of accounting. These investments are included in Other Assets and the Corporation’s proportionate share of income or loss is included in Equity Investment Gains. The preparation of the Consolidated Financial Statements in conformity with accounting principles generally accepted in the United States (GAAP) requires management to make estimates and assumptions that affect reported amounts and disclosures. Actual results could differ from those estimates and assumptions. Certain prior period amounts have been reclassified to conform to current period presentation. Assets held in an agency or fiduciary capacity are not included in the Consolidated Financial Statements. The Corporation accounts for investments in companies in which it owns a voting interest of 20 percent to 50 percent and for which it has the ability to exercise significant influence over operating and financing decisions using the equity method of accounting. These investments are included in Other Assets and the Corporation’s proportionate share of income or loss is included in Other Income and Accumulated Other Comprehensive Income (OCI), where applicable. The preparation of the Consolidated Financial Statements in conformity with accounting principles generally accepted in the United States requires management to make estimates and assumptions that affect reported amounts and disclosures. Actual results could differ from those estimates and assumptions.
| | Recently Issued or Proposed Accounting Pronouncements On February 16, 2006, the Financial Accounting Standards Board (FASB) issued SFAS No. 155, “Accounting for Certain Hybrid Instruments” (SFAS 155), which permits, but does not require, fair value accounting for any hybrid financial instrument that contains an embedded derivative that would otherwise require bifurcation in accordance with SFAS 133. The statement also subjects beneficial interests issued by securitization vehicles to the requirements of SFAS 133. The statement
|
On February 15, 2007, the Financial Accounting Standards Board (FASB) issued Statement of Financial Accounting Standards (SFAS) No. 159, “The Fair Value Option for Financial Assets and Financial Liabilities” (SFAS 159), which allows an entity the irrevocable option to elect fair value for the initial and subsequent measurement for certain financial assets and liabilities on a contract-by-contract basis. Subsequent changes in fair value of these financial assets and liabilities would be recognized in earnings when they occur. SFAS 159 further establishes certain additional disclosure requirements. SFAS 159 is effective as of January 1, 2007, with earlier adoption permitted. Management is currently evaluating the effect of the statement on the Corporation’s results of operations and financial condition. On August 11, 2005, the FASB issued two exposure drafts which would amend SFAS No. 140, “Accounting for Transfers and Servicing of Financial Assets and Extinguishments of Liabilities—a replacement of FASB Statement No. 125” (SFAS 140). The exposure draft, “Accounting for Transfers of Financial Assets,” would revise and clarify the criteria for derecognition of transferred financial assets. It would also place restrictions on the ability of a qualifying special purpose entity to roll over beneficial interests such as short-term commercial paper. The provisions of this exposure draft are expected to be effective at various dates beginning in 2006. Management is currently evaluating the effect of the provisions of the exposure draft on the Corporation’s results of operations and financial condition. The second exposure draft, “Accounting for Servicing of Financial Assets,” would permit, but not require, an entity to account for one or more classes of servicing rights (i.e., mortgage servicing rights, or MSRs) at fair value, with changes in fair value recorded in income. The exposure draft is expected to be issued during the first quarter of 2006, to be effective as of January 1, 2006. The Corporation expects to utilize the fair value approach for MSRs upon adoption of this standard. The final statement is not expected to have a material impact on the Corporation’s results of operations or financial condition.
On July 14, 2005, the FASB issued an exposure draft, FASB Staff Position (FSP) No. FAS 13-a, “Accounting for a Change or Projected Change in the Timing of Cash Flows Relating to Income Taxes Generated by a Leveraged Lease Transaction” (FSP 13-a). The FASB has met recently to discuss modifications to and finalization of FSP 13-a due, in part, to comment letters received in response to the exposure draft. It is anticipated that FSP 13-a will be effective January 1, 2007 and that the impact of adoption should be reflected as a change in the opening balance of retained earnings in the period of adoption. FSP 13-a’s principal provision is the requirement that a lessor recalculate the recognition of lease income when there is a change in the estimated timing of the cash flows relating to income taxes generated by such leveraged lease. This provision is expected to be retained in the final version, which the FASB expects to complete during the first quarter of 2006.
Management is considering the potential impact of the Internal Revenue Service’s (IRS) stated position on certain leveraged leases and the impact of such position on the Corporation and its predecessors’ federal income tax returns. Depending on the final provisions of FSP 13-a and the final resolution with the IRS, adoption of FSP 13-a may have a material impact on the Corporation’s current accounting treatment for leveraged leases. Adoption of the FSP would result in both an adjustment to Goodwill for leveraged leases acquired as part of the FleetBoston Merger and a change in the opening balance of retained earnings in the period of adoption.
On July 14, 2005, the FASB issued an exposure draft, “Accounting for Uncertain Tax Positions—an interpretation of FASB Statement No. 109.” The exposure draft, as modified by recent FASB deliberations, requires recognition of a tax benefit to the extent of management’s best estimate of the impact of a tax position, provided it is more likely than not that the tax position would be sustained based on its technical merits. The exposure draft is expected to be effective for the Corporation’s financial statements for the year beginning on January 1, 2008, with earlier adoption permitted. Management is currently evaluating the impact and timing of the adoption of SFAS 159 on the Corporation’s financial condition and results of operations.
On September 29, 2006, the FASB issued SFAS No. 158, “Employers’ Accounting for Defined Benefit Pension and Other Postretirement Plans, an amendment of FASB Statements No. 87, 88, 106, and 132(R)” (SFAS 158), which requires the recognition of a plan’s over-funded or under-funded status as an asset or liability with an offsetting adjustment to Accumulated Other Comprehensive Income (OCI). SFAS 158 further requires the determination of the fair values of a plan’s assets at a company’s year-end and recognition of actuarial gains and losses, prior service costs or credits, and transition assets or obligations as a component of Accumulated OCI. This statement was effective as of December 31, 2006. The adoption of SFAS 158 reduced Accumulated OCI by approximately $1.3 billion after tax in 2006. On September 15, 2006, the FASB issued SFAS No. 157, “Fair Value Measurements” (SFAS 157). SFAS 157 defines fair value, establishes a framework for measuring fair value under GAAP and enhances disclosures about fair value measurements. SFAS 157 defines fair value as the exchange price that would be received for an asset or paid to transfer a liability (an exit price) in the principal or most advantageous market for the asset or liability in an orderly transaction between market participants on the measurement date. SFAS 157 is effective for the Corporation’s financial statements issued for the year beginning on January 1, 2008, with earlier adoption permitted. Management is currently evaluating the impact and timing of the adoption of SFAS 157 on the Corporation’s financial condition and results of operations. On September 13, 2006, the Securities and Exchange Commission (SEC) issued Staff Accounting Bulletin (SAB) No. 108 “Considering the Effects of Prior Year Misstatements when Quantifying Misstatements in Current Year Financial Statements” (SAB 108). SAB 108 expresses the SEC Staff’s views regarding the process of quantifying financial statement misstatements. SAB 108 states that in evaluating the materiality of financial statement misstatements, a corporation must quantify the impact of correcting misstatements, including both the carryover and reversing effects of prior year misstatements, on the current year financial statements. SAB 108 is effective for the year ended December 31, 2006. The application of SAB 108 did not have an impact on the Corporation’s financial condition and results of operations. On July 13, 2006, the FASB issued FASB Staff Position (FSP) No. FAS 13-2, “Accounting for a Change or Projected Change in the Timing of Cash Flows Relating to Income Taxes Generated by a Leveraged Lease Transaction” (FSP 13-2). The principal provision of FSP 13-2 is the requirement that a lessor recalculate the recognition of lease income when there is a change in the estimated timing of the cash flows relating to income taxes generated by such leveraged lease. FSP 13-2 is effective as of January 1, 2007 and requires that the cumulative effect of adoption be reflected as an adjustment to the beginning balance of Retained Earnings with a corresponding offset decreasing the net investment in leveraged leases. The adoption of FSP 13-2 is expected to reduce Retained Earnings by approximately $1.4 billion after-tax in the first quarter of 2007. This estimate reflects new information that changed management’s previously disclosed assumption of the projected timing and classification of future income tax cash flows related to certain leveraged leases. On July 13, 2006, the FASB released FASB Interpretation No. 48, “Accounting for Uncertainty in Income Taxes, an interpretation of FASB Statement No. 109” (FIN 48). FIN 48 clarifies the accounting and reporting for income taxes where interpretation of the tax law may be uncertain. FIN 48 prescribes a comprehensive model for the financial statement recognition, measurement, presentation and disclosure of income tax uncertainties with respect to positions taken or expected to be taken in income tax returns. The Corporation will adopt FIN 48 in the first quarter of 2007. The adoption of FIN 48 is not expected to have a material impact on the Corporation’s financial condition and results of operations. On March 17, 2006, the FASB issued SFAS No. 156, “Accounting for Servicing of Financial Assets, an amendment of FASB Statement No. 140” (SFAS 156), which permits, but does not require, an entity to account for one or more classes of servicing rights (i.e., mortgage servicing rights, or MSRs) at fair value, with the changes in fair value recorded in the Consolidated Statement of Income. The Corporation elected to early adopt the standard and to account for consumer-related MSRs using the fair value measurement method on January 1, 2006. Commercial-related MSRs continue to be accounted for using the amortization method (i.e., lower of cost or market). The adoption of this standard did not have a material impact on the Corporation’s financial condition and results of operations. For additional information on MSRs, see Note 8 of the Consolidated Financial Statements. On February 16, 2006, the FASB issued SFAS No. 155, “Accounting for Certain Hybrid Instruments, an amendment of FASB Statements No. 133 and 140” (SFAS 155), which permits, but does not require, fair value accounting for any hybrid financial instrument that contains an embedded derivative that would otherwise require bifurcation in accordance with SFAS No. 133 “Accounting for Derivative Instruments and Hedging Activities, as amended” (SFAS 133). The statement also subjects beneficial interests issued by securitization vehicles to the requirements of SFAS 133. The Corporation will adopt SFAS 155 in the first quarter of 2007. The adoption of SFAS 155 is not expected to have a material impact on the Corporation’s financial condition and results of operations. On January 1, 2006, the Corporation adopted SFAS No. 123 (revised 2004), “Share-based Payment” (SFAS 123R). Prior to January 1, 2006, the Corporation accounted for its stock-based compensation plans under a fair value-based method of accounting. The adoption of SFAS 123R impacted the recognition of stock compensation for any awards granted to retirement-eligible employees and the presentation of cash flows resulting from the tax benefits due to tax deductions in excess of the compensation cost recognized for those options (excess tax benefits) in the Consolidated Statement of Cash Flows. For additional information, see Note 17 of the Consolidated Financial Statements. BANK OF AMERICA CORPORATION AND SUBSIDIARIES
Notes to Consolidated Financial Statements—(Continued)
January 1, 2007. Management is currently evaluating the effect of the exposure draft, which is required to be reflected as a change in the opening balance of retained earnings in the period of adoption.
On December 16, 2004, the FASB issued SFAS No. 123 (revised 2004) “Share-based Payment” (SFAS 123R) which eliminates the ability to account for share-based compensation transactions, including grants of employee stock options, using Accounting Principles Board (APB) Opinion No. 25, “Accounting for Stock Issued to Employees” (APB 25), and generally requires that such transactions be accounted for using a fair value-based method with the resulting compensation cost recognized over the period that the employee is required to provide service in order to receive their compensation. SFAS 123R also amends SFAS No. 95, “Statement of Cash Flows,” requiring the benefits of tax deductions in excess of recognized compensation costs to be reported as financing cash flows, rather than as operating cash flows as currently required. The Corporation adopted the fair value-based method of accounting for stock-based employee compensation prospectively as of January 1, 2003. The Corporation adopted SFAS 123R effective January 1, 2006 under the modified-prospective application. Upon adoption of SFAS 123R and as a result of a recent Securities and Exchange Commission (SEC) Staff (the Staff) interpretation, the Corporation changed its approach for recognizing stock compensation cost for employees who meet certain age and service criteria and thus, are retirement eligible as described in the plan. For any new awards granted, the Corporation will recognize stock compensation cost immediately for awards granted to retirement eligible employees or over the period from the grant date to the date retirement eligibility is achieved. Prior to adoption of SFAS 123R, awards granted to retirement eligible employees were expensed over the stated vesting period. Accordingly, the Corporation expects that earnings per common share will be reduced by approximately $0.05 in the first quarter due to the acceleration of stock-based compensation expense. The incremental impact of the change is approximately $0.04 for the full year when compared to expensing over the stated vesting period.
Stock-based Compensation
SFAS No. 148, “Accounting for Stock-Based Compensation—Transition and Disclosure—an amendment of FASB Statement No. 123,” (SFAS 148) was adopted prospectively by the Corporation on January 1, 2003. SFAS 148 provides alternative methods of transition for a voluntary change to the fair value-based method of accounting for stock-based employee compensation. All stock options granted under plans before the adoption date will continue to be accounted for under APB 25 unless these stock options are modified or settled subsequent to adoption. SFAS 148 was effective for all stock option awards granted in 2003 and thereafter. Under APB 25, the Corporation accounted for stock options using the intrinsic value method and no compensation expense was recognized, as the grant price was equal to the strike price. Under the fair value method, stock option compensation expense is measured on the date of grant using an option-pricing model. The option-pricing model is based on certain assumptions and changes to those assumptions may result in different fair value estimates.
In accordance with SFAS 148, the Corporation provides disclosures as if it had adopted the fair value-based method of measuring all outstanding employee stock options during 2005, 2004 and 2003. The following table presents the effect on Net Income and Earnings per Common Share had the fair value-based method been applied to all outstanding and unvested awards for 2005, 2004 and 2003.
| | | | | | | | | | | | | | | | Year Ended December 31
| | | (Dollars in millions, except per share data) | | 2005
| | | 2004
(Restated)
| | | 2003
(Restated)
| | Net income (as reported) | | $ | 16,465 | | | $ | 13,947 | | | $ | 10,762 | | Stock-based employee compensation expense recognized during the year, net of related tax effects | | | 203 | | | | 161 | | | | 78 | | Stock-based employee compensation expense determined under fair value-based method, net of related tax effects(1) | | | (203 | ) | | | (198 | ) | | | (225 | ) | | | |
|
|
| |
|
|
| |
|
|
| Pro forma net income | | $ | 16,465 | | | $ | 13,910 | | | $ | 10,615 | | | | |
|
|
| |
|
|
| |
|
|
| As reported | | | | | | | | | | | | | Earnings per common share | | $ | 4.10 | | | $ | 3.71 | | | $ | 3.62 | | Diluted earnings per common share | | | 4.04 | | | | 3.64 | | | | 3.55 | | Pro forma | | | | | | | | | | | | | Earnings per common share | | | 4.10 | | | | 3.70 | | | | 3.57 | | Diluted earnings per common share | | | 4.04 | | | | 3.63 | | | | 3.50 | |
(1) | | Includes all awards granted, modified or settled for which the fair value was required to be measured under SFAS 123, except restricted stock. Restricted stock expense (net of taxes), included in Net Income for 2005, 2004 and 2003 was $308 million, $187 million and $179 million. |
| BANK OF AMERICA CORPORATION AND SUBSIDIARIESNotes to Consolidated Financial Statements—(Continued)
In determining the pro forma disclosures in the previous table, the fair value of options granted was estimated on the date of grant using the Black-Scholes option-pricing model and assumptions appropriate to each plan. The Black-Scholes model was developed to estimate the fair value of traded options, which have different characteristics than employee stock options, and changes to the subjective assumptions used in the model can result in materially different fair value estimates. The weighted average grant date fair values of the options granted during 2005, 2004 and 2003 were based on the assumptions below. See Note 17 of the Consolidated Financial Statements for further discussion.
| | | | | | | | | | | | | Shareholder Approved Plans
| | | | | 2005
| | | 2004
| | | 2003
| | Risk-free Interest Rate | | 3.94 | % | | 3.36 | % | | 3.82 | % | Dividend Yield | | 4.60 | % | | 4.56 | % | | 4.40 | % | Volatility | | 20.53 | % | | 22.12 | % | | 26.57 | % | Expected Lives (Years) | | 6 | | | 5 | | | 7 | |
Compensation expense under the fair value-based method is recognized over the vesting period of the related stock options. Accordingly, the pro forma results of applying SFAS 123 in 2005, 2004 and 2003 may not be indicative of future amounts.
Cash and Cash Equivalents |
Cash on hand, cash items in the process of collection, and amounts due from correspondent banks and the Federal Reserve Bank are included in Cash and Cash Equivalents. | Securities Purchased underUnder Agreements to Resell and Securities Sold under Agreements to Repurchase |
Securities Purchased under Agreements to Resell and Securities Sold under Agreements to Repurchase are treated as collateralized financing transactions and are recorded at the amounts at which the securities were acquired or sold plus accrued interest. The Corporation’s policy is to obtain the use of Securities Purchased under Agreements to Resell. The market value of the underlying securities, which collateralize the related receivable on agreements to resell, is monitored, including accrued interest. The Corporation may require counterparties to deposit additional collateral or return collateral pledged, when appropriate. The Corporation has accepted collateral that it is permitted by contract or custom to sell or repledge. At December 31, 2006, the fair value of this collateral was approximately $186.6 billion of which $113.0 billion was sold or repledged. At December 31, 2005, the fair value of this collateral was approximately $179.1 billion of which $112.5 billion was sold or repledged. The primary source of this collateral is reverse repurchase agreements. The Corporation also pledges securities as collateral in transactions that consist of repurchase agreements, public and trust deposits, Treasury tax and loan notes, and other short-term borrowings. This collateral can be sold or repledged by the counterparties to the transactions. In addition, the Corporation obtains collateral in connection with its derivative activities. Required collateral levels vary depending on the credit risk rating and the type of counterparty. Generally, the Corporation accepts collateral in the form of cash, U.S. Treasury securities and other marketable securities. Based on provisions contained in legal netting agreements, the Corporation has netted cash collateral against the applicable derivative mark-to-market exposures. Accordingly, the Corporation offsets its obligation to return or its right to reclaim cash collateral against the fair value of the derivatives being collateralized. The Corporation also pledges collateral on its own derivative positions which can be applied against Derivative Liabilities. The Corporation has accepted collateral that it is permitted by contract or custom to sell or repledge. At December 31, 2005, the fair value of this collateral was approximately $179.1 billion of which $112.5 billion was sold or repledged. At December 31, 2004, the fair value of this collateral was approximately $152.5 billion of which $117.5 billion was sold or repledged. The primary source of this collateral is reverse repurchase agreements. The Corporation pledges securities as collateral in transactions that consist of repurchase agreements, public and trust deposits, Treasury tax and loan notes, and other short-term borrowings. This collateral can be sold or repledged by the counterparties to the transactions.
In addition, the Corporation obtains collateral in connection with its derivative activities. Required collateral levels vary depending on the credit risk rating and the type of counterparty. Generally, the Corporation accepts collateral in the form of cash, U.S. Treasury securities and other marketable securities. Based on provisions contained in legal netting agreements, the Corporation has netted cash collateral against the applicable derivative mark-to-market exposures. Accordingly, the Corporation offsets its obligation to return or its right to reclaim cash collateral against the fair value of the derivatives being collateralized.
Financial instruments utilized in trading activities are stated at fair value. Fair value is generally based on quoted market prices. If quoted market prices are not available, fair values are estimated based on dealer quotes, pricing models or quoted prices for instruments with similar characteristics. Realized and unrealized gains and losses are recognized in Trading Account Profits. | Derivatives and Hedging Activities All derivatives are recognized on the Consolidated Balance Sheet at fair value, taking into consideration the effects of legally enforceable master netting agreements that allow the Corporation to settle positive and negative positions
BANK OF AMERICA CORPORATION AND SUBSIDIARIES
|
The Corporation designates a derivative as held for trading, an economic hedge not designated as a SFAS 133 hedge, or a qualifying SFAS 133 hedge when it enters into the derivative contract. The designation may change based upon management’s reassessment or changing circumstances. Derivatives utilized by the Corporation include swaps, financial futures and forward settlement contracts, and option contracts. A swap agreement is a contract between two parties to exchange cash flows based on specified underlying notional amounts, assets and/or indices. Financial futures and forward settlement contracts are agreements to buy or sell a quantity of a financial instrument, index, currency or commodity at a predetermined future date, and rate or price. An option contract is an agreement that conveys to the purchaser the right, but not the obligation, to buy or sell a quantity of a financial instrument (including another derivative financial instrument), index, currency or commodity at a predetermined rate or price during a period or at a time in the future. Option agreements can be transacted on organized exchanges or directly between parties. The Corporation also provides credit derivatives to customers who wish to increase or decrease credit exposures. In addition, the Corporation utilizes credit derivatives to manage the credit risk associated with the loan portfolio. All derivatives are recognized on the Consolidated Balance Sheet at fair value, taking into consideration the effects of legally enforceable master netting agreements that allow the Corporation to settle positive and negative positions and offset cash collateral held with the same counterparty on a net basis. For exchange-traded contracts, fair value is based on quoted market prices. For non-exchange traded contracts, fair value is based on dealer quotes, pricing models or quoted prices for instruments with similar characteristics. The Corporation recognizes gains and losses at inception of a derivative contract only if the fair value of the contract is evidenced by a quoted market price in an active market, an observable price or other market transaction, or other observable data supporting a valuation model in accordance with Emerging Issues Task Force (EITF) Issue No. 02-3, “Issues Involved in Accounting for Derivative Contracts Held for Trading Purposes and Contracts Involved in Energy Trading and Risk Management Activities” (EITF 02-3). For those gains and losses not evidenced by the above mentioned market data, the transaction price is used as the fair value of the derivative contract. Any difference between the transaction price and the model fair value is considered an unrecognized gain or loss at inception of the contract. These unrecognized gains and losses are recorded in income using the straight line method of amortization over the contractual life of the derivative contract. Earlier recognition of the full unrecognized gain or loss is permitted if the trade is terminated early, subsequent market activity is observed which supports the model fair value of the contract, or significant inputs used in the valuation model become observable in the market. As of December 31, 2006, the balance of the above unrecognized gains and losses was not material. SFAS 157, when adopted, will nullify certain guidance in EITF 02-3 and, as a result, a portion of the above unrecognized gains and losses will be accounted for as a cumulative-effect adjustment to the opening balance of Retained Earnings. Trading Derivatives and Economic Hedges The Corporation designates at inception whether the derivative contract is considered hedging or non-hedging for SFAS 133 accounting purposes. Derivatives held for trading purposes are included in Derivative Assets or Derivative Liabilities with changes in fair value reflected in Trading Account Profits. Derivatives used as economic hedges but not designated in a hedging relationship for accounting purposes are also included in Derivative Assets or Derivative Liabilities. Changes in the fair value of derivatives that serve as economic hedges of MSRs are recorded in Mortgage Banking Income. Changes in the fair value of derivatives that serve as asset and liability management (ALM) economic hedges, which do not qualify or were not designated as accounting hedges, are recorded in Other Income. Credit derivatives used by the Corporation do not qualify for hedge accounting under SFAS 133 despite being effective economic hedges with changes in the fair value of these derivatives included in Other Income. Derivatives Used For SFAS 133 Hedge Accounting Purposes For SFAS 133 hedges, the Corporation formally documents at inception all relationships between hedging instruments and hedged items, as well as its risk management objectives and strategies for undertaking various accounting hedges. Additionally, the Corporation uses dollar offset or regression analysis at the hedge’s inception and for each reporting period thereafter to assess whether the derivative used in its hedging transaction is expected to be and has been highly effective in offsetting changes in the fair value or cash flows of the hedged items. The Corporation discontinues hedge accounting when it is determined that a derivative is not expected to be or has ceased to be highly effective as a hedge, and then reflects changes in fair value in earnings after termination of the hedge relationship. The Corporation uses its derivatives designated as hedging for accounting purposes as either fair value hedges, cash flow hedges or hedges of net investments in foreign operations. The Corporation manages interest rate and foreign currency exchange rate sensitivity predominantly through the use of derivatives. Fair value hedges are used to protect against changes in the fair value of the Corporation’s assets and liabilities that are due to interest rate or foreign exchange volatility. Cash flow hedges are used to minimize the variability in cash flows of assets or liabilities, or forecasted transactions caused by interest rate or foreign exchange fluctuation. For cash flow hedges, the maximum length of time over which forecasted transactions are hedged is 29 years, with a substantial portion of the hedged transactions being less than 10 years. Changes in the fair value of derivatives designated as fair value hedges are recorded in earnings, together with changes in the fair value of the related hedged item. Changes in the fair value of derivatives designated as cash flow hedges are recorded in Accumulated OCI and are reclassified into the line item in the Consolidated Statement of Income in which the hedged item is recorded in the same period the hedged item affects earnings. Hedge ineffectiveness and gains and losses on the excluded component of a derivative in assessing hedge effectiveness are recorded in earnings in the same income statement caption that is used to record hedge effectiveness. SFAS 133 retains certain concepts under SFAS No. 52, “Foreign Currency Translation,” (SFAS 52) for foreign currency exchange hedging. Consistent with SFAS 52, the Corporation records changes in the fair value of derivatives used as hedges of the net investment in foreign operations, to the extent effective, as a component of Accumulated OCI. If a derivative instrument in a fair value hedge is terminated or the hedge designation removed, the previous adjustments to the carrying amount of the hedged asset or liability are subsequently accounted for in the same manner as other components of the carrying amount of that asset or liability. For interest-earning assets and interest-bearing liabilities, such adjustments are amortized to earnings over the remaining life of the respective asset or liability. If a derivative instrument in a cash flow hedge is terminated or the hedge designation is removed, related amounts in Accumulated OCI are reclassified into earnings in the same period or periods during which the hedged forecasted transaction affects earnings. If it is probable that a forecasted transaction will not occur, any related amounts in Accumulated OCI are reclassified into earnings in that period. | Notes to Consolidated Financial Statements—(Continued)
and offset cash collateral held with the same counterparty on a net basis. For exchange-traded contracts, fair value is based on quoted market prices. For non-exchange traded contracts, fair value is based on dealer quotes, pricing models or quoted prices for instruments with similar characteristics.
The Corporation recognizes gains and losses at inception of a contract only if the fair value of the contract is evidenced by a quoted market price in an active market, an observable price or other market transaction, or other observable data supporting a valuation model in accordance with EITF Issue No. 02-3, “Issues Involved in Accounting for Derivative Contracts Held for Trading Purposes and Contracts Involved in Energy Trading and Risk Management Activities”. For those gains and losses not evidenced by the above mentioned market data, the transaction price is used as the fair value of the contract. Any difference between the transaction price and the model fair value is considered an unrecognized gain or loss at inception of the contract. These unrecognized gains and losses are recorded in income using the straight line method of amortization over the contractual life of the derivative contract. Earlier recognition of the full unrecognized gain or loss is permitted if the trade is terminated early, subsequent market activity is observed which supports the model fair value of the contract, or significant inputs used in the valuation model become observable in the market.
The Corporation designates at inception whether the derivative contract is considered hedging or non-hedging for SFAS 133 accounting purposes. Non-hedging derivatives held for trading purposes are included in Derivative Assets or Derivative Liabilities with changes in fair value reflected in Trading Account Profits. Other non-hedging derivatives that are considered economic hedges, but not designated in a hedging relationship for accounting purposes, are also included in Derivative Assets or Derivative Liabilities with changes in fair value recorded in Trading Account Profits, Mortgage Banking Income or Other Income on the Consolidated Statement of Income. Credit derivatives used by the Corporation do not qualify for hedge accounting under SFAS 133 despite being effective economic hedges with changes in the fair value of these derivatives included in Trading Account Profits. Changes in the fair value of derivatives that serve as economic hedges of MSRs are recorded in Mortgage Banking Income, after June 1, 2004. Changes in the fair value of derivatives that serve as ALM economic hedges, which do not qualify or were not designated as accounting hedges, are recorded in Other Income.
For SFAS 133 hedges, the Corporation formally documents at inception all relationships between hedging instruments and hedged items, as well as its risk management objectives and strategies for undertaking various accounting hedges. Additionally, the Corporation uses dollar offset or regression analysis at the hedge’s inception and for each reporting period thereafter to assess whether the derivative used in its hedging transaction is expected to be and has been highly effective in offsetting changes in the fair value or cash flows of the hedged items. The Corporation discontinues hedge accounting when it is determined that a derivative is not expected to be or has ceased to be highly effective as a hedge, and then reflects changes in fair value in earnings after termination of the hedge relationship.
The Corporation uses its derivatives designated as hedging for accounting purposes as either fair value hedges, cash flow hedges or hedges of net investments in foreign operations. The Corporation manages interest rate and foreign currency exchange rate sensitivity predominantly through the use of derivatives. Fair value hedges are used to limit the Corporation’s exposure to total changes in the fair value of its fixed interest-earning assets or interest-bearing liabilities that are due to interest rate or foreign exchange volatility. Cash flow hedges are used to minimize the variability in cash flows of interest-earning assets or interest-bearing liabilities or forecasted transactions caused by interest rate or foreign exchange fluctuation. The maximum length of time over which forecasted transactions are hedged is 29 years, with a substantial portion of the hedged transactions being less than 10 years. Changes in the fair value of derivatives designated for hedging activities that are highly effective as hedges are recorded in earnings or Accumulated OCI, depending on whether the hedging relationship satisfies the criteria for a fair value or cash flow hedge. Hedge ineffectiveness and gains and losses on the excluded component of a derivative in assessing hedge effectiveness are recorded in earnings in the same income statement caption that is used to record hedge effectiveness. SFAS 133 retains certain concepts under SFAS No. 52, “Foreign Currency Translation,” (SFAS 52) for foreign currency exchange hedging. Consistent with SFAS 52, the Corporation records changes in the fair value of derivatives used as hedges of the net investment in foreign operations as a component of Accumulated OCI, to the extent effective.
The Corporation, from time to time, purchases or issues financial instruments containing embedded derivatives. The embedded derivative is separated from the host contract and carried at fair value if the economic characteristics of the derivative are not clearly and closely related to the economic characteristics of the host contract. To the extent that the Corporation cannot reliably identify and measure the embedded derivative, the entire contract is carried at fair value on the Consolidated Balance Sheet with changes in fair value reflected in earnings.
If a derivative instrument in a fair value hedge is terminated or the hedge designation removed, the previous adjustments of the carrying amount of the hedged asset or liability are subsequently accounted for in the same manner as other components of the carrying amount of that asset or liability. For interest-earning assets and interest-
BANK OF AMERICA CORPORATION AND SUBSIDIARIES
Notes to Consolidated Financial Statements—(Continued)
bearing liabilities, such adjustments are amortized to earnings over the remaining life of the respective asset or liability. If a derivative instrument in a cash flow hedge is terminated or the hedge designation is removed, related amounts in Accumulated OCI are reclassified into earnings in the same period or periods during which the hedged forecasted transaction affects earnings.
Interest Rate Lock Commitments The Corporation enters into interest rate lock commitments (IRLCs) in connection with its mortgage banking activities to fund residential mortgage loans at specified times in the future. IRLCs that relate to the origination of mortgage loans that will be held for sale are considered derivative instruments under SFAS No. 149, “Amendment of Statement 133 on Derivative Instruments and Hedging Activities” (SFAS 149). As such, these IRLCs are recognized
|
The Corporation enters into interest rate lock commitments (IRLCs) in connection with its mortgage banking activities to fund residential mortgage loans at specified times in the future. IRLCs that relate to the origination of mortgage loans that will be held for sale are considered derivative instruments under SFAS No. 149, “Amendment of Statement 133 on Derivative Instruments and Hedging Activities.” As such, these IRLCs are recorded at fair value with changes in fair value recorded in Mortgage Banking Income. Consistent with SEC SAB No. 105, “Application of Accounting Principles to Loan Commitments,” the Corporation does not record any unrealized gain or loss at the inception of the loan commitment, which is the time the commitment is issued to the borrower. The Corporation records unrealized gains or losses based upon subsequent changes in the value from the inception of the loan commitment. In estimating the fair value of an IRLC, the Corporation assigns a probability to the loan commitment based on an expectation that it will be exercised and the loan will be funded. The fair value of the commitments is derived from the fair value of related mortgage loans which is based on observable market data. Changes to the fair value of IRLCs are recognized based on interest rate changes, changes in the probability that the commitment will be exercised and the passage of time. Changes from the expected future cash flows related to the customer relationship or loan servicing are excluded from the valuation of the IRLCs. Outstanding IRLCs expose the Corporation to the risk that the price of the loans underlying the commitments might decline from inception of the rate lock to funding of the loan. To protect against this risk, the Corporation utilizes forward loan sales commitments and other derivative instruments, including interest rate swaps and options, to economically hedge the risk of potential changes in the value of the loans that would result from the commitments. The changes in the fair value of these derivatives are recorded in Mortgage Banking Income. Consistent with SEC Staff Accounting Bulletin No. 105, “Application of Accounting Principles to Loan Commitments,” the Corporation does not record any unrealized gain or loss at the inception of the loan commitment, which is the time the commitment is issued to the borrower. The initial value of the loan commitment derivative is based on the consideration exchanged, if any, for entering into the commitment. In estimating the subsequent fair value of an IRLC, the Corporation assigns a probability to the loan commitment based on an expectation that it will be exercised and the loan will be funded. This probability is commonly referred to as the pull through assumption. The fair value of the commitments is derived from the fair value of related mortgage loans, which is based on a highly liquid, readily observable market. Changes to the fair value of IRLCs are recognized based on interest rate changes, changes in the probability that the commitment will be exercised and the passage of time. Changes from the expected future cash flows related to the customer relationship or loan servicing are excluded from the valuation of the IRLCs.
Outstanding IRLCs expose the Corporation to the risk that the price of the loans underlying the commitments might decline from inception of the rate lock to funding of the loan due to increases in mortgage interest rates. To protect against this risk, the Corporation utilizes forward loan sales commitments and other derivative instruments, including options, to economically hedge the risk of potential changes in the value of the loans that would result from the commitments. The Corporation expects that the changes in the fair value of these derivative instruments will offset changes in the fair value of the IRLCs.
| Securities Debt securities
|
Debt Securities are classified based on management’s intention on the date of purchase and recorded on the Consolidated Balance Sheet as Debt Securities as of the trade date. Debt Securities as of the trade date. Debt securities which management has the intent and ability to hold to maturity are classified as held-to-maturity and reported at amortized cost. Debt Securities that are bought and held principally for the purpose of resale in the near term are classified as Trading Account Assets and are stated at fair value with unrealized gains and losses included in Trading Account Profits. All other Debt Securities that management has the intent and ability to hold to recovery unless there is a significant deterioration in credit quality in any individual security are classified as available-for-sale (AFS) and carried at fair value with net unrealized gains and losses included in Accumulated OCI on an after-tax basis. Interest on Debt Securities, including amortization of premiums and accretion of discounts, is included in Interest Income. Realized gains and losses from the sales of Debt Securities, which are included in Gains (Losses) on Sales of Debt Securities, are determined using the specific identification method. Marketable equity securities are classified based on management’s intention on the date of purchase and recorded on the Consolidated Balance Sheet as of the trade date. Marketable equity securities that are bought and held principally for the purpose of resale in the near term are classified as Trading Account Assets and are stated at fair value with unrealized gains and losses included in Trading Account Profits. Other marketable equity securities are accounted for as AFS and classified in the near term are classified as trading instruments and are stated at fair value with unrealized gains and losses included in Trading Account Profits. All other debt securities are classified as available-for-sale (AFS) and carried at fair value with net unrealized gains and losses included in Accumulated OCI on an after-tax basis. Interest on debt securities, including amortization of premiums and accretion of discounts, are included in Interest Income. Realized gains and losses from the sales of debt securities, which are included in Gains on Sales of Debt Securities, are determined using the specific identification method.
Marketable equity securities are classified based on management’s intention on the date of purchase and recorded on the Consolidated Balance Sheet as of the trade date. Marketable equity securities that are bought and held principally for the purpose of resale in the near term are classified as trading instruments and are stated at fair value with unrealized gains and losses included in Trading Account Profits. Other marketable equity securities are classified as AFS and either recorded as AFS Securities, if they are a component of the ALM portfolio, or otherwise recorded as Other Assets. All AFS marketable equity securities are carried at fair value with net unrealized gains and losses included in Accumulated OCI on an after-tax basis. Dividend income on AFS marketable equity securities is included in Interest Income. Dividend income on marketable equity securities recorded in Other Assets is included in Noninterest Income. Realized gains and losses on the sale of all AFS marketable equity securities, which are recorded in Equity Investment Gains, are determined using the weighted average method.
Investments in equity securities without readily determinable market values are recorded in Other Assets, are generally accounted for using the cost method and are subject to impairment testing as applicable.
Equity investments held by Principal Investing, a diversified equity investor in companies at all stages of their life cycle from startup to buyout, are reported at fair value. Equity investments for which there are active market quotes are
BANK OF AMERICA CORPORATION AND SUBSIDIARIES
Notes to Consolidated Financial Statements—(Continued)
carried at estimated fair value based on market prices and recorded as Other Assets. All AFS marketable equity securities in which management has the intent and ability to hold to recovery are carried at fair value with net unrealized gains and losses included in Accumulated OCI on an after-tax basis. Dividend income on all AFS marketable equity securities is included in Equity Investment Gains. Realized gains and losses on the sale of all AFS marketable equity securities, which are recorded in Equity Investment Gains, are determined using the specific identification method.
Investments in equity securities without readily determinable market values are recorded in Other Assets, are accounted for using the cost method and are subject to impairment testing as applicable. Equity investments held by Principal Investing, a diversified equity investor in companies at all stages of their life cycle from startup to buyout, are reported at fair value pursuant to American Institute of Certified Public Accountants (AICPA) Investment Company Audit Guide and recorded in Other Assets. These investments are made either directly in a company or held through a fund. Equity investments for which there are active market quotes are carried at estimated fair value based on market prices. Nonpublic and other equity investments for which representative market quotes are not readily available are initially valued at cost. Subsequently, these investments are reviewed semi-annually or on a quarterly basis, where appropriate, and adjusted to reflect changes in value as a result of initial public offerings, market liquidity, the investees’ financial results, sales restrictions, or other than temporary declines in value. Gains and losses on these equity investments, both unrealized and realized, are recorded in Equity Investment Gains. Loans are reported at their outstanding principal balances net of any unearned income, charge-offs, unamortized deferred fees and costs on originated loans, and premiums or discounts on purchased loans. Loan origination fees and certain direct origination costs are deferred and recognized as adjustments to income over the lives of the related loans. Unearned income, discounts and premiums are amortized to income using methods that approximate the interest method. The Corporation purchases loans with and without evidence of credit quality deterioration since origination. Those loans with evidence of credit quality deterioration for which it is probable at purchase that we will be unable to collect all contractually required payments are accounted for under AICPA Statement of Position 03-3, “Accounting for Certain Loans or Debt Securities Acquired in a Transfer” (SOP 03-3). SOP 03-3 addresses accounting for differences between contractual cash flows and cash flows expected to be collected from an investor’s initial investment in loans acquired in a transfer if those differences are attributable, at least in part, to credit quality. SOP 03-3 requires impaired loans be recorded at fair value and prohibits “carrying over” or the creation of valuation allowances in the initial accounting of loans acquired in a transfer that are within the scope of this SOP (categories of loans for which it is probable, at the time of acquisition, that all amounts due according to the contractual terms of the loan agreement will not be collected). The prohibition of the valuation allowance carryover applies to the purchase of an individual loan, a pool of loans, a group of loans, and loans acquired in a purchase business combination. Under SOP 03-3, the excess of cash flows expected at purchase over the purchase price is recorded as interest income over the life of the loan. For those loans not within the scope of SOP 03-3 any difference between the purchase price and the par value of the loan is reflected in interest income over the life of the loan. The Corporation provides equipment financing to its customers through a variety of lease arrangements. Direct financing leases are carried at the aggregate of lease payments receivable plus estimated residual value of the leased property less unearned income. Leveraged leases, which are a form of financing leases, are carried net of nonrecourse debt. Unearned income on leveraged and direct financing leases is accreted to earnings over the lease terms by methods that approximate the interest method. The Corporation provides equipment financing to its customers through a variety of lease arrangements. Direct financing leases are carried at the aggregate of lease payments receivable plus estimated residual value of the leased property, less unearned income. Leveraged leases, which are a form of financing lease, are carried net of nonrecourse debt. Unearned income on leveraged and direct financing leases is amortized over the lease terms by methods that approximate the interest method.
| Allowance for Credit Losses |
The allowance for credit losses which includes the Allowance for Loan and Lease Losses and the reserve for unfunded lending commitments, represents management’s estimate of probable losses inherent in the Corporation’s lending activities. The Allowance for Loan and Lease Losses represents the estimated probable credit losses in funded consumer and commercial loans and leases while the reserve for unfunded lending commitments, including standby letters of credit (SBLCs) and binding unfunded loan commitments, represents estimated probable credit losses in these off-balance sheet credit instruments based on utilization assumptions. Credit exposures, excluding Derivative Assets and Trading Account Assets, deemed to be uncollectible are charged against these accounts. Cash recovered on previously charged off amounts are credited to these accounts. The Corporation performs periodic and systematic detailed reviews of its lending portfolios to identify credit risks and to assess the overall collectibility of those portfolios. The allowance on certain homogeneous loan portfolios, which generally consist of consumer loans, is based on aggregated portfolio segment evaluations generally by product type. Loss forecast models are utilized for these segments which consider a variety of factors including, but not limited to, historical loss experience, estimated defaults or foreclosures based on portfolio trends, delinquencies, economic conditions and credit scores. These consumer loss forecast models are updated on a quarterly basis in order to incorporate information reflective of the current economic environment. The remaining commercial portfolios are reviewed on an individual loan basis. Loans subject to individual reviews are analyzed and segregated by risk according to the Corporation’s internal risk rating scale. These risk classifications, in conjunction with an analysis of historical loss experience, current economic conditions, industry performance trends, geographic or obligor concentrations within each portfolio segment, and any other pertinent information (including individual valuations on nonperforming loans in accordance with SFAS No. 114, “Accounting by Creditors for Impairment of a Loan,” (SFAS 114)) result in the estimation of the allowance for credit losses. The historical loss experience is updated quarterly to incorporate the most recent data reflective of the current economic environment.
If necessary, a specific Allowance for Loan and Lease Losses is established for individual impaired commercial loans. A loan is considered impaired when, based on current information and events, it is probable that the Corporation will be unable to collect all amounts due, including principal and interest, according to the contractual terms of the agreement. Once a loan has been identified as individually impaired, management measures impairment in accordance with SFAS 114. Individually impaired loans are measured based on the present value of payments expected to be received, observable market prices, or for loans that are solely dependent on the collateral for repayment, the estimated fair value of the collateral. If the recorded investment in impaired loans exceeds the present value of payments expected to be received, a specific allowance is established as a component of the Allowance for Loan and Lease Losses.
Two components of the Allowance for Loan and Lease Losses and the reserve for unfunded lending commitments, represents management’s estimate of probable losses inherent in the Corporation’s lending activities. The Allowance for Loan and Lease Losses represents the estimated probable credit losses in funded consumer and commercial loans and leases while the reserve for unfunded lending commitments, including standby letters of credit (SBLCs) and binding unfunded loan commitments, represents estimated probable credit losses on these unfunded credit instruments based on utilization assumptions. Credit exposures, excluding Derivative Assets and Trading Account Assets, deemed to be uncollectible are charged against these accounts. Cash recovered on previously charged off amounts are recorded as recoveries to these accounts.
The Corporation performs periodic and systematic detailed reviews of its lending portfolios to identify credit risks and to assess the overall collectibility of those portfolios. The allowance on certain homogeneous loan portfolios, which generally consist of consumer and certain commercial loans such as the business card and small business portfolio, is based on aggregated portfolio segment evaluations generally by product type. Loss forecast models are utilized for these segments which consider a variety of factors including, but not limited to, historical loss experience, estimated defaults or foreclosures based on portfolio trends, delinquencies, economic conditions and credit scores. These models are updated on a quarterly basis in order to incorporate information reflective of the current economic environment. The remaining commercial portfolios are reviewed on an individual loan basis. Loans subject to individual reviews are analyzed and segregated by risk according to the Corporation’s internal risk rating scale. These risk classifications, in conjunction with an analysis of historical loss experience, current economic conditions, industry performance trends, geographic or obligor concentrations within each portfolio segment, and any other pertinent information (including individual valuations on nonperforming loans in accordance with SFAS No. 114, “Accounting by Creditors for Impairment of a Loan,” (SFAS 114)) result in the estimation of the allowance for credit losses. The historical loss experience is updated quarterly to incorporate the most recent data reflective of the current economic environment. If necessary, a specific Allowance for Loan and Lease Losses is established for individual impaired commercial loans. A loan is considered impaired when, based on current information and events, it is probable that the Corporation will be unable to collect all amounts due, including principal and interest, according to the contractual terms of the agreement. Once a loan has been identified as individually impaired, management measures impairment in accordance with SFAS 114. Individually impaired loans are measured based on the present value of payments expected to be received, observable market prices, or for loans that are solely dependent on the collateral for repayment, the estimated fair value of the collateral. If the recorded investment in impaired loans exceeds the present value of payments expected to be received, a specific allowance is established as a component of the Allowance for Loan and Lease Losses. The Allowance for Loan and Lease Losses includes two components which are allocated to cover the estimated probable losses in each loan and lease category based on the results of the Corporation’s detailed review process described above. The first component covers those commercial loans that are either nonperforming or impaired. The second component covers those commercial loans that are either nonperforming or impaired. The second component covers BANK OF AMERICA CORPORATION AND SUBSIDIARIES
Notes to Consolidated Financial Statements—(Continued)
consumer loans and leases, and performing commercial loans and leases. Included within this second component of the Allowance for Loan and Lease Losses and determined separately from the procedures outlined above are reserves which are maintained to cover uncertainties that affect the Corporation’s estimate of probable losses including the imprecision inherent in the forecasting methodologies, as well as domestic and global economic uncertainty and large single name defaults or event risk. Management evaluates the adequacy of the Allowance for Loan and Lease Losses based on the combined total of these two components. In addition to the Allowance for Loan and Lease Losses, the Corporation also estimates probable losses related to unfunded lending commitments, such as letters of credit and financial guarantees, and binding unfunded loan commitments. Unfunded lending commitments are subject to individual reviews and are analyzed and segregated by risk according to the Corporation’s internal risk rating scale. These risk classifications, in conjunction with an analysis of historical loss experience, current economic conditions, performance trends within specific portfolio segments and any other pertinent information, result in the estimation of the reserve for unfunded lending commitments. The allowance for credit losses related to the loan and lease portfolio, and the reserve for unfunded lending commitments are reported on the Consolidated Balance Sheet in the Allowance for Loan and Lease Losses, and Accrued Expenses and Other Liabilities. Provision for Credit Losses related to the loans and leases portfolio and unfunded lending commitments are subject to individual reviews and are analyzed and segregated by risk according to the Corporation’s internal risk rating scale. These risk classifications, in conjunction with an analysis of historical loss experience, utilization assumptions, current economic conditions, performance trends within specific portfolio segments and any other pertinent information, result in the estimation of the reserve for unfunded lending commitments.
The allowance for credit losses related to the loan and lease portfolio is reported on the Consolidated Balance Sheet in the Allowance for Loan and Lease Losses. The allowance for credit losses related to the reserve for unfunded lending commitments is reported on the Consolidated Balance Sheet in Accrued Expenses and Other Liabilities. Provision for Credit Losses related to the loan and lease portfolio and unfunded lending commitments is reported in the Consolidated Statement of Income in the Provision for Credit Losses. | Nonperforming Loans and Leases, Charge-offs, and Delinquencies Credit
|
In accordance with the Corporation’s policies, non-bankrupt credit card loans are charged off at 180 days past due or 60 days from notification of bankruptcy filing and are not classified as nonperforming. Unsecured consumer loans and deficiencies in non-real estate secured loans are charged off at 120 days past due and not classified as nonperforming. Real estate secured consumer loans are placed on nonaccrual status and classified as nonperforming at 90 days past due. The amount deemed uncollectible on real estate secured loans is charged off at 180 days past due. Consumer loans, open-end unsecured consumer loans, and real estate secured loans are charged off no later than the end of the month in which the account becomes 180 days past due. Personal property secured loans are charged off no later than the end of the month in which the account becomes 120 days past due. Accounts in bankruptcy are written down to collateral value either 60 days after bankruptcy notification (credit card and certain open-end unsecured accounts) or no later than the end of the month in which the account becomes 60 days past due. Only real estate secured accounts are generally placed into non accrual status and classified as nonperforming at 90 days past due. These loans can be returned to performing status when principal or interest is less than 90 days past due. Commercial loans and leases, excluding business card loans, that are past due 90 days or more as to principal or interest, or where reasonable doubt exists as to timely collection, including loans that are individually identified as being impaired, are generally classified as nonperforming unless well-secured and in the process of collection. Loans whose contractual terms have been restructured in a manner which grants a concession to a borrower experiencing financial difficulties, without compensation on restructured loans, are classified as nonperforming until the loan is performing for an adequate period of time under the restructured agreement. In situations where the Corporation does not receive adequate compensation, the restructuring is considered a troubled debt restructuring. Interest accrued but not collected is reversed when a commercial loan is classified as nonperforming. Interest collections on commercial nonperforming loans and leases for which the ultimate collectibility of principal is uncertain are applied as principal reductions; otherwise, such collections are credited to income when received. Commercial loans and leases may be restored to performing status when all principal and interest is current and full repayment of the remaining contractual principal and interest is expected, or when the loan otherwise becomes well-secured and is in the process of collection. Business card loans are charged off no later than the end of the month in which the account becomes 180 days past due or in which 60 days has elapsed since receipt of notification of bankruptcy filing, whichever comes first, and are not classified as nonperforming. The entire balance of an account is contractually delinquent if the minimum payment is not received by the specified due date on the customer’s billing statement. Interest and fees continue to accrue on past due loans until the date the loan goes into nonaccrual status, if applicable. Delinquency is reported on accruing loans that are 30 days or more past due. Commercial loans and leases that are past due 90 days or more as to principal or interest, or where reasonable doubt exists as to timely collection, including loans that are individually identified as being impaired, are generally classified as nonperforming unless well-secured and in the process of collection. Loans whose contractual terms have been restructured in a manner which grants a concession to a borrower experiencing financial difficulties, without compensation on restructured loans, are classified as nonperforming until the loan is performing for an adequate period of time under the restructured agreement. In situations where the Corporation does not receive adequate compensation, the restructuring is considered a troubled debt restructuring. Interest accrued but not collected is reversed when a commercial loan is classified as nonperforming. Interest collections on commercial nonperforming loans and leases for which the ultimate collectibility of principal is uncertain are applied as principal reductions; otherwise, such collections are credited to income when received. Commercial loans and leases may be restored to performing status when all principal and interest is current and full repayment of the remaining contractual principal and interest is expected, or when the loan otherwise becomes well-secured and is in the process of collection.
Loans held-for-sale include residential mortgage, loan syndications, and to a lesser degree, commercial real estate, consumer finance and other loans, and are carried at the lower of aggregate cost or market value. Loans held-for-sale are included in Other Assets. Premises and Equipment are stated at cost less accumulated depreciation and amortization. Depreciation and amortization are recognized using the straight-line method over the estimated useful lives of the assets. Estimated lives range up to 40 years for buildings, up to 12 years for furniture and equipment, and the shorter of lease term or estimated useful life for leasehold improvements. | Mortgage Servicing Rights Pursuant to agreements between
|
Effective January 1, 2006, the Corporation early adopted SFAS 156 and began accounting for consumer-related MSRs at fair value with changes in fair value recorded in Mortgage Banking Income, while commercial-related MSRs continue to be accounted for using the amortization method (i.e., lower of cost or market) with impairment recognized as a reduction to Mortgage Banking Income. Certain derivatives are used as economic hedges of the MSRs, but are not designated as hedges under SFAS 133. These derivatives are marked to market and recognized through Mortgage Banking Income. Prior to January 1, 2006, the Corporation applied SFAS 133 hedge accounting for derivative financial instruments that had been designated to hedge MSRs. The loans underlying the MSRs being hedged were stratified into pools that possessed similar interest rate and prepayment risk exposures. The Corporation had designated the hedged risk as the change in the overall fair value of these stratified pools within a daily hedge period. The Corporation performed both prospective and retrospective hedge effectiveness evaluations, using regression analyses. A prospective test was performed to determine whether the hedge was expected to be highly effective at the inception of the hedge. A retrospective test was performed at the end of the daily hedge period to determine whether the hedge was actually effective. Debt Securities were also used as economic hedges of MSRs and were accounted for as AFS Securities with realized gains recorded in Gains (Losses) on Sales of Debt Securities and unrealized gains or losses recorded in Accumulated OCI in Shareholders’ Equity. For additional information on MSRs, see Note 8 of the Consolidated Financial Statements. | Goodwill and its counterparties, $2.2 billion of Excess Spread Certificates (the Certificates) were converted into MSRs on June 1, 2004. Prior to the conversion of the Certificates into MSRs, the Certificates were accounted for on a mark-to-market basis (i.e. fair value) and changes in the value were recognized as Trading Account Profits. On the date of the conversion, the Corporation recorded these MSRs at the Certificates’ fair market value, and that value became their new cost basis. Subsequent to the conversion, the Corporation accounts for BANK OF AMERICA CORPORATION AND SUBSIDIARIESIntangible Assets
|
Net assets of companies acquired in purchase transactions are recorded at fair value at the date of acquisition. Identified intangibles are amortized on an accelerated or straight-line basis over the estimated period of benefit. Goodwill is not amortized but is reviewed for potential impairment on an annual basis, or when events or circumstances indicate a potential impairment, at the reporting unit level. The impairment test is performed in two phases. The first step of the Goodwill impairment test compares the fair value of the reporting unit with its carrying amount, including Goodwill. If the fair value of the reporting unit exceeds its carrying amount, Goodwill of the reporting unit is considered not impaired; however, if the carrying amount of the reporting unit exceeds its fair value, an additional step has to be performed. This additional step compares the implied fair value of the reporting unit’s Goodwill (as defined in SFAS No. 142, “Goodwill and Other Intangible Assets”) with the carrying amount of that Goodwill. An impairment loss is recorded to the extent that the carrying amount of Goodwill exceeds its implied fair value. In 2006, 2005, and 2004, Goodwill was tested for impairment and it was determined that Goodwill was not impaired at any of these dates. Intangible Assets subject to amortization are evaluated for impairment in accordance with SFAS No. 144 “Accounting for the Impairment or Disposal of Long-Lived Assets.” An impairment loss will be recognized if the carrying amount of the Intangible Asset is not recoverable and exceeds fair value. The carrying amount of the intangible is considered not recoverable if it exceeds the sum of the undiscounted cash flows expected to result from the use of the asset. At December 31, 2006, Intangible Assets included on the Consolidated Balance Sheet consist of purchased credit card relationship intangibles, core deposit intangibles, affinity relationships, and other intangibles that are amortized on an accelerated or straight-line basis over anticipated periods of benefit of up to 15 years. There were no events or changes in circumstances in 2006, 2005, and 2004 that indicated the carrying amounts of our intangibles may not be recoverable. | Notes to Consolidated Financial Statements—(Continued)Special Purpose Financing Entities
the MSRs at the lower of cost or market with impairment recognized as a reduction of Mortgage Banking Income. Except for Note 9 of the Consolidated Financial Statements, what are now referred to as MSRs include the Certificates for periods prior to the conversion.
During 2004, the Corporation discussed with the Staff the accounting treatment for the Certificates and MSRs. As a result of this discussion, the conclusion was reached that the Certificates lacked sufficient separation from the MSRs to be accounted for as described above (i.e. fair value). Accordingly, the Corporation should have continued to account for the Certificates as MSRs (i.e. lower of cost or market). The effect on our previously filed Consolidated Financial Statements of following lower of cost or market accounting for the Certificates compared to fair value accounting (i.e. the prior accounting) was adjusted and was not material.
When applying SFAS 133 hedge accounting for derivative financial instruments that have been designated to hedge MSRs, loans underlying the MSRs being hedged are stratified into pools that possess similar interest rate and prepayment risk exposures. The Corporation has designated the hedged risk as the change in the overall fair value of these stratified pools within a daily hedge period. The Corporation performs both prospective and retrospective hedge effectiveness evaluations, using regression analyses. A prospective test is performed to determine whether the hedge is expected to be highly effective at the inception of the hedge. A retrospective test is performed at the end of the daily hedge period to determine whether the hedge was actually effective.
Other derivatives are used as economic hedges of the MSRs, but are not designated as hedges under SFAS 133. These derivatives are marked to market and recognized through Mortgage Banking Income. Securities are also used as economic hedges of MSRs, but do not qualify as hedges under SFAS 133 and, therefore, are accounted for as AFS Securities with realized gains recorded in Gains on Sales of Debt Securities and unrealized gains or losses recorded in Accumulated OCI in Shareholders’ Equity.
Goodwill and Other Intangibles
Net assets of companies acquired in purchase transactions are recorded at fair value at the date of acquisition, as such, the historical cost basis of individual assets and liabilities are adjusted to reflect their fair value. Identified intangibles are amortized on an accelerated or straight-line basis over the period benefited. Goodwill is not amortized but is reviewed for potential impairment on an annual basis, or if events or circumstances indicate a potential impairment, at the reporting unit level. The impairment test is performed in two phases. The first step of the Goodwill impairment test compares the fair value of the reporting unit with its carrying amount, including Goodwill. If the fair value of the reporting unit exceeds its carrying amount, Goodwill of the reporting unit is considered not impaired; however, if the carrying amount of the reporting unit exceeds its fair value, an additional procedure must be performed. That additional procedure compares the implied fair value of the reporting unit’s Goodwill (as defined in SFAS No. 142, “Goodwill and Other Intangible Assets” (SFAS 142)) with the carrying amount of that Goodwill. An impairment loss is recorded to the extent that the carrying amount of Goodwill exceeds its implied fair value. In 2005, 2004 and 2003, Goodwill was tested for impairment and no impairment charges were recorded.
Other intangible assets subject to amortization are evaluated for impairment in accordance with SFAS No. 144 “Accounting for the Impairment or Disposal of Long-Lived Assets” (SFAS 144). An impairment loss will be recognized if the carrying amount of the intangible asset is not recoverable and exceeds fair value. The carrying amount of the intangible is considered not recoverable if it exceeds the sum of the undiscounted cash flows expected to result from the use of the asset. At December 31, 2005, intangible assets included on the Consolidated Balance Sheet consist of core deposit intangibles, purchased credit card relationship intangibles and other customer-related intangibles that are amortized on an accelerated or straight-line basis using an estimated range of anticipated lives of 6 to 10 years.
|
In the ordinary course of business, the Corporation supports its customers’ financing needs by facilitating the customers’ access to different funding sources, assets and risks. In addition, the Corporation utilizes certain financing arrangements to meet its balance sheet management, funding, liquidity, and market or credit risk management needs. These financing entities may be in the form of corporations, partnerships, limited liability companies or trusts, and are generally not consolidated on the Corporation’s Consolidated Balance Sheet. The majority of these activities are basic term or revolving securitization vehicles for mortgages, credit cards or other types of loans which are generally funded through term-amortizing debt structures. Other special purpose entities finance their activities by issuing short-term commercial paper. The securities issued from both types of vehicles are designed to be paid off from the underlying cash flows of the vehicles’ assets or the reissuance of commercial paper. Securitizations The Corporation securitizes, sells and services interests in residential mortgage loans and credit card loans, and from time to time, automobile, consumer finance and commercial loans. The accounting for these activities is governed by SFAS No. 140, “Accounting for Transfers and Servicing of Financial Assets and Extinguishments of Liabilities—a replacement of FASB Statement No. 125” (SFAS 140). The securitization vehicles are Qualified Special Purpose Entities (QSPEs) which, in accordance with SFAS 140, are legally isolated, bankruptcy remote and beyond the control of the seller. QSPEs are not included in the consolidated financial statements of the seller. When the Corporation securitizes assets, it may retain interest- only strips, one or more subordinated tranches, subordinated interests in accrued interest and fees on the securitized receivables and, in some cases, cash reserve accounts which are generally considered residual interests in the securitized assets. The Corporation may also retain senior tranches in these securitizations. Gains and losses upon sale of the assets are based on an allocation of the previous carrying amount of the assets to the retained interests. Carrying amounts of assets transferred are allocated in proportion to the relative fair values of the assets sold and interests retained. Quoted market prices are used to obtain fair values of senior retained interests. Generally, quoted market prices for retained residual interests are not available; therefore, the Corporation estimates fair values based upon the present value of the associated expected future cash flows. This may require management to estimate credit losses, prepayment speeds, forward interest yield curves, discount rates and other factors that impact the value of retained interests. See Note 9 of the Consolidated Financial Statements for further discussion. Interest-only strips retained in connection with credit card securitizations are classified in Other Assets and carried at fair value, with changes in fair value recorded in Card Income. Other retained interests are primarily classified in Other Assets or AFS Securities and carried at fair value or amounts that approximate fair value with changes in fair value recorded in Accumulated OCI. The excess cash flows expected to be received over the amortized cost of these retained interests is recognized as Interest Income using the effective yield method. If the fair value of such retained interests has declined below its carrying amount and there has been an adverse change in estimated contractual cash flows of the underlying assets, then such decline is determined to be other-than-temporary and the retained interest is written down to fair value with a corresponding adjustment to earnings. Other Special Purpose Financing Entities In the ordinary course of business, the Corporation supports its customers’ financing needs by facilitating the customers’ access to different funding sources, assets and risks. In addition, the Corporation utilizes certain financing arrangements to meet its balance sheet management, funding, liquidity, and market or credit risk management needs. These financing entities may be in the form of corporations, partnerships, limited liability companies or trusts, and are generally not consolidated on the Corporation’s Consolidated Balance Sheet. The majority of these activities are basic term or revolving securitization vehicles for mortgages or other types of loans which are generally funded through term-amortizing debt structures. Other special purpose entities finance their activities by issuing short-term commercial paper. Both types of vehicles are designed to be paid off from the underlying cash flows of the assets held in the vehicle.
BANK OF AMERICA CORPORATION AND SUBSIDIARIES
Notes to Consolidated Financial Statements—(Continued)
Securitizations
The Corporation securitizes, sells and services interests in residential mortgage loans, and from time to time, consumer finance, commercial and credit card loans. The accounting for these activities are governed by SFAS 140. The securitization vehicles are Qualified Special Purpose Entities (QSPEs) which, in accordance with SFAS 140, are legally isolated, bankruptcy remote and beyond the control of the seller. QSPEs are not included in the consolidated financial statements of the seller. When the Corporation securitizes assets, it may retain interest-only strips, one or more subordinated tranches and, in some cases, a cash reserve account which are generally considered residual interests in the securitized assets. The Corporation may also retain senior tranches in these securitizations. Gains and losses upon sale of the assets depend, in part, on the Corporation’s allocation of the previous carrying amount of the assets to the retained interests. Previous carrying amounts are allocated in proportion to the relative fair values of the assets sold and interests retained.
Quoted market prices are used to obtain fair values of senior retained interests. Generally, quoted market prices for retained residual interests are not available; therefore, the Corporation estimates fair values based upon the present value of the associated expected future cash flows. This may require management to estimate credit losses, prepayment speeds, forward yield curves, discount rates and other factors that impact the value of retained interests. See Note 9 of the Consolidated Financial Statements for further discussion.
The excess cash flows expected to be received over the amortized cost of the retained interest is recognized as Interest Income using the effective yield method. If the fair value of the retained interest has declined below its carrying amount and there has been an adverse change in estimated contractual cash flows of the underlying assets, then such decline is determined to be other-than-temporary and the retained interest is written down to fair value with a corresponding adjustment to earnings.
Other Special Purpose Financing Entities
Other special purpose financing entities are generally funded with short-term commercial paper. These financing entities are usually contractually limited to a narrow range of activities that facilitate the transfer of or access to various types of assets or financial instruments and provide the investors in the transaction protection from creditors of the Corporation in the event of bankruptcy or receivership of the Corporation. In certain situations, the Corporation provides liquidity commitments and/or loss protection agreements. The Corporation determines whether these entities should be consolidated by evaluating the degree to which it maintains control over the financing entity and will receive the risks and rewards of the assets in the financing entity. In making this determination, the Corporation considers whether the entity is a QSPE, which is generally not required to be consolidated by the seller or investors in the entity. For non-QSPE structures or VIEs, the Corporation assesses whether it is the primary beneficiary of the entity. In accordance with FASB Interpretation No. 46 (Revised December 2003), “Consolidation of Variable Interest Entities, an interpretation of ARB No. 51” (FIN 46R), the primary beneficiary is the party that consolidates a VIE based on its assessment that it will absorb a majority of the expected losses or expected residual returns of the entity, or both. For additional information on other special purpose financing entities, see Note 9 of the Consolidated Financial Statements. The Corporation accounts for income taxes in accordance with SFAS No. 109, “Accounting for Income Taxes” (SFAS 109), resulting in two components of Income Tax Expense: current and deferred. Current income tax expense approximates taxes to be paid or refunded for the current period. Deferred income tax expense results from changes in deferred tax assets and liabilities between periods. These gross deferred tax assets and liabilities represent decreases or increases in taxes expected to be paid in the future because of future reversals of temporary differences in the bases of assets and liabilities as measured by tax laws and their bases as reported in the financial statements. Deferred tax assets have also been recognized for net operating loss carryforwards and tax credit carryforwards. Valuation allowances are then recorded to reduce deferred tax assets to the amounts management concludes are more likely than not to be realized. For additional information on income taxes, see Note 18 of the Consolidated Financial Statements. Deferred tax assets have also been recognized for net operating loss carryforwards and tax credit carryforwards. Valuation allowances are then recorded to reduce deferred tax assets to the amounts management concludes are more likely than not to be realized.
The Corporation has established qualified retirement plans covering substantially all full-time and certain part-time employees. Pension expense under these plans is charged to current operations and consists of several components of net pension cost based on various actuarial assumptions regarding future experience under the plans. In addition, the Corporation has established unfunded supplemental benefit plans and supplemental executive retirement plans for selected officers of the Corporation and its subsidiaries (SERPS) that provide benefits that cannot be paid from a qualified retirement plan due to Internal Revenue Code restrictions. The SERPS are frozen and the executive offices do not accrue any additional benefits. These plans are nonqualified under the Internal Revenue Code and assets used to fund benefit payments are not segregated from other assets of the Corporation; therefore, in general, a participant’s or beneficiary’s claim to benefits under these plans is as a general creditor. In addition, the Corporation has established several postretirement healthcare and life insurance benefit plans. The Corporation accounts for its retirement benefit plans in accordance with SFAS No. 87, “Employers’ Accounting for Pensions” (SFAS 87), SFAS No. 88, “Employers’ Accounting for Settlements and Curtailment of Defined Benefit Pension Plans and for Termination Benefits,” and SFAS No. 106, “Employers Accounting for Postretirement Benefits Other Than Pensions,” as applicable. On December 31, 2006, the Corporation adopted SFAS 158 which requires the recognition of a plan’s over-funded or under-funded status as an asset or liability with an offsetting adjustment to Accumulated OCI. SFAS 158 requires the determination of the fair values of a plan’s assets at a company’s year-end and recognition of actuarial gains and losses, prior service costs or credits, and transition assets or obligations as a component of Accumulated OCI. These amounts were previously netted against the plans’ funded status in the Corporation’s Consolidated Balance Sheet. These amounts will be subsequently recognized as components of net periodic benefit costs. Further, actuarial gains and losses that arise in subsequent periods that are not initially recognized as a component of net periodic benefit cost will be recognized as a component of Accumulated OCI. Those amounts will subsequently be recorded as a component of net periodic benefit cost as they are amortized during future periods. | BANK OF AMERICA CORPORATION AND SUBSIDIARIESAccumulated Other Comprehensive Income
Notes to Consolidated Financial Statements—(Continued)
|
The Corporation records gains and losses on cash flow hedges, unrealized gains and losses on AFS Securities, unrecognized actuarial gains and losses, transition obligation and prior service costs on Pension and Postretirement plans, foreign currency translation adjustments, and related hedges of net investments in foreign operations in Accumulated OCI, net of tax. Accumulated OCI also includes fair value adjustments on certain retained interests in the Corporation’s securitization transactions. Gains or losses on derivatives accounted for as cash flow hedges are reclassified to Net Income when the hedged transaction affects earnings. Gains and losses on AFS Securities are reclassified to Net Income as the gains or losses are realized upon sale of the securities. Other-than-temporary impairment charges are reclassified to Net Income at the time of the charge. Translation gains or losses on foreign currency translation adjustments are reclassified to Net Income upon the substantial sale or liquidation of investments in foreign operations. In addition, the Corporation has established unfunded supplemental benefit plans and supplemental executive retirement plans for selected officers of the Corporation and its subsidiaries that provide benefits that cannot be paid from a qualified retirement plan due to Internal Revenue Code restrictions. These plans are nonqualified under the Internal Revenue Code and assets used to fund benefit payments are not segregated from other assets of the Corporation; therefore, in general, a participant’s or beneficiary’s claim to benefits under these plans is as a general creditor.
In addition, the Corporation has established several postretirement healthcare and life insurance benefit plans.
| Other Comprehensive Income
The Corporation records unrealized gains and losses on AFS Securities, foreign currency translation adjustments, related hedges of net investments in foreign operations and gains and losses on cash flow hedges in Accumulated OCI. Gains and losses on AFS Securities are reclassified to Net Income as the gains or losses are realized upon sale of the securities. Other-than-temporary impairment charges are reclassified to Net Income at the time of the charge. Translation gains or losses on foreign currency translation adjustments are reclassified to Net Income upon the sale or liquidation of investments in foreign operations. Gains or losses on derivatives accounted for as hedges are reclassified to Net Income when the hedged transaction affects earnings.
Earnings Per Common Share |
Earnings per Common Share is computed by dividing Net Income Available to Common Shareholders by the weighted average common shares issued and outstanding. For Diluted Earnings per Common Share, Net Income Available to Common Shareholders can be affected by the conversion of the registrant’s convertible preferred stock. Where the effect of this conversion would have been dilutive, Net Income Available to Common Shareholders is adjusted by the associated preferred dividends. This adjusted Net Income is divided by the weighted average number of common shares issued and outstanding for each period plus amounts representing the dilutive effect of stock options outstanding, restricted stock, restricted stock units and the dilution resulting from the conversion of the registrant’s convertible preferred stock, if applicable. The effects of convertible preferred stock, restricted stock, restricted stock units and stock options are excluded from the computation of diluted earnings per common share in periods in which the effect would be antidilutive. Dilutive potential common shares are calculated using the treasury stock method. | Foreign Currency Translation Assets, liabilities and operations of foreign branches and subsidiaries are recorded based on the functional currency of each entity. For certain of the foreign operations, the functional currency is the local currency, in which case the assets, liabilities and operations are translated, for consolidation purposes, at current exchange
|
Assets, liabilities and operations of foreign branches and subsidiaries are recorded based on the functional currency of each entity. For certain of the foreign operations, the functional currency is the local currency, in which case the assets, liabilities and operations are translated, for consolidation purposes, at period-end rates from the local currency to the reporting currency, the U.S. dollar. The resulting unrealized gains or losses are reported as a component of Accumulated OCI on an after-tax basis. When the foreign entity is not a free-standing operation or is in a hyperinflationary economy, the functional currency used to measure the financial statements of a foreign entity is the U.S. dollar. In these instances, the resulting realized gains or losses are reported as a component of Accumulated OCI on an after-tax basis. When the foreign entity’s functional currency is determined to be the U.S. dollar, the resulting remeasurement currency gains or losses on foreign denominated assets or liabilities are included in Net Income. | Co-Branding Credit Card Arrangements
The Corporation has co-brand arrangements that entitle a cardholder to receive benefits based on purchases made with the card. These arrangements have remaining terms generally not exceeding five years. The Corporation may pay one-time fees which would be deferred ratably over the term of the arrangement. The Corporation makes monthly payments to the co-brand partners based on the volume of cardholders’ purchases and on the number of points awarded to cardholders. Such payments are expensed as incurred and are recorded as contra-revenue.
|
Endorsing organization agreements The Corporation contracts with other organizations to obtain their endorsement of the Corporation’s loan products. This endorsement may provide the Corporation exclusive rights to market to the organization’s members or to customers on behalf of the Corporation. These organizations endorse the Corporation’s loan products and provide the Corporation with their mailing lists and marketing activities. These agreements generally have terms that range from five to seven years. The Corporation typically pays royalties in exchange for their endorsement. These compensation costs to the Corporation are recorded as contra-revenue against Card Income. Cardholder reward agreements The Corporation offers reward programs that allow its cardholders to earn points that can be redeemed for a broad range of rewards including cash, travel and discounted products. The Corporation establishes a rewards liability based upon the points earned which are expected to be redeemed and the average cost per point redemption. The points to be redeemed are estimated based on past redemption behavior, card product type, account transaction activity and other historical card performance. The liability is reduced as the points are redeemed. The estimated cost of the rewards programs is recorded as contra-revenue against Card Income. | Note 2—FleetBostonStock-based Compensation
|
On January 1, 2006, the Corporation adopted SFAS 123R under the modified-prospective application. The Corporation had previously adopted the fair value-based method of accounting for stock-based employee compensation under SFAS No. 148, “Accounting for Stock-Based Compensation – Transition and Disclosure – an amendment of FASB Statement No. 123,” (SFAS 148) prospectively, on January 1, 2003. Had the Corporation adopted SFAS 148 retrospectively, the impact in 2005 and 2004 would not have been material. For additional information on stock-based employee compensation, see Note 17 of the Consolidated Financial Statements. | NOTE 2 – MBNA Merger and Restructuring Activity Pursuant to the Agreement and Plan of Merger, dated October 27, 2003, by and between the Corporation and FleetBoston (the FleetBoston Merger Agreement), the
|
The Corporation acquired 100 percent of the outstanding stock of MBNA on January 1, 2006, for $34.6 billion. In connection therewith 1,260 million shares of MBNA common stock were exchanged for 631 million shares of the Corporation’s common stock. Prior to the MBNA merger, this represented approximately 16 percent of the Corporation’s outstanding common stock. MBNA shareholders also received cash of $5.2 billion. The MBNA merger was a tax-free merger for the Corporation. The acquisition expands the Corporation’s customer base and its opportunity to deepen customer relationships across the full breadth of the Corporation by delivering innovative deposit, lending and investment products and services to MBNA’s customer base. Additionally, the acquisition allows the Corporation to significantly increase its affinity relationships through MBNA’s credit card operations and sell these credit cards through our delivery channels (including the retail branch network). MBNA’s results of operations were included in the Corporation’s results beginning January 1, 2006. The MBNA merger was accounted for under the purchase method of accounting in accordance with SFAS No. 141, “Business Combinations.” The purchase price has been allocated to the assets acquired and the liabilities assumed based on their fair values at the MBNA merger date as summarized in the following table. | | | | | | | | | MBNA Purchase Price Allocation(In millions, except per share amounts) | | Purchase price | | | | | | | | Purchase price per share of the Corporation’s common stock(1) | | $ | 45.856 | | | | | Exchange ratio | | | 0.5009 | | | | | Purchase price per share of the Corporation’s common stock exchanged | | $ | 22.969 | | | | | Cash portion of the MBNA merger consideration | | | 4.125 | | | | | Implied value of one share of MBNA common stock | | | 27.094 | | | | | MBNA common stock exchanged | | | 1,260 | | | | | Total value of the Corporation’s common stock and cash exchanged | | | | | $ | 34,139 | | Fair value of outstanding stock options and direct acquisition costs | | | | | | 467 | | Total purchase price | | | | | $ | 34,606 | | | | | Allocation of the purchase price | | | | | | | | MBNA stockholders’ equity | | | | | $ | 13,410 | | MBNA goodwill and other intangible assets | | | | | | (3,564 | ) | Adjustments to reflect assets acquired and liabilities assumed at fair value: | | | | | | | | Loans and leases | | | | | | (292 | ) | Premises and equipment | | | | | | (563 | ) | Identified intangibles(2) | | | | | | 7,881 | | Other assets | | | | | | (683 | ) | Deposits | | | | | | (97 | ) | Exit and termination liabilities | | | | | | (269 | ) | Other personnel-related liabilities | | | | | | (634 | ) | Other liabilities and deferred income taxes | | | | | | (564 | ) | Long-term debt | | | | | | (409 | ) | Fair value of net assets acquired | | | | | | 14,216 | | Goodwill resulting from the MBNA merger(3) | | | | | $ | 20,390 | |
(1) | The value of the outstanding stock of FleetBoston on April 1, 2004, in a tax-free merger to the Corporation, in order to expand the Corporation’s presence in the Northeast. FleetBoston’s results of operations were included in the Corporation’s results beginning April 1, 2004. As provided by the FleetBoston Merger Agreement, approximately 1.069 billion shares of FleetBoston common stock were exchanged for approximately 1.187 billion shareswith MBNA shareholders was based upon the average of the Corporation’s common stock. At the date of the FleetBoston Merger, this represented approximately 29 percent of the Corporation’s outstanding common stock. FleetBoston shareholders also received cash of $4 million in lieu of any fractional sharesclosing prices of the Corporation’s common stock that
BANK OF AMERICA CORPORATION AND SUBSIDIARIES
Notes to Consolidated Financial Statements—(Continued)
would have otherwise been issued on April 1, 2004. Holders of FleetBoston preferred stock received 1.1 million sharesfor the period commencing two trading days before, and ending two trading days after, June 30, 2005, the date of the Corporation’s preferred stock. The Corporation’s preferred stock that was exchanged was valued using the book value of FleetBoston preferred stock. The depositary shares underlying the FleetBoston preferred stock, each representing a one-fifth interest in the FleetBoston preferred stock prior to the FleetBoston Merger, represent a one-fifth interest in a share of the Corporation’s preferred stock. The purchase price was adjusted to reflect the effect of the 15.7 million shares of FleetBoston common stock that the Corporation already owned.MBNA merger announcement.
The FleetBoston Merger was accounted for under the purchase method of accounting in accordance with SFAS No. 141, “Business Combinations” (SFAS 141). Accordingly, the final purchase price was allocated to the assets acquired and the liabilities assumed based on their estimated fair values at the FleetBoston Merger date as summarized below.
| | | | | | | | | (In millions except per share amounts) | | | | | | Purchase price | | | | | | | | FleetBoston common stock exchanged (in thousands) | | | 1,068,635 | | | | | Exchange ratio | | | 1.1106 | | | | | | | |
|
| | | | | Total shares of the Corporation’s common stock exchanged (in thousands) | | | 1,186,826 | | | | | Purchase price per share of the Corporation’s common stock(1) | | $ | 38.44 | | | | | | | |
|
| | | | | Total value of the Corporation’s common stock exchanged | | | | | $ | 45,622 | | FleetBoston preferred stock converted to the Corporation’s preferred stock | | | | | | 271 | | Fair value of outstanding stock options, direct acquisition costs and the effect of FleetBoston shares already owned by the Corporation | | | | | | 1,360 | | | | | | | |
|
|
| Total purchase price | | | | | $ | 47,253 | | | | | | | |
|
|
| | | | Allocation of the purchase price | | | | | | | | FleetBoston stockholders’ equity | | | | | $ | 19,329 | | FleetBoston goodwill and other intangible assets | | | | | | (4,709 | ) | Adjustments to reflect assets acquired and liabilities assumed at fair value: | | | | | | | | Securities | | | | | | (84 | ) | Loans and leases | | | | | | (776 | ) | Premises and equipment | | | | | | (766 | ) | Identified intangibles | | | | | | 3,243 | | Other assets and deferred income tax | | | | | | 312 | | Deposits | | | | | | (313 | ) | Other liabilities | | | | | | (313 | ) | Exit and termination liabilities | | | | | | (641 | ) | Long-term debt | | | | | | (1,182 | ) | | | | | | |
|
|
| Fair value of net assets acquired | | | | | | 14,100 | | | | | | | |
|
|
| Goodwill resulting from the FleetBoston Merger | | | | | $ | 33,153 | | | | | | | |
|
|
|
(1) | | The value of the shares of common stock exchanged with FleetBoston shareholders was based upon the average of the closing prices of the Corporation’s common stock for the period commencing two trading days before, and ending two trading days after, October 27, 2003, the date of the FleetBoston Merger Agreement. |
(2) | Includes purchased credit card relationships of $5,698 million, affinity relationships of $1,641 million, core deposit intangibles of $214 million, and other intangibles, including trademarks, of $328 million. The amortization life for core deposit intangibles is 10 years, purchased credit card relationships and affinity relationships are 15 years, and other intangibles over periods not exceeding 10 years. These intangibles are primarily amortized on an accelerated basis. |
(3) | No Goodwill is expected to be deductible for tax purposes. Substantially all Goodwill was allocated toGlobal Consumer and Small Business Banking. |
As a result of the MBNA merger, the Corporation acquired certain loans for which there was, at the time of the merger, evidence of deterioration of credit quality since origination and for which it was probable that all contractually required payments would not be collected. These loans were accounted for in accordance with SOP 03-3 which requires that purchased impaired loans be recorded at fair value as of the merger date. The purchase accounting adjustment to reduce impaired loans to fair value resulted in an increase in Goodwill. In addition, an adjustment was made to the Allowance for Loan and Lease Losses for those impaired loans resulting in a decrease in Goodwill. The outstanding balance and fair value of such loans was approximately $1.3 billion and $940 million as of the merger date. At December 31, 2006, there were no outstanding balances for such loans. | | Unaudited Pro Forma Condensed Combined Financial Information |
The following unaudited pro forma condensed combined financial information presents the results of operations of the Corporation had the MBNA merger taken place at January 1, 2005 and 2004. Included in the 2004 pro forma amounts are FleetBoston results for the three months ended March 31, 2004. | | | | | | | | | | Pro Forma | | (Dollars in millions) | | 2005 | | 2004 | | Net interest income | | $ | 34,029 | | $ | 32,831 | | Noninterest income | | | 32,647 | | | 30,523 | | Total revenue | | | 66,676 | | | 63,354 | | Provision for credit losses | | | 5,082 | | | 3,983 | | Gains on sales of debt securities | | | 1,084 | | | 1,775 | | Merger and restructuring charges | | | 1,179 | | | 624 | | Other noninterest expense | | | 34,411 | | | 34,373 | | Income before income taxes | | | 27,088 | | | 26,149 | | Net income | | | 18,157 | | | 17,300 |
Merger and Restructuring Charges in the above table include a nonrecurring restructuring charge related to legacy MBNA of $767 million for 2005. Pro forma Earnings per Common Share and Diluted Earnings per Common Share were $3.90 and $3.86 for 2005, and $3.68 and $3.62 for 2004. The following unaudited pro forma condensed combined financial information presents the Corporation's results of operations had the FleetBoston Merger taken place at the beginning of each year.
| | | | | | | | | | | | | | | | 2004 | | 2003 | | (Dollars in millions, except per common share information) | | (Restated)
| | (Restated)
| Net interest income | | $ | 29,747 | | $ | 27,249 | Noninterest income | | | 22,523 | | | 22,756 | Provision for credit losses | | | 2,769 | | | 3,864 | Gains on sales of debt securities | | | 1,773 | | | 1,069 | Merger and restructuring charges | | | 618 | | | — | Other noninterest expense | | | 28,507 | | | 27,319 | Income before income taxes | | | 22,149 | | | 19,891 | Net income | | | 14,707 | | | 13,250 | | | |
|
| |
|
| Per common share information | | | | | | | Earnings | | $ | 3.62 | | $ | 3.20 | | | |
|
| |
|
| Diluted earnings | | $ | 3.56 | | $ | 3.15 | | | |
|
| |
|
| Average common shares issued and outstanding (in thousands) | | | 4,054,322 | | | 4,138,139 | | | |
|
| |
|
| Average diluted common shares issued and outstanding (in thousands) | | | 4,124,671 | | | 4,201,053 | | | |
|
| |
|
|
| BANK OF AMERICA CORPORATION AND SUBSIDIARIESNotes to Consolidated Financial Statements—(Continued)
Merger and Restructuring Charges |
Merger and Restructuring Charges are recorded in the Consolidated Statement of Income and include incremental costs to integrate the operations of the Corporation and MBNA. These charges represent costs associated with these one-time activities and do not represent ongoing costs of the fully integrated combined organization. The following table presents severance and employee-related charges, systems integrations and related charges, and other merger-related charges. Merger and Restructuring Charges for 2005 and 2004 were $412 million and $618 million and primarily related to the FleetBoston merger. | | | | | (Dollars in millions) | | 2006 | | Severance and employee-related charges | | $ | 85 | | Systems integrations and related charges | | | 552 | | Other | | | 168 | Total merger and restructuring charges | | $ | 805 |
Merger and Restructuring Charges are recorded in the Consolidated Statement of Income, and include incremental costs to integrate the Corporation’s and FleetBoston’s operations. These charges represent costs associated with these one-time activities and do not represent on-going costs of the fully integrated combined organization. Systems integrations and related charges, and other, as shown in the following table, are expensed as incurred.
In addition, Merger and Restructuring Charges include costs related to an infrastructure initiative that was initiated in the third quarter of 2004 to simplify the Corporation’s business model. These costs were solely severance related. The Corporation does not expect to incur additional severance costs related to this initiative.
| | | | | | | | (Dollars in millions) | | 2005
| | 2004
| Severance and employee-related charges: | | | | | | | Merger-related | | $ | 38 | | $ | 138 | Infrastructure initiative | | | 1 | | | 102 | Systems integrations and related charges | | | 218 | | | 249 | Other | | | 155 | | | 129 | | | |
|
| |
|
| Total merger and restructuring charges | | $ | 412 | | $ | 618 | | | |
|
| |
|
|
| Exit Costs and Restructuring Reserves |
On January 1, 2006, the Corporation initially recorded liabilities of $468 million for MBNA’s exit and termination costs as purchase accounting adjustments resulting in an increase in Goodwill. Included in the $468 million were $409 million for severance, relocation and other employee-related expenses and $59 million for contract terminations. During 2006, the Corporation revised certain of its initial estimates due to lower severance costs and updated integration plans including site consolidations that resulted in the reduction of exit cost reserves of $199 million. This reduction in reserves consisted of $177 million related to severance, relocation and other employee-related expenses and $22 million related to contract termination estimates. Cash payments of $144 million in 2006 consisted of $111 million of severance, relocation and other employee-related costs, and $33 million of contract terminations. The impact of these items reduced the balance in the liability to $125 million at December 31, 2006. Restructuring reserves were also established for legacy Bank of America associate severance, other employee-related expenses and contract terminations. During 2006, $160 million was recorded to the restructuring reserves. Of these amounts, $80 million was related to associate severance and other employee-related expenses, and another $80 million to contract terminations. During 2006, cash payments of $22 million for severance and other employee-related costs and $71 million for contract termination have reduced this liability. The net impact of these items resulted in a balance of $67 million at December 31, 2006. Payments under exit costs and restructuring reserves associated with the MBNA merger are expected to be substantially completed in 2007. The following table presents the changes in Exit Costs and Restructuring Reserves for the year ended December 31, 2006. | | | | | | | | | | (Dollars in millions) | | Exit Cost
Reserves (1) | | | Restructuring
Reserves(2) | | | Balance, January 1, 2006 | | $ | — | | | $ | — | | | MBNA exit costs | | | 269 | | | | — | | | Restructuring charges | | | — | | | | 160 | | | Cash payments | | | (144 | ) | | | (93 | ) | Balance, December 31, 2006 | | $ | 125 | | | $ | 67 | |
As of December 31, 2004, there were $382 million of exit costs reserves remaining, which included $291 million for severance, relocation and other employee-related costs, $87 million for contract terminations, and $4 million for other charges. During 2005, $17 million of reductions to the exit(1)
| Exit costs reserves were recorded as a result of revised estimates. Cash payments of $306 million were charged against this liabilityestablished in 2005, including $239 million of severance, relocation and other employee-related costs, and $67 million of contract terminations reducing the balancepurchase accounting resulting in the liability to $59 million at December 31, 2005. As of December 31, 2004, there were $166 million of restructuring reserves remaining related to severance and other employee-related charges. Restructuring reservesan increase in 2005 included an additional charge for the legacy Bank of America associate severance and other employee-related charges of $58 million. These charges included $20 million as a result of revised estimates to complete relocations to the Northeast. During 2005, cash payments of $151 million for severance and other employee-related costs have been charged against this liability reducing the balance to $73 million as of December 31, 2005.
Payments under these exit costs and restructuring reserves are expected to be substantially completed in 2006.
Exit Costs and Restructuring ReservesGoodwill.
| | | | | | | | | | | | | | | | | | | | Exit Costs Reserves(1)
| | | Restructuring Reserves(2)
| | | (Dollars in millions) | | 2005
| | | 2004
| | | 2005
| | | 2004
| | Balance, January 1 | | $ | 382 | | | $ | — | | | $ | 166 | | | $ | — | | FleetBoston exit costs | | | (17 | ) | | | 658 | | | | — | | | | — | | Restructuring charges | | | — | | | | — | | | | 57 | | | | 138 | | Infrastructure initiative | | | — | | | | — | | | | 1 | | | | 102 | | Cash payments | | | (306 | ) | | | (276 | ) | | | (151 | ) | | | (74 | ) | | | |
|
|
| |
|
|
| |
|
|
| |
|
|
| Balance, December 31 | | $ | 59 | | | $ | 382 | | | $ | 73 | | | $ | 166 | | | | |
|
|
| |
|
|
| |
|
|
| |
|
|
|
(1) | | Exit costs reserves were established in purchase accounting resulting in an increase in Goodwill. |
(2) | | Restructuring reserves were established by a charge to income. |
Note 3—MBNA(2)
| Restructuring reserves were established by a charge to Merger and Restructuring Charges. |
Pursuant to the Agreement and Plan of Merger, dated June 30, 2005, by and between the Corporation and MBNA (the MBNA Merger Agreement), the Corporation acquired 100 percent of the outstanding stock of MBNA on January 1, 2006. The MBNA Merger was a tax-free merger for the Corporation. The acquisition expands the Corporation’s customer base and its opportunity to deepen customer relationships across the full breadth of the company by delivering innovative deposit, lending and investment products and services to MBNA’s customer base. Additionally, the acquisition allows the Corporation to significantly increase its affinity relationships through MBNA’s credit card operations. MBNA’s results of operations will be included in the Corporation’s results beginning January 1, 2006.
| BANK OF AMERICA CORPORATION AND SUBSIDIARIESNotes to Consolidated Financial Statements—(Continued)
Under the terms of the MBNA Merger Agreement, MBNA stockholders received 0.5009 of a share of the Corporation’s common stock plus $4.125 for each MBNA share of common stock. As provided by the MBNA Merger Agreement, approximately 1,260 million shares of MBNA common stock were exchanged for approximately 631 million shares of the Corporation’s common stock. At the date of the MBNA Merger, this represented approximately 16 percent of the Corporation’s outstanding common stock. MBNA shareholders also received cash of $5.2 billion. On NovemberNOTE 3 2005, MBNA redeemed all shares of its 7 1/2% Series A Cumulative Preferred Stock and Series B Adjustable Rate Cumulative Preferred Stock, in accordance with the terms of the MBNA Merger Agreement.
The MBNA Merger will be accounted for under the purchase method of accounting in accordance with SFAS 141. The purchase price has been allocated to the assets acquired and the liabilities assumed based on their estimated fair values at the MBNA Merger date as summarized below. This allocation is based on management’s current estimation and could change as the fair value calculations are finalized and more information becomes available.
| | | | | | | | | (Unaudited) | | | | | | | (In millions, except per share amounts) | | | | | | Purchase price | | | | | | | | Purchase price per share of the Corporation’s common stock(1) | | $ | 45.856 | | | | | Exchange ratio | | | 0.5009 | | | | | | | |
|
| | | | | Purchase price per share of the Corporation’s common stock exchanged | | $ | 22.969 | | | | | Cash portion of the MBNA Merger consideration | | | 4.125 | | | | | | | |
|
| | | | | Implied value of one share of MBNA common stock | | | 27.094 | | | | | MBNA common stock exchanged | | | 1,260 | | | | | | | |
|
| | | | | Total value of the Corporation’s common stock and cash exchanged | | | | | $ | 34,139 | | Fair value of outstanding stock options and direct acquisition costs | | | | | | 440 | | | | | | | |
|
|
| Total purchase price | | | | | $ | 34,579 | | | | | | | |
|
|
| Allocation of the purchase price | | | | | | | | MBNA stockholders’ equity | | | | | $ | 13,410 | | MBNA goodwill and other intangible assets | | | | | | (3,564 | ) | Adjustments to reflect assets acquired and liabilities assumed at fair value: | | | | | | | | Loans and leases | | | | | | (270 | ) | Premises and equipment | | | | | | (588 | ) | Identified intangibles(2) | | | | | | 8,080 | | Other assets | | | | | | (824 | ) | Deposits | | | | | | (100 | ) | Exit and termination liabilities | | | | | | (1,185 | ) | Other liabilities and deferred income taxes | | | | | | (706 | ) | Long-term debt | | | | | | (404 | ) | | | | | | |
|
|
| Estimated fair value of net assets acquired | | | | | | 13,849 | | | | | | | |
|
|
| Estimated goodwill resulting from the MBNA Merger(3) | | | | | $ | 20,730 | | | | | | | |
|
|
|
(1) | | The value of the shares of common stock exchanged with MBNA shareholders was based upon the average of the closing prices of the Corporation’s common stock for the period commencing two trading days before, and ending two trading days after, June 30, 2005, the date of the MBNA Merger Agreement. |
(2) | | Includes core deposit intangibles of $204 million, purchased credit card receivables of $5,468 million, affinity relationships of $2,018 million and other intangibles of $390 million. The amortization life for core deposit intangibles is 10 years and purchased credit card receivables and affinity relationships are 15 years. |
(3) | | No Goodwill is expected to be deductible for tax purposes. Goodwill will be allocated toGlobal Consumer and SmallBusiness Banking. |
BANK OF AMERICA CORPORATION AND SUBSIDIARIES
Notes to Consolidated Financial Statements—(Continued)
Note 4—– Trading Account Assets and Liabilities
The Corporation engages in a variety of trading-related activities that are either for clients or its own account.
|
The following table presents the fair values of the components of Trading Account Assets and Liabilities at December 31, 2006 and 2005. | | | | | | | | | | December 31 | | (Dollars in millions) | | 2006 | | 2005 | | Trading account assets | | | | | | | | Corporate securities, trading loans and other | | $ | 53,923 | | $ | 46,554 | | U.S. government and agency securities(1) | | | 36,656 | | | 31,091 | | Equity securities | | | 27,103 | | | 31,029 | | Mortgage trading loans and asset-backed securities | | | 15,449 | | | 12,290 | | Foreign sovereign debt | | | 19,921 | | | 10,743 | Total | | $ | 153,052 | | $ | 131,707 | | Trading account liabilities | | | | | | | | U.S. government and agency securities(2) | | $ | 26,760 | | $ | 23,179 | | Equity securities | | | 23,908 | | | 11,371 | | Foreign sovereign debt | | | 9,261 | | | 8,915 | | Corporate securities and other | | | 7,741 | | | 7,425 | Total | | $ | 67,670 | | $ | 50,890 |
(1) | Includes $22.7 billion and $20.9 billion at December 31, 20052006 and 2004. | | | | | | | | | | December 31
| | (Dollars in millions) | | 2005
| | 2004
| Trading account assets | | | | | | | Corporate securities, trading loans and other | | $ | 46,554 | | $ | 35,227 | U.S. government and agency securities(1) | | | 31,091 | | | 20,462 | Equity securities | | | 31,029 | | | 19,504 | Mortgage trading loans and asset-backed securities | | | 12,290 | | | 9,625 | Foreign sovereign debt | | | 10,743 | | | 8,769 | | | |
|
| |
|
| Total | | $ | 131,707 | | $ | 93,587 | | | |
|
| |
|
| Trading account liabilities | | | | | | | U.S. government and agency securities(2) | | $ | 23,179 | | $ | 14,332 | Equity securities | | | 11,371 | | | 8,952 | Foreign sovereign debt | | | 8,915 | | | 4,793 | Corporate securities and other | | | 7,407 | | | 8,538 | Mortgage trading loans and asset-backed securities | | | 18 | | | 39 | | | |
|
| |
|
| Total | | $ | 50,890 | | $ | 36,654 | | | |
|
| |
|
|
(1) | | Includes $22.1 billion and $17.3 billion at December 31, 2005 and 2004 of government-sponsored enterprise obligations that are not backed by the full faith and credit of the U.S. government. |
(2) | | Includes $1.4 billion and $1.2 billion at December 31, 2005 and 2004 of government-sponsored enterprise obligations that are not backed by the full faith and credit of the U.S. government. |
Note 5—(2)
| Includes $2.2 billion and $1.4 billion at December 31, 2006 and 2005 of government-sponsored enterprise obligations that are not backed by the full faith and credit of the U.S. government. |
The Corporation designates derivatives as trading derivatives, economic hedges, or as derivatives used for SFAS 133 accounting purposes. For additional information on our derivatives and hedging activities, see Note 1 of the Consolidated Financial Statements. The Corporation designates a derivative as held for trading, an economic hedge not designated as a SFAS 133 hedge, or a qualifying SFAS 133 hedge when it enters into the derivative contract. The designation may change based upon management’s reassessment or changing circumstances. Derivatives utilized by the Corporation include swaps, financial futures and forward settlement contracts, and option contracts. A swap agreement is a contract between two parties to exchange cash flows based on specified underlying notional amounts, assets and/or indices. Financial futures and forward settlement contracts are agreements to buy or sell a quantity of a financial instrument, index, currency or commodity at a predetermined future date, and rate or price. An option contract is an agreement that conveys to the purchaser the right, but not the obligation, to buy or sell a quantity of a financial instrument (including another derivative financial instrument), index, currency or commodity at a predetermined rate or price during a period or at a time in the future. Option agreements can be transacted on organized exchanges or directly between parties. The Corporation also provides credit derivatives to customers who wish to increase or decrease credit exposures. In addition, the Corporation utilizes credit derivatives to manage the credit risk associated with the loan portfolio.
| | Credit Risk Associated with Derivative Activities Credit risk associated with derivatives is measured as the net replacement cost in the event the counterparties with contracts in a gain position to the Corporation completely fail to perform under the terms of those contracts. In managing derivative credit risk, both the current exposure, which is the replacement cost of contracts on the measurement date, as well as an estimate of the potential change in value of contracts over their remaining lives are considered. The Corporation’s derivative activities are primarily with financial institutions and corporations. To minimize credit risk, the Corporation enters into legally enforceable master netting agreements, which reduce risk by permitting the closeout and netting of transactions with the same counterparty upon occurrence of certain events. In addition, the Corporation reduces credit risk by obtaining collateral from counterparties. The determination of the need for and the levels of collateral will vary based on an assessment of the credit risk of the counterparty. Generally, the Corporation accepts collateral in the form of cash, U.S. Treasury securities and other marketable securities. The Corporation held $24.9 billion of collateral on derivative positions, of which $17.1 billion could be applied against credit risk at December 31, 2005.
BANK OF AMERICA CORPORATION AND SUBSIDIARIES
Notes to Consolidated Financial Statements—(Continued)
A portion of the derivative activity involves exchange-traded instruments. Exchange-traded instruments conform to standard terms and are subject to policies set by the exchange involved, including margin and security deposit requirements. Management believes the credit risk associated with these types of instruments is minimal. The average fair value of Derivative Assets for 2005 and 2004 was $25.9 billion and $28.0
|
Credit risk associated with derivatives is measured as the net replacement cost in the event the counterparties with contracts in a gain position to the Corporation completely fail to perform under the terms of those contracts. In managing derivative credit risk, both the current exposure, which is the replacement cost of contracts on the measurement date, as well as an estimate of the potential change in value of contracts over their remaining lives are considered. The Corporation’s derivative activities are primarily with financial institutions and corporations. To minimize credit risk, the Corporation enters into legally enforceable master netting agreements which reduce risk by permitting the closeout and netting of transactions with the same counterparty upon occurrence of certain events. In addition, the Corporation reduces credit risk by obtaining collateral from counterparties. The determination of the need for and the levels of collateral will vary based on an assessment of the credit risk of the counterparty. Generally, the Corporation accepts collateral in the form of cash, U.S. Treasury securities and other marketable securities. The Corporation held $24.2 billion of collateral on derivative positions, of which $14.9 billion could be applied against credit risk at December 31, 2006. A portion of the derivative activity involves exchange-traded instruments. Exchange-traded instruments conform to standard terms and are subject to policies set by the exchange involved, including margin and security deposit requirements. Management believes the credit risk associated with these types of instruments is minimal. The average fair value of Derivative Assets, less cash collateral, for 2006 and 2005 was $24.2 billion and $25.9 billion. The average fair value of Derivative Liabilities for 2006 and 2005 was $16.6 billion and $16.8 billion. The average fair value of Derivative Liabilities for 2005 and 2004 was $16.8 billion and $15.7 billion. The following table presents the contract/notional amounts and credit risk amounts at December 31, 2006 and 2005 of all the Corporation’s derivative positions. These derivative positions are primarily executed in the over-the-counter market. The credit risk amounts take into consideration the effects of legally enforceable master netting agreements, and on an aggregate basis have been reduced by the cash collateral applied against Derivative Assets. At December 31, 2006 and 2005, the cash collateral applied against Derivative Assets on the Consolidated Balance Sheet was $7.3 billion and $9.3 billion. In addition, at December 31, 2006 and 2005, the cash collateral placed against Derivative Liabilities was $6.5 billion and $7.6 billion. | | | | | | | | | | | | | | | | | | | December 31, 2006 | | December 31, 2005 | | (Dollars in millions) | | Contract/
Notional | | Credit
Risk | | Contract/
Notional | | Credit
Risk | Interest rate contracts | | | | | | | | | | | | | Swaps | | $ | 18,185,655 | | $ | 9,601 | | $ | 14,401,577 | | $ | 11,085 | Futures and forwards | | | 2,283,579 | | | 103 | | | 2,113,717 | | | — | Written options | | | 1,043,933 | | | — | | | 900,036 | | | — | Purchased options | | | 1,308,888 | | | 2,212 | | | 869,471 | | | 3,345 | Foreign exchange contracts | | | | | | | | | | | | | Swaps | | | 451,462 | | | 4,241 | | | 333,487 | | | 3,735 | Spot, futures and forwards | | | 1,234,009 | | | 2,995 | | | 944,321 | | | 2,481 | Written options | | | 464,420 | | | — | | | 214,668 | | | — | Purchased options | | | 414,004 | | | 1,391 | | | 229,049 | | | 1,214 | Equity contracts | | | | | | | | | | | | | Swaps | | | 32,247 | | | 577 | | | 28,287 | | | 548 | Futures and forwards | | | 19,947 | | | 24 | | | 6,479 | | | 44 | Written options | | | 102,902 | | | — | | | 69,048 | | | — | Purchased options | | | 104,958 | | | 7,513 | | | 57,693 | | | 6,729 | Commodity contracts | | | | | | | | | | | | | Swaps | | | 4,868 | | | 1,129 | | | 8,809 | | | 2,475 | Futures and forwards | | | 13,513 | | | 2 | | | 5,533 | | | — | Written options | | | 9,947 | | | — | | | 7,854 | | | — | Purchased options | | | 6,796 | | | 184 | | | 3,673 | | | 546 | Credit derivatives(1) | | | 1,497,869 | | | 756 | | | 722,190 | | | 766 | | | | | | | | | | | | | | Credit risk before cash collateral | | | | | | 30,728 | | | | | | 32,968 | Less: Cash collateral applied | | | | | | 7,289 | | | | | | 9,256 | Total derivative assets | | | | | $ | 23,439 | | | | | $ | 23,712 |
(1) | The December 31, 2005 and 2004 of allnotional amount has been reclassified to conform with new regulatory guidance, which defined the Corporation’s derivative positions. These derivative positions are primarily executed innotional as the over-the-counter market. The credit risk amounts take into consideration the effects of legally enforceable master netting agreements, and on an aggregate basis have been reduced by the cash collateral applied against Derivative Assets. At December 31, 2005 and 2004, the cash collateral applied against Derivative Assets on the Consolidated Balance Sheet was $9.3 billion and $9.4 billion. In addition, at December 31, 2005 and 2004, the cash collateral placed against Derivative Liabilities was $7.6 billion and $6.0 billion. Derivatives(1)contractual loss protection for structured basket transactions.
| | | | | | | | | | | | | | | | December 31
| | | | 2005
| | 2004
| | (Dollars in millions) | | Contract/
Notional
| | Credit
Risk
| | Contract/
Notional
| | Credit
Risk
| Interest rate contracts | | | | | | | | | | | | | Swaps | | $ | 14,401,577 | | $ | 11,085 | | $ | 11,597,813 | | $ | 12,705 | Futures and forwards | | | 2,113,717 | | | — | | | 1,833,216 | | | 332 | Written options | | | 900,036 | | | — | | | 988,253 | | | — | Purchased options | | | 869,471 | | | 3,345 | | | 1,243,809 | | | 4,840 | Foreign exchange contracts | | | | | | | | | | | | | Swaps | | | 333,487 | | | 3,735 | | | 305,999 | | | 7,859 | Spot, futures and forwards | | | 944,321 | | | 2,481 | | | 956,995 | | | 3,593 | Written options | | | 214,668 | | | — | | | 167,225 | | | — | Purchased options | | | 229,049 | | | 1,214 | | | 163,243 | | | 679 | Equity contracts | | | | | | | | | | | | | Swaps | | | 28,287 | | | 548 | | | 34,130 | | | 1,039 | Futures and forwards | | | 6,479 | | | 44 | | | 4,078 | | | — | Written options | | | 69,048 | | | — | | | 37,080 | | | — | Purchased options | | | 57,693 | | | 6,729 | | | 32,893 | | | 5,741 | Commodity contracts | | | | | | | | | | | | | Swaps | | | 8,809 | | | 2,475 | | | 10,480 | | | 2,099 | Futures and forwards | | | 5,533 | | | — | | | 6,307 | | | 6 | Written options | | | 7,854 | | | — | | | 9,270 | | | — | Purchased options | | | 3,673 | | | 546 | | | 5,535 | | | 301 | Credit derivatives(2) | | | 2,017,896 | | | 766 | | | 499,741 | | | 430 | | | |
|
| |
|
| |
|
| |
|
| Credit risk before cash collateral | | | | | | 32,968 | | | | | | 39,624 | Less: Cash collateral applied | | | | | | 9,256 | | | | | | 9,389 | | | | | | |
|
| | | | |
|
| Total derivative assets | | | | | $ | 23,712 | | | | | $ | 30,235 | | | | | | |
|
| | | | |
|
|
(1) | | Includes long and short derivative positions. |
(2) | | The increase in credit derivatives notional amounts reflects structured basket transactions and customer-driven activity. |
| ALM ProcessActivitiesInterest rate contracts and foreign exchange contracts are utilized in the Corporation’s ALM process. The Corporation maintains an overall interest rate risk management strategy that incorporates the use of interest rate contracts to minimize significant fluctuations in earnings that are caused by interest rate volatility. The Corporation’s goal is to manage interest rate sensitivity so that movements in interest rates do not significantly adversely affect Net Interest Income. As a result of interest rate fluctuations, hedged fixed-rate assets and liabilities appreciate or depreciate in market value. Gains or losses on the derivative instruments that are linked to the hedged fixed-rate assets and liabilities are expected to substantially offset this unrealized appreciation or depreciation. Interest Income and Interest Expense on hedged variable-rate assets and liabilities increase or decrease as a result of interest rate fluctuations. Gains and losses on the derivative instruments that are linked to these hedged assets and liabilities are expected to substantially offset this variability in earnings.
BANK OF AMERICA CORPORATION AND SUBSIDIARIES
Notes to Consolidated Financial Statements—(Continued)
Interest rate contracts, which are generally non-leveraged generic interest rate and basis swaps, options and futures, allow the Corporation to manage its interest rate risk position. Non-leveraged generic interest rate swaps involve the exchange of fixed-rate and variable-rate interest payments based on the contractual underlying notional amount. Basis swaps involve the exchange of interest payments based on the contractual underlying notional amounts, where both the pay rate and the receive rate are floating rates based on different indices. Option products primarily consist of caps, floors, swaptions and options on index futures contracts. Futures contracts used for the ALM process
|
Interest rate contracts and foreign exchange contracts are utilized in the Corporation’s ALM activities. The Corporation maintains an overall interest rate risk management strategy that incorporates the use of interest rate contracts to minimize significant fluctuations in earnings that are caused by interest rate volatility. The Corporation’s goal is to manage interest rate sensitivity so that movements in interest rates do not significantly adversely affect Net Interest Income. As a result of interest rate fluctuations, hedged fixed-rate assets and liabilities appreciate or depreciate in market value. Gains or losses on the derivative instruments that are linked to the hedged fixed-rate assets and liabilities are expected to substantially offset this unrealized appreciation or depreciation. Interest Income and Interest Expense on hedged variable-rate assets and liabilities increase or decrease as a result of interest rate fluctuations. Gains and losses on the derivative instruments that are linked to these hedged assets and liabilities are expected to substantially offset this variability in earnings. Interest rate contracts, which are generally non-leveraged generic interest rate and basis swaps, options and futures, allow the Corporation to manage its interest rate risk position. Non-leveraged generic interest rate swaps involve the exchange of fixed-rate and variable-rate interest payments based on the contractual underlying notional amount. Basis swaps involve the exchange of interest payments based on the contractual underlying notional amounts, where both the pay rate and the receive rate are floating rates based on different indices. Option products primarily consist of caps, floors and swaptions. Futures contracts used for the Corporation’s ALM activities are primarily index futures providing for cash payments based upon the movements of an underlying rate index. The Corporation uses foreign currency contracts to manage the foreign exchange risk associated with certain foreign currency-denominated assets and liabilities, as well as the Corporation’s equity investments in foreign subsidiaries. Foreign exchange contracts, which include spot futures and forward contracts, represent agreements to exchange the currency of one country for the currency of another country at an agreed-upon price on an agreed-upon settlement date. Foreign exchange option contracts are similar to interest rate option contracts except that they are based on currencies rather than interest rates. Exposure to loss on these contracts will increase or decrease over their respective lives as currency exchange and interest rates fluctuate. | | Fair Value and Cash Flow Hedges |
The Corporation uses various types of interest rate and foreign currency exchange rate derivative contracts to protect against changes in the fair value of its fixed-rate assets and liabilities due to fluctuations in interest rates and exchange rates (fair value hedges). The Corporation also uses these types of contracts to protect against changes in the cash flows of its variable-rate assets and liabilities, and other forecasted transactions (cash flow hedges). For cash flow hedges, gains and losses on derivative contracts reclassified from Accumulated OCI to current period earnings are included in the line item in the Consolidated Statement of Income in which the hedged item is recorded and in the same period the hedged item affects earnings. During the next 12 months, net losses on derivative instruments included in Accumulated OCI of approximately $1.0 billion ($658 million after-tax) are expected to be reclassified into earnings. These net losses reclassified into earnings are expected to decrease income or increase expense on the respective hedged items. The following table summarizes certain information related to the Corporation’s derivative hedges accounted for under SFAS 133 for 2006 and 2005: | | | | | | | | | | (Dollars in millions) | | 2006 | | | 2005 | | Fair value hedges | | | | | | | | | Hedge ineffectiveness recognized in earnings(1) | | $ | 23 | | | $ | 166 | | Net gain (loss) excluded from assessment of effectiveness(2) | | | — | | | | (13 | ) | Cash flow hedges | | | | | | | | | Hedge ineffectiveness recognized in earnings(3) | | | 18 | | | | (31 | ) | Net investment hedges | | | | | | | | | Gains (losses) included in foreign currency translation adjustments within Accumulated OCI(4) | | | (475 | ) | | | 66 | |
(1) | Hedge ineffectiveness was recognized primarily within Net Interest Income and Mortgage Banking Income in the Consolidated Statement of Income in which the hedged item isfor 2006 and 2005, respectively. |
(2) | Net gain (loss) excluded from assessment of effectiveness was recorded andprimarily within Mortgage Banking Income in the same periodConsolidated Statement of Income for 2005. |
(3) | Hedge ineffectiveness was recognized primarily within Net Interest Income in the hedged item affects earnings. DuringConsolidated Statement of Income for 2006 and 2005. |
(4) | Amount for 2006 primarily represents net investment hedges of certain foreign subsidiaries acquired in connection with the next 12 months, net losses on derivative instruments included in Accumulated OCI of approximately $632 million (pre-tax) are expected to be reclassified into earnings. These net losses reclassified into earnings are expected to decrease income or increase expense on the respective hedged items.MBNA merger. The following table summarizes certain information related to the Corporation’s hedging activities for 2005 and 2004:
| | | | | | | | | | (Dollars in millions) | | 2005
| | | 2004
| | Fair value hedges | | | | | | | | | Hedge ineffectiveness recognized in earnings(1) | | $ | 166 | | | $ | 10 | | Net loss excluded from assessment of effectiveness(2) | | | (13 | ) | | | (6 | ) | Cash flow hedges | | | | | | | | | Hedge ineffectiveness recognized in earnings(3) | | | (31 | ) | | | (11 | ) | Net investment hedges | | | | | | | | | Gains (losses) included in foreign currency translation adjustments within Accumulated OCI | | | 66 | | | | (157 | ) |
(1) | | Included $5 million and $(8) million recorded in Net Interest Income, $167 million and $18 million recorded in Mortgage Banking Income, $(5) million and $0 recorded in Investment Banking Income, and $(1) million and $0 recorded in Trading Account Profits in the Consolidated Statement of Income for 2005 and 2004. |
(2) | | Included $0 and $(5) million recorded in Net Interest Income and $(15) million and $(1) million recorded in Mortgage Banking Income, and $2 million and $0 recorded in Investment Banking Income in the Consolidated Statement of Income for 2005 and 2004. |
(3) | | Included $(17) million and $(13) million recorded in Net Interest Income and $(14) million and $2 million recorded in Mortgage Banking Income from other cash flow hedges in the Consolidated Statement of Income for 2005 and 2004. |
| BANK OF AMERICA CORPORATION AND SUBSIDIARIESNotes to Consolidated Financial Statements—(Continued)
Note 6NOTE 5 – Securities
|
The amortized cost, gross unrealized gains and losses, and fair value of AFS debt and marketable equity securities at December 31, 2006 and 2005 were: | | | | | | | | | | | | | | Available-for-sale securities | | | | | | | | | | | | | | | (Dollars in millions) | | Amortized
Cost | | Gross
Unrealized
Gains | | Gross
Unrealized
Losses | | | Fair
Value | 2006 | | | | | | | | | | | | | | U.S. Treasury securities and agency debentures | | $ | 697 | | $ | — | | $ | (9 | ) | | $ | 688 | Mortgage-backed securities | | | 161,693 | | | 4 | | | (4,804 | ) | | | 156,893 | Foreign securities | | | 12,126 | | | 2 | | | (78 | ) | | | 12,050 | Other taxable securities(1) | | | 16,776 | | | 10 | | | (134 | ) | | | 16,652 | Total taxable securities | | | 191,292 | | | 16 | | | (5,025 | ) | | | 186,283 | Tax-exempt securities | | | 6,493 | | | 64 | | | (34 | ) | | | 6,523 | Total available-for-sale debt securities | | $ | 197,785 | | $ | 80 | | $ | (5,059 | ) | | $ | 192,806 | Available-for-sale marketable equity securities (2) | | $ | 2,799 | | $ | 408 | | $ | (10 | ) | | $ | 3,197 | 2005 | | | | | | | | | | | | | | U.S. Treasury securities and agency debentures | | $ | 730 | | $ | — | | $ | (13 | ) | | $ | 717 | Mortgage-backed securities | | | 197,101 | | | 198 | | | (5,268 | ) | | | 192,031 | Foreign securities | | | 10,944 | | | 1 | | | (54 | ) | | | 10,891 | Other taxable securities(1) | | | 13,198 | | | 126 | | | (99 | ) | | | 13,225 | Total taxable securities | | | 221,973 | | | 325 | | | (5,434 | ) | | | 216,864 | Tax-exempt securities | | | 4,693 | | | 31 | | | (32 | ) | | | 4,692 | Total available-for-sale debt securities | | $ | 226,666 | | $ | 356 | | $ | (5,466 | ) | | $ | 221,556 | Available-for-sale marketable equity securities (2) | | $ | 575 | | $ | 305 | | $ | (18 | ) | | $ | 862 |
(1) | Includes corporate debt and marketable equity securities, and Held-to-maturity securities at December 31, 2005, 2004 and 2003 were:asset-backed securities. |
(2) | | | | | | | | | | | | | | (Dollars in millions) | | Amortized
Cost
| | Gross
Unrealized
Gains
| | Gross
Unrealized
Losses
| | Fair
Value
| Available-for-sale securities | | | | | | | | | | | | | 2005 | | | | | | | | | | | | | U.S. Treasury securities and agency debentures | | $ | 730 | | $ | — | | $ | 13 | | $ | 717 | Mortgage-backed securities | | | 197,101 | | | 198 | | | 5,268 | | | 192,031 | Foreign securities | | | 10,944 | | | 1 | | | 54 | | | 10,891 | Other taxable securities(1) | | | 13,198 | | | 126 | | | 99 | | | 13,225 | | | |
|
| |
|
| |
|
| |
|
| Total taxable | | | 221,973 | | | 325 | | | 5,434 | | | 216,864 | Tax-exempt securities | | | 4,693 | | | 31 | | | 32 | | | 4,692 | | | |
|
| |
|
| |
|
| |
|
| Total available-for-sale securities | | $ | 226,666 | | $ | 356 | | $ | 5,466 | | $ | 221,556 | | | |
|
| |
|
| |
|
| |
|
| Available-for-sale marketable equity securities(2) | | $ | 4,060 | | $ | 305 | | $ | 18 | | $ | 4,347 | | | |
|
| |
|
| |
|
| |
|
| 2004 | | | | | | | | | | | | | U.S. Treasury securities and agency debentures | | $ | 826 | | $ | — | | $ | 1 | | $ | 825 | Mortgage-backed securities | | | 173,697 | | | 174 | | | 624 | | | 173,247 | Foreign securities | | | 7,437 | | | 36 | | | 26 | | | 7,447 | Other taxable securities(1) | | | 9,493 | | | — | | | 13 | | | 9,480 | | | |
|
| |
|
| |
|
| |
|
| Total taxable | | | 191,453 | | | 210 | | | 664 | | | 190,999 | Tax-exempt securities | | | 3,662 | | | 87 | | | 5 | | | 3,744 | | | |
|
| |
|
| |
|
| |
|
| Total available-for-sale securities | | $ | 195,115 | | $ | 297 | | $ | 669 | | $ | 194,743 | | | |
|
| |
|
| |
|
| |
|
| Available-for-sale marketable equity securities(2) | | $ | 3,571 | | $ | 32 | | $ | 2 | | $ | 3,601 | | | |
|
| |
|
| |
|
| |
|
| 2003 | | | | | | | | | | | | | U.S. Treasury securities and agency debentures | | $ | 710 | | $ | 5 | | $ | 2 | | $ | 713 | Mortgage-backed securities | | | 56,403 | | | 63 | | | 575 | | | 55,891 | Foreign securities | | | 2,816 | | | 23 | | | 38 | | | 2,801 | Other taxable securities(3) | | | 4,765 | | | 36 | | | 69 | | | 4,732 | | | |
|
| |
|
| |
|
| |
|
| Total taxable | | | 64,694 | | | 127 | | | 684 | | | 64,137 | Tax-exempt securities | | | 2,167 | | | 79 | | | 1 | | | 2,245 | | | |
|
| |
|
| |
|
| |
|
| Total available-for-sale securities | | $ | 66,861 | | $ | 206 | | $ | 685 | | $ | 66,382 | | | |
|
| |
|
| |
|
| |
|
| Available-for-sale marketable equity securities(2) | | $ | 2,803 | | $ | 394 | | $ | 31 | | $ | 3,166 | | | |
|
| |
|
| |
|
| |
|
| Held-to-maturity securities | | | | | | | | | | | | | 2005 | | | | | | | | | | | | | Taxable securities | | $ | 4 | | $ | — | | $ | — | | $ | 4 | Tax-exempt securities | | | 43 | | | — | | | — | | | 43 | | | |
|
| |
|
| |
|
| |
|
| Total held-to-maturity securities | | $ | 47 | | $ | — | | $ | — | | $ | 47 | | | |
|
| |
|
| |
|
| |
|
| 2004 | | | | | | | | | | | | | Taxable securities | | $ | 41 | | $ | 4 | | $ | 4 | | $ | 41 | Tax-exempt securities | | | 289 | | | — | | | 1 | | | 288 | | | |
|
| |
|
| |
|
| |
|
| Total held-to-maturity securities | | $ | 330 | | $ | 4 | | $ | 5 | | $ | 329 | | | |
|
| |
|
| |
|
| |
|
| 2003 | | | | | | | | | | | | | Taxable securities | | $ | 96 | | $ | 3 | | $ | 3 | | $ | 96 | Tax-exempt securities | | | 151 | | | 7 | | | — | | | 158 | | | |
|
| |
|
| |
|
| |
|
| Total held-to-maturity securities | | $ | 247 | | $ | 10 | | $ | 3 | | $ | 254 | | | |
|
| |
|
| |
|
| |
|
|
(1) | | Includes corporate debt, asset-backed securities and equity instruments. |
(2) | | Represents those AFS marketable equity securities that are recorded in Other Assets on the Consolidated Balance Sheet. |
(3) | | Includes corporate debt and asset-backed securities. |
BANK OF AMERICA CORPORATION AND SUBSIDIARIES
Notes to Consolidated Financial Statements—(Continued)
At December 31, 2005, accumulated net unrealized losses on AFS debt and marketable equity securities included in Accumulated OCI were $3.0 billion, net of the related income tax benefit of $1.8 billion. At December 31, 2004, accumulated net unrealized losses on these securities were $196 million, net of the related income tax benefit of $146 million.
The following table presents the current fair value and the associated unrealized losses only on investments in securities with unrealized losses at December 31, 2005 and 2004. The table also discloses whether these securities have had unrealized losses for less than twelve months, or for twelve months or longer.
| | | | | | | | | | | | | | | | | | | | | | | | | December 31, 2005
| | | | | Less than twelve months
| | | Twelve months or longer
| | | Total
| | | (Dollars in millions) | | Fair
Value
| | Unrealized
Losses
| | | Fair
Value
| | Unrealized
Losses
| | | Fair
Value
| | Unrealized
Losses
| | Available-for-sale securities | | | | | | | | | | | | | | | | | | | | | | U.S. Treasury securities and agency debentures(1) | | $ | 251 | | $ | (9 | ) | | $ | 163 | | $ | (4 | ) | | $ | 414 | | $ | (13 | ) | Mortgage-backed securities | | | 149,979 | | | (3,766 | ) | | | 40,236 | | | (1,502 | ) | | | 190,215 | | | (5,268 | ) | Foreign securities | | | 3,455 | | | (41 | ) | | | 852 | | | (13 | ) | | | 4,307 | | | (54 | ) | Other taxable securities | | | 3,882 | | | (79 | ) | | | 469 | | | (20 | ) | | | 4,351 | | | (99 | ) | | | |
|
| |
|
|
| |
|
| |
|
|
| |
|
| |
|
|
| Total taxable securities | | | 157,567 | | | (3,895 | ) | | | 41,720 | | | (1,539 | ) | | | 199,287 | | | (5,434 | ) | Tax-exempt securities(1) | | | 2,308 | | | (27 | ) | | | 156 | | | (5 | ) | | | 2,464 | | | (32 | ) | | | |
|
| |
|
|
| |
|
| |
|
|
| |
|
| |
|
|
| Total temporarily-impaired available-for-sale securities | | | 159,875 | | | (3,922 | ) | | | 41,876 | | | (1,544 | ) | | | 201,751 | | | (5,466 | ) | Temporarily-impaired marketable equity securities | | | 146 | | | (18 | ) | | | — | | | — | | | | 146 | | | (18 | ) | | | |
|
| |
|
|
| |
|
| |
|
|
| |
|
| |
|
|
| Total temporarily-impaired securities | | $ | 160,021 | | $ | (3,940 | ) | | $ | 41,876 | | $ | (1,544 | ) | | $ | 201,897 | | $ | (5,484 | ) | | | |
|
| |
|
|
| |
|
| |
|
|
| |
|
| |
|
|
| | | | | | December 31, 2004
| | | | | Less than twelve months
| | | Twelve months or longer
| | | Total
| | | (Dollars in millions) | | Fair
Value
| | Unrealized
Losses
| | | Fair
Value
| | Unrealized
Losses
| | | Fair
Value
| | Unrealized
Losses
| | Available-for-sale securities | | | | | | | | | | | | | | | | | | | | | | U.S. Treasury securities and agency debentures(1) | | $ | 381 | | $ | (1 | ) | | $ | 22 | | $ | — | | | $ | 403 | | $ | (1 | ) | Mortgage-backed securities | | | 52,687 | | | (297 | ) | | | 17,426 | | | (327 | ) | | | 70,113 | | | (624 | ) | Foreign securities | | | 4,964 | | | (11 | ) | | | 99 | | | (15 | ) | | | 5,063 | | | (26 | ) | Other taxable securities | | | 1,130 | | | (9 | ) | | | 37 | | | (4 | ) | | | 1,167 | | | (13 | ) | | | |
|
| |
|
|
| |
|
| |
|
|
| |
|
| |
|
|
| Total taxable securities | | | 59,162 | | | (318 | ) | | | 17,584 | | | (346 | ) | | | 76,746 | | | (664 | ) | Tax-exempt securities(1) | | | 1,088 | | | (5 | ) | | | 21 | | | — | | | | 1,109 | | | (5 | ) | | | |
|
| |
|
|
| |
|
| |
|
|
| |
|
| |
|
|
| Total temporarily-impaired available-for-sale securities | | | 60,250 | | | (323 | ) | | | 17,605 | | | (346 | ) | | | 77,855 | | | (669 | ) | | | |
|
| |
|
|
| |
|
| |
|
|
| |
|
| |
|
|
| Temporarily-impaired marketable equity securities | | | 83 | | | (2 | ) | | | — | | | — | | | | 83 | | | (2 | ) | | | |
|
| |
|
|
| |
|
| |
|
|
| |
|
| |
|
|
| Held-to-maturity securities | | | | | | | | | | | | | | | | | | | | | | Taxable securities | | | 41 | | | (4 | ) | | | — | | | — | | | | 41 | | | (4 | ) | Tax-exempt securities | | | 288 | | | (1 | ) | | | — | | | — | | | | 288 | | | (1 | ) | | | |
|
| |
|
|
| |
|
| |
|
|
| |
|
| |
|
|
| Total temporarily-impaired held-to-maturity securities | | | 329 | | | (5 | ) | | | — | | | — | | | | 329 | | | (5 | ) | | | |
|
| |
|
|
| |
|
| |
|
|
| |
|
| |
|
|
| Total temporarily-impaired securities | | $ | 60,662 | | $ | (330 | ) | | $ | 17,605 | | $ | (346 | ) | | $ | 78,267 | | $ | (676 | ) | | | |
|
| |
|
|
| |
|
| |
|
|
| |
|
| |
|
|
|
(1) | | Unrealized losses less than $500 thousand are shown as zero. |
The unrealized losses associated with U.S. Treasury securities and agency debentures, mortgage-backed securities, certain foreign securities, other taxable securities and tax-exempt securities are not considered to be other-than-temporary because their unrealized losses are related to changes in interest rates and do not affect the expected cash flows of the underlying collateral or issuer. The Corporation has the ability and intent to hold these securities for a period of time sufficient to recover all unrealized losses. Accordingly, the Corporation has not recognized any other-than-temporary impairments for these securities.
BANK OF AMERICA CORPORATION AND SUBSIDIARIES
Notes to Consolidated Financial Statements—(Continued)
The Corporation had investments in securities from the Federal National Mortgage Association (Fannie Mae) and Federal Home Loan Mortgage Corporation (Freddie Mac) that exceeded 10 percent of consolidated Shareholders’ Equity as of December 31, 2005 and 2004. Those investments had market values of $144.1 billion and $46.9 billion at December 31, 2005 and $133.6 billion and $35.8 billion at December 31, 2004. In addition, these investments had total amortized costs of $148.0 billion and $48.3 billion at December 31, 2005 and $132.9 billion and $35.9 billion at December 31, 2004.
Pursuant to an agreement dated June 17, 2005, the Corporation committed to purchase approximately nine percent of the stock of China Construction Bank (CCB) for $3.0 billion. Under this agreement, the Corporation made an initial purchase of CCB shares for $2.5 billion in August 2005 and during CCB’s initial public offering in October 2005, made an additional purchase of $500 million. These shares are non-transferable until the third anniversary of the initial public offering. The Corporation also holds an option to increase its ownership interest in CCB to 19.9 percent over the next five years. At December 31, 2005, this $3.0 billion investment in CCB was included in Other Assets.
Securities are pledged or assigned to secure borrowed funds, government and trust deposits and for other purposes. The carrying value of pledged securities was $116.7 billion and $45.1 billion at December 31, 2005 and 2004.
The expected maturity distribution of the Corporation’s mortgage-backed securities and the contractual maturity distribution of the Corporation’s other securities, and the yields of the Corporation’s securities portfolio at December 31, 2005 are summarized in the following table. Actual maturities may differ from the contractual or expected maturities shown below since borrowers may have the right to prepay obligations with or without prepayment penalties.
| | | | | | | | | | | | | | | | | | | | | | | | | | | | | | | | | | Due in one year or less
| | | Due after one
year through
five years
| | | Due after five
years through
ten years
| | | Due after ten years(1)
| | | Total
| | | (Dollars in millions) | | Amount
| | Yield(2)
| | | Amount
| | Yield(2)
| | | Amount
| | Yield(2)
| | | Amount
| | Yield(2)
| | | Amount
| | Yield(2)
| | Fair value of available-for-sale securities | | | | | | | | | | | | | | | | | | | | | | | | | | | | | | | U.S. Treasury securities and agency debentures | | $ | 15 | | 3.24 | % | | $ | 378 | | 3.52 | % | | $ | 324 | | 4.34 | % | | $ | — | | — | % | | $ | 717 | | 3.88 | % | Mortgage-backed securities | | | 18 | | 4.40 | | | | 56,130 | | 4.94 | | | | 126,789 | | 5.09 | | | | 9,094 | | 5.23 | | | | 192,031 | | 5.06 | | Foreign securities | | | 891 | | 4.44 | | | | 339 | | 4.41 | | | | 9,620 | | 5.66 | | | | 41 | | 6.06 | | | | 10,891 | | 5.58 | | Other taxable securities | | | 278 | | 4.86 | | | | 6,245 | | 4.54 | | | | 4,712 | | 4.91 | | | | 1,990 | | 5.51 | | | | 13,225 | | 4.73 | | | | |
|
| | | | |
|
| | | | |
|
| | | | |
|
| | | | |
|
| | | | Total taxable | | | 1,202 | | 4.52 | | | | 63,092 | | 4.89 | | | | 141,445 | | 5.13 | | | | 11,125 | | 5.28 | | | | 216,864 | | 5.06 | | Tax-exempt securities(3) | | | 1,255 | | 4.53 | | | | 331 | | 6.79 | | | | 2,767 | | 5.78 | | | | 339 | | 5.67 | | | | 4,692 | | 5.50 | | | | |
|
| | | | |
|
| | | | |
|
| | | | |
|
| | | | |
|
| | | | Total available-for-sale securities | | $ | 2,457 | | 4.53 | % | | $ | 63,423 | | 4.90 | % | | $ | 144,212 | | 5.14 | % | | $ | 11,464 | | 5.26 | % | | $ | 221,556 | | 5.07 | % | | | |
|
| | | | |
|
| | | | |
|
| | | | |
|
| | | | |
|
| | | | Amortized cost of available- for-sale securities | | $ | 2,514 | | | | | $ | 64,885 | | | | | $ | 147,538 | | | | | $ | 11,729 | | | | | $ | 226,666 | | | | | | |
|
| | | | |
|
| | | | |
|
| | | | |
|
| | | | |
|
| | | | Amortized cost of held-to- maturity securities | | | | | | | | | | | | | | | | | | | | | | | | | | | | | | | Taxable securities | | $ | 4 | | 4.00 | % | | $ | — | | — | % | | $ | — | | — | % | | $ | — | | — | % | | $ | 4 | | 4.00 | % | Tax-exempt securities(3) | | | 10 | | 3.37 | | | | 31 | | 3.58 | | | | 2 | | 5.51 | | | | — | | — | | | | 43 | | 3.61 | | | | |
|
| | | | |
|
| | | | |
|
| | | | |
|
| | | | |
|
| | | | Total held-to-maturity securities | | $ | 14 | | 3.38 | % | | $ | 31 | | 3.58 | % | | $ | 2 | | 5.51 | % | | $ | — | | — | % | | $ | 47 | | 3.65 | % | | | |
|
| | | | |
|
| | | | |
|
| | | | |
|
| | | | |
|
| | | | Fair value of held-to- maturity securities | | $ | 14 | | | | | $ | 31 | | | | | $ | 2 | | | | | $ | — | | | | | $ | 47 | | | | | | |
|
| | | | |
|
| | | | |
|
| | | | |
|
| | | | |
|
| | | |
(1) | | Includes securities with no stated maturity. |
(2) | | Yields are calculated based on the amortized cost of the securities. |
(3) | | Yield of tax-exempt securities calculated on a FTE basis. |
The components of realized gains and losses on sales of debt securities for 2005, 2004 and 2003 were:
| | | | | | | | | | | | | | (Dollars in millions) | | 2005
| | | 2004 (Restated)
| | | 2003
| | Gross gains | | $ | 1,154 | | | $ | 2,270 | | | $ | 1,246 | | Gross losses | | | (70 | ) | | | (546 | ) | | | (305 | ) | | | |
|
|
| |
|
|
| |
|
|
| Net gains on sales of debt securities | | $ | 1,084 | | | $ | 1,724 | | | $ | 941 | | | | |
|
|
| |
|
|
| |
|
|
|
BANK OF AMERICA CORPORATION AND SUBSIDIARIES
Notes to Consolidated Financial Statements—(Continued)
The Income Tax Expense attributable to realized net gains on debt securities sales was $400 million, $640 million and $329 million in 2005, 2004 and 2003, respectively.
Note 7—Outstanding Loans and Leases
Outstanding loans and leases at December 31, 2005 and 2004 were:
| | | | | | | | | | December 31
| | (Dollars in millions) | | 2005
| | 2004
(Restated)
| Consumer | | | | | | | Residential mortgage | | $ | 182,596 | | $ | 178,079 | Credit card | | | 58,548 | | | 51,726 | Home equity lines | | | 62,098 | | | 50,126 | Direct/Indirect consumer | | | 45,490 | | | 40,513 | Other consumer(1) | | | 6,725 | | | 7,439 | | | |
|
| |
|
| Total consumer | | | 355,457 | | | 327,883 | | | |
|
| |
|
| Commercial | | | | | | | Commercial—domestic | | | 140,533 | | | 122,095 | Commercial real estate(2) | | | 35,766 | | | 32,319 | Commercial lease financing | | | 20,705 | | | 21,115 | Commercial—foreign | | | 21,330 | | | 18,401 | | | |
|
| |
|
| Total commercial | | | 218,334 | | | 193,930 | | | |
|
| |
|
| Total | | $ | 573,791 | | $ | 521,813 | | | |
|
| |
|
|
(1) | | Includes consumer finance of $2,849 million and $3,395 million; foreign consumer of $3,841 million and $3,563 million; and consumer lease financing of $35 million and $481 million at December 31, 2005 and 2004. |
(2) | | Includes domestic commercial real estate loans of $35,181 million and $31,879 million; and foreign commercial real estate loans of $585 million and $440 million at December 31, 2005 and 2004. |
The following table presents the gross recorded investment in specific loans, without consideration to the specific component of the Allowance for Loan and Lease Losses, that were considered individually impaired in accordance with SFAS 114 at December 31, 2005 and 2004. SFAS 114 impairment includes performing troubled debt restructurings, and excludes all commercial leases.
| | | | | | | | | | December 31
| | (Dollars in millions) | | 2005
| | 2004
| Commercial—domestic | | $ | 613 | | $ | 868 | Commercial real estate | | | 49 | | | 87 | Commercial—foreign | | | 34 | | | 273 | | | |
|
| |
|
| Total impaired loans | | $ | 696 | | $ | 1,228 | | | |
|
| |
|
|
The average recorded investment in certain impaired loans for 2005, 2004 and 2003 was approximately $852 million, $1.6 billion and $3.0 billion, respectively. At December 31, 2005 and 2004, the recorded investment in impaired loans requiring an Allowance for Loan and Lease Losses based on individual analysis per SFAS 114 guidelines was $517 million and $926 million, and the related Allowance for Loan and Lease Losses was $55 million and $202 million. For 2005, 2004 and 2003, Interest Income recognized on impaired loans totaled $17 million, $21 million and $105 million, respectively, all of which was recognized on a cash basis.
At December 31, 2005 and 2004, nonperforming loans and leases, including impaired loans and nonaccrual consumer loans, totaled $1.5 billion and $2.2 billion. Nonperforming securities amounted to zero and $140 million at December 31, 2005 and 2004. In addition, included in Other Assets were nonperforming loans held for sale and leveraged lease partnership interests of $50 million and $151 million at December 31, 2005 and 2004.
Foreclosed properties amounted to $92 million and $102 million at December 31, 2005 and 2004, and are included in Other Assets on the Consolidated Balance Sheet.
|
At December 31, 2006, the amortized cost and fair value of both taxable and tax-exempt Held-to-maturity Securities was $40 million. At December 31, 2005, the amortized cost and fair value of both taxable and tax-exempt Held-to-maturity Securities was $47 million. At December 31, 2006, accumulated net unrealized losses on AFS debt and marketable equity securities included in Accumulated OCI were $2.9 billion, net of the related income tax benefit of $1.7 billion. At December 31, 2005, accumulated net unrealized losses on these securities were $3.0 billion, net of the related income tax benefit of $1.8 billion. The following table presents the current fair value and the associated gross unrealized losses only on investments in securities with gross unrealized losses at December 31, 2006 and 2005. The table also discloses whether these securities have had gross unrealized losses for less than twelve months, or for twelve months or longer. | | | | | | | | | | | | | | | | | | | | | | | | | December 31, 2006 | | | | | Less than twelve months | | | Twelve months or longer | | | Total | | | (Dollars in millions) | | Fair Value | | Gross
Unrealized
Losses | | | Fair
Value | | Gross
Unrealized
Losses | | | Fair
Value | | Gross
Unrealized
Losses | | | Available-for-sale securities | | | | | | | | | | | | | | | | | | | | | | U.S. Treasury securities and agency debentures | | $ | 387 | | $ | (9 | ) | | $ | — | | $ | — | | | $ | 387 | | $ | (9 | ) | Mortgage-backed securities | | | 4,684 | | | (128 | ) | | | 151,092 | | | (4,676 | ) | | | 155,776 | | | (4,804 | ) | Foreign securities | | | 45 | | | (1 | ) | | | 6,908 | | | (77 | ) | | | 6,953 | | | (78 | ) | Other taxable securities | | | 5,452 | | | (125 | ) | | | 287 | | | (9 | ) | | | 5,739 | | | (134 | ) | Total taxable securities | | | 10,568 | | | (263 | ) | | | 158,287 | | | (4,762 | ) | | | 168,855 | | | (5,025 | ) | Tax-exempt securities | | | 811 | | | (4 | ) | | | 1,271 | | | (30 | ) | | | 2,082 | | | (34 | ) | Total temporarily-impaired available-for-sale debt securities | | | 11,379 | | | (267 | ) | | | 159,558 | | | (4,792 | ) | | | 170,937 | | | (5,059 | ) | Temporarily-impaired marketable equity securities | | | 244 | | | (10 | ) | | | — | | | — | | | | 244 | | | (10 | ) | Total temporarily-impaired securities | | $ | 11,623 | | $ | (277 | ) | | $ | 159,558 | | $ | (4,792 | ) | | $ | 171,181 | | $ | (5,069 | ) |
| | | | | | | | | | | | | | | | | | | | | | | | | December 31, 2005 | | | | | Less than twelve months | | | Twelve months or longer | | | Total | | | (Dollars in millions) | | Fair Value | | Gross
Unrealized
Losses | | | Fair Value | | Gross
Unrealized
Losses | | | Fair Value | | Gross
Unrealized
Losses | | | Available-for-sale securities | | | | | | | | | | | | | | | | | | | | | | U.S. Treasury securities and agency debentures | | $ | 251 | | $ | (9 | ) | | $ | 163 | | $ | (4 | ) | | $ | 414 | | $ | (13 | ) | Mortgage-backed securities | | | 149,979 | | | (3,766 | ) | | | 40,236 | | | (1,502 | ) | | | 190,215 | | | (5,268 | ) | Foreign securities | | | 3,455 | | | (41 | ) | | | 852 | | | (13 | ) | | | 4,307 | | | (54 | ) | Other taxable securities | | | 3,882 | | | (79 | ) | | | 469 | | | (20 | ) | | | 4,351 | | | (99 | ) | Total taxable securities | | | 157,567 | | | (3,895 | ) | | | 41,720 | | | (1,539 | ) | | | 199,287 | | | (5,434 | ) | Tax-exempt securities | | | 2,308 | | | (27 | ) | | | 156 | | | (5 | ) | | | 2,464 | | | (32 | ) | Total temporarily-impaired available-for-sale debt securities | | | 159,875 | | | (3,922 | ) | | | 41,876 | | | (1,544 | ) | | | 201,751 | | | (5,466 | ) | Temporarily-impaired marketable equity securities | | | 146 | | | (18 | ) | | | — | | | — | | | | 146 | | | (18 | ) | Total temporarily-impaired securities | | $ | 160,021 | | $ | (3,940 | ) | | $ | 41,876 | | $ | (1,544 | ) | | $ | 201,897 | | $ | (5,484 | ) |
Management evaluates securities for other-than-temporary impairment on a quarterly basis, and more frequently when conditions warrant such evaluation. Factors considered in determining whether an impairment is other-than-temporary include (1) the length of time and the extent to which the fair value has been less than cost, (2) the financial condition and near-term prospects of the issuer, and (3) the intent and ability of the Corporation to hold the investment for a period of time sufficient to allow for any anticipated recovery in fair value. At December 31, 2006, the amortized cost of approximately 5,000 securities in AFS securities exceeded their fair value by $5.1 billion. Included in the $5.1 billion of gross unrealized losses on AFS securities at December 31, 2006, was $277 million of gross unrealized losses that have existed for less than twelve months and $4.8 billion of gross unrealized losses that have existed for a period of twelve months or longer. Of the gross unrealized losses existing for twelve months or more, $4.7 billion, or 98 percent, of the gross unrealized loss is related to approximately 1,500 mortgage-backed securities. These securities are predominately all investment grade, with more than 90 percent rated AAA. The gross unrealized losses on these mortgage-backed securities are due to overall increases in market interest rates. The Corporation has the ability and intent to hold these securities for a period of time sufficient to recover all gross unrealized losses. Accordingly, the Corporation has not recognized any other-than-temporary impairment for these securities. The Corporation had investments in securities from the Federal National Mortgage Association (Fannie Mae) and Federal Home Loan Mortgage Corporation (Freddie Mac) that exceeded 10 percent of consolidated Shareholders’ Equity as of December 31, 2006 and 2005. Those investments had market values of $109.9 billion and $42.0 billion at December 31, 2006, and $144.1 billion and $46.9 billion at December 31, 2005. In addition, these investments had total amortized costs of $113.5 billion and $43.3 billion at December 31, 2006, and $148.0 billion and $48.3 billion at December 31, 2005. As disclosed in the preceding paragraph, the Corporation has not recognized any other-than-temporary impairment for these securities. Securities are pledged or assigned to secure borrowed funds, government and trust deposits and for other purposes. The carrying value of pledged securities was $83.8 billion and $116.7 billion at December 31, 2006 and 2005. The expected maturity distribution of the Corporation’s mortgage-backed securities and the contractual maturity distribution of the Corporation’s other debt securities, and the yields of the Corporation’s AFS debt securities portfolio at December 31, 2006 are summarized in the following table. Actual maturities may differ from the contractual or expected maturities shown below since borrowers may have the right to prepay obligations with or without prepayment penalties. | | | | | | | | | | | | | | | | | | | | | | | | | | | | | | | | | | Due in one
year or less | | | Due after one year
through five years | | | Due after five years
through ten years | | | Due after
ten years (1) | | | Total | | | (Dollars in millions) | | Amount | | Yield (2) | | | Amount | | Yield (2) | | | Amount | | Yield (2) | | | Amount | | Yield (2) | | | Amount | | Yield (2) | | Fair value of available-for-sale debt securities | | | | | | | | | | | | | | | | | | | | | | | | | | | | | | | U.S. Treasury securities and agency debentures | | $ | 78 | | 4.08 | % | | $ | 524 | | 3.96 | % | | $ | 80 | | 4.31 | % | | $ | 6 | | 5.73 | % | | $ | 688 | | 4.03 | % | Mortgage-backed securities | | | 17 | | 5.59 | | | | 11,456 | | 4.40 | | | | 143,370 | | 5.04 | | | | 2,050 | | 8.62 | | | | 156,893 | | 5.04 | | Foreign securities | | | 819 | | 4.88 | | | | 6,177 | | 5.27 | | | | 4,949 | | 5.37 | | | | 105 | | 6.27 | | | | 12,050 | | 5.29 | | Other taxable securities | | | 3,581 | | 4.70 | | | | 10,435 | | 5.19 | | | | 2,237 | | 5.33 | | | | 399 | | 6.40 | | | | 16,652 | | 5.13 | | Total taxable | | | 4,495 | | 4.73 | | | | 28,592 | | 4.87 | | | | 150,636 | | 5.06 | | | | 2,560 | | 8.17 | | | | 186,283 | | 5.06 | | Tax-exempt securities (3) | | | 1,000 | | 5.82 | | | | 1,169 | | 5.90 | | | | 3,226 | | 5.82 | | | | 1,128 | | 6.44 | | | | 6,523 | | 5.94 | | Total available-for-sale debt securities | | $ | 5,495 | | 4.93 | % | | $ | 29,761 | | 4.91 | % | | $ | 153,862 | | 5.07 | % | | $ | 3,688 | | 7.64 | % | | $ | 192,806 | | 5.09 | % | Amortized cost of available-for-sale debt securities | | $ | 5,495 | | | | | $ | 30,293 | | | | | $ | 158,301 | | | | | $ | 3,696 | | | | | $ | 197,785 | | | |
(1) | Includes securities with no stated maturity. |
(2) | Yields are calculated based on the amortized cost of carrying foreclosed propertiesthe securities. |
(3) | Yield of tax-exempt securities calculated on a fully taxable-equivalent (FTE) basis. |
The components of realized gains and losses on sales of debt securities for 2006, 2005 and 2004 were: | | | | | | | | | | | | | | (Dollars in millions) | | 2006 | | | 2005 | | | 2004 | | Gross gains | | $ | 87 | | | $ | 1,154 | | | $ | 2,270 | | Gross losses | | | (530 | ) | | | (70 | ) | | | (546 | ) | Net gains (losses) on sales of debt securities | | $ | (443 | ) | | $ | 1,084 | | | $ | 1,724 | |
The Income Tax Expense (Benefit) attributable to realized net gains (losses) on debt securities sales was $(163) million, $400 million, and $640 million in 2006, 2005 and 2004, respectively. Pursuant to an agreement dated June 17, 2005, the Corporation agreed to purchase approximately nine percent, or 19.1 billion shares, of the stock of China Construction Bank (CCB). These shares are accounted for at cost as they are non-transferable until the third anniversary of the initial public offering in October 2008. The Corporation also holds an option to increase its ownership interest in CCB to 19.9 percent. This option expires in February 2011. At December 31, 2006, the investment in the CCB shares was included in Other Assets. Additionally, the Corporation sold its Brazilian operations to Banco Itaú Holding Financeira S.A. (Banco Itaú) for approximately $1.9 billion in preferred stock. These shares are non-transferable for three years from the date of the agreement dated May 1, 2006 and are accounted for at cost. The sale closed in September 2006. At December 31, 2006, this $1.9 billion of preferred stock was included in Other Assets. The shares of CCB and Banco Itaú are currently carried at cost but, as required by GAAP, will be accounted for as AFS marketable equity securities and carried at fair value with an offset to Accumulated OCI beginning in the fourth quarter of 2007 and second quarter of 2008, respectively. The fair values of the CCB shares and Banco Itaú shares were approximately $12.2 billion and $2.5 billion at December 31, 2006. | | NOTE 6 – Outstanding Loans and Leases |
Outstanding loans and leases at December 31, 2006 and 2005 were: | | | | | | | | | | December 31 | | (Dollars in millions) | | 2006 | | 2005 | Consumer | | | | | | | Residential mortgage | | $ | 241,181 | | $ | 182,596 | Credit card—domestic | | | 61,195 | | | 58,548 | Credit card—foreign | | | 10,999 | | | — | Home equity lines | | | 74,888 | | | 62,098 | Direct/Indirect consumer(1) | | | 68,224 | | | 45,490 | Other consumer(2) | | | 9,218 | | | 6,725 | Total consumer | | | 465,705 | | | 355,457 | Commercial | | | | | | | Commercial—domestic | | | 161,982 | | | 140,533 | Commercial real estate(3) | | | 36,258 | | | 35,766 | Commercial lease financing | | | 21,864 | | | 20,705 | Commercial—foreign | | | 20,681 | | | 21,330 | Total commercial | | | 240,785 | | | 218,334 | Total | | $ | 706,490 | | $ | 573,791 |
(1) | Includes home equity loans of $12.8 billion and $8.1 billion at December 31, 2006 and 2005. |
(2) | Includes foreign consumer loans of $6.2 billion and $3.8 billion at December 31, 2006 and 2005 2004 and 2003 amounted to $4 million, $3consumer finance loans of $2.8 billion for both December 31, 2006 and 2005. |
(3) | Includes domestic commercial real estate loans of $35.7 billion and $35.2 billion, and foreign commercial real estate loans of $578 million and $3$585 million respectively.at December 31, 2006 and 2005. BANK OF AMERICA CORPORATION AND SUBSIDIARIES
|
The following table presents the recorded loan amounts, without consideration for the specific component of the Allowance for Loan and Lease Losses, that were considered individually impaired in accordance with SFAS 114 at December 31, 2006 and 2005. SFAS 114 impairment includes performing troubled debt restructurings and excludes all commercial leases. | | | | | | | | | | December 31 | | (Dollars in millions) | | 2006 | | 2005 | Commercial—domestic | | $ | 586 | | $ | 613 | Commercial real estate | | | 118 | | | 49 | Commercial—foreign | | | 13 | | | 34 | Total impaired loans | | $ | 717 | | $ | 696 |
The average recorded investment in certain impaired loans for 2006, 2005 and 2004 was approximately $722 million, $852 million and $1.6 billion, respectively. At December 31, 2006 and 2005, the recorded investment in impaired loans requiring an Allowance for Loan and Lease Losses based on individual analysis per SFAS 114 guidelines was $567 million and $517 million, and the related Allowance for Loan and Lease Losses was $43 million and $55 million. For 2006, 2005 and 2004, Interest Income recognized on impaired loans totaled $36 million, $17 million and $21 million, respectively, all of which was recognized on a cash basis. At December 31, 2006 and 2005, nonperforming loans and leases, including impaired loans and nonaccrual consumer loans, totaled $1.8 billion and $1.5 billion. In addition, included in Other Assets were nonperforming loans held-for-sale of $80 million and $69 million at December 31, 2006 and 2005. The Corporation has loan products with varying terms (e.g., interest-only mortgages, option adjustable rate mortgages, etc.) and loans with high loan-to-value ratios. Exposure to any of these loan products does not result in a significant concentration of credit risk. Terms of loan products, collateral coverage, the borrower’s credit history, and the amount of these loans that are retained on our balance sheet are included in the Corporation’s assessment when establishing its Allowance for Loan and Lease Losses. | Notes to Consolidated Financial Statements—(Continued)Note 8—NOTE 7 – Allowance for Credit Losses
|
The following table summarizes the changes in the allowance for credit losses for 2006, 2005 and 2004: | | | | | | | | | | | | | | (Dollars in millions) | | 2006 | | | 2005 | | | 2004 | | Allowance for loan and lease losses, January 1 | | $ | 8,045 | | | $ | 8,626 | | | $ | 6,163 | | FleetBoston balance, April 1, 2004 | | | — | | | | — | | | | 2,763 | | MBNA balance, January 1, 2006 | | | 577 | | | | — | | | | — | | Loans and leases charged off | | | (5,881 | ) | | | (5,794 | ) | | | (4,092 | ) | Recoveries of loans and leases previously charged off | | | 1,342 | | | | 1,232 | | | | 979 | | Net charge-offs | | | (4,539 | ) | | | (4,562 | ) | | | (3,113 | ) | Provision for loan and lease losses | | | 5,001 | | | | 4,021 | | | | 2,868 | | Other | | | (68 | ) | | | (40 | ) | | | (55 | ) | Allowance for loan and lease losses, December 31 | | | 9,016 | | | | 8,045 | | | | 8,626 | | Reserve for unfunded lending commitments, January 1 | | | 395 | | | | 402 | | | | 416 | | FleetBoston balance, April 1, 2004 | | | — | | | | — | | | | 85 | | Provision for unfunded lending commitments | | | 9 | | | | (7 | ) | | | (99 | ) | Other | | | (7 | ) | | | — | | | | — | | Reserve for unfunded lending commitments, December 31 | | | 397 | | | | 395 | | | | 402 | | Total allowance for credit losses | | $ | 9,413 | | | $ | 8,440 | | | $ | 9,028 | |
| | NOTE 8 – Mortgage Servicing Rights |
Effective January 1, 2006, the Corporation adopted SFAS 156 and accounts for consumer-related MSRs at fair value with changes in fair value recorded in the Consolidated Statement of Income in Mortgage Banking Income. The Corporation economically hedges these MSRs with certain derivatives such as options and interest rate swaps. Prior to January 1, 2006, consumer-related MSRs were accounted for on a lower of cost or market basis and hedged with derivatives that qualified for SFAS 133 hedge accounting. The following table presents activity for consumer-related MSRs for 2006 and 2005. | | | | | | | | | | (Dollars in millions) | | 2006 | | | 2005 | | Balance, January 1 | | $ | 2,658 | | | $ | 2,358 | | MBNA balance, January 1, 2006 | | | 9 | | | | — | | Additions | | | 572 | | | | 860 | | Sales of MSRs | | | (71 | ) | | | (176 | ) | Impact of customer payments | | | (713 | ) | | | — | | Amortization | | | — | | | | (612 | ) | Other changes in MSR market value(1) | | | 414 | | | | 228 | | Balance, December 31(2) | | $ | 2,869 | | | $ | 2,658 | |
(1) | For 2006, amount reflects changes in discount rates and prepayment speed assumptions, mostly due to changes in interest rates. For 2005, amount reflects $291 million related to change in value attributed to SFAS 133 hedged MSRs, and $63 million of impairments. |
(2) | Before the adoption of SFAS 156, there was an impairment allowance of $257 million at December 31, 2005. |
Commercial-related MSRs are accounted for using the amortization method (i.e., lower of cost or market). Commercial-related MSRs were $176 million and $148 million at December 31, 2006 and 2005 and are not included in the table above. The key economic assumptions used in valuations of MSRs included modeled prepayment rates and resultant weighted- average lives of the MSRs and the option adjusted spread (OAS) levels. An OAS model runs multiple interest rate scenarios and projects prepayments specific to each one of those interest rate scenarios. As of December 31, 2006, the fair value of consumer-related MSRs was $2.9 billion, and the modeled weighted-average lives of MSRs related to fixed and adjustable rate loans (including hybrid Adjustable Rate Mortgages) were 4.98 years and 3.19 years. The following table presents the sensitivity of the weighted-average lives and fair value of MSRs to changes in modeled assumptions. | | | | | | | | | | | | | | December 31, 2006 | | | | | Change in Weighted-average lives | | | | | | (Dollars in millions) | | Fixed | | | Adjustable | | | Change in Fair value | | Prepayment rates | | | | | | | | | | | Impact of 10% decrease | | 0.33 | years | | 0.26 | years | | $ | 135 | | Impact of 20% decrease | | 0.70 | | | 0.58 | | | | 289 | | | | | | Impact of 10% increase | | (0.29 | ) | | (0.23 | ) | | | (120 | ) | Impact of 20% increase | | (0.55 | ) | | (0.42 | ) | | | (227 | ) | OAS level | | | | | | | | | | | Impact of 100 bps decrease | | n/a | | | n/a | | | | 109 | | Impact of 200 bps decrease | | n/a | | | n/a | | | | 227 | | | | | | Impact of 100 bps increase | | n/a | | | n/a | | | | (101 | ) | Impact of 200 bps increase | | n/a | | | n/a | | | | (195 | ) |
The Corporation securitizes assets and may continue to hold a portion or all of the securities, subordinated tranches, interest-only strips, subordinated interests in accrued interest and fees on the securitized receivables, and, in some cases, cash reserve accounts, all of which are known as retained interests, which are carried at fair value or amounts that approximate fair value. Those assets may be serviced by the Corporation or by third parties. The following table summarizes the changes in the allowance for credit losses for 2005, 2004 and 2003:
| | Mortgage-related Securitizations |
The Corporation securitizes a portion of its residential mortgage loan originations in conjunction with or shortly after loan closing. In addition, the Corporation may, from time to time, securitize commercial mortgages and first residential mortgages that it originates or purchases from other entities. In 2006 and 2005, the Corporation converted a total of $65.5 billion (including $15.5 billion originated by other entities) and $95.1 billion (including $15.9 billion originated by other entities), of commercial mortgages and first residential mortgages into mortgage-backed securities issued through Fannie Mae, Freddie Mac, Government National Mortgage Association, Bank of America, N.A. and Banc of America Mortgage Securities. At December 31, 2006 and 2005, the Corporation retained $5.5 billion (including $4.2 billion issued prior to 2006) and $7.2 billion (including $2.4 billion issued prior to 2005) of these securities. At December 31, 2006, these retained interests were valued using quoted market prices. In 2006, the Corporation reported $341 million in gains on loans converted into securities and sold, of which gains of $329 million were from loans originated by the Corporation and $12 million were from loans originated by other entities. In 2005, the Corporation reported $575 million in gains on loans converted into securities and sold, of which gains of $592 million were from loans originated by the Corporation and losses of $17 million were from loans originated by other entities. At December 31, 2006 and 2005, the Corporation had recourse obligations of $412 million and $471 million with varying terms up to seven years on loans that had been securitized and sold. In 2006 and 2005, the Corporation purchased $17.4 billion and $19.6 billion of mortgage-backed securities from third parties and resecuritized them. Net gains, which include Net Interest Income earned during the holding period, totaled $25 million and $13 million. The Corporation did not retain any of the securities issued in these transactions. In 2006 and 2005, the Corporation also purchased an additional $4.9 billion and $7.2 billion of mortgage loans from third parties and securitized them. In 2006, the Corporation retained residual interests in these transactions which totaled $224 million at December 31, 2006 and are classified in Trading Account Assets, with changes in fair value recorded in earnings. These residual interests are included in the sensitivity table below which sets forth the sensitivity of the fair value of residual interests to changes in key assumptions. In 2005, the Corporation resecuritized the residual interests and did not retain a significant interest in the securitization trusts. The Corporation reported $16 million and $4 million in gains on these transactions in 2006 and 2005. The Corporation has retained MSRs from the sale or securitization of mortgage loans. Servicing fee and ancillary fee income on all mortgage loans serviced, including securitizations, was $775 million and $789 million in 2006 and 2005. For more information on MSRs, see Note 8 of the Consolidated Financial Statements. | | | | | | | | | | | | | | (Dollars in millions) | | 2005
| | | 2004
| | | 2003
| | Allowance for loan and lease losses, January 1 | | $ | 8,626 | | | $ | 6,163 | | | $ | 6,358 | | FleetBoston balance, April 1, 2004 | | | — | | | | 2,763 | | | | — | | Loans and leases charged off | | | (5,794 | ) | | | (4,092 | ) | | | (3,867 | ) | Recoveries of loans and leases previously charged off | | | 1,232 | | | | 979 | | | | 761 | | | | |
|
|
| |
|
|
| |
|
|
| Net charge-offs | | | (4,562 | ) | | | (3,113 | ) | | | (3,106 | ) | | | |
|
|
| |
|
|
| |
|
|
| Provision for loan and lease losses | | | 4,021 | | | | 2,868 | | | | 2,916 | | Transfers | | | (40 | ) | | | (55 | ) | | | (5 | ) | | | |
|
|
| |
|
|
| |
|
|
| Allowance for loan and lease losses, December 31 | | | 8,045 | | | | 8,626 | | | | 6,163 | | | | |
|
|
| |
|
|
| |
|
|
| Reserve for unfunded lending commitments, January 1 | | | 402 | | | | 416 | | | | 493 | | FleetBoston balance, April 1, 2004 | | | — | | | | 85 | | | | — | | Provision for unfunded lending commitments | | | (7 | ) | | | (99 | ) | | | (77 | ) | | | |
|
|
| |
|
|
| |
|
|
| Reserve for unfunded lending commitments, December 31 | | | 395 | | | | 402 | | | | 416 | | | | |
|
|
| |
|
|
| |
|
|
| Total Allowance for Credit Losses | | $ | 8,440 | | | $ | 9,028 | | | $ | 6,579 | | | | |
|
|
| |
|
|
| |
|
|
|
| | Credit Card and Other Securitizations |
As a result of the MBNA merger, the Corporation acquired interests in credit card, other consumer, and commercial loan securitization vehicles. These acquired interests include interest-only strips, subordinated tranches, cash reserve accounts, and subordinated interests in accrued interest and fees on the securitized receivables. During 2006, the Corporation securitized $23.7 billion of credit card receivables resulting in $104 million in gains (net of securitization transaction costs of $28 million) which was recorded in Card Income. Aggregate debt securities outstanding for the MBNA credit card securitization trusts as of December 31, 2006 and January 1, 2006, were $96.0 billion and $81.6 billion. As of December 31, 2006 and January 1, 2006, the aggregate debt securities outstanding for the Corporation’s credit card securitization trusts, including MBNA, were $96.8 billion and $83.8 billion. The other consumer and commercial loan securitization vehicles acquired with MBNA were not material to the Corporation. The Corporation also securitized $3.3 billion and $3.8 billion of automobile loans and recorded losses of $6 million and $17 million in 2006 and 2005. At December 31, 2006 and 2005, aggregate debt securities outstanding for the Corporation’s automobile securitization vehicles were $5.2 billion and $4.0 billion, and the Corporation held residual interests which totaled $130 million and $93 million. At December 31, 2006 and 2005, the Corporation held investment grade securities issued by its securitization vehicles of $3.5 billion (none of which were issued in 2006) and $4.4 billion (including $2.6 billion issued in 2005), which are valued using quoted market prices, in the AFS securities portfolio. At December 31, 2006 and 2005, there were no recognized servicing assets or liabilities associated with any of these securitization transactions. The Corporation has provided protection on a subset of one consumer finance securitization in the form of a guarantee with a maximum payment of $220 million that will only be paid if over-collateralization is not sufficient to absorb losses and certain other conditions are met. The Corporation projects no payments will be due over the remaining life of the contract, which is less than one year. Key economic assumptions used in measuring the fair value of certain residual interests that continue to be held by the Corporation (included in Other Assets) in securitizations and the sensitivity of the current fair value of residual cash flows to changes in those assumptions are disclosed in the following table. | | | | | | | | | | | | | | | | | | Credit Card | | | Consumer Finance(1) | | | (Dollars in millions) | | 2006 | | | 2005 | | | 2006 | | | | | 2005 | | | Carrying amount of residual interests(2) | | $ 2,929 | | | $ 203 | | | $ 811 | | | | | $ 290 | | | Balance of unamortized securitized loans | | 98,295 | | | 2,237 | | | 6,153 | | | | | 2,667 | | | Weighted average life to call or maturity (in years) | | 0.3 | | | 0.5 | | | 0.3-2.7 | | | | | 0.8 | | | Revolving structures—monthly payment rate | | 11.2-19.8 | % | | 12.1 | % | | | | | | | | | Amortizing structures—annual constant prepayment rate: | | | | | | | | | | | | | | | Fixed rate loans | | | | | | | | 20.0-25.9 | | | % | | 26.3-28.9 | % | Adjustable rate loans | | | | | | | | 32.8-37.1 | | | | | 37.6 | | Impact on fair value of 10% favorable change | | $ 43 | | | $ 2 | | | $ 7 | | | | | $ 8 | | Impact on fair value of 25% favorable change | | 133 | | | 3 | | | 12 | | | | | 17 | | Impact on fair value of 10% adverse change | | (38 | ) | | (2 | ) | | (15 | ) | | | | (16 | ) | Impact on fair value of 25% adverse change | | (82 | ) | | (3 | ) | | (23 | ) | | | | (39 | ) | | Expected credit losses(3) | | 3.8-5.8 | % | | 4.0-4.3 | % | | 4.4-5.9 | | | % | | 3.9-5.6 | % | Impact on fair value of 10% favorable change | | $ 86 | | | $ 3 | | | $ 16 | | | | | $ 7 | | Impact on fair value of 25% favorable change | | 218 | | | 8 | | | 42 | | | | | 18 | | Impact on fair value of 10% adverse change | | (85 | ) | | (3 | ) | | (15 | ) | | | | (7 | ) | Impact on fair value of 25% adverse change | | (211 | ) | | (8 | ) | | (36 | ) | | | | (18 | ) | | Residual cash flows discount rate (annual rate) | | 12.5 | % | | 12.0 | % | | 16.0-30.0 | | | % | | 30.0 | % | Impact on fair value of 100 bps favorable change | | $ 12 | | | $ — | | | $ 5 | | | | | $ 5 | | Impact on fair value of 200 bps favorable change | | 17 | | | — | | | 11 | | | | | 11 | | Impact on fair value of 100 bps adverse change | | (14 | ) | | — | | | (5 | ) | | | | (5 | ) | Impact on fair value of 200 bps adverse change | | (27 | ) | | — | | | (10 | ) | | | | (10 | ) |
Note 9—Special Purpose Financing Entities(1)
| The Corporation securitizes assetsConsumer finance includes mortgage loans purchased and may retain a portion or all of the securities, subordinated tranches, interest-only stripssecuritized in 2006 and originated consumer finance loans that were securitized in some cases, a cash reserve account,2001, all of which are considered retainedserviced by third parties.
|
(2) | Residual interests include interest-only strips, subordinated tranches, subordinated interests in accrued interest and fees on the securitized assets. Those assets may be serviced by the Corporationreceivables and cash reserve accounts which are carried at fair value or by third parties. The Corporation also uses other special purpose financing entities to access the commercial paper market and for other lending, leasing and real estate activities. Mortgage-related Securitizations
The Corporation securitizes the majority of its residential mortgage loan originationsamounts that approximate fair value. Residual interests in conjunction with or shortly after loan closing. In addition, the Corporation may, from time to time, securitize commercial mortgages and first residential mortgages that it originates or purchases from other entities. In 2005 and 2004, the Corporation converted a total of $102.6 billion (including $23.3 billion originated by other entities) and $96.9 billion (including $18.0 billion originated by other entities), of residential first mortgages and commercial mortgages into mortgage-backed securities issued through Fannie Mae, Freddie Mac, Government National Mortgage Association, Bank of America, N.A. and Banc of America Mortgage Securities. At December 31, 2005 and 2004, the Corporation retained $7.2 billion (including $2.4 billion issued prior to 2005) and $9.2 billion (including $1.2 billion issued prior to 2004) of securities. At December 31, 2005, these retained interests were valued using quoted market prices.
In 2005, the Corporation reported $577 million in gains on loans converted into securities and sold, of which gains of $592 million were from loans originated by the Corporation and losses of $15 million were from loans originated by other entities. In 2004, the Corporation reported $952 million in gains on loans converted into securities and sold, of which gains of $886 million were from loans originated by the Corporation and gains of $66 million were from loans originated by other entities. At December 31, 2005, the Corporation had recourse obligations of $471 million with varying terms up to seven years on loans that had been securitized and sold.
In 2005 and 2004, the Corporation purchased $19.6 billion and $31.1 billion of mortgage-backed securities from third parties and resecuritized them. Net gains, which include net interest income earned during the holding period, totaled $13 million and $55 million. The Corporation did not retain any of the securities issued in these transactions.
BANK OF AMERICA CORPORATION AND SUBSIDIARIES
Notes to Consolidated Financial Statements—(Continued)
The Corporation has retained MSRs from the sale or securitization of mortgage loans. Servicing fee and ancillary fee income on all mortgage loans serviced, including securitizations, was $789totaling $224 million and $568 million in 2005 and 2004. The following table presents activity in MSRs in 2005 and 2004. Effective June 1, 2004, Excess Spread Certificates (the Certificates) were converted to MSRs.
| | | | | | | | | | (Dollars in millions) | | 2005
| | | 2004
| | Balance, January 1 | | $ | 2,481 | | | $ | 479 | | | | |
|
|
| |
|
|
| Additions | | | 910 | | | | 3,035 | (1) | Amortization | | | (637 | ) | | | (360 | ) | Sales of MSRs | | | (176 | ) | | | — | | Valuation adjustment of MSRs(2) | | | 228 | | | | (673 | ) | | | |
|
|
| |
|
|
| Balance, December 31(3) | | $ | 2,806 | | | $ | 2,481 | | | | |
|
|
| |
|
|
|
(1) | | Includes $2.2 billion of Excess Spread Certificates converted to MSRs on June 1, 2004. |
(2) | | For 2005 and 2004, includes $291 million and $(210) million related to change in value attributed to SFAS 133 hedged MSRs and $63 million and $463 million of impairment. |
(3) | | Net of impairment allowance of $257 million and $361 million for 2005 and 2004. |
The estimated fair value of MSRs was $2.8 billion and $2.5 billion at December 31, 2005 and 2004.
The key economic assumptions used2006 are classified in valuations of MSRs include modeled prepayment rates and resultant expected weighted average lives of the MSRs and the option adjusted spread (OAS) levels. An OAS model runs multiple interest rate scenarios and projects prepayments specific to each one of those interest rate scenarios.
As of December 31, 2005, the modeled weighted average lives of MSRs related to fixed and adjustable rate loans (including hybrid ARMs) were 4.94 years and 3.03 years. A decrease of 10 and 20 percent in modeled prepayments would extend the expected weighted average lives for MSRs related to fixed rate loans to 5.26 years and 5.63 years, and would extend the expected weighted average lives for MSRs related to adjustable rate loans to 3.30 years and 3.63 years. The expected extension of weighted average lives would increase the value of MSRs by a range of $126 million to $269 million. An increase of 10 and 20 percent in modeled prepayments would reduce the expected weighted average lives for MSRs related to fixed rate loans to 4.65 years and 4.40 years, and would reduce the expected weighted average lives for MSRs related to adjustable rate loans to 2.81 years and 2.62 years. The expected reduction of weighted average lives would decrease the value of MSRs by a range of $112 million to $212 million. A decrease of 100 and 200 basis points (bps) in the OAS level would result in an increase in the value of MSRs ranging from $97 million to $202 million, and an increase of 100 and 200 bps in the OAS level would result in a decrease in the value of MSRs ranging from $90 million to $175 million.
For purposes of evaluating and measuring impairment, the Corporation stratifies the portfolio based on the predominant risk characteristics of loan type and note rate. Indicated impairment, by risk stratification, is recognized as a reduction in Mortgage Banking Income, through a valuation allowance, for any excess of adjusted carrying value over estimated fair value.
Trading Account Assets. Other Securitizations As a result of the FleetBoston Merger in 2004, the Corporation acquired an interest in several credit card, home equity loan and commercial loan securitization vehicles, which had aggregate debt securities outstanding of $4.1 billion as of December 31, 2005.
At December 31, 2005 and 2004, the Corporation retained investment grade securities of $4.4 billion (including $2.6 billion issued in 2005) and $2.9 billion, which are valued using quoted market prices, in the AFS securities portfolio. At December 31, 2005 there were no recognized servicing assets associated with these securitization transactions.
The Corporation has provided protection on a subset of one consumer finance securitization in the form of a guarantee with a maximum payment of $220 million that will only be paid if over-collateralization is not sufficient to absorb losses and certain other conditions are met. The Corporation projects no payments will be due over the remaining life of the contract, which is less than one year.
BANK OF AMERICA CORPORATION AND SUBSIDIARIES
Notes to Consolidated Financial Statements—(Continued)
Key economic assumptions used in measuring the fair value of certain residual interests (includedare classified in Other Assets) in securitizations and the sensitivity of the current fair value of residual cash flows to changes in those assumptions are as follows:Assets.
|
(3) | | | | | | | | | | | | | | | | | | | | | | | | | | | | | | | | | | | | Credit Card(1)
| | | Subprime Consumer
Finance(2)
| | | Automobile
Loans
| | | Commercial
Loans
| | | (Dollars in millions) | | 2005
| | | 2004
| | | 2005
| | | 2004
| | | 2005
| | | 2004
| | | 2005
| | | 2004
| | | Carrying amount of residual interests (at fair value)(3) | | $ | 203 | | | $ | 349 | | | $ | 290 | | | $ | 313 | | | $ | 93 | | | $ | 34 | | | $ | 92 | | | $ | 130 | | | Balance of unamortized securitized loans | | | 2,237 | | | | 6,903 | | | | 2,667 | | | | 4,892 | | | | 3,996 | | | | 1,644 | | | | 1,904 | | | | 3,337 | | | Weighted average life to call or maturity (in years)(4) | | | 0.5 | | | | 1.2 | | | | 0.8 | | | | 1.3 | | | | 1.6 | | | | 1.4 | | | | 1.8 | | | | 1.8 | | | Revolving structures—annual payment rate | | | 12.1 | % | | | 13.7 | % | | | | | | | | | | | | | | | | | | | 25.8 | % | | | 26.0 | % | | Amortizing structures—annual constant prepayment rate: | | | | | | | | | | | | | | | | | | | | | | | | | | | | | | | | | Fixed rate loans | | | | | | | | | | | 26.3-28.9 | % | | | 28.3-32.7 | % | | | 17.6-25.5 | % | | | 24.9 | % | | | | | | | | | Adjustable rate loans | | | | | | | | | | | 37.6 | | | | 27.0-40.8 | | | | — | | | | — | | | | | | | | | | Impact on fair value of 100 bps favorable change | | $ | 2 | | | $ | 1 | | | $ | — | | | $ | 1 | | | $ | — | | | $ | — | | | $ | — | | | $ | 2 | | Impact on fair value of 200 bps favorable change | | | 3 | | | | 2 | | | | — | | | | 11 | | | | 1 | | | | — | | | | 1 | | | | 2 | | Impact on fair value of 100 bps adverse change | | | (2 | ) | | | (1 | ) | | | (8 | ) | | | (9 | ) | | | (1 | ) | | | — | | | | — | | | | (1 | ) | Impact on fair value of 200 bps adverse change | | | (3 | ) | | | (2 | ) | | | (9 | ) | | | (17 | ) | | | (1 | ) | | | (1 | ) | | | (1 | ) | | | (1 | ) | | Expected credit losses(5) | | | 4.0-4.3 | % | | | 5.3-9.7 | % | | | 3.9-5.6 | % | | | 5.1-11.3 | % | | | 1.8-1.8 | % | | | 1.6 | % | | | 0.4 | % | | | 0.4 | % | Impact on fair value of 10% favorable change | | $ | 3 | | | $ | 18 | | | $ | 7 | | | $ | 27 | | | $ | 7 | | | $ | 3 | | | $ | 1 | | | $ | 1 | | Impact on fair value of 25% favorable change | | | 8 | | | | 47 | | | | 18 | | | | 71 | | | | 15 | | | | 6 | | | | 2 | | | | 2 | | Impact on fair value of 10% adverse change | | | (3 | ) | | | (15 | ) | | | (7 | ) | | | (27 | ) | | | (6 | ) | | | (2 | ) | | | (1 | ) | | | (1 | ) | Impact on fair value of 25% adverse change | | | (8 | ) | | | (27 | ) | | | (18 | ) | | | (68 | ) | | | (15 | ) | | | (6 | ) | | | (2 | ) | | | (2 | ) | | Residual cash flows discount rate (annual rate) | | | 12.0 | % | | | 6.0-12.0 | % | | | 30.0 | % | | | 30.0 | % | | | 15.0-20.0 | % | | | 20.0 | % | | | 12.3 | % | | | 12.3 | % | Impact on fair value of 100 bps favorable change | | $ | — | | | $ | — | | | $ | 5 | | | $ | 6 | | | $ | 3 | | | $ | 1 | | | $ | 1 | | | $ | 1 | | Impact on fair value of 200 bps favorable change | | | — | | | | — | | | | 11 | | | | 12 | | | | 5 | | | | 1 | | | | 1 | | | | 2 | | Impact on fair value of 100 bps adverse change | | | — | | | | — | | | | (5 | ) | | | (6 | ) | | | (2 | ) | | | (1 | ) | | | (1 | ) | | | (1 | ) | Impact on fair value of 200 bps adverse change | | | — | | | | — | | | | (10 | ) | | | (12 | ) | | | (5 | ) | | | (1 | ) | | | (1 | ) | | | (2 | ) |
(1) | | The impact of changing residual cash flows discount rates is immaterial. |
(2) | | Subprime consumer finance includes subprime real estate loan securitizations, which are serviced by third parties. |
(3) | | Residual interests include interest-only strips, one or more subordinated tranches, accrued interest receivable, and in some cases, a cash reserve account. |
(4) | | Before any optional clean-up calls are executed, economic analysis will be performed. |
(5) | | Annual rates of expected credit losses are presented for credit card, home equity lines and commercial securitizations. Cumulative lifetime rates of expected credit losses (incurred plus projected) are presented for subprime consumer finance securitizations and auto securitizations. |
The sensitivities in the preceding table are hypothetical and should be used with caution. As the amounts indicate, changes in fair value based on variations in assumptions generally cannot be extrapolated because the relationship of the change in assumption to the change in fair value may not be linear. Also, the effect of a variation in a particular assumption on the fair value of the retained interest is calculated without changing any other assumption. In reality, changes in one factor may result in changes in another, which might magnify or counteract the sensitivities. Additionally, the Corporation has the ability to hedge interest rate risk associated with retained residual positions. The above sensitivities do not reflect any hedge strategies that may be undertaken to mitigate such risk.
Static pool net credit losses are considered in determining the valuepresented for credit card securitizations. Cumulative lifetime rates of retained interests. Static pool netexpected credit losses include actual losses incurred(incurred plus projected credit losses divided by the original balance of each securitization pool. For auto loan securitizations, weighted average static pool net credit lossesprojected) are presented for securitizations entered into in 2005 were 1.77 percent for the year ended December 31, 2005. For securitizations entered into in 2004, the weighted average static pool net credit losses were 1.79consumer finance securitizations.
|
The sensitivities in the preceding table are hypothetical and should be used with caution. As the amounts indicate, changes in fair value based on variations in assumptions generally cannot be extrapolated because the relationship of the change in assumption to the change in fair value may not be linear. Also, the effect of a variation in a particular assumption on the fair value of an interest that continues to be held by the Corporation is calculated without changing any other assumption. In reality, changes in one factor may result in changes in another, which might magnify or counteract the sensitivities. Additionally, the Corporation has the ability to hedge interest rate risk associated with retained residual positions. The above sensitivities do not reflect any hedge strategies that may be undertaken to mitigate such risk. Static pool net credit losses are considered in determining the value of the retained interests of the consumer finance securitization. Static pool net credit losses include actual losses incurred plus projected credit losses divided by the original balance of each securitization pool. For consumer finance securitizations entered into in 2006, weighted average static pool net credit losses were 5.00 percent for the year ended December 31, 2006. For consumer finance securitizations entered into in 2001, weighted average static pool net credit losses were 5.29 percent for the year ended December 31, 2006, and 5.50 percent for the year ended December 31, 2005. Principal proceeds from collections reinvested in revolving credit card securitizations were $163.4 billion and $4.5 billion in 2006 and 2005. Contractual credit card servicing fee income totaled $1.9 billion and $97 million in 2006 and 2005. Other cash flows received on retained interests, such as cash flow from interest-only strips, were $6.7 billion and $183 million in 2006 and 2005, for credit card securitizations. Proceeds from collections reinvested in revolving commercial loan securitizations were $4.6 billion and $8.7 billion in 2006 and 2005. Servicing fees and other cash flows received on retained interests, such as cash flows from interest-only strips, were $2 million and $15 million in 2006, and $3 million and $34 million in 2005 for commercial loan securitizations. The Corporation also reviews its loans and leases portfolio on a managed basis. Managed loans and leases are defined as on-balance sheet Loans and Leases as well as those loans in revolving securitizations and other securitizations where servicing is retained that are undertaken for corporate management purposes, which include credit card, commercial loans, automobile and certain mortgage securitizations. Managed loans and leases exclude originate-to-distribute loans and other loans in securitizations where the Corporation has not retained servicing. New advances on accounts for which previous loan balances were sold to the securitization trusts will be recorded on the Corporation’s Consolidated Balance Sheet after the revolving period of the securitization, which has the effect of increasing Loans and Leases on the Corporation’s Consolidated Balance Sheet and increasing Net Interest Income and charge-offs, with a related reduction in Noninterest Income. Portfolio balances, delinquency and historical loss amounts of the managed loans and leases portfolio for 2006 and 2005 were as follows: | | | | | | | | | | | | | | | | | | | | | | | | | | | December 31, 2006 | | | December 31, 2005(1) | | (Dollars in millions) | | Total Loans
and Leases | | | Accruing
Loans and
Leases Past
Due 90 Days
or More | | | Nonperforming
Loans and Leases | | | Total Loans
and Leases | | | Accruing
Loans and
Leases Past
Due 90 Days
or More | | | Nonperforming
Loans and Leases | Residential mortgage(2) | | $ | 245,840 | | | $ | 118 | | | $ | 660 | | | $ | 188,380 | | | $ | — | | | $ | 570 | Credit card—domestic | | | 142,599 | | | | 3,828 | | | | n/a | | | | 60,785 | | | | 1,217 | | | | n/a | Credit card—foreign | | | 27,890 | | | | 608 | | | | n/a | | | | — | | | | — | | | | n/a | Home equity lines | | | 75,197 | | | | — | | | | 251 | | | | 62,546 | | | | 3 | | | | 117 | Direct/Indirect consumer | | | 75,112 | | | | 493 | | | | 44 | | | | 49,544 | | | | 75 | | | | 37 | Other consumer | | | 9,218 | | | | 38 | | | | 77 | | | | 6,725 | | | | 15 | | | | 61 | Total consumer | | | 575,856 | | | | 5,085 | | | | 1,032 | | | | 367,980 | | | | 1,310 | | | | 785 | Commercial—domestic | | | 163,274 | | | | 265 | | | | 598 | | | | 142,447 | | | | 117 | | | | 581 | Commercial real estate | | | 36,258 | | | | 78 | | | | 118 | | | | 35,766 | | | | 4 | | | | 49 | Commercial lease financing | | | 21,864 | | | | 26 | | | | 42 | | | | 20,705 | | | | 15 | | | | 62 | Commercial—foreign | | | 20,681 | | | | 9 | | | | 13 | | | | 21,330 | | | | 32 | | | | 34 | Total commercial | | | 242,077 | | | | 378 | | | | 771 | | | | 220,248 | | | | 168 | | | | 726 | Total managed loans and leases | | | 817,933 | | | | 5,463 | | | | 1,803 | | | | 588,228 | | | | 1,478 | | | | 1,511 | Managed loans in securitizations | | | (111,443 | ) | | | (2,407 | ) | | | (16 | ) | | | (14,437 | ) | | | (23 | ) | | | — | Total held loans and leases | | $ | 706,490 | | | $ | 3,056 | | | $ | 1,787 | | | $ | 573,791 | | | $ | 1,455 | | | $ | 1,511 |
| | | | | | | | | | | | | | | | | | | | | | | | | | | | Year Ended December 31, 2006 | | | | | Year Ended December 31, 2005 (1) | | | (Dollars in millions) | | Average Loans and
Leases Outstanding | | | Net
Losses | | | Net Loss
Ratio (3) | | | | | Average Loans and
Leases Outstanding | | | Net
Losses | | | Net Loss
Ratio (3) | | Residential mortgage | | $ | 213,097 | | | $ | 39 | | | 0.02 | % | | | | $ | 179,474 | | | $ | 27 | | | 0.02 | % | Credit card—domestic | | | 138,592 | | | | 5,395 | | | 3.89 | | | | | | 59,048 | | | | 4,086 | | | 6.92 | | Credit card—foreign | | | 24,817 | | | | 980 | | | 3.95 | | | | | | — | | | | — | | | — | | Home equity lines | | | 69,071 | | | | 51 | | | 0.07 | | | | | | 56,821 | | | | 31 | | | 0.05 | | Direct/Indirect consumer | | | 68,227 | | | | 839 | | | 1.23 | | | | | | 46,719 | | | | 248 | | | 0.53 | | Other consumer | | | 10,713 | | | | 303 | | | 2.83 | | | | | | 6,908 | | | | 275 | | | 3.99 | | Total consumer | | | 524,517 | | | | 7,607 | | | 1.45 | | | | | | 348,970 | | | | 4,667 | | | 1.34 | | Commercial—domestic | | | 153,796 | | | | 367 | | | 0.24 | | | | | | 130,882 | | | | 170 | | | 0.13 | | Commercial real estate | | | 36,939 | | | | 3 | | | 0.01 | | | | | | 34,304 | | | | — | | | — | | Commercial lease financing | | | 20,862 | | | | (28 | ) | | (0.14 | ) | | | | | 20,441 | | | | 231 | | | 1.13 | | Commercial—foreign | | | 23,521 | | | | (8 | ) | | (0.04 | ) | | | | | 18,491 | | | | (72 | ) | | (0.39 | ) | Total commercial | | | 235,118 | | | | 334 | | | 0.14 | | | | | | 204,118 | | | | 329 | | | 0.16 | | Total managed loans and leases | | | 759,635 | | | | 7,941 | | | 1.05 | | | | | | 553,088 | | | | 4,996 | | | 0.90 | | Managed loans in securitizations | | | (107,218 | ) | | | (3,402 | ) | | 3.17 | | | | | | (15,870 | ) | | | (434 | ) | | 2.73 | | Total held loans and leases | | $ | 652,417 | | | $ | 4,539 | | | 0.70 | % | | | | $ | 537,218 | | | $ | 4,562 | | | 0.85 | % |
(1) | The amounts at and for the year ended December 31, 2005 have been adjusted to include certain mortgage and 1.63 percent forauto securitizations as these are now included in the year ended December 31, 2004. For the subprime consumer finance securitizations, weighted average static pool net credit losses for securitizations entered into in 2001 were 5.50 percent for the year ended December 31, 2005,Corporation’s definition of managed loans and 5.93 percent for the year ended December 31, 2004. For securitizations entered into in 1999, the weighted average static pool net credit losses were 9.16 percent for the year ended December 31, 2005, and 12.22 percent for the year ended December 31, 2004.leases. |
Proceeds from collections reinvested in revolving credit card securitizations were $2.0 billion and $6.8 billion in 2005 and 2004. Credit card servicing fee income totaled $97 million and $134 million in 2005 and 2004. Other cash flows received on retained interests, such as cash flows from interest-only strips, were $206 million and $345 million in 2005 and 2004, for credit card securitizations. Proceeds from collections reinvested in revolving commercial loan securitizations were $8.7 billion and $7.5 billion in 2005 and 2004. Servicing fees and other cash flows received on retained interests, such as cash flows from interest-only strips, were $3 million and $34 million in 2005, and $4 million and $11 million in 2004 for commercial loan securitizations.(2)
| The Corporation reviews itsAccruing loans and leases portfolio on a managed basis. Managedpast due 90 days or more represent residential mortgage loans related to repurchases pursuant to our servicing agreements with Government National Mortgage Association mortgage pools whose repayments are insured by the Federal Housing Administration or guaranteed by the Department of Veterans Affairs. In 2005, these loans were recorded in loans held-for-sale and leases are defined as on-balance sheet Loans and Leases as well as loans in revolving securitizations, which include credit cards, home equity lines and commercial loans. New advances on accounts for which previous loan balances were soldamounted to the securitization trusts will be recorded on the Corporation’s Consolidated Balance Sheet after the revolving period of the securitization, which has the effect of increasing Loans and Leases on the Corporation’s Consolidated Balance Sheet and increasing Net
BANK OF AMERICA CORPORATION AND SUBSIDIARIES$161 million.
|
Notes to Consolidated Financial Statements—(Continued)(3)
| Interest Income and charge-offs, with a corresponding reduction in Noninterest Income. Portfolio balances, delinquency and historicalThe net loss amounts of theratio is calculated by dividing managed loans and leases portfolio for 2005 and 2004 were as follows:
| | | | | | | | | | | | | | | | | | | | | | | | | | | | December 31, 2005
| | | December 31, 2004 (Restated)
| | (Dollars in millions) | | Total
Principal
Amount of
Loans and
Leases
| | | Principal
Amount
of Accruing
Loans and
Leases
Past Due
90 Days or
More(1)
| | | Principal
Amount of
Nonperforming
Loans and
Leases
| | | Total
Principal
Amount of
Loans and
Leases
| | | Principal
Amount
of Accruing
Loans and
Leases
Past Due
90 Days or
More(1)
| | | Principal
Amount of
Nonperforming
Loans and
Leases
| | Residential mortgage | | $ | 182,596 | | | $ | — | | | $ | 570 | | | $ | 178,079 | | | $ | — | | | $ | 554 | | Credit card | | | 60,785 | | | | 1,217 | | | | — | | | | 58,629 | | | | 1,223 | | | | — | | Home equity lines | | | 62,553 | | | | 3 | | | | 117 | | | | 50,756 | | | | 3 | | | | 66 | | Direct/Indirect consumer | | | 45,490 | | | | 75 | | | | 37 | | | | 40,513 | | | | 58 | | | | 33 | | Other consumer | | | 6,725 | | | | 15 | | | | 61 | | | | 7,439 | | | | 23 | | | | 85 | | | | |
|
|
| |
|
|
| |
|
|
| |
|
|
| |
|
|
| |
|
|
| Total consumer | | | 358,149 | | | | 1,310 | | | | 785 | | | | 335,416 | | | | 1,307 | | | | 738 | | | | |
|
|
| |
|
|
| |
|
|
| |
|
|
| |
|
|
| |
|
|
| Commercial—domestic | | | 142,437 | | | | 117 | | | | 581 | | | | 125,432 | | | | 121 | | | | 855 | | Commercial real estate | | | 35,766 | | | | 4 | | | | 49 | | | | 32,319 | | | | 1 | | | | 87 | | Commercial lease financing | | | 20,705 | | | | 15 | | | | 62 | | | | 21,115 | | | | 14 | | | | 266 | | Commercial—foreign | | | 21,330 | | | | 32 | | | | 34 | | | | 18,401 | | | | 2 | | | | 267 | | | | |
|
|
| |
|
|
| |
|
|
| |
|
|
| |
|
|
| |
|
|
| Total commercial | | | 220,238 | | | | 168 | | | | 726 | | | | 197,267 | | | | 138 | | | | 1,475 | | | | |
|
|
| |
|
|
| |
|
|
| |
|
|
| |
|
|
| |
|
|
| Total managed loans and leases | | | 578,387 | | | $ | 1,478 | | | $ | 1,511 | | | | 532,683 | | | $ | 1,445 | | | $ | 2,213 | | | | |
|
|
| |
|
|
| |
|
|
| |
|
|
| |
|
|
| |
|
|
| Loans in revolving securitizations | | | (4,596 | ) | | | | | | | | | | | (10,870 | ) | | | | | | | | | | | |
|
|
| | | | | | | | | |
|
|
| | | | | | | | | Total held loans and leases | | $ | 573,791 | | | | | | | | | | | $ | 521,813 | | | | | | | | | | | | |
|
|
| | | | | | | | | |
|
|
| | | | | | | | | | | | | | | Year Ended December 31, 2005
| | | Year Ended December 31, 2004 (Restated)
| | (Dollars in millions) | | Average
Loans and
Leases
Outstanding
| | | Loans and
Leases Net
Losses
| | | Net Loss
Ratio(2)
| | | Average
Loans and
Leases
Outstanding
| | | Loans and
Leases Net
Losses
| | | Net Loss Ratio(2)
| | Residential mortgage | | $ | 173,773 | | | $ | 27 | | | | 0.02 | % | | $ | 167,270 | | | $ | 36 | | | | 0.02 | % | Credit card | | | 59,048 | | | | 4,086 | | | | 6.92 | | | | 50,296 | | | | 2,829 | | | | 5.62 | | Home equity lines | | | 56,842 | | | | 31 | | | | 0.05 | | | | 39,942 | | | | 15 | | | | 0.04 | | Direct/Indirect consumer | | | 44,981 | | | | 248 | | | | 0.55 | | | | 38,078 | | | | 208 | | | | 0.55 | | Other consumer | | | 6,908 | | | | 275 | | | | 3.98 | | | | 7,717 | | | | 193 | | | | 2.50 | | | | |
|
|
| |
|
|
| | | | | |
|
|
| |
|
|
| | | | | Total consumer | | | 341,552 | | | | 4,667 | | | | 1.37 | | | | 303,303 | | | | 3,281 | | | | 1.08 | | | | |
|
|
| |
|
|
| | | | | |
|
|
| |
|
|
| | | | | Commercial—domestic | | | 130,870 | | | | 157 | | | | 0.12 | | | | 117,422 | | | | 184 | | | | 0.16 | | Commercial real estate | | | 34,304 | | | | — | | | | — | | | | 28,085 | | | | (3 | ) | | | (0.01 | ) | Commercial lease financing | | | 20,441 | | | | 231 | | | | 1.13 | | | | 17,483 | | | | 9 | | | | 0.05 | | Commercial—foreign | | | 18,491 | | | | (72 | ) | | | (0.39 | ) | | | 16,505 | | | | 173 | | | | 1.05 | | | | |
|
|
| |
|
|
| | | | | |
|
|
| |
|
|
| | | | | Total commercial | | | 204,106 | | | | 316 | | | | 0.16 | | | | 179,495 | | | | 363 | | | | 0.20 | | | | |
|
|
| |
|
|
| | | | | |
|
|
| |
|
|
| | | | | Total managed loans and leases | | | 545,658 | | | $ | 4,983 | | | | 0.91 | % | | | 482,798 | | | $ | 3,644 | | | | 0.75 | % | | | |
|
|
| |
|
|
| | | | | |
|
|
| |
|
|
| | | | | Loans in revolving securitizations | | | (8,440 | ) | | | | | | | | | | | (10,181 | ) | | | | | | | | | | | |
|
|
| | | | | | | | | |
|
|
| | | | | | | | | Total held loans and leases | | $ | 537,218 | | | | | | | | | | | $ | 472,617 | | | | | | | | | | | | |
|
|
| | | | | | | | | |
|
|
| | | | | | | | |
(1) | | Excludes consumer real estate loans, which are placed on nonperforming status at 90 days past due. |
(2) | | The net loss ratio is calculated by dividing managed loans and leases net losses by average managed loans and leases outstanding for each loan and lease category. |
| BANK OF AMERICA CORPORATION AND SUBSIDIARIESVariable Interest Entities
|
Notes to Consolidated Financial Statements—(Continued)
Variable Interest Entities
At December 31, 2006 and 2005, the assets and liabilities of the Corporation’s multi-seller asset-backed commercial paper conduits that have been consolidated in accordance with FIN 46R were reflected in AFS Securities, Other Assets, and Commercial Paper and Other Short-term Borrowings. As of December 31, 2006 and 2005, the Corporation held $10.5 billion and $6.6 billion of assets in these entities, and in the unlikely event that all of the assets in the VIEs become worthless, the Corporation’s maximum loss exposure associated with these entities including unfunded lending commitments would be approximately $12.9 billion and $8.3 billion. In addition, the Corporation had net investments in leveraged lease trusts totaling $8.6 billion and $8.2 billion at December 31, 2006 and 2005. These amounts, which were reflected in Loans and Leases, represent the Corporation’s maximum loss exposure to these entities in the unlikely event that the leveraged lease investments become worthless. Debt issued by the leveraged lease trusts is nonrecourse to the Corporation. The Corporation also had contractual relationships with other consolidated VIEs that engage in leasing or lending activities or real estate joint ventures. As of December 31, 2006 and 2005, the amount of assets of these entities was $3.3 billion and $750 million, and in the unlikely event that all of the assets in the VIEs become worthless, the Corporation’s maximum possible loss exposure would be $1.6 billion and $212 million. Additionally, the Corporation had significant variable interests in other VIEs that it did not consolidate because it was not deemed to be the primary beneficiary. In such cases, the Corporation does not absorb the majority of the entities’ expected losses nor does it receive a majority of the entities’ expected residual returns. These entities typically support the financing needs of the Corporation’s customers by facilitating their access to the commercial paper markets. The Corporation functions as administrator and provides either liquidity and letters of credit, or derivatives to the VIE. The Corporation also provides asset management and related services to or invests in other special purpose vehicles that engage in lending, investing, or real estate activities. Total assets of these entities at December 31, 2006 and 2005 were approximately $51.9 billion and $36.1 billion. Revenues associated with administration, liquidity, letters of credit and other services were approximately $136 million and $122 million for the year ended December 31, 2006 and 2005. At December 31, 2006 and 2005, in the unlikely event that all of the assets in the VIEs become worthless, the Corporation’s maximum loss exposure associated with these VIEs would be approximately $46.0 billion and $30.4 billion, which is net of amounts syndicated. Management does not believe losses resulting from the Corporation’s multi-seller asset-backed commercial paper conduits that have been consolidated in accordance with FASB Interpretation No. 46 (Revised December 2003), “Consolidation of Variable Interest Entities, an interpretation of ARB No. 51” were reflected in AFS Securities, Other Assets, and Commercial Paper and Other Short-term Borrowings inGlobal Capital Markets and Investment Banking. As of December 31, 2005 and 2004, the Corporation held $6.6 billion and $7.7 billion of assets in these entities while the Corporation’s maximum loss exposure associated with these entities including unfunded lending commitments was approximately $8.0 billion and $9.4 billion. The Corporation also had contractual relationships with other consolidated VIEs that engage in leasing or lending activities or real estate joint ventures. As of December 31, 2005 and 2004, the amount of assets of these entities was $750 million and $560 million, and the Corporation’s maximum possible loss exposure was $212 million and $132 million. Additionally, the Corporation had significant variable interests in other VIEs that it did not consolidate because it was not deemed to be the primary beneficiary. In such cases, the Corporation does not absorb the majority of the entities’ expected losses nor does it receive a majority of the entities’ expected residual returns. These entities typically support the financing needs of the Corporation’s customers by facilitating their access to the commercial paper markets. The Corporation functions as administrator and provides either liquidity and letters of credit, or derivatives to the VIE. The Corporation also provides asset management and related services to other special purpose vehicles that engage in lending, investing, or real estate activities. Total assets of these entities at December 31, 2005 and 2004 were approximately $32.5 billion and $32.9 billion. Revenues associated with administration, liquidity, letters of credit and other services were approximately $121 million and $154 million for the year ended December 31, 2005 and 2004. At December 31, 2005 and 2004, the Corporation’s maximum loss exposure associated with these VIEs was approximately $26.7 billion and $25.0 billion, which is net of amounts syndicated.
Management does not believe losses resulting from its involvement with the entities discussed above will be material. See Note 1 of the Consolidated Financial Statements for additional discussion of special purpose financing entities.
| Note 10—NOTE 10 – Goodwill and Other IntangiblesIntangible Assets
The following table presents allocated Goodwill at December 31, 2005 and 2004 for each business segment andAll Other. The increases from December 31, 2004 were primarily due to the $65 million of goodwill adjustments related to National Processing, Inc. (NPC) and the acquisitions of Works, Inc., which added approximately $49 million to Goodwill.
| | | | | | | | | | December 31
| | (Dollars in millions) | | 2005
| | 2004
| Global Consumer and Small Business Banking | | $ | 18,491 | | $ | 18,453 | Global Business and Financial Services | | | 16,750 | | | 16,707 | Global Capital Markets and Investment Banking | | | 4,542 | | | 4,500 | Global Wealth and Investment Management | | | 5,333 | | | 5,338 | All Other | | | 238 | | | 264 | | | |
|
| |
|
| Total | | $ | 45,354 | | $ | 45,262 | | | |
|
| |
|
|
The gross carrying value and accumulated amortization related to core deposit intangibles and other intangibles at December 31, 2005 and 2004 are presented below:
| | | | | | | | | | | | | | | | December 31
| | | | 2005
| | 2004
| | (Dollars in millions) | | Gross Carrying
Value
| | Accumulated
Amortization
| | Gross Carrying
Value
| | Accumulated
Amortization
| Core deposit intangibles | | $ | 3,661 | | $ | 1,881 | | $ | 3,668 | | $ | 1,354 | Other intangibles | | | 2,353 | | | 939 | | | 2,256 | | | 683 | | | |
|
| |
|
| |
|
| |
|
| Total | | $ | 6,014 | | $ | 2,820 | | $ | 5,924 | | $ | 2,037 | | | |
|
| |
|
| |
|
| |
|
|
As a result of the FleetBoston Merger, the Corporation recorded $2.2 billion of core deposit intangibles, $660 million of purchased credit card relationship intangibles and $409 million of other customer relationship intangibles. The weighted average amortization period of these intangibles is approximately nine years. As a result of the acquisition of NPC during 2004, the Corporation allocated $479 million to other intangibles with a weighted average amortization period of approximately 10 years.
BANK OF AMERICA CORPORATION AND SUBSIDIARIES
Notes to Consolidated Financial Statements—(Continued)
Amortization expense on core deposit intangibles and other intangibles was $809 million, $664 million and $217
|
The following table presents allocated Goodwill at December 31, 2006 and 2005 for each business segment andAll Other. | | | | | | | | | December 31 | | (Dollars in millions) | | 2006 | | 2005 | | Global Consumer and Small Business Banking | | $38,760 | | $ | 18,491 | | Global Corporate and Investment Banking | | 21,331 | | | 21,292 | | Global Wealth and Investment Management | | 5,333 | | | 5,333 | All Other | | 238 | | | 238 | Total | | $65,662 | | $ | 45,354 |
The gross carrying values and accumulated amortization related to Intangible Assets at December 31, 2006 and 2005 are presented below: | | | | | | | | | | | | | | | | December 31 | | | | 2006 | | 2005 | | (Dollars in millions) | | Gross Carrying
Value | | Accumulated
Amortization | | Gross Carrying
Value | | Accumulated
Amortization | Purchased credit card relationships | | $ | 6,790 | | $ | 1,159 | | $ | 977 | | $ | 450 | Core deposit intangibles | | | 3,850 | | | 2,396 | | | 3,661 | | | 1,881 | Affinity relationships | | | 1,650 | | | 205 | | | — | | | — | Other intangibles | | | 1,525 | | | 633 | | | 1,376 | | | 489 | Total | | $ | 13,815 | | $ | 4,393 | | $ | 6,014 | | $ | 2,820 |
For information on the impact of the MBNA merger, see Note 2 of the Consolidated Financial Statements. Amortization of Intangibles expense was $1.8 billion, $809 million and $664 million in 2006, 2005 and 2004, respectively. The increase for the year ended December 31, 2006 was primarily due to the MBNA merger. The Corporation estimates the aggregate amortization expense will be approximately $1.5 billion, $1.3 billion, $1.2 billion, $1.0 billion and $900 million for 2005, 2004, and 2003, respectively. The increase for the year ended December 31, 2005 was primarily due to the FleetBoston Merger. The Corporation estimates that aggregate amortization expense will be $746 million, $599 million, $486 million, $385 million and $311 million for 2006, 2007, 2008, 2009, and 2010 and 2011, respectively. | Note 11—NOTE 11 – Deposits
The Corporation had domestic certificates of deposit of $100 thousand or more totaling $47.0 billion and $56.2 billion at December 31, 2005 and 2004.
|
The Corporation had domestic certificates of deposit of $100 thousand or more totaling $72.5 billion and $47.0 billion at December 31, 2006 and 2005. The Corporation had other domestic time deposits of $100 thousand or more totaling $1.9 billion and $1.4 billion at December 31, 2006 and 2005. Foreign certificates of deposit and other foreign time deposits of $100 thousand or more totaled $62.1 billion and $38.8 billion at December 31, 2006 and 2005. | Time deposits of $100 thousand or more totaling $1.4 billion and $1.1 billion at December 31, 2005 and 2004. Foreign certificates of deposit and other foreign time deposits of $100 thousand or more totaled $38.8 billion and $28.6 billion at December 31, 2005 and 2004. The following table presents the maturities of domestic and foreign certificates of deposit of $100 thousand or more, and of other domestic time deposits of $100 thousand or more at December 31, 2005.
|
| | | | | | | | | | | | | | | | | (Dollars in millions) | | Three months
or less | | Over three months
to six months | | Over six months
to twelve months | | Thereafter | | Total | Domestic certificates of deposit | | $ | 33,540 | | $ | 14,205 | | $ | 20,794 | | $ | 4,006 | | $ | 72,545 | Domestic other time deposits | | | 300 | | | 364 | | | 399 | | | 885 | | | 1,948 | Foreign certificates of deposit and other time deposits | | | 55,649 | | | 4,569 | | | 906 | | | 971 | | | 62,095 |
At December 31, 2006, the scheduled maturities for total time deposits were as follows: | | | | | | | | | | | (Dollars in millions) | | Domestic | | Foreign | | Total | Due in 2007 | | $ | 154,509 | | $ | 88,396 | | $ | 242,905 | Due in 2008 | | | 7,283 | | | 218 | | | 7,501 | Due in 2009 | | | 4,590 | | | — | | | 4,590 | Due in 2010 | | | 2,179 | | | 1 | | | 2,180 | Due in 2011 | | | 807 | | | 2 | | | 809 | Thereafter | | | 959 | | | 1,187 | | | 2,146 | Total | | $ | 170,327 | | $ | 89,804 | | $ | 260,131 |
| | | | | | | | | | | | | | | | | (Dollars in millions) | | Three
months
or less
| | Over
three months
to six months
| | Over
six months to
twelve months
| | Thereafter
| | Total
| Domestic certificates of deposit of $100 thousand or more | | $ | 19,922 | | $ | 12,271 | | $ | 8,762 | | $ | 6,023 | | $ | 46,978 | Domestic other time deposits of $100 thousand or more | | | 99 | | | 113 | | | 205 | | | 991 | | | 1,408 | Foreign certificates of deposit and other time deposits of $100 thousand or more | | | 35,595 | | | 1,994 | | | 208 | | | 989 | | | 38,786 |
At December 31, 2005, the scheduled maturities for total time deposits were as follows:
| | | | | | | | | | | (Dollars in millions) | | Domestic
| | Foreign
| | Total
| Due in 2006 | | $ | 101,461 | | $ | 60,733 | | $ | 162,194 | Due in 2007 | | | 12,103 | | | 100 | | | 12,203 | Due in 2008 | | | 3,521 | | | 245 | | | 3,766 | Due in 2009 | | | 2,650 | | | 26 | | | 2,676 | Due in 2010 | | | 1,856 | | | 1 | | | 1,857 | Thereafter | | | 1,123 | | | 1,182 | | | 2,305 | | | |
|
| |
|
| |
|
| Total | | $ | 122,714 | | $ | 62,287 | | $ | 185,001 | | | |
|
| |
|
| |
|
|
| Note 12—NOTE 12 – Short-term Borrowings and Long-term Debt
Short-term Borrowings
Bank of America Corporation and certain other subsidiaries issue commercial paper in order to meet short-term funding needs. Commercial paper outstanding at December 31, 2005 was $25.0 billion compared to $25.4 billion at December 31, 2004.
Bank of America, N.A. maintains a domestic program to offer up to a maximum of $60.0 billion, at any one time, of bank notes with fixed or floating rates and maturities of at least seven days from the date of issue. Short-term bank notes outstanding under this program totaled $22.5 billion at December 31, 2005 compared to $9.6 billion at December 31, 2004. These short-term bank notes, along with Treasury tax and loan notes, term federal funds purchased and commercial paper, are reflected in Commercial Paper and Other Short-term Borrowings on the Consolidated Balance Sheet.
BANK OF AMERICA CORPORATION AND SUBSIDIARIES
Notes to Consolidated Financial Statements—(Continued)
Long-term Debt
The following table presents Long-term Debt at December 31, 2005 and 2004:
| | | | | | | | | | December 31
| | (Dollars in millions) | | 2005
| | 2004
(Restated)
| Notes issued by Bank of America Corporation(1) | | | | | | | Senior notes: | | | | | | | Fixed, ranging from 0.73% to 9.25%, due 2006 to 2043 | | $ | 36,357 | | | 34,218 | Floating, ranging from 0.20% to 6.41%, due 2006 to 2041 | | | 19,050 | | | 15,452 | Subordinated notes: | | | | | | | Fixed, ranging from 3.95% to 10.20%, due 2006 to 2037 | | | 20,596 | | | 22,688 | Floating, 4.29%, due 2019 | | | 10 | | | 10 | Junior subordinated notes (related to trust preferred securities): | | | | | | | Fixed, ranging from 5.25% to 11.45%, due 2026 to 2035 | | | 10,337 | | | 7,582 | Floating, ranging from 4.87% to 5.54%, due 2027 to 2033 | | | 1,922 | | | 1,957 | | | |
|
| |
|
| Total notes issued by Bank of America Corporation | | | 88,272 | | | 81,907 | | | |
|
| |
|
| Notes issued by Bank of America, N.A. and other subsidiaries(1) | | | | | | | Senior notes: | | | | | | | Fixed, ranging from 0.93% to 17.20%, due 2006 to 2033 | | | 1,096 | | | 927 | Floating, ranging from 1.00% to 5.49%, due 2006 to 2051 | | | 4,985 | | | 5,569 | Subordinated notes: | | | | | | | Fixed, ranging from 5.75% to 7.38%, due 2006 to 2009 | | | 1,871 | | | 2,186 | Floating, 4.54%, due 2019 | | | 8 | | | 8 | | | |
|
| |
|
| Total notes issued by Bank of America, N.A. and other subsidiaries | | | 7,960 | | | 8,690 | | | |
|
| |
|
| Notes issued by NB Holdings Corporation(1) | | | | | | | Junior subordinated notes (related to trust preferred securities): | | | | | | | Fixed, ranging from 7.95% to 8.06%, due 2026 | | | 515 | | | 515 | Floating, 5.16%, due 2027 | | | 258 | | | 258 | | | |
|
| |
|
| Total notes issued by NB Holdings Corporation | | | 773 | | | 773 | | | |
|
| |
|
| Other debt | | | | | | | Advances from the Federal Home Loan Bank of Atlanta | | | | | | | Fixed, ranging from 4.16% to 5.87%, due 2006 to 2007 | | | 2,750 | | | 2,750 | Advances from the Federal Home Loan Bank of New York | | | | | | | Fixed, ranging from 4.00% to 8.29%, due 2006 to 2016 | | | 296 | | | 638 | Advances from the Federal Home Loan Bank of Seattle | | | | | | | Fixed, ranging from 5.45% to 7.42%, due 2006 to 2031 | | | 578 | | | 2,081 | Advances from the Federal Home Loan Bank of Boston | | | | | | | Fixed, ranging from 1.00% to 7.72%, due 2006 to 2025 | | | 178 | | | 230 | Other | | | 41 | | | 47 | | | |
|
| |
|
| Total other debt | | | 3,843 | | | 5,746 | | | |
|
| |
|
| Total long-term debt | | $ | 100,848 | | $ | 97,116 | | | |
|
| |
|
|
(1) | | Rates and maturity dates reflect outstanding debt at December 31, 2005. |
The majority of the floating rates are based on three- and six-month London InterBank Offered Rates (LIBOR). Bank of America Corporation and Bank of America, N.A. maintain various domestic and international debt programs to offer both senior and subordinated notes. The notes may be denominated in U.S. dollars or foreign currencies. At December 31, 2005 and 2004, the amount of foreign currency denominated debt translated into U.S. dollars included in total long-term debt was $23.1 billion and $16.2 billion. Foreign currency contracts are used to convert certain foreign currency denominated debt into U.S. dollars.
| BANK OF AMERICA CORPORATION AND SUBSIDIARIESShort-term Borrowings
|
Bank of America Corporation and certain other subsidiaries issue commercial paper in order to meet short-term funding needs. Commercial paper outstanding at December 31, 2006 was $41.2 billion compared to $25.0 billion at December 31, 2005. Bank of America, N.A. maintains a domestic program to offer up to a maximum of $50.0 billion, at any one time, of bank notes with fixed or floating rates and maturities of at least seven days from the date of issue. Short-term bank notes outstanding under this program totaled $24.5 billion at December 31, 2006, compared to $22.5 billion at December 31, 2005. These short-term bank notes, along with Treasury tax and loan notes, term federal funds purchased and commercial paper, are reflected in Commercial Paper and Other Short-term Borrowings on the Consolidated Balance Sheet. | Notes to Consolidated Financial Statements—(Continued)Long-term Debt
|
The following table presents the balance of Long-term Debt at December 31, 2006 and 2005 and the related rates and maturity dates at December 31, 2006: | | | | | | | | | | December 31 | | (Dollars in millions) | | 2006 | | 2005 | | Notes issued by Bank of America Corporation | | | | | | | | Senior notes: | | | | | | | Fixed, with a weighted average rate of 4.51%, ranging from 0.84% to 7.50%, due 2007 to 2043 | | $ | 38,587 | | $ | 36,357 | Floating, with a weighted average rate of 4.93%, ranging from 0.72% to 6.78%, due 2007 to 2041 | | | 26,695 | | | 19,050 | | Subordinated notes: | | | | | | | Fixed, with a weighted average rate of 6.08%, ranging from 2.94% to 10.20%, due 2007 to 2037 | | | 23,896 | | | 20,596 | Floating, with a weighted average rate of 5.69%, ranging from 5.11% to 5.70% due 2016 to 2019 | | | 510 | | | 10 | Junior subordinated notes (related to trust preferred securities): | | | | | | | Fixed, with a weighted average rate of 6.77%, ranging from 5.25% to 11.45%, due 2026 to 2055 | | | 13,665 | | | 10,337 | Floating, with a weighted average rate of 6.07%, ranging from 5.92% to 8.72%, due 2027 to 2033 | | | 2,203 | | | 1,922 | Total notes issued by Bank of America Corporation | | | 105,556 | | | 88,272 | | Notes issued by Bank of America, N.A. and other subsidiaries | | | | | | | | Senior notes: | | | | | | | Fixed, with a weighted average rate of 5.03%, ranging from 0.93% to 11.30%, due 2007 to 2033 | | | 6,450 | | | 1,096 | Floating, with a weighted average rate of 5.28%, ranging from 3.69% to 6.78%, due 2007 to 2051 | | | 22,219 | | | 4,985 | | Subordinated notes: | | | | | | | Fixed, with a weighted average rate of 6.36%, ranging from 5.75% to 7.13%, due 2007 to 2036 | | | 4,294 | | | 1,871 | Floating, with a weighted average rate of 5.63%, ranging from 5.36% to 5.64%, due 2016 to 2019 | | | 918 | | | 8 | Total notes issued by Bank of America, N.A. and other subsidiaries | | | 33,881 | | | 7,960 | | Notes issued by NB Holdings Corporation | | | | | | | | Junior subordinated notes (related to trust preferred securities): | | | | | | | Fixed, with a weighted average rate of 8.02%, ranging from 7.95% to 8.06%, due 2026 | | | 515 | | | 515 | Floating, 6.00%, due 2027 | | | 258 | | | 258 | Total notes issued by NB Holdings Corporation | | | 773 | | | 773 | | Other debt | | | | | | | | Advances from the Federal Home Loan Bank of Atlanta | | | | | | | Floating, 5.49%, due 2007 | | | 500 | | | 2,750 | | Advances from the Federal Home Loan Bank of New York | | | | | | | Fixed, with a weighted average rate of 6.07%, ranging from 4.00% to 8.29%, due 2007 to 2016 | | | 285 | | | 296 | | Advances from the Federal Home Loan Bank of Seattle | | | | | | | Fixed, with a weighted average rate of 6.34%, ranging from 5.40% to 7.42%, due 2007 to 2031 | | | 125 | | | 578 | Floating, with a weighted average rate of 5.33%, ranging from 5.30% to 5.35%, due 2007 to 2008 | | | 3,200 | | | — | | Advances from the Federal Home Loan Bank of Boston | | | | | | | Fixed, with a weighted average rate of 5.83%, ranging from 1.00% to 7.72%, due 2007 to 2026 | | | 146 | | | 178 | Floating, with a weighted average rate of 5.43%, ranging from 5.30% to 5.50%, due 2008 to 2009 | | | 1,500 | | | — | | Other | | | 34 | | | 41 | Total other debt | | | 5,790 | | | 3,843 | Total long-term debt | | $ | 146,000 | | $ | 100,848 |
The majority of the floating rates are based on three- and six-month London InterBank Offered Rates (LIBOR). Bank of America Corporation and Bank of America, N.A. maintain various domestic and international debt programs to offer both senior and subordinated notes. The notes may be denominated in U.S. dollars or foreign currencies. At December 31, 2006 and 2005, the amount of foreign currency denominated debt translated into U.S. dollars included in total long-term debt was $37.8 billion and $23.1 billion. Foreign currency contracts are used to convert certain foreign currency denominated debt into U.S. dollars. At December 31, 2006 and 2005, Bank of America Corporation was authorized to issue approximately $58.1 billion and $27.0 billion of additional corporate debt and other securities under its existing shelf registration statements. At December 31, 2006 and 2005, and 2004, Bank of America Corporation was authorized to issue approximately $27.0 billion and $37.1 billion of additional corporate debt and other securities under its existing shelf registration statements. At December 31, 2005 and 2004, Bank of America, N.A. was authorized to issue approximately $30.8 billion and $9.5 billion and $27.2 billion of bank notes and Euro medium-term notes. The weighted average effective interest rates for total long-term debt, total fixed-rate debt and total floating-rate debt (based on the rates in effect at December 31, 2006) were 5.32 percent, 5.41 percent and 5.18 percent, respectively, at December 31, 2006 and (based on the rates in effect at December 31, 2005) were 5.22 percent, 5.53 percent and 4.31 percent, respectively, at December 31, 2005. These obligations were denominated primarily in U.S. dollars. Aggregate annual maturities of long-term debt obligations (based on final maturity dates) at December 31, 2006 are as follows: | | | | | | | | | | | | | | | | | | | | | | | (Dollars in millions) | | 2007 | | 2008 | | 2009 | | 2010 | | 2011 | | Thereafter | | Total | | Bank of America Corporation | | $ | 4,377 | | $ | 11,031 | | $ | 15,260 | | $ | 11,585 | | $ | 7,943 | | $ | 55,360 | | $ | 105,556 | | Bank of America, N.A. and other subsidiaries | | | 11,158 | | | 13,279 | | | 1,705 | | | 871 | | | 162 | | | 6,706 | | | 33,881 | | NB Holdings Corporation | | | — | | | — | | | — | | | — | | | — | | | 773 | | | 773 | | Other | | | 1,659 | | | 2,668 | | | 1,019 | | | 234 | | | 4 | | | 206 | | | 5,790 | Total | | $ | 17,194 | | $ | 26,978 | | $ | 17,984 | | $ | 12,690 | | $ | 8,109 | | $ | 63,045 | | $ | 146,000 |
Trust Preferred Securities Trust preferred securities (Trust Securities) are issued by the trust companies (the Trusts), which are not consolidated. These Trust Securities are mandatorily redeemable preferred security obligations of the Trusts. The sole assets of the Trusts are Junior Subordinated Deferrable Interest Notes of the Corporation (the Notes). The Trusts are 100 percent owned finance subsidiaries of the Corporation. Obligations associated with the Notes are included in the Long-term Debt table on the previous page. See Note 15 of the Consolidated Financial Statements for a discussion regarding the treatment for regulatory capital purposes of the Trust Securities. At December 31, 2006, the Corporation had 38 Trusts which have issued Trust Securities to the public. Certain of the Trust Securities were issued at a discount and may be redeemed prior to maturity at the option of the Corporation. The Trusts have invested the proceeds of such Trust Securities in the Notes. Each issue of the Notes has an interest rate equal to the corresponding Trust Securities distribution rate. The Corporation has the right to defer payment of interest on the Notes at any time or from time to time for a period not exceeding five years provided that no extension period may extend beyond the stated maturity of the relevant Notes. During any such extension period, distributions on the Trust Securities will also be deferred, and the Corporation’s ability to pay dividends on its common and preferred stock will be restricted. The Trust Securities are subject to mandatory redemption upon repayment of the related Notes at their stated maturity dates or their earlier redemption at a redemption price equal to their liquidation amount plus accrued distributions to the date fixed for redemption and the premium, if any, paid by the Corporation upon concurrent repayment of the related Notes. Periodic cash payments and payments upon liquidation or redemption with respect to Trust Securities are guaranteed by the Corporation to the extent of funds held by the Trusts (the Preferred Securities Guarantee). The Preferred Securities Guarantee, when taken together with the Corporation’s other obligations, including its obligations under the Notes, will constitute a full and unconditional guarantee, on a subordinated basis, by the Corporation of payments due on the Trust Securities. The following table is a summary of the outstanding Trust Securities and the Notes at December 31, 2006 as originated by Bank of America Corporation and the predecessor banks. | | | | | | | | | | | | | | | | | | | | (Dollars in millions) Issuer | | Issuance Date | | Aggregate
Principal
Amount
of Trust
Securities | | Aggregate
Principal
Amount
of the
Notes | | Stated
Maturity of
the Notes | | Per Annum
Interest Rate of the
Notes | | | | | Interest Payment
Dates | | Redemption
Period | | Bank of America | | | | | | | | | | | | | | | | | | | | | Capital Trust I | | December 2001 | | $ | 575 | | $ | 593 | | December 2031 | | 7.00 | % | | | | 3/15,6/15,9/15,12/15 | | On or after 12/15/06 | | Capital Trust II | | January 2002 | | | 900 | | | 928 | | February 2032 | | 7.00 | | | | | 2/1, 5/1,8/1,11/1 | | On or after 2/01/07 | | Capital Trust III | | August 2002 | | | 500 | | | 516 | | August 2032 | | 7.00 | | | | | 2/15, 5/15,8/15,11/15 | | On or after 8/15/07 | | Capital Trust IV | | April 2003 | | | 375 | | | 387 | | May 2033 | | 5.88 | | | | | 2/1, 5/1,8/1,11/1 | | On or after 5/01/08 | | Capital Trust V | | November 2004 | | | 518 | | | 534 | | November 2034 | | 6.00 | | | | | 2/3, 5/3,8/3,11/3 | | On or after 11/03/09 | | Capital Trust VI | | March 2005 | | | 1,000 | | | 1,031 | | March 2035 | | 5.63 | | | | | 3/8,9/8 | | Any time | | Capital Trust VII | | August 2005 | | | 1,665 | | | 1,717 | | August 2035 | | 5.25 | | | | | 2/10,8/10 | | Any time | | Capital Trust VIII | | August 2005 | | | 530 | | | 546 | | August 2035 | | 6.00 | | | | | 2/25,5/25,8/25,11/25 | | On or after 8/25/10 | | Capital Trust X | | March 2006 | | | 900 | | | 928 | | March 2055 | | 6.25 | | | | | 3/29,6/29,9/29,12/29 | | On or after 3/29/11 | | Capital Trust XI | | May 2006 | | | 1,000 | | | 1,031 | | May 2036 | | 6.63 | | | | | 5/23,11/23 | | Any time | | Capital Trust XII | | August 2006 | | | 863 | | | 890 | | August 2055 | | 6.88 | | | | | 2/2,5/2,8/2,11/2 | | On or after 8/02/11 | | NationsBank | | | | | | | | | | | | | | | | | | | | | Capital Trust II | | December 1996 | | | 365 | | | 376 | | December 2026 | | 7.83 | | | | | 6/15,12/15 | | On or after 12/15/06 | | Capital Trust III | | February 1997 | | | 500 | | | 515 | | January 2027 | | 3-mo. LIBOR +55 bps | | | | | 1/15,4/15,7/15,10/15 | | On or after 1/15/07 | | Capital Trust IV | | April 1997 | | | 500 | | | 515 | | April 2027 | | 8.25 | | | | | 4/15,10/15 | | On or after 4/15/07 | | BankAmerica | | | | | | | | | | | | | | | | | | | | | Institutional Capital A | | November 1996 | | | 450 | | | 464 | | December 2026 | | 8.07 | | | | | 6/30,12/31 | | On or after 12/31/06 | | Institutional Capital B | | November 1996 | | | 300 | | | 309 | | December 2026 | | 7.70 | | | | | 6/30,12/31 | | On or after 12/31/06 | | Capital II | | December 1996 | | | 450 | | | 464 | | December 2026 | | 8.00 | | | | | 6/15,12/15 | | On or after 12/15/06 | | Capital III | | January 1997 | | | 400 | | | 412 | | January 2027 | | 3-mo. LIBOR +57 bps | | | | | 1/15,4/15, 7/15,10/15 | | On or after 1/15/02 | | Barnett | | | | | | | | | | | | | | | | | | | | | Capital I | | November 1996 | | | 300 | | | 309 | | December 2026 | | 8.06 | | | | | 6/1,12/1 | | On or after 12/01/06 | | Capital II | | December 1996 | | | 200 | | | 206 | | December 2026 | | 7.95 | | | | | 6/1,12/1 | | On or after 12/01/06 | | Capital III | | January 1997 | | | 250 | | | 258 | | February 2027 | | 3-mo. LIBOR +62.5 bps | | | | | 2/1,5/1,8/1,11/1 | | On or after 2/01/07 | | Fleet | | | | | | | | | | | | | | | | | | | | | Capital Trust II | | December 1996 | | | 250 | | | 258 | | December 2026 | | 7.92 | | | | | 6/15,12/15 | | On or after 12/15/06 | | Capital Trust V | | December 1998 | | | 250 | | | 258 | | December 2028 | | 3-mo. LIBOR +100 bps | | | | | 3/18, 6/18,9/18, 12/18 | | On or after 12/18/03 | | Capital Trust VIII | | March 2002 | | | 534 | | | 550 | | March 2032 | | 7.20 | | | | | 3/15, 6/15,9/15,12/15 | | On or after 3/08/07 | | Capital Trust IX | | July 2003 | | | 175 | | | 180 | | August 2033 | | 6.00 | | | | | 2/1, 5/1,8/1,11/1 | | On or after 7/31/08 | | BankBoston | | | | | | | | | | | | | | | | | | | | | Capital Trust I | | November 1996 | | | 250 | | | 258 | | December 2026 | | 8.25 | | | | | 6/15,12/15 | | On or after 12/15/06 | | Capital Trust II | | December 1996 | | | 250 | | | 258 | | December 2026 | | 7.75 | | | | | 6/15,12/15 | | On or after 12/15/06 | | Capital Trust III | | June 1997 | | | 250 | | | 258 | | June 2027 | | 3-mo. LIBOR +75 bps | | | | | 3/15, 6/15,9/15,12/15 | | On or after 6/15/07 | | Capital Trust IV | | June 1998 | | | 250 | | | 258 | | June 2028 | | 3-mo. LIBOR +60 bps | | | | | 3/8, 6/8,9/8,12/8 | | On or after 6/08/03 | | Summit | | | | | | | | | | | | | | | | | | | | | Capital Trust I | | March 1997 | | | 150 | | | 155 | | March 2027 | | 8.40 | | | | | 3/15,9/15 | | On or after 3/15/07 | | Progress | | | | | | | | | | | | | | | | | | | | | Capital Trust I | | June 1997 | | | 9 | | | 9 | | June 2027 | | 10.50 | | | | | 6/1,12/1 | | On or after 6/01/07 | | Capital Trust II | | July 2000 | | | 6 | | | 6 | | July 2030 | | 11.45 | | | | | 1/19,7/19 | | On or after 7/19/10 | | Capital Trust III | | November 2002 | | | 10 | | | 10 | | November 2032 | | 3-mo. LIBOR +335 bps | | | | | 2/15,5/15,8/15,11/15 | | On or after 11/15/07 | | Capital Trust IV | | December 2002 | | | 5 | | | 5 | | January 2033 | | 3-mo. LIBOR +335 bps | | | | | 1/7, 4/7,7/7,10/7 | | On or after 1/07/08 | | MBNA | | | | | | | | | | | | | | | | | | | | | Capital Trust A | | December 1996 | | | 250 | | | 258 | | December 2026 | | 8.28 | | | | | 6/1,12/1 | | On or after 12/01/06 | | Capital Trust B | | January 1997 | | | 280 | | | 289 | | February 2027 | | 3-mo. LIBOR +80 bps | | | | | 2/1,5/1,8/1,11/1 | | On or after 2/01/07 | | Capital Trust D | | June 2002 | | | 300 | | | 309 | | October 2032 | | 8.13 | | | | | 1/1,4/1,7/1,10/1 | | On or after 10/01/07 | | Capital Trust E | | November 2002 | | | 200 | | | 206 | | February 2033 | | 8.10 | | | | | 2/15,5/15,8/15,11/15 | | On or after 2/15/08 | Total | | | | $ | 15,960 | | $ | 16,454 | | | | | | | | | | | |
The weighted average effective interest rates for total long-term debt, total fixed-rate debt and total floating-rate debt (based on the rates in effect at December 31, 2005) were 5.22 percent, 5.53 percent and 4.31 percent, respectively, at December 31, 2005 and (based on the rates in effect at December 31, 2004) were 4.97 percent, 5.64 percent and 2.69 percent, respectively, at December 31, 2004. These obligations were denominated primarily in U.S. dollars.
Aggregate annual maturities of long-term debt obligations (based on final maturity dates) at December 31, 2005 are as follows:
| | | | | | | | | | | | | | | | | | | | | | | (Dollars in millions) | | 2006
| | 2007
| | 2008
| | 2009
| | 2010
| | Thereafter
| | Total
| Bank of America Corporation | | $ | 6,834 | | $ | 5,250 | | $ | 13,998 | | $ | 8,222 | | $ | 11,442 | | $ | 42,526 | | $ | 88,272 | Bank of America, N.A. and other subsidiaries | | | 1,615 | | | 1,839 | | | 2,345 | | | 718 | | | 50 | | | 1,393 | | | 7,960 | NB Holdings Corporation | | | — | | | — | | | — | | | — | | | — | | | 773 | | | 773 | Other | | | 2,739 | | | 562 | | | 71 | | | 20 | | | 237 | | | 214 | | | 3,843 | | | |
|
| |
|
| |
|
| |
|
| |
|
| |
|
| |
|
| Total | | $ | 11,188 | | $ | 7,651 | | $ | 16,414 | | $ | 8,960 | | $ | 11,729 | | $ | 44,906 | | $ | 100,848 | | | |
|
| |
|
| |
|
| |
|
| |
|
| |
|
| |
|
|
| Trust Preferred SecuritiesTrust preferred securities (Trust Securities) are issued by the trust companies (the Trusts) that were deconsolidated by the Corporation as a result of the adoption of FIN 46R. These Trust Securities are mandatorily redeemable preferred security obligations of the Trusts. The sole assets of the Trusts are Junior Subordinated Deferrable Interest Notes of the Corporation (the Notes). The Trusts are 100 percent owned finance subsidiaries of the Corporation. Obligations associated with these securities are included in junior subordinated notes related to Trust Securities in the Long-term Debt table on page 122. See Note 15 of the Consolidated Financial Statements for a discussion regarding the treatment for regulatory capital purposes of the Trust Securities.
At December 31, 2005, the Corporation had 32 Trusts which have issued Trust Securities to the public. Certain of the Trust Securities were issued at a discount and may be redeemed prior to maturity at the option of the Corporation. The Trusts have invested the proceeds of such Trust Securities in the Notes. Each issue of the Notes has an interest rate equal to the corresponding Trust Securities distribution rate. The Corporation has the right to defer payment of interest on the Notes at any time or from time to time for a period not exceeding five years provided that no extension period may extend beyond the stated maturity of the relevant Notes. During any such extension period, distributions on the Trust Securities will also be deferred, and the Corporation’s ability to pay dividends on its common and preferred stock will be restricted.
The Trust Securities are subject to mandatory redemption upon repayment of the related Notes at their stated maturity dates or their earlier redemption at a redemption price equal to their liquidation amount plus accrued distributions to the date fixed for redemption and the premium, if any, paid by the Corporation upon concurrent repayment of the related Notes.
Periodic cash payments and payments upon liquidation or redemption with respect to Trust Securities are guaranteed by the Corporation to the extent of funds held by the Trusts (the Preferred Securities Guarantee). The Preferred Securities Guarantee, when taken together with the Corporation’s other obligations, including its obligations under the Notes, will constitute a full and unconditional guarantee, on a subordinated basis, by the Corporation of payments due on the Trust Securities.
BANK OF AMERICA CORPORATION AND SUBSIDIARIES
Notes to Consolidated Financial Statements—(Continued)
The following table is a summary of the outstanding Trust Securities and the Notes at December 31, 2005 as originated by Bank of America Corporation and the predecessor banks.
| | | | | | | | | | | | | | | | | | | (Dollars in millions) | | | | | | | | | | | | | | | | Issuer
| | Issuance Date
| | Aggregate
Principal
Amount of
Trust
Securities
| | Aggregate
Principal
Amount
of the Notes
| | Stated
Maturity of the
Notes
| | Per Annum
Interest Rate
of the Notes
| | | Interest
Payment
Dates
| | Redemption
Period
| Bank of America | | | | | | | | | | | | | | | | | | Capital Trust I | | December 2001 | | $ | 575 | | $ | 593 | | December 2031 | | 7.00 | % | | 3/15,6/15,9/15,12/15 | | On or after 12/15/06 | Capital Trust II | | January 2002 | | | 900 | | | 928 | | February 2032 | | 7.00 | | | 2/1, 5/1,8/1,11/1 | | On or after 2/01/07 | Capital Trust III | | August 2002 | | | 500 | | | 516 | | August 2032 | | 7.00 | | | 2/15, 5/15,8/15,11/15 | | On or after 8/15/07 | Capital Trust IV | | April 2003 | | | 375 | | | 387 | | May 2033 | | 5.88 | | | 2/1, 5/1,8/1,11/1 | | On or after 5/01/08 | Capital Trust V | | November 2004 | | | 518 | | | 534 | | November 2034 | | 6.00 | | | 2/3, 5/3,8/3,11/3 | | On or after 11/03/09 | Capital Trust VI | | February 2005 | | | 1,000 | | | 1,031 | | March 2035 | | 5.63 | | | 3/8,9/8 | | Any time | Capital Trust VII | | August 2005 | | | 1,461 | | | 1,507 | | August 2035 | | 5.25 | | | 2/10,8/10 | | Any time | Capital Trust VIII | | August 2005 | | | 530 | | | 546 | | August 2035 | | 6.00 | | | 2/25,5/25,8/25,11/25 | | On or after 8/25/10 | | | | | | | | | NationsBank | | | | | | | | | | | | | | | | | | Capital Trust II | | December 1996 | | | 365 | | | 376 | | December 2026 | | 7.83 | | | 6/15,12/15 | | On or after 12/15/06 | Capital Trust III | | February 1997 | | | 494 | | | 509 | | January 2027 | | 3-mo. LIBOR
+55 bps |
| | 1/15,4/15,7/15,10/15 | | On or after 1/15/07 | Capital Trust IV | | April 1997 | | | 498 | | | 513 | | April 2027 | | 8.25 | | | 4/15,10/15 | | On or after 4/15/07 | | | | | | | | | BankAmerica | | | | | | | | | | | | | | | | | | Institutional Capital A | | November 1996 | | | 450 | | | 464 | | December 2026 | | 8.07 | | | 6/30,12/31 | | On or after 12/31/06 | Institutional Capital B | | November 1996 | | | 300 | | | 309 | | December 2026 | | 7.70 | | | 6/30,12/31 | | On or after 12/31/06 | Capital II | | December 1996 | | | 450 | | | 464 | | December 2026 | | 8.00 | | | 6/15,12/15 | | On or after 12/15/06 | Capital III | | January 1997 | | | 400 | | | 412 | | January 2027 | | 3-mo. LIBOR
+57 bps |
| | 1/15,4/15, 7/15,10/15 | | On or after 1/15/02 | | | | | | | | | Barnett | | | | | | | | | | | | | | | | | | Capital I | | November 1996 | | | 300 | | | 309 | | December 2026 | | 8.06 | | | 6/1,12/1 | | On or after 12/01/06 | Capital II | | December 1996 | | | 200 | | | 206 | | December 2026 | | 7.95 | | | 6/1,12/1 | | On or after 12/01/06 | Capital III | | January 1997 | | | 250 | | | 258 | | February 2027 | | 3-mo. LIBOR
+62.5 bps |
| | 2/1,5/1,8/1,11/1 | | On or after 2/01/07 | | | | | | | | | Fleet | | | | | | | | | | | | | | | | | | Capital Trust II | | December 1996 | | | 250 | | | 258 | | December 2026 | | 7.92 | | | 6/15,12/15 | | On or after 12/15/06 | Capital Trust V | | December 1998 | | | 250 | | | 258 | | December 2028 | | 3-mo. LIBOR
+100 bps |
| | 3/18, 6/18,9/18, 12/18 | | On or after 12/18/03 | Capital Trust VII | | September 2001 | | | 500 | | | 515 | | December 2031 | | 7.20 | | | 3/15, 6/15,9/15, 12/15 | | On or after 9/17/06 | Capital Trust VIII | | March 2002 | | | 534 | | | 551 | | March 2032 | | 7.20 | | | 3/15, 6/15,9/15,12/15 | | On or after 3/08/07 | Capital Trust IX | | July 2003 | | | 175 | | | 180 | | August 2033 | | 6.00 | | | 2/1, 5/1,8/1,11/1 | | On or after 7/31/08 | | | | | | | | | BankBoston | | | | | | | | | | | | | | | | | | Capital Trust I | | November 1996 | | | 250 | | | 258 | | December 2026 | �� | 8.25 | | | 6/15,12/15 | | On or after 12/15/06 | Capital Trust II | | December 1996 | | | 250 | | | 258 | | December 2026 | | 7.75 | | | 6/15,12/15 | | On or after 12/15/06 | Capital Trust III | | June 1997 | | | 250 | | | 258 | | June 2027 | | 3-mo. LIBOR
+75 bps |
| | 3/15, 6/15,9/15,12/15 | | On or after 6/15/07 | Capital Trust IV | | June 1998 | | | 250 | | | 258 | | June 2028 | | 3-mo. LIBOR
+60 bps |
| | 3/8, 6/8,9/8,12/8 | | On or after 6/08/03 | | | | | | | | | Summit | | | | | | | | | | | | | | | | | | Capital Trust I | | March 1997 | | | 150 | | | 155 | | March 2027 | | 8.40 | | | 3/15,9/15 | | On or after 3/15/07 | | | | | | | | | Progress | | | | | | | | | | | | | | | | | | Capital Trust I | | June 1997 | | | 9 | | | 9 | | June 2027 | | 10.50 | | | 6/1,12/1 | | On or after 6/01/07 | Capital Trust II | | July 2000 | | | 6 | | | 6 | | July 2030 | | 11.45 | | | 1/19,7/19 | | On or after 7/19/10 | Capital Trust III | | November 2002 | | | 10 | | | 10 | | November 2032 | | 3-mo. LIBOR
+33.5 bps |
| | 2/15,5/15,8/15,11/15 | | On or after 11/15/07 | Capital Trust IV | | December 2002 | | | 5 | | | 5 | | January 2033 | | 3-mo. LIBOR
+33.5 bps |
| | 1/7, 4/7,7/7,10/7 | | On or after 1/07/08 | | | | | |
|
| |
|
| | | | | | | | | | Total | | | | $ | 12,455 | | $ | 12,841 | | | | | | | | | | | | | | |
|
| |
|
| | | | | | | | | |
BANK OF AMERICA CORPORATION AND SUBSIDIARIES
Notes to Consolidated Financial Statements—(Continued)
Note 13—NOTE 13 – Commitments and Contingencies
|
In the normal course of business, the Corporation enters into a number of off-balance sheet commitments. These commitments expose the Corporation to varying degrees of credit and market risk and are subject to the same credit and market risk limitation reviews as those instruments recorded on the Corporation’s Consolidated Balance Sheet. | | Credit Extension Commitments |
The Corporation enters into commitments to extend credit such as loan commitments, SBLCs and commercial letters of credit to meet the financing needs of its customers. The outstanding unfunded lending commitments shown in the following table have been reduced by amounts participated to other financial institutions of $30.5 billion and $30.4 billion at December 31, 2006 and 2005. The carrying amount for these commitments, which represents the liability recorded related to these instruments, at December 31, 2006 and 2005 was $444 million and $458 million. At December 31, 2006, the carrying amount included deferred revenue of $47 million and a reserve for unfunded lending commitments of $397 million. At December 31, 2005, the carrying amount included deferred revenue of $63 million and a reserve for unfunded lending commitments of $395 million. | | | | | | | | | | December 31 | | (Dollars in millions) | | 2006 | | 2005 | Loan commitments(1) | | $ | 338,205 | | $ | 271,906 | Home equity lines of credit | | | 98,200 | | | 78,626 | Standby letters of credit and financial guarantees | | | 53,006 | | | 48,129 | Commercial letters of credit | | | 4,482 | | | 5,972 | Legally binding commitments | | | 493,893 | | | 404,633 | Credit card lines(2) | | | 853,592 | | | 192,967 | Total | | $ | 1,347,485 | | $ | 597,600 |
The Corporation enters into commitments to extend credit such as loan commitments, SBLCs and commercial letters of credit to meet the financing needs of its customers. The outstanding unfunded lending commitments shown in the following table have been reduced by amounts participated to other financial institutions of $30.4 billion and $23.4 billion(1)
| Included at December 31, 2006 and 2005, were equity commitments of $2.8 billion and 2004. The carrying amount for these commitments, which represents the liability recorded$1.5 billion, related to these instruments, at December 31, 2005 and 2004 was $458 million and $520 million. At December 31, 2005, the carrying amount included deferred revenue of $63 million and a reserve for unfunded lending commitments of $395 million. At December 31, 2004, the carrying amount included deferred revenue of $118 million and a reserve for unfunded lending commitments of $402 million. | | | | | | | | | | December 31
| | (Dollars in millions) | | 2005
| | 2004
| Loan commitments(1) | | $ | 277,757 | | $ | 245,042 | Home equity lines of credit | | | 78,626 | | | 60,128 | Standby letters of credit and financial guarantees | | | 43,095 | | | 42,850 | Commercial letters of credit | | | 5,154 | | | 5,653 | | | |
|
| |
|
| Legally binding commitments | | | 404,632 | | | 353,673 | Credit card lines | | | 192,968 | | | 165,694 | | | |
|
| |
|
| Total | | $ | 597,600 | | $ | 519,367 | | | |
|
| |
|
|
(1) | | At December 31, 2005 and 2004, there were equity commitments of $1.4 billion and $2.0 billion, related to obligations to further fund Principal Investing equity investments. |
Legally binding commitments to extend credit generally have specified rates and maturities. Certain of these commitments have adverse change clauses that help to protect the Corporation against deterioration in the borrowers’ ability to pay.(2)
| The Corporation issues SBLCs and financial guarantees to support the obligations of its customers to beneficiaries. Additionally, in many cases, the Corporation holds collateral in various forms against these SBLCs. As part of its risk management activities,the MBNA merger on January 1, 2006, the Corporation continuously monitors the creditworthinessacquired $588.4 billion of the customer as well as SBLC exposure; however, if the customer fails to perform the specified obligation to the beneficiary, the beneficiary may draw upon the SBLC by presenting documents that are in compliance with the letter of credit terms. In that event, the Corporation either repays the money borrowed or advanced, makes payment on account of the indebtedness of the customer or makes payment on account of the default by the customer in the performance of an obligation to the beneficiary up to the full notional amount of the SBLC. The customer is obligated to reimburse the Corporation for any such payment. If the customer fails to pay, the Corporation would, as contractually permitted, liquidate collateral and/or set off accounts.
Commercial letters of credit, issued primarily to facilitate customer trade finance activities, are usually collateralized by the underlying goods being shipped to the customer and are generally short-term. Credit card lines are unsecured commitments that are not legally binding. Management reviews credit card lines at least annually, and upon evaluation of the customers’ creditworthiness, the Corporation has the right to terminate or change certain terms of theunused credit card lines.
|
Legally binding commitments to extend credit generally have specified rates and maturities. Certain of these commitments have adverse change clauses that help to protect the Corporation against deterioration in the borrowers’ ability to pay. The Corporation issues SBLCs and financial guarantees to support the obligations of its customers to beneficiaries. Additionally, in many cases, the Corporation holds collateral in various forms against these SBLCs. As part of its risk management activities, the Corporation continuously monitors the creditworthiness of the customer as well as SBLC exposure; however, if the customer fails to perform the specified obligation to the beneficiary, the beneficiary may draw upon the SBLC by presenting documents that are in compliance with the letter of credit terms. In that event, the Corporation either repays the money borrowed or advanced, makes payment on account of the indebtedness of the customer or makes payment on account of the default by the customer in the performance of an obligation to the beneficiary up to the full notional amount of the SBLC. The customer is obligated to reimburse the Corporation for any such payment. If the customer fails to pay, the Corporation would, as contractually permitted, liquidate collateral and/or offset accounts. Commercial letters of credit, issued primarily to facilitate customer trade finance activities, are usually collateralized by the underlying goods being shipped to the customer and are generally short-term. Credit card lines are unsecured commitments that are not legally binding. Management reviews credit card lines at least annually, and upon evaluation of the customers’ creditworthiness, the Corporation has the right to terminate or change certain terms of the credit card lines. The Corporation uses various techniques to manage risk associated with these types of instruments that include obtaining collateral and/or adjusting commitment amounts based on the borrower’s financial condition; therefore, the total commitment amount does not necessarily represent the actual risk of loss or future cash requirements. For each of these types of instruments, the Corporation’s maximum exposure to credit loss is represented by the contractual amount of these instruments. The Corporation uses various techniques to manage risk associated with these types of instruments that include obtaining collateral and/or adjusting commitment amounts based on the borrower’s financial condition; therefore, the total commitment amount does not necessarily represent the actual risk of loss or future cash requirements. For each of these types of instruments, the Corporation’s maximum exposure to credit loss is represented by the contractual amount of these instruments.
| | Other Commitments At December 31, 2005 and 2004, charge cards (nonrevolving card lines) to individuals and government entities guaranteed by the U.S. government in the amount of $9.4 billion and $10.9 billion were not included in credit card
BANK OF AMERICA CORPORATION AND SUBSIDIARIES
Notes to Consolidated Financial Statements—(Continued)
line commitments in the previous table. The outstanding balances related to these charge cards were $171 million and $205 million at December 31, 2005 and 2004.
At December 31, 2005, the Corporation had whole mortgage loan purchase commitments of $4.0 billion, all of which will settle in the first quarter of 2006. At December 31, 2004, the Corporation had whole mortgage loan purchase commitments of $3.3 billion, all of which settled in the first quarter of 2005. At December 31, 2005 and 2004, the Corporation had no forward whole mortgage loan sale commitments.
The Corporation has entered into operating leases for certain of its premises and equipment. Commitments under these leases approximate $1.3 billion in 2006, $1.1 billion in 2007, $1.1 billion in 2008, $799 million in 2009, $650 million in 2010 and $3.5 billion for all years thereafter.
In 2005, the Corporation entered into an agreement for the committed purchase of retail automotive loans over a five-year period, ending June 30, 2010. In 2005, the Corporation purchased $5.0 billion of such loans and at December 31, 2005, the remaining commitment amount was $47.0 billion. Under the agreement, the Corporation is committed to purchase up to $7.0 billion of such loans for the period January 1, 2006 through June 30, 2006 and up to $10.0 billion in each of the agreement’s next four fiscal years.
Other Guarantees
The Corporation sells products that offer book value protection primarily to plan sponsors of Employee Retirement Income Security Act of 1974 (ERISA) governed pension plans, such as 401(k) plans and 457 plans. The book value protection is provided on portfolios of intermediate/short-term investment grade fixed income securities and is intended to cover any shortfall in the event that plan participants withdraw funds when market value is below book value. The Corporation retains the option to exit the contract at any time. If the Corporation exercises its option, the purchaser can require the Corporation to purchase zero coupon bonds with the proceeds of the liquidated assets to assure the return of principal. To manage its exposure, the Corporation imposes significant restrictions and constraints on the timing of the withdrawals, the manner in which the portfolio is liquidated and the funds are accessed, and the investment parameters of the underlying portfolio. These constraints, combined with structural protections, are designed to provide adequate buffers and guard against payments even under extreme stress scenarios. These guarantees are booked as derivatives and marked to market in the trading portfolio. At December 31, 2005 and 2004, the notional amount of these guarantees totaled $34.0 billion and $26.3 billion with estimated maturity dates between 2006 and 2035. As of December 31, 2005 and 2004, the Corporation has not made a payment under these products, and management believes that the probability of payments under these guarantees is remote.
The Corporation also sells products that guarantee the return of principal to investors at a preset future date. These guarantees cover a broad range of underlying asset classes and are designed to cover the shortfall between the market value of the underlying portfolio and the principal amount on the preset future date. To manage its exposure, the Corporation requires that these guarantees be backed by structural and investment constraints and certain pre-defined triggers that would require the underlying assets or portfolio to be liquidated and invested in zero-coupon bonds that mature at the preset future date. The Corporation is required to fund any shortfall at the preset future date between the proceeds of the liquidated assets and the purchase price of the zero-coupon bonds. These guarantees are booked as derivatives and marked to market in the trading portfolio. At December 31, 2005 and 2004, the notional amount of these guarantees totaled $6.5 billion and $8.1 billion. These guarantees have various maturities ranging from 2006 to 2016. At December 31, 2005 and 2004, the Corporation had not made a payment under these products, and management believes that the probability of payments under these guarantees is remote.
The Corporation also has written put options on highly rated fixed income securities. Its obligation under these agreements is to buy back the assets at predetermined contractual yields in the event of a severe market disruption in the short-term funding market. These agreements have various maturities ranging from two to seven years, and the pre-determined yields are based on the quality of the assets and the structural elements pertaining to the market disruption. The notional amount of these put options was $803 million and $653 million at December 31, 2005 and 2004. Due to the high quality of the assets and various structural protections, management believes that the probability of incurring a loss under these agreements is remote.
In the ordinary course of business, the Corporation enters into various agreements that contain indemnifications, such as tax indemnifications, whereupon payment may become due if certain external events occur, such as a change in tax law. These agreements typically contain an early termination clause that permits the Corporation to exit the agreement upon these events. The maximum potential future payment under indemnification agreements is difficult to assess for several reasons, including the inability to predict future changes in tax and other laws, the difficulty in determining how such laws would apply to parties in contracts, the absence of exposure limits contained in standard
BANK OF AMERICA CORPORATION AND SUBSIDIARIES
Notes to Consolidated Financial Statements—(Continued)
contract language and the timing of the early termination clause. Historically, any payments made under these guarantees have been de minimis. Management has assessed the probability of making such payments in the future as remote.
The Corporation has entered into additional guarantee agreements, including lease end obligation agreements, partial credit guarantees on certain leases, real estate joint venture guarantees, sold risk participation swaps and sold put options that require gross settlement. The maximum potential future payment under these agreements was approximately $1.8 billion and $2.1 billion at December 31, 2005 and 2004. The estimated maturity dates of these obligations are between 2006 and 2033. The Corporation has made no material payments under these guarantees.
The Corporation provides credit and debit card processing services to various merchants, processing credit and debit card transactions on their behalf. In connection with these services, a liability may arise in the event of a billing dispute between the merchant and a cardholder that is ultimately resolved in the cardholder’s favor and the merchant defaults upon its obligation to reimburse the cardholder. A cardholder, through its issuing bank, generally has until the later of up to four months after the date a transaction is processed or the delivery of the product or service to present a chargeback to the Corporation as the merchant processor. If the Corporation is unable to collect this amount from the merchant, it bears the loss for the amount paid to the cardholder. In 2005 and 2004, the Corporation processed $352.9 billion and $143.1 billion of transactions and recorded losses as a result of these chargebacks of $13 million and $6 million.
At December 31, 2005 and 2004, the Corporation held as collateral approximately $248 million and $203 million of merchant escrow deposits which the Corporation has the right to set off against amounts due from the individual merchants. The Corporation also has the right to offset any payments with cash flows otherwise due to the merchant. Accordingly, the Corporation believes that the maximum potential exposure is not representative of the actual potential loss exposure. The Corporation believes the maximum potential exposure for chargebacks would not exceed the total amount of merchant transactions processed through Visa and MasterCard for the last four months, which represents the claim period for the cardholder, plus any outstanding delayed-delivery transactions. As of December 31, 2005 and 2004, the maximum potential exposure totaled approximately $118.2 billion and $93.4
|
At December 31, 2006 and 2005, charge cards (nonrevolving card lines) to individuals and government entities guaranteed by the U.S. government in the amount of $9.6 billion and $9.4 billion were not included in credit card line commitments in the previous table. The outstanding balances related to these charge cards were $193 million and $171 million at December 31, 2006 and 2005. At December 31, 2006, the Corporation had whole mortgage loan purchase commitments of $8.5 billion, all of which will settle in the first quarter of 2007. At December 31, 2005, the Corporation had whole mortgage loan purchase commitments of $4.0 billion, all of which settled in the first quarter of 2006. The Corporation has entered into operating leases for certain of its premises and equipment. Commitments under these leases approximate $1.4 billion in 2007, $1.3 billion in 2008, $1.1 billion in 2009, $931 million in 2010, $801 million in 2011, and $6.0 billion for all years thereafter. In 2005, the Corporation entered into an agreement for the committed purchase of retail automotive loans over a five-year period ending June 30, 2010. In 2005, the Corporation purchased $5.0 billion of such loans. In 2006, the Corporation purchased $7.5 billion of such loans. Under the agreement, the Corporation is committed to purchase up to $5.0 billion of such loans for the period July 1, 2006 through June 30, 2007 and up to $10.0 billion in each of the agreement’s next three fiscal years. As of December 31, 2006, the remaining commitment amount was $32.5 billion. Within the Corporation’s brokerage business, the Corporation has contracted with a third party to provide clearing services that include underwriting margin loans to the Corporation’s clients. This contract stipulates that the Corporation will indemnify the third party for any margin loan losses that occur in their issuing margin to the Corporation’s clients. The maximum potential future payment under this indemnification was $1.1 billion and $1.2 billion at December 31, 2005 and 2004.
The Corporation sells products that offer book value protection primarily to plan sponsors of Employee Retirement Income Security Act of 1974 (ERISA) governed pension plans, such as 401(k) plans and 457 plans. The book value protection is provided on portfolios of intermediate/short-term investment grade fixed income securities and is intended to cover any shortfall in the event that plan participants withdraw funds when market value is below book value. The Corporation retains the option to exit the contract at any time. If the Corporation exercises its option, the purchaser can require the Corporation to purchase zero coupon bonds with the proceeds of the liquidated assets to assure the return of principal. To manage its exposure, the Corporation imposes significant restrictions and constraints on the timing of the withdrawals, the manner in which the portfolio is liquidated and the funds are accessed, and the investment parameters of the underlying portfolio. These constraints, combined with structural protections, are designed to provide adequate buffers and guard against payments even under extreme stress scenarios. These guarantees are booked as derivatives and marked to market in the trading portfolio. At December 31, 2006 and 2005, the notional amount of these guarantees totaled $33.2 billion and $34.0 billion with estimated maturity dates between 2007 and 2036. As of December 31, 2006 and 2005, the Corporation has not made a payment under these products, and management believes that the probability of payments under these guarantees is remote. The Corporation also sells products that guarantee the return of principal to investors at a preset future date. These guarantees cover a broad range of underlying asset classes and are designed to cover the shortfall between the market value of the underlying portfolio and the principal amount on the preset future date. To manage its exposure, the Corporation requires that these guarantees be backed by structural and investment constraints and certain pre-defined triggers that would require the underlying assets or portfolio to be liquidated and invested in zero-coupon bonds that mature at the preset future date. The Corporation is required to fund any shortfall at the preset future date between the proceeds of the liquidated assets and the purchase price of the zero-coupon bonds. These guarantees are booked as derivatives and marked to market in the trading portfolio. At December 31, 2006 and 2005, the notional amount of these guarantees totaled $4.0 billion and $6.5 billion. These guarantees have various maturities ranging from 2007 to 2013. At December 31, 2006 and 2005, the Corporation had not made a payment under these products, and management believes that the probability of payments under these guarantees is remote. The Corporation also has written put options on highly rated fixed income securities. Its obligation under these agreements is to buy back the assets at predetermined contractual yields in the event of a severe market disruption in the short-term funding market. These agreements have various maturities ranging from two to five years, and the pre-determined yields are based on the quality of the assets and the structural elements pertaining to the market disruption. The notional amount of these put options was $2.1 billion and $803 million at December 31, 2006 and 2005. Due to the high quality of the assets and various structural protections, management believes that the probability of incurring a loss under these agreements is remote. In the ordinary course of business, the Corporation enters into various agreements that contain indemnifications, such as tax indemnifications, whereupon payment may become due if certain external events occur, such as a change in tax law. These agreements typically contain an early termination clause that permits the Corporation to exit the agreement upon these events. The maximum potential future payment under indemnification agreements is difficult to assess for several reasons, including the inability to predict future changes in tax and other laws, the difficulty in determining how such laws would apply to parties in contracts, the absence of exposure limits contained in standard contract language and the timing of the early termination clause. Historically, any payments made under these guarantees have been de minimis. Management has assessed the probability of making such payments in the future as remote. The Corporation has entered into additional guarantee agreements, including lease end obligation agreements, partial credit guarantees on certain leases, real estate joint venture guarantees, sold risk participation swaps and sold put options that require gross settlement. The maximum potential future payment under these agreements was approximately $2.0 billion and $1.8 billion at December 31, 2006 and 2005. The estimated maturity dates of these obligations are between 2007 and 2033. The Corporation has made no material payments under these guarantees. The Corporation provides credit and debit card processing services to various merchants, processing credit and debit card transactions on their behalf. In connection with these services, a liability may arise in the event of a billing dispute between the merchant and a cardholder that is ultimately resolved in the cardholder’s favor and the merchant defaults upon its obligation to reimburse the cardholder. A cardholder, through its issuing bank, generally has until the later of up to four months after the date a transaction is processed or the delivery of the product or service to present a chargeback to the Corporation as the merchant processor. If the Corporation is unable to collect this amount from the merchant, it bears the loss for the amount paid to the cardholder. In 2006 and 2005, the Corporation processed $377.8 billion and $352.9 billion of transactions and recorded losses as a result of these chargebacks of $20 million and $13 million. At December 31, 2006 and 2005, the Corporation held as collateral approximately $32 million and $248 million of merchant escrow deposits which the Corporation has the right to offset against amounts due from the individual merchants. The Corporation also has the right to offset any payments with cash flows otherwise due to the merchant. Accordingly, the Corporation believes that the maximum potential exposure is not representative of the actual potential loss exposure. The Corporation believes the maximum potential exposure for chargebacks would not exceed the total amount of merchant transactions processed through Visa and MasterCard for the last four months, which represents the claim period for the cardholder, plus any outstanding delayed-delivery transactions. As of December 31, 2006 and 2005, the maximum potential exposure totaled approximately $114.5 billion and $118.2 billion. Within the Corporation’s brokerage business, the Corporation has contracted with a third party to provide clearing services that include underwriting margin loans to the Corporation’s clients. This contract stipulates that the Corporation will indemnify the third party for any margin loan losses that occur in their issuing margin to the Corporation’s clients. The maximum potential future payment under this indemnification was $938 million and $1.1 billion at December 31, 2006 and 2005. Historically, any payments made under this indemnification have been immaterial. As these margin loans are highly collateralized by the securities held by the brokerage clients, the Corporation has assessed the probability of making such payments in the future as remote. This indemnification would end with the termination of the clearing contract. For additional information on recourse obligations related to residential mortgage loans sold and other guarantees related to securitizations, see Note 9 of the Consolidated Financial Statements. | | Litigation and Regulatory Matters In the ordinary course of business, the Corporation and its subsidiaries are routinely defendants in or parties to many pending and threatened legal actions and proceedings, including actions brought on behalf of various classes of claimants. Certain of these actions and proceedings are based on alleged violations of consumer protection, securities, environmental, banking, employment and other laws. In certain of these actions and proceedings, claims for substantial monetary damages are asserted against the Corporation and its subsidiaries.
In the ordinary course of business, the Corporation and its subsidiaries are also subject to regulatory examinations, information gathering requests, inquiries and investigations. Certain subsidiaries of the Corporation are registered broker/dealers or investment advisors and are subject to regulation by the SEC, the National Association of Securities Dealers, the New York Stock Exchange and state securities regulators. In connection with formal and informal inquiries by those agencies, such subsidiaries receive numerous requests, subpoenas and orders for documents, testimony and information in connection with various aspects of their regulated activities.
In view of the inherent difficulty of predicting the outcome of such litigation and regulatory matters, particularly where the claimants seek very large or indeterminate damages or where the cases present novel legal theories or involve a large number of parties, the Corporation cannot state with confidence what the eventual outcome of the pending matters will be, what the timing of the ultimate resolution of these matters will be, or what the eventual loss, fines or penalties related to each pending matter may be.
BANK OF AMERICA CORPORATION AND SUBSIDIARIES
|
In the ordinary course of business, the Corporation and its subsidiaries are routinely defendants in or parties to many pending and threatened legal actions and proceedings, including actions brought on behalf of various classes of claimants. Certain of these actions and proceedings are based on alleged violations of consumer protection, securities, environmental, banking, employment and other laws. In certain of these actions and proceedings, claims for substantial monetary damages are asserted against the Corporation and its subsidiaries. In the ordinary course of business, the Corporation and its subsidiaries are also subject to regulatory examinations, information gathering requests, inquiries and investigations. Certain subsidiaries of the Corporation are registered broker/dealers or investment advisors and are subject to regulation by the SEC, the National Association of Securities Dealers, the New York Stock Exchange and state securities regulators. In connection with formal and informal inquiries by those agencies, such subsidiaries receive numerous requests, subpoenas and orders for documents, testimony and information in connection with various aspects of their regulated activities. In view of the inherent difficulty of predicting the outcome of such litigation and regulatory matters, particularly where the claimants seek very large or indeterminate damages or where the matters present novel legal theories or involve a large number of parties, the Corporation cannot state with confidence what the eventual outcome of the pending matters will be, what the timing of the ultimate resolution of these matters will be, or what the eventual loss, fines or penalties related to each pending matter may be. In accordance with SFAS No. 5, “Accounting for Contingencies”, the Corporation establishes reserves for litigation and regulatory matters when those matters present loss contingencies that are both probable and estimable. When loss contingencies are not both probable and estimable, the Corporation does not establish reserves. In some of the matters described below, including but not limited to a substantial portion of the Parmalat Finanziaria S.p.A. matters, loss contingencies are not both probable and estimable in the view of management, and, accordingly, reserves have not been established for those matters. Based on current knowledge, management does not believe that loss contingencies, if any, arising from pending litigation and regulatory matters, including the litigation and regulatory matters described below, will have a material adverse effect on the consolidated financial position or liquidity of the Corporation, but may be material to the Corporation’s operating results for any particular reporting period. Adelphia Communications Corporation Bank of America, N.A. (BANA), Banc of America Securities (BAS), Fleet National Bank and Fleet Securities, Inc. (FSI) are defendants in an adversary proceeding brought by the Official Committee of Unsecured Creditors (the Creditors’ Committee) on behalf of Adelphia and Adelphia as co-plaintiffs that had been pending in the U.S. Bankruptcy Court for the Southern District of New York (the Bankruptcy Court). The lawsuit names over 400 defendants and asserts over 50 claims under federal statutes, including the Bank Holding Company Act, state common law, and various provisions of the Bankruptcy Code. The plaintiffs seek avoidance and recovery of payments, equitable subordination, disallowance and re-characterization of claims, and recovery of damages in an unspecified amount. The Official Committee of Equity Security Holders of Adelphia intervened in this proceeding and filed its own complaint, which is similar to the unsecured creditors’ committee complaint and also asserts claims under RICO and additional state law theories. BANA, BAS and FSI have filed motions to dismiss both complaints. On February 9, 2006, the U.S. District Court for the Southern District of New York overseeing the Adelphia securities litigation granted the motions of the adversary defendants to withdraw the adversary proceeding from the Bankruptcy Court, except with respect to the pending motions to dismiss. On January 5, 2007, the Bankruptcy Court entered an order confirming a plan of reorganization of Adelphia and its subsidiaries, which provides that, effective on February 13, 2007, the adversary proceeding will be transferred to a liquidating trust created under the plan. In re Initial Public Offering Securities Beginning in 2001, Robertson Stephens, Inc. (an investment banking subsidiary of FleetBoston that ceased operations during 2002), BAS, other underwriters, and various issuers and others, were named as defendants in certain of the 309 purported class actions that have been consolidated in the U.S. District Court for the Southern District of New York asIn re Initial Public Offering Securities Litigation. The plaintiffs contend that the defendants failed to make certain required disclosures and manipulated prices of IPO securities through, among other things, alleged agreements with institutional investors receiving allocations to purchase additional shares in the aftermarket and seek unspecified damages. On October 13, 2004, the district court granted in part and denied in part plaintiffs’ motions to certify as class actions six of the 309 cases. On December 5, 2006, the U.S. Court of Appeals for the Second Circuit (the Second Circuit) reversed the district court’s class certification order. The plaintiffs have petitioned the Second Circuit to reconsider its ruling. That petition is pending. The district court stayed all proceedings pending a decision on the petition. On February 15, 2005, the district court conditionally approved a settlement between the plaintiffs and many of the issuer defendants, in which the issuer defendants guaranteed that the plaintiffs will receive at least $1 billion in the settled actions. The district court has deferred a final ruling on this settlement until the Second Circuit decides whether it will reconsider its December 5, 2006 class certification ruling. Robertson Stephens, Inc. and other underwriters also have been named as defendants in putative class action lawsuits filed in the U.S. District Court for the Southern District of New York under the federal antitrust laws alleging that the underwriters conspired to manipulate the aftermarkets for IPO securities and to extract anticompetitive fees in connection with IPOs. The complaints seek declaratory relief and unspecified treble damages. On September 28, 2005, the Second Circuit reversed the district court’s dismissal of these cases, remanding them to the district court for further proceedings. On December 7, 2006, the U.S. Supreme Court granted the underwriters’ petition seeking review of the Second Circuit’s decision. Interchange Antitrust Litigation The Corporation and certain of its subsidiaries are defendants in actions filed on behalf of a putative class of retail merchants that accept Visa and MasterCard payment cards. The first of these actions was filed in June 2005. On April 24, 2006, putative class plaintiffs filed a First Consolidated and Amended Class Action Complaint. Plaintiffs therein allege that the defendants conspired to fix the level of interchange and merchant discount fees and that certain other practices, including various Visa and MasterCard rules, violate federal and California antitrust laws. On May 22, 2006, the putative class plaintiffs filed a supplemental complaint against many of the same defendants, including the Corporation and certain of its subsidiaries, alleging additional federal antitrust claims and a fraudulent conveyance claim under New York Debtor and Creditor Law, all arising out of MasterCard’s 2006 initial public offering. The putative class plaintiffs seek unspecified treble damages and injunctive relief. Additional defendants in the putative class actions include Visa, MasterCard, and other financial institutions. The putative class actions are coordinated for pre-trial proceedings in the U.S. District Court for the Eastern District of New York, together with additional, individual actions brought only against Visa and MasterCard, under the captionIn Re Payment Card Interchange Fee and Merchant Discount Anti-Trust Litigation. Motions to dismiss portions of the First Consolidated and Amended Class Action Complaint and the supplemental complaint are pending. Miller On August 13, 1998, a predecessor of BANA was named as a defendant in a class action filed in Superior Court of California, County of San Francisco, entitled Paul J. Miller v. Bank of America, N.A., challenging its practice of debiting accounts that received, by direct deposit, governmental benefits to repay fees incurred in those accounts. The action alleges, among other claims, fraud, negligent misrepresentation and other violations of California law. On October 16, 2001, a class was certified consisting of more than one million California residents who have, had or will have, at any time after August 13, 1994, a deposit account with BANA into which payments of public benefits are or have been directly deposited by the government. The case proceeded to trial on January 20, 2004. On March 4, 2005, the trial court entered a judgment that purported to award the plaintiff class restitution in the amount of $284 million, plus attorneys’ fees, and provided that class members whose accounts were assessed an insufficient funds fee in violation of law suffered substantial emotional or economic harm and, therefore, are entitled to an additional $1,000 statutory penalty. The judgment also purported to enjoin BANA, among other things, from engaging in the account balancing practices at issue. On November 22, 2005, the California Court of Appeal granted BANA’s request to stay the judgment, including the injunction, pending appeal. On November 20, 2006, the California Court of Appeal reversed the judgment in its entirety, holding that BANA’s practice did not constitute a violation of California law. On December 14, 2006, the California Court of Appeal denied plaintiff’s petition for rehearing. Plaintiff has petitioned for review in the California Supreme Court. Municipal Derivatives Matters The Antitrust Division of the U.S. Department of Justice (DOJ), the SEC, and the Internal Revenue Service (IRS) are investigating possible anticompetitive bidding practices in the municipal derivatives industry involving various parties, including BANA, from the early 1990s to date. The activities at issue in these industry-wide government investigations concern the bidding process for municipal derivatives that are offered to states, municipalities and other issuers of tax-exempt bonds. The Corporation has cooperated, and continues to cooperate, with the DOJ, the SEC and the IRS. On January 11, 2007, the Corporation entered into a Corporate Conditional Leniency Letter (the Letter) with DOJ. Under the Letter and subject to the Corporation’s continuing cooperation, DOJ will not bring any criminal antitrust prosecution against the Corporation in connection with the matters that the Corporation reported to DOJ. Subject to satisfying DOJ and the court presiding over any civil litigation of the Corporation’s cooperation, the Corporation is eligible for (i) a limit on liability to single, rather than treble, damages in any related civil antitrust actions, and (ii) relief from joint and several antitrust liability with other civil defendants. No such civil actions have been filed to date, but no assurances can be given that such actions will not be filed. Parmalat Finanziaria S.p.A. On December 24, 2003, Parmalat Finanziaria S.p.A. was admitted into insolvency proceedings in Italy, known as “extraordinary administration.” The Corporation, through certain of its subsidiaries, including BANA, provided financial services and extended credit to Parmalat and its related entities. On June 21, 2004, Extraordinary Commissioner Dr. Enrico Bondi filed with the Italian Ministry of Production Activities a plan of reorganization for the restructuring of the companies of the Parmalat group that are included in the Italian extraordinary administration proceeding. In July 2004, the Italian Ministry of Production Activities approved the Extraordinary Commissioner’s restructuring plan, as amended, for the Parmalat group companies that are included in the Italian extraordinary administration proceeding. This plan was approved by the voting creditors and the Court of Parma, Italy in October of 2005. Litigation and investigations relating to Parmalat are pending in both Italy and the United States, and the Corporation is responding to inquiries concerning Parmalat from regulatory and law enforcement authorities in Italy and the United States. Notes to Consolidated Financial Statements—(Continued)
In accordance with SFAS No. 5, “Accounting for Contingencies”, the Corporation establishes reserves for litigation and regulatory matters when those matters present loss contingencies that are both probable and estimable. When loss contingencies are not both probable and estimable, the Corporation does not establish reserves. In some of the matters described below, including but not limited to the Parmalat Finanziaria, S.p.A. matter, loss contingencies are not both probable and estimable in the view of management, and, accordingly, reserves have not been established for those matters. Based on current knowledge, management does not believe that loss contingencies, if any, arising from pending litigation and regulatory matters, including the litigation and regulatory matters described below, will have a material adverse effect on the consolidated financial position or liquidity of the Corporation, but may be material to the Corporation’s operating results for any particular reporting period.
Adelphia Communications Corporation (Adelphia)
Bank of America, N.A. (BANA) and Banc of America Securities LLC (BAS) are defendants, among other defendants, in a putative class action and individual civil actions relating to Adelphia. The first of these actions was filed in June 2002; these actions have been consolidated for pre-trial purposes in the U.S. District Court for the Southern District of New York. BAS was a member of seven underwriting syndicates of securities issued by Adelphia, and BANA was an agent and/or lender in connection with five credit facilities in which Adelphia subsidiaries were borrowers. Fleet National Bank (FNB) and Fleet Securities, Inc. (FSI) are also named as defendants in certain of the actions. FSI was a member of three underwriting syndicates of securities issued by Adelphia, and FNB was a lender in connection with four credit facilities in which Adelphia subsidiaries were borrowers. The complaints allege claims under the Securities Act of 1933, the Securities Exchange Act of 1934, and various state law theories. The complaints seek damages of unspecified amounts.
The court has granted the motions of BANA, BAS and other bank defendants to dismiss certain class plaintiffs’ claims on statute of limitations grounds. The court permitted plaintiffs who purchased bonds in a 2001 $750 million bond offering, of which BAS underwrote fifty percent, to assert claims against BAS relating to that offering and certain other offerings made under the same registration statement. The court has also granted in part and denied in part defendants’ motions to dismiss certain of the individual actions. Other motions to dismiss the class action and certain of the individual actions remain pending.
BANA, BAS, FNB, and FSI are also defendants in an adversary proceeding brought by the Official Committee of Unsecured Creditors on behalf of Adelphia and Adelphia as co-plaintiffs that had been pending in the U.S. Bankruptcy Court for the Southern District of New York. The lawsuit names over 400 defendants and asserts over 50 claims under federal statutes, including the Bank Holding Company Act, state common law, and various provisions of the Bankruptcy Code. The plaintiffs seek avoidance and recovery of payments, equitable subordination, disallowance and re-characterization of claims, and recovery of damages in an unspecified amount. The Official Committee of Equity Security Holders of Adelphia has intervened in this proceeding and filed its own complaint, which is similar to the unsecured creditors’ committee complaint and also asserts claims under RICO and additional state law theories. BANA, BAS and FSI have filed motions to dismiss both complaints. On February 9, 2006, the U.S. District Court for the Southern District of New York overseeing the Adelphia securities litigation granted the motions of the adversary defendants to withdraw the adversary proceeding from the bankruptcy court, except with respect to the pending motions to dismiss.
Data Treasury
The Corporation and BANA have been named as defendants in an action filed by Data Treasury Corporation in the U.S. District Court for the Eastern District of Texas. Plaintiff alleges that defendants have “provided, sold, installed, utilized, and assisted others to use and utilize image-based banking and archival solutions” in a manner that infringes United States Patent Nos. 5,910,988 and 6,032,137. Plaintiff seeks unspecified damages and injunctive relief against the alleged infringement. The court has scheduled a trial of this action for October 2, 2007.
The Corporation and BANA have been named as defendants, along with 54 other defendants, in an action filed by Data Treasury Corporation in the U.S. District Court for the Eastern District of Texas. Plaintiff alleges that the Corporation and BANA, among other defendants, are “making, using, selling, offering for sale, and/or importing into the United States, directly, contributory, and/or by inducement, without authority, products and services that fall within the scope of the claims of” United States Patent Nos. 5,265,007; 5,583,759; 5,717,868; and 5,930,778. Plaintiff seeks unspecified damages and injunctive relief against the alleged infringement.
In re Initial Public Offering Securities
Beginning in 2001, Robertson Stephens, Inc. (an investment banking subsidiary of FleetBoston that ceased operations during 2002), BAS, other underwriters, and various issuers and others, were named as defendants in
BANK OF AMERICA CORPORATION AND SUBSIDIARIES
Notes to Consolidated Financial Statements—(Continued)
purported class action lawsuits alleging violations of federal securities laws in connection with the underwriting of initial public offerings (IPOs) and seeking unspecified damages. Robertson Stephens, Inc. and BAS were named in certain of the 309 purported class actions that have been consolidated in the U.S. District Court for the Southern District of New York as In re Initial Public Offering Securities Litigation. The plaintiffs contend that the defendants failed to make certain required disclosures and manipulated prices of IPO securities through, among other things, alleged agreements with institutional investors receiving allocations to purchase additional shares in the aftermarket, and false and misleading analyst reports. On October 13, 2004, the court granted in part and denied in part plaintiffs’ motions to certify as class actions six of the 309 cases. On June 30, 2005, the U.S. Court of Appeals for the Second Circuit granted the underwriter defendants’ petition for permission to appeal the court’s class certification order. The appeal is pending.
The plaintiffs have reached a settlement with 298 of the issuer defendants, in which the issuer defendants guaranteed that the plaintiffs will receive at least $1.0 billion in the settled actions and assigned to the plaintiffs the issuers’ interest in all claims against the underwriters for “excess compensation.” On February 15, 2005, the U.S. District Court for the Southern District of New York conditionally approved the issuer defendants’ settlement. A fairness hearing is scheduled for April 24, 2006.
Robertson Stephens, Inc. and other underwriters also have been named as defendants in putative class action lawsuits filed in the U.S. District Court for the Southern District of New York under the federal antitrust laws alleging that the underwriters conspired to manipulate the aftermarkets for IPO securities and to extract anticompetitive fees in connection with IPOs. The complaint seeks declaratory relief and unspecified treble damages. On September 28, 2005, the Court of Appeals for the Second Circuit reversed the district court’s dismissal of the antitrust class actions, remanding the cases to the district court for further proceedings. The defendants have filed a petition for certiorari with the United States Supreme Court, which is pending.
Interchange Anti-trust Litigation
The Corporation and certain of its subsidiaries are defendants in putative class actions that have been transferred for coordinated pre-trial proceedings to the U.S. District Court for the Eastern District of New York, under the captionIn Re Payment Card Interchange Fee and Merchant Discount Anti-Trust Litigation. Defendants include other financial institutions and, among others, Visa and MasterCard. Plaintiffs seek certification of a class of retail merchants and allege, among other claims, that defendants conspired to fix the level of interchange and merchant discount fees and that certain practices that prohibit merchants from charging cardholders for fees the merchant pays to the credit card companies violate the federal antitrust laws. Plaintiffs seek unspecified treble damages and injunctive relief.
Miller
On August 13, 1998, a predecessor of BANA was named as a defendant in a class action filed in Superior Court of California, County of San Francisco, entitled Paul J. Miller v. Bank of America, N.A., challenging its practice of debiting accounts that received, by direct deposit, governmental benefits to repay fees incurred in those accounts. The action alleges fraud, negligent misrepresentation and violations of certain California laws. On October 16, 2001, a class was certified consisting of more than one million California residents who have, had or will have, at any time after August 13, 1994, a deposit account with BANA into which payments of public benefits are or have been directly deposited by the government. The case proceeded to trial on January 20, 2004.
On March 4, 2005, the trial court entered a judgment that awards the plaintiff class restitution in the amount of $284 million, plus attorneys’ fees, and provides that class members whose accounts were assessed an insufficient funds fee in violation of law suffered substantial emotional or economic harm and, therefore, are entitled to an additional $1,000 penalty. The judgment also includes injunctive relief.
On May 13, 2005, BANA filed with the California Court of Appeal, First Appellate District, a notice of appeal and, on May 16, 2005, a writ of supersedeas, seeking a stay of the trial court’s judgment pending appeal. On November 22, 2005, the Court of Appeal granted BANA’s writ, staying the judgment, including the injunction, pending appeal. The appeal remains pending.
Mutual Fund Operations Matters
In early 2005, the Corporation entered into settlement agreements with the New York Attorney General and the SEC relating to late trading and market timing of mutual funds. The Corporation is continuing to respond to inquiries from federal and state regulatory and law enforcement agencies concerning mutual fund related matters.
In addition, lawsuits seeking unspecified damages concerning mutual fund trading were brought against the Corporation and its pre-merger FleetBoston subsidiaries, including putative class actions purportedly brought on behalf
BANK OF AMERICA CORPORATION AND SUBSIDIARIES
Notes to Consolidated Financial Statements—(Continued)
of shareholders in Nations Funds mutual funds, derivative actions brought on behalf of one or more Nations Funds mutual funds by Nations Funds shareholders, putative ERISA class actions brought on behalf of participants in Bank of America Corporation’s 401(k) plan, derivative actions brought against the Corporation’s directors on behalf of the Corporation by shareholders in the Corporation, class actions and derivative actions brought by shareholders in third-party mutual funds alleging that the Corporation or its subsidiaries facilitated improper trading in those funds, and a private attorney general action brought under California law. The lawsuits filed to date with respect to pre-merger FleetBoston subsidiaries include putative class actions purportedly brought on behalf of shareholders in Columbia mutual funds, derivative actions brought on behalf of one or more Columbia mutual funds or trusts by Columbia mutual fund shareholders, and an individual shareholder action.
All lawsuits pending in federal courts with respect to alleged late trading or market timing in mutual funds have been transferred to the U.S. District Court for the District of Maryland for coordinated pre-trial proceedings under the captionIn re Mutual Funds Investment Litigation, other than a putative class action complaint filed on February 22, 2006 in the U.S. District Court for the Southern District of New York alleging, among other things, market timing in the Nations Funds. Motions to remand to state court remain pending in two of those lawsuits. One lawsuit that originated in state court was removed to the U.S. District Court for the Southern District of Illinois. Pursuant to an order of the U.S. Court of Appeals for the Seventh Circuit, the U.S. District Court for the Southern District of Illinois dismissed that action. On January 6, 2006, the U.S. Supreme Court granted plaintiff’s petition for review on the issue of whether the Court of Appeals for the Seventh Circuit had appellate jurisdiction to review the remand order.
On August 25, 2005, the U.S. District Court for the District of Maryland dismissed the state law claims and derivative claims filed by Janus shareholders against the Corporation and certain of its subsidiaries. The claims under Section 10(b) of the Securities Exchange Act of 1934 were not dismissed. On November 3, 2005, the court dismissed the state law claims and derivative claims filed against the Corporation and certain of its subsidiaries by shareholders in various third-party mutual funds. The claims under Section 10(b) of the Securities Exchange Act of 1934 were not dismissed. Also on November 3, 2005, the court dismissed the claims under the Securities Act of 1933, the claims under Sections 34(b) and 36(a) of the Investment Company Act of 1940 (ICA) and the state law claims against the Corporation and certain of its pre-merger FleetBoston subsidiaries. The claims under Sections 10(b) and 20(a) of the Securities Exchange Act of 1934 and Section 36(b) of the ICA were not dismissed.
On December 15, 2005, the Corporation and its named subsidiaries entered into a settlement of the direct and derivative claims brought on behalf of the Nations Funds shareholders and the ERISA claims brought on behalf of Bank of America Corporation’s 401(k) plan participants. Among other conditions, the settlement is contingent upon a minimum threshold amount being received by the Nations Funds shareholders and/or the Nations Funds mutual funds from the previously established regulatory settlement fund consisting of $250 million in disgorgement and $125 million in civil penalties paid by the Corporation in 2005. The settlement is subject to court approval. If the settlement is approved, the Corporation and its named subsidiaries would pay settlement administration costs and fees to plaintiffs’ counsel as approved by the court.
Parmalat Finanziaria S.p.A.
On December 24, 2003, Parmalat Finanziaria S.p.A. was admitted into insolvency proceedings in Italy, known as “extraordinary administration.” The Corporation, through certain of its subsidiaries, including BANA, provided financial services and extended credit to Parmalat and its related entities. On June 21, 2004, Extraordinary Commissioner Dr. Enrico Bondi filed with the Italian Ministry of Production Activities a plan of reorganization for the restructuring of the companies of the Parmalat group that are included in the Italian extraordinary administration proceeding.
In July 2004, the Italian Ministry of Production Activities approved the Extraordinary Commissioner’s restructuring plan, as amended, for the Parmalat group companies that are included in the Italian extraordinary administration proceeding. This plan was approved by the voting creditors of Parmalat and subsequently, on October 1, 2005, the Court of Parma, Italy issued its decision approving those claimants who would be recognized as creditors in the proceeding.
Litigation and investigations relating to Parmalat are pending in both Italy and the United States, and the Corporation is responding to inquiries concerning Parmalat from regulatory and law enforcement authorities in Italy and the United States.
Proceedings in Italy On May 26, 2004, theThe Public Prosecutor’s Office for the Court of Milan, Italy filed criminal charges against Luca Sala, Luis Moncada, and Antonio Luzi, three former employees, alleging the crime of market manipulation in connection with a press release issued by Parmalat. The Public Prosecutor’s Office also filed a related charge against the BANK OF AMERICA CORPORATION AND SUBSIDIARIES
Notes to Consolidated Financial Statements—(Continued)
Corporation asserting administrative liability based on an alleged failure to maintain an organizational model sufficient to prevent the alleged criminal activities of its former employees. Preliminary hearings beganhave begun on this administrative charge on February 22, 2006. and trial is expected to begin in the first quarter of 2007. The main trial of the market manipulation charges against Messrs. Luzi, Moncada, and Sala began in the Court of Milan, Italy on September 28, 2005. Hearing dates in this trial are currently set through June 2006.July 2007. The Corporation is participating in this trial as a party that has been damaged by the alleged actions of defendants other than its former employees, including former Parmalat officials. Additionally, pursuant to a December 19, 2005 court ruling, other third parties are participating in the trial who claim damages against BANA as a result of the alleged criminal violations of the Corporation’s former employees and other defendants. Separately, The Public Prosecutor’s Office for the Court of Parma, Italy is conducting an investigation into the collapse of Parmalat. The Corporation has cooperated, and continues to cooperate, with The Public Prosecutor’s Office with respect to this investigation. The Public Prosecutor’s Office has given notice of its intention to file charges, including a charge of the crime of fraudulent bankruptcy under Italian criminal law, in connection with this investigation against the same three former employees of the Corporation who are named in the Milan criminal proceedings, Messrs. Luzi, Moncada and Sala. Proceedings in the United States On March 5, 2004, a First Amended Complaint was filed in a putative securities class action pending in the U.S. District Court for the Southern District of New York entitled Southern Alaska Carpenters Pension Fund et al. v. Bonlat Financing Corporation et al., which names the Corporation as a defendant. The action is brought on behalf of a putative class of purchasers of Parmalat securities. The First Amended Complaintsecurities and alleges causes of action against the Corporation for violations of the federal securities laws based uponagainst the Corporation’s alleged role in the alleged Parmalat accounting fraud. This action was consolidated with several other putative class actions filed against multiple defendants,Corporation and on October 18, 2004, an Amended Consolidated Complaint was filed. Unspecified damages are being sought. On July 13, 2005,certain affiliates. After the court granted in its entiretydismissed the motioninitial complaint as to dismiss filed by the Corporation, BANA and Banc of America Securities Limited in the consolidated putative class actions. The court granted the plaintiffs(BASL), plaintiff filed a right to file a second amended complaint. After the filing of the second amended complaint andSecond Amended Complaint, which seeks unspecified damages. Following the Corporation’s motion to dismiss such complaint, on February 9, 2006,the Second Amended Complaint, the court granted the Corporation’s motion to dismiss in part, allowing the plaintiff to proceed on claims with respect to two transactions entered into between the Corporation and Parmalat. On February 27, 2006, theThe Corporation has filed itsan answer to the second amended complaint.Second Amended Complaint. The putative class plaintiffs filed a motion for class certification on September 21, 2006, which remains pending. The Corporation also filed on October 10, 2006 a motion to dismiss the claims of foreign purchaser plaintiffs for lack of subject matter jurisdiction. On October 7, 2004, Enrico Bondi filed an action in the U.S. District Court for the Western District of North Carolina on behalf of Parmalat and its shareholders and creditors against the Corporation and various related entities, entitled Dr. EnricoBondi, Extraordinary Commissioner of Parmalat Finanziaria, S.p.A., et al. v. Bank of America Corporation, et al. (the Bondi Action). The complaint allegesalleged federal and state RICO claims and various state law claims, including fraud. The complaint seekssought damages in excess of $10.0$10 billion. The Bondi Action was transferred to the U.S. District Court for the Southern District of New York for coordinated pre-trial purposes with the putative class actions and other related cases against non-Bank of America defendants under the captionIn re Parmalat Securities Litigation. On August 5, 2005, the U.S. District Court for the Southern District of New York granted the Corporation’s motion to dismiss the Bondi Action in part, dismissing ten of the twelve counts. After the plaintiff’s filing of a First Amended Complaint on September 9, 2005, and the Corporation’s motion to dismiss such complaint, on January 31, 2006, the court granted the Corporation’s motion to dismiss in part, allowing the plaintiff to proceed on the previously dismissed federal and state RICO claims with respect to three transactions entered into between the Corporation and Parmalat. The Corporation has filed an answer and counterclaims (the Bank of America Counterclaims) seeking damages against Parmalat and a number of its subsidiaries and affiliates as compensation for financial losses and other damages suffered. Parmalat filed a motion to dismiss certain of the Bank of America Counterclaims, and that motion is pending. On February 10,November 21, 2006, the CorporationParmalat filed its answera motion to amend the First Amended Complaint and also its request to file counterclaims inadd a claim of breach of fiduciary duty by the Bondi Action. Corporation to Parmalat. That motion is pending. On November 23, 2005, the Official Liquidators of Food Holdings LimitedLtd. and Dairy Holdings Limited,Ltd., two entities in liquidation proceedings in the Cayman Islands, filed a complaint against the Corporation and several related entities in the U.S. District Court for the Southern District of New York, against the Corporation and several related entities, entitledFood Holdings Ltd,Ltd., et al. v. Bank of America Corp., et al.al, (the(the Food Holdings Action). TheAlso on November 23, 2005, the Provisional Liquidators of Parmalat Capital Finance Ltd. (who are also the liquidators in the Food Holdings Action), filed a complaint against the Corporation and several related entities in North Carolina state court for Mecklenburg County, entitledParmalat Capital Finance Limited v. Bank of America Corp., et al.(the PCFL Action). Both actions have been consolidated for pretrial purposes with the other pending actions in theIn Re Parmalat Securities Litigationmatter. The Food Holdings Action alleges that the Corporation and other defendants conspired with Parmalat in carrying out transactions involving the plaintiffs in connection with the funding of Parmalat’s Brazilian entities, and it asserts claims for fraud, negligent misrepresentation, breach of fiduciary duty, civil conspiracy and other related claims. The complaint seeks damages in excess of $400 million. The Food Holdings Action was consolidated for pretrial purposes with the other pending actions in theIn Re Parmalat Securities Litigation matter. On November 23, 2005, the Provisional Liquidators of Parmalat Capital Finance Limited (PCFL) (who are also the Official Liquidators of Food Holdings Ltd. and Dairy Holdings Ltd.) filed a complaint against the Corporation and
BANK OF AMERICA CORPORATION AND SUBSIDIARIES
Notes to Consolidated Financial Statements—(Continued)
several related entities in North Carolina state court for Mecklenburg County, entitledParmalat Capital Finance Limited v. Bank of America Corp., et al. (the PCFL Action). PCFL is a Cayman Islands corporation that is in liquidation proceedings in Grand Cayman. The PCFL Action alleges that the Corporation and other defendants conspired with Parmalat insiders to loot and divert monies from PCFL, and it asserts claims for breach of fiduciary duty, aiding and abetting breach of fiduciary dutycivil conspiracy and other related claims. PCFL asserts that it lost hundredsseeks “hundreds of millions of dollars as a direct result of the Corporation’s activities.dollars” in damages. The Corporation has filed a notice of removalmoved to the U.S. District Court for the Western District of North Carolina.dismiss both actions. The PCFL Action has been transferred to the U.S. District Court for the Southern District of New York for coordinated pre-trial purposes with the other Parmalat-related proceedings.motions are pending.
On December 15, 2005, certainCertain purchasers of Parmalat-related private placement offerings have filed first amended petitionscomplaints against the Corporation and various related entities in state courts in Iowa, entitledthe following actions:Principal Global Investors, LLC, et al. v. Bank of America Corporation, et al. (Principal Global Investors) andin the U.S. District Court for the Southern District of Iowa;Monumental Life Insurance Company, et al. v. Bank of America Corporation, et al. (Monumentalin the U.S. District Court for the Northern District of Iowa;Prudential Insurance Company of America and Hartford Life Insurance Company)Company v. Bank of America Corporation, et al. in the U.S. District Court for the Northern District of Illinois;Allstate Life Insurance Company v. Bank of America Corporation, et al. in the U.S. District Court for the Northern District of Illinois;Hartford Life Insurance v. Bank of America Corporation, et al.in the U.S. District Court for the Southern District of New York; andJohn Hancock Life Insurance Company, et al. v. Bank of America Corporation et al. in the U.S. District Court for the District of Massachusetts. The actions variously allege violations of Iowafederal and state securities law and various state common law, claims, and seek rescission and unspecified damages based upon the Corporation’s and related entities’ alleged roles in certain private placement offerings issued by Parmalat-related companies. On January 4 and 5, 2006, respectively,Except for the Principal Global Investors John Hancock Life Insurancecase, was removedthe most recently filed matter, the cases have been transferred to the U.S. District Court for the Southern District of Iowa, and the Monumental Life Insurance Company case was removed to the U.S. District CourtNew York for the Northern District of Iowa. On February 13, 2006, the Corporation filed its answers to each of these complaints. On February 15, 2006, these cases were consolidated for pretrialcoordinated pre-trial purposes with theIn Rere Parmalat Securities Litigationmatter. The plaintiffs seek rescission and unspecified damages resulting from alleged purchases of approximately $305 million in private placement instruments. In addition to claims relating to private placement transactions, theJohn Hancock Life Insurancecase also claims damages relating to a separate Eurobond investment alleged in the amount of $25 million.
On January 18, 2006, Gerald K. Smith, in his capacity as Trustee of Farmland Dairies LLC Litigation Trust, filed a complaint against the Corporation, BANA, BAS, BASL, Bank of America National Trust & Savings Association and BankAmerica International Limited, as well as other financial institutions and accounting firms, in the U.S. District Court for the Southern District of New York, entitledGerald K. Smith, Litigation Trustee v. Bank of America Corporation,, et al. (the “Farmland Action”)Farmland Action). Prior to bankruptcy restructuring, Farmland Dairies LLC was a wholly-owned subsidiary of Parmalat USA Corporation, which was a wholly-owned subsidiary of Parmalat SpA. The Farmland Action asserts claims of aiding and abetting, breach of fiduciary duty, civil conspiracy and related claims against the Bank of America defendants and other defendants. The plaintiff seeks unspecified damages. On February 23, 2006, the plaintiff filed its first amended complaint.First Amended Complaint, which was dismissed on August 16, 2006, with leave to file a Second Amended Complaint, which plaintiff filed on September 8, 2006. The Corporation has moved to dismiss the Second Amended Complaint. On April 21, 2006, the Plan Administrator of the Plan of Liquidation of Parmalat-USA Corporation filed a complaint in the U.S. District Court for the Southern District of New York against the Corporation and certain of its subsidiaries, as well as other financial institutions and accounting firms entitledG. Peter Pappas in his capacity as the Plan Administrator of the Plan of Liquidation of Parmalat-USA Corporation v. Bank of America Corporation, et al. (the Parmalat USA Action). The Parmalat USA Action asserts claims of aiding and abetting, breach of fiduciary duty, civil conspiracy and related claims against the Bank of America defendants and other defendants. The plaintiff seeks unspecified damages. The Corporation has moved to dismiss the Parmalat USA Action. The motion is pending. Pension Plan Matters The Corporation is a defendant in a putative class action entitledWilliam L. Pender, et al. v. Bank of America Corporation, et al.(formerly captionedAnita Pothier, et al. v. Bank of America Corporation, et al.), which was initially filed June 2004 in the U.S. District Court for the Southern District of Illinois and subsequently transferred to the U.S. District Court for the Western District of North Carolina. The action is brought on behalf of participants in or beneficiaries of The Bank of America Pension Plan (formerly known as the NationsBank Cash Balance Plan) and The Bank of America 401(k) Plan (formerly known as the NationsBank 401(k) Plan). The Third Amended Complaint names as defendants the Corporation, BANA, The Bank of America Pension Plan, The Bank of America 401(k) Plan, the Bank of America Corporation Corporate Benefits Committee and various members thereof, and PricewaterhouseCoopers LLP. The two named plaintiffs are alleged to be a current and a former participant in The Bank of America Pension Plan and 401(k) Plan. The Third Amended Complaintcomplaint alleges the defendants violated various provisions of ERISA, including that the design of The Bank of America Pension Plan violated ERISA’s defined benefit pension plan standards and that such plan’s definition of normal retirement age is invalid. In addition, the complaint alleges age discrimination in the design and operation of The Bank of America Pension Plan, unlawful lump sum benefit calculation, violation of ERISA’s “anti-backloading” rule, improper benefit to the Corporation and its predecessor, and various prohibited transactions and fiduciary breaches. The complaint further alleges that certain voluntary transfers of assets by participants in The Bank of America 401(k) Plan to The Bank of America Pension Plan violated ERISA. ERISA, and other related claims. The complaint alleges that current and former participants in these plans are entitled to greater benefits and seeks declaratory relief, monetary relief in an unspecified amount, equitable relief, including an order reforming The Bank of America Pension Plan, attorneys’ fees and interest. The court has scheduled the case for trial in September 2006. On September 25, 2005, defendants moved to dismiss the Third Amended Complaint. The motion is pending.
complaint. On December 1, 2005, the named plaintiffs moved to certify classes consisting of, among others, (1)(i) all persons who accrued or who are currently accruing benefits under The Bank of America Pension Plan and (2)(ii) all persons who elected BANK OF AMERICA CORPORATION AND SUBSIDIARIES
Notes to Consolidated Financial Statements—(Continued)
to have amounts representing their account balances under The Bank of America 401(k) Plan transferred to The Bank of America Pension Plan. The motion to dismiss and the motion for class certification isare pending. The IRS is conducting an audit of the 1998 and 1999 tax returns of The Bank of America Pension Plan and The Bank of America 401(k) Plan. This audit includes a review of voluntary transfers by participants of 401(k) Plan assets to The Bank of America Pension Plan and whether such transfers were in accordance with applicable law. In December 2005, the Corporation received a Technical Advice Memorandum from the National Office of the IRS that concludesconcluded that the amendments made to The Bank of America 401(k) Plan in 1998 to permit the voluntary transfers to The Bank of America Pension Plan violated the anti-cutback rule of Section 411(d)(6) of the Internal Revenue Code. In November 2006, the Corporation received another Technical Advice Memorandum denying the Corporation’s request that the conclusion reached in the first Technical Advice Memorandum be applied prospectively only. The Corporation continues to participate in administrative proceedings with the IRS regarding issues raised in the audit. On September 29, 2004, a separate putative class action, entitledDonna C. Richards v. FleetBoston Financial Corp. and the FleetBoston Financial Pension Plan (Fleet Pension Plan), was filed in the U.S. District Court for the District of Connecticut on behalf of all former and current Fleet employees who on December 31, 1996, were not at least age 50 with 15 years of vesting service and who participated in the Fleet Pension Plan before January 1, 1997, and who have participated in the Fleet Pension Plan at any time since January 1, 1997. The complaint allegesalleged that FleetBoston or its predecessor violated ERISA by amending the Fleet Financial Group, Inc. Pension Plan (a predecessor to the Fleet Pension Plan) to add a cash balance benefit formula without notifying participants that the amendment significantly reduced their plan benefits, by conditioning the amount of benefits payable under the Fleet Pension Plan upon the form of benefit elected, by reducing the rate of benefit accruals on account of age, and by failing to inform participants of the correct amount of their pensions and related claims. The complaint also alleges that the Fleet Pension Plan violatesalleged violation of the “anti-backloading” rule of ERISA. The complaint seekssought equitable and remedial relief, including a declaration that the cash balance amendment to the Fleet Pension Plan was ineffective, additional unspecified benefit payments, attorneys’ fees and interest. On March 31, 2006, the court certified a class with respect to plaintiff’s claims that (i) the cash balance benefit formula reduces the rate of benefit accrual on account of age, (ii) the participants did not receive proper notice of the alleged reduction of future benefit accrual, and (iii) the summary plan description was not adequate. Plaintiff filed an amended complaint realleging the three claims as to which a class was certified and amending two claims the court had dismissed, and defendants moved to dismiss plaintiff’s amended claims. The court dismissed plaintiff’s amended anti-backloading claim and a portion of the plaintiff’s amended breach of fiduciary duty claim. The court subsequently certified a class as to the portions of plaintiff’s breach of fiduciary duty claim that were not dismissed. On December 28, 2004,12, 2006, plaintiff filed a second amended complaint adding new allegations to the breach of fiduciary duty and summary plan description claims, and a new claim alleging that the Fleet Pension Plan violated ERISA in calculating lump-sum distributions. On December 22, 2006, plaintiff filed a motion forto extend class certification. On January 25, 2005,certification to the defendants moved to dismissnew allegations and claim in the action. These motions are pending. second amended complaint. Refco Beginning in October 2005, BAS was named as a defendant in several federalputative class action and derivative lawsuits filed in the U.S. District Court for the Southern District of New York relating to Refco Inc. (Refco). The lawsuits, variouslywhich have been consolidated and seek unspecified damages, name as other defendants Refco’s outside auditors, certain officers and directors of Refco, other financial services companies, (including in two cases the Corporation), and other individuals and companies. The actionslawsuits allege violations of the disclosure requirements of the federal securities laws and state laws in connection with the sale of Refco securities, including the RefcoRefco’s senior subordinated notes offering in August 2004 and the RefcoRefco’s initial public offering in August 2005. Customers of RefcoBAS and certain other underwriter defendants have also named BAS,moved to dismiss the Corporation and other underwriters as defendants in a federal class action underclaims relating to the federal securities laws. The complaints seek unspecified damages.notes offering. BAS is also responding to various regulatory inquiries relating to Refco. Trading and Research Activities The SEC has been conducting a formal investigation with respect to certain trading and research-related activities of BAS. These matters primarily arose during the period 1999-2001 in BAS’ San Francisco operations. In September 2005, the SEC staff advised BAS that it intends to recommend to the SEC an enforcement action against BAS in connection with these matters. This matter remains pending. BANK OF AMERICA CORPORATION AND SUBSIDIARIES
Notes to Consolidated Financial Statements—(Continued)
| | NOTE 14 – Shareholders’ Equity and Earnings Per Common Share |
Note 14—Shareholders’ Equity and Earnings Per Common Share
The following table presents share repurchase activity for the three months and years ended December 31, 2006, 2005 2004 and 2003,2004, including total common shares repurchased under announced programs, weighted average per share price and the remaining buyback authority under announced programs. Share Repurchase Activity | | | | | | | | | | | (Dollars in millions, except per share information; shares in thousands) | | Number of Common
Shares Repurchased
under Announced
Programs(1)
| | Weighted
Average
Per
Share
Price(1)
| | Remaining Buyback Authority
under Announced Programs(2)
| | | | | Dollars
| | Shares
| Three months ended March 31, 2005 | | 43,214 | | $ | 46.05 | | $ | 14,688 | | 237,411 | Three months ended June 30, 2005 | | 40,300 | | | 45.38 | | | 12,859 | | 197,111 | Three months ended September 30, 2005 | | 10,673 | | | 43.32 | | | 11,403 | | 186,438 | | | |
| | | | | | | | | October 1-31, 2005 | | 0 | | | 0.00 | | | 11,403 | | 186,438 | November 1-30, 2005 | | 11,550 | | | 45.38 | | | 10,879 | | 174,888 | December 1-31, 2005 | | 20,700 | | | 46.42 | | | 9,918 | | 154,188 | | | |
| | | | | | | | | Three months ended December 31, 2005 | | 32,250 | | | 46.05 | | | | | | | | |
| | | | | | | | | Year ended December 31, 2005 | | 126,437 | | | 45.61 | | | | | | | | |
| | | | | | | | | | | | | (Dollars in millions, except per share information; shares in thousands) | | Number of Common
Shares Repurchased
under Announced
Programs(3)
| | Weighted
Average
Per
Share
Price(3)
| | Remaining Buyback Authority
under Announced Programs(4)
| | | | | Dollars
| | Shares
| Three months ended March 31, 2004 | | 24,306 | | $ | 40.03 | | $ | 12,378 | | 204,178 | Three months ended June 30, 2004 | | 49,060 | | | 41.07 | | | 7,978 | | 155,118 | Three months ended September 30, 2004 | | 40,430 | | | 43.56 | | | 6,217 | | 114,688 | | | |
| | | | | | | | | October 1-31, 2004 | | 16,102 | | | 44.24 | | | 5,505 | | 98,586 | November 1-30, 2004 | | 11,673 | | | 45.84 | | | 4,969 | | 86,913 | December 1-31, 2004 | | 6,288 | | | 46.32 | | | 4,678 | | 80,625 | | | |
| | | | | | | | | Three months ended December 31, 2004 | | 34,063 | | | 45.17 | | | | | | | | |
| | | | | | | | | Year ended December 31, 2004 | | 147,859 | | | 42.52 | | | | | | | | |
| | | | | | | | | | | | | (Dollars in millions, except per share information; shares in thousands) | | Number of Common
Shares Repurchased
under Announced
Programs(5)
| | Weighted
Average
Per
Share
Price(5)
| | Remaining Buyback Authority
under Announced Programs(6)
| | | | | Dollars
| | Shares
| Three months ended March 31, 2003 | | 36,800 | | $ | 34.24 | | $ | 13,930 | | 270,370 | Three months ended June 30, 2003 | | 60,600 | | | 37.62 | | | 10,610 | | 209,770 | Three months ended September 30, 2003 | | 50,230 | | | 40.32 | | | 8,585 | | 159,540 | | | |
| | | | | | | | | October 1-31, 2003 | | 13,800 | | | 40.28 | | | 8,029 | | 145,740 | November 1-30, 2003 | | 64,212 | | | 37.68 | | | 5,610 | | 81,528 | December 1-31, 2003 | | 33,044 | | | 38.10 | | | 4,351 | | 48,484 | | | |
| | | | | | | | | Three months ended December 31, 2003 | | 111,056 | | | 38.13 | | | | | | | | |
| | | | | | | | | Year ended December 31, 2003 | | 258,686 | | | 37.88 | | | | | | | | |
| | | | | | | | |
| | | | | | | | | | | | | | | | Number of Common
Shares Repurchased
under Announced
Programs(1) | | Weighted
Average
Per Share
Price | | | | Remaining Buyback Authority
under Announced Programs (2) | | (Dollars in millions, except per share information; shares in thousands) | | | | | | Amounts | | Shares | Three months ended March 31, 2006 | | 88,450 | | $ | 46.02 | | | | $ | 5,847 | | 65,738 | Three months ended June 30, 2006 | | 83,050 | | | 48.16 | | | | | 11,169 | | 182,688 | Three months ended September 30, 2006 | | 59,500 | | | 51.51 | | | | | 8,104 | | 123,188 | October 1-31, 2006 | | 16,000 | | | 53.82 | | | | | 7,243 | | 107,188 | November 1-30, 2006 | | 22,100 | | | 54.33 | | | | | 6,042 | | 85,088 | December 1-31, 2006 | | 22,000 | | | 53.16 | | | | | 4,873 | | 63,088 | Three months ended December 31, 2006 | | 60,100 | | | 53.77 | | | | | | | | Year ended December 31, 2006 | | 291,100 | | | 49.35 | | | | | | | | | | | | | | | | Number of Common
Shares Repurchased
under Announced
Programs(3) | | Weighted
Average
Per Share
Price | | | | Remaining Buyback Authority
under Announced Programs(2) | | (Dollars in millions, except per share information; shares in thousands) | | | | | | Amounts | | Shares | Three months ended March 31, 2005 | | 43,214 | | $ | 46.05 | | | | $ | 14,688 | | 237,411 | Three months ended June 30, 2005 | | 40,300 | | | 45.38 | | | | | 11,865 | | 197,111 | Three months ended September 30, 2005 | | 10,673 | | | 43.32 | | | | | 11,403 | | 186,438 | October 1-31, 2005 | | — | | | — | | | | | 11,403 | | 186,438 | November 1-30, 2005 | | 11,550 | | | 45.38 | | | | | 10,879 | | 174,888 | December 1-31, 2005 | | 20,700 | | | 46.42 | | | | | 9,918 | | 154,188 | Three months ended December 31, 2005 | �� | 32,250 | | | 46.05 | | | | | | | | Year ended December 31, 2005 | | 126,437 | | | 45.61 | | | | | | | | | | | | | | | | Number of Common
Shares Repurchased
under Announced
Programs(4) | | Weighted
Average
Per Share
Price | | | | Remaining Buyback Authority
under Announced Programs(2) | | (Dollars in millions, except per share information; shares in thousands) | | | | | | Amounts | | Shares | Three months ended March 31, 2004 | | 24,306 | | $ | 40.03 | | | | $ | 12,378 | | 204,178 | Three months ended June 30, 2004 | | 49,060 | | | 41.07 | | | | | 7,978 | | 155,118 | Three months ended September 30, 2004 | | 40,430 | | | 43.56 | | | | | 6,217 | | 114,688 | October 1-31, 2004 | | 16,102 | | | 44.24 | | | | | 5,505 | | 98,586 | November 1-30, 2004 | | 11,673 | | | 45.84 | | | | | 4,969 | | 86,913 | December 1-31, 2004 | | 6,288 | | | 46.32 | | | | | 4,678 | | 80,625 | Three months ended December 31, 2004 | | 34,063 | | | 45.17 | | | | | | | | Year ended December 31, 2004 | | 147,859 | | | 42.52 | | | | | | | |
(1) | Reduced Shareholders’ Equity by $14.4 billion and increased diluted earnings per common share by $0.10 in 2006. These repurchases were partially offset by the issuance of approximately 118.4 million shares of common stock under employee plans, which increased Shareholders’ Equity by $4.8 billion, net of $39 million of deferred compensation related to restricted stock awards, and decreased diluted earnings per common share by $0.05 in 2006. |
(2) | On April 26, 2006, our Board of Directors (the Board) authorized a stock repurchase program of up to 200 million shares of the Corporation’s common stock at an aggregate cost not to exceed $12.0 billion and to be completed within a period of 12 to 18 months. On March 22, 2005, the Board authorized a stock repurchase program of up to 200 million shares of the Corporation’s common stock at an aggregate cost not to exceed $12.0 billion and to be completed within a period of 18 months. This repurchase plan was completed during the second quarter of 2006. On January 28, 2004, the Board authorized a stock repurchase program of up to 180 million shares of the Corporation’s common stock at an aggregate cost not to exceed $9.0 billion. This repurchase plan was completed during the second quarter of 2005. On January 22, 2003, the Board authorized a stock repurchase program of up to 260 million shares of the Corporation’s common stock at an aggregate cost of $12.5 billion. This repurchase plan was completed during the second quarter of 2004. |
(3) | Reduced Shareholders’ Equity by $5.8 billion and increased diluted earnings per common share by $0.05 in 2005. These repurchases were partially offset by the issuance of approximately 79.6 million shares of common stock under employee plans, which increased Shareholders’ Equity by $3.1 billion, net of $145 million of deferred compensation related to restricted stock awards, and decreased diluted earnings per common share by $0.04 in 2005. |
(2)(4) | | On January 28, 2004, the Board authorized a stock repurchase program of up to 180 million shares of the Corporation’s common stock at an aggregate cost not to exceed $9.0 billion. This repurchase plan was completed during the third quarter of 2005. On March 22, 2005, the Board authorized an additional stock repurchase program of up to 200 million shares of the Corporation’s common stock at an aggregate cost not to exceed $12.0 billion and to be completed within a period of 18 months. |
(3) | | Reduced Shareholders’ Equity by $6.3 billion and increased diluted earnings per common share by $0.06 in 2004. These repurchases were partially offset by the issuance of approximately 121121.1 million shares of common stock under employee plans, which increased Shareholders’ Equity by $3.9 billion, net of $127 million of deferred compensation related to restricted stock awards, and decreased diluted earnings per common share by $0.06 in 2004. |
(4) | | On January 22, 2003, the Board authorized a stock repurchase program of up to 260 million shares of the Corporation’s common stock at an aggregate cost of $12.5 billion. This repurchase plan was completed during the second quarter of 2004. On January 28, 2004, the Board authorized a stock repurchase program of up to 180 million shares of the Corporation’s common stock at an aggregate cost not to exceed $9.0 billion. This repurchase plan was completed during the third quarter of 2005. |
(5) | | Reduced Shareholders’ Equity by $9.8 billion and increased diluted earnings per common share by $0.11 in 2003. These repurchases were partially offset by the issuance of approximately 139 million shares of common stock under employee plans, which increased Shareholders’ Equity by $4.2 billion, net of $123 million of deferred compensation related to restricted stock awards, and decreased diluted earnings per common share by $0.08 in 2003. |
(6) | | On December 11, 2001, the Board authorized a stock repurchase program of up to 260 million shares of the Corporation’s common stock at an aggregate cost of up to $10.0 billion. This repurchase plan was completed during the second quarter of 2003. On January 22, 2003, the Board authorized a stock repurchase program of up to 260 million shares of the Corporation’s common stock at an aggregate cost of $12.5 billion. This repurchase plan was completed during the second quarter of 2004. |
BANK OF AMERICA CORPORATION AND SUBSIDIARIES
Notes to Consolidated Financial Statements—(Continued)
The Corporation will continue to repurchase shares, from time to time, in the open market or in private transactions through the Corporation’s approved repurchase programs.program. The Corporation expects to continue to repurchase a number of shares of common stock at least equal to any shares issued under the Corporation’s employee stock plans. Effective for the third quarter dividend, the Board increased the quarterly cash dividend on common stock from $0.50 to $0.56. In October 2006, the Board declared a fourth quarter cash dividend, which was paid on December 22, 2006 to common shareholders of record on December 1, 2006. At December 31, 2005,
In November 2006, the Corporation had 690,000authorized 85,100 shares authorized and 382,450issued 81,000 shares, or $96 million, outstanding$2.0 billion, of Bank of America Corporation Floating Rate Non-Cumulative Preferred Stock, Series E (Series E Preferred Stock) with a par value of $0.01 per share. Ownership is held in the form of depositary shares, each representing a 1/1,000th interest in a share of Series E Preferred Stock, paying a quarterly cash dividend on the liquidation preference of $25,000 per share of Series E Preferred Stock at an annual rate equal to the greater of (a) three-month LIBOR plus 0.35 percent and (b) 4.00 percent, payable quarterly in arrears. On any dividend date on or after November 15, 2011, the Corporation may redeem Series E Preferred Stock, in whole or in part, at its option, at $25,000 per share, plus accrued and unpaid dividends. In September 2006, the Corporation authorized 34,500 shares and issued 33,000 shares, or $825 million, of Bank of America Corporation 6.204% Non-Cumulative Preferred Stock, Series D (Series D Preferred Stock) with a par value of $0.01 per share. Ownership is held in the form of depositary shares, each representing a 1/1,000th interest in a share of Series D Preferred Stock, paying a quarterly cash dividend on the liquidation preference of $25,000 per share of Series D Preferred Stock at an annual rate of 6.204 percent. On any dividend date on or after September 14, 2011, the Corporation may redeem Series D Preferred Stock, in whole or in part, at its option, at $25,000 per share, plus accrued and unpaid dividends. Series E Preferred Stock and Series D Preferred Stock (these Series) shares are not subject to the operations of a sinking fund, have no participation rights and are not convertible. The holders of these Series have no general voting rights. If any quarterly dividend payable on these Series is in arrears for six or more quarterly dividend periods (whether consecutive or not), the holders of these Series and any other class or series of preferred stock ranking equally as to payment of dividends and upon which equivalent voting rights have been conferred and are exercisable (voting as a single class) will be entitled to vote for the election of two additional directors. These voting rights terminate when the Corporation has paid in full dividends on these Series for at least four quarterly dividend periods following the dividend arrearage. During October 2006, the Board declared a $0.38775 regular cash dividend on the Series D Preferred Stock. The dividend was payable December 14, 2006, to shareholders of record on November 30, 2006. On July 14, 2006, the Corporation redeemed its 6.75% Perpetual Preferred Stock with a stated value of $250 per share. Ownership is held inThe 382,450 shares, or $96 million, outstanding of preferred stock were redeemed at the formstated value of depositary shares paying dividends quarterly at an annual rate of 6.75 percent. On or after April 15, 2006, the Corporation may redeem Bank of America 6.75% Perpetual Preferred Stock, in whole or in part, at its option, at $250 per share, plus accrued and unpaid dividends. TheOn July 3, 2006, the Corporation also had 805,000 shares authorized and 700,000 shares, or $175 million, outstanding of Bank of Americaredeemed its Fixed/Adjustable Rate Cumulative Preferred Stock with a stated value of $250 per share. Ownership is held inThe 700,000 shares, or $175 million, outstanding of preferred stock were redeemed at the formstated value of depositary shares paying dividends quarterly at an annual rate of 6.60 percent through April 1, 2006. After April 1, 2006, the dividend rate on Fixed/Adjustable Rate Cumulative Preferred Stock will be a rate per annum equal to 0.50 percent plus the highest of the Treasury Bill Rate, the Ten Year Constant Maturity Rate, and the Thirty Year Constant Maturity Rate, as each term is defined in BAC’s Amended and Restated Certificate of Designations establishing the Fixed/Adjustable Rate Cumulative Preferred Stock. The applicable rate per annum for any dividend period beginning on or after April 1, 2006 will not be less than 7.00 percent nor greater than 13.00 percent. On or after April 1, 2006, the Corporation may redeem Bank of America Fixed/Adjustable Rate Cumulative Preferred Stock, in whole or in part, at its option, at $250 per share, plus accrued and unpaid dividends.
In addition to the preferred stock described above, the Corporation had 35,045 shares authorized and 7,739 shares, or $1 million, outstanding of the Series B Preferred Stock with a stated value of $100 per share paying dividends quarterly at an annual rate of 7.00 percent. The Corporation may redeem the Series B Preferred Stock, in whole or in part, at its option, at $100 per share, plus accrued and unpaid dividends. All preferred stock outstanding has preference over our common stock with respect to the payment of dividends and distribution of our assets in the event of a liquidation or dissolution. Except in certain circumstances, the holders of preferred stock have no voting rights. The following table presents the changes in Accumulated OCI for 2006, 2005, and 2004.2004, net of tax. | | | | | | | | | | | | | | | | | | (Dollars in millions)(1) | | Securities
| | | Derivatives(2)
| | | Other
| | | Total
| | Balance, December 31, 2003 (Restated) | | $ | (70 | ) | | $ | (2,094 | ) | | $ | (270 | ) | | $ | (2,434 | ) | Net change in fair value recorded in Accumulated OCI | | | 1,088 | | | | (294 | ) | | | (18 | ) | | | 776 | | Less: Net gains (losses) reclassified into earnings(3) | | | 1,215 | | | | (109 | ) | | | — | | | | 1,106 | | | | |
|
|
| |
|
|
| |
|
|
| |
|
|
| Balance, December 31, 2004 (Restated) | | | (197 | ) | | | (2,279 | ) | | | (288 | ) | | | (2,764 | ) | | | |
|
|
| |
|
|
| |
|
|
| |
|
|
| Net change in fair value recorded in Accumulated OCI | | | (1,907 | ) | | | (2,225 | ) | | | 48 | | | | (4,084 | ) | Less: Net gains (losses) reclassified into earnings(3) | | | 874 | | | | (166 | ) | | | — | | | | 708 | | | | |
|
|
| |
|
|
| |
|
|
| |
|
|
| Balance, December 31, 2005 | | $ | (2,978 | ) | | $ | (4,338 | ) | | $ | (240 | ) | | $ | (7,556 | ) | | | |
|
|
| |
|
|
| |
|
|
| |
|
|
|
| | | | | | | | | | | | | | | | | | (Dollars in millions) | | Securities (1,2) | | | Derivatives (3) | | | Other (4) | | | Total | | Balance, December 31, 2003 | | $ | (70 | ) | | $ | (2,094 | ) | | $ | (270 | ) | | $ | (2,434 | ) | Net change in fair value recorded in Accumulated OCI | | | 1,088 | | | | (294 | ) | | | (18 | ) | | | 776 | | Net realized (gains) losses reclassified into earnings(5) | | | (1,215 | ) | | | 109 | | | | — | | | | (1,106 | ) | Balance, December 31, 2004 | | | (197 | ) | | | (2,279 | ) | | | (288 | ) | | | (2,764 | ) | Net change in fair value recorded in Accumulated OCI | | | (1,907 | ) | | | (2,225 | ) | | | 48 | | | | (4,084 | ) | Net realized (gains) losses reclassified into earnings(5) | | | (874 | ) | | | 166 | | | | — | | | | (708 | ) | Balance, December 31, 2005 | | | (2,978 | ) | | | (4,338 | ) | | | (240 | ) | | | (7,556 | ) | Net change in fair value recorded in Accumulated OCI | | | 465 | | | | 534 | | | | (1,091 | ) | | | (92 | ) | Net realized (gains) losses reclassified into earnings(5) | | | (220 | ) | | | 107 | | | | 50 | | | | (63 | ) | Balance, December 31, 2006 | | $ | (2,733 | ) | | $ | (3,697 | ) | | $ | (1,281 | ) | | $ | (7,711 | ) |
(1) | | Amounts shown are net-of-tax.In 2006, 2005, and 2004, the Corporation reclassified net realized (gains) losses into earnings on the sales of AFS debt securities of $279 million, $(683) million, and $(1.1) billion, respectively, and (gains) losses on the sales of AFS marketable equity securities of $(499) million, $(191) million, and $(129) million, respectively. |
(2) | Accumulated OCI includes fair value gain of $135 million on certain retained interests in the Corporation’s securitization transactions at December 31, 2006. |
(3) | The amount included in Accumulated OCI for terminated derivative contracts was a losswere losses of $3.2 billion and $2.5 billion, net-of-tax, at December 31, 2006 and a gain2005, and gains of $143 million, net-of-tax, at December 31, 2005 and 2004. |
(3)(4) | At December 31, 2006, Accumulated OCI includes the accumulated adjustment to initially apply FASB Statement No. 158 of $(1,428) million. |
(5) | Included in this line item are amounts related to derivatives used in cash flow hedge relationships. These amounts are reclassified into earnings in the same periodyear or periodsyears during which the hedged forecasted transaction affectstransactions affect earnings. This line item also includes gains (losses) on AFS securities. These amounts are reclassified into earnings upon sale of the related security. |
BANK OF AMERICA CORPORATION AND SUBSIDIARIES
Notes to Consolidated Financial Statements—(Continued)
| | Earnings per Common Share |
The calculation of earnings per common share and diluted earnings per common share for 2006, 2005, 2004 and 20032004 is presented below. See Note 1 of the Consolidated Financial Statements for a discussion on the calculation of earnings per common share. | | | | | | | | | | | | | | (Dollars in millions, except per share information; shares in thousands) | | 2005
| | | 2004
(Restated)
| | | 2003
(Restated)
| | Earnings per common share | | | | | | | | | | | | | Net income | | $ | 16,465 | | | $ | 13,947 | | | $ | 10,762 | | Preferred stock dividends | | | (18 | ) | | | (16 | ) | | | (4 | ) | | | |
|
|
| |
|
|
| |
|
|
| Net income available to common shareholders | | $ | 16,447 | | | $ | 13,931 | | | $ | 10,758 | | | | |
|
|
| |
|
|
| |
|
|
| Average common shares issued and outstanding | | | 4,008,688 | | | | 3,758,507 | | | | 2,973,407 | | | | |
|
|
| |
|
|
| |
|
|
| Earnings per common share | | $ | 4.10 | | | $ | 3.71 | | | $ | 3.62 | | | | |
|
|
| |
|
|
| |
|
|
| Diluted earnings per common share | | | | | | | | | | | | | Net income available to common shareholders | | $ | 16,447 | | | $ | 13,931 | | | $ | 10,758 | | Convertible preferred stock dividends | | | — | | | | 2 | | | | 4 | | | | |
|
|
| |
|
|
| |
|
|
| Net income available to common shareholders and assumed conversions | | $ | 16,447 | | | $ | 13,933 | | | $ | 10,762 | | | | |
|
|
| |
|
|
| |
|
|
| Average common shares issued and outstanding | | | 4,008,688 | | | | 3,758,507 | | | | 2,973,407 | | Dilutive potential common shares(1, 2) | | | 59,452 | | | | 65,436 | | | | 56,949 | | | | |
|
|
| |
|
|
| |
|
|
| Total diluted average common shares issued and outstanding | | | 4,068,140 | | | | 3,823,943 | | | | 3,030,356 | | | | |
|
|
| |
|
|
| |
|
|
| Diluted earnings per common share | | $ | 4.04 | | | $ | 3.64 | | | $ | 3.55 | | | | |
|
|
| |
|
|
| |
|
|
|
| | | | | | | | | | | | | | (Dollars in millions, except per share information; shares in thousands) | | 2006 | | | 2005 | | | 2004 | | Earnings per common share | | | | | | | | | | | | | Net income | | $ | 21,133 | | | $ | 16,465 | | | $ | 13,947 | | Preferred stock dividends | | | (22 | ) | | | (18 | ) | | | (16 | ) | Net income available to common shareholders | | $ | 21,111 | | | $ | 16,447 | | | $ | 13,931 | | Average common shares issued and outstanding | | | 4,526,637 | | | | 4,008,688 | | | | 3,758,507 | | Earnings per common share | | $ | 4.66 | | | $ | 4.10 | | | $ | 3.71 | | | | | | Diluted earnings per common share | | | | | | | | | | | | | Net income available to common shareholders | | $ | 21,111 | | | $ | 16,447 | | | $ | 13,931 | | Convertible preferred stock dividends | | | — | | | | — | | | | 2 | | Net income available to common shareholders and assumed conversions | | $ | 21,111 | | | $ | 16,447 | | | $ | 13,933 | | Average common shares issued and outstanding | | | 4,526,637 | | | | 4,008,688 | | | | 3,758,507 | | Dilutive potential common shares(1, 2) | | | 69,259 | | | | 59,452 | | | | 65,436 | | Total diluted average common shares issued and outstanding | | | 4,595,896 | | | | 4,068,140 | | | | 3,823,943 | | Diluted earnings per common share | | $ | 4.59 | | | $ | 4.04 | | | $ | 3.64 | |
(1) | | For 2006, 2005 2004 and 2003,2004, average options to purchase 355 thousand, 39 million 62 million and 3462 million shares, respectively, were outstanding but not included in the computation of earnings per common share because they were antidilutive. |
(2) | | Includes incremental shares from assumed conversions of convertible preferred stock, restricted stock units, restricted stock shares and stock options. |
Effective for the third quarter dividend, the Board increased the quarterly cash dividend 11 percent from $0.45 to $0.50 per common share. In October 2005, the Board declared a fourth quarter cash dividend which was paid on December 23, 2005 to common shareholders of record on December 2, 2005. In January 2006, the Board declared a quarterly cash dividend of $0.50 per common share payable on March 24, 2006 to shareholders of record on March 3, 2006.
Note 15—Regulatory Requirements and Restrictions
| | NOTE 15 – Regulatory Requirements and Restrictions |
The Board of Governors of the Federal Reserve System (FRB) requires the Corporation’s banking subsidiaries to maintain reserve balances based on a percentage of certain deposits. Average daily reserve balances required by the FRB were $5.6 billion and $6.4 billion for 2006 and $6.3 billion for 2005 and 2004.2005. Currency and coin residing in branches and cash vaults (vault cash) are used to partially satisfy the reserve requirement. The average daily reserve balances, in excess of vault cash, held with the Federal Reserve BankFRB amounted to $27 million and $361 million for 2006 and $627 million for 2005 and 2004. 2005. The primary source of funds for cash distributions by the Corporation to its shareholders is dividends received from its banking subsidiaries.subsidiaries Bank of America, N.A., and FIA Card Services, N.A. Effective June 10, 2006, MBNA America Bank, N.A. was renamed FIA Card Services, N.A. Additionally, on October 20, 2006, Bank of America, N.A. (USA) and Fleet National Bank declared and paid dividends of $7.4 billion, $1.9 billion and $750 million, respectively, for 2005 to the parent. On June 13, 2005, Fleet National Bank merged with and into Bank of America,FIA Card Services, N.A., with Bank of America, N.A. as the surviving entity. In 2006, Bank of America N.A. andCorporation received $16.0 billion in dividends from its banking subsidiaries. In 2007, Bank of America, N.A. (USA)and FIA Card Services, N.A. can declare and pay dividends to the parentBank of $12.1America Corporation of $11.4 billion and $879$356 million plus an additional amount equal to itstheir net profits for 2006,2007, as defined by statute, up to the date of any such dividend declaration. The other subsidiary national banks can initiate aggregate dividend payments in 20062007 of $44$68 million plus an additional amount equal to their net profits for 2006,2007, as defined by statute, up to the date of any such dividend declaration. The amount of dividends that each subsidiary bank may declare in a calendar year without approval by the OCCOffice of the Comptroller of the Currency (OCC) is the subsidiary bank’s net profits for that year combined with its net retained profits, as defined, for the preceding two years. The FRB, the OCC and the Federal Deposit Insurance Corporation (collectively, the Agencies) have issued regulatory capital guidelines for U.S. banking organizations. Failure to meet the capital requirements can initiate certain mandatory and discretionary actions by regulators that could have a material effect on the Corporation’s financial statements. At December 31, 20052006, the Corporation, Bank of America, N.A. and 2004,FIA Card Services, N.A. were classified as “well-capitalized” under this regulatory framework. At December 31, 2005, the Corporation, Bank of America N.A. and Bank of America, BANK OF AMERICA CORPORATION AND SUBSIDIARIES
Notes to Consolidated Financial Statements—(Continued)
America. N.A. (USA) were also classified as well-capitalized under this regulatory framework.“well-capitalized.” There have been no conditions or events since December 31, 20052006 that management believes have changed the Corporation’s, Bank of America, N.A.’s and Bank of America,FIA Card Services, N.A. (USA)’s capital classifications. The regulatory capital guidelines measure capital in relation to the credit and market risks of both on and off-balance sheet items using various risk weights. Under the regulatory capital guidelines, Total Capital consists of three tiers of capital. Tier 1 Capital includes Common Shareholders’ Equity, Trust Securities, minority interests and qualifying Preferred Stock, less Goodwill and other adjustments. Tier 2 Capital consists of Preferred Stock not qualifying as Tier 1 Capital, mandatory convertible debt, limited amounts of subordinated debt, other qualifying term debt, the allowance for credit losses up to 1.25 percent of risk-weighted assets and other adjustments. Tier 3 Capital includes subordinated debt that is unsecured, fully paid, has an original maturity of at least two years, is not redeemable before maturity without prior approval by the FRB and includes a lock-in clause precluding payment of either interest or principal if the payment would cause the issuing bank’s risk-based capital ratio to fall or remain below the required minimum. Tier 3 Capital can only be used to satisfy the Corporation’s market risk capital requirement and may not be used to support its credit risk requirement. At December 31, 20052006 and 2004,2005, the Corporation had no subordinated debt that qualified as Tier 3 Capital. Certain corporate sponsored trust companies which issue trust preferred securities (Trust Securities)Trust Securities are not consolidated under FIN 46R. As a result, the Trust Securities are not included on our Consolidated Balance Sheets.Sheet. On March 1, 2005, the FRB issued Risk-Based Capital Standards: Trust Preferred Securities and the Definition of Capital (the Final Rule) which allows Trust Securities to continue to qualify as Tier 1 Capital with revised quantitative limits that would be effective after a five-year transition period. As a result, Trust Securities are included in Tier 1 Capital. The FRB’s Final Rule limits restricted core capital elements to 15 percent for internationally active bank holding companies. Internationally active bank holding companies are those with consolidated assets greater than $250 billion or on-balance sheet exposure greater than $10 billion. At December 31, 2005, our restricted core capital elements comprised 16.6 percent of total core capital elements. In addition, the FRB revised the qualitative standards for capital instruments included in regulatory capital. At December 31, 2006, our restricted core capital elements comprised 17.3 percent of total core capital elements. We expect to be fully compliant with the revised limits prior to the implementation date of March 31, 2009. On July 28, 2004, the FRB and other regulatory agencies issued the Final Capital Rule for Consolidated Asset-backed Commercial Paper Program Assets (the Final Rule). The Final Rule allows companies to exclude from risk-weighted assets, the assets of consolidated asset-backed commercial paper (ABCP) conduits when calculating Tier 1 and Total Risk-based Capital ratios. The Final Rule also requires that liquidity commitments provided by the Corporation to ABCP conduits, whether consolidated or not, be included in the capital calculations. The Final Rule was effective September 30, 2004. There was no material impact to Tier 1 and Total Risk-based Capital as a result of the adoption of this rule.
To meet minimum, adequately-capitalized regulatory requirements, an institution must maintain a Tier 1 Capital ratio of four percent and a Total Capital ratio of eight percent. A well-capitalized institution must generally maintain capital ratios 200 bps higher than the minimum guidelines. The risk-based capital rules have been further supplemented by a leverage ratio, defined as Tier 1 Capital divided by adjusted quarterly average Total Assets, after certain adjustments. The leverage ratio guidelines establish a minimum of three percent. Banking organizations must maintain a leverage capital ratio of at least five percent to be classified as well-capitalized.“well-capitalized.” As of December 31, 2005,2006, the Corporation was classified as well-capitalized“well-capitalized” for regulatory purposes, the highest classification. Net Unrealized Gains (Losses) on AFS Debt Securities, Net Unrealized Gains on AFS Marketable Equity Securities, and the Net Unrealized Gains (Losses) on Derivatives, and the impact of SFAS No. 158 included in Shareholders’ Equity at December 31, 20052006 and 2004,2005, are excluded from the calculations of Tier 1 Capital and leverage ratios. The Total Capital ratio excludes all of the above with the exception of up to 45 percent of Net Unrealized Gains on AFS Marketable Equity Securities. | | Regulatory Capital Developments |
Regulatory Capital Developments
In June 2004,On September 25, 2006, the Agencies officially published updates specific to U.S. market implementation of the risk-based capital rules originally published by the Basel Committee onof Banking Supervision issued a new set of risk-based capital standards (Basel II) with the intent of more closely aligning regulatory capital requirements with underlying risk. In August 2003, the U.S. regulatory agencies drafted the Advanced Notice of Proposed Rulemaking to establish a comparable rule for large U.S. financial institutions. The final rule, which is expected to be issued during the second quarter of 2006, will provide us within June 2004. These updates provided clarification asand additional guidance related to the requirements under U.S. regulations.
rules and their implementation, as well as started an official comment period, which was subsequently extended in December 2006 for an additional 90 days. Several of our international units will begin implementinghave begun local parallel implementation reporting Basel II locallyratios to their host countries during 2006, with full implementation byexpected during 2007. U.S. regulatory agencies have delayed implementation of Basel II forWith the consolidated entity until 2008. During BANK OF AMERICA CORPORATION AND SUBSIDIARIES
Notesrecently published updates, revised market risk rules are scheduled to Consolidated Financial Statements—(Continued)
be fully implemented in 2008, we will operate inwhile credit and operational risk rules are subject to a parallel test period, supervisory approval and subsequent implementation. During the parallel testing environment, where current regulatory capital measures will be utilized simultaneously with the new rules. However, in 2009 and until at least 2011,During the three-year implementation period, the U.S. is expected towill impose floors (limits) on capital reductions when compared to current measures. Regulatory Capital | | | | | | | | | | | | | | | | | | | | | | December 31
| | | | 2005
| | 2004
| | | | | | (Restated)
| | | | Actual
| | Minimum Required(1)
| | Actual
| | Minimum Required(1)
| | (Dollars in millions) | | Ratio
| | | Amount
| | | Ratio
| | | Amount
| | Risk-based capital | | | | | | | | | | | | | | | | | | | Tier 1 | | | | | | | | | | | | | | | | | | | Bank of America Corporation | | 8.25 | % | | $ | 74,375 | | $ | 36,059 | | 8.20 | % | | $ | 65,049 | | $ | 31,735 | Bank of America, N.A. | | 8.70 | | | | 69,547 | | | 31,987 | | 8.23 | | | | 46,546 | | | 22,628 | Fleet National Bank(2) | | — | | | | — | | | — | | 10.10 | | | | 14,741 | | | 5,837 | Bank of America, N.A. (USA) | | 8.66 | | | | 5,567 | | | 2,570 | | 8.54 | | | | 3,879 | | | 1,817 | Total | | | | | | | | | | | | | | | | | | | Bank of America Corporation | | 11.08 | | | | 99,901 | | | 72,118 | | 11.73 | | | | 93,034 | | | 63,470 | Bank of America, N.A. | | 10.73 | | | | 85,773 | | | 63,973 | | 10.27 | | | | 58,079 | | | 45,255 | Fleet National Bank(2) | | — | | | | — | | | — | | 13.32 | | | | 19,430 | | | 11,673 | Bank of America, N.A. (USA) | | 11.46 | | | | 7,361 | | | 5,140 | | 11.93 | | | | 5,418 | | | 3,634 | Leverage | | | | | | | | | | | | | | | | | | | Bank of America Corporation | | 5.91 | | | | 74,375 | | | 37,732 | | 5.89 | | | | 65,049 | | | 33,141 | Bank of America, N.A. | | 6.69 | | | | 69,547 | | | 31,192 | | 6.22 | | | | 46,546 | | | 22,444 | Fleet National Bank(2) | | — | | | | — | | | — | | 8.15 | | | | 14,741 | | | 5,427 | Bank of America, N.A. (USA) | | 9.37 | | | | 5,567 | | | 1,783 | | 9.19 | | | | 3,879 | | | 1,266 |
| | | | | | | | | | | | | | | | | | | | December 31 | | | | 2006 | | | | 2005 | | | | Actual | | Minimum Required (1) | | | | Actual | | Minimum Required (1) | | (Dollars in millions) | | Ratio | | | Amount | | | | Ratio | | | Amount | | Risk-based capital | | | | | | | | | | | | | | | | | Tier 1 | | | | | | | | | | | | | | | | | Bank of America Corporation | | 8.64 | % | | $91,064 | | $42,181 | | | | 8.25 | % | | $74,375 | | $36,059 | Bank of America, N.A. | | 8.89 | | | 76,174 | | 34,264 | | | | 8.70 | | | 69,547 | | 31,987 | FIA Card Services, N.A. (2) | | 14.08 | | | 19,562 | | 5,558 | | | | — | | | — | | — | Bank of America, N.A. (USA) (3) | | — | | | — | | — | | | | 8.66 | | | 5,567 | | 2,570 | | | | | | | | | Total | | | | | | | | | | | | | | | | | Bank of America Corporation | | 11.88 | | | 125,226 | | 84,363 | | | | 11.08 | | | 99,901 | | 72,118 | Bank of America, N.A. | | 11.19 | | | 95,867 | | 68,529 | | | | 10.73 | | | 85,773 | | 63,973 | FIA Card Services, N.A. (2) | | 17.02 | | | 23,648 | | 11,117 | | | | — | | | — | | — | Bank of America, N.A. (USA) (3) | | — | | | — | | — | | | | 11.46 | | | 7,361 | | 5,140 | | | | | | | | | Tier 1 Leverage | | | | | | | | | | | | | | | | | Bank of America Corporation | | 6.36 | | | 91,064 | | 42,935 | | | | 5.91 | | | 74,375 | | 37,732 | Bank of America, N.A. | | 6.63 | | | 76,174 | | 34,487 | | | | 6.69 | | | 69,547 | | 31,192 | FIA Card Services, N.A. (2) | | 16.88 | | | 19,562 | | 3,478 | | | | — | | | — | | — | Bank of America, N.A. (USA) (3) | | — | | | — | | — | | | | 9.37 | | | 5,567 | | 1,783 |
(1) | | Dollar amount required to meet guidelines for adequately capitalized institutions. |
(2) | FIA Card Services, N.A. is presented for periods subsequent to December 31, 2005. |
(3) | On June 13, 2005, Fleet National Bank merged with and into Bank of America, N.A., with Bank of America, N.A. as the surviving entity.(USA) merged into FIA Card Services, N.A. on October 20, 2006. |
| | NOTE 16 – Employee Benefit Plans |
Note 16—Employee Benefit Plans
Pension and Postretirement Plans
| | Pension and Postretirement Plans |
The Corporation sponsors noncontributory trusteed qualified pension plans that cover substantially all officers and employees. The plans provide defined benefits based on an employee’s compensation, age and years of service. The Bank of America Pension Plan (the Pension Plan) provides participants with compensation credits, based on age and years of service. The Pension Plan allows participants to select from various earnings measures, which are based on the returns of certain funds or common stock of the Corporation. The participant-selected earnings measures determine the earnings rate on the individual participant account balances in the Pension Plan. Participants may elect to modify earnings measure allocations on a periodic basis subject to the provisions of the Pension Plan. The benefits become vested upon completion of five years of service. It is the policy of the Corporation to fund not less than the minimum funding amount required by ERISA. The Pension Plan has a balance guarantee feature, applied at the time a benefit payment is made from the plan, that protects participant balances transferred and certain compensation credits from future market downturns. The Corporation is responsible for funding any shortfall on the guarantee feature. As a result of recent mergers, the Corporation assumed the obligations related to the pension plans of former FleetBoston and MBNA. The Bank of America Pension Plan for Legacy Fleet (the Fleet Pension Plan) is substantially similar to the Bank of America Plan discussed above; however, the Fleet Pension Plan does not allow participants to select various earnings measures; rather the earnings rate is based on a benchmark rate. The Bank of America Pension Plan for Legacy MBNA (the MBNA Pension Plan) retirement benefits are based on the number of years of benefit service and a percentage of the participant’s average annual compensation during the five highest paid consecutive years of their last ten years of employment. The Corporation sponsors a number of noncontributory, nonqualified pension plans. As a result of mergers, the Corporation assumed the obligations related to the noncontributory, nonqualified pension plans of former FleetBoston and MBNA. These plans, which are unfunded, provide defined pension benefits to certain employees. In addition to retirement pension benefits, full-time, salaried employees and certain part-time employees may become eligible to continue participation as retirees in health care and/or life insurance plans sponsored by the Corporation. Based on the other provisions of the individual plans, certain retirees may also have the cost of these benefits partially paid by the Corporation. As The obligations assumed as a result of the merger with FleetBoston Merger, the Corporation assumed the obligations related to the plans of former FleetBoston. These plans are substantially similar to the legacy Bank of America plans discussed above, however, the
Corporation’s Postretirement Health and Life Plans. The MBNA Postretirement Health and Life Plan provides certain health care and life insurance benefits for a closed group upon early retirement.BANK OF AMERICA CORPORATION AND SUBSIDIARIES
Notes to Consolidated Financial Statements—(Continued)
FleetBoston Financial Pension Plan does not allow participants to select various earnings measures; rather the earnings rate is based on a benchmark rate. The tables within this Note include the information related to thesethe MBNA plans described above beginning onJanuary 1, 2006 and the FleetBoston plans beginning April 1, 2004.
On December 31, 2006, the Corporation adopted SFAS 158 which requires the recognition of a plan’s over-funded or under-funded status as an asset or liability with an offsetting adjustment to Accumulated OCI. SFAS 158 requires the determination of the fair values of a plan’s assets at a company’s year-end and recognition of actuarial gains and losses, prior service costs or credits, and transition assets or obligations as a component of Accumulated OCI. These amounts were previously netted against the plans’ funded status in the Corporation’s Consolidated Balance Sheet pursuant to the provisions of SFAS 87. These amounts will be subsequently recognized as components of net periodic benefit costs. Further, actuarial gains and losses that arise in subsequent periods that are not initially recognized as a component of net periodic benefit cost will be recognized as a component of Accumulated OCI. Those amounts will subsequently be recognized as a component of net periodic benefit cost as they are amortized during future periods. Reflected
The incremental effects of adopting the provisions of SFAS 158 on the Corporation’s Consolidated Balance Sheet at December 31, 2006 are presented in these resultsthe following table. The adoption of SFAS 158 had no effect on the Corporation’s Consolidated Statement of Income for the year ended December 31, 2006, or for any year presented. | | | | | | | | | | | | | | (Dollars in millions) | | Before
Application of
Statement 158 | | | Adjustments | | | After
Application of
Statement 158 | | Other assets(1) | | $ | 121,649 | | | $ | (1,966 | ) | | $ | 119,683 | | Total assets | | | 1,461,703 | | | | (1,966 | ) | | | 1,459,737 | | Accrued expenses and other liabilities(2) | | | 42,790 | | | | (658 | ) | | | 42,132 | | Total liabilities | | | 1,325,123 | | | | (658 | ) | | | 1,324,465 | | Accumulated OCI(3) | | | (6,403 | ) | | | (1,308 | ) | | | (7,711 | ) | Total shareholders’ equity | | | 136,580 | | | | (1,308 | ) | | | 135,272 | | Total liabilities and shareholders’ equity | | | 1,461,703 | | | | (1,966 | ) | | | 1,459,737 | |
(1) | Represents adjustments to plans in an asset position of $(1,966) million. |
(2) | Represents adjustments to plans in a liability position of $301 million, the reversal of the additional minimum liability adjustment of $(190) million and an adjustment to deferred tax liabilities of $(769) million. |
(3) | Includes employee benefit plan adjustments of $(1,428) million, net of tax, and the reversal of the additional minimum liability adjustment of $120 million, net of tax. |
Amounts included in Accumulated OCI (pre-tax) at December 31, 2006 were as follows: | | | | | | | | | | | | | | | | (Dollars in millions) | | Qualified
Pension Plans | | Nonqualified
Pension Plans | | | Postretirement
Health and Life
Plans | | | Total | Net actuarial loss | | $ | 1,765 | | $ | 224 | | | $ | (68 | ) | | $ | 1,921 | Transition obligation | | | — | | | — | | | | 189 | | | | 189 | Prior service cost | | | 201 | | | (44 | ) | | | — | | | | 157 | Amount recognized in Accumulated OCI(1) | | $ | 1,966 | | $ | 180 | | | $ | 121 | | | $ | 2,267 |
(1) | Amount recognized in Accumulated OCI net-of-tax is $1,428 million. |
The estimated net actuarial loss and prior service cost for the Qualified Pension Plans that will be amortized from Accumulated OCI, (pre-tax), into net periodic benefit cost during 2007 are key changes to$130 million and $46 million. The estimated net actuarial loss and prior service cost for the Nonqualified Pension Plans that will be amortized from Accumulated OCI, (pre-tax), into net periodic benefit cost during 2007 are $19 million and $(8) million. The estimated net actuarial loss and transition obligation for the Postretirement Health and Life Plans and the Nonqualified Pension Plans. On December 8, 2003, the President signed the Medicare Actthat will be amortized from Accumulated OCI, (pre-tax), into law. The Medicare Act introduces a voluntary prescription drug benefit under Medicare as well as a federal subsidy to sponsors of retiree health care plans that provide at least an actuarially equivalent benefit. In the third quarter of 2004, the Corporation adopted FSP No. 106-2, which resulted in a reduction of $53 million in the Corporation’s accumulated postretirement benefit obligation. In addition, the Corporation’s net periodic benefit cost for other postretirement benefits was decreased by $15during 2007 is $(22) million for 2004 as a result of the remeasurement.and $31 million. BANK OF AMERICA CORPORATION AND SUBSIDIARIES
Notes to Consolidated Financial Statements—(Continued)
The following table summarizes the changes in the fair value of plan assets, changes in the projected benefit obligation (PBO), the funded status of both the accumulated benefit obligation (ABO) and the PBO, and the weighted average assumptions used to determine benefit obligations for the pension plans and postretirement plans at December 31, 20052006 and 2004. Prepaid2005. Amounts recognized at December 31, 2006 and accrued benefit costs2005 are reflected in Other Assets, and Accrued Expenses and Other Liabilities on the Consolidated Balance Sheet. The discount rate assumption is based on a cash flow matching technique and this assumption is subject to change each year. This technique utilizes a yield curve based upon Moody’s Aa rated corporate bonds with cash flows that match estimated benefit payments to produce the discount rate assumption. For the Pension Plan, the FleetBoston Pension Plan, and the FleetBostonMBNA Pension Plan, (the Qualified Pension Plans), as well asthe Nonqualified Pension Plans, and the Postretirement Health and Life Plans, the discount rate at December 31, 2005,2006, was 5.505.75 percent. For both the Qualified Pension Plans and the Postretirement Health and Life Plans, the expected long-term return on plan assets will beis 8.00 percent for 2006.2007. The expected return on plan assets is determined using the calculated market-related value for the Qualified Pension Plans and the fair value for the Postretirement Health and Life Plans. The asset valuation method for the Qualified Pension Plans recognizes 60 percent of the market gains or losses in the first year, with the remaining 40 percent spread equally over the next four years. | | | | | | | | | | | | | | | | | | | | | | | | | | | | Qualified Pension
Plans(1)
| | | Nonqualified
Pension Plans(1)
| | | Postretirement
Health and Life Plans(1)
| | | (Dollars in millions) | | 2005
| | | 2004
| | | 2005
| | | 2004
| | | 2005
| | | 2004
| | Change in fair value of plan assets | | | | | | | | | | | | | | | | | | | | | | | | | (Primarily listed stocks, fixed income and real estate) | | | | | | | | | | | | | | | | | | | | | | | | | Fair value, January 1 | | $ | 12,153 | | | $ | 8,975 | | | $ | 1 | | | $ | — | | | $ | 166 | | | $ | 156 | | FleetBoston balance, April 1, 2004 | | | — | | | | 2,277 | | | | — | | | | 1 | | | | — | | | | 45 | | Actual return on plan assets | | | 803 | | | | 1,447 | | | | — | | | | — | | | | 11 | | | | 25 | | Company contributions(2) | | | 1,000 | | | | 200 | | | | 118 | | | | 63 | | | | 27 | | | | 40 | | Plan participant contributions | | | — | | | | — | | | | — | | | | — | | | | 98 | | | | 82 | | Benefits paid | | | (859 | ) | | | (746 | ) | | | (118 | ) | | | (63 | ) | | | (176 | ) | | | (182 | ) | | | |
|
|
| |
|
|
| |
|
|
| |
|
|
| |
|
|
| |
|
|
| Fair value, December 31 | | $ | 13,097 | | | $ | 12,153 | | | $ | 1 | | | $ | 1 | | | $ | 126 | | | $ | 166 | | | | |
|
|
| |
|
|
| |
|
|
| |
|
|
| |
|
|
| |
|
|
| Change in projected benefit obligation | | | | | | | | | | | | | | | | | | | | | | | | | Projected benefit obligation, January 1 | | $ | 11,461 | | | $ | 8,428 | | | $ | 1,094 | | | $ | 712 | | | $ | 1,352 | | | $ | 1,127 | | FleetBoston balance, April 1, 2004 | | | — | | | | 2,045 | | | | — | | | | 377 | | | | — | | | | 196 | | Service cost | | | 261 | | | | 257 | | | | 11 | | | | 27 | | | | 11 | | | | 9 | | Interest cost | | | 643 | | | | 623 | | | | 61 | | | | 62 | | | | 78 | | | | 76 | | Plan participant contributions | | | — | | | | — | | | | — | | | | — | | | | 98 | | | | 82 | | Plan amendments | | | (77 | ) | | | 19 | | | | (1 | ) | | | (74 | ) | | | — | | | | (12 | ) | Actuarial loss | | | 261 | | | | 835 | | | | 61 | | | | 53 | | | | 57 | | | | 56 | | Benefits paid | | | (859 | ) | | | (746 | ) | | | (118 | ) | | | (63 | ) | | | (176 | ) | | | (182 | ) | | | |
|
|
| |
|
|
| |
|
|
| |
|
|
| |
|
|
| |
|
|
| Projected benefit obligation, December 31 | | $ | 11,690 | | | $ | 11,461 | | | $ | 1,108 | | | $ | 1,094 | | | $ | 1,420 | | | $ | 1,352 | | | | |
|
|
| |
|
|
| |
|
|
| |
|
|
| |
|
|
| |
|
|
| Funded status, December 31 | | | | | | | | | | | | | | | | | | | | | | | | | Accumulated benefit obligation (ABO) | | $ | 11,383 | | | $ | 11,025 | | | $ | 1,085 | | | $ | 1,080 | | | | n/a | | | | n/a | | Overfunded (unfunded) status of ABO | | | 1,714 | | | | 1,128 | | | | (1,084 | ) | | | (1,079 | ) | | | n/a | | | | n/a | | Provision for future salaries | | | 307 | | | | 436 | | | | 23 | | | | 14 | | | | n/a | | | | n/a | | Projected benefit obligation (PBO) | | | 11,690 | | | | 11,461 | | | | 1,108 | | | | 1,094 | | | | 1,420 | | | $ | 1,352 | | | | |
|
|
| |
|
|
| |
|
|
| |
|
|
| |
|
|
| |
|
|
| Overfunded (unfunded) status of PBO | | $ | 1,407 | | | $ | 692 | | | $ | (1,107 | ) | | $ | (1,093 | ) | | $ | (1,294 | ) | | $ | (1,186 | ) | Unrecognized net actuarial loss | | | 2,621 | | | | 2,364 | | | | 262 | | | | 234 | | | | 92 | | | | 112 | | Unrecognized transition obligation | | | — | | | | — | | | | — | | | | — | | | | 221 | | | | 252 | | Unrecognized prior service cost | | | 209 | | | | 328 | | | | (52 | ) | | | (59 | ) | | | — | | | | — | | | | |
|
|
| |
|
|
| |
|
|
| |
|
|
| |
|
|
| |
|
|
| Prepaid (accrued) benefit cost | | $ | 4,237 | | | $ | 3,384 | | | $ | (897 | ) | | $ | (918 | ) | | $ | (981 | ) | | $ | (822 | ) | | | |
|
|
| |
|
|
| |
|
|
| |
|
|
| |
|
|
| |
|
|
| Weighted average assumptions, December 31 | | | | | | | | | | | | | | | | | | | | | | | | | Discount rate(3) | | | 5.50 | % | | | 5.75 | % | | | 5.50 | % | | | 5.75 | % | | | 5.50 | % | | | 5.75 | % | Expected return on plan assets | | | 8.50 | | | | 8.50 | | | | n/a | | | | n/a | | | | 8.50 | | | | 8.50 | | Rate of compensation increase | | | 4.00 | | | | 4.00 | | | | 4.00 | | | | 4.00 | | | | n/a | | | | n/a | |
| | | | | | | | | | | | | | | | | | | | | | | | | | | | Qualified Pension Plans(1) | | | Nonqualified Pension Plans(1) | | | Postretirement
Health and Life Plans (1) | | | (Dollars in millions) | | 2006 | | | 2005 | | | 2006 | | | 2005 | | | 2006 | | | 2005 | | Change in fair value of plan assets | | | | | | | | | | | | | | | | | | | | | | | | | (Primarily listed stocks, fixed income and real estate) | | | | | | | | | | | | | | | | | | | | | | | | | Fair value, January 1 | | $ | 13,097 | | | $ | 12,153 | | | $ | 1 | | | $ | 1 | | | $ | 126 | | | $ | 166 | | MBNA balance, January 1, 2006 | | | 555 | | | | — | | | | — | | | | — | | | | — | | | | — | | Actual return on plan assets | | | 1,829 | | | | 803 | | | | — | | | | — | | | | 15 | | | | 11 | | Company contributions(2) | | | 2,200 | | | | 1,000 | | | | 321 | | | | 118 | | | | 52 | | | | 27 | | Plan participant contributions | | | — | | | | — | | | | — | | | | — | | | | 98 | | | | 98 | | Benefits paid | | | (888 | ) | | | (859 | ) | | | (322 | ) | | | (118 | ) | | | (213 | ) | | | (176 | ) | Federal subsidy on benefits paid | | | n/a | | | | n/a | | | | n/a | | | | n/a | | | | 12 | | | | n/a | | Fair value, December 31 | | $ | 16,793 | | | $ | 13,097 | | | $ | — | | | $ | 1 | | | $ | 90 | | | $ | 126 | | | | | | | | | Change in projected benefit obligation | | | | | | | | | | | | | | | | | | | | | | | | | Projected benefit obligation, January 1 | | $ | 11,690 | | | $ | 11,461 | | | $ | 1,108 | | | $ | 1,094 | | | $ | 1,420 | | | $ | 1,352 | | MBNA balance, January 1, 2006 | | | 695 | | | | — | | | | 486 | | | | — | | | | 278 | | | | — | | Service cost | | | 306 | | | | 261 | | | | 13 | | | | 11 | | | | 13 | | | | 11 | | Interest cost | | | 676 | | | | 643 | | | | 78 | | | | 61 | | | | 86 | | | | 78 | | Plan participant contributions | | | — | | | | — | | | | — | | | | — | | | | 98 | | | | 98 | | Plan amendments | | | 33 | | | | (77 | ) | | | — | | | | (1 | ) | | | — | | | | — | | Actuarial (gains) losses | | | 168 | | | | 261 | | | | (18 | ) | | | 61 | | | | (145 | ) | | | 57 | | Benefits paid | | | (888 | ) | | | (859 | ) | | | (322 | ) | | | (118 | ) | | | (213 | ) | | | (176 | ) | Federal subsidy on benefits paid | | | n/a | | | | n/a | | | | n/a | | | | n/a | | | | 12 | | | | n/a | | Projected benefit obligation, December 31 | | $ | 12,680 | | | $ | 11,690 | | | $ | 1,345 | | | $ | 1,108 | | | $ | 1,549 | | | $ | 1,420 | | | | | | | | | Funded status, December 31 | | | | | | | | | | | | | | | | | | | | | | | | | Accumulated benefit obligation | | $ | 12,151 | | | $ | 11,383 | | | $ | 1,345 | | | $ | 1,085 | | | | n/a | | | | n/a | | Overfunded (unfunded) status of ABO | | | 4,642 | | | | 1,714 | | | | (1,345 | ) | | | (1,084 | ) | | | n/a | | | | n/a | | Provision for future salaries | | | 529 | | | | 307 | | | | — | | | | 23 | | | | n/a | | | | n/a | | Projected benefit obligation | | | 12,680 | | | | 11,690 | | | | 1,345 | | | | 1,108 | | | | 1,549 | | | | 1,420 | | Overfunded (unfunded) status of PBO | | $ | 4,113 | | | $ | 1,407 | | | $ | (1,345 | ) | | $ | (1,107 | ) | | $ | (1,459 | ) | | $ | (1,294 | ) | Unrecognized net actuarial loss(3) | | | n/a | | | | 2,621 | | | | n/a | | | | 262 | | | | n/a | | | | 92 | | Unrecognized transition obligation (3) | | | n/a | | | | — | | | | n/a | | | | — | | | | n/a | | | | 221 | | Unrecognized prior service cost (3) | | | n/a | | | | 209 | | | | n/a | | | | (52 | ) | | | n/a | | | | — | | Amount recognized, December 31 | | $ | 4,113 | | | $ | 4,237 | | | $ | (1,345 | ) | | $ | (897 | ) | | $ | (1,459 | ) | | $ | (981 | ) | | | | | | | | | | | | | | | | | | | | | | | | | | | Weighted average assumptions, December 31 | | | | | | | | | | | | | | | | | | | | | | | | | Discount rate | | | 5.75 | % | | | 5.50 | % | | | 5.75 | % | | | 5.50 | % | | | 5.75 | % | | | 5.50 | % | Expected return on plan assets | | | 8.00 | | | | 8.50 | | | | n/a | | | | n/a | | | | 8.00 | | | | 8.50 | | Rate of compensation increase | | | 4.00 | | | | 4.00 | | | | 4.00 | | | | 4.00 | | | | n/a | | | | n/a | |
(1) | | The measurement date for the Qualified Pension Plans, Nonqualified Pension Plans, and Postretirement Health and Life Plans was December 31 of eachyeareach year reported. |
(2) | | The Corporation’s best estimate of its contributions to be made to the Qualified Pension Plans, Nonqualified Pension Plans, and Postretirement HealthandHealth and Life Plans in 20062007 is $0, million, $97 million and $37$95 million. |
(3) | Upon the adoption of SFAS 158 on December 31, 2006, unrecognized net actuarial losses, unrecognized transition obligations, and unrecognized prior service costs are now recorded as an adjustment to Accumulated OCI. |
n/a = not applicable Amounts recognized in the Consolidated Financial Statements at December 31, 2006 and 2005 were as follows: | | | | | | | | | | | | | | | December 31, 2006 | | | (Dollars in millions) | | Qualified
Pension Plans | | Nonqualified
Pension Plans | | | Postretirement
Health and Life
Plans | | Other assets | | $ | 4,113 | | $ | — | | | $ | — | | Accrued expenses and other liabilities | | | — | | | (1,345 | ) | | | (1,459 | ) | Net amount recognized at December 31 | | $ | 4,113 | | $ | (1,345 | ) | | $ | (1,459 | ) |
| | | | | | | | | | | | | | | December 31, 2005 | | | (Dollars in millions) | | Qualified
Pension Plans | | Nonqualified
Pension Plans | | | Postretirement
Health and Life
Plans | | Prepaid benefit cost | | $ | 4,237 | | $ | — | | | $ | — | | Accrued benefit cost | | | — | | | (897 | ) | | | (981 | ) | Additional minimum liability | | | — | | | (187 | ) | | | — | | SFAS 87 Accumulated OCI adjustment(1) | | | — | | | 187 | | | | — | | Net amount recognized at December 31 | | $ | 4,237 | | $ | (897 | ) | | $ | (981 | ) |
(1) | Amount recognized in Accumulated OCI net of tax is $118 million. |
Net periodic benefit cost for 2006, 2005 and 2004 included the following components: | | | | | | | | | | | | | | | | | | | | | | | | | | | | | | | | | | | | | | | | Qualified Pension Plans | | | Nonqualified Pension Plans | | | Postretirement Health and Life Plans | | | (Dollars in millions) | | 2006 | | | 2005 | | | 2004 | | | 2006 | | | 2005 | | | 2004 | | | 2006 | | | 2005 | | | 2004 | | Components of net periodic benefit cost | | | | | | | | | | | | | | | | | | | | | | | | | | | | | | | | | | | | | Service cost | | $ | 306 | | | $ | 261 | | | $ | 257 | | | $ | 13 | | | $ | 11 | | | $ | 27 | | | $ | 13 | | | $ | 11 | | | $ | 9 | | Interest cost | | | 676 | | | | 643 | | | | 623 | | | | 78 | | | | 61 | | | | 62 | | | | 86 | | | | 78 | | | | 76 | | Expected return on plan assets | | | (1,034 | ) | | | (983 | ) | | | (915 | ) | | | — | | | | — | | | | — | | | | (10 | ) | | | (14 | ) | | | (16 | ) | Amortization of transition obligation | | | — | | | | — | | | | — | | | | — | | | | — | | | | — | | | | 31 | | | | 31 | | | | 32 | | Amortization of prior service cost (credits) | | | 41 | | | | 44 | | | | 55 | | | | (8 | ) | | | (8 | ) | | | 3 | | | | — | | | | — | | | | 1 | | Recognized net actuarial loss | | | 229 | | | | 182 | | | | 92 | | | | 20 | | | | 24 | | | | 14 | | | | 12 | | | | 80 | | | | 74 | | Recognized loss due to settlements and curtailments | | | — | | | | — | | | | — | | | | — | | | | 9 | | | | — | | | | — | | | | — | | | | — | | Net periodic benefit cost | | $ | 218 | | | $ | 147 | | | $ | 112 | | | $ | 103 | | | $ | 97 | | | $ | 106 | | | $ | 132 | | | $ | 186 | | | $ | 176 | | Weighted average assumptions used to determine net cost for years ended December 31 | | | | | | | | | | | | | | | | | | | | | | | | | | | | | | | | | | | | | Discount rate(1) | | | 5.50 | % | | | 5.75 | % | | | 6.25 | % | | | 5.50 | % | | | 5.75 | % | | | 6.25 | % | | | 5.50 | % | | | 5.75 | % | | | 6.25 | % | Expected return on plan assets | | | 8.00 | | | | 8.50 | | | | 8.50 | | | | n/a | | | | n/a | | | | n/a | | | | 8.00 | | | | 8.50 | | | | 8.50 | | Rate of compensation increase | | | 4.00 | | | | 4.00 | | | | 4.00 | | | | 4.00 | | | | 4.00 | | | | 4.00 | | | | n/a | | | | n/a | | | | n/a | |
(1) | In connection with the FleetBoston Merger, themerger, their plans of former FleetBoston were remeasured on April 1, 2004, using a discount rate of 6.00 percent. |
BANK OF AMERICA CORPORATION AND SUBSIDIARIES
Notes to Consolidated Financial Statements—(Continued)
Amounts recognized in the Consolidated Financial Statements at December 31, 2005 and 2004 were as follows:
| | | | | | | | | | | | | | | | | | | | | | | | | | Qualified Pension
Plans
| | Nonqualified
Pension Plans
| | | Postretirement
Health and Life Plans
| | | (Dollars in millions) | | 2005
| | 2004
| | 2005
| | | 2004
| | | 2005
| | | 2004
| | Prepaid benefit cost | | $ | 4,237 | | $ | 3,384 | | $ | — | | | $ | — | | | $ | — | | | $ | — | | Accrued benefit cost | | | — | | | — | | | (897 | ) | | | (918 | ) | | | (981 | ) | | | (822 | ) | Additional minimum liability | | | — | | | — | | | (187 | ) | | | (161 | ) | | | — | | | | — | | Intangible asset | | | — | | | — | | | — | | | | 1 | | | | — | | | | — | | Accumulated OCI | | | — | | | — | | | 187 | | | | 160 | | | | — | | | | — | | | | |
|
| |
|
| |
|
|
| |
|
|
| |
|
|
| |
|
|
| Net amount recognized at December 31 | | $ | 4,237 | | $ | 3,384 | | $ | (897 | ) | | $ | (918 | ) | | $ | (981 | ) | | $ | (822 | ) | | | |
|
| |
|
| |
|
|
| |
|
|
| |
|
|
| |
|
|
|
Net periodic pension benefit cost for 2005, 2004 and 2003 included the following components:
| | | | | | | | | | | | | | | | | | | | | | | | | | | | Qualified Pension Plans
| | | Nonqualified Pension Plans
| | | (Dollars in millions) | | 2005
| | | 2004
| | | 2003
| | | 2005
| | | 2004
| | | 2003
| | Components of net periodic pension benefit cost | | | | | | | | | | | | | | | | | | | | | | | | | Service cost | | $ | 261 | | | $ | 257 | | | $ | 187 | | | $ | 11 | | | $ | 27 | | | $ | 25 | | Interest cost | | | 643 | | | | 623 | | | | 514 | | | | 61 | | | | 62 | | | | 45 | | Expected return on plan assets | | | (983 | ) | | | (915 | ) | | | (735 | ) | | | — | | | | — | | | | — | | Amortization of prior service cost | | | 44 | | | | 55 | | | | 55 | | | | (8 | ) | | | 3 | | | | 3 | | Recognized net actuarial loss | | | 182 | | | | 92 | | | | 47 | | | | 24 | | | | 14 | | | | 11 | | Recognized loss due to settlements and curtailments | | | — | | | | — | | | | — | | | | 9 | | | | — | | | | — | | | | |
|
|
| |
|
|
| |
|
|
| |
|
|
| |
|
|
| |
|
|
| Net periodic pension benefit cost | | $ | 147 | | | $ | 112 | | | $ | 68 | | | $ | 97 | | | $ | 106 | | | $ | 84 | | | | |
|
|
| |
|
|
| |
|
|
| |
|
|
| |
|
|
| |
|
|
| Weighted average assumptions used to determine net cost for years ended December 31 | | | | | | | | | | | | | | | | | | | | | | | | | Discount rate(1) | | | 5.75 | % | | | 6.25 | % | | | 6.75 | % | | | 5.75 | % | | | 6.25 | % | | | 6.75 | % | Expected return on plan assets | | | 8.50 | | | | 8.50 | | | | 8.50 | | | | n/a | | | | n/a | | | | n/a | | Rate of compensation increase | | | 4.00 | | | | 4.00 | | | | 4.00 | | | | 4.00 | | | | 4.00 | | | | 4.00 | |
(1) | | In connection with the FleetBoston Merger, the plans of former FleetBoston were remeasured on April 1, 2004, using a discount rate of 6.00 percent. |
For 2005, 2004 and 2003, net periodic postretirement benefit cost included the following components:
| | | | | | | | | | | | | | (Dollars in millions) | | 2005
| | | 2004(1)
| | | 2003
| | Components of net periodic postretirement benefit cost | | | | | | | | | | | | | Service cost | | $ | 11 | | | $ | 9 | | | $ | 9 | | Interest cost | | | 78 | | | | 76 | | | | 68 | | Expected return on plan assets | | | (14 | ) | | | (16 | ) | | | (15 | ) | Amortization of transition obligation | | | 31 | | | | 32 | | | | 32 | | Amortization of prior service cost | | | — | | | | 1 | | | | 4 | | Recognized net actuarial loss | | | 80 | | | | 74 | | | | 89 | | | | |
|
|
| |
|
|
| |
|
|
| Net periodic postretirement benefit cost | | $ | 186 | | | $ | 176 | | | $ | 187 | | | | |
|
|
| |
|
|
| |
|
|
| Weighted average assumptions used to determine net cost for years ended December 31 | | | | | | | | | | | | | Discount rate(2) | | | 5.75 | % | | | 6.25 | % | | | 6.75 | % | Expected return on plan assets | | | 8.50 | | | | 8.50 | | | | 8.50 | |
(1) | | Includes the effect of the adoption of FSP No. 106-2, which reduced net periodic postretirement benefit cost by $15 million. |
(2) | | In connection with the FleetBoston Merger, the plans of former FleetBoston were remeasured on April 1, 2004, using a discount rate of 6.00 percent. |
BANK OF AMERICA CORPORATION AND SUBSIDIARIES
Notes to Consolidated Financial Statements—(Continued)
Net periodic postretirement health and life expense was determined using the “projected unit credit” actuarial method. Gains and losses for all benefits except postretirement health care are recognized in accordance with the standard amortization provisions of the applicable accounting standards. For the Postretirement Health Care Plans, 50 percent of the unrecognized gain or loss at the beginning of the fiscal year (or at subsequent remeasurement) is recognized on a level basis during the year. Assumed health care cost trend rates affect the postretirement benefit obligation and benefit cost reported for the Postretirement Health Care Plans. The assumed health care cost trend rate used to measure the expected cost of benefits covered by the Postretirement Health Care Plans was 109.0 percent for 2006,2007, reducing in steps to 55.0 percent in 20112012 and later years. A one-percentage-point increase in assumed health care cost trend rates would have increased the service and interest costs and the benefit obligation by $3 million and $51 million in 2006, $3 million and $51 million in 2005, and $4 million and $56 million in 2004, and $4 million and $52 million in 2003.2004. A one-percentage-point decrease in assumed health care cost trend rates would have lowered the service and interest costs and the benefit obligation by $3 million and $44 million in 2006, $3 million and $43 million in 2005, $3 million and $48 million in 2004, and $3 million and $48 million in 2003.2004. Plan Assets
The Qualified Pension Plans have been established as retirement vehicles for participants, and trusts have been established to secure benefits promised under the Qualified Pension Plans. The Corporation’s policy is to invest the trust assets in a prudent manner for the exclusive purpose of providing benefits to participants and defraying reasonable expenses of administration. The Corporation’s investment strategy is designed to provide a total return that, over the long-term, increases the ratio of assets to liabilities. The strategy attempts to maximize the investment return on assets at a level of risk deemed appropriate by the Corporation while complying with ERISA and any subsequent applicable regulations and laws. The investment strategy utilizes asset allocation as a principal determinant for establishing the risk/reward profile of the assets. Asset allocation ranges are established, periodically reviewed, and adjusted as funding levels and liability characteristics change. Active and passive investment managers are employed to help enhance the risk/return profile of the assets. An additional aspect of the investment strategy used to minimize risk (part of the asset allocation plan) includes matching the equity exposure of participant-selected earnings measures. For example, the common stock of the Corporation held in the trust is maintained as an offset to the exposure related to participants who selected to receive an earnings measure based on the return performance of common stock of the Corporation. No plan assets are expected to be returned to the Corporation during 2007. The Expected Return on Asset Assumption (EROA assumption) was developed through analysis of historical market returns, historical asset class volatility and correlations, current market conditions, anticipated future asset allocations, the funds’ past experience, and expectations on potential future market returns. The EROA assumption represents a long-term average view of the performance of the Qualified Pension Plans and Postretirement Health and Life Plan assets, a return that may or may not be achieved during any one calendar year. In a simplistic analysis of the EROA assumption, the building blocks used to arrive at the long-term return assumption would include an implied return from equity securities of 8.75 percent, debt securities of 5.75 percent, and real estate of 8.757.00 percent for all pension plans and postretirement health and life plans. The Qualified Pension Plans’ and Postretirement Health and Life Plans’ asset allocationallocations at December 31, 2006 and 2005 and 2004 and target allocationallocations for 20062007 by asset category are as follows: | | | | | | | | | | | | | 2006
Target
Allocation
| | | Percentage of Plan Assets at December 31
| | Asset Category
| | | 2005
| | | 2004
| | Equity securities | | 65 – 80 | % | | 71 | % | | 75 | % | Debt securities | | 20 – 35 | | | 27 | | | 23 | | Real estate | | 0 – 5 | | | 2 | | | 2 | | | | | | | |
|
| |
|
| Total | | | | | 100 | % | | 100 | % | | | | | | |
|
| |
|
|
| | | | | | | | | | | | | | | | | | | Asset Category | | Qualified Pension Plans | | | Postretirement Health and Life Plans | | | | | | | | Percentage of Plan
Assets at December 31 | | | | | | Percentage of Plan
Assets at December 31 | | | | | 2007 Target Allocation | | | 2006 | | | 2005 | | | 2007 Target Allocation | | | 2006 | | | 2005 | | Equity securities | | 65 - 80 | % | | 68 | % | | 71 | % | | 50 - 70 | % | | 61 | % | | 57 | % | Debt securities | | 20 - 35 | | | 30 | | | 27 | | | 30 - 50 | | | 36 | | | 41 | | Real estate | | 0 - 5 | | | 2 | | | 2 | | | 0 - 5 | | | 3 | | | 2 | | Total | | | | | 100 | % | | 100 | % | | | | | 100 | % | | 100 | % |
Equity securities for the Qualified Pension Plans include common stock of the Corporation in the amounts of $882 million (5.25 percent of total plan assets) and $798 million (6.10 percent of total plan assets) and $871 million (7.17 percent of total plan assets) at December 31, 20052006 and 2004. BANK OF AMERICA CORPORATION AND SUBSIDIARIES
Notes to Consolidated Financial Statements—(Continued)
The Postretirement Health and Life Plans’ asset allocation at December 31, 2005 and 2004 and target allocation for 2006 by asset category are as follows:
| | | | | | | | | | | | | 2006
Target
Allocation
| | | Percentage of Plan Assets at December 31
| | Asset Category
| | | 2005
| | | 2004
| | Equity securities | | 50 – 70 | % | | 57 | % | | 75 | % | Debt securities | | 30 – 50 | | | 41 | | | 24 | | Real estate | | 0 – 5 | | | 2 | | | 1 | | | | | | | |
|
| |
|
| Total | | | | | 100 | % | | 100 | % | | | | | | |
|
| |
|
|
2005. The Bank of America and MBNA Postretirement Health and Life Plans had no investment in the common stock of the Corporation at December 31, 20052006 or 2004.2005. The FleetBoston Postretirement Health and Life Plans included common stock of the Corporation in the amount of $0.4 million (0.46 percent of total plan assets) and $0.3 million (0.27 percent of total plan assets) at December 31, 20052006 and $0.3 million (0.20 percent of total plan assets) at December 31, 2004.2005, respectively. Projected Benefit Payments
| | Projected Benefit Payments |
Benefit payments projected to be made from the Qualified Pension Plans, the Nonqualified Pension Plans and the Postretirement Health and Life Plans are as follows: | | | | | | | | | | | | | (Dollars in millions) | | Qualified
Pension Plans(1)
| | Nonqualified
Pension Plans(2)
| | Postretirement Health and Life Plans
| | | | | Net
Payments(3)
| | Medicare
Subsidy
| 2006 | | $ | 867 | | $ | 97 | | $ | 98 | | $ | 3 | 2007 | | | 899 | | | 96 | | | 97 | | | 4 | 2008 | | | 925 | | | 109 | | | 97 | | | 4 | 2009 | | | 940 | | | 105 | | | 97 | | | 4 | 2010 | | | 945 | | | 109 | | | 96 | | | 4 | 2011 – 2015 | | | 4,885 | | | 554 | | | 447 | | | 18 |
| | | | | | | | | | | | | | | | | Qualified
Pension Plans (1) | | Nonqualified
Pension Plans (2) | | Postretirement Health and Life Plans | | | | | | | | (Dollars in millions) | | | | Net Payments (3) | | Medicare Subsidy | | 2007 | | $ | 1,007 | | $ | 97 | | $ | 135 | | $ | (12 | ) | 2008 | | | 1,022 | | | 101 | | | 135 | | | (12 | ) | 2009 | | | 1,026 | | | 104 | | | 137 | | | (12 | ) | 2010 | | | 1,035 | | | 103 | | | 138 | | | (12 | ) | 2011 | | | 1,051 | | | 105 | | | 138 | | | (12 | ) | 2012 - 2016 | | | 5,262 | | | 518 | | | 656 | | | (58 | ) |
(1) | | Benefit payments expected to be made from the plans’ assets. |
(2) | | Benefit payments expected to be made from the Corporation’s assets. |
(3) | | Benefit payments (net of retiree contributions) expected to be made from a combination of the plans’ and the Corporation’s assets. |
Defined Contribution Plans
| | Defined Contribution Plans |
The Corporation maintains qualified defined contribution retirement plans and nonqualified defined contribution retirement plans. As a result of the FleetBoston Merger,merger, beginning on April 1, 2004, the Corporation maintains the defined contribution plans of former FleetBoston. There are two componentsAs a result of the qualifiedMBNA merger on January 1, 2006, the Corporation also maintains the defined contribution plans the Bank of America 401(k) Plan and the FleetBoston Financial Savings Plan (the 401(k) Plans), an employee stock ownership plan (ESOP) and a profit-sharing plan. former MBNA. The Corporation contributed approximately $328 million, $274 million and $267 million for 2006, 2005 and $204 million for 2005, 2004, and 2003, in cash and stock. Contributions in 2003 were utilized primarily to purchase the Corporation’s common stock, under the terms of the Bank of America 401(k) Plan.respectively. At December 31, 20052006 and 2004,2005, an aggregate of 10699 million shares and 113106 million shares of the Corporation’s common stock were held by the 401(k) Plans. During 2004, the Corporation converted the ESOP Preferred Stock held by the Bank of America 401(k) Plan to common stock so that there were no outstanding shares of preferred stock at December 31, 2004 in the 401(k) Plans. Under the terms of the ESOPEmployee Stock Ownership Plan (ESOP) Preferred Stock provision for the Bank of America 401(k) Plan, payments to the plan for dividends on the ESOP Preferred Stock were $4 million for 2004 and 2003.2004. Payments to the planBank of America 401(k) Plan and legacy FleetBoston 401(k) Plan for dividends on Common Stock were $208 million, $207 million and $181 million during 2006, 2005 and 2004, respectively. Payments to the MBNA 401(k) Plan for dividends on the ESOP Common StockCorporation’s common stock were $207$8 million $181 million and $128 million during the same years. in 2006. In addition, certain non-U.S. employees within the Corporation are covered under defined contribution pension plans that are separately administered in accordance with local laws. Rewarding Success Plan
In 2005, the Corporation introduced a broad-based cash incentive plan for more than 140,000 associates that meet certain eligibility criteria and are below certain compensation levels. The amount of the cash award is determined based on the Corporation’s operating net income and common stock price performance for the full year. During 2006 and 2005, the Corporation recorded an expense of $237 million and $145 million for this plan.Plan. | | NOTE 17 – Stock-Based Compensation Plans |
On January 1, 2006, the Corporation adopted SFAS 123R under the modified-prospective application. The compensation cost recognized in income for the plans described below was $1.0 billion, $805 million and $536 million in 2006, 2005 and 2004, respectively. The related income tax benefit recognized in income was $382 million, $294 million and $188 million for 2006, 2005 and 2004, respectively. BANK OF AMERICA CORPORATION AND SUBSIDIARIES
NotesPrior to Consolidated Financial Statements—(Continued)
Note 17—Stock-based Compensation Plans
At December 31, 2005,the adoption of SFAS 123R, awards granted to retirement-eligible employees were expensed over the stated vesting period. SFAS 123R requires that the Corporation had certain stock-basedrecognize stock compensation plans that are described below. For all stock-basedcost immediately for any awards granted to retirement-eligible employees, or over the vesting period or the period from the grant date to the date retirement eligibility is achieved, whichever is shorter. Upon the grant of awards in the first quarter of 2006, the Corporation recognized approximately $320 million in equity-based compensation due to awards issued priorbeing granted to retirement-eligible employees.
Prior to the adoption of SFAS 123R, the Corporation presented tax benefits of deductions resulting from the exercise of stock options as operating cash flows in the Consolidated Statement of Cash Flows. SFAS 123R requires the cash flows resulting from the tax benefits due to tax deductions in excess of the compensation cost recognized for those options (excess tax benefits) to be classified as financing cash flows. The Corporation classified $477 million in excess tax benefits as a financing cash inflow for 2006. Prior to January 1, 2003,2006, the Corporation appliedestimated the provisionsfair value of APB 25stock options granted on the date of grant using the Black-Scholes option-pricing model. On January 1, 2006, the Corporation began using a lattice option-pricing model to estimate the grant date fair value of stock options granted. The table below presents the assumptions used to estimate the fair value of stock options granted on the date of grant using the lattice option-pricing model for 2006. Lattice option-pricing models incorporate ranges of assumptions for inputs and those ranges are disclosed in accountingthe table below. The risk-free rate for itsperiods within the contractual life of the stock option and award plans. Stock-based compensation plans enacted after December 31, 2002, are accounted for under the provisions of SFAS 123. For additional informationis based on the accounting for stock-based compensation plans and pro forma disclosures, see Note 1U.S. Treasury yield curve in effect at the time of grant. Expected volatilities are based on implied volatilities from traded stock options on the Corporation’s common stock, historical volatility of the Consolidated Financial Statements.Corporation’s common stock, and other factors. The Corporation uses historical data to estimate stock option exercise and employee termination within the model. The expected term of stock options granted is derived from the output of the model and represents the period of time that stock options granted are expected to be outstanding. The table below also includes the assumptions used to estimate the fair value of stock options granted on the date of grant using the Black-Scholes option-pricing model for 2005 and 2004. The estimates of fair value from these models are theoretical values for stock options and changes in the assumptions used in the models could result in materially different fair value estimates. The actual value of the stock options will depend on the market value of the Corporation’s common stock when the stock options are exercised. The following table presents information on equity compensation plans at December 31, 2005:
| | | | | | | | | | | Number of Shares to be Issued Upon
Exercise
of Outstanding Options(1,4)
| | Weighted Average
Exercise Price of Outstanding
Options(2)
| | Number of Shares Remaining for Future Issuance Under Equity Compensation Plans(3)
| Plans approved by shareholders | | 231,465,981 | | $ | 35.91 | | 167,163,952 | Plans not approved by shareholders | | 20,032,226 | | | 30.63 | | — | | | |
| | | | |
| Total | | 251,498,207 | | $ | 35.47 | | 167,163,952 | | | |
| |
|
| |
|
(1) | | Includes 10,655,618 unvested restricted stock units. |
(2) | | Does not take into account unvested restricted stock units. |
(3) | | Excludes shares to be issued upon exercise of outstanding options. |
(4) | | In addition to the securities presented in the table above, there were outstanding options to purchase 57,290,213 shares of the Corporation’s common stock and 1,275,565 unvested restricted stock units granted to employees of predecessor companies assumed in mergers. The weighted average option price of the assumed options was $33.69 at December 31, 2005. |
| | | | | | | | | | | | | 2006 | | | 2005 | | | 2004 | | Risk-free interest rate | | 4.59 – 4.70 | % | | 3.94 | % | | 3.36 | % | Dividend yield | | 4.50 | | | 4.60 | | | 4.56 | | Expected volatility | | 17.00 – 27.00 | | | 20.53 | | | 22.12 | | Weighted-average volatility | | 20.30 | | | n/a | | | n/a | | Expected lives (years) | | 6.5 | | | 6 | | | 5 | |
The Corporation has certain stock-basedequity compensation plans that were approved by its shareholders. These plans are the Key Employee Stock Plan and the Key Associate Stock Plan. Additionally one equity compensation plan (2002 Associates Stock Option Plan) was not approved by the Corporation’s shareholders. Descriptions of the material features of these plans follow. Key Employee Stock Plan
The Key Employee Stock Plan, as amended and restated, provided for different types of awards. These include stock options, restricted stock shares and restricted stock units. Under the plan, ten-year options to purchase approximately 260 million shares of common stock were granted through December 31, 2002, to certain employees at the closing market price on the respective grant dates. Options granted under the plan generally vest in three or four equal annual installments. At December 31, 2005,2006, approximately 9066 million options were outstanding under this plan. No further awards may be granted. Key Associate Stock Plan
On April 24, 2002, the shareholders approved the Key Associate Stock Plan to be effective January 1, 2003. This approval authorized and reserved 200 million shares for grant in addition to the remaining amount under the Key Employee Stock Plan as of December 31, 2002, which was approximately 34 million shares plus any shares covered by awards under the Key Employee Stock Plan that terminate, expire, lapse or are cancelled after December 31, 2002. Upon the FleetBoston Merger, merger, the shareholders authorized an additional 102 million shares and on April 26, 2006, the shareholders authorized an additional 180 million shares for grant under the Key Associate Stock Plan. At December 31, 2005,2006, approximately 130135 million options were outstanding under this plan. Approximately 18 million shares of restricted stock and restricted stock units were granted during 2005.in 2006. These shares of restricted stock generally vest in three equal annual installments beginning one year from the grant date. The Corporation incurred restricted stock expense of $778 million, $486 million, and $288 million in 2006, 2005 and $276 million in 2005, 2004 and 2003. BANK OF AMERICA CORPORATION AND SUBSIDIARIES2004.
Notes to Consolidated Financial Statements—(Continued)
The Corporation has certain stock-based compensation plans that were not approved by its shareholders. These broad-based plans are the 2002 Associates Stock Option Plan and Take Ownership!. Descriptions of the material features of these plans follow.
2002 Associates Stock Option Plan
| | 2002 Associates Stock Option Plan |
The Bank of America Corporation 2002 Associates Stock Option Plan was a broad-based plan that covered all employees below a specified executive grade level.level and was not approved by the Corporation’s shareholders. Under the plan, eligible employees received a one-time award of a predetermined number of options entitling them to purchase shares of the Corporation’s common stock. All options are nonqualified and have an exercise price equal to the fair market value on the date of grant. Approximately 108 million options were granted on February 1, 2002. The award included two performance-based vesting triggers. During 2003, the first option vesting trigger wastriggers, which were subsequently achieved. During 2004, the second option vesting trigger was achieved. In addition, the options continue to be exercisable following termination of employment under certain circumstances. At December 31, 2005,2006, approximately 205 million options were outstanding under this plan. The options expire on January 31, 2007. No further awards may be granted. Take Ownership!The following table presents information on equity compensation plans at December 31, 2006:
The Bank of America Global Associate Stock Option Program (Take Ownership!) covered all employees below a specified executive grade level. Under the plan, eligible employees received an award of a predetermined number of stock options entitling them to purchase shares of the Corporation’s common stock at the fair market value on the grant date. Options were granted on the first business day of 1999, 2000 and 2001. All options are nonqualified. At January 2, 2004, all options issued under this plan were fully vested. These options expire five years after the grant date. In addition, the options continue to be exercisable following termination of employment under certain circumstances. At December 31, 2005, approximately 134 thousand options were outstanding under this plan. No further awards may be granted. All remaining options expired January 2, 2006.
| | | | | | | | | | | Number of Shares
to be Issued(1, 3) | | Weighted Average
Exercise Price of
Outstanding
Options(2) | | Number of Shares
Remaining for Future
Issuance Under Equity
Compensation Plans | Plans approved by shareholders | | 215,115,189 | | $ | 37.59 | | 304,107,699 | Plan not approved by shareholders(4) | | 5,148,042 | | | 30.68 | | — | Total | | 220,263,231 | | | 37.42 | | 304,107,699 |
(1) | Includes 13,871,207 unvested restricted stock units. |
Additional stock option plans assumed in connection with various acquisitions remain outstanding and are included in the following tables. No further awards may be granted under these plans.
(2) | Does not take into account unvested restricted stock units. |
(3) | In addition to the securities presented in the table above, there were outstanding options to purchase 38,681,146 shares of the Corporation’s common stock and 502,760 unvested restricted stock units granted to employees of predecessor companies assumed in mergers. The weighted average option price of the assumed options was $34.07 at December 31, 2006. |
(4) | Shareholder approval of these broad-based stock option plans was not required by applicable law or New York Stock Exchange rules. |
The following tables presenttable presents the status of all option plans at December 31, 2005, 2004 and 2003,2006, and changes during the years then ended:2006: | | | | | | | | | | | | | | | | | | | | | | 2005
| | 2004
| | 2003
| Employee stock options
| | Shares
| | | Weighted
Average
Exercise
Price
| | Shares
| | | Weighted
Average
Exercise
Price
| | Shares
| | | Weighted
Average
Exercise
Price
| Outstanding at January 1 | | 337,551,559 | | | $ | 32.93 | | 320,331,380 | | | $ | 30.66 | | 411,447,300 | | | $ | 29.10 | Options assumed through acquisition | | — | | | | — | | 78,761,708 | | | | 28.68 | | — | | | | — | Granted | | 35,615,891 | | | | 46.58 | | 63,472,170 | | | | 40.80 | | 61,336,790 | | | | 35.03 | Exercised | | (68,206,402 | ) | | | 29.89 | | (111,958,135 | ) | | | 27.77 | | (132,491,842 | ) | | | 27.72 | Forfeited | | (6,828,246 | ) | | | 38.59 | | (13,055,564 | ) | | | 34.15 | | (19,960,868 | ) | | | 31.41 | | | |
|
| | | | |
|
| | | | |
|
| | | | Outstanding at December 31 | | 298,132,802 | | | | 35.13 | | 337,551,559 | | | | 32.93 | | 320,331,380 | | | | 30.66 | | | |
|
| | | | |
|
| | | | |
|
| | | | Options exercisable at December 31 | | 213,326,486 | | | | 32.41 | | 243,735,846 | | | | 30.73 | | 167,786,372 | | | | 30.02 | | | |
|
| | | | |
|
| | | | |
|
| | | | Weighted average fair value of options granted during the year | | | | | $ | 6.48 | | | | | $ | 5.59 | | | | | $ | 6.77 | | | | | | |
|
| | | | |
|
| | | | |
|
| | | | | | | | 2005
| | 2004
| | 2003
| Restricted stock/unit awards
| | Shares
| | | Weighted
Average
Grant
Price
| | Shares
| | | Weighted
Average
Grant
Price
| | Shares
| | | Weighted
Average
Grant
Price
| Outstanding unvested grants at January 1 | | 20,449,565 | | | $ | 37.12 | | 16,170,546 | | | $ | 31.64 | | 15,679,946 | | | $ | 30.37 | Share obligations assumed through acquisition | | — | | | | — | | 7,720,476 | | | | 31.62 | | — | | | | — | Granted | | 17,599,740 | | | | 46.60 | | 10,338,327 | | | | 41.03 | | 8,893,718 | | | | 34.69 | Vested | | (9,409,844 | ) | | | 37.48 | | (12,031,945 | ) | | | 29.43 | | (7,697,576 | ) | | | 32.47 | Canceled | | (1,361,355 | ) | | | 43.49 | | (1,747,839 | ) | | | 38.10 | | (705,542 | ) | | | 32.85 | | | |
|
| | | | |
|
| | | | |
|
| | | | Outstanding unvested grants at December 31 | | 27,278,106 | | | $ | 42.79 | | 20,449,565 | | | $ | 37.12 | | 16,170,546 | | | $ | 31.64 | | | |
|
| |
|
| |
|
| |
|
| |
|
| |
|
|
BANK OF AMERICA CORPORATION AND SUBSIDIARIES
| | | | | | | | Employee stock options | | December 31, 2006 | | | | Shares | | | Weighted
Average Exercise
Price | Outstanding at January 1, 2006 | | 298,132,802 | | | $ | 35.13 | Options assumed through acquisition | | 31,506,268 | | | | 32.70 | Granted | | 31,534,150 | | | | 44.42 | Exercised | | (111,615,059 | ) | | | 32.93 | Forfeited | | (4,484,991 | ) | | | 41.48 | Outstanding at December 31, 2006 | | 245,073,170 | | | | 36.89 | Options exercisable at December 31, 2006 | | 178,277,236 | | | | 34.17 | Options vested and expected to vest(1) | | 244,223,346 | | | | 36.87 |
(1) | Includes vested shares and nonvested shares after a forfeiture rate is applied. |
NotesThe weighted average remaining contractual term and aggregate intrinsic value of options outstanding was 5.7 years and $4.0 billion, options exercisable was 4.7 years and $3.4 billion, and options vested and expected to Consolidated Financial Statements—(Continued)vest was 5.7 years and $4.0 billion at December 31, 2006.
The weighted average grant-date fair value of options granted in 2006, 2005 and 2004 was $6.90, $6.48 and $5.59. The total intrinsic value of options exercised in 2006 was $2.0 billion. The following table summarizes information about stock options outstandingpresents the status of the nonvested shares at December 31, 2005:2006, and changes during 2006: | | | | | | | | | | | | | | | | Outstanding Options
| | Options Exercisable
| Range of Exercise Prices
| | Number
Outstanding at
December 31, 2005
| | Weighted
Average
Remaining
Term
| | Weighted
Average
Exercise
Price
| | Number
Exercisable at
December 31,
2005
| | Weighted
Average
Exercise
Price
| $ 5.00 – $15.00 | | 60,888 | | 0.2 years | | $ | 12.87 | | 60,888 | | $ | 12.87 | $15.01 – $23.25 | | 6,181,199 | | 4.7 years | | | 19.09 | | 6,181,199 | | | 19.09 | $23.26 – $32.75 | | 121,675,632 | | 4.2 years | | | 28.93 | | 121,674,932 | | | 28.93 | $32.76 – $49.50 | | 170,215,083 | | 6.7 years | | | 40.14 | | 85,409,467 | | | 38.34 | | | |
| | | | | | |
| | | | Total | | 298,132,802 | | 5.6 years | | $ | 35.13 | | 213,326,486 | | $ | 32.41 | | | |
| |
| |
|
| |
| |
|
|
| | | | | | | | Restricted stock/unit awards | | December 31, 2006 | | | | Shares | | | Weighted
Average Grant
Date Fair Value | Outstanding at January 1, 2006 | | 27,278,106 | | | $ | 42.79 | Share obligations assumed through acquisition | | 754,740 | | | | 30.40 | Granted | | 18,128,115 | | | | 44.43 | Vested | | (12,319,864 | ) | | | 41.41 | Cancelled | | (2,251,755 | ) | | | 44.52 | Outstanding at December 31, 2006 | | 31,589,342 | | | | 43.85 |
Note 18—Income TaxesAt December 31, 2006, there was $766 million of total unrecognized compensation cost related to share-based compensation arrangements for all awards that is expected to be recognized over a weighted average period of .86 years. The total fair value of restricted stock vested in 2006 was $559 million.
The components of Income Tax Expense for 2006, 2005 2004 and 20032004 were as follows: | | | | | | | | | | | | | (Dollars in millions) | | 2005
| | 2004
(Restated)
| | | 2003
(Restated)
| | Current income tax expense | | | | | | | | | | | | Federal | | $ | 5,229 | | $ | 6,392 | | | $ | 4,642 | | State | | | 676 | | | 683 | | | | 412 | | Foreign | | | 415 | | | 405 | | | | 260 | | | | |
|
| |
|
|
| |
|
|
| Total current expense | | | 6,320 | | | 7,480 | | | | 5,314 | | | | |
|
| |
|
|
| |
|
|
| Deferred income tax expense (benefit) | | | | | | | | | | | | Federal | | | 1,577 | | | (512 | ) | | | (249 | ) | State | | | 85 | | | (23 | ) | | | (50 | ) | Foreign | | | 33 | | | 16 | | | | 4 | | | | |
|
| |
|
|
| |
|
|
| Total deferred expense (benefit) | | | 1,695 | | | (519 | ) | | | (295 | ) | | | |
|
| |
|
|
| |
|
|
| Total income tax expense(1) | | $ | 8,015 | | $ | 6,961 | | | $ | 5,019 | | | | |
|
| |
|
|
| |
|
|
|
| | | | | | | | | | | | | (Dollars in millions) | | 2006 | | | 2005 | | 2004 | | Current income tax expense | | | | | | | | | | | | Federal | | $ | 7,398 | | | $ | 5,229 | | $ | 6,392 | | State | | | 796 | | | | 676 | | | 683 | | Foreign | | | 796 | | | | 415 | | | 405 | | Total current expense | | | 8,990 | | | | 6,320 | | | 7,480 | | Deferred income tax expense (benefit) | | | | | | | | | | | | Federal | | | 1,807 | | | | 1,577 | | | (512 | ) | State | | | 45 | | | | 85 | | | (23 | ) | Foreign | | | (2 | ) | | | 33 | | | 16 | | Total deferred expense (benefit) | | | 1,850 | | | | 1,695 | | | (519 | ) | Total income tax expense (1) | | $ | 10,840 | | | $ | 8,015 | | $ | 6,961 | |
(1) | | Does not reflect the deferred tax effects of Unrealized Gains and Losses on AFS Debt and Marketable Equity Securities, Foreign Currency Translation Adjustments, Derivatives, and Derivativesthe accumulated adjustment to apply SFAS No. 158 that are included in Accumulated OCI. As a result of these tax effects, Accumulated OCI increased $378 million, $2,863 million and $303 million in 2006, 2005 and $1,916 million in 2005, 2004 and 2003.2004. Also, does not reflect tax benefits associated with the Corporation’s employee stock plans which increased Common Stock and Additional Paid-in Capital $674 million, $416 million and $401 million in 2006, 2005 and $443 million in 2005, 2004 and 2003.2004. Goodwill was reduced $195 million, $22 million and $101 million in 2006, 2005 and 2004, reflecting the tax benefits attributable to exercises of employee stock options issued by MBNA and FleetBoston which had vested prior to the merger date.dates. |
Income Tax Expense for 2006, 2005 2004 and 20032004 varied from the amount computed by applying the statutory income tax rate to Income before Income Taxes. A reconciliation between the expected federal income tax expense using the federal statutory tax rate of 35 percent to the Corporation’s actual Income Tax Expense and resulting effective tax rate for 2006, 2005 2004 and 20032004 follows: | | | | 2005
| | 2004 (Restated)
| | 2003 (Restated)
| | | 2006 | | 2005 | | 2004 | | | (Dollars in millions) | | Amount
| | Percent
| | Amount
| | Percent
| | Amount
| | Percent
| | | Amount | | Percent | | Amount | | Percent | | Amount | | Percent | | Expected federal income tax expense | | $ | 8,568 | | | 35.0 | % | | $ | 7,318 | | | 35.0 | % | | $ | 5,523 | | | 35.0 | % | | $ | 11,191 | | | 35.0 | % | | $ | 8,568 | | | 35.0 | % | | $ | 7,318 | | | 35.0 | % | Increase (decrease) in taxes resulting from: | | | | | | | | | | | | | | | Tax-exempt income, including dividends | | | (605 | ) | | (2.5 | ) | | | (526 | ) | | (2.5 | ) | | | (325 | ) | | (2.1 | ) | | | (630 | ) | | (2.0 | ) | | | (605 | ) | | (2.5 | ) | | | (526 | ) | | (2.5 | ) | State tax expense, net of federal benefit | | | 495 | | | 2.0 | | | | 429 | | | 2.1 | | | | 235 | | | 1.5 | | | | 547 | | | 1.7 | | | | 495 | | | 2.0 | | | | 429 | | | 2.1 | | Goodwill amortization | | | — | | | — | | | | — | | | — | | | | 12 | | | 0.1 | | | IRS tax settlement | | | — | | | — | | | | — | | | — | | | | (84 | ) | | (0.5 | ) | | Low income housing credits/other credits | | | (423 | ) | | (1.7 | ) | | | (352 | ) | | (1.7 | ) | | | (212 | ) | | (1.3 | ) | | | (537 | ) | | (1.7 | ) | | | (423 | ) | | (1.7 | ) | | | (352 | ) | | (1.7 | ) | Foreign tax differential | | | (99 | ) | | (0.4 | ) | | | (78 | ) | | (0.4 | ) | | | (50 | ) | | (0.3 | ) | | | (291 | ) | | (0.9 | ) | | | (99 | ) | | (0.4 | ) | | | (78 | ) | | (0.4 | ) | TIPRA—FSC/ETI | | | | 175 | | | 0.5 | | | | — | | | — | | | | — | | | — | | Other | | | 79 | | | 0.3 | | | | 170 | | | 0.8 | | | | (80 | ) | | (0.6 | ) | | | 385 | | | 1.3 | | | | 79 | | | 0.3 | | | | 170 | | | 0.8 | | | | |
|
|
| |
|
| |
|
|
| |
|
| |
|
|
| |
|
| | Total income tax expense | | $ | 8,015 | | | 32.7 | % | | $ | 6,961 | | | 33.3 | % | | $ | 5,019 | | | 31.8 | % | | $ | 10,840 | | | 33.9 | % | | $ | 8,015 | | | 32.7 | % | | $ | 6,961 | | | 33.3 | % | | | |
|
|
| |
|
| |
|
|
| |
|
| |
|
|
| |
|
| |
BANK OF AMERICA CORPORATION AND SUBSIDIARIES
Notes to Consolidated Financial Statements—(Continued)
During 2002, the Corporation reached a tax settlement agreement with the IRS. This agreement resolved issues for numerous tax returns of the Corporation and various predecessor companies and finalized all federal income tax liabilities, excluding those relating to FleetBoston, through 1999. As a result of the settlement, a reduction in Income Tax Expense of $84 million in 2003 was recorded representing refunds received.
The IRS is currently examining the Corporation’s federal income tax returns for the years 2000 through 2002 as well as2002. In addition, the federal income tax returns of FleetBoston and certain other subsidiaries are currently under examination for years ranging from 1997 to 2000.through 2004 as well as the federal income tax returns of MBNA for years ranging from 2001 through 2004. The Corporation’s current estimate of the resolution of these various examinations is reflected in accrued income taxes; however, final settlement of the examinations or changes in the Corporation’s estimate may result in future income tax expense or benefit. Significant components of the Corporation’s net deferred tax liability at December 31, 20052006 and 20042005 are presented in the following table. | | | | | | | | | | | | December 31
| | | (Dollars in millions) | | 2005
| | | 2004 (Restated)
| | Deferred tax liabilities | | | | | | | | | Equipment lease financing | | $ | 6,455 | | | $ | 6,192 | | Intangibles | | | 1,138 | | | | 803 | | Investments | | | 238 | | | | 1,088 | | State income taxes | | | 168 | | | | 222 | | Fixed assets | | | 152 | | | | 47 | | Loan fees and expenses | | | 142 | | | | — | | Deferred gains and losses | | | 15 | | | | 251 | | Other | | | 1,122 | | | | 874 | | | | |
|
|
| |
|
|
| Gross deferred tax liabilities | | | 9,430 | | | | 9,477 | | | | |
|
|
| |
|
|
| Deferred tax assets | | | | | | | | | Security valuations | | | 2,822 | | | | 2,434 | | Allowance for credit losses | | | 2,623 | | | | 2,973 | | Available-for-sale securities | | | 1,845 | | | | 146 | | Accrued expenses | | | 1,235 | | | | 533 | | Employee compensation and retirement benefits | | | 559 | | | | 648 | | Foreign tax credit carryforward | | | 169 | | | | 467 | | Loan fees and expenses | | | — | | | | 241 | | Other | | | 416 | | | | 1,288 | | | | |
|
|
| |
|
|
| Gross deferred tax assets | | | 9,669 | | | | 8,730 | | | | |
|
|
| |
|
|
| Valuation allowance(1) | | | (253 | ) | | | (155 | ) | | | |
|
|
| |
|
|
| Total deferred tax assets, net of valuation allowance | | | 9,416 | | | | 8,575 | | | | |
|
|
| |
|
|
| Net deferred tax liabilities(2) | | $ | 14 | | | $ | 902 | | | | |
|
|
| |
|
|
|
| | | | | | | | | | | | December 31 | | | (Dollars in millions) | | 2006 | | | 2005 | | Deferred tax liabilities | | | | | | | | | Equipment lease financing | | $ | 6,895 | | | $ | 6,455 | | Intangibles | | | 1,198 | | | | 506 | | Fee income | | | 1,065 | | | | 386 | | Mortgage servicing rights | | | 787 | | | | 632 | | Foreign currency | | | 659 | | | | 251 | | State income taxes | | | 353 | | | | 168 | | Fixed assets | | | — | | | | 152 | | Loan fees and expenses | | | — | | | | 142 | | Other | | | 1,232 | | | | 1,137 | | Gross deferred tax liabilities | | | 12,189 | | | | 9,829 | | Deferred tax assets | | | | | | | | | Allowance for credit losses | | | 3,054 | | | | 2,623 | | Security valuations | | | 2,703 | | | | 3,208 | | Available-for-sale securities | | | 1,632 | | | | 1,845 | | Accrued expenses | | | 1,283 | | | | 1,235 | | Employee compensation and retirement benefits | | | 1,273 | | | | 559 | | Foreign tax credit carryforward | | | 117 | | | | 169 | | Other | | | 198 | | | | 429 | | Gross deferred tax assets | | | 10,260 | | | | 10,068 | | Valuation allowance(1) | | | (122 | ) | | | (253 | ) | Total deferred tax assets, net of valuation allowance | | | 10,138 | | | | 9,815 | | Net deferred tax liabilities(2) | | $ | 2,051 | | | $ | 14 | |
(1) | | At December 31, 2004, $702006 and 2005, $43 million and $53 million of the valuation allowance related to grossdeferredgross deferred tax assets was attributable to the MBNA and FleetBoston Merger.mergers. Future recognition of the tax attributes associated with these gross deferred tax assets would result in tax benefits being allocated to reduce Goodwill. |
(2) | | The Corporation’s net deferred tax liabilities were adjusted during 2006 and 2005 and2004 to include $565 million and $279 million of net deferred tax liabilities and $2.0 billion of net deferred tax assets related to business combinations accounted for under the purchase method. |
The valuation allowance at December 31, 20052006 and 20042005 is attributable to deferred tax assets generated in certain state and foreign jurisdictions. During 2005, deferred tax assets were recognizedjurisdictions for certain state temporary differences that had previously not been recognized. The valuation allowance change for 2005 was primarily attributable to these deferred tax assets, aswhich management continues to believebelieves it is more likely than not that realization of these assets will not occur. The decrease in the valuation allowance primarily resulted from a remeasurement of certain state temporary differences against which valuation allowances had been recorded and the conclusion of state tax examinations. The foreign tax credit carryforward reflected in the table above represents foreign income taxes paid that are creditable against future U.S. income taxes. If not used, these credits begin to expire after 20122013 and could fully expire after 2014.2016. The Tax Increase Prevention and Reconciliation Act of 2005 (TIPRA) was signed into law in 2006. Among other things, TIPRA repealed certain provisions of prior law relating to transactions entered into under the extraterritorial income and foreign sales corporation regimes. The TIPRA repeal results in an increase in the U.S. taxes expected to be paid on certain portions of the income earned from such transactions after December 31, 2006. Accounting for the change in law resulted in the recognition of a $175 million charge to Income Tax Expense during 2006. BANK OF AMERICA CORPORATION AND SUBSIDIARIES
Notes to Consolidated Financial Statements—(Continued)
The American Jobs Creation Act of 2004 (the Act) provides U.S. companies with the ability to elect to apply a special one-time tax deduction equal to 85 percent of certain earnings remitted from foreign subsidiaries, provided certain criteria are met. Management elected to apply the Act for 2005 and recorded a one-time tax benefit of $70 million for the year ended December 31, 2005. At December 31, 20052006 and 2004,2005, federal income taxes had not been provided on $1.4$4.4 billion and $1.1$1.4 billion of undistributed earnings of foreign subsidiaries, earned prior to 1987 and after 1997 that have been reinvested for an indefinite period of time. If the earnings were distributed, an additional $249$573 million and $221$249 million of tax expense, net of credits for foreign taxes paid on such earnings and for the related foreign withholding taxes, would resulthave resulted in 20052006 and 2004.2005. Note 19—Fair Value of Financial Instruments
| | NOTE 19 – Fair Value of Financial Instruments |
SFAS No. 107, “Disclosures About Fair Value of Financial Instruments” (SFAS 107), requires the disclosure of the estimated fair value of financial instruments. The fair value of a financial instrument is the amount at which the instrument could be exchanged in a current transaction between willing parties, other than in a forced or liquidation sale. Quoted market prices, if available, are utilized as estimates of the fair values of financial instruments. Since no quoted market prices exist for certain of the Corporation’s financial instruments, the fair values of such instruments have been derived based on management’s assumptions, the estimated amount and timing of future cash flows and estimated discount rates. The estimation methods for individual classifications of financial instruments are described more fully below. Different assumptions could significantly affect these estimates. Accordingly, the net realizable values could be materially different from the estimates presented below. In addition, the estimates are only indicative of the value of individual financial instruments and should not be considered an indication of the fair value of the combined Corporation. The provisions of SFAS 107 do not require the disclosure of the fair value of lease financing arrangements and nonfinancial instruments, including intangible assetsGoodwill and Intangible Assets such as goodwill, franchise, andpurchased credit card, affinity, and trust relationships. Short-term Financial Instruments
| | Short-term Financial Instruments |
The carrying value of short-term financial instruments, including cash and cash equivalents, time deposits placed, federal funds sold and purchased, resale and repurchase agreements, commercial paper and other short-term investments and borrowings, approximates the fair value of these instruments. These financial instruments generally expose the Corporation to limited credit risk and have no stated maturities or have short-term maturities and carry interest rates that approximate market. Financial Instruments Traded in the Secondary Market
| | Financial Instruments Traded in the Secondary Market and Strategic Investments |
Held-to-maturity securities, AFS debt and marketable equity securities, trading account instruments, and long-term debt traded actively in the secondary market and strategic investments have been valued using quoted market prices. The fair values of trading account instruments, securities and securitiesstrategic investments are reported in Notes 43 and 65 of the Consolidated Financial Statements. Derivative Financial Instruments
| | Derivative Financial Instruments |
All derivatives are recognized on the balance sheetConsolidated Balance Sheet at fair value, net of cash collateral held and taking into consideration the effects of legally enforceable master netting agreements that allow the Corporation to settle positive and negative positions with the same counterparty on a net basis. For exchange-traded contracts, fair value is based on quoted market prices. For non-exchange traded contracts, fair value is based on dealer quotes, pricing models or quoted prices for instruments with similar characteristics. The fair value of the Corporation’s derivative assets and liabilities is presented in Note 54 of the Consolidated Financial Statements. Loans
Fair values were estimated for groups of similar loans based upon type of loan and maturity. The fair value of loans was determined by discounting estimated cash flows using interest rates approximating the Corporation’s current origination rates for similar loans and adjusted to reflect the inherent credit risk. Where quoted market prices were available, primarily for certain residential mortgage loans and commercial loans, such market prices were utilized as estimates for fair values. Substantially all of the foreign loans reprice within relatively short timeframes. Accordingly, for foreign loans, the net carrying values were assumed to approximate their fair values. BANK OF AMERICA CORPORATION AND SUBSIDIARIES
Notes to Consolidated Financial Statements—(Continued)
Deposits
The fair value for deposits with stated maturities was calculated by discounting contractual cash flows using current market rates for instruments with similar maturities. The carrying value of foreign time deposits approximates fair value. For deposits with no stated maturities, the carrying amount was considered to approximate fair value and does not take into account the significant value of the cost advantage and stability of the Corporation’s long-term relationships with depositors. The book and fair values of certain financial instruments at December 31, 20052006 and 20042005 were as follows: | | | | December 31
| | | | | | | | | | | | 2005
| | 2004
| | December 31 | | | | | | | | (Restated)
| | 2006 | | 2005 | | (Dollars in millions) | | Book
Value
| | Fair
Value
| | Book
Value
| | Fair
Value
| | Book Value | | Fair Value | | Book Value | | Fair Value | Financial assets | | | | | | | | | | | | | | | | | Loans | | $ | 545,238 | | $ | 542,626 | | $ | 492,033 | | $ | 497,614 | | Loans(1) | | | $ | 675,544 | | $ | 679,738 | | $ | 545,238 | | $ | 542,626 | Financial liabilities | | | | | | | | | | | | | | | | | Deposits | | | 634,670 | | | 633,928 | | | 618,570 | | | 618,409 | | | 693,497 | | | 693,041 | | | 634,670 | | | 633,928 | Long-term debt | | | 100,848 | | | 101,446 | | | 97,116 | | | 101,477 | | | 146,000 | | | 148,120 | | | 100,848 | | | 101,446 |
Note 20—Business Segment Information(1) | Presented net of the Allowance for Loan and Lease Losses. |
| | NOTE 20 – Business Segment Information |
The Corporation reports the results of its operations through fourthree business segments:Global Consumer and Small Business Banking, Global Business and Financial Services, Global Capital MarketsCorporate and Investment Banking, andGlobal Wealth and Investment Management. Certain operating segments have been aggregated into a single business segment. The Corporation may periodically reclassify business segment results based on modifications to its management reporting methodologies and changes in organizational alignment. Global Consumer and Small Business Banking provides a diversified range of products and services to individuals and small businesses through multiple delivery channels.its primary businesses:Deposits, Card Services, Mortgage andHome Equity.Global BusinessCorporate and Financial ServicesInvestment Banking serves domestic and international businessissuer and investor clients, providing financial services, specialized industry expertise and local delivery through a global team of client managers and a variety of businesses. During the third quarter of 2005, our operations in Mexico were realigned and are now included in the results ofits primary businesses:Global Business and Financial Services, rather thanGlobalLending, Capital Markets and Investment BankingAdvisory Services, andTreasury Services.Global Capital Markets These businesses provide traditional bank deposit and Investment Banking providesloan products to large corporations and institutional clients, capital-raising solutions, advisory services, derivatives capabilities, equity and debt sales and trading for the Corporation’s clients, as well as traditional bank deposit and loan products, treasury management and payment services to large corporations and institutional clients. Also during the third quarter of 2005, the Corporation announced the future combination ofGlobal Business and Financial Services andGlobal Capital Markets and Investment Banking that was effective on January 1, 2006. This new segment is calledGlobal Corporate and Investment Banking.services.Global Wealth and Investment Management offers investment services, estate management, financial planning services, fiduciary management, credit and banking expertise, and diversified asset management products to institutional clients, as well as affluent and high-net-worth individuals.individuals through its primary businesses:The Private Bank,Columbia Management andPremier Banking and Investments. All Other consists primarily of Equityequity investment activities including Principal Investing, Corporate Investments and Strategic Investments,the residual impact of the allowance for credit losses process,and the cost allocation processes, Merger and Restructuring Charges, intersegment eliminations, and the results of certain consumer finance and commercial lending businesses that are being liquidated.All Other also includes certain amounts associated with the ALM process,activities, including the residual impact of funds transfer pricing allocation methodologies, amounts associated with the change in the value of derivatives used as economic hedges of interest rate and foreign exchange rate fluctuations that do not qualify for SFAS 133 hedge accounting treatment, certain gains or losses on sales of whole mortgage loans, and Gains (Losses) on Sales of Debt Securities.
Total Revenue includes Net Interest Income on a fully taxable-equivalent (FTE)FTE basis and Noninterest Income. The adjustment of Net Interest Income to a FTE basis results in a corresponding increase in Income Tax Expense. The Net Interest Income of the business segmentsbusinesses includes the results of a funds transfer pricing process that matches assets and liabilities with similar interest rate sensitivity and maturity characteristics. Net Interest Income of the business segments also includes an allocation of Net Interest Income generated by the Corporation’s ALM process. activities. Certain expenses not directly attributable to a specific business segment are allocated to the segments based on pre-determined means. The most significant of these expenses include data processing costs, item processing costs and certain centralized or shared functions. Data processing costs are allocated to the segments based on equipment usage. Item processing costs are allocated to the segments based on the volume of items processed for each segment. The costcosts of certain centralized or shared functions are allocated based on methodologies which reflect utilization. BANK OF AMERICA CORPORATION AND SUBSIDIARIES
Notes to Consolidated Financial Statements—(Continued)
The following table presents Total Revenue on a FTE basis and Net Income in 2006, 2005 2004 and 2003,2004, and Total Assets at December 31, 20052006 and 20042005 for each business segment, as well asAll Other. Business Segments At and for the Year Ended December 31
| | | | | | | | | | | | | | | | | | | | | | | | | | | Total Corporation
| | Global Consumer and
Small Business Banking(1)
| | | (Dollars in millions) | | 2005
| | | 2004 (Restated)
| | | 2003 (Restated)
| | 2005
| | | 2004
| | | 2003
| | Net interest income (FTE basis) | | $ | 31,569 | | | $ | 28,677 | | | $ | 21,149 | | $ | 17,053 | | | $ | 15,911 | | | $ | 11,052 | | Noninterest income | | | 25,354 | | | | 21,005 | | | | 17,329 | | | 11,823 | | | | 9,245 | | | | 8,542 | | | | |
|
|
| |
|
|
| |
|
| |
|
|
| |
|
|
| |
|
|
| Total revenue (FTE basis) | | | 56,923 | | | | 49,682 | | | | 38,478 | | | 28,876 | | | | 25,156 | | | | 19,594 | | Provision for credit losses | | | 4,014 | | | | 2,769 | | | | 2,839 | | | 4,271 | | | | 3,333 | | | | 1,694 | | Gains (losses) on sales of debt securities | | | 1,084 | | | | 1,724 | | | | 941 | | | (2 | ) | | | 117 | | | | 13 | | Amortization of intangibles | | | 809 | | | | 664 | | | | 217 | | | 551 | | | | 441 | | | | 139 | | Other noninterest expense | | | 27,872 | | | | 26,348 | | | | 19,938 | | | 12,889 | | | | 12,114 | | | | 9,460 | | | | |
|
|
| |
|
|
| |
|
| |
|
|
| |
|
|
| |
|
|
| Income before income taxes | | | 25,312 | | | | 21,625 | | | | 16,425 | | | 11,163 | | | | 9,385 | | | | 8,314 | | Income tax expense | | | 8,847 | | | | 7,678 | | | | 5,663 | | | 4,007 | | | | 3,414 | | | | 2,985 | | | | |
|
|
| |
|
|
| |
|
| |
|
|
| |
|
|
| |
|
|
| Net income | | $ | 16,465 | | | $ | 13,947 | | | $ | 10,762 | | $ | 7,156 | | | $ | 5,971 | | | $ | 5,329 | | | | |
|
|
| |
|
|
| |
|
| |
|
|
| |
|
|
| |
|
|
| Period-end total assets | | $ | 1,291,803 | | | $ | 1,110,432 | | | | | | $ | 335,551 | | | $ | 336,902 | | | | | | | | |
|
|
| |
|
|
| | | | |
|
|
| |
|
|
| | | | | | | | | | | Global Business
and Financial Services(1)
| | Global Capital Markets and
Investment Banking(1)
| | | (Dollars in millions) | | 2005
| | | 2004
| | | 2003
| | 2005
| | | 2004
| | | 2003
| | Net interest income (FTE basis) | | $ | 7,788 | | | $ | 6,534 | | | $ | 4,253 | | $ | 3,298 | | | $ | 4,058 | | | $ | 4,233 | | Noninterest income | | | 3,372 | | | | 2,717 | | | | 1,613 | | | 5,711 | | | | 4,988 | | | | 4,118 | | | | |
|
|
| |
|
|
| |
|
| |
|
|
| |
|
|
| |
|
|
| Total revenue (FTE basis) | | | 11,160 | | | | 9,251 | | | | 5,866 | | | 9,009 | | | | 9,046 | | | | 8,351 | | Provision for credit losses | | | (49 | ) | | | (442 | ) | | | 526 | | | (244 | ) | | | (445 | ) | | | 308 | | Gains (losses) on sales of debt securities | | | 146 | | | | — | | | | — | | | 117 | | | | (10 | ) | | | (14 | ) | Amortization of intangibles | | | 132 | | | | 113 | | | | 30 | | | 47 | | | | 43 | | | | 24 | | Other noninterest expense | | | 4,030 | | | | 3,485 | | | | 2,092 | | | 6,631 | | | | 6,538 | | | | 5,390 | | | | |
|
|
| |
|
|
| |
|
| |
|
|
| |
|
|
| |
|
|
| Income before income taxes | | | 7,193 | | | | 6,095 | | | | 3,218 | | | 2,692 | | | | 2,900 | | | | 2,615 | | Income tax expense | | | 2,631 | | | | 2,251 | | | | 1,145 | | | 956 | | | | 976 | | | | 865 | | | | |
|
|
| |
|
|
| |
|
| |
|
|
| |
|
|
| |
|
|
| Net income | | $ | 4,562 | | | $ | 3,844 | | | $ | 2,073 | | $ | 1,736 | | | $ | 1,924 | | | $ | 1,750 | | | | |
|
|
| |
|
|
| |
|
| |
|
|
| |
|
|
| |
|
|
| Period-end total assets | | $ | 237,679 | | | $ | 214,045 | | | | | | $ | 395,900 | | | $ | 303,897 | | | | | | | | |
|
|
| |
|
|
| | | | |
|
|
| |
|
|
| | | | | | | | | | | Global Wealth and
Investment Management(1)
| | All Other
| | | (Dollars in millions) | | 2005
| | | 2004
| | | 2003
| | 2005
| | | 2004 (Restated)
| | | 2003 (Restated)
| | Net interest income (FTE basis) | | $ | 3,770 | | | $ | 2,869 | | | $ | 1,954 | | $ | (340 | ) | | $ | (695 | ) | | $ | (343 | ) | Noninterest income | | | 3,623 | | | | 3,064 | | | | 2,078 | | | 825 | | | | 991 | | | | 978 | | | | |
|
|
| |
|
|
| |
|
| |
|
|
| |
|
|
| |
|
|
| Total revenue (FTE basis) | | | 7,393 | | | | 5,933 | | | | 4,032 | | | 485 | | | | 296 | | | | 635 | | Provision for credit losses | | | (5 | ) | | | (20 | ) | | | 11 | | | 41 | | | | 343 | | | | 300 | | Gains on sales of debt securities | | | — | | | | — | | | | — | | | 823 | | | | 1,617 | | | | 942 | | Amortization of intangibles | | | 74 | | | | 62 | | | | 20 | | | 5 | | | | 5 | | | | 4 | | Other noninterest expense | | | 3,598 | | | | 3,369 | | | | 2,075 | | | 724 | | | | 842 | | | | 921 | | | | |
|
|
| |
|
|
| |
|
| |
|
|
| |
|
|
| |
|
|
| Income before income taxes | | | 3,726 | | | | 2,522 | | | | 1,926 | | | 538 | | | | 723 | | | | 352 | | Income tax expense (benefit) | | | 1,338 | | | | 917 | | | | 687 | | | (85 | ) | | | 120 | | | | (19 | ) | | | |
|
|
| |
|
|
| |
|
| |
|
|
| |
|
|
| |
|
|
| Net income | | $ | 2,388 | | | $ | 1,605 | | | $ | 1,239 | | $ | 623 | | | $ | 603 | | | $ | 371 | | | | |
|
|
| |
|
|
| |
|
| |
|
|
| |
|
|
| |
|
|
| Period-end total assets | | $ | 127,156 | | | $ | 122,587 | | | | | | $ | 195,517 | | | $ | 133,001 | | | | | | | | |
|
|
| |
|
|
| | | | |
|
|
| |
|
|
| | | | |
| | | | | | | | | | | | | | | | | | | | | | | | | | At and for the Year Ended December 31 | | Total Corporation | | | Global Consumer and
Small Business Banking(1, 2) | | | (Dollars in millions) | | 2006 | | | 2005 | | | 2004 | | | 2006 | | | 2005 | | | 2004 | | Net interest income (FTE basis) | | $ | 35,815 | | | $ | 31,569 | | | $ | 28,677 | | | $ | 21,100 | | | $ | 16,898 | | | $ | 15,767 | | Noninterest income | | | 38,432 | | | | 25,354 | | | | 21,005 | | | | 20,591 | | | | 11,425 | | | | 8,958 | | Total revenue (FTE basis) | | | 74,247 | | | | 56,923 | | | | 49,682 | | | | 41,691 | | | | 28,323 | | | | 24,725 | | Provision for credit losses | | | 5,010 | | | | 4,014 | | | | 2,769 | | | | 5,172 | | | | 4,243 | | | | 3,331 | | Gains (losses) on sales of debt securities | | | (443 | ) | | | 1,084 | | | | 1,724 | | | | (1 | ) | | | (2 | ) | | | 117 | | Amortization of intangibles | | | 1,755 | | | | 809 | | | | 664 | | | | 1,511 | | | | 551 | | | | 441 | | Other noninterest expense | | | 33,842 | | | | 27,872 | | | | 26,348 | | | | 17,319 | | | | 12,573 | | | | 12,003 | | Income before income taxes | | | 33,197 | | | | 25,312 | | | | 21,625 | | | | 17,688 | | | | 10,954 | | | | 9,067 | | Income tax expense | | | 12,064 | | | | 8,847 | | | | 7,678 | | | | 6,517 | | | | 3,933 | | | | 3,300 | | Net income | | $ | 21,133 | | | $ | 16,465 | | | $ | 13,947 | | | $ | 11,171 | | | $ | 7,021 | | | $ | 5,767 | | Period-end total assets | | $ | 1,459,737 | | | $ | 1,291,803 | | | | | | | $ | 382,392 | | | $ | 331,259 | | | | | | | | | | | | Global Corporate and
Investment Banking(1) | | | Global Wealth and
Investment Management(1, 2) | | | (Dollars in millions) | | 2006 | | | 2005 | | | 2004 | | | 2006 | | | 2005 | | | 2004 | | Net interest income (FTE basis) | | $ | 10,693 | | | $ | 11,156 | | | $ | 10,670 | | | $ | 3,881 | | | $ | 3,820 | | | $ | 2,921 | | Noninterest income | | | 11,998 | | | | 9,444 | | | | 7,982 | | | | 3,898 | | | | 3,496 | | | | 3,079 | | Total revenue (FTE basis) | | | 22,691 | | | | 20,600 | | | | 18,652 | | | | 7,779 | | | | 7,316 | | | | 6,000 | | Provision for credit losses | | | (6 | ) | | | (291 | ) | | | (886 | ) | | | (40 | ) | | | (7 | ) | | | (22 | ) | Gains (losses) on sales of debt securities | | | 53 | | | | 263 | | | | (10 | ) | | | — | | | | — | | | | — | | Amortization of intangibles | | | 164 | | | | 174 | | | | 152 | | | | 76 | | | | 79 | | | | 66 | | Other noninterest expense | | | 11,834 | | | | 10,959 | | | | 10,149 | | | | 3,929 | | | | 3,631 | | | | 3,392 | | Income before income taxes | | | 10,752 | | | | 10,021 | | | | 9,227 | | | | 3,814 | | | | 3,613 | | | | 2,564 | | Income tax expense | | | 3,960 | | | | 3,637 | | | | 3,311 | | | | 1,411 | | | | 1,297 | | | | 932 | | Net income | | $ | 6,792 | | | $ | 6,384 | | | $ | 5,916 | | | $ | 2,403 | | | $ | 2,316 | | | $ | 1,632 | | Period-end total assets | | $ | 689,248 | | | $ | 633,362 | | | | | | | $ | 137,739 | | | $ | 129,232 | | | | | | | | | | | | | | All Other | | | | | | | | | | | | (Dollars in millions) | | 2006 | | | 2005 | | | 2004 | | | | | | | | | | | Net interest income (FTE basis) | | $ | 141 | | | $ | (305 | ) | | $ | (681 | ) | | | | | | | | | | | | | Noninterest income | | | 1,945 | | | | 989 | | | | 986 | | | | | | | | | | | | | | Total revenue (FTE basis) | | | 2,086 | | | | 684 | | | | 305 | | | | | | | | | | | | | | Provision for credit losses | | | (116 | ) | | | 69 | | | | 346 | | | | | | | | | | | | | | Gains (losses) on sales of debt securities | | | (495 | ) | | | 823 | | | | 1,617 | | | | | | | | | | | | | | Amortization of intangibles | | | 4 | | | | 5 | | | | 5 | | | | | | | | | | | | | | Other noninterest expense | | | 760 | | | | 709 | | | | 804 | | | | | | | | | | | | | | Income before income taxes | | | 943 | | | | 724 | | | | 767 | | | | | | | | | | | | | | Income tax expense (benefit) | | | 176 | | | | (20 | ) | | | 135 | | | | | | | | | | | | | | Net income | | $ | 767 | | | $ | 744 | | | $ | 632 | | | | | | | | | | | | | | Period-end total assets | | $ | 250,358 | | | $ | 197,950 | | | | | | | | | | | | | | | | | |
(1) | | There were no material intersegment revenues among the segments. |
(2) | Total Assets include asset allocations to match liabilities (i.e., deposits). |
BANK OF AMERICA CORPORATION AND SUBSIDIARIES
Notes to Consolidated Financial Statements—(Continued)
The following tables present reconciliations of the fourthree business segments’ Total Revenue on a FTE basis and Net Income to the Consolidated Statement of Income, and Total Assets to the Consolidated Balance Sheet. The adjustments presented in the table below include consolidated income and expense amounts not specifically allocated to individual business segments. | | | | | | | | | | | | | | | | Year Ended December 31
| | | (Dollars in millions) | | 2005
| | | 2004
(Restated)
| | | 2003
(Restated)
| | Segments’ total revenue (FTE basis) | | $ | 56,438 | | | $ | 49,386 | | | $ | 37,843 | | Adjustments: | | | | | | | | | | | | | ALM activities | | | (501 | ) | | | 20 | | | | 421 | | Equity investments | | | 1,372 | | | | 448 | | | | (256 | ) | Liquidating businesses | | | 214 | | | | 282 | | | | 324 | | FTE basis adjustment | | | (832 | ) | | | (717 | ) | | | (644 | ) | Other | | | (600 | ) | | | (454 | ) | | | 146 | | | | �� |
|
|
| |
|
|
| |
|
|
| Consolidated revenue | | $ | 56,091 | | | $ | 48,965 | | | $ | 37,834 | | | | |
|
|
| |
|
|
| |
|
|
| Segments’ net income | | $ | 15,842 | | | $ | 13,344 | | | $ | 10,391 | | Adjustments, net of taxes: | | | | | | | | | | | | | ALM activities(1) | | | 52 | | | | 869 | | | | 802 | | Equity investments | | | 796 | | | | 202 | | | | (246 | ) | Liquidating businesses | | | 109 | | | | 78 | | | | (21 | ) | Merger and restructuring charges | | | (275 | ) | | | (411 | ) | | | — | | Litigation expense | | | (33 | ) | | | 66 | | | | (150 | ) | Other | | | (26 | ) | | | (201 | ) | | | (14 | ) | | | |
|
|
| |
|
|
| |
|
|
| Consolidated net income | | $ | 16,465 | | | $ | 13,947 | | | $ | 10,762 | | | | |
|
|
| |
|
|
| |
|
|
|
| | | | | | | | | | | | | | | | Year Ended December 31 | | | (Dollars in millions) | | 2006 | | | 2005 | | | 2004 | | Segments’ total revenue (FTE basis) | | $ | 72,161 | | | $ | 56,239 | | | $ | 49,377 | | Adjustments: | | | | | | | | | | | | | ALM activities(1) | | | (441 | ) | | | (501 | ) | | | 20 | | Equity investment gains | | | 2,866 | | | | 1,964 | | | | 911 | | Liquidating businesses | | | 267 | | | | 214 | | | | 282 | | FTE basis adjustment | | | (1,224 | ) | | | (832 | ) | | | (717 | ) | Other | | | (606 | ) | | | (993 | ) | | | (908 | ) | Consolidated revenue | | $ | 73,023 | | | $ | 56,091 | | | $ | 48,965 | | | | | | Segments’ net income | | $ | 20,366 | | | $ | 15,721 | | | $ | 13,315 | | Adjustments, net of taxes: | | | | | | | | | | | | | ALM activities(1, 2, 3) | | | (816 | ) | | | 52 | | | | 869 | | Equity investment gains | | | 1,806 | | | | 1,257 | | | | 583 | | Liquidating businesses | | | 139 | | | | 109 | | | | 78 | | Merger and restructuring charges | | | (507 | ) | | | (275 | ) | | | (411 | ) | Other | | | 145 | | | | (399 | ) | | | (487 | ) | Consolidated net income | | $ | 21,133 | | | $ | 16,465 | | | $ | 13,947 | |
(1) | Includes Revenue associated with derivative instruments which did not qualify for SFAS 133 hedge accounting treatment of $(675) million and $86 million in 2005 and 2004. |
(2) | Includes Net Income associated with derivative instruments which did not qualify for SFAS 133 hedge accounting treatment of $(421) million and $(196) million in 2005 and 2004. |
(3) | Includes pre-tax Gains (Losses) on Sales of Debt Securities of $823$(494) million, $1,612$820 million and $938$1,613 million in 2006, 2005 and 2004, and 2003, respectively. |
| | | | December 31
| | | December 31 | | | (Dollars in millions) | | 2005
| | 2004
(Restated)
| | | 2006 | | 2005 | | Segments’ total assets | | $ | 1,096,286 | | | $ | 977,431 | | | | $ | 1,209,379 | | | $ | 1,093,853 | | Adjustments: | | | | | | | ALM activities, including securities portfolio | | | 365,068 | | | | 339,423 | | | | | 378,211 | | | | 365,060 | | Equity investments | | | 6,712 | | | | 7,625 | | | | | 15,639 | | | | 13,960 | | Liquidating businesses | | | 3,399 | | | | 4,390 | | | | | 3,280 | | | | 3,399 | | Elimination of excess earning asset allocations | | | (206,940 | ) | | | (232,954 | ) | | | Elimination of segment excess asset allocations to match liabilities | | | | (166,618 | ) | | | (204,788 | ) | Other | | | 27,278 | | | | 14,517 | | | | | 19,846 | | | | 20,319 | | | | |
|
|
| |
|
|
| | | Consolidated total assets | | $ | 1,291,803 | | | $ | 1,110,432 | | | | $ | 1,459,737 | | | $ | 1,291,803 | | | | |
|
|
| |
|
|
| | |
BANK OF AMERICA CORPORATION AND SUBSIDIARIES
Notes to Consolidated Financial Statements—(Continued)
Note 21—Parent Company Information
| | NOTE 21 – Parent Company Information |
The following tables present the Parent Company Only financial information: Condensed Statement of Income | | | | | | | | | | | | | Year Ended December 31
| | (Dollars in millions) | | 2005
| | 2004
(Restated)
| | 2003
(Restated)
| Income | | | | | | | | | | Dividends from subsidiaries: | | | | | | | | | | Bank subsidiaries | | $ | 10,400 | | $ | 8,100 | | $ | 8,950 | Other subsidiaries | | | 63 | | | 133 | | | 34 | Interest from subsidiaries | | | 2,581 | | | 1,085 | | | 610 | Other income | | | 1,719 | | | 2,463 | | | 2,717 | | | |
|
| |
|
| |
|
| Total income | | | 14,763 | | | 11,781 | | | 12,311 | | | |
|
| |
|
| |
|
| Expense | | | | | | | | | | Interest on borrowed funds | | | 3,843 | | | 2,876 | | | 2,153 | Noninterest expense | | | 2,636 | | | 2,057 | | | 2,310 | | | |
|
| |
|
| |
|
| Total expense | | | 6,479 | | | 4,933 | | | 4,463 | | | |
|
| |
|
| |
|
| Income before income taxes and equity in undistributed earnings of subsidiaries | | | 8,284 | | | 6,848 | | | 7,848 | Income tax benefit | | | 791 | | | 360 | | | 596 | | | |
|
| |
|
| |
|
| Income before equity in undistributed earnings of subsidiaries | | | 9,075 | | | 7,208 | | | 8,444 | Equity in undistributed earnings of subsidiaries: | | | | | | | | | | Bank subsidiaries | | | 6,518 | | | 6,165 | | | 2,224 | Other subsidiaries | | | 872 | | | 574 | | | 94 | | | |
|
| |
|
| |
|
| Total equity in undistributed earnings of subsidiaries | | | 7,390 | | | 6,739 | | | 2,318 | | | |
|
| |
|
| |
|
| Net income | | $ | 16,465 | | $ | 13,947 | | $ | 10,762 | | | |
|
| |
|
| |
|
| Net income available to common shareholders | | $ | 16,447 | | $ | 13,931 | | $ | 10,758 | | | |
|
| |
|
| |
|
|
| | | | | | | | | | | | | Year Ended December 31 | | (Dollars in millions) | | 2006 | | 2005 | | 2004 | Income | | | | | | | | | | Dividends from subsidiaries: | | | | | | | | | | Bank subsidiaries | | $ | 15,950 | | $ | 10,400 | | $ | 8,100 | Other subsidiaries | | | 111 | | | 63 | | | 133 | Interest from subsidiaries | | | 3,944 | | | 2,581 | | | 1,085 | Other income | | | 2,346 | | | 1,719 | | | 2,463 | Total income | | | 22,351 | | | 14,763 | | | 11,781 | Expense | | | | | | | | | | Interest on borrowed funds | | | 5,799 | | | 3,843 | | | 2,876 | Noninterest expense | | | 3,019 | | | 2,636 | | | 2,057 | Total expense | | | 8,818 | | | 6,479 | | | 4,933 | Income before income taxes and equity in undistributed earnings of subsidiaries | | | 13,533 | | | 8,284 | | | 6,848 | Income tax benefit | | | 1,002 | | | 791 | | | 360 | Income before equity in undistributed earnings of subsidiaries | | | 14,535 | | | 9,075 | | | 7,208 | Equity in undistributed earnings of subsidiaries: | | | | | | | | | | Bank subsidiaries | | | 5,613 | | | 6,518 | | | 6,165 | Other subsidiaries | | | 985 | | | 872 | | | 574 | Total equity in undistributed earnings of subsidiaries | | | 6,598 | | | 7,390 | | | 6,739 | Net income | | $ | 21,133 | | $ | 16,465 | | $ | 13,947 | Net income available to common shareholders | | $ | 21,111 | | $ | 16,447 | | $ | 13,931 |
Condensed Balance Sheet | | | | December 31
| | December 31 | | (Dollars in millions) | | 2005
| | 2004
(Restated)
| | 2006 | | 2005 | Assets | | | | | | | | | Cash held at bank subsidiaries | | $ | 49,670 | | $ | 47,138 | | $ | 54,989 | | $ | 49,670 | Securities | | | 2,285 | | | 2,694 | | | 2,932 | | | 2,285 | Receivables from subsidiaries: | | | | | | | | | Bank subsidiaries | | | 14,581 | | | 10,531 | | | 17,063 | | | 14,581 | Other subsidiaries | | | 18,766 | | | 19,897 | | | 20,661 | | | 18,766 | Investments in subsidiaries: | | | | | | | | | Bank subsidiaries | | | 119,210 | | | 114,334 | | | 162,291 | | | 119,210 | Other subsidiaries | | | 2,472 | | | 1,499 | | | 6,488 | | | 2,472 | Other assets | | | 13,685 | | | 14,036 | | | 19,118 | | | 13,685 | | | |
|
| |
|
| | Total assets | | $ | 220,669 | | $ | 210,129 | | $ | 283,542 | | $ | 220,669 | | | |
|
| |
|
| | Liabilities and shareholders’ equity | | | | | | | | | Commercial paper and other short-term borrowings | | $ | 19,333 | | $ | 19,611 | | $ | 31,852 | | $ | 19,333 | Accrued expenses and other liabilities | | | 7,228 | | | 7,124 | | | 9,929 | | | 7,228 | Payables to subsidiaries: | | | | | | | | | Bank subsidiaries | | | 1,824 | | | 487 | | | 857 | | | 1,824 | Other subsidiaries | | | 2,479 | | | 765 | | | 76 | | | 2,479 | Long-term debt | | | 88,272 | | | 81,907 | | | 105,556 | | | 88,272 | Shareholders’ equity | | | 101,533 | | | 100,235 | | | 135,272 | | | 101,533 | | | |
|
| |
|
| | Total liabilities and shareholders’ equity | | $ | 220,669 | | $ | 210,129 | | $ | 283,542 | | $ | 220,669 | | | |
|
| |
|
| |
BANK OF AMERICA CORPORATION AND SUBSIDIARIES
Notes to Consolidated Financial Statements—(Continued)
Condensed Statement of Cash Flows | | | | Year Ended December 31
| | | Year Ended December 31 | | | (Dollars in millions) | | 2005
| | 2004
(Restated)
| | 2003
(Restated)
| | | 2006 | | 2005 | | 2004 | | Operating activities | | | | | | | | | Net income | | $ | 16,465 | | | $ | 13,947 | | | $ | 10,762 | | | $ | 21,133 | | | $ | 16,465 | | | $ | 13,947 | | Reconciliation of net income to net cash provided by operating activities: | | | | | | | | | Equity in undistributed losses of subsidiaries | | | (7,390 | ) | | | (6,739 | ) | | | (2,318 | ) | | Equity in undistributed earnings of subsidiaries | | | | (6,598 | ) | | | (7,390 | ) | | | (6,739 | ) | Other operating activities, net | | | (1,035 | ) | | | (1,487 | ) | | | 295 | | | | 2,159 | | | | (1,035 | ) | | | (1,487 | ) | | | |
|
|
| |
|
|
| |
|
|
| | Net cash provided by operating activities | | | 8,040 | | | | 5,721 | | | | 8,739 | | | | 16,694 | | | | 8,040 | | | | 5,721 | | | | |
|
|
| |
|
|
| |
|
|
| | Investing activities | | | | | | | | | Net (purchases) sales of securities | | | 403 | | | | (1,348 | ) | | | (59 | ) | | | (705 | ) | | | 403 | | | | (1,348 | ) | Net payments from (to) subsidiaries | | | (3,145 | ) | | | 821 | | | | (1,160 | ) | | | (13,673 | ) | | | (3,145 | ) | | | 821 | | Other investing activities, net | | | (3,001 | ) | | | 3,348 | | | | (1,598 | ) | | | (1,300 | ) | | | (3,001 | ) | | | 3,348 | | | | |
|
|
| |
|
|
| |
|
|
| | Net cash provided by (used in) investing activities | | | (5,743 | ) | | | 2,821 | | | | (2,817 | ) | | | (15,678 | ) | | | (5,743 | ) | | | 2,821 | | | | |
|
|
| |
|
|
| |
|
|
| | Financing activities | | | | | | | | | Net increase (decrease) in commercial paper and other short-term borrowings | | | (292 | ) | | | 15,937 | | | | 2,482 | | | | 12,519 | | | | (292 | ) | | | 15,937 | | Proceeds from issuance of long-term debt | | | 20,477 | | | | 19,965 | | | | 14,713 | | | | 28,412 | | | | 20,477 | | | | 19,965 | | Retirement of long-term debt | | | (11,053 | ) | | | (9,220 | ) | | | (5,928 | ) | | | (15,506 | ) | | | (11,053 | ) | | | (9,220 | ) | Proceeds from issuance of preferred stock | | | | 2,850 | | | | — | | | | — | | Redemption of preferred stock | | | | (270 | ) | | | — | | | | — | | Proceeds from issuance of common stock | | | 3,077 | | | | 3,939 | | | | 4,249 | | | | 3,117 | | | | 2,846 | | | | 3,712 | | Common stock repurchased | | | (5,765 | ) | | | (6,286 | ) | | | (9,766 | ) | | | (14,359 | ) | | | (5,765 | ) | | | (6,286 | ) | Cash dividends paid | | | (7,683 | ) | | | (6,468 | ) | | | (4,281 | ) | | | (9,661 | ) | | | (7,683 | ) | | | (6,468 | ) | Other financing activities, net | | | 1,474 | | | | 293 | | | | 201 | | | | (2,799 | ) | | | 1,705 | | | | 520 | | | | |
|
|
| |
|
|
| |
|
|
| | Net cash provided by financing activities | | | 235 | | | | 18,160 | | | | 1,670 | | | | 4,303 | | | | 235 | | | | 18,160 | | | | |
|
|
| |
|
|
| |
|
|
| | Net increase in cash held at bank subsidiaries | | | 2,532 | | | | 26,702 | | | | 7,592 | | | | 5,319 | | | | 2,532 | | | | 26,702 | | Cash held at bank subsidiaries at January 1 | | | 47,138 | | | | 20,436 | | | | 12,844 | | | | 49,670 | | | | 47,138 | | | | 20,436 | | | | |
|
|
| |
|
|
| |
|
|
| | Cash held at bank subsidiaries at December 31 | | $ | 49,670 | | | $ | 47,138 | | | $ | 20,436 | | | $ | 54,989 | | | $ | 49,670 | | | $ | 47,138 | | | | |
|
|
| |
|
|
| |
|
|
| |
BANK OF AMERICA CORPORATION AND SUBSIDIARIES
Notes to Consolidated Financial Statements—(Continued)
Note 22—Performance by Geographical Area
| | NOTE 22 – Performance by Geographical Area |
Since the Corporation’s operations are highly integrated, certain asset, liability, income and expense amounts must be allocated to arrive at Total Assets, Total Revenue, Income (Loss) Before Income Taxes and Net Income (Loss) by geographic area. The Corporation identifies its geographic performance based upon the business unit structure used to manage the capital or expense deployed in the region as applicable. This requires certain judgments related to the allocation of revenue so that revenue can be appropriately matched with the related expense or capital deployed in the region. | | | | | | | | | | | | | | | | | | Year | | At December 31 | | Year Ended December 31 | | (Dollars in millions) | | | Total Assets(1) | | Total
Revenue (2) | | Income
Before
Income Taxes | | Net
Income | Domestic(3) | | 2006 | | $ | 1,300,711 | | $ | 64,189 | | $ | 28,041 | | $ | 18,605 | | | 2005 | | | 1,183,953 | | | 51,860 | | | 21,880 | | | 14,778 | | | | 2004 | | | | | | 45,767 | | | 19,369 | | | 12,943 | Asia | | 2006 | | | 32,886 | | | 1,117 | | | 637 | | | 420 | | | 2005 | | | 32,272 | | | 909 | | | 521 | | | 344 | | | 2004 | | | | | | 718 | | | 286 | | | 204 | Europe, Middle East and Africa | | 2006 | | | 113,129 | | | 5,470 | | | 1,843 | | | 1,193 | | | 2005 | | | 57,226 | | | 1,783 | | | 920 | | | 603 | | | 2004 | | | | | | 1,420 | | | 605 | | | 395 | Latin America and the Caribbean | | 2006 | | | 13,011 | | | 2,247 | | | 1,452 | | | 915 | | | 2005 | | | 18,352 | | | 1,539 | | | 1,159 | | | 740 | | | | 2004 | | | | | | 1,060 | | | 648 | | | 405 | Total Foreign | | 2006 | | | 159,026 | | | 8,834 | | | 3,932 | | | 2,528 | | | 2005 | | | 107,850 | | | 4,231 | | | 2,600 | | | 1,687 | | | | 2004 | | | | | | 3,198 | | | 1,539 | | | 1,004 | Total Consolidated | | 2006 | | $ | 1,459,737 | | $ | 73,023 | | $ | 31,973 | | $ | 21,133 | | | 2005 | | | 1,291,803 | | | 56,091 | | | 24,480 | | | 16,465 | | | | 2004 | | | | | | 48,965 | | | 20,908 | | | 13,947 |
| | | | | | | | | | | | | | | | | | | | | At December 31
| | Year Ended December 31
| | (Dollars in millions) | | Year
| | Total
Assets(1)
| | Total
Revenue(2)
| | Income (Loss)
Before Income
Taxes
| | | Net
Income
(Loss)
| | Domestic(3)(1)
(Restated)
(Restated)
| | 2005
2004
2003 | | $
| 1,195,212
1,046,727 | | $
| 52,714
46,252
36,444 | | $
| 22,790
19,852
15,859 |
| | $
| 15,357
13,246
10,786 |
| | | | | | | Asia
| | 2005
2004
2003 | |
| 28,442
21,658 | |
| 727
674
416 | |
| 360
260
57 |
| |
| 255
192
54 |
| | | | | | | Europe, Middle East and Africa
| | 2005
2004
2003 | |
| 51,917
27,580 | |
| 1,257
1,136
850 | |
| 355
335
25 |
| |
| 229
224
23 |
| | | | | | | Latin America and the Caribbean
| | 2005
2004
2003 | |
| 16,232
14,467 | |
| 1,393
903
124 | |
| 975
461
(160 |
) | |
| 624
285
(101 |
) | | | | | | | Total Foreign
| | 2005
2004
2003 | |
| 96,591
63,705 | |
| 3,377
2,713
1,390 | |
| 1,690
1,056
(78 |
) | |
| 1,108
701
(24 |
) | | | | | | | Total Consolidated
(Restated)
(Restated)
| | 2005
2004
2003 | | $
| 1,291,803
1,110,432 | | $
| 56,091
48,965
37,834 | | $
| 24,480
20,908
15,781 |
| | $
| 16,465
13,947
10,762 |
|
(1) | | Total Assets includes long-lived assets, which are primarily located in the U.S. |
(2) | | There were no material intercompany revenues between geographic regions for any of the periods presented. |
(3) | | Includes the Corporation’s Canadian operations, which had Total Assets of $4,052 million$7.9 billion and $4,849 million$4.3 billion at December 31, 20052006 and 2004;2005; Total Revenue of $113$641 million, $88$115 million and $96$90 million; Income beforeBefore Income Taxes of $66$244 million, $49$67 million and $60$49 million; and Net Income of $159 million, $56 million $41 million, and $12$41 million for the years ended December 31, 2006, 2005 and 2004, and 2003.respectively. |
BANK OF AMERICA CORPORATION AND SUBSIDIARIES
Notes to Consolidated Financial Statements—(Continued)
Note 23—Restatement of Quarterly Financial Statements (unaudited)
Consolidated Statement of Income
The following tables set forth the effects of the restatement for the quarters in 2005 and 2004.
| | | | | | | | | | | | | | | | | | | | | | | | | | | | | | 2005 Quarters
| | | | Fourth
| | | Third
| | | Second
| | First
| (Dollars in millions, except per
share information) | | As Previously
Reported(1)
| | Restated
| | | As Previously
Reported
| | Restated
| | | As Previously
Reported
| | Restated
| | As Previously
Reported
| | Restated
| Interest income | | | | | | | | | | | | | | | | | | | | | | | | | | | Interest and fees on loans and leases | | $ | 9,559 | | $ | 9,536 | | | $ | 8,956 | | $ | 8,933 | | | $ | 8,312 | | $ | 8,294 | | $ | 8,107 | | $ | 8,080 | Interest and dividends on securities | | | 2,819 | | | 2,815 | | | | 2,797 | | | 2,793 | | | | 2,799 | | | 2,796 | | | 2,534 | | | 2,533 | Federal funds sold and securities purchased under agreements to resell | | | 1,462 | | | 1,477 | | | | 1,372 | | | 1,382 | | | | 1,252 | | | 1,249 | | | 893 | | | 904 | Trading account assets | | | 1,585 | | | 1,585 | | | | 1,550 | | | 1,550 | | | | 1,426 | | | 1,426 | | | 1,182 | | | 1,182 | Other interest income | | | 605 | | | 605 | | | | 547 | | | 547 | | | | 502 | | | 502 | | | 437 | | | 437 | | | |
|
| |
|
|
| |
|
| |
|
|
| |
|
| |
|
| |
|
| |
|
| Total interest income | | | 16,030 | | | 16,018 | | | | 15,222 | | | 15,205 | | | | 14,291 | | | 14,267 | | | 13,153 | | | 13,136 | | | |
|
| |
|
|
| |
|
| |
|
|
| |
|
| |
|
| |
|
| |
|
| Interest expense | | | | | | | | | | | | | | | | | | | | | | | | | | | Deposits | | | 2,434 | | | 2,476 | �� | | | 2,439 | | | 2,471 | | | | 2,379 | | | 2,363 | | | 2,043 | | | 2,182 | Short-term borrowings | | | 3,902 | | | 3,855 | | | | 3,250 | | | 3,190 | | | | 2,677 | | | 2,582 | | | 1,969 | | | 1,988 | Trading account liabilities | | | 619 | | | 619 | | | | 707 | | | 707 | | | | 611 | | | 611 | | | 427 | | | 427 | Long-term debt | | | 1,215 | | | 1,209 | | | | 1,053 | | | 1,102 | | | | 974 | | | 1,074 | | | 841 | | | 1,033 | | | |
|
| |
|
|
| |
|
| |
|
|
| |
|
| |
|
| |
|
| |
|
| Total interest expense | | | 8,170 | | | 8,159 | | | | 7,449 | | | 7,470 | | | | 6,641 | | | 6,630 | | | 5,280 | | | 5,630 | | | |
|
| |
|
|
| |
|
| |
|
|
| |
|
| |
|
| |
|
| |
|
| Net interest income | | | 7,860 | | | 7,859 | | | | 7,773 | | | 7,735 | | | | 7,650 | | | 7,637 | | | 7,873 | | | 7,506 | | | | | | | | | | Noninterest income | | | | | | | | | | | | | | | | | | | | | | | | | | | Service charges | | | 1,927 | | | 1,927 | | | | 2,080 | | | 2,080 | | | | 1,920 | | | 1,920 | | | 1,777 | | | 1,777 | Investment and brokerage services | | | 1,062 | | | 1,062 | | | | 1,060 | | | 1,060 | | | | 1,049 | | | 1,049 | | | 1,013 | | | 1,013 | Mortgage banking income | | | 215 | | | 215 | | | | 180 | | | 180 | | | | 189 | | | 189 | | | 221 | | | 221 | Investment banking income | | | 537 | | | 537 | | | | 522 | | | 522 | | | | 431 | | | 431 | | | 366 | | | 366 | Equity investment gains | | | 481 | | | 481 | | | | 668 | | | 668 | | | | 492 | | | 492 | | | 399 | | | 399 | Card income | | | 1,507 | | | 1,507 | | | | 1,520 | | | 1,520 | | | | 1,437 | | | 1,437 | | | 1,289 | | | 1,289 | Trading account profits | | | 253 | | | 253 | | | | 514 | | | 514 | | | | 285 | | | 285 | | | 760 | | | 760 | Other income | | | 280 | | | (31 | ) | | | 290 | | | (128 | ) | | | 562 | | | 1,152 | | | 324 | | | 207 | | | |
|
| |
|
|
| |
|
| |
|
|
| |
|
| |
|
| |
|
| |
|
| Total noninterest income | | | 6,262 | | | 5,951 | | | | 6,834 | | | 6,416 | | | | 6,365 | | | 6,955 | | | 6,149 | | | 6,032 | | | |
|
| |
|
|
| |
|
| |
|
|
| |
|
| |
|
| |
|
| |
|
| Total revenue | | | 14,122 | | | 13,810 | | | | 14,607 | | | 14,151 | | | | 14,015 | | | 14,592 | | | 14,022 | | | 13,538 | | | | | | | | | | Provision for credit losses | | | 1,400 | | | 1,400 | | | | 1,159 | | | 1,159 | | | | 875 | | | 875 | | | 580 | | | 580 | | | | | | | | | | Gains on sales of debt securities | | | 71 | | | 71 | | | | 29 | | | 29 | | | | 325 | | | 325 | | | 659 | | | 659 | | | | | | | | | | Noninterest expense | | | | | | | | | | | | | | | | | | | | | | | | | | | Personnel | | | 3,845 | | | 3,845 | | | | 3,837 | | | 3,837 | | | | 3,671 | | | 3,671 | | | 3,701 | | | 3,701 | Occupancy | | | 699 | | | 699 | | | | 638 | | | 638 | | | | 615 | | | 615 | | | 636 | | | 636 | Equipment | | | 305 | | | 305 | | | | 300 | | | 300 | | | | 297 | | | 297 | | | 297 | | | 297 | Marketing | | | 265 | | | 265 | | | | 307 | | | 307 | | | | 346 | | | 346 | | | 337 | | | 337 | Professional fees | | | 283 | | | 283 | | | | 254 | | | 254 | | | | 216 | | | 216 | | | 177 | | | 177 | Amortization of intangibles | | | 196 | | | 196 | | | | 201 | | | 201 | | | | 204 | | | 204 | | | 208 | | | 208 | Data processing | | | 394 | | | 394 | | | | 361 | | | 361 | | | | 368 | | | 368 | | | 364 | | | 364 | Telecommunications | | | 219 | | | 219 | | | | 206 | | | 206 | | | | 196 | | | 196 | | | 206 | | | 206 | Other general operating | | | 1,055 | | | 1,055 | | | | 1,061 | | | 1,061 | | | | 985 | | | 985 | | | 1,019 | | | 1,019 | Merger and restructuring charges | | | 59 | | | 59 | | | | 120 | | | 120 | | | | 121 | | | 121 | | | 112 | | | 112 | | | |
|
| |
|
|
| |
|
| |
|
|
| |
|
| |
|
| |
|
| |
|
| Total noninterest expense | | | 7,320 | | | 7,320 | | | | 7,285 | | | 7,285 | | | | 7,019 | | | 7,019 | | | 7,057 | | | 7,057 | | | |
|
| |
|
|
| |
|
| |
|
|
| |
|
| |
|
| |
|
| |
|
| Income before income taxes | | | 5,473 | | | 5,161 | | | | 6,192 | | | 5,736 | | | | 6,446 | | | 7,023 | | | 7,044 | | | 6,560 | Income tax expense | | | 1,705 | | | 1,587 | | | | 2,065 | | | 1,895 | | | | 2,150 | | | 2,366 | | | 2,349 | | | 2,167 | | | |
|
| |
|
|
| |
|
| |
|
|
| |
|
| |
|
| |
|
| |
|
| Net income | | $ | 3,768 | | $ | 3,574 | | | $ | 4,127 | | $ | 3,841 | | | $ | 4,296 | | $ | 4,657 | | $ | 4,695 | | $ | 4,393 | | | |
|
| |
|
|
| |
|
| |
|
|
| |
|
| |
|
| |
|
| |
|
| Net income available to common shareholders | | $ | 3,764 | | $ | 3,570 | | | $ | 4,122 | | $ | 3,836 | | | $ | 4,292 | | $ | 4,653 | | $ | 4,690 | | $ | 4,388 | | | |
|
| |
|
|
| |
|
| |
|
|
| |
|
| |
|
| |
|
| |
|
| Per common share information | | | | | | | | | | | | | | | | | | | | | | | | | | | Earnings | | $ | 0.94 | | $ | 0.89 | | | $ | 1.03 | | $ | 0.96 | | | $ | 1.07 | | $ | 1.16 | | $ | 1.16 | | $ | 1.09 | | | |
|
| |
|
|
| |
|
| |
|
|
| |
|
| |
|
| |
|
| |
|
| Diluted earnings | | $ | 0.93 | | $ | 0.88 | | | $ | 1.02 | | $ | 0.95 | | | $ | 1.06 | | $ | 1.14 | | $ | 1.14 | | $ | 1.07 | | | |
|
| |
|
|
| |
|
| |
|
|
| |
|
| |
|
| |
|
| |
|
| Dividends paid | | $ | 0.50 | | $ | 0.50 | | | $ | 0.50 | | $ | 0.50 | | | $ | 0.45 | | $ | 0.45 | | $ | 0.45 | | $ | 0.45 | | | |
|
| |
|
|
| |
|
| |
|
|
| |
|
| |
|
| |
|
| |
|
| Average common shares issued and outstanding (in thousands) | | | 3,996,024 | | | 3,996,024 | | | | 4,000,573 | | | 4,000,573 | | | | 4,005,356 | | | 4,005,356 | | | 4,032,550 | | | 4,032,550 | | | |
|
| |
|
|
| |
|
| |
|
|
| |
|
| |
|
| |
|
| |
|
| Average diluted common shares issued and outstanding (in thousands) | | | 4,053,859 | | | 4,053,859 | | | | 4,054,659 | | | 4,054,659 | | | | 4,065,355 | | | 4,065,355 | | | 4,099,062 | | | 4,099,062 | | | |
|
| |
|
|
| |
|
| |
|
|
| |
|
| |
|
| |
|
| |
|
|
(1) | | The Corporation provided unaudited financial information relating to the fourth quarter of 2005Item 9. Changes in its current reportand Disagreements with Accountants on Form 8-K filed on January 23, 2006.Accounting and Financial Disclosure |
BANK OF AMERICA CORPORATION AND SUBSIDIARIES
Notes to Consolidated Financial Statements—(Continued)
Consolidated Statement of Income
| | | | | | | | | | | | | | | | | | | | | | | | | | | | | | | 2004 Quarters
| | | | Fourth
| | Third
| | | Second
| | | First
| (Dollars in millions, except per
share information) | | As Previously
Reported
| | Restated
| | As Previously
Reported
| | | Restated
| | | As Previously
Reported
| | Restated
| | | As Previously
Reported
| | Restated
| Interest income | | | | | | | | | | | | | | | | | | | | | | | | | | | | Interest and fees on loans and leases | | $ | 7,919 | | $ | 7,877 | | $ | 7,508 | | | $ | 7,499 | | | $ | 7,237 | | $ | 7,183 | | | $ | 5,549 | | $ | 5,492 | Interest and dividends on securities | | | 2,065 | | | 2,063 | | | 2,078 | | | | 2,076 | | | | 1,907 | | | 1,907 | | | | 1,212 | | | 1,210 | Federal funds sold and securities purchased under agreements to resell | | | 712 | | | 699 | | | 484 | | | | 464 | | | | 413 | | | 385 | | | | 434 | | | 392 | Trading account assets | | | 1,035 | | | 1,035 | | | 960 | | | | 960 | | | | 1,009 | | | 1,009 | | | | 1,012 | | | 1,012 | Other interest income | | | 464 | | | 464 | | | 457 | | | | 457 | | | | 424 | | | 424 | | | | 345 | | | 345 | | | |
|
| |
|
| |
|
|
| |
|
|
| |
|
| |
|
|
| |
|
| |
|
| Total interest income | | | 12,195 | | | 12,138 | | | 11,487 | | | | 11,456 | | | | 10,990 | | | 10,908 | | | | 8,552 | | | 8,451 | | | |
|
| |
|
| |
|
|
| |
|
|
| |
|
| |
|
|
| |
|
| |
|
| Interest expense | | | | | | | | | | | | | | | | | | | | | | | | | | | | Deposits | | | 1,829 | | | 1,764 | | | 1,711 | | | | 1,616 | | | | 1,529 | | | 1,427 | | | | 1,206 | | | 1,114 | Short-term borrowings | | | 1,543 | | | 1,452 | | | 1,152 | | | | 1,050 | | | | 1,019 | | | 910 | | | | 720 | | | 660 | Trading account liabilities | | | 352 | | | 352 | | | 333 | | | | 333 | | | | 298 | | | 298 | | | | 334 | | | 334 | Long-term debt | | | 724 | | | 1,020 | | | 626 | | | | 942 | | | | 563 | | | 907 | | | | 491 | | | 814 | | | |
|
| |
|
| |
|
|
| |
|
|
| |
|
| |
|
|
| |
|
| |
|
| Total interest expense | | | 4,448 | | | 4,588 | | | 3,822 | | | | 3,941 | | | | 3,409 | | | 3,542 | | | | 2,751 | | | 2,922 | | | |
|
| |
|
| |
|
|
| |
|
|
| |
|
| |
|
|
| |
|
| |
|
| Net interest income | | | 7,747 | | | 7,550 | | | 7,665 | | | | 7,515 | | | | 7,581 | | | 7,366 | | | | 5,801 | | | 5,529 | | | | | | | | | | Noninterest income | | | | | | | | | | | | | | | | | | | | | | | | | | | | Service charges | | | 1,891 | | | 1,891 | | | 1,899 | | | | 1,899 | | | | 1,783 | | | 1,783 | | | | 1,416 | | | 1,416 | Investment and brokerage services | | | 1,008 | | | 1,008 | | | 972 | | | | 972 | | | | 999 | | | 999 | | | | 635 | | | 635 | Mortgage banking income | | | 156 | | | 156 | | | (250 | ) | | | (250 | ) | | | 299 | | | 299 | | | | 209 | | | 209 | Investment banking income | | | 497 | | | 497 | | | 438 | | | | 438 | | | | 547 | | | 547 | | | | 404 | | | 404 | Equity investment gains | | | 426 | | | 426 | | | 220 | | | | 220 | | | | 84 | | | 84 | | | | 133 | | | 133 | Card income | | | 1,380 | | | 1,380 | | | 1,258 | | | | 1,258 | | | | 1,159 | | | 1,159 | | | | 795 | | | 795 | Trading account profits | | | 269 | | | 269 | | | 184 | | | | 184 | | | | 413 | | | 414 | | | | 3 | | | 2 | Other income | | | 339 | | | 547 | | | 201 | | | | 1,291 | | | | 183 | | | (415 | ) | | | 135 | | | 355 | | | |
|
| |
|
| |
|
|
| |
|
|
| |
|
| |
|
|
| |
|
| |
|
| Total noninterest income | | �� | 5,966 | | | 6,174 | | | 4,922 | | | | 6,012 | | | | 5,467 | | | 4,870 | | | | 3,730 | | | 3,949 | | | |
|
| |
|
| |
|
|
| |
|
|
| |
|
| |
|
|
| |
|
| |
|
| | | | | | | | | | Total revenue | | | 13,713 | | | 13,724 | | | 12,587 | | | | 13,527 | | | | 13,048 | | | 12,236 | | | | 9,531 | | | 9,478 | | | | | | | | | | Provision for credit losses | | | 706 | | | 706 | | | 650 | | | | 650 | | | | 789 | | | 789 | | | | 624 | | | 624 | | | | | | | | | | Gains on sales of debt securities | | | 101 | | | 101 | | | 732 | | | | 333 | | | | 795 | | | 795 | | | | 495 | | | 495 | | | | | | | | | | Noninterest expense | | | | | | | | | | | | | | | | | | | | | | | | | | | | Personnel | | | 3,520 | | | 3,520 | | | 3,534 | | | | 3,534 | | | | 3,629 | | | 3,629 | | | | 2,752 | | | 2,752 | Occupancy | | | 648 | | | 648 | | | 622 | | | | 622 | | | | 621 | | | 621 | | | | 488 | | | 488 | Equipment | | | 326 | | | 326 | | | 309 | | | | 309 | | | | 318 | | | 318 | | | | 261 | | | 261 | Marketing | | | 337 | | | 337 | | | 364 | | | | 364 | | | | 367 | | | 367 | | | | 281 | | | 281 | Professional fees | | | 275 | | | 275 | | | 207 | | | | 207 | | | | 194 | | | 194 | | | | 160 | | | 160 | Amortization of intangibles | | | 209 | | | 209 | | | 200 | | | | 200 | | | | 201 | | | 201 | | | | 54 | | | 54 | Data processing | | | 371 | | | 371 | | | 341 | | | | 341 | | | | 333 | | | 333 | | | | 284 | | | 284 | Telecommunications | | | 216 | | | 216 | | | 180 | | | | 180 | | | | 183 | | | 183 | | | | 151 | | | 151 | Other general operating | | | 1,159 | | | 1,159 | | | 1,043 | | | | 1,043 | | | | 1,257 | | | 1,257 | | | | 999 | | | 999 | Merger and restructuring charges | | | 272 | | | 272 | | | 221 | | | | 221 | | | | 125 | | | 125 | | | | — | | | — | | | |
|
| |
|
| |
|
|
| |
|
|
| |
|
| |
|
|
| |
|
| |
|
| Total noninterest expense | | | 7,333 | | | 7,333 | | | 7,021 | | | | 7,021 | | | | 7,228 | | | 7,228 | | | | 5,430 | | | 5,430 | | | |
|
| |
|
| |
|
|
| |
|
|
| |
|
| |
|
|
| |
|
| |
|
| Income before income taxes | | | 5,775 | | | 5,786 | | | 5,648 | | | | 6,189 | | | | 5,826 | | | 5,014 | | | | 3,972 | | | 3,919 | Income tax expense | | | 1,926 | | | 1,931 | | | 1,884 | | | | 2,086 | | | | 1,977 | | | 1,673 | | | | 1,291 | | | 1,271 | | | |
|
| |
|
| |
|
|
| |
|
|
| |
|
| |
|
|
| |
|
| |
|
| Net income | | $ | 3,849 | | $ | 3,855 | | $ | 3,764 | | | $ | 4,103 | | | $ | 3,849 | | $ | 3,341 | | | $ | 2,681 | | $ | 2,648 | | | |
|
| |
|
| |
|
|
| |
|
|
| |
|
| |
|
|
| |
|
| |
|
| Net income available to common shareholders | | $ | 3,844 | | $ | 3,850 | | $ | 3,759 | | | $ | 4,098 | | | $ | 3,844 | | $ | 3,336 | | | $ | 2,680 | | $ | 2,647 | | | |
|
| |
|
| |
|
|
| |
|
|
| |
|
| |
|
|
| |
|
| |
|
| Per common share information | | | | | | | | | | | | | | | | | | | | | | | | | | | | Earnings | | $ | 0.95 | | $ | 0.95 | | $ | 0.93 | | | $ | 1.01 | | | $ | 0.95 | | $ | 0.82 | | | $ | 0.93 | | $ | 0.92 | | | |
|
| |
|
| |
|
|
| |
|
|
| |
|
| |
|
|
| |
|
| |
|
| Diluted earnings | | $ | 0.94 | | $ | 0.94 | | $ | 0.91 | | | $ | 0.99 | | | $ | 0.93 | | $ | 0.81 | | | $ | 0.91 | | $ | 0.90 | | | |
|
| |
|
| |
|
|
| |
|
|
| |
|
| |
|
|
| |
|
| |
|
| Dividends paid | | $ | 0.45 | | $ | 0.45 | | $ | 0.45 | | | $ | 0.45 | | | $ | 0.40 | | $ | 0.40 | | | $ | 0.40 | | $ | 0.40 | | | |
|
| |
|
| |
|
|
| |
|
|
| |
|
| |
|
|
| |
|
| |
|
| Average common shares issued and outstanding (in thousands) | | | 4,032,979 | | | 4,032,979 | | | 4,052,304 | | | | 4,052,304 | | | | 4,062,384 | | | 4,062,384 | | | | 2,880,306 | | | 2,880,306 | | | |
|
| |
|
| |
|
|
| |
|
|
| |
|
| |
|
|
| |
|
| |
|
| Average diluted common shares issued and outstanding (in thousands) | | | 4,106,040 | | | 4,106,040 | | | 4,121,375 | | | | 4,121,375 | | | | 4,131,290 | | | 4,131,290 | | | | 2,933,402 | | | 2,933,402 | | | |
|
| |
|
| |
|
|
| |
|
|
| |
|
| |
|
|
| |
|
| |
|
|
BANK OF AMERICA CORPORATION AND SUBSIDIARIES
Notes to Consolidated Financial Statements—(Continued)
Consolidated Balance Sheet
| | | | | | | | | | | | | | | | | | | | | | | | | | | | | | | | | | | | 2005 Quarters
| | | | | Fourth
| | | Third
| | | Second
| | | First
| | | (Dollars in millions) | | As
Previously
Reported(1)
| | | Restated
| | | As
Previously
Reported
| | | Restated
| | | As
Previously
Reported
| | | Restated
| | | As
Previously
Reported
| | | Restated
| | Assets | | | | | | | | | | | | | | | | | | | | | | | | | | | | | | | | | Cash and cash equivalents | | $ | 36,999 | | | $ | 36,999 | | | $ | 32,771 | | | $ | 32,771 | | | $ | 33,935 | | | $ | 33,935 | | | $ | 28,698 | | | $ | 28,698 | | Time deposits placed and other short-term investments | | | 12,800 | | | | 12,800 | | | | 11,236 | | | | 11,236 | | | | 9,682 | | | | 9,682 | | | | 11,223 | | | | 11,223 | | Federal funds sold and securities purchased under agreements to resell | | | 149,785 | | | | 149,785 | | | | 135,409 | | | | 135,409 | | | | 149,287 | | | | 149,287 | | | | 139,396 | | | | 139,396 | | Trading account assets | | | 131,707 | | | | 131,707 | | | | 121,256 | | | | 121,256 | | | | 126,658 | | | | 126,658 | | | | 124,960 | | | | 124,960 | | Derivative assets | | | 23,712 | | | | 23,712 | | | | 26,005 | | | | 26,005 | | | | 26,019 | | | | 26,019 | | | | 26,182 | | | | 26,182 | | Securities: | | | | | | | | | | | | | | | | | | | | | | | | | | | | | | | | | Available-for-sale | | | 221,556 | | | | 221,556 | | | | 227,349 | | | | 227,349 | | | | 233,412 | | | | 233,412 | | | | 218,675 | | | | 218,675 | | Held-to-maturity, at cost | | | 47 | | | | 47 | | | | 136 | | | | 136 | | | | 174 | | | | 174 | | | | 275 | | | | 275 | | | | |
|
|
| |
|
|
| |
|
|
| |
|
|
| |
|
|
| |
|
|
| |
|
|
| |
|
|
| Total securities | | | 221,603 | | | | 221,603 | | | | 227,485 | | | | 227,485 | | | | 233,586 | | | | 233,586 | | | | 218,950 | | | | 218,950 | | | | |
|
|
| |
|
|
| |
|
|
| |
|
|
| |
|
|
| |
|
|
| |
|
|
| |
|
|
| Loans and leases | | | 573,782 | | | | 573,791 | | | | 554,603 | | | | 554,612 | | | | 529,418 | | | | 529,428 | | | | 529,466 | | | | 529,457 | | Allowance for loan and lease losses | | | (8,045 | ) | | | (8,045 | ) | | | (8,326 | ) | | | (8,326 | ) | | | (8,319 | ) | | | (8,319 | ) | | | (8,313 | ) | | | (8,313 | ) | | | |
|
|
| |
|
|
| |
|
|
| |
|
|
| |
|
|
| |
|
|
| |
|
|
| |
|
|
| Loans and leases, net of allowance | | | 565,737 | | | | 565,746 | | | | 546,277 | | | | 546,286 | | | | 521,099 | | | | 521,109 | | | | 521,153 | | | | 521,144 | | | | |
|
|
| |
|
|
| |
|
|
| |
|
|
| |
|
|
| |
|
|
| |
|
|
| |
|
|
| Premises and equipment, net | | | 7,786 | | | | 7,786 | | | | 7,659 | | | | 7,659 | | | | 7,602 | | | | 7,602 | | | | 7,531 | | | | 7,531 | | Mortgage servicing rights | | | 2,807 | | | | 2,806 | | | | 2,764 | | | | 2,763 | | | | 2,366 | | | | 2,365 | | | | 2,668 | | | | 2,667 | | Goodwill | | | 45,354 | | | | 45,354 | | | | 45,298 | | | | 45,298 | | | | 45,381 | | | | 45,381 | | | | 45,378 | | | | 45,378 | | Core deposit intangibles and other intangibles | | | 3,194 | | | | 3,194 | | | | 3,356 | | | | 3,356 | | | | 3,472 | | | | 3,472 | | | | 3,679 | | | | 3,679 | | Other assets | | | 90,311 | | | | 90,311 | | | | 92,743 | | | | 92,743 | | | | 87,243 | | | | 87,243 | | | | 82,421 | | | | 82,421 | | | | |
|
|
| |
|
|
| |
|
|
| |
|
|
| |
|
|
| |
|
|
| |
|
|
| |
|
|
| Total assets | | $ | 1,291,795 | | | $ | 1,291,803 | | | $ | 1,252,259 | | | $ | 1,252,267 | | | $ | 1,246,330 | | | $ | 1,246,339 | | | $ | 1,212,239 | | | $ | 1,212,229 | | | | |
|
|
| |
|
|
| |
|
|
| |
|
|
| |
|
|
| |
|
|
| |
|
|
| |
|
|
| Liabilities | | | | | | | | | | | | | | | | | | | | | | | | | | | | | | | | | Deposits in domestic offices: | | | | | | | | | | | | | | | | | | | | | | | | | | | | | | | | | Noninterest-bearing | | $ | 179,571 | | | $ | 179,571 | | | $ | 174,990 | | | $ | 174,990 | | | $ | 175,427 | | | $ | 175,427 | | | $ | 166,499 | | | $ | 166,499 | | Interest-bearing | | | 384,155 | | | | 384,155 | | | | 390,973 | | | | 390,973 | | | | 397,778 | | | | 397,778 | | | | 403,534 | | | | 403,534 | | Deposits in foreign offices: | | | | | | | | | | | | | | | | | | | | | | | | | | | | | | | | | Noninterest-bearing | | | 7,165 | | | | 7,165 | | | | 6,750 | | | | 6,750 | | | | 6,102 | | | | 6,102 | | | | 5,319 | | | | 5,319 | | Interest-bearing | | | 63,779 | | | | 63,779 | | | | 53,764 | | | | 53,764 | | | | 56,110 | | | | 56,110 | | | | 54,635 | | | | 54,635 | | | | |
|
|
| |
|
|
| |
|
|
| |
|
|
| |
|
|
| |
|
|
| |
|
|
| |
|
|
| Total deposits | | | 634,670 | | | | 634,670 | | | | 626,477 | | | | 626,477 | | | | 635,417 | | | | 635,417 | | | | 629,987 | | | | 629,987 | | | | |
|
|
| |
|
|
| |
|
|
| |
|
|
| |
|
|
| |
|
|
| |
|
|
| |
|
|
| Federal funds purchased and securities sold under agreements to repurchase | | | 240,655 | | | | 240,655 | | | | 217,053 | | | | 217,053 | | | | 207,710 | | | | 207,710 | | | | 187,652 | | | | 187,652 | | Trading account liabilities | | | 50,890 | | | | 50,890 | | | | 51,244 | | | | 51,244 | | | | 61,906 | | | | 61,906 | | | | 53,434 | | | | 53,434 | | Derivative liabilities | | | 15,000 | | | | 15,000 | | | | 15,711 | | | | 15,711 | | | | 15,630 | | | | 15,630 | | | | 15,363 | | | | 15,363 | | Commercial paper and other short-term borrowings | | | 116,269 | | | | 116,269 | | | | 107,655 | | | | 107,655 | | | | 93,763 | | | | 93,763 | | | | 93,440 | | | | 93,440 | | Accrued expenses and other liabilities | | | 31,749 | | | | 31,938 | | | | 32,976 | | | | 33,250 | | | | 34,470 | | | | 34,940 | | | | 35,081 | | | | 35,319 | | Long-term debt | | | 101,338 | | | | 100,848 | | | | 99,885 | | | | 99,149 | | | | 96,894 | | | | 95,638 | | | | 98,763 | | | | 98,107 | | | | |
|
|
| |
|
|
| |
|
|
| |
|
|
| |
|
|
| |
|
|
| |
|
|
| |
|
|
| Total liabilities | | | 1,190,571 | | | | 1,190,270 | | | | 1,151,001 | | | | 1,150,539 | | | | 1,145,790 | | | | 1,145,004 | | | | 1,113,720 | | | | 1,113,302 | | | | |
|
|
| |
|
|
| |
|
|
| |
|
|
| |
|
|
| |
|
|
| |
|
|
| |
|
|
| Commitments and contingencies (Note 9) | | | | | | | | | | | | | | | | | | | | | | | | | | | | | | | | | | | | | | | | | | Shareholders’ equity | | | | | | | | | | | | | | | | | | | | | | | | | | | | | | | | | Preferred stock, $0.01 par value; authorized—100,000,000 shares for all periods; issued and outstanding—1,090,189 shares for all periods | | | 271 | | | | 271 | | | | 271 | | | | 271 | | | | 271 | | | | 271 | | | | 271 | | | | 271 | | Common stock and additional paid-in capital, $0.01 par value(2,3) | | | 41,693 | | | | 41,693 | | | | 42,548 | | | | 42,548 | | | | 42,507 | | | | 42,507 | | | | 43,589 | | | | 43,589 | | Retained earnings | | | 67,205 | | | | 67,552 | | | | 65,439 | | | | 65,980 | | | | 63,328 | | | | 64,154 | | | | 60,843 | | | | 61,309 | | Accumulated other comprehensive income (loss) | | | (7,518 | ) | | | (7,556 | ) | | | (6,509 | ) | | | (6,580 | ) | | | (4,992 | ) | | | (5,023 | ) | | | (5,559 | ) | | | (5,617 | ) | Other | | | (427 | ) | | | (427 | ) | | | (491 | ) | | | (491 | ) | | | (574 | ) | | | (574 | ) | | | (625 | ) | | | (625 | ) | | | |
|
|
| |
|
|
| |
|
|
| |
|
|
| |
|
|
| |
|
|
| |
|
|
| |
|
|
| Total shareholders’ equity | | | 101,224 | | | | 101,533 | | | | 101,258 | | | | 101,728 | | | | 100,540 | | | | 101,335 | | | | 98,519 | | | | 98,927 | | | | |
|
|
| |
|
|
| |
|
|
| |
|
|
| |
|
|
| |
|
|
| |
|
|
| |
|
|
| Total liabilities and shareholders’ equity | | $ | 1,291,795 | | | $ | 1,291,803 | | | $ | 1,252,259 | | | $ | 1,252,267 | | | $ | 1,246,330 | | | $ | 1,246,339 | | | $ | 1,212,239 | | | $ | 1,212,229 | | | | |
|
|
| |
|
|
| |
|
|
| |
|
|
| |
|
|
| |
|
|
| |
|
|
| |
|
|
|
(1) | | The Corporation provided unaudited financial information relating to the fourth quarter of 2005 in its current report on Form 8-K filed on January 23, 2006. |
(2) | | Authorized—7,500,000,000 shares for the Fourth, Third, Second and First Quarters |
(3) | | Issued and outstanding—3,999,688,491 shares, 4,013,063,444 shares, 4,016,703,839 shares and 4,035,318,509 shares for the Fourth, Third, Second and First Quarters |
BANK OF AMERICA CORPORATION AND SUBSIDIARIES
Notes to Consolidated Financial Statements—(Continued)
Consolidated Balance Sheet
| | | | | | | | | | | | | | | | | | | | | | | | | | | | | | | | | 2004 Quarters
| | | | | Fourth
| | | Third
| | | Second
| | | First
| | | (Dollars in millions) | | As
Previously
Reported
| | | Restated
| | | As
Previously
Reported
| | | Restated
| | | As
Previously
Reported
| | | Restated
| | | As
Previously
Reported
| | | Restated
| | Assets | | | | | | | | | | | | | | | | | | | | | | | | | | | | | | Cash and cash equivalents | | $ | 28,936 | | | $ | 28,936 | | | $ | 29,252 | | | $ | 29,252 | | | $ | 31,789 | | | 31,789 | | | 22,296 | | | 22,296 | | Time deposits placed and other short-term investments | | | 12,361 | | | | 12,361 | | | | 11,021 | | | | 11,021 | | | | 10,418 | | | 10,418 | | | 8,561 | | | 8,561 | | Federal funds sold and securities purchased under agreements to resell | | | 91,360 | | | | 91,360 | | | | 104,570 | | | | 104,570 | | | | 81,437 | | | 81,437 | | | 73,057 | | | 73,057 | | Trading account assets | | | 93,587 | | | | 93,587 | | | | 102,925 | | | | 102,925 | | | | 85,972 | | | 85,972 | | | 75,004 | | | 75,004 | | Derivative assets | | | 30,235 | | | | 30,235 | | | | 25,398 | | | | 25,398 | | | | 25,908 | | | 25,908 | | | 28,481 | | | 28,481 | | Securities: | | | | | | | | | | | | | | | | | | | | | | | | | | | | | | Available-for-sale | | | 194,743 | | | | 194,743 | | | | 163,438 | | | | 163,438 | | | | 166,175 | | | 166,175 | | | 139,546 | | | 139,546 | | Held-to-maturity, at cost | | | 330 | | | | 330 | | | | 420 | | | | 420 | | | | 478 | | | 478 | | | 242 | | | 242 | | | | |
|
|
| |
|
|
| |
|
|
| |
|
|
| |
|
|
| |
|
| |
|
| |
|
| Total securities | | | 195,073 | | | | 195,073 | | | | 163,858 | | | | 163,858 | | | | 166,653 | | | 166,653 | | | 139,788 | | | 139,788 | | | | |
|
|
| |
|
|
| |
|
|
| |
|
|
| |
|
|
| |
|
| |
|
| |
|
| Loans and leases | | | 521,837 | | | | 521,813 | | | | 511,639 | | | | 511,613 | | | | 498,481 | | | 498,452 | | | 375,968 | | | 375,938 | | Allowance for loan and lease losses | | | (8,626 | ) | | | (8,626 | ) | | | (8,723 | ) | | | (8,723 | ) | | | (8,767 | ) | | (8,767 | ) | | (6,080 | ) | | (6,080 | ) | | | |
|
|
| |
|
|
| |
|
|
| |
|
|
| |
|
|
| |
|
| |
|
| |
|
| Loans and leases, net of allowance | | | 513,211 | | | | 513,187 | | | | 502,916 | | | | 502,890 | | | | 489,714 | | | 489,685 | | | 369,888 | | | 369,858 | | | | |
|
|
| |
|
|
| |
|
|
| |
|
|
| |
|
|
| |
|
| |
|
| |
|
| Premises and equipment, net | | | 7,517 | | | | 7,517 | | | | 7,884 | | | | 7,884 | | | | 7,797 | | | 7,797 | | | 6,076 | | | 6,076 | | Mortgage servicing rights | | | 2,482 | | | | 2,481 | | | | 2,453 | | | | 2,452 | | | | 3,005 | | | 3,004 | | | 2,184 | | | 2,182 | | Goodwill | | | 45,262 | | | | 45,262 | | | | 44,709 | | | | 44,709 | | | | 44,672 | | | 44,672 | | | 11,468 | | | 11,468 | | Core deposit intangibles and other intangibles | | | 3,887 | | | | 3,887 | | | | 3,726 | | | | 3,726 | | | | 3,922 | | | 3,922 | | | 854 | | | 854 | | Other assets | | | 86,546 | | | | 86,546 | | | | 74,117 | | | | 74,117 | | | | 73,444 | | | 73,444 | | | 62,317 | | | 62,317 | | | | |
|
|
| |
|
|
| |
|
|
| |
|
|
| |
|
|
| |
|
| |
|
| |
|
| Total assets | | $ | 1,110,457 | | | $ | 1,110,432 | | | $ | 1,072,829 | | | $ | 1,072,802 | | | $ | 1,024,731 | | | 1,024,701 | | | 799,974 | | | 799,942 | | | | |
|
|
| |
|
|
| |
|
|
| |
|
|
| |
|
|
| |
|
| |
|
| |
|
| Liabilities | | | | | | | | | | | | | | | | | | | | | | | | | | | | | | Deposits in domestic offices: | | | | | | | | | | | | | | | | | | | | | | | | | | | | | | Noninterest-bearing | | $ | 163,833 | | | $ | 163,833 | | | $ | 155,406 | | | $ | 155,406 | | | $ | 154,061 | | | 154,061 | | | 121,629 | | | 121,629 | | Interest-bearing | | | 396,645 | | | | 396,645 | | | | 380,956 | | | | 380,956 | | | | 369,446 | | | 369,446 | | | 267,850 | | | 267,850 | | Deposits in foreign offices: | | | | | | | | | | | | | | | | | | | | | | | | | | | | | | Noninterest-bearing | | | 6,066 | | | | 6,066 | | | | 5,632 | | | | 5,632 | | | | 5,499 | | | 5,499 | | | 2,805 | | | 2,805 | | Interest-bearing | | | 52,026 | | | | 52,026 | | | | 49,264 | | | | 49,264 | | | | 46,407 | | | 46,407 | | | 43,308 | | | 43,308 | | | | |
|
|
| |
|
|
| |
|
|
| |
|
|
| |
|
|
| |
|
| |
|
| |
|
| Total deposits | | | 618,570 | | | | 618,570 | | | | 591,258 | | | | 591,258 | | | | 575,413 | | | 575,413 | | | 435,592 | | | 435,592 | | | | |
|
|
| |
|
|
| |
|
|
| |
|
|
| |
|
|
| |
|
| |
|
| |
|
| Federal funds purchased and securities sold under agreements to repurchase | | | 119,741 | | | | 119,741 | | | | 142,992 | | | | 142,992 | | | | 119,264 | | | 119,264 | | | 115,434 | | | 115,434 | | Trading account liabilities | | | 36,654 | | | | 36,654 | | | | 36,825 | | | | 36,825 | | | | 29,689 | | | 29,689 | | | 27,402 | | | 27,402 | | Derivative liabilities | | | 17,928 | | | | 17,928 | | | | 12,721 | | | | 12,721 | | | | 14,381 | | | 14,381 | | | 16,290 | | | 16,290 | | Commercial paper and other short-term borrowings | | | 78,598 | | | | 78,598 | | | | 61,585 | | | | 61,585 | | | | 63,162 | | | 63,162 | | | 56,614 | | | 56,614 | | Accrued expenses and other liabilities | | | 41,243 | | | | 41,590 | | | | 28,851 | | | | 29,205 | | | | 28,682 | | | 28,747 | | | 18,635 | | | 19,269 | | Long-term debt | | | 98,078 | | | | 97,116 | | | | 100,586 | | | | 99,582 | | | | 98,319 | | | 98,082 | | | 81,231 | | | 79,474 | | | | |
|
|
| |
|
|
| |
|
|
| |
|
|
| |
|
|
| |
|
| |
|
| |
|
| Total liabilities | | | 1,010,812 | | | | 1,010,197 | | | | 974,818 | | | | 974,168 | | | | 928,910 | | | 928,738 | | | 751,198 | | | 750,075 | | | | |
|
|
| |
|
|
| |
|
|
| |
|
|
| |
|
|
| |
|
| |
|
| |
|
| | | | | | | | | | Commitments and contingencies (Note 9) | | | | | | | | | | | | | | | | | | | | | | | | | | | | | | | | | | | | | | | Shareholders’ equity | | | | | | | | | | | | | | | | | | | | | | | | | | | | | | Preferred stock, $0.01 par value(1,2) | | | 271 | | | | 271 | | | | 271 | | | | 271 | | | | 322 | | | 322 | | | 53 | | | 53 | | Common stock and additional paid-in capital, $0.01 par value(3,4) | | | 44,236 | | | | 44,236 | | | | 44,756 | | | | 44,756 | | | | 45,669 | | | 45,669 | | | 29 | | | 29 | | Retained earnings | | | 58,006 | | | | 58,773 | | | | 55,979 | | | | 56,739 | | | | 54,030 | | | 54,452 | | | 51,808 | | | 52,738 | | Accumulated other comprehensive income (loss) | | | (2,587 | ) | | | (2,764 | ) | | | (2,669 | ) | | | (2,806 | ) | | | (3,862 | ) | | (4,142 | ) | | (2,743 | ) | | (2,582 | ) | Other | | | (281 | ) | | | (281 | ) | | | (326 | ) | | | (326 | ) | | | (338 | ) | | (338 | ) | | (371 | ) | | (371 | ) | | | |
|
|
| |
|
|
| |
|
|
| |
|
|
| |
|
|
| |
|
| |
|
| |
|
| Total shareholders’ equity | | | 99,645 | | | | 100,235 | | | | 98,011 | | | | 98,634 | | | | 95,821 | | | 95,963 | | | 48,776 | | | 49,867 | | | | |
|
|
| |
|
|
| |
|
|
| |
|
|
| |
|
|
| |
|
| |
|
| |
|
| Total liabilities and shareholders’ equity | | $ | 1,110,457 | | | $ | 1,110,432 | | | $ | 1,072,829 | | | $ | 1,072,802 | | | $ | 1,024,731 | | | 1,024,701 | | | 799,974 | | | 799,942 | | | | |
|
|
| |
|
|
| |
|
|
| |
|
|
| |
|
|
| |
|
| |
|
| |
|
|
(1) | | Authorized—100,000,000 shares for the Fourth, Third, Second and First Quarters |
(2) | | Issued and outstanding—1,090,189 shares, 1,090,189 shares, 2,292,013 shares and 1,239,563 shares for the Fourth, Third, Second and First Quarters |
(3) | | Authorized—7,500,000,000 shares for the Fourth, Third, Second and First Quarters |
(4) | | Issued and outstanding—4,046,546,212 shares, 4,049,062,685 shares, 2,031,328,433 shares and 1,445,487,313 shares for the Fourth, Third, Second and First Quarters |
BANK OF AMERICA CORPORATION AND SUBSIDIARIES
Notes to Consolidated Financial Statements—(Continued)
Consolidated Statement of Changes in Shareholders’ Equity, As Previously Reported
For the Three, Six and Nine Months in 2005
| | | | | | | | | | | | | | | | | | | | | | | | | | | | | | | (Dollars in millions, shares in thousands) | | Preferred Stock
| | Common Stock
and
Additional Paid-in
Capital
| | | Retained Earnings
| | | Accumulated
Other
Comprehensive Income (Loss)(1)
| | | Other
| | | Total
Share-
holders’ Equity
| | | Comprehensive Income
| | | | | Shares
| | | Amount
| | | | | | | Balance, December 31, 2004 | | $ | 271 | | 4,046,546 | | | $ | 44,236 | | | $ | 58,006 | | | $ | (2,587 | ) | | $ | (281 | ) | | $ | 99,645 | | | | | | Net income | | | | | | | | | | | | | 4,695 | | | | | | | | | | | | 4,695 | | | $ | 4,695 | | Net unrealized gains (losses) on available-for-sale debt and marketable equity securities | | | | | | | | | | | | | | | | | (1,541 | ) | | | | | | | (1,541 | ) | | | (1,541 | ) | Net unrealized gains (losses) on foreign currency translation adjustments | | | | | | | | | | | | | | | | | (5 | ) | | | | | | | (5 | ) | | | (5 | ) | Net gains (losses) on derivatives | | | | | | | | | | | | | | | | | (1,426 | ) | | | | | | | (1,426 | ) | | | (1,426 | ) | Cash dividends paid: | | | | | | | | | | | | | | | | | | | | | | | | | | | | | | | Common | | | | | | | | | | | | | (1,830 | ) | | | | | | | | | | | (1,830 | ) | | | | | Preferred | | | | | | | | | | | | | (5 | ) | | | | | | | | | | | (5 | ) | | | | | Common stock issued under employee plans and related tax benefits | | | | | 31,987 | | | | 1,343 | | | | | | | | | | | | (344 | ) | | | 999 | | | | | | Common stock repurchased | | | | | (43,214 | ) | | | (1,990 | ) | | | | | | | | | | | | | | | (1,990 | ) | | | | | Other | | | | | | | | | | | | | (23 | ) | | | | | | | | | | | (23 | ) | | | | | | | |
|
| |
|
| |
|
|
| |
|
|
| |
|
|
| |
|
|
| |
|
|
| |
|
|
| Balance, March 31, 2005 | | $ | 271 | | 4,035,319 | | | $ | 43,589 | | | $ | 60,843 | | | $ | (5,559 | ) | | $ | (625 | ) | | $ | 98,519 | | | $ | 1,723 | | | | |
|
| |
|
| |
|
|
| |
|
|
| |
|
|
| |
|
|
| |
|
|
| |
|
|
| Balance, December 31, 2004 | | $ | 271 | | 4,046,546 | | | $ | 44,236 | | | $ | 58,006 | | | $ | (2,587 | ) | | $ | (281 | ) | | $ | 99,645 | | | | | | Net income | | | | | | | | | | | | | 8,991 | | | | | | | | | | | | 8,991 | | | $ | 8,991 | | Net unrealized gains (losses) on available- for-sale debt and marketable equity securities | | | | | | | | | | | | | | | | | 584 | | | | | | | | 584 | | | | 584 | | Net unrealized gains (losses) on foreign currency translation adjustments | | | | | | | | | | | | | | | | | 30 | | | | | | | | 30 | | | | 30 | | Net gains (losses) on derivatives | | | | | | | | | | | | | | | | | (3,019 | ) | | | | | | | (3,019 | ) | | | (3,019 | ) | Cash dividends paid: | | | | | | | | | | | | | | | | | | | | | | | | | | | | | | | Common | | | | | | | | | | | | | (3,640 | ) | | | | | | | | | | | (3,640 | ) | | | | | Preferred | | | | | | | | | | | | | (9 | ) | | | | | | | | | | | (9 | ) | | | | | Common stock issued under employee plans and related tax benefits | | | | | 53,672 | | | | 2,090 | | | | | | | | | | | | (292 | ) | | | 1,798 | | | | | | Common stock repurchased | | | | | (83,514 | ) | | | (3,819 | ) | | | | | | | | | | | | | | | (3,819 | ) | | | | | Other | | | | | | | | | | | | | (20 | ) | | | | | | | (1 | ) | | | (21 | ) | | | | | | | |
|
| |
|
| |
|
|
| |
|
|
| |
|
|
| |
|
|
| |
|
|
| |
|
|
| Balance, June 30, 2005 | | $ | 271 | | 4,016,704 | | | $ | 42,507 | | | $ | 63,328 | | | $ | (4,992 | ) | | $ | (574 | ) | | $ | 100,540 | | | $ | 6,586 | | | | |
|
| |
|
| |
|
|
| |
|
|
| |
|
|
| |
|
|
| |
|
|
| |
|
|
| Balance, December 31, 2004 | | $ | 271 | | 4,046,546 | | | $ | 44,236 | | | $ | 58,006 | | | $ | (2,587 | ) | | $ | (281 | ) | | $ | 99,645 | | | | | | Net income | | | | | | | | | | | | | 13,118 | | | | | | | | | | | | 13,118 | | | $ | 13,118 | | Net unrealized gains (losses) on available-for-sale debt and marketable equity securities | | | | | | | | | | | | | | | | | (1,711 | ) | | | | | | | (1,711 | ) | | | (1,711 | ) | Net unrealized gains (losses) on foreign currency translation adjustments | | | | | | | | | | | | | | | | | 26 | | | | | | | | 26 | | | | 26 | | Net gains (losses) on derivatives | | | | | | | | | | | | | | | | | (2,237 | ) | | | | | | | (2,237 | ) | | | (2,237 | ) | Cash dividends paid: | | | | | | | | | | | | | | | | | | | | | | | | | | | | | | | Common | | | | | | | | | | | | | (5,658 | ) | | | | | | | | | | | (5,658 | ) | | | | | Preferred | | | | | | | | | | | | | (14 | ) | | | | | | | | | | | (14 | ) | | | | | Common stock issued under employee plans and related tax benefits | | | | | 60,704 | | | | 2,593 | | | | | | | | | | | | (211 | ) | | | 2,382 | | | | | | Common stock repurchased | | | | | (94,187 | ) | | | (4,281 | ) | | | | | | | | | | | | | | | (4,281 | ) | | | | | Other | | | | | | | | | | | | | (13 | ) | | | | | | | 1 | | | | (12 | ) | | | | | | | |
|
| |
|
| |
|
|
| |
|
|
| |
|
|
| |
|
|
| |
|
|
| |
|
|
| Balance, September 30, 2005 | | $ | 271 | | 4,013,063 | | | $ | 42,548 | | | $ | 65,439 | | | $ | (6,509 | ) | | $ | (491 | ) | | $ | 101,258 | | | $ | 9,196 | | | | |
|
| |
|
| |
|
|
| |
|
|
| |
|
|
| |
|
|
| |
|
|
| |
|
|
|
(1) | | At September 30, 2005, June 30, 2005, and March 31, 2005, Accumulated Other Comprehensive Income (Loss) includes Net Unrealized Gains (Losses) on AFS Debt and Marketable EquitySecurities of $(1,908) million, $387 million and $(1,738) million, respectively; Net Unrealized Losses on Foreign Currency Translation Adjustments of $(129) million, $(125) million and $(160) million, respectively; Net Unrealized Gains (Losses)on Derivatives of $(4,338) million, $(5,120) million, and $(3,527) million, respectively; and Other of $(134) million, $(134) million and $(134) million, respectively. |
BANK OF AMERICA CORPORATION AND SUBSIDIARIES
Notes to Consolidated Financial Statements—(Continued)
Consolidated Statement of Changes in Shareholders’ Equity, As Restated
For the Three, Six and Nine Months in 2005
| | | | | | | | | | | | | | | | | | | | | | | | | | | | | | | | | | Preferred
Stock
| | Common Stock
and Additional
Paid-in Capital
| | | Retained
Earnings
| | | Accumulated
Other Comprehensive Income (Loss)(1)
| | | Other
| | | Total
Share- holders’
Equity
| | | Comprehensive
Income
| | | (Dollars in millions, shares in thousands) | | | Shares
| | | Amount
| | | | | | | Balance, December 31, 2004 | | $ | 271 | | 4,046,546 | | | $ | 44,236 | | | $ | 58,773 | | | $ | (2,764 | ) | | $ | (281 | ) | | $ | 100,235 | | | | | | Net income | | | | | | | | | | | | | 4,393 | | | | | | | | | | | | 4,393 | | | $ | 4,393 | | Net unrealized gains (losses) on available-for-sale debt and marketable equity securities | | | | | | | | | | | | | | | | | (1,541 | ) | | | | | | | (1,541 | ) | | | (1,541 | ) | Net unrealized gains (losses) on foreign currency translation adjustments | | | | | | | | | | | | | | | | | (5 | ) | | | | | | | (5 | ) | | | (5 | ) | Net gains (losses) on derivatives | | | | | | | | | | | | | | | | | (1,306 | ) | | | | | | | (1,306 | ) | | | (1,306 | ) | Cash dividends paid: | | | | | | | | | | | | | | | | | | | | | | | | | | | | | | | Common | | | | | | | | | | | | | (1,830 | ) | | | | | | | | | | | (1,830 | ) | | | | | Preferred | | | | | | | | | | | | | (5 | ) | | | | | | | | | | | (5 | ) | | | | | Common stock issued under employee plans and related tax benefits | | | | | 31,987 | | | | 1,343 | | | | | | | | | | | | (344 | ) | | | 999 | | | | | | Common stock repurchased | | | | | (43,214 | ) | | | (1,990 | ) | | | | | | | | | | | | | | | (1,990 | ) | | | | | Other | | | | | | | | | | | | | (22 | ) | | | (1 | ) | | | | | | | (23 | ) | | | (1 | ) | | | |
|
| |
|
| |
|
|
| |
|
|
| |
|
|
| |
|
|
| |
|
|
| |
|
|
| Balance, March 31, 2005 | | $ | 271 | | 4,035,319 | | | $ | 43,589 | | | $ | 61,309 | | | $ | (5,617 | ) | | $ | (625 | ) | | $ | 98,927 | | | $ | 1,540 | | | | |
|
| |
|
| |
|
|
| |
|
|
| |
|
|
| |
|
|
| |
|
|
| |
|
|
| Balance, December 31, 2004 | | $ | 271 | | 4,046,546 | | | $ | 44,236 | | | $ | 58,773 | | | $ | (2,764 | ) | | $ | (281 | ) | | $ | 100,235 | | | | | | Net income | | | | | | | | | | | | | 9,050 | | | | | | | | | | | | 9,050 | | | $ | 9,050 | | Net unrealized gains (losses) on available- for-sale debt and marketable equity securities | | | | | | | | | | | | | | | | | 584 | | | | | | | | 584 | | | | 584 | | Net unrealized gains (losses) on foreign currency translation adjustments | | | | | | | | | | | | | | | | | 30 | | | | | | | | 30 | | | | 30 | | Net gains (losses) on derivatives | | | | | | | | | | | | | | | | | (2,873 | ) | | | | | | | (2,873 | ) | | | (2,873 | ) | Cash dividends paid: | | | | | | | | | | | | | | | | | | | | | | | | | | | | | | | Common | | | | | | | | | | | | | (3,640 | ) | | | | | | | | | | | (3,640 | ) | | | | | Preferred | | | | | | | | | | | | | (9 | ) | | | | | | | | | | | (9 | ) | | | | | Common stock issued under employee plans and related tax benefits | | | | | 53,672 | | | | 2,090 | | | | | | | | | | | | (292 | ) | | | 1,798 | | | | | | Common stock repurchased | | | | | (83,514 | ) | | | (3,819 | ) | | | | | | | | | | | | | | | (3,819 | ) | | | | | Other | | | | | | | | | | | | | (20 | ) | | | | | | | (1 | ) | | | (21 | ) | | | | | | | |
|
| |
|
| |
|
|
| |
|
|
| |
|
|
| |
|
|
| |
|
|
| |
|
|
| Balance, June 30, 2005 | | $ | 271 | | 4,016,704 | | | $ | 42,507 | | | $ | 64,154 | | | $ | (5,023 | ) | | $ | (574 | ) | | $ | 101,335 | | | $ | 6,791 | | | | |
|
| |
|
| |
|
|
| |
|
|
| |
|
|
| |
|
|
| |
|
|
| |
|
|
| Balance, December 31, 2004 | | $ | 271 | | 4,046,546 | | | $ | 44,236 | | | $ | 58,773 | | | $ | (2,764 | ) | | $ | (281 | ) | | $ | 100,235 | | | | | | Net income | | | | | | | | | | | | | 12,891 | | | | | | | | | | | | 12,891 | | | $ | 12,891 | | Net unrealized gains (losses) on available-for-sale debt and marketable equity securities | | | | | | | | | | | | | | | | | (1,711 | ) | | | | | | | (1,711 | ) | | | (1,711 | ) | Net unrealized gains (losses) on foreign currency translation adjustments | | | | | | | | | | | | | | | | | 26 | | | | | | | | 26 | | | | 26 | | Net gains (losses) on derivatives | | | | | | | | | | | | | | | | | (2,130 | ) | | | | | | | (2,130 | ) | | | (2,130 | ) | Cash dividends paid: | | | | | | | | | | | | | | | | | | | | | | | | | | | | | | | Common | | | | | | | | | | | | | (5,658 | ) | | | | | | | | | | | (5,658 | ) | | | | | Preferred | | | | | | | | | | | | | (14 | ) | | | | | | | | | | | (14 | ) | | | | | Common stock issued under employee plans and related tax benefits | | | | | 60,704 | | | | 2,593 | | | | | | | | | | | | (211 | ) | | | 2,382 | | | | | | Common stock repurchased | | | | | (94,187 | ) | | | (4,281 | ) | | | | | | | | | | | | | | | (4,281 | ) | | | | | Other | | | | | | | | | | | | | (12 | ) | | | (1 | ) | | | 1 | | | | (12 | ) | | | (1 | ) | | | |
|
| |
|
| |
|
|
| |
|
|
| |
|
|
| |
|
|
| |
|
|
| |
|
|
| Balance, September 30, 2005 | | $ | 271 | | 4,013,063 | | | $ | 42,548 | | | $ | 65,980 | | | $ | (6,580 | ) | | $ | (491 | ) | | $ | 101,728 | | | $ | 9,075 | | | | |
|
| |
|
| |
|
|
| |
|
|
| |
|
|
| |
|
|
| |
|
|
| |
|
|
|
(1) | | At September 30, 2005, June 30, 2005, and March 31, 2005, Accumulated Other Comprehensive Income (Loss) includes Net Unrealized Gains (Losses) on AFS Debt and Marketable Equity Securities of $(1,908) million, $387 million and $(1,738) million, respectively; Net Unrealized Losses on Foreign Currency Translation Adjustments of $(129) million, $(125) million and $(160) million, respectively; Net Unrealized Gains (Losses) on Derivatives of $(4,409) million, $(5,152) million, and $(3,585) million, respectively; and Other of $(134) million, $(134) million and $(134) million, respectively. |
BANK OF AMERICA CORPORATION AND SUBSIDIARIES
Notes to Consolidated Financial Statements—(Continued)
Consolidated Statement of Changes in Shareholders’ Equity, As Previously Reported
For the Three, Six and Nine Months in 2004
| | | | | | | | | | | | | | | | | | | | | | | | | | | | | | | | (Dollars in millions, shares in thousands) | | Preferred
Stock
| | | Common Stock and
Additional Paid-in
Capital
| | | Retained
Earnings
| | | Accumulated
Other
Comprehensive
Income (Loss)(1)
| | | Other
| | | Total
Share-
holders’
Equity
| | | Comprehensive
Income
| | | | | Shares
| | | Amount
| | | | | | | Balance, December 31, 2003 | | $ | 54 | | | 2,882,288 | | | $ | 29 | | | $ | 50,198 | | | $ | (2,148 | ) | | $ | (153 | ) | | $ | 47,980 | | | | | | Net income | | | | | | | | | | | | | | 2,681 | | | | | | | | | | | | 2,681 | | | $ | 2,681 | | Net unrealized gains (losses) on available-for-sale debt and marketable equity securities | | | | | | | | | | | | | | | | | | 661 | | | | | | | | 661 | | | | 661 | | Net unrealized gains (losses) on foreign currency translation adjustments | | | | | | | | | | | | | | | | | | 3 | | | | | | | | 3 | | | | 3 | | Net gains (losses) on derivatives | | | | | | | | | | | | | | | | | | (1,259 | ) | | | | | | | (1,259 | ) | | | (1,259 | ) | Cash dividends paid: | | | | | | | | | | | | | | | | | | | | | | | | | | | | | | | | Common | | | | | | | | | | | | | | (1,158 | ) | | | | | | | | | | | (1,158 | ) | | | | | Preferred | | | | | | | | | | | | | | (1 | ) | | | | | | | | | | | (1 | ) | | | | | Common stock issued under employee plans and related tax benefits | | | | | | 32,892 | | | | 1,060 | | | | | | | | | | | | (218 | ) | | | 842 | | | | | | Common stock repurchased | | | | | | (24,306 | ) | | | (1,061 | ) | | | 88 | | | | | | | | | | | | (973 | ) | | | | | Conversion of preferred stock | | | (1 | ) | | 100 | | | | 1 | | | | | | | | | | | | | | | | | | | | | | | | |
|
|
| |
|
| |
|
|
| |
|
|
| |
|
|
| |
|
|
| |
|
|
| |
|
|
| Balance, March 31, 2004 | | $ | 53 | | | 2,890,974 | | | $ | 29 | | | $ | 51,808 | | | $ | (2,743 | ) | | $ | (371 | ) | | $ | 48,776 | | | $ | 2,086 | | | | |
|
|
| |
|
| |
|
|
| |
|
|
| |
|
|
| |
|
|
| |
|
|
| |
|
|
| Balance, December 31, 2003 | | $ | 54 | | | 2,882,288 | | | $ | 29 | | | $ | 50,198 | | | $ | (2,148 | ) | | $ | (153 | ) | | $ | 47,980 | | | | | | Net income | | | | | | | | | | | | | | 6,530 | | | | | | | | | | | | 6,530 | | | $ | 6,530 | | Net unrealized gains (losses) on available- for-sale debt and marketable equity securities | | | | | | | | | | | | | | | | | | (2,025 | ) | | | | | | | (2,025 | ) | | | (2,025 | ) | Net unrealized gains (losses) on foreign currency translation adjustments | | | | | | | | | | | | | | | | | | (18 | ) | | | | | | | (18 | ) | | | (18 | ) | Net gains (losses) on derivatives | | | | | | | | | | | | | | | | | | 329 | | | | | | | | 329 | | | | 329 | | Cash dividends paid: | | | | | | | | | | | | | | | | | | | | | | | | | | | | | | | | Common | | | | | | | | | | | | | | (2,796 | ) | | | | | | | | | | | (2,796 | ) | | | | | Preferred | | | | | | | | | | | | | | (6 | ) | | | | | | | | | | | (6 | ) | | | | | Common stock issued under employee plans and related tax benefits | | | | | | 66,804 | | | | 2,280 | | | | | | | | | | | | (183 | ) | | | 2,097 | | | | | | Stock issued in acquisition | | | 271 | | | 1,186,728 | | | | 46,480 | | | | | | | | | | | | | | | | 46,751 | | | | | | Common stock repurchased | | | | | | (73,366 | ) | | | (3,076 | ) | | | 88 | | | | | | | | | | | | (2,988 | ) | | | | | Conversion of preferred stock | | | (3 | ) | | 202 | | | | 1 | | | | | | | | | | | | | | | | (2 | ) | | | | | Other | | | | | | | | | | (45 | ) | | | 16 | | | | | | | | (2 | ) | | | (31 | ) | | | | | | | |
|
|
| |
|
| |
|
|
| |
|
|
| |
|
|
| |
|
|
| |
|
|
| |
|
|
| Balance, June 30, 2004 | | $ | 322 | | | 4,062,656 | | | $ | 45,669 | | | $ | 54,030 | | | $ | (3,862 | ) | | $ | (338 | ) | | $ | 95,821 | | | $ | 4,816 | | | | |
|
|
| |
|
| |
|
|
| |
|
|
| |
|
|
| |
|
|
| |
|
|
| |
|
|
| Balance, December 31, 2003 | | $ | 54 | | | 2,882,288 | | | $ | 29 | | | $ | 50,198 | | | $ | (2,148 | ) | | $ | (153 | ) | | $ | 47,980 | | | | | | Net income | | | | | | | | | | | | | | 10,294 | | | | | | | | | | | | 10,294 | | | $ | 10,294 | | Net unrealized gains (losses) on available-for-sale debt and marketable equity securities | | | | | | | | | | | | | | | | | | (390 | ) | | | | | | | (390 | ) | | | (390 | ) | Net unrealized gains (losses) on foreign currency translation adjustments | | | | | | | | | | | | | | | | | | (9 | ) | | | | | | | (9 | ) | | | (9 | ) | Net gains (losses) on derivatives | | | | | | | | | | | | | | | | | | (122 | ) | | | | | | | (122 | ) | | | (122 | ) | Cash dividends paid: | | | | | | | | | | | | | | | | | | | | | | | | | | | | | | | | Common | | | | | | | | | | | | | | (4,629 | ) | | | | | | | | | | | (4,629 | ) | | | | | Preferred | | | | | | | | | | | | | | (11 | ) | | | | | | | | | | | (11 | ) | | | | | Common stock issued under employee plans and related tax benefits | | | | | | 89,603 | | | | 3,037 | | | | | | | | | | | | (172 | ) | | | 2,865 | | | | | | Stocks issued in acquisition | | | 271 | | | 1,186,728 | | | | 46,480 | | | | | | | | | | | | | | | | 46,751 | | | | | | Common stock repurchased | | | | | | (113,796 | ) | | | (4,837 | ) | | | 88 | | | | | | | | | | | | (4,749 | ) | | | | | Conversion of preferred stock | | | (54 | ) | | 4,240 | | | | 54 | | | | | | | | | | | | | | | | — | | | | | | Other | | | | | | | | | | (7 | ) | | | 39 | | | | | | | | (1 | ) | | | 31 | | | | | | | | |
|
|
| |
|
| |
|
|
| |
|
|
| |
|
|
| |
|
|
| |
|
|
| |
|
|
| Balance, September 30, 2004 | | $ | 271 | | | 4,049,063 | | | $ | 44,756 | | | $ | 55,979 | | | $ | (2,669 | ) | | $ | (326 | ) | | $ | 98,011 | | | $ | 9,773 | | | | |
|
|
| |
|
| |
|
|
| |
|
|
| |
|
|
| |
|
|
| |
|
|
| |
|
|
|
(1) | | At September 30, 2004, June 30, 2004, and March 31, 2004, Accumulated Other Comprehensive Income (Loss) includes Net Unrealized Gains (Losses) on AFS Debt and Marketable Equity Securities of $(460) million, $(2,095) million and $591 million, respectively; Net Unrealized Losses on Foreign Currency Translation Adjustments of $(175) million, $(184) million and $(163) million, respectively; Net Unrealized Gains (Losses) on Derivatives of $(1,930) million, $(1,479) million, and $(3,067) million, respectively; and Other of $(104) million, $(104) million and $(104) million, respectively. |
BANK OF AMERICA CORPORATION AND SUBSIDIARIES
Notes to Consolidated Financial Statements—(Continued)
Consolidated Statement of Changes in Shareholders’ Equity, As Restated
For the Three, Six and Nine Months in 2004
| | | | | | | | | | | | | | | | | | | | | | | | | | | | | | | | (Dollars in millions, shares in thousands) | | Preferred
Stock
| | | Common Stock and
Additional Paid-in
Capital
| | | Retained
Earnings
| | | Accumulated
Other
Comprehensive
Income (Loss)(1)
| | | Other
| | | Total
Share-
holders’
Equity
| | | Comprehensive
Income
| | | | | Shares
| | | Amount
| | | | | | | Balance, December 31, 2003 | | $ | 54 | | | 2,882,288 | | | $ | 29 | | | $ | 51,162 | | | $ | (2,434 | ) | | $ | (154 | ) | | $ | 48,657 | | | | | | Net income | | | | | | | | | | | | | | 2,648 | | | | | | | | | | | | 2,648 | | | $ | 2,648 | | Net unrealized gains (losses) on available-for-sale debt and marketable equity securities | | | | | | | | | | | | | | | | | | 661 | | | | | | | | 661 | | | | 661 | | Net unrealized gains (losses) on foreign currency translation adjustments | | | | | | | | | | | | | | | | | | 3 | | | | | | | | 3 | | | | 3 | | Net gains (losses) on derivatives | | | | | | | | | | | | | | | | | | (812 | ) | | | | | | | (812 | ) | | | (812 | ) | Cash dividends paid: | | | | | | | | | | | | | | | | | | | | | | | | | | | | | | | | Common | | | | | | | | | | | | | | (1,158 | ) | | | | | | | | | | | (1,158 | ) | | | | | Preferred | | | | | | | | | | | | | | (1 | ) | | | | | | | | | | | (1 | ) | | | | | Common stock issued under employee plans and related tax benefits | | | | | | 32,892 | | | | 1,060 | | | | | | | | | | | | (218 | ) | | | 842 | | | | | | Common stock repurchased | | | | | | (24,306 | ) | | | (1,061 | ) | | | 88 | | | | | | | | | | | | (973 | ) | | | | | Conversion of preferred stock | | | (1 | ) | | 100 | | | | 1 | | | | | | | | | | | | | | | | — | | | | | | Other | | | | | | | | | | | | | | (1 | ) | | | — | | | | 1 | | | | — | | | | | | | | |
|
|
| |
|
| |
|
|
| |
|
|
| |
|
|
| |
|
|
| |
|
|
| |
|
|
| Balance, March 31, 2004 | | $ | 53 | | | 2,890,974 | | | $ | 29 | | | $ | 52,738 | | | $ | (2,582 | ) | | $ | (371 | ) | | $ | 49,867 | | | $ | 2,500 | | | | |
|
|
| |
|
| |
|
|
| |
|
|
| |
|
|
| |
|
|
| |
|
|
| |
|
|
| Balance, December 31, 2003 | | $ | 54 | | | 2,882,288 | | | $ | 29 | | | $ | 51,162 | | | $ | (2,434 | ) | | $ | (154 | ) | | $ | 48,657 | | | | | | Net income | | | | | | | | | | | | | | 5,989 | | | | | | | | | | | | 5,989 | | | $ | 5,989 | | Net unrealized gains (losses) on available- for-sale debt and marketable equity securities | | | | | | | | | | | | | | | | | | (2,025 | ) | | | | | | | (2,025 | ) | | | (2,025 | ) | Net unrealized gains (losses) on foreign currency translation adjustments | | | | | | | | | | | | | | | | | | (18 | ) | | | | | | | (18 | ) | | | (18 | ) | Net gains (losses) on derivatives | | | | | | | | | | | | | | | | | | 335 | | | | | | | | 335 | | | | 335 | | Cash dividends paid: | | | | | | | | | | | | | | | | | | | | | | | | | | | | | | | | Common | | | | | | | | | | | | | | (2,796 | ) | | | | | | | | | | | (2,796 | ) | | | | | Preferred | | | | | | | | | | | | | | (6 | ) | | | | | | | | | | | (6 | ) | | | | | Common stock issued under employee plans and related tax benefits | | | | | | 66,804 | | | | 2,280 | | | | | | | | | | | | (183 | ) | | | 2,097 | | | | | | Stocks issued in acquisition | | | 271 | | | 1,186,728 | | | | 46,480 | | | | | | | | | | | | | | | | 46,751 | | | | | | Common stock repurchased | | | | | | (73,366 | ) | | | (3,076 | ) | | | 88 | | | | | | | | | | | | (2,988 | ) | | | | | Conversion of preferred stock | | | (3 | ) | | 202 | | | | 1 | | | | | | | | | | | | | | | | (2 | ) | | | | | Other | | | | | | | | | | (45 | ) | | | 15 | | | | — | | | | (1 | ) | | | (31 | ) | | | | | | | |
|
|
| |
|
| |
|
|
| |
|
|
| |
|
|
| |
|
|
| |
|
|
| |
|
|
| Balance, June 30, 2004 | | $ | 322 | | | 4,062,656 | | | $ | 45,669 | | | $ | 54,452 | | | $ | (4,142 | ) | | $ | (338 | ) | | $ | 95,963 | | | $ | 4,281 | | | | |
|
|
| |
|
| |
|
|
| |
|
|
| |
|
|
| |
|
|
| |
|
|
| |
|
|
| Balance, December 31, 2003 | | $ | 54 | | | 2,882,288 | | | $ | 29 | | | $ | 51,162 | | | $ | (2,434 | ) | | $ | (154 | ) | | $ | 48,657 | | | | | | Net income | | | | | | | | | | | | | | 10,092 | | | | | | | | | | | | 10,092 | | | $ | 10,092 | | Net unrealized gains (losses) on available-for-sale debt and marketable equity securities | | | | | | | | | | | | | | | | | | (390 | ) | | | | | | | (390 | ) | | | (390 | ) | Net unrealized gains (losses) on foreign currency translation adjustments | | | | | | | | | | | | | | | | | | (9 | ) | | | | | | | (9 | ) | | | (9 | ) | Net gains (losses) on derivatives | | | | | | | | | | | | | | | | | | 27 | | | | | | | | 27 | | | | 27 | | Cash dividends paid: | | | | | | | | | | | | | | | | | | | | | | | | | | | | | | | | Common | | | | | | | | | | | | | | (4,629 | ) | | | | | | | | | | | (4,629 | ) | | | | | Preferred | | | | | | | | | | | | | | (11 | ) | | | | | | | | | | | (11 | ) | | | | | Common stock issued under employee plans and related tax benefits | | | | | | 89,603 | | | | 3,037 | | | | | | | | | | | | (172 | ) | | | 2,865 | | | | | | Stocks issued in acquisition | | | 271 | | | 1,186,728 | | | | 46,480 | | | | | | | | | | | | | | | | 46,751 | | | | | | Common stock repurchased | | | | | | (113,796 | ) | | | (4,837 | ) | | | 88 | | | | | | | | | | | | (4,749 | ) | | | | | Conversion of preferred stock | | | (54 | ) | | 4,240 | | | | 54 | | | | | | | | | | | | | | | | — | | | | | | Other | | | | | | | | | | (7 | ) | | | 37 | | | | — | | | | — | | | | 30 | | | | | | | | |
|
|
| |
|
| |
|
|
| |
|
|
| |
|
|
| |
|
|
| |
|
|
| |
|
|
| Balance, September 30, 2004 | | $ | 271 | | | 4,049,063 | | | $ | 44,756 | | | $ | 56,739 | | | $ | (2,806 | ) | | $ | (326 | ) | | $ | 98,634 | | | $ | 9,720 | | | | |
|
|
| |
|
| |
|
|
| |
|
|
| |
|
|
| |
|
|
| |
|
|
| |
|
|
|
(1) | | At September 30, 2004, June 30, 2004, and March 31, 2004, Accumulated Other Comprehensive Income (Loss) includes Net Unrealized Gains (Losses) on AFS Debt and Marketable Equity Securities of $(460) million, $(2,095) million and $591 million, respectively; Net Unrealized Losses on Foreign Currency Translation Adjustments of $(175) million, $(184) million and $(163) million, respectively; Net Unrealized Gains (Losses) on Derivatives of $(2,067) million, $(1,759) million, and $(2,906) million, respectively; and Other of $(104) million, $(104) million and $(104) million, respectively. |
BANK OF AMERICA CORPORATION AND SUBSIDIARIES
Notes to Consolidated Financial Statements—(Continued)
Consolidated Statement of Cash Flows
| | | | | | | | | | | | | | | | | | | | Three Months Ended March 31
| | | | | 2005
| | | 2004
| | | (Dollars in millions) | | As Previously
Reported
| | | Restated
| | | As Previously
Reported
| | | Restated
| | Operating activities | | | | | | | | | | | | | | | | | Net income | | $ | 4,695 | | | $ | 4,393 | | | $ | 2,681 | | | $ | 2,648 | | Reconciliation of net income to net cash provided by (used in) operating activities: | | | | | | | | | | | | | | | | | Provision for credit losses | | | 580 | | | | 580 | | | | 624 | | | | 624 | | Gains on sales of debt securities | | | (659 | ) | | | (659 | ) | | | (495 | ) | | | (495 | ) | Depreciation and premises improvements amortization | | | 240 | | | | 240 | | | | 209 | | | | 209 | | Amortization of intangibles | | | 208 | | | | 208 | | | | 54 | | | | 54 | | Deferred income tax benefit | | | (85 | ) | | | (267 | ) | | | (66 | ) | | | (86 | ) | Net increase in trading and derivative instruments | | | (13,041 | ) | | | (12,697 | ) | | | (8,528 | ) | | | (7,475 | ) | Net (increase) decrease in other assets | | | 4,283 | | | | 4,283 | | | | (5,063 | ) | | | (5,063 | ) | Net decrease in accrued expenses and other liabilities | | | (4,489 | ) | | | (4,489 | ) | | | (8,252 | ) | | | (8,252 | ) | Other operating activities, net | | | (3,707 | ) | | | (3,669 | ) | | | 3,275 | | | | 2,275 | | | | |
|
|
| |
|
|
| |
|
|
| |
|
|
| Net cash used in operating activities | | | (11,975 | ) | | | (12,077 | ) | | | (15,561 | ) | | | (15,561 | ) | | | |
|
|
| |
|
|
| |
|
|
| |
|
|
| Investing activities | | | | | | | | | | | | | | | | | Net (increase) decrease in time deposits placed and other short-term investments | | | 1,138 | | | | 1,138 | | | | (510 | ) | | | (510 | ) | Net (increase) decrease in federal funds sold and securities purchased under agreements to resell | | | (48,036 | ) | | | (48,036 | ) | | | 3,435 | | | | 3,435 | | Proceeds from sales of available-for-sale securities | | | 38,451 | | | | 38,451 | | | | 11,090 | | | | 11,090 | | Proceeds from maturities of available-for-sale securities | | | 10,181 | | | | 10,181 | | | | 1,848 | | | | 1,848 | | Purchases of available-for-sale securities | | | (74,552 | ) | | | (74,552 | ) | | | (84,567 | ) | | | (84,567 | ) | Proceeds from maturities of held-to-maturity securities | | | 55 | | | | 55 | | | | 5 | | | | 5 | | Proceeds from sales of loans and leases | | | 1,113 | | | | 1,113 | | | | 876 | | | | 876 | | Other changes in loans and leases, net | | | (9,560 | ) | | | (9,574 | ) | | | (6,133 | ) | | | (6,133 | ) | Additions to mortgage servicing rights, net | | | (168 | ) | | | (168 | ) | | | (249 | ) | | | (249 | ) | Net purchases of premises and equipment | | | (254 | ) | | | (254 | ) | | | (249 | ) | | | (249 | ) | Proceeds from sales of foreclosed properties | | | 26 | | | | 26 | | | | 49 | | | | 49 | | Net cash paid for business acquisitions | | | (116 | ) | | | — | | | | (15 | ) | | | (15 | ) | Other investing activities, net | | | (72 | ) | | | (72 | ) | | | 800 | | | | 800 | | | | |
|
|
| |
|
|
| |
|
|
| |
|
|
| Net cash used in investing activities | | | (81,794 | ) | | | (81,692 | ) | | | (73,620 | ) | | | (73,620 | ) | | | |
|
|
| |
|
|
| |
|
|
| |
|
|
| Financing activities | | | | | | | | | | | | | | | | | Net increase in deposits | | | 11,417 | | | | 11,417 | | | | 21,479 | | | | 21,479 | | Net increase in federal funds purchased and securities sold under agreements to repurchase | | | 67,911 | | | | 67,911 | | | | 37,388 | | | | 37,388 | | Net increase in commercial paper and other short-term borrowings | | | 14,842 | | | | 14,842 | | | | 21,634 | | | | 21,634 | | Proceeds from issuance of long-term debt | | | 4,768 | | | | 4,768 | | | | 7,558 | | | | 7,558 | | Retirement of long-term debt | | | (2,702 | ) | | | (2,702 | ) | | | (2,507 | ) | | | (2,507 | ) | Proceeds from issuance of common stock | | | 1,180 | | | | 1,180 | | | | 1,000 | | | | 1,000 | | Common stock repurchased | | | (1,990 | ) | | | (1,990 | ) | | | (973 | ) | | | (973 | ) | Cash dividends paid | | | (1,835 | ) | | | (1,835 | ) | | | (1,159 | ) | | | (1,159 | ) | Other financing activities, net | | | (37 | ) | | | (37 | ) | | | (23 | ) | | | (23 | ) | | | |
|
|
| |
|
|
| |
|
|
| |
|
|
| Net cash provided by financing activities | | | 93,554 | | | | 93,554 | | | | 84,397 | | | | 84,397 | | | | |
|
|
| |
|
|
| |
|
|
| |
|
|
| Effect of exchange rate changes on cash and cash equivalents | | | (23 | ) | | | (23 | ) | | | (4 | ) | | | (4 | ) | | | |
|
|
| |
|
|
| |
|
|
| |
|
|
| Net decrease in cash and cash equivalents | | | (238 | ) | | | (238 | ) | | | (4,788 | ) | | | (4,788 | ) | Cash and cash equivalents at January 1 | | | 28,936 | | | | 28,936 | | | | 27,084 | | | | 27,084 | | | | |
|
|
| |
|
|
| |
|
|
| |
|
|
| Cash and cash equivalents at March 31 | | $ | 28,698 | | | $ | 28,698 | | | $ | 22,296 | | | $ | 22,296 | | | | |
|
|
| |
|
|
| |
|
|
| |
|
|
|
BANK OF AMERICA CORPORATION AND SUBSIDIARIES
Notes to Consolidated Financial Statements—(Continued)
Consolidated Statement of Cash Flows
| | | | | | | | | | | | | | | | | | | | Six Months Ended June 30
| | | | | 2005
| | | 2004
| | | (Dollars in millions) | | As Previously
Reported
| | | Restated
| | | As Previously
Reported
| | | Restated
| | Operating activities | | | | | | | | | | | | | | | | | Net income | | $ | 8,991 | | | $ | 9,050 | | | $ | 6,530 | | | $ | 5,989 | | Reconciliation of net income to net cash provided by (used in) operating activities: | | | | | | | | | | | | | | | | | Provision for credit losses | | | 1,455 | | | | 1,455 | | | | 1,413 | | | | 1,413 | | Gains on sales of debt securities | | | (984 | ) | | | (984 | ) | | | (1,290 | ) | | | (1,290 | ) | Depreciation and premises improvements amortization | | | 478 | | | | 478 | | | | 477 | | | | 477 | | Amortization of intangibles | | | 412 | | | | 412 | | | | 255 | | | | 255 | | Deferred income tax expense (benefit) | | | 391 | | | | 425 | | | | (11 | ) | | | (335 | ) | Net increase in trading and derivative instruments | | | (7,014 | ) | | | (6,897 | ) | | | (9,799 | ) | | | (10,444 | ) | Net increase in other assets | | | (299 | ) | | | (299 | ) | | | (281 | ) | | | (281 | ) | Net decrease in accrued expenses and other liabilities | | | (5,869 | ) | | | (5,869 | ) | | | (7,800 | ) | | | (7,800 | ) | Other operating activities, net | | | (4,858 | ) | | | (5,150 | ) | | | (669 | ) | | | 842 | | | | |
|
|
| |
|
|
| |
|
|
| |
|
|
| Net cash used in operating activities | | | (7,297 | ) | | | (7,379 | ) | | | (11,175 | ) | | | (11,174 | ) | | | |
|
|
| |
|
|
| |
|
|
| |
|
|
| Investing activities | | | | | | | | | | | | | | | | | Net decrease in time deposits placed and other short-term investments | | | 2,679 | | | | 2,679 | | | | 796 | | | | 796 | | Net (increase) decrease in federal funds sold and securities purchased under agreements to resell | | | (57,927 | ) | | | (57,927 | ) | | | 6,043 | | | | 6,043 | | Proceeds from sales of available-for-sale securities | | | 140,666 | | | | 132,006 | | | | 37,729 | | | | 37,729 | | Proceeds from maturities of available-for-sale securities | | | 14,794 | | | | 21,808 | | | | 12,215 | | | | 12,215 | | Purchases of available-for-sale securities | | | (192,401 | ) | | | (190,755 | ) | | | (123,771 | ) | | | (123,771 | ) | Proceeds from maturities of held-to-maturity securities | | | 156 | | | | 156 | | | | 5 | | | | 5 | | Proceeds from sales of loans and leases | | | 12,221 | | | | 12,221 | | | | 2,002 | | | | 2,002 | | Other changes in loans and leases, net | | | (21,540 | ) | | | (21,574 | ) | | | (3,497 | ) | | | (3,498 | ) | Additions to mortgage servicing rights, net | | | (407 | ) | | | (407 | ) | | | (662 | ) | | | (662 | ) | Net purchases of premises and equipment | | | (563 | ) | | | (563 | ) | | | (585 | ) | | | (585 | ) | Proceeds from sales of foreclosed properties | | | 58 | | | | 58 | | | | 97 | | | | 97 | | Net cash (paid for) acquired in business acquisitions | | | (116 | ) | | | — | | | | 5,608 | | | | 5,608 | | Other investing activities, net | | | 306 | | | | 306 | | | | (138 | ) | | | (138 | ) | | | |
|
|
| |
|
|
| |
|
|
| |
|
|
| Net cash used in investing activities | | | (102,074 | ) | | | (101,992 | ) | | | (64,158 | ) | | | (64,159 | ) | | | |
|
|
| |
|
|
| |
|
|
| |
|
|
| Financing activities | | | | | | | | | | | | | | | | | Net increase in deposits | | | 16,847 | | | | 16,847 | | | | 21,266 | | | | 21,266 | | Net increase in federal funds purchased and securities sold under agreements to repurchase | | | 87,969 | | | | 87,969 | | | | 35,275 | | | | 35,275 | | Net increase in commercial paper and other short-term borrowings | | | 15,165 | | | | 15,165 | | | | 22,000 | | | | 22,000 | | Proceeds from issuance of long-term debt | | | 7,806 | | | | 7,806 | | | | 12,648 | | | | 12,648 | | Retirement of long-term debt | | | (7,714 | ) | | | (7,714 | ) | | | (7,385 | ) | | | (7,385 | ) | Proceeds from issuance of common stock | | | 1,927 | | | | 1,927 | | | | 2,052 | | | | 2,052 | | Common stock repurchased | | | (3,819 | ) | | | (3,819 | ) | | | (2,988 | ) | | | (2,988 | ) | Cash dividends paid | | | (3,649 | ) | | | (3,649 | ) | | | (2,802 | ) | | | (2,802 | ) | Other financing activities, net | | | (58 | ) | | | (58 | ) | | | (9 | ) | | | (9 | ) | | | |
|
|
| |
|
|
| |
|
|
| |
|
|
| Net cash provided by financing activities | | | 114,474 | | | | 114,474 | | | | 80,057 | | | | 80,057 | | | | |
|
|
| |
|
|
| |
|
|
| |
|
|
| Effect of exchange rate changes on cash and cash equivalents | | | (104 | ) | | | (104 | ) | | | (19 | ) | | | (19 | ) | | | |
|
|
| |
|
|
| |
|
|
| |
|
|
| Net increase in cash and cash equivalents | | | 4,999 | | | | 4,999 | | | | 4,705 | | | | 4,705 | | Cash and cash equivalents at January 1 | | | 28,936 | | | | 28,936 | | | | 27,084 | | | | 27,084 | | | | |
|
|
| |
|
|
| |
|
|
| |
|
|
| Cash and cash equivalents at June 30 | | $ | 33,935 | | | $ | 33,935 | | | $ | 31,789 | | | $ | 31,789 | | | | |
|
|
| |
|
|
| |
|
|
| |
|
|
|
BANK OF AMERICA CORPORATION AND SUBSIDIARIES
Notes to Consolidated Financial Statements—(Continued)
Consolidated Statement of Cash Flows
| | | | | | | | | | | | | | | | | | | | Nine Months Ended September 30
| | | | | 2005
| | | 2004
| | | (Dollars in millions) | | As Previously
Reported
| | | Restated
| | | As Previously
Reported
| | | Restated
| | Operating activities | | | | | | | | | | | | | | | | | Net income | | $ | 13,118 | | | $ | 12,891 | | | $ | 10,294 | | | $ | 10,092 | | Reconciliation of net income to net cash provided by (used in) operating activities: | | | | | | | | | | | | | | | | | Provision for credit losses | | | 2,614 | | | | 2,614 | | | | 2,063 | | | | 2,063 | | Gains on sales of debt securities | | | (1,013 | ) | | | (1,013 | ) | | | (2,022 | ) | | | (1,623 | ) | Depreciation and premises improvements amortization | | | 716 | | | | 716 | | | | 723 | | | | 723 | | Amortization of intangibles | | | 613 | | | | 613 | | | | 455 | | | | 455 | | Deferred income tax expense (benefit) | | | 262 | | | | 126 | | | | (402 | ) | | | (524 | ) | Net increase in trading and derivative instruments | | | (10,305 | ) | | | (10,503 | ) | | | (21,396 | ) | | | (22,153 | ) | Net increase in other assets | | | (3,330 | ) | | | (3,130 | ) | | | (590 | ) | | | (590 | ) | Net decrease in accrued expenses and other liabilities | | | (6,015 | ) | | | (6,015 | ) | | | (7,919 | ) | | | (7,919 | ) | Other operating activities, net | | | (6,994 | ) | | | (6,718 | ) | | | (1,043 | ) | | | 20 | | | | |
|
|
| |
|
|
| |
|
|
| |
|
|
| Net cash used in operating activities | | | (10,334 | ) | | | (10,419 | ) | | | (19,837 | ) | | | (19,456 | ) | | | |
|
|
| |
|
|
| |
|
|
| |
|
|
| Investing activities | | | | | | | | | | | | | | | | | Net decrease in time deposits placed and other short-term investments | | | 1,125 | | | | 1,125 | | | | 193 | | | | 193 | | Net increase in federal funds sold and securities purchased under agreements to resell | | | (44,049 | ) | | | (44,049 | ) | | | (17,090 | ) | | | (17,090 | ) | Proceeds from sales of available-for-sale securities | | | 143,079 | | | | 143,079 | | | | 77,860 | | | | 88,425 | | Proceeds from maturities of available-for-sale securities | | | 24,378 | | | | 24,378 | | | | 19,710 | | | | 19,710 | | Purchases of available-for-sale securities | | | (202,053 | ) | | | (202,053 | ) | | | (165,359 | ) | | | (176,323 | ) | Proceeds from maturities of held-to-maturity securities | | | 194 | | | | 194 | | | | 63 | | | | 63 | | Proceeds from sales of loans and leases | | | 13,059 | | | | 13,059 | | | | 3,192 | | | | 3,192 | | Other changes in loans and leases, net | | | (48,730 | ) | | | (48,763 | ) | | | (18,938 | ) | | | (18,942 | ) | Additions to mortgage servicing rights, net | | | (663 | ) | | | (663 | ) | | | (841 | ) | | | (841 | ) | Net purchases of premises and equipment | | | (858 | ) | | | (858 | ) | | | (970 | ) | | | (970 | ) | Proceeds from sales of foreclosed properties | | | 101 | | | | 101 | | | | 145 | | | | 145 | | Investment in China Construction Bank | | | (2,500 | ) | | | (2,500 | ) | | | — | | | | — | | Net cash (paid in) acquired in business acquisitions | | | (118 | ) | | | — | | | | 5,593 | | | | 5,615 | | Other investing activities, net | | | 83 | | | | 83 | | | | 788 | | | | 788 | | | | |
|
|
| |
|
|
| |
|
|
| |
|
|
| Net cash used in investing activities | | | (116,952 | ) | | | (116,867 | ) | | | (95,654 | ) | | | (96,035 | ) | | | |
|
|
| |
|
|
| |
|
|
| |
|
|
| Financing activities | | | | | | | | | | | | | | | | | Net increase in deposits | | | 7,907 | | | | 7,907 | | | | 37,111 | | | | 37,111 | | Net increase in federal funds purchased and securities sold under agreements to repurchase | | | 97,312 | | | | 97,312 | | | | 59,003 | | | | 59,003 | | Net increase in commercial paper and other short-term borrowings | | | 29,057 | | | | 29,057 | | | | 20,424 | | | | 20,424 | | Proceeds from issuance of long-term debt | | | 17,813 | | | | 17,813 | | | | 19,080 | | | | 19,080 | | Retirement of long-term debt | | | (13,076 | ) | | | (13,076 | ) | | | (11,286 | ) | | | (11,286 | ) | Proceeds from issuance of common stock | | | 2,215 | | | | 2,215 | | | | 2,729 | | | | 2,729 | | Common stock repurchased | | | (4,281 | ) | | | (4,281 | ) | | | (4,749 | ) | | | (4,749 | ) | Cash dividends paid | | | (5,672 | ) | | | (5,672 | ) | | | (4,640 | ) | | | (4,640 | ) | Other financing activities, net | | | (104 | ) | | | (104 | ) | | | (41 | ) | | | (41 | ) | | | |
|
|
| |
|
|
| |
|
|
| |
|
|
| Net cash provided by financing activities | | | 131,171 | | | | 131,171 | | | | 117,631 | | | | 117,631 | | | | |
|
|
| |
|
|
| |
|
|
| |
|
|
| Effect of exchange rate changes on cash and cash equivalents | | | (50 | ) | | | (50 | ) | | | 28 | | | | 28 | | | | |
|
|
| |
|
|
| |
|
|
| |
|
|
| Net increase in cash and cash equivalents | | | 3,835 | | | | 3,835 | | | | 2,168 | | | | 2,168 | | Cash and cash equivalents at January 1 | | | 28,936 | | | | 28,936 | | | | 27,084 | | | | 27,084 | | | | |
|
|
| |
|
|
| |
|
|
| |
|
|
| Cash and cash equivalents at September 30 | | $ | 32,771 | | | $ | 32,771 | | | $ | 29,252 | | | $ | 29,252 | | | | |
|
|
| |
|
|
| |
|
|
| |
|
|
|
Item 9. CHANGES IN AND DISAGREEMENTS WITH ACCOUNTANTS ON ACCOUNTING AND FINANCIAL DISCLOSURE
There were no changes in or disagreements with accountants on accounting and financial disclosure. Item 9A. CONTROLS AND PROCEDURES
(a) Restatement
| | Item 9A. Controls And Procedures |
As a result of a recent interpretation on the “short cut” methodend of accounting for derivatives as hedges underthe period covered by this report and pursuant to Rule 13a-15 of SFAS 133, the Corporation undertook additional review and testing related to the remediationSecurities Exchange Act of a significant deficiency outstanding at December 31, 2004 which had been previously reported to the Audit Committee. As a result of that review and testing, management identified additional deficiencies in1934 (the “Exchange Act”), the Corporation’s processes and procedures related tomanagement, including the accounting treatment of derivative transactions used as hedges against changes in interest rates and foreign currency values. After initial discussions with the Audit Committee Chair, the Audit Committee held a meeting on February 15, 2006 to review with management the potential impact of these matters. After completing further analysis, management recommended to the Audit Committee, at a follow-up meeting held on February 21, 2006, that previously reported financial results be restated to eliminate hedge accounting for certain transactions. The Audit Committee agreed with management’s recommendation. In light of the restatement, the previously reported financial statements for the full year 2002 as well as the quarterly and annual periods in 2003, 2004, and 2005 should no longer be relied upon.
(b) Evaluation of Disclosure Controls and Procedures
In connection with the restatement, under the direction of our Chief Executive Officer and Chief Financial Officer, we reevaluated our disclosure controlsconducted an evaluation of the effectiveness and procedures. As a result we determined that a deficiency in processes and procedures over financial reportingdesign of derivatives and hedging originally classified as a significant deficiency at December 31, 2004 should have been classified as a material weakness at December 31, 2004. Solely as a result of this material weakness, we concluded that our disclosure controls and procedures were not effective as(as that term is defined in Rules 13a-15(e) and 15d-15(e) of March 31, 2005, June 30, 2005, and September 30, 2005.
(c) Remediation of Material Weakness in Internal Control
We believethe Exchange Act). Based upon that we have fully remediatedevaluation, the material weakness in our internal control over financial reporting with respect to accounting for derivative transactions used as hedges as of December 31, 2005. The remedial actions included:
implementing additional management and oversight controls to review and approve hedging strategies and related documentation to ensure hedge accounting is appropriately applied with respect to SFAS 133;
discontinuing practices and processes where sustainable controls did not exist and automating other critical functions within the process; and
retesting our internal financial controls with respect to the deficiencies related to the material weakness to ensure they are operating effectively to ensure compliance with SFAS 133.
In connection with this report, under the direction of ourCorporation’s Chief Executive Officer and Chief Financial Officer we have evaluated ourconcluded, as of the end of the period covered by this report, that Bank of America’s disclosure controls and procedures currentlywere effective in effect, includingrecording, processing, summarizing and reporting information required to be disclosed, within the remedial actions discussed above,time periods specified in the Securities and we have concluded that, as of December 31, 2005, our disclosure controlsExchange Commission’s rules and procedures are effective.
forms. See Report of Management on page 87100 for management’s report on the Corporation’s internal control over financial reporting which is incorporated herein by reference. Except for the remediationIn addition, and as of the material weakness discussed above,end of the period covered by this report, there washave been no changechanges in our internal control over financial reporting during the quarter ended December 31, 2005,2006, that materially affected, or isare reasonably likely to materially affect, our internal control over financial reporting.
Item 9B. OTHER INFORMATION
| | Item 9B. Other Information |
None PART III
Item 10. DIRECTORS AND EXECUTIVE OFFICERS OF THE REGISTRANT
| | Item 10. Directors, Executive Officers and Corporate Governance |
Information included under the following captions in the Corporation’s proxy statement relating to its 20062007 annual meeting of stockholders (the “2006“2007 Proxy Statement”) is incorporated herein by reference: “Section 16(a) Beneficial Ownership Reporting Compliance”; “Agreements with Certain Executive Officers”Corporate Governance - Code of Ethics”; and “Corporate Governance.Governance - Audit Committee.” Additional information required by Item 10 with respect to executive officers is set forth in Part I, Item 4A hereof. Information regarding the Corporation’s directors is set forth in the Proxy Statement on pages 1114 through 1416 under “The Nominees.” The most recent certifications by the Corporation’s Chief Executive Officer and Chief Financial Officer pursuant to Section 302 of the Sarbanes-Oxley Act of 2002 are filed as Exhibits 31(a) and 31(b) to this report. The Corporation also has submitted to the New York Stock Exchange (the “NYSE”) its most recent annual certification by its Chief Executive Officer confirming that the Corporation has complied with the NYSE corporate governance standards, as required by Section 303A.12(a) of the NYSE-Listed Company Manual.
Item 11. EXECUTIVE COMPENSATION
| | Item 11. Executive Compensation |
Information included under the following captions in the 20062007 Proxy Statement is incorporated herein by reference: “Corporate Governance - Director Compensation”; “Compensation Discussion and Analysis”; “Executive Compensation”; “Retirement Plans for Executive Officers”;
“Agreements with Certain Executive Officers”;
“Compensation Committee Interlocks and Insider Participation”; and “Certain Transactions.Compensation Committee Report.” Item 12. SECURITY OWNERSHIP OF CERTAIN BENEFICIAL OWNERS AND MANAGEMENT AND RELATED STOCKHOLDER MATTERS
| | Item 12. Security Ownership of Certain Beneficial Owners and Management and Related Stockholder Matters |
Information included under the following caption in the 20062007 Proxy Statement is incorporated herein by reference: See also Note 17 of the Consolidated Financial Statements for information on the Corporation’sBank of America’s equity compensation plans. Item 13. CERTAIN RELATIONSHIPS AND RELATED TRANSACTIONS
| | Item 13. Certain Relationships and Related Transactions, and Director Independence |
Information included under the following captions in the 20062007 Proxy Statement is incorporated herein by reference: “Compensation Committee Interlocks and Insider Participation”Corporate Governance - Director Independence”; and Item 14. PRINCIPAL ACCOUNTANT FEES AND SERVICES
| | Item 14. Principal Accountant Fees and Services |
Information included under the following captions in the 20062007 Proxy Statement is incorporated herein by reference: “Item 2: Ratification of the Independent Registered Public Accountants.Accounting Firm.” PART IV
Item 15. EXHIBITS, FINANCIAL STATEMENT SCHEDULES
| | Item 15. Exhibits, Financial Statement Schedules |
With the exception of the information expressly incorporated herein by reference, the 20062007 Proxy Statement is not to be deemed filed as part of this Annual Report on Form 10-K.
SIGNATURES Pursuant to the requirements of Section 13 of the Securities Exchange Act of 1934, the registrant has duly caused this report to be signed on its behalf by the undersigned, thereunto duly authorized. Date: February 28, 2007 Date: March 16, 2006
| | | BANK OF AMERICA CORPORATION
Bank of America Corporation | | | By: | | */s/ KENNETHKenneth D. LEWISLewis
| | | Kenneth D. Lewis Chairman, Chief Executive Officer and President |
Pursuant to the requirements of the Securities Exchange Act of 1934, this report has been signed below by the following persons on behalf of the registrant and in the capacities and on the dates indicated. | | | | | Signature
| | Title
| | Date
| | | | */s/ KENNETH D. LEWIS
Kenneth D. Lewis Kenneth D. Lewis | | Chairman, Chief Executive Officer and President and Director (Principal Executive Officer) | | March 16, 2006February 28, 2007 | | | | */s/ ALVARO G.DE MOLINAJoe L. Price
Alvaro G. de MolinaJoe L. Price
| | Chief Financial Officer (Principal Financial Officer) | | March 16, 2006February 28, 2007 | | | | */s/ NEIL A. COTTY
Neil A. Cotty Neil A. Cotty | | Senior Vice President and Chief Accounting Officer (Principal Accounting Officer) | | March 16, 2006February 28, 2007 | | | | */s/ WILLIAM BARNET, III
William Barnet, III William Barnet, III | | Director | | March 16, 2006February 28, 2007 | | | | */s/ FRANK P. BRAMBLE, SR.
Frank P. Bramble, Sr. Frank P. Bramble, Sr. | | Director | | March 16, 2006February 28, 2007 | | | | */s/ CHARLES W. COKERJohn T. Collins
Charles W. CokerJohn T. Collins
| | Director | | March 16, 2006February 28, 2007 | | | | */s/ JOHN T. COLLINSGary L. Countryman
John T. CollinsGary L. Countryman
| | Director | | March 16, 2006February 28, 2007 | | | | */s/ GARY L. COUNTRYMANTommy R. Franks
Gary L. CountrymanTommy R. Franks
| | Director | | March 16, 2006February 28, 2007 | | | | */s/ TOMMY R. FRANKSPaul Fulton
Tommy R. FranksPaul Fulton
| | Director | | March 16, 2006February 28, 2007 | | | | */s/ PAUL FULTONCharles K. Gifford
Paul FultonCharles K. Gifford
| | Director | | March 16, 2006February 28, 2007 | | | | */s/ CHARLES K. GIFFORDW. Steven Jones
Charles K. GiffordW. Steven Jones
| | Director | | March 16, 2006February 28, 2007 | | | | */s/ W. STEVEN JONESMonica C. Lozano
W. Steven JonesMonica C. Lozano
| | Director | | March 16, 2006February 28, 2007 | | | | */s/ WALTER E. MASSEY
Walter E. Massey Walter E. Massey | | Director | | March 16, 2006February 28, 2007 |
| | | | | Signature
| | Title
| | Date
| | | | */s/ THOMAS J. MAY
Thomas J. May Thomas J. May | | Director | | March 16, 2006February 28, 2007 | | | | */s/ PATRICIA E. MITCHELL
Patricia E. Mitchell Patricia E. Mitchell | | Director | | March 16, 2006February 28, 2007 | | | | */s/ EDWARD L. ROMEROThomas M. Ryan
Edward L. RomeroThomas M. Ryan
| | Director | | March 16, 2006February 28, 2007 | | | | */s/ THOMAS M. RYANO. Temple Sloan, Jr.
Thomas M. RyanO. Temple Sloan, Jr.
| | Director | | March 16, 2006February 28, 2007 | | | | */s/ O. TEMPLE SLOAN, JR.Meredith R. Spangler
O. Temple Sloan, Jr.Meredith R. Spangler
| | Director | | March 16, 2006February 28, 2007 | | | | */s/ MEREDITH R. SPANGLERRobert L. Tillman
Meredith R. SpanglerRobert L. Tillman
| | Director | | March 16, 2006February 28, 2007 | | | | */s/ JACKIE M. WARD
Jackie M. Ward Jackie M. Ward | | Director | | March 16, 2006February 28, 2007 | | | | *By: /s/ WILLIAM J. MOSTYN III
William J. Mostyn III William J. Mostyn III Attorney-in-Fact | | | | |
INDEX TO EXHIBITS | | | Exhibit No.
| | Description
| 23(a) | | Agreement and Plan of Merger dated as of June 30, 2005, between the registrant and MBNA Corporation, incorporated by reference to Exhibit 2.1 of registrant’s Current Report on Form 8-K filed July 6, 2005. | 3(a) | | Amended and Restated Certificate of Incorporation of registrant, as in effect on the date hereof, incorporated by reference to Exhibit 99.1 of registrant’s Current Report on Form 8-K filed May 7, 1999.hereof. | (b) | | Certificate of Amendment of Amended and Restated Certificate of Incorporation of registrant, as in effect on the date hereof, incorporated by reference to Exhibit 3.1 of registrant’s Current Report on Form 8-K filed March 30, 2004. | (c) | | Amended and Restated Bylaws of registrant, as in effect on the date hereof, incorporated by reference to Exhibit 3.1 of registrant’s Current Report on Form 8-K filed December 14, 2005.January 24, 2007. | 4(a) | | Specimen certificate of registrant’s Common Stock, incorporated by reference to Exhibit 4.13 of registrant’s Registration No. 333-83503. | (b) | | Specimen certificate of registrant’s 7% Cumulative Redeemable Preferred Stock, Series B, incorporated by reference to Exhibit 4(c) of registrant’s 1998 Annual Report on Form 10-K (the “1998 10-K”). | (c) | | Amended Certificate of Designation of registrant’s 6.75 % Perpetual Preferred Stock, incorporated by reference to Exhibit 4.1 of registrant’s Current Report on Form 8-K filed March 30, 2004. | (d) | | Amended Certificate of Designation of registrant’s Fixed/Adjustable Rate Cumulative Preferred Stock, incorporated by reference to Exhibit 4.2 of registrant’s Current Report on Form 8-K filed March 30, 2004. | (e) | | Deposit Agreement relating to registrant’s Series VI 6.75% Perpetual Preferred Stock of Fleet Financial Group, Inc., dated as of February 21, 1996, by and among Fleet Financial Group, Inc., Fleet National Bank, as depositary, and the holders from time to time of the Depositary Shares, incorporated by reference to Exhibit 4.3 of registrant’s Current Report on Form 8-K filed March 30, 2004. | (f) | | Amendment to the Deposit Agreement relating to registrant’s Series VI 6.75% Perpetual Preferred Stock of Fleet Financial Group, Inc. and dated as of February 21, 1996, effective as of April 1, 2004, by and between Bank of America Corporation and EquiServe, Inc., incorporated by reference to Exhibit 4.4 of registrant’s Current Report on Form 8-K filed March 30, 2004. | (g) | | Deposit Agreement relating to registrant’s Series VII Fixed/Adjustable Rate Cumulative Preferred Stock of Fleet Financial Group, Inc., dated as of April 1, 1996, by and among Fleet Financial Group, Inc., Fleet National Bank, as depositary, and the holders from time to time of the Depositary Shares, incorporated by reference to Exhibit 4.5 of registrant’s Current Report on Form 8-K filed March 30, 2004. | (h) | | Amendment to the Deposit Agreement relating to registrant’s Series VII Fixed/Adjustable Rate Cumulative Preferred Stock of Fleet Financial Group, Inc. and dated as of February 21, 1996, effective as of April 1, 2004, by and between Bank of America Corporation and EquiServe, Inc., incorporated by reference to Exhibit 4.6 of registrant’s Current Report on Form 8-K filed March 30, 2004. | (i) | | Indenture dated as of September 1, 1989 between registrant (successor to NationsBank Corporation, formerly known as NCNB Corporation) and The Bank of New York Trust Company, N.A. (successor to The Bank of New York), pursuant to which registrant issued its 9 3/8% Subordinated Notes, due 2009; and its 10.20% Subordinated Notes, due 2015, incorporated by reference to Exhibit 4.1 of registrant’s Registration No. 33-30717; and First Supplemental Indenture thereto dated as of August 28, 1998, incorporated by reference to Exhibit 4(f) of the 1998 10-K. | (j) (b) | | Indenture dated as of January 1, 1995 between registrant (successor to NationsBank Corporation) and U.S. Bank Trust National Association (successor to BankAmerica National Trust Company), pursuant to which registrant issued its 5 7/8% Senior Notes, due 2009; its 7 1/8% Senior Notes, due 2006; its 4 3/4% Senior Notes, due 2006; its 5 1/4% Senior Notes, due 2007; its 6 1/4% Senior Notes, due 2012; its 4 7/8% Senior Notes due 2012; its 5 1/8% Senior Notes, due 2014; its 3.761% Senior Notes, due 2007; its 3 7/8% Senior Notes, due 2008; its 4 7/8% Senior Notes, due 2013; its 3 5/8% Senior Notes, due 2008; its 3 1/4% Senior Notes, due 2008; its 4¼% Senior Notes, due 2010; its 4 3/8% Senior Notes, due 2010; its 3 3/8% Senior Notes, due 2009; its 4 5/8% Senior Notes, due 2014; its 5 3/8% Senior Notes, due June 2014; its 4¼% Senior Notes, due October 2010; its 4% Senior Notes, due 2015; its Floating Rate Callable Senior Notes, due 2008; its Floating Rate Callable Senior Notes, due 2010; its 4 3/4% Senior Notes, due 2015; its 4 1/2% Senior Notes, due 2010; its Floating Rate Callable Senior Notes, due August 2008; its Three-Month LIBOR Floating Rate Senior Notes, due November 2008; its One-Month LIBOR Floating Rate Senior Notes, due November 2008; andits Three-Month LIBOR Floating Rate Notes, due March 2009; its Three-Month LIBOR Floating Rate Notes, due June 2009; its 5.38% Senior Notes, due August 2011; its Three-Month LIBOR Floating Rate Notes, due August 2011; its Three-Month PRIME Floating Rate Notes, due September 2009; its Three-Month LIBOR Floating Rate Notes, due September 2009; its 5.63% Senior Notes, due October 2016; its Three-Month LIBOR Floating Rate Notes, due November 2009; its Senior Medium-Term Notes, Series E, F, G, H, I, J and K, incorporated by reference to Exhibit 4.1 of registrant’s Registration No. 33-57533; First Supplemental Indenture thereto dated as of September 18, 1998, incorporated by reference to Exhibit 4.3 of registrant’s Current Report on Form 8-K filed November 18, 1998; and Second Supplemental Indenture thereto dated as of May 7, 2001 between registrant, U.S. Bank Trust National Association, as Prior Trustee, and the Bank of New York Trust Company, N.A. (successor to The Bank of New York), as Successor Trustee, incorporated by reference to Exhibit 4.4 of registrant’s Current Report on Form 8-K dated June 5, 2001.2001; Third Supplemental Indenture thereto dated as of July 28, 2004, between registrant and The Bank of New York Trust Company, N.A. (successor to The Bank of New York), incorporated by reference to Exhibit 4.2 of registrant’s Current Report on Form 8-K filed August 27, 2004; and Fourth Supplemental Indenture thereto dated as of April 28, 2006 between the registrant and The Bank of New York Trust Company, N.A. (successor to The Bank of New York), incorporated by reference to Exhibit 4.6 of registrant’s Registration Statement on Form S-3 (Registration No. 333-133852). | (k) (c) | | Indenture dated as of January 1, 1995 between registrant (successor to NationsBank Corporation) and The Bank of New York Trust Company, N.A. (successor to The Bank of New York), pursuant to which registrant issued its 7 3/4% Subordinated Notes, due 2015; its 7 1/4% Subordinated Notes, due 2025; its 6 1/2% Subordinated Notes, due 2006; its 7 1/2% Subordinated Notes, due 2006; its 7.80% Subordinated Notes, due 2016; its 6 3/8% Subordinated Notes, due 2008; its 6.80% Subordinated Notes, due 2028; its 6.60% Subordinated Notes, due 2010; its 7.80% Subordinated Notes due 2010; its 7.40% Subordinated Notes, due 2011; its 4 3/4% Subordinated Notes, due 2013; its 5 1/4% Subordinated Notes, due 2015; its 4 3/4% Fixed/Floating Rate Callable |
| | | Exhibit No.
| | Description
| | | Subordinated Notes, due 20192019; its 5.75% Subordinated Notes, due August 2016; its Three-month LIBOR Floating Rate Notes, due August 2016; its 5.42% Subordinated Notes, due March 2017; its 5.49% Subordinated Notes, due March 2019; and its Subordinated Medium-Term Notes, Series F incorporated by reference to Exhibit 4.8 of registrant’s Registration No. 33-57533; and First Supplemental Indenture thereto dated as of August 28, 1998, incorporated by reference to Exhibit 4.8 of registrant’s Current Report on Form 8-K filed November 18, 1998. | (l) (d) | | Amended and Restated ProgramAgency Agreement dated as of August 4, 200521, 2006 among registrant Banc of America Securities Limited and others.JPMorgan Chase Bank, N.A. London Branch. | (m) (e) | | AmendedIssuing and Restated Issuing Paying Agency Agreement dated as of January 15, 2004May 23, 2006, between Bank of America, N.A., as Issuer, and Deutsche Bank Trust Company Americas, as Issuing and Paying Agent, incorporated by reference to Exhibit 4(n) for the fiscal year ended December 31, 2004.Americas. | (n) (f) | | Indenture dated as of November 27, 1996 between registrant (successor to NationsBank Corporation) and The Bank of New York Trust Company, N.A. (successor to The Bank of New York), incorporated by reference to Exhibit 4.10 of registrant’s Registration No. 333-15375. | (o) (g) | | Second Supplemental Indenture dated as of December 17, 1996 to the Indenture dated as of November 27, 1996 between registrant (successor to NationsBank Corporation) and The Bank of New York Trust Company, N.A. (successor to The Bank of New York) pursuant to which registrant issued its 7.83% Junior Subordinated Deferrable Interest Notes due 2026, incorporated by reference to Exhibit 4.3 of registrant’s Current Report on Form 8-K dated December 10, 1996. |
| | | (p)Exhibit No. | | Description | (h) | | Third Supplemental Indenture dated as of February 3, 1997 to the Indenture dated as of November 27, 1996 between registrant (successor to NationsBank Corporation) and The Bank of New York Trust Company, N.A. (successor to The Bank of New York) pursuant to which registrant issued its Floating Rate Junior Subordinated Deferrable Interest Notes due 2027, incorporated by reference to Exhibit 4.3 of registrant’s Current Report on Form 8-K dated January 22, 1997. | (q) (i) | | Fourth Supplemental Indenture dated as of April 22, 1997 to the Indenture dated as of November 27, 1996 between registrant (successor to NationsBank Corporation) and The Bank of New York Trust Company, N.A. (successor to The Bank of New York) pursuant to which registrant issued its 8 1/4% Junior Subordinated Deferrable Interest Notes, due 2027, incorporated by reference to Exhibit 4.3 of registrant’s Current Report on Form 8-K dated April 15, 1997. | (r) (j) | | Fifth Supplemental Indenture dated as of August 28, 1998 to the Indenture dated as of November 27, 1996 between registrant and The Bank of New York Trust Company, N.A. (successor to The Bank of New York), incorporated by reference to Exhibit 4(t) of the 1998 10-K. | (s) (k) | | Indenture dated as of November 27, 1996, between Barnett Banks, Inc. and Bank One (successor to The First National Bank of Chicago), as Trustee, and First Supplemental Indenture dated as of January 9, 1998, among NationsBank Corporation, NB Holdings Corporation, Barnett Banks, Inc. and The First National Bank of Chicago (predecessor to Bank One), as Trustee, pursuant to which registrant (as successor to NationsBank Corporation) issued its 8.06% Junior Subordinated Debentures, due 2026, incorporated by reference to Exhibit 4(u) of registrant’s 1997 Annual Report on Form 10-K (the “1997 10-K”). | (t) (l) | | Indenture dated as of November 1, 1991 between the former BankAmerica Corporation and J.P. Morgan Trust Company, National Association, as successor trustee to the former Manufacturers Hanover Trust Company of California, pursuant to which registrant (as successor to the former BankAmerica Corporation) issued its 7.20% Subordinated Notes due 2006; its 6.20% Subordinated Notes due 2006; its 7 1/8% Subordinated Notes due 2006; its 6 5/8% Subordinated Notes due 2007; its 6 5/8% Subordinated Notes due August 2007; its 7 1/8% Subordinated Notes due 2009; its 7 1/8% Subordinated Notes due 2011; its 6 5/8% Subordinated Notes, due October, 2007; and its 6 1/4% Subordinated Notes due 2008; First Supplemental Indenture thereto dated as of September 8, 1992; and Second Supplemental Indenture thereto dated as of September 15, 1998, incorporated by reference to Exhibit 4(w) of the 1998 10-K. | (u) (m) | | Junior Subordinated Indenture dated as of November 27, 1996 between the former BankAmerica Corporation and Deutsche Bank Trust Company Americas, as successor trustee to Bankers Trust Company, pursuant to which registrant (as successor to the former BankAmerica Corporation) issued its 8.07% Junior Subordinated Debentures Series A due 2026; and its 7.70% Junior Subordinated Debentures Series B due 2026; and First Supplemental Indenture thereto dated as of September 15, 1998, incorporated by reference to Exhibit 4(z) of the 1998 10-K. | (v) (n) | | Junior Subordinated Indenture dated as of December 20, 1996 between the former BankAmerica Corporation and Deutsche Bank Trust Company Americas, as successor trustee to Bankers Trust Company, pursuant to which registrant (as successor to the former BankAmerica Corporation) issued its 8.00% Junior Subordinated Deferrable Interest Debentures, Series 2 due 2026 and its Floating Rate Junior Subordinated Deferrable Interest Debentures, Series 3 due 2027; and First Supplemental Indenture thereto dated as of September 15, 1998, incorporated by reference to Exhibit 4(aa) of the 1998 10-K. | (w) (o) | | Restated Senior Indenture dated as of January 1, 2001 between registrant and The Bank of New York, pursuant to which registrant issued its Senior InterNotesSM, incorporated by reference to Exhibit 4.1 of registrant’s Registration No. 333-47222. | (x) (p) | | Restated Subordinated Indenture dated as of January 1, 2001 between registrant and The Bank of New York, pursuant to which registrant issued its Subordinated InterNotesSM, incorporated by reference to Exhibit 4.2 of registrant’s Registration No. 333-47222. | (y) (q) | | Amended and Restated Senior Indenture dated as of July 1, 2001 between registrant and The Bank of New York Trust Company, N.A. (successor to The Bank of New York), pursuant to which registrant issued its Senior InterNotesSM, incorporated by reference to Exhibit 4.1 of registrant’s Registration No. 333-65750. | (z) (r) | | Amended and Restated Subordinated Indenture dated as of July 1, 2001 between registrant and The Bank of New York Trust Company, N.A. (successor to The Bank of New York), pursuant to which registrant issued its Subordinated InterNotesSM, incorporated by reference to Exhibit 4.2 of registrant’s Registration No. 333-65750. |
| | | Exhibit No.
(s) | | Description
| (aa) | | Restated Indenture dated as of November 1, 2001 between registrant and The Bank of New York Trust Company, N.A. (successor to The Bank of New York), incorporated by reference to Exhibit 4.10 of registrant’s Registration No. 333-70984. | (bb)
(t) | | First Supplemental Indenture dated as of December 14, 2001 to the Restated Indenture dated as of November 1, 2001 between registrant and The Bank of New York Trust Company, N.A. (successor to The Bank of New York) pursuant to which registrant issued its 7% Junior Subordinated Notes due 2031, incorporated by reference to Exhibit 4.3 of registrant’s Current Report on Form 8-K dated December 6, 2001. | (cc) (u) | | Second Supplemental Indenture dated as of January 31, 2002 to the Restated Indenture dated as of November 1, 2001 between registrant and The Bank of New York Trust Company, N.A. (successor to The Bank of New York) pursuant to which registrant issued its 7% Junior Subordinated Notes due 2032, incorporated by reference to Exhibit 4.3 of registrant’s Current Report on Form 8-K dated January 24, 2002. | (dd) (v) | | Third Supplemental Indenture dated as of August 9, 2002 to the Restated Indenture dated as of November 1, 2001 between registrant and The Bank of New York Trust Company, N.A. (successor to The Bank of New York) pursuant to which registrant issued its 7% Junior Subordinated Notes due 2032, incorporated by reference to Exhibit 4.3 of registrant’s Current Report on Form 8-K dated August 2, 2002. |
| | | (ee)Exhibit No. | | Description | (w) | | Fourth Supplemental Indenture dated as of April 30, 2003 between registrant and The Bank of New York Trust Company, N.A. (successor to The Bank of New York) pursuant to which registrant issued its 5 7/8% Junior Subordinated Notes due 2033, incorporated by reference to Exhibit 4.3 of registrant’s Current Report on Form 8-K dated April 23, 2003. | (ff) (x) | | Fifth Supplemental Indenture dated as of November 3, 2004 between registrant and The Bank of New York Trust Company, N.A. (successor to The Bank of New York) pursuant to which registrant issued its 6% Junior Subordinated Notes due 2034, incorporated by reference to Exhibit 4.3 of registrant’s Current Report on Form 8-K dated October 21, 2004. | (gg) (y) | | Sixth Supplemental Indenture dated as of March 8, 2005 between the registrant and The Bank of New York Trust Company, N.A. (successor to The Bank of New York) pursuant to which registrant issued its 5 5/8% Junior Subordinated Notes due 2035, incorporated by reference to Exhibit 4.3 of registrant’s Current Report on Form 8-K dated February 24, 2005. | (hh) (z) | | Seventh Supplemental Indenture dated as of August 9, 2005 between the registrant and The Bank of New YorkYorkTrust Company, N.A. (successor to The Bank of New York) pursuant to which registrant issued its 5 1/4% Junior Subordinated Notes due 2035, incorporated by reference to Exhibit 4.3 of registrant’s Current Report on Form 8-K dated August 4, 2005. | (ii) (aa) | | Eighth Supplemental Indenture dated as of August 25, 2005 between the registrant and The Bank of New York Trust Company, N.A. (successor to The Bank of New York) pursuant to which registrant issued its 6% Junior Subordinated Notes due 2035, incorporated by reference to Exhibit 4.3 of registrant’s Current Report on Form 8-K dated August 17, 2005. | (jj) (bb) | | Tenth Supplemental Indenture dated as of March 28, 2006 between the registrant and The Bank of New York Trust Company, N.A. (successor to The Bank of New York) pursuant to which registrant issued its 6 1/4% Junior Subordinated Notes due 2055. | (cc) | | Eleventh Supplemental Indenture dated as of May 23, 2006 between the registrant and The Bank of New York Trust Company, N.A. (successor to The Bank of New York) pursuant to which registrant issued its 6 5/8% Junior Subordinated Notes due 2036. | (dd) | | Twelfth Supplemental Indenture dated as of August 2, 2006 between the registrant and The Bank of New York Trust Company, N.A. (successor to The Bank of New York) pursuant to which registrant issued its 6 7/8% Junior Subordinated Notes due 2055. | (ee) | | Indenture dated as of November 26, 1996 between registrant (successor to Bank of Boston Corporation) and The Bank of New York Trust Company, N.A. (successor to The Bank of New York), as Debenture Trustee, pursuant to which registrant issued its 8.25% Junior Subordinated Deferrable Interest Debentures due 2026, incorporated by reference to Exhibit 4.1 to BankBoston Corporation’s Registration Statement on Form S-4 (File No. 333-19083); First Supplemental Indenture thereto dated as of October 1, 1999 and Second Supplemental Indenture thereto dated as of March 18, 2004, incorporated by reference to Exhibit 4(hh) of registrant’s 2004 Annual Report on Form 10-K dated March 1, 2005 (the “2004 10-K”). | (kk) (ff) | | Indenture dated as of December 10, 1996 between registrant (successor to Bank of Boston Corporation) and The Bank of New York Trust Company, N.A. (successor to The Bank of New York), as Trustee, pursuant to which registrant issued its 7 3/4% Junior Subordinated Deferrable Interest Debentures due 2026, incorporated by reference to Exhibit 4.1 to BankBoston Corporation’s Registration Statement on Form S-4 (File No. 333-19111); First Supplemental Indenture thereto dated as of October 1, 1999 and Second Supplemental Indenture thereto dated as of March 18, 2004, incorporated by reference to Exhibit 4(ii) of the 2004 10-K. | (ll) (gg) | | Indenture dated as of June 4, 1997 between registrant (successor to BankBoston Corporation) and The Bank of New York Trust Company, N.A. (successor to The Bank of New York), as Trustee, pursuant to which registrant issued its Floating Rate Junior Subordinated Deferrable Interest Debentures due 2027, incorporated by reference to Exhibit 4.1 to BankBoston Corporation’s Registration Statement on Form S-3 (File No. 333-27229); First Supplemental Indenture thereto dated as of October 1, 1999 and Second Indenture thereto dated as of March 18, 2004, incorporated by reference to Exhibit 4(jj) of the 2004 10-K. | (mm) (hh) | | Indenture dated as of December 11, 1996 between registrant (successor to Fleet Financial Group, Inc.) and The First National Bank of Chicago (predecessor to Bank One), as Trustee, incorporated by reference to Exhibit 4(b) of Fleet Financial Group, Inc.’s Current Report on Form 8-K (File No. 1-6366) dated December 20, 1996; First Supplemental Indenture thereto dated as of December 11, 1996 pursuant to which registrant issued its 7.92% Junior Subordinated Deferrable Interest Debentures due 2026, incorporated by reference to Exhibit 4(c) of Fleet Financial Group, Inc.’s Current Report on Form 8-K (File No. 1-6366) dated December 20, 1996 and Third Supplemental Indenture thereto dated as of March 18, 2004, incorporated by reference to Exhibit 4(kk) of the 2004 10-K. | (nn) (ii) | | Indenture dated as of December 18, 1998 between registrant (successor to Fleet Financial Group, Inc.) and The First National Bank of Chicago (predecessor to Bank One), as Trustee, incorporated by reference to Exhibit 4(b) of Fleet Financial Group, Inc.’s Current Report on Form 8-K (File No. 1-6366) dated December 18, 1998; First Supplemental Indenture thereto dated as of December 18, 1998 pursuant to which registrant issued its Floating Rate Junior Subordinated Deferrable Interest Debentures due 2028, incorporated by reference to Exhibit 4(c) to Fleet Financial Group, Inc.’s Current Report on Form 8-K (File No. 1-6366) dated December 18, 1998 and Second Supplemental Indenture thereto dated as of March 18, 2004, incorporated by reference to Exhibit 4(ll) of the 2004 10-K. | |
| | | Exhibit No.
| | Description
| (oo) (jj) | | Indenture dated as of June 30, 2000 between registrant (successor to FleetBoston Financial Corporation) and The Bank of New York Trust Company, N.A. (successor to The Bank of New York), as Trustee, incorporated by reference to Exhibit 4(b) of FleetBoston Financial Corporation’s Current Report on Form 8-K dated (File No. 1-6366) June 30, 2000. | (pp) (kk) | | Second Supplemental Indenture dated as of September 17, 2001 to the Indenture dated as of June 30, 2000 between registrant (successor to FleetBoston Financial Corporation) and The Bank of New York Trust Company, N.A. (successor to The Bank of New York) pursuant to which registrant | | | issued its 7.20% Junior Subordinated Deferrable Interest Debentures due 2031, incorporated by reference to Exhibit 2.6 to FleetBoston Financial Corporation’s Registration Statement on Form 8-A (File No. 1-6366) filed on September 21, 2001. | (qq) (ll) | | Third Supplemental Indenture dated as of March 8, 2002 to the Indenture dated as of June 30, 2000 between registrant (successor to FleetBoston Financial Corporation) and The Bank of New York Trust Company, N.A. (successor to The Bank of New York) pursuant to which registrant issued its 7.20% Junior Subordinated Deferrable Interest Debentures due 2032, incorporated by reference to Exhibit 2.7 to FleetBoston Financial Corporation’s Registration Statement on Form 8-A (File No. 1-6366) filed on March 8, 2002. | (rr) (mm) | | Fourth Supplemental Indenture dated as of July 31, 2003 to the Indenture dated as of June 30, 2000 between registrant (successor to FleetBoston Financial Corporation) and The Bank of New York Trust Company, N.A. (successor to The Bank of New York) pursuant to which registrant issued its 6.00% Junior subordinated Deferrable Interest Debentures due 2033, incorporated by reference to Exhibit 2.8 to FleetBoston Financial Corporation’s Registration Statement on Form 8-A (File No. 1-6366) filed on July 31, 2003. | (ss) (nn) | | Fifth Supplemental Indenture dated as of March 18, 2004 to the Indenture dated as of June 30, 2000 between the registrant (successor to FleetBoston Financial Corporation) and The Bank of New York Trust Company, N.A. (successor to The Bank of New York), incorporated by reference to Exhibit 4(rr) of the 2004 10-K. | (tt) (oo) | | Indenture dated December 6, 1999 between registrant (successor to Fleet BostonFleetBoston Corporation) and the Bank of New York,York*, as Trustee, pursuant to which registrant issued its 4 7/8% Senior Notes, due 2006; its 3.85% Senior Notes, due 2008; and its Senior Medium-Term Notes, Series T, incorporated by reference to Exhibit 4(a) to FleetBoston Financial | | | Corporation’s Registration Statement on Form S-3 (File No. 333-72912); and First Supplemental Indenture thereto dated as of March 18, 2004, incorporated by reference to Exhibit 4.61 of registrant’s Registration Statement on Form S-3/A (File No. 333-112708). | (uu) (pp) | | Indenture dated October 1, 1992 between registrant (successor to Fleet Financial Group, Inc.) and The First National Bank of Chicago (predecessor to J.P. Morgan Trust Company, N.A.), as Trustee, incorporated by reference to Exhibit 4(d) to Fleet Financial Group, Inc.’s Registration Statement on Form S-3/A (File No. 33-50216) pursuant to which registrant issued its 7 1/8% Subordinated Notes, due 2006; its 6 7/8% Subordinated Notes, due 2028; its 6½% Subordinated Notes, due 2008; its 6 3/8% Subordinated Notes, due 2008; its 6.70% Subordinated Notes, due 2028; and its 7 3/8% Subordinated Notes, due 2009; First Supplemental Indenture thereto dated as of November 30, 1992, incorporated by reference to Exhibit 4 of Fleet Financial Group, Inc.’s Current Report on Form 8-K (File No. 1-06366) filed December 2, 1992; and Second Supplemental Indenture thereto dated as of March 18, 2004, incorporated by reference to Exhibit 4.59 of registrant’s Registration Statement on Form S-3/A (File No. 333-112708). | (qq) | | Indenture dated as of September 29, 1992 between MBNA Corporation (predecessor to registrant) and Bankers Trust Company, pursuant to which MBNA issued its Senior Medium-Term Notes, Series F, incorporated by reference to Exhibit 4(a) to MBNA’s Registration Statement on Form S-3 (Registration No. 33-95600); and First Supplemental Indenture thereto dated as of December 21, 2005 between the registrant and Deutsche Bank Trust Company Americas (successor to Bankers Trust Company), incorporated by reference to Exhibit 4.32 to registrant’s Registration Statement on Form S-3 (Registration No. 333-130821). | (rr) | | Indenture dated as of December 18, 1996 between registrant (successor to MBNA Corporation) and The Bank of New York Trust Company, N.A. (successor to The Bank of New York), pursuant to which MBNA issued its 8.278% Junior Subordinated Deferrable Interest Debentures, Series A, its Floating Rate Junior Subordinated Deferrable Interest Debentures, Series B, incorporated by reference to Exhibit 4(c) to MBNA’s Registration Statement on Form S-4/A (Registration No. 333-21181). | (ss) | | First Supplemental Indenture dated as of June 27, 2002 to the Indenture dated as of December 18, 1996 between registrant (successor to MBNA Corporation) and The Bank of New York Trust Company, N.A. (successor to The Bank of New York) pursuant to which MBNA issued its 8.125% Junior Subordinated Debentures, Series D, incorporated by reference to Exhibit 4.2 to MBNA’s Current Report on Form 8-K (File No. 1-10683) filed June 26, 2002. | (tt) | | Second Supplemental Indenture dated as of November 27, 2002 to the Indenture dated as of December 18, 1996 between registrant (successor to MBNA Corporation) and The Bank of New York Trust Company, N.A. (successor to The Bank of New York) pursuant to which MBNA issued its 8.10% Junior Subordinated Debentures, Series E, incorporated by reference to Exhibit 4.2 to MBNA’s Current Report on Form 8-K (File No. 1-10683) filed November 26, 2002. | (uu) | | Third Supplemental Indenture dated as of December 21, 2005 to the Indenture dated as of December 18, 1996 among the registrant, MBNA Corporation (predecessor to registrant) and The Bank of New York Trust Company, N.A. (successor to The Bank of New York). |
| | | | Exhibit No. | | Description | (vv) | | Agency Agreement dated as of July 17, 1997, between MBNA America Bank, N.A. (predecessor to Bank of America, N.A.), The First National Bank of Chicago (predecessor to Bank One Trust Company, N.A.), as Global Agent, and others, incorporated by reference to Exhibit 4.12 to MBNA Corporation’s 1999 Annual Report on Form 10-K (File No. 1-10683), as amended by Amendment No. 1 thereto dated as of April 10, 2001, incorporated by reference to Exhibit 4.12 to MBNA Corporation’s 2001 Annual Report on Form 10-K (File No. 1-10683) and Amendment No. 2 thereto dated as April 10, 2002, incorporated by reference to Exhibit 4.15 of MBNA Corporation’s 2002 Annual Report on Form 10-K (File No. 1-10683). | (ww) | | Agency Agreement dated as of August 27, 2003 among MBNA Canada Bank, JPMorgan Chase Bank, as Global Agent, and others. | (xx) | | Agency Agreement dated as of September 15, 2004 among MBNA Europe Funding PLC, Deutsche Bank Trust Company Americas, as Global Agent, and others. | (yy) | | Fifth Supplemental Trust Deed dated as of September 24, 2004 between MBNA Europe Funding PLC, MBNA America Bank, N.A. (predecessor to Bank of America, N.A.), and Deutsche Trustee Company Limited, incorporated by reference to Exhibit 4 to MBNA Corporation’s Current Report on Form 8-K (File No. 1-10683) filed September 30, 2004 | (zz) | | Australian MTN Deed Poll dated as of May 18, 2006 granted by registrant. | (aaa) | | Agreement of Appointment and Acceptance dated as of December 29, 2006 between registrant and The Bank of New York Trust Company, N.A. | | The registrant has other long-term debt agreements, but these are not material in amount. Copies of these agreements will be
furnished to the Commission on request. | 10(a) | | NationsBank Corporation and Designated Subsidiaries Supplemental Executive Retirement Plan, incorporated by reference to Exhibit 10(j) of the 1994 10-K; Amendment thereto dated as of June 28, 1989, incorporated by reference to Exhibit 10(g) of registrant’s 1989 Annual Report on Form 10-K (the “1989 10-K”); Amendment thereto dated as of June 27, 1990, incorporated by reference to Exhibit 10(g) of registrant’s 1990 Annual Report on Form 10-K (the “1990 10-K”); Amendment thereto dated as of July 21, 1991, incorporated by reference to Exhibit 10(bb) of the 1991 10-K; Amendments thereto dated as of December 3, 1992 and December 15, 1992, incorporated by reference to Exhibit 10(l) of registrant’s 1992 Annual Report on Form 10-K (the “1992 10-K”); Amendment thereto dated as of September 28, 1994, incorporated by reference to Exhibit 10(j) of registrant’s 1994 Annual Report on Form 10-K (the “1994 Form 10-K”); Amendments thereto dated March 27, 1996 and June 25, 1997, incorporated by reference to Exhibit 10(c) of the 1997 10-K; Amendments thereto dated April 10, 1998, June 24, 1998 and October 1, 1998, incorporated by reference to Exhibit 10(b) of the 1998 10-K; Amendment thereto dated December 14, 1999, incorporated by reference to Exhibit 10(b) of registrant’s 1999 Annual Report on Form 10-K (the “1999 10-K”); and Amendment thereto dated as of March 28, 2001, incorporated by reference to Exhibit 10(b) of registrant’s 2001 Annual Report on Form 10-K (the “2001 10-K”); and Amendment thereto dated December 10, 2002, incorporated by reference to Exhibit 10(b) of registrant’s 2002 Annual Report on Form 10-K (the “2002 10-K”). | (b) | | NationsBank Corporation and Designated Subsidiaries Deferred Compensation Plan for Key Employees, incorporated by reference to Exhibit 10(k) of the 1994 10-K; Amendment thereto dated as of June 28, 1989, incorporated by reference to Exhibit 10(h) of the 1989 10-K; Amendment thereto dated as of June 27, 1990, incorporated by reference to Exhibit 10(h) of the 1990 10-K; Amendment thereto dated as of July 21, 1991, incorporated by reference to Exhibit 10(bb) of the 1991 10-K; Amendment thereto dated as of December 3, 1992, incorporated by reference to Exhibit 10(m) of the 1992 10-K; and Amendments thereto dated April 10, 1998 and October 1, 1998, incorporated by reference to Exhibit 10(b) of the 1998 10-K. | (c) | | Bank of America Pension Restoration Plan, as amended and restated effective January 1, 2005, incorporated by reference to Exhibit 10(c) of the 2004 10-K. |
| | | Exhibit No.
(d) | | Description
| (d) | | NationsBank Corporation Benefit Security Trust dated as of June 27, 1990, incorporated by reference to Exhibit 10(t) of the 1990 10-K; First Supplement thereto dated as of November 30, 1992, incorporated by reference to Exhibit 10(v) of the 1992 10-K; and Trustee Removal/Appointment Agreement dated as of December 19, 1995, incorporated by reference to Exhibit 10(o) of registrant’s 1995 Annual Report on Form 10-K. | (e) | | Bank of America 401(k) Restoration Plan, as amended and restated effective January 1, 2005.2005, incorporated by reference to Exhibit 10(e) of the registrant’s 2005 Annual Report on Form 10-K (the “2005 10-K”); and Amendment thereto dated December 15, 2006. | (f) | | Bank of America Executive Incentive Compensation Plan, as amended and restated effective December 10, 2002, incorporated by reference to Exhibit 10(g) of the 2002 10-K. | (g) | | Bank of America Director Deferral Plan, as amended and restated effective January 27, 1999, incorporated by reference to Exhibit 10(i) of the 1998 10-K; Amendment thereto dated April 24, 2002, incorporated by reference to Exhibit 10(h) of the 2002 10-K; and Bank of America Corporation Director Deferral Plan, as amended and restated, effective December 10, 2002, incorporated by reference to Exhibit 10(h) of the 2002 10-K.1, 2005. | (h) | | Bank of America Corporation Directors’ Stock Plan, as amended and restated effective January 1, 2002, incorporated by reference to Exhibit 10(j) of the 2001 10-K; Amendment thereto dated April 24, 2002, incorporated by reference to Exhibit 10(i) of the 2002 10-K; Bank of America Corporation Directors’ Stock Plan, as amended and restated effective December 10, 2002, incorporated by reference to Exhibit 10(i) of the 2002 10-K; form of Restricted Stock Award agreement, incorporated by reference to Exhibit 10(h) of the 2004 10-K; and Bank of America Corporation Directors’ Stock Plan as amended and restated effective April 26, 2006, incorporated by reference to Exhibit 10.2 to the Registrant’s Form 8-K filed on December 14, 2005. |
| | | (i)Exhibit No. | | Description | (i) | | Bank of America Corporation 2003 Key Associate Stock Plan, effective January 1, 2003, as amended and restated effective April 1, 2004, incorporated by reference to Exhibit 10(f) of registrant’s Registration Statement on Form S-4 (File No. 333-110924); Amendment thereto dated March 13, 2006; and form of Restricted Stock Units Award Agreement;Agreement and form of Stock Option Award Agreement. | (j) | | Split Dollar Life Insurance Agreement, dated as of October 16, 1998 between registrant and NationsBank, N. A., as Trustee under that certain Irrevocable Trust Agreement No. 2 dated October 1, 1998, by and between James H. Hance, Jr., as Grantor, and NationsBank, N. A., as Trustee,each incorporated by reference to Exhibit 10(dd)10(i) of the 1998 10-K; and Amendment thereto dated January 24, 2002, incorporated by reference to Exhibit 10(o) of the 20012005 10-K. | (k) (j) | | Split Dollar Life Insurance Agreement dated as of September 28, 1998 between registrant and J. Steele Alphin, as Trustee under that certain Irrevocable Trust Agreement dated June 23, 1998, by and between Kenneth D. Lewis, as Grantor, and J. Steele Alphin, as Trustee, incorporated by reference to Exhibit 10(ee) of the 1998 10-K; and Amendment thereto dated January 24, 2002, incorporated by reference to Exhibit 10(p) of the 2001 10-K. | (l) (k) | | Bank of America Corporation 2002 Associates Stock Option Plan, effective February 1, 2002, incorporated beby reference to Exhibit 10(s) of the 2002 10-K. | (m) (l) | | Take Ownership!, The BankAmerica Global Associate Stock Option Program, effective October 1, 1998, incorporated by reference to Exhibit 10(t) of the 2002 10-K. | (n) | | Amendment to various plans in connection with FleetBoston Financial Corporation merger, incorporated by reference to Exhibit 10(v) of registrant’s 2003 Annual Report on Form 10-K (the “2003 10-K”). | (o) (m) | | FleetBoston Supplemental Executive Retirement Plan, as amended by Amendment One thereto effective January 1, 1997, Amendment Two thereto effective October 15, 1997, Amendment Three thereto effective July 1, 1998, Amendment Four thereto effective August 15, 1999, Amendment Five thereto effective January 1, 2000, Amendment Six thereto effective October 10, 2001, Amendment Seven thereto effective February 19, 2002, Amendment Eight thereto effective October 15, 2002, Amendment Nine thereto effective January 1, 2003, Amendment Ten thereto effective October 21, 2003, and Amendment Eleven thereto effective December 31, 2004, incorporated by reference to Exhibit 10(r) of the 2004 10-K. | (p) (n) | | FleetBoston Amended and Restated 1992 Stock Option and Restricted Stock Plan, incorporated by reference to Exhibit 10(s) of the 2004 10-K. | (q) (o) | | FleetBoston Executive Deferred Compensation Plan No. 2, as amended by Amendment One thereto effective February 1, 1999, Amendment Two thereto effective January 1, 2000, Amendment Three thereto effective January 1, 2002, Amendment Four thereto effective October 15, 2002, Amendment Five thereto effective January 1, 2003, and Amendment Six thereto effective December 16, 2003, incorporated by reference to Exhibit 10(u) of the 2004 10-K. | (r) (p) | | FleetBoston Executive Supplemental Plan, as amended by Amendment One thereto effective January 1, 2000, Amendment Two thereto effective January 1, 2002, Amendment Three thereto effective January 1, 2003, Amendment Four thereto effective January 1, 2003, and Amendment Five thereto effective December 31, 2004, incorporated by reference to Exhibit 10(v) of the 2004 10-K. | (s) (q) | | FleetBoston Retirement Income Assurance Plan, as amended by Amendment One thereto effective January 1, 1997, Amendment Two thereto effective January 1, 2000, Amendment Three thereto effective November 1, 2001, Amendment Four thereto effective January 1, 2003, Amendment Five thereto effective December 16, 2003, and Amendment Six thereto effective December 31, 2004, incorporated by reference to Exhibit 10(w) of the 2004 10-K; and Amendment Seven thereto dated December 20, 2005.2005, incorporated by reference to Exhibit 10(s) of the 2005 10-K. | (t) (r) | | Trust Agreement for the FleetBoston Executive Deferred Compensation Plans No. 1 and 2, incorporated by reference to Exhibit 10(x) of the 2004 10-K. | (u) (s) | | Trust Agreement for the FleetBoston Executive Supplemental Plan, incorporated by reference to Exhibit 10(y) of the 2004 10-K. |
| | | Exhibit No.
(t) | | Description
| (v) | | Trust Agreement for the FleetBoston Retirement Income Assurance Plan and the FleetBoston Supplemental Executive Retirement Plan, incorporated by reference to Exhibit 10(z) of the 2004 10-K. | (w) (u) | | FleetBoston Directors Deferred Compensation and Stock Unit Plan, as amended by an amendment thereto effective as of July 1, 2000, a Second Amendment thereto effective as of January 1, 2003, a Third Amendment thereto dated April 14, 2003, and a Fourth Amendment thereto effective January 1, 2004, incorporated by reference to Exhibit 10(aa) of the 2004 10-K. | (x) (v) | | FleetBoston 1996 Long-Term Incentive Plan, incorporated by reference to Exhibit 10(bb) of the 2004
10-K. | (y) (w) | | BankBoston Corporation and its Subsidiaries Deferred Compensation Plan, as amended by a First Amendment thereto, a Second Amendment thereto, a Third Amendment thereto, an Instrument thereto (providing for the cessation of accruals effective December 31, 2000) and an Amendment thereto dated December 24, 2001, incorporated by reference to Exhibit 10(cc) of the 2004 10-K. | (z) (x) | | BankBoston, N.A. Bonus Supplemental Employee Retirement Plan, as amended by a First Amendment, a Second Amendment, a Third Amendment and a Fourth Amendment thereto, incorporated by reference to Exhibit 10(dd) of the 2004 10-K. | (aa) (y) | | Description of BankBoston Supplemental Life Insurance Plan, incorporated by reference to Exhibit 10(ee) of the 2004 10-K. |
| | | (bb)Exhibit No. | | Description | (z) | | BankBoston, N.A. Excess Benefit Supplemental Employee Retirement Plan, as amended by a First Amendment, a Second Amendment, a Third Amendment thereto (assumed by FleetBoston on October 1, 1999) and an Instrument thereto, incorporated by reference to Exhibit 10(ff) of the 2004 10-K. | (cc) (aa) | | Description of BankBoston Supplemental Long-Term Disability Plan, incorporated by reference to Exhibit 10(gg) of the 2004 10-K. | (dd) (bb) | | BankBoston Director Stock Award Plan, incorporated by reference to Exhibit 10(hh) of the 2004 10-K. | (ee) (cc) | | BankBoston Directors Deferred Compensation Plan, as amended by a First Amendment and a Second Amendment thereto, incorporated by reference to Exhibit 10(ii) of the 2004 10-K. | (ff) (dd) | | BankBoston, N.A. Directors’ Deferred Compensation Plan, as amended by a First Amendment and a Second Amendment thereto, incorporated by reference to Exhibit 10(jj) of the 2004 10-K. | (gg) (ee) | | BankBoston 1997 Stock Option Plan for Non-Employee Directors, as amended by an amendment thereto dated as of October 16, 2001, incorporated by reference to Exhibit 10(kk) of the 2004 10-K. | (hh) (ff) | | Description of BankBoston Director Retirement Benefits Exchange Program, incorporated by reference to Exhibit 10(ll) of the 2004 10-K. | (ii) (gg) | | Employment Agreement, dated as of March 14, 1999, between FleetBoston and Charles K. Gifford, as amended by an amendment thereto effective as of February 7, 2000, a Second Amendment thereto effective as of April 22, 2002, and a Third Amendment thereto effective as of October 1, 2002, incorporated by reference to Exhibit 10(mm) of the 2004 10-K. | (jj) (hh) | | Form of Change in Control Agreement entered into with Charles K. Gifford, incorporated by reference to Exhibit 10(nn) of the 2004 10-K. | (kk) (ii) | | Global amendment to definition of “change in control” or “change of control,” together with a list of plans affectiveaffected by such amendment, incorporated by reference to Exhibit 10(oo) of the 2004 10-K. | (ll) (jj) | | Employment Agreement dated October 27, 2003 between Bank of America Corporation and Brian T. Moynihan, incorporated by reference to Exhibit 10(d) of registrant’s Registration Statement on Form S-4 (File No. 333-110924). | (nn) (kk) | | Retirement Agreement dated January 26, 2005 between Bank of America Corporation and Charles K. Gifford, incorporated by reference to Exhibit 10.1 to the registrant’s Form 8-K filed on January 26, 2005. | (oo) (ll) | | Amendment to various FleetBoston stock option awards, dated March 25, 2004, incorporated by reference to Exhibit 10(ss) of the 2004 10-K. | (pp) (mm) | | Cancellation Agreement dated October 26, 2005 between Bank of America Corporation and Brian T. Moynihan, incorporated by reference to Exhibit 10.1 of registrant’s Form 8-K filed October 26, 2005. | (qq) (nn) | | Agreement Regarding Participation in the FleetBoston Supplemental Executive Retirement Plan dated October 26, 2005 between Bank of America Corporation and Brian T. Moynihan, incorporated by reference to Exhibit 10.2 of registrant’s Form 8-K filed October 26, 2005. | 12 | | Ratio of Earnings to Fixed Charges. | | | Ratio of Earnings to Fixed Charges and Preferred Dividends. | 21 | | List of Subsidiaries. | 23 | | Consent of PricewaterhouseCoopers LLP. | 24(a) | | Power of Attorney. | (b) | | Corporate Resolution. |
| | | Exhibit No.
| | DescriptionPower of Attorney.
| 31(a) (b) | | Corporate Resolution. | 31(a) | | Certification of the Chief Executive Officer pursuant to Section 302 of the Sarbanes-Oxley Act of 2002 | (b) | | Certification of the Chief Financial Officer pursuant to Section 302 of the Sarbanes-Oxley Act of 2002 | 32(a) | | Certification of the Chief Executive Officer pursuant to 18 U.S.C. Section 1350, as adopted pursuant to Section 906 of the Sarbanes-Oxley Act of 2002 | (b) | | Certification of the Chief Financial Officer pursuant to 18 U.S.C. Section 1350, as adopted pursuant to Section 906 of the Sarbanes-Oxley Act of 2002 |
| * | Denotes executive compensation plan or arrangement. |
E-7 |
|
|
|
|
|
|
|
|
|
|
|
|
|