UNITED STATES
SECURITIES AND EXCHANGE COMMISSION
Washington, DC 20549
FORM 10-K
| x | Annual Report Pursuant to Section 13 OR 15(d) of the Securities and Exchange Act of 1934 |
For the Fiscal Year Ended December 31, 20052008
| ¨ | Transition Report Pursuant to Section 13 or 15(d) of the Securities and Exchange Act of 1934 |
For the transition period from to
Commission File Number:
000-51515
CORE-MARK HOLDING COMPANY, INC.
(Exact name of registrant as specified in its charter)
| Delaware | 20-1489747 | |
| (State or other jurisdiction of incorporation or organization) | (I.R.S. Employer Identification No.) | |
395 Oyster Point Boulevard, Suite 415 South San Francisco, California 94080 | (650) 589-9445 | |
| (Address of Principal Executive Offices, including Zip Code) | (Registrant’s Telephone Number, Including Area Code) | |
Securities Registered Pursuant to Section 12(b) of the Act:
Title of each class | Name of each exchange | |
|
Securities registered pursuant to Section 12(g) of the Act:
Common Stock, par value $0.01 per share
(Title of class) None
Indicate by check mark if the registrant is a well-known seasoned issuer, as defined in Rule 405 of the Securities Act. Yes ¨No x
Indicate by check mark if the registrant is not required to file reports pursuant to Section 13 or Section 15(d) of the Act. Yes ¨No x
Indicate by check mark whether the registrant (1) has filed all reports required to be filed by Section 13 or 15(d) of the Securities Exchange Act of 1934 during the preceding 12 months (or for such shorter period that the registrant was required to file such reports) and (2) has been subject to such filing requirements for the past 90 days. Yes x No¨
Indicate by check mark if disclosure of delinquent filers pursuant to Item 405 of Regulation S-K is not contained herein, and will not be contained, to the best of registrant’s knowledge, in definitive proxy or information statements incorporated by reference in Part III of this Form 10-K or any amendment to this Form 10-K. ¨ CHECK IF APPLICABLE
Indicate by check mark whether the registrant is a large accelerated filer, an accelerated filer, a non-accelerated filer, or a non-accelerated filer.smaller reporting company. See definitionthe definitions of “large accelerated filer,” “accelerated filerfiler” and large accelerated filer”“smaller reporting company” in Rule 12b-2 of the Exchange Act. (Check one):
Large accelerated filer ¨ |
| |
Non-accelerated filer ¨ | Smaller reporting company ¨ | |
(Do not check if a smaller reporting company). | ||
Indicate by check mark whether the registrant is a shell company (as defined in Rule 12b-2 of the Act). Yes ¨No x
State the aggregate market value of the voting and non-voting common stock held by non-affiliates computed by reference to the closing price of the common stock as of June 30, 2005,2008, the last day of the registrant’s most recently completed second quarter: $265,996,663$277,773,841.
Indicate by check mark whether the registrant has filed all reports required to be filed by Section 12, 13 or 15(d) of the Securities Exchange Act of 1934 subsequent to the distribution of securities under a plan confirmed by the court. Yes x No¨
As of March 31, 2006,February 27, 2009, the Registrant had 9,841,97610,809,692 shares of its common stock issued and outstanding.
DOCUMENTS INCORPORATED BY REFERENCE(
See Parts III and IV. Registrant’s Proxy Statement for the 2009 Annual Meeting of Stockholders is incorporated by reference to Part III)III in this Form 10-K.
i
SPECIAL NOTE REGARDING FORWARD LOOKING STATEMENTS
ThisExcept for historical information, the statements made in this Annual Report on Form 10-K contains disclosures which are forward-looking statements made pursuant to the safe-harbor provisions of the Private Securities Litigation Reform Act of 1995. Forward-looking statements are based on certain assumptions or estimates, discuss future expectations, describe future plans and strategies, contain projections of results of operations or of financial condition or state other forward-looking information. Our ability to predict results or the actual effect of future plans or strategies is inherently uncertain.
Although we believe that the expectations reflected in such forward-looking statements are based on reasonable assumptions, actual results and performance could differ materially from those set forth in the forward-looking statements. Forward-looking statements include all statements that do not relate solely to historical or current facts, andin some cases can generally be identified by the use of words such as may, believe, will, expect, project, estimate, anticipate, plan“may,” “will,” “should,” “potential,” “intend,” “expect,” “seek,” “anticipate,” “estimate,” “believe,” “could,” “would,” “project,” “predict,” “continue,” “plan,” “propose” or continue.other similar words or expressions. These forward-looking statements are based on the current plans and expectations of our management and are subject to certain risks and uncertainties that could cause actual results to differ materially from historical results or those anticipated. These factorsdiscussed in such forward looking statements.
Factors that might cause or contribute to such differences include, but are not limited to: economic conditions affecting the cigarette and consumable goods industry; the adverse effect of legislation and other matters affecting the cigarette industry; financial risks associated with purchasing cigarettes and other tobacco products from certain product manufacturers; increases in excise and other taxes on cigarettes and other tobacco products; increased competition in the distribution industry; our reliance on income from rebates, allowances and other incentive programs;to our dependence on the convenience store industry;retail industry for our revenues; uncertain and recent economic conditions; competition; price increases; our dependence on relatively few suppliers; the low-margin nature of cigarette and consumable goods distribution; certain distribution centers’ dependence on a few relatively large customers; competition in the risk that we may not be able to retainlabor market and attract customers;collective bargaining agreements; product liability claims and manufacturer recalls of products; fuel price increases; our inabilitydependence on our senior management and key personnel; integration of acquired businesses; currency exchange rate fluctuations; our ability to borrow additional capital; governmental regulations and changes thereto; earthquake and natural disaster damage; failure or disruptions to our information systems; a general decline in cigarette sales volume; competition from sales of our suppliersdeep-discount brands and illicit and other low priced sales of cigarettes. Refer to provide products; the negative affectsPart I, Item 1A, “Risk Factors” of product liability claims; the loss of key personnel, our inability to attract and retain new qualified personnel or the failure to renew collective bargaining agreements covering certain of our employees; currency exchange rate fluctuations; government regulation; and the residual effects of the Fleming bankruptcy on our customer, supplier and employee relationships, and our results of operations.
this Form 10-K. Except as provided by law, we undertake no obligation to publicly update or revise any forward-looking statements, whether as a result of new information, future events or otherwise. You should also read, among other things, the risks and uncertainties described in the section of this Annual Report on Form 10-K entitled Risk Factors.
Restatements of Previously Issued Financial Statements
On March 23, 2006 the Audit Committee of the Board of Directors of the Company (as defined below) and management concluded that our audited consolidated financial statements as of December 31, 2004 and for the period from August 23, 2004 to December 31, 2004 and our unaudited condensed consolidated financial statements as of and for the six months ended June 30, 2005, each included in our registration statement on Form 10, and our unaudited condensed consolidated financial statements as of and for the three and nine months ended September 30, 2005 included in our Form 10-Q for the third quarter of 2005, should no longer be relied upon because of errors in those financial statements relating to the accounting for foreign currency translation adjustments related to intercompany balances. Accordingly, the Company is restating its financial statements for such periods to correct such error, and to correct inventory valuation errors, and other errors in estimation and balance sheet classifications. Such restatements are reflected herein and we intend to also reflect these restatements in amendments to our Form 10 registration statement and our Form 10-Q for the third quarter of 2005.
For further information concerning the restatements and the specific adjustments made seeItem 7 Management Discussion and Analysis of Financial Condition and Results of Operations—Restatements of Financial Information and Note 2 of the Notes to the Consolidated Financial Statements elsewhere herein.
ii
| ITEM 1. | BUSINESS |
Unless the context indicates otherwise, all references in this Annual Report on Form 10-K to Core-Mark, the Company, we, us, or our refer to Core-Mark Holding Company, Inc. and its direct and indirect subsidiaries.
Company Overview
Core-Mark is one of the largestleading wholesale distributors to the convenience retail industry in North America in terms of annual sales, providingand provides sales and marketing, distribution and logistics services to customer locations across the United States and Canada.
Although Core-Mark Holding Company, Inc. was incorporated in Delaware in August 2004, the business conducted by Core-Mark dates back to 1888 when Glaser Bros., a family-owned-and-operated candy and tobacco distribution business, was founded in San Francisco. In June 2002, Fleming Companies, Inc. acquired Core-Mark International. At the time of the acquisition, Core-Mark International distributed products to convenience stores and other retailers in the Western United States and Canada from a network of 20 distribution centers. In addition to Fleming’s other national retail and wholesale grocery operations, Fleming owned and operated seven convenience store distribution centers in the Eastern and Midwestern United States. After the acquisition of Core-Mark International by Fleming, Core-Mark International’s management continued to operate Core-Mark International’s distribution business and began integrating Fleming’s convenience store distribution centers into Core-Mark International’s operations. In connection with Fleming’s bankruptcy three of Fleming’s convenience distribution centers were fully integrated into Core-Mark International’s operations.
Core-Mark operates a network of 24 distribution centers in the United States and Canada, including two distribution centers that we operate as a third party logistics provider. One of these third party distribution centers is located in Phoenix, Arizona, which we refer to as the Arizona Distribution Center (ADC), and is dedicated solely to supporting the logistics and management requirements of one of our major customers, Circle K. In April 2005, we began operating a second third party logistics distribution facility located in San Antonio, Texas, which we refer to as the Retail Distribution Center (RDC), and is dedicated solely to supporting Valero.
We distribute a diverse line of national and private label convenience store products to over 19,000 customer locations. The products we distribute include cigarettes, tobacco, candy, snacks, fast food, grocery products, non-alcoholic beverages, general merchandise and health and beauty care products. For the twelve months ended December 31, 2005, approximately 72% of our net sales came from the cigarette category and approximately 28% of our net sales came from the remaining non-cigarette categories. During the same twelve month period, approximately 35% of our gross profit was generated from cigarette categories while approximately 65% of our gross profit was generated from the non-cigarette categories.
We also provide sales and marketing, distribution and logistics services to our customer locations which include a variety of store formats, including traditional convenience retail stores, grocery stores, drug stores, liquor stores, gift shops, specialty stores and other stores that carry convenience products. We distribute approximately 38,000 SKUs of packaged consumable goods to our customers, and also provide an array of information and data services that enable our customers to better manage retail product sales and marketing functions.
Our management team is led by J. Michael Walsh, our President and Chief Executive Officer, who has been with Core-Mark since April 1991. He leads a team of 14 senior managers who have largely overseen the operations of Core-Mark since 1991. Our management has expertise in all of the critical functional areas including logistics, sales and marketing, purchasing, information technology, finance, human resources and retail store support.
Company Background
Our origins date back to 1888, when Glaser Bros., a family-owned-and-operated candy and tobacco distribution business, was founded in San Francisco. In June 2002, Fleming Companies, Inc., or Fleming,
acquired Core-Mark International, Inc., or CMI, our operating subsidiary. On April 1, 2003, Fleming filed for protection under Chapter 11 of the United States Bankruptcy Code. The debtor-in-possession entities comprising Core-Mark were included in the Chapter 11 proceedings. Fleming’s plan of reorganization, or the Plan, which became effective on August 23, 2004, provided for the reorganization of certain of Fleming’s convenience operations and subsidiaries around Core-Mark International. Fleming’s other assets and liabilities were transferred to two special-purpose trusts and are being liquidated.
On August 23, 2004, pursuant to the Plan, we emerged from the Fleming bankruptcy and undertook the following actions:
(1) We issued an aggregate of 9.8 million shares of our common stock to Fleming in exchange for the stock of Core-Mark International, Inc. and its subsidiaries. Further to the Plan, warrants to purchase an aggregate of 990,616 shares of our common stock were issued to Fleming and distributed by Fleming to its Class 6(B) creditors in March 2005. We refer to these warrants as the Class 6(B) warrants. The Class 6(B) warrants have an exercise price of $20.925 per share, a 35% premium to the fair value of a share of our common stock as determined pursuant to the Plan, are immediately exercisable, and expire in 2011. As of December 31, 2005, all of the Class 6(B) warrants allocated to the Class 6(B) creditors under the Plan had been distributed. We also issued warrants to purchase an aggregate of 247,654 shares of our common stock to the holders of our Tranche B Notes. We entered into a registration rights agreement with the holders of the Tranche B Warrants pursuant to which we registered under the Securities Act of 1933 the shares of our common stock issuable upon exercise of the Tranche B Warrants. The Tranche B Warrants have an exercise price of $15.50 per share.
Subsequent to the initial capitalization, we established four stock-based compensation plans. (See—Note 13, Stock-Based Compensation Plans.)
(2) We guaranteed certain obligations of two trusts set up pursuant to the Plan for the benefit of Fleming’s former creditors.
(3) We assumed the remaining workers compensation, general liabilities, auto liabilities and pension liabilities of the Fleming grocery divisions totaling approximately $33 million.
(4) Core-Mark reflected the terms of the Plan in its consolidated financial statements applying the terms of the American Institute of Certified Public Accountants (AICPA) Statement of Position 90-7,Financial Reporting by Entities in Reorganization under the Bankruptcy Code (SOP 90-7) with respect to financial reporting upon emergence from bankruptcy (See Note 8—Reorganization Items, Net to the consolidated financial statements).
Corporate Information
Our corporate headquarters are located at 395 Oyster Point Boulevard, Suite 415, South San Francisco, California 94080. The telephone number of our corporate headquarters is (650) 589-9445. Our website address is http://www.core-mark.com. The information included on our website is not included as a part of, or incorporated by reference into, this Annual Report on Form 10-K.
Industry Overview
Wholesale distributors provide valuable services to both manufacturers of consumer products and convenience retailers. Manufacturers benefit from wholesale distributors’ broad retail coverage, inventory management and efficient processing of small orders. Wholesale distributors provide convenience retailers access to a broad product line, the ability to place small quantity orders, inventory management and access to trade credit. In addition, large full-service wholesale distributors, such as Core-Mark, offer retailers the ability to participate in manufacturer and Company sponsored marketing programs, merchandising and product category
management services, as well as the use of information systems that are focused on minimizing retailers’ investment in inventory, while seeking to maximize their sales.
We operate in an industry where, in 2007, based on the Association for Convenience and Petroleum Retailing [formerly known as the National Association of Convenience Stores (NACS)], 2008 State of the Industry (SOI) Report, total in-store sales at convenience retail locations approximated $169 billion and were generated through an estimated 146,000 stores across the United States. We estimate that 45% to 55% of the products that these stores sell are supplied by wholesale distributors such as Core-Mark. The convenience retail industry gross profit for in-store sales was approximately $45 billion in 2007 and $44 billion in 2006. Over the ten years from 1997 through 2007, convenience in-store sales increased by a compounded annual growth rate of 7.6%. Two of the factors influencing this growth were a 9.1% compounded annual growth rate in average cigarette sales for convenience retail locations and a 3.0% compounded annual growth rate in the number of stores.
We distribute a diverse line of national and private label convenience store products to approximately 24,000 customer locations in all 50 states of the Unites States and 5 Canadian provinces. The products we distribute include cigarettes, tobacco, candy, snacks, fast food, groceries, fresh products, dairy, non-alcoholic beverages, general merchandise, and health and beauty care products. We service traditional convenience stores as well as alternative outlets selling convenience products. Our traditional convenience store customers include many of the major national and super-regional convenience store operators as well as thousands of multi and single-store customers. Our alternative outlet customers comprise a variety of store formats, including drug stores, grocery stores, liquor stores, cigarette and tobacco shops, hotel gift shops, correctional facilities, military exchanges, college bookstores, casinos, video rental stores, hardware stores and airport concessions.
We operate a network of 26 distribution centers in 14 states and Canada, including two distribution centers that we operate as a third-party logistics provider. We distribute approximately 42,000 SKUs (Stock Keeping Units) of packaged consumable goods to our customers, and also provide an array of information and data services that enable our customers to better manage retail product sales and marketing functions.
In 2008, our consolidated net sales increased 8.7% to $6,044.9 million from $5,560.9 million in 2007. Cigarettes comprised approximately 68.2% of total net sales in 2008, while approximately 71.0% of our gross profit was generated from food/non-food products.
Competitive Strengths
We believe we have the following fundamental competitive strengths which are the foundation of our business strategy:
Experience in the Industry. Our origins date back to 1888, when Glaser Bros., a family-owned-and-operated candy and tobacco distribution business, was founded in San Francisco. The executive management team comprised of our CEO and 14 senior managers has largely overseen the operations of Core-Mark for more than a decade, bringing their expertise to critical functional areas including logistics, sales and marketing, purchasing, information technology, finance, human resources and retail store support.
Innovative & Flexible.Wholesale distributors typically provide convenience retailers access to a broad product line, the ability to place small quantity orders, inventory management and access to trade credit. As a large full-service wholesale distributor we offer retailers the ability to participate in manufacturer and Company sponsored sales and marketing programs, merchandising and product category management services, as well as the use of information systems that are focused on minimizing retailers’ investment in inventory, while seeking to maximize their sales.
Distribution Capabilities.The wholesale distribution industry is highly fragmented and historically has consisted of a large number of small, privately-owned businesses and a small number of large, full-service wholesale distributors serving multiple geographic regions. Relative to smaller competitors, large distributors such as Core-Mark benefit from several competitive advantages including: increased purchasing power, the ability to service large national chain accounts, economies of scale in sales and operations, the ability to spread fixed corporate costs over a larger revenue base, and the resources to invest in information technology and other productivity enhancing technology.
Convenience in-storeBusiness Strategy
Our objective is to increase overall return to shareholders by growing market share, revenues, profitability and cash flow. To achieve that objective, we have become one of the largest marketers of fresh and broad-line supply solutions in North America. In order to further enhance our value to the retailer, we plan to:
Drive our Vendor Consolidation Initiative (VCI).We expect our VCI program will allow us to grow by capitalizing on the highly fragmented nature of the distribution channel that services the convenience retail industry. A convenience retailer generally receives their store merchandise includes candy, snacks, fastthrough a large number of unique deliveries. This represents a highly inefficient and costly process for the individual stores. Our VCI program offers convenience retailers the ability to receive one delivery for the bulk of their products, including dairy and other perishable items, thus simplifying the supply chain and eliminating operational costs.
Deliver Fresh Products. We believe there is an increasing trend among consumers to purchase fresh food and dairy products beer, non-alcoholic packaged beverages, frozenfrom convenience stores. We have modified and upgraded our refrigerated capacity, including investing in chill docks, state-of-the-art ordering devices and tri-temperature trailers, which enables us to deliver a significant range of chilled items general merchandise, health and beauty care products, other grocery products, cigarettes, cigarsincluding milk, produce and other tobacco products. Aggregate U.S. wholesale salesfresh foods to retail outlets. We now have the in-house expertise and experience to properly source, handle and market this highly perishable product line. We intend on expanding the delivery of convenience store merchandise include wholesalefresh food and dairy products through the development of unique and comprehensive marketing programs. In addition, we have launched a rebranding program to properly reflect the role this new fresh product salesline will play in the Company’s and the industry’s future.
Expand our Presence Eastward. We believe there is significant opportunity for us to traditional convenience stores and sales to a varietyincrease our market share by expanding our presence east of alternative convenience retailers, which we refer to as alternative outlets. Alternative outlets include drug stores, grocery stores, liquor stores, cigarette and tobacco shops, hotel gift shops, correctional facilities, military exchanges, college bookstores, casinos, video rental stores, hardware stores, airport concessions and movie theatres, and others.
the Mississippi. According to the 2005 National Association offor Convenience Stores (NACS) State of the Industryand Petroleum Retailing 2008 SOI Report, during 2004,2007, aggregate U.S.United States traditional convenience retail in-store sales were approximately $132$169 billion through approximately 138,000 stores. We estimate that146,000 stores with most of those stores
located east of the products that these stores sell, 45%Mississippi. We believe our expansion eastward will be accomplished by acquiring new customers, both national and regional, through a combination of exemplary service, VCI programs, fresh product deliveries, innovative marketing strategies, and competitive pricing. In addition, we intend to 55%explore select acquisitions of other wholesale distributors which complement our business. In June 2006, we acquired the Klein Candy Company, L.P. (“Pennsylvania division”) to further our eastern expansion. In January 2008, we opened a new distribution facility near Toronto, Ontario. This new facility expanded our existing market geography in Canada. In June 2008, we acquired Auburn Merchandise Distributors, Inc., (“AMD” or “New England division”), to further expand our presence and infrastructure in the Northeastern region of the productsUnited States(See Note 3—Acquisitions).
Continue Building Sustainable Competitive Advantage. We believe our ability to increase sales and profitability with existing and new customers is highly dependent upon us being able to deliver consistently high levels of service, innovative marketing programs, and information technology and logistics support. To that fundamental end, we are supplied by wholesale distributorscommitted to further improving our operational efficiencies in our distribution centers while containing our costs in order to enhance profitability. To further enhance our competitive advantage, we have been the first to recognize emerging trends and to offer to the retailer our unique marketing programs such as Core-Mark. The convenience store retail industry gross profit for in-store sales wasVCI and Fresh. We believe this innovation has established us as the market leader in providing valuable marketing and supply chain solutions in the industry.
Customers, Products and Suppliers
We service approximately $39 billion24,000 customer locations in 2004 which represents an increase of 9.5% over 2003. Over the ten years from 1994 through 2004, convenience in-store sales increased by a compounded annual growth rate of 6.9%. Twoall 50 states of the factors influencing this growth were a 9.9% compounded annual growth rate in cigarette salesUnited States and a 3.5% compounded annual growth rate in the number of stores.
The traditional convenience store sector is divided into two principal categories: (1) corporates, defined as corporate-owned and operated chains with a national or multi-region footprint, such as Circle K, Petro-Canada and Valero; and (2) independents and smaller chains, including franchisees, dealers and individually operated locations. Based on the 2005 NACS State5 Canadian provinces. Our customers represent many of the Industry Report, we estimate independentslarge national and smaller chains, those comprising 50 stores or less, represent approximately 76% of traditionalregional convenience store salesretailers in the United States while corporates represented 24%. Conversely, Canadian convenience store sales are dominated by corporates.
Customers and Marketing
We service over 19,000 customer locations in 38 U.S. statesCanada and five Canadian provinces. Our top fifteen customers as of December 31, 2005 included Alimentation Couche-Tard (the parent company of Circle K stores in the U.S. and Mac’s stores in Canada), Arco am/pm franchisees, ConocoPhillips, Esso Convenience, Kroger (convenience), Maverik Country Stores, Petro-Canada, RaceTrac and Valero. We service traditional convenience stores as well as alternative outlets selling convenience store products. Our traditional convenience store customers include many of the major national and super-regional convenience store operators as well as thousands of multi- and single-store customers. Ourleading alternative outlet customers comprise a variety of store formats, including drug stores, grocery stores, liquor stores, cigarette and tobacco shops, hotel gift shops, correctional facilities, military exchanges, college bookstores, casinos, video rental stores, hardware stores and airport concessions. Some of our other alternative outlet customers include Hudson News, London Drugs, MGM Grand Hotel and Shoppers Drug Mart.customers. Our top ten customers accounted for approximately 31%30.1% of our sales in 2005,2008, while our largest customer accounted for less than 6%approximately 7.5% of our total sales in 2005.2008.
Sales, Products and Suppliers
The financial information set forth below reflects the restatement of our financial statements for the first three quarters of fiscal year 2005 and for the period from August 23 through December 31, 2004, as discussed
underManagement’s Discussion and Analysis of Financial Condition and Results of Operations—Restatements of Financial Information and Note 2 of the Notes to the Consolidated Financial Statements.
For the purpose of comparing our results of operations by product category in the table below the results for fiscal year 2004 have been combined for the Successor and Predecessor Companies as discussedunder Management’s Discussion and Analysis of Financial Condition and Results of Operations.
The following table summarizes our cigarette and other product sales over the past five years asBelow is a percentcomparison of our net sales:sales mix by primary product category for the last three years (in millions):
| 2005(1) | 2004(1) (Restated) | 2003(1) | 2002(1) | 2001(1) | ||||||||||||||||
Cigarettes | ||||||||||||||||||||
Net sales (in millions)(4) | $ | 3,505.2 | $ | 3,048.2 | $ | 3,049.8 | $ | 3,368.4 | $ | 2,473.1 | ||||||||||
Gross Profit (in millions) (2)(3) | $ | 93.5 | $ | 87.4 | $ | 106.7 | $ | 129.3 | $ | 82.6 | ||||||||||
% of Total Sales | 72 | % | 72 | % | 71 | % | 72 | % | 72 | % | ||||||||||
% of Gross Profit | 35 | % | 36 | % | 40 | % | 42 | % | 39 | % | ||||||||||
All other products | ||||||||||||||||||||
Net sales (in millions)(5) | $ | 1,385.9 | $ | 1,174.2 | $ | 1,274.5 | $ | 1,293.7 | $ | 951.9 | ||||||||||
Gross Profit (in millions) | $ | 177.5 | $ | 153.3 | $ | 162.7 | $ | 179.0 | $ | 131.3 | ||||||||||
% of Total Sales | 28 | % | 28 | % | 29 | % | 28 | % | 28 | % | ||||||||||
% of Gross Profit | 65 | % | 64 | % | 60 | % | 58 | % | 61 | % | ||||||||||
Total Net Sales (in millions) | $ | 4,891.1 | $ | 4,222.4 | $ | 4,324.3 | $ | 4,662.1 | $ | 3,425.0 | ||||||||||
Gross Profit (in millions) | $ | 271.0 | $ | 240.7 | $ | 269.4 | $ | 308.3 | $ | 213.9 | ||||||||||
| 2008 | 2007 | 2006 | ||||||||||||||||
| Net Sales | % of Net Sales | Net Sales | % of Net Sales | Net Sales | % of Net Sales | |||||||||||||
Cigarettes | $ | 4,124.8 | 68.2 | % | $ | 3,863.1 | 69.5 | % | $ | 3,783.8 | 71.2 | % | ||||||
Food | 710.1 | 11.7 | % | 596.7 | 10.7 | % | 522.4 | 9.8 | % | |||||||||
Candy | 401.3 | 6.7 | % | 349.8 | 6.3 | % | 318.3 | 6.0 | % | |||||||||
Other Tobacco Products | 402.7 | 6.7 | % | 353.4 | 6.4 | % | 322.6 | 6.1 | % | |||||||||
Health, Beauty & General | 220.1 | 3.6 | % | 206.2 | 3.7 | % | 187.7 | 3.5 | % | |||||||||
Non-alcoholic Beverages | 180.9 | 3.0 | % | 186.4 | 3.4 | % | 174.3 | 3.3 | % | |||||||||
Equipment / Other | 5.0 | 0.1 | % | 5.3 | 0.1 | % | 5.3 | 0.1 | % | |||||||||
Total Food/Non-Food Products | 1,920.1 | 31.8 | % | 1,697.8 | 30.5 | % | 1,530.6 | 28.8 | % | |||||||||
Total Net Sales | $ | 6,044.9 | 100.0 | % | $ | 5,560.9 | 100.0 | % | $ | 5,314.4 | 100.0 | % | ||||||
Cigarette Products. We purchase cigarette products from all the major U.S.United States and Canadian manufacturers. With cigarettes accounting for approximately $3,505.2$4,124.8 million or 72%68.2% of our total net sales revenueand 29.0% of our total gross profit in 2005,2008, we control major purchases of cigarettes centrally in order to minimize routineoptimize inventory levels and to maximize cigarette purchasing opportunities. The daily replenishment of inventory and brand selection is controlled by our distribution centers.
Although U.S.United States cigarette consumption has generally declined since 1980,1980. Based on 2007 statistics provided by the Tobacco Merchants Association (TMA) published in early 2008 and compiled from the United States
Department of Agriculture-Economic Research Service, total cigarette consumption in the United States declined from 480 billion cigarettes in 1997 to 362 billion cigarettes in 2007, or a 25% reduction in consumption. Prior to 2007, we have benefitedhad benefitted from a shift in cigarette and tobacco sales to the convenience storeretail segment. According to the 2005 NACS Statemost recent statistic available on the growth of the Industry Report,cigarette sales in the convenience storeretail segment in the NACS 2007 SOI Report (which includes data through December 31, 2006), the convenience retail portion of aggregate U.S.United States cigarette sales increased from approximately 38%54% in 19931999 to 62%64% in 2004. Total
Total cigarette consumption also declined in Canada as illustrated byfrom 45.5 billion cigarettes in 1997 to 14.1 billion cigarettes in 2007, or a 69% reduction in consumption, according to consumption statistics availablepublished in 2008 by Canada’s central statistical agency, Statistics Canada.
Our overall cigarette carton sales declined 1.0% in 2008 and 1.4% in 2007, excluding carton sales made by the new divisions, Toronto and New England. The shift in cigarette carton sales from other channels to the convenience retail segment may no longer be adequate to compensate for the years 1995 through 2005.
The following table illustrates U.S. cigarette consumption since 1950 and Canadian cigarette consumption since 1995.declines.
Year | Total U.S. Consumption(1) (in billions of cigarettes) | Total Canadian Consumption(2) (in billions of cigarettes) | ||
1950 | 375.8 | — | ||
1960 | 484.4 | — | ||
1970 | 536.4 | — | ||
1980 | 631.5 | — | ||
1990 | 525.0 | — | ||
1995 | 487.0 | 45.4 | ||
2000 | 430.0 | 42.8 | ||
2001 | 425.0 | 41.2 | ||
2002 | 415.0 | 36.1 | ||
2003 | 400.0 | 33.7 | ||
2004 | 390.0 | 32.3 | ||
2005 | 378.0 | 30.8 |
We have no long-term cigarette purchase agreements and buy substantially all of our products on an as needed basis. Cigarette manufacturers historically have offered structured incentive programs to wholesalers based on maintaining market share and executing promotional programs. These programs have been significantly decreased by several major manufacturers, including Philip Morris and R.J. Reynolds, and are subject to change by the manufacturermanufacturers without notice.
Excise taxes on cigarettes and other tobacco products are imposed by the various states, localities and provincesprovinces. We collect these taxes from our customers and remit these amounts to the appropriate authorities. Excise taxes are a significant component of our revenue and cost of sales. During 2005,2008, we paidincluded in net sales approximately $1,195.0$1,474.4 million of state and provincial excise taxes in the U.S. and Canada.taxes. As of December 31, 2005,2008, state cigarette excise taxes in the U.S.United States jurisdictions we serve ranged from $0.07 per pack of 20 cigarettes in South Carolina to $2.03$2.75 per pack of 20 cigarettes in Washington.the state of New York. In the Canadian jurisdictions we serve, provincial excise taxes ranged from C$2.302.47 per pack of 20 cigarettes in Ontario to C$4.20 per pack of 20 cigarettes in the Northwest Territories.
In the United States, legislation was introduced in 2008 to fund the State Children’s Health Insurance Program (SCHIP) by raising the federal cigarette excise tax from 39¢ to $1.01 per pack. Federal excise tax is included as a component of our product cost charged by the manufacturer. The legislation, which was signed into law in February 2009, becomes effective on April 1, 2009.
Food and Non-Food ProductsProducts.. The food product category includes candy, snacks, fast food, grocerysnacks, groceries, fresh products, dairy and non-alcoholic beverages. The non-food product category includes general merchandise, health and beauty care products and tobacco products other than cigarettes.bread. Food and non-foodNon-food product categories were $1,385.9$1,920.1 million of net sales for the year ended December 31, 2005in 2008 and account for approximately 28%31.8% of our sales, buthowever, these categories represented approximately 65%71.0% of our gross profit. We structure our marketing and merchandising programs around these higher margin products.
Our Suppliers. We purchase products for resale from approximately 3,800 trade suppliers and manufacturers located across the United States and Canada. In 2005,2008, we purchased approximately 51%61% of our products from our top 20 suppliers, with our top two suppliers, Philip Morris and R.J. Reynolds, representing approximately 26%27% and 15%14% of our purchases, respectively. We coordinate our purchasing from suppliers by negotiating, on a corporate-wide basis, special arrangements to obtain volume discounts and additional allowances and rebates,incentives, while also taking advantage of promotional and advertising allowancesincentives offered to us as a wholesale distributor. In
addition, buyers in each of our distribution facilities purchase products, particularly food, directly from the manufacturers, improving product mix and availability for individual markets and reducing our inventory investment.
We have historically operated without purchase contracts with our major vendors, instead relying on relationships based on industry trade practices. Immediately following the Fleming bankruptcy, the trade credit terms that we had been enjoying were substantially reduced or eliminated by our vendors. We have restored credit terms with nearly all of our vendors, but some of these credit terms are less favorable than those provided to us prior to Fleming’s bankruptcy due primarily to changes in industry credit terms.
Operations
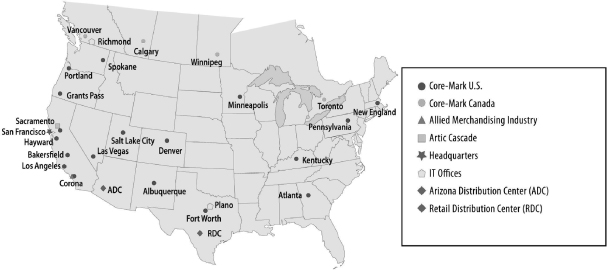
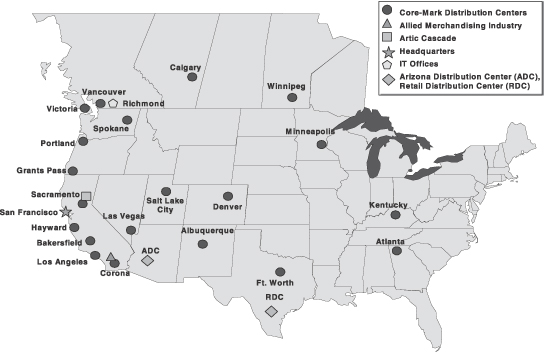
We operate a total of 2426 distribution centers. We have operationscenters consisting of 22 in the Western United States consistingand four in Canada as of 15December 31, 2008. The map below describes the scope of our operations and distribution centers located in California, Colorado, Nevada, New Mexico, Oregon, Texas, Utah and Washington; the Southeastern and Midwestern United States consistingcenters.
Map of three distribution centers located in Georgia, Kentucky and Minnesota; and Canada consisting of four distribution centers located in Alberta, British Columbia and Manitoba. Operations
Two of our 24 distribution centers,the facilities we operate in the United States, Artic Cascade and Allied Merchandising Industry, are consolidating warehouses which buy products from our suppliers in bulk quantities and then distribute the products to many of our other Western distribution centers. By using Artic Cascade, located in Sacramento, California, to obtain products at lower cost from frozen product vendors, we are able to offer a broader selection of quality products to retailers at more competitive prices. Allied Merchandising Industry located in Corona, California purchases the majority of our non-food products, other than cigarettes and tobacco products, for our Western distribution centers, enabling us to reduce our overall general merchandise and health and beauty care product inventory. Two of theWe operate two additional facilities that we operate are in our role as a third party logistics provider. One distribution facility located in Phoenix, Arizona, referred to as the Arizona Distribution Center (ADC), is dedicated solely to supporting the logistics and management requirements of one of our major customers, Circle K. In April 2005, we began operating aAlimentation Couche-Tard. The second third party logistics distribution facility located in San Antonio, Texas, referred to as the Valero Retail Distribution FacilityCenter (RDC), which is dedicated solely to supporting another major customer, Valero.
Map of Operations
We purchase a variety of brand name and private label products, totaling approximately 38,00042,000 SKUs, including approximately 2,6004,900 SKUs of cigarette and other tobacco products, from our suppliers and manufacturers. We offer customers a variety of food and non-food products, including candy, snacks, fast food, groceries, fresh products, dairy, non-alcoholic beverages, general merchandise and health and beauty care products.
A typical convenience store order is comprised of a mix of dry, frozen and chilled products. Receivers,Our receivers, stockers, order selectors, stampers, forklift drivers and loaders received, stored and picked nearly 390435 million, 407 million and 300405 million items (a carton of 10 packs of cigarettes is one item) or 5466 million, 64 million and 4359 million cubic feet of product, during the years ended December 31, 20052008, 2007 and December 31, 2004,2006, respectively, while limiting the order-itemservice error rate to about twoapproximately three errors per thousand items shipped.shipped(Note—these performance metrics do not include those of the Pennsylvania division prior to Core-Mark integrating them into our distribution system on October 1, 2006, and those of our New England division—See Note 3—Acquisitions).
Our proprietary Distribution Center Management System, or DCMS, platform provides our distribution centers with the flexibility to adapt to our customers’ information technology requirements in an industry that does not have a standard information technology platform. Actively integrating our customers into our platform is a priority which enables fast, efficient and reliable service.
Distribution
At December 31, 2005,2008, we had approximately 650908 transportation department personnel, including delivery drivers, shuttle drivers, routers, training supervisors and managers who focus on achieving safe, on-time deliveries. Our daily orders are picked and loaded nightly in reverse order of scheduled delivery. At December 31, 2005,2008, our trucking systemfleet consisted of approximately 380671 tractors, trucks and vans, of which nearly all were leased. Our trailers are typically owned byWe have made a significant investment over the past few years in upgrading our trailer fleet to tri-temperature (“tri-temp”) which gives us and many have refrigerated compartments that allow usthe capability to deliver frozen, chilled, and chillednon-refrigerated goods in one delivery. As of December 31, 2008, over 40% of our fleet consisted of tri-temp trailers with the remainder capable of delivering refrigerated and non-refrigerated foods. This provides us the multiple temperature zone capability needed to support our focus on delivering fresh products alongside non-refrigerated goods. Grossto our customers. Our fuel consumption costs for the year ended December 31, 20052008 totaled approximately $9.9$9.4 million, net of fuel surcharges passed on to customers, which represented an increase of approximately $3.2$2.4 million, from 2004, or 48%,$7.0 million in 2007 due to increased fuel prices, miles driven and increased sales volume. A significant portionthe additions of the fuel costs are offset by fuel surcharges of $4.6 million which are included in our customer pricing. In 2004, gross fuel costs were $6.7 million which were offset by fuel surcharges of $3.2 million.two new divisions.
Competition
We estimate that, as of December 31, 2005,2008, there were over 400approximately 350 wholesale distributors to traditional convenience store retailers in the United States, approximately 30 of which are broad-line distributors similar to Core-Mark.States. We believe that Core-Mark and McLane Company, Inc., a subsidiary of Berkshire Hathaway, Inc., are second largest and the two largest convenience wholesale companies,distributors, measured by annual sales, in North America. There are also companies that provide products to specific regions of the country, such as The H.T. Hackney Company in the Southeast, Eby-Brown Company in the Midwest, Mid-Atlantic and Southeast and GSC Enterprises, Inc. in Texas and surrounding states, and several hundred local distributors serving small regional chains and independent convenience stores.retailers. In Canada, there are fewer wholesale suppliers asdistributors compared to the United States. In addition, we also compete withcertain manufacturers who deliver their products directly to convenience stores, such as Coca-Cola bottlers, Frito Lay, and Interstate Bakeries.Bakeries deliver their products directly to convenience retailers.
Competition within the industry is based primarily based on service, price and variety of products offered, schedules and reliability of deliveries, and the range and quality of the services provided.provided, price, variety of products offered and the reliability of deliveries. We operate from a perspective that focuses heavily on providing competitive pricing as well as outstanding customer service as evidenced bythrough our decentralized distribution centers, order fulfillment rates, on time deliveries, innovative marketing solutions, and merchandising support.support as well as competitive pricing. At least one of our major competitors currently operates on a logistics model that concentrates on competitive pricing, using large distribution centers and providing competitive order fulfillment rates. This logistics model, however, couldmay result in uncertainless certain delivery times and leavescould leave the customer to perform all of the merchandising functions. Many of our small competitors focus on customer service from small distribution facilities and concentrate on long-standing customer relationships. We believe that our unique combination of priceservice, marketing solutions and serviceprice is a compelling combination that is highly attractive to customers and results in our increasing growth.may enhance their growth and profitability.
SinceWe purchase cigarettes primarily from manufacturers covered by the tobacco industry’s master settlement agreementMaster Settlement Agreement (MSA), which was signed in November 1998,1998. Since then, we have experienced increased wholesale competition for cigarette sales. Competition amongst cigarette wholesalers is based primarily on the basis of service, price and variety. Competition amongvariety, whereas competition amongst manufacturers for cigarette sales is based primarily based on brand positioning, price, product attributes, consumer loyalty, promotions, advertising and
retail presence. Cigarette brands produced by the major tobacco product manufacturers generally require competitive pricing, substantial marketing support, retail programs and other financial incentives to maintain or improve a brand’s market position. Increased selling prices and higher cigarette taxes have resulted in the growth of deep-discount brands. Deep-discount brands are brands manufactured by companies that are not original participants to the MSA, and accordingly, do not have cost structures burdened with MSA-related payments to the same extent as the original participating manufacturers. Historically, major tobacco product manufacturers have had a competitive advantage in the United States because significant cigarette marketing restrictions and the scale of investment required to compete made gaining consumer awareness and trial of new brands difficult. However, since the MSA was signed in November 1998, the category of deep-discount brands manufactured by smaller manufacturers or supplied by importers has grown substantially.
As a result of purchasing cigarettes for sale in MSA states exclusively from manufacturers that are parties to the MSA, we are adversely impacted by increases in deep-discount brand growth. We believe that non-MSA manufacturers that sell deep-discount brands have steadily increased their combined market share of cigarette sales. The premium and discount cigarettes subject to the MSA that we sell have been negatively impacted by widening price gaps in the prices between those brands and the deep-discount brands for the past several years. As a result, our operations may be negatively impacted as sales of premium cigarettes and other tobacco products that we sell decline. Non-MSA cigarettes sold in MSA states also may be subject to additional legal liabilities.
We also face competition duefrom the sale of cigarettes by third parties over the internet and by other means designed to avoid collection of applicable taxes, including the sale of cigarettes in non-taxable jurisdictions, imports of foreign low priced brands, and the diversion into the United States market of cigarettes intended for sale outside the United States, the sale of counterfeit cigarettes by third parties, the sale of cigarettes in non-taxable jurisdictions, inter-state and international smuggling of cigarettes, the sale of cigarettes by third parties over the Internet and by other means designed to avoid collection of applicable taxes and increased imports of foreign low priced brands.States. The competitive environment has been characterizedimpacted by a continued influx of cheapalternative smoking products, such as snus and snuff, and higher prices due to higher state excise taxes and list price increases for cigarettes manufacturesmanufactured by parties to the MSA. As a result, the lowest priced products of manufacturers of numerous small share brands manufactured by companies that are not parties to the MSA have increasedheld their market share, putting pressure on the profitability of the premium cigarettes that we sell.cigarettes.
Working Capital Practices
We sell products on credit terms to our customers that averaged, as measured by days sales outstanding, about 9 days for 2008 and 10 days for the year ended December 31, 2005 and about 11 days for the year ended December 31, 2004.2007. Credit terms may impact pricing and are competitive within our industry. An increasing number of our customers remit payment electronically.electronically which facilitates efficient and timely monitoring of payment risk. Canadian days sales outstanding in receivables tend to be lower as Canadian industry practice is for shorter credit terms than those in the United States.
We maintain our inventory of products based on the level of sales of the particular product and manufacturer replenishment cycles. The number of days a particular item of inventory remains in our distribution centers varies by product and is principally driven by the turnover of that product and economic order quantities. We typically order and carry in inventory additional amounts of certain critical products to assure high order fulfillment levels.levels for these items. The number of days of cost of sales in inventory averaged about 1315 days during 20042008 and 2005.2007.
We obtain terms from our vendors withinbased on industry termspractices and consistent with our credit standing. Vendor terms vary depending on individual vendor policies and also may vary between product categories. We take advantage of the full complement of vendor offerings, including early payment terms. During 2005,Our days purchasespayable outstanding during 2008 averaged approximately 912 days, including cigarette and tobacco taxes payable, as compared to 11 days for 2007, with a range of twothree days prepaid to 30 days credit and was significantly affected by the cigarette industry where the leading vendors provide incentives for prepayment. This average includes the impact of tobacco taxes payable.credit.
The days outstanding averages presented in this Working Capital Practices section are calculated using month-end averages.
Employees
As of December 31, 2005,2008, we had approximately 3,430 employees. Four4,181 employees, including 578 in administration, finance and purchasing, 1,026 in sales and marketing, and 2,577 in warehousing and distribution functions. Of these employees, 457 employees are located in Canada and the remainder in the United States. Three of our distribution centers, Hayward, Las Vegas Victoria and Calgary, employ people who are covered by collective bargaining agreements with local affiliates of The International Brotherhood of Teamsters (Hayward and Las Vegas), and United Food and Commercial Workers (Calgary) and United Steelworkers of America (Victoria). Approximately 220199 employees, or approximately 6%,4.8% of our workforce, are unionized. There have been no disruptions in customer service, strikes, work stoppages or slowdowns as a result of union activities, and we believe we have satisfactory relations with our employees.
FacilitiesTOTAL EMPLOYEES BY BUSINESS FUNCTIONS
Our headquarters are located in South San Francisco, California, and we operate distribution centers throughout the United States and Canada. We have operations in the Western United States consisting of 15 distribution centers located in California, Colorado, Nevada, New Mexico, Oregon, Texas, Utah and Washington; the Eastern and Midwestern United States consisting of three distribution centers located in Georgia, Kentucky and Minnesota; and Canada consisting of four distribution centers located in Alberta, British Columbia and Manitoba. Two of our 24 distribution centers, Artic Cascade and Allied Merchandising Industry, are consolidating warehouses which buy products from our suppliers in bulk quantities and then distribute the products to our other Western distribution centers. By using Artic Cascade, located in Sacramento, California, to obtain products at lower cost from frozen product vendors, we are able to offer a broader selection of quality products to retailers at more competitive prices. Allied Merchandising Industry, located in Corona, California, purchases the majority of our non-food products, other than cigarettes, for our Western distribution centers enabling us to reduce our overall general merchandise and health and beauty care product inventory. Each facility is equipped for receiving, stocking, order selection and loading customer orders on trucks for delivery. Each facility provides warehouse, distribution, sales and support functions for its geographic area under the supervision of a division president and operates under a common set of performance metrics.
| December 31, 2008 | ||||||
| United States | Canada | Total Core-Mark Employees | ||||
Administration, Finance, and Purchasing | 478 | 100 | 578 | |||
Sales and Marketing | 974 | 52 | 1,026 | |||
Warehousing and Distribution | 2,272 | 305 | 2,577 | |||
Total Categories | 3,724 | 457 | 4,181 | |||
Of the 24 distribution centers we operate, two are operated as third party logistics providers. One distribution facility located in Phoenix, Arizona, referred to as the Arizona Distribution Center, or the ADC, is dedicated solely to supporting the logistics and management requirements of one of our major customers, Circle K. In April 2005, we began operating a second third party logistics distribution facility, located in San Antonio, Texas, referred to as the Valero Retail Distribution Center (RDC), which is dedicated solely to supporting Valero.
Regulation
As a distributor of food products, we are subject to the Federal Food, Drug and Cosmetic Act and regulations promulgated by the U.S.United States Food and Drug Administration (FDA). The FDA regulates the holding requirements for foods through its current good manufacturing practice regulations, specifies the standards of identity for certain foods and prescribes the format and content of certain information required to appear on food product labels. A limited number of the over-the-counter medications that we distribute are subject to the regulations of the U.S.United States Drug Enforcement Administration. In Canada, similar standards related to food and over-the-counter medications are governed by Health Canada. The products we distribute are also subject to federal, state, provincial and local regulation through such measures as the licensing of our facilities, enforcement by state, provincial and local health agencies of state and localrelevant standards for the products we distribute and regulation of the our trade practices in connection with the sale of our products. Our facilities are inspected periodically by federal, state, provincial and local authorities including the Occupational Safety and Health Administration under the U.S.United States Department of Labor which require us to comply with certain health and safety standards to protect our employees.
We are also subject to regulation by numerous other federal, state, provincial and local regulatory agencies, including but not limited to the U.S.United States Department of Labor, which sets employment practice standards for workers, and the U.S. DepartmentUnited States and Canadian Departments of Transportation, which regulatesregulate transportation of perishable goods, and similar state, provincial and
local agencies. Compliance with these laws has not had and is not anticipated to have a material effect on our results of operations.
We voluntarily participate in random quality inspections of all of our distribution centers, conducted by the American Institute of Baking (AIB). The AIB publishes standards as a tool to permit operators of distribution centers to evaluate the food safety risks within their operations and determine the levels of compliance with the standards. AIB conducts an inspection which is composed of food safety and quality criteria. AIB conducts its inspections based on five categories: adequacy of the company’s food safety program, pest control, operational methods and personnel practices, maintenance of food safety and cleaning practices. Within these five categories, the AIB evaluates over 100 criteria items. AIB’s independent evaluation is summarized and posted on its website for our customer’scustomers’ review. In 2005,2008, nearly 90%87% of our distribution centers received the highest rating from the AIB and the remaining distribution centers received the second highest rating.
Registered Trademarks
We have registered trademarks including the following: Arcadia Bay®, Arcadia Bay Coffee Company®, Boonaritos™, Boondoggles®, Cable Car®, Core-Mark®, Core-Mark International®, EMERALD®, Feastona®, Java Street®, QUICKEATS®, Richland ValleyTM, SmartStock®, Starmark®and SmartStockTastefully Yours®.
Segment and Geographic Information
We operate in two reportable geographic segments—the United States and Canada.SeeNote 16—Segment and Geographic Information to our consolidated financial statements.
Corporate and Available Information
You may readThe office of our corporate headquarters is located at 395 Oyster Point Boulevard, Suite 415, South San Francisco, California 94080 and copy any materialsthe telephone number is (650) 589-9445.
Our internet website address iswww.core-mark.com. We provide free access to various reports that we file with or furnish to the United States Securities and Exchange Commission through our website, as soon as reasonably practicable after they have been filed or furnished. These reports include, but are not limited to, our annual reports on Form 10-K, quarterly reports on Form 10-Q, and any amendments to those reports. Our SEC at
reports can be accessed through the SEC’s Public Reference room at 100 F Street, NE, Washington, DC 20549. The public“Investor Relations” section of our website, or throughwww.sec.gov. Also available on our website are printable versions of Core-Mark’s Audit Committee Charter, Compensation Committee Charter, Nominating and Corporate Governance Committee Charter, and Code of Business Conduct and Ethics. Copies of these documents may obtain informationbe requested from:
Core-Mark International
395 Oyster Point Blvd, Suite 415
South San Francisco, CA 94080
Attention: Investor Relations
Corporate Governance—Code of Business Conduct and Ethics and Whistle Blower Policy:
Our Code of Business Conduct and Ethics is designed to promote honest, ethical and lawful conduct by all employees, officers and directors and is posted on the operation“Investor Relations” section of our website at www.core-mark.com under “Corporate Governance.”
Additionally, the Audit Committee (“Audit Committee”) of the Public Reference Room by callingBoard of Directors of Core-Mark has established procedures to receive, retain, investigate and act on complaints and concerns of employees, shareholders and others regarding accounting, internal accounting controls and auditing matters, including complaints regarding attempted or actual circumvention of internal accounting controls or complaints regarding violations of the SECCompany’s accounting policies. The procedures are also described in our website address at 1-800-SEC-0330. The Company is an electronic filer andwww.core-mark.com under Corporate Governance in the SEC maintains an Internet site that contains reports, proxy and formation statements, and other information regarding issuers that file electronically with the SEC at http://www.sec.gov.“Investor Relations” section.
| ITEM 1.A. | RISK FACTORS |
You should carefully consider the following risks together with all of the other information contained in this Annual Report on Form 10-K. The risks and uncertainties described below are not the only ones we face. Additional risks and uncertainties not currently known to us or those we currently view as immaterial may also materially adversely affect our business, financial condition or results of operations.
This Annual Report on Form 10-K contains forward-looking statements that involve risks and uncertainties. Our actual results may differ significantly from the results discussed in the forward-looking statements. Factors that might cause such differences include, but are not limited to, the risk factors set forth below (See—Special Note Regarding Forward Looking Statements)Statements prior to Item 1. Business).
FACTORS THAT MAY AFFECT FUTURE OPERATING RESULTS
Risks RelatingRelated to the Economy and Market Conditions
Current difficult economic conditions and market turmoil may reduce demand for our products and increase credit risks.
Current market turmoil and difficult economic conditions, including actual and potential job losses among many sectors of the economy, significant declines in real estate values, large losses to consumer retirement and investment accounts, increases in food and fuel prices and uncertainty regarding federal tax and economic policies have resulted in reduced consumer confidence and curtailed consumer spending. If these economic conditions persist or deteriorate further, we expect that convenience retail operators will experience continued weakness and further reductions in same store sales, which will adversely affect demand for our products and will result in reduced sales and pressures on margins. This may have a material adverse effect on our business and operating results. These economic and market conditions, combined with continuing difficulties in the credit markets and the resulting pressures on liquidity may also place a number of our convenience retail customers under financial stress, which would increase our credit risk and potential bad debt exposure.
Our business is sensitive to general economic conditions and, in particular, to gasoline prices and the labor market.
Our operating results are also sensitive to, and may be adversely affected by, other factors, including inflation, competitive price pressures, severe weather conditions and unexpected increases in fuel or other transportation-related costs. Due to the low margins on the products we distribute, changes in general economic conditions could materially adversely affect our operating results.
Two particular economic factors may have a significant impact on our sales, margins and costs. First, our retailers have reported to us that when gasoline prices increased they have experienced a decrease in the proportion of their customers’ expenditures on food/non-food products compared to customers’ expenditures on cigarettes. When gasoline prices undergo sustained increases and a similar shift in expenditures results, we experience pressure on our sales and gross margins since sales of food/non-food products result in higher margins than sales of cigarettes do. Second, our results are sensitive to the labor market. For example, the strength of the employment market in the transportation sector has led to a shortage of qualified drivers in some areas, increasing our costs as we are required to use more temporary drivers and increase wages for permanent drivers in the affected areas. Shortages of qualified warehouse and other employees could similarly increase our costs.
Historically, we have been able to pass on a substantial portion of increases in our own fuel costs to our customers in the form of fuel surcharges, but our ability to continue to pass through price increases, either from manufacturers or costs incurred in the business, including labor and fuel costs, is not assured.
As a result of recent recessionary economic conditions and financial market turmoil, our pension plan is currently underfunded and we will be required to make cash payments to the plan, reducing the cash available for our business.
We sponsored a qualified defined-benefit pension plan and a post-retirement benefit plan for employees hired before September 1986. We record a liability associated with these plans equal to the excess of the benefit obligation over the fair value of plan assets. The benefit liability recorded under the provisions of Statement of Financial Accounting Standards No. 158 “Employers’ Accounting for Defined Benefit Pension and Other Postretirement Plans,” at December 31, 2008 was $34.9 million for the pension plan. Our pension plan’s underfunded status increased from approximately $4.0 million in 2007 to approximately $12.8 million in 2008. The primary reason for this increase in the underfunding status of the plan from 2007 to 2008 is due to a lower return than expected on invested plan assets as of December 31, 2008 compared to December 31, 2007 as a result of the recent economic downturn and financial market turmoil. The amount of the estimated contributions is expected to increase in 2010 due, in part, to the underperformance of the plan assets relative to our expectations given the overall market downturn during 2008. If the performance of the assets in the plan does not meet our expectations, or if other actuarial assumptions are modified, our future cash payments to the plan could be substantially higher than we expect. The pension plan is subject to the Employee Retirement Income Security Act of 1974, or ERISA. Under ERISA, the Pension Benefit Guaranty Corporation, or PBGC, has the authority to terminate an underfunded pension plan under limited circumstances. In the event our pension plan is terminated for any reason while it is underfunded, we will incur a liability to the PBGC that may be equal to the entire amount of the underfunding in the pension plan.
Risks Related to Our Business and Industry
We are dependent on the convenience retail industry for our revenues, and our results of operations would suffer if there is an overall decline in the convenience retail industry.
The majority of our sales are made under purchase orders and short-term contracts with convenience retail which inherently involve significant risks. These risks include the uncertainty of general economic conditions in the convenience retail industry, credit exposure from our customers, termination of customer relationships without notice, consolidation of our customer base and consumer movement toward purchasing from club stores. Any of these factors could negatively affect the convenience retail industry which would negatively affect our results of operations.
We face competition in our distribution markets and if we are unable to compete effectively in any distribution market, we may lose market share and suffer a decline in sales.
Our distribution centers operate in highly competitive markets. We face competition from local, regional and national tobacco and consumable products distributors on the basis of service, price and variety of products offered, schedules and reliability of deliveries, and the range and quality of services provided. Some of our competitors, including a subsidiary of Berkshire Hathaway Inc., McLane Company, Inc., the largest convenience wholesale distributor in the United States, have substantial financial resources and long standing customer relationships. In addition, heightened competition among our existing competitors or by new entrants into the distribution market could create additional competitive pressures that may reduce our margins and adversely affect our business. If we fail to successfully respond to these competitive pressures or to implement our strategies effectively, we may lose market share and our results of operations could suffer.
If we are not able to retain existing customers and attract new customers, our results of operations could suffer.
Increasing the growth and profitability of our distribution business is particularly dependent upon our ability to retain existing customers and attract additional distribution customers. The ability to attract additional customers through our existing network of distribution centers is especially important because it enables us to
leverage our distribution centers and other fixed assets. Our ability to retain existing customers and attract new customers is dependent upon our ability to provide industry-leading customer service, offer competitive products at low prices, maintain high levels of productivity and efficiency in distributing products to our customers while integrating new customers into our distribution system, and offer marketing, merchandising and ancillary services that provide value to our customers. If we are unable to execute these tasks effectively, we may not be able to attract a significant number of new customers and our existing customer base could decrease, either or both of which could have an adverse impact on our results of operations.
If the costs to us of the products we distribute increase and we cannot pass the increase on to our customers, our results of operations could be adversely affected.
Our industry is characterized by a high volume of sales with relatively low profit margins. We experience increases in our cost of goods sold when manufacturers increase prices or reduce or eliminate discounts and incentive programs. If we cannot pass along such cost increases to our customers due to resistance to higher prices, our relatively narrow profit margins and earnings could be negatively affected.
We rely on funding from manufacturer discount and incentive programs and cigarette excise stamping allowances, any material changes in these programs could adversely affect our results of operations.
We receive payments from the manufacturers of the products we distribute for allowances, discounts, volume rebates, and other merchandising and incentive programs. These payments are a substantial benefit to us. The amount and timing of these payments are affected by changes in the programs by the manufacturers, our ability to sell specified volumes of a particular product, attaining specified levels of purchases by our customers, and the duration of carrying a specified product. In addition, we receive discounts from states in connection with the purchase of excise stamps for cigarettes. If the manufacturers or states change or discontinue these programs or change the timing of payments, or if we are unable to maintain the volume of our sales, our results of operations could be negatively affected.
We depend on relatively few suppliers for a large portion of our products, and any interruptions in the supply of the products that we distribute could adversely affect our results of operations.
We obtain the products we distribute from third party suppliers. At December 31, 2008, we had approximately 3,800 vendors, and during 2008 we purchased approximately 61% of our products from our top 20 suppliers, with our top two suppliers, Philip Morris and R. J. Reynolds, representing approximately 27% and 14% of our purchases, respectively. We do not have any long-term contracts with our suppliers committing them to provide products to us. Although our purchasing volume can provide leverage when dealing with suppliers, suppliers may not provide the products we distribute in the quantities we request or on favorable terms. Since we do not control the actual production of the products we distribute, we are also subject to delays caused by interruption in production based on conditions outside our control. These conditions include job actions or strikes by employees of suppliers, inclement weather, transportation interruptions, and natural disasters or other catastrophic events. Our inability to obtain adequate supplies of the products we distribute as a result of any of the foregoing factors or otherwise, could cause us to fail to meet our obligations to our customers and reduce the volume of our sales.
We may lose business if cigarette or other manufacturers decide to engage in direct distribution of their products.
In the past certain large manufacturers have elected to engage in direct distribution of their products and eliminate distributors such as Core-Mark. If other manufacturers make similar decisions in the future our revenues and profits would be adversely affected, and there can be no assurance that we will be able to take action to compensate for such losses.
Cigarette and consumable goods distribution is a low-margin business sensitive to economic conditions.
We derive most of our revenues from the distribution of cigarettes, other tobacco products, candy, snacks, fast food, grocerygroceries, fresh products, dairy, non-alcoholic beverages, general merchandise and health and beauty care products.
Our industry is characterized by a high volume of sales with relatively low profit margins. Our non-cigarettefood/non-food sales are at prices that are based on the cost of the product plus a percentage markup. As a result, our profit levels may be negatively impacted during periods of cost deflation for these products, even though our gross profit as a percentage of the price of goods sold may remain relatively constant. PeriodsAlternatively, periods of product cost inflation may also have a negative impact on our profit margins and earnings with respect to sales of cigarettes. Gross profit on cigarette sales are generally fixed on a cents per carton basis. Therefore, as cigarette prices increase, gross profit generally decreases as a percent of sales. In addition, if the cost of the cigarettes that we purchase increase due to manufacturer price increases or increases in applicable excise tax rates, our inventory costs and accounts receivable could rise. To the extent that product cost increases are not passed on to our customers due to their resistance to higher prices, our profit margins and earnings could be negatively impacted.
The consumable goodsSome of our distribution industry is sensitivecenters are dependent on a few relatively large customers, and our failure to nationalmaintain our relationships with these customers could substantially harm our business and regional economic conditions. Inflation, fuel costsprospects.
Some of our distribution centers are dependent on relationships with a single customer or a few customers, and other factors affecting consumer confidence generally may negatively impactwe expect our sales. Ourreliance on these relationships to continue for the foreseeable future. Any termination or non-renewal of customer relationships could severely and adversely affect the revenues generated by certain of our distribution centers. Any future termination, non-renewal or reduction in services that we provide to these select customers would cause our revenues to decline and our operating results are also sensitive to, andwould be harmed.
We may be adversely affected by, other factors, including difficulties with the collectability of accounts receivable, competitive price pressures, severe weather conditions and unexpected increases in fuel or other transportation-related costs. Duesubject to the low- margins on the products we distribute, changes in general economic conditionsproduct liability claims which could materially adversely affect our business, and our operations could be subject to disruptions as a result of manufacturer recalls of products.
Core-Mark, as with other distributors of food and consumer products, faces the risk of exposure to product liability claims in the event that the use of products sold by us causes injury or illness. With respect to product liability claims, we believe that we have sufficient liability insurance coverage and indemnities from manufacturers. However, product liability insurance may not continue to be available at a reasonable cost, or, if available, may not be adequate to cover all of our liabilities. We generally seek contractual indemnification and insurance coverage from parties supplying the products we distribute, but this indemnification or insurance coverage is limited, as a practical matter, to the creditworthiness of the indemnifying party and the insured limits of any insurance provided by suppliers. If we do not have adequate insurance, if contractual indemnification is not available or if a party cannot fulfill its indemnification obligation, product liability relating to defective products could materially adversely impact our results of operations.
In addition, we may be required to manage a recall of products on behalf of a manufacturer. Managing a recall could disrupt our operations as we might be required to devote substantial resources toward implementing the recall, which could materially adversely affect our ability to provide quality service to our customers.
Our ability to operate effectively could be impaired by the risks and costs associated with the efforts to grow our business through acquisitions.
Efforts to grow our distribution business may include acquisitions. Acquisitions entail various risks such as identifying suitable candidates, effecting acquisitions at acceptable rates of return, obtaining adequate financing and acceptable terms and conditions. Our success depends in a large part on factors such as our ability to successfully integrate such operations and personnel in a timely and efficient manner and retain the customer base of the acquired operations. If we cannot successfully integrate these operations and retain the customer base, we may experience material adverse consequences to our results of operations and financial condition. The
integration of separately managed businesses operating results.in different markets involves a number of risks, including the following:
demands on management related to the increase in our size after the acquisition of operations;
difficulties in the assimilation of different corporate cultures and business practices, such as those involving vendor promotions, and of geographically dispersed personnel and operations;
difficulties in the integration of departments, information technology systems, operating methods, technologies, books and records and procedures, as well as in maintaining uniform standards and controls, including internal accounting controls, procedures and policies; and
expenses of any undisclosed liabilities, such as those involving environmental or legal matters.
Successful integration of new operations will depend on our ability to manage those operations, fully assimilate the operations into our distribution network, realize opportunities for revenue growth presented by strengthened product offerings and expanded geographic market coverage, maintain the customer base and eliminate redundant and excess costs. We may not realize the anticipated benefits or savings from an acquisition to the extent or in the time frame anticipated, if at all, or such benefits and savings may include higher costs than anticipated.
We may not be able to achieve the expected benefits from the implementation of new marketing initiatives.
We are taking action to improve our competitive performance through a series of strategic marketing initiatives. The goal of this effort is to develop and implement a comprehensive and competitive business strategy, addressing the special needs of the distribution industry environment, increase our market position within the industry, and ultimately create increased shareholder value.
We may not be able to successfully execute our new marketing initiatives and realize the intended synergies, business opportunities and growth prospects. Many of the risk factors previously mentioned, such as increased competition, may limit our ability to capitalize on business opportunities and expand our business. Our efforts to capitalize on business opportunities may not bring the intended result. Assumptions underlying estimates of expected revenue growth or overall cost savings may not be met or economic conditions may deteriorate. Customer acceptance of new distribution formats developed may not be as anticipated, hampering our ability to attract new customers or maintain our existing customer base. Additionally, our management may have its attention diverted from other important activities while trying to execute new marketing initiatives. If these or other factors limit our ability to execute our strategic initiatives, our expectations of future results of operations, including expected revenue growth and cost savings, may not be met.
Our information technology systems may be subject to failure or disruptions, which could seriously harm our business.
Our business is highly dependent on our Distribution Center Management System, or DCMS. The convenience retail industry does not have a standard information technology or IT platform. Therefore, actively integrating our customers into our IT platform is a priority, and our DCMS platform provides our distribution centers with the flexibility to adapt to our customers’ IT requirements. We also rely on DCMS and our internal information technology staff to maintain the information required to operate our distribution centers and to provide our customers with fast, efficient and reliable deliveries. While we have taken steps to increase redundancy in our IT systems, if our DCMS fails or is subject to disruptions, we may suffer disruptions in service to our customers and our results of operations could suffer.
We depend on our senior management and key personnel.
We substantially depend on the continued services and performance of our senior management and other key personnel. Certain personnel such as our information technology, tax and procurement staff, among others, have significant proprietary or industry knowledge and skills specific to our business. We do not maintain key person life insurance policies on these individuals, and we do not have employment agreements with any of our executive officers. The loss of the services of any of our executive officers or key employees could harm our business.
We operate in a competitive labor market and a portion of our employees are covered by collective bargaining agreements.
Our continued success will depend partly on our ability to attract and retain qualified personnel. We compete with other businesses in each of our markets with respect to attracting and retaining qualified employees. A shortage of qualified employees could require us to enhance our wage and benefits packages in order to compete effectively in the hiring and retention of qualified employees or to hire more expensive temporary employees. In addition, at December 31, 2008, 199, or 4.8%, of our employees were covered by collective bargaining agreements with labor organizations, which expire at various times over the course of the next year.
We cannot assure you that we will be able to renew our respective collective bargaining agreements on favorable terms, that employees at other facilities will not unionize, that our labor costs will not increase, that we will be able to recover any increases in labor costs through increased prices charged to customers or that we will not suffer business interruptions as a result of strikes or other work stoppages. If we fail to attract and retain qualified employees, to control our labor costs, or to recover any increased labor costs through increased prices charged to our customers or offsets by productivity gains, our results of operations could be materially adversely affected.
Proposed federal legislation that would eliminate the secret ballot in union elections may make it easier for unions to organize our employees. This may result in more of our employees becoming subject to collective bargaining agreements and may negatively affect our labor relations and labor costs.
Risks Related to the Distribution of Cigarettes
Our sales volume is largely dependent upon the distribution of cigarette products, sales of which are declining.
The distribution of cigarette and other tobacco products is currently a significant portion of our business. For the year ended December 31, 2005,In 2008, approximately 72%68.2% of our revenues came from the distribution of cigarettes. During the same period, approximately 35%29.0% of our gross profit was generated from cigarettes. Due to increases in the prices of cigarettes and other tobacco products, restrictions on advertising and promotions by cigarette manufacturers, increases in cigarette regulation and excise taxes, health concerns, increased pressure from anti-tobacco groups and other factors, the U.S.United States and Canadian cigarette and tobacco market has generally been declining since 1980, and is expected to continue to decline. Notwithstanding the general decline in consumption, we have benefited
Prior to 2007 our cigarette sales had benefitted from a shift of cigarette and tobaccoin sales to the convenience stores.retail segment, and as a result of this shift, convenience store cigarette sales had not declined in proportion to the decline in overall consumption. However, our cigarette carton sales began to decline in 2007, and this favorabledecline continued in 2008. We believe this trend is driven principally by an increasing decline in overall consumption due to factors such as increasingly more legislative controls which regulate where the consumer may or may not continuesmoke and the acceleration in the frequency and amount of excise tax increases which reduces demand. The shift in cigarette carton sales from other channels to the convenience retail segment may reverse.no longer be adequate to compensate for consumption declines.
Legislation and other matters are negatively affecting the cigarette and tobacco industry.
The tobacco industry is subject to a wide range of laws and regulations regarding the advertising, sale, taxation and use of tobacco products imposed by local, state, federal and foreign governments. Various state and provincial governments have adopted or are considering legislation and regulations restricting displays and advertising of tobacco products, establishing fire safety standards for cigarettes, raising the minimum age to possess or purchase tobacco products, requiring the disclosure of ingredients used in the manufacture of tobacco products, imposing restrictions on public smoking, restricting the sale of tobacco products directly to consumers or other unlicensed recipients over the Internet, and other tobacco product regulation. For example, the United States Supreme Court has recently determined that lawsuits may proceed against tobacco manufacturers based on alleged deceptive advertising in the marketing of so-called “light” cigarettes. In British Colombia,Columbia, Canada, legislation was adopted authorizing the provincial government to seek recovery of tobacco-related health care costs from the tobacco industry and a lawsuit under such legislation is underway. The Supreme Court of Canada unanimously upheld the Province’s right to sue the tobacco industry and concluded the Tobacco Damages and Health Care Costs Recovery Act is constitutional. Other states and provinces may adopt similar legislation and initiate similar lawsuits. Furthermore, in Alberta, Canada, the Tobacco Reduction Act was passed in 2008 to prohibit the sale of all cigarette and tobacco products from all health-care facilities, public post-secondary campuses, pharmacies and stores containing a pharmacy effective January 1, 2009. In addition, cigarettes are subject to substantial excise taxes in the United States and Canada. Significant increases in cigarette-related taxes have been proposed or enacted and are likely to continue to be proposed or enacted within the United States and Canada. These tax increases are likely to continue to have an adverse impact on sales of cigarettes due to lower consumption levels orand sales outside of legitimate channels.
In the United States we purchase cigarettes primarily from manufacturers covered by the tobacco industry’s Master Settlement Agreement (or MSA)(MSA), which results in our facing certain potential liabilities and financial risks including competition from lower priced sales of cigarettes produced by manufacturers who do not participate in the Master Settlement Agreement.MSA.
In June 1994, the Mississippi attorney general brought an action against various tobacco industry members. This action was broughtmembers on behalf of the state to recover state funds paid for health-care medical and other assistance to state citizens suffering from diseases and conditions allegedlycosts related to tobacco use. Most other states through their attorneys general or other state agencies, sued the major U.S.United States cigarette manufacturers based on similar theories. The cigarette manufacturer defendants settled the first four of these cases scheduled for trial—with Mississippi, Florida, Texas and Minnesota—Minnesota by separate agreements between each state and those manufacturers in each case.agreements. These states are referred to as non-MSA states.
In November 1998, the major U.S.United States tobacco product manufacturers entered into the MSA with the other 46 states, the District of Columbia, Puerto Rico, Guam, theand certain United States Virgin Islands, American Samoa and the Northern Marianas to settle asserted and unasserted health care cost recovery and other claims.territories. The MSA and the other state settlement agreements:agreements settled all health-care cost recovery actions brought by, or on behalf of, the settling jurisdictions; released the major U.S. cigarette manufacturers from various additional present and potential future claims relating to past conduct arising out of the use, sale, distribution, manufacture, development, advertising, marketing or health effects of, the exposure to, or research, statements or warnings about, tobacco products; settled all monetary claims relating to future conduct arising out of the use of, or exposure to, tobacco products, that have been manufactured in the ordinary course of business; imposed a stream of future payment obligations on major U.S.United States cigarette manufacturers;manufacturers and placed significant restrictions on theirthe ability to market and sell cigarettes. The payments required under the MSA result in the products sold by the participating manufacturers to be priced at higher levels than non-MSA manufacturers.
In order to limit our potential tobacco related liabilities, we do not purchasetry to limit our purchases of cigarettes from non-MSA manufacturers for sale in MSA states. The benefits of liability limitations and indemnities we are entitled to under the MSA do not apply to sales of cigarettes manufactured by non-MSA manufacturers.
Competition among cigarette manufacturers for cigarette sales is primarily based on brand positioning, price, product attributes, consumer loyalty, promotions, advertising and retail presence. Cigarette brands produced by the major tobacco product manufacturers generally require competitive pricing, substantial marketing support, retail programs and other financial incentives From time to maintain or improvetime we purchase a brand’s market position. Increased selling prices and higher cigarette taxes have resulted in the growthlimited amount of deep-discount brands. Deep-discount brands are brands manufactured by companies that are not original participants to the MSA, and accordingly, do not have cost structures burdened with MSA-related payments to the same extent as the original participating manufacturers. Historically, major tobacco product manufacturers have had a competitive advantage in the United States because significant cigarette marketing restrictions and the scale of investment required to compete made gaining consumer awareness and trial of new brands difficult. However, since the MSA was signed in November 1998, the category of deep-discount brands manufactured by smaller manufacturers or supplied by importers has grown substantially.
As a result of purchasing premium and discount cigarettes for sale in MSA states exclusively from manufacturers that are parties to the MSA, we are adversely impacted by sales of brands from non-MSA manufacturers and deep-discount brand growth. We believe that small manufacturers, not subject to the MSA, of deep-discount brands have steadily increased their combined market share of cigarette sales. The premium and discount cigarettes subject to the MSA that we sell have been negatively impacted by widening price gaps in the prices between those brands and the deep-discount brands for the past several years. The growth in market share of the deep-discount brands since the MSA was signed in 1998 has had an adverse impact on the volume of the cigarettes that we sell. As a result,when circumstances limit our operations may be negatively impacted as sales volumes of premium cigarettes and the other tobacco products erode.
We also face competition from illicit and other low priced sales of cigarettes.
We also face competition from the diversion into the United States market of cigarettes intended for sale outside the United States, the sale of counterfeit cigarettes by third parties, the sale of cigarettes in non-taxable jurisdictions, inter-state and international smuggling of cigarettes, increased imports of foreign low priced brands, the sale of cigarettes by third parties over the Internet and by other means designedability to avoid collection of applicable taxes. The competitive environment has been characterized bydoing so. For example, during a continued influx of cheap products that challenge sales of higher pricedtransition period while integrating distribution operations from an acquisition we may need to purchase and taxeddistribute cigarettes manufactured by partiesnon-MSA manufacturers to satisfy the MSA. Increaseddemands of customers of the acquired business. With respect to sales of counterfeitsuch non-MSA cigarettes, sales by third parties over the internet, or sales by meanswe could be subject to avoid the collection of applicable taxes,litigation that could have an adverse effect on our results of operations.expose us to liabilities for which we would not be indemnified.
If the tobacco industry’s master settlement agreementMaster Settlement Agreement is invalidated, or tobacco manufacturers cannot meet their obligations to indemnify us, we could be subject to substantial litigation liability.
In connection with the MSA, we are indemnified by the tobacco product manufacturers from which we purchase cigarettes and other tobacco products for liabilities arising from our sale of the tobacco products that they supply to us. To date, litigation challenging the validity of the MSA, including claims that the MSA violates antitrust laws, has not been successful. However, if such litigation were to be successful and the MSA is invalidated, we could be subject to substantial litigation due to our sales of cigarettes and other tobacco products, and we may not be indemnified for such costs by the tobacco product manufacturers in the future. In addition, even if we continue to be indemnified by cigarette manufacturers that are parties to the MSA, future litigation awards against such cigarette manufacturers and usour company could be so large as to eliminate the ability of the manufacturers to satisfy their indemnification obligations. Our
We face competition from sales of deep-discount brands and illicit and other low priced sales of cigarettes.
As a result of purchasing cigarettes for sale in MSA states primarily from manufacturers that are parties to the MSA, we are adversely impacted by sales of brands from non-MSA manufacturers and deep-discount brands manufactured by small manufacturers that are not original participants to the MSA. The cigarettes subject to the MSA that we sell have been negatively impacted by widening price gaps between those brands and deep-discount brands for the past several years. Growth in market share of deep-discount brands since the MSA was signed in 1998 has had an adverse impact on the volume of the cigarettes that we sell.
We also face competition from the diversion into the United States market of cigarettes intended for sale outside the United States, the sale of counterfeit cigarettes by third parties, the sale of cigarettes in non-taxable jurisdictions, inter-state and international smuggling of cigarettes, increased imports of foreign low priced brands, the sale of cigarettes by third parties over the internet and by other means designed to avoid collection of applicable taxes. The competitive environment has been characterized by a continued influx of cheap products that challenge sales of higher priced and taxed cigarettes manufactured by parties to the MSA. Increased sales of counterfeit cigarettes, sales by third parties over the internet, or sales by means to avoid the collection of applicable taxes, could have an adverse effect on our results of operations could be negatively impacted due to increased litigation costs and potential adverse rulings against us.operations.
Cigarettes and other tobacco products are subject to substantial excise taxes and if these taxes are increased, our sales of cigarettes and other tobacco products could decline.
Cigarettes and tobacco products are subject to substantial excise taxes in the United States and Canada. Significant increases in cigarette-related taxes and/or fees have been proposed or enacted and are likely to continue to be proposed or enacted within the United States and Canada. For example, several states passed ballot measures during 2007 and 2008 which will have the effect of increasing excise taxes on cigarettes and other tobacco products. In the United States, legislation was recently introduced to fund the State Children’s Health Insurance Program (SCHIP) by raising the federal cigarette excise tax from 39¢ to $1.01 per pack. This legislation was passed and signed into law in February 2009 and becomes effective April 1, 2009.
These tax increases are expected to continue to have an adverse impact on sales of cigarettes due to lower consumption levels and a shift in sales from the premium to the non-premium or discount cigarette segments or to sales outside of legitimate channels. In addition, state and local governments may require us to prepay for excise tax stamps placed on packages of cigarettes and other tobacco products that we sell. If these excise taxes are substantially increased, it could have a negative impact on our liquidity. Accordingly, we may be required to obtain additional debt financing, which we may not be able to obtain on satisfactory terms or at all. Our inability to prepay the excise taxes may prevent or delay our purchase of cigarettes and other tobacco products, which could materially adversely affect our ability to supply our customers.
We face competition in our distribution markets and if we are unable to compete effectively in any distribution market, we may lose market share and suffer a decline in sales.
Our distribution centers operate in highly competitive markets. We face competition from local, regional and national tobacco and consumable products distributors on the basis of service, price and variety of products offered, schedules and reliability of deliveries, and the range and quality of services provided.
Some of our competitors, including a subsidiary of Berkshire Hathaway Inc., McLane Company, Inc., the largest convenience wholesale distributor in the U.S., have substantial financial resources and long standing customer relationships. In addition, heightened competition among our existing competitors or by new entrants into the distribution market could create additional competitive pressures that may reduce our margins and
adversely affect our business. If we failRisks Related to successfully respond to these competitive pressures or to implement our strategies effectively, we may lose market shareForeign Exchange and our results of operations could suffer.
If the costs to us of the products we distribute increase, or excise stamp taxes increase, and we cannot pass these increases on to our customers, our results of operations could be adversely affected.Financing
It we cannot pass along to our customers increases in our cost of goods sold which we experience when manufacturers or taxing authorities increase prices or taxes invoiced or reduce or eliminate discounts, rebates, allowances and other incentive programs, our profit margins could erode. Our industry is characterized by a high volume of sales with relatively low profit margins. If we cannot pass along cost increases to our customers due to resistance to higher prices, our relatively narrow profit margins and earnings could be negatively affected.
We rely on funding from manufacturer discounts, rebates, allowances and incentives programs and cigarette excise stamping allowances and material changes in these programs could adversely affect our results of operations.
We receive payments from the manufacturers of the products we distribute for allowances, discounts, volume rebates, and other merchandising incentives in connection with various incentive programs. These payments are a substantial benefit to us and the amount and timing of these payments are affected by changes in the programs by the manufacturers, our ability to sell specified volumes of a particular product or attaining specified levels of purchases by our customers, and the duration of carrying a specified product. In addition, we receive discounts from states in connection with the purchase of excise stamps for cigarettes. If the manufacturers or states change or discontinue these programs or we are unable to maintain the volume of our sales, our results of operations could be negatively affected.
We are dependent on the convenience store industry for our revenues, and our results of operations would suffer if there is an overall decline in the convenience store industry.
The majority of our sales are made under purchase orders and short-term contracts with convenience stores which inherently involve significant risks. These risks include the uncertainty of general economic conditions in the convenience store industry, credit exposure from our customers and termination of customer relationships without notice, consolidation of our customer base, and consumer movement toward purchasing from club stores. Any of these factors could negatively affect the convenience store industry which would negatively affect our results of operations.
Some of our distribution centers are dependent on a few relatively large customers, and our failure to maintain our relationships with these customers could substantially harm our business and prospects.
Some of our distribution centers are dependent on relationships with a single customer or a few customers, and we expect our reliance on these relationships to continue for the foreseeable future. Any termination or non-renewal of customer relationships could severely and adversely affect the revenues generated by certain of our distribution centers. For example, in connection with Fleming’s bankruptcy, our customer relationships with Target and K-Mart were terminated resulting in a significant loss of revenue and the closure of four distribution centers located in the Eastern United States. Any future termination, non-renewal or reduction in services that we provide to these select customers would cause our revenues to decline and our operating results would be harmed.
If we are not able to attract new customers, our results of operations could suffer.
Increasing the growth and profitability of our distribution business is particularly dependent upon our ability to retain existing customers and capture additional distribution customers. The ability to capture additional customers through our existing network of distribution centers is especially important because it enables us to
leverage our distribution centers and other fixed assets. Our ability to retain existing customers and attract new customers is dependent upon our ability to provide industry-leading customer service, offer competitive products at low prices, maintain high levels of productivity and efficiency in distributing products to our customers while integrating new customers into our distribution system, and offer marketing, merchandising and ancillary services that provide value to our customers. If we are unable to execute these tasks effectively, we may not be able to attract a significant number of new customers and our existing customer base could decrease, either or both of which could have an adverse impact on our results of operations.
We may not be able to borrow the additional capital to provide us with sufficient liquidity and capital resources necessary to meet our future financial obligations.
We expect that our principal sources of funds will be cash generated from our operations and, if necessary, borrowings under our $250 million 2005 Credit Facility. While we believe our sources of liquidity are adequate, we cannot assure you that these sources will provide us with sufficient liquidity and capital resources required to meet our future financial obligations, or to provide funds for our working capital, capital expenditures and other needs for the foreseeable future. We may require additional equity or debt financing to meet our working capital requirements or to fund our capital expenditures. We may not be able to obtaining financing on terms satisfactory to us, or at all.
We depend on relatively few suppliers for a large portion of our products, and any interruptions in the supply of the products that we distribute could adversely affect our results of operations.
We obtain the products we distribute from third party suppliers. At December 31, 2005, we had approximately 3,800 vendors, and during 2005 we purchased approximately 51% of our products from our top 20 suppliers, with our top two suppliers, Philip Morris and R. J. Reynolds, representing approximately 26% and 15% of our purchases, respectively. We do not have any long-term contracts with our suppliers committing them to provide products to us. Although our purchasing volume can provide leverage when dealing with suppliers, suppliers may not provide the products we distribute in the quantities we request or on favorable terms. Because we do not control the actual production of the products we distribute, we are also subject to delays caused by interruption in production based on conditions outside our control. These conditions include job actions or strikes by employees of suppliers, inclement weather, transportation interruptions, and natural disasters or other catastrophic events. Our inability to obtain adequate supplies of the products we distribute as a result of any of the foregoing factors or otherwise, could cause us to fail to meet our obligations to our customers.
We may be subject to product liability claims which could materially adversely affect our business.
Core-Mark, as with other distributors of food and consumer products, faces the risk of exposure to product liability claims in the event that the use of products sold by us causes injury or illness. With respect to product liability claims, we believe that we have sufficient liability insurance coverage and indemnities from manufacturers. However, product liability insurance may not continue to be available at a reasonable cost, or, if available, may not be adequate to cover all of our liabilities. We generally seek contractual indemnification and insurance coverage from parties supplying the products we distribute, but this indemnification or insurance coverage is limited, as a practical matter, to the creditworthiness of the indemnifying party and the insured limits of any insurance provided by suppliers. If we do not have adequate insurance or if contractual indemnification is not available or if the counterparty can not fulfill its indemnification obligation, product liability relating to defective products could materially adversely impact our results of operations.
We depend on our senior management and key personnel.
We substantially depend on the continued services and performance of our senior management and other key personnel, particularly J. Michael Walsh, our President and Chief Executive Officer. We do not maintain key person life insurance policies on these individuals or any of our other executive officers, and we do not have
employment agreements with any of our executive officers. The loss of the services of any of our executive officers or key employees could harm our business.
We operate in a competitive labor market and a portion of our employees are covered by collective bargaining agreements.
Our continued success will partly depend on our ability to attract and retain qualified personnel. We compete with other businesses in each of our markets with respect to attracting and retaining qualified employees. A shortage of qualified employees could require us to enhance our wage and benefits packages in order to compete effectively in the hiring and retention of qualified employees or to hire more expensive temporary employees. In addition, at December 31, 2005 approximately 6%, or approximately 220, of our employees are covered by collective bargaining agreements with labor organizations, which expire at various times over the course of the next two years.
We cannot assure you that we will be able to renew our respective collective bargaining agreements on favorable terms, that employees at other facilities will not unionize, that our labor costs will not increase, that we will be able to recover any increases in labor costs through increased prices charged to customers or that we will not suffer business interruptions as a result of strikes or other work stoppages. If we fail to attract and retain qualified employees, to control our labor costs, or to recover any increased labor costs through increased prices charged to our customers or offsets by productivity gains, our results of operations could be materially adversely affected.
Currency exchange rate fluctuations could have an adverse effect on our revenues and financial results.
We generate a significant portion of our revenues in Canadian dollars, approximately 21%15% in 2005.2008 and 14% in 2007. We also incur a significant portion of our expenses in Canadian dollars. To the extent that we are unable to match revenues received in Canadian dollars with costs paid in the same currency, exchange rate fluctuations in Canadian dollars could have an adverse effect on our revenues and financial results. During times of a strengthening U.S. dollar (such as the second half of 2008), our reported sales and earnings from our Canadian operations will be reduced because the Canadian currency will be translated into fewer U.S. dollars. Prior to August 23, 2004, we did not reflect foreign currency transaction gains or losses in our results of operations because these intercompany balances were determined to beConversely, during times of a permanent nature. After August 23, 2004weakening U.S. dollar (as occurred in 2007), our reported sales and earnings from our Canadian operations will be increased because such intercompany balances began fluctuating and the balances were determined toCanadian currency will be of a trading nature. GAAP requirestranslated into more U.S. dollars. Accounting principles generally accepted in the United States (GAAP) require that such foreign currency transaction gains or losses on intercompany transactions be recorded currently as a gaingains or losslosses within the income statement. To the extent we incur losses on such transactions, our net income and earnings per share will be reduced.
We may not be able to borrow additional capital to provide us with sufficient liquidity and capital resources necessary to meet our future financial obligations.
During the current economic downturn, some companies have experienced difficulties in drawing on lines of credit, issuing debt and raising capital generally, which has had a material adverse effect on their liquidity. In addition, if banks from which companies expect to receive financing fail or become insolvent, the borrowing capacity of those companies may be reduced. We expect that our principal sources of funds will be cash generated from our operations and, if necessary, borrowings under our $250 million credit facility. While we believe our sources of liquidity are adequate, we cannot assure you that these sources will be available or continue to provide us with sufficient liquidity and capital resources required to meet our future financial obligations, or to provide funds for our working capital, capital expenditures and other needs. We may require additional equity or debt financing to meet our working capital requirements or to fund our capital expenditures. We may not be able to obtain financing on terms satisfactory to us, or at all.
Our operating flexibility is limited in significant respects by the restrictive covenants in our Credit Facility.
Our credit facility imposes restrictions on us that could increase our vulnerability to general adverse economic and industry conditions by limiting our flexibility in planning for and reacting to changes in our business and industry. Specifically, these restrictions limit our ability, among other things, to: incur additional indebtedness, pay dividends and make distributions, issue stock of subsidiaries, make investments, repurchase stock, create liens, enter into transactions with affiliates, merge or consolidate, or transfer and sell our assets. In addition, under our credit facility, under certain circumstances we are required to meet a fixed charge coverage ratio. Our ability to comply with this covenant may be affected by factors beyond our control and a breach of the covenant could result in an event of default under our credit facility, which would permit the lenders to declare all amounts incurred thereunder to be immediately due and payable and terminate their commitments to make further extensions of credit.
Risks Related to Government Regulation and Environment
We are subject to governmental regulation and if we are unable to comply with regulations that affect our business or if there are substantial changes in these regulations, our business could be adversely affected.
As a distributor of food products, we are subject to the regulation by the U.S.United States Food and Drug Administration.Administration, Health Canada and similar regulatory authorities at the state, provincial and local levels. In addition, our employees operate tractor trailers, trucks, forklifts and various other powered material handling equipment. equipment and we are therefore subject to regulation by the U.S. and Canadian Departments of Transportation.
Our operations are also subject to regulation by the Occupational Safety and Health Administration, the Department of Transportation, Drug Enforcement Agency and other federal, state, provincial and local agencies. Each of these regulatory authorities havehas broad administrative powers with respect to our operations. If we fail to adequately comply with government regulations or regulations become more stringent, we could experience increased inspections, regulatory authorities could take remedial action including imposing fines or shutting down our operations or we could be subject to increased compliance costs. If any of these events were to occur, our results of operations would be adversely affected.
Earthquake and natural disaster damage could have a material adverse affect on our business.
We are headquartered in, and conduct a significant portion of our operations in California. Our operations in California are susceptible to damage from earthquakes. In addition, twoone of our data centers areis located in
California and Oregon and may be Richmond, British Columbia, Canada which is susceptible to damageearthquakes, and one of our data centers is located in the event of an earthquake.Plano, Texas which is susceptible to wind storms. We believe that we maintain adequate insurance to indemnify us for losses. However, significant earthquake and natural disaster damage could result in losses in excess of our insurance coverage which would materially adversely affect our results of operations. We also have operations in areas that have been affected by natural disasters such as hurricanes, tornados, flooding, ice and snow storms. While we maintain insurance to indemnify us for losses due to such occurrences, our insurance may not be sufficient or payments under our policies may not be received timely enough to prevent adverse impacts on our business. Our customers could also be affected by like events, adversely impacting our sales.
Our information technology systems may be subject to failure or disruptions, which could seriously harm our business.
Our business is highly dependent on our Distribution Center Management System, or DCMS. The convenience store industry does not have a standard information technology, or IT platform. Therefore, actively integrating our customers into our IT platform is a priority, and our DCMS platform provides our distribution centers with the flexibility to adapt to our customers’ IT requirements. We also rely on our DCMS, and our internal information technology staff, to maintain the information required to operate our distribution centers and provide our customers with fast, efficient and reliable deliveries. While we have taken steps to increase redundancy in our IT systems, if our DCMS fails or is subject to disruptions, we may suffer disruptions in service to our customers and our results of operations could suffer.
Risks Relating to Our Recent Reorganization
We are guarantors of certain payments pursuant to the Plan of Reorganization.
Pursuant to the Plan, two special purpose trusts, the Post Confirmation Trust, or PCT, and the Reclamation Creditor’s Trust, or RCT, were established. We refer to the PCT and the RCT collectively as the Trusts. The Trusts are charged with administering certain responsibilities under the Plan, including liquidating certain assets, the pursuit and collection of litigation claims and causes of action and the reconciliation and payment of specific types of claims including trade lien vendor claims, or TLV claims, each as allocated between the PCT and the RCT pursuant to the Plan. Under the terms of the Plan, we guarantee the payment of PCT administrative claims in excess of $56 million. In addition, if the assets of the RCT are inadequate to satisfy all of the allowed TLV claims, we must pay such claims in full plus any accrued interest. We also guarantee all eligible but unpaid non-TLV claims up to a maximum of $15 million. The Plan limits the combined guarantee amounts of the RCT TLV and non-TLV claims to not greater than $137 million. To the extent that are we are required to fund amounts under the guarantees, our results of operations and our liquidity and capital resources could be materially adversely affected. In addition, we may not have sufficient cash reserves to pay the amounts required under the guarantees when they become due.
The Fleming bankruptcy has negatively affected some of our relationships with customers, suppliers and employees and our results of operations and may continue to negatively affect such relationships and our results of operations.
We estimate that the former Fleming convenience distribution centers, which included Core-Mark International and seven Fleming distribution centers, lost approximately $1.2 billion in annualized sales after Fleming’s Chapter 11 filing, with approximately $360 million of such lost sales attributable to four closed distribution centers located in the Eastern United States and the balance attributable to the distribution centers now comprising Core-Mark. We cannot predict accurately or quantify the additional effects, if any, that the bankruptcy may continue to have on our operations.
Our operating flexibility is limited in significant respects by the restrictive covenants in our 2005 Credit Facility.
Our 2005 Credit Facility imposes restrictions on us that could increase our vulnerability to general adverse economic and industry conditions by limiting our flexibility in planning for and reacting to changes in our business and industry. Specifically, these restrictions limit our ability, among other things, to: incur additional indebtedness, pay dividends and make distributions, issue stock of subsidiaries, make investments, repurchase stock, create liens, enter into transactions with affiliates, merge or consolidate, or transfer and sell our assets.
In addition, under our 2005 Credit Facility, we are required to meet certain financial ratios and tests. Our ability to comply with these covenants may be affected by factors beyond our control. If we breach any of these covenants or restrictions, it could result in an event of default under our 2005 Credit Facility, which would permit our lenders to declare all amounts incurred thereunder to be immediately due and payable, and our lenders under our 2005 Credit Facility could terminate their commitments to make further extensions of credit under our 2005 Credit Facility.
Our reorganization valuation is based in part on estimates of future performance. If our estimates are not accurate, the market price of our common stock could be adversely affected.
Our financial statements reflect the adoption of American Institute of Certified Public Accountants Statement of Position 90-7, or SOP 90-7. In accordance with fresh-start accounting under SOP 90-7, all assets and liabilities were recorded at their respective fair values on the Effective Date of the Plan, August 23, 2004 These fair values represent our best estimates and are based on independent valuations where applicable. To calculate the fair value of our assets, or reorganization value as defined in SOP 90-7, on the effective date of the Plan, financial projections were prepared and the fair value of assets as well as our enterprise value was determined using various valuation methods based on these financial projections. The estimated enterprise value used for portions of this valuation analysis is highly dependent upon our achieving the future financial results set forth in the projections as well as the realization of certain other assumptions, which are not guaranteed. SOP 90-7 requires that the reorganization value be allocated to the assets in conformity with FASB Statement No. 141,Business Combinations(SFAS No. 141). Although we allocated our reorganization value among our assets in accordance with SFAS No. 141, our allocations were based on assumptions. Accordingly, these allocations are estimates only. Subsequent changes, if any, will be reflected in our operating results. The valuation, insofar as it relates to the enterprise value, necessarily assumes that we will achieve the estimates of future operating results in all material respects. If these results are not achieved, the resulting values could be materially different from our estimates, and the trading price of our common stock could be adversely affected.
Our tax treatment of the reorganization may not be accepted by the IRS, which could result in increased tax liabilities.
Deferred tax assets and liabilities as reflected at August 23, 2004 in connection with the application of fresh-start accounting are based on management’s best estimate of the tax filing position that is probable of being accepted by the applicable taxing authorities. The Company intends to take an alternative position on its tax returns. Based on this alternative tax filing position, the Company has taken deductions on its tax returns that could be challenged by the taxing authorities. Although management believes that the Company’s tax filing position will more likely than not be sustained in the event of an examination by applicable taxing authorities and we would contest any proposed adjustment vigorously, the outcome of such matters can not be predicted with certainty. As such, the Company has accrued approximately $3.9 million in other tax liabilities on the accompanying December 31, 2005 consolidated balance sheet for this eventuality.
Risks Relating to an Investment in Our Common Stock
Approximately 2.3 million of our outstanding shares held by Fleming have yet to be distributed pursuant to the Plan and additional shares will be issued pursuant to the 2005 Long-Term Incentive Plan.
Pursuant to the Plan, we issued an aggregate of 9.8 million shares of our common stock to Fleming. As of December 31, 2005, 7.5 million shares of our common stock and warrants to purchase 1.2 million shares of our common stock have been distributed by Fleming pursuant to the Plan. An aggregate of 2.3 million shares of our common stock are subject to future distribution pursuant to the Plan by Fleming. Future distributions of the remaining 2.3 million shares of common stock pursuant to the Plan by Fleming are at the discretion of the Post Confirmation Trust (PCT) and the bankruptcy court and are not in our control. In addition, as of December 31, 2005, restricted stock units, restricted stock and options issued pursuant to our stock incentive plans relating to 1.4 million shares of our common stock were outstanding.
In February 2005, our board of directors adopted our 2005 Long Term Incentive Plan, or the 2005 Plan, and authorized the grant of restricted stock units under the 2005 Plan to be allocated by our Chief Executive Officer among our employees in proportion to grants made under the 2004 Plan. The number of shares of our common stock issuable under the 2005 Plan is limited to a number of shares having a market value of $5.5 million, based on the average closing price of our common stock over the eleventh through twentieth trading days following the date that our common stock becomes listed for quotation on the NASDAQ National Market. This average closing price was established in December 2005 and was determined to be $32.201. In February 2005, the Compensation Committee and the Board of Directors approved the grant of restricted stock units having a value of approximately $5.0 million with a vesting commencement date of February 1, 2005. Using the established share price of $32.201 the number of shares issued was 153,455. The Board of Directors determined that the balance of approximately $0.5 million available for grants under the 2005 Plan should be reserved for possible future issuance.
The distribution of a significant amount of shares of common stock onto the market or the sale of a substantial number of shares at any given time could result in a decline in the price of our common stock, cause dilution, or increase volatility.
We may not be able to obtain the required approval of holders of shares of our common stock for certain actions as our largest shareholder, Fleming, may not be permitted by the bankruptcy court or may choose not to vote any undistributed shares.
As of December 31, 2005, only 7.5 million shares, or approximately 77%, of our outstanding common stock has been distributed by Fleming under the Plan. Fleming holds the balance of the 9.8 million shares of our common stock to be distributed pursuant to the Plan, and without bankruptcy court approval, Fleming may not be permitted to attend a meeting of our stockholders for purposes of establishing a quorum for a stockholders meeting or to vote its shares of our common stock. Therefore, we may not be able to effect certain corporate actions that require the approval of our stockholders. The failure to take such stockholder actions could have a material adverse affect on us and our operations.
We have identified eleven material weaknesses in our internal controls over financial reporting. If we fail to remedy these or any other material weaknesses in our internal controls over financial reporting that we may identify, such failure could result in material misstatements in our financial statements, cause investors to lose confidence in our reported financial information and have a negative effect on the trading price of our common stock.
A material weakness is defined in standards established by the Public Company Accounting Oversight Board as a deficiency in internal control over financial reporting that results in more than a remote likelihood that a material misstatement of the annual or interim financial statements will not be prevented or detected. As
discussed below in “Item 9.A. Controls and Procedures,” we have identified eleven material weaknesses in our internal controls over financial reporting consisting of failures to:
(i) maintain an effective control environment and a failure by management to extend the necessary rigor and commitment to disclosure controls and procedures,
(ii) maintain effective controls over the financial reporting process due to an insufficient complement of personnel with an appropriate level of accounting knowledge, experience and training in the application of generally accepted accounting principles commensurate with the company’s financial reporting requirements and the complexity of the company’s operations and transactions,
(iii) maintain effective controls to ensure the adequacy of debt discount and debt issuance costs,
(iv) maintain effective controls to ensure the appropriate classification and presentation of deferred stock-based compensation within stockholders’ equity,
(v) maintain effective controls to ensure the accurate preparation and review of the cash flow statement,
(vi) maintain effective controls to ensure the appropriate classification and presentation of accounts and disclosures in the consolidated financial statements,
(vii) maintain effective controls to ensure there is adequate analysis, documentation, reconciliation, and review of accounting records and supporting data,
(viii) maintain effective controls to ensure the appropriate valuation of insurance related contracts,
(ix) maintain effective controls over the recording of journal entries to account for management fee contract amendments,
(x) maintain effective controls over the accuracy of amounts subject to estimation with respect to other receivables, inventory, deposits and prepayments, other non-current assets, accrued liabilities, cost of sales and operating expenses,
(xi) maintain effective controls over the accurate preparation, recording, and review of foreign exchange translation adjustments.
In order to address these material weaknesses, on March 23, 2006 our audit committee directed management to formulate an enhancement, with the assistance of an outside consultant, to our remediation plan initially approved by the audit committee following the identification of material weaknesses in connection with finalizing our third quarter 2005 results. However, we have yet to develop such an enhanced remediation plan nor implement it. If we fail to remediate these material weaknesses or any other material weaknesses we may identify, such failure could result in material misstatements in our financial statements.
Due to our need to engage a successor independent registered public accounting firm as a result of PricewaterhouseCoopers LLP’s decision to decline to stand for re-election as our independent registered public accounting firm upon completion of the audit of our financial statements for fiscal 2005, we may be unable to file our first quarter 2006 Form 10-Q within the required filing period which may impact adversely our eligibility to remain listed on NASDAQ.
We are in the process of seeking to engage a new independent registered public accounting firm. If we are not able to engage a new independent registered public accounting firm on a timely basis to review our financial statements for the first quarter of 2006, we may need to delay the release of our earnings for the first quarter of
2006 and the filing of our Form 10-Q for such quarter. Such delays, coupled with the material weaknesses we have identified in our internal controls over financial reporting and the fact that we have not yet implemented a remediation plan to address the material weaknesses, could cause investors to lose confidence in our reported financial information, which could have a negative effect on the trading price of our common stock. In addition, the inability to file our Form 10-Q for the first quarter of 2005 on a timely basis could adversely impact our eligibility to remain listed on the NASDAQ stock market.
We will incur significant costs as a result of being a public company.
As a public company, we will incur significant accounting, legal, governance, compliance and other expenses that private companies do not incur. In addition, the Sarbanes-Oxley Act of 2002 and the rules subsequently implemented by the Securities and Exchange Commission and the NASDAQ Stock Market, have required changes in corporate governance practices of public companies. We expect these rules and regulations to increase our legal, audit and financial compliance costs and to make some activities more time-consuming and costly. For example, as a result of becoming a public company, we are required to create additional board committees and adopt policies regarding internal controls and disclosure controls and procedures. In addition, we will incur additional costs associated with our public company reporting requirements. We also expect these rules and regulations to make it more difficult and more expensive for us to obtain director and officer liability insurance and we may be required to accept reduced policy limits and coverage or incur substantially higher costs to obtain the same or similar coverage. As a result, it may be more difficult for us to attract and retain qualified persons to serve on our board of directors or as executive officers.
We may be unable to meet our obligation to conform to the rules adopted by the Securities and Exchange Commission under Section 404 of the Sarbanes-Oxley Act of 2002.
We are engaged in the process of assessing the effectiveness of our internal control over financial reporting in connection with the rules adopted by the Securities and Exchange Commission under Section 404 of the Sarbanes-Oxley Act of 2002. Compliance with Section 404 of the Sarbanes-Oxley Act of 2002 is required in connection with the filing of our annual Report on Form 10-K of the fiscal year ending December 31, 2006. While our management is expending significant resources in an effort to complete this important project, there can be no assurance that we will be able to achieve our objective on a timely basis. There also can be no assurance that our auditors will be able to issue an unqualified opinion on management’s assessment of the effectiveness of our internal control over financial reporting.
Any failure to complete our assessment of our internal control over financial reporting, to remediate the eleven material weaknesses we have identified or any other material weaknesses that we may identify or to implement new or improved controls, or difficulties encountered in their implementation, could harm our operating results, cause us to fail to meet our reporting obligations or result in material misstatements in our financial statements. Any such failure also could adversely affect the results of the periodic management evaluations of our internal control over financial reporting that are required under Section 404 of the Sarbanes-Oxley Act of 2002. Inadequate internal controls could also cause investors to lose confidence in our reported financial information, which could have a negative effect on the trading price of our common stock.
| ITEM 1.B. | UNRESOLVED STAFF COMMENTS |
None.
| ITEM 2. | PROPERTIES |
Our headquarters are located in South San Francisco, California, and consist of approximately 22,00026,000 square feet of leased office space. We also lease approximately 13,000 square feet for use by our information technology and tax personnel in Richmond, British Columbia.Columbia and approximately 6,000 square feet for use by our information technology personnel in Plano, Texas. We lease approximately 2.242.7 million square feet and own approximately 0.120.4 million square feet of distribution space.
Distribution Center Facilities by City and State of Location(1) | ||||
Albuquerque, New Mexico | Las Vegas, Nevada | |||
Atlanta, Georgia | Los Angeles, California | |||
Bakersfield, California | Leitchfield, Kentucky | Calgary, Alberta | ||
Corona, California | Minneapolis, Minnesota | Toronto, Ontario | ||
Denver, Colorado | Portland, Oregon | Vancouver, British Columbia | ||
Fort Worth, Texas | ||||
Sacramento, California(3) | Winnipeg, Manitoba | |||
Grants Pass, Oregon | Salt Lake City, Utah | |||
Hayward, California | Spokane, Washington | |||
| (1) | Excluding outside storage facilities or depots and two facilities that we operate as third-party logistics provider. Depots are defined as a secondary location for a division which may include any combination of sales offices, operational departments and/or storage. We own distribution center facilities located in Leitchfield, Kentucky and Wilkes-Barre, Pennsylvania. All other facilities listed are leased. |
| (2) | This facility includes a distribution center and our Allied Merchandising Industry consolidating warehouse. |
| (4) | Acquired in June 2008. |
We also operate distribution centers on behalf of two of our major customers, one in Phoenix, Arizona for Circle KAlimentation Couche-Tard and the one in San Antonio, Texas for Valero. Each facility is leased by the specific customer solely for their use and operated by Core-Mark.
| ITEM 3. | LEGAL PROCEEDINGS |
Proceedings Under Chapter 11As of the Bankruptcy Code
On April 1, 2003, Fleming filed for protection under Chapter 11 of the U.S. Bankruptcy Code. The debtor entities comprising Core-MarkDecember 31, 2008, we were includednot involved in the Chapter 11any material legal proceedings. The Plan, pursuant to which the debtors were reorganized around Core-Mark International and Fleming’s one remaining convenience store wholesale distribution center, was confirmed on July 27, 2004 and became effective on August 23, 2004. Pursuant to the Plan, two special purpose trusts, the Post Confirmation Trust, or PCT, and the Reclamation Creditor’s Trust, or RCT, were established. These trusts are charged with administering certain responsibilities under the Plan, including liquidating certain assets, the pursuit and collection of litigation claims and causes of action and the reconciliation and payment of specific types of claims, including trade lien vendor claims, or TLV claims, each as allocated between the PCT and the RCT pursuant to the Plan. Under the terms of the Plan, in the event that the amount of PCT administrative claims exceeds $56 million, we guarantee the payment of all such claims. In addition, if the assets of the RCT are inadequate to satisfy all of the allowed TLV claims, we must pay such claims in full plus any accrued interest. We also guarantee all eligible but unpaid non-TLV claims up to a maximum of $15 million. The Plan limits the amounts of the TLV and non-TLV claims to not greater than $137 million.
| ITEM 4. | SUBMISSION OF MATTERS TO A VOTE OF SECURITY HOLDERS |
None.No matters were submitted to a vote of security holders during the fourth quarter of the fiscal year covered by this report.
| ITEM 5. | MARKET FOR REGISTRANT’S COMMON EQUITY, RELATED STOCKHOLDER MATTERS AND ISSUER PURCHASES OF EQUITY SECURITIES |
Prior to April 2005, ourOur common stock was not traded. From April 2005 to December 1, 2005 our common stock traded over-the-counter and sales were reportedtrades on the Pink Sheets service provided by Pink Sheets LLC under the symbol “CMRK”. Since December 2, 2005 our common stock has traded on the Nasdaq National
NASDAQ Global Market under the symbol “CORE”.“CORE.” According to the records of our transfer agent, we had 1,7222,782 stockholders of record as of February 28, 2006. 27, 2009.
The following table sets forthprovides the range of high and low bid prices or sales prices of our common stock as reported by the Nasdaq NationalNASDAQ Global Market orfor the periods indicated:
| Low Price | High Price | |||||
Fiscal 2008 | ||||||
4th Quarter | $ | 14.81 | $ | 24.94 | ||
3rd Quarter | 24.65 | 30.74 | ||||
2nd Quarter | 25.53 | 30.03 | ||||
1st Quarter | 22.59 | 29.95 | ||||
| Low Price | High Price | |||||
Fiscal 2007 | ||||||
4th Quarter | 24.74 | 36.35 | ||||
3rd Quarter | 29.66 | 37.70 | ||||
2nd Quarter | 33.22 | 38.17 | ||||
1st Quarter | 29.70 | 37.21 | ||||
PERFORMANCE COMPARISON
The graph below presents a comparison of cumulative total return to stockholders for the period Core-Mark had securities trading on the Pink Sheets or on the NASDAQ Global Market and the cumulative total return of the NASDAQ Non-Financial Stock Index and a peer group of companies (the Performance Peer Group).
Cumulative total return to stockholders is measured by per share price change for the periods indicated (as applicable):period by the share price at the beginning of the measurement period. Core-Mark’s cumulative stockholder return is based on an investment of $100 on November 7, 2005 and is compared to the total return of the NASDAQ Non-Financial Stock Index and the weighted average performance of the Performance Peer Group over the same period with a like amount invested. In 2008, we added a comparison to the Russell 2000 Index. We regularly compare our performance to this index since it includes primarily companies with relatively small market capitalization similar to us.
The companies composing the Performance Peer Group are Sysco Corp. (SYY), Nash Finch Company (NAFC), United Natural Foods, Inc. (UNFI) and AMCON Distributing Co. (DIT). Performance Food Group Co. (PFGC) was removed from the Peer Group as it was acquired by another company in 2008.
COMPARISON OF CUMULATIVE TOTAL RETURN
AMONG CORE-MARK, NASDAQ NON-FINANCIAL STOCK AND RUSSELL 2000 INDEXES,
AND THE PERFORMANCE PEER GROUP
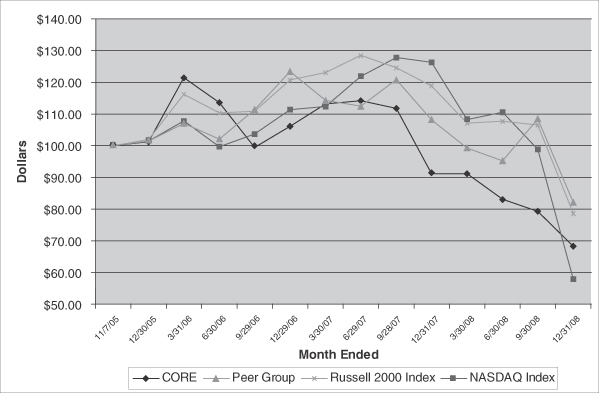
| Low Price | High Price | |||
Fiscal 2005 | ||||
4th Quarter(1) | 28.00 | 34.00 | ||
3rd Quarter(2) | 25.50 | 34.50 | ||
2nd Quarter(2) | 24.90 | 37.50 | ||
1st Quarter(2) | N/A | N/A |
| Investment Value at | ||||||||||||||||||||||||
| 11/7/05 | 12/30/05 | 3/31/06 | 6/30/06 | 9/29/06 | 12/29/06 | |||||||||||||||||||
CORE | $ | 100.00 | $ | 101.27 | $ | 121.46 | $ | 113.65 | $ | 99.49 | $ | 106.19 | ||||||||||||
NASDAQ Index | $ | 100.00 | $ | 101.56 | $ | 107.91 | $ | 99.68 | $ | 103.71 | $ | 111.38 | ||||||||||||
Russell 2000 Index | $ | 100.00 | $ | 102.04 | $ | 116.27 | $ | 110.42 | $ | 110.91 | $ | 120.78 | ||||||||||||
Performance Peer Group | $ | 100.00 | $ | 101.47 | $ | 107.08 | $ | 102.10 | $ | 111.38 | $ | 123.46 | ||||||||||||
| 3/30/07 | 6/29/07 | 9/28/07 | 12/31/07 | 3/31/08 | 6/30/08 | 9/30/08 | 12/31/08 | |||||||||||||||||
CORE | $ | 113.27 | $ | 114.22 | $ | 111.84 | $ | 91.17 | $ | 91.24 | $ | 83.17 | $ | 79.33 | $ | 68.32 | ||||||||
NASDAQ Index | $ | 112.39 | $ | 121.93 | $ | 127.83 | $ | 126.36 | $ | 108.28 | $ | 110.64 | $ | 98.85 | $ | 57.94 | ||||||||
Russell 2000 Index | $ | 123.13 | $ | 128.57 | $ | 124.59 | $ | 118.89 | $ | 107.12 | $ | 107.75 | $ | 106.55 | $ | 78.72 | ||||||||
Performance Peer Group | $ | 114.34 | $ | 112.48 | $ | 120.86 | $ | 108.20 | $ | 99.25 | $ | 95.28 | $ | 108.50 | $ | 82.18 | ||||||||
We have not declared or paid any cash dividends on our common stock. The credit agreement for our 2005 Credit Facility prohibits us from payingplaces limitations on our ability to pay cash dividends on our common stock. In addition, we intend to retain future earnings, if any, to finance the operation and expansion of our business. Therefore, we do not anticipate paying any cash dividends on our common stock in the foreseeable future. The payment of any future dividends will be determined by our board of directors in light of then existing conditions, including our earnings, financial condition and capital requirements, strategic alternatives, restrictions in financing agreements, business conditions and other factors.
The following table sets forth the total number of shares of our common stock to be issued upon exercise of outstanding options and upon the vesting of restricted stock units, the weighted average exercise price of such options and price of the restricted stock units and the number of shares of our common stock available for future issuance under our 2004 Plan, 2005 Plan and Directors Plans. None of the 2004 Plan, 2005 Plan or Directors Plans were approved by our stockholders, however the 2004 Plan and 2004 Directors Plan were approved by the Bankruptcy Court in connection with Fleming’s bankruptcy.
Equity Compensation Plan Information
(as of December 31, 2005)
Number of securities to rights | Weighted-average exercise price of outstanding options, warrants and rights | Number of securities remaining available for future issuance under equity compensation plans (excluding securities reflected in column 1) | |||||||
2004 Long Term Incentive Plan—Restricted Stock Units and Options | 1,237,693 | (1) | $ | 15.50 | (2) | 66,822 | |||
2005 Long Term Incentive Plan—Restricted Stock Units | 153,455 | ** | (3) | 17,860 | |||||
2004 Directors Equity Incentive Plan | 30,000 | $ | 15.50 | 0 | |||||
2005 Directors Equity Incentive Plan | 15,000 | $ | 27.03 | 0 | |||||
Equity Incentive Plans
2004 Long-Term Incentive Plan
We adopted our 2004 Long-Term Incentive Plan, or the 2004 Plan, effective August 23, 2004, the effective date of the Plan. The 2004 Plan permits us to issue incentive awards to eligible participants selected by our Compensation Committee that are settled in our common stock, cash, or other Core-Mark securities. Available awards under the 2004 Plan include:
Awards under the 2004 Plan may be granted, in the discretion of the Compensation Committee, to any director, officer (including a non-employee officer) or employee of the Company, as well as to any other individual performing services for us or any Core-Mark subsidiary and to any individual to whom an offer of employment or offer to provide services has been extended by us or any Core-Mark subsidiary.
2005 Long-Term Incentive Plan
We adopted our 2005 Long-Term Incentive Plan, or the 2005 Plan, effective February, 2005. The 2005 Plan permits us to issue incentive awards to eligible participants selected by our Compensation Committee that are settled in our common stock, cash, or other Core-Mark securities. Available awards under the 2005 Plan include restricted stock and restricted stock units and performance awards. Awards under the 2005 Plan may be granted, in the discretion of the Compensation Committee, to any director, officer (including a non-employee officer) or employee of the Company, as well as to any other individual performing services for us or any Core-Mark subsidiary and to any individual to whom an offer of employment or offer to provide services has been extended by us or any Core-Mark subsidiary.
2004 Directors Equity Incentive Plan
We adopted our 2004 Directors Equity Incentive Plan, or the 2004 Directors Plan, effective August 23, 2004, the effective date of the 2004 Directors Plan. The 2004 Directors Plan permits us to grant non-qualified stock options to our non-employee directors. Awards under the 2004 Directors Plan may be granted, in the discretion of our board of directors, to any non-employee director of the Company or any subsidiary.
2005 Directors Equity Incentive Plan
We adopted our 2005 Directors Equity Incentive Plan, or the 2005 Directors Plan, effective August, 2005. The 2005 Directors Plan permits us to grant non-qualified stock options to our non-employee directors. The terms of the 2005 Directors Plan are substantially similar to the 2004 Directors Plan.
Sales of Unregistered Securities
Common Stock and Warrants Issued Pursuant to the Plan of Reorganization in 2004
Pursuant to Fleming’sthe plan of reorganization (May 2004) described in Exhibit 2.1 and incorporated by reference (see Part IV, Item 15, Exhibit Index of this Form 10-K), herein referred to as “Fleming’s bankruptcy” or “plan of reorganization,” on August 23, 2004 we issued an aggregate of 9,800,000 shares of our common stock and warrants to purchase an aggregate of 990,616 shares of our common stock to the
Class 6(B) creditors of Fleming. We refer to the warrants we issued to the Class 6(B) creditors as the Class 6(B) Warrants. We received no cash consideration for the issuance of common stock and the Class 6(B) Warrants. The Class 6(B) Warrants have an exercise price of $20.925$20.93 per share and may be exercised at the election of the holder at any time prior to August 23, 2011. The shares of common stock and the Class 6(B) Warrants were issued pursuant to an exemption from registration under Section 1145(a) of the Bankruptcy Code. We also issued warrants to purchase an aggregate of 247,654 shares of our common stock to the holders of our Tranche B Notes. The Tranche B Warrants have an exercise price of $15.50 per share. We entered into a registration rights agreement with the holders of the Tranche B Warrants pursuant to which we registered under the Securities Act of 1933 the sharesShares of our common stock issuableissued upon exercise of the Tranche B Warrants.Warrants are issued pursuant to an exemption from registration under Section 4(2) of the Securities Act of 1933.
During 2008, no Class 6(B) warrants were exercised or issued in either cash or cashless transactions, and a total of 21,988 shares of common stock have been issued since inception pursuant to exercises of Class 6(B) warrants. During 2008, there were no Tranche B warrants exercised and issued in cashless transactions, and the total number of shares of common stock issued since inception pursuant to Tranche B warrants as of December 31, 2008 remained at 73,507 shares.
SummaryIssuer Purchases of Equity CapitalizationSecurities
The following table provides the repurchases of common stock shares during the year ended December 31, 2008:
Calendar Month/Period in which purchases were made: | Total Number of Shares Repurchased(1) | Average Cost per Share(2) | Total Cost of Purchased Shares (in millions) | Maximum Repurchases Allowed (in millions)(3) | |||||||
Mar 12, 2008—approval of share repurchase | — | $ | — | $ | — | $ | 30.0 | ||||
Mar 20, 2008 to Mar 31, 2008 | 97,854 | 29.15 | 2.9 | 27.1 | |||||||
May 1, 2008 to May 31, 2008 | 51,282 | 27.84 | 1.4 | 25.7 | |||||||
Jun 1, 2008 to Jun 30, 2008 | 118,949 | 27.17 | 3.2 | 22.5 | |||||||
Jul 1, 2008 to Jul 31, 2008 | 61,860 | 25.97 | 1.6 | 20.9 | |||||||
Aug 1, 2008 to Aug 31, 2008 | 29,648 | 28.56 | 0.9 | 20.0 | |||||||
Sept 1, 2008 to Sept 30, 2008 | 37,123 | 27.17 | 1.0 | 19.0 | |||||||
Oct 1, 2008 to Oct 31, 2008 | — | — | — | — | |||||||
Nov 1, 2008 to Nov 30, 2008 | — | — | — | — | |||||||
Dec 1, 2008 to Dec 31, 2008 | — | — | — | — | |||||||
Total Repurchases | 396,716 | $ | 27.66 | $ | 11.0 | $ | 19.0 | ||||
| Shares Outstanding or Subject to Issuance(1) | ||||||||
| Shares Authorized(1) | August 23, 2004 | December 31, 2004 | December 31, 2005 | |||||
Common Stock Issued Pursuant to the Plan of Reorganization @ $0.01 par value | 9,800,000 | 9,800,000 | 9,800,000 | 9,800,000 | ||||
Held by Fleming pending distribution under the Plan: | 9,800,000 | 9,800,000 | 2,309,382 | |||||
Distributed: | — | — | 7,490,618 | |||||
| 9,800,000 | 9,800,000 | 9,800,000 | ||||||
Management & Director Incentive Plans: | ||||||||
Restricted Stock Grants under 2004 LTIP(2) | 15,375 | 15,375 | 8,542 | |||||
Restricted Stock Units under 2004 LTIP | 175,501 | 175,501 | 187,759 | |||||
sub-total | 200,000 | 190,876 | 190,876 | 196,301 | ||||
Options Granted under 2004 LTIP | 1,114,444 | 1,060,422 | 1,060,422 | 1,049,934 | ||||
Restricted Stock Units under 2005 LTIP | 171,315 | — | — | 153,455 | ||||
Options Granted under 2004 Director’s Equity Incentive Plan | 30,000 | 30,000 | 30,000 | 30,000 | ||||
Options Granted under 2005 Director’s Equity Incentive Plan | 15,000 | — | — | 15,000 | ||||
| 1,281,298 | 1,281,298 | 1,444,690 | ||||||
Tranche B Warrants | 247,654 | 247,654 | 247,654 | 247,654 | ||||
Class 6(b) Warrants | 990,616 | 990,616 | 990,616 | 990,616 | ||||
Subtotal Shares Issued or subject to issuance | 12,569,029 | |||||||
Balance of total shares authorized | 37,430,971 | |||||||
Totals | 50,000,000 | 12,319,568 | 12,319,568 | 12,482,960 | ||||
| (1) |
| (2) | Includes related transaction fees. |
| ITEM 6. | SELECTED FINANCIAL DATA |
The information in the Selected Financial Data table below reflects the Successor Company and Predecessor Company (as defined below) results of operations and financial condition of the following entities:
Core-Mark Holding Company, Inc., or Core-Mark, is the ultimate parent holding company for all of our operations, including Core-Mark International, Inc., or CMI, Head Distributing Company, Inc., or Head Distributing, Minter Weisman Company, or Minter Weisman, and a convenience distribution center located in Leitchfield, Kentucky.our wholly-owned subsidiaries.
On April 1, 2003 Fleming Companies, Inc. (Fleming), including its subsidiaries, filed for bankruptcy protection under Chapter 11 of the United States Bankruptcy Code. On July 27, 2004, the bankruptcy court confirmed Fleming’s Plan of Reorganization, or the Plan. The Plan provided for the reorganization of the debtors around CMI and its subsidiaries. On August 23, 2004 (Effective Date) the Plan was declared effective by the bankruptcy court and the Company emerged from the Fleming bankruptcy. In connection with the emergence from bankruptcy, Core-Mark implemented American Institute of Certified Public Accountants (AICPA) Statement of Position 90-7 (SOP 90-7)Financial Reporting by Entities in Reorganization Under the Bankruptcy Code. All financial information prior to August 23, 2004 is identified as relating to the Predecessor Company. All financial information after August 22, 2004 relates to the Successor Company(See Note 3—Summary of Significant Accounting Policies).
Basis of Presentation
The followingselected financial informationdata for periods prior to August 23, 2004 relates to the Predecessor Company (which was “Core-Mark International, Inc.” prior to emerging from bankruptcy in 2004) and financial informationdata for periods after August 23,22, 2004 relates to Core-Mark. In connection with the Successor Company.emergence from bankruptcy in 2004, Core-Mark implemented American Institute of Certified Public Accountants (AICPA)Statement of Position 90-7 (SOP 90-7) Financial Reporting by Entities in Reorganization Under the Bankruptcy Code.
The selected consolidated financial data of the Successor Company for the year ended December 31, 2005 and for the period August 23, 2004 through December 31, 2004, and of the Predecessor Company for the periods January 1, 2004 through August 22, 2004 and for the year ended December 31, 2003 as described below, reflect the consolidated results of operations, financial position, and cash flows of Core-Mark, CMI and its subsidiaries. However, the consolidated financial statements reflect the results of operations of Head Distributing only following its acquisition in April of 2002.
The selected consolidated financial data for the year end December 31,years 2008, 2007, 2006 and 2005 periods from August 23, 2004 through December 31, 2004, January 1, 2004 through August 22, 2004 and for the year ended December 31, 2003 are derived from Core-Mark’s audited consolidated financial statements included in thisour Annual ReportReports on Form 10-K. The financial information set forth below reflects the restatement of our financial statements for the period from August 23 through December 31, 2004 and as of December 31, 2004, as discussedunder Management’s Discussion and Analysis of Financial Condition and Results of Operations—Restatements of Financial Informationand Note 2 of the Notes to the Consolidated Financial Statements.
The following financial data should be read in conjunction with the consolidated financial statements and notes thereto, and withItem 2(b),7, Management’s Discussion and Analysis of Financial Condition and Results of Operations.
SELECTED CONSOLIDATED FINANCIAL DATA
| Successor Company | Predecessor Company | |||||||||||||||||||||
| Year ended December 31, 2005 | Period from 2004 | Period from January 1 through August 22, 2004 | Year ended December 31, | |||||||||||||||||||
(in millions except per share amounts) | 2003 | 2002 | 2001(a) | |||||||||||||||||||
Statement of Operations Data: | ||||||||||||||||||||||
Net sales(a) | $ | 4,891.1 | $ | 1,549.3 | $ | 2,673.1 | $ | 4,324.3 | $ | 4,662.1 | $ | 3,425.0 | ||||||||||
Gross profit(b) | 271.0 | 90.9 | 149.8 | 269.4 | 308.3 | 213.9 | ||||||||||||||||
Warehousing and distribution expenses | 135.7 | 42.6 | 78.7 | 130.2 | 131.8 | 92.6 | ||||||||||||||||
Selling, general and administrative expenses | 90.0 | 34.9 | 59.3 | 98.3 | 93.2 | 77.9 | ||||||||||||||||
Goodwill and other long-lived asset impairment(c) | — | — | — | 291.4 | — | — | ||||||||||||||||
Income (loss) from operations | 44.0 | 13.0 | 11.8 | (252.2 | ) | 79.8 | 44.2 | |||||||||||||||
Interest expense, net(d) | 10.0 | 4.8 | 4.4 | 5.4 | 8.2 | 11.1 | ||||||||||||||||
Reorganization items, net(e) | — | 0.8 | (70.0 | ) | 7.3 | — | — | |||||||||||||||
Income (loss) from continuing operations | 14.3 | 5.3 | 50.7 | (265.2 | ) | 39.5 | 17.5 | |||||||||||||||
Income (loss) from discontinued operations | — | — | — | (2.8 | ) | 0.3 | — | |||||||||||||||
Net income (loss) | 14.3 | 5.3 | 50.7 | (268.0 | ) | 39.8 | 17.5 | |||||||||||||||
Per Share Data(f): | ||||||||||||||||||||||
Basic income (loss) per common share: | ||||||||||||||||||||||
Continuing operations | $ | 1.46 | $ | 0.54 | $ | 5.17 | $ | (27.06 | ) | $ | 4.03 | $ | 1.79 | |||||||||
Discontinued operations | — | — | — | $ | (0.29 | ) | $ | 0.03 | $ | — | ||||||||||||
Net income (loss) | $ | 1.46 | $ | 0.54 | $ | 5.17 | $ | (27.35 | ) | $ | 4.06 | $ | 1.79 | |||||||||
Diluted income (loss) per common share: | ||||||||||||||||||||||
Continuing operations | $ | 1.37 | $ | 0.54 | $ | 5.17 | $ | (27.06 | ) | $ | 4.03 | $ | 1.79 | |||||||||
Discontinued operations | — | — | — | $ | (0.29 | ) | $ | 0.03 | $ | — | ||||||||||||
Net income (loss) | $ | 1.37 | $ | 0.54 | $ | 5.17 | $ | (27.35 | ) | $ | 4.06 | $ | 1.79 | |||||||||
Shares used to compute net income (loss) per share: | ||||||||||||||||||||||
Basic | 9.8 | 9.8 | 9.8 | 9.8 | 9.8 | 9.8 | ||||||||||||||||
Diluted | 10.5 | 9.8 | 9.8 | 9.8 | 9.8 | 9.8 | ||||||||||||||||
Other Financial Data: | — | |||||||||||||||||||||
Excise taxes(g) | $ | 1,195.0 | $ | 367.8 | $ | 643.5 | $ | 925.6 | $ | 825.7 | $ | 670.7 | ||||||||||
Cigarette inventory holding profits(h) | 5.7 | 1.1 | 0.2 | 7.2 | 9.8 | 5.8 | ||||||||||||||||
LIFO expense (income)(b) | 7.5 | 1.8 | 2.7 | (2.1 | ) | (16.7 | ) | 5.6 | ||||||||||||||
Depreciation and amortization(i) | 13.5 | 4.7 | 7.0 | 9.9 | 12.2 | 9.7 | ||||||||||||||||
Stock-based compensation | 4.0 | 0.9 | — | — | — | — | ||||||||||||||||
Capital expenditures | 7.8 | 5.7 | 6.4 | 8.4 | 5.5 | 7.9 | ||||||||||||||||
| December 31, | August 22, | December 31, | ||||||||||||||||||||
| 2005 | 2004 (Restated) | 2004 | 2003 | 2002 | 2001 | |||||||||||||||||
Balance Sheet Data | ||||||||||||||||||||||
Total assets | $ | 510.4 | $ | 504.2 | $ | 517.2 | $ | 513.8 | $ | 773.4 | $ | 390.1 | ||||||||||
Total debt, including current maturities(d) | 59.6 | 77.5 | 118.7 | — | — | 163.5 | ||||||||||||||||
| Core-Mark Holding Company, Inc. and Subsidiaries | Predecessor Company | |||||||||||||||||||
| Year ended December 31, | Period from August 23 through December 31, 2004 | Period from January 1 through August 22, 2004 | ||||||||||||||||||
(in millions, except per share amounts) | 2008(a) | 2007 | 2006(b) | 2005 | ||||||||||||||||
Statement of Operations Data: | ||||||||||||||||||||
Net sales | $ | 6,044.9 | $ | 5,560.9 | $ | 5,314.4 | $ | 4,891.1 | $ | 1,549.3 | $ | 2,673.1 | ||||||||
Gross profit | 359.1 | 332.6 | 297.7 | 271.0 | 90.9 | 149.8 | ||||||||||||||
Warehousing and distribution expenses | 197.6 | 174.1 | 151.1 | 135.7 | 42.6 | 78.7 | ||||||||||||||
Selling, general and administrative expenses | 129.4 | 119.0 | 106.6 | 90.0 | 34.9 | 59.3 | ||||||||||||||
Income from operations | 30.1 | 37.7 | 38.5 | 44.0 | 13.0 | 11.8 | ||||||||||||||
Interest expense, net(c) | 1.2 | 1.0 | 4.2 | 11.0 | 5.2 | 4.4 | ||||||||||||||
Reorganization items, net(d) | — | — | — | — | 0.8 | (70.0 | ) | |||||||||||||
Net income | 17.9 | 24.1 | 20.6 | 14.3 | 5.3 | 50.7 | ||||||||||||||
Per Share Data(e): | ||||||||||||||||||||
Basic income per common share | $ | 1.71 | $ | 2.30 | $ | 2.05 | $ | 1.46 | $ | 0.54 | $ | 5.17 | ||||||||
Diluted income per common share | $ | 1.64 | $ | 2.15 | $ | 1.87 | $ | 1.37 | $ | 0.54 | $ | 5.17 | ||||||||
Shares used to compute net income per share: | ||||||||||||||||||||
Basic | 10.5 | 10.5 | 10.0 | 9.8 | 9.8 | 9.8 | ||||||||||||||
Diluted | 10.9 | 11.2 | 11.0 | 10.5 | 9.8 | 9.8 | ||||||||||||||
Other Financial Data: | ||||||||||||||||||||
Excise taxes(f) | $ | 1,474.4 | $ | 1,349.4 | $ | 1,313.3 | $ | 1,195.0 | $ | 367.8 | $ | 643.5 | ||||||||
Cigarette inventory holding profits(g) | 3.1 | 7.3 | 4.1 | 5.7 | 1.1 | 0.2 | ||||||||||||||
LIFO expense | 11.0 | 13.1 | 2.9 | 7.5 | 1.8 | 2.7 | ||||||||||||||
Depreciation and amortization(h) | 17.4 | 14.9 | 13.2 | 12.5 | 4.3 | 7.0 | ||||||||||||||
Stock-based compensation | 3.9 | 5.3 | 4.4 | 4.0 | 0.9 | — | ||||||||||||||
Capital expenditures | 19.9 | 20.8 | 12.8 | 7.8 | 5.7 | 6.4 | ||||||||||||||
| December 31, | August 22, 2004 | |||||||||||||||||||
| 2008 | 2007 | 2006 | 2005 | 2004 | ||||||||||||||||
Balance Sheet Data: | ||||||||||||||||||||
Total assets | $ | 612.6 | $ | 577.1 | $ | 555.6 | $ | 510.4 | $ | 504.2 | $ | 517.2 | ||||||||
Total debt, including current maturities | 30.8 | 29.7 | 78.0 | 59.6 | 77.5 | 118.7 | ||||||||||||||
| (a) | The selected consolidated financial data for 2008 includes the |
| (b) |
| Interest expense, net, |
Reorganization items, net: |
and liabilities, a $66.1 million net gain on the discharge of pre-petition debt, and other bankruptcy related costs including professional and other fees of $1.9 million; and for the period from August 23 to December 31, 2004 includes primarily bankruptcy related professional fees. |
| For the Predecessor Company, basic net income |
| State and provincial |
| Cigarette inventory holding profits represent income related to cigarette and excise tax stamp inventories on hand at the time either cigarette manufacturers increase their prices or states increase their excise taxes, for which the Company is able to pass such increases on to its customers. This income is recorded as an offset to cost of goods sold and recognized as the inventory is sold. This income is not predictable and is dependent on inventory levels and the timing of manufacturer price increases or state excise tax increases. |
| Depreciation and amortization includes depreciation on property and equipment and amortization of purchased |
| ITEM 7. | MANAGEMENT’S DISCUSSION AND ANALYSIS OF FINANCIAL CONDITION AND RESULTS OF OPERATIONS |
The following is a discussion and analysis of Core-Mark’s business, critical accounting policies and its consolidatedfinancial condition, results of operations, and financial condition. Following an introduction and overview is an executive summary providing significant highlights of the operations and business initiatives. The critical accounting policies disclose certain accounting policies that are material to Core-Mark’s results of operations and financial condition for the periods presented. The discussion and analysis of Core-Mark’s results of operations is presented in two comparative sections, 2005 compared with 2004, and 2004 compared with 2003. Disclosures related to seasonality, liquidity and financial condition and contractual obligations and commitments complete management’s discussion and analysis. The information in this Management’s Discussion and Analysis contains certain forward-looking statements, which reflect our current view with respect to future events and financial performance. Any such forward looking statements are subject to risks and uncertainties that could cause our actual results of operations to differ materially from historical results or current expectations. (See Special Note Regarding Forward Looking Statement on page ii and Item 1—Business—Risk Factors beginning on page 5.) This discussion and analysiscapital resources should be read in conjunction with Core-Mark’sthe accompanying audited consolidated financial statements and related notes thereto.thereto that are included under Part II, Item 8, of this Form 10-K. Also refer to Special Note on “Forward Looking Statements,” which is included after Table of Contents in this Form 10-K.
OverviewOur Business
Core-Mark is one of the leading wholesale distributors to the convenience storeretail industry in North America in terms of annual sales, providingand provides sales and marketing, distribution and logistics services to customer locations across the United States and Canada. We operate a network of 2426 distribution centers (including two distribution facilities we operate as a third party logistics provider) in the United States and Canada, distributing a diverse line of national and private label convenience store products to approximately 19,00024,000 customer locations. The products we distribute include cigarettes, tobacco, candy, snacks, fast food, grocerygroceries, fresh products, dairy, non-alcoholic beverages, general merchandise, and health and beauty care products. We service a variety of store formats including traditional convenience stores, grocery stores, drug stores, liquor stores and other stores that carry convenience products.
We derive our net sales primarily from sales to convenience store customers. Our gross profit is derived primarily by applying a markup to the cost of the product at the time of the sale and from cost reductions derived from vendor credit term discounts received and other vendor incentive programs. Our operating expenses are comprised primarily of:of sales personnel costs; warehouse personnel costs related to receiving, stocking, and selecting product for delivery; delivery costs such as delivery personnel, truck leases and fuel; costs relating to the rental and maintenance of our facilities,facilities; and other general and administrative costs.
BackgroundOverview of 2008 Results
Core-Mark Holding Company, Inc.Net sales for 2008 increased 8.7% to $6.0 billion from $5.6 billion in 2007 driven by a 13.1% increase in our food/non-food sales and a 6.8% increase in our cigarette sales. Sales in both categories benefitted from the addition of our new Toronto and New England divisions which contributed slightly more than 50% of our sales growth. The balance of this increase was incorporateddriven by new customers, deeper sales penetration into existing stores and price inflation, partially offset by a slight decline in remaining cigarette cartons. Food, candy and other tobacco products were the fastest growing categories in the food/non-food product lines. Candy showed organic growth but also benefitted from manufacturer price increases over the past two years. Cigarette sales increased in absolute dollars compared to 2007 as a result of both price and excise tax increases and a 2.2% increase in overall cigarette carton sales, which includes sales from the two new divisions.
Excluding our new Toronto division, cigarette carton sales in Canada increased approximately 8.3% in 2008 driven by market share gains and sales from additional product lines. Excluding the recently acquired New England division, cigarette carton sales in the United States experienced a modest decline of 1.7% for 2008. This result was an improvement compared with the 2.7% decline in cigarette carton sales in the United States for 2007 compared to 2006. The year-over-year decrease in carton sales in the United States, after excluding carton sales from our New England division, appears to be driven primarily by a decline in overall consumer demand which we believe is influenced by, among other factors, manufacturer price and state tax increases and legislative actions to regulate where a consumer can smoke. We expect these factors to continue to adversely impact our cigarette carton sales, primarily in the U.S., for 2009. In addition, we expect our cigarette carton sales in the United States to be adversely impacted by the passage of the State Children’s Health Insurance Program (SCHIP). Effective April 1, 2009, federal cigarette excise taxes will increase from 39¢ to $1.01 per pack and manufacturers have passed along, or are expected to pass along, these taxes in their list prices charged to distributors.
We continue to monitor current macroeconomic conditions including consumer confidence and spending levels. We believe declines in consumer spending had a minor impact on August 20, 2004our sales in 2008. However, if
consumer spending declines further and/or the current declines persist for a prolonged period of time, our sales and gross profit may be materially and adversely impacted in 2009.
Gross profit for 2008 increased 8.0% to $359.1 million compared with $332.6 million in 2007. Included in gross profit for 2008 is a net refund of $1.4 million from the State of Texas related to the overpayment of taxes on Other Tobacco Products (OTP). Gross profit for 2007 includes a $13.3 million OTP tax refund from the State of Washington. Gross profit for 2008 increased $40.4 million, or 12.4%, compared with 2007, excluding the OTP tax refunds, cigarette holding gains and changes in LIFO reserves. This increase in gross profit for 2008 was driven primarily by a 12.1% increase in the food/non-food categories and incremental gross profit from the Toronto and New England divisions.
Operating expenses increased 11.6% to $329.0 million for 2008 compared with $294.9 million in 2007. Approximately 47% of this dollar increase was related to the addition of our New England and Toronto divisions, the latter of which is expected to leverage its operating expenses as the ultimate parent company for Core-Mark International, Inc., and Core-Mark International’s wholly owned subsidiaries pursuantthey continue to add new customers. The remaining increase of 6% is attributable to a plansignificant increase in health care and workers’ compensation costs stemming from higher medical costs as well as severity of reorganization,certain claims. In addition, more employees earned a bonus in 2008 since the Plan, following a bankruptcy petition as described below.results used to calculate bonuses for 2007 excluded the OTP tax refund, but included the $5.9 million bad debt expense. Inflation in fuel costs also contributed to the remaining increase in operating expenses, especially during the first seven months of 2008. Significant increases in the price of fuel could materially impact our financial results depending on the extent and timing of the increases and our ability to adjust our fuel surcharges accordingly. Our surcharge is generally set at the beginning of each quarter based on the average price of fuel for the previous quarter.
In June 2002, Fleming Companies, Inc., or Fleming, acquired Core-Mark International. After the acquisition, Core-Mark International’s management continuedOperating income was $30.1 million for 2008 compared with $37.7 million in 2007. Excluding cigarette holding gains, changes in LIFO reserves, and OTP tax refunds in both years, operating income increased 20.8% to operate Core-Mark International’s distribution business$36.6 million in 2008 from $30.3 million in 2007. Depreciation and began integrating Fleming’s convenience distribution centers into Core-Mark International’s operations.amortization increased to $17.4 million in 2008 from $14.9 million in 2007 resulting from investment in our new divisions and investment in our cold channel enhancements, and stock compensation expenses decreased from $5.3 million in 2007 to $3.9 million in 2008.
Business Developments
Asset Acquisitions in 2008 and 2006
On April 1, 2003 Fleming filed for protection under Chapter 11June 23, 2008, we acquired substantially all of the U.S. Bankruptcy Code.assets of Auburn Merchandise Distributors, Inc., (“AMD”) located in Whitinsville, Massachusetts, a wholly-owned subsidiary of Warren Equities, Inc., for approximately $28.7 million, including transaction costs. The debtor-in-possession entities comprising Core-Mark were includedassets purchased include primarily accounts receivable, inventory and fixed assets. AMD operates out of a 130,000 sq. ft. facility and conducts business primarily in the Chapter 11 proceedings as Core-Mark had guaranteed Fleming’s debt. The Plan, which became effective on August 23, 2004, provided for the reorganizationNortheastern region of the debtors around Core-Mark. Fleming’s other assetsUnited States. The AMD acquisition has expanded our presence and liabilities were transferred to two
special-purpose trusts, and its remaining direct and indirect subsidiaries have been dissolved or areinfrastructure in the process of being dissolved.
On August 23, 2004, Core-Mark emerged from the Fleming bankruptcy and reflected the termsNortheastern region of the Plan in its consolidated financial statements, applyingUnited States. The purchase price of approximately $28.7 million, including transaction costs, exceeded the terms of the American Institute of Certified Public Accountants Statement of Position 90-7 (SOP 90-7),Financial Reporting by Entities in Reorganization under the Bankruptcy Code with respect to financial reporting upon emergence from bankruptcy (fresh-start accounting).
Pursuant to fresh-start accounting rules, a new reporting entity, which we refer to as the Successor Company, was deemed to be created upon emergence from the Fleming bankruptcy and recorded amounts of assets and liabilities were adjusted to reflect their estimated fair values at the time of emergence based on management’s assessments which considered independent valuations where applicable. The effective date of Core-Mark’s emergence from bankruptcy was August 23, 2004. All financial information prior to August 23, 2004 is identified as relating to the Predecessor Company. All financial information after August 22, 2004 relates to the Successor Company.
Adjustments pursuant to fresh-start accounting to reflect the fair value of net assets acquired by approximately $0.9 million, which was recorded as goodwill. AMD conducts operations as the “New England” division of Core-Mark. Results of operations of AMD have been included in our consolidated statements of operations since the date of acquisition.
On June 19, 2006, we completed the purchase of substantially all the assets and certain liabilities of Klein Candy Co. L.P. (Pennsylvania Division), a full service distributor of tobacco and grocery items to convenience stores and other retail store formats in nine Eastern and mid-Western states, for approximately $58.3 million, including $0.7 million of direct transaction costs. We acquired Klein to help build a national distribution capacity. To fund the acquisition, we increased our borrowing under our Credit Facility by $57.6 million, but also increased our available borrowing capacity by $27.6 million as a result of the inclusion of the Klein assets in our borrowing base. Approximately 60 days subsequent to the acquisition, we established accounts payable credit
terms, including cigarette and tobacco taxes payable, of approximately $23.1 million related to the Pennsylvania division operations, which reduced the borrowings required as a result of the acquisition. In October 2006, we integrated the Pennsylvania division onto our proprietary DCMS platform(See Note 3—Acquisitions).
Share Repurchase Program
On March 12, 2008, our Board of Directors authorized a share repurchase program of up to $30.0 million to repurchase shares of our common stock in the open market or in privately negotiated transactions subject to market conditions. The number of shares to be repurchased and the timing of the purchases will be based on market conditions, our cash and liquidity requirements, relevant securities laws and other factors. The share repurchase program may be discontinued or amended at any time. We funded share repurchases during 2008, and plan to fund any future repurchases, from available cash. Our Credit Facility was amended to allow us to execute the share repurchase program. We repurchased 396,716 shares of common stock under the share repurchase program as of emergence fromDecember 31, 2008 at a total cost of $11.0 million.
Tobacco Tax Refunds Settlement Agreements
In November 2008, we entered into a settlement agreement with the Fleming bankruptcy amountedState of Texas Comptroller of Public Accounts related to $5.8 million in reorganization items, net. The adjustment was primarily attributable to ascribing value to intangible internally developed softwarea technical interpretation of $6.0 million, an increase to our deferred rent accrualthe State of $3.8 million, offset by charges for the re-valuation of other balance sheet items totaling $4.0 million, including inventory and accounts receivable. The restructuring of our capital structure and resulting discharge of pre-petition debtTexas’ Other Tobacco Products Tax Law, which resulted in a net gainrefund of $66.1$1.4 million. The charge for the revaluation of our assets and liabilities and the net gain on the discharge of pre-petition debt areThis refund, which was received in January 2009, was recorded in reorganization items, net in the consolidated statementsfourth quarter of operations(See Note 8—Reorganization Items, Net to the consolidated financial statements).
Trust Guarantees. Pursuant to the Plan, two special purpose trusts were established, the Post-Confirmation Trust (PCT), and the Reclamation Creditors’ Trust (RCT), which we refer to collectively2008 as the Trusts(See Off-Balance Sheet Arrangements in this Management’s Discussion and Analysis of Financial Condition and Results of Operations and Note 1—Summary Company Information and Emergence from Bankruptcy to the consolidated financial statements). We guaranteed payment obligations of the Trusts based on certain thresholds, in the event of the Trusts’ inability to pay eligible settlements. Financial Accounting Standards Board (FASB) Interpretation No. 45 (FIN 45),Guarantor’s Accounting and Disclosure Requirements for Guarantees, Including Indirect Guarantees of Indebtedness of Others, requires that an entity issuing a guarantee must recognize, at the inception of the guarantee, a liability equal to the fair value of the guarantee. Based on the estimates provided by the Trusts and our analysis prepared in accordance with FIN 45, we believe that (i) the guaranteed claims of the PCT are substantially below the guarantee threshold, and (ii) the assets of the RCT will be sufficient to satisfy the Trade Lien Vendor (TLV) and Non-Trade Lien Vendor (non-TLV) claims against it. No liability is believed to exist at this time with respect to these guarantees. However, if the assets of either Trust are insufficient to cover the liabilities of such Trust we could be required to satisfy the guarantees.
Critical Accounting Policies and Estimates
Management’s Discussion and Analysis of our Financial Condition and Results of Operations is based on our consolidated financial statements, which have been prepared in accordance with accounting principles generally accepted in the United States of America (GAAP). The preparation of our consolidated financial statements requires estimates and assumptions that affect the reported amounts of assets and liabilities as of the date of the financial statements and the reported amounts of net sales and expenses during the reporting period. The critical accounting polices used in the preparation of the consolidated financial statements are those that are important both to the presentation of financial condition and results of operations and require significant judgments with regards to estimates used and are more fully explained in Note 3—Summary of Significant Accounting Policies to our consolidated financial statements. On an ongoing basis, we evaluate our estimates,
including those related to accounts receivable and allowance for doubtful accounts, inventories, fresh-start valuations, intangible assets, trust guarantees, vendor allowances, income taxes, and self-insurance obligations. We base our estimates on historical experience and on various assumptions we believe are reasonable under the circumstances, the results of which form the basis for making judgments about the carrying value of assets and liabilities that are not readily apparent from other sources. We believe the current assumptions and other considerations used to estimate amounts reflected in our financial statements are appropriate; however, actual results could differ from these estimates.
The following is a summary of our most critical policies and estimates.
Inventories. Our U.S. inventories are valued at the lower of cost or market. Cost of goods sold is determined on a last-in, first-out (LIFO) basis using producer price indices as published by the U.S. Department of Labor. The producer price indices are applied to inventory which is grouped by merchandise having similar characteristics. Under LIFO, current costs of goods sold are matched against current sales. Historically, increases in the cost of products such as cigarettes and tobacco resulted from cost increases by the manufacturers and increases in federal and state excise taxes. During periods of rising prices, the LIFO method of costing inventories generally results in higher costs being charged against income (LIFO expense), while lower costs are retained in inventories. To the extent inventories or prices decline significantly at the end of any period where there have been increasing prices in previous periods, under LIFO some older and potentially lower priced inventory is considered as having been sold, resulting in a lower cost of goods sold compared to current prices, and increased current gross profit (LIFO income).
We reduce inventory value for spoiled, aged and unrecoverable inventory based on amounts on hand and historical experience.
Vendor Rebates and Allowances. Periodic payments from vendors in various forms and volume or other purchase discounts are reflected in the carrying value of the related inventory when earned and as cost of goods sold as the related merchandise is sold. Up-front consideration received from vendors linked to purchase or other commitments is initially deferred and amortized ratablyreduction to cost of goods sold or assold.
In April 2007, we entered into a settlement agreement with the performanceState of Washington Department of Revenue related to a technical interpretation of the activitiesState of Washington’s Other Tobacco Tax Law which specified bya refund of Other Tobacco Product (OTP) tax of approximately $13.3 million, representing 25% of the vendor to earnState of Washington OTP tax we paid for the fee is completed. Cooperative advertising rebates, slotting allowances, racking,periods of December 1991 through December 1996 and other promotional reimbursements from suppliers areMay 1998 through June 2005. This refund, which was received in July 2007, was recorded in the second quarter of 2007 as reductionsa reduction to cost of goods soldsold.
Expansion to Eastern Canada
In January 2008, we opened a new distribution facility near Toronto, Ontario. This new facility expanded our existing market geography in Canada. We signed a long-term supply agreement with Couche-Tard, a Canadian retailer that operates over 600 stores in the period the related promotional or merchandising programs were provided. Someprovince of Ontario. The total cost of the vendor allowances, rebatesfacility was approximately $9.6 million, including $1.8 million of start-up costs, of which approximately $1.0 million was expensed in 2008.
New Business and merchandising promotions require that we make assumptions and judgments regarding, for example, the likelihood of achieving market share levels or attaining specified levels of purchases. Vendor rebates and allowances are at the discretion of our vendors and can fluctuate due to changesSupply Agreement with MAPCO Express, Inc. in vendor strategies and market requirements.2008
Income Taxes. Income taxes are accounted for under the liability method in accordance with Statement of Financial Accounting Standards (SFAS) No. 109,Accounting for Income Taxes. Deferred tax assets and liabilities are recognized for the estimated future tax consequences attributable to differences between the financial statement carrying amounts of existing assets and liabilities and their respective tax bases and operating loss and tax credit carry-forwards. Deferred tax assets and liabilities are measured using enacted tax rates in effect for the year in which those temporary differences are expected to be recovered or settled. The effect on deferred tax assets and liabilities of a change in tax rates is recognized in income in the period that includes the enactment date. Deferred tax assets are reduced by a valuation allowance when management does not consider it more likely than not that some portion or all of the deferred tax assets will be realized.
For periods ending prior to emergence from bankruptcy, the Predecessor Company’s financial statements were prepared on a carve-out basis. For financial reporting purposes, the provision for income taxes was computed based on a stand-alone, separate-return basis. However, Core-Mark’s operating results were included in Fleming’s consolidated U.S. income tax return and consolidated, combined or unitary state income tax returns and in tax returns of the Canadian operations. Deferred tax asset and liability accounts were adjusted to their
realizable values in connection with fresh-start accounting. Prior to emergence the Company had a valuation allowance of $4.2 million, related primarily to limitations on net operating loss carry-forwards, which was utilized as part of the applicable fresh-start accounting tax adjustments. As ofOn December 31, 2005, the Company had2007, we signed a valuation allowanceSupply Agreement with MAPCO Express, Inc. (MAPCO) to serve their network of $1.9 million related to foreign tax credits, which will expire in 2014 and 2015.
Deferred tax assets and liabilities as adjusted at August 23, 2004 pursuant to the application of fresh-start accounting were based on our best estimate of the tax filing position that was probable of being accepted by the applicable taxing authorities. We have taken an alternative position in our tax returns. Based on this alternative tax filing position, we have taken deductions on our current period tax return that may be challenged by the taxing authorities. Although we believe that our tax filing position will more likely than not be sustained in the event of an examination by applicable taxing authorities and we would contest any proposed adjustment vigorously, the outcome of such matters can not be predicted with certainty. As such, we have accrued approximately $3.9 million in other tax liabilities on the accompanying December 31, 2005 consolidated balance sheet for this contingency.
Claim Liabilities and Insurance Recoverables. We maintain reserves related to health and welfare, workers compensation and auto liability programs that are principally self-insured. The reserves include an estimate of expected settlements on pending claims and a provision for claims incurred but not reported. These estimates are based on management’s assessment of potential liability which considered independent actuarial analyses or other acceptable methods using available information with respect to pending claims, historical experience and current cost trends. Claims activity, and resultant requirements, will fluctuate based on incurrence of claims and related health care costs required to satisfy these claims.
Pursuant to the Plan, on the Effective Date, we assumed approximately $29.5 million in net self-insurance obligations from Fleming related to workers compensation and auto liability programs based on management’s assessment of a third party actuarial valuation. These amounts were recorded in the reorganization adjustments as of August 23, 2004 and are included in accrued liabilities and claims liabilities.(See Note 4—Other Balance Sheet Accounts Detail to the consolidated financial statements).
Pension Liabilities. We maintain a frozen pension plan and post-retirement benefit plan for certain employees and former employees of CMI. Pursuant to the Plan, we maintain three pension plans for certain former Fleming employees. The pension costs and other post-retirement benefit costs charged to operations are determined based on management’s assessment, which considered annual valuations by an independent actuary. Included in the actuarial calculation are an assumed return on plan assets based on a weighted-average expected rate of return developed using historical returns for each major class of pension plan assets, and an assumed discount rate which approximates the rate at which benefits could be effectively settled as of the measurement date.
We select the assumed discount rate(s) for each benefit plan as the rate at which the benefits could be effectively settled as of the measurement date. In selecting an appropriate discount rate the we use a yield curve methodology, matching the expected benefits at each duration to the available high quality yields at that duration and calculating an equivalent yield, which is the ultimate discount rates used.(See Note 14—Employee Benefit Plans to the consolidated financial statements).
Stock-based Compensations.
We expense stock-based compensation using the fair value method as permitted by SFAS No. 123,Accounting for Stock-Based Compensation.The fair-value method requires the use of certain estimates and assumptions such as expected-life and volatility.
Computer Software Developed or Obtained for Internal Use.
We account for our propriety computer software, or DCMS system, in accordance with the American Institute of Certified Public Accountants (AICPA) Statement of Position No. 98-1,Accounting for the Costs of
Computer Software Developed or Obtained for Internal Use.The statement specifies certain criteria under which costs associated with this software are either expensed or capitalized and amortized.
Forward-Looking Trend and Other Information
Cigarette Consumption
The distribution of cigarettes currently represents a significant portion of our business. For the year ended December 31, 2005, approximately 72% of our revenues came from the distribution of cigarettes. During the same period, approximately 35% of our gross profit was generated from cigarettes.
Aggregate U.S. cigarette consumption has been in decline since 1980 and we expect this trend to continue. However, over the last decade our cigarette sales have benefited from a shift in sales to the convenience store segment. As a result of this shift, our cigarette sales have not declined in proportion to the decline in overall consumption. We anticipate that eventually the shift in cigarette carton sales to the convenience store segment will stabilize and cigarette sales through500 convenience stores will start to decline more in line with the overall decline in cigarette consumption.
We focus our marketing efforts primarily on our growing non-cigarette product sales. Non-cigarette products typically earn higher profit margins than cigarette sales and our goal is to continue to increase non-cigarette product sales in the future to offset the potential decline in cigarette revenues and gross profit.
Excise taxes on cigarettes are a significant component of our net sales and our cost of sales. For the year ended December 31, 2005, approximately 24% of our net sales and 26% of our cost of sales represented excise taxes. We anticipate that as states, localities and provinces impose increasingly higher excise taxes on cigarette sales they will become a larger component of8 Southeastern states. This new business relationship has strengthened our sales and our costoperations in the Southeastern United States.
Distribution Development by Imperial Tobacco of sales. IncreasesCanada in excise taxes result2006
The largest tobacco manufacturer in higherCanada, Imperial Tobacco Canada, sales prices per carton, but do not typically increase gross profit per carton. As a result, we anticipate that increases in excise taxes will tend to offset the effect of any decrease in carton sales on our revenues. However, increases in excise taxes generally would not increase our gross profit dollars, which would generally decline with declines in carton sales.
Cigarette Inventory Holding Profits
Distributors, such as Core-Mark, from time to time may earn higher gross profits on cigarette inventory and excise tax stamp quantities on hand due to increases in state and local taxes and cigarette manufacturer pricing. We refer to these profits as cigarette inventory holding profits. Over the past several years we have earned significant cigarette inventory holding profits. For example, cigarette inventory holding profits for the year ended December 31, 2005 were $5.7 million, or 2.1%whose products represented approximately 40% of our gross profit for the period. Cigarette inventory holding profits represent profit related to cigarette and excise tax stamp inventories on hand at the time either cigarette manufacturers increase their pricesCanadian revenues, or states, localities or provinces that allow such inventory holding profits increase their excise taxes. This profit is recorded as an offset to costapproximately 8% of goods sold and is recognized as the inventory is sold. It is difficult to predict whether cigarette holding profits will occur in the future since they are dependent on the actions of cigarette manufacturers and taxing authorities. SeeItem 6—Financial Information—(a) Selected Financial Information-Selected Consolidated Financial Data where we set forth cigarette holding profits for the periods presented.
Restatements
On March 23, 2006 the Audit Committee of the Board of Directors of the Company and management concluded that our audited consolidated financial statements as of December 31, 2004 and for the period from August 23, 2004 to December 31, 2004 and our unaudited condensed consolidated financial statements as of andtotal revenues, for the six months ended June 30, 2005, each included2006, commenced by-passing wholesale distributors when it began direct-to-store delivery of its products in our registration statement on Form 10, and our
unaudited condensed consolidated financial statements as of and for the three and nine months ended September 30, 2005 included in our Form 10-Q for the third quarter of 2005, should no longer be relied upon because of errors in those financial statements relating to the accounting of foreign currency translation adjustments related to intercompany balances. Specifically, we determined that foreign currency translation adjustments related to intercompany balances of our Canadian branch were incorrectly recorded as a component of comprehensive income directly to stockholders’ equity. These intercompany balances were incorrectly thought to be of a permanent nature. Because such intercompany balances post-emergence were not permanent in nature and were fluctuating throughout the period, the foreign exchange gains or losses should have been recorded as a gain (or loss) within the income statement. Accordingly, we are restating our financial statements for such periods to correct the above error and to correct the additional errors discussed below.
In connection with this restatement, we also corrected an approximately $0.4 million inventory undervaluation error (and a corresponding overstatement of cost of goods sold) in our financial statements for the period from August 23, 2004 through December 31, 2004 and a related $0.4 million overvaluation error (and a corresponding understatement of cost of goods sold) in our financial statements for the six months ended June 30, 2005 and for the nine months ended September 30, 2005. Additionally, our restatement reflects adjustments for the period from August 23, 2004 through December 31, 2004 to correct estimation errors and to correct errors in certain balance sheet classifications. The correction of the estimation errors2006. This resulted in a $0.1decline in our sales of approximately $253.9 million decrease in cost of goods sold and a $0.2 million decrease in selling, general and administrative expenses for the period from August 23, 2004 through December 31, 2004, and a corresponding $0.1 million increase in cost of goods sold and $0.2 million increase in selling, general and administrative expenses for the six months ended June 30, 2005 and nine months ended September 30, 2005. In addition, diluted earnings per share for the three months ended September 30, 2005 decreased from $0.092007 compared to $0.08 as a result of a change in the method of calculating diluted earnings per share. Previously, we calculate diluted earning per share by dividing net income expressed in millions by fully diluted shares.2006. As restated, we calculate diluted earnings per share by dividing net income expressed in dollars by fully diluted shares.
The correction of the error relating to the accounting of foreign currency translation adjustments had the effect of increasing (decreasing) income from continuing operations before taxes, net income and diluted earnings per share by $2.4 million, $1.5 million and $0.15, respectively for the period August 23 through December 31, 2004, by $(0.6) million, $(0.3) million and $(0.03), respectively, for the six months ended June 30, 2005, and by $(0.6) million, $(0.3) million and $(0.03), respectively, for the nine months ended September 30, 2005.
The aggregate effect of correcting the accounting errors described above was as follows:
For the period from August 23, 2004 through December 31, 2004, income from continuing operations before taxes increased by $3.1 million, net income after taxes increased by $1.9 million and diluted earnings per share increased $0.19. For the nine months ending September 30, 2005, income from continuing operations before taxes decreased $1.3 million, net income after taxes decreased $0.8 million and diluted earnings per share decreased $0.07. For the six months ending June 30, 2005, income from continuing operations before taxes decreased $1.3 million, net income after taxes decreased $0.8 million and diluted earnings per share decreased $0.06. There was no impact to income from continuing operations or net income for the three months ended September 30, 2005, however, diluted earnings per share decreased by $0.01 from $0.09 to $0.08 as a result of the change in the methodapplication of calculating diluted earnings per share.
The following table shows the impact of the restatementsurcharges or increased mark-ups on other products we distribute to our operating income and our net income in the relevant periods:
Effects of Restatement
| 2005 | 2004 | ||||||||||||||||||||||||
in millions, except per | Three months ended (Unaudited) | Nine months ended (Unaudited) | Six months ended (Unaudited) | Period from August 23 through December 31, 2004 | |||||||||||||||||||||
| As Reported | Restated | As Reported | Restated | As Reported | Restated | As Reported | Restated | ||||||||||||||||||
Income from continuing operations before income taxes | $ | 1.9 | $ | 1.9 | $ | 12.2 | $ | 10.9 | $ | 10.3 | $ | 9.0 | $ | 6.3 | $ | 9.4 | |||||||||
Net Income | 0.9 | 0.9 | 6.7 | 5.9 | 5.8 | 5.0 | 3.4 | 5.3 | |||||||||||||||||
Diluted income (loss) per common share | $ | 0.09 | $ | 0.08 | $ | 0.64 | $ | 0.57 | $ | 0.56 | $ | 0.50 | $ | 0.35 | $ | 0.54 | |||||||||
The financial information set forth below reflects the restatementCanadian customers, we believe we have recovered substantially all of our financial statements for the first three quarters of fiscal year 2005 and for the period from August 23 through December 31, 2004, as discussedunder Restatements of Financial Informationand Note 2 of the Notes to the Consolidated Financial Statements.
Executive Summary of Results of Operations
In June 2002, CMI was acquired by Fleming. After the consummation of the acquisition, Fleming began assigning the responsibility of managing Fleming’s seven convenience distribution centers, which we refer to as the Fleming Eastern Distribution Centers, to CMI’s management. The process of converting these distribution centers to CMI’s systems and management was under way by the end of the first quarter of 2003. On April 1, 2003, Fleming filed for Chapter 11 bankruptcy protection on behalf of itself and all of its subsidiaries, including CMI, which was a guarantor of Fleming’s indebtedness.
In the months following the bankruptcy filing, all of the convenience distribution operations were adversely impacted by Fleming’s use of cash flow generated from convenience operations to subsidize other corporate needs. Fleming was unable to make all of its vendor payments and product deliveries including those for the convenience operations. Additionally, as a result of the bankruptcy filing, vendor credit terms and state excise tax terms were reduced or ceased, and cash or deposit payments via wire transfers were required by significant vendors, further straining liquidity. During the early months of bankruptcy, CMI’s ability to fulfill customer orders decreased significantly and ultimately caused a loss of customers, primarily those serviced out of the Fleming Eastern Distribution Centers. The significant customer losseslost profits that resulted from Fleming’s inabilitythe decision of Imperial Tobacco. Although competition provides our Canadian customers choices,
thus far they have selected to satisfy its vendor paymentcontinue purchasing products and services from us despite our need to apply surcharges and other means of recouping lost profits from the sales of Imperial Tobacco products.
If other manufacturers were to take similar action and begin direct delivery of their products, our business would be adversely affected. However, to date we have had no indication that other manufacturers intend to do so. We believe that manufacturers may be less likely to make such a change since by using Core-Mark as a distributor the manufacturer leverages Core-Mark’s existing distribution network and shifts customer delivery obligations resultedcredit risk to us. Conversely, a decision to engage in direct distribution would require the closing of four Fleming Distribution Centers. In mid-2003, Fleming determined that the conveniencemanufacturer to invest in and bear those distribution operations were of value,costs and decided to attempt to preserve them. During mid-2003, sufficient liquidity for our operations was obtained through (i) a reduction of working capital requirements, (ii) the support of customers and vendors, (iii) private label merchandising proceeds, and (iv) insurance proceeds permitting us to keep the remaining distribution centers operating. The estimated impact of the bankruptcyextend credit to the net sales of the continuing entities that now comprise Core-Mark was approximately $800 million in lost annualized net sales with approximately $530 million of such lost sales attributable to the Eastern Distribution Centers. We measured the annualized losses by evaluating specific customer losses during the period April 1, 2003 through October 31, 2003 and annualizing the results.directly.
We have been successful in normalizing business operations since the fall of 2003, and we believe customer, vendor, and employee confidence has improved significantly since that time. On August 23, 2004,
Core-Mark emerged from bankruptcy as the sole surviving entity of the Fleming group of companies. In connection with the emergence from bankruptcy we were relieved of our pre-petition obligations to the Fleming creditors and our vendors. After our common stock is fully distributed pursuant to the Plan, and assuming all outstanding warrants and options are exercised, Fleming creditors will have been issued approximately 88% of the common stock of Core-Mark, management will have been issued approximately 10% and the Tranche B lenders, who provided debt financing in connection with our emergence from the Fleming bankruptcy, will have been issued approximately 2%.
Pursuant to the Plan, we entered into a three-year agreement with a group of lenders to provide a $250 million revolving credit facility, the 2004 Revolving Credit Facility. In addition, we entered into a $60 million five-year term facility consisting of notes and letters of credit, the Tranche B loan. Upon emergence from bankruptcy, we had $118.7 million in long-term debt on our balance sheet. As of December 31, 2005, we had repaid this debt.
On October 13, 2005 we entered into a new, five-year $250 million revolving credit facility, the 2005 Credit Facility, that refinanced and replaced the 2004 Revolving Credit Facility and the five-year Tranche B term facility, repaid all debt and replaced or cash-collateralized all $53.3 million in letters of credit outstanding under the prior agreements, and terminated those agreements. As of December 31, 2005, there were $59.6 million in revolving loans and $51.9 million in letters of credit outstanding under the 2005 Credit Facility.
Since our emergence from the Fleming bankruptcy, our trade accounts payable, including book overdrafts, increased from $35.5 million as of August 23, 2004 to $66.5 million as of December 31, 2005, reflecting resumption of pre-bankruptcy terms with the majority of our vendors. Due to changes in industry-wide credit terms, we do not expect to return to pre-bankruptcy trade accounts payable levels. From a liquidity standpoint, with the 2005 Credit Facility in place and the resumption of trade terms, along with cash generated from operations, we believe that we have adequate capital resources to meet our working capital, capital expenditure and other cash needs for at least the next 12 months (See Liquidity and Capital Resources section below).
Our business is highly competitive and our future success will continue to depend on our ability to deliver high volumes of product efficiently and accurately, making it easy for our customers to do business with us by helping them grow their business in a profitable manner and by providing sales and marketing, technology and merchandising services. Growing sales and further improving operational efficiencies in our Eastern Distribution Centers are two important objectives which will, if accomplished successfully, improve our profitability.
Results of Operations
For the purposesComparison of the periods presented2008 and 2007(1)
| 2008 Increase (Decrease) (in millions) | 2008 | 2007 | ||||||||||||||||||
| Amounts (in millions) | % of Net sales | % of Net sales, less excise taxes | Amounts (in millions) | % of Net sales | % of Net sales, less excise taxes | |||||||||||||||
Net sales | $ | 484.0 | $ | 6,044.9 | 100.0 | — | $ | 5,560.9 | 100.0 | — | ||||||||||
Net sales—Cigarettes | 261.7 | 4,124.8 | 68.2 | 60.7 | 3,863.1 | 69.5 | 62.4 | |||||||||||||
Net sales—Food/Non-food | 222.3 | 1,920.1 | 31.8 | 39.3 | 1,697.8 | 30.5 | 37.6 | |||||||||||||
Net sales, less excise taxes(2) | 359.0 | 4,570.5 | 75.6 | 100.0 | 4,211.5 | 75.7 | 100.0 | |||||||||||||
Gross profit | 26.5 | 359.1 | 5.9 | 7.9 | 332.6 | 6.0 | 7.9 | |||||||||||||
Warehousing and distribution expenses(3) | 23.5 | 197.6 | 3.3 | 4.3 | 174.1 | 3.1 | 4.1 | |||||||||||||
Selling, general and administrative expenses | 10.4 | 129.4 | 2.1 | 2.8 | 119.0 | 2.1 | 2.8 | |||||||||||||
Income from operations | (7.6 | ) | 30.1 | 0.5 | 0.7 | 37.7 | 0.7 | 0.9 | ||||||||||||
Interest expense | (0.2 | ) | 2.2 | — | 0.1 | 2.4 | — | 0.1 | ||||||||||||
Interest income | (0.4 | ) | (1.0 | ) | — | — | (1.4 | ) | — | — | ||||||||||
Foreign currency transaction losses (gains), net | 7.2 | 6.3 | 0.1 | 0.1 | (0.9 | ) | — | — | ||||||||||||
Income before income taxes | (15.0 | ) | 22.6 | 0.4 | 0.5 | 37.6 | 0.7 | 0.9 | ||||||||||||
Net income | (6.2 | ) | 17.9 | 0.3 | 0.4 | 24.1 | 0.4 | 0.6 | ||||||||||||
| (1) | Amounts and percentages have been rounded for presentation purposes and might differ from unrounded results. |
| (2) | Net sales, less excise taxes is a non-GAAP financial measure which we provide to separate the increase in sales due to actual sales growth and increases in excise taxes (See—Comparison of Sales and Gross Profit by Product Line, page 36). Increases in cigarette-related taxes and/or fees, excise taxes, drive prices higher on the cigarette products we sell which result in higher net sales without increasing gross profit dollars. Increases in excise taxes result in a decline in overall gross profit percentage since net sales increase and gross profit dollars remain the same. |
| (3) | Gross margins may not be comparable to those of other entities because warehouse and distribution expenses are not included as a component of cost of goods sold. |
Consolidated Net Sales. Net sales increased by $484.0 million, or 8.7%, to $6,044.9 million for 2008 from $5,560.9 million in Management’s Discussion and Analysis2007. The increase includes excise taxes of Financial Condition and Results of Operations, the results of the Successor Company for the period from August 23, 2004 through December 31, 2004$124.9 million. Excluding our new distribution facility in Toronto and the Predecessor Company for the period from January 1, 2004 through August 22, 2004 have been combined for convenience of discussion since separate discussions of the Predecessor and Successor periods would not be meaningful in terms of operating results or comparisons to other periods. When we refer to results for the year ended December 31, 2004 or 2004, we are referring to combined results.Due to fresh-start accounting applied with differing effect to the Predecessor and Successor Company periods, the combined 2004 results should not be taken as indicative of our historical results.
Comparison of the Years Ended December 31, 2005 and 2004
The following table sets forth the results of operations for the year ending December 31, 2005 and compares this to the combined results of operations for the periods August 23, 2004 through December 31, 2004 and January 1, 2004 through August 22, 2004. The comparative table is presented solely to complement management’s discussion and analysis of our results of operations. Excise taxes, which have been increasing at a rapid rate, represent a significant portion of net sales. The following table includes percentages ofrecently acquired New England division, net sales less excise taxes, in order to remove the impact such excise taxes have on the percentageincreased $227.6 million, or 4.1%, driven by net sales increases from existing and new customers.
Net Sales of net sales.
| (in millions) | 2005 Increases/ (Decreases) Successor and | Successor ended 2005 | 2005 % of Net | 2005 % of Net excise | Successor and (Restated) | Successor % of Net (Restated) | Successor (Restated) | Successor (Restated) | Predecessor Period from January 1 through August 22, 2004 | ||||||||||||||||||||
Net Sales | $ | 668.7 | $ | 4,891.1 | 100.0 | $ | 4,222.4 | 100.0 | $ | 1,549.3 | $ | 2,673.1 | |||||||||||||||||
Net sales—Cigarettes | 457.0 | 3,505.2 | 71.7 | 65.1 | 3,048.2 | 72.2 | 66.1 | 1,124.3 | 1,923.9 | ||||||||||||||||||||
Net sales—Food/Non-food | 211.7 | 1,385.9 | 28.3 | 34.9 | 1,174.2 | 27.8 | 33.9 | 425.0 | 749.2 | ||||||||||||||||||||
Net sales, less excise taxes | 485.0 | 3,696.1 | 75.6 | 100.0 | 3,211.1 | 76.1 | 100.0 | 1,181.5 | 2,029.6 | ||||||||||||||||||||
Gross profit | 30.3 | 271.0 | 5.5 | 7.3 | 240.7 | 5.7 | 7.5 | 90.9 | 149.8 | ||||||||||||||||||||
Warehousing and distribution expenses | 14.4 | 135.7 | 2.8 | 3.7 | 121.3 | 2.9 | 3.8 | 42.6 | 78.7 | ||||||||||||||||||||
Selling, general and administrative expenses | (4.2 | ) | 90.0 | 1.8 | 2.4 | 94.2 | 2.2 | 2.9 | 34.9 | 59.3 | |||||||||||||||||||
Income from operations | 19.2 | 44.0 | 0.9 | 1.2 | 24.8 | 0.6 | 0.8 | 13.0 | 11.8 | ||||||||||||||||||||
Interest expense, net | 0.8 | 10.0 | 0.2 | 0.3 | 9.2 | 0.2 | 0.3 | 4.8 | 4.4 | ||||||||||||||||||||
Foreign currency transaction (gains) losses, net | 3.3 | 0.9 | — | — | (2.4 | ) | (0.1 | ) | (0.1 | ) | (2.4 | ) | — | ||||||||||||||||
Loss on early extinguishment of debt | 6.2 | 6.2 | 0.1 | 0.2 | — | — | — | — | — | ||||||||||||||||||||
Reorganization items, net | 69.2 | — | — | — | (69.2 | ) | (1.6 | ) | (2.2 | ) | 0.8 | (70.0 | ) | ||||||||||||||||
Net income | (41.7 | ) | 14.3 | 0.3 | 0.4 | 56.0 | 1.3 | 1.7 | 5.3 | 50.7 | |||||||||||||||||||
Net salesCigarettes.. Net sales of $4,891.1 millioncigarettes for the year ended December 31, 20052008 increased $668.7$261.7 million, or 15.8%6.8%, compared to the year ended December 31, 2004. The 2005 sales included excise taxes of $1,195.0 million.$4,124.8 million from $3,863.1 million in 2007. The increase in net cigarette sales was driven by a 4.5% increase in the
average sales price per carton due primarily to the addition of three significant new customers, which we began servicing in the first quarter of 2005. These new customers represent approximately $455.5 million or 68.1% of the increase in net sales, inclusive ofmanufacturer price and state excise taxes. The remaining increase in net sales of $213.2 million was due to increases in net sales to existing customers, net increases due to other smaller customer additions and losses, the impact of cigarette tax increases and increasessales from our new distribution facilities in Toronto and New England, which also contributed to an approximate 2.2% increase in overall carton sales compared with 2007. Carton sales declined approximately 1.7% in the United States, excluding sales from our New England division, due primarily to overall lower consumer demand. Carton sales in Canada increased 19.6%, or 8.3%, excluding sales from our Canadian operations due to foreign currency translation changes. These increases were partially offset by the loss of two significant customers with annualized revenues of approximately $210 million.new Toronto division. The increase in carton sales in Canada was attributable primarily to market share gains and sales of additional product lines. Total net cigarette sales as a percentage of total net sales due to excise taxes was approximately $183.7 million in the year ended December 31, 2005 compared to the year ended December 31, 2004,68.2% for 2008 and is included in the increases described above. 69.5% for 2007.
Net sales from our Canadian operations increased overall by $69.2 million for the year ended December 31, 2005 compared to the year ended December 31, 2004, due primarily to an increaseSales of $68.8 million caused by changes in foreign currency translation rates. The strengthening of the Canadian dollar compared to the U.S. dollar resulted in U.S. dollar sales increases from our Canadian operations.
Net sales of cigarettes of $3,505.2 for the year ended December 31, 2005 increased $457.0 million, or 15.0% compared to the year ended December 31, 2004. The 2005 sales included excise taxes of $1,097.8 million. Of this increase, $329.7 million, or 72.1%, inclusive of excise taxes, was attributable to the addition of the three new customers in the first quarter of 2005. The remaining increase in cigarette sales was attributable in part to increases in state and provincial excise taxes that occurred during the periods, which we passed on to our customers. Several states and provinces increased cigarette taxes during 2004 and 2005 and these increases are reflected in our net sales of cigarettes. The increase in net sales of cigarettes due to cigarette excise taxes was approximately $171.0 million in the year ended December 31, 2005 compared to the year ended December 31, 2004 and is included in the increases described above. In the year ended December 31, 2005, cigarette carton sales increased by 10.2% compared to the year ended December 31, 2004. This increase was primarily attributable to the addition of the three significant new customers.
Food/Non-Food Products.Net sales of food and non-food products of $1,385.9 for the year ended December 31, 20052008 increased $211.7$222.3 million, or 18.0%13.1%, compared to $1,920.1 million from $1,697.8 million for 2007. The increase was due primarily to increases in our food, candy and other tobacco product categories driven by the year ended December 31, 2004. The 2005 foodCompany’s sales and non-food sales included excise taxesmarketing initiatives and the addition of $97.2 million, which consist primarily of excise taxes related to other non-cigarette tobacco products . Of the increase inour new Toronto and New England divisions. Total net sales of food and non-food products $125.8as a percentage of total net sales was 31.8% for 2008 compared to 30.5% for 2007.
Gross Profit.Gross profit represents the portion of sales remaining after deducting the cost of goods sold during the period. Vendor incentives, cigarette holding profits and changes in LIFO reserves are classified as elements of cost of goods sold. Gross profit in 2008 increased by $26.5 million, or 59.4%8.0%, inclusive of excise taxes, is attributable to the three new customers mentioned above. The remaining increase of $85.9$359.1 million or 40.6%, is due primarily to net increasesfrom $332.6 million in sales to existing customers and net sales increases due to other smaller customer additions and losses.2007.
Gross profit. Our gross profit is primarily comprised of two components: profits earned as a result of mark-ups to our customers and profits earned by participating in vendor discount and rebate programs, and other promotional and merchandising programs. Additionally, changes in our LIFO reserves impact gross profit. Gross profit for the year ended December 31, 2005 was $271.0 million an increase of $30.3 million, or 12.6%, compared to $240.7 million for the year ended December 31, 2004. The increase was primarily caused by an increase in sales volume and the impact of cigarette inventory holding profits related to state cigarette tax increases and manufacturer price increases. As a percent of sales less excise taxes, gross profit decreased from 7.5% for the year ended December 31, 2004 to 7.3% for the year ended December 31, 2005.
The following table sets forth notableprovides the components comprising the change in gross profit as a percentage of net sales year over year.for 2008 and 2007(1):
| (in millions) | Successor Year ended December 31, 2005 |
% of Net sales | 2005 % of Net | Successor and Combined Year ended (Restated) | Combined 2004 % of Net (Restated) | Combined (Restated) | ||||||||||||||||||||||||||||||||||
| 2008 | 2007 | |||||||||||||||||||||||||||||||||||||||
| Amounts (in millions) | % of Net sales | % of Net sales, less excise taxes | Amounts (in millions) | % of Net sales | % of Net sales, less excise taxes | |||||||||||||||||||||||||||||||||||
Net sales | $ | 4,891.1 | 100.0 | $ | 4,222.4 | 100.0 | $ | 6,044.9 | 100.0 | % | — | $ | 5,560.9 | 100.0 | % | — | ||||||||||||||||||||||||
Net sales, less excise taxes | 3,696.1 | 75.6 | 100.0 | 3,211.1 | 76.1 | 100.0 | ||||||||||||||||||||||||||||||||||
LIFO income (expense) | (7.5 | ) | (0.15 | ) | (0.20 | ) | (4.5 | ) | (0.11 | ) | (0.14 | ) | ||||||||||||||||||||||||||||
Net sales, less excise taxes(2) | 4,570.5 | 75.6 | 100.0 | % | 4,211.5 | 75.7 | 100.0 | % | ||||||||||||||||||||||||||||||||
Components of gross profit: | ||||||||||||||||||||||||||||||||||||||||
OTP tax refunds(3) | 1.4 | 0.02 | 0.03 | 13.3 | 0.24 | 0.32 | ||||||||||||||||||||||||||||||||||
LIFO expense | (11.0 | ) | (0.18 | ) | (0.24 | ) | (13.1 | ) | (0.24 | ) | (0.31 | ) | ||||||||||||||||||||||||||||
Cigarette inventory holding profits | 5.7 | 0.12 | 0.15 | 1.3 | 0.03 | 0.04 | 3.1 | 0.05 | 0.07 | 7.3 | 0.13 | 0.17 | ||||||||||||||||||||||||||||
Credit terms withheld | — | — | — | (3.5 | ) | (0.08 | ) | (0.11 | ) | |||||||||||||||||||||||||||||||
Remaining gross profit | 272.8 | 5.57 | 7.38 | 247.4 | 5.86 | 7.70 | 365.6 | 6.05 | 8.00 | 325.1 | 5.85 | 7.72 | ||||||||||||||||||||||||||||
Gross profit | $ | 271.0 | 5.54 | 7.33 | $ | 240.7 | 5.70 | 7.49 | $ | 359.1 | 5.94 | % | 7.86 | % | $ | 332.6 | 5.98 | % | 7.90 | % | ||||||||||||||||||||
Several factors impacted gross profit margins period over period. The decrease in gross profit as
| (1) | Amounts and percentages have been rounded for presentation purposes and might differ from unrounded results. |
| (2) | Net sales, less excise taxes is a non-GAAP financial measure which we provide to separate the increase in sales due to actual sales growth and increases in excise taxes (See—Comparison of Sales and Gross Profit by Product Line, page 36). Increases in cigarette-related taxes and/or fees, excise taxes, drive prices higher on the cigarette products we sell which result in higher net sales generally without increasing gross profit dollars. Increases in excise taxes result in a decline in overall gross profit percentage since net sales increase and gross profit dollars remain the same. |
| (3) | We received OTP (Other Tobacco Products) tax refunds from the State of Texas of $1.4 million in 2008, and from the State of Washington of $13.3 million in 2007. |
As a percentage of net sales, our remaining gross profit improved to 6.05% for 2008 compared to 5.85% for 2007. Our remaining gross profit percentage for cigarettes declined approximately 5 basis points for 2008 to 2.56% compared with 2.61% in 2007. This decline was attributabledue primarily to inflation in product cost from increases in excise taxes. Our remaining cigarette gross profit increased 2.4% on a cents per carton basis. Remaining gross profit related to our food/non-food category increased approximately 32 basis points for 2008 to 13.53% compared with 13.21% in 2007. Excluding our new divisions, Toronto and New England, remaining gross profit
for food/non-food category increased 47 basis points to 13.68% in 2008 compared with 2007. The increase in remaining gross profit percentage was due primarily to a reductionhigher percentage of sales from higher margin food/non-food products combined with an increase in rebatesinventory holding gains related to candy, somewhat offset by an increase in inventory shrinkage and allowances received from our vendors, lower margins earned on sales to the three new significant customers added in early 2005 and increases in cigarette and tobacco excise taxes. Effective with the Fleming bankruptcy filing, two major cigarette manufacturers in Canada withdrew their credit terms discounts which are included as a componentaddition of costnational chain store customers.
In 2008, approximately 71.0% of goods sold. This resulted in lost cigarette gross profit totaling approximately $3.5 million for the year ended December 31, 2004was derived from food/non-food products compared to 2005. The credit terms discounts and related gross profit were restored69.5% in late August 2004, after emergence from bankruptcy, resulting in increased gross profit in 2005 compared to 2004. Other rebates and allowances declined during2007, including the year ended December 31, 2005 compared toimpact of the year ended December 31, 2004. Cigarette gross profit for the year ended December 31, 2005 included approximately $5.7 million in cigarette inventory holding profits relating to cigarette exciseOTP tax increases and manufacturer price increases, compared to $1.3 million in cigarette inventory holding profits for the year ended December 31, 2004.refunds.
Operating expensesExpenses. Our operating expenses include costs related to warehousing, distribution, and selling, general and administrative activities. For the year ended December 31, 2005,In 2008, operating expenses increased $11.1$34.1 million, or 5.1%11.6%, to $227.0$329.0 million from $215.9$294.9 million in 2007. Included in operating expenses for the year ended December 31, 2004. Overall, costs2007 was a bad debt charge of $5.9 million related to labortwo customers and benefits comprised approximately 66%a workers’ compensation benefit of warehousing,$3.1 million related to favorable claims experience prior to 2007. Excluding these two items, operating expenses increased $36.9 million, or 12.6%, for 2008. This increase in operating expenses was driven primarily by a 13.5% increase in warehouse and distribution expenses and an 8.7% increase in selling, general and administrative expenses for the year ended December 31, 2005. A significantexpenses. As a percentage of our labor costs are variablesales, total operating expenses were 5.4% in nature and fluctuate relative to our sales volume.2008 compared with 5.3% in 2007.
Warehousing and distribution expensesDistribution Expenses. Warehousing and distribution expenses increased $23.5 million, or 13.5%, to $197.6 million in 2008 from $174.1 million in 2007. The increase in warehousing and distribution expenses was due primarily to increases in sales volume, the addition of our Toronto and New England divisions which represented 48.9% of the increase, sales growth and related operational inefficiencies at two of our divisions which accounted for 24.8% of the year ended December 31, 2005increase, higher fuel costs, net of surcharges, which represented 7.0% of the increase, and an increase in facility and truck rental expense due primarily to investment in additional capacity in certain locations to support our growth in key markets. As a percentage of sales, warehousing and distribution expenses were 3.3% for 2008 as compared to 3.1% for 2007.
Selling, General and Administrative (“SG&A”) Expenses.SG&A expenses increased $10.4 million, or 8.7%, to $129.4 million in 2008 from $119.0 million in 2007. SG&A expenses were impacted in 2007 by a $5.9 million bad debt charge related to two customers that filed for bankruptcy protection and a workers’ compensation benefit of $3.1 million related to favorable claims experience prior to 2007. Excluding these two items, SG&A expenses increased by $14.4$13.2 million, or 11.9%11.4%, comparedin 2008. The increase for 2008 is due primarily to higher employee benefit costs driven by increases in healthcare and workers’ compensation costs due to a higher wage base, increased medical costs, as well as an increase in the severity of certain claims, the addition of the Toronto and New England divisions, and lower bonus last year ended December 31, 2004.as a result of fewer employees qualifying. As a percentage of net sales, less excise taxes, theseSG&A expenses were 2.1% for both 2008 and 2007.
Interest Expense. Interest expense includes both debt interest and amortization of fees related to borrowings. For 2008, interest expense decreased by $0.2 million, or 8.3%, to $2.2 million from 3.8% for the year ended December 31, 2004 to 3.7% for the year ended December 31, 2005.$2.4 million in 2007. The decrease as a percent of net sales, less excise taxes for the year ended December 31, 2005 isin interest expense was due primarily to cost improvements generated throughlower interest rates during 2008 compared to 2007. Average borrowings for 2008 were $21.1 million compared to $19.8 million for 2007. During 2008, the re-engineeringweighted average interest rate on the revolving credit facility was 3.8% compared to 6.7% in 2007. The decline in interest rates is the result of three of our distribution centers.general decreases in rates charged to us on both prime and LIBOR borrowings.
Selling, general and administrative expensesInterest Income.. Selling, general and administrative expenses for the year ended December 31, 2005 decreased by $4.2 In 2008 interest income was $1.0 million or 4.5%, compared to the year ended December 31, 2004. As a percentage of net sales, less excise taxes, these expenses decreased$1.4 million for 2007. Interest income is derived from 2.9%our earnings on cash balances kept in trust, checking accounts and overnight deposits. The interest income was lower for the year ended December 31, 20042008 due primarily to 2.4% for the year ended December 31, 2005. Expense reductions at three of our distribution centers significantly contributed to this decrease. In 2005, we benefited from a reduction in workers’ compensation, general and auto insurance liabilities resulting in expense reductions totaling $8.5 million. The selling, general and administrative expenses were negatively impacted by costs such as audit, legal and audit-
related consulting totaling approximately $6.5 million for the year ended December 31, 2005 and an increase of $4.7 million compared to the year ended December 31, 2004, incurred primarily in connection with becoming a public company. Also we had unanticipated recoveries related primarily to insurance and receivable-related recoveries totaling approximately $3.9 million. Additionally, we incurred expenses of approximately $0.9 million for the year ended December 31, 2005, compared to $0.3 million for the year ended December 31, 2004, associated with our ongoing initiative to prepare for compliance with regulations under the Sarbanes Oxley Act of 2002.
Income from operations. Income from operations for the year ended December 31, 2005 was $44.0 million compared to $24.8 million for the year ended December 31, 2004. The increase is attributable to the items discussed above.prevailing interest rates.
Interest expense,Foreign Currency Transaction Losses (Gains), net. Interest expense for the year ended December 31, 2005 increased by $0.8 million, or 8.7%, compared to the year ended December 31, 2004. For the year ended December 31, 2005, the effective interest rate and average net borrowings, including letters of credit outstanding, were higher than for the year ended December 31, 2004. The higher effective interest rate for 2005 was in part due to higher interest rates charged under our Tranche B borrowings that was established at emergence on August 23, 2004. As a result of the refinancing of both the Tranche B borrowings and our 2004 revolver debt in October 2005, effective interest rates declined significantly to 8.1% for the fourth quarter of 2005 from 9.0% for the first three quarters of 2005. The Company’s LIBOR margin decreased from 12% under the Tranche B Notes and a range of 2.25% to 2.75% under the 2004 Revolving Credit Facility to a range of 1.00% to 1.75% under the 2005 Revolving Credit Facility. Interest expense for the period January 1, 2004 through August 22, 2004 was imputed as required under carve-out accounting during which time that the Company had inter-company borrowings with Fleming.
Foreign currency transaction (gains) losses, net. We incurred foreign currency transaction losses of $6.3 million in 2008 compared to $0.9 million for the year ended December 31, 2005, compared to $2.4 million in foreign currency transaction gains for the year ended December 31, 2004, or an increase in expense of $3.3 million compared to the year ended December 31, 2004.2007. The increase in expensefluctuation was due primarily to intercompany activity related to our Canadian operations and changes inthe depreciation of the Canadian foreign exchange rates.
Lossrate against the US dollar over the last six months of 2008 on early extinguishment of debt. The loss on early extinguishment of debt of $6.2 million incurred in 2005transactions between our Canadian and U.S. operations. For 2008 the average Canadian/United States exchange rate was recorded in connection with prepayment penalties and the write-off of debt discount and issuance costs associated with the early retirement of the funded portion of the 2004 Revolving Credit Facility and Tranche B Note Agreement.
Reorganization items, net. Reorganization items, net$1.0676 compared to $1.0735 for the year ended December 31, 2004 represents expenses we incurred as a result of the Fleming bankruptcy and adjustments related to fresh-start accounting. The application of fresh-start accounting in connection with our emergence from the Fleming bankruptcy on August 23, 2004 resulted in a $5.8 million upward adjustment to reflect the fair value of assets and liabilities as of such date and a net gain of $66.1 million relating to the discharge of pre-petition debt. Additionally, we incurred legal, consulting and other professional costs in connection with the Fleming bankruptcy which were included in reorganization items, net for 2004. No reorganization items were incurred in the year ended December 31, 2005.2007.
Income Taxes.Our effective tax rate was 20.8% for 2008 compared to 35.9% for 2007 (See Note 10—Income Taxes for a reconciliation of the differences between the federal statutory tax rate and the effective tax rate). Included in the provision for income taxes for 2008 was a $3.2 million benefit related primarily to the expiration of the statute of limitations for uncertain tax positions and changes to prior year’s estimates, and $0.1 million of penalties net of after-tax interest credit related to unrecognized tax benefits recorded under FIN 48.
Comparison of the Years Ended December 31, 20042007 and 20032006(1)
The following table sets forth the combined results of operations for the periods August 23, 2004 through December 31, 2004 and January 1, 2004 through August 22, 2004, and compares them to the year ended December 31, 2003. The comparative table is presented solely to complement management’s discussion and analysis of our results of operations.
| (in millions) | Successor (Restated) | Successor (Restated) |
2004 sales (Restated) | Combined % of Net (Restated) | Successor (Restated) | Predecessor Period from January 1 through August 22, 2004 | Predecessor Year ended December 31, 2003 | 2003 % of Net sales | 2003 excise taxes | |||||||||||||||||||||||
Net sales | $ | (101.9 | ) | $ | 4,222.4 | 100.0 | $ | 1,549.3 | $ | 2,673.1 | $ | 4,324.3 | 100.0 | |||||||||||||||||||
Net sales—Cigarettes | (1.6 | ) | 3,048.2 | 72.2 | 66.1 | 1,124.3 | 1,923.9 | 3,049.8 | 70.5 | 64.8 | ||||||||||||||||||||||
Net sales—Food/Non-food | (100.3 | ) | 1,174.2 | 27.8 | 33.9 | 425.0 | 749.2 | 1,274.5 | 29.5 | 35.2 | ||||||||||||||||||||||
Net sales, less excise taxes | (187.6 | ) | 3,211.1 | 76.1 | 100.0 | 1,181.5 | 2,029.6 | 3,398.7 | 78.6 | 100.0 | ||||||||||||||||||||||
Gross profit | (28.7 | ) | 240.7 | 5.7 | 7.5 | 90.9 | 149.8 | 269.4 | 6.2 | 7.9 | ||||||||||||||||||||||
Warehousing and distribution expenses | (8.9 | ) | 121.3 | 2.9 | 3.8 | 42.6 | 78.7 | 130.2 | 3.0 | 3.8 | ||||||||||||||||||||||
Selling, general and administrative expenses | (4.1 | ) | 94.2 | 2.2 | 2.9 | 34.9 | 59.3 | 98.3 | 2.3 | 2.9 | ||||||||||||||||||||||
Goodwill and other long-lived asset impairment | (291.4 | ) | — | — | — | — | — | 291.4 | 6.7 | 8.5 | ||||||||||||||||||||||
Income (loss) from operations | 277.0 | 24.8 | 0.6 | 0.8 | 13.0 | 11.8 | (252.2 | ) | (5.8 | ) | (7.4 | ) | ||||||||||||||||||||
Interest expense, net | 3.8 | 9.2 | 0.2 | 0.3 | 4.8 | 4.4 | 5.4 | 0.1 | 0.2 | |||||||||||||||||||||||
Foreign currency transaction (gains) losses, net | (2.4 | ) | (2.4 | ) | (0.1 | ) | (0.1 | ) | (2.4 | ) | — | — | — | — | ||||||||||||||||||
Reorganization items, net | (76.5 | ) | (69.2 | ) | (1.6 | ) | (2.2 | ) | 0.8 | (70.0 | ) | 7.3 | 0.2 | 0.2 | ||||||||||||||||||
Income (loss) from discontinued operations | 2.8 | — | — | — | — | — | (2.8 | ) | (0.1 | ) | (0.1 | ) | ||||||||||||||||||||
Net income (loss) | 324.0 | 56.0 | 1.3 | 1.7 | 5.3 | 50.7 | (268.0 | ) | (6.2 | ) | (7.8 | ) | ||||||||||||||||||||
| 2007 Increase (Decrease) (in millions) | 2007 | 2006 | ||||||||||||||||||
| Amounts (in millions) | % of Net sales | % of Net sales, less excise taxes | Amounts (in millions) | % of Net sales | % of Net sales, less excise taxes | |||||||||||||||
Net sales | $ | 246.5 | $ | 5,560.9 | 100.0 | — | $ | 5,314.4 | 100.0 | |||||||||||
Net sales—Cigarettes | 79.3 | 3,863.1 | 69.5 | 62.4 | 3,783.8 | 71.2 | 64.4 | |||||||||||||
Net sales—Food/Non-food | 167.2 | 1,697.8 | 30.5 | 37.6 | 1,530.6 | 28.8 | 35.6 | |||||||||||||
Net sales, less excise taxes(2) | 210.4 | 4,211.5 | 75.7 | 100.0 | 4,001.1 | 75.3 | 100.0 | |||||||||||||
Gross profit | 34.9 | 332.6 | 6.0 | 7.9 | 297.7 | 5.6 | 7.4 | |||||||||||||
Warehousing and distribution expenses(3) | 23.0 | 174.1 | 3.1 | 4.1 | 151.1 | 2.8 | 3.8 | |||||||||||||
Selling, general and administrative expenses | 12.4 | 119.0 | 2.1 | 2.8 | 106.6 | 2.0 | 2.7 | |||||||||||||
Income from operations | (0.8 | ) | 37.7 | 0.7 | 0.9 | 38.5 | 0.7 | 1.0 | ||||||||||||
Interest expense | (2.9 | ) | 2.4 | — | 0.1 | 5.3 | 0.1 | 0.1 | ||||||||||||
Interest income | 0.3 | (1.4 | ) | — | — | (1.1 | ) | — | — | |||||||||||
Foreign currency transaction (gains) losses, net | 1.2 | (0.9 | ) | — | — | 0.3 | — | — | ||||||||||||
Income before income taxes | 3.6 | 37.6 | 0.7 | 0.9 | 34.0 | 0.6 | 0.8 | |||||||||||||
Net income | 3.5 | 24.1 | 0.4 | 0.6 | 20.6 | 0.4 | 0.5 | |||||||||||||
| (1) | Amounts and percentages have been rounded for presentation purposes and might differ from unrounded results. |
| (2) | Net sales, less excise taxes is a non-GAAP financial measure which we provide to separate the increase in sales due to actual sales growth and increases in excise taxes (See—Comparison of Sales and Gross Profit by Product Line, page 36). Increases in cigarette-related taxes and/or fees, excise taxes, drive prices higher on the cigarette products we sell which result in higher net sales without increasing gross profit dollars. Increases in excise taxes result in a decline in overall gross profit percentage since net sales increase and gross profit dollars remain the same. |
| (3) | Gross margins may not be comparable to those of other entities because warehouse and distribution expenses are not included as a component of cost of goods sold. |
Consolidated Net Sales.Net sales increased by $246.5 million, or 4.6%, to $5,560.9 million in 2007 from $5,314.4 million in 2006. The increase is due primarily to $231.9 million of incremental sales from our Pennsylvania division which we acquired in June 2006, and net sales increases of $268.5 million to existing and new customers offset by lost sales of $253.9 million due to Imperial Tobacco’s move to direct-to-store delivery. Increases in our overall Canadian operations net sales due to foreign currency exchange rate changes were approximately $40.9 million for 2007 compared to $59.1 million for 2006.
Net salesSales of Cigarettes.. Net sales of $4,222.4 millioncigarettes for the year ended December 31, 2004 decreased $101.92007 increased $79.3 million, or 2.4%2.1%, compared to $3,863.1 million from $3,783.8 million in 2006. The increase in net cigarette sales was driven by a 3.6% increase in the year ended December 31, 2003. The 2004average sales included excise taxes of $1,011.3 million. The decrease wasprice per carton due primarily to customer losses resulting from Fleming’s Chapter 11 filing.manufacturer price and state excise tax increases, offset by a 1.4% decrease in overall carton sales compared to 2006. The former Fleming Eastern Distribution Centers were significantly impacted by the bankruptcy, and experienced an aggregate netdecrease in cigarette carton sales decline of approximately $193.0 millionwas due primarily to the loss of customers. These distribution centers had fewer stable, long-term relationships within their customer base than was the case in our other distribution centers. This decrease was significantlyImperial Tobacco volume described above offset by increases inincremental sales from the Pennsylvania division.
Adjusting for these items, remaining carton sales declined 2.1% for 2007. Total net cigarette sales as a percentage of total net sales in the remaining distribution centers. were 69.5% for 2007 and 71.2% for 2006.
Net Sales of Food/Non-Food Products.Net sales of food and non-food products for 2007 increased $167.2 million, or 10.9%, to $1,697.8 million from our Canadian operations increased overall by $85.2$1,530.6 million in 2004 compared2006. The increase was due primarily to 2003,higher sales to existing and new customers driven by the Company’s sales and marketing initiatives, and incremental sales from the Pennsylvania division. Total net sales of food and non-food products as a percentage of total net sales were 30.5% for 2007 and 28.8% for 2006.
Gross Profit.Gross profit represents the portion of sales remaining after deducting the cost of goods sold during the period. Vendor incentives, cigarette holding profits and changes in LIFO reserves are classified as elements of cost of goods sold. Gross profit in 2007 increased by $34.9 million, or 11.7%, to $332.6 million from $297.7 million in 2006. The increase in gross profit dollars for 2007 was due primarily to an overall increase in sales volume, the State of Washington OTP tax refund of $13.3 million recorded as a reduction to cost of goods sold, and an increase in cigarette inventory holding profits of $3.2 million, partially offset by an increase of $63.9 million caused by changes in foreign currency translation rates. The strengthening of the Canadian dollar compared to the U.S. dollar resulted in U.S. dollar sales increases. Excluding the impact of the Eastern Distribution Centers and foreign currency translation, overall sales increased by approximately $27 million. The inability to attract new customers during bankruptcy significantly impacted our ability to grow net sales.
Net sales of cigarettes decreased $1.6 million, or less than 1%, in 2004 compared to 2003. The 2004 sales included excise taxes of $926.9 million. The decrease in net sales was caused by a decline in cigarette sales at the former Fleming Eastern Distribution Centers of $118.5 million which was largely offset by increases in cigarette sales by our other distribution centers of $116.9 million. During 2004, cigarette carton sales volume declined by 1.7% due primarily to lost business as a result of the bankruptcy. Although cigarette carton volume declined by 1.7%, the decline in net cigarette sales of only 0.1% was due to increases in cigarette manufacturer prices and state and provincial excise taxes, which were passed on to our customers and reflected in net sales as well as the impact of foreign currency translation.
Net sales of food products and non-food products decreased $100.3 million, or 7.9%, in 2004 compared with 2003. The 2004 sales included excise taxes of $84.4 million. Of this decrease, $74.5 million was attributable to the former Fleming Eastern Distribution Centers and $25.8 million was attributable to the remaining distribution centers. The decrease in food and non-food sales was due to the loss of customers and our inability to attract new customers while in bankruptcy.
Gross profit. Gross profit decreased by $28.7$10.2 million in 2004 compared with 2003.LIFO expense.
The following table sets forth notableprovides the components comprising the change in gross profit as a percentage of net sales year over year.for 2007 and 2006(1):
| (in millions) | Successor and Year ended (Restated) | Combined 2004 % of Net sales (Restated) | Combined 2004 % of Net sales, less (Restated) | Predecessor Year ended | 2003 % of Net | 2003 % of Net sales, less | ||||||||||||||
Net sales | $ | 4,222.4 | 100.0 | $ | 4,324.3 | 100.0 | ||||||||||||||
Net sales, less excise taxes | 3,211.1 | 76.1 | 100.0 | 3,398.7 | 78.6 | 100.0 | ||||||||||||||
Private label merchandising proceeds | — | — | — | 6.0 | 0.14 | 0.18 | ||||||||||||||
LIFO income (expense) | (4.5 | ) | (0.11 | ) | (0.14 | ) | 2.1 | 0.05 | 0.06 | |||||||||||
Cigarette inventory holding profits | 1.3 | 0.03 | 0.04 | 7.2 | 0.17 | 0.21 | ||||||||||||||
Credit terms withheld | (3.5 | ) | (0.08 | ) | (0.11 | ) | (4.7 | ) | (0.11 | ) | (0.14 | ) | ||||||||
Remaining gross profit | 247.4 | 5.86 | 7.70 | 258.8 | 5.98 | 7.62 | ||||||||||||||
Gross Profit | $ | 240.7 | 5.70 | 7.49 | $ | 269.4 | 6.23 | 7.93 | ||||||||||||
| 2007 | 2006 | |||||||||||||||||||
| Amounts (in millions) | % of Net sales | % of Net sales, less excise taxes | Amounts (in millions) | % of Net sales | % of Net sales, less excise taxes | |||||||||||||||
Net sales | $ | 5,560.9 | 100.0 | % | — | $ | 5,314.4 | 100.0 | % | — | ||||||||||
Net sales, less excise taxes(2) | 4,211.5 | 75.7 | 100.0 | % | 4,001.1 | 75.3 | 100.0 | % | ||||||||||||
Components of gross profit: | ||||||||||||||||||||
State of Washington OTP tax refund | 13.3 | 0.24 | 0.32 | — | — | — | ||||||||||||||
LIFO expense | (13.1 | ) | (0.24 | ) | (0.31 | ) | (2.9 | ) | (0.06 | ) | (0.07 | ) | ||||||||
Cigarette inventory holding profits | 7.3 | 0.13 | 0.17 | 4.1 | 0.08 | 0.10 | ||||||||||||||
Remaining gross profit | 325.1 | 5.85 | 7.72 | 296.5 | 5.58 | 7.41 | ||||||||||||||
Gross profit | $ | 332.6 | 5.98 | % | 7.90 | % | $ | 297.7 | 5.60 | % | 7.44 | % | ||||||||
| (1) | Amounts and percentages have been rounded for presentation purposes and might differ from unrounded results. |
| (2) | Net sales, less excise taxes is a non-GAAP financial measure which we provide to separate the increase in sales due to actual sales growth and increases in excise taxes (See—Comparison of Sales and Gross Profit by Product Line, page 36). Increases in cigarette-related taxes and/or fees, excise taxes, drive prices higher on the cigarette products we sell which result in higher net sales generally without increasing gross profit dollars. Increases in excise taxes result in a decline in overall gross profit percentage since net sales increase and gross profit dollars remain the same. |
As a percentage of net sales, our remaining gross profit declined in 2004 asimproved to 5.85% for 2007 compared to 2003 due5.58% for 2006. Our remaining gross profit percentage for cigarettes increased approximately 7 basis points for 2007 to the decline2.61% compared with 2.54% in 2006. Our remaining cigarette gross profit increased 6.4% on a cents per carton basis. Remaining gross profit related to our food/non-food category increased approximately 13 basis points for 2007 to 13.21% compared with 13.08% in 2006.
As a percentage of net sales, gross profit increased to approximately 6.0% for 2007 from lost customers and lost vendor discounts resulting5.6% for 2006. In 2007, approximately 69.5% of gross profit was derived from food/non-food products, including the Fleming bankruptcy. Additionally, a $6.6State of Washington OTP tax refund benefit of $13.3 million, increasecompared to 66.9% in LIFO2006.
expense, the non-recurrence in 2004 of $6.0 million in income related to private label merchandising income earned in 2003 and a $5.9 million decrease in cigarette inventory holding gains in 2004 compared to 2003 related to cigarette tax and manufacturer price increases in 2003, contributed to the decline. Core-Mark had LIFO expense of $4.5 million in 2004 compared to LIFO income of $2.1 million in 2003 which was primarily the result of inflation in the confection product category. During 2003, we recorded cigarette inventory holding profits of approximately $7.2 million as a result of cigarette tax and manufacturer price increases compared to $1.3 million in 2004. In addition, effective with the bankruptcy, two major cigarette manufacturers in Canada withheld their credit terms discounts, resulting in a reduction in gross profit of $3.5 million in 2004 and $4.7 million in 2003.
Operating Expenses.Our operating expenses include costs related to warehousing, distribution, and selling, general and administrative activities. Overall, costsIn 2007, operating expenses increased $35.7 million, or 13.8%, to $294.9 million from $259.2 million in 2006. Included in operating expenses for 2007 was a charge of $5.9 million related to laboran increase in our allowance for doubtful accounts for two customers who declared bankruptcy in the fourth quarter of 2007, and benefits comprised approximately 63%a workers’ compensation benefit of warehousing, distribution and selling, general and administrative$3.1 million related to favorable claims experience prior to 2007. Excluding these two items, operating expenses for the year ended December 31, 2004. A significantincreased $32.9 million, or 12.7%, in 2007 as compared to 2006. As a percentage of our labor costs are variablesales, total operating expenses were 5.3% in nature and fluctuate relative to our sales volume.
Warehousing and distribution2007 compared with 4.9% in 2006. The increase in operating expenses. The decline in warehousing and distribution expense of $8.9 million in 2004 from 2003 was due primarily to a decline in salaries and benefits by approximately $7.3 million, in connection with the decline in sales volume and increased efficiencies in the Eastern Distribution Centers. Staff reductions were required as a resultpercentage of the decline in sales volume due primarily to the bankruptcy. During the same period, we were also refining the operations in the Eastern Distribution Centers by incorporating available technology and proven methodologies.
Selling, general and administrative expenses. The decline in selling, general and administrative expenses of $4.1 million in 2004 from 2003 was due in part to a reduction in sales personnel in our Eastern Distribution Centers. This was in response to the lost business described above and contributed to a decrease in selling expenses of $1.9 million. In addition, general and other administrative expenses at our Eastern Distribution Centers were reduced in 2004 compared to 2003 by $2.5 million, due primarily to salary and benefit reductions required due to the lost business. Slight increases overall in selling, general, and administrative expenses at our other distribution centers and corporate offices explain the difference.
Goodwill and other long-lived asset impairment. In connection with the Fleming bankruptcy filing in 2003, we evaluated our goodwill and long-lived intangible assets for potential impairment. As a result we recorded an impairment charge to write-off goodwill and long-lived intangible assets in accordance with SFAS 142. This charge was $291.4 million in total and is reflected in our 2003 statement of operations. After such charge, there was no remaining goodwill or intangible long-lived assets and no charge was required in 2004.
Income (loss) from operations. Income from operations for 2004 was $24.8 million compared to a loss from operations of $252.2 million for 2003, an increase of $277.0 million, primarily attributable to the write-off of goodwill and long-lived assets during 2003. After eliminating the impact of the $291.4 million charge, the decrease to $24.8 million in 2004 from $39.2 million in 2003 is primarily attributable to lost business, which was driven by the bankruptcy and our inability to secure full vendor discounts, coupled with rising inventory costs under the LIFO method.
Interest expense, net. Interest expense increased by $3.8 million in 2004 from 2003 due primarily to an increase in warehousing and distribution expenses which were 3.1% of sales in 2007 compared to 2.8% in 2006 and to the effective borrowing rates under our 2004 Revolving Credit Facilityreduction in sales related to the loss of Imperial Tobacco volume.
Warehousing and term loanDistribution Expenses.Warehousing and distribution expenses increased debt levels required upon emergenceby $23.0 million, or 15.2%, to $174.1 million in 2007 from bankruptcy. Interest expense for 2003$151.1 million in 2006. The increase in warehousing and distribution expenses was estimated as partdue primarily to the addition of carve-out accounting, becausethe Pennsylvania division in June 2006, an increase in sales volume, higher salaries and benefits and an increase in facility rent expense. The increase in salaries and benefits was driven primarily by tight labor market conditions at five of our divisions. Rent expense increased due primarily to investment in additional leased capacity in certain locations to support our growth in key markets. Additionally, included in warehousing and distribution costs in 2007 was approximately $0.2 million of start up costs related party borrowings withto our former parent, Fleming.new Toronto facility which became operational in 2008. As a percentage of sales, these expenses were 3.1% for 2007 as compared to 2.8% for 2006.
Foreign currency transaction gains (losses)Selling, General and Administrative (“SG&A”) Expenses.SG&A expenses increased $12.4 million, or 11.6%, net. Foreign currency transaction gainsto $119.0 million in 2007 from $106.6 million in 2006. The increase in SG&A expenses was due primarily to incremental expenses from our Pennsylvania division which we acquired in June 2006, an increase in the allowance for the year ended December 31, 2004 were $2.4doubtful accounts of $5.9 million comparedrelated to $0.0two customers, and severance expense due to organizational changes in Canada amounting to $0.6 million, offset by a workers’ compensation benefit of $3.1 million related to favorable claims experience for the year ended December 31, 2003. There were no such gains or losses prior years. Additionally, included in SG&A expenses for 2007 is approximately $0.6 million of start up costs related to our emergencenew Toronto facility which became operational in 2008. SG&A expenses for 2006 include a benefit of $3.8 million of workers’ compensation costs resulting from the Fleming bankruptcy because we considered our foreign investments (in Canada) to bea favorable settlement of a permanent nature prior to emergence. Post-emergence, such
intercompany balances fluctuated with sufficient frequency to record the foreign exchange gains or losses as a gain (or loss) within the income statement.
Reorganization items, net. Reorganization items, net represents expenses we incurred as a result of the Chapter 11 bankruptcy and adjustments related to fresh-start accounting. In 2004, the application of fresh-start accounting resulted in a net $5.8 million increase in assets to reflect the fair value of assets and liabilities and a net gain of $66.1 million relating to the discharge of pre-petition debt. Additionally, in 2004,amounts owed by us for claims inherited in connection with the reorganization,Fleming bankruptcy, and the favorable settlement of vendors’ payables and previously written-off customer’s receivables totaling $1.6 million. Additionally in 2006, we incurred $2.7received a $1.6 million benefit in insurance proceeds related to a fire at our Denver distribution center in 2002. These benefits in 2006 were offset by incremental costs of other bankruptcy related costs, including professional fees. The charges in 2003 consisted primarily of professional fees and other cost$1.0 million incurred in connection with the Fleming bankruptcy. (integration of the Pennsylvania division, and $0.6 million of closure and consolidation costs for the Victoria/Vancouver Facility in Canada. As a percentage of net sales, SG&A expenses were 2.1% for 2007 compared to 2.0% for 2006.
See Note 8—Reorganization Items, NetInterest Expense.Interest expense includes both debt interest and amortization of fees related to borrowings. For 2007, interest expense decreased by $2.9 million, or 54.7%, to $2.4 million from $5.3 million in 2006. The decrease in interest expense was due primarily to lower average borrowings during 2007 compared to 2006, partially offset by a higher average interest rate. The average borrowings for 2007 were $19.8 million compared to $60.7 million for 2006. During 2007, the weighted average interest rate on the revolving credit facility was 6.7% compared to 6.5% for the same period in 2006.
Interest Income.In 2007 interest income was $1.4 million compared to $1.1 million for 2006. Our interest income is derived from earnings on cash balances kept in trust, checking accounts and overnight deposits.
Foreign Currency Transaction (Gains) Losses, net. We incurred foreign currency transaction gains of $0.9 million in 2007 compared to $0.3 million in losses in 2006. The fluctuation was due primarily to the consolidated financial statements)appreciation of the Canadian foreign exchange rate against the US dollar in 2007 on transactions between our Canadian and U.S. operations. For 2007 the average Canadian/United States exchange rate was $1.0735 compared to $1.1343 for 2006.
Income Taxes.Our effective tax rate was 35.9% for 2007 compared to 39.4% for 2006 (SeeNote 10— Income Taxes for a reconciliation of the differences between the federal statutory tax rate and the effective tax rate). Included in the provision for income taxes for 2007 was $1.4 million of after-tax interest related to the underpayment of income taxes in 2004 and 2005, and to unrecognized tax benefits under FIN 48. The underpayment of income taxes in 2004 and 2005 was due primarily to the misapplication of a tax position we adopted upon emergence from bankruptcy in 2004. The provision for income taxes also included a $2.1 million benefit, inclusive of $0.4 million of after tax interest, related primarily to corrections to our tax liability reserves associated with unitary taxes and other bankruptcy related costs, and to the expiration of the statute of limitations for certain tax positions included in our unrecognized tax benefits as of December 31, 2007.
Income (loss) from discontinued operations. Income (loss) from discontinued operations included the revenuesComparison of Sales and expenses associated with the discontinuation of our Adel, Georgia distribution center, which took place in January 2004. The Adel distribution center was closed due to the loss of customers as a result of the Fleming bankruptcy.Gross Profit by Product Line
Seasonality
Quarterly operating results can be affected by seasonality due to the nature ofThe following table summarizes our customers’ businesses. Specifically, we typically generate higher revenuescigarette and other product sales, LIFO expense, gross profits during the warm weather travel months (May through August) thanprofit and other relevant financial data for 2008, 2007 and 2006 (dollars in other times throughout the year. Each period may have many elements that affect sales. For example, in 2005 our net new customer sales occurred primarily in the second through fourth quarters of the year. The seasonal trends are illustrated by the following table:millions)(1):
| % of Full Year Sales by Quarter | ||||||||
| March 31 | June 30 | September 30 | December 31 | |||||
2005 | 22.1 | 25.9 | 27.3 | 24.7 | ||||
2004 | 22.9 | 25.3 | 26.7 | 25.1 | ||||
2003 | 25.4 | 26.3 | 25.4 | 22.9 | ||||
2002 | 21.6 | 24.9 | 29.1 | 24.4 | ||||
2001 | 22.0 | 25.7 | 26.4 | 25.9 | ||||
2000 | 23.8 | 25.4 | 25.8 | 25.0 | ||||
1999 | 22.2 | 24.9 | 26.8 | 26.1 | ||||
1998 | 22.7 | 24.6 | 26.6 | 26.1 | ||||
1998 – 2005 average sales | 22.8 | 25.4 | 26.8 | 25.0 | ||||
1998 – 2005 average sales(1) | 22.4 | 25.2 | 27.0 | 25.4 | ||||
| 2008 | 2007 | 2006 | ||||||||||
Cigarettes | ||||||||||||
Net sales | $ | 4,124.8 | $ | 3,863.1 | $ | 3,783.8 | ||||||
Excise Taxes in Net Sales | $ | 1,350.9 | $ | 1,237.2 | $ | 1,209.0 | ||||||
Net Sales, less excise taxes(2) | $ | 2,773.9 | $ | 2,625.9 | $ | 2,574.8 | ||||||
LIFO expense | $ | 4.7 | $ | 6.7 | $ | 1.7 | ||||||
Remaining Gross Profit(3) | $ | 105.7 | $ | 100.9 | $ | 96.2 | ||||||
Remaining Gross Profit % | 2.56 | % | 2.61 | % | 2.54 | % | ||||||
Gross Profit(4) | $ | 104.1 | $ | 101.5 | $ | 98.5 | ||||||
Gross Profit % | 2.52 | % | 2.63 | % | 2.61 | % | ||||||
Gross Profit % less excise taxes | 3.75 | % | 3.87 | % | 3.83 | % | ||||||
Food/Non-Food Products | ||||||||||||
Net sales | $ | 1,920.1 | $ | 1,697.8 | $ | 1,530.6 | ||||||
Excise Taxes in Net Sales | $ | 123.5 | $ | 112.2 | $ | 104.3 | ||||||
Net sales, less excise taxes(2) | $ | 1,796.6 | $ | 1,585.6 | $ | 1,426.3 | ||||||
LIFO expense | $ | 6.3 | $ | 6.4 | $ | 1.2 | ||||||
Remaining Gross Profit(3) | $ | 259.9 | $ | 224.2 | $ | 200.3 | ||||||
Remaining Gross Profit % | 13.53 | % | 13.21 | % | 13.08 | % | ||||||
Gross Profit(5) | $ | 255.0 | $ | 231.1 | $ | 199.2 | ||||||
Gross Profit % | 13.28 | % | 13.61 | % | 13.01 | % | ||||||
Gross Profit % less excise taxes | 14.19 | % | 14.57 | % | 13.96 | % | ||||||
Totals | ||||||||||||
Total Net Sales | $ | 6,044.9 | $ | 5,560.9 | $ | 5,314.4 | ||||||
Total Excise Taxes in Net Sales | $ | 1,474.4 | $ | 1,349.4 | $ | 1,313.3 | ||||||
Total Net Sales, less excise taxes(2) | $ | 4,570.5 | $ | 4,211.5 | $ | 4,001.1 | ||||||
LIFO expense | $ | 11.0 | $ | 13.1 | $ | 2.9 | ||||||
Remaining Gross Profit(3) | $ | 365.6 | $ | 325.1 | $ | 296.5 | ||||||
Remaining Gross Profit % | 6.05 | % | 5.85 | % | 5.58 | % | ||||||
Gross Profit(4) (5) | $ | 359.1 | $ | 332.6 | $ | 297.7 | ||||||
Gross Profit % | 5.94 | % | 5.98 | % | 5.60 | % | ||||||
Gross Profit % less excise taxes | 7.86 | % | 7.90 | % | 7.44 | % | ||||||
| (1) |
| (2) | Net sales, less excise taxes is a non-GAAP financial measure which we provide to separate the increase in sales due to actual sales growth and increases in excise taxes. Increases in cigarette-related taxes and/or fees, |
excise taxes, drive prices higher on the cigarette products we sell which result in higher net sales generally without increasing gross profit dollars. Increases in excise taxes result in a decline in overall gross profit percentage since net sales increase and gross profit dollars remain the same. |
| (3) | Remaining gross profit is a non-GAAP financial measure which we provide to segregate the effects of LIFO expense, cigarette inventory holding profits and other major non-recurring items, such as OTP tax refunds, that significantly affect the comparability of gross profit. |
| (4) | Cigarettes gross profit includes (i) cigarette inventory holding profits related to manufacturer price increases and increases in excise taxes and (ii) LIFO expense. Cigarette holding profits for the years 2008, 2007 and 2006 were |
| (5) | Food/Non-Food gross profit includes (i) increases in excise taxes and (ii) LIFO expense. In addition, included in Food/Non-Food gross profit for 2008 is the State of Texas OTP net tax refund of $1.4 million, and for 2007 the State of Washington OTP tax refund of $13.3 million, both of which were recorded as |
Inflation
Historically, we have not experienced a significant adverse impact as a result of price increases from our suppliers as we have been able to adjust our selling prices in order to maintain our overall gross profit dollars. However, significant increases in cigarette product costs and cigarette excise taxes adversely impact our gross profit margin percentages. Inflation can also result in increases in LIFO expense, adversely impacting our gross profit margins. Increases inas a percentage of net sales of cigarettes driven by tax and manufacturer price increases do not generate significant recurring additional gross profit dollars, thereby deflating gross profit margin percentages in this category.because we are paid on a per carton basis. While we have historically been able to maintain or slightly increase gross profit dollars related to such increases, gross profit margin percentages typically decline as a result of the impact of significant price or tax increases have on net cigarette sales. GrossInversely, we have generally benefitted from price increases on the net sales of food/non-food categories because we generally mark up product costs using a percentage of cost of goods sold.
Inflation can also result in increases in LIFO expense, adversely impacting our gross profit percentage (See Note 2—Summary of Significant Accounting Policies).
Our fuel costs represent a significant portion of our operating expenses. Fuel consumption costs for the year ended December 31, 20052008 totaled approximately $9.9$9.4 million, net of fuel surcharges passed on to customers, which represented an increase of approximately $3.2$2.4 million, or 34.3%, from 2004,$7.0 million in 2007 due primarily to increased fuel prices and to a lesser extent to miles driven, and the addition of our Toronto and New England divisions. For 2007, our fuel consumption costs were $7.0 million, net of fuel surcharges passed on to customers, which represented an increase of approximately $0.5 million, or 48%7.7%, from $6.5 million in 2006 due to increased fuel
prices, miles driven and increased sales volume. A significant portion these costs were offset by fuel surchargesthe addition of $4.6 million which are included in our customer pricing. In 2004, gross fuel costs were $6.7 million which included fuel surcharges of $3.2 million. The ability to continue to pass through price increases, either from manufacturers or costs incurred in the business, including labor and fuel costs, is not assured.Pennsylvania division.
Liquidity and Capital Resources
Our cash and cash equivalents as of December 31, 2008 were $15.7 million compared to $21.3 million as of December 31, 2007. Our restricted cash as of December 31, 2008 was $11.4 million as compared to $11.5 million for 2007. Restricted cash primarily represents funds that have been set aside in trust as required by one of the Canadian provincial taxing authorities to secure amounts payable for cigarette and tobacco excise taxes.
Our liquidity requirements arise primarily from the funding of our working capital, capital expenditure programsexpenditures and debt service requirements with respect toof our credit facilities. We have historically funded our capitalliquidity requirements through our current operations and external borrowings. HoweverOur cash flow from operating activities provided $55.6 million in 2008 and at the end of 2008 we had $186.0 million of borrowing capacity available in our revolving credit facility.
During the current downturn in global financial markets some companies have experienced difficulties drawing on lines of credit, issuing debt and raising capital generally, which have had a material adverse impact on their liquidity. Based on our anticipated cash needs, availability under our revolving credit facility and the
scheduled maturity of our debt, we expect that our current liquidity, notwithstanding these adverse market conditions, will be sufficient to meet all of our anticipated needs during the period June 18, 2002 to August 23, 2004, when Fleming was our parent company, to the extent necessary, we funded our operations through inter-company borrowings.next twelve months.
Our cash as of December 31, 2005 and 2004 was $30.0 million and $26.2 million, respectively. Our restricted cash as of December 31, 2005 and 2004 was $10.8 million and $12.1 million, respectively. Restricted cash represents funds that have been set aside in trust as required by Canadian provincial taxing authorities to secure amounts payable to these authorities for cigarette and tobacco excise taxes.(See—Statement of Cash Flows to the consolidated financial statements.)flows from operating activities
Year ended December 31, 20052008
Cash flows from operating activities
For the year ended December 31, 2005, netNet cash provided by operating activities was $35.2decreased by $11.0 million and consisted of cash generated from operations of $41.6to $55.6 million and cash used as a result of changes in assets and liabilities of $6.4 million. Cash generated from operations includes net income of $14.3for 2008 compared with $66.6 million coupled with the benefit of non-cash charges for depreciation and amortization, and the change in our LIFO inventory allowance.
2007. The decrease in net cash from changes in assets and liabilitiesflows provided by operations was due primarily to ana $7.0 million decrease in net income adjusted for non-cash activity such as depreciation, amortization, LIFO expense, and foreign currency transaction losses, coupled with a $4.0 million decrease in working capital due primarily to the addition of our Toronto and New England divisions and higher cigarette inventories to capitalize on buying opportunities.
Year ended December 31, 2007
Net cash provided by operating activities increased by $29.1 million to $66.6 million for 2007 compared with $37.5 million for 2006. The increase in inventories of $19.5net cash flow provided by operations was due primarily to a $16.1 million a decrease in pension, claims and other accrued liabilities and income taxes of $13.9 million, offset by decreases in other receivables of $8.3 million, and an increase in net income adjusted for non-cash activity such as depreciation, amortization and LIFO expense and a $13.0 million net increase in cash provided by working capital. The increase from working capital was largely driven by cigarette and tobacco taxes payable which generated $20.0 million in cash through the re-establishment of $13.6 million. Thecredit terms in several states with the largest impact coming from the State of California.
Cash flows from investing activities
Year ended December 31, 2008
Net cash used in investing activities increased by $25.8 million to $49.1 million for 2008 from $23.3 million in 2007. This increase in inventories was due primarily to incremental confection inventoriesthe acquisition of AMD. We paid approximately $28.0 million which consisted primarily of purchased accounts receivable, inventory and fixed assets, offset by approximately $1.6 million of cash received in December 2005the acquisition. Capital expenditures were $19.9 million in connection2008 compared with manufacturer promotions and increases in other inventory categories$20.8 million for 2007. Capital expenditures for 2008 related to increased sales volume in 2005. The decrease in pension, claims, and other accrued liabilities is due primarily to general, auto,the completion of our new Toronto distribution facility and workers compensation claims settlements, reducing the claim amounts outstanding during the year. The decrease in other receivables during the period was primarily the result of the collection of vendor receivablesexpenditures for refrigerated delivery and warehouse equipment.
We estimate that were outstanding as of December 31, 2004 related to the bankruptcy. The increase in cigarette and excise taxes payable was due primarily to an increase in purchase volume, increases in excise tax rates during the year and the reinstatement of credit terms in some states in which we do business.fiscal 2009 capital expenditures will not exceed $27.0 million.
Cash flows relating to investing activities
For the yearYear ended December 31, 2005,2007
Net cash flows used in investing activities were $6.6decreased by $43.3 million to $23.3 million for 2007 from $66.6 million in 2006. Cash flows in investing activities in 2006 included $55.5 million related to the Klein acquisition.
Capital expenditures increased by $8.0 million to $20.8 million in 2007 due primarily to our investment in the Toronto facility which approximated $6.4 million and were entirely attributable to capital expenditures during the period. The capital spending related primarily to the scheduled replacement ofin refrigerated delivery and warehouse equipment. Our original capital expenditure plan was to spend approximately $10 million during 2005, related primarily to facility upgrades and scheduled replacement of delivery and warehouse equipment. We deferred some of these capital expenditures in 2005 and now expect capital expenditures for 2006 to total approximately $16 million, which includes equipping a replacement facility in Spokane, Washington and increasing our refrigerated product capabilities.
Cash flows from financing activities
For the yearYear ended December 31, 2005, net2008
Net cash used in financing activities decreased by $28.5 million to $11.0 million in 2008 compared with $39.5 million in 2007. The decrease was $23.5 million. We borrowed $86.5due primarily to higher repayments on our revolving line of credit made in 2007 as compared to 2008, offset by approximately $11.0 million of cash payments to repurchase our common stock and made paymentsa decrease in book overdrafts.
Year ended December 31, 2007
Net cash used in financing activities increased by $58.2 million to $39.5 million of $71.9net cash used for 2007 compared with $18.7 million of net cash provided by financing activities for the same period in 2006. The change was due primarily to repayments under our 2004 and 2005 Credit Facilities, which
resultedrevolving credit facility offset slightly by an increase in a net source of cash of $14.6 million for 2005. Debt issuance costs of $2.1 million were paid in connection with the 2005 Credit Facility. The 2004 Credit Facility and Tranche B loan were fully repaid in 2005 and terminated, as described further below under2005 Revolving Credit Facility.book overdrafts.
2005 RevolvingOur Credit Facility
OnIn October 13, 2005, we entered into a new $250 million five-year revolving credit facility which we refer to as the 2005 (“Credit Facility, with a group of lenders led by J.P. Morgan Chase. The 2005 Credit Facility refinanced and replaced the 2004 Revolving Credit Facility and the Tranche B term facility. In conjunction with establishing the 2005 Credit Facility we prepaid all $32.3 million in outstanding loansFacility”). All obligations under the 2004 Revolving Credit Facility and the Tranche B term facility, cash collateralized or transferred to the 2005 Credit Facility all $53.3 million in letters of credit issued under the 2004 Revolving Credit Facility and the Tranche B term facility and terminated the 2004 Revolving Credit Facility and the Tranche B note.
As required under the Tranche B term facility, we paid pre-payment fees of $1.8 million in 2005 and we expensed $2.0 million for the write-off of debt discount related to the Tranche B note agreement. Unamortized debt issuance costs of $2.4 million related to the Tranche B term facility and the 2004 Revolving Credit Facility were written off in 2005. These charges totaling $6.2 million were recorded as loss on early extinguishment of debt in our consolidated statement of operations in 2005.
The 2005 Credit Facility provides for up to $250 million in revolving loans, of which $160 million is available as letters of credit and up to C$110 million is available in Canadian dollars. Borrowing under the 2005 Credit Facility is subject to a formula based on eligible accounts receivable, eligible inventory, certain equipment and certain unrestricted cash balances, less certain reserves (the 2005 Credit Facility Borrowing Base), which limits the amount of revolving loans and letters of credit available. The administrative agent under the 2005 Credit Facility also has the right, under certain circumstances, to establish additional reserves against the commitment under the 2005 Credit Facility.
At our option, interest rates on the U.S. revolving loans and letters of credit under the 2005 Credit Facility are based on LIBOR plus an applicable margin, or on an alternate base rate equal to the higher of the prime rate or the federal funds rate plus 0.50%. There is no additional margin on alternate base rate advances. Loans made in Canadian Dollars bear interest at either a rate based on the Canadian deposit offered rate (CDOR), which is equal to the rate quoted on the publicly available CDOR screen plus 0.10%, plus an applicable margin or at a Canadian base rate equal to the greater of the Canadian prime rate or the CDOR rate plus 1%. The applicable margin on LIBOR-based loans and CDOR-based loans may range from 1.00% to 1.75% depending on our adjusted EBITDA as defined in the 2005 Credit Facility, and was initially set at 1.50%. Interest is payable monthly, or if we elect LIBOR or CDOR, at the expiration of each LIBOR or CDOR period, which is one, two, three or six months, as we may elect under the 2005 Credit Facility (except that if the Company elects a LIBOR or CDOR period of six months, interest is payable at the end of the third and sixth months). We are subject to an unused facility fee that may range from 0.25% to 0.30% of the unused portion of the 2005 Credit Facility depending on the our adjusted EBITDA as defined in the 2005 Credit Facility, and was initially set at 0.25%.
The Credit Agreement for the 2005 Credit Facility (the 2005 Credit Agreement) contains restrictive covenants, including among others limitations on dividends and other restricted payments, other indebtedness, liens, investments and acquisitions and certain asset sales. If the Company’s availability under the 2005 Credit Facility falls below $35 million, we will be obligated to maintain a fixed charge coverage ratio, calculated as provided in the 2005 Credit Agreement and based on adjusted EBITDA as defined in the 2005 Credit Agreement, of not less than 1.1 to 1.
The 2005 Credit Facility is collateralizedsecured by a first priority interest in, and liens upon substantially all of the Company’sour present and future assets. The terms of the 2005 Credit Facility permit prepayment without penalty at any time (subject to customary breakage costs with respect to LIBOR or CDOR-based loans prepaid prior to the
end of an interest period). The Company is required
On March 12, 2008, we entered into a Second Amendment to pay off any outstanding balance on the facility in October, 2010.
We paid approximately $2.1 million in financing costs in establishing the 2005our Credit Facility which have been deferred and are being amortized over(the “Second Amendment”). This Amendment established our basket for permitted acquisitions made after the lifedate of the facility. These costs are included in other non-current assets on the consolidated balance sheet. At December 31, 2005, we were in compliance with all of the conditions and covenants and had a net available borrowing capacity under the 2005 Credit Facility of approximately $67.0 million.
During 2005, the maximum amount of borrowing and letters of credit outstanding under the revolving credit facilities were $68.3Second Amendment at $100 million and $51.9 million, respectively. As of December 31, 2005, the totalincreased our basket for permitted stock repurchases to $30 million.
Net available borrowings, outstanding were $59.6 million and letters of credit outstanding were $51.9 million. At December 31, 2005 we elected the LIBOR option and the 30-day and 60-day LIBOR rates were 4.37% and 4.30%, respectively. The weighted-average interest rate for the year ended December 31, 2005 for the revolving credit facility was 5.8%. The balance outstanding on the 2005 Credit Facility has been classified as long-term debt because the facility expires on October 12, 2010.
We do not believe that the matters described in theRestatements section of thisManagements’ Discussion and Analysis of Financial Condition and Results of Operationsand inNote 2—Restatements of Financial Statementsconstituted or established the existence of a breach or default under the Credit Agreement dated as of October 12, 2005 for our $250 million revolving credit facility. However, in order to avoid any dispute over whether a breach or default had occurred, we nevertheless obtained a confirmatory waiver from the lenders under the Credit Agreement of any such potential breach or default.
Our long-term debtamounts borrowed and outstanding letters of credit as ofunder the dates belowCredit Facility were as follows (in millions):
December 31, 2005 | December 31, 2004 | August 23, 2004 | |||||||||
Revolving credit facility | $ | 59.6 | $ | 45.0 | $ | 86.4 | |||||
Tranche B notes payable | — | 35.5 | 35.5 | ||||||||
Subtotal | 59.6 | 80.5 | 121.9 | ||||||||
Less: Debt discount | — | (3.0 | ) | (3.2 | ) | ||||||
Subtotal | 59.6 | 77.5 | 118.7 | ||||||||
Less: Current portion of long-term debt | — | — | — | ||||||||
Total long-term debt, net of current portion | $ | 59.6 | $ | 77.5 | $ | 118.7 | |||||
Letters of credit outstanding | $ | 51.9 | $ | 61.2 | $ | 57.1 | |||||
| December 31, 2008 | December 31, 2007 | |||||
Net available borrowings | $ | 186.0 | $ | 160.0 | ||
Amounts borrowed | $ | 30.0 | $ | 29.7 | ||
Outstanding letters of credit | $ | 24.4 | $ | 28.5 | ||
We believe that our ability to generate cash from operations and funds available from our new 2005The Credit Facility will be adequate to fund working capital, capital spendingcontains restrictive covenants, including among others, limitations on dividends and other cash needs for at leastrestricted payments, other indebtedness, liens, investments and acquisitions and certain asset sales. We are in compliance with all of the next 12 months. covenants under the facility.
Our ability to generate adequate cash from operations in the future, however, will depend on, among other things, our ability to successfully implement our business strategies while continuing to tightly control our expenses and to manage the impact of changes in manufacturers’ pricing. We can give no assurance that we will be able to successfully implement those strategies and cost control initiatives, or successfully manage our pricing to match increases from the manufactures. In addition, changes in our operating plans, lower than anticipated sales, increased expenses,weighted average interest rate increases, acquisitions or other events may cause us to seek additional debt or equity financing in future periods. We can give no assurance that financing will be availablewas calculated based on acceptable terms or at all. Additional equity financing could be dilutive to holdersour daily cost of our common stock; debt financing, if available, could impose additional cash payment obligations and additional covenants and operating restrictions.
Year ended December 31, 2004
Cash flows from operating activities
During 2004, net cash provided by the Successor and Predecessor Companies combined operating activities of $7.1 million consisted of an increase in cash from changes in assets and liabilities of $51.6 million and cash provided by operations of $11.1 million, offset by excise tax payments reducing liabilities subject to compromise of $55.6 million. Cash provided by operations during 2004 was driven by $56.0 million in net income, coupled with non-cash adjustments related primarily to fresh-start accounting and deferred taxes.
The increase in cash provided from changes in assets and liabilities was primarily driven by an increase in accounts payable of $30.1 million which resulted from our successful efforts to secure more favorable trade credit terms with our vendors after the Plan was approved. Of the total $30.1 million increase in accounts payable, $18.9 million occurred after emergence from bankruptcy. In addition, cash provided from changes in assets and liabilities benefited from a $28.2 million decrease in other receivables related primarily to collections of vendor receivables that were stalled during bankruptcy. These sources of cash were offset by payments of $55.6 million in excise tax liabilities previously classified as liabilities subject to compromise, a net increase of 9.0 million in deposits, prepayments and other non-current assets,borrowing which was due primarily to an increase in workers’ compensation deposits which we inherited from Fleming pursuant to the Plan, partially offset bycomputed on a reduction in deposits required by our vendors, which was related to our emergence from bankruptcy.
Cash flows relating to investing activities
For the year ended December 31, 2004, cash flows used in investing activities were $12.1 million,blend of prime and were entirely attributable to capital expenditures during the periods. For the year ended December 31, 2004, capital spending-related primarily to the reengineering of three of our distribution centers and scheduled replacement of delivery and warehouse equipment.
Cash flows from financing activities
For 2004, net cash used by financing activities was $1.3 million. As a result of our reorganization, we borrowed $86.4 million under our 2004 Revolving Credit Facility and $35.5 million of Tranche B notes were issued. Debt issuance costs of $3.8 million were paid in connection with the emergence financing. Additionally, during the period January 1, 2004 through August 22, 2004, a net of $55.0 million of distributions from our former parent were received. Pursuant to the Plan, $139.6 million was distributed to the PCT and RCT upon emergence. Net payments made on our outstanding debt obligations totaled $41.4 million for the year.
In connection with the issuance of indebtedness upon emergence from the Fleming bankruptcy, we issued warrants to the lenders under our Tranche B Note Agreement to purchase up to an aggregate of 247,654 shares of our common stock at an exercise price of $15.50 per share, the fair value of our common stock as determined pursuant to the Plan.LIBOR rates. The warrants are immediately exercisable and expire seven years from the date of issuance. The warrants were valued at $1.4 million and were charged to discount on debt and amortized into interest expense over the term of the notes. The value of the warrants was calculated using the Black-Scholes option pricing model with the following assumptions: a term of seven years, a risk freeweighted average interest rate of 3.85%, volatility of 30%, and an expected dividend yield of zero.
Year ended December 31, 2003
Cash flows from operating activities
During 2003, net cash provided by operating activities of $53.4 million consisted of cash provided by operations of $18.2 million and an increase in cash from changes in assets and liabilities of $35.2 million. Cash provided by operations includes the net loss of $268.0 million for 2003 which was offset by $286.2 million in
non-cash charges related primarily to the impairment of goodwill and long-lived intangible assets, depreciation and amortization. Contributing to the increase in cash from changes in asset and liabilities were decreases in accounts receivable of $39.1 million and inventories of $21.6 million, and a net increase in accounts payable of $22.3 million (including a decrease in trade accounts payable of $81.0 million and cigarette and tobacco taxes payable of $18.3 million, and an increase in liabilities subject to compromise of $121.6 million). These were offset by increases in restricted cash, other receivables and deposits and prepayments. The decreases in trade accounts receivable and inventories were a result of the bankruptcy, as disruptions toon our supply chain led to inventory shortages and ultimately a loss of sales. The decrease in inventories was partially offset by a purchase of excess cigarette inventories in connection with a Canadian manufacturer holiday and in anticipation of U.S. cigarette manufacturer price changes at year-end 2003. The net increase in accounts payable is attributable to the bankruptcy filing because pre-petition indebtedness was stayed. The increase in other receivables of $29.5 million was the result of our inability to collect vendor promotional allowances and other incentive program monies due us while in bankruptcy. The increase in deposits and prepayments was a result of several vendors requiring cash payments prior to the shipment of products. In addition, restricted cash, related to monies set aside as security to obtain tax credit terms with two provinces in Canada, was $19.8 million at December 31, 2003, while it did not exist at December 31, 2002.
Cash flows relating to investing activities
For the year ended December 31, 2003, cash flows used in investing activities were $8.4 million, and were entirely attributable to capital expenditures during the periods. The capital spending was primarily attributable to the scheduled replacement of delivery and warehouse equipment.
Cash flows from financing activities
For the year ended December 31, 2003 we had net distributions to Fleming totaling $28.5 million, which were the result of excess cash flows from operations. Book overdrafts resulted in a use of cash totaling $16.4 million in 2003. This change represents the amount of issued checks that have not cleared through our banking system. The outstanding checks were typically funded through borrowings on the Fleming revolving credit facility when they cleared the bank.was 3.8% for 2008 and 6.7% for 2007. We paid total unused facility fees of $0.5 million in both 2008 and 2007.
Contractual Obligations and Commitments
Contractual ObligationsObligations.. The following table presents information regarding our contractual obligations that existexisted as of December 31, 2005:2008:
| (in millions) | Total | 2006 | 2007 | 2008 | 2009 | 2010 | 2011 and Thereafter | Total | 2009 | 2010 | 2011 | 2012 | 2013 | 2014 and Thereafter | ||||||||||||||||||||||||||||
Long-term debt | $ | 59.6 | $ | — | $ | — | $ | — | $ | — | $ | 59.6 | $ | — | $ | 30.0 | $ | — | $ | 30.0 | $ | — | $ | — | $ | — | $ | — | ||||||||||||||
Purchase obligations(2) | 0.6 | 0.6 | — | — | — | — | — | |||||||||||||||||||||||||||||||||||
Letters of credit | 24.4 | 24.4 | — | — | — | — | — | |||||||||||||||||||||||||||||||||||
Operating leases | 85.8 | 18.7 | 16.4 | 12.7 | 10.3 | 8.4 | 19.3 | 180.0 | 27.4 | 25.7 | 23.0 | 18.9 | 13.9 | 71.1 | ||||||||||||||||||||||||||||
Capitalized leases(3) | 0.8 | — | — | 0.1 | 0.1 | 0.1 | 0.5 | |||||||||||||||||||||||||||||||||||
Total contractual obligations | $ | 145.4 | $ | 18.7 | $ | 16.4 | $ | 12.7 | $ | 10.3 | $ | 68.0 | $ | 19.3 | ||||||||||||||||||||||||||||
Total contractual obligations(4)(5)(6) | $ | 235.8 | $ | 52.4 | $ | 55.7 | $ | 23.1 | $ | 19.0 | $ | 14.0 | $ | 71.6 | ||||||||||||||||||||||||||||
Purchase orders for the purchase of inventory and other services are not included in the table above because purchase orders represent authorizations to purchase rather than binding agreements. For the purposes of this table, contractual obligations for purchase of goods or services are defined as agreements that are enforceable and legally binding and that specify all significant terms, including: fixed or minimum quantities to be purchased; fixed, minimum or variable price provisions, and the approximate timing of the transaction. Our purchase orders are based on our current inventory needs and are fulfilled by our suppliers within short time periods. We also enter into contracts for outsourced services; however, the obligations under these contracts are not significant and the contracts generally contain clauses allowing for cancellation without significant penalty.
| (1) | Does not include interest costs associated with the Revolving Credit Facility which had a rate of 3.8% as of December 31, 2008. |
| (2) | Purchase orders for the purchase of inventory and other services are not included in the table above because purchase orders represent authorizations to purchase rather than binding agreements. For the purposes of this table, contractual obligations for purchase of goods or services are defined as agreements that are enforceable and legally binding and that specify all significant terms, including: fixed or minimum quantities to be purchased; fixed, minimum or variable price provisions, and the approximate timing of the transaction. Our purchase orders are based on our current inventory needs and are fulfilled by our suppliers within short time periods. We also enter into contracts for outsourced services; however, the obligations under these contracts are not significant and the contracts generally contain clauses allowing for cancellation without significant penalty. As of December 31, 2008, $0.5 million represents information technology related purchase commitments, and $0.1 million represents estimated transportation equipment purchase commitments. |
| (3) | Represents refrigeration equipment included in an operating lease. |
| (4) | We have not included in the table above Claims Liabilities of $31.3 million, net of current portion, which includes health and welfare, workers’ compensation and general and auto liabilities because it does not have a definite payout by year. They are included in a separate line in the Consolidated Balance Sheet and discussed in Note 2 to our Consolidated Financial Statements in Item 8. |
| (5) | As discussed in Note 13 to our Consolidated Financial Statements included in Item 8, we have a $12.8 million long-term obligation arising from an underfunded pension plan. Future minimum pension funding requirements are not included in the schedule above as they are not available for all periods presented. The increase in the funding requirements between years has been driven by the underperformance of the pension plan assets primarily due to lower returns on invested plan assets as a result of the decline in the overall global economy during 2008. |
| (6) | The table excludes unrecognized tax liabilities computed under FIN 48 of $6.1 million because a reasonable and reliable estimate of the timing of future tax payments or settlements, if any, cannot be determined(See Note 10—Income Taxes). |
Off-Balance Sheet Arrangements
Letter of Credit CommitmentsCommitments.. As of December 31, 2005,2008, our standby letters of credit issued under our 2005 Credit Facility were $51.9$24.4 million of which $3.9 million relates to workers’ compensation and $48 million relatesrelated primarily to casualty insurance and tax bonds and casualty insurance. All of theobligations. The standby letters of credit expire in 2007.2009. However, in the ordinary course of our business, we will continue to renew or modify the terms of the letters of the credit as required byto support business needs.requirements. The liabilities underlying the letters of credit are reflected on our consolidated balance sheets as of December 31, 2005, December 31, 2004 and August 23, 2004.sheets.
Trust Guarantees. Pursuant to the Plan, two special purpose trusts were established, the Post-Confirmation Trust (PCT), and the Reclamation Creditors’ Trust (RCT), collectively, the Trusts(See Note 1—SummaryCompany Information and Emergence from Bankruptcy to the consolidated financial statements). The Trusts were established in order to administer post-confirmation responsibilities ordered under the Plan including, but not limited to, the pursuit of assets and reconciliation and subsequent settlement of pre-petition and post-petition claims, including specific administrative claims. Under the terms of the Plan, we guarantee the payment of all PCT administrative claims in excess of $56 million. In addition, if the assets of the RCT are inadequate to satisfy all of the allowed TLV claims, we must pay such claims in full plus any accrued interest. We also guarantee all eligible but unpaid non-TLV claims up to a maximum of $15 million. The Plan limits the combined amounts of the RCT TLV and non-TLV claims to not greater than $137 million. FIN 45 requires that an entity issuing a guarantee must recognize, at the inception of the guarantee, a liability equal to the fair value of the guarantee. Based on the estimates provided by the Trusts, we believe that (i) the PCT administrative claims are substantially below the guarantee threshold and (ii) the assets of the RCT will be sufficient to satisfy the TLV claims and non-TLV claims against it. Therefore, we have not accrued any liability with respect to these guarantees. However, if the assets of either Trust are insufficient to cover the liabilities of such Trust we could be required to satisfy the guarantees. We have reviewed the Trusts and guarantees pursuant to FIN 46 and found that they are not subject to consolidation.
Operating Leases. The majority of our sales offices, warehouse facilities, and trucks are subject to lease agreements which expire at various dates through 2021 (excluding renewal options). These leases generally require us to maintain, insure, and pay any related taxes. In most instances, we expect the leases that expire will be renewed or replaced in the normal course of our business.
Third Party Distribution CentersCenters.. We currently manage two regional distribution centers for third party convenience store operators who engage in self-distribution. Under the agreementsagreement relating to one of these facilities, the third parties haveparty has a “put” right under which theyit may require us to acquire the facilities.facility. If the put right is exercised, we will be required to (1) purchase the inventory in the facilities at cost, (2) purchase the physical assets of the facilities at fully depreciated cost, and (3) assume the obligations of the third partiesparty as lessees under the leases related to those facilities. While we believe the likelihood that thesethis put optionsoption will be exercised is remote, if they areit were exercised, we couldwould be required to make aggregate capital expenditures of approximately $10$5.9 million based on current estimates. The amount of capital expenditureexpenditures would vary depending on the timing of any exercise of such puts.
Restatements of Financial Information
Background
On March 23, 2006 the Audit Committeeputs and does not include an estimate of the Board of Directors of the Companycost to purchase inventory because such purchases would simply replace other planned inventory purchases and management concluded that our audited consolidated financial statements as of December 31, 2004 and for the period from August 23, 2004 to December 31, 2004 and our unaudited condensed consolidated financial statements as of and for the six months ended June 30, 2005, each included in our registration statement on Form 10, and our unaudited condensed consolidated financial statements as of and for the three and nine months ended September 30, 2005 included in our Form 10-Q for the third quarter of 2005, should no longer be relied upon because of errors in those financial statements relating to the accounting of foreign currency translationwould not represent an incremental cost.
adjustments related to intercompany balances. Specifically, we determined that foreign currency translation adjustments related to intercompany balances of our Canadian branch were incorrectly recorded as a component of comprehensive income directly to stockholders’ equity. These intercompany balances were incorrectly thought to be of a permanent nature. Because such intercompany balances post-emergence were not permanent in natureCritical Accounting Policies and were fluctuating throughout the period, the foreign exchange gains or losses should have been recorded as a gain (or loss) within the income statement. Accordingly, we are restating our financial statements for such periods to correct the above error and to correct the additional errors discussed below.Estimates
In connection with this restatement, we also corrected an approximately $0.4 million inventory undervaluation error (and a corresponding understatement of cost of goods sold) in our financial statements for the period from August 23, 2004 through December 31, 2004 and a related $0.4 million overvaluation error (and a corresponding understatement of cost of goods sold) in our financial statements for the six months ended June 30, 2005 and for the nine months ended September 30, 2005. Additionally, our restatement reflects adjustments for the period from August 23, 2004 through December 31, 2004 to correct estimation errors and to correct errors in certain balance sheet classifications. The correction of the estimation errors resulted in a $0.1 million decrease in cost of goods sold and a $0.2 million decrease in selling, general and administrative expenses for the period from August 23, 2004 through December 31, 2004, and a corresponding $0.1 million increase in cost of goods sold and $0.2 million increase in selling, general and administrative expenses for the six months ended June 30, 2005 and nine months ended September 30, 2005. In addition, diluted earnings per share for the three months ended September 30, 2005 decreased from $0.09 to $0.08 as a result of a change in the method of calculating diluted earnings per share. Previously, we calculate diluted earning per share by dividing net income expressed in millions by fully diluted shares. As restated, we calculate diluted earnings per share by dividing net income expressed in dollars by fully diluted shares.
The correction of the error relating to the accounting of foreign currency translation adjustments had the effect of increasing (decreasing) income from continuing operations before taxes, net income and diluted earnings per share by $2.4 million, $1.5 million and $0.15, respectively for the period August 23 through December 31, 2004, by $(0.6) million, $(0.3) million and $(0.03), respectively, for the six months ended June 30, 2005, and by $(0.6) million, $(0.3) million and $(0.03), respectively, for the nine months ended September 30, 2005.
The aggregate effect of correcting the accounting errors described above was as follows:
For the period from August 23, 2004 through December 31, 2004, income from continuing operations before taxes increased by $3.1 million, net income after taxes increased by $1.9 million and diluted earnings per share increased $0.19. For the nine months ending September 30, 2005, income from continuing operations before taxes decreased $1.3 million, net income after taxes decreased $0.8 million and diluted earnings per share decreased $0.07. For the six months ending June 30, 2005, income from continuing operations before taxes decreased $1.3 million, net income after taxes decreased $0.8 million and diluted earnings per share decreased $0.06. There was no impact to income from continuing operations or net income for the three months ended September 30, 2005, however, diluted earnings per share decreased by $0.01 from $0.09 to $0.08 as a result of the change in the method of calculating diluted earnings per share.
The following tables set forth the consolidated statement of operations as originally reported and as restated for the periods indicated (in millions):
| Nine months ended September 30, 2005 (Unaudited) | ||||||
As Filed in November 30, 2005 | As Restated | |||||
Net sales | $ | 3,681.2 | $ | 3,681.2 | ||
Cost of goods sold | 3,474.4 | 3,474.9 | ||||
Gross profit | 206.8 | 206.3 | ||||
Warehousing and distribution expenses | 102.5 | 102.5 | ||||
Selling, general and administrative expenses | 78.2 | 78.4 | ||||
Amortization of intangible assets | 0.9 | 0.9 | ||||
Total operating expenses | 181.6 | 181.8 | ||||
Income from operations | 25.2 | 24.5 | ||||
Interest expense, net | 9.5 | 9.5 | ||||
Loss on early extinguishment of debt | 2.6 | 2.6 | ||||
Foreign currency transaction (gains) losses, net | — | 0.6 | ||||
Amortization of debt issuance costs | 0.9 | 0.9 | ||||
Income from operations before income taxes | 12.2 | 10.9 | ||||
Provision for income taxes | 5.5 | 5.0 | ||||
Net income | $ | 6.7 | $ | 5.9 | ||
Management’s Discussion and Analysis of our Financial Condition and Results of Operations is based on our consolidated financial statements, which have been prepared in accordance with accounting principles generally accepted in the United States of America (GAAP). The preparation of our consolidated financial statements requires estimates and assumptions that affect the reported amounts of assets and liabilities as originallyof the date of the financial statements and the reported amounts of net sales and expenses during the reporting period. The critical accounting polices used in the preparation of the consolidated financial statements are those that are important both to the presentation of financial condition and results of operations and require significant judgments with regards to estimates. We base our estimates on historical experience and on various assumptions we believe are reasonable under the circumstances, the results of which form the basis for making judgments about the carrying value of assets and liabilities that are not readily apparent from other sources. We believe the current assumptions and other considerations used to estimate amounts reflected in our Form 10-Q forfinancial statements are appropriate; however, actual results could differ from these estimates.
We believe that the period ended September 30, 2005 is impactedfollowing represent the more critical accounting policies, which are subject to estimates and assumptions used in the following manner bypreparation of our financial statements.
Allowance for Doubtful Accounts
We maintain an allowance for doubtful accounts for losses we estimate will arise from our trade customers’ inability to make required payments. We evaluate the restated results:
Our gross profitcollectability of accounts receivable and determine the appropriate allowance for doubtful accounts based on historical experience and a review of specific customer accounts. In determining the nine months ended September 30, 2005 decreased by $0.5 million due toadequacy of allowances for customer receivables, we analyze factors such as the impactvalue of any collateral, customer financial statements, historical collection experience, aging of receivables, general economic conditions and other factors. It is possible that the correction of the inventory valuation and estimation errors described above.
Our selling, general and administrative expenses increased by $0.2 million for the nine months ended September 30, 3005 due to the impactaccuracy of the estimation errors described above.process could be materially affected by different judgments as to the collectability based on information considered and further deterioration of accounts. If circumstances change (i.e., further evidence of material adverse creditworthiness, additional accounts become credit risks, store closures, or deterioration in general economic conditions), our estimates of the recoverability of amounts due us could be reduced by a material amount, including to zero.
We incurred foreign currency transaction lossesThe allowance for doubtful accounts at December 31, 2008, 2007 and 2006 amounted to 6.0%, 6.9%, and 2.7%, respectively, of $0.6net trade accounts receivable. The increase from 2006 to 2007 was due primarily to two of our customers who filed for bankruptcy under Chapter 11 during the fourth quarter of 2007.
Bad debt expense associated with our trade customer receivables was $1.6 million for 2008, $6.9 million for 2007, and $0.4 million for 2006. Bad debt expense for 2007 included a charge of $5.9 million related to two customers who declared bankruptcy in the nine months ended September 30, 2005, compared to $0.7 millionfourth quarter of gains2007. As a percentage of sales, our bad debt expense was 0.0%, 0.1% and 0.0% for 2008, 2007 and 2006, respectively.
Inventories
Our United States inventories are valued at the lower of cost or market. Cost of goods sold is determined on a last-in, first-out (LIFO) basis using producer price indices (PPIs) as published by the United States Department of Labor. PPIs are updated by the Department of Labor on a lag basis for manufacturer price increases or decreases implemented after the initial PPI has been published for a given month. When we are aware of material price increases or decreases from manufacturers we will estimate the PPI for the nine months ended September 30, 2004.respective period in order to more accurately reflect inflation rates. The increase in expense for(PPIs) are applied to inventory which is grouped by merchandise having similar characteristics. Under the 2005 period compared toLIFO method, current costs of goods sold are matched against current sales. During periods of rising prices, the 2004 period was due to the impact of changes in foreign currency translation rates and intercompany activity related to our Canadian operations.
As Filed in October 31, 2005 Net sales Cost of goods sold Gross profit Warehousing and distribution expenses Selling, general and administrative expenses Amortization of intangible assets Goodwill and asset impairment charges Total operating expenses Income from operations Interest expense, net Foreign currency transaction (gains) losses, net Amortization of debt issuance costs Income from operations before income taxes Provision for income taxes Net income Six months ended June 30, 2005
(Unaudited)
Form 10/A on As Restated $ 2,347.9 $ 2,347.9 2,212.0 2,212.5 135.9 135.4 65.4 65.4 53.0 53.2 0.5 0.5 — — 118.9 119.1 17.0 16.3 6.2 6.2 — 0.6 0.5 0.5 10.3 9.0 4.5 4.0 $ 5.8 $ 5.0
Management’s Discussion and Analysis of Financial Condition and Results of Operations with respect to the six months ended June 30, 2005 as originally reported in our Form 10 registration statement is impacted in the following manner by the restated results:
Our gross profit for the six months ended June 30, 2005 decreased by $0.5 million due to the impact of the correction of the inventory valuation and estimation errors described above.
Our selling, general and administrative expenses increased by $0.2 million for the nine months ended September 30, 2005 due to the impact of the estimation errors described above inRestatements of Financial Information.
We incurred foreign currency transaction losses of $0.6 million for the six months ended June 30, 2005. The loss was due to the impact of changes in foreign currency translation rates and intercompany activity related to our Canadian operations. For the six months ended June 30, 2004, we had no such transaction losses.
As Filed in Form 10/A on October 21, 2005 Net sales Cost of goods sold Gross profit Warehousing and distribution expenses Selling, general and administrative expenses Amortization of intangible assets Goodwill and asset impairment charges Total operating expenses Income (loss) from operations Interest expense, net Foreign currency transaction (gains) losses, net Reorganization items, net Amortization of debt issuance costs Income (loss) from operations before income taxes Provision for income taxes Net income Period from August 23
through
December 31, 2004 As Restated $ 1,549.3 $ 1,549.3 1,458.9 1,458.4 90.4 90.9 42.6 42.6 35.1 34.9 0.4 0.4 — — 78.1 77.9 12.3 13.0 4.8 4.8 — (2.4 ) 0.8 0.8 0.4 0.4 6.3 9.4 2.9 4.1 $ 3.4 $ 5.3
Restated Quarterly Information
All unaudited financial information set forth below reflects the restatement of our financial statements for the fiscal quarters September and December 2004 and March and June 2005 as previously presented in our Form 10/A filed October 21, 2005 and discussed in Note 2 and Note 15 of the Notes to the Consolidated Financial Statements. Other than with respect to theLIFO method of calculating earnings per share discussed abovecosting inventories generally results inRestatements higher costs being charged against income (LIFO expense), while lower costs are retained in inventories. To the extent inventories or prices decline significantly at the end of Financial Information, the restatement did not effect our financial statements for the three months ended September 30, 2005,.
The following tables set forth the restated consolidated statements of operations for the quarterlyany period where there have been increasing prices in prior periods, indicated.
Three Months Ended
(unaudited)
(under LIFO some older and potentially lower priced inventory is considered as having been sold, resulting in millions)
June 30, (Restated) | March 31, (Restated) | |||||
Net sales | $ | 1,268.1 | $ | 1,079.8 | ||
Net sales—Cigarettes | 899.8 | 773.8 | ||||
Net sales—Food/Non-food | 368.3 | 306.0 | ||||
Cigarette inventory holding profits | 2.6 | 2.5 | ||||
Gross profit | 72.4 | 63.0 | ||||
Warehousing and distribution expenses | 34.2 | 31.2 | ||||
Selling and administrative expenses | 25.6 | 27.6 | ||||
Income from operations | 12.4 | 3.9 | ||||
Interest expense, net | 3.0 | 3.2 | ||||
Foreign currency transaction (gains) losses, net | 0.3 | 0.3 | ||||
Net income | 5.0 | 0.0 | ||||
For the three months ended June 30, 2005 the results of operations were impacted by an adjustment to record foreign currency transaction losses of $0.3 million, before taxes.
For the three months ended March 31, 2005 the results of operations were impacted by adjustments to increasea lower cost of goods sold compared to current prices, and increased current gross profit (LIFO income).
Vendor and Sales Incentives
Vendors’ Discounts, Rebates and Allowances—Periodic payments from vendors in various forms including volume or other purchase discounts are reflected in the carrying value of the related inventory when earned and as cost of goods sold as the related merchandise is sold. Up-front consideration received from vendors linked to purchase or other commitments is initially deferred and amortized ratably to cost of goods sold or as the performance of the activities specified by $0.5the vendor to earn the fee is completed. Cooperative advertising incentives from suppliers are recorded as reductions to cost of goods sold to the extent the vendor considerations exceeds the costs relating to the programs. These amounts are recorded in the period the related promotional or merchandising programs were provided. Some of the vendor incentive promotions require that we make assumptions and judgments regarding, for example, the likelihood of achieving market share levels or attaining specified levels of purchases. Vendor incentives are at the discretion of our vendors and can fluctuate due to changes in vendor strategies and market requirements.
Customers’ Sales Incentives—We also provide sales rebates or discounts to our customers on a regular basis. The customers’ sales incentives are recorded as a reduction to sales revenue as the “sales incentive” is earned by the customer. Additionally, we may provide racking and slotting allowances for the customers’ commitments to continue using us as the supplier of their products. These allowances may be paid at the inception of the contract or on a periodic basis. Allowances paid at the inception of the contract are capitalized and amortized over the period of the distribution agreement as a reduction to sales.
Income Taxes
Income taxes are accounted for under the liability method in accordance with Statement of Financial Accounting Standards(SFAS) No. 109,Accounting for Income Taxes. Deferred tax assets and liabilities are recognized for the estimated future tax consequences attributable to differences between the financial statement carrying amounts of existing assets and liabilities and their respective tax basis and operating loss and tax credit carry-forwards. Deferred tax assets and liabilities are measured using enacted tax rates in effect for the year in which those temporary differences are expected to be recovered or settled. The effect on deferred tax assets and liabilities of a change in tax rates is recognized in income in the period that includes the enactment date. Deferred tax assets are reduced by a valuation allowance when management does not consider it more likely than not that some portion or all of the deferred tax assets will be realized. In assessing the need for a valuation allowance, our management evaluates all significant available positive and negative evidence, including historical operating results, estimates of future taxable income and the existence of prudent and feasible tax planning strategies. As of December 31, 2008, we had a valuation allowance of $0.1 million with respect to increase selling100% of the deferred tax asset related to foreign tax credits. We believe that it is more likely than not we will be unable to utilize the foreign tax credits, which expire in years 2014 to 2016, due primarily to the relatively lower taxable income generated in Canada compared with the United States. Changes in the expectations regarding the realization of deferred tax assets could materially impact income tax expense in future periods.
We adopted the provisions ofFinancial Interpretation No. 48 (FIN 48),Accounting for Uncertainty in Income Taxes, on January 1, 2007, which clarifies the accounting for uncertain tax positions. FIN 48 prescribes a process for the recognition and measurement of a tax position taken or expected to be taken in a tax return and requires us to make estimates of the likelihood that certain tax positions will be realized upon ultimate settlement. In evaluating the exposures connected with our various tax filing positions, we establish an accrual when, despite our belief that our tax return positions are supportable, we believe that certain positions may be successfully challenged and a loss is probable. To the extent that our view as to the outcome of these matters change, we will adjust income tax expense in the period in which such determination is made. We classify interest and penalties related to income taxes as income tax expense.
Claims Liabilities and Insurance Recoverables
We maintain reserves related to workers’ compensation, general and administrative expenses by $0.2 millionauto liability and health and welfare programs that are principally self-insured. Our workers’ compensation, general and auto liability insurance
policies include a deductible of $500,000 per occurrence and we maintain excess loss insurance that covers any health and welfare costs in excess of $200,000 per person per year. Our reserves for workers’ compensation, general and auto insurance liabilities are estimated based on applying an actuarially derived loss development factor to our incurred losses, including losses for claims incurred but not yet reported. Actuarial projections of losses concerning workers’ compensation, general and auto insurance liabilities are subject to a high degree of variability. Among the causes of this variability are unpredictable external factors affecting future inflation rates, health care costs, litigation trends, legal interpretations, legislative reforms, benefit level changes and claim settlement patterns. Our reserve for health and welfare claims includes an estimate of claims incurred but not yet reported which is derived primarily from historical experience.
Our claim liabilities and the related recoverables from insurance carriers for estimated claims in excess of deductible amounts and other insured events are presented in their gross amounts because there is no right of off-set. The following is a summary of our net reserves as of December 31, 2008 and December 31, 2007:
| 2008 | 2007 | |||||||||||||||||||||||
| Current | Long- Term | Total | Current | Long- Term | Total | |||||||||||||||||||
Gross Claims Liabilities: | ||||||||||||||||||||||||
Workers’ Compensation Liability | $ | 5.7 | $ | 29.2 | $ | 34.9 | $ | 5.5 | $ | 29.8 | $ | 35.3 | ||||||||||||
Auto & General Liability | 1.3 | 1.8 | 3.1 | 0.8 | 1.1 | 1.9 | ||||||||||||||||||
Health & Welfare Liability | 2.3 | 0.3 | 2.6 | 2.3 | 0.3 | 2.6 | ||||||||||||||||||
Total Gross Claims Liabilities | 9.3 | 31.3 | 40.6 | 8.6 | 31.2 | 39.8 | ||||||||||||||||||
Insurance Recoverables | (2.9 | ) | (19.8 | ) | (22.7 | ) | (3.4 | ) | (20.7 | ) | (24.1 | ) | ||||||||||||
Reserves (net): | ||||||||||||||||||||||||
Workers’ Compensation Liability | $ | 3.2 | $ | 10.3 | $ | 13.5 | $ | 2.4 | $ | 9.7 | $ | 12.1 | ||||||||||||
Auto & General Liability | 0.9 | 0.9 | 1.8 | 0.5 | 0.5 | 1.0 | ||||||||||||||||||
Health & Welfare Liability | 2.3 | 0.3 | 2.6 | 2.3 | 0.3 | 2.6 | ||||||||||||||||||
Reserves (net) | $ | 6.4 | $ | 11.5 | $ | 17.9 | $ | 5.2 | $ | 10.5 | $ | 15.7 | ||||||||||||
The increase in these reserves for 2008 is due primarily to a general increase in workers’ compensation costs combined with an increase in severity of certain claims. The increase in our auto and general liability was due to an increase in our fleet size and severity of certain claims.
A 10% change in our incurred but not reported estimates would increase or decrease the accrualestimated reserves for employee salariesour workers’ compensation liability, general and benefitsauto insurance liability and an adjustment to foreign currency transaction losseshealth and welfare liability as of $0.3December 31, 2008 by $0.7 million, before taxes.$0.1 million and $0.2 million, respectively.
Three Months EndedPension Liabilities
We sponsored a qualified defined-benefit pension plan and a post-retirement benefit plan for employees hired before September 1986. There have been no new entrants to the pension or non-pension post-retirement benefit plans after those benefit plans were frozen on September 30, 1989. Pursuant to the plan of reorganization (May 2004) described in Exhibit 2.1 and incorporated by reference (see Part IV, Item 15, Exhibit Index of this Form 10-K), we were assigned the obligations for three former Fleming defined-benefit pension plans. All of the pension and post-retirement benefit plans are collectively referred to as the “Pension Plans.”
The determination of the obligation and expense associated with our Pension Plans are dependent, in part, on our selection of certain assumptions used by our independent actuaries in calculating these amounts. These assumptions are disclosed in Note 13 to the consolidated financial statements and include, among other things, the weighted average discount rate, the expected weighted average long-term rate of return on plan assets and the
rate of compensation increases. Actual results in any given year will often differ from actuarial assumptions because of economic and other factors. In accordance with GAAP, actual results that differ from the actuarial assumptions are accumulated and amortized over future periods and, therefore, affect recognized expense and recorded obligation in such future periods. While we believe our assumptions are appropriate, significant differences in actual results or changes in our assumptions may materially affect our pension and other postretirement obligations and the future expense.
We select the weighted average discount rates for each benefit plan as the rate at which the benefits could be effectively settled as of the measurement date. In selecting an appropriate weighted average discount rate we use a yield curve methodology, matching the expected benefits at each duration to the available high quality yields at that duration and calculating an equivalent yield, which is the ultimate discount rate used. The weighted average discount rate used to determine 2008 pension expense was 6.35%. A lower weighted average discount rate increases the present value of benefit obligations and increases pension expense. Expected return on pension plan assets is based on historical experience of our portfolio and the review of projected returns by asset class on broad, publicly traded equity and fixed-income indices, as well as target asset allocation. Our target asset allocation mix is designed to meet our long-term pension and post-retirement benefit plan requirements. For 2008 our assumed weighted average rate of return was 7.5% on our assets.
Sensitivity to changes in the major assumptions for our pension plans as of December 31, 2008 is as follows (dollars in millions):
| Percentage Point Change | Projected benefit obligation decrease (increase) | Expense decrease (increase) | ||||
Expected return on plan assets | +/- .25 pt | $0.0 /(0.0) | $0.1 / (0.1) | |||
Discount rate—Pension | +/- .25 pt | $(0.9) /0.8 | $0.0 / (0.0) | |||
Discount rate—Post-retirement | +/- .25 pt | $(0.3) /0.1 | $0.0 / (0.0) |
Stock-Based Compensation
(unaudited)We expense stock-based compensation using the fair value method as permitted bySFAS No. 123R,Share-Based Payment.Determining the appropriate fair value model and calculating the fair value of stock-based awards at the grant date requires considerable judgment, including estimating stock price volatility, expected life of share awards, and forfeiture rates. We develop our estimates based on historical data and market information which can change significantly over time. Currently we use the Black-Scholes option valuation model to value stock option awards.We recognize compensation expense using the straight-line amortization method for stock-based compensation awards with vesting based on service and ratably for awards based on performance conditions. If we were to use alternative valuation methodologies, the amount we expense for stock-based payments could be significantly different (See Note 12—Stock-Based Compensation Plans).
(in millions)
| September 30, 2004 | ||||||||||||
December 31, (Restated) | August 23 to (Restated) | July 1 to August 22, 2004 | ||||||||||
Net sales | $ | 1,061.8 | $ | 487.5 | $ | 636.8 | ||||||
Net sales—Cigarettes | 774.4 | 349.9 | 457.7 | |||||||||
Net sales—Food/Non-food | 287.4 | 137.6 | 179.1 | |||||||||
Cigarette inventory holding profits | 1.1 | — | — | |||||||||
Gross profit | 62.5 | 28.4 | 35.6 | |||||||||
Warehousing and distribution expenses | 29.5 | 13.1 | 19.6 | |||||||||
Selling and administrative expenses | 24.4 | 10.5 | 12.0 | |||||||||
Income from operations | 8.2 | 4.8 | 4.1 | |||||||||
Interest expense, net | 3.3 | 1.5 | 0.6 | |||||||||
Foreign currency transaction (gains) losses, net | (1.7 | ) | (0.7 | ) | — | |||||||
Reorganization items, net | 0.2 | 0.6 | (71.7 | ) | ||||||||
Net income (loss) | 3.3 | 2.0 | 49.3 | |||||||||
For the three months ended December 31, 2004 the resultsImpact of operations were impacted by an adjustment to decrease cost of goods sold by $0.45 million and an adjustment to record foreign currency gains of $1.7 million, before taxes.
For the period from August 23, 2004 through September 30, 2004 the results of operations were impacted by an adjustment to record foreign currency gains of $0.7 million, before taxes. Prior to our emergence from the Fleming bankruptcy, we did not record foreign currency gains or losses in our statement of operations because our foreign investments were considered to be of a permanent nature.
The following tables set forth the effects of the restatement for the quarterly periods indicated.
Three Months Ended
(unaudited)
(in millions)
June 30, (Restated) | March 31, (Restated) | |||||||
Net sales | $ | — | $ | — | ||||
Net sales—Cigarettes | — | — | ||||||
Net sales—Food/Non-food | — | — | ||||||
Cigarette inventory holding profits | — | — | ||||||
Gross profit | — | (0.5 | ) | |||||
Warehousing and distribution expenses | — | — | ||||||
Selling and administrative expenses(1) | — | 0.2 | ||||||
Income from operations | — | (0.7 | ) | |||||
Interest expense, net | — | — | ||||||
Foreign currency transaction (gains) losses, net | 0.3 | 0.3 | ||||||
Net income (loss) | (0.2 | ) | (0.6 | ) | ||||
Three Months Ended
(unaudited)
(in millions)
| September 30, 2004 | |||||||||||
December 31, (Restated) | August 23 to (Restated) | July 1 to August 22, 2004 | |||||||||
Net sales | $ | — | $ | — | $ | — | |||||
Net sales—Cigarettes | — | — | — | ||||||||
Net sales—Food/Non-food | — | — | — | ||||||||
Cigarette inventory holding profits | — | — | — | ||||||||
Gross profit | 0.5 | — | — | ||||||||
Warehousing and distribution expenses | — | — | — | ||||||||
Selling and administrative expenses | (0.2 | ) | — | — | |||||||
Income from operations | 0.7 | — | — | ||||||||
Interest expense, net | — | — | — | ||||||||
Foreign currency transaction (gains) losses, net | (1.7 | ) | (0.7 | ) | — | ||||||
Reorganization items, net | — | — | — | ||||||||
Net income (loss) | 1.5 | 0.4 | — | ||||||||
We also reclassified several items to conform to the current presentation. Book over draft amounts included in accounts payable on the balance sheet during reporting periods prior to December 31, 2005 have been presented separately on the balance sheet in this Form 10-K. Deferred stock-based compensation presented separately in stockholders’ equity on the balance sheet in the Form 10/A filed on October 21, 2005, is included in additional paid in capital in this Form 10-K. Net borrowings and repayments under the revolving line of credit which were presented separately in the statement of cash flows in the Form 10/A and in the Form 10-Q filed on November 30, 2005 are aggregated and presented net in this Form 10-K. Such reclassifications and other minor balance sheet reclassifications had no impact on consolidated net income or total stockholders’ equity as previously reported.
New Accounting Pronouncements on our Consolidated Financial Statements
Fair Value Measurements
In October 2005,September 2006, the FASB issuedSFAS No. 157,Fair Value Measurements. SFAS No. 157 defines fair value as the price that would be received to sell an asset or paid to transfer a liability in an orderly transaction between market participants at the measurement date. The standard also establishes a framework for measuring fair value and provides for expanded disclosures about fair value measurements. In February 2008, the FASB issuedFASB Staff Position (“FSP”) No. 13-1,FAS 157-1,“Application of FASB Statement No. 157 to FASB Statement No. 13 and Other Accounting Pronouncements That Address Fair Value Measurements for Rental Costs Incurred During a Construction Period”Purposes of Lease Classification or Measurement under Statement 13 (“ andFSP No. 13-1”)FAS 157-2, which requires rental costs associated with ground or building operating leasesEffective Date of FASB Statement No. 157. FSP 157-1 amends SFAS No. 157 to remove certain leasing transactions from its
scope. FSP 157-2 delays the effective date of SFAS No. 157 to fiscal years beginning after November 15, 2008 for all non-financial assets and non-financial liabilities, except for items that are incurred duringrecognized or disclosed at fair value in the financial statements on a construction period to be recognized as rental expense. FSPrecurring basis (at least annually). SFAS No. 13-1157 is effective for periods beginning after December 15, 2005. We will adopt FSP No. 13-1 beginning with itsour fiscal year 2006.beginning January 1, 2009. We do not expect the adoption of FSPSFAS No. 13-1 will have a significant impact on our financial statements.
In June 2005, the Financial Accounting Standards Board’s (the FASB) Emerging Issues Task Force reached a consensus on Issue No. 05-6, “Determining the Amortization Period for Leasehold Improvements” (EITF 05-6). This guidance requires that leasehold improvements acquired in a business combination or purchased subsequent157 to the inception of a lease be amortized over the lesser of the useful life of the assets or a term that includes renewals that are reasonably assured at the date of the business combination or purchase. This guidance is effective for interim reporting periods beginning after June 29, 2005, and is applicable only to leasehold improvements that are purchased or acquired in reporting periods beginning after the effective date. The adoption of EITF 05-6 did not have a material impact on our consolidated financial statements.
Fair Value Option for Financial Assets and Financial Liabilities
In May 2005,February 2007, the FASB issuedSFAS No. 154,159,Accounting ChangesThe Fair Value Option for Financial Assets and Error CorrectionsFinancial Liabilities., which provides companies an option to report selected financial assets and liabilities at fair value. SFAS No. 154 establishes new standards159 requires companies to provide information to assist financial statement users to understand the effect of a company’s choice to use fair value on accountingits earnings, as well as to display on the face of the balance sheet the fair value of assets and liabilities chosen by the company for changes in accounting principles. Pursuant to the new rules, all such changes must be accounted for by retrospective application to the financial statements of prior periods unless it is impracticable to do so.fair value accounting. SFAS No. 154 supercedes Accounting Principles Bulletin (APB) Opinion 20,Accounting for Changes and SFAS No. 3,Reporting Accounting Changes in Interim Financial Statements, though it carries forward the guidance of those pronouncements with respect to accounting for changes in estimates, changes in the reporting entity, and error corrections. This statement159 is effective for our fiscal year beginning January 1, 2008. SFAS 159 had no material impact on our consolidated financial statements for 2008.
Accounting for Business Combinations and Non-Controlling Interests
In December 2007, the FASB issuedSFAS No. 141R,Business Combinations, andSFAS 160, Noncontrolling Interests in Consolidated Financial Statements—An Amendment of ARB No. 51. SFAS 141R and SFAS 160 require most identifiable assets, liabilities, non-controlling interests, and goodwill acquired in a business combination to be recorded at “full fair value” and require non-controlling interests (previously referred to as minority interests) to be reported as a component of equity, which changes the accounting changes and error corrections made in yearsfor transactions with non-controlling interest holders. Both Statements are effective for periods beginning on or after December 15, 2005, with early2008, and earlier adoption permitted for changes and corrections made in years beginningis prohibited. SFAS 141R will be applied to business combinations occurring after May 2005.the effective date. SFAS 160 will be applied prospectively to all non-controlling interests, including any that arose before the effective date. We will adopt SFAS No. 154 for the fiscal year 2006 and do not expect the adoption of SFAS No. 154 will141R and SFAS 160 to have a material impact on our consolidated financial statements.
Disclosures about Derivative Instruments and Hedging Activities
In March 2005,2008, the FASB issued Financial InterpretationSFAS No. 47,161,AccountingDisclosures about Derivative Instruments and Hedging Activities—an Amendment of SFAS No. 133(“SFAS 161”). SFAS 161 enhances required disclosures regarding derivatives and hedging activities, including enhanced disclosures regarding how: (a) an entity uses derivative instruments, (b) derivative instruments and related hedged items are accounted for Conditional Asset Retirement Obligationsunder SFAS 133, and (c) derivative instruments and related hedged items affect an entity's financial position, financial performance, and cash flows. SFAS 161 is effective for fiscal years and interim periods beginning after November 15, 2008 and early adoption is permitted. We do not expect the adoption of SFAS 161 to have a material impact on the disclosures that accompany our consolidated financial statements.
Employers’ Disclosures about Postretirement Benefit Plan Assets(FIN 47
In December 2008, the FASB issuedFSP SFAS No. 132(R)-1,)Employer’s Disclosures about Postretirement Benefit Plan Assets, which is an interpretationamends Statement 132(R). FSP FAS 132(R)-1 enhances required disclosures about employers’ plan assets, including employers’ investment strategies, major categories of Statementplan assets, concentrations of Financial Accounting Standards (SFAS) No. 143, “Accounting for Asset Retirement Obligations.” FIN 47 clarifies terminologyrisk within SFAS No. 143plan assets, and requires an entityvaluation techniques used to recognize a liability formeasure the fair value of a conditional asset retirement obligation when incurred if the liability’s fair value can be reasonably estimated. FIN 47plan assets. FSP FAS 132(R)-1 is effective for fiscal years ending after December 15, 2005. The2009 and early adoption is permitted. We do not expect the adoption of FIN No. 47 did notFSP FAS 132(R)-1 in 2009 to have a material impact on our financial statements.
In March 2005, the SEC issued SAB No. 107 which offers guidance on SFAS No. 123(R). SAB No. 107 was issued to assist preparers by simplifying some of the implementation challenges of SFAS No. 123(R) while enhancing the informationdisclosures that investors receive. SAB No. 107 creates a framework that is premised on two overarching themes: (a) considerable judgment will be required by preparers to successfully implement SFAS No. 123(R), specifically when valuing employee stock options; and (b) reasonable individuals, acting in good faith, may conclude differently on the fair value of employee stock options. Key topics covered by SAB No. 107 include valuation models, expected volatility and expected term. We expect to apply the principles of SAB No. 107 in conjunction with our adoption of SFAS No. 123(R) in fiscal year 2006.
In December, 2004, the FASB issued SFAS No. 123 (revised 2004) (SFAS No. 123R),Share-Based Payment. SFAS No. 123(R) replaces SFAS No. 123,Accounting for Stock-Based Compensation and supersedes APB Opinion No. 25. Generally, the approach in SFAS No. 123(R) is similar to the approach described in SFAS No. 123 for fair value. However, SFAS No. 123(R) requires all share-based payments to employees, including grants of employee stock options, to be recognized in the financial statements based on their fair values and
prohibits pro forma disclosure as an alternative to financial statement recognition. SFAS No. 123(R) is effective for interim or annual reporting periods beginning after December 15, 2005. We will adopt SFAS No. 123(R) beginning in the first quarter of 2006 and do not expect the adoption will have a material impact on our financial statements.
In December 2004, the FASB issued SFAS No. 153Exchanges of Nonmonetary Assets—An Amendment of APB Opinion No. 29. The provisions of this statement are effective for non monetary asset exchanges occurring in periods beginning after June 15, 2005. This statement eliminates the exception to fair value for exchanges of similar productive assets and replaces it with a general exception for exchange transactions that do not have commercial substance—that is, transactions that are not expected to result in significant changes in the cash flows of the reporting entity. The adoption of SFAS No. 153 did have a significant impact onaccompany our consolidated financial statements.
In November 2004, FASB issued SFAS No. 151,Inventory CostsForward-Looking Trend and Other Information that amends the guidance
Cigarette Industry Trends
Cigarette Consumption
Aggregate United States cigarette consumption has declined since 1980. Prior to 2007 our cigarette sales had benefitted from a shift in Accounting Research Bulletin No. 43, Chapter 4,Inventory Pricing, (ARB No. 43) to clarify the accounting for abnormal amounts of idle facility expense, freight, handling costs, and wasted material (spoilage). In addition, this statement requires that an allocation of fixed production overheadssales to the costsconvenience retail segment, and as a result of conversionthis shift, convenience retail cigarette sales had not declined in proportion to the decline in overall consumption. However, our cigarette carton sales have declined in 2007 and 2008. We believe this trend is driven principally by an increasing decline in overall consumption due to factors such as increasingly more legislative controls which regulate where the consumer may or may not smoke, the acceleration in the frequency and amount of excise tax increases which reduces demand and manufacturer price increases. The shift in cigarette carton sales from other channels to the convenience retail segment may no longer be basedadequate to compensate for consumption declines.
Excise Taxes
Cigarette and tobacco products are subject to substantial excise taxes in the United States and Canada. Significant increases in cigarette-related taxes and/or fees have been levied by the taxing authorities in the past and are likely to continue to be levied in the future. We increase cigarette prices as excise tax increases are assessed on cigarette products which we sell. As a result, generally, increases in excise taxes do not increase the overall gross profit dollars in the same proportion, which, will result in a decline in overall gross profit percentage. In February 2009, the State Children’s Health Insurance Program (SCHIP) was signed into law. The SCHIP will be funded by an increase in federal cigarette excise taxes from 39¢ to $1.01 per pack of cigarettes effective April 1, 2009. We believe this increase in excise taxes will negatively impact our liquidity, contribute to a further decline in consumer cigarette consumption which will adversely impact our cigarette carton sales and could result in a decrease of our gross profit as a percentage of sales.
Cigarette Inventory Holding Profits
Distributors such as Core-Mark, from time to time, may earn higher gross profits on cigarette inventory and excise tax stamp quantities on hand either at the time cigarette manufacturers increase their prices or when states, localities or provinces increase their excise taxes and allow us to recognize cigarette inventory holding profits. These profits are recorded as an offset to cost of goods sold as the inventory is sold. Over the past several years we have earned significant cigarette inventory holding profits. For example, cigarette inventory holding profits for 2008, 2007 and 2006 were $3.1 million, or 0.9%, $7.3 million, or 2.2%, $4.1 million, or 1.4%, respectively, of our gross profit. It is difficult to predict whether cigarette inventory holding profits will occur in the future since they are dependent on the normal capacityactions of cigarette manufacturers and taxing authorities.
Food and Non-Food Product Trends
We focus our marketing efforts primarily on growing our food/non-food product sales. These product sales typically earn higher profit margins than cigarette sales and our goal is to continue to increase food/non-food product sales in the future to offset the potential decline in cigarette revenues and gross profits.
General Economic Trends
Uncertain Economic Conditions
Recent market turmoil and uncertain economic conditions, including increases in food and fuel prices, changes in the credit and housing markets leading to the current financial and credit crisis, and actual and potential job losses among many sectors of the production facilities. SFAS No. 151 is effectiveeconomy, significant declines in the stock market resulting in large losses to consumer retirement and investment accounts, and uncertainty regarding future federal tax and economic policies have resulted in reduced consumer confidence and curtailed retail spending. As a result,
convenience store operators may experience a reduction in same store sales in subsequent quarters, which will adversely affect demand for inventory costs incurred during years beginning after June 15, 2005. We will adopt SFAS No. 151 forour products and may result in reduced sales unless offset by other factors (such as an increase in the fiscal year 2006number or size of our customers’ stores, penetration of product offerings into existing stores serviced, or increases in our market share). These economic and market conditions, combined with continuing difficulties in the credit markets and the resulting pressures on liquidity may also place a number of our convenience store customers under financial stress, which would increase our credit risk and potential bad debt exposure. If the economic conditions in our key markets deteriorate or do not believeshow improvement, we may experience material adverse impacts to our business and operating results.
Increases in Fuel Prices
Increases in the price of fuel affect our business both indirectly and directly. Indirectly, they contribute to reduced consumer confidence and curtailed retail spending. Directly, they increase our transportation and delivery costs. Although to date we have succeeded in passing through a substantial portion of these increased costs in the form of fuel surcharges, we have not been able to do so in all cases, and there is no assurance that we will be able to continue to do so in the adoption willfuture. Where we have imposed a significant impact onsurcharge, our consolidated financial statements.
In July 2002,The Public Company Accounting Reformrecoveries typically lag our increased costs by some period of time. Accordingly, we have been adversely affected by increased fuel prices and Investor Protection Act of 2002 (the Sarbanes-Oxley Act) was enacted. Section 404 of the Sarbanes-Oxley Act stipulates that public companies must take responsibility for maintaining an effective system of internal control. The act requires public companies that are accelerated filersexpect this effect to report on the effectiveness of their internal control over financial reporting and obtain an attestation report from their independent registered public accounting firm about management’s report. Non-accelerated filers must comply with the new requirements related to internal control over financial reporting for their first year ending on or after July 15, 2006 under the latest dates of extension granted by the SEC. We are non-accelerated filers and therefore expect to comply with Section 404 of the Sarbanes-Oxley Act for the year ended December 31, 2006.continue so long as prices increase.
| ITEM 7.A. | QUANTITATIVE AND QUALITATIVE DISCLOSURES ABOUT MARKET RISK |
Our major exposure to market risk comes from changes in short-term interest rates on our variable rate debt. At December 31, 2005,2008, all amounts borrowed under our Credit Facility represented variable rate debt represented 100% of our total debt. Depending upon the borrowing option chosen, the variable rate debtinterest charged is generally based upon LIBOR or the prime rate plus an applicable margin. If interest rates on existing variable rate debt increased 6422 basis points (which approximates 10% of the weighted average interest rate on our variable rate debt)year end outstanding balance), our results from operations and cash flows would not be materially affected.
We conduct business in Canada. However, changes in the U.S./Canadian exchange rate had no material impact on the overall results of the Canadian operations, as virtually all revenues and expenses of such operations are Canadian dollar based. To the extent that funds are moved to or from Canada, we would be exposed to fluctuations in the U.S./CanadianCanadian/United States exchange rate. The U.S./CanadianCanadian/United States exchange rate based on the noon rate used for balance sheet translation was 1.1659, 1.2062, 1.2977,$1.2246, $0.9881, and 1.2924$1.1653 as of December 31, 2005, December 31, 2004, August 23, 2004,2008, 2007, and December 31, 2003.2006, respectively. We do not engage in hedging transactions.
| ITEM 8. | FINANCIAL STATEMENTS AND |
| Page | ||
(a) Financial Statements filed as part of this Annual Report on Form 10-K | ||
1. Financial | ||
A. Audited Financial Statements | ||
• | ||
• Consolidated Balance | ||
| 50 | |
| ||
| 51 | |
• Consolidated Statements of Stockholders’ Equity and Comprehensive | ||
| ||
| 52 | |
| ||
| 53 | |
2. Financial Statement | ||
• Schedule II Valuation and Qualifying Accounts | ||
REPORT OF INDEPENDENT REGISTERED PUBLIC ACCOUNTING FIRM
To the Board of Directors and Stockholders of
of Core-Mark Holding Company, Inc.:
We have audited the accompanying consolidated balance sheets of Core-Mark Holding Co.,Company, Inc. and Subsidiariessubsidiaries (the “Company”) as of August 23, 2004December 31, 2008 and 2007, and the related consolidated statements of operations, stockholders’ equity and comprehensive income, (loss), and cash flows for period from January 1, 2004 through August 22, 2004 andeach of the yearthree years in the period ended December 31, 2003.2008. Our audits also includeincluded the financial statement schedule Schedule II—Valuationlisted in the Index at Item 8 (a) (2). These financial statements and Qualifying Accounts for the period from January 1, 2004 through August 22, 2004 and the year ended December 31, 2003. These consolidated financial statementsstatement schedule are the responsibility of the Company’s management. Our responsibility is to express an opinion on thesethe consolidated financial statements and financial statement schedule based on our audits.
We conducted our audits in accordance with the standards of the Public Company Accounting Oversight Board (United States). Those standards require that we plan and perform the audit to obtain reasonable assurance about whether the financial statements are free of material misstatement. An audit includes examining, on a test basis, evidence supporting the amounts and disclosures in the financial statements. An audit also includes assessing the accounting principles used and significant estimates made by management, as well as evaluating the overall financial statement presentation. We believe that our audits provide a reasonable basis for our opinion.
In our opinion, the consolidatedsuch financial statements referred to above present fairly, in all material respects, the financial position of Core-Mark Holding Co.,Company, Inc. and Subsidiariessubsidiaries as of August 23, 2004,December 31, 2008 and 2007, and the results of their operations and their cash flows for each of the period from January 1, 2004 through August 22, 2004 and the yearthree years then ended, December 31, 2003, in conformity with accounting principles generally accepted in the United States of America. Also, in our opinion, the relatedsuch financial statement schedule, for the period from January 1, 2004 through August 22, 2004 and the year ended December 31, 2003, when considered in relation to the basic consolidated financial statements taken as a whole, presents fairly, in all material respects, the information set forth therein.
As discussed in Note 113 to the consolidated financial statements, the United States Bankruptcy Court for District of Delaware confirmed the Third Amended and Revised Joint Plan of Reorganization of the Fleming Companies, Inc and its Subsidiaries (the “plan”) on July 27, 2004. Confirmation of the plan and the Company’s emergence from bankruptcy resulted in the discharge of claims against the Company that arose before April 1, 2003 as provided for in the plan. The plan was substantially consummated and the Company emerged from bankruptcy on August 23, 2004. In connection with its emergence from bankruptcy,December 31, 2006, the Company adopted fresh start accounting asStatement of August 23, 2004.
/s/ Burr, Pilger & Mayer LLP
San Francisco, California
September 1, 2005
REPORT OF INDEPENDENT REGISTERED PUBLIC ACCOUNTING FIRM
To Board of DirectorsFinancial Accounting Standards No. 158, “Employers’ Accounting for Defined Benefit Pension and Stockholders of
Core-Mark Holding Company, Inc.:
In our opinion,Other Postretirement Plans.” As discussed in Note 10 to the accompanying consolidated balance sheets and the related consolidated statement of operations, stockholders’ equity and comprehensive income (loss) and cash flows present fairly, in all material respects, the financial position of Core-Mark Holding Company, Inc. and its subsidiaries (Successor Company) at December 31, 2005 and December 31, 2004, and the results of their operations and their cash flows for the year ended December 31, 2005 and for the period from August 23, 2004 to December 31, 2004 in conformity with accounting principles generally accepted in the United States of America. In addition, in our opinion, the financial statement schedule listed in the index appearing on page 59 presents fairly, in all material respects, the information set forth therein for the year ended December 31, 2005 and for the period from August 23, 2004 to December 31, 2004 when read in conjunction with the related consolidated financial statements. These financial statements, andon January 1, 2007, the financial statement schedule are the responsibility of the Successor Company’s management. Our responsibility is to express an opinion on these financial statements and the financial statement schedule based on our audits. Company adopted Financial Accounting Standards Board Interpretation No. 48, “Accounting for Uncertainty in Income Taxes.”
We conducted our audits of these statementshave also audited, in accordance with the standards of the Public Company Accounting Oversight Board (United States). Those standards require that we plan and perform, the audit to obtain reasonable assurance about whether theCompany’s internal control over financial statements are free of material misstatement. An audit includes examining, on a test basis, evidence supporting the amounts and disclosures in the financial statements, assessing the accounting principles used and significant estimates made by management, and evaluating the overall financial statement presentation. We believe that our audits provide a reasonable basis for our opinion.
As discussed in Note 1 to the consolidated financial statements, the United States Bankruptcy Court for the District of Delaware confirmed the Third Amended and Revised Joint Plan of Reorganization of Fleming Companies, Inc. and its Subsidiaries (the “plan”) on July 27, 2004. Confirmation of the plan resulted in discharge of all claims against the Company that arose before April 1, 2003 and substantially alters rights and interest of equity security holders as provided for in the plan. The plan was substantially consummated on August 23, 2004 and the Company emerged from bankruptcy. In connection with its emergence from bankruptcy, the Company adopted fresh start accounting as of August 23, 2004.
As discussed in Note 2 to the consolidated financial statements, the Successor Company has restated its consolidated financial statementsreporting as of December 31, 20042008, based on the criteria established inInternal Control—Integrated Framework issued by the Committee of Sponsoring Organizations of the Treadway Commission and forour report dated March 13, 2009 expressed an unqualified opinion on the period from August 23, 2004 through December 31, 2004.
/s/ PricewaterhouseCoopers LLPCompany’s internal control over financial reporting.
San Francisco, California
/s/ Deloitte & Touche LLP |
San Francisco, California |
AprilMarch 13, 20062009
CORE-MARK HOLDING COMPANY, INC. AND SUBSIDIARIES
CONSOLIDATED BALANCE SHEETS
(In millions, except per share data)
| Successor Company | |||||||||||||||||||
December 31, 2005 | December 31, (Restated) | August 23, 2004 | December 31, 2008 | December 31, 2007 | |||||||||||||||
| Assets | |||||||||||||||||||
Current assets: | |||||||||||||||||||
Cash and cash equivalents | $ | 30.0 | $ | 26.2 | $ | 34.5 | $ | 15.7 | $ | 21.3 | |||||||||
Restricted cash | 10.8 | 12.1 | 26.6 | 11.4 | 11.5 | ||||||||||||||
Accounts receivable, net of allowance for doubtful accounts of $6.5, $7.5 and $7.0 respectively | 128.6 | 133.9 | 137.1 | ||||||||||||||||
Other receivables, net | 27.2 | 34.1 | 53.9 | ||||||||||||||||
Inventories, net | 199.7 | 186.4 | 141.9 | ||||||||||||||||
Deposits and prepayments | 18.6 | 36.9 | 52.4 | ||||||||||||||||
Accounts receivable, net of allowance for doubtful accounts of $8.8 million and $9.3 million, respectively (Note 5) | 146.9 | 135.7 | |||||||||||||||||
Other receivables, net (Note 5) | 34.1 | 32.1 | |||||||||||||||||
Inventories, net (Note 6) | 238.4 | 216.4 | |||||||||||||||||
Deposits and prepayments (Note 5) | 26.5 | 36.9 | |||||||||||||||||
Deferred income taxes (Note 10) | 12.2 | 8.4 | |||||||||||||||||
Total current assets | 414.9 | 429.6 | 446.4 | 485.2 | 462.3 | ||||||||||||||
Property and equipment, net | 40.9 | 41.3 | 38.0 | ||||||||||||||||
Deferred income taxes | 2.1 | 0.7 | — | ||||||||||||||||
Other non-current assets, net | 52.5 | 32.6 | 32.8 | ||||||||||||||||
Property and equipment, net (Note 7) | 74.2 | 69.3 | |||||||||||||||||
Deferred income taxes (Note 10) | 12.1 | 7.2 | |||||||||||||||||
Goodwill | 3.7 | 2.8 | |||||||||||||||||
Other non-current assets, net (Note 5) | 37.4 | 35.5 | |||||||||||||||||
Total assets | $ | 510.4 | $ | 504.2 | $ | 517.2 | $ | 612.6 | $ | 577.1 | |||||||||
| Liabilities and Stockholders’ Equity | |||||||||||||||||||
Current liabilities: | |||||||||||||||||||
Accounts payable | $ | 46.3 | $ | 40.6 | $ | 19.8 | $ | 66.0 | $ | 54.3 | |||||||||
Book overdrafts | 20.2 | 20.7 | 15.7 | 17.8 | 21.1 | ||||||||||||||
Cigarette and tobacco taxes payable | 64.0 | 49.0 | 51.8 | 103.2 | 94.2 | ||||||||||||||
Accrued liabilities | 59.3 | 60.3 | 61.2 | ||||||||||||||||
Income taxes payable | 6.0 | 15.6 | 9.3 | ||||||||||||||||
Deferred income taxes | 13.3 | 14.4 | 21.6 | ||||||||||||||||
Accrued liabilities (Note 5) | 58.1 | 56.7 | |||||||||||||||||
Deferred income taxes (Note 10) | 1.6 | — | |||||||||||||||||
Total current liabilities | 209.1 | 200.6 | 179.4 | 246.7 | 226.3 | ||||||||||||||
Long-term debt, net | 59.6 | 77.5 | 118.7 | ||||||||||||||||
Other tax liabilities | 3.9 | 1.8 | — | ||||||||||||||||
Deferred income taxes | — | — | 0.3 | ||||||||||||||||
Long-term debt, net (Note 8) | 30.8 | 29.7 | |||||||||||||||||
Other long-term liabilities | 11.1 | 13.7 | |||||||||||||||||
Claims liabilities, net of current portion | 41.0 | 46.3 | 46.6 | 31.3 | 31.2 | ||||||||||||||
Pension liabilities | 12.2 | 11.4 | 10.9 | 19.1 | 9.7 | ||||||||||||||
Total liabilities | 325.8 | 337.6 | 355.9 | $ | 339.0 | $ | 310.6 | ||||||||||||
Commitments and contingencies (Note 10) | |||||||||||||||||||
Commitments and contingencies (Note 9) | |||||||||||||||||||
Stockholders’ equity: | |||||||||||||||||||
Common stock; $0.01 par value (50,000,000 shares authorized, 9,809,929, 9,815,375 and 9,815,375 shares issued and outstanding at December 31, 2005, December 31, 2004 and August 23, 2004) | 0.1 | 0.1 | 0.1 | ||||||||||||||||
Common stock; $0.01 par value (50,000,000 shares authorized, 10,746,416 and 10,445,886 shares issued and outstanding at December 31, 2008 and December 31, 2007, respectively) | $ | 0.1 | $ | 0.1 | |||||||||||||||
Additional paid-in capital | 166.1 | 162.1 | 161.2 | 209.3 | 202.6 | ||||||||||||||
Treasury stock at cost, 396,716 shares of common stock (Note 14) | (11.0 | ) | — | ||||||||||||||||
Retained earnings | 19.6 | 5.3 | — | 82.3 | 64.4 | ||||||||||||||
Accumulated other comprehensive loss | (1.2 | ) | (0.9 | ) | — | (7.1 | ) | (0.6 | ) | ||||||||||
Total stockholders’ equity | 184.6 | 166.6 | 161.3 | 273.6 | 266.5 | ||||||||||||||
Total liabilities and stockholders’ equity | $ | 510.4 | $ | 504.2 | $ | 517.2 | $ | 612.6 | $ | 577.1 | |||||||||
The accompanying notes are an integral part of these consolidated financial statements.
CORE-MARK HOLDING COMPANY, INC. AND SUBSIDIARIES
CONSOLIDATED STATEMENTS OF OPERATIONS
(In millions, except per share data)
| Successor Company | Predecessor Company | ||||||||||||||
| Year ended December 31, 2005 | Period from December 31, | Period from August 22, 2004 | Year ended December 31, | ||||||||||||
Net sales(a) | $ | 4,891.1 | $ | 1,549.3 | $ | 2,673.1 | $ | 4,324.3 | |||||||
Cost of goods sold(a) (b) | 4,620.1 | 1,458.4 | 2,523.3 | 4,054.9 | |||||||||||
Gross profit | 271.0 | 90.9 | 149.8 | 269.4 | |||||||||||
Warehousing and distribution expenses | 135.7 | 42.6 | 78.7 | 130.2 | |||||||||||
Selling, general and administrative expenses | 90.0 | 34.9 | 59.3 | 98.3 | |||||||||||
Amortization of intangible assets | 1.3 | 0.4 | — | 1.7 | |||||||||||
Goodwill and asset impairment charges | — | — | — | 291.4 | |||||||||||
Total operating expenses | 227.0 | 77.9 | 138.0 | 521.6 | |||||||||||
Income (loss) from operations | 44.0 | 13.0 | 11.8 | (252.2 | ) | ||||||||||
Interest expense, net | 10.0 | 4.8 | 4.4 | 5.4 | |||||||||||
Foreign currency transaction (gains) losses, net | 0.9 | (2.4 | ) | — | — | ||||||||||
Loss on early extinguishment of debt | 6.2 | — | — | — | |||||||||||
Reorganization items, net | — | 0.8 | (70.0 | ) | 7.3 | ||||||||||
Amortization of debt issuance costs | 1.0 | 0.4 | — | — | |||||||||||
Income (loss) from continuing operations before income taxes | 25.9 | 9.4 | 77.4 | (264.9 | ) | ||||||||||
Provision for income taxes from continuing operations | 11.6 | 4.1 | 26.7 | 0.3 | |||||||||||
Income (loss) from continuing operations | 14.3 | 5.3 | 50.7 | (265.2 | ) | ||||||||||
Income (loss) from discontinued operations before income taxes | — | — | — | (4.6 | ) | ||||||||||
Provision (benefit) for income taxes from discontinued operations | — | — | — | (1.8 | ) | ||||||||||
Income (loss) from discontinued operations, net of tax | — | — | — | (2.8 | ) | ||||||||||
Net income (loss) | $ | 14.3 | $ | 5.3 | $ | 50.7 | $ | (268.0 | ) | ||||||
Basic income (loss) per common share: | |||||||||||||||
Continuing operations | $ | 1.46 | $ | 0.54 | $ | 5.17 | $ | (27.06 | ) | ||||||
Discontinued operations | — | — | — | (0.29 | ) | ||||||||||
Net income (loss) | $ | 1.46 | $ | 0.54 | $ | 5.17 | $ | (27.35 | ) | ||||||
Diluted income (loss) per common share: | |||||||||||||||
Continuing operations | $ | 1.37 | $ | 0.54 | $ | 5.17 | $ | (27.06 | ) | ||||||
Discontinued operations | — | — | — | (0.29 | ) | ||||||||||
Net income (loss) | $ | 1.37 | $ | 0.54 | $ | 5.17 | $ | (27.35 | ) | ||||||
Basic weighted average shares | 9.8 | 9.8 | 9.8 | 9.8 | |||||||||||
Diluted weighted average shares | 10.5 | 9.8 | 9.8 | 9.8 | |||||||||||
| Year Ended December 31, | ||||||||||||
| 2008 | 2007 | 2006 | ||||||||||
Net sales | $ | 6,044.9 | $ | 5,560.9 | $ | 5,314.4 | ||||||
Cost of goods sold | 5,685.8 | 5,228.3 | 5,016.7 | |||||||||
Gross profit | 359.1 | 332.6 | 297.7 | |||||||||
Warehousing and distribution expenses | 197.6 | 174.1 | 151.1 | |||||||||
Selling, general and administrative expenses | 129.4 | 119.0 | 106.6 | |||||||||
Amortization of intangible assets | 2.0 | 1.8 | 1.5 | |||||||||
Total operating expenses | 329.0 | 294.9 | 259.2 | |||||||||
Income from operations | 30.1 | 37.7 | 38.5 | |||||||||
Interest expense | 2.2 | 2.4 | 5.3 | |||||||||
Interest income | (1.0 | ) | (1.4 | ) | (1.1 | ) | ||||||
Foreign currency transaction losses (gains), net | 6.3 | (0.9 | ) | 0.3 | ||||||||
Income before income taxes | 22.6 | 37.6 | 34.0 | |||||||||
Provision for income taxes (Note 10) | 4.7 | 13.5 | 13.4 | |||||||||
Net income | $ | 17.9 | $ | 24.1 | $ | 20.6 | ||||||
Basic income per common share (Note 11) | $ | 1.71 | $ | 2.30 | $ | 2.05 | ||||||
Diluted income per common share (Note 11) | $ | 1.64 | $ | 2.15 | $ | 1.87 | ||||||
Basic weighted average shares (Note 11) | 10.5 | 10.5 | 10.0 | |||||||||
Diluted weighted average shares (Note 11) | 10.9 | 11.2 | 11.0 | |||||||||
The accompanying notes are an integral part of these consolidated financial statements.
CORE-MARK HOLDING COMPANY, INC. AND SUBSIDIARIES
CONSOLIDATED STATEMENTS OF STOCKHOLDERS’ EQUITY
AND COMPREHENSIVE INCOME (LOSS)
(In millions)
Common Stock | Additional Paid-In Capital | Retained Earnings (Accumulated Deficit) | Accumulated Other Comprehensive Income (Loss) | Total Stockholders’ Equity | Total Comprehensive Income (Loss) | ||||||||||||||||||||
| Shares | Amount | ||||||||||||||||||||||||
| Predecessor Company | |||||||||||||||||||||||||
Balance, December 31, 2002 | — | $ | — | $ | 490.5 | $ | 23.0 | $ | (1.2 | ) | $ | 512.3 | $ | — | |||||||||||
Net loss | — | — | — | (268.0 | ) | — | (268.0 | ) | (268.0 | ) | |||||||||||||||
Net distributions to Fleming Companies, Inc. | — | — | (28.5 | ) | — | — | (28.5 | ) | — | ||||||||||||||||
Minimum pension liability adjustment, net of taxes of $0.1 | — | — | — | — | (0.1 | ) | (0.1 | ) | (0.1 | ) | |||||||||||||||
Foreign currency translation adjustment | — | — | — | — | 3.0 | 3.0 | 3.0 | ||||||||||||||||||
Total comprehensive loss | $ | (265.1 | ) | ||||||||||||||||||||||
Balance, December 31, 2003 | — | — | 462.0 | (245.0 | ) | 1.7 | 218.7 | ||||||||||||||||||
Net income | — | — | — | 50.7 | — | 50.7 | 50.7 | ||||||||||||||||||
Net distributions to Fleming Companies, Inc. | — | — | 55.0 | — | — | 55.0 | — | ||||||||||||||||||
Minimum pension liability adjustment, net of taxes of $0.7 | — | — | — | — | (1.1 | ) | (1.1 | ) | (1.1 | ) | |||||||||||||||
Foreign currency translation adjustment | — | — | — | — | (0.5 | ) | (0.5 | ) | (0.5 | ) | |||||||||||||||
Total comprehensive income | $ | 49.1 | |||||||||||||||||||||||
Balance prior to application of fresh-start accounting | — | — | 517.0 | (194.3 | ) | 0.1 | 322.8 | ||||||||||||||||||
Reorganization and fresh-start accounting adjustments(See Note 8— Reorganization Items, Net | 9.8 | 0.1 | (355.8 | ) | 194.3 | (0.1 | ) | (161.5 | ) | ||||||||||||||||
Balance, August 23, 2004 | 9.8 | $ | 0.1 | $ | 161.2 | $ | — | $ | — | $ | 161.3 | ||||||||||||||
| Successor Company | |||||||||||||||||||||||||
Balance, August 23, 2004 | 9.8 | $ | 0.1 | $ | 161.2 | $ | — | $ | — | $ | 161.3 | $ | — | ||||||||||||
Net income, as restated | — | — | — | 5.3 | — | 5.3 | 5.3 | ||||||||||||||||||
Amortization of deferred stock-based compensation | — | — | 0.9 | — | — | 0.9 | — | ||||||||||||||||||
Minimum pension liability adjustment, net of taxes of $0.6 | — | — | — | — | (0.9 | ) | (0.9 | ) | (0.9 | ) | |||||||||||||||
Foreign currency translation adjustment, as restated | — | — | — | — | — | — | — | ||||||||||||||||||
Total comprehensive income | $ | 4.4 | |||||||||||||||||||||||
Balance, December 31, 2004, as restated | 9.8 | 0.1 | 162.1 | 5.3 | (0.9 | ) | 166.6 | — | |||||||||||||||||
Net income, | — | — | — | 14.3 | — | 14.3 | 14.3 | ||||||||||||||||||
Amortization of deferred stock based compensation | — | — | 4.0 | — | — | 4.0 | — | ||||||||||||||||||
Minimum pension liability adjustment, net of taxes of $0.3 | — | — | — | — | (0.4 | ) | (0.4 | ) | (0.4 | ) | |||||||||||||||
Foreign currency translation adjustment | — | — | — | — | 0.1 | 0.1 | 0.1 | ||||||||||||||||||
Total comprehensive income | $ | 14.0 | |||||||||||||||||||||||
Balance, December 31, 2005 | 9.8 | $ | 0.1 | $ | 166.1 | $ | 19.6 | $ | (1.2 | ) | $ | 184.6 | |||||||||||||
| Common Stock | Additional Paid-In Capital | Treasury Stock | Retained Earnings | Accumulated Other Comprehensive Income (Loss) | Total Stockholders’ Equity | Total Comprehensive Income | ||||||||||||||||||||||
| Shares | Amount | |||||||||||||||||||||||||||
Balance, December 31, 2005 | 9.8 | $ | 0.1 | $ | 166.1 | $ | — | $ | 19.6 | $ | (1.2 | ) | $ | 184.6 | — | |||||||||||||
Net income | — | — | — | — | 20.6 | — | 20.6 | 20.6 | ||||||||||||||||||||
Amortization of stock-based compensation | — | — | 4.4 | — | — | — | 4.4 | — | ||||||||||||||||||||
Cash proceeds from exercise of common stock | — | — | 3.2 | — | — | — | 3.2 | — | ||||||||||||||||||||
Minimum pension liability adjustment, net of taxes of $0.9 | — | — | — | — | — | 1.3 | 1.3 | 1.3 | ||||||||||||||||||||
SFAS No. 158 adoption adjustment, net of taxes of $0.3 | — | — | — | — | — | (0.4 | ) | (0.4 | ) | — | ||||||||||||||||||
Excess tax deductions associated with common stock | — | — | 1.8 | — | — | — | 1.8 | — | ||||||||||||||||||||
Issuance of stock-based instruments | 0.4 | — | — | — | — | — | — | — | ||||||||||||||||||||
Foreign currency translation adjustment | — | — | — | — | — | 0.2 | 0.2 | 0.2 | ||||||||||||||||||||
Total comprehensive income | $ | 22.1 | ||||||||||||||||||||||||||
Balance, December 31, 2006 | 10.2 | 0.1 | 175.5 | — | 40.2 | (0.1 | ) | 215.7 | ||||||||||||||||||||
Net income | — | — | — | — | 24.1 | — | 24.1 | $ | 24.1 | |||||||||||||||||||
Amortization of stock-based compensation | — | — | 5.3 | — | — | — | 5.3 | — | ||||||||||||||||||||
Cash proceeds from exercise of common stock | — | — | 2.2 | — | — | — | 2.2 | — | ||||||||||||||||||||
FIN 48 adoption adjustments | — | — | 18.5 | — | 0.1 | — | 18.6 | — | ||||||||||||||||||||
Pension plan funded status adjustment, net of taxes of $0.7 | — | — | — | — | — | (1.0 | ) | (1.0 | ) | (1.0 | ) | |||||||||||||||||
Excess tax deductions associated with common stock | — | — | 1.1 | — | — | — | 1.1 | — | ||||||||||||||||||||
Issuance of stock-based instruments | 0.2 | — | — | — | — | — | — | — | ||||||||||||||||||||
Foreign currency translation adjustment | — | — | — | — | — | 0.5 | 0.5 | 0.5 | ||||||||||||||||||||
Total comprehensive income | $ | 23.6 | ||||||||||||||||||||||||||
Balance, December 31, 2007 | 10.4 | 0.1 | 202.6 | — | 64.4 | (0.6 | ) | 266.5 | ||||||||||||||||||||
Net income | — | — | — | — | 17.9 | — | 17.9 | $ | 17.9 | |||||||||||||||||||
Amortization of stock-based compensation | — | — | 3.9 | — | — | — | 3.9 | — | ||||||||||||||||||||
Cash proceeds from exercise of common stock | — | — | 2.5 | — | — | — | 2.5 | — | ||||||||||||||||||||
Pension plan funded status adjustment, net of taxes of $3.8 | — | — | — | — | — | (5.9 | ) | (5.9 | ) | (5.9 | ) | |||||||||||||||||
Excess tax deductions associated with common stock | — | — | 0.3 | — | — | — | 0.3 | — | ||||||||||||||||||||
Issuance of stock-based instruments | 0.7 | — | — | — | — | — | — | — | ||||||||||||||||||||
Repurchases of common stock | (0.4 | ) | — | — | (11.0 | ) | — | — | (11.0 | ) | — | |||||||||||||||||
Foreign currency translation adjustment | — | — | — | — | — | (0.6 | ) | (0.6 | ) | (0.6 | ) | |||||||||||||||||
Total comprehensive income | $ | 11.4 | ||||||||||||||||||||||||||
Balance, December 31, 2008 | 10.7 | $ | 0.1 | $ | 209.3 | $ | (11.0 | ) | $ | 82.3 | $ | (7.1 | ) | $ | 273.6 | |||||||||||||
The accompanying notes are an integral part of these consolidated financial statements.
CORE-MARK HOLDING COMPANY, INC. AND SUBSIDIARIES
CONSOLIDATED STATEMENTS OF CASH FLOWS
(In millions)
| Successor Company | Predecessor Company | |||||||||||||||
Year ended December 31, 2005 | Period from (Restated) | Period from January 1 through August 22, 2004 | Year ended December 31, 2003 | |||||||||||||
Cash flows from operating activities: | ||||||||||||||||
Net income (loss) | $ | 14.3 | $ | 5.3 | $ | 50.7 | $ | (268.0 | ) | |||||||
Adjustments to reconcile net income (loss) to net cash provided by (used in) operating activities: | ||||||||||||||||
LIFO and inventory reserves | 7.5 | 1.9 | 2.7 | (2.1 | ) | |||||||||||
Fresh-start accounting adjustments, net | — | — | (81.3 | ) | — | |||||||||||
Amortization of stock-based compensation expense | 4.0 | 0.9 | — | — | ||||||||||||
Allowance for doubtful accounts | (0.3 | ) | 1.4 | 5.7 | 3.4 | |||||||||||
Depreciation and amortization | 13.5 | 4.7 | 7.0 | 9.9 | ||||||||||||
Loss on early extinguishment of debt | 4.4 | |||||||||||||||
Impairment of goodwill and other long-lived assets | — | — | — | 291.4 | ||||||||||||
Foreign currency transaction (gains) losses, net | 0.9 | (2.4 | ) | — | — | |||||||||||
Deferred income taxes | (2.7 | ) | (7.2 | ) | 21.7 | (16.4 | ) | |||||||||
Changes in operating assets and liabilities, net of acquisitions: | ||||||||||||||||
Restricted cash | 1.7 | 14.5 | (6.7 | ) | (19.8 | ) | ||||||||||
Accounts receivable | 5.1 | 1.1 | (6.4 | ) | 39.1 | |||||||||||
Other receivables | 8.3 | 18.5 | 9.7 | (29.5 | ) | |||||||||||
Inventories | (19.5 | ) | (48.4 | ) | 47.8 | 21.6 | ||||||||||
Deposits, prepayments and other non-current assets | (6.1 | ) | 13.8 | (22.8 | ) | (18.2 | ) | |||||||||
Accounts payable | 4.4 | 18.9 | 11.2 | (81.0 | ) | |||||||||||
Cigarette and tobacco taxes payable | 13.6 | 0.2 | (1.1 | ) | (18.3 | ) | ||||||||||
Liabilities subject to compromise | — | — | (55.6 | ) | 121.6 | |||||||||||
Pension, claims and other accrued liabilities and income taxes payable | (13.9 | ) | 8.7 | (7.4 | ) | 19.7 | ||||||||||
Net cash provided by (used in) operating activities | 35.2 | 31.9 | (24.8 | ) | 53.4 | |||||||||||
Cash flows from investing activities: | ||||||||||||||||
Additions to property and equipment, net | (6.6 | ) | (5.7 | ) | (6.4 | ) | (8.4 | ) | ||||||||
Net cash used in investing activities | (6.6 | ) | (5.7 | ) | (6.4 | ) | (8.4 | ) | ||||||||
Cash flows from financing activities: | ||||||||||||||||
Proceeds from emergence financing | — | — | 120.5 | — | ||||||||||||
Net cash distributed to Trusts upon emergence | — | — | (139.6 | ) | — | |||||||||||
Net capital distributions from (to) Fleming | — | — | 55.0 | (28.5 | ) | |||||||||||
Borrowing under revolving line of credit | 86.5 | — | — | — | ||||||||||||
Repayments under revolving line of credit | (71.9 | ) | (41.4 | ) | — | — | ||||||||||
Principal payments on long-term debt | (35.5 | ) | — | — | — | |||||||||||
Changes in debt issuance costs | (2.1 | ) | — | (3.8 | ) | — | ||||||||||
Increase (decrease) book overdrafts | (0.5 | ) | 5.0 | 3.0 | (16.4 | ) | ||||||||||
Net cash (used in) provided by financing activities | (23.5 | ) | (36.4 | ) | 35.1 | (44.9 | ) | |||||||||
Effects of changes in foreign exchange rates | (1.3 | ) | 1.9 | (0.5 | ) | 5.1 | ||||||||||
(Decrease) increase in cash and cash equivalents | 3.8 | (8.3 | ) | 3.4 | 5.2 | |||||||||||
Cash and cash equivalents, beginning period | 26.2 | 34.5 | 31.1 | 25.9 | ||||||||||||
Cash and cash equivalents, end of period | $ | 30.0 | $ | 26.2 | $ | 34.5 | $ | 31.1 | ||||||||
Supplemental disclosures: | ||||||||||||||||
Cash paid during the period for: | ||||||||||||||||
Income taxes | $ | 21.4 | $ | 4.0 | $ | — | $ | — | ||||||||
Interest | $ | 10.8 | $ | 1.7 | $ | — | $ | 2.3 | ||||||||
Payments made in conjunction with Chapter 11 reorganization: | ||||||||||||||||
Professional fees | $ | — | $ | 0.5 | $ | 1.6 | $ | 2.0 | ||||||||
Pre-petition claim payments | $ | — | $ | — | $ | 54.9 | $ | — | ||||||||
Non-cash transactions | $ | — | $ | — | $ | 1.6 | $ | — | ||||||||
| Year Ended December 31, | ||||||||||||
| 2008 | 2007 | 2006 | ||||||||||
Cash flows from operating activities: | ||||||||||||
Net income | $ | 17.9 | $ | 24.1 | $ | 20.6 | ||||||
Adjustments to reconcile net income to net cash provided by operating activities: | ||||||||||||
LIFO and inventory provisions | 11.0 | 14.5 | 3.7 | |||||||||
Amortization of debt issuance costs | 0.5 | 0.4 | 0.4 | |||||||||
Amortization of stock-based compensation expense | 3.9 | 5.3 | 4.4 | |||||||||
Bad debt expense, net | 1.6 | 6.9 | (1.2 | ) | ||||||||
Depreciation and amortization | 17.4 | 14.9 | 13.2 | |||||||||
Foreign currency transaction losses (gains), net | 6.3 | (0.9 | ) | 0.3 | ||||||||
Deferred income taxes | (4.9 | ) | (4.5 | ) | 3.2 | |||||||
Changes in operating assets and liabilities: | ||||||||||||
Accounts receivable | (2.9 | ) | 9.2 | (1.5 | ) | |||||||
Other receivables | (4.2 | ) | 6.0 | (4.9 | ) | |||||||
Inventories | (31.9 | ) | (7.1 | ) | (3.3 | ) | ||||||
Deposits, prepayments and other non-current assets | 4.4 | (8.5 | ) | 5.7 | ||||||||
Accounts payable | 13.8 | 2.3 | 4.9 | |||||||||
Cigarette and tobacco taxes payable | 16.2 | 22.7 | 2.7 | |||||||||
Pension, claims and other accrued liabilities | 6.2 | (15.3 | ) | (11.8 | ) | |||||||
Income taxes payable | 0.3 | (3.4 | ) | 1.1 | ||||||||
Net cash provided by operating activities | 55.6 | 66.6 | 37.5 | |||||||||
Cash flows from investing activities: | ||||||||||||
Restricted cash | (2.2 | ) | (0.6 | ) | 1.5 | |||||||
Acquisition of business, net of cash acquired | (26.4 | ) | — | (55.5 | ) | |||||||
Additions to property and equipment, net | (19.9 | ) | (20.8 | ) | (12.8 | ) | ||||||
Capitalization of software | (0.7 | ) | (2.0 | ) | — | |||||||
Proceeds from sale of fixed assets | 0.1 | 0.1 | 0.2 | |||||||||
Net cash used in investing activities | (49.1 | ) | (23.3 | ) | (66.6 | ) | ||||||
Cash flows from financing activities: | ||||||||||||
Borrowings (repayments) under revolving credit facility, net | 0.1 | (48.4 | ) | 18.4 | ||||||||
Repurchases of common stock shares (treasury stock) | (11.0 | ) | — | — | ||||||||
Proceeds from exercise of common stock options | 2.5 | 2.2 | 3.2 | |||||||||
Excess tax deductions associated with stock-based compensation | 0.6 | 1.1 | 1.8 | |||||||||
(Decrease) increase in book overdrafts | (3.2 | ) | 5.6 | (4.7 | ) | |||||||
Net cash (used in) provided by financing activities | (11.0 | ) | (39.5 | ) | 18.7 | |||||||
Effects of changes in foreign exchange rates | (1.1 | ) | (2.4 | ) | 0.3 | |||||||
(Decrease) increase in cash and cash equivalents | (5.6 | ) | 1.4 | (10.1 | ) | |||||||
Cash and cash equivalents, beginning of period | 21.3 | 19.9 | 30.0 | |||||||||
Cash and cash equivalents, end of period | $ | 15.7 | $ | 21.3 | $ | 19.9 | ||||||
Supplemental disclosures: | ||||||||||||
Cash paid during the period for: | ||||||||||||
Income taxes, includes interest paid, net of refunds | $ | 7.5 | $ | 28.1 | $ | 8.2 | ||||||
Interest | $ | 1.7 | $ | 2.5 | $ | 5.5 | ||||||
The accompanying notes are an integral part of these consolidated financial statements.
CORE-MARK HOLDING COMPANY, INC. AND SUBSIDIARIES
NOTES TO CONSOLIDATED FINANCIAL STATEMENTS
1. Summary Company Information and Emergence from Bankruptcy
| 1. | Summary of Company Information |
Nature of Operations
Core-Mark Holding Company, Inc. (Core-Mark), a Delaware corporation, and subsidiaries (referred herein as “we,” “us” “our,” “Core-Mark” or the “Company”), is a broad-line, full serviceone of the leading wholesale distributor of packaged consumer productsdistributors to the convenience retail industry in North America in terms of annual sales, and provides sales and marketing, distribution and logistics services to customer locations across the United States and Canada, with revenues generated from the sale of cigarettes, tobacco products, candy, snacks, fast food, fresh products, groceries, dairy, non-alcoholic beverages, general merchandise and health and beauty aids and other general merchandise. The Company’scare products. Our principal customers include traditional convenience stores, grocery stores, drug stores, liquor stores and liquor stores. Core-Mark’sother stores that carry convenience products. We operate a network of 26 distribution centers in the United States and Canada, distributing a diverse line of national and private label convenience store products to approximately 24,000 customer locations in all 50 states of the United States and 5 Canadian provinces. Our origin dates back to 1888, when Glaser Bros., a family owned and operatedfamily-owned-and-operated candy and tobacco distribution business, was founded in San Francisco.
Chapter 11 Filing by Fleming Companies, Inc.
In June 2002, Fleming acquired Core-Mark International, Inc., or CMI. At the time of acquisition, CMI distributed products to convenience stores and other retailers in the Western United States and Canada from a network of 20 distribution centers. In addition to Fleming’s other operations, Fleming owned and operated seven convenience store distribution centers in the Eastern and Midwestern United States. After the acquisition of CMI by Fleming, CMI’s management continued to operate CMI’s convenience distribution business and began integrating Fleming’s convenience distribution centers into its operations. Minter-Weisman Company (Minter-Weisman) and Head Distributing Company (Head Distributing), two subsidiaries of Fleming, became subsidiaries of CMI in December 2002 as part of such integration.
Fleming Bankruptcy. On April 1, 2003 (the Petition Date), Fleming filed for bankruptcy protection under Chapter 11 of the United States Bankruptcy Code in the state of Delaware. During the bankruptcy proceedings, Fleming and its subsidiaries, including CMI and its subsidiaries (collectively, the Debtors) continued to operate the business as debtors-in-possession under the jurisdiction of the bankruptcy court and in accordance with the applicable provisions of the Bankruptcy Code.
Core-Mark Holding Company, Inc. (Core-Mark Holding), was incorporated on August 20, 2004 as a holding company for Core-Mark Holdings I, Inc., Core-Mark Holdings II, Inc., Core-Mark Holdings III, Inc., CMI and CMI’s wholly-owned subsidiaries (collectively, Core-Mark or the Company) pursuant to a plan of reorganization following a bankruptcy petition by the Company’s former parent, Fleming Companies, Inc. (Fleming), as described below.
Emergence of Core-Mark Holding Company, Inc.
Core-Mark Emerges from the Reorganization as a Separate Entity. On July 27, 2004 (the Confirmation Date), the bankruptcy court confirmed Fleming’s Plan of Reorganization, as amended and revised (the Plan). The Plan provided for the reorganization of the Debtors with CMI surviving as an operating entity. Pursuant to the Plan, certain creditors formed Core-Mark Holding, Core-Mark Holdings I, Inc., Core-Mark Holdings II, Inc. and Core-Mark Holding III, Inc. Core-Mark Holdings I, Inc., and Core-Mark Holdings II, Inc. each own 50% of Core-Mark Holdings III, Inc. On August 23, 2004 (the Effective Date), the Plan was declared effective by the bankruptcy court and Core-Mark emerged from bankruptcy. Upon emergence, Fleming transferred its interest in CMI to Core-Mark Holdings III, Inc., making CMI a wholly-owned subsidiary of Core-Mark Holdings III, Inc., and transferred all of the remaining assets of one of its wholly-owned convenience store distribution centers to a subsidiary of CMI. Upon emergence from the Fleming bankruptcy, Core-Mark reflected the terms of the Plan in its consolidated financial statements applying the terms of the American Institute of Certified Public Accountants (AICPA) Statement of Position 90-7,Financial Reporting by Entities in Reorganization under the Bankruptcy Code (SOP 90-7) with respect to financial reporting upon emergence from bankruptcy.
All financial information prior to August 23, 2004 is identified as relating to the Predecessor Company. All financial information after August 22, 2004 relates to the Successor Company(See Note3—Summary of Significant Accounting Policies).
CORE-MARK HOLDING COMPANY, INC. AND SUBSIDIARIES
NOTES TO CONSOLIDATED FINANCIAL STATEMENTS—(Continued)
Disposition of the Creditors and Equity Holders of the Fleming Companies, Pursuant to the Plan of Reorganization. Three categories of claimants with the following claim disposition terms were established pursuant to the Plan. The Fleming equity holders received no distribution and their interests were canceled. Administrative and priority tax claimants and debtor-in-possession lenders were to be paid in full. Other claimants are served by two special-purpose trusts: the Reclamation Creditors Trust (RCT) and the Post Confirmation Trust (PCT), which together we refer to as the Trusts, as described below. The assets and liabilities of the Debtors remaining after the formation of Core-Mark were transferred into the Trusts. At their inception, the total assets of the Trusts were designed and estimated to be in excess of the total liabilities owed to their claimants.The RCT serves the trade lien vendor (TLV) and non-trade lien vendor (non-TLV) claimants and is responsible for pursuing and liquidating the assigned RCT assets in order to satisfy claims from holders who have asserted that their claims have been granted priority and/or are secured by a lien (See terms of claim disposition at Reclamation’s Creditor Trust, below). The PCT serves the Class 6(A) and Class 6(B) claimants and is responsible for liquidating the assigned PCT assets, issuing the Company’s common stock and common stock warrants, and reconciling and settling claims against Fleming and Core-Mark (See terms of claim disposition at Post Confirmation Trust, below).
Pursuant to the Plan, the Debtors, including principally Core-Mark, contributed $122 million in cash to the PCT. The Company entered into a revolving credit agreement and Tranche B Note Agreement to fund its cash payment to the PCT(See Note 7—Long-term Debt to the consolidated financial statements).
Under Chapter 11 of the United States Bankruptcy Code, actions by creditors to collect indebtedness owed prior to the Petition Date were stayed and certain other pre-petition contractual obligations were not enforced against the Debtors. The Company received approval from the bankruptcy court to pay specific pre-petition liabilities, including taxes, employee salaries and wages, benefits and other employee obligations. The restructuring of the Company’s capital structure and resulting discharge of pre-petition debt resulted in a net gain of $66.1 million.
Core-Mark Capitalization.
Common Stock
Core-Mark Holding was incorporated on August 20, 2004. The authorized capital stock of Core-Mark Holding consists of 50 million shares of common stock, with a par value of $0.01 per share. Core-Mark Holding transferred 9,800,000 shares of common stock to Fleming in exchange for the stock of Core-Mark International and its subsidiaries. Under the Plan of Reorganization, Fleming distributed this common stock to its creditors as instructed by the PCT in settlement of pre-petition claims. The Company determined that $3.2 million in estimated fair value of the common stock to be disbursed by the PCT should be recorded as a reduction to the gain on discharge of liabilities subject to compromise upon emergence.
Warrants
On August 23, 2004, pursuant to the Plan, Core-Mark issued warrants to purchase an aggregate of 990,616 shares of common stock. The warrants were transferred by Core-Mark to the PCT and the warrants were distributed by the PCT to creditors (Class 6(B) claimants) in partial settlement of their pre-petition liabilities. The warrants have an exercise price of $20.925 per share, with a seven-year term and were issued to the PCT for the benefit of former holders of Fleming senior subordinated notes. The warrants were valued at $4.6 million and were recorded as additional paid-in capital upon emergence. The estimated fair value of the warrants was calculated using the Black-Scholes option pricing model with the following assumptions: a term of seven years, a risk free interest rate of 3.85%, expected volatility of 30%, and an expected dividend yield of zero.
CORE-MARK HOLDING COMPANY, INC. AND SUBSIDIARIES
NOTES TO CONSOLIDATED FINANCIAL STATEMENTS—(Continued)
On August 23, 2004, Core-Mark issued additional warrants, pursuant to the Plan, to purchase an aggregate of 247,654 shares of common stock to holders of the Tranche B Notes. The warrants have an exercise price of $15.50 per share, the fair value of our common stock as determined pursuant to the Plan, and a seven-year term. The warrants were valued at $1.4 million, based on the fair value of our common stock of $15.50, pursuant to the Plan. They were recorded as a discount on debt and are being amortized into interest expense over the original five- year term of the Tranche B notes using the effective interest rate method. The estimated fair value of the warrants was calculated using the Black-Scholes option pricing model with the following assumptions: a term of seven years, a risk free interest rate of 3.85%, expected volatility of 30%, and an expected dividend yield of zero.
Stock-Based Compensation Plans
Pursuant to the Plan, on the Effective Date the Company established a stock-based compensation plan with two components consisting of 1,114,444 options to purchase common stock and 200,000 restricted shares of common stock reserved for grants to management. The stock options have exercise price of $15.50 per share based on the fair value of our common stock pursuant to the Plan. The options and restricted shares vest over three years and have a seven year term (SeeNote 13—Stock Based-Compensation Plans to the consolidated financial statements). Non-employee members of our board of directors also received options to purchase an aggregate of 30,000 shares of our common stock under our 2004 Directors Equity Incentive Plan.
In 2005, the Company established two additional stock-based compensation plans: (1) the 2005 Directors’ Equity Incentive Plan (2005 Directors LTIP) which granted 15,000 non-qualified options to non-employee directors at an exercise price of $27.03 based on the average “Pink Sheets” trading price of the Company’s common stock over the twenty trading days ending two trading days before the date of grant, (2) the 2005 Long-Term Incentive Plan (2005 LTIP) established a number of shares of common stock available for issue based on a value of $5.5 million divided by the average closing price over the eleventh through twentieth trading days following the date that the Company’s stock became listed on the NASDAQ National Market. In February 2005, the Company approved a grant of restricted stock units having a value of approximately $5.0 million. The closing price was established in December 2005 at $32.201. (SeeNote 13—Stock Based-Compensation Plans to the consolidated financial statements).
Special Purpose Trusts and Guarantees by Core-Mark
Post Confirmation Trust
Pursuant to the Plan, the PCT was established and charged with administering certain post-confirmation responsibilities under the Plan, including, but not limited to, liquidating certain assets, the pursuit and collection of litigation claims and causes of action and the reconciliation and payment of specific types of claims, each as allocated between the PCT and the RCT pursuant to the Plan. The liabilities of the PCT include tax and other statutory related claims, professional fees, reserves, general unsecured claims and certain administrative claims that were not satisfied on the Effective Date of the Plan. The assets of the PCT include cash, trade account receivables, certain royalty payments receivable related to the sale of Fleming’s wholesale operations, litigation claims receivable, certain RCT assets assigned to the PCT and Fleming’s remaining assets which were transferred to the PCT upon Core-Mark’s emergence from bankruptcy, as described in the Plan.
At the inception of the PCT its total assets were estimated to be approximately $180 million and total liabilities were estimated to be approximately $145 million, including approximately $52 million in certain non-professional fee administrative claims. These estimates were based on financial projections prepared by an independent restructuring firm hired by Fleming, and on an evaluation of the accounts and records of Fleming, and were included in Fleming’s disclosure statement and the Plan as filed with the bankruptcy court. Under the
CORE-MARK HOLDING COMPANY, INC. AND SUBSIDIARIES
NOTES TO CONSOLIDATED FINANCIAL STATEMENTS—(Continued)
terms of the Plan, Core-Mark guarantees all PCT liabilities with respect to administrative claims in excess of $56 million. Core-Mark’s guarantee in connection with the PCT is related solely to the administrative claims portion of the trust. The beneficiaries of the PCT are certain unsecured creditors, the RCT and Core-Mark, as set forth in the Plan(See Note 10—Commitments and Contingencies to the consolidated financial statements).
Reclamation Creditors’ Trust
Pursuant to the Plan, the RCT was established to administer certain post-confirmation responsibilities under the Plan, including, but not limited to, the pursuit and collection of RCT assets and the payment of reclamation claims. To facilitate the claims reconciliation process, the PCT provides professional staff and employees of the PCT, computer systems, data bases and other relevant information to the RCT. The RCT reimburses the PCT for direct costs and an allocation of indirect costs for such staff, employees, data bases and other information subject to certain limitations as set forth in the Plan. The assets of the RCT included approximately $6 million in cash at inception and certain of the assets of the Debtors including vendor deductions, disputed payments, preference claims, causes of action and other rights of the Debtors against the reclamation creditors, as described in the Plan.
At its inception, the total assets of the RCT were estimated to be approximately $140 million and total liabilities were estimated to be approximately $120 million. These estimates were based on financial projections prepared by Fleming’s independent restructuring firm, based on an evaluation of the accounts and records of Fleming, and were included in Fleming’s disclosure statement and the Plan as filed with the bankruptcy court. The TLV creditors are the primary beneficiaries of the RCT and their claims are entitled to be settled in full before any payments are made to the non-TLV creditors. In the event that the assets of the trust are inadequate to satisfy all of the allowed TLV claims, Core-Mark must pay such claims in full plus any accrued interest pursuant to certain guarantees under the Plan. In addition, Core-Mark guarantees all eligible but unpaid non-TLV claims up to a maximum of $15 million. For each dollar of excess assets transferred from the PCT to the RCT in excess of $10 million, the Core-Mark non-TLV guarantee is reduced by 50% of that amount transferred.
In July 2005, the Company conducted an analysis of the guarantees under Financial Interpretation No. 45,Guarantor’s Accounting and Disclosure Requirements for Guarantees, Including Indirect Guarantees of Indebtedness of Others. Based on the estimates provided by the Trusts and the Company’s analysis the assets of the Trusts are sufficient to satisfy the claims against it; therefore, the Company believed that the fair value of its guarantee liability as of August 23, 2004 and December 31, 2004 was not significant. As of the year ended December 31, 2005, the Company received additional advice from the trusts indicating that the value of the trust assets was in excess of the amount of the trust guarantees, therefore and in accordance with SFAS 5Accounting for Contingencies, the Company deemed remote the likelihood that a liability existed as of December 31, 2005 to satisfy the trust claims. However, if the assets of the Trust prove insufficient to pay the claims in the future, the Company could be required to satisfy the guarantees.(See Note 10—Commitments and Contingencies to the consolidated financial statements).
2. Restatements of Financial Statements
On March 23, 2006 the Audit Committee of the Board of Directors of the Company and management concluded that the audited consolidated financial statements as of December 31, 2004 and for the period from August 23, 2004 to December 31, 2004 and the unaudited condensed consolidated financial statements as of and for the six months ended June 30, 2005, each included in the Company’s registration statement on Form 10, and the unaudited condensed consolidated financial statements as of and for the three and nine months ended September 30, 2005 included in the Company’s Form 10-Q for the third quarter of 2005, should no longer be relied upon because of errors in those financial statements relating to the accounting of foreign currency
CORE-MARK HOLDING COMPANY, INC. AND SUBSIDIARIES
NOTES TO CONSOLIDATED FINANCIAL STATEMENTS—(Continued)
translation adjustments related to intercompany balances. Specifically, management determined that foreign currency translation adjustments related to intercompany balances of the Company’s Canadian branch were incorrectly recorded as a component of comprehensive income directly to stockholders’ equity. These intercompany balances were incorrectly thought to be of a permanent nature. Because such intercompany balances post-emergence were not permanent in nature and were fluctuating throughout the period, the foreign exchange gains or losses should have been recorded as a gain (or loss) within the income statement. Accordingly, the Company is restating its financial statements for such periods to correct the above error and to correct the additional errors discussed below.
In connection with this restatement, the Company also corrected an approximately $0.4 million inventory undervaluation error (and a corresponding overstatement of cost of goods sold) in the financial statements for the period from August 23, 2004 through December 31, 2004 and a related $0.4 million overvaluation error (and a corresponding understatement of cost of goods sold) in the financial statements for the six months ended June 30, 2005 (unaudited) and for the nine months ended September 30, 2005 (unaudited). Additionally, the restatement reflects adjustments for the period from August 23, 2004 through December 31, 2004 to correct estimation errors and to correct errors in certain balance sheet classifications. The correction of the estimation errors resulted in a $0.1 million decrease in cost of goods sold and a $0.2 million decrease in selling, general and administrative expenses for the period from August 23, 2004 through December 31, 2004, and a corresponding $0.1 million increase in cost of goods sold and $0.2 million increase in selling, general and administrative expenses for the six months ended June 30, 2005 (unaudited) and nine months ended September 30, 2005 (unaudited). In addition, diluted earnings per share for the three months ended September 30, 2005 (unaudited) decreased from $0.09 to $0.08 as a result of a change in the method of calculating diluted earnings per share. Previously, we calculate diluted earning per share by dividing net income expressed in millions by fully diluted shares. As restated, diluted earnings per share are calculated by dividing net income expressed in dollars by fully diluted shares.
The correction of the error relating to the accounting of foreign currency translation adjustments had the effect of increasing (decreasing) income from continuing operations before taxes, net income and diluted earnings per share by $2.4 million, $1.5 million and $0.15, respectively for the period August 23 through December 31, 2004, by $(0.6) million, $(0.3) million and $(0.03), respectively, for the six months ended June 30, 2005 (unaudited), and by $(0.6) million, $(0.3) million and $(0.03), respectively, for the nine months ended September 30, 2005 (unaudited).
The aggregate effect of correcting the accounting errors described above was as follows:
For the period from August 23, 2004 through December 31, 2004, income from continuing operations before taxes increased by $3.1 million, net income after taxes increased by $1.9 million and diluted earnings per share increased $0.19. For the nine months ending September 30, 2005 (unaudited), income from continuing operations before taxes decreased $1.3 million, net income after taxes decreased $0.8 million and diluted earnings per share decreased $0.07. For the six months ending June 30, 2005 (unaudited), income from continuing operations before taxes decreased $1.3 million, net income after taxes decreased $0.8 million and diluted earnings per share decreased $0.06. There was no impact to income from continuing operations or net income for the three months ended September 30, 2005 (unaudited), however, diluted earnings per share decreased by $0.01 from $0.09 to $0.08 as a result of the change in the method of calculating diluted earnings per share.
Unless otherwise noted, all financial information set forth below reflects the restatement of the Company’s financial statements for the first three quarters of fiscal year 2005 (unaudited) and for the period from August 23 through December 31, 2004. Although the financial statements for the third quarter of 2005 are being restated, the restatement impacts only the nine month period ended September 30, 2005 (unaudited) included in such financial statements and no adjustment is being made to the three month period ended September 30, 2005
CORE-MARK HOLDING COMPANY, INC. AND SUBSIDIARIES
NOTES TO CONSOLIDATED FINANCIAL STATEMENTS—(Continued)
(unaudited). For information concerning the restatement of the quarterly results of operations seeNote 15—Quarterly Financial Data (unaudited).
CONSOLIDATED BALANCE SHEET CHANGES
(In millions except share data)
September 30, 2005 (Unaudited) | |||||||||||
| As filed in Form 10-Q on November 30, 2005 | Adjustments | As Restated | |||||||||
Assets | |||||||||||
Current assets: | |||||||||||
Cash and cash equivalents | $ | 30.4 | $ | — | $ | 30.4 | |||||
Restricted cash | 12.2 | — | 12.2 | ||||||||
Accounts receivable, net of allowance for doubtful accounts of $6.7 | 141.5 | 1.8 | 143.3 | ||||||||
Other receivables, net | 22.3 | 0.9 | 23.2 | ||||||||
Inventories, net | 155.4 | — | 155.4 | ||||||||
Deposits and prepayments | 38.4 | (2.4 | ) | 36.0 | |||||||
Total current assets | 400.2 | 0.3 | 400.5 | ||||||||
Property and equipment, net | 38.7 | — | 38.7 | ||||||||
Deferred income taxes | 3.3 | — | 3.3 | ||||||||
Other non-current assets, net | 33.1 | 1.7 | 34.8 | ||||||||
Total assets | $ | 475.3 | $ | 2.0 | $ | 477.3 | |||||
Liabilities and Stockholders’ Equity | |||||||||||
Current liabilities: | |||||||||||
Accounts payable | $ | 42.2 | $ | 2.0 | $ | 44.2 | |||||
Book overdrafts | 21.5 | — | 21.5 | ||||||||
Cigarette and tobacco taxes payable | 61.5 | — | 61.5 | ||||||||
Accrued liabilities | 60.2 | — | 60.2 | ||||||||
Income taxes payable | 2.8 | 0.7 | 3.5 | ||||||||
Deferred income taxes | 13.7 | — | 13.7 | ||||||||
Total current liabilities | 201.9 | 2.7 | 204.6 | ||||||||
Long-term debt, net | 35.6 | — | 35.6 | ||||||||
Other tax liabilities | 1.8 | — | 1.8 | ||||||||
Claims liabilities, net of current portion | 48.1 | — | 48.1 | ||||||||
Pension liabilities | 11.4 | — | 11.4 | ||||||||
Total liabilities | 298.8 | 2.7 | 301.5 | ||||||||
Commitments and contingencies (Note 10) | |||||||||||
Stockholders’ equity: | |||||||||||
Common stock; $0.01 par value (50,000,000 shares authorized, 9,808,542 shares issued and outstanding at September 30, 2005) | 0.1 | — | 0.1 | ||||||||
Additional paid-in capital | 165.1 | — | 165.1 | ||||||||
Retained earnings | 10.1 | 1.1 | 11.2 | ||||||||
Accumulated other comprehensive income | 1.2 | (1.8 | ) | (0.6 | ) | ||||||
Total stockholders’ equity | 176.5 | (0.7 | ) | 175.8 | |||||||
Total liabilities and stockholders’ equity | $ | 475.3 | $ | 2.0 | $ | 477.3 | |||||
The accompanying notes are an integral part of these consolidated financial statements.
CORE-MARK HOLDING COMPANY, INC. AND SUBSIDIARIES
NOTES TO CONSOLIDATED FINANCIAL STATEMENTS—(Continued)
CONSOLIDATED BALANCE SHEET CHANGES
(In millions except share data)
June 30, 2005 (Unaudited) | |||||||||||
As Filed in October 21, 2005 | Adjustments | As Restated | |||||||||
Assets | |||||||||||
Current assets: | |||||||||||
Cash and cash equivalents | $ | 35.5 | $ | — | $ | 35.5 | |||||
Restricted cash | 13.2 | — | 13.2 | ||||||||
Accounts receivable, net of allowance for doubtful accounts of $7.1 | 146.3 | 1.6 | 147.9 | ||||||||
Other receivables, net | 24.0 | 1.4 | 25.4 | ||||||||
Inventories, net | 184.0 | — | 184.0 | ||||||||
Deposits and prepayments | 44.1 | (2.0 | ) | 42.1 | |||||||
Total current assets | 447.1 | 1.0 | 448.1 | ||||||||
Property and equipment, net | 40.1 | — | 40.1 | ||||||||
Deferred income taxes | 1.4 | — | 1.4 | ||||||||
Other non-current assets, net | 32.8 | 1.3 | 34.1 | ||||||||
Total assets | $ | 521.4 | $ | 2.3 | $ | 523.7 | |||||
Liabilities and Stockholders’ Equity | |||||||||||
Current liabilities: | |||||||||||
Accounts payable | $ | 47.3 | $ | 2.3 | $ | 49.6 | |||||
Book overdrafts | 18.9 | — | 18.9 | ||||||||
Cigarette and tobacco taxes payable | 58.0 | — | 58.0 | ||||||||
Accrued liabilities | 63.9 | — | 63.9 | ||||||||
Income taxes payable | 7.9 | 0.7 | 8.6 | ||||||||
Deferred income taxes | 14.0 | — | 14.0 | ||||||||
Total current liabilities | 210.0 | 3.0 | 213.0 | ||||||||
Long-term debt, net | 77.1 | — | 77.1 | ||||||||
Other tax liabilities | 1.0 | — | 1.0 | ||||||||
Claims liabilities, net of current portion | 47.5 | — | 47.5 | ||||||||
Pension liabilities | 11.4 | — | 11.4 | ||||||||
Total liabilities | 347.0 | 3.0 | 350.0 | ||||||||
Commitments and contingencies (Note 10) | |||||||||||
Stockholders’ equity: | |||||||||||
Common stock; $0.01 par value (50,000,000 shares authorized, 9,815,375 shares issued and outstanding at June 30, 2005) | 0.1 | — | 0.1 | ||||||||
Additional paid-in capital | 164.1 | — | 164.1 | ||||||||
Retained earnings | 9.2 | 1.1 | 10.3 | ||||||||
Accumulated other comprehensive income | 1.0 | (1.8 | ) | (0.8 | ) | ||||||
Total stockholders’ equity | 174.4 | (0.7 | ) | 173.7 | |||||||
Total liabilities and stockholders’ equity | $ | 521.4 | $ | 2.3 | $ | 523.7 | |||||
The accompanying notes are an integral part of these consolidated financial statements.
CORE-MARK HOLDING COMPANY, INC. AND SUBSIDIARIES
NOTES TO CONSOLIDATED FINANCIAL STATEMENTS—(Continued)
CONSOLIDATED BALANCE SHEET CHANGES
(In millions except share data)
| December 31, 2004 | |||||||||||
As Filed in October 21, 2005 | Adjustment | As Restated | |||||||||
Assets | |||||||||||
Current assets: | |||||||||||
Cash and cash equivalents | $ | 26.2 | $ | — | $ | 26.2 | |||||
Restricted cash | 12.1 | — | 12.1 | ||||||||
Accounts receivable, net of allowance for doubtful accounts of $7.7 | 131.7 | 2.2 | 133.9 | ||||||||
Other receivables, net | 34.8 | (0.7 | ) | 34.1 | |||||||
Inventories, net | 186.3 | 0.1 | 186.4 | ||||||||
Deposits and prepayments | 38.7 | (1.8 | ) | 36.9 | |||||||
Total current assets | 429.8 | (0.2 | ) | 429.6 | |||||||
Property and equipment, net | 41.3 | — | 41.3 | ||||||||
Deferred income taxes | 0.7 | — | 0.7 | ||||||||
Other non-current assets, net | 31.8 | 0.8 | 32.6 | ||||||||
Total assets | $ | 503.6 | $ | 0.6 | $ | 504.2 | |||||
Liabilities and Stockholders’ Equity | |||||||||||
Current liabilities: | |||||||||||
Accounts payable | $ | 40.5 | $ | 0.1 | $ | 40.6 | |||||
Book overdrafts | 20.7 | — | 20.7 | ||||||||
Cigarette and tobacco taxes payable | 49.0 | — | 49.0 | ||||||||
Accrued liabilities | 60.5 | (0.2 | ) | 60.3 | |||||||
Income taxes payable | 14.4 | 1.2 | 15.6 | ||||||||
Deferred income taxes | 14.4 | — | 14.4 | ||||||||
Total current liabilities | 199.5 | 1.1 | 200.6 | ||||||||
Long-term debt, net | 77.5 | — | 77.5 | ||||||||
Other tax liabilities | 1.8 | — | 1.8 | ||||||||
Claims liabilities, net of current portion | 46.3 | — | 46.3 | ||||||||
Pension liabilities | 11.4 | — | 11.4 | ||||||||
Total liabilities | 336.5 | 1.1 | 337.6 | ||||||||
Commitments and contingencies (Note 10) | |||||||||||
Stockholders’ equity: | |||||||||||
Common stock; $0.01 par value (50,000,000 shares authorized, 9,815,375 shares issued and outstanding at December 31, 2004) | 0.1 | — | 0.1 | ||||||||
Additional paid-in capital | 162.1 | — | 162.1 | ||||||||
Retained earnings | 3.4 | 1.9 | 5.3 | ||||||||
Accumulated other comprehensive income | 1.5 | (2.4 | ) | (0.9 | ) | ||||||
Total stockholders’ equity | 167.1 | (0.5 | ) | 166.6 | |||||||
Total liabilities and stockholders’ equity | $ | 503.6 | $ | 0.6 | $ | 504.2 | |||||
The accompanying notes are an integral part of these consolidated financial statements.
CORE-MARK HOLDING COMPANY, INC. AND SUBSIDIARIES
NOTES TO CONSOLIDATED FINANCIAL STATEMENTS—(Continued)
CONSOLIDATED STATEMENTS OF OPERATIONS CHANGES
(In millions, except per share data)
| Period from August 23 through December 31, 2004 | |||||||||||
As Filed in October 21, 2005 | Adjustments | As Restated | |||||||||
Net sales(a) | $ | 1,549.3 | $ | — | $ | 1,549.3 | |||||
Cost of goods sold(a) (b) | 1,458.9 | (0.5 | ) | 1,458.4 | |||||||
Gross profit | 90.4 | 0.5 | 90.9 | ||||||||
Warehousing and distribution expenses | 42.6 | — | 42.6 | ||||||||
Selling, general and administrative expenses | 35.1 | (0.2 | ) | 34.9 | |||||||
Amortization of intangible assets | 0.4 | — | 0.4 | ||||||||
Goodwill and asset impairment charges | — | — | — | ||||||||
Total operating expenses | 78.1 | (0.2 | ) | 77.9 | |||||||
Income from operations | 12.3 | 0.7 | 13.0 | ||||||||
Interest expense, net | 4.8 | — | 4.8 | ||||||||
Foreign currency transaction (gains) losses, net | — | (2.4 | ) | (2.4 | ) | ||||||
Reorganization items, net | 0.8 | — | 0.8 | ||||||||
Amortization of debt issuance costs | 0.4 | — | 0.4 | ||||||||
Income from operations before income taxes | 6.3 | 3.1 | 9.4 | ||||||||
Provision for income taxes | 2.9 | 1.2 | 4.1 | ||||||||
Net income | $ | 3.4 | $ | 1.9 | $ | 5.3 | |||||
Basic income per common share: | |||||||||||
Net income | $ | 0.35 | $ | 0.19 | $ | 0.54 | |||||
Diluted income per common share: | |||||||||||
Net income | $ | 0.35 | $ | 0.19 | $ | 0.54 | |||||
Basic weighted average shares | 9.8 | 9.8 | 9.8 | ||||||||
Diluted weighted average shares | 9.8 | 9.8 | 9.8 | ||||||||
The accompanying notes are an integral part of these consolidated financial statements.
CORE-MARK HOLDING COMPANY, INC. AND SUBSIDIARIES
NOTES TO CONSOLIDATED FINANCIAL STATEMENTS—(Continued)
CONSOLIDATED STATEMENTS OF OPERATIONS CHANGES
(In millions, except per share data)
Six months ended June 30, 2005 (Unaudited) | ||||||||||
As Filed in October 21, 2005 | Adjustments | As Restated | ||||||||
Net sales(a) | $ | 2,347.9 | $ | — | $ | 2,347.9 | ||||
Cost of goods sold(a) (b) | 2,212.0 | 0.5 | 2,212.5 | |||||||
Gross profit | 135.9 | (0.5 | ) | 135.4 | ||||||
Warehousing and distribution expenses | 65.4 | — | 65.4 | |||||||
Selling, general and administrative expenses | 53.0 | 0.2 | 53.2 | |||||||
Amortization of intangible assets | 0.5 | — | 0.5 | |||||||
Goodwill and asset impairment charges | — | — | — | |||||||
Total operating expenses | 118.9 | 0.2 | 119.1 | |||||||
Income from operations | 17.0 | (0.7 | ) | 16.3 | ||||||
Interest expense, net | 6.2 | — | 6.2 | |||||||
Foreign currency transaction (gains) losses, net | — | 0.6 | 0.6 | |||||||
Amortization of debt issuance costs | 0.5 | — | 0.5 | |||||||
Income (loss) from operations before income taxes | 10.3 | (1.3 | ) | 9.0 | ||||||
Provision for income taxes | 4.5 | (0.5 | ) | 4.0 | ||||||
Net income (loss) | $ | 5.8 | $ | (0.8 | ) | $ | 5.0 | |||
Basic income (loss) per common share: | ||||||||||
Net income (loss) | $ | 0.59 | $ | (0.07 | ) | $ | 0.52 | |||
Diluted income (loss) per common share: | ||||||||||
Net income (loss) | $ | 0.56 | $ | (0.06 | ) | $ | 0.50 | |||
Basic weighted average shares | 9.8 | 9.8 | 9.8 | |||||||
Diluted weighted average shares | 10.4 | 10.4 | 10.4 | |||||||
The accompanying notes are an integral part of these consolidated financial statements.
CORE-MARK HOLDING COMPANY, INC. AND SUBSIDIARIES
NOTES TO CONSOLIDATED FINANCIAL STATEMENTS—(Continued)
CONSOLIDATED STATEMENTS OF OPERATIONS CHANGES
(In millions, except per share data)
Nine months ended September 30, 2005 (Unaudited) | ||||||||||
As Filed in November 30, 2005 | Adjustments | As Restated | ||||||||
Net sales(a) | $ | 3,681.2 | $ | — | $ | 3,681.2 | ||||
Cost of goods sold(a) (b) | 3,474.4 | 0.5 | 3,474.9 | |||||||
Gross profit | 206.8 | (0.5 | ) | 206.3 | ||||||
Warehousing and distribution expenses | 102.5 | — | 102.5 | |||||||
Selling, general and administrative expenses | 78.2 | 0.2 | 78.4 | |||||||
Amortization of intangible assets | 0.9 | — | 0.9 | |||||||
Total operating expenses | 181.6 | 0.2 | 181.8 | |||||||
Income from operations | 25.2 | (0.7 | ) | 24.5 | ||||||
Interest expense, net | 9.5 | — | 9.5 | |||||||
Loss on early extinguishment of debt | 2.6 | 2.6 | ||||||||
Foreign currency transaction (gains) losses, net | — | 0.6 | 0.6 | |||||||
Amortization of debt issuance costs | 0.9 | — | 0.9 | |||||||
Income (loss) from operations before income taxes | 12.2 | (1.3 | ) | 10.9 | ||||||
Provision for income taxes | 5.5 | (0.5 | ) | 5.0 | ||||||
Net income (loss) | $ | 6.7 | $ | (0.8 | ) | $ | 5.9 | |||
Basic income (loss) per common shares | ||||||||||
Net income (loss) | $ | 0.68 | $ | (0.07 | ) | $ | 0.61 | |||
Diluted income (loss) per common share: | ||||||||||
Net income (loss) | $ | 0.64 | $ | (0.07 | ) | $ | 0.57 | |||
Basic weighted average shares | 9.8 | 9.8 | 9.8 | |||||||
Diluted weighted average shares | 10.4 | 10.4 | 10.4 | |||||||
The accompanying notes are an integral part of these consolidated financial statements.
CORE-MARK HOLDING COMPANY, INC. AND SUBSIDIARIES
NOTES TO CONSOLIDATED FINANCIAL STATEMENTS—(Continued)
CONSOLIDATED STATEMENTS OF CASH FLOW CHANGES
(in millions)
Nine months ended September 30, 2005 (Unaudited) | ||||||||||||
As filed in November 30, 2005 | Adjustments | As Restated | ||||||||||
Cash flows from operating activities: | ||||||||||||
Net income | $ | 6.7 | $ | (0.8 | ) | $ | 5.9 | |||||
Adjustments to reconcile net income to net cash provided by operating activities: | ||||||||||||
LIFO and inventory reserves | 5.0 | — | 5.0 | |||||||||
Amortization of stock-based compensation expense | 3.0 | — | 3.0 | |||||||||
Allowance for doubtful accounts | 0.6 | — | 0.6 | |||||||||
Depreciation and amortization | 11.7 | — | 11.7 | |||||||||
Loss on early extinguishment of debt | 2.3 | — | 2.3 | |||||||||
Foreign currency transactions (gains) losses, net | — | 0.6 | 0.6 | |||||||||
Deferred income taxes | (3.5 | ) | — | (3.5 | ) | |||||||
Changes in operating assets and liabilities, net of acquisitions: | ||||||||||||
Restricted cash | (0.1 | ) | — | (0.1 | ) | |||||||
Accounts receivable | (9.7 | ) | 0.4 | (9.3 | ) | |||||||
Other receivables | 12.7 | (1.6 | ) | 11.1 | ||||||||
Inventories | 26.2 | 0.1 | 26.3 | |||||||||
Deposits, prepayments and other non-current assets | (5.1 | ) | (0.3 | ) | (5.4 | ) | ||||||
Accounts payable | 1.2 | 1.9 | 3.1 | |||||||||
Cigarette and tobacco taxes payable | 11.1 | — | 11.1 | |||||||||
Pension, claims and other accrued liabilities and income taxes payable | (10.4 | ) | (0.3 | ) | (10.7 | ) | ||||||
Net cash provided by operating activities | 51.7 | — | 51.7 | |||||||||
Cash flows from investing activities: | ||||||||||||
Additions to property and equipment, net | (4.2 | ) | — | (4.2 | ) | |||||||
Net cash used in investing activities | (4.2 | ) | — | (4.2 | ) | |||||||
Cash flows from financing activities: | ||||||||||||
Borrowings under revolving line of credit | 18.7 | — | 18.7 | |||||||||
Repayments under revolving line of credit | (28.0 | ) | — | (28.0 | ) | |||||||
Principal payments on long-term debt | (35.5 | ) | — | (35.5 | ) | |||||||
Increase in book overdrafts | 0.8 | — | 0.8 | |||||||||
Net cash used in financing activities | (44.0 | ) | — | (44.0 | ) | |||||||
Effects of changes in foreign exchange rates | 0.7 | — | 0.7 | |||||||||
Increase in cash and cash equivalents | 4.2 | — | 4.2 | |||||||||
Cash and cash equivalents, beginning period | 26.2 | — | 26.2 | |||||||||
Cash and cash equivalents, end of period | $ | 30.4 | — | $ | 30.4 | |||||||
Supplemental disclosures: | ||||||||||||
Cash paid during the period for: | ||||||||||||
Income taxes | $ | 20.7 | $ | — | $ | 20.7 | ||||||
Interest | $ | 9.4 | $ | — | $ | 9.4 | ||||||
The accompanying notes are an integral part of these consolidated financial statements.
CORE-MARK HOLDING COMPANY, INC. AND SUBSIDIARIES
NOTES TO CONSOLIDATED FINANCIAL STATEMENTS—(Continued)
CONSOLIDATED STATEMENTS OF CASH FLOW CHANGES
(in millions)
Six months ended June 30, 2005 (Unaudited) | ||||||||||||
As filed in October 21, 2005 | Adjustments | As Restated | ||||||||||
Cash flows from operating activities: | ||||||||||||
Net income | $ | 5.8 | $ | (0.8 | ) | $ | 5.0 | |||||
Adjustments to reconcile net income to net cash provided by operating activities: | ||||||||||||
LIFO and inventory reserves | 3.2 | — | 3.2 | |||||||||
Amortization of stock-based compensation expense | 2.0 | — | 2.0 | |||||||||
Allowance for doubtful accounts | (0.6 | ) | — | (0.6 | ) | |||||||
Depreciation and amortization | 7.2 | — | 7.2 | |||||||||
Foreign currency transactions (gains) losses, net | — | 0.6 | 0.6 | |||||||||
Deferred income taxes | (1.1 | ) | — | (1.1 | ) | |||||||
Changes in operating assets and liabilities, net of acquisitions: | ||||||||||||
Restricted cash | (1.1 | ) | — | (1.1 | ) | |||||||
Accounts receivable | (13.7 | ) | 0.6 | (13.1 | ) | |||||||
Other receivables | 10.8 | (2.1 | ) | 8.7 | ||||||||
Inventories | (0.5 | ) | 0.1 | (0.4 | ) | |||||||
Deposits, prepayments and other non-current assets | (8.7 | ) | (0.3 | ) | (9.0 | ) | ||||||
Accounts payable | 6.7 | 2.2 | 8.9 | |||||||||
Cigarette and tobacco taxes payable | 8.5 | — | 8.5 | |||||||||
Pension, claims and other accrued liabilities and income taxes payable | (2.9 | ) | (0.3 | ) | (3.2 | ) | ||||||
Net cash provided by operating activities | 15.6 | — | 15.6 | |||||||||
Cash flows from investing activities: | ||||||||||||
Additions to property and equipment, net | (3.4 | ) | — | (3.4 | ) | |||||||
Net cash used in investing activities | (3.4 | ) | — | (3.4 | ) | |||||||
Cash flows from financing activities: | ||||||||||||
Borrowings under revolving line of credit | 14.3 | — | 14.3 | |||||||||
Principal payments on long-term debt | (15.0 | ) | — | (15.0 | ) | |||||||
Decrease in book overdrafts | (1.7 | ) | — | (1.7 | ) | |||||||
Net cash used in financing activities | (2.4 | ) | (2.4 | ) | ||||||||
Effects of changes in foreign exchange rates | (0.5 | ) | (0.5 | ) | ||||||||
Increase in cash and cash equivalents | 9.3 | — | 9.3 | |||||||||
Cash and cash equivalents, beginning period | 26.2 | — | 26.2 | |||||||||
Cash and cash equivalents, end of period | $ | 35.5 | — | $ | 35.5 | |||||||
Supplemental disclosures: | ||||||||||||
Cash paid during the period for: | ||||||||||||
Income taxes | $ | 12.3 | $ | — | $ | 12.3 | ||||||
Interest | $ | 0.1 | $ | — | $ | 0.1 | ||||||
The accompanying notes are an integral part of these consolidated financial statements.
CORE-MARK HOLDING COMPANY, INC. AND SUBSIDIARIES
NOTES TO CONSOLIDATED FINANCIAL STATEMENTS—(Continued)
CONSOLIDATED STATEMENTS OF CASH FLOW CHANGES
(in millions)
| Period from August 23 through December 31, 2004 | ||||||||||||
As filed in October 21, 2005 | Adjustments | As Restated | ||||||||||
Cash flows from operating activities: | ||||||||||||
Net income | $ | 3.4 | $ | 1.9 | $ | 5.3 | ||||||
Adjustments to reconcile net income to net cash provided by operating activities: | ||||||||||||
LIFO and inventory reserves | 1.9 | — | 1.9 | |||||||||
Amortization of stock-based compensation expense | 0.9 | — | 0.9 | |||||||||
Allowance for doubtful accounts | 1.4 | — | 1.4 | |||||||||
Depreciation and amortization | 4.7 | — | 4.7 | |||||||||
Foreign currency transactions (gains) losses, net | — | (2.4 | ) | (2.4 | ) | |||||||
Deferred income taxes | (7.2 | ) | — | (7.2 | ) | |||||||
Changes in operating assets and liabilities, net of acquisitions: | ||||||||||||
Restricted cash | 14.5 | — | 14.5 | |||||||||
Accounts receivable | 3.3 | (2.2 | ) | 1.1 | ||||||||
Other receivables | 17.8 | 0.7 | 18.5 | |||||||||
Inventories | (48.3 | ) | (0.1 | ) | (48.4 | ) | ||||||
Deposits, prepayments and other non-current assets | 12.8 | 1.0 | 13.8 | |||||||||
Accounts payable | 18.8 | 0.1 | 18.9 | |||||||||
Cigarette and tobacco taxes payable | 0.2 | — | 0.2 | |||||||||
Pension, claims and other accrued liabilities and income taxes payable | 7.7 | 1.0 | 8.7 | |||||||||
Net cash provided by operating activities | 31.9 | — | 31.9 | |||||||||
Cash flows from investing activities: | ||||||||||||
Additions to property and equipment, net | (5.7 | ) | — | (5.7 | ) | |||||||
Net cash used in investing activities | (5.7 | ) | — | (5.7 | ) | |||||||
Cash flows from financing activities: | ||||||||||||
Repayments under revolving line of credit | (41.4 | ) | — | (41.4 | ) | |||||||
Increase in book overdrafts | 5.0 | — | 5.0 | |||||||||
Net cash used in financing activities | (36.4 | ) | (36.4 | ) | ||||||||
Effects of changes in foreign exchange rates | 1.9 | 1.9 | ||||||||||
Decrease in cash and cash equivalents | (8.3 | ) | — | (8.3 | ) | |||||||
Cash and cash equivalents, beginning period | 34.5 | — | 34.5 | |||||||||
Cash and cash equivalents, end of period | $ | 26.2 | — | $ | 26.2 | |||||||
Supplemental disclosures: | ||||||||||||
Cash paid during the period for: | ||||||||||||
Income taxes | $ | 4.0 | $ | — | $ | 4.0 | ||||||
Interest | $ | 1.7 | $ | — | $ | 1.7 | ||||||
Payments made in conjunction with Chapter 11 reorganization: | ||||||||||||
Professional fees | $ | 0.5 | $ | — | $ | 0.5 | ||||||
The accompanying notes are an integral part of these consolidated financial statements.
CORE-MARK HOLDING COMPANY, INC. AND SUBSIDIARIES
NOTES TO CONSOLIDATED FINANCIAL STATEMENTS—(Continued)
CONSOLIDATED STATEMENTS OF CASH FLOW CHANGES
(in millions)
Period from August 23 through (Unaudited) | ||||||||||||
As filed in November 30, 2005 | Adjustments | As Restated | ||||||||||
Cash flows from operating activities: | ||||||||||||
Net income | $ | 1.6 | $ | 0.4 | $ | 2.0 | ||||||
Adjustments to reconcile net income to net cash provided by operating activities: | ||||||||||||
LIFO and inventory reserves | 0.5 | — | 0.5 | |||||||||
Amortization of stock-based compensation expense | 0.2 | — | 0.2 | |||||||||
Allowance for doubtful accounts | 0.4 | — | 0.4 | |||||||||
Depreciation and amortization | 1.4 | — | 1.4 | |||||||||
Foreign currency transactions (gains) losses, net | — | (0.7 | ) | (0.7 | ) | |||||||
Deferred income taxes | (0.3 | ) | — | (0.3 | ) | |||||||
Changes in operating assets and liabilities, net of acquisitions: | ||||||||||||
Restricted cash | 6.4 | — | 6.4 | |||||||||
Accounts receivable | 1.4 | — | 1.4 | |||||||||
Other receivables | 19.0 | — | 19.0 | |||||||||
Inventories | 2.2 | — | 2.2 | |||||||||
Deposits, prepayments and other non-current assets | 4.2 | — | 4.2 | |||||||||
Accounts payable | 1.4 | — | 1.4 | |||||||||
Cigarette and tobacco taxes payable | (5.9 | ) | — | (5.9 | ) | |||||||
Pension, claims and other accrued liabilities and income taxes payable | 3.9 | 0.3 | 4.2 | |||||||||
Net cash provided by operating activities | 36.4 | — | 36.4 | |||||||||
Cash flows from investing activities: | ||||||||||||
Additions to property and equipment, net | (0.2 | ) | — | (0.2 | ) | |||||||
Net cash used in investing activities | (0.2 | ) | — | (0.2 | ) | |||||||
Cash flows from financing activities: | ||||||||||||
Repayments under revolving line of credit | (36.6 | ) | — | (36.6 | ) | |||||||
Decrease in book overdrafts | (1.8 | ) | — | (1.8 | ) | |||||||
Net cash used in financing activities | (38.4 | ) | (38.4 | ) | ||||||||
Effects of changes in foreign exchange rates | 0.7 | 0.7 | ||||||||||
Decrease in cash and cash equivalents | (1.5 | ) | — | (1.5 | ) | |||||||
Cash and cash equivalents, beginning period | 34.5 | — | 34.5 | |||||||||
Cash and cash equivalents, end of period | $ | 33.0 | — | $ | 33.0 | |||||||
Supplemental disclosures: | ||||||||||||
Cash paid during the period for: | ||||||||||||
Income taxes | $ | 0.3 | $ | — | $ | 0.3 | ||||||
Interest | $ | 0.4 | $ | — | $ | 0.4 | ||||||
Payments made in conjunction with Chapter 11 reorganization: | ||||||||||||
Professional fees | $ | 0.1 | $ | — | $ | 0.1 | ||||||
The accompanying notes are an integral part of these consolidated financial statements.
CORE-MARK HOLDING COMPANY, INC. AND SUBSIDIARIES
NOTES TO CONSOLIDATED FINANCIAL STATEMENTS—(Continued)
3. Summary of Significant Accounting Policies
Basis of Presentation
The consolidated financial statements of Core-Mark have been prepared in accordance with generally accepted accounting principles in the United States of America (GAAP)Consolidation and reflect the results of operations, financial position, and cash flows of the Company and its subsidiaries.
Principles of ConsolidationPresentation
The consolidated financial statements include Core-Mark and its wholly-owned subsidiaries. All significant inter-company balances and transactions are eliminated.
The Company also evaluates its relationships with variable interest entitieshave been eliminated in which it may not have a majority or voting interest but with which it may be required to consolidate because it is deemed to be the primary beneficiary of that entity. As of December 31, 2005, the Company’s exposure to expected losses or residual returns from such variable interest entities was not significant.consolidated financial statements.
Use of Estimates
These financial statements have been prepared on the accrual basis of accounting in accordance with accounting principles generally accepted in the United States of America. This requires management to make certain estimates and assumptions that affect the reported amounts of assets and liabilities and the disclosure of contingent assets and liabilities at the date of the financial statements and the reported amounts of revenues and expenses during the reporting period. The Company’s management considersWe consider the allowance for doubtful accounts, the allowance related to other receivables, inventory reserves, fresh-start valuations,LIFO valuation, recoverability of goodwill and other long-lived assets, carve-outstock compensation expense, allocations, trust guarantees, the realizability of deferred income taxes, uncertain tax positions, pension benefits and self-insurance reserves and the fair value of the Company’s common stock and stock volatility to be those estimates which involve a higher degree of judgment and complexity. Actual results could differ from those estimates.
Revenue Recognition
We recognize revenue at the point at which the product is delivered and title passes to the customer in accordance with the Securities and Exchange Commission (“SEC”) issuedStaff Accounting Bulleting No. 104 (SAB 104),“Revenue Recognition.”Revenues are reported net of customer incentives, discounts and returns, including an allowance for estimated returns. The allowance for sales returns is calculated based on our returns experience which has historically not been significant. We also earn management services fee revenue from operating third party distribution centers belonging to certain customers. The service fee revenue was approximately $3.0 million in 2008, $2.8 million in 2007 and $3.4 million in 2006. These revenues represented less than 1% of our total revenues for each of those years. The service fee revenue is recognized as earned on a monthly basis in accordance with the terms of the management service fee contracts, and is included in net sales on the accompanying consolidated statements of operations.
CORE-MARK HOLDING COMPANY, INC. AND SUBSIDIARIES
NOTES TO CONSOLIDATED FINANCIAL STATEMENTS—(Continued)
Vendor and Sales Incentives
Vendors’ Discounts, Rebates and Allowances—Periodic payments from vendors in various forms including volume or other purchase discounts are reflected in the carrying value of the related inventory when earned and as cost of goods sold as the related merchandise is sold. Up-front consideration received from vendors linked to purchase or other commitments is initially deferred and amortized ratably to cost of goods sold or as the performance of the activities specified by the vendor to earn the fee is completed. Cooperative advertising incentives from suppliers are recorded as reductions to cost of goods sold to the extent the vendor considerations exceeds the costs relating to the programs. These amounts are recorded in the period the related promotional or merchandising programs were provided. Some of the vendor incentive promotions require that we make assumptions and judgments regarding, for example, the likelihood of achieving market share levels or attaining specified levels of purchases. Vendor incentives are at the discretion of our vendors and can fluctuate due to changes in vendor strategies and market requirements.
Customers’ Sales Incentives—We also provide sales rebates or discounts to our customers on a regular basis. These customers’ sales incentives are recorded as a reduction to sales revenue as the “sales incentive” is earned by the customer. Additionally, we may provide racking and slotting allowances for the customer’s commitment to continue using us as the supplier of their products. These allowances may be paid at the inception of the contract or on a periodic basis. Allowances paid at the inception of the contract are capitalized and amortized over the period of the distribution agreement as a reduction to sales.
Excise Taxes
Excise taxes on cigarettes and other tobacco products are a significant component of our net sales and our cost of sales. In 2008, 2007 and 2006 approximately 24%, 24% and 25%, respectively, of our net sales, and approximately 26% for each of those years of our cost of goods sold represented excise taxes.
Foreign Currency Translation
The operating assets and liabilities of the Company’sour Canadian operations, whose functional currency is the Canadian dollar, are translated to US dollars at exchange rates in effect at period-end. Income and expenses are translated at average rates for the period. Adjustments resulting from such translation are presented as foreign currency translation adjustments, net of applicable income taxes, and are included in accumulated other comprehensive income. The statements of operations, including income (loss), a separate componentand expenses, of stockholders’ equity. The Company recognizesour Canadian operations are translated to US dollars at average exchange rates for the period for financial reporting purposes. We also recognize the gain or loss on foreign currency exchange transactions between our Canadian and U.S. operations, net of applicable income taxes, in the consolidated statementstatements of operations.
Cash, Cash Equivalents and Restricted Cash
Cash and cash equivalents include cash, money market funds and all highly liquid investments with original maturities of three months or less. Restricted cash represents funds collected and set aside in trust as required by Canadian provincial taxing authorities. As of December 31, 2005, December 31, 2004 and August, 23, 2004, the Company included in2008, we had cash book overdrafts of $20.2$17.8 million $20.7as compared to $21.1 million and $15.7 million, respectively,as of December 31, 2007, reflecting issued checks that have not cleared through itsour banking system in the ordinary course of business in
CORE-MARK HOLDING COMPANY, INC. AND SUBSIDIARIES
NOTES TO CONSOLIDATED FINANCIAL STATEMENTS—(Continued)
for accounts payable. The Company’sOur policy has been to fund these outstanding checks as they clear with cash held on deposit with other financial institutions or with borrowings under itsour line of credit.
CORE-MARK HOLDING COMPANY, INC. AND SUBSIDIARIES
NOTES TO CONSOLIDATED FINANCIAL STATEMENTS—(Continued)
Financial Instruments
The carrying amount for the Company’sour cash, cash equivalents, restricted cash, trade accounts receivable, other receivables, trade accounts payable, cigarette and tobacco taxes payable and other accrued liabilities approximates fair value because of the short maturity of these financial instruments. The carrying amount of the Company’s long-term debt approximates fair value based on the Company’s best estimate of interest rates that would be available to the Company for similar debt obligations. The carrying amount of the Company’sour variable rate debt approximates fair value due to the variable nature of interest rates.value.
Risks and Concentrations
Financial instruments, which potentially subject the Companyus to concentrations of credit risk, consist principally of temporary cash investments, accounts receivable and other receivables. The Company places itsWe place our cash and cash equivalents in investment-grade, short-term instruments with high quality financial institutions and, by policy, limitslimit the amount of credit exposure in any one financial instrument. The Company pursuesWe pursue amounts and allowancesincentives due from its vendors, and in the normal course of business, isand are often allowed to deduct these amounts and allowancesincentives from payments made by the Company to suchour vendors.
A credit review is completed for new customers and ongoing credit evaluations of each customer’s financial condition are performed and prepayment or other guarantees are required whenever deemed necessary. Credit limits given to customers are based on a risk assessment of their ability to pay and other factors. The Company has noWe do not have individual customers that account for more than 10% of itsour total sales. The Company has no individual customers that accountsales or for more than 10% of its total accounts receivable. However, some of our distribution centers are dependent on relationships with a single customer or a few large customers.
The Company hasWe have two significant suppliers: Philip Morris USA, Inc. and R.J. Reynolds Tobacco Company. For the years ended December 31, 2005 and December 31, 2004, respectively, cigarette productProduct purchases were approximately 26% and 25% from Philip Morris USA, Inc., were approximately 27% for 2008, and approximately 15%25% for both 2007 and 16%2006. Product purchases from R.J. Reynolds Tobacco Company.Company were approximately 14% for 2008 and 2007, and 15% for 2006.
Cigarette sales represented approximately 68.2%, 69.5%, and 71.2% of our revenues and contributed approximately 29.0%, 30.5%, and 33.1% of our gross profit in 2008, 2007 and 2006, respectively. United States cigarette consumption has declined since 1980. If cigarette consumption continues to decline and we do not make up for lost cigarette carton sales through cigarette price increases or by increasing our food/non-food sales, our results of operations would be materially and adversely affected.
Accounts Receivable and Allowance for Doubtful Accounts
Accounts receivable consists of trade receivables from customers. The Company evaluatesWe evaluate the collectibility of accounts receivable and determinesdetermine the appropriate allowance for doubtful accounts based on historical experience and a review of specific customer accounts. Account balances are charged off against the allowance when collection efforts have been exhausted and the Company believes itreceivable is probable that accounts receivable will not be recovered.deemed worthless.(See Note 5—Other Balance Sheet Accounts Detail, Allowance for Doubtful Accounts, Accounts Receivable).
Other Receivables
Other receivables consist primarily of amounts due from vendors for promotional allowances and other incentive programs,incentives, which are accrued as earned, as well as net vendor receivables relating to vendor deductions and disputed payments arising after the Petition Date. The Company evaluatesearned. We evaluate the collectibility of amounts due from vendors and determinesdetermine the appropriate allowance for doubtful accounts due from vendors based on historical experience and on a review of specific amounts outstanding. A significant portion ofWhile we believe that such allowances are adequate, these estimates could change in the allowance for doubtful accounts due from vendors relatesfuture depending upon our ability to collect these vendor receivables arising after Fleming filed for bankruptcy andreceivables.
CORE-MARK HOLDING COMPANY, INC. AND SUBSIDIARIES
NOTES TO CONSOLIDATED FINANCIAL STATEMENTS—(Continued)
which have been outstanding for more than 12 months as of December 31, 2005. While management believes that such allowances are adequate, these estimates could change in the future depending upon management’s ability to collect these vendor receivables.
Inventories
Inventories consist of finished goods, including cigarettes and other tobacco products, food and other products, and related consumable products held for re-sale and are valued at the lower of cost or market. In the United States, cost is primarily determined on a last–in, first–out (LIFO) basis using producer price indices as determined by the Department of Labor.Labor, adjusted based on more current information if necessary. Under the LIFO method, current costs of goods sold are matched against current sales. Inventories in Canada are valued on a first–in, first–out (FIFO) basis as LIFO is not a permitted inventory valuation method in Canada. As of December 31, 2008, approximately 85% of our FIFO inventory was valued on a LIFO basis.
During periods of rising prices, the LIFO method of costing inventories generally results in higher current costs being charged against income while lower costs are retained in inventories. Conversely, during periods of decreasing prices, the LIFO method of costing inventories generally results in lower current costs being charged against income and higher stated inventories. Liquidations of inventory may also result in the sale of low-cost inventory and a decrease of cost of goods sold. We reduce inventory value for spoiled, aged and unrecoverable inventory based on amounts on hand and historical experience. The impact of the LIFO layer decrements that occurred during 2008 was insignificant to cost of goods sold.
Property and Equipment
Property and equipment are recorded at cost, net of accumulated depreciation and amortization. Depreciation and amortization on new purchases are computed using the straight-line method over their estimated useful lives. Leasehold improvements are amortized using the straight-line method over the shorter of the estimated useful life of the property or the term of the lease including available renewal option terms if it is reasonably assured that those terms will be exercised. Upon retirement or sale, the cost and related accumulated depreciation are removed from the accounts and any related gain or loss is reflected in operations. Maintenance and repairs are charged to operations as incurred.
The Company hasWe have determined the following useful lives for itsour fixed assets:
| Useful life in years | ||
Delivery equipment | 4 to 10 | |
Office furniture and equipment | 3 to 10 | |
Warehouse equipment | 3 to 15 | |
Leasehold improvements | ||
| 25 |
Asset Retirement Obligations
The Company evaluates the legal obligations arising from the retirement of long-lived assets in accordance with Statement of Financial Accounting Standards (SFAS) No. 143,Accounting for Asset Retirement Obligations and Financial Interpretation No. 47,Accounting for Conditional Asset Retirement Obligations. Asset retirement obligations of the Company relate primarily to operating leases of its distribution centers. Specifically, certain leases require that the Company restore property to its original state upon termination of the lease. This would include the removal of any leasehold improvements, fixtures and equipment in addition to other cosmetic requirements. The Company accounts for liabilities related to asset retirement obligations on a discounted basis. Under SFAS No. 143 the liability is added to the carrying amount of the associated asset and then depreciated
CORE-MARK HOLDING COMPANY, INC. AND SUBSIDIARIES
NOTES TO CONSOLIDATED FINANCIAL STATEMENTS—(Continued)
over the lesser of the lease term or the useful life of the asset. The lease term includes available renewal option terms if it is reasonably assured that those terms will be exercised by the Company.
Impairment of Long-lived Assets
We review our intangible and long-lived assets for potential impairment at least annually, based on projected undiscounted cash flows associated with these assets. Long-lived and intangible assets may also be included in impairment testing when events and circumstances exist that indicate the carrying amounts of those assets may not be recoverable. Measurement of impairment losses for long-lived assets that we expect to hold and use is based on the estimated fair value of those assets.
The Company evaluatesWe evaluate long-lived assets in accordance with the provisions ofSFAS No. 144,Accounting for the Impairment or Disposal of Long-Lived Assets.Long-lived assets consist primarily of land, buildings, furniture, fixtures and equipment, leasehold improvements and intangible assets. An impairment of long-lived assets exists
CORE-MARK HOLDING COMPANY, INC. AND SUBSIDIARIES
NOTES TO CONSOLIDATED FINANCIAL STATEMENTS—(Continued)
when future undiscounted cash flows are less than an asset group’s carrying value over the estimated remaining useful life of the primary assets. Impairment is measured as the difference between carrying value and fair value. Fair value is based on appraised value or estimated sales value, similar assets in recent transactions or discounted cash flows. Assets to be disposed of are reported at the lower of carrying amount or fair value less the cost to sell such assets. During 2008 and 2007, we did not have impairment costs related to long-lived assets or assets identified for abandonment as a result of facility closures or facility relocation.
Goodwill and Intangible Assets
The Company reviews itsWe review goodwill and intangible assets for impairment, in accordance withSFAS No. 142,Goodwill and Other Intangible Assets, on an annual basis or whenever significant events or changes occur in itsour business. The reviews are performed at the operating division level, which comprise the Company’sour reporting units. The provisions of SFAS No. 142 require that a two-step test be performed to assess goodwill for impairment. First, the fair value of each reporting unit is compared to its carrying value. Generally, fair value represents the discounted projected cash flows of an operating division. If the fair value exceeds the carrying value, goodwill is not impaired and no further testing is performed. The second step is performed if the carrying value exceeds the fair value. The implied fair value of the reporting unit’s goodwill must be determined and compared to the carrying value of the goodwill. If the carrying value of a reporting unit’s goodwill exceeds its implied fair value, an impairment loss equal to the difference will be recorded The Company doesrecorded. Based on the impairment tests performed as of November 30, 2008 and November 30, 2007, there was no impairment of goodwill in 2008 or 2007. There can be no assurance that future goodwill tests will not result in a charge to earnings. We do not amortize those intangible assets that have been determined to have indefinite useful lives. Information on other intangible assets is provided inNote 5—Other Balance Sheet Accounts Detail.
Computer Software Developed or Obtained for Internal Use
We account for proprietary computer software systems, namely our Distribution Center Management System (DCMS), in accordance with theAmerican Institute of Certified Public Accountants (AICPA) Statement of Position No. 98-1,Accounting for the Costs of Computer Software Developed or Obtained for Internal Use.This statement specifies certain criteria under which costs associated with this software are either expensed or capitalized and amortized. During 2007 we completed the implementation of Hyperion Financial Management (HFM). The costs related to the implementation of HFM were either expensed or capitalized in accordance with this pronouncement. During 2008 and 2007 we capitalized approximately $0.7 million and $2.0 million, respectively, primarily for HFM and DCMS enhancements as well as other non-proprietary systems which are included in the consolidated balance sheets for the years then ended.
Debt Issuance Costs
In accordance withAccounting Principles Board Opinion No. 21,Interest on Receivables and Payables,debt issuance costs have been deferred and are being amortized as interest expense over the termsfive-year term of the related debt agreements, generally three to five years,agreement using the effective interest method. Debt issuance costs are included in other non-current assets, net, on the accompanying consolidated balance sheets.
Claims Liabilities and Insurance Recoverables
Pursuant to the Financial Accounting Standards Board (FASB)In accordance withFASB Interpretation No. 39 (FIN No. 39),Offsetting of Amounts Related to Certain Contracts, the Company’s claims liabilities and the related recoverables from its insurance carriers for estimated claims in excess of deductible amounts and other insured events are presented in their gross amounts on the accompanying consolidated balance sheets because there is no right of off-set. The carrying values of claims liabilities and insurance recoverables are not discounted. Insurance recoverables are included in other receivables, net and other non-current assets, net. Insurance recoverables atAs of December 31, 2003 were negligible because the Company2008, we had not yet assumed theliabilities for workers’ compensation, auto and general liability related to both Core-Mark and Fleming (“former owner of Core-Mark” related to emergence from bankruptcy in 2004) self-insurance obligations described below.
The Company maintains reserves related to healthof $31.3 million long-term and welfare, workers compensation and auto liability programs that are principally self-insured. The Company’s workers compensation and auto liability self-$9.3 million short-term.
CORE-MARK HOLDING COMPANY, INC. AND SUBSIDIARIES
NOTES TO CONSOLIDATED FINANCIAL STATEMENTS—(Continued)
insuranceWe maintain reserves related to health and welfare, workers’ compensation, auto and general liability programs currentlythat are principally self-insured. We have a per-claim ceiling of $500,000 for our workers’ compensation, general and the Company hasauto liability self-insurance programs and a per-claim limit of $200,000 for our health and welfare program. We purchased insurance to cover the claims that exceed the ceiling up to policy limits. Self-insured reserves are for pending or future claims that fall outside the policy. Thepolicy and reserves include an estimate of expected settlements on pending claims and a provision for claims incurred but not reported. These estimatesEstimates for workers’ compensation, auto and general liability insurance are based on the Company’sour assessment of potential liability using an annual actuarial analysis of available information with respect to pending claims, historical experience and current cost trends. AccrualsReserves for claims under these programs are included in accrued liabilities (current portion) and claims liabilities, net of current portion(See Note 4—Other Balance Sheet Accounts Detail to the consolidated financial statements).portion.
Carve-out Accounting
The Predecessor Company’s consolidated financial statements for the period ended August 22, 2004, and the year ended December 31 2003, included herein are presented on a carve-out basis and do not reflect what the consolidated results of operations, financial position, and cash flows of Core-Mark and its subsidiaries would have been had Core-Mark been a separate stand-alone entity during all of the periods presented. SAB Topic 1.B,Allocation of Expenses and Related Disclosure in Financial Statements of Subsidiaries, Divisions or Lesser Business Components of Another Entity(Topic 1.B) requires that financial statements prepared on a carve-out basis include costs incurred by the parent company on behalf of the carved out entity. Core-Mark has maintained its own independent systems and infrastructure and did not rely on Fleming for any significant administrative, management or other services. However, estimated costs incurred by Fleming and allocated to Core-Mark are as follows (in millions):
| Predecessor Company | ||||||
Period from January 1 through | Year ended December 31, 2003 | |||||
Insurance, investor relations, legal, Board of Directors and other | $ | 0.5 | $ | 0.7 | ||
Imputed interest | 4.1 | 4.0 | ||||
Total | $ | 4.6 | $ | 4.7 | ||
In accordance with the carve-out accounting provisions of Topic 1.B, from June 17, 2002 until emergence from bankruptcy on August 23, 2004, net interest expense includes amounts imputed to reflect a charge from Fleming to the Company for interest on debt incurred by Fleming pursuant to its acquisition of CMI. Imputed interest amounts were $4.0 million and $4.1 million for the year ended December 31, 2003 and the period from January 1 to August 22, 2004, respectively. The average rate was 7.7% for all periods.
Revenue Recognition
The Company recognizes revenue in accordance SAB No. 104,Revenue Recognition. Under this bulletin, four criteria must be met for revenue recognition: (1) persuasive evidence of an arrangement must exist, (2) delivery must occur, (3) the selling price must be fixed or determinable and (4) collectibility must be reasonably assured. Based on its terms of sale, the Company has determined these criteria are met at the point at which the product is delivered and title passes to the customer. The Company grants its customers sales incentives such as rebates or discounts, racking and slotting allowances and treats these as a reduction of revenues at the time the sale is recognized. The Company monitors product returns on an ongoing basis. Based on current analysis and its historical experience, the Company has determined that the amount of product returns
CORE-MARK HOLDING COMPANY, INC. AND SUBSIDIARIES
NOTES TO CONSOLIDATED FINANCIAL STATEMENTS—(Continued)
is insignificant. Therefore, no allowance for product returns has been provided for in the Company’s consolidated balance sheets and statements of operations. The Company also earns management services fee revenue from operating third party distribution centers belonging to certain of the Company’s customers. Such revenue is recognized as earned on a monthly basis in accordance with the terms of the management services fee contracts.
Vendor Rebates and Allowances
Periodic payments from vendors in various forms, volume or other purchase discounts are reflected in the carrying value of the related inventory when earned and as cost of goods sold as the related merchandise is sold. Up-front consideration received from vendors linked to purchase or other commitments is initially deferred and amortized ratably to cost of goods sold or as the performance of the activities specified by the vendor to earn the fee is completed. Cooperative advertising rebates, slotting allowances, racking, and other promotional reimbursements from suppliers are earned as reductions to cost of goods sold in the period the related promotional or merchandising programs were provided.
Pension Costs and Other Post-retirement Benefit Costs
In accordance withSFAS No. 132R,Employers Accounting for Pensions and Other Postretirement Benefits,which amends FAS 87, 88 and 106, pension costs and other post-retirement benefit costs charged to operations are estimated on the basis of annual valuations by an independent actuary. Adjustments arising from plan amendments, changes in assumptions and experience gains and losses are amortized over the expected average remaining service life of the employee groupgroup. In addition, in September 2006, the FASB issuedSFAS No. 158, Employer’s Accounting for Defined Benefit Pension and Other Postretirement Plans.In accordance with SFAS No. 158, we recognized in the consolidated balance sheet an asset for a plan’s overfunded status or a liability for a plan’s underfunded status, measured the plan’s assets and its obligations to determine the plan’s funded status as of the end of the employer’s fiscal year, and recognized changes in the funded status of our defined benefit postretirement plan in the year in which the change occurred(See Note 14 —Employee13—Employee Benefit Plans to the consolidated financial statements)Plans).
Income Taxes
Income taxes are accounted for under the liability method in accordance withSFAS No. 109,Accounting for Income Taxes.Deferred tax assets and liabilities are recognized for the estimated future tax consequences attributable to differences between the financial statement carrying amounts of existing assets and liabilities and their respective tax bases and operating loss and tax credit carry-forwards. Deferred tax assets and liabilities are measured using enacted tax rates in effect for the year in which those temporary differences are expected to be recovered or settled. The effect on deferred tax assets and liabilities of a change in tax rates is recognized in income in the period that includes the enactment date. Deferred tax assets are reduced by a valuation allowance when management doeswe do not consider it more likely than not that some portion or all of the deferred tax assets will be realized.
Prior As of December 31, 2008, we had a valuation allowance of $0.1 million related to emergence from bankruptcy,foreign tax credits, which will expire in 2014 to 2016. In June 2006, the Predecessor Company’sFinancial Accounting Standards Board (“FASB”) issuedFinancial Interpretation No. 48 (FIN 48),Accounting for Uncertainty in Income Taxes,which clarifies the accounting for uncertainty in income taxes recognized in an enterprise’s financial statements were prepared on a carve-out basis. For financial reporting purposes, the provision for income taxes was computed based on a stand-alone, separate-return basis. However, Core-Mark’s operating results were included in Fleming’s consolidated U.S. income tax return and consolidated, combined or unitary state income tax returns and in tax returns of the Canadian operations. Upon emergence, deferred tax asset and liability accounts were provided for in accordance withSFAS No. 109109.We adopted the provisions of FIN 48 on January 1, 2007. FIN 48 provides guidance on measurement of unrecognized tax benefits and SOP 90-7.liabilities, de-recognition, classification, interest and penalties, accounting for interim periods, disclosure and transition(See Note 10—Income Taxes).
Stock-basedStock-Based Compensation
The Company expensesWe expense stock-based compensation using the fair value method as permittedrequired bySFAS No. 123 (R),Accounting for Share-Based Payment(See Note 12—Stock-Based Compensation.Compensation Plans). Determining the appropriate fair value model and calculating the fair value of stock-based awards at the grant date requires considerable judgment, including estimating stock price volatility, expected life of share awards, and forfeiture rates. We develop our estimates based on historical data and market information which can change significantly over time.
CORE-MARK HOLDING COMPANY, INC. AND SUBSIDIARIES
NOTES TO CONSOLIDATED FINANCIAL STATEMENTS—(Continued)
Computer Software Developed or ObtainedCurrently, we use the Black-Scholes option valuation model to value stock awards.We recognize compensation expense using the straight-line amortization method for Internal Use.stock-based compensation awards with vesting based on service and ratably for awards based on performance conditions.
The Company accounts for its propriety computer software, or DCMS system,Total Comprehensive Income
We report comprehensive income in accordance withSFAS No. 130,Reporting Comprehensive Income. Total Comprehensive Income consists of two components: net income and other comprehensive income. Other comprehensive income refers to revenue, expenses, gains and losses that under generally accepted accounting principles are recorded directly as an element of stockholders’ equity, but are excluded from net income. Other comprehensive income is comprised of adjustments to minimum pension liability and currency translation adjustments relating to our foreign operations in Canada whose functional currency is not the American InstituteU.S. dollar(See statements of Certified Public Accountants (AICPA) Statement of Position No. 98-1,Accounting for the Costs of Computer Software Developed or Obtained for Internal Use.The statement specifies certain criteria under which costs associated with this software are either expensed or capitalizedstockholders’ equity and amortized.comprehensive income).
Segment Information
Pursuant to We report our segment information in accordance withSFAS No. 131,Disclosures about Segments of an Enterprise and Related Information, which establishes standards for reporting by public enterprises on information about product lines, geographical areas and major customers, thecustomers. The method of determining what information to report is based on the way management organizes the Companywe are organized for making operational decisions and assessment of financial performance. From the perspective of the Company’sour chief operating decision maker, the Company ismakers, we are engaged in the business of distributing packaged consumer products to convenience retail stores in the United States of America and Canada. Therefore, the Company haswe have determined that it has two reportable segments and evaluates thesewe have two reportable segments based on geographical area.area-United States and Canada. We present our segment reporting information based on business operations and by major product category for each of the two geographic segments (See Note 16—Segment Information).
Earnings (Loss) perPer Share
Basic earnings (loss) per share is calculated by dividing net income by the weighted average number of common shares outstanding during each period, excluding unvested restricted stock. Diluted earnings per share assumeassumes the exercise of stock options and common stock warrants and the impact of restricted stock, when dilutive, using the treasury stock method.method(See Note 11—Earnings Per Share).
Reclassifications
We reclassified several items to conform to the current presentation. Book over draft amounts included in accounts payable on the balance sheet during reporting periods prior to December 31, 2005 have been presented separately on the balance sheet in this Form 10-K. Deferred stock-based compensation presented separately in stockholders’ equity on the balance sheet in the Form 10/A filed on October 21, 2005, is included in additional paid in capital in this Form 10-K. Net borrowings and repayments under the revolving lineImpact of credit which were presented separately in the statement of cash flows in the Form 10/A and in the Form 10-Q filed on November 30, 2005 are aggregated and presented net in this Form 10-K. Such reclassifications had no impact on consolidated net income or total stockholders’ equity as previously reported.
New Accounting Pronouncements on our Consolidated Financial Statements
In October 2005,September 2006, the FASB issuedSFAS No. 157,Fair Value Measurements. SFAS No. 157 defines fair value as the price that would be received to sell an asset or paid to transfer a liability in an orderly transaction between market participants at the measurement date. The standard also establishes a framework for measuring fair value and provides for expanded disclosures about fair value measurements. In February 2008, the FASB issuedFASB Staff Position (“FSP”) No. 13-1,FAS 157-1,“Application of FASB Statement No. 157 to FASB Statement No. 13 and Other Accounting Pronouncements That Address Fair Value Measurements for Rental Costs Incurred During a Construction Period”Purposes of Lease Classification or Measurement under Statement 13 (“ andFSP No. 13-1”)FAS 157-2, which requires rental costs associated with ground or building operating leasesEffective Date of FASB Statement No. 157. FSP 157-1 amends SFAS No. 157 to remove certain leasing transactions from its scope. FSP 157-2 delays the effective date of SFAS No. 157 to fiscal years beginning after November 15, 2008 for all non-financial assets and non-financial liabilities, except for items that are incurred duringrecognized or disclosed at fair value in the financial statements on a construction period to be recognized as rental expense. FSPrecurring basis (at least annually). SFAS No. 13-1157 is effective for periods beginning after December 15, 2005. The Company will adopt FSP No. 13-1 beginning with itsour fiscal year 2006 and doesbeginning January 1, 2009. We do not expect the adoption willof SFAS No. 157 to have a significantmaterial impact on itsour consolidated financial statements.
In June 2005, the Financial Accounting Standards Board’s (the FASB) Emerging Issues Task Force reached a consensus on Issue No. 05-6, “Determining the Amortization Period for Leasehold Improvements” (EITF 05-6). This guidance requires that leasehold improvements acquired in a business combination or purchased subsequent to the inception of a lease be amortized over the lesser of the useful life of the assets or a term that includes
CORE-MARK HOLDING COMPANY, INC. AND SUBSIDIARIES
NOTES TO CONSOLIDATED FINANCIAL STATEMENTS—(Continued)
renewals that are reasonably assuredIn February 2007, the FASB issuedSFAS No. 159,The Fair Value Option for Financial Assets and Financial Liabilities,which provides companies an option to report selected financial assets and liabilities at fair value. SFAS 159 requires companies to provide information to assist financial statement users to understand the dateeffect of a company’s choice to use fair value on its earnings, as well as to display on the face of the balance sheet the fair value of assets and liabilities chosen by the company for fair value accounting. SFAS 159 was effective for our fiscal year beginning January 1, 2008. SFAS 159 had no material impact on our consolidated financial statements for 2008.
In December 2007, the FASB issuedSFAS No. 141R,Business Combinations,andSFAS No. 160,Noncontrolling Interests in Consolidated Financial Statements—An Amendment of ARB No. 51. SFAS 141R and SFAS 160 require most identifiable assets, liabilities, non-controlling interests, and goodwill acquired in a business combination or purchase. This guidance isto be recorded at “full fair value” and require non-controlling interests (previously referred to as minority interests) to be reported as a component of equity, which changes the accounting for transactions with non-controlling interest holders. Both Statements are effective for interim reporting periods beginning on or after June 29, 2005,December 15, 2008, and earlier adoption is applicable onlyprohibited. SFAS 141R will be applied to leasehold improvements that are purchased or acquired in reporting periods beginningbusiness combinations occurring after the effective date. TheSFAS 160 will be applied prospectively to all non-controlling interests, including any that arose before the effective date. We do not expect the adoption of EITF 05-6 did notSFAS 141R and SFAS 160 to have a material impact on the financial statements.
In May 2005, the Financial Accounting Standards Board (FASB) issued SFAS No. 154,Accounting Changes and Error Corrections. SFAS No. 154 establishes new standards on accounting for changes in accounting principles. Pursuant to the new rules, all such changes must be accounted for by retrospective application to the financial statements of prior periods unless it is impracticable to do so. SFAS No. 154 supersedes Accounting Principles Bulletin (APB) Opinion 20, Accounting for Changes and SFAS No. 3,Reporting Accounting Changes in Interim Financial Statements, though it carries forward the guidance of those pronouncements with respect to accounting for changes in estimates, changes in the reporting entity, and error corrections. This statement is effective for accounting changes and error corrections made in years beginning after December 15, 2005, with early adoption permitted for changes and corrections made in years beginning after May 2005. The company will adopt SFAS No. 154 for the fiscal year 2006 does not expect adoption will have a material impact on the Company’sour consolidated financial statements.
In March 2005,2008, the FASB issued Financial InterpretationSFAS No. 47,161,AccountingDisclosures about Derivative Instruments and Hedging Activities—an Amendment of SFAS No. 133. SFAS 161 enhances required disclosures regarding derivatives and hedging activities, including enhanced disclosures regarding how: (a) an entity uses derivative instruments, (b) derivative instruments and related hedged items are accounted for Conditional Asset Retirement Obligationsunder SFAS 133, and (c) derivative instruments and related hedged items affect an entity's financial position, financial performance, and cash flows. SFAS 161 is effective for fiscal years and interim periods beginning after November 15, 2008 and early adoption is permitted. We do not expect the adoption of SFAS 161 will have a material effect on the disclosures that accompany our consolidated financial statements.
In December 2008, the FASB issuedFSP SFAS No. 132(R)-1,Employer’s Disclosures about Postretirement Benefit Plan Assets(FIN 47), which is an interpretationamends Statement 132(R). FSP FAS 132(R)-1 enhances required disclosures about employers’ plan assets, including employers’ investment strategies, major categories of Statementplan assets, concentrations of Financial Accounting Standards (SFAS) No. 143, “Accounting for Asset Retirement Obligations.” FIN 47 clarifies terminologyrisk within SFAS No. 143plan assets, and requires an entityvaluation techniques used to recognize a liability formeasure the fair value of a conditional asset retirement obligation when incurred if the liability’s fair value can be reasonably estimated. FIN 47plan assets. FSP FAS 132(R)-1 is effective for fiscal years ending after December 15, 2005. The2009 and early adoption is permitted. We do not expect the adoption of FIN No. 47 did notFSP FAS 132(R)-1 to have a material impact on the disclosures that accompany our consolidated financial statements.
In March 2005, the SEC issued SAB No. 107 which offers guidance on SFAS No. 123(R). SAB No. 107 was issued to assist preparers by simplifying some
| 3. | Acquisitions |
On June 23, 2008, we acquired substantially all of the implementation challengesassets of SFAS No. 123(R) while enhancingAuburn Merchandise Distributors, Inc., (“AMD”) located in Whitinsville, Massachusetts, a wholly-owned subsidiary of Warren Equities, Inc., for approximately $28.7 million, including transaction costs. The assets purchased include primarily accounts receivable, inventory, fixed assets and other intangibles, with no significant liabilities. Auburn operates out of a 130,000 sq. ft. facility and conducts business primarily in the information that investors receive. SAB No. 107 creates a framework that is premised on two overarching themes: (a) considerable judgment will be required by preparers to successfully implement SFAS No. 123(R), specifically when valuing employee stock options; and (b) reasonable individuals, acting in good faith, may conclude differently onNortheastern region of the United States. The purchase price exceeded the estimated fair value of employee stock options. Key topics coverednet assets acquired by SAB No. 107 include valuation models, expected volatility and expected term. The Company expectsapproximately $0.9 million, which has been recorded as goodwill. AMD will conduct operations as the “New England” division of Core-Mark. Results of operations of AMD have been included in Core-Mark’s consolidated statements of operations since the date of acquisition to applyDecember 31, 2008. We have determined that had the principlesacquisition been completed as of SAB No. 107 in conjunction with our adoptionthe beginning of SFAS No. 123(R) in fiscal year 2006.
In December 2004, the FASB issued SFAS No. 123 (revised 2004) (SFAS No. 123R),Share-Based Payment. SFAS No. 123(R) replaces SFAS No. 123,Accounting for Stock-Based Compensation and supersedes APB Opinion No. 25. Generally,period the approach in SFAS No. 123(R) is similar to the approach described in SFAS No. 123 for fair value. However, SFAS No. 123(R) requires all share-based payments to employees, including grants of employee stock options, to be recognized in the financial statements based on their fair values and prohibits pro forma disclosure as an alternative to financial statement recognition. SFAS No. 123(R) is effective for interim or annual reporting periods beginning after December 15, 2005. The Company will adopt SFAS No. 123(R) beginning in the first quarter of 2006 and does not expect the adoption will have a material impact on its financial statements.
In December 2004, the FASB issued SFAS No. 153Exchanges of Nonmonetary Assets—An Amendment of APB Opinion No. 29. The provisions of this statement are effective for non monetary asset exchanges occurring in periods beginning after June 15, 2005. This statement eliminates the exception to fair value for exchanges of similar productive assets and replaces it with a general exception for exchange transactions that dowould not have been material.
CORE-MARK HOLDING COMPANY, INC. AND SUBSIDIARIES
NOTES TO CONSOLIDATED FINANCIAL STATEMENTS—(Continued)
commercial substance—that is, transactions that are not expectedOn June 19, 2006, we completed the purchase of substantially all the assets and certain liabilities of Klein Candy Co. L.P. (the Pennsylvania division), a full service distributor of tobacco and grocery items to resultconvenience stores and other retail store formats in significant changesnine Eastern and mid-Western states, for approximately $58.3 million. The purchase price was allocated primarily to working capital items, $9.7 million to property and equipment and $2.8 million to goodwill.
We acquired Klein and AMD, to help build a national distribution capacity by expanding our presence into the Eastern United States.
| 4. | Victoria / Vancouver Facility Consolidation |
We consolidated business operations of our Victoria and Vancouver, British Columbia distribution centers in 2006 in order to reduce operating costs and improve service to customers. Total expenses related to the facility consolidation were $0.6 million in 2006. The facility closure costs were included in the cash flowsconsolidated statement of the reporting entity. The Company does not expect the adoption of SFAS No. 153 to have a significant impact on its consolidated financial statements.operations for 2006 under selling, general and administrative expenses.
In November 2004, FASB issued SFAS No. 151,Inventory Costs that amends the guidance in Accounting Research Bulletin (ARB) No. 43, Chapter 4,Inventory Pricing, (ARB No. 43) to clarify the accounting for abnormal amounts of idle facility expense, freight, handling costs, and wasted material (spoilage). In addition, this statement requires that an allocation of fixed production overheads to the costs of conversion be based on the normal capacity of the production facilities. SFAS No. 151 is effective for inventory costs incurred during years beginning after June 15, 2005. The Company will adopt SFAS No. 151 for the fiscal year 2006 does not expect the adoption will have a significant impact on its consolidated financial statements.
4. Other Balance Sheet Accounts Detail
| 5. | Other Balance Sheet Accounts Detail |
Allowance for Doubtful Accounts, Accounts Receivable
The changes in the allowance for doubtful accounts due from customers consist of the following during the following periods (in millions):
| Successor Company | Predecessor Company | |||||||||||||||||||||||
| Year ended December 31, | Period from August 23 through December 31, 2004 (Restated) | Period from August 22, 2004 | Year ended December 31, | |||||||||||||||||||||
| 2005 | 2003 | 2008 | 2007 | |||||||||||||||||||||
Balance, beginning of period | $ | 7.5 | $ | 7.0 | $ | 5.6 | $ | 4.8 | $ | 9.3 | $ | 4.0 | ||||||||||||
Net additions charged to operations | 0.9 | 2.2 | 2.8 | 3.4 | 1.6 | 6.9 | ||||||||||||||||||
Less: Write-offs | (1.9 | ) | (1.7 | ) | (1.4 | ) | (2.6 | ) | ||||||||||||||||
Less: Write-offs and adjustments | (2.1 | ) | (1.6 | ) | ||||||||||||||||||||
Balance, end of period | $ | 6.5 | $ | 7.5 | $ | 7.0 | $ | 5.6 | $ | 8.8 | $ | 9.3 | ||||||||||||
During the fourth quarter of 2007, two of our customers filed for bankruptcy under Chapter 11. Based on management’s evaluation of the customers’ ability to make future payments, including the legal options available, we increased the allowance for doubtful accounts by $5.9 million in the last two quarters of 2007 to provide for the collection risks with respect to these two accounts receivable. The increase in the allowance for doubtful accounts was recognized in our selling, general and administrative expenses which is included in our operating expenses. We continually assess our collection risks and make appropriate adjustments, as deemed necessary, to the allowance for doubtful accounts to ensure that reserves for accounts receivable are adequate.
Other Receivables, Net
Other receivables, net consist of the following (in millions):
December 31, 2005 | December 31, (Restated) | August 23, 2004 | December 31, 2008 | December 31, 2007 | |||||||||||
Vendor receivables, net | $ | 19.8 | $ | 27.1 | $ | 50.3 | $ | 25.9 | $ | 27.5 | |||||
Insurance recoverables, current | 4.3 | 2.5 | 3.1 | 2.9 | 3.4 | ||||||||||
Other | 3.1 | 4.5 | 0.5 | 5.3 | 1.2 | ||||||||||
Total | $ | 27.2 | $ | 34.1 | $ | 53.9 | $ | 34.1 | $ | 32.1 | |||||
The allowance for doubtful accounts due from vendors was $2.3 million, $4.5 million, $3.7$0.2 million as of December 31, 2005, December 31, 20042008 and August 23, 2004, respectively.2007.
CORE-MARK HOLDING COMPANY, INC. AND SUBSIDIARIES
NOTES TO CONSOLIDATED FINANCIAL STATEMENTS—(Continued)
Deposits and Prepayments
Deposits and prepayments consist of the following (in millions):
December 31, 2005 | December 31, (Restated) | August 23, 2004 | December 31, 2008 | December 31, 2007 | |||||||||||
Deposits | $ | 5.1 | $ | 20.4 | $ | 24.5 | $ | 3.6 | $ | 3.6 | |||||
Prepayments | 13.5 | 16.5 | 27.9 | 22.9 | 33.3 | ||||||||||
Total | $ | 18.6 | $ | 36.9 | $ | 52.4 | $ | 26.5 | $ | 36.9 | |||||
The Company’sOur deposits and prepayments include deposits related to workers’ compensation claims, prepayments relating to insurance policies, income taxes, product purchases, prepaid rent and rental deposits and up front consideration to customers.
Other Non-Current Assets, Net
Other non-current assets, net consist of the following (in millions):
December 31, 2005 | December 31, (Restated) | August 23, 2004 | December 31, 2008 | December 31, 2007 | |||||||||||
Internally developed and other software, net | $ | 5.4 | $ | 6.2 | $ | 6.0 | |||||||||
Internally developed and other purchased software, net | $ | 4.7 | $ | 5.6 | |||||||||||
Insurance recoverables, net of current portion | 26.1 | 20.7 | 20.9 | 19.8 | 20.7 | ||||||||||
Debt issuance costs, net | 2.0 | 3.3 | 3.8 | 1.0 | 1.2 | ||||||||||
Insurance deposits, net of current portion | 16.2 | 0.7 | — | 5.1 | 6.0 | ||||||||||
Other non-current assets | 2.8 | 1.7 | 2.1 | ||||||||||||
Amortizable intangibles | 3.8 | 1.2 | |||||||||||||
Other customer receivables | 1.9 | 0.2 | |||||||||||||
Other assets | 1.1 | 0.6 | |||||||||||||
Total | $ | 52.5 | $ | 32.6 | $ | 32.8 | $ | 37.4 | $ | 35.5 | |||||
Intangible Assets. As a result of Core-Mark’s then parent company Fleming filing for Chapter 11 bankruptcy on April 1, 2003, the Company performed a test for impairment on its acquired intangibles and long-lived assets based on third-party valuations. The test measured the value of those assets based on an income approach using the net present value of expected future cash flows generated by the reporting units or asset groupings, as applicable. As a result of the impairment testing performed, the acquired intangible assets were determined to be impaired, but property and equipment were not impaired based on third-party valuations. As a result, the Company recorded an impairment charge of $45.8 million to write-down the purchased intangibles and certain other long-lived intangible assets to their fair value as of April 1, 2003. This non-cash impairment charge is included in the accompanying consolidated statement of operations for the year ended December 31, 2003.
In accordance with Fresh-Start accounting under SOP 90-7, Management initiated an independent third-party valuation analysis which determined the fair value of the Company’s internally developed software to be $6.0 million at August 23, 2004.Long-Lived Assets. Internally developed software with an eight-yearaverage eight year life was $5.0$2.9 million at December 31, 2008 and $5.7$3.5 million at December 31, 2007, net of accumulated amortization for the years ended December 31, 2005 and December 31, 2004, respectively. In addition, other non-current assets included otheramortization. Other purchased software with an average life of one to three years whichfive year amounted to $0.4$1.8 million and $0.5 million as ofat December 31, 20052008 and $2.1 million at December 31, 2004, respectively.
Where applicable, we utilize independent valuations to assist us2007, net of accumulated depreciation. The amortization of intangible assets, inclusive of non-compete agreements and customers’ list, recorded in determining whether impairment exists for certain long-lived and intangible assets. As an initial step, the fair value of the Company as a business enterprise was determined through cash flow-based and market-based analyses. As a next step, specific assets
CORE-MARK HOLDING COMPANY, INC. AND SUBSIDIARIES
NOTES TO CONSOLIDATED FINANCIAL STATEMENTS—(Continued)
were analyzed, including our proprietary DCMS information systems platform, financing fees and long-term racking assets. It was determined that no impairment existed for these assets as of the test date.
Goodwill.Upon adoption of SFAS No. 142 on January 1, 2002, the Company ceased amortizing the remaining balances of goodwill existing at that time. For goodwill arising after January 1, 2002, no amortization was required in accordance with SFAS No. 142. The Company completed the transitional goodwill impairment test in January 2002 upon adoption of SFAS No. 142 and completed an annual test for impairment in December 2002. In each case, the Company determined that the carrying amount of goodwill was not impaired.
On April 1, 2003, Core-Mark’s then parent company Fleming filed for Chapter 11 bankruptcy, which was deemed an event or change in circumstances under SFAS No. 142 requiring impairment testing. As of the date of bankruptcy filing, the Company performed an impairment test on goodwill for each of its reporting units, or operating divisions, using the two-step approach. In testing the Company’s goodwill for impairment, the Company’s reporting units were determined, according to SFAS No. 142, to be the 22 distribution centers. For purposes of goodwill testing, with the assistance of an independent valuation firm, the Company’s unallocated goodwill was allocated to the reporting units based on projected cash flow performance. Additionally, with the assistance of an independent valuation firm, the Company determined the fair value of each reporting unit. This fair value was determined based on discounted cash flows derived from the financial projections provided to the bankruptcy court pursuant to the Plan. The resulting fair value of each reporting unit was then compared to its carrying value. Each of the 22 reporting units tested individually had fair values below their carrying values, indicating potential impairment. The Company then completed the next step of the goodwill impairment test by allocating the fair value of each reporting unit to its assets and liabilities, deriving the resulting fair value of goodwill. The result of this analysis was that none of the reporting units could support any of the allocated goodwill. Accordingly, an impairment charge of $245.6 million was recorded effective April 1, 2003, which represented 100% of the Company’s then total goodwill balance. This non-cash impairment charge is included in goodwill and asset impairment charges on the accompanying consolidated statement of operations was $2.0 million for the year ended December 31, 2003.
Accounts Payable2008 and $1.8 million for 2007.
Accounts payable consist of amounts due to our vendors for the purchase of inventory and for other operating expenses payable.
Cigarette and Tobacco Taxes Payable
Cigarette and tobacco taxes payable consist of amounts due to states, provinces and other jurisdictions relating to taxes due on cigarette and tobacco purchases and sales.
Claims Liabilities and Insurance Recoverables
Claim liabilities and insurance recoverables consist of the following (in millions):
December 31, 2005 | December 31, 2004 | August 23, 2004 | ||||||||||
Insurance recoverables, current portion, (included in Other receivables, net) | $ | 4.3 | $ | 2.5 | $ | 3.1 | ||||||
Insurance recoverables, net of current portion | 26.1 | 20.7 | 20.9 | |||||||||
Claim liabilities, current portion (included in Accrued liabilities) | (17.8 | ) | (18.8 | ) | (16.6 | ) | ||||||
Claim liabilities, net of current portion | (41.0 | ) | (46.3 | ) | (46.6 | ) | ||||||
Total, net | (28.4 | ) | (41.9 | ) | (39.2 | ) | ||||||
CORE-MARK HOLDING COMPANY, INC. AND SUBSIDIARIES
NOTES TO CONSOLIDATED FINANCIAL STATEMENTS—(Continued)
The Company’s insurance recoverables relate to receivables from its insurance carriers for estimated claims in excess of deductible amounts.(See Note 3 – Summary of Significant Accounting Policies.)
Claim liabilities consist primarily of auto, workers compensation, and medical claim liabilities.
Accrued Liabilities
Accrued liabilities consist of the following (in millions):
December 31, 2005 | December 31, (Restated) | August 23, 2004 | December 31, 2008 | December 31, 2007 | |||||||||||
Accrued payroll, retirement, and other benefits | $ | 13.4 | $ | 15.5 | $ | 18.6 | $ | 17.5 | $ | 12.3 | |||||
Claims liabilities, current | 17.8 | 18.8 | 16.6 | 9.3 | 8.6 | ||||||||||
Other accrued expenses | 23.0 | 21.4 | 21.6 | 20.9 | 28.2 | ||||||||||
Accrued customer incentives payable | 5.1 | 4.6 | 4.4 | 10.4 | 7.6 | ||||||||||
Total | $ | 59.3 | $ | 60.3 | $ | 61.2 | $ | 58.1 | $ | 56.7 | |||||
The Company’s
CORE-MARK HOLDING COMPANY, INC. AND SUBSIDIARIES
NOTES TO CONSOLIDATED FINANCIAL STATEMENTS—(Continued)
Our accrued payroll, retirement and other benefits include accruals for vacation, bonus, wages, 401(K)401(k) benefit matching and the current portion of pension and post-retirement benefit obligations. The Company’sOur other accrued expenses include Canadian goods and services taxes, legal expenses, interest and other miscellaneous accruals.
5. Inventories
| 6. | Inventories |
Inventories consist of the following (in millions):
December 31, 2005 | December 31, 2004 (Restated) | August 23, 2004 | December 31, 2008 | December 31, 2007 | |||||||||||||||
Inventories at FIFO, net of reserves | $ | 209.0 | $ | 188.2 | $ | 141.9 | $ | 274.7 | $ | 241.7 | |||||||||
Less: LIFO reserve | (9.3 | ) | (1.8 | ) | — | (36.3 | ) | (25.3 | ) | ||||||||||
Inventories | $ | 199.7 | $ | 186.4 | $ | 141.9 | |||||||||||||
Inventories at LIFO | $ | 238.4 | $ | 216.4 | |||||||||||||||
| 7. | Property and Equipment |
Property and equipment consist of the following (in millions):
| December 31, 2008 | December 31, 2007 | |||||||
Delivery, warehouse and office equipment | $ | 94.0 | $ | 73.7 | ||||
Equipment under Capital Leases | 1.0 | — | ||||||
Leasehold improvements | 9.1 | 14.7 | ||||||
Land and buildings | 12.5 | 12.1 | ||||||
| 116.6 | 100.5 | |||||||
Accumulated depreciation and amortization | (42.4 | ) | (31.2 | ) | ||||
Total | $ | 74.2 | $ | 69.3 | ||||
For the year ended December 31, 2005, the period from August 23, 2004 through December 31, 2004,2008, 2007 and the period from January 1, 2004 through August 22, 2004, the Company2006, depreciation and amortization expenses related to property and equipment were $12.8 million, $10.8 million and $9.5 million, respectively. Property and equipment includes accruals for construction in progress of $0.7 million in 2008, $3.3 million in 2007, and $1.4 million in 2006. During 2008, we reclassified approximately $6.5 million of leasehold improvements to delivery, warehouse and office equipment. This reclassification did not have any impact on our results of operations or financial position.
| 8. | Long-Term Debt |
Total Long-term debt as presented in the aggregate liquidate LIFO inventory quantities. consolidated balance sheets consists of the following (in millions):
| December 31, 2008 | December 31, 2007 | |||||
Amounts borrowed (Credit Facility) | $ | 30.0 | $ | 29.7 | ||
Obligations under Capital Leases | 0.8 | — | ||||
Total Long-term debt | $ | 30.8 | $ | 29.7 | ||
In conjunction withOctober 2005, we entered into a $250 million five-year revolving credit facility (“Credit Facility”). All obligations under the Company’s Fresh-Start accounting, on August 23, 2004 inventories were adjusted to fair value. Consequently, the LIFO reserveCredit Facility are secured by a first priority interest and liens upon substantially all of $2.3 million at August 22, 2004 was eliminated.
The Company provides inventory valuation reductions for spoiled, aged and unrecoverable inventory based on amounts on hand and historical shrinkage experience. This reserve was $1.2 million, $1.2 million and $0.0 million as of December 31, 2005, December 31, 2004 and August 23, 2004, respectively.
During the year ended December 31, 2003 inventory reductions resulted in a liquidation of LIFO inventory quantities which were carried at lower costs compared with the cost of purchases in the prior years. The effect of these liquidations decreased cost of goods sold by approximately $2.1 million and increased net income by approximately $1.3 million, or $0.13 per share for the year ended December 31, 2003.our
CORE-MARK HOLDING COMPANY, INC. AND SUBSIDIARIES
NOTES TO CONSOLIDATED FINANCIAL STATEMENTS—(Continued)
6. Property and Equipment
Property and equipment consist of the following (in millions):
December 31, 2005 | December 31, 2004 | August 23, 2004 | |||||||||
Delivery, warehouse and office equipment | $ | 40.8 | $ | 33.7 | $ | 27.5 | |||||
Leasehold improvements | 8.7 | 8.3 | 8.5 | ||||||||
Land and Building | 2.2 | 2.1 | 2.0 | ||||||||
| 51.7 | 44.1 | 38.0 | |||||||||
Accumulated depreciation and amortization | (10.8 | ) | (2.8 | ) | — | ||||||
Total | $ | 40.9 | $ | 41.3 | $ | 38.0 | |||||
Depreciation and amortization expense related to property and equipment is as follows (in millions):
Successor Company | Predecessor Company | |||||
Year ended December 31, 2005 | Period from August 23 through December 31, 2004 | Period from January 1 through | Year ended December 31, 2003 | |||
$8.3 | $2.8 | $5.7 | $8.2 | |||
7. Long-Term Debt
Pursuant to the Plan, the Company entered into a three-year agreement with a group of lenders to provide a $250 million lending agreement, the 2004 Revolving Credit Facility. In addition, we entered into a $60 million five year term loan consisting of notes or letters of credit, the Tranche B Note Agreement. Upon emergence from bankruptcy, we had $118.7 million in long-term debt on our balance sheet.
On October 13, 2005, the Company entered into a new $250 million five-year revolving credit facility, which we refer to as the 2005 Credit Facility, with a group of lenders led by J.P. Morgan Chase. The 2005 Credit Facility refinanced and replaced the 2004 Revolving Credit Facility and the Tranche B term facility, and in conjunction with establishing the 2005 Credit Facility the Company prepaid all $32.3 million in outstanding revolving loans under the 2004 Revolving Credit Facility and the Tranche B term facility, cash collateralized or transferred to the 2005 Credit Facility all $53.3 million in letters of credit issued under the 2004 Revolving Credit Facility and the Tranche B term facility, and terminated the 2004 Revolving Credit Facility and the Tranche B note agreement. The Company does not believe that the matters described inNote 2 – Restatements of Financial Statements constituted or established the existence of a breach or default under the Credit Agreement, however, in order to avoid any dispute over whether a breach or default had occurred, the Company nevertheless obtained a confirmatory waiver from the lenders under the Credit Agreement of any such potential breach or default
As required under the Tranche B term facility, in 2005 the Company paid pre-payment fees of $1.8 million and expensed $2.0 million for the write-off of debt discount related to the Tranche B note agreement. Unamortized debt issuance costs of $2.4 million related to the Tranche B term facility and the 2004 Revolving Credit Facility were written off in 2005. These charges, totaling $6.2 million, were recorded as loss on early extinguishment of debt in the consolidated statement of operations in 2005. The 2005 Credit Facility provides for up to $250 million in revolving loans, of which $160 million is available as letters of credit and up to C$110 million is available in Canadian dollars. Borrowing under the 2005 Credit Facility is subject to a formula based
CORE-MARK HOLDING COMPANY, INC. AND SUBSIDIARIES
NOTES TO CONSOLIDATED FINANCIAL STATEMENTS—(Continued)
on eligible accounts receivable, eligible inventory, certain equipment and certain unrestricted cash balances, less certain reserves (the 2005 Credit Facility Borrowing Base), which limits the amount of revolving loans and letters of credit available. The administrative agent under the 2005 Credit Facility also has the right, under certain circumstances, to establish additional reserves against the commitment under the 2005 Credit Facility.
At the Company’s option, interest rates on the U.S. revolving loans and letters of credit under the 2005 Credit Facility are based on LIBOR plus an applicable margin, or on an alternate base rate equal to the higher of the prime rate or the federal funds rate plus 0.50%. There is no additional margin on alternate base rate advances. Loans made in Canadian Dollars bear interest at either a rate based on the Canadian deposit offered rate (CDOR), which is equal to the rate quoted on the publicly available CDOR screen plus 0.10%, plus an applicable margin or at a Canadian base rate equal to the greater of the Canadian prime rate or the CDOR rate plus 1%. The applicable margin on LIBOR-based loans and CDOR-based loans may range from 1.00% to 1.75% depending on our adjusted EBITDA as defined in the 2005 Credit Facility, and was initially set at 1.50%.
Interest is payable monthly, or if we elect LIBOR or CDOR, at the expiration of each LIBOR or CDOR period, which is one, two, three or six months, as the Company may elect under the 2005 Credit Facility (except that if the Company elects a LIBOR or CDOR period of six months, interest is payable at the end of the third and sixth months). The Company is subject to an unused facility fee that may range from 0.25% to 0.30% of the unused portion of the 2005 Credit Facility depending on the Company’s adjusted EBITDA as defined in the 2005 Credit Facility. For the fiscal year ended December 31, 2005 the unused facility fee percentage was established at 0.25%.
The credit agreement for the 2005 Credit Facility (the 2005 Credit Agreement) contains restrictive covenants, including among others limitations on dividends and other restricted payments, other indebtedness, liens, investments and acquisitions, and certain asset sales. If the Company’s availability under the 2005 Credit Facility falls below $35 million, we will be obligated to maintain a fixed charge coverage ratio, calculated as provided in the 2005 Credit Agreement and based on adjusted EBITDA as defined in the 2005 Credit Agreement, of not less than 1.1 to 1.
The 2005 Credit Facility is collateralized by a first priority interest in, and liens upon, substantially all of the Company’s present and future assets. The terms of the 2005 Credit Facility permit prepayment without penalty at any time (subject to customary breakage costs with respect to LIBOR or CDOR-based loans prepaid prior to the end of an interest period). The Company is required
On March 12, 2008, we entered into a Second Amendment to pay off any outstanding balance onour Credit Facility (the “Second Amendment”). This Amendment established our basket for permitted acquisitions made after the facility in October, 2010. At December 31, 2005, the Company was in compliance with alldate of the conditions and covenants and had a net available borrowing capacity under the 2005 Credit Facility of approximately $67.0 million. The Company paid a total of approximately $2.1 million in financing costs for the 2005 Credit Facility, which will be deferred and amortized over the life of the facility. These costs were included in other non-current assets on the consolidated balance sheet.
During 2005, the maximum amount of borrowing and letters of credit outstanding under the revolving credit facilities were $68.3Second Amendment at $100 million and $51.9 million, respectively. As of December 31, 2005, the totalincreased our basket for permitted stock repurchases to $30 million.
Net available borrowings, outstanding were $59.6 million and letters of credit outstanding were $51.9 million. At December 31, 2005 the Company elected the LIBOR option and the 30-day and 60-day LIBOR rates were 4.37% and 4.30%, respectively. The weighted-average interest rate for the year ended December 31, 2005 for the revolving credit facility was 5.8%. The Company’s LIBOR margin decreased from 12% under the Tranche B Notes and a range of 2.25% to 2.75% under the 2004 Revolving Credit Facility to a range of 1.00% to 1.75% under 2005 Revolving Credit Facility. The balance outstanding on the 2005 Credit Facility has been classified as long-term debt because the facility expires on October 12, 2010.
CORE-MARK HOLDING COMPANY, INC. AND SUBSIDIARIES
NOTES TO CONSOLIDATED FINANCIAL STATEMENTS—(Continued)
The Company’s long-term debtamounts borrowed and outstanding letters of credit as ofunder the dates belowCredit Facility were as follows (in millions):
December 31, 2005 | December 31, 2004 | August 23, 2004 | |||||||||
Revolving credit facility | $ | 59.6 | $ | 45.0 | $ | 86.4 | |||||
Tranche B notes payable | — | 35.5 | 35.5 | ||||||||
Subtotal | 59.6 | 80.5 | 121.9 | ||||||||
Less: Debt discount | — | (3.0 | ) | (3.2 | ) | ||||||
Subtotal | 59.6 | 77.5 | 118.7 | ||||||||
Less: Current portion of long-term debt | — | — | — | ||||||||
Total long-term debt, net of current portion | $ | 59.6 | $ | 77.5 | $ | 118.7 | |||||
Letters of credit outstanding | $ | 51.9 | $ | 61.2 | $ | 57.1 | |||||
| December 31, 2008 | December 31, 2007 | |||||
Net available borrowings | $ | 186.0 | $ | 160.0 | ||
Amounts borrowed | $ | 30.0 | $ | 29.7 | ||
Outstanding letters of credit | $ | 24.4 | $ | 28.5 | ||
The scheduled contractual maturityCredit Facility contains restrictive covenants, including among others, limitations on dividends and other restricted payments, other indebtedness, liens, investments and acquisitions and certain asset sales. We are in compliance with all of long-term debt asthe covenants under the facility.
Our weighted average interest rate was calculated based on our daily cost of borrowing which was computed on a blend of prime and LIBOR rates. The weighted average interest rate on our revolving credit facility for the years ended December 31, 20052008 and 2007 was $59.63.8% and 6.7%, respectively. We paid total unused facility fees of $0.5 million related to the 2005 Revolving Credit Facility due in 2010.
both 2008 and 2007. Unamortized debt issuance costs were $2.0$1.0 million $3.4 million, $3.8as of December 31, 2008 and $1.2 million at December 31, 2005, December 31, 2004 and August 23, 2004, respectively.
8. Reorganization Items, Net
Reorganization items, net, represent expenses and other adjustments the Company incurred as a result of Fleming’s Chapter 11 bankruptcy. Reorganization items, net is presented separately in the accompanying consolidated statements of operations as required by SOP 90-7 and consists of the following (in millions):2007.
| Successor Company | Predecessor Company | |||||||||||||
Year ended December 31, | Period from August 23 through December 31, 2004 | Period from January 1 through August 22, 2004 | Year ended December 31, | |||||||||||
Net gain on cancellation of debt | $ | — | $ | — | $ | (66.1 | ) | $ | — | |||||
Revaluation of assets and liabilities | — | — | (5.8 | ) | — | |||||||||
Professional fees | — | 0.7 | 1.6 | 2.5 | ||||||||||
Other expenses | — | 0.1 | 0.3 | 4.8 | ||||||||||
Total | $ | — | $ | 0.8 | $ | (70.0 | ) | $ | 7.3 | |||||
Other reorganization expenses include charges related to former customer proprietary inventory, vendor receivables arising as a result of the bankruptcy deemed uncollectible and other charges. In connection with the bankruptcy, substantial professional fees were incurred and paid by Fleming, and the unallocated portions are not included herein.
| 9. |
| |||||||||||||||||||||||||||||||||||||||||||||||||||||||||||||||||
Purchase Commitments
Purchase agreements and commitments entered into in the ordinary course of business obligate us to make future purchases of transportation and information technology equipment. As of December 31, 2008, estimated transportation equipment purchase commitments were $0.1 million and estimated information technology purchase commitments were $0.5 million.
Operating Leases
The Company leasesWe lease nearly all of itsour sales and warehouse facilities as well as tractors, trucks, vans, and truckscertain equipment under operating lease agreements expiring at various dates through 2016,2021, excluding renewal options. Minimum rentRent expense is expensedrecorded in accordance withSFAS No. 13,Accounting for LeaseLeases,s, on a straight-line basis over the term of the lease including available renewal optionsoption terms if it is reasonably assured that the renewal options will be exercised. The operating leases generally require the Companyus to pay taxes, maintenance and insurance. In most instances, the Company’s management expectswe expect the operating leases that expire will be renewed or replaced in the normal course of the Company’s business. If applicable, the Company records a liability for asset retirement obligations associated with its leases, in accordance with FIN No. 47 which is an interpretation of SFAS No. 143,Accounting for Asset Retirement Obligations. At December 31, 2005 the Company believes that its asset retirement obligations are immaterial.
CORE-MARK HOLDING COMPANY, INC. AND SUBSIDIARIES
NOTES TO CONSOLIDATED FINANCIAL STATEMENTS—(Continued)
Future minimum rental payments under non-cancelable operating leases (with initial or remaining lease terms in excess of one year and excluding contracted vehicle maintenance costs) were as follows as of December 31, 2005:2008:
Year Ending December 31, | (in millions) | ||
2006 | $ | 18.7 | |
2007 | 16.4 | ||
2008 | 12.7 | ||
2009 | 10.3 | ||
2010 | 8.4 | ||
Thereafter | 19.3 | ||
| $ | 85.8 | ||
Year Ending December 31, | (in millions) | ||
2009 | $ | 27.4 | |
2010 | 25.7 | ||
2011 | 23.0 | ||
2012 | 18.9 | ||
2013 | 13.9 | ||
Thereafter | 71.1 | ||
| $ | 180.0 | ||
CORE-MARK HOLDING COMPANY, INC. AND SUBSIDIARIES
NOTES TO CONSOLIDATED FINANCIAL STATEMENTS—(Continued)
TotalFor 2008, 2007 and 2006, rental expenseexpenses for operating and month-to-month leases, including contracted vehicle maintenance costs is as follows (in millions):were $33.8 million, $29.1 million, and $23.9 million, respectively.
Capital Leases
Successor Company | Predecessor Company | |||||
Year ended December 31, 2005 | Period from | Period from January 1 through August 22, 2004 | Year ended December 31, 2003 | |||
$ 24.1 | $7.3 | $16.5 | $19.5 | |||
As of December 31, 2008, we have approximately $0.8 million of refrigeration equipment leased under a capital lease.
Contingencies
Litigation
The Company isWe are subject to certain legal proceedings, claims, investigations and administrative proceedings in the ordinary course of itsour business. In accordance withSFAS No. 5,Accounting for Contingencies, the Company makes we make a provision for a liability when it is both probable that the liability has been incurred and the amount of the liability can be reasonably estimated. These provisions, if any, are reviewed at least quarterly and adjusted to reflect the impacts of negotiations, settlements, rulings, advice of legal counsel, and other information and events pertaining to a particular case. At December 31, 2005, the Company was2008, we were not involved in any material litigation.
Trust Guarantees
| 10. | Income Taxes |
Pursuant to the Plan, the Company guarantees the payment of all PCT administrative claims in excess of $56 million. In addition, if the assetsOur income tax provision consists of the RCT are inadequate to satisfy all of the allowed TLV claims in the RCT, the Company must pay such claims in full plus any accrued interest. The Company also guarantees all eligible but unpaid non-TLV claims in the RCT up to a maximum of $15 million. The Plan limits the combined RCT guarantee amounts of the TLV and non-TLV claims to no more than $137 million. FASB Interpretation No. 45 (FIN 45),Guarantor’s Accounting and Disclosure Requirements for Guarantees, Including Indirect Guarantees of Indebtedness of Others, requires that an entity issuing a guarantee must recognize, at the inception of the guarantee, a liability equal to the fair value of the guarantee. Based on the estimates provided by the Trusts and the Company’s analysis the assets of the Trusts are sufficient to satisfy the claims against it; therefore, the Company believes that the fair value of its guarantee liability as of August 23, 2004 and December 31, 2004 was not significant. In accordance with SFAS 5Accounting for Contingencies, the Company deemed remote the likelihood that a liability existed as of December 31, 2005 to satisfy the trust claims. However, if the assets of the Trust prove insufficient to pay the claims in the future, the Company could be required to satisfy the guarantees.
11. Income Taxes
The Company is subject to United States federal, state, local and foreign income taxes. The domestic and foreign components of income (loss) from continuing operations before provision (benefit) for income taxes were as followsfollowing (in millions):
| Successor Company | Predecessor Company | Year ended December 31, | ||||||||||||||||||||||||
Year ended December 31, | Period from (Restated) | Period from August 22, | Year ended 2003 | 2008 | 2007 | 2006 | ||||||||||||||||||||
Domestic | $ | 19.5 | $ | 4.6 | $ | 62.6 | $ | (262.7 | ) | |||||||||||||||||
Current: | ||||||||||||||||||||||||||
Federal | $ | 6.8 | $ | 13.5 | $ | 7.8 | ||||||||||||||||||||
State | 0.6 | 3.4 | 1.3 | |||||||||||||||||||||||
Foreign | 6.4 | 4.8 | 14.8 | (2.2 | ) | (0.1 | ) | 0.4 | 1.7 | |||||||||||||||||
Total current tax provision | 7.3 | 17.3 | 10.8 | |||||||||||||||||||||||
| $ | 25.9 | $ | 9.4 | $ | 77.4 | $ | (264.9 | ) | ||||||||||||||||||
Deferred: | ||||||||||||||||||||||||||
Federal | (1.6 | ) | (2.3 | ) | 2.2 | |||||||||||||||||||||
State | (1.0 | ) | (0.4 | ) | 0.7 | |||||||||||||||||||||
Foreign | — | (1.1 | ) | (0.3 | ) | |||||||||||||||||||||
Total deferred tax (benefit) provision | (2.6 | ) | (3.8 | ) | 2.6 | |||||||||||||||||||||
Income tax provision | $ | 4.7 | $ | 13.5 | $ | 13.4 | ||||||||||||||||||||
CORE-MARK HOLDING COMPANY, INC. AND SUBSIDIARIES
NOTES TO CONSOLIDATED FINANCIAL STATEMENTS—(Continued)
The Company’s income tax provision (benefit) from continuing operations consistsA reconciliation of the following (in millions):
| Successor Company | Predecessor Company | ||||||||||||||
Year ended December 31, | Period through (Restated) | Period from through August 22, | Year ended December 31, 2003 | ||||||||||||
Current: | |||||||||||||||
Federal | $ | 8.8 | $ | 7.5 | $ | 4.6 | $ | 13.7 | |||||||
State | 2.4 | 2.1 | 1.1 | 3.1 | |||||||||||
Foreign | 2.8 | 2.4 | — | — | |||||||||||
Total current tax provision | 14.0 | 12.0 | 5.7 | 16.8 | |||||||||||
Deferred: | |||||||||||||||
Federal | (1.6 | ) | (5.8 | ) | 11.8 | (12.5 | ) | ||||||||
State | (0.4 | ) | (1.2 | ) | 5.2 | (2.7 | ) | ||||||||
Foreign | (0.4 | ) | (0.9 | ) | 4.0 | (1.3 | ) | ||||||||
Total deferred tax (benefit) provision | (2.4 | ) | (7.9 | ) | 21.0 | (16.5 | ) | ||||||||
Income tax provision | $ | 11.6 | $ | 4.1 | $ | 26.7 | $ | 0.3 | |||||||
Total income tax provision differs from the expected income tax provision computed by applying the U.S.statutory federal statutory corporate income tax rate to our effective income (loss) from continuing operations beforetax rate and income taxes as followstax provision (in millions): follows:
| Successor Company | Predecessor Company | |||||||||||||||
Year ended December 31, | Period from (Restated) | Period from August 22, 2004 | Year ended 2003 | |||||||||||||
Expected federal income tax provision at the statutory rate | $ | 9.1 | $ | 3.3 | $ | 27.1 | $ | (92.7 | ) | |||||||
Increase (decrease) resulting from: | ||||||||||||||||
State income taxes, net of federal benefit | 1.3 | 0.5 | 4.1 | 0.3 | ||||||||||||
Non-deductible goodwill impairment | — | — | — | 93.8 | ||||||||||||
Exclusion of cancellation of debt income | — | — | (1.3 | ) | — | |||||||||||
Effect of foreign operations | (0.4 | ) | (0.8 | ) | 4.0 | (1.3 | ) | |||||||||
Change in valuation allowances | 1.1 | 0.7 | (4.2 | ) | — | |||||||||||
Adjustment to estimated tax accruals | — | — | (2.8 | ) | — | |||||||||||
Other, net | 0.5 | 0.4 | (0.2 | ) | 0.2 | |||||||||||
Income tax provision | $ | 11.6 | $ | 4.1 | $ | 26.7 | $ | 0.3 | ||||||||
CORE-MARK HOLDING COMPANY, INC. AND SUBSIDIARIES
NOTES TO CONSOLIDATED FINANCIAL STATEMENTS—(Continued)
| Year Ended December 31, | |||||||||||||||||||||
| 2008 | 2007 | 2006 | |||||||||||||||||||
Federal income tax provision at the statutory rate | $ | 7.9 | 35.0 | % | $ | 13.2 | 35.0 | % | $ | 11.9 | 35.0 | % | |||||||||
Increase (decrease) resulting from: | |||||||||||||||||||||
State income taxes, net of federal benefit | 1.0 | 4.4 | 1.9 | 5.1 | 1.3 | 3.8 | |||||||||||||||
Decrease in unrecognized tax benefits | (2.5 | ) | (11.1 | ) | (0.8 | ) | (2.1 | ) | — | — | |||||||||||
Effect of foreign operations | (0.1 | ) | (0.4 | ) | (0.8 | ) | (2.1 | ) | (0.3 | ) | (0.8 | ) | |||||||||
Change in valuation allowances | (1.6 | ) | (7.1 | ) | — | — | 0.4 | 1.1 | |||||||||||||
Other, net | — | — | — | — | 0.1 | 0.3 | |||||||||||||||
Income tax provision | $ | 4.7 | 20.8 | % | $ | 13.5 | 35.9 | % | $ | 13.4 | 39.4 | % | |||||||||
Deferred tax assets and liabilities are measured using enacted tax rates expected to apply to taxable income in the years in which those temporary differences are expected to be recovered or settled. The tax effects of significant temporary differences which comprise deferred tax assets and liabilities are as follows (in millions):
| Successor Company | Predecessor Company | |||||||||||||||||||||||
December 31, 2005 | December 31, (Restated) | August 23, 2004 | December 31, 2003 | December 31, 2008 | December 31, 2007 | |||||||||||||||||||
Deferred tax assets: | ||||||||||||||||||||||||
Net operating loss carryforwards | $ | — | $ | — | $ | — | $ | 4.7 | ||||||||||||||||
Employee benefits, including post-retirement benefits | 17.7 | 17.9 | 14.7 | 7.5 | $ | 22.3 | $ | 14.7 | ||||||||||||||||
Trade and other receivables | 2.7 | 3.3 | — | 2.1 | 3.4 | 2.8 | ||||||||||||||||||
Inventories | 2.5 | 1.6 | ||||||||||||||||||||||
Goodwill and intangibles | 0.4 | 0.1 | 0.2 | 7.8 | 1.1 | 0.9 | ||||||||||||||||||
Self-insurance reserve | 2.4 | 4.7 | 9.3 | 1.7 | ||||||||||||||||||||
Self-insurance reserves | 1.7 | 1.4 | ||||||||||||||||||||||
State taxes | 0.8 | 1.5 | ||||||||||||||||||||||
Other | 2.8 | 1.6 | 0.7 | 2.1 | 2.0 | 3.5 | ||||||||||||||||||
Subtotal | 26.0 | 27.6 | 24.9 | 25.9 | 33.8 | 26.4 | ||||||||||||||||||
Less: valuation allowance | (1.9 | ) | (0.7 | ) | — | (4.2 | ) | (0.1 | ) | (1.7 | ) | |||||||||||||
Net deferred tax assets | 24.1 | 26.9 | 24.9 | 21.7 | $ | 33.7 | $ | 24.7 | ||||||||||||||||
Deferred tax liabilities: | ||||||||||||||||||||||||
Inventories | 20.2 | 20.3 | 21.6 | 23.2 | ||||||||||||||||||||
Trade and other receivables | — | — | 3.6 | — | ||||||||||||||||||||
Property and equipment | 10.0 | 12.0 | 12.5 | 3.8 | $ | 9.3 | $ | 5.2 | ||||||||||||||||
Deferred income | 1.9 | 2.3 | 2.8 | — | 1.5 | 1.9 | ||||||||||||||||||
Deferred debt issuance costs | — | 2.5 | 2.7 | — | ||||||||||||||||||||
Other | 3.2 | 3.5 | 3.6 | 4.4 | 1.7 | 2.0 | ||||||||||||||||||
Total deferred tax liabilities | 35.3 | 40.6 | 46.8 | 31.4 | $ | 12.5 | $ | 9.1 | ||||||||||||||||
Total net deferred tax liabilities | $ | (11.2 | ) | $ | (13.7 | ) | $ | (21.9 | ) | $ | (9.7 | ) | ||||||||||||
Total net deferred tax assets | $ | 21.2 | $ | 15.6 | ||||||||||||||||||||
Net current deferred tax assets | 10.7 | 8.4 | ||||||||||||||||||||||
Net non-current deferred tax assets | $ | 10.5 | $ | 7.2 | ||||||||||||||||||||
The net deferred tax assets (liabilities) as presented in the accompanying consolidated balance sheets are as follows (in millions):
| Successor Company | Predecessor Company | |||||||||||||||
December 31, 2005 | December 31, 2004 | August 23, 2004 | December 31, 2003 | |||||||||||||
Net current deferred taxes | $ | (13.3 | ) | $ | (14.4 | ) | $ | (21.6 | ) | $ | (18.9 | ) | ||||
Net non-current deferred taxes | 2.1 | 0.7 | (0.3 | ) | 9.2 | |||||||||||
Total net deferred tax liabilities | $ | (11.2 | ) | $ | (13.7 | ) | $ | (21.9 | ) | $ | (9.7 | ) | ||||
In assessing the potential realization of deferred tax assets, management considers whether it is more likely than not that some portion or all of the deferred tax assets will not be realized. The ultimate realization of deferred tax assets is dependent upon the generation of future taxable income during the periods in which those temporary differences become deductible. The Company considers the scheduled reversal of deferred tax liabilities, projected future income and tax planning strategies in making this assessment. At each balance sheet date, a valuation allowance has beenwas established against the deferred tax assets based on management’s assessment whether it is more likely than not that these deferred tax assets would not be realized. Prior to emergence the CompanyWe had a valuation allowance of $4.2$0.1 million related primarily to limitations on net operating loss carry-forwards, which was utilized as part of the applicable Fresh-Start accounting adjustments.
CORE-MARK HOLDING COMPANY, INC. AND SUBSIDIARIES
NOTES TO CONSOLIDATED FINANCIAL STATEMENTS—(Continued)
As ofat December 31, 2005, the Company had a valuation allowance of $1.92008 and $1.7 million at December 31, 2007 related to foreign tax credits, which will expire in 2014 and 2015.
Deferred tax assets and liabilities as reflected at August 23, 2004 in connection with the application of fresh-start accounting are based on management’s best estimate of the tax filing position as probable of being accepted by the applicable taxing authorities. The Company has taken an alternative position on its tax returns. Based on this alternative tax filing position, the Company has taken deductions on its tax returns that may be challenged by the taxing authorities. Although management believes that the Company’s tax filing position will more likely than not be sustained in the event of an examination by applicable taxing authorities and would contest any proposed adjustment vigorously, the outcome of such matters can not be predicted with certainty. As such, the Company has accrued approximately $3.9 million in other tax liabilities on the accompanying December 31, 2005 consolidated balance sheet for this contingency.to 2016.
12. Earnings Per Share
The following table sets forthIn June 2006, the computation of basic and diluted net earnings (loss) per share (in millions, except per share amounts):
| Successor Company | Predecessor Company | |||||||||||||
Year ended December 31, | Period from August 23, | Period January 1, | Year ended 2003 | |||||||||||
Income (loss) from continuing operations | $ | 14.3 | $ | 5.3 | $ | 50.7 | $ | (265.2 | ) | |||||
Income (loss) from discontinued operations, net of tax | — | — | — | (2.8 | ) | |||||||||
Net income (loss) | $ | 14.3 | $ | 5.3 | $ | 50.7 | $ | (268.0 | ) | |||||
Basic weighted-average shares outstanding | 9.8 | 9.8 | 9.8 | 9.8 | ||||||||||
Dilutive common equivalent shares: | ||||||||||||||
Unvested restricted stock | 0.1 | — | — | — | ||||||||||
Stock options | 0.2 | — | — | — | ||||||||||
Class 6(b) warrants | 0.3 | — | — | — | ||||||||||
Tranche B warrants | 0.1 | — | — | — | ||||||||||
Diluted weighted-average shares outstanding | 10.5 | 9.8 | 9.8 | 9.8 | ||||||||||
Basic earnings (loss) from continuing operations per share | $ | 1.46 | $ | 0.54 | $ | 5.17 | $ | (27.06 | ) | |||||
Basic earnings (loss) from discontinued operations per share | $ | — | $ | — | $ | — | $ | (0.29 | ) | |||||
Basic earnings (loss) per share | $ | 1.46 | $ | 0.54 | $ | 5.17 | $ | (27.35 | ) | |||||
Diluted net earnings (loss) from continuing operations per share | $ | 1.37 | $ | 0.54 | $ | 5.17 | $ | (27.06 | ||||||
Diluted net earnings (loss) from discontinued operations per share | $ | — | $ | — | $ | — | $ | (0.29 | ) | |||||
Diluted net earnings (loss) per share | $ | 1.37 | $ | 0.54 | $ | 5.17 | $ | (27.35 | ) | |||||
Upon emergence fromFinancial Accounting Standards Board (FASB) issuedFinancial Interpretation No. 48 (FIN 48),Accounting for Uncertainty in Income Taxeswhich clarifies the Fleming bankruptcy, all common stock equivalents of the Predecessor Company were cancelled. As such, basic and diluted earnings (loss) per shareaccounting for the Predecessor Company were computed using the Successor Company’s capital structure for comparative purposes only.uncertainty in income taxes
CORE-MARK HOLDING COMPANY, INC. AND SUBSIDIARIES
NOTES TO CONSOLIDATED FINANCIAL STATEMENTS—(Continued)
13. Stock-Based Compensation Plans
The Company accounts for its stock-based compensation plans using the fair value method as prescribedrecognized in an enterprise’s financial statements in accordance withSFAS No. 123, whereby stock-based compensation cost is measured at109,Accounting for Income Taxes.We adopted FIN 48 on January 1, 2007 which resulted in an increase in our stockholders’ equity of $18.6 million.
At December 31, 2008, the grant date based on the fair valuetotal amount of unrecognized tax benefits which was included in other tax liabilities, related to federal, state and foreign taxes was approximately $6.1 million. A reconciliation of the awardbeginning and isending amounts of unrecognized tax benefits for 2008 and 2007 follows (in millions):
| 2008 | 2007 | |||||||
Balance at beginning of year | $ | 10.2 | $ | 10.5 | ||||
Lapse of statute of limitations | (3.4 | ) | (0.9 | ) | ||||
Other | (0.7 | ) | 0.6 | |||||
Balance at end of year | $ | 6.1 | $ | 10.2 | ||||
The total amount of net unrecognized tax benefits that would impact the effective tax rate, if recognized, as expense over the vesting period. Total stock-based compensation cost recognized on the accompanying consolidated statement of operations was $4.0would be $5.3 million for the year ended 2005, and $0.9 million for the period from August 23, 2004 to December 31, 2004. There was no stock-based compensation plan in place prior to August 23, 2004, therefore the stock-based compensation cost was $0 for the period from January 1, 2004 through August 22, 2004 and for the year ended December 31, 2003.
The Company maintains four stock-based compensation plans, the 2004 Long-Term Incentive Plan, the 2004 Directors’ Equity Incentive Plan, the 2005 Long-Term Incentive Plan and the 2005 Directors’ Equity Incentive Plan which were established on and after the date of emergence from the Fleming bankruptcy. The fair value of each option grant is estimated on the date of grant using the Black-Scholes option pricing model.
2004 Long-Term Incentive Plan
On the date of emergence, the Company established the 2004 Long-Term Incentive Plan (2004 LTIP), which has of two components consisting of 1,114,444 stock options and 200,000 restricted stock.
Under the Company’s 2004 LTIP, the Company’s Board of Directors is authorized to grant options to its employees to purchase up to 1,114,444 shares of common stock. For each option, the exercise price must equal the fair value of the Company’s common stock on the date of grant and carries a term of seven years. One third of the option shares vest on the first anniversary of the vesting commencement date and the remaining shares vest in equal monthly installments over the two year period following the first anniversary of the vesting commencement date. Based on the Black-Scholes option pricing model, the weighted-average grant date fair value per option granted was $4.39. The following assumptions were used for option grants made during the period from August 23, 2004 through December 31, 2004 and for the year December 31, 2005: expected life of four years, a risk-free interest rate of 3.0%, expected volatility of 30%, and an expected dividend yield of zero. Total stock-based compensation cost recognized from stock option awards under the 2004 LTIP totaled $1.5 and $0.5 million for the year ended December 31, 2005 and the period from August 23, 2004 through December 31, 2004, respectively.
The 2004 LTIP provides for the granting of 200,000 shares of restricted common stock to officers and key employees. Restricted common stock issued under the 2004 LTIP generally vests over three years, with a one-year cliff vesting, followed by vesting ratably over the remaining 24 months. In August 2004, pursuant to the Plan, the Company granted 190,876 shares of common stock with a fair-value of $15.50 per share. In December 2005, the Company granted an additional 7,313 shares with a fair value of $32.30 per share pursuant to the Plan. There were 83,995 restricted common shares vested as of December 31, 2005.2008. The stock-based compensation totaling $3.0unrecognized tax benefits of $6.1 million which approximatesas of December 31, 2008 could be impacted further by the fair valueexpiration of the restricted common shares onstatute of limitations for certain tax positions in future years. We estimate the date of grant, is being recognized ratably over the three-year vesting period of the restricted common shares using the straight-line method. Total stock-based compensation cost recognized from restricted stock awards under the 2004 LTIP totaled $1.0 and $0.4impact could be up to $4.7 million for the year ended December 31, 2005 and the period from August 23, 2004 through December 31, 2009.
We file U.S., state and foreign income tax returns in jurisdictions with varying statutes of limitations. The 2005 to 2007 tax years remain subject to examination by federal and state tax authorities. The 2004 respectively.tax year is still open for certain state tax authorities. The 2000 to 2007 tax years remain subject to examination by the respective tax authority for the foreign jurisdictions. In 2007, the Canada Revenue Agency initiated an examination of our Canadian tax returns for 2003 and 2004. The examination has been completed and no adjustments have been proposed as of December 31, 2008.
2004 Directors’ Equity Incentive PlanWe recognize interest and penalties on income taxes in income tax expense. As of December 31, 2008, we recorded a liability of $3.1 million for estimated interest and penalties related to unrecognized tax benefits under FIN 48, consisting of $2.5 million for interest and $0.6 million of penalties.
Under
| 11. | Earnings Per Share |
The following table sets forth the Company’s 2004 Directors’ Equity Incentive Plan (2004 Directors’ Plan), the Company’s Boardcomputation of Directors may from time to time grant options to non-employee board members to purchase up to 7,500 sharesbasic and diluted net earnings per share (in millions, except per share amounts):
| Year Ended December 31, | |||||||||||||||||||||||||||||||||
| 2008 | 2007 | 2006 | |||||||||||||||||||||||||||||||
Net Income | Weighted Average Shares Outstanding | Net Income Common Share | Net Income | Weighted Average Shares Outstanding | Net Income Common Share | Net Income | Weighted Average Shares Outstanding | Net Income Common Share | |||||||||||||||||||||||||
Basic EPS | $ | 17.9 | 10.5 | $ | 1.71 | $ | 24.1 | 10.5 | $ | 2.30 | $ | 20.6 | 10.0 | $ | 2.05 | ||||||||||||||||||
| Effect of dilutive common share equivalents: | |||||||||||||||||||||||||||||||||
| Unvested restricted stock units | — | — | — | — | 0.2 | (0.03 | ) | ||||||||||||||||||||||||||
| Stock options | 0.2 | (0.03 | ) | 0.3 | (0.06 | ) | 0.3 | (0.06 | ) | ||||||||||||||||||||||||
| Warrants | 0.2 | (0.04 | ) | 0.4 | (0.09 | ) | 0.5 | (0.09 | ) | ||||||||||||||||||||||||
| Performance Shares | — | — | — | — | — | — | |||||||||||||||||||||||||||
| Diluted EPS | $ | 17.9 | 10.9 | $ | 1.64 | $ | 24.1 | 11.2 | $ | 2.15 | $ | 20.6 | 11.0 | $ | 1.87 | ||||||||||||||||||
Note: Basic and diluted earnings per share are calculated based on unrounded actual amounts.
CORE-MARK HOLDING COMPANY, INC. AND SUBSIDIARIES
NOTES TO CONSOLIDATED FINANCIAL STATEMENTS—(Continued)
of the Company’s common stock in aggregate. On the date of emergence, a total of 30,000Certain options to purchase common stock were outstanding but were not included in the computation of diluted earnings per share because the effect would be anti-dilutive. For 2008 and 2007 there were 249,453 and 121,475 anti-dilutive options, respectively. There were no anti-dilutive options in 2006.
In May 2004, we issued an aggregate of 9,800,000 shares of our common stock and warrants to purchase an aggregate of 990,616 shares of our common stock to the Class 6(B) creditors of Fleming Inc. (our former parent company) pursuant to its plan of reorganization. We refer to the warrants we issued to the Class 6(B) creditors as the Class 6(B) warrants. We received no cash consideration for the issuance of common stock and the Class 6(B) warrants. The Class 6(B) warrants have an exercise price of $20.93 per share and may be exercised at the election of the holder at any time prior to August 23, 2011. The shares of common stock and the Class 6(B) warrants were issued pursuant to an exemption from registration under Section 1145(a) of the Bankruptcy Code. We also issued warrants to purchase an aggregate of 247,654 shares of our common stock to the holders of our Tranche B Notes, which we refer to as Tranche B warrants. The Tranche B warrants have an exercise price of $15.50 per share.
The number of Class 6(B) warrants outstanding was 968,628 at the end of both 2008 and 2007, and 968,684 at the end of 2006. The number of Tranche B warrants outstanding was 126,716 at the end of 2008, 2007 and 2006. The Class 6(B) warrants and the Tranche B warrants have been classified as permanent equity under EITF 00-19, “Accounting for Derivative Financial Information Indexed to, and Potentially Settled in, a Company’s Own Stock.” We used the treasury stock method, as prescribed bySFAS No. 128,“Earnings Per Share,” to determine the shares of common stock due to conversion of outstanding warrants as of December 31, 2008.
| 12. | Stock-Based Compensation Plans |
We account for stock-based compensation underSFAS No. 123(R),Share-Based Payment, an amendment ofSFAS No. 123,Accounting for Stock Based Compensation, using the modified prospective method. Under this method, compensation cost is recognized beginning with the effective date based on (a) the requirements of SFAS No. 123(R) for all share-based payment awards granted after the effective date, and (b) based on the requirements of SFAS No. 123 for awards granted to employees prior to the effective date that remain unvested on the effective date. Accordingly, prior period amounts are not restated. SFAS No. 123(R) requires all share-based payments to be recognized in the income statement based on their fair values.
Total stock-based compensation cost recognized in the consolidated statements of operations for 2008, 2007 and 2006 was $3.9 million, $5.3 million and $4.4 million, respectively. Total unrecognized compensation cost related to non-vested share-based compensation arrangements was $4.8 million at December 31, 2008. This balance is expected to be recognized over a weighted average period of 1.8 years.
Employee stock-based compensation expense recognized in 2008 was calculated based on awards ultimately expected to vest and has been reduced for estimated forfeitures. Our forfeiture experience since inception of our plans has been approximately 2.9% of the total grants. The historical rate of forfeiture is a component of the basis for predicting the future rate of forfeitures, which are also dependent on the remaining service period related to grants and on the limited number of approximately 79 plan participants. We issue new shares to satisfy stock option exercises.
CORE-MARK HOLDING COMPANY, INC. AND SUBSIDIARIES
NOTES TO CONSOLIDATED FINANCIAL STATEMENTS—(Continued)
We maintain five stock-based compensation plans: the 2004 Long-Term Incentive Plan, the 2004 Directors’ Equity Incentive Plan, the 2005 Long-Term Incentive Plan, the 2005 Directors’ Equity Incentive Plan, and the 2007 Long-Term Incentive Plan.
| Number of securities to be issued upon exercise of outstanding options, warrants, and rights | Number of securities remaining available for future issuance under equity compensation plans (excluding securities reflected in column 1) | |||
2004 Long-Term Incentive Plan—Restricted Stock Units and Options | 635,269 | 2,543 | ||
2005 Long-Term Incentive Plan—Restricted Stock Units | 38,472 | 134 | ||
2004 Directors Equity Incentive Plan | 30,000 | — | ||
2005 Directors Equity Incentive Plan | 15,000 | — | ||
2007 Long-Term Incentive Plan(1) | 373,635 | 680,162 |
| (1) | Includes non-qualified stock options, restricted stock units and performance shares. |
2004 Long-Term Incentive Plan
The 2004 Long-Term Incentive Plan (2004 LTIP) provides for issuance of up to 1,314,444 shares of non-qualified stock options and restricted stock units. For option grants, the exercise price equals the fair value of the Company’s common stock on the date of grant. For restricted stock grants, the exercise price is fixed at $0.01. Options and restricted stock units vest over a three-year period; one-third of the options and restricted stock units cliff-vest on the first anniversary of the vesting commencement date and the remaining options and restricted stock units vest in equal monthly and quarterly installments, respectively, over the two-year period following the first anniversary of the vesting commencement date. Stock options expire seven years after the date of grant. Restricted stock units do not have an expiration date. Restricted stock units are available for grant to officers and key employees. Stock-based compensation is being recognized ratably over the three-year vesting period of the stock options or restricted stock units using the straight-line method.
2004 Directors’ Equity Incentive Plan
The 2004 Directors’ Equity Incentive Plan (2004 Directors’ Plan) consists of 30,000 non-qualified stock options that have been granted to non-employee Directors of the Company. This plan has terms and vesting requirements similar to those of the 2004 LTIP, except options vest quarterly underafter the 2004 Directors’ Plan versus monthlyfirst anniversary of the vesting under the 2004 LTIP. Based on the Black-Scholes option pricing model, the weighted-average grant date fair value per option granted was $4.39. The following assumptions were usedcommencement date. No stock options are available for the grants, all of which occurred between August 23, 2004 and December 31, 2004: expected life of four years, a risk-free interest rate of 3.0%, expected volatility of 30%, and an expected dividend yield of zero. Total stock-based compensation cost recognized from stock option awards under the 2004 Directors’ Plan totaled $44 thousand and $16 thousand for the year ended December 31, 2005 and the period from August 23, 2004 through December 31, 2004, respectively.future issuance.
2005 Long TermLong-Term Incentive Plan
In FebruaryThe 2005 the Company adopted the 2005 Long TermLong-Term Incentive Plan (2005 LTIP). Under the 2005 LTIP, the number of shares of common stock issuable is limited to a number of shares having a market value of $5.5 million, based on the average closing price of our common stock over the eleventh through twentieth trading days following the date that the common stock became listed for quotation on the NASDAQ National Market. In February 2005, the Compensation Committee and the Board of Directors approved the grant of restricted stock units having a value of approximately $5.0 million. The Board of Directors determined that the balance of approximately $0.5 million available for grants under the 2005 LTIP should be reserved for possible future issuance. The average closing price was established in December 2005 and was determined to be $32.201. The 2005 LTIP provides for the granting of 171,315 shares of restricted common stock units to officers and key employees. Restricted commonThe majority of restricted stock units issued under the 2005 LTIP generally vests over three years, with a one-year cliff vesting beginning on February 1, 2005, followed by vesting ratably over the remaining 8 quarters. In December, 2005 the Company granted 153,455 shares of restricted stock, with retroactive vesting pursuant to the Plan, with a fair-value of $32.201 per share. Total stock-based compensation cost recognized from restricted stock awards under the 2005 LTIP totaled $1.5 million for the year ended December 31, 2005.
2005 Directors Equity Incentive Plan
The Company adopted the 2005 Directors Equity Incentive Plan (2005 Director’ Plan) to be effective in August 2005. The 2005 Directors Plan permits granting of non-qualified stock options to non-employee directors. The terms of the 2005 Directors Plan are substantially similar to the 2004 Directors Plan other than:
2005 Directors’ Equity Incentive Plan
The Company granted a total2005 Directors’ Equity Incentive Plan (2005 Directors’ Plan) consists of 15,000 non-qualified stock options that have been granted to non-employee directors duringDirectors of the year ended December 31, 2005. Based onCompany. The terms of the Black-Scholes option pricing model,2005 Directors’ Plan are similar to the weighted-average grant date2004 Directors’ Plan. No stock options are available for future issuance.
CORE-MARK HOLDING COMPANY, INC. AND SUBSIDIARIES
NOTES TO CONSOLIDATED FINANCIAL STATEMENTS—(Continued)
2007 Long-Term Incentive Plan
The 2007 Long-Term Incentive Plan (2007 LTIP) provides for the granting of awards of up to 1,202,350 shares of our common stock (including treasury shares) to officers, employees, and non-employee directors (40,000 shares are reserved for issuance to non-employee directors). The 2007 LTIP became effective on July 1, 2007. Awards may be made under the 2007 LTIP through June 30, 2017, which is 10 years from the effective date of the 2007 LTIP. We currently anticipate that substantially all of the shares available for grant under the 2007 LTIP will be granted prior to December 31, 2010 (within three and one-half years from the effective date of the 2007 LTIP).
The available awards under the 2007 LTIP include: stock options, restricted stock units and performance shares. The annual award limits of the 2007 LTIP provide for options which are limited in any one plan year to 100,000 shares to any one participant, and performance shares which are also limited to 100,000 to any one participant in any one plan year. Restricted stock units, or RSUs, are awards that will be subject to certain restrictions and subject to a risk of forfeiture upon certain kinds of employment terminations. A RSU represents a right to receive a share of our common stock at the end of a specified period. Unless a grant agreement provides otherwise, a holder of a RSU has the right to receive accumulated dividends or distributions on the corresponding shares underlying the RSU on the date the RSU vests and thereafter until the underlying shares are issued. Performance shares may include (i) specific dollar-value target awards, (ii) performance units, the value of each unit being determined by the Compensation Committee at the time of issuance, and/or (iii) performance shares, the value of each such share being equal to the fair market value of a share of our common stock.
If any grant of shares under the 2007 LTIP expires or is forfeited by the grantee (whether due to failure to satisfy vesting requirement or otherwise), then such forfeited shares will be withdrawn from the pool of shares available for grant under the 2007 LTIP.
Assumptions Used for Fair Value
We use the Black-Scholes multiple option-pricing model to determine the grant date fair value per option granted was $8.20. for each stock option. Option-pricing models require the input of assumptions that are estimated at the date of grant.
The following table presents the assumptions used in the Black-Scholes option-pricing model to value the stock options granted during the period 2006 through 2008. Restricted stock units and performance shares were used: expected lifevalued at the fair market value of four years, a risk-free interest rateour stock at date of 4.25%,grant.
| Year Ended December 31, | |||||||||
| 2008 | 2007 | 2006 | |||||||
Expected life (years) | 4.0 | 4.0 | 4.0 | ||||||
Risk-free interest rate | 2.55% | 4.50%-5.00% | 4.41%-5.13% | ||||||
Volatility | 35% | 30% | 30% | ||||||
Dividend yield | — | — | — | ||||||
Weighted-average fair value per share of grants: | |||||||||
Stock options | $ | 8.45 | $ | 11.39 | $ | — | |||
Restricted stock units | $ | 25.80 | $ | 35.41 | $ | 34.85 | |||
Performance shares | $ | 25.80 | $ | 36.95 | $ | — | |||
CORE-MARK HOLDING COMPANY, INC. AND SUBSIDIARIES
NOTES TO CONSOLIDATED FINANCIAL STATEMENTS—(Continued)
There is limited historical information available to support the estimate of certain assumptions required to value the stock options and restricted stock units as our shares began trading on the over-the-counter market in April 2005 and on the NASDAQ national market in December 2005. The expected volatility of 30%,our stock is based on a variety of factors including the volatility measures of other companies in relatively similar industries and anthe measures of companies which recently emerged from bankruptcy. The risk free rate for periods within the contractual life of the option is based on the United States Treasury yield curve in effect at the time of grant. The expected dividend yieldterm of zero. Total stock-based compensation cost recognized from these awards totaled $22 thousandoptions granted represents the period of time we estimate that options granted are expected to be outstanding.
The following table summarizes the activity for all stock options, restricted stock units, and performance shares under all of the plans for the year ended December 31, 2005.2008:
| December 31, 2006 | December 31, 2007 | Activity during 2008 | December 31, 2008 | |||||||||||||||||||||||||||||||||||||||||||||||
| Outstanding | Outstanding | Granted | Exercised | Canceled/Reclass | Outstanding | Exercisable | ||||||||||||||||||||||||||||||||||||||||||||
| Plans | Securities | Number | Price | Number | Price | Number | Price | Number | Price | Number | Price | Number | Price | Number | Price | |||||||||||||||||||||||||||||||||||
| 2004 LTIP | RSU | 116,928 | $ | 0.01 | 74,627 | $ | 0.01 | — | $ | — | (32,649 | ) | $ | 0.01 | — | $ | — | 41,978 | $ | 0.01 | 35,724 | $ | 0.01 | |||||||||||||||||||||||||||
| 2004 LTIP | Options | 840,372 | 15.50 | 753,546 | 16.99 | 3,869 | 25.81 | (162,124 | ) | 15.50 | (2,000 | ) | 36.03 | 593,291 | 17.39 | 567,366 | 16.61 | |||||||||||||||||||||||||||||||||
| 2004 Directors’ | Options | 30,000 | 15.50 | 30,000 | 15.50 | — | — | — | — | — | — | 30,000 | 15.50 | 30,000 | 15.50 | |||||||||||||||||||||||||||||||||||
| 2005 LTIP | RSU | 126,467 | 0.01 | 90,976 | 0.01 | 2,372 | 0.01 | (54,825 | ) | 0.01 | (51 | ) | 0.01 | 38,472 | 0.01 | 29,885 | 0.01 | |||||||||||||||||||||||||||||||||
| 2005 Directors’ | Options | 15,000 | 27.03 | 15,000 | 27.03 | — | — | — | — | — | — | 15,000 | 27.03 | 15.000 | 27.03 | |||||||||||||||||||||||||||||||||||
| 2007 LTIP | RSU | — | — | 59,871 | 0.01 | 125,585 | 0.01 | (29,992 | ) | 0.01 | (8,470 | ) | 0.01 | 146,994 | 0.01 | 5,238 | 0.01 | |||||||||||||||||||||||||||||||||
| Options | — | — | 66,838 | 36.96 | 144,016 | 25.81 | — | — | (11,709 | ) | 28.63 | 199,145 | 29.39 | 37,841 | 36.54 | |||||||||||||||||||||||||||||||||||
| Perf. Shares | — | — | 19,979 | 0.01 | 85,235 | 0.01 | (20,938 | ) | 0.01 | (56,776 | ) | 0.01 | 27,500 | 0.01 | — | 0.01 | ||||||||||||||||||||||||||||||||||
Note: Price is weighted average price per share.
The aggregate intrinsic value of stock options exercised in 2008 was $2.1 million, $2.5 million in 2007, and $3.9 million in 2006. The aggregate intrinsic value of restricted stock units exercised in 2008 was $3.1 million, $3.2 million in 2007, and $4.1 million in 2006. The aggregate intrinsic value of performance shares exercised in 2008 was less than $0.1 million, and $0.5 million in 2007.
CORE-MARK HOLDING COMPANY, INC. AND SUBSIDIARIES
NOTES TO CONSOLIDATED FINANCIAL STATEMENTS—(Continued)
The following table summarizes information about stock option activity andtables summarize stock options, outstanding for the 2004 LTIPrestricted stock units and 2004 Directors’ Equity Incentive Planperformance shares that have vested and 2005 LTIP and 2005 Directors’ Equity Incentive Planare expected to vest as of and for the year ended December 31, 2005:2008:
| 2004 LTIP | 2004 LTIP and Directors’ Plan | 2005 LTIP | 2005 Directors Plan | |||||||||||||||||||
Number of Restricted Stock | Weighted Average Price | Number of Option Shares | Weighted Average Exercise Price | Number of Restricted Stock Units | Weighted Average Exercise | Number Option Shares | Weighted Average Exercise | |||||||||||||||
Outstanding at December 31, 2004 | 190,876 | $ | 0.01 | 1,090,422 | $ | 15.50 | — | $ | — | — | $ | — | ||||||||||
Units granted | 7,313 | 0.01 | — | — | 153,455 | 0.01 | 15,000 | 27.03 | ||||||||||||||
Units exercised | — | — | (1,387 | ) | $ | 15.50 | — | — | — | — | ||||||||||||
Units canceled | (1,888 | ) | 0.01 | (9,101 | ) | $ | 15.50 | — | — | — | — | |||||||||||
Outstanding at December 31, 2005 | 196,301 | $ | 0.01 | 1,079,934 | $ | 15.50 | 153,455 | $ | 0.01 | 15,000 | $ | 27.03 | ||||||||||
| December 31, 2008 | ||||||||||||||||||||||
| Outstanding | Weighted Average Remaining Contractual Term (years) | Aggregate Intrinsic Value(1) (in thousands) | ||||||||||||||||||||
| Plans | Securities | Vested | Expected to Vest(2) | Vested | Expected to Vest(2) | Vested | Expected to Vest(2) | |||||||||||||||
| 2004 LTIP | RSU | 35,724 | 6,076 | — | — | $ | 768 | $ | 131 | |||||||||||||
| 2004 LTIP | Options | 567,366 | 25,186 | 2.8 | 5.3 | 3,231 | — | |||||||||||||||
| 2004 Directors’ Plan | Options | 30,000 | — | 2.6 | — | 181 | — | |||||||||||||||
| 2005 LTIP | RSU | 29,885 | 8,342 | — | — | 643 | 179 | |||||||||||||||
| 2005 Directors’ Plan | Options | 15,000 | — | 3.6 | — | — | — | |||||||||||||||
| 2007 LTIP | RSU | 5,238 | 137,716 | — | — | 113 | 2,962 | |||||||||||||||
| Options | 37,841 | 156,707 | 5.5 | 6.0 | — | — | ||||||||||||||||
| Perf. Shares | — | 25,313 | — | — | — | 544 | ||||||||||||||||
| Options/Units Outstanding | Stock/Units Exercisable | ||||||||||||||
Name of Plan | Exercise Prices | Number Option | Weighted- Average Remaining Contractual Life | Weighted- Average Exercise Price | Number Shares | Weighted- Exercise | |||||||||
Restricted Stock Units under | |||||||||||||||
2004 LTIP | $ | 0.01 | 188,988 | 5.6 years | $ | 0.01 | 83,995 | $ | 0.01 | ||||||
2004 LTIP | $ | 0.01 | 7,313 | 6.0 years | $ | 0.01 | 3,250 | $ | 0.01 | ||||||
2005 LTIP | $ | 0.01 | 153,455 | 6.1 years | $ | 0.01 | — | $ | 0.01 | ||||||
Options Granted under | |||||||||||||||
2004 LTIP and Directors’ Plan | $ | 15.50 | 1,079,934 | 5.6 years | $ | 15.50 | 479,971 | $ | 15.50 | ||||||
2005 Directors’ Plan | $ | 27.03 | 15,000 | 6.6 years | $ | 27.03 | — | — | |||||||
| (1) | Aggregate intrinsic value is calculated based upon the difference between the exercise prices of options or restricted stock units and our closing common stock price on December 31, 2008 of $21.52, multiplied by the number of instruments that are vested or expected to vest. Options and restricted stock units having exercise prices greater than the closing stock price noted above are excluded from this calculation. |
| (2) | Options and restricted stock units that are expected to vest are net of estimated future forfeitures. |
14. Employee Benefit PlansThe aggregate fair values of options vested in 2008, 2007 and 2006 were approximately $1.6 million, $6.7 million and $12.2 million, respectively. The aggregate fair value of restricted stock units vested in 2008, 2007 and 2006 was approximately $1.4 million, $2.7 million and $5.3 million, respectively. The aggregate fair value of performance shares vested in 2008 and 2007 was approximately $0.1 million and $0.6 million, respectively.
| 13. | Employee Benefit Plans |
Pension Plans
The Predecessor CompanyWe sponsored a qualified defined-benefit pension plan and a post-retirement benefit plan for employees hired before September 1986. There have been no new entrants to the pension or post retirementnon-pension post-retirement benefit plans after those benefit plans were frozen on September 30, 1989. As part of the Plan, these pension and post-retirement benefit plans remained in place after the Effective Date, and the Successor Company will continue to honor these plans.
Pursuant to the Plan, on the Effective Date, the Company wasplan of reorganization (May 2004) described in Exhibit 2.1 and incorporated by reference (see Part IV, Item 15, Exhibit Index of this Form 10-K), we were assigned the obligationobligations for three former Fleming defined-benefit pension plans, which represented approximately $3.9 million in net pension obligations. This amount was included in the reorganization adjustments asplans. All of August 23, 2004. The Predecessor Company’s frozenthese three pension benefit planplans and post-retirement benefit plan and the three former Fleming pension plans are collectively referred to as the Pension Plans.
Our defined-benefit pension plan is subject to the Employee Retirement Income Security Act of 1974 (ERISA). Under ERISA, the Pension Benefit Guaranty Corporation (PBGC) has the authority to terminate an underfunded pension plan under limited circumstances. In the event our pension plan is terminated for any reason while it is underfunded, we will incur a liability to the PBGC that may be equal to the entire amount of the underfunding. Our post-retirement benefit plan is not subject to ERISA. As a result, the post-retirement benefit plan is not required to be pre-funded, and, accordingly, has no plan assets.
CORE-MARK HOLDING COMPANY, INC. AND SUBSIDIARIES
NOTES TO CONSOLIDATED FINANCIAL STATEMENTS—(Continued)
In December 2003, the FASB issued SFAS No. 132 (Revised 2003),Employer’s Disclosures about Pensions and Other Postretirement Benefits, which enhanced the required disclosures about pension plansPension costs and other postretirement benefit plans, but did not change the measurement or recognition principles for those plans. The Company adopted the provisions of SFAS No. 132R on January 1, 2004, the “measurement date”. The statement requires additional annual disclosures about assets, obligations, cash flows, and net periodicpost-retirement benefit costs charged to operations are estimated on the basis of annual valuations with the assistance of an independent actuary. Adjustments arising from plan amendments, changes in assumptions and experience gains and losses, are amortized over the average future life expectancy of inactive participants for the defined benefit pension plansplan, and other definedexpected average remaining service life of active participants for the post-retirement benefit postretirement plans.plan.
The following tables provide a reconciliation of the changes in the Pension Plans’ benefit obligations and fair value of assets over the two-year period ending December 31, 2005,2008, and a statement of the funded status for the year ended December 31, 2005, for the period from August 23, 2004 to December 31, 2004, the period from January 1, 2004 to August 22, 20042008 and for the year ended December 31, 20032007 (in millions):
| Pension Benefits Successor Company | Other Post-retirement Benefits Successor Company | |||||||||||||||||||||||
December 31, 2005 | December 31, 2004 | August 23, 2004 | December 31, 2005 | December 31, 2004 | August 23, 2004 | |||||||||||||||||||
Change in benefit obligation: | ||||||||||||||||||||||||
Obligation at beginning of period | $ | 38.9 | $ | 37.0 | $ | 17.4 | $ | 3.8 | $ | 3.7 | $ | 3.6 | ||||||||||||
Service cost | — | — | — | — | — | |||||||||||||||||||
Interest cost | 2.1 | 0.8 | 0.7 | 0.4 | 0.1 | 0.2 | ||||||||||||||||||
Participant contributions | — | — | — | — | — | — | ||||||||||||||||||
Actuarial loss | — | 2.0 | 0.7 | 1.5 | 0.1 | — | ||||||||||||||||||
Benefit payments | (2.4 | ) | (0.9 | ) | (0.8 | ) | (0.1 | ) | (0.1 | ) | (0.1 | ) | ||||||||||||
Assignment of Fleming plans | — | — | 19.0 | — | — | — | ||||||||||||||||||
Benefit obligation at end of period | $ | 38.6 | $ | 38.9 | $ | 37.0 | $ | 5.6 | $ | 3.8 | $ | 3.7 | ||||||||||||
Change in Pension Plan Assets: | ||||||||||||||||||||||||
Fair value of pension plan assets at beginning of period | $ | 28.7 | $ | 27.5 | $ | 13.0 | $ | 0.0 | $ | 0.0 | $ | 0.0 | ||||||||||||
Actual return on plan assets | 1.5 | 1.2 | 0.2 | — | — | — | ||||||||||||||||||
Employer contributions | 1.7 | 0.9 | — | 0.1 | 0.1 | 0.1 | ||||||||||||||||||
Participant contributions | — | — | — | — | — | — | ||||||||||||||||||
Benefit payments | (2.4 | ) | (0.9 | ) | (0.8 | ) | (0.1 | ) | (0.1 | ) | (0.1 | ) | ||||||||||||
Assignment of Fleming plans | — | — | 15.1 | — | — | — | ||||||||||||||||||
Fair value of pension plan assets at end of period | $ | 29.5 | $ | 28.7 | $ | 27.5 | $ | 0.0 | $ | 0.0 | $ | 0.0 | ||||||||||||
Funded Status: | ||||||||||||||||||||||||
Funded status | $ | (9.1 | ) | $ | (10.2 | ) | $ | (9.5 | ) | $ | (5.6 | ) | $ | (3.8 | ) | $ | (3.7 | ) | ||||||
Unrecognized gain (loss), net | 2.2 | 1.5 | — | 1.5 | 0.1 | — | ||||||||||||||||||
Net amount recognized | $ | (6.9 | ) | $ | (8.7 | ) | $ | (9.5 | ) | $ | (4.1 | ) | $ | (3.7 | ) | $ | (3.7 | ) | ||||||
| Pension Benefits | Other Post-retirement Benefits | |||||||||||||||
| December 31, 2008 | December 31, 2007 | December 31, 2008 | December 31, 2007 | |||||||||||||
Change in Benefit Obligation: | ||||||||||||||||
Obligation at beginning of period | $ | 35.3 | $ | 36.2 | $ | 6.0 | $ | 5.2 | ||||||||
Interest cost | 2.2 | 2.1 | 0.4 | 0.4 | ||||||||||||
Actuarial loss (gain) | 0.1 | (0.3 | ) | 0.5 | 0.7 | |||||||||||
Benefit payments | (2.7 | ) | (2.7 | ) | (0.3 | ) | (0.3 | ) | ||||||||
Benefit obligation at end of period | $ | 34.9 | $ | 35.3 | $ | 6.6 | $ | 6.0 | ||||||||
Change in Pension Plan Assets: | ||||||||||||||||
Fair value of pension plan assets at beginning of period | $ | 31.3 | $ | 31.9 | $ | — | $ | — | ||||||||
Actual return on plan assets | (6.9 | ) | 0.8 | — | — | |||||||||||
Employer contributions | 0.4 | 1.3 | 0.3 | 0.3 | ||||||||||||
Benefit payments | (2.7 | ) | (2.7 | ) | (0.3 | ) | (0.3 | ) | ||||||||
Fair value of pension plan assets at end of period | $ | 22.1 | $ | 31.3 | $ | — | $ | — | ||||||||
Funded Status: | ||||||||||||||||
Funded status | $ | (12.8 | ) | $ | (4.0 | ) | $ | (6.6 | ) | $ | (6.0 | ) | ||||
CORE-MARK HOLDING COMPANY, INC. AND SUBSIDIARIES
NOTES TO CONSOLIDATED FINANCIAL STATEMENTS—(Continued)
The following table disclosesDuring 2008, the amounts recognizedactual return on investments was below expectations, which was the primary reason for the increase in the Company’s consolidated balance sheets (in millions):underfunded status of the plan from 2007 to 2008. The expected return on pension plan assets for 2008 was a gain of $2.3 million compared with a realized loss of $6.9 million due to the economic recession and financial market turmoil which led to a significant decline in the market value of invested plan assets.
| Pension Benefits | Other Post-retirement Benefits | |||||||||||||||||
December 31, 2005 | December 31, 2004 | August 23, 2004 | December 31, 2005 | December 31, 2004 | August 23, 2004 | |||||||||||||
Accrued benefit cost | $ | 9.1 | $ | 10.2 | $ | 9.5 | $ | 4.1 | $ | 3.7 | $ | 3.7 | ||||||
Less: Accumulated other comprehensive income | 2.2 | 1.5 | — | — | — | — | ||||||||||||
Net amount recognized | $ | 6.9 | $ | 8.7 | $ | 9.5 | $ | 4.1 | $ | 3.7 | $ | 3.7 | ||||||
The following table provides information for Pension Plans with an accumulated benefit obligation in excess of plan assets (in millions):
| Successor Company | |||||||||
December 31, 2005 | December 31, 2004 | August 23, 2004 | |||||||
Projected benefit obligation | $ | 38.6 | $ | 38.9 | $ | 37.0 | |||
Accumulated benefit obligation | 38.6 | 38.9 | 37.0 | ||||||
Net amount recognized | 29.5 | 28.7 | 27.5 | ||||||
The following table provides components of the net periodic pension cost (in millions):
| Successor Company | Predecessor Company | |||||||||||||||
Year ended December 31, 2005 | Period from August 23, through December 31, 2004 | Period from January 1, through August 22, 2004 | Year ended 2003 | |||||||||||||
Interest cost | $ | 2.1 | $ | 0.8 | $ | 0.7 | $ | 1.1 | ||||||||
Expected return on plan assets | (2.2 | ) | (0.7 | ) | (0.6 | ) | (0.9 | ) | ||||||||
Amortization of net actuarial loss | — | — | — | — | ||||||||||||
Net periodic benefit cost | $ | (0.1 | ) | $ | 0.1 | $ | 0.1 | $ | 0.2 | |||||||
The following table provides components of the net periodic other benefit cost (in millions):
| Successor Company | Predecessor Company | ||||||||||||
| Year ended December 31, 2005 | Period from August 23, | Period from January 1, August 22, | Year ended December 31, 2003 | ||||||||||
Service cost | $ | 0.2 | $ | — | $ | — | $ | 0.1 | |||||
Interest cost | 0.3 | 0.1 | 0.2 | 0.2 | |||||||||
Net periodic other benefit cost | $ | 0.5 | $ | 0.1 | $ | 0.2 | $ | 0.3 | |||||
| December 31, 2008 | December 31, 2007 | |||||
Projected benefit obligation | $ | 34.9 | $ | 35.3 | ||
Accumulated benefit obligation | 34.9 | 35.3 | ||||
Fair value of pension plan assets | 22.1 | 31.3 | ||||
CORE-MARK HOLDING COMPANY, INC. AND SUBSIDIARIES
NOTES TO CONSOLIDATED FINANCIAL STATEMENTS—(Continued)
The increase in minimum liability included in other accumulated comprehensive income is as followsfollowing table provides components of the net periodic pension cost (in millions):
Successor Company | Predecessor Company | |||||
Year ended December 31, | Period from August 23, to December 31, | Period from August 22, 2004 | Year ended December 31, 2003 | |||
$0.7 | $1.5 | $— | $0.1 | |||
| 2008 | 2007 | 2006 | ||||||||||
Interest cost | $ | 2.2 | $ | 2.1 | $ | 2.0 | ||||||
Expected return on plan assets | (2.3 | ) | (2.3 | ) | (2.2 | ) | ||||||
Net periodic benefit cost | $ | (0.1 | ) | $ | (0.2 | ) | $ | (0.2 | ) | |||
The following table provides components of the net periodic other benefit cost (in millions):
| 2008 | 2007 | 2006 | |||||||
Interest cost | $ | 0.4 | $ | 0.4 | $ | 0.3 | |||
Amortization of net actuarial loss | 0.1 | 0.2 | 0.1 | ||||||
Net periodic other benefit cost | $ | 0.5 | $ | 0.6 | $ | 0.4 | |||
The prior-service costs, which includes interest, are amortized on a straight-line basis over the average remaining service periodfuture life expectancy of activeinactive participants. Gains and losses in excess of 10% of the greater of the benefit obligation and market-related value of assets are amortized over the average future life expectancy of inactive participants. Our measurement date was on December 31, 2008. We estimated that average future life expectancy is 18.0 years for the pension benefit plan and remaining service periodlife of active participants.participants is 7.6 years for post-retirement benefit plan.
Assumptions Used:
The following tables show weighted-average assumptions used in the measurement of the Company’s benefit obligations are shown in the following table:of:
| Pension Benefits | Other Post-retirement Benefits | |||||||||||||||||
| Successor Company | Successor Company | |||||||||||||||||
December 31, 2005 | December 31, 2004 | August 23, 2004 | December 31, 2005 | December 31, 2004 | August 23, 2004 | |||||||||||||
Discount rate | 5.47 | % | 5.50 | % | 6.00 | % | 5.52 | % | 5.75 | % | 6.00 | % | ||||||
Rate of compensation increase | — | — | — | — | — | — | ||||||||||||
The weighted-average assumptions used in the measurement of net periodic benefit costs are shown in the following table:
Benefit Obligations: | ||||||||||||
| Pension Benefits | Other Post-retirement Benefits | |||||||||||
| December 31, 2008 | December 31, 2007 | December 31, 2008 | December 31, 2007 | |||||||||
Discount rate | 6.26 | % | 6.35 | % | 6.07 | % | 6.43 | % | ||||
| Pension Benefits | Other Post-retirement Benefits | |||||||||||||||||||||||||||||
Net Periodic Benefit Costs: | ||||||||||||||||||||||||||||||
| Successor Company | Successor Company | Pension Benefits | Other Post-retirement Benefits | |||||||||||||||||||||||||||
December 31, 2005 | December 31, 2004 | August 23, 2004 | December 31, 2005 | December 31, 2004 | August 23, 2004 | December 31, 2008 | December 31, 2007 | December 31, 2008 | December 31, 2007 | |||||||||||||||||||||
Discount rate | 5.50 | % | 6.00 | % | 6.25 | % | 5.75 | % | 6.00 | % | 6.25 | % | 6.35 | % | 5.80 | % | 6.43 | % | 5.80 | % | ||||||||||
Expected return on assets | 7.50 | % | 7.50 | % | 7.50 | % | — | — | — | 7.50 | % | 7.50 | % | — | — | |||||||||||||||
Rate of compensation increase | — | — | — | — | — | — | ||||||||||||||||||||||||
Assumed health care trend rates for the post-retirement benefit plans are as follows:
| Successor Company | |||||||||
December 31, 2005 | December 31, 2004 | August 23, 2004 | |||||||
Assumed rate for next year | 9.00 | % | 11.00 | % | 11.00 | % | |||
Ultimate rate | 5.00 | % | 5.00 | % | 5.00 | % | |||
Year that ultimate rate is reached | 2010 | 2010 | 2010 | ||||||
| December 31, 2008 | December 31, 2007 | |||||
Assumed current trend rate for next year | 8.00 | % | 9.00 | % | ||
Ultimate year trend rate | 5.00 | % | 5.00 | % | ||
Year that ultimate trend rate is reached | 2011 | 2011 |
The weighted average discount rates used to determine pension and post-retirement benefit plan obligations and expense are based on a yield curve methodology which matches the expected benefits at each duration to the
CORE-MARK HOLDING COMPANY, INC. AND SUBSIDIARIES
NOTES TO CONSOLIDATED FINANCIAL STATEMENTS—(Continued)
available high quality yields at that duration and calculating an equivalent yield. At December 31, 2008, our discount rates were 6.26% and 6.07% related to our pension and post-retirement plan benefit obligations respectively compared with 6.35% and 6.43%, respectively, at December 31, 2007. The decrease in the discount rate for 2008 was due primarily to lower bond yields.
Assumed health care cost trend rates have a significantan effect on the amounts reported for the post-retirement health care plans. A 1% change in assumed health care cost trend rates would have the following effects (in millions):
| 1% Increase | 1% Decrease | 1% Increase | 1% Decrease | ||||||||||
Effect on total of service and interest cost components of net periodic postretirement health care benefit cost | $ | 0.1 | $ | — | $ | 0.1 | $ | — | |||||
Effect on the health care component of the accumulated postretirement benefit obligation | $ | 1.5 | $ | 0.1 | $ | 1.0 | $ | (0.8 | ) | ||||
The Company usesWe use a building block approach in determining the overall expected long-term return on assets. Under this approach, a weighted average expected rate of return is developed based on historical returns for each major asset class and the proportion of assets of the class held by the Pension Plans. After determiningWe then review the weighted average in this manner, the Company reviews the resultresults and may make adjustments in subsequent years to reflect expectations of future rates of return that may differ from those experienced in the past.
The Company selects the assumed discount rate(s) for each benefit plan as the rate at which the benefits could be effectively settled as of the measurement date. In selecting an appropriate discount rates the Company uses a yield curve methodology, matching the expected benefits at each duration to the available high quality yields at that duration and calculating an equivalent yield, which are the ultimate discount rates used.
Core-Mark’s Pension Plan weighted-average asset allocations by asset category are as follows:
Asset Category | December 31, 2005 | December 31, 2004 | December 31, 2008 | December 31, 2007 | ||||||||
Equity securities | 38 | % | 42 | % | 57 | % | 61 | % | ||||
Debt securities | 30 | % | 52 | % | 26 | % | 26 | % | ||||
Insurance contracts | 12 | % | 0 | % | 13 | % | 10 | % | ||||
Mutual Funds | 15 | % | 0 | % | ||||||||
Money market funds | 1 | % | 2 | % | ||||||||
Other | 4 | % | 4 | % | 4 | % | 3 | % | ||||
| 100 | % | 100 | % | 100 | % | 100 | % | |||||
The Company implemented newOur investment guidelines in 2005. The Company’s new asset allocation ranges are: 0-20% cash, 50-70% equity, and 30-50% fixed income. In addition to asset allocation, the Company’sour investment guidelines set forth the requirement for diversification within asset class, types and classes for investment prohibited and permitted, specific indices to be used for benchmark in investment decisions, and criteria for individual security.
We calculate the fair market value of plan assets. Debt and equity securities are recorded at their fair market value each year-end as determined by quoted closing market prices on national securities exchanges or other markets, as applicable. The Companyinsurance contracts are valued based on discounted cash flows of current yields of similar contracts with comparable duration.
We contributed $1.7$0.4 million $0.9in 2008 and $1.3 million $0.0in 2007 to our defined benefit pension plan, and $0.3 million in both 2007 and 2008 to itsour post-retirement benefit plan. For 2009 we will have a carryover credit balance of approximately $0.9 million in our pension benefit plan that we will have available to use against our 2009 expected contributions of approximately $0.7 million. If we elect to use it, then we will not need to make a cash contribution to the pension plan in 2009. We expect to contribute $0.3 million to our post-retirement benefits plan in 2009. The amount of estimated contributions for the year ended December 31, 2005, forpension plan is expected to increase in 2010 due to expected lower return on plan assets as a result of the period from August 23, 2004 through December 31, 2004, for the period from January 1, 2004 through August 22, 2004, and for the year ended December 31, 2003, respectively.
The Company contributed $0.1 million, $0.1 million, $0.1 million and $0.2 million to its post-retirement benefit plan for the year ended December 31, 2005, for the period from August 23, 2004 through December 31, 2004, for the period from January 1, 2004 through August 22, 2004, and for the year ended December 31, 2003, respectively.recent economic downturn.
CORE-MARK HOLDING COMPANY, INC. AND SUBSIDIARIES
NOTES TO CONSOLIDATED FINANCIAL STATEMENTS—(Continued)
The Company expects to make 2006 contributions of $1.2 million and $0.2 million, respectively, for pension and other post-retirement benefits.
Estimated future benefit payments reflecting future service are as follows (in millions):
Year ended December 31, | Pension | Other Postretirement | ||||
2006 | $ | 2.2 | $ | 0.2 | ||
2007 | 2.2 | 0.2 | ||||
2008 | 2.3 | 0.3 | ||||
2009 | 2.3 | 0.3 | ||||
2010 | 2.3 | 0.3 | ||||
2011 through 2015 | 12.5 | 1.6 | ||||
Year ended December 31, | Pension | Other Post-retirement | ||||
2009 | $ | 2.9 | $ | 0.3 | ||
2010 | 2.6 | 0.3 | ||||
2011 | 2.8 | 0.3 | ||||
2012 | 3.1 | 0.4 | ||||
2013 | 2.8 | 0.4 | ||||
2014 through 2018 | 15.6 | 2.2 | ||||
Amounts recognized in the consolidated statements of stockholders’ equity and comprehensive income (in millions):
| Pension After Tax | Other Post-retirement Benefits After Tax | ||||||
Net loss during 2007 | $ | 0.7 | $ | 0.3 | |||
Net loss during 2008 | $ | 5.6 | $ | 0.2 | |||
Amounts recognized in the consolidated balance sheet (in millions):
Year ended December 31, 2007 | Pension | Other Post-retirement | ||||||
Current liabilities | — | (0.3 | ) | |||||
Non-current liabilities | (4.0 | ) | (5.7 | ) | ||||
Accumulated other comprehensive loss | $ | (4.0 | ) | $ | (6.0 | ) | ||
Year ended December 31, 2008 | Pension | Other Post-retirement | ||||||
Current liabilities | — | (0.3 | ) | |||||
Non-current liabilities | (12.8 | ) | (6.3 | ) | ||||
Accumulated other comprehensive loss | $ | (12.8 | ) | $ | (6.6 | ) | ||
Expected amortizations for the year ending December 31, 2009 (in millions):
| Pension | Other Post-retirement | ||||||
Expected amortization of net loss | $ | 0.4 | $ | 0.2 | |||
Savings Plans
The Company maintainsWe maintain defined contribution plans in the United States, subject to Section 401(k) of the Internal Revenue Code, and in Canada, subject to the Department of National Revenue Taxation Income Tax Act. For the fiscal year ended December 31, 2005,2008, eligible U.S.United States employees could elect to contribute on a tax-deferred basis from 1% to 75%, of their compensation to a maximum of $14,000.$15,500. Eligible U.S.United States employees over 50 years of age could also contribute an additional $4,000$5,000 on a tax-deferred basis. In Canada, employees could elect to contribute from 1% to 18% of their compensationup to a maximum of $16,500$20,000 Canadian dollars. A contributionUnder the 401(k) plan, we match 100% of up to 6% is considered to be a basic contribution and the Company could make a discretionary matching contribution of $0.50 for each dollar of a participant’s basic contribution. As a result of the bankruptcy, the Company’s cash contributions were suspended during the year ended December 31, 2003 through emergence on August 23, 2004. However, beginning in August 23, 2004, the Company resumed accruing a matching contribution and made its first cash payment since emergence in early 2005, which totaled $1.5 million. For the year ended December 31, 2005, the Company made a matching payment of $1.5 million in early 2006.United States employee
CORE-MARK HOLDING COMPANY, INC. AND SUBSIDIARIES
NOTES TO CONSOLIDATED FINANCIAL STATEMENTS—(Continued)
15. Quarterly Financial Data (Unaudited)contributions up to 2% of base salary, and match 25% of employee contributions from 2% to 6% of base salary. For Canadian employees, we match 50% of employee contributions up to 6% of base salary. For the year ended December 31, 2008, we made a matching payment of approximately $2.0 million in January 2009.
| 14. | Repurchase of Common Stock |
On March 12, 2008, our Board of Directors authorized a share repurchase program of up to $30 million designed to repurchase shares of our common stock in the open market or in privately negotiated transactions subject to market conditions. The number of shares to be purchased and the timing of the purchases will be based on market conditions, our cash and liquidity requirements, relevant securities laws and other factors. The share repurchase program may be discontinued or amended at any time. We plan to fund the majority of the share repurchases from available cash. Our Credit Facility was amended on March 12, 2008 to increase our basket for permitted stock repurchases to $30 million to allow us to execute the share repurchase program.
We repurchased 396,716 shares of common stock under the share repurchase program as of December 31, 2008 at a total cost of $11.0 million.
| 15. | Quarterly Financial Data (Unaudited) |
The tables below sets forth the Successor Company’sprovide our unaudited consolidated results of operations for each of the four quarters for the year ended December 31, 2005. For the year ended2008 and December 31, 2004, the tables contains the Successor Company’s quarter ended December 31, 2004 and the period from August 23, 2004 through September 30, 2004 and Predecessor Company’s unaudited consolidated results of operations for each of the quarters ended June 30, 2004, and March 31, 2004 and for the period from July 1, 2004 through August 22, 20042007 (in millions, except per share amounts):
Three Months Ended (unaudited) (in millions, except per share data) | ||||||||||||
| Successor Company | ||||||||||||
| December 31, 2005 | September 30, (Restated) | June 30, (Restated) | March 31, (Restated) | |||||||||
Net sales | $ | 1,209.9 | $ | 1,333.3 | $ | 1,268.1 | $ | 1,079.8 | ||||
Net sales—Cigarettes | 875.4 | 956.2 | 899.8 | 773.8 | ||||||||
Net sales—Food/Non-food | 334.5 | 377.1 | 368.3 | 306.0 | ||||||||
Cigarette inventory holding profits | 0.3 | 0.3 | 2.6 | 2.5 | ||||||||
Gross profit | 64.7 | 70.9 | 72.4 | 63.0 | ||||||||
Warehousing and distribution expenses | 33.2 | 37.1 | 34.2 | 31.2 | ||||||||
Selling and administrative expenses(1) | 11.6 | 25.2 | 25.6 | 27.6 | ||||||||
Income from operations | 19.5 | 8.2 | 12.4 | 3.9 | ||||||||
Interest expense, net | 0.5 | 3.3 | 3.0 | 3.2 | ||||||||
Foreign currency transaction (gains) losses, net | 0.3 | — | 0.3 | 0.3 | ||||||||
Net income | 8.4 | 0.9 | 5.0 | 0.0 | ||||||||
Basic net income per share | $ | 0.85 | $ | .09 | $ | 0.52 | $ | 0.01 | ||||
Diluted net income per share | $ | 0.79 | $ | .08 | $ | 0.48 | $ | 0.01 | ||||
Shares used in computing basic net income per share | 9.8 | 9.8 | 9.8 | 9.8 | ||||||||
Shares used in computing diluted net income per share | 10.6 | 10.5 | 10.4 | 10.2 | ||||||||
Depreciation and amortization | $ | 1.8 | $ | 4.5 | $ | 3.9 | $ | 3.3 | ||||
Excise taxes | $ | 303.6 | $ | 328.7 | $ | 300.9 | $ | 261.8 | ||||
| Three Months Ended (unaudited) (in millions, except per share data) | ||||||||||||||||
| December 31, 2008 | September 30, 2008 | June 30, 2008 | March 31, 2008 | |||||||||||||
Net sales(8) | $ | 1,492.2 | $ | 1,672.7 | $ | 1,534.6 | $ | 1,345.4 | ||||||||
Net sales—Cigarettes | 1,028.5 | 1,144.9 | 1,032.4 | 919.0 | ||||||||||||
Net sales—Food/Non-food | 463.7 | 527.8 | 502.2 | 426.4 | ||||||||||||
Cigarette inventory holding profits(1) | 1.5 | 0.2 | 1.3 | 0.1 | ||||||||||||
Gross profit | 92.9 | (2) | 93.9 | 91.1 | 81.2 | |||||||||||
Warehousing and distribution expenses(7) | 46.4 | 54.3 | 51.0 | (3) | 45.9 | (3) | ||||||||||
Selling, general and administrative expenses | 33.9 | (4) | 30.5 | 30.9 | (4) | 34.1 | (4) | |||||||||
Income from operations | 12.1 | 8.6 | 8.7 | 0.7 | ||||||||||||
Interest expense(5) | 0.6 | 0.7 | 0.4 | 0.5 | ||||||||||||
Interest income | (0.1 | ) | (0.2 | ) | (0.4 | ) | (0.3 | ) | ||||||||
Foreign currency transaction losses, net | 3.7 | 1.5 | 0.1 | 1.0 | ||||||||||||
Net income | 7.4 | 5.3 | 5.7 | (0.5 | ) | |||||||||||
Basic net income per share(6) | $ | 0.71 | $ | 0.51 | $ | 0.54 | $ | (0.05 | ) | |||||||
Diluted net income per share(6) | $ | 0.70 | $ | 0.49 | $ | 0.51 | $ | (0.05 | ) | |||||||
Shares used in computing basic net income per share | 10.4 | 10.4 | 10.5 | 10.6 | ||||||||||||
Shares used in computing diluted net income per share | 10.5 | 10.9 | 11.0 | 10.6 | ||||||||||||
Depreciation and amortization | $ | 4.5 | $ | 4.5 | $ | 4.0 | $ | 4.4 | ||||||||
Stock-based compensation | $ | 1.1 | $ | 0.9 | $ | 0.9 | $ | 1.0 | ||||||||
Excise taxes(8) | $ | 370.6 | $ | 414.9 | $ | 364.0 | $ | 324.9 | ||||||||
| (1) |
| (2) | Includes a $1.4 million State of Texas OTP net tax refund which was recorded as a reduction to cost of goods sold during the fourth quarter of 2008. |
| (3) | Includes start up costs of $0.3 million for first quarter of 2008 and $0.1 million for the |
CORE-MARK HOLDING COMPANY, INC. AND SUBSIDIARIES
NOTES TO CONSOLIDATED FINANCIAL STATEMENTS—(Continued)
Three Months Ended (unaudited) (in millions, except per share data) | |||||||||||||||||||
| Successor Company | Predecessor Company | ||||||||||||||||||
| September 30, 2004 | |||||||||||||||||||
December 31, (Restated) | August 23 to (Restated) | July 1 to August 22, 2004 | June 30, 2004 | March 31, 2004 | |||||||||||||||
Net sales | $ | 1,061.8 | $ | 487.5 | $ | 636.8 | $ | 1,067.7 | $ | 968.6 | |||||||||
Net sales—Cigarettes | 774.4 | 349.9 | 457.7 | 765.7 | 700.5 | ||||||||||||||
Net sales—Food/Non-food | 287.4 | 137.6 | 179.1 | 302.0 | 268.1 | ||||||||||||||
Cigarette inventory holding profits | 1.1 | — | — | 0.1 | 0.1 | ||||||||||||||
Gross profit | 62.5 | 28.4 | 35.6 | 59.4 | 54.8 | ||||||||||||||
Warehousing and distribution expenses | 29.5 | 13.1 | 19.6 | 29.3 | 29.8 | ||||||||||||||
Selling and administrative expenses | 24.4 | 10.5 | 12.0 | 24.2 | 23.1 | ||||||||||||||
Income from operations | 8.2 | 4.8 | 4.1 | 5.8 | 1.9 | ||||||||||||||
Interest expense, net | 3.3 | 1.5 | 0.6 | 1.8 | 2.0 | ||||||||||||||
Foreign currency transaction (gains) losses, net | (1.7 | ) | (0.7 | ) | — | — | — | ||||||||||||
Reorganization items, net | 0.2 | 0.6 | (71.7 | ) | 0.7 | 1.0 | |||||||||||||
Net income (loss) | 3.3 | 2.0 | 49.3 | 2.1 | (0.7 | ) | |||||||||||||
Basic net income (loss) per share | $ | 0.33 | $ | 0.20 | $ | 5.03 | $ | 0.21 | $ | (0.07 | ) | ||||||||
Diluted net income (loss) per share | $ | 0.33 | $ | 0.20 | $ | 5.03 | $ | 0.21 | $ | (0.07 | ) | ||||||||
Shares used in computing basic net income per share | 9.8 | 9.8 | 9.8 | 9.8 | 9.8 | ||||||||||||||
Shares used in computing diluted net income per share | 9.8 | 9.8 | 9.8 | 9.8 | 9.8 | ||||||||||||||
Depreciation and amortization | $ | 3.2 | $ | 1.5 | $ | 1.5 | $ | 2.9 | $ | 2.6 | |||||||||
Excise taxes | $ | 253.4 | $ | 114.4 | $ | 158.7 | $ | 260.6 | $ | 224.2 | |||||||||
| (4) | Includes start up costs of $0.4 million for first quarter of 2008, $0.1 million for the second quarter of 2008, and $0.1 million in the third and fourth quarters combined related to the new Toronto division. |
| (5) | Includes amortization of debt issuance costs, of approximately $0.1 million for each quarter in 2008. |
| (6) | Totals may not agree with full year amounts due to rounding and separate calculations for each quarter. |
| (7) | Warehousing and distribution expenses are not included as a component of the Company’s cost of goods sold which presentation may differ from that of other registrants. |
| (8) | Excise taxes are a component of Net Sales. |
| Three Months Ended (unaudited) (in millions, except per share data) | ||||||||||||||||
| December 31, 2007 | September 30, 2007 | June 30, 2007 | March 31, 2007 | |||||||||||||
Net sales(9) | $ | 1,373.3 | $ | 1,477.5 | $ | 1,434.0 | $ | 1,276.1 | ||||||||
Net sales—Cigarettes | 956.6 | 1,021.1 | 993.6 | 891.8 | ||||||||||||
Net sales—Food/Non-food | 416.7 | 456.4 | 440.4 | 384.3 | ||||||||||||
Cigarette inventory holding profits(1) | 0.6 | 2.3 | 1.1 | 3.3 | ||||||||||||
Gross profit | 75.3 | (2) | 85.2 | 96.6 | (5) | 75.5 | ||||||||||
Warehousing and distribution expenses(8) | 45.5 | (3) | 45.6 | 42.9 | 40.1 | |||||||||||
Selling, general and administrative expenses | 23.7 | (4) | 34.6 | (4) | 29.5 | 31.2 | ||||||||||
Income from operations | 5.6 | 4.6 | 23.7 | (5) | 3.8 | |||||||||||
Interest expense(6) | 0.4 | 0.5 | 0.6 | 0.9 | ||||||||||||
Interest income | (0.7 | ) | (0.2 | ) | (0.3 | ) | (0.2 | ) | ||||||||
Foreign currency transaction (gains) losses, net | — | (0.3 | ) | (0.7 | ) | 0.1 | ||||||||||
Net income | 5.1 | 3.3 | 13.6 | 2.1 | ||||||||||||
Basic net income per share(7) | $ | 0.49 | $ | 0.32 | $ | 1.31 | $ | 0.20 | ||||||||
Diluted net income per share(7) | $ | 0.46 | $ | 0.30 | $ | 1.20 | $ | 0.19 | ||||||||
Shares used in computing basic net income per share | 10.6 | 10.4 | 10.4 | 10.3 | ||||||||||||
Shares used in computing diluted net income per share | 11.2 | 11.3 | 11.3 | 11.1 | ||||||||||||
Depreciation and amortization | $ | 4.1 | $ | 3.4 | $ | 3.9 | $ | 3.5 | ||||||||
Stock-based compensation | $ | 1.2 | $ | 1.7 | $ | 1.2 | $ | 1.2 | ||||||||
Excise taxes(9) | $ | 338.9 | $ | 361.8 | $ | 345.5 | $ | 303.2 | ||||||||
| (1) | Cigarette inventory holding profits relate to increases in manufacturer prices and excise taxes. |
| (2) | Reflects an increase in LIFO expense of $3.9 million resulting from higher annual producer price index estimates primarily for cigarettes, grocery, and confectionery products, and by $0.9 million in operational adjustments in the Calgary division related to excise taxes and rebates of which $0.5 million related to prior quarters in 2007. |
| (3) | Includes start up costs of $0.2 million related to the new Toronto division. |
| (4) | Includes bad debt charges of $5.2 million recorded in the third quarter of 2007 and $0.7 million in the fourth quarter of 2007 related to two customers who filed for bankruptcy in the fourth quarter of 2007. Also included in the fourth quarter of 2007 were start up costs of $0.5 million for the new Toronto division, offset by a $3.1 million reduction in workers’ compensation, general and auto insurance liabilities related to favorable claims experience for prior years. |
| (5) | Includes a $13.3 million State of Washington OTP tax refund which was recorded as a reduction to cost of goods sold during the second quarter of 2007. |
| (6) | Includes amortization of debt issuance costs, of approximately $0.1 million for each quarter in 2007. |
| (7) | Totals may not agree with full year amounts due to rounding and separate calculations for each quarter. |
| (8) | Warehousing and distribution expenses are not included as a component of the Company’s cost of goods sold which presentation may differ from that of other registrants. |
| (9) | Excise taxes are a component of Net Sales. |
CORE-MARK HOLDING COMPANY, INC. AND SUBSIDIARIES
NOTES TO CONSOLIDATED FINANCIAL STATEMENTS—(Continued)
| 16. | Segment Information |
The impact of the restatement adjustmentsWe are reflected in the tables below.
September 30, (Restated) | June 30, (Restated) | March 31, (Restated) | ||||||||||
Net sales | $ | — | $ | — | $ | — | ||||||
Net sales—Cigarettes | — | — | — | |||||||||
Net sales—Food/Non-food | — | — | — | |||||||||
Cigarette inventory holding profits | — | — | — | |||||||||
Gross profit | — | — | (0.5 | ) | ||||||||
Warehousing and distribution expenses | — | — | — | |||||||||
Selling and administrative expenses | — | — | 0.2 | |||||||||
Income from operations | — | — | (0.7 | ) | ||||||||
Interest expense, net | — | — | — | |||||||||
Foreign currency transaction (gains) losses, net | — | 0.3 | 0.3 | |||||||||
Net income (loss) | — | (0.2 | ) | (0.6 | ) | |||||||
Basic net income (loss) per share | $ | — | $ | (0.01 | ) | $ | (0.05 | ) | ||||
Diluted net income (loss) per share | $ | (0.01 | ) | $ | (0.02 | ) | $ | (0.05 | ) | |||
Shares used in computing basic net income per share | — | 9.8 | 9.8 | |||||||||
Shares used in computing diluted net income per share | — | 10.4 | 10.2 | |||||||||
Depreciation and amortization | $ | — | $ | — | $ | — | ||||||
Excise taxes | $ | — | $ | — | $ | — | ||||||
| Successor Company | Predecessor Company | ||||||||||
| September 30, 2004 | |||||||||||
| December 31, 2004 | August 23 to September 30, 2004 | July 1 to August 22, 2004 | |||||||||
Net sales | $ | — | $ | — | $ | — | |||||
Net sales—Cigarettes | — | — | — | ||||||||
Net sales—Food/Non-food | — | — | — | ||||||||
Cigarette inventory holding profits | — | — | — | ||||||||
Gross profit | 0.5 | — | — | ||||||||
Warehousing and distribution expenses | — | — | — | ||||||||
Selling and administrative expenses | (0.2 | ) | — | — | |||||||
Income from operations | 0.7 | — | — | ||||||||
Interest expense, net | — | — | — | ||||||||
Foreign currency transaction (gains) losses, net | (1.7 | ) | (0.7 | ) | — | ||||||
Reorganization items, net | — | — | — | ||||||||
Net income | 1.5 | 0.4 | — | ||||||||
Basic net income per share | $ | 0.15 | $ | 0.04 | $ | — | |||||
Diluted net income per share | $ | 0.15 | $ | 0.04 | $ | — | |||||
Shares used in computing basic net income per share | 9.8 | 9.8 | — | ||||||||
Shares used in computing diluted net income per share | 9.8 | 9.8 | — | ||||||||
Depreciation and amortization | $ | — | $ | — | $ | — | |||||
Excise taxes | $ | — | $ | — | $ | — | |||||
CORE-MARK HOLDING COMPANY, INC. AND SUBSIDIARIES
NOTES TO CONSOLIDATED FINANCIAL STATEMENTS—(Continued)
16. Segment and Geographic Information
Core-Mark is one of the largestleading wholesale distributors to the convenience retail industry in North America providingin terms of annual sales, and provide sales and marketing, distribution and logistics services to customer locations across the United States and Canada. The Company distributesWe distribute consumable goods including cigarettes, tobacco, candy, snacks, fast food, grocerygroceries, fresh products, dairy, non-alcoholic beverages, general merchandise and health and beauty care products to customers in approximately in 3850 states and five5 Canadian provinces. The Company servicesWe service a variety of store formats, including traditional convenience stores, grocery stores, drug stores, liquor stores, gift shops, specialty stores and other stores that carry convenience products.
The Company has identifiedAs of December 31, 2008, we operated 24 distribution centers (excluding two reportabledistribution facilities we operated as third party logistics provider) which support our wholesale distribution business. Out of the 24 distribution centers, 20 are located in the United States and four in Canada. Two of the facilities we operate in the United States are consolidating warehouses which buy products from our suppliers in bulk quantities and then distribute the products to our other distribution centers and the two third-party logistics provider.
These distribution centers (operating divisions) produced almost all of our revenues and have been aggregated as operating segments, in accordance withSFAS 131,Disclosures About Segments of an Enterprise and Related Information, into two geographic reporting segments, United States and Canada, based on the differingdifferent economic characteristics and regulatory environments of each.both countries. Corporate adjustments and eliminations include the net results after intercompany eliminations for our consolidating warehouses, corporate fees for service revenue, reclassifying adjustments, corporate allocations, and elimination of inter-company interest charges. Accounting policies for measuring segment assets and earnings before income taxes are substantially consistent with those described inNote 3—2—Summary of Significant Accounting Policies to the consolidated financial statements. For management reporting purposes, the Company evaluates business segment performance before income taxes and other items that do not reflect the underlying business performance. Inter-segment revenues are not significant and no single customer accounted for 10% or more of the Company’sour total revenues. Information about our business operations based on the Company’s operations by business segment and geographical location is astwo geographic reporting segments follows (in millions):
| Successor Company | Predecessor Company | |||||||||||||||
Year ended December 31, | Period from December 31, (Restated) | Period August 22, | Year ended December 31, 2003 | |||||||||||||
Net sales: | ||||||||||||||||
United States | $ | 3,861.9 | $ | 1,186.9 | $ | 2,079.2 | $ | 3,461.3 | ||||||||
Canada | 1,008.1 | 355.2 | 583.7 | 853.7 | ||||||||||||
Corporate adjustments and eliminations | 21.1 | 7.2 | 10.2 | 9.3 | ||||||||||||
Total | $ | 4,891.1 | $ | 1,549.3 | $ | 2,673.1 | $ | 4,324.3 | ||||||||
Income (loss) from continuing operations before income taxes: | ||||||||||||||||
United States | $ | 16.0 | $ | (0.8 | ) | $ | (5.2 | ) | $ | (11.1 | ) | |||||
Canada | 7.7 | 3.3 | (1.6 | ) | (0.6 | ) | ||||||||||
Corporate adjustments and eliminations | 2.2 | 6.9 | 84.2 | (253.2 | ) | |||||||||||
Total | $ | 25.9 | $ | 9.4 | $ | 77.4 | $ | (264.9 | ) | |||||||
Interest expense: | ||||||||||||||||
United States | $ | 24.4 | $ | 10.0 | $ | 17.5 | $ | 15.8 | ||||||||
Canada | (2.4 | ) | 0.2 | 0.5 | (0.3 | ) | ||||||||||
Corporate adjustments and eliminations | (12.0 | ) | (5.4 | ) | (13.6 | ) | (10.1 | ) | ||||||||
Total | $ | 10.0 | $ | 4.8 | $ | 4.4 | $ | 5.4 | ||||||||
Depreciation and amortization: | ||||||||||||||||
United States | $ | 8.7 | $ | 3.1 | $ | 5.7 | $ | 7.0 | ||||||||
Canada | 0.8 | 0.2 | 0.4 | 0.7 | ||||||||||||
Corporate adjustments and eliminations | 4.0 | 1.4 | 0.9 | 2.2 | ||||||||||||
Total | $ | 13.5 | $ | 4.7 | $ | 7.0 | $ | 9.9 | ||||||||
CORE-MARK HOLDING COMPANY, INC. AND SUBSIDIARIES
NOTES TO CONSOLIDATED FINANCIAL STATEMENTS—(Continued)
| 2008 | 2007 | 2006 | ||||||||||
Net sales: | ||||||||||||
United States | $ | 5,082.3 | $ | 4,771.3 | $ | 4,360.2 | ||||||
Canada | 935.8 | 768.2 | 932.5 | |||||||||
Corporate adjustments and eliminations | 26.8 | 21.4 | 21.7 | |||||||||
Total | $ | 6,044.9 | $ | 5,560.9 | $ | 5,314.4 | ||||||
Income before income taxes: | ||||||||||||
United States | $ | 34.9 | $ | 18.1 | $ | 15.4 | ||||||
Canada | (5.6 | ) | (1.0 | ) | 3.1 | |||||||
Corporate adjustments and eliminations | (6.7 | ) | 20.5 | 15.5 | ||||||||
Total | $ | 22.6 | $ | 37.6 | $ | 34.0 | ||||||
Interest expense: | ||||||||||||
United States | $ | 20.6 | $ | 20.6 | $ | 21.9 | ||||||
Canada | 0.9 | — | — | |||||||||
Corporate adjustments and eliminations | (19.3 | ) | (18.2 | ) | (16.6 | ) | ||||||
Total | $ | 2.2 | $ | 2.4 | $ | 5.3 | ||||||
Interest income: | ||||||||||||
United States | $ | 0.1 | $ | 0.2 | $ | 0.1 | ||||||
Canada | 0.1 | 0.1 | 0.4 | |||||||||
Corporate adjustments and eliminations | 0.8 | 1.1 | 0.6 | |||||||||
Total | $ | 1.0 | $ | 1.4 | $ | 1.1 | ||||||
Depreciation and amortization: | ||||||||||||
United States | $ | 12.4 | $ | 11.2 | $ | 10.5 | ||||||
Canada | 2.0 | 1.0 | 0.9 | |||||||||
Corporate adjustments and eliminations | 3.0 | 2.7 | 1.8 | |||||||||
Total | $ | 17.4 | $ | 14.9 | $ | 13.2 | ||||||
Identifiable assets by geographic area:
| Successor Company | |||||||||
As of December 31, | As of December 31, 2004 (Restated) | As of August 23, 2004 | |||||||
Identifiable assets: | |||||||||
United States | $ | 416.1 | $ | 421.8 | $ | 420.1 | |||
Canada | 94.3 | 82.4 | 97.1 | ||||||
Total | $ | 510.4 | $ | 504.2 | $ | 517.2 | |||
17. Comprehensive Income (Loss)
Comprehensive income (loss) is presented in accordance with SFAS No. 130Comprehensive Income and consists primarily of foreign currency translation adjustments and minimum pension liability adjustments, net of tax.
Accumulated other comprehensive income consisted of the followingreporting segments (in millions):
Minimum Pension Liability | Foreign Translation | Total | ||||||||||
Balance at December 31, 2002 | $ | (1.0 | ) | $ | (0.2 | ) | $ | (1.2 | ) | |||
Minimum pension liability adjustment, net of taxes of $0.1 | (0.1 | ) | — | (0.1 | ) | |||||||
Foreign currency translation adjustment | — | 3.0 | 3.0 | |||||||||
Balance at December 31, 2003 | (1.1 | ) | 2.8 | 1.7 | ||||||||
Minimum pension liability adjustment, net of taxes of $0.7 | (1.1 | ) | — | (1.1 | ) | |||||||
Foreign currency translation adjustment | — | (0.5 | ) | (0.5 | ) | |||||||
Fresh start adjustment | 2.2 | (2.3 | ) | (0.1 | ) | |||||||
Balance at August 23, 2004 | — | — | — | |||||||||
Minimum pension liability adjustment, net of taxes of $0.6 | (0.9 | ) | — | (0.9 | ) | |||||||
Foreign currency translation adjustment, as restated | — | — | — | |||||||||
Balance at December 31, 2004, as restated | (0.9 | ) | — | (0.9 | ) | |||||||
Minimum pension liability adjustment, net of taxes of $0.3 | (0.4 | ) | — | (0.4 | ) | |||||||
Foreign currency translation adjustment, as restated | — | 0.1 | 0.1 | |||||||||
Balance at December 31, 2005 | $ | (1.3 | ) | $ | 0.1 | $ | (1.2 | ) | ||||
| December 31, 2008 | December 31, 2007 | |||||
Identifiable assets: | ||||||
United States | $ | 530.7 | $ | 489.4 | ||
Canada | 81.9 | 87.7 | ||||
Total | $ | 612.6 | $ | 577.1 | ||
The net sales mix for our primary product categories is as follows (in millions):
| 2008 | 2007 | 2006 | |||||||
Cigarettes | $ | 4,124.8 | $ | 3,863.1 | $ | 3,783.8 | |||
Food | 710.1 | 596.7 | 522.4 | ||||||
Candy | 401.3 | 349.8 | 318.3 | ||||||
Other Tobacco Products | 402.7 | 353.4 | 322.6 | ||||||
Health, Beauty & General | 220.1 | 206.2 | 187.7 | ||||||
Non-Alcoholic Beverages | 180.9 | 186.4 | 174.3 | ||||||
Equipment / Other | 5.0 | 5.3 | 5.3 | ||||||
Total Food/Non-Food Products | 1,920.1 | 1,697.8 | 1,530.6 | ||||||
Total Net Sales | $ | 6,044.9 | $ | 5,560.9 | $ | 5,314.4 | |||
| ITEM 9. | CHANGES IN AND DISAGREEMENTS WITH ACCOUNTANTS ON ACCOUNTING AND FINANCIAL DISCLOSURE. |
Although no disclosure is required by Item 304 (b) of Regulation S-K, as disclosed in our Form 8-K filed with the SEC on March 24, 2006 and as amended by our Form 8-K/A filed on April 17, 2006 on March 20, 2006, PricewaterhouseCoopers LLP notified us that it declined to stand for re-election as our independent registered public accounting firm upon completion of the audit and subsequent filing of our financial statements as of and for the year ended December 31, 2005 included in this Annual Report for 2005 on Form 10-K. In the Form 8-K we discuss disagreements that arose in connection with PricewaterhouseCooper LLP’s review of the Company’s unaudited condensed consolidated financial statements as of and for the three and nine month periods ended September 30, 2005 related to (i) the accounting for loss on extinguishment of debt and (ii) the preparation of the cash flow statement with respect to changes in foreign currency exchange rates. These disagreements were resolved to PricewaterhouseCooper LLP’s satisfaction. The Audit Committee of our Board of Directors is currently seeking to engage a new independent registered public accounting firm. SeeItem 1.A. Risk Factors for a discussion of certain risks we face if we are not able to engage a new independent public accounting firm on a timely basis to review our financial statements for the first quarter of 2006.
In connection with the reorganization of Core-Mark International, Inc. and its subsidiaries under the Plan, we retained Burr, Pilger & Mayer LLP as our independent accountants. In November 2004, we dismissed and replaced Burr, Pilger & Mayer LLP as our independent accountants. The reports of Burr, Pilger & Mayer LLP on our financial statements for the year 2003 and for the period from January 1, 2004 through August 22, 2004 contained no adverse opinion or disclaimer of opinion, and were not qualified or modified as to uncertainty, audit scope, or accounting principles. There have been no disagreements with Burr, Pilger & Mayer LLP on any matter of accounting principles or practices, financial statement disclosure or accounting scope or procedure, which disagreements if not resolved to the satisfaction of Burr, Pilger & Mayer LLP would have caused them to make reference thereto in their report on the financial statements for such years. The decision to change accounting firms was approved by the audit committee of our board of directors. In November 2004, we engaged PricewaterhouseCoopers LLP as our new independent accountants. The replacement of Burr, Pilger & Mayer LLP by PricewaterhouseCoopers LLP was approved by our Board of Directors. We have provided Burr, Pilger & Mayer with a copy of the disclosure contained in this section of our annual report.None.
| ITEM 9.A. | CONTROLS AND PROCEDURES |
Evaluation of Disclosure Controls and Procedures
The Company maintainsWe conducted, under the supervision and with the participation of our management, including the chief executive officer and chief financial officer, an evaluation of the effectiveness of the design and operation of our disclosure controls and procedures as(as defined in Rules 13a-15(e) and 15d-15(e) under the Securities Exchange Act of 1934, as amended, referenced herein asamended). Based on our evaluation, the Exchange Act. These disclosure controls and procedures are designed to ensure that information required to be disclosed by the Company in the reports that it files or submits under the Exchange Act is recorded, processed, summarized, and reported within the time periods specified in the SEC’s rules and forms, and that such information is accumulated and communicated to Company’s management, including its chief executive officer and chief financial officer as appropriate, to allow timely decisions regarding required disclosure.
The Company carried out, under the supervision and with the participation of the Company’s management, including the Company’s Chief Executive Officer and the Company’s Chief Financial Officer, an evaluation of the effectiveness of the design and operation of the Company’s disclosure controls and procedures performed pursuant to Rule 13a-15 under the Exchange Act. Based on their evaluation, the Company’s Chief Executive Officer and its Chief Financial Officer concluded that, as of December 31, 2005, the Company’s2008, our disclosure controls and procedures were not effective because of the material weaknesses discussed below. Notwithstanding the existence of the material weaknesses described below, management has concluded that the consolidated financial statements in this Form 10-K fairly present, in all material respects, the Company’s financial position, results of operations and cash flows for the periods and dates presented.
Material Weaknesses inManagement’s Report on Internal Control Overover Financial Reporting
A material weaknessOur management is aresponsible for establishing and maintaining adequate internal control deficiency, or a combination of control deficiencies, that resultsover financial reporting as defined in more than a remote likelihood that a material misstatementRule 13a-15(f) of the annual or interim financial statements will not be prevented or detected. The material weaknesses inSecurities Exchange Act of 1934. We assessed the effectiveness of our internal control over financial reporting as of December 31, 2005 are as follows:
|
|
Additionally, these material weaknesses could result in a misstatement of significant accounts and disclosures, that would result in a material misstatement to the Company’s interim or annual consolidated financial statements that would not be prevented or detected.
The material weaknesses described in paragraphs 2,3,4,5 and 7 above were initially identified in connection with preparing the Company’s unaudited condensed consolidated financial statements as of and for the three and nine month periods ended September 30, 2005. The material weaknesses described in paragraphs 1,6,8,9,10, 11 above were thereafter identified in connection with preparing the Company’s audited consolidated financial statementsamounts on a FIFO basis as of and for the year ended December 31, 2005. Management believes the newly identified material weaknesses existed in periods prior to the fourth quarter 2005. Therefore, management assessed the effect2008.
Based on this assessment, we concluded that our internal control over financial reporting was effective as of such material weaknesses on financial statements for prior periods and, as a result, identified additional adjustments in the restatement discussed elsewhere in this Form 10-K.
Remediation of Material Weaknesses
To address the material weaknesses discussed above, the Audit Committee has directed management, with the assistance of an outside consultant, to formulate an enhancementOur assessment of the Company’s remediation plan initially developed to address deficiencies identified at the timeeffectiveness of filingour internal control over financial reporting as of the Company’s Form 10-Q for the third quarter of 2005.December 31, 2008 has been audited by Deloitte & Touche LLP, our independent registered public accounting firm, as stated in their report which appears herein.
Changes in Internal Control Overover Financial Reporting
There have beenwere no changes in the Company’sour internal control over financial reporting that occurred during the most recently completed fiscalfourth quarter of the year ended December 31, 2008 that have materially affected, or are reasonably likely to materially affect, the internal control over financial reporting.
REPORT OF INDEPENDENT REGISTERED PUBLIC ACCOUNTING FIRM ON INTERNAL CONTROL OVER FINANCIAL REPORTING
To the Board of Directors and Stockholders of
Core-Mark Holding Company, Inc.:
We have audited the internal control over financial reporting of Core-Mark Holding Company, Inc. and subsidiaries (the “Company”) as of December 31, 2008, based on criteria established inInternal Control—Integrated Framework issued by the Committee of Sponsoring Organizations of the Treadway Commission. As described in “Management’s Report on Internal Control over Financial Reporting,” management excluded from its assessment the internal control over financial reporting at the New England division, which was acquired on June 23, 2008 and whose financial statements constituted approximately 6% and 5% of net and total assets, respectively, 3% of revenues and less than 5% of income before income taxes of the consolidated financial statements amounts on a FIFO basis as of and for the year ended December 31, 2008. Accordingly, our audit did not include the internal control over financial reporting at the New England division. The Company’s management is responsible for maintaining effective internal control over financial reporting and for its assessment of the effectiveness of internal control over financial reporting, including the accompanying “Management’s Report on Internal Control over Financial Reporting”. Our responsibility is to express an opinion on the Company’s internal control over financial reporting.reporting based on our audit.
We conducted our audit in accordance with the standards of the Public Company Accounting Oversight Board (United States). Those standards require that we plan and perform the audit to obtain reasonable assurance about whether effective internal control over financial reporting was maintained in all material respects. Our audit included obtaining an understanding of internal control over financial reporting, assessing the risk that a material weakness exists, testing and evaluating the design and operating effectiveness of internal control based on the assessed risk, and performing such other procedures as we considered necessary in the circumstances. We believe that our audit provides a reasonable basis for our opinion.
A company’s internal control over financial reporting is a process designed by, or under the supervision of, the company’s principal executive and principal financial officers, or persons performing similar functions, and effected by the company’s board of directors, management, and other personnel to provide reasonable assurance regarding the reliability of financial reporting and the preparation of financial statements for external purposes in accordance with generally accepted accounting principles. A company’s internal control over financial reporting includes those policies and procedures that (1) pertain to the maintenance of records that, in reasonable detail, accurately and fairly reflect the transactions and dispositions of the assets of the company; (2) provide reasonable assurance that transactions are recorded as necessary to permit preparation of financial statements in accordance with generally accepted accounting principles, and that receipts and expenditures of the company are being made only in accordance with authorizations of management and directors of the company; and (3) provide reasonable assurance regarding prevention or timely detection of unauthorized acquisition, use, or disposition of the company’s assets that could have a material effect on the financial statements.
Because of the inherent limitations of internal control over financial reporting, including the possibility of collusion or improper management override of controls, material misstatements due to error or fraud may not be prevented or detected on a timely basis. Also, projections of any evaluation of the effectiveness of the internal control over financial reporting to future periods are subject to the risk that the controls may become inadequate because of changes in conditions, or that the degree of compliance with the policies or procedures may deteriorate.
In our opinion, the Company maintained, in all material respects, effective internal control over financial reporting as of December 31, 2008, based on the criteria established inInternal Control—Integrated Frameworkissued by the Committee of Sponsoring Organizations of the Treadway Commission.
We have also audited, in accordance with the standards of the Public Company Accounting Oversight Board (United States), the consolidated financial statements and financial statement schedule as of and for the year ended December 31, 2008 of the Company and our report dated March 13, 2009 expressed an unqualified opinion on those consolidated financial statements and financial statement schedule and included an explanatory paragraph relating to the adoption of two new accounting standards.
| /s/ Deloitte & Touche LLP |
San Francisco, California March 13, 2009 |
| ITEM 9.B. | OTHER INFORMATION |
None.
| ITEM 10. | DIRECTORS AND OFFICERS OF THE REGISTRANT |
The information required by this item is included in our Proxy Statement for the 20062009 Annual Meeting of Stockholders under the following captions, and is incorporated herein by reference thereto: “Election“Nominees for Director,” “Board of Directors,” “Executive“Our Executive Officers,” “Sectionand “Ownership of Core-Mark Common Stock—Section 16(a) Beneficial Ownership Reporting Compliance,” “Report of the Audit Committee” and “Corporate Governance.Compliance.”
| ITEM 11. | EXECUTIVE COMPENSATION |
The information required by this item is included in our Proxy Statement for the 20062009 Annual Meeting of Stockholders under the following captions, and is incorporated herein by reference thereto: “Director Compensation”“Board of Directors—Director Compensation,” “Board of Directors—Compensation Committee Interlocks and Insider Participation,” “Compensation Discussion and Analysis,” “Compensation Committee Report,” and “Compensation of Named Executives.”
| ITEM 12. | SECURITY OWNERSHIP OF CERTAIN BENEFICIAL OWNERS AND MANAGEMENT AND RELATED STOCKHOLDER MATTERS |
The information required by this item is included (i) in our Proxy Statement for the 20062009 Annual Meeting of Stockholders under the caption “Ownership of Core-Mark Common Stock” and is incorporated herein by reference thereto, and (ii) in Item 5 of this Annual Report on Form 10-K and is incorporated herein by reference thereto.
| ITEM 13. | CERTAIN RELATIONSHIPS AND RELATED TRANSACTIONS |
The information required by this item is included in our Proxy Statement for the 20062009 Annual Meeting of Stockholders under the following caption, and is incorporated by reference herein by reference thereto: “Certain Relationships.“Board of Directors—Certain Relationships and Related Transactions,” “Board of Directors—Committees of the Board of Directors” and “Board of Directors—Corporate Governance.”
| ITEM 14. | PRINCIPAL ACCOUNTANT FEES AND SERVICES |
The information required by this item is incorporated by reference from Core-Mark’s Definitive2009 Proxy Statement for its 2006our 2009 Annual Meeting of Stockholders under the caption “Principal Accountant Fees and Services.“Independent Public Accountants.”
| ITEM 15. | EXHIBITS AND FINANCIAL STATEMENT SCHEDULES |
EXHIBIT INDEX
The following exhibits are filed as part of this Annual Report on Form 10-K:
EXHIBIT INDEX
Exhibit | Description | |
| 2.1 | Third Amended and Revised Joint Plan of Reorganization of Fleming Companies, Inc. and its Subsidiaries Under Chapter 11 of the Bankruptcy Code, dated May 25, 2004 (incorporated by reference to Exhibit 2.1 of the | |
| 3.1 | Certificate of Incorporation of Core-Mark Holding Company, Inc. (incorporated by reference to Exhibit 3.1 of the | |
| 3.2 | Second Amended and Restated Bylaws of Core-Mark Holding Company, Inc. (incorporated by reference to Exhibit 3.2 of the | |
| 4.1 | Form of Class 6(B) Warrant (incorporated by reference to Exhibit 4.1 of the | |
| 10.1 | 2004 Long-Term Incentive Plan (incorporated by reference to Exhibit 10.1 of the | |
| 10.2 | 2004 Directors Equity Incentive Plan (incorporated by reference to Exhibit 10.2 of the | |
| 10.3 | 2005 Long-Term Incentive Plan (incorporated by reference to Exhibit 10.3 of the | |
| 10.4 | 2005 Directors Equity Incentive Plan (incorporated by reference to Exhibit 10.4 of the | |
| 10.5 | 2007 Long-Term Incentive Plan (incorporated by reference to Annex A of the Company’s Proxy Statement on Schedule 14A filed on April 23, 2007). | |
| 10.6 | Statement of Policy Regarding 2007 Long-Term Incentive Plan (incorporated by reference to Exhibit 99.1 of the Company’s Current Report on Form 8-K filed on May 9, 2007). | |
| 10.7 | Form of Management Option Award Agreement for Awards under the Core-Mark Holding Company, Inc. 2004 Long-Term Incentive Plan. | |
| 10.8 | Form of Management Restricted Stock Unit Award Agreement for Awards under the Core-Mark Holding Company, Inc. 2004 Long-Term Incentive Plan and 2005 Long-Term Incentive Plan. | |
| 10.9 | Form of Management Option Award Agreement for Awards under the Core-Mark Holding Company, Inc. 2007 Long-Term Incentive Plan (incorporated by reference to Exhibit 10.3 of the Company’s Current Report on Form 8-K filed on July 6, 2007). | |
| 10.10 | Form of Management Restricted Stock Unit Award Agreement for July 2007 Awards under the Core-Mark Holding Company, Inc. 2007 Long-Term Incentive Plan (incorporated by reference to Exhibit 10.2 of the Company’s Current Report on Form 8-K filed on July 6, 2007). | |
| 10.11 | Form of Management Performance Share Award Agreement for July 2007 Awards under the Core-Mark Holding Company, Inc. 2007 Long-Term Incentive Plan (incorporated by reference to Exhibit 10.4 of the Company’s Current Report on Form 8-K filed on July 6, 2007). | |
Exhibit | Description | |
| 10.12 | Form of Management Restricted Stock Unit Award Agreement for January 2008 Awards under the Core-Mark Holding Company, Inc. 2007 Long-Term Incentive Plan. | |
| 10.13 | Form of Management Performance Share Award Agreement for January 2008 Awards under the Core-Mark Holding Company, Inc. 2007 Long-Term Incentive Plan (incorporated by reference to Exhibit 10.4 of the Company’s Current Report on Form 8-K filed on February 14, 2008). | |
| 10.14 | Form of First Amendment to Management Performance Share Award Agreement for January 2008 Awards under the Core-Mark Holding Company, Inc. 2007 Long-Term Incentive Plan. | |
| 10.15 | Form of Indemnification Agreement for Officers and Directors (incorporated by reference to Exhibit 10.5 of the | |
| ||
| Registration Rights Agreement, dated August 20, 2004, among Core-Mark Holding Company, Inc. and the parties listed on Schedule I attached thereto | ||
| Credit Agreement, dated October 12, 2005, among Core-Mark Holding Company, Inc., Core-Mark International, Inc., Core-Mark Holdings I, Inc., Core-Mark Holdings II, Inc., Core-Mark Holdings III, Inc., Core-Mark | ||
| First Amendment to Credit Agreement, dated December 4, 2007, among Core-Mark Holding Company, Inc., Core-Mark International, Inc., Core-Mark Holdings I, Inc., Core-Mark Holdings II, Inc., Core-Mark Holdings III, Inc., Core-Mark Midcontinent, Inc., Core-Mark Interrelated Companies, Inc., Head Distributing Company and Minter-Weisman Co., as Borrowers, the Lenders Signatory Thereto as Lenders, and JPMorgan Chase Bank, N.A., as Administrative Agent. | ||
| 10.20 | Second Amendment to Credit Agreement, dated March 12, 2008, among Core-Mark Holding Company, Inc., Core-Mark International, Inc., Core-Mark Holdings I, Inc., Core-Mark Holdings II, Inc., Core-Mark Holdings III, Inc., Core-Mark Midcontinent, Inc., Core-Mark Interrelated Companies, Inc., Head Distributing Company and Minter-Weisman Co., as Borrowers, the Lenders Signatory Thereto as Lenders, and JPMorgan Chase Bank, N.A., as Administrative Agent (incorporated by reference to Exhibit 10.1 of the Company's Current Report on Form 8-K filed on March 18, 2008). | |
| 10.21 | Pledge and Security Agreement, dated October 12, 2005, among Core-Mark Holding Company, Inc., Core-Mark Holdings I, Inc., Core-Mark Holdings II, Inc., Core-Mark Holdings III, Inc., Core-Mark International, Inc., Core-Mark Midcontinent, Inc., Core-Mark Interrelated Companies, Inc., Head Distributing Company, Inc. and Minter-Weisman Co., Inc., as Grantors, and JPMorgan Chase Bank, N.A., as Administrative Agent (incorporated by reference to Exhibit 10.14 of the | |
| ||
| Waiver | ||
| 11.1 | Statement of Computation of Earnings Per Share (required information contained within this Annual Report on Form 10-K). | |
Exhibit | Description | |
| 14.1 | Core-Mark Code of | |
| 21.1 | List of Subsidiaries of Core-Mark Holding Company, Inc. (incorporated by reference to Exhibit 21.1 of the Company’s Annual Report on Form 10-K filed on April 14, 2006). | |
| 23.1 | Consent of | |
| 31.1 | Certification of Chief Executive Officer Pursuant to Section 302 of the Sarbanes-Oxley Act of 2002. | |
| 31.2 | Certification of Chief Financial Officer Pursuant to Section 302 of the Sarbanes-Oxley Act of 2002. | |
| 32.1 | Certification of Chief Executive Officer Pursuant to 18 U.S.C. Section 1350. | |
| 32.2 | Certification of Chief Financial Officer Pursuant to 18 U.S.C. Section 1350. | |
SIGNATURES
Pursuant to the requirements of Section 13 or 15(d) of the Securities Exchange Act of 1934, the registrant has duly caused this report to be signed on its behalf by the undersigned, thereunto duly authorized.
| CORE-MARK | ||||||||||
Date: | By: | J. MICHAEL WALSH | ||||||||
J. Michael Walsh President, Chief Executive Officer and Director | ||||||||||
Pursuant to the requirements of the Securities Exchange Act of 1934, this report has been signed below by the following persons on behalf of the registrant and in the capacities and on the dates indicated.
SIGNATURE | TITLE | DATE | ||
/ J. Michael Walsh | President, Chief Executive Officer and Director (Principal Executive Officer) |
| ||
| 2009 | ||||
/
| Chief Financial Officer (Principal Financial Officer) |
| ||
| 2009 | ||||
/
| Vice President, |
| ||
| 2009 | ||||
/ Randolph I. Thornton | Chairman of the Board of Directors |
| ||
| 2009 | ||||
/ Stuart W. Booth | Director |
| ||
| 2009 | ||||
/S/ ROBERT A. ALLEN Robert A. Allen | Director | |||
| March 13, 2009 | ||||
/ Gary F. Colter | Director |
| ||
| 2009 | ||||
/ Harvey | Director |
| ||
| 2009 | ||||
/ L. William Krause | Director |
| ||
| 2009 | ||||
CORE-MARK HOLDING COMPANY, INC. AND SUBSIDIARIES
SCHEDULE II—VALUATION AND QUALIFYING ACCOUNTS
(in thousands)
| Balance at Beginning of Period | Charged (Credited) to Costs and Expenses | Deductions | Charged to Other Accounts | Balance at End of Period | Balance at Beginning of Period | Charged (Credited) to Costs and Expenses | Deductions | Charged to Other Accounts | Balance at End of Period | ||||||||||||||||||||||||||
Year ended December 31, 2003 | |||||||||||||||||||||||||||||||||||
Allowances: | |||||||||||||||||||||||||||||||||||
Year ended December 31, 2006 | |||||||||||||||||||||||||||||||||||
Allowances for: | |||||||||||||||||||||||||||||||||||
Trade receivables | $ | 4,806 | $ | 3,354 | $ | (2,607 | ) | $ | — | $ | 5,553 | $ | 6,521 | $ | 415 | $ | (2,969 | ) | $ | 17 | $ | 3,984 | |||||||||||||
Vendor allowances | 515 | 1,384 | (229 | ) | — | 1,670 | 2,315 | (1,595 | ) | 329 | — | 1,049 | |||||||||||||||||||||||
Inventory reserves | 1,892 | 846 | (539 | ) | 79 | 2,278 | 1,215 | 5,052 | (5,085 | ) | — | 1,182 | |||||||||||||||||||||||
Valuation allowance on deferred tax assets | 4,148 | — | — | — | 4,148 | 1,856 | 404 | — | — | 2,260 | |||||||||||||||||||||||||
| $ | 11,361 | $ | 5,045 | $ | (2,836 | ) | $ | 79 | $ | 13,649 | $ | 11,907 | $ | 4,276 | $ | (7,725 | ) | $ | 17 | $ | 8,475 | ||||||||||||||
| �� | |||||||||||||||||||||||||||||||||||
Period from January 1, 2004 through | |||||||||||||||||||||||||||||||||||
Allowances: | |||||||||||||||||||||||||||||||||||
Year ended December 31, 2007 | |||||||||||||||||||||||||||||||||||
Allowances for: | |||||||||||||||||||||||||||||||||||
Trade receivables | $ | 5,553 | $ | 2,775 | $ | (1,356 | ) | $ | — | $ | 6,972 | $ | 3,984 | $ | 6,885 | $ | (1,936 | ) | $ | 359 | $ | 9,292 | |||||||||||||
Vendor allowances | 1,670 | (87 | ) | (661 | ) | 2,804 | 3,726 | 1,049 | (587 | ) | (230 | ) | __ | 232 | |||||||||||||||||||||
Inventory reserves | 2,278 | 1,820 | (2,985 | ) | 21 | 1,134 | 1,182 | 7,143 | (7,568 | ) | __ | 757 | |||||||||||||||||||||||
Valuation allowance on deferred tax assets | 4,148 | — | (4,148 | ) | — | — | 2,260 | — | — | (595 | ) | 1,665 | |||||||||||||||||||||||
| $ | 13,649 | $ | 4,179 | $ | (8,822 | ) | $ | 2,826 | $ | 11,832 | $ | 8,475 | $ | 13,441 | $ | (9,734 | ) | $ | (236 | ) | $ | 11,946 | |||||||||||||
Period from August 23, 2004 through | |||||||||||||||||||||||||||||||||||
Allowances: | |||||||||||||||||||||||||||||||||||
Trade receivables, as restated | $ | 6,972 | $ | 2,199 | $ | (1,682 | ) | $ | — | $ | 7,489 | ||||||||||||||||||||||||
Vendor allowances, as restated | 3,726 | 1,546 | (784 | ) | — | 4,488 | |||||||||||||||||||||||||||||
Year ended December 31, 2008 | |||||||||||||||||||||||||||||||||||
Allowances for: | |||||||||||||||||||||||||||||||||||
Trade receivables | $ | 9,292 | $ | 1,641 | $ | (2,313 | ) | $ | 197 | $ | 8,817 | ||||||||||||||||||||||||
Vendor allowances | 232 | (79 | ) | (27 | ) | — | 126 | ||||||||||||||||||||||||||||
Inventory reserves | 1,134 | 150 | (144 | ) | 51 | 1,191 | 757 | 9,731 | (9,859 | ) | — | 629 | |||||||||||||||||||||||
Valuation allowance on deferred tax assets | — | 752 | — | — | 752 | 1,665 | — | — | (1,589 | ) | 76 | ||||||||||||||||||||||||
| $ | 11,832 | $ | 4,521 | $ | (2,484 | ) | $ | 51 | $ | 13,920 | $ | 11,946 | $ | 11,293 | $ | (12,199 | ) | $ | (1,392 | ) | $ | 9,648 | |||||||||||||
Year ended December 31, 2005 | |||||||||||||||||||||||||||||||||||
Allowances: | |||||||||||||||||||||||||||||||||||
Trade receivables, as restated | $ | 7,489 | $ | 873 | $ | (1,879 | ) | $ | 38 | $ | 6,521 | ||||||||||||||||||||||||
Vendor allowances, as restated | 4,488 | (1,206 | ) | (967 | ) | — | 2,315 | ||||||||||||||||||||||||||||
Inventory reserves | 1,191 | 721 | (791 | ) | 94 | 1,215 | |||||||||||||||||||||||||||||
Valuation allowance on deferred tax assets | 752 | 1,104 | — | — | 1,856 | ||||||||||||||||||||||||||||||
| $ | 13,920 | $ | 701 | $ | (2,846 | ) | $ | 132 | $ | 11,907 | |||||||||||||||||||||||||