UNITED STATES SECURITIES AND
SECURITIES AND EXCHANGE COMMISSION
WASHINGTON, D.C. 20549
FORM 10-K
| x | ANNUAL REPORT PURSUANT TO SECTION 13 OR 15(d) OF THE SECURITIES EXCHANGE ACT OF 1934 |
For the fiscal year endedApril 30, 20062007 or
| ¨ | TRANSITION REPORT PURSUANT TO SECTION 13 OR 15(d) OF THE SECURITIES EXCHANGE ACT OF 1934 |
For the transition period from to
Commission file number0-5286
KEWAUNEE SCIENTIFIC CORPORATION
(Exact name of registrant as specified in its charter)
| Delaware | 38-0715562 | |
(State or other jurisdiction of incorporation or organization) | (IRS Employer Identification No.) |
2700 West Front Street Statesville, North Carolina | 28677-2927 | |
| (Address of principal executive offices) | (Zip Code) |
Registrant’s telephone number, including area code:(704) 873-7202
Securities registered pursuant to Section 12(b) of the Act:None
Securities registered pursuant to Section 12(g) of the Act:
Common Stock $2.50 par value
(Title of Class)
Indicate by check mark if the registrant is a well-known seasoned issuer, as defined in Rule 405 of the Securities Act. Yes ¨ No x
Indicate by check mark if the registrant is not required to file reports pursuant to Section 13 or Section 15(d) of the Act. Yes ¨ No x
Indicate by check mark whether the registrant (1) has filed all reports required to be filed by Section 13 or 15(d) of the Securities Exchange Act of 1934 during the preceding 12 months (or for such shorter period that the registrant was required to file such reports), and (2) has been subject to such filing requirements for the past 90 days. Yes x No ¨
Indicate by check mark if disclosure of delinquent filers pursuant to Item 405 of Regulation S-K is not contained herein, and will not be contained, to the best of registrant’s knowledge, in definitive proxy or information statements incorporated by reference in Part III of this Form 10-K or any amendment to this Form 10-K. Yes x
Indicate by check mark whether the registrant is a large accelerated filer, an accelerated filer, or a non-accelerated filer. See definition of “accelerated filer and large accelerated filer” in Rule 12b-2 of the Exchange Act.
Large accelerated filer ¨ Accelerated filer ¨ Non-accelerated filer x
Indicate by check mark whether the registrant is a shell company (as defined by Rule 12b-2 of the Exchange Act). Yes ¨ No x
The aggregate market value of shares of voting stock held by non-affiliates of the registrant was approximately $15,614,843,$13,820,231, based on the last reported sale price of the registrant’s Common Stock on October 31, 2005,2006, the last business day of the registrant’s most recently completed second fiscal quarter. Only shares beneficially owned by directors of the registrant (excluding shares subject to options) and each person owning more than 10% of the outstanding Common Stock of the registrant were excluded in that such persons may be deemed to be affiliates. This determination of affiliate status is not necessarily a conclusive determination for other purposes.
As of July 5, 2006,2007, the registrant had outstanding 2,492,2702,507,770 shares of Common Stock.
DOCUMENTS INCORPORATED BY REFERENCE: Those portions of the Company’s proxy statement for use in connection with Kewaunee Scientific Corporation’s annual meeting of stockholders to be held on August 23, 2006,22, 2007, indicated in this report are incorporated by reference into Parts I, II andPart III hereof.
| Table of Contents | Page or Reference | ||||
Item 1. | Business | 3 | ||||
Item 1A. | Risk Factors | 5 | ||||
Item 1B. | Unresolved Staff Comments | |||||
Item 2. | Properties | 7 | ||||
Item 3. | Legal Proceedings | 7 | ||||
Item 4. | Submission of Matters to a Vote of Security Holders | 7 | ||||
| ||||||
Item 5. | ||||||
Item 6. | Selected Financial Data | 9 | ||||
Item 7. | Management’s Discussion and Analysis of Financial Condition and Results of Operations | 10 | ||||
Item 7A. | Quantitative and Qualitative Disclosures About Market Risk | 16 | ||||
Item 8. | Financial Statements and Supplementary Data | 16 | ||||
Item 9. | Changes in and Disagreements with Accountants on Accounting and Financial Disclosure | |||||
Item 9A. | Controls and Procedures | |||||
Item 9B. | Other Information | |||||
| ||||||
Item 10. | ||||||
Item 11. | ||||||
Item 12. | Security Ownership of Certain Beneficial Owners and Management and Related Stockholder Matters | |||||
Item 13. | ||||||
Item 14. | ||||||
| ||||||
Item 15. | Exhibits, Financial Statement Schedules | |||||
2
General
Our principal business is the design, manufacture and installation of laboratory and technical furniture products. Laboratory furniture products include both steel and wood cabinetry, fume hoods, flexible systems, and worksurfaces. Technical furniture products include workstations, workbenches, computer enclosures, and network storage systems.
Our products are sold primarily through purchase orders and contracts submitted by customers through our dealers and commissioned agents and a national distributor, as well as through competitive bids submitted by us and our subsidiaries in India and Singapore. Products are sold principally to pharmaceutical, biotechnology, industrial, chemical and commercial research laboratories, educational institutions, healthcare institutions, governmental entities, manufacturing facilities, and users of networking furniture. We consider the markets in which we compete to be highly competitive, with a significant amount of the business involving competitive public bidding.
It is common in the laboratory furniture industry for customer orders to require delivery at extended future dates, as products are frequently to be installed in buildings yet to be constructed. Changes or delays in building construction may cause delays in delivery of the orders and our recognition of the sale. Since prices are normally quoted on a firm basis in the industry, we bear the burden of possible increases in labor and material costs between receipt of an order and delivery of the product. The impact of such possible increases is considered when determining the sales price.
Our need for working capital and our credit practices are comparable to those of other companies manufacturing, selling, and installing similar products in similar markets. Since our products are used in building construction products,projects, in many cases payments for our laboratory products are received over longer periods of time than payments for many other types of manufactured products, thus requiring increased working capital. In addition, payment terms associated with certain projects provide for a retention amount until completion of the project, thus also increasing required working capital. On average, payments for our products are received during the quarter following shipment, with the exception of the retention amounts which are collected at the completion of the project.
The principal raw materials and products manufactured by others used by us in our products are cold-rolled carbon and stainless steel, hardwood lumber and plywood, paint, chemicals, resins, hardware, plumbing and electrical fittings. Such materials and products are purchased from multiple suppliers and are typically readily available.
We hold various patents and patent rights but do not consider that our success or growth is dependent upon our patents or patent rights. Our business is not dependent upon licenses, franchises or concessions.
Our business is not generally cyclical, although sales are sometimes lower during our third quarter because of slower construction activity in certain areas of the country during the winter months. Our business is not dependent on any one or a few customers; however, sales to our national distributor, VWR International, represented 13 percent, 14 percent, 15 percent, and 1115 percent of our total sales in fiscal years 2007, 2006 2005 and 2004,2005, respectively.
Our order backlog at April 30, 20062007 was $36.4$51.1 million, as compared to $36.4 million at April 30, 2006 and $40.6 million at April 30, 2005 and $43.1 million at April 30, 2004.2005. All but $3.3$7.9 million of the backlog at April 30, 20062007 was scheduled for shipment during fiscal year 2007;2008; however, it may reasonably be expected that delays in shipments will
3
occur because of customer rescheduling or delay in completion of projects which involve the installation of our products. Based on scheduled shipment dates and past experience, we expect that more than 9080 percent of our order backlog at April 30, 20062007 will be shipped during fiscal year 2007.2008.
Segment Information
See Note 9 of the Notes to Consolidated Financial Statements included in Item 8 of this Annual Report on Form 10-K for information concerning our Domestic and International business segments.
Competition
We consider the industries in which we compete to be highly competitive and believe that the principal competitive factors are price, product performance, and customer service. A significant portion of our business is based upon competitive public bidding.
Research and Development
The amount spent by us during the fiscal year ended April 30, 20062007 on research and development activities related to new or re-designed products was $760,000.$945,000. The amounts spent for similar purposes in the fiscal years ended April 30, 2006 and 2005 were $760,000 and 2004 were $785,000, and $791,000, respectively.
Environmental Compliance
In the last three fiscal years, compliance with federal, state or local provisions enacted or adopted regulating the discharge of materials into the environment has had no material effect on us. There are no material capital expenditures anticipated for such purposes, and no material effect therefrom is anticipated on our earnings or competitive position.
Employees
At April 30, 2006,2007, we had 471433 domestic employees and 95121 international employees.
Other Information
Our internetInternet address iswww.kewaunee.com. We make available, free of charge through this web site, our annual report to stockholders. Our Form 10-K and 10-Q financial reports may be obtained by stockholders by writing the Secretary of the Company, Kewaunee Scientific Corporation, P.O. Box 1842, Statesville, NC 28687-1842. The public may also obtain information on our reports, proxy, and information statements at the SEC internetInternet sitewww.sec.gov.
Safe Harbor Statement under the Private Securities Litigation Reform Act of 1995
Certain statements included and referenced in this report, including Management’s Discussion and Analysis of Financial Condition and Results of Operations, constitute “forward-looking” statements within the meaning of the Private Securities Litigation Reform Act of 1995 (the “Reform Act”). Such forward-looking statements involve known and unknown risks, uncertainties and other factors that could significantly impact results or achievements expressed or implied by such forward-looking statements. These factors include, but are not limited to, economic, competitive, governmental, and technological factors affecting our operations, markets, products, services, and prices, as well as prices for certain raw materials and energy. The cautionary statements made by us pursuant to the Reform Act herein and elsewhere should not be construed as exhaustive. We cannot always predict what factors would cause actual results to differ materially from those indicated by the forward-looking statements. In addition, readers are urged to consider statements that include the terms “believes,” “belief,” “expects,” “plans,” “objectives,” “anticipates,” “intends” or the like to be uncertain and forward-looking.
Executive Officers of the Registrant
Included herein in Part III, Item 10(b) of this Annual Report on Form 10-K.
4
You should carefully consider the following risks before youryou decide to buy shares of our common stock. If any of the following risks actually occurs,occur, our business, results of operations or financial condition would likely suffer. In such case, the trading price of our common stock would decline, and you may lose all or part of the money you paid to buy our stock.
This and other public reports may contain forward-looking statements based on current expectations, assumptions, estimates and projections about us and our industry. These forward-looking statements involve risks and uncertainties. Our actual results could differ materially from those forward-looking statements as resultsa result of many factors, as more fully described below and elsewhere in our public reports. We do not undertake to update publicly any forward-looking statements for any reasons, even if new information becomes available or other events occur in the future.
If we fail to compete effectively, our revenue and profit margins could decline.
We face a variety of competition in all of the markets in which we participate. Competitive pricing, including price competition or the introduction of new products, could have material adverse effects on our revenues and profit margins.
Our ability to compete effectively depends to a significant extent on the specification or approval of our products by architects, engineers, and customers. If a significant segment of those communities were to decide that the design, materials, manufacturing, testing or quality control of our products is inferior to that of any of our competitors, our sales and profits would be materially and adversely affected.
If we lose a large customer, our sales and profits would decline.
We have substantial sales to one large customer. In particular, one customerThat distributor accounted for 14%13% of our net sales in fiscal year 2006.2007. Loss of all or a part of our sales to a large customer would have a material effect on our revenues and profits.
An increase in the price of raw materials could negatively affect our sales and profits.
Our principal raw materials are steel, including stainless steel, wood and epoxy resin. Numerous factors beyond our control, such as general economic conditions, competition, worldwide demand, labor costs, energy costs, and import duties and other trade restrictions, influence prices for our raw materials. In March 2002, for example, the United States imposed tariffs on several types of imported steel, which increased our cost of steel. In addition, consolidation among domestic integrated steel producers, changes in supply and demand in steel markets, the weakening United States dollar and other events have led to increased steel costs. The domestic steel market is heavily influenced by three major United States manufacturers. Worldwide demand for steel is strong. We have not always been able, and in the future we might not be able, to increase our product prices in amounts that correspond to increaseincreases in costs of raw materials, without materially and adversely affecting our sales and profits. We have not attempted to hedge against changes in prices of steel or other raw materials.
Our future growth may depend on our ability to penetrate new international markets.
International laws and regulations, construction customs, standards, techniques and methods differ from those in the United States. Significant challenges of conducting business in foreign countries include, among other factors, local acceptance of our products, political instability, currency controls, changes in import and export regulations, changes in tariff and freight rates, and fluctuations in foreign exchange rates.
5
Events outside our control may affect our operating results.
We have little control over the timing of our customer shipments. Shipments that we anticipate in one quarter may occur in another quarter, affecting both quarters’ results. Weather conditions, such as unseasonably warm, cold or wet weather, can affect and sometimes delay projects. Political and economic events can also affect our revenues. When sales do not meet our expectations, our operating results will be reduced for the relevant quarters.
Our principal markets are in the laboratory building construction industry. This industry is subject to significant volatility due to various factors, none of which is within our control. Declines in construction activity or demand for our products could materially and adversely affect our business and financial condition.
We depend on key management and technical personnel, the loss of whom could harm our business.
We depend on certain key management and technical personnel. The loss of one or more key employees may materially and adversely affect us. Our success also depends on our ability to attract and retain additional highly qualified technical, marketing and management personnel necessary for the maintenance and expansion of our activities. We might not be able to attract or retain such personnel.
Our stock price is likely to be volatile and could drop.
The trading price of our Common Stock could be subject to wide fluctuations in response to quarter to quarter variation in operating results, announcement of technological innovations or new products by us or our competitors, general conditions in the construction and construction materials industries, relatively low trading volume in our Common Stock and other events or factors. In addition, in recent years the stock market has experienced extreme price fluctuations. This volatility has had a substantial effect on the market prices of securities issued by many companies for reasons unrelated to the operating performance of those companies. Securities market fluctuations may adversely affect the market price of our Common Stock.
We are subject to a number of significant risks that might cause our actual results to vary materially from our forecasts, targets, or projections, including:
Failing to anticipate, appropriately invest in and effectively manage the human, information technology and logistical resources necessary to support the growth of our business, including managing the costs associated with such resources;
Failing to generate sufficient future positive operating cash flows and, if necessary, secure adequate external financing to fund our growth; and
Interruptions in service by common carriers that ship goods within our distribution channels.
FailureThe implementation of a new information technology system may disrupt our operations.
Our ability to design, manufacture, market and service our products is dependent on information technology systems that encompass all of our internal control overmajor business functions. We are in the process of implementing a comprehensive enterprise resource planning (“ERP”) software system. This new ERP system will cover many areas of our business. System failure or malfunctioning may result in disruption of operations and the inability to process transactions and could adversely affect our financial reporting could harmresults. If we encounter unforeseen delays or difficulties or significant increased costs in implementing our system, our business and financial results.
Our management is responsible for establishing and maintaining adequate internal control over financial reporting. Internal control over financial reporting is a process to provide reasonable assurance regarding the reliability of financial reporting for external purposes in accordance with accounting principles generally accepted in the United States. Internal control over financial reporting includes maintaining records that in reasonable detail accurately and fairly reflect our transactions; providing reasonable assurance that transactions are recorded as necessary for preparation of the
6
consolidated financial statements; providing reasonable assurance that receipts and expenditures of our assets are made in accordance with management authorization; and providing reasonable assurance that unauthorized acquisition, use or disposition of our assets thatcondition could have a material effect on the consolidated financial statements would be prevented or detected on a timely basis. Because of its inherent limitations, internal control over financial reporting is not intended to provide absolute assurance that a misstatement of our consolidated financial statements would be prevented or detected. Any failure to maintain an effective system of internal control over financial reporting could limit our ability to report our financial results accurately and timely or to detect and prevent fraud.adversely affected.
Item 1B. Unresolved Staff Comments
None.
We own and operate three adjacent manufacturing facilities in Statesville, North Carolina. These facilities also house our corporate offices, as well as sales and marketing, administration, engineering and drafting personnel. These facilities together comprise approximately 382,000 square feet and are located on approximately 20 acres of land. In addition, at April 30, 2006,2007, we leased our primary distribution facility and other warehouse facilities totaling 164,000160,000 square feet in Statesville, North Carolina. We also lease and operate a manufacturing facility in Bangalore, India totaling approximately 16,000 square feet.
All of the facilities which we own are held free and clear of any encumbrances. We believe our facilities are suitable for their respective uses and are adequate for our current needs.
From time to time, we are involved in certain disputes and litigation relating to claims arising out of our operations in the ordinary course of business. Further, we periodically are subject to government audits and inspections. We believe that any such matters presently pending will not, individually or in the aggregate, have a material adverse effect on our results of operations or financial condition.
Item 4. Submission of Matters to a Vote of Security Holders
Not Applicable.
7
Item 5. Market for Registrant’s Common Equity, Related Stockholder Matters and Issuer Purchases of Equity Securities
Our common stock is traded in the NASDAQ National Market system, under the symbol KEQU. The following table sets forth the quarterly high and low prices reported on the NASDAQ National Market System.
First Quarter | Second Quarter | Third Quarter | Fourth Quarter | |||||||||||||||||||||
2007 | ||||||||||||||||||||||||
High | $ | 9.10 | $ | 8.57 | $ | 11.47 | $ | 11.90 | ||||||||||||||||
Low | $ | 8.09 | $ | 7.38 | $ | 7.40 | $ | 9.64 | ||||||||||||||||
Close | $ | 8.79 | $ | 7.44 | $ | 9.78 | $ | 10.97 | ||||||||||||||||
First Quarter | Second Quarter | Third Quarter | Fourth Quarter | |||||||||||||||||||||
2006 | ||||||||||||||||||||||||
High | $ | 9.00 | $ | 10.18 | $ | 10.64 | $ | 9.25 | $ | 9.00 | $ | 10.18 | $ | 10.64 | $ | 9.25 | ||||||||
Low | $ | 6.68 | $ | 8.17 | $ | 8.66 | $ | 8.69 | $ | 6.68 | $ | 8.17 | $ | 8.66 | $ | 8.69 | ||||||||
Close | $ | 8.88 | $ | 8.48 | $ | 9.20 | $ | 8.85 | $ | 8.88 | $ | 8.48 | $ | 9.20 | $ | 8.85 | ||||||||
2005 | ||||||||||||||||||||||||
High | $ | 11.34 | $ | 10.04 | $ | 9.50 | $ | 9.00 | ||||||||||||||||
Low | $ | 9.10 | $ | 8.51 | $ | 8.27 | $ | 7.08 | ||||||||||||||||
Close | $ | 9.50 | $ | 9.25 | $ | 8.67 | $ | 7.51 | ||||||||||||||||
As of June 30, 2006,July 5, 2007, we estimate there were approximately 1,000 stockholders of our common shares, of which 243225 were stockholders of record. We paid cash dividends of $0.28 per share for each of the fiscal years 2007, 2006, and 2005. We currently expect to pay dividends in the future in line with our actual and anticipated future operating results.
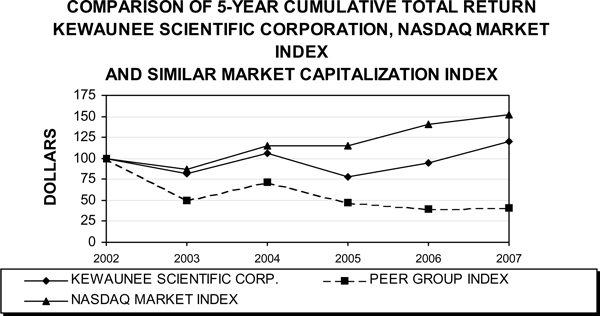
Performance Graph
The graph below sets forth a comparison of the Company’s annual stockholder return with the annual stockholder return of (i) the Nasdaq Market Index, and (ii) an index of Nasdaq, non-financial companies with similar market capitalizations to the Company. The graph is based on an investment of $100 on May 1, 2002 (the first trading day of the Company’s fiscal year beginning on that date) in the Company’s common stock, assuming dividend reinvestment. The graph is not an indicator of the future performance of the Company. Thus, it should not be used to predict the future performance of the Company’s stock. The graph and related data were furnished by Hemscott, Inc., Richmond, Virginia.
In addition to the Company, the Similar Market Capitalization Index is comprised of the following companies: Amtech Systems, Inc.; Arotech Corporation; Jaco Electronics, Inc.; Max & Erma’s Restaurants, Inc.; Point.360; Pyramid Breweries Inc.; and Tripos, Inc. Consistent with the prior year, the Company used for an index companies with a market capitalization similar to that of the Company (the “Peer Group”). The Peer Group index was used because there exists no applicable published industry index or line-of-business index, and the Company does not believe it can reasonably identify a peer group of companies in its industry because the Company’s primary competitors are either divisions of larger corporations or are privately owned.
Securities Authorized for Issuance under Equity Compensation Plan
See Item 12 in this Form 10-K for a discussion of securities authorized for issuance under our equity compensation plans.
8
Item 6. Selected Financial Data
The following table sets forth our selected consolidated financial information for each of the five years ended April 30, 2007, 2006, 2005, 2004, 2003, and 2002;2003; this information is derived from our audited Consolidated Financial Statements, the most recent three years of which appear elsewhere herein. The data presented below should be read in conjunction with the Consolidated Financial Statements and related Notes thereto and “Item 7—7 – Management’s Discussion and Analysis of Financial Condition and Results of Operations” included elsewhere herein.
$ and shares in thousands, except per share amounts | Year Ended April 30 | |||||||||||||||||||||||||||||||||||||||
| Year Ended April 30 | ||||||||||||||||||||||||||||||||||||||||
$ and shares in thousands, except per share amounts | 2006 | 2005 | 2004 | 2003 | 2002 | 2007 | 2006 | 2005 | 2004 | 2003 | ||||||||||||||||||||||||||||||
Net sales | $ | 84,071 | $ | 73,481 | $ | 94,700 | $ | 71,163 | $ | 84,849 | $ | 81,441 | $ | 84,071 | $ | 73,481 | $ | 94,700 | $ | 71,163 | ||||||||||||||||||||
Costs of products sold | 71,663 | 60,997 | 79,011 | 58,451 | 70,143 | 66,355 | 71,663 | 60,997 | 79,011 | 58,451 | ||||||||||||||||||||||||||||||
Gross profit | 12,408 | 12,484 | 15,689 | 12,712 | 14,706 | 15,086 | 12,408 | 12,484 | 15,689 | 12,712 | ||||||||||||||||||||||||||||||
Other operating income | 884 | — | — | — | — | — | 884 | — | — | — | ||||||||||||||||||||||||||||||
Operating expenses | 12,175 | 12,699 | 13,491 | 13,476 | 11,801 | 11,728 | 12,175 | 12,699 | 13,491 | 13,476 | ||||||||||||||||||||||||||||||
Operating earnings (loss) | 1,117 | (215 | ) | 2,198 | (764 | ) | 2,905 | 3,358 | 1,117 | (215 | ) | 2,198 | (764 | ) | ||||||||||||||||||||||||||
Other income (expense) | 50 | 2 | 319 | 96 | (6 | ) | ||||||||||||||||||||||||||||||||||
Other income | 53 | 50 | 2 | 319 | 96 | |||||||||||||||||||||||||||||||||||
Interest expense | (470 | ) | (310 | ) | (301 | ) | (155 | ) | (144 | ) | (670 | ) | (470 | ) | (310 | ) | (301 | ) | (155 | ) | ||||||||||||||||||||
Earnings (loss) before income taxes | 697 | (523 | ) | 2,216 | (823 | ) | 2,755 | 2,741 | 697 | (523 | ) | 2,216 | (823 | ) | ||||||||||||||||||||||||||
Income tax expense (benefit) | 288 | (488 | ) | 621 | (549 | ) | 793 | 902 | 288 | (488 | ) | 621 | (549 | ) | ||||||||||||||||||||||||||
Earnings (loss) before minority interests | 409 | (35 | ) | 1,595 | (274 | ) | 1,962 | 1,839 | 409 | (35 | ) | 1,595 | (274 | ) | ||||||||||||||||||||||||||
Minority interests in subsidiaries | (216 | ) | (112 | ) | (133 | ) | (68 | ) | (62 | ) | (299 | ) | (216 | ) | (112 | ) | (133 | ) | (68 | ) | ||||||||||||||||||||
Net earnings (loss) | $ | 193 | $ | (147 | ) | $ | 1,462 | $ | (342 | ) | $ | 1,900 | $ | 1,540 | $ | 193 | $ | (147 | ) | $ | 1,462 | $ | (342 | ) | ||||||||||||||||
Weighted average shares outstanding: | ||||||||||||||||||||||||||||||||||||||||
Basic | 2,492 | 2,491 | 2,486 | 2,478 | 2,468 | 2,493 | 2,492 | 2,491 | 2,486 | 2,478 | ||||||||||||||||||||||||||||||
Diluted | 2,493 | 2,495 | 2,497 | 2,485 | 2,481 | 2,495 | 2,493 | 2,495 | 2,497 | 2,485 | ||||||||||||||||||||||||||||||
PER SHARE DATA: | ||||||||||||||||||||||||||||||||||||||||
Net earnings (loss): | ||||||||||||||||||||||||||||||||||||||||
Basic | $ | 0.08 | $ | (0.06 | ) | $ | 0.59 | $ | (0.14 | ) | $ | 0.77 | $ | 0.62 | $ | 0.08 | $ | (0.06 | ) | $ | 0.59 | $ | (0.14 | ) | ||||||||||||||||
Diluted | 0.08 | (0.06 | ) | 0.59 | (0.14 | ) | 0.77 | 0.62 | 0.08 | (0.06 | ) | 0.59 | (0.14 | ) | ||||||||||||||||||||||||||
Cash dividends | 0.28 | 0.28 | 0.28 | 0.28 | 0.28 | 0.28 | 0.28 | 0.28 | 0.28 | 0.28 | ||||||||||||||||||||||||||||||
Year-end book value | 10.25 | 10.43 | 10.77 | 10.46 | 10.90 | 9.64 | 10.25 | 10.43 | 10.77 | 10.46 | ||||||||||||||||||||||||||||||
| As of April 30 | ||||||||||||||||||||||||||||||||||||||||
$ in thousands | 2006 | 2005 | 2004 | 2003 | 2002 | |||||||||||||||||||||||||||||||||||
BALANCE SHEET DATA: | ||||||||||||||||||||||||||||||||||||||||
Current assets | $ | 31,398 | $ | 26,780 | $ | 31,536 | $ | 24,986 | $ | 25,426 | ||||||||||||||||||||||||||||||
Current liabilities | 20,373 | 16,399 | 18,919 | 13,328 | 10,609 | |||||||||||||||||||||||||||||||||||
Net working capital | 11,025 | 10,381 | 12,617 | 11,658 | 14,817 | |||||||||||||||||||||||||||||||||||
Net property, plant and equipment | 11,163 | 10,730 | 11,362 | 11,791 | 12,811 | |||||||||||||||||||||||||||||||||||
Total assets | 50,472 | 46,212 | 50,461 | 43,654 | 42,190 | |||||||||||||||||||||||||||||||||||
Total borrowings/long-term debt | 9,059 | 5,127 | 9,045 | 3,346 | 2,611 | |||||||||||||||||||||||||||||||||||
Stockholders’ equity | 25,546 | 25,989 | 26,791 | 25,938 | 26,912 | |||||||||||||||||||||||||||||||||||
OTHER DATA: | ||||||||||||||||||||||||||||||||||||||||
Capital expenditures | $ | 1,886 | $ | 976 | $ | 1,619 | $ | 3,143 | $ | 2,065 | ||||||||||||||||||||||||||||||
Year-end stockholders of records | 243 | 252 | 265 | 273 | 289 | |||||||||||||||||||||||||||||||||||
Year-end employees (domestic) | 471 | 484 | 533 | 543 | 535 | |||||||||||||||||||||||||||||||||||
$ in thousands BALANCE SHEET DATA: Current assets Current liabilities Net working capital Net property, plant and equipment Total assets Total borrowings/long-term debt Stockholders’ equity OTHER DATA: Capital expenditures Year-end stockholders of record Year-end employees (domestic)9 As of April 30 2007 2006 2005 2004 2003 $ 28,514 $ 31,398 $ 26,780 $ 31,536 $ 24,986 16,183 20,373 16,399 18,919 13,328 12,331 11,025 10,381 12,617 11,658 11,255 11,163 10,730 11,362 11,791 45,240 50,472 46,212 50,461 43,654 4,325 9,059 5,127 9,045 3,346 24,048 25,546 25,989 26,791 25,938 $ 1,724 $ 1,886 $ 976 $ 1,619 $ 3,143 225 243 252 265 273 433 471 484 533 543
Item 7. Management’s Discussion and Analysis of Financial Condition and Results of Operations
SPECIAL NOTE REGARDING FORWARD-LOOKING STATEMENTS
Certain statements in this document constitute “forward-looking” statements within the meaning of the Private Securities Litigation Reform Act of 1995 (the “Reform Act”). Such forward-looking statements involve known and unknown risks, uncertainties, and other factors that could significantly impact results or achievements expressed or implied by such forward-looking statements. These factors include, but are not limited to, economic, competitive, governmental, and technological factors affecting our operations, markets, products, services, and prices. The cautionary statements made pursuant to the Reform Act herein and elsewhere by us should not be construed as exhaustive. We cannot always predict what factors would cause actual results to differ materially from those indicated by the forward-looking statements. In addition, readers are urged to consider statements that include the terms “believes,” “belief,” “expects,” “plans,” “objectives,” “anticipates,” “intends,” or the like to be uncertain and forward-looking. Over time, our actual results, performance or achievements will likely differ from the anticipated results, performance or achievements that are expressed or implied by our forward-looking statements, and such difference might be significant and harmful to our stockholders’ interest. Many important factors that could cause such a difference are described under the caption “Risk Factors,” in Item 1A of this annual report, which you should review carefully.
MANAGEMENTSMANAGEMENT’S DISCUSSION AND ANALYSIS
INTRODUCTION
We are a recognized leader in the design, manufacture, and installation of laboratory and technical furniture products. Laboratory furniture products include both steel and wood cabinetry, fume hoods, flexible systems, and worksurfaces. Technical furniture products include workstations, workbenches, computer enclosures, and network storage systems. Our headquarters and manufacturing facilities are located in Statesville, North Carolina. We also have subsidiaries in Singapore and Bangalore, India that serve the Asian and Middle East markets. Although only approximately 15.1%18.2% of our sales were through our international subsidiaries in fiscal year 2006,2007 these sales are considered an important part of our long-term growth strategy.
Our products are primarily sold through purchase orders and contracts submitted by customers through our dealers and commissioned agents, a national distributor, and through competitive bids submitted by us and our subsidiaries. Products are sold principally to pharmaceutical, biotechnology, industrial, chemical and commercial research laboratories, educational institutions, healthcare institutions, governmental entities, manufacturing facilities, and users of networking furniture. We consider the markets in which we compete to be highly-competitive,highly competitive, with a significant amount of the business involving competitive public bidding.
It is common in the laboratory furniture industry for customer orders to require delivery at extended future dates, as products are frequently to be installed in buildings yet to be constructed. Changes or delays in building construction may cause delays in delivery of the orders and our recognition of the sale. Since prices are normally quoted on a firm basis in the industry, we bear the burden of possible increases in labor and material costs between receipt of an order and delivery of the product. The impact of such possible increases is considered when determining the sales price. The principal raw materials and products manufactured by others used in our products are cold-rolled carbon and stainless steel, hardwood lumbers and plywood, paint, chemicals, resins, hardware, plumbing and electrical fittings. Such materials and products are purchased from multiple suppliers and are typically readily available.
10
CRITICAL ACCOUNTING POLICIES
In the ordinary course of business, we have made a number of estimates and assumptions relating to the reporting of results of operations and financial position in the preparation of our financial statements in conformity with generally accepted accounting principles in the United States of America. Actual results could differ significantly from those estimates. We believe that the following discussion addresses our most critical accounting policies, which are those that are most important to the portrayal of our financial condition and results of operations, and require management’s most difficult, subjective, and complex judgments, often as a result of the need to make estimates about the effect of matters that are inherently uncertain.
REVENUE RECOGNITION
A portion of our product sales result from fixed-price construction contracts that involve a signed contract for a fixed price to provide our laboratory furniture and fume hoods for a construction project. We are usually in the role asof a subcontractor, but in some cases may enter into a contract directly with the end-user of the products. Product sales resulting from fixed-price construction contracts are generated from multiple-element arrangements that require separate units of accounting and estimates regarding the fair value of individual elements. Our multiple-element arrangements that qualify as separate units of accounting are: product sales and installation services. Each of these elements represent individual units of accounting as the delivered item has value to a customer on a stand-alone basis, objective and reliable evidence of fair value exists for undelivered items, and arrangements normally do not contain a general right of return relative to the delivered item. We determine fair value based on the price of the deliverable when it is sold separately or based on third-party evidence. In accordance with the guidance in Emerging Issues Task Force (“EITF”) 00-21 “Revenue Arrangements with Multiple Deliverables”,Deliverables,” we use the residual method to allocate the arrangement consideration when the arrangement does not indicate fair value of the product sale. Under the residual method, the amount of consideration allocated to the delivered item equals the total arrangement consideration less the aggregate fair value of the undelivered items. Assuming all other criteria for revenue recognition have been met, we recognize revenue for product sales at the date of shipment. Product sales resulting from purchase orders involve a purchase order received by us from our dealers or our stocking distributor. This category includes product sales for standard products, as well as products which require some customization. These sales are recognized under the terms of the purchase order which generally are freight on board (“FOB”) shipping point and do not include rights of return. Accordingly, sales are recognized at the time of shipment.
ALLOWANCE FOR DOUBTFUL ACCOUNTS
Evaluation of the allowance for doubtful accounts involves management judgments and estimates. We evaluate the collectibility of our trade accounts receivable based on a number of factors. In circumstances where management is aware of a customer’s inability to meet its financial obligations to us, or a project dispute makes it unlikely that all of the receivable owed by a customer will be collected, a specific reserve for bad debts is estimated and recorded, to reduce the recognized receivable to the estimated amount we believe will ultimately be collected. In addition to specific customer identification of potential bad debts, a general reserve for bad debts is estimated and recorded based on our recent past loss history and an overall assessment of past due trade accounts receivable amounts outstanding.
INVENTORIES
Inventories are valued at the lower of cost or market. The cost of the majority of inventories is measured on the last in, first out (“LIFO”) method. The LIFO method allocates the most recent costs to cost of products sold, and, therefore, recognizes into operating results fluctuations in raw materials,
11
and other inventoriable costs more quickly than other methods. Other inventories consisted of foreign inventories and are measured at actual cost.
PENSION BENEFITS
We sponsor pension plans covering all employees who meetmet eligibility requirements.requirements as of April 30, 2005. In February 2005, our pension plans were amended as of April 30, 2005. No further benefits have been, or will be, earned under the plans subsequent to the amendment date, and no additional participants have been, or will be, added to the plans. Several statistical and other factors, which attempt to anticipate future events, are used in calculating the expense and liability related to the pension plans. These factors include assumptions about the discount rate used to calculate and determine benefit obligations and expected return on plan assets within certain guidelines. The actuarial assumptions used by us may differ materially from actual results due to changing market and economic conditions, higher or lower withdrawal rates, or longer or shorter life spans of participants. These differences may significantly affect the amount of pension income or expense recorded by us in future periods.
RESULTS OF OPERATIONS
Sales for fiscal year 2007 were $81.4 million, a decrease of 3% from fiscal year 2006 sales of $84.1 million. Domestic operations sales for the year were $66.6 million, a decrease of 8% from the prior year. As reflected in the growth of our order backlog, the domestic marketplace for laboratory products continued to be healthy during the year, particularly for larger laboratory products. However, the marketplace for small and mid-sized projects remained subdued and very price competitive. International operations sales for the year were $14.8 million, an increase of 23% over the prior year. International
operations sales for the year benefited from a strengthening of our sales representation in the Asian and Middle East markets and a further expansion of our manufacturing capabilities in India.
Our order backlog was $51.2 million at April 30, 2007, as compared to $36.4 million at April 30, 2006, and $40.6 million at April 30, 2005. The increase in order backlog in fiscal year 2007 was due to the strong volume of incoming orders, both domestic and international, in the second half of the year.
Sales for fiscal year 2006 were $84.1 million, an increase of 14.4%14% from fiscal year 2005 sales of $73.4 million. Domestic demandoperations sales for our products improved during the year. Domestic salesyear were $72.0 million, an increase of 6.2%6% over the prior year. Although demand for products improved, a significant amount of excess manufacturing capacity remained in the marketplace. Domestic selling prices for laboratory products declined during thefiscal year 2006, as manufacturers reacted to the excess manufacturing capacity. Growth accelerated for our Asian subsidiaries duringcapacity in the year, asmarketplace. International operations sales through our international subsidiaries increased 113% to $12.0 million.
Sales for fiscal year 20052006 were $73.4$12.0 million, a decreasean increase of 22% from fiscal year 2004 sales of $94.7 million. Domestic sales were $67.1 million, a decrease of 24% from113% over the prior year, while sales through our international sales decreased 8% to $6.9 million. Sales for fiscal year 2005, both domestic and international, were adversely affected by several factors during the year. Spending for new research projects by pharmaceutical companies was reduced by the uncertainties surrounding the November 2004 presidential election and the potential impact of its outcome on pricing of prescription drugs. The significant increases in the cost of construction materials during fiscal year 2005 reduced the number of laboratory projects generally available in the marketplace, or delayed construction. Spending for laboratory construction for higher education science buildings slowed significantly during fiscal year 2005 due to the combination of significantly higher construction costs and reduced state funds available for these projects. Our order backlog was $36.4 million at April 30, 2006, as compared to $40.6 million at April 30, 2005, and $43.1 million at April 30, 2004.
Gross profit represented 14.8%18.5%, 17.0%14.8%, and 16.6%17.0% of sales in fiscal years 2007, 2006, and 2005, respectively. The increase in the gross profit margin in fiscal year 2007 from fiscal year 2006 was primarily due to improved manufacturing costs, continuing success in identifying new lower cost global supply sources for raw materials and 2004, respectively.components, and other cost improvement activities. The decrease in gross profit margin in fiscal year 2006 from fiscal year 2005 was due to a number of unfavorable factors. These included lower selling prices, increased costs of raw materials, particularly steel and epoxy resin, and increased costs of energy and transportation. We only had limited success in our efforts to pass on these added costs to customers. The unfavorable factors were partially offset by actions taken to reduce factory overhead, manufacturing costs, and material costs.
The increase in gross profit margin in fiscal year 2005 from fiscal year 2004 was due to aggressive activities to reduce overhead and material costs. These improvements more than offset significant increases in raw material prices, particularly steel and epoxy resin, which reduced gross profit for the year by $1.4 million, or 1.9% of sales.
Other operating income of $884,000 in fiscal year 2006 resulted from the sale of our former plant site in Lockhart, Texas.
12
Operating expenses were $11.7 million, $12.2 million, $12.7 million, and $13.5$12.7 million in fiscal years 2007, 2006, 2005, and 2004,2005, respectively, and 14.5%14.4%, 17.3%14.5%, and 14.2%17.3% of sales, respectively. The decrease in operating expenses for fiscal year 2007 as compared to fiscal year 2006 was primarily due to a reduction in sales and marketing expenses of $368,000 and a decline of $182,000 in sales commission due to lower sales. The decrease in operating expenses for fiscal year 2006 as compared to fiscal year 2005 was primarily attributable to cost reduction activities during the currentfiscal year 2006, the full benefit of workforce reductions made during the prior year, a decrease in pension expense of $251,000 resulting from the freezing of benefits in our pension plans as of April 30, 2005, and a reduction in bad debt expense of $232,000.
On a dollar basis, operating expenses for fiscal year 2005 as compared to fiscal year 2004 benefited from cost reduction activities, including reduced salaries and benefits of $630,000 resulting from workforce reductions made during the year. Operating expenses in fiscal year 2005 also benefited from a decline in sales commissions of $461,000 as compared to the prior year due to the lower sales volumes. As a percent of sales, operating expenses in fiscal year 2005 increased as compared to fiscal year 2004 as the amount of operating expenses did not decline proportionately with the decline in sales.
Other income was $53,000, $50,000, $2,000, and $319,000$2,000 in fiscal years 2007, 2006, and 2005, and 2004, respectively. Other income for fiscal year 2004 includes $295,000 received during the year from the resolution of a disputed claim for laboratory furniture sold several years earlier.
Interest expense was $670,000, $470,000, $310,000, and $301,000$310,000 in fiscal years 2007, 2006, and 2005, respectively. The increased interest expense in fiscal year 2007 resulted primarily from higher interest rates paid and 2004, respectively.higher levels of bank borrowings and capital leases during the year. The increased interest expense in fiscal year 2006 resulted primarily from higher interest rates paid. The increased interest
Income tax expense of $902,000, or 32.9% of pretax earnings, was recorded in fiscal year 2005 resulted2007. The effective tax rate for fiscal year 2007 differs from higher interestthe statutory rate as it was increased by the impact of differing foreign tax rates paid, partially offsetand was decreased by lower levelsthe impact of borrowings.state and federal tax credits.
Income tax expense of $288,000, or 41.3% of pretax earnings, was recorded in fiscal year 2006. The impact of earned state and federal tax credits in fiscal year 2006 was offset by a valuation allowance established against earned but unused tax credits, since the utilization of these tax credits depends on future taxable income.credits. An income tax benefit of $488,000, or 93.3% of the pretax loss, was recorded in fiscal year 2005. An income tax expense of $621,000, or 28.0% of pretax earnings was recorded in fiscal year 2004. The effective rate for fiscal yearsyear 2005 and 2004 differs from the statutory rate due to the impact of earned state and federal tax credits. The effective rate for fiscal year 2005 was also impacted by the level of the pretax losses.
Minority interest related to our two subsidiaries that are not 100% owned by us were $299,000, $216,000, $112,000, and $133,000,$112,000, for fiscal years 2007, 2006, 2005, and 2004,2005, respectively. The changes in minority interest for each year were due to changes in the net income of the subsidiaries.
Net earnings in fiscal year 2007 were $1,540,000, or $0.62 per diluted share. Net earnings in fiscal year 2006 were $193,000, or $0.08 per diluted share. Net earnings in fiscal year 2006 included a gain of $540,000 resulting from the sale of our former plant site in Lockhart, Texas. A net loss of $147,000, or $0.06 per diluted share, was reported for fiscal year 2005. Net earnings in fiscal year 2004 were $1.5 million, or $0.59 per diluted share. Net earnings in fiscal year 2006 were increased by $540,000, resulting from the sale of our former plant site in Lockhart, Texas.
LIQUIDITY AND CAPITAL RESOURCES
Our principal sources of liquidity have historically been funds generated from operating activities, supplemented as needed by borrowings under our revolving credit facility. Additionally, certain machinery and equipment are financed by non-cancelable operating leases or capital leases. We believe that these sources of funds will be sufficient to support ongoing business requirements, including capital expenditures, through fiscal year 2007.2008.
At April 30, 2006,2007, we had advances of $8.2$3.5 million outstanding under an unsecured $9$12 million revolving credit facility. The credit facility matures in December 2006,2007, and we intend to extend or replace it with a new facility prior to the maturity date.date, although there can be no assurance as to the availability or terms of any such extension or replacement.
13
During fiscal year 2003, we entered into a 10-year operating lease for a new distribution center in Statesville, North Carolina. This lease arrangement, as well as most of our leases for machinery and equipment, provides us with renewal and purchase options and certain early cancellation rights.
In fiscal year 2005, we began a project to purchase and install a new enterprise resource planning system (ERP). system. The project is projected to have a total cost of $2.0$3.1 million and is expected to be completed in the third quarter of fiscal year 2007.2008. We have entered into lease arrangements to fund the majority of the expectedexternal costs of the project as costs are incurred. Costs of $300,000, $852,000 and $715,000 for the project were incurred and funded under operating and capital lease arrangements during fiscal years 2007, 2006 and 2005, respectively.
The following table summarizes the obligated cash payments including interest, if applicable, for the above commitments as of April 30, 2006:2007:
PAYMENTS DUE BY PERIOD
($ in thousands)
Contractual Obligations | Total | 1 Year | 2-3 Years | 4-5 Years | After 5 years | Total | 1 Year | 2-3 Years | 4-5 Years | After 5 years | ||||||||||||||||||||
Operating Leases | $ | 7,183 | $ | 1,552 | $ | 2,558 | $ | 1,858 | $ | 1,215 | $ | 5,755 | $ | 1,441 | $ | 2,388 | $ | 1,574 | $ | 352 | ||||||||||
Capital Leases | 977 | 329 | 581 | 67 | — | 989 | 431 | 548 | 10 | — | ||||||||||||||||||||
Total Contractual Cash Obligations | $ | 8,160 | $ | 1,881 | $ | 3,139 | $ | 1,925 | $ | 1,215 | $ | 6,744 | $ | 1,872 | $ | 2,936 | $ | 1,584 | $ | 352 | ||||||||||
We do not have any off balance sheet obligations at April 30, 2006.2007.
Operating activities provided cash of $8.7 million in fiscal year 2007, primarily from operating earnings, a reduction in accounts receivable, and an increase in deferred revenue. Operating activities used cash of $246,000 in fiscal year 2006. Operating activities2006 and provided cash of $3.1 million in fiscal year 2005 and used cash of $943,000 in fiscal year and 2004.2005. The primary uses of cash during fiscal year 2006 were increases in inventory and accounts receivable balances, partially offset by cash provided from operating earnings and an increase in accounts payable. Operations, along with a reduction in accounts receivable, and inventory were the primary sources of cash in fiscal year 2005. The primary use of cash in fiscal year 2004 was to fund the significant increase in receivables, which was partially offset by funds provided from operating earnings and a reduction in inventory. The majority of the April 30, 20062007 accounts receivable balances are expected to be collected during the first quarter of fiscal year 2007,2008, with the exception of retention amounts on fixed-price contracts which are collected when the entire construction project is completed and all retention funds are paid by the owner.
We made cash contributions of $2.5 million and $750,000 to our pension plans in fiscal years 2005 and 2004, respectively. As discussed above, no further benefits have been, or will be, earned under theour pension plans after April 30, 2005, and no additional participants have been, or will be, added to the plans. We did not make any contributions to the plans in fiscal yearyears 2007 and 2006, and do not expect to make any contributions to the plans in fiscal year 2007.2008.
Capital expenditures were $1.7 million, $1.9 million, $1.0 million, and $1.6$1.0 million in fiscal years 2007, 2006, and 2005, and 2004, respectively. Capital expenditures in fiscal year 2007 were funded primarily from cash generated by operating activities. Capital expenditures in fiscal year 2006 were funded primarily from cash generated by the sale of our property in Lockhart, Texas. Capital assets related to the ERP system in the amount of $580,000 were funded under capital leases in fiscal year 2006. Capital expenditures in fiscal year 2005 were funded primarily from cash generated by operating activities. Capital assets related to the ERP system in the amountamounts of $300,000, $580,000, and $440,000 were funded under capital leases in fiscal year 2005. Capital expenditures in fiscal year 2004 were funded primarily from borrowings under our credit facility.years 2007, 2006, and 2005, respectively. Fiscal year 20072008 capital expenditures are anticipated to be approximately $1.0 million and are expected to be funded primarily by cash from operating activities.
14
Working capital increased to $12.3 million at April 30, 2007, from $11.0 million at April 30, 2006, from $10.4 million at April 30, 2005, and the ratio of current assets to current liabilities decreasedincreased to 1.8-to-1 at April 30, 2007, from 1.5-to-1 at April 30, 2006, from 1.6-to-1 at April 30, 2005.2006. The increase in working capital for fiscal year 20062007 was attributeddue to increases in cash and cash equivalents.
We paid cash dividends of $0.28 per share for each of the fiscal years 2007, 2006, 2005, and 2004.2005. We expect to pay dividends in the future in line with our actual and anticipated future operating results.
RECENT ACCOUNTING STANDARDS
Adoption of SEC Staff Accounting Bulletin (“SAB”) No. 108 In September 2006, the SEC staff released Staff Accounting Bulletin No. 108, “Considering the Effects of Prior Year Misstatements When Quantifying Misstatements in Current Year Financial Statements” (“SAB 108”). SAB 108 was issued in order to eliminate the diversity of practice surrounding how public companies quantify financial statement misstatements. Traditionally, there have been two widely-recognized methods of quantifying the effects of financial statement misstatements: the “roll-over” method and the “iron curtain” method. The roll-over method focuses primarily on the impact of a misstatement on the income statement, including the reversing effect of prior year misstatements, but its use can lead to the accumulation of misstatements in the balance sheet. The iron curtain method focuses primarily on the effect of correcting the period-end balance sheet with less emphasis on the reversing effects of prior year errors on the income statement.
In SAB 108, the SEC staff established an approach that required quantification of financial statement misstatements based on the effect of the misstatements on each of a company’s financial statements and the related financial statement disclosures. This model is commonly referred to as a “dual approach” because it requires quantification of errors under both the iron curtain and the roll-over methods.
SAB 108 permits public companies to initially apply its provisions either by (i) restating prior financial statements as if the “dual approach” had always been used or (ii) recording the cumulative effect of initially applying the “dual approach” as adjustments to the carrying values of assets and liabilities as of May 2005,1, 2006 with an offsetting adjustment recorded to the opening balance of retained earnings.
During fiscal years 1998 through 2006 the Company overstated deferred income tax assets by a cumulative total amount of $421,000. Subsequent to the years in which the overstatements occurred, the Company discovered the errors and determined they were not material to the Company’s financial statements for the years in which they occurred. The Company elected to apply SAB 108 to correct the errors using the cumulative effect transition method.
The following table summarizes the effects on the related account balances of applying the guidance in SAB 108 as of May 1, 2006:
| Origination Period of Misstatement | ||||||||||||
$ in thousands | Adjustment | Years ended April 30 | ||||||||||
| at May 1, 2006 | 2006 | 2005 | 2004 and Prior | |||||||||
Decrease in deferred income tax assets | $ | 421 | $ | 45 | $ | 61 | $ | 315 | ||||
Decrease in net income | — | 45 | 61 | 315 | ||||||||
Decrease in retained earnings | 421 | — | — | — | ||||||||
New Accounting StandardsIn June 2006, the FASB issued SFASInterpretation No. 154,48, “Accounting Changes and Error Corrections.” SFAS No. 154 replaces APB No. 20, “Accounting Changes”, and SFAS No. 3, “Reporting Accounting Changesfor Uncertainty in Interim Financial Statements”, and established retrospective applicationIncome Taxes” (“FIN 48” or the “Interpretation”) which defines the threshold for recognizing the benefits of a changetax return positions in accounting principle. SFAS No. 154 provides guidance for determining whether retrospective application is impracticable. The reporting of a correction of an error by restating previously issuedthe financial statements is also addressed. SFAS No. 154 is effective for fiscal periods beginning after December 15, 2005. Weas “more-likely-than-not” to be sustained by the taxing authority. “Uncertainty in Income Taxes,” as used in the title of the new Interpretation, refers to uncertainty about how some transactions will adopt SFAS No. 154be treated under the tax law. This uncertainty leads to questions about whether tax positions taken or to be taken on tax returns should be reflected in fiscal year 2007 and believe that it will not have a material impact on ourthe financial conditionstatements before they are finally resolved with the taxing authorities. FIN 48 applies to all tax
positions, regardless of their level of uncertainty or resultsthe nature of operations.
In December 2004, the FASB issued SFAS No. 123(R), “Share-Based Payment,” which is a revision of SFAS No. 123, “Accounting for Stock Based Compensation.” SFAS No. 123(R) supersedes APB Opinion No. 25, “Accounting for Stock Issued to Employees,” and related interpretations, and requires all companies to estimateposition. However, the fair value of incentive stock options granted and then amortize that estimated fair value to expense over the options vesting period. We currently account for our stock option plans under theInterpretation’s recognition and measurement principlesrequirements are likely to have the most impact on positions for which current or future deductions may be disallowed or reduced in a tax examination. The Interpretation applies to situations where the uncertainty is about the timing of APB Opinion No. 25. No employeethe deduction, the amount of the deduction, or outside director compensation costs related to stock option grants are currently reflected in net income, as all option awards granted under those plans had an exercise price equal to the market value onvalidity of the date of grant. SFAS No. 123(R)deduction. FIN 48 is effective for fiscal years beginning after JuneDecember 15, 2005. We2006, and the Company will adopt SFAS No. 123(R) inthis Interpretation during the first quarter of fiscal year 2007 and believe that it will2008. The Company has not have a material impact on our financial condition or results of operations.
In December 2004,yet determined the FASB issued SFAS No. 153, “Exchanges of Nonmonetary Assets, an amendment of APB Opinion No. 29.” This statement addresses the measurement of exchanges of nonmonetary assets and redefines the scope of transactions that should be measured based on fair value of the assets exchanged. SFAS No. 153 is effective for fiscal periods beginning after June 15, 2005. We will adopt SFAS No. 153 in fiscal year 2007 and believe that it will not have a material impact on our financial condition or results of operations.
In December 2004, the FASB issued FASB Staff Position (FSP) 109-1, “Application of FASB Statement No. 109, Accounting for Income Taxes, to the Tax Deduction on Qualified Production Activities Provided by the American Jobs Creation Act of 2004, and FSP 109-2, “Accounting and Disclosure Guidance for the Foreign Earnings Repatriation Provision within the American Jobs Creation Act of 2004 (the ACT).” These FSPs provides accounting and disclosure guidelines relative to the income tax deductions and repatriation provisions contained in the ACT. These FSPs were effective upon issuance. We have not determined what impact,effect, if any, that the ACT and these FSPs mayadoption of FIN 48 will have on ourits consolidated financial position or results of operations.
In November 2004,September 2006, the FASB issued SFAS No. 151, “Inventory Costs, an Amendment157, “Fair Value Measurement” (“SFAS 157”), which establishes a single authoritative definition of ARB No. 43, Chapter 4.”fair value, sets out a framework for measuring fair value, and requires additional disclosures about fair-value measurements in both annual and interim reports. SFAS No. 151 seeks157 applies only to clarifyfair-value measurements that are already required or permitted by other accounting standards and is expected to increase the accountingconsistency of those measurements. SFAS 157 is effective for abnormal amounts of idle facility expense, freight, handling costs, and wasted material in the determination of inventory carrying costs. This statement requires such costs to be treated as a current period expense. SFAS No. 151 is effectivefair-value measures already required or permitted by other standards for financial statements issued for fiscal years beginning after JuneNovember 15, 2005. We2007 and will adopt SFAS No. 151be effective for the Company in fiscal year 2007 and believe2009. The Company has not yet determined the effect, if any, that itthe adoption of this standard will not have a material impact on ourits consolidated financial conditionposition or results of operations.
In September 2006, the FASB issued SFAS No. 158, “Employers’ Accounting for Defined Benefit Pension and Other Postretirement Plans” (“SFAS 158”), which requires employers to recognize on their balance sheets the funded status of pension and other postretirement benefit plans. SFAS 158 also requires companies to recognize actuarial gains and losses, prior service cost, and any remaining transition amounts from the initial application of Statements 87 and 106 when recognizing a plan’s funded status, with the offset to accumulated other comprehensive income. The provisions of SFAS 158 are effective for fiscal years ending after December 15, 2006 and the Company has adopted this standard effective April 30, 2007. Adoption of this standard resulted in a $3.4 million decrease in other Non-Current Assets, a $2.1 million decrease in Other Comprehensive Income, a $1.1 million decrease in Deferred Tax Liabilities, and a $129,000 increase in Deferred Tax Assets.
In February 2007, the FASB issued SFAS No. 159, “the Fair Value Option for Financial Assets and Financial Liabilities” (“SFAS 159”), which allows measurement of specified financial instruments, warranty and insurance contracts at fair value on a contract by contract basis, with changes in fair value recognized in earnings in each period. SFAS 159 is effective at the beginning of the fiscal year that begins after November 15,
2007, and will be effective for the Company in fiscal year 2009. The Company has not yet determined the effect, if any, that the adoption of this standard will have on its consolidated financial position or results of operations.SARBANES-OXLEY SECTION 404 REQUIREMENTS
On May 17, 2006, the U.S. Securities and Exchange Commission further extended the compliance dates for non-accelerated filers to include in their annual reports a report by management on our internal control over financial reporting and an accompanying auditor’s report. As such,a result, we must comply with this requirement for our year ending April 30, 2008.
OUTLOOK
OurWhile our ability to predict future demand for our products is verycontinues to be limited given, among other general economic factors affecting the Company and our markets, ourthe Company’s role as subcontractor or supplier to dealers of subcontractors.for subcontractors, we expect fiscal year 2008 to be profitable. In addition to thesegeneral economic factors affecting the Company and our markets, demand for our products is also dependent upon the number of laboratory construction projects planned and/or current progress in projects already under constructionconstruction. Our earnings are also impacted by increased costs of raw materials, including stainless steel, wood, and our successepoxy resin, and whether we are able to increase product prices to customers in the competitive public bidding process for many of our contracts.amounts that correspond to such increases without materially and adversely affecting sales.
Item 7A. Quantitative and Qualitative Disclosures About Market Risk
We are exposed to market risk in the area of interest rates. This exposure is associated with amounts outstanding under our bank note, certain lease obligations for production machinery, and advances under our revolving credit loan, all of which are priced on a floating rate basis. The principal balance under the revolving credit loan was $8.2$3.5 million at April 30, 2006.2007. We believe that this exposure to market risk is not material.
Item 8. Financial Statements and Supplementary Data
Consolidated Financial Statements
All other schedules for which provision is made in the applicable accounting regulations of the Securities and Exchange Commission are not required under the related instructions or are inapplicable and, therefore, have been omitted.
16
MANAGEMENT’S REPORT OFON CONSOLIDATED FINANCIAL STATEMENTS
To the Stockholders and Board of DirectorsTO THE STOCKHOLDERS AND BOARD OF DIRECTORS
of Kewaunee Scientific CorporationOF KEWAUNEE SCIENTIFIC CORPORATION
The consolidated financial statements and accompanying notes were prepared by management, which is responsible for their integrity and objectivity. Management believes the financial statements, which include amounts based on judgments and estimates, fairly reflect the Company’s financial position and operating results, in accordance with generally accepted accounting principles. All financial information in this report is consistent with the financial statements.
Management maintains internal accounting control systems and related policies and procedures designed to provide reasonable assurance that assets are safeguarded, that transactions are properly recorded and executed in accordance with management’s authorization, and that accounting records may be relied upon for the preparation of financial statements and other financial information. The design, monitoring, and revision of internal accounting control systems involve, among other things, management’s judgment with respect to the relative costs and expected benefits of specific control measures. The Company’s consolidated financial statements have been audited by independent accountants who have expressed their opinion with respect to the fairness of those statements. Their audits included consideration of the Company’s internal accounting control systems over financial reporting and related policies and procedures.procedures as basis for designing appropriate audit procedures, but not for the purpose of expressing an opinion on the effectiveness of the Company’s internal control over financial reporting. They advise management and the Audit Committee of significant matters resulting from their audits.
The Audit Committee of the Board of Directors, which is composed solely of directors who are not officers or employees of the Company, selects the independent accountants for the annual audit of the consolidated financial statements and meets with management and the independent accountants to discuss the scope and findings of audits and financial reportedreporting and internal control matters.
D. Michael Parker
Senior Vice President, Finance
Chief Financial Officer
June 26, 2006
17July 12, 2007
REPORT OF INDEPENDENT REGISTERED PUBLIC ACCOUNTING FIRM
To The Stockholders and Board ofTO THE STOCKHOLDERS AND BOARD OF DIRECTORS
Directors of Kewaunee Scientific CorporationOF KEWAUNEE SCIENTIFIC CORPORATION
We have audited the accompanying consolidated balance sheetsheets of Kewaunee Scientific Corporation, and subsidiaries (the Company) as of April 30, 2007 and 2006, and the related consolidated statements of operations, stockholders’ equity and cash flows for the yearyears then ended. Our auditaudits also included the financial statement schedule listed in the index at Item 15(a). These financial statements and the schedule are the responsibility of the Company’s management. Our responsibility is to express an opinion on these financial statements and the schedule based on our audit.audits.
We conducted our auditaudits of these statements in accordance with the standards of the Public Company Accounting Oversight Board (United States). Those standards require that we plan and perform the audit to obtain reasonable assurance about whether the financial statements are free of material misstatement. An audit includes examining, on a test basis, evidence supporting the amounts and disclosures in the financial statements, assessing the accounting principles used and significant estimates made by management, and evaluating the overall financial statement presentation. We believe that our audit providesaudits provide a reasonable basis for our opinion.
In our opinion, the financial statements referred to above present fairly, in all material respects, the financial position of Kewaunee Scientific Corporation and its subsidiaries at April 30, 2007 and 2006, and the consolidated results of their operations and their cash flows for the yearyears ended April 30, 2007 and 2006, in conformity with accounting principles generally accepted in the United States of America.
Also, in our opinion, the related financial statement schedule, when considered in relation to the consolidated financial statements taken as a whole, presents fairly in all material respects the information set forth therein.
As discussed in the notes to the consolidated financials statements, the Company: (1) effective April 30, 2007, began to recognize the funded status of its benefit plan in its consolidated balance sheet to conform to Statement of Financial Accounting Standards No. 158, Employers’ Accounting for Defined Benefit Pension and Other Postretirement Plans – an amendment of FASB Statements No. 87, 88, 106, and 132(R), and (2) effective April 30, 2007, the Company adopted the dual method of evaluating errors, as required by Staff Accounting Bulletin No. 108, “Considering the Effects of Prior Year Misstatements when Quantifying Misstatements in Current Year Financial Statements.”
CHERRY, BEKAERT & HOLLAND, L.L.P.
Charlotte, North Carolina
June 26, 2006
18July 12, 2007
REPORT OF INDEPENDENT REGISTERED PUBLIC ACCOUNTING FIRM
To the Stockholders and Board ofTO THE STOCKHOLDERS AND BOARD OF DIRECTORS
Directors of Kewaunee Scientific CorporationOF KEWAUNEE SCIENTIFIC CORPORATION
In our opinion, the consolidated financial statements listed in the accompanying index present fairly, in all material respects, the financial position of Kewaunee Scientific Corporation and its subsidiaries at April 30, 2005, and the results of its operations and its cash flows for each of the two years in the periodyear ended April 30, 2005 in conformity with accounting principles generally accepted in the United States of America. In addition, in our opinion, the financial statement schedule for the year ended April 30, 2005 listed in the accompanying index presents fairly, in all material respects, the information set forth therein when read in conjunction with the related consolidated financial statements. These financial statements and financial statement schedule are the responsibility of the Company’s management. Our responsibility is to express an opinion on these financial statements and financial statement schedule based on our audits. We conducted our audits of these statements in accordance with the standards of the Public Company Accounting Oversight Board (United States). Those standards require that we plan and perform the audit to obtain reasonable assurance about whether the financial statements are free of material misstatement. An audit includes examining, on a test basis, evidence supporting the amounts and disclosures in the financial statements, assessing the accounting principles used and significant estimates made by management, and evaluating the overall financial statement presentation. We believe that our audits provide a reasonable basis for our opinion.
PRICEWATERHOUSECOOPERSPricewaterhouseCoopers LLP
Charlotte, North Carolina
June 15, 2005
19
KEWAUNEE SCIENTIFIC CORPORATION
CONSOLIDATED STATEMENTS OF OPERATIONS
Years Ended April 30
$ and shares in thousands, except per share amounts | 2006 | 2005 | 2004 | |||||||||
Net sales | $ | 84,071 | $ | 73,481 | $ | 94,700 | ||||||
Costs of products sold | 71,663 | 60,997 | 79,011 | |||||||||
Gross profit | 12,408 | 12,484 | 15,689 | |||||||||
Other operating income | 884 | — | — | |||||||||
Operating expenses | 12,175 | 12,699 | 13,491 | |||||||||
Operating earnings (loss) | 1,117 | (215 | ) | 2,198 | ||||||||
Other income | 50 | 2 | 319 | |||||||||
Interest expense | (470 | ) | (310 | ) | (301 | ) | ||||||
Earnings (loss) before income taxes | 697 | (523 | ) | 2,216 | ||||||||
Income tax (benefit) expense | 288 | (488 | ) | 621 | ||||||||
Earnings (loss) before minority interests | 409 | (35 | ) | 1,595 | ||||||||
Minority Interests in subsidiaries | (216 | ) | (112 | ) | (133 | ) | ||||||
Net earnings (loss) | $ | 193 | $ | (147 | ) | $ | 1,462 | |||||
Net earnings (loss) per share | ||||||||||||
Basic | $ | 0.08 | $ | (0.06 | ) | $ | 0.59 | |||||
Diluted | $ | 0.08 | $ | (0.06 | ) | $ | 0.59 | |||||
Weighted average number of common shares outstanding | ||||||||||||
Basic | 2,492 | 2,491 | 2,486 | |||||||||
Diluted | 2,493 | 2,495 | 2,497 | |||||||||
Years Ended April 30 | Kewaunee Scientific Corporation | |||||
$ and shares in thousands, except per share amounts | 2007 | 2006 | 2005 | |||||||||
Net sales | $ | 81,441 | $ | 84,071 | $ | 73,481 | ||||||
Costs of products sold | 66,355 | 71,663 | 60,997 | |||||||||
Gross profit | 15,086 | 12,408 | 12,484 | |||||||||
Other operating income | — | 884 | — | |||||||||
Operating expenses | 11,728 | 12,175 | 12,699 | |||||||||
Operating earnings (loss) | 3,358 | 1,117 | (215 | ) | ||||||||
Other income | 53 | 50 | 2 | |||||||||
Interest expense | (670 | ) | (470 | ) | (310 | ) | ||||||
Earnings (loss) before income taxes | 2,741 | 697 | (523 | ) | ||||||||
Income tax (benefit) expense | 902 | 288 | (488 | ) | ||||||||
Earnings (loss) before minority interests | 1,839 | 409 | (35 | ) | ||||||||
Minority Interests in subsidiaries | (299 | ) | (216 | ) | (112 | ) | ||||||
Net earnings (loss) | $ | 1,540 | $ | 193 | $ | (147 | ) | |||||
Net earnings (loss) per share | ||||||||||||
Basic | $ | 0.62 | $ | 0.08 | $ | (0.06 | ) | |||||
Diluted | $ | 0.62 | $ | 0.08 | $ | (0.06 | ) | |||||
Weighted average number of | ||||||||||||
Common shares outstanding | ||||||||||||
Basic | 2,493 | 2,492 | 2,491 | |||||||||
Diluted | 2,495 | 2,493 | 2,495 | |||||||||
The accompanying Notes are an integral part of these Consolidated Financial Statements.
20
KEWAUNEE SCIENTIFIC CORPORATION
CONSOLIDATED STATEMENTS OF STOCKHOLDERS’ EQUITY
Kewaunee Scientific Corporation
$ in thousands, except per share data | Common Stock | Additional Paid-in Capital | Retained Earnings | Accumulated Other Comprehensive Income (Loss) | Treasury Stock | Total Stockholders’ Equity | |||||||||||||||||||||||||||||||||||||||
Balance at April 30, 2003 | $ | 6,550 | $ | 145 | $ | 20,110 | $ | (9 | ) | $ | (858 | ) | $ | 25,938 | |||||||||||||||||||||||||||||||
Net earnings | — | — | 1,462 | — | — | 1,462 | |||||||||||||||||||||||||||||||||||||||
Cash dividends declared, $.28 per share | — | — | (696 | ) | — | — | (696 | ) | |||||||||||||||||||||||||||||||||||||
Stock options exercised, 7,525 shares | — | (4 | ) | — | — | 46 | 42 | ||||||||||||||||||||||||||||||||||||||
Foreign currency translation adjustments | — | — | — | 27 | — | 27 | |||||||||||||||||||||||||||||||||||||||
Change in fair value of cash flow hedge, net of tax | — | — | — | 18 | — | 18 | |||||||||||||||||||||||||||||||||||||||
$ in thousands, except per share amounts | Common Stock | Additional Paid-in Capital | Retained Earnings | Accumulated Other Comprehensive Income (Loss) | Treasury Stock | Total Stockholders’ Equity | |||||||||||||||||||||||||||||||||||||||
Balance at April 30, 2004 | $ | 6,550 | $ | 141 | $ | 20,876 | $ | 36 | $ | (812 | ) | $ | 26,791 | $ | 6,550 | $ | 141 | $ | 20,876 | $ | 36 | $ | (812 | ) | $ | 26,791 | |||||||||||||||||||
Net loss | — | — | (147 | ) | — | — | (147 | ) | — | — | (147 | ) | — | — | (147 | ) | |||||||||||||||||||||||||||||
Cash dividends declared, $.28 per share | — | — | (698 | ) | — | — | (698 | ) | — | — | (698 | ) | — | — | (698 | ) | |||||||||||||||||||||||||||||
Stock options exercised, 3,500 shares | — | 3 | — | — | 22 | 25 | — | 3 | — | — | 22 | 25 | |||||||||||||||||||||||||||||||||
Foreign currency translation adjustments | — | — | — | 7 | — | 7 | — | — | — | 7 | — | 7 | |||||||||||||||||||||||||||||||||
Change in fair value of cash flow hedge, net of tax | — | — | — | 11 | — | 11 | — | — | — | 11 | — | 11 | |||||||||||||||||||||||||||||||||
Balance at April 30, 2005 | $ | 6,550 | $ | 144 | $ | 20,031 | $ | 54 | $ | (790 | ) | $ | 25,989 | 6,550 | 144 | 20,031 | 54 | (790 | ) | 25,989 | |||||||||||||||||||||||||
Net Earnings | — | — | 193 | — | — | 193 | |||||||||||||||||||||||||||||||||||||||
Net earnings | — | — | 193 | — | — | 193 | |||||||||||||||||||||||||||||||||||||||
Cash dividends declared, $.28 per share | — | — | (698 | ) | — | — | (698 | ) | — | — | (698 | ) | — | — | (698 | ) | |||||||||||||||||||||||||||||
Stock options exercised, 500 shares | — | — | — | — | 3 | 3 | — | — | — | — | 3 | 3 | |||||||||||||||||||||||||||||||||
Foreign currency translation adjustments | — | — | — | 57 | — | 57 | — | — | — | 57 | — | 57 | |||||||||||||||||||||||||||||||||
Change in fair value of cash Flow hedge, net of tax | — | — | — | 2 | — | 2 | |||||||||||||||||||||||||||||||||||||||
Change in fair value of cash flow hedge, net of tax | — | — | — | 2 | — | 2 | |||||||||||||||||||||||||||||||||||||||
Balance at April 30, 2006 | $ | 6,550 | $ | 144 | $ | 19,526 | $ | 113 | $ | (787 | ) | $ | 25,546 | 6,550 | 144 | 19,526 | 113 | (787 | ) | 25,546 | |||||||||||||||||||||||||
Net earnings | — | — | 1,540 | — | — | 1,540 | |||||||||||||||||||||||||||||||||||||||
Cash dividends declared, $.28 per share | — | — | (698 | ) | — | — | (698 | ) | |||||||||||||||||||||||||||||||||||||
Stock options exercised, 2,500 shares | — | 11 | — | — | 16 | 27 | |||||||||||||||||||||||||||||||||||||||
Foreign currency translation adjustments | — | — | — | 166 | — | 166 | |||||||||||||||||||||||||||||||||||||||
Cumulative effect of adoption of SAB No. 108 | (421 | ) | (421 | ) | |||||||||||||||||||||||||||||||||||||||||
Adoption of SFAS No. 158, net of tax | — | — | — | (2,112 | ) | — | (2,112 | ) | |||||||||||||||||||||||||||||||||||||
Balance at April 30, 2007 | $ | 6,550 | $ | 155 | $ | 19,947 | $ | (1,833 | ) | $ | (771 | ) | $ | 24,048 | |||||||||||||||||||||||||||||||
The accompanying Notes are an integral part of these Consolidated Financial Statements.
21
KEWAUNEE SCIENTIFIC CORPORATION
April 30 | Kewaunee Scientific Corporation | |||||
$ and shares in thousands, except per share amounts | 2006 | 2005 | 2007 | 2006 | ||||||||||||
ASSETS | ||||||||||||||||
Current Assets | ||||||||||||||||
Cash and cash equivalents | $ | 929 | $ | 225 | $ | 2,231 | $ | 929 | ||||||||
Restricted cash | 399 | 379 | 372 | 399 | ||||||||||||
Receivables, less allowance: $450 (2006); $688 (2005) | 23,199 | 21,683 | ||||||||||||||
Receivables, less allowance: $262 (2007); $450 (2006) | 19,061 | 23,199 | ||||||||||||||
Inventories | 5,860 | 3,542 | 5,869 | 5,860 | ||||||||||||
Deferred income taxes | 378 | 456 | 297 | 378 | ||||||||||||
Prepaid income taxes | — | 94 | ||||||||||||||
Prepaid expenses and other current assets | 633 | 401 | 684 | 633 | ||||||||||||
Total Current Assets | 31,398 | 26,780 | 28,514 | 31,398 | ||||||||||||
Property, Plant and Equipment | ||||||||||||||||
Land | 41 | 41 | ||||||||||||||
Buildings and improvements | 9,552 | 9,665 | ||||||||||||||
Machinery and equipment | 25,828 | 24,761 | ||||||||||||||
Property, plant and equipment | 35,421 | 34,467 | ||||||||||||||
Accumulated depreciation | (24,258 | ) | (23,737 | ) | ||||||||||||
Net Property, Plant and Equipment | 11,163 | 10,730 | ||||||||||||||
Property, Plant and Equipment, Net | 11,255 | 11,163 | ||||||||||||||
Other Assets | ||||||||||||||||
Prepaid pension cost | 4,898 | 4,731 | 1,911 | 4,898 | ||||||||||||
Property held for sale | — | 1,450 | ||||||||||||||
Deferred income taxes | 129 | — | ||||||||||||||
Other | 3,013 | 2,521 | 3,431 | 3,013 | ||||||||||||
Total Other Assets | 7,911 | 8,702 | 5,471 | 7,911 | ||||||||||||
Total Assets | $ | 50,472 | $ | 46,212 | $ | 45,240 | $ | 50,472 | ||||||||
LIABILITIES AND STOCKHOLDERS’ EQUITY | ||||||||||||||||
Current Liabilities | ||||||||||||||||
Short-term borrowings | $ | 8,216 | $ | 3,778 | $ | 3,489 | $ | 8,216 | ||||||||
Current portion of long-term debt | — | 931 | ||||||||||||||
Current obligations under capital leases | 260 | 111 | 360 | 260 | ||||||||||||
Accounts payable | 9,074 | 8,558 | 8,437 | 9,074 | ||||||||||||
Employee compensation and amounts withheld | 1,297 | 1,113 | 1,416 | 1,297 | ||||||||||||
Deferred revenue | 535 | 1,261 | 1,672 | 535 | ||||||||||||
Other accrued expenses | 991 | 647 | 809 | 991 | ||||||||||||
Total Current Liabilities | 20,373 | 16,399 | 16,183 | 20,373 | ||||||||||||
Obligations under capital leases | 583 | 307 | 476 | 583 | ||||||||||||
Deferred income taxes | 247 | 391 | — | 247 | ||||||||||||
Accrued employee benefit plan costs | 2,905 | 2,524 | 3,351 | 2,905 | ||||||||||||
Other long-term liabilities | — | 2 | ||||||||||||||
Minority interest in subsidiaries | 818 | 600 | 1,182 | 818 | ||||||||||||
Total Liabilities | 24,926 | 20,223 | 21,192 | 24,926 | ||||||||||||
Commitments and Contingencies (Note 7) | ||||||||||||||||
Stockholders’ Equity | ||||||||||||||||
Common stock, $2.50 par value, Authorized—5,000 shares; | 6,550 | 6,550 | ||||||||||||||
Common stock, $2.50 par value, Authorized- 5,000 shares; | ||||||||||||||||
Issued- 2,620 shares; Outstanding-2,495 shares (2007) 2,492 shares (2006) | 6,550 | 6,550 | ||||||||||||||
Additional paid-in-capital | 144 | 144 | 155 | 144 | ||||||||||||
Retained earnings | 19,526 | 20,031 | 19,947 | 19,526 | ||||||||||||
Accumulated other comprehensive income | 113 | 54 | ||||||||||||||
Common stock in treasury, at cost: 128 shares (2006 and 2005) | (787 | ) | (790 | ) | ||||||||||||
Accumulated other comprehensive income (loss) | (1,833 | ) | 113 | |||||||||||||
Common stock in treasury, at cost: 125 shares (2007); 128 shares (2006) | (771 | ) | (787 | ) | ||||||||||||
Total Stockholders’ Equity | 25,546 | 25,989 | 24,048 | 25,546 | ||||||||||||
Total Liabilities and Stockholders’ Equity | $ | 50,472 | $ | 46,212 | $ | 45,240 | $ | 50,472 | ||||||||
The accompanying Notes are an integral part of these Consolidated Financial Statements.
22
KEWAUNEE SCIENTIFIC CORPORATION
CONSOLIDATED STATEMENTS OF CASH FLOWS
Years Ended April 30 | Kewaunee Scientific Corporation |
$ in thousands | 2006 | 2005 | 2004 | 2007 | 2006 | 2005 | ||||||||||||||||||
Cash Flows from Operating Activities | ||||||||||||||||||||||||
Net earnings (loss) | $ | 193 | $ | (147 | ) | $ | 1,462 | $ | 1,540 | $ | 193 | $ | (147 | ) | ||||||||||
Adjustments to reconcile net earnings (loss) to net cash | ||||||||||||||||||||||||
Adjustments to reconcile net earnings (loss) to net cash | ||||||||||||||||||||||||
Provided by (used in) operating activities: | ||||||||||||||||||||||||
Depreciation | 2,027 | 2,048 | 2,048 | 1,952 | 2,027 | 2,048 | ||||||||||||||||||
Bad debt provision | 288 | 520 | 454 | 136 | 288 | 520 | ||||||||||||||||||
Increase in deferred income tax expense | (66 | ) | (561 | ) | (565 | ) | ||||||||||||||||||
Provision (benefit) for deferred income tax expense | 541 | (66 | ) | (562 | ) | |||||||||||||||||||
Gain on disposal of property, plant and equipment | (884 | ) | — | — | — | (884 | ) | — | ||||||||||||||||
Decrease (increase) in prepaid income taxes | 94 | 71 | 1,334 | — | 94 | 71 | ||||||||||||||||||
(Increase) decrease in receivables | (1,804 | ) | 2,784 | (9,303 | ) | |||||||||||||||||||
Decrease (increase) in receivables | 4,002 | (1,804 | ) | 2,784 | ||||||||||||||||||||
(Increase) decrease in inventories | (2,318 | ) | 743 | 1,673 | (9 | ) | (2,318 | ) | 743 | |||||||||||||||
(Increase) decrease in prepaid pension cost | (167 | ) | (1,861 | ) | 36 | |||||||||||||||||||
Increase in prepaid pension cost | (382 | ) | (167 | ) | (1,861 | ) | ||||||||||||||||||
(Decrease) increase in accounts payable and other accrued expenses | 3,345 | (1,636 | ) | 1,114 | (700 | ) | 3,345 | (1,636 | ) | |||||||||||||||
(Decrease) increase in deferred revenue | (726 | ) | 109 | 296 | ||||||||||||||||||||
Increase (decrease) in deferred revenue | 1,137 | (726 | ) | 109 | ||||||||||||||||||||
Other, net | (228 | ) | 1,073 | 508 | 488 | (228 | ) | 1,074 | ||||||||||||||||
Net cash (used in) provided by operating activities | (246 | ) | 3,143 | (943 | ) | |||||||||||||||||||
Net cash provided by (used in) operating activities | 8,705 | (246 | ) | 3,143 | ||||||||||||||||||||
Cash Flows from Investing Activities | ||||||||||||||||||||||||
Capital expenditures | (1,886 | ) | (976 | ) | (1,619 | ) | (1,724 | ) | (1,886 | ) | (976 | ) | ||||||||||||
Proceeds from sale of property, plant and equipment | 2,500 | — | — | — | 2,500 | — | ||||||||||||||||||
Increase in restricted cash | (20 | ) | (17 | ) | (186 | ) | ||||||||||||||||||
Increase (decrease) in restricted cash | 27 | (20 | ) | (17 | ) | |||||||||||||||||||
Net cash provided by (used in) investing activities | 594 | (993 | ) | (1,805 | ) | |||||||||||||||||||
Net cash (used in) provided by investing activities | (1,697 | ) | 594 | (993 | ) | |||||||||||||||||||
Cash Flows from Financing Activities | ||||||||||||||||||||||||
(Decrease) increase in bank overdraft | (2,301 | ) | 2,301 | (1,836 | ) | — | (2,301 | ) | 2,301 | |||||||||||||||
Dividends paid | (698 | ) | (698 | ) | (696 | ) | (698 | ) | (698 | ) | (698 | ) | ||||||||||||
Net increase (decrease) in short-term borrowings | 4,438 | (3,218 | ) | 5,580 | ||||||||||||||||||||
Proceeds from long-term debt | — | — | 1,200 | |||||||||||||||||||||
Net (decrease) increase in short-term borrowings | (4,727 | ) | 4,438 | (3,218 | ) | |||||||||||||||||||
Payments on long-term debt | (931 | ) | (1,118 | ) | (1,081 | ) | — | (931 | ) | (1,118 | ) | |||||||||||||
Payments of capital leases | (155 | ) | (22 | ) | — | (308 | ) | (155 | ) | (22 | ) | |||||||||||||
Proceeds from exercise of stock options (including tax benefit) | 3 | 25 | 42 | 27 | 3 | 25 | ||||||||||||||||||
Net cash provided by (used in) financing activities | 356 | (2,730 | ) | 3,209 | ||||||||||||||||||||
Net cash (used in) provided by financing activities | (5,706 | ) | 356 | (2,730 | ) | |||||||||||||||||||
Increase (decrease) in Cash and Cash Equivalents | 704 | (580 | ) | 461 | 1,302 | 704 | (580 | ) | ||||||||||||||||
Cash and Cash Equivalents at Beginning of Year | 225 | 805 | 344 | 929 | 225 | 805 | ||||||||||||||||||
Cash and Cash Equivalents at End of Year | $ | 929 | $ | 225 | $ | 805 | $ | 2,231 | $ | 929 | $ | 225 | ||||||||||||
Supplemental Disclosure of Cash Flow Information | ||||||||||||||||||||||||
Interest paid | $ | 388 | $ | 314 | $ | 289 | $ | 678 | $ | 388 | $ | 314 | ||||||||||||
Income taxes paid (refunded) | $ | (145 | ) | $ | 40 | $ | (506 | ) | 19 | (145 | ) | 40 | ||||||||||||
Purchase of fixed assets under capital leases | $ | 580 | $ | 440 | — | 300 | 580 | 440 | ||||||||||||||||
The accompanying Notes are an integral part of these Consolidated Financial Statements.
23
NOTES TO CONSOLIDATED FINANCIAL STATEMENTS
Note 1—Summary of Significant Accounting Policies
Kewaunee Scientific Corporation (the “Company”) is a manufacturer of laboratory and technical furniture, including steel and wood laboratory cabinetry, fume hoods, flexible systems, worksurfaces, workstations, workbenches, and computer enclosures. The Company’s sales are made through purchase orders and contracts submitted by customers, its dealers and agents, a national stocking distributor, competitive bids submitted by the Company, and its subsidiaries located in Singapore and Bangalore, India. The majority of the Company’s products are sold to customers located in North America, primarily within the United States. The Company’s laboratory products are used in chemistry, physics, biology, and other general science laboratories in the pharmaceutical, biotechnology, industrial, chemical, commercial, educational, government, and health care markets. Technical products are used in manufacturing facilities ofmanufacturing computers and light electronics, and by users of computer and networking furniture.
Principles of Consolidation The Company’s consolidated financial statements include the accounts of Kewaunee Scientific Corporation and its three international subsidiaries. A brief description of each subsidiary, along with the amount of the Company’s controlling financial interests, is as follows: (1) Kewaunee Labway Asia Pte. Ltd., a dealer for the Company’s products in Singapore, is 51% owned by the Company; (2) Kewaunee Labway Scientific India Pvt. Ltd., a dealer for the Company’s products in Bangalore, India, is 95% owned by Kewaunee Labway Asia; and (3) Kewaunee Scientific Corporation India Pvt. Ltd. in Bangalore, India, ana manufacturing and assembly operation, is 100% owned by the Company. All intercompany balances, transactions, and profits have been eliminated. Included in the consolidated balance sheets are net assets of $5,988,000$2,031,000 and $3,220,000$1,203,000 at April 30, 20062007 and 2005,2006, respectively, of the Company’s subsidiaries. Net sales by the Company’s subsidiaries in the amount of $14,856,000, $12,044,000, $5,642,000, and $6,178,000$5,643,000 were included in the consolidated statement of operations.operations for fiscal years 2007, 2006, and 2005, respectively.
Cash and Cash Equivalents Cash and cash equivalents consist of cash on hand and highly liquid investments with original maturities of three months or less. At April 30, 2005, $2.3 million of outstanding checks in excess of offsetting cash balances were included in accounts payable in the accompanying consolidated balance sheet. During the years ended April 30, 20062007 and 2005,2006, the Company had cash deposits in excess of FDIC insured limits. The Company has not experienced any losses from such deposits.
Restricted Cash Restricted cash includes bank deposits of a subsidiary used for performance guarantees against customer orders.
Allowance for Doubtful AccountsThe Company evaluates the collectibility of its trade accounts receivable based on a number of factors. In circumstances where management is aware of a customer’s inability to meet theirits financial obligations to the Company, or a project dispute makes it unlikely that all of the receivable owed by a customer will be collected, a specific reserve for bad debts is estimated and recorded, to reduce the recognized receivable to the estimated amount the Company believes will ultimately be collected. In addition to specific customer identification of potential bad debts, a general reserve for bad debts is estimated and recorded based on the customer’s recent past loss history and an overall assessment of past due trade accounts receivable amounts outstanding. Accounts are written off when it is clearly established that the receivable is a bad debt.
InventoriesInventories are valued at the lower of cost or market. The cost of the majority of inventories is measured on the last in, first out (“LIFO”) method. The LIFO method allocates the most recent costs to cost of products sold; and, therefore, recognizes into operating results fluctuations in
24
costs of raw materials and other inventoriable costs more quickly than other methods. Other inventories consisted of foreign inventories and are measured at actual cost.
Property, Plant and EquipmentProperty, plant and equipment are stated at cost less accumulated depreciation. Depreciation is determined for financial reporting purposes principally on the straight-line method over the estimated useful lives of the individual assets or, for leaseholds, over the terms of the related leases, if shorter. The lives, by category, generally are as follows: buildingsProperty, plant and improvements, 10-40 years; leasehold improvements, 10 years; furniture, fixtures, and office equipment 3-5 years; computer equipment, 3-5 years; factory machinery and vehicles, 5-10 years. consisted of the following at April 30:
$ in thousands | 2007 | 2006 | Useful Life | |||||||
Land | $ | 41 | $ | 41 | ||||||
Building and improvements | 9,932 | 9,552 | 10-40 years | |||||||
Machinery and equipment | 27,123 | 25,828 | 5-10 years | |||||||
Total | 37,086 | 35,421 | ||||||||
Less accumulated depreciation | (25,841 | ) | (24,258 | ) | ||||||
Net property, plant & equipment | $ | 11,255 | $ | 11,163 | ||||||
Management reviews the carrying value of property, plant and equipment for impairment whenever changes in circumstances or events indicate that such carrying value may not be recoverable. If projected undiscounted cash flows are not sufficient to recover the carrying value of the potentially impaired asset the carrying value is reduced to fair value. At April 30, 20062007 and 2005,2006, equipment financed under capital leases with a cost of $1,020,000$1,320,000 and $440,000,$1,020,000, respectively, was included in machinery and equipment.
Other Assets Other assets at April 30, 2007 and 2006 include $3,284,000 and 2005 include $2,856,000, and $2,380,000, respectively, of assets held in a trust account for non-qualified benefit plans and $156,000$147,000 and $141,000,$156,000, respectively, of cash surrender values of life insurance policies.
Use of Estimates The presentation of financial statements in conformity with generally accepted accounting principles in the United States of America requires management to make estimates and assumptions that affect the amounts reported in the financial statements and accompanying notes. Actual results could differ from these estimates. Significant estimates impacting the accompanying financial statements include the allowance for uncollectible accounts receivable, inventory valuation, and pension liabilities.
Fair Value of Financial Instruments Financial instruments include cash and cash equivalents, mutual funds, cash surrender value of life insurance policies, long-term debt, and short-term borrowings. Management believes the carrying value of these assets and liabilities approximate their fair value.
Sales Recognition Product sales are generally recognized at the date of shipment, or when customers have purchased and accepted title to the goods, but because of construction delays, have requested that the Company temporarily store the finished goods on the customer’s behalf. Deferred revenue consists of customer deposits and advance billings of the Company’s products where sales have not yet been recognized. Service revenue for installation of product sold is recognized as the installation services are performed. Accounts receivable includes retainage in the amounts of $2,604,000$1,689,000 and $2,593,000$2,604,000 at April 30, 20062007 and 2005,2006, respectively. Shipping and handling costs are included in cost of sales. Because of the nature and quality of the Company’s products, any warranty issues are determined in a relatively short period after the sale and are infrequent in nature, and as such, warranty costs are expensed as incurred.
Product sales resulting from fixed-price construction contracts involve a signed contract for a fixed price to provide the Company’s laboratory furniture and fume hoods for a construction project. The Company is usually in the role asof a subcontractor, but in some cases may enter into a contract directly with the end-user of the products. Product sales resulting from fixed-price construction contracts are generated from multiple-element arrangements that require separate units of accounting and estimates regarding the fair value of individual elements. The Company has determined that its multiple-element arrangements that qualify as separate units of accounting are: product sales and installation services. Each of these elements represent individual units of accounting as the delivered item has value to a
25
customer on a stand-alone basis, objective and reliable evidence of fair value exists for undelivered items, and arrangements normally do not contain a general right of return relative to the delivered item. The Company determines fair value based on the price of the deliverable when it is sold separately or based on third-party evidence. In accordance with the guidance in EITF 00-21, the Company uses the residual method to allocate the arrangement consideration when the arrangement does not indicate fair value of the product sale. Under the residual method, the amount of consideration allocated to the delivered item equals the total arrangement consideration less the aggregate fair value of the undelivered items. Assuming all other criteria for revenue recognition have been met, the Company recognizes revenue for product sales at the date of shipment.
Product sales resulting from purchase orders involve a purchase order received by the Company from its dealers or its stocking distributor. This category includes product sales for standard products, as well as products which require some customization. These sales are recognized under the terms of the purchase order which generally are freight on board (“FOB”) shipping point and do not include rights of return. Accordingly, sales are recognized at the time of shipment.
Credit Concentration Credit risk is generally not concentrated with any one customer or industry, although the Company does enter into large contracts with individual customers from time-to-time. The Company performs credit evaluations of its customers. Revenues from the Company’s national stocking distributor, VWR International, represented 14%13%, 15%14%, and 11%15% of the Company’s total sales in fiscal years 2007, 2006, 2005, and 2004,2005, respectively.
Income Taxes Deferred income taxes reflect the net tax effects of temporary differences between the carrying amounts of assets and liabilities for financial reporting purposes and the amounts used for income tax purposes.
Advertising Costs Advertising costs are expensed as incurred, including trade shows, training materials, sales samples, and other related expenses. Advertising costs for the years ended April 30, 2007, 2006, and 2005 were $208,000, $282,000, and 2004 were $282,000, $329,000, and $219,000, respectively.
Property Held for Sale Property held for sale at April 30, 2005 consisted primarily of land and buildings in Lockhart, Texas. This property was the site of the Company’s Texas operation that was relocated to Statesville, North Carolina in the fourth quarter of fiscal year 2003. On May 13, 2005, the Company completed the sale of these buildings and land to a non-affiliated third party for $2,500,000 in cash. The sale was recorded in the Company’s fiscal year 2006 first quarter ending July 31, 2005 and resulted in a pretax gain of approximately $884,000, which was recorded as other operating income and resulted in an after-tax gain of approximately $540,000.
Derivative Financial Instruments The Company records derivatives on the balance sheet at fair value and establishestablishes criteria for designation and effectiveness of hedging relationships. The nature of the Company’s business activities involves the management of various financial and market risks, including those related to changes in interest rates. The Company doesemploys derivative financial instruments, such as interest rate swap contracts, are employed to mitigate certain of those risks. The Company does not enter into derivative instruments for speculative purposes. There were no derivative financial instruments as of April 30, 2007.
Foreign Currency Translation The financial statements of subsidiaries located outside the United States are measured using the local currency as the functional currency. Balance sheet accountsAssets and liabilities of the Company’s foreign subsidiaries are translated into United States dollars at year-end exchange rates. IncomeSales, expenses, and expense itemscash flows are translated at weighed average exchange rates for each period. Net translation gains or losses are included in other comprehensive income, a separate component of stockholders’ equity. The Company does not provide for U.S. income taxes on foreign currency translation adjustments, since
26
it does not provide for such taxes on undistributed earnings of foreign subsidiaries. Gains and losses from foreign currency transactions of these subsidiaries are included in net earnings.
Earnings Per Share Basic earnings per share is based on the weighted average number of common shares outstanding during the year. Diluted earnings per share reflects the assumed exercise and conversion of outstanding options under the Company’s stock option plans, except when options have an antidilutive effect. Options to purchase 151,600 and 160,60027,500 shares of common stock at a price of $12.00 and 151,600 shares at prices of $9.10 to $12.00 were outstanding at April 30, 20062007 and 2005,2006, respectively, but were not included in the computation of diluted EPS because the optionsoption exercise prices were greater than the average market price of the common shares at that date.date, and, accordingly, such options would have an antidilutive effect.
Accounting for Stock Options ThePrior to May 1, 2006, the Company accountsaccounted for stock options granted to employees and directorsits stock-based compensation using the intrinsic value method. Under this method no compensation expense is recorded since the exercise price of the stock options is equal to the market price of the underlying stock on the grant date. The Company did not grant any stock options during fiscal years 2006, 2005, and 2004. The estimated weighted average fair value of options granted under the Company’s stock option plans were valued using the Black-Scholes option-pricing models based upon the input of highly subjective assumptions including the expected stock price volatility. Had compensation expense for the stock options issued been determined consistent with FASB Statement No. 123, “Accounting for Stock-Based Compensation,” as amended by SFAS 148, “Accounting for Stock-Based Compensation— Transition and Disclosure,” issued in December 2002, net earnings (loss) and net earnings (loss) per share would have been reduced to the following pro forma amounts:
$ in thousands, except per share amounts | 2006 | 2005 | 2004 | ||||||||
Net earnings (loss) as reported | $ | 193 | $ | (147 | ) | $ | 1,462 | ||||
Pro forma compensation cost | — | (23 | ) | (62 | ) | ||||||
Net earnings (loss) pro forma | $ | 193 | $ | (170 | ) | $ | 1,400 | ||||
Net earnings (loss) per share—Basic | |||||||||||
As reported | $ | 0.08 | $ | (0.06 | ) | $ | 0.59 | ||||
Pro forma | $ | 0.08 | $ | (0.07 | ) | $ | 0.56 | ||||
Net earnings (loss) per share—Diluted | |||||||||||
As reported | $ | 0.08 | $ | (0.06 | ) | $ | 0.59 | ||||
Pro forma | $ | 0.08 | $ | (0.07 | ) | $ | 0.56 | ||||
Segment Reporting Financial Accounting Standards BoardPrinciples Bulletin (“FASB”APB”) Statement of Financial Accounting Standards (“SFAS”) No. 131, “Disclosure About Segments of an Enterprise and Related Information,” establishes standards for the way that public companies report information about products and services, geographic areas, and major customers. The Company has reviewed SFAS No. 131 and determined that it has a single reportable segment.
New Accounting Standards In May 2005, the FASB issued SFAS No. 154, “Accounting Changes and Error Corrections.” SFAS No. 154 replaces APB No. 20, “Accounting Changes,” and SFAS No. 3, “Reporting Accounting Changes in Interim Financial Statements,” and established retrospective application of a change in accounting principle. SFAS No. 154 provides guidance for determining whether retrospective application is impracticable. The reporting of a correction of an error by restating previously issued financial statements is also addressed. SFAS No. 154 is effective for fiscal periods beginning after December 15, 2005. The Company will adopt SFAS No. 154 in fiscal year 2007 and believes that it will not have a material impact on its financial condition or results of operations.
In December 2004, the FASB issued SFAS No. 123(R), “Share-Based Payment,” which is a revision of SFAS No. 123, “Accounting for Stock Based Compensation.” SFAS No. 123(R) supersedes
27
APB Opinion No. 25, “Accounting for Stock Issued to Employees,” and related interpretations, and requires all companies to estimate the fair value of incentive stock options granted and then amortize that estimated fair value to expense over the options vesting period.interpretations. The Company currently accountsprovided pro forma disclosure in accordance with SFAS No. 148, “Accounting for stock option plans underStock-Based Compensation-Transition and Disclosure,” as if the recognition and measurement principlesfair-value method of SFAS No. 123, “Accounting for Stock-Based Compensation,” had been applied to stock-based compensation. In accordance with APB Opinion No. 25. No employee or outside director25, no stock-based compensation costs related to stock option grants are currentlycost was reflected in the Company’s prior year net income as all option awardsfor grants of stock options to employees because the Company granted under those plans hadstock options with an exercise price equal to the market value of the stock on the date of grant. Through fiscal year 2003, the Company used stock options as its primary long-term incentive plan for officers. The Company has not granted any stock options since fiscal year 2003.
Had the Company used the fair-value based accounting method for stock compensation expense prescribed by SFAS Nos. 123 and 148 for the fiscal years ended April 30, 2006 and 2005, the Company’s net earnings would have been reduced to the pro forma amounts set forth below:
$ in thousands, except per share amounts | 2006 | 2005 | |||||
Net earnings (loss) as reported | $ | 193 | $ | (147 | ) | ||
Pro forma compensation cost | — | (23 | ) | ||||
Net earnings (loss) pro forma | $ | 193 | $ | (170 | ) | ||
Net earnings (loss) per share – Basic | |||||||
As reported | $ | 0.08 | $ | (0.06 | ) | ||
Pro forma | 0.08 | (0.07 | ) | ||||
Net earnings (loss) per share – Diluted | |||||||
As reported | $ | 0.08 | $ | (0.06 | ) | ||
Pro forma | 0.08 | (0.07 | ) | ||||
Effective May 1, 2006, the Company adopted the fair-value recognition provisions of SFAS No. 123(R), “Share-Based Payment,” using the modified prospective transition method and, therefore, has not restated results for prior periods. Under this transition method, the Company recorded stock-based compensation expense for the fiscal year ended April 30, 2007 of $1,000 for all stock-based compensation awards granted prior to, but not yet vested as of, April 30, 2006, based on the grant date fair value estimated in accordance with the original provisions of SFAS No. 123.
Adoption of SEC Staff Accounting Bulletin (“SAB”) No. 108 In September 2006, the SEC staff released Staff Accounting Bulletin No. 108, “Considering the Effects of Prior Year Misstatements When Quantifying Misstatements in Current Year Financial Statements” (“SAB 108”). SAB 108 was issued in order to eliminate the diversity of practice surrounding how public companies quantify financial statement misstatements. Traditionally, there have been two widely-recognized methods of quantifying the effects of financial statement misstatements: the “roll-over” method and the “iron curtain” method. The roll-over method focuses primarily on the impact of a misstatement on the income statement, including the reversing effect of prior year misstatements, but its use can lead to the accumulation of misstatements in the balance sheet. The iron curtain method focuses primarily on the effect of correcting the period-end balance sheet with less emphasis on the reversing effects of prior year errors on the income statement.
In SAB 108, the SEC staff established an approach that required quantification of financial statement misstatements based on the effect of the misstatements on each of the Company’s financial statements and the related financial statement disclosures. This model is commonly referred to as a “dual approach” because it requires quantification of errors under both the iron curtain and the roll-over methods.
SAB 108 permits public companies to initially apply its provisions either by (i) restating prior financial statements as if the “dual approach” had always been used or (ii) recording the cumulative effect of initially applying the “dual approach” as adjustments to the carrying values of assets and liabilities as of May 1, 2006 with an offsetting adjustment recorded to the opening balance of retained earnings.
During fiscal years 1998 through 2006 the Company overstated deferred income tax assets by a cumulative total amount of $421,000. Subsequent to the years in which the overstatements occurred, the Company discovered the errors and determined they were not material to the Company’s financial statements for the years in which they occurred. The Company elected to apply SAB 108 to correct the errors using the cumulative effect transition method.
The following table summarizes the effects on the related account balances of applying the guidance in SAB 108 as of May 1, 2006:
| Origination Period of Misstatement | ||||||||||||
$ in thousands | Adjustment | Years ended April 30 | ||||||||||
| at May 1, 2006 | 2006 | 2005 | 2004 and Prior | |||||||||
Decrease in deferred income tax assets | $ | 421 | $ | 45 | $ | 61 | $ | 315 | ||||
Decrease in net income | — | 45 | 61 | 315 | ||||||||
Decrease in retained earnings | 421 | — | — | — | ||||||||
New Accounting StandardsIn June 2006, the FASB issued Interpretation No. 48, “Accounting for Uncertainty in Income Taxes” (FIN 48” or the “Interpretation”) which defines the threshold for recognizing the benefits of tax return positions in the financial statements as “more-likely-than-not” to be sustained by the taxing authority. “Uncertainty in Income Taxes,” as used in the title of the new Interpretation, refers to uncertainty about how some transactions will be treated under the tax law. This uncertainty leads to questions about whether tax positions taken or to be taken on tax returns should be reflected in the financial statements before they are finally resolved with the taxing authorities. FIN 48 applies to all tax positions, regardless of their level of uncertainty or the nature of the position. However, the Interpretation’s recognition and measurement requirements are likely to have the most impact on positions for which current or future deductions may be disallowed or reduced in a tax examination. The Interpretation applies to situations where the uncertainty is about the timing of the deduction, the amount of the deduction, or the validity of the deduction. FIN 48 is effective for fiscal years beginning after JuneDecember 15, 2005. The2006, and the Company will adopt SFAS No. 123(R) inthis Interpretation during the first quarter of fiscal year 2007 and believes2008. The Company has not yet determined the effect, if any, that itthe adoption of FIN 48 will not have a material impact on its consolidated financial conditionposition or results of operations.
In December 2004,September 2006, the FASB issued SFAS No. 153, “Exchanges157, “Fair Value Measurement” (“SFAS 157”), which establishes a single authoritative definition of Nonmonetary Assets, an amendment of APB Opinion No. 29.” This statement addresses the measurement of exchanges of nonmonetary assets and redefines the scope of transactions that should be measured based on fair value, sets out a framework for measuring fair value, and requires additional disclosures about fair-value measurements in both annual and interim reports. SFAS 157 applies only to fair-value measurements that are already required or permitted by other accounting standards and is expected to increase the consistency of the assets exchanged.those measurements. SFAS No. 153157 is effective for fair-value measures already required or permitted by other standards for financial statements issued for fiscal periodsyears beginning after JuneNovember 15, 2005. The2007 and will be effective for the Company will adopt SFAS No. 153 in fiscal year 2007 and believes that it will not have a material impact on its financial condition or results of operations.
In December 2004, the FASB issued FASB Staff Position (FSP) 109-1, “Application of FASB Statement No. 109, Accounting for Income Taxes, to the Tax Deduction on Qualified Production Activities Provided by the American Jobs Creation Act of 2004,” and FSP 109-2, “Accounting and Disclosure Guidance for the Foreign Earnings Repatriation Provision within the American Jobs Creation Act of 2004 (the ACT).” These FSPs provide accounting and disclosure guidelines relative to the income tax deductions and repatriation provisions contained in the ACT. These FSPs were effective upon issuance.2009. The Company has not yet determined what impact,the effect, if any, that the ACT and these FSPs mayadoption of this standard will have on its consolidated financial position or results of operations.
In November 2004,September 2006, the FASB issued SFAS No. 151, “Inventory Costs, an Amendment158, “Employers’ Accounting for Defined Benefit Pension and Other Postretirement Plans” (“SFAS 158”), which requires employers to recognize on their balance sheets the funded status of ARB No. 43, Chapter 4.”pension and other postretirement benefit plans. SFAS No. 151 seeks158 also requires companies to clarifyrecognize actuarial gains and losses, prior service cost, and any remaining transition amounts from the accounting for abnormal amountsinitial application of idle facility expense, freight, handling costs,Statements 87 and wasted material in106 when recognizing a plan’s funded status, with the determinationoffset to accumulated other comprehensive income. The provisions of inventory carrying costs. This statement requires such costs to be treated as a current period expense. SFAS No. 151 is158 are effective for fiscal years beginningending after JuneDecember 15, 2005. The2006 and the Company will adopthas adopted this standard effective April 30, 2007. Adoption of this standard resulted in a $3.4 million decrease in other Non-Current Assets, a $2.1 million decrease in Other Comprehensive Income, a $1.1 million decrease in Deferred Tax Liabilities and a $129,000 increase in Deferred Tax Assets.
In February 2007, the FASB issued SFAS No. 151159, “the Fair Value Option for Financial Assets and Financial Liabilities” (“SFAS 159”), which allows measurement of specified financial instruments, warranty and insurance contracts at fair value on a contract by contract basis, with changes in fair value recognized in earnings in each period. SFAS 159 is effective at the beginning of the fiscal year that begins after November 15, 2007, and will be effective for the Company in fiscal year 2007 and believes2009. The Company has not yet determined the effect, if any, that itthe adoption of this standard will not have a material impact on its consolidated financial conditionposition or results of operations.
Note 2—Inventories
Inventories consisted of the following at April 30:
$ in thousands | 2006 | 2005 | 2007 | 2006 | ||||||||
Finished goods | $ | 1,653 | $ | 1,054 | $ | 1,243 | $ | 1,653 | ||||
Work-in-process | 745 | 929 | 1,257 | 745 | ||||||||
Materials and components | 3,462 | 1,559 | 3,369 | 3,462 | ||||||||
Total inventories | $ | 5,860 | $ | 3,542 | $ | 5,869 | $ | 5,860 | ||||
If inventories had been determined using the first-in, first-out (FIFO) method at April 30, 20062007 and 2005,2006, reported inventories would have been $2.0 million and $2.4 million greater.greater, respectively. During fiscal year 2007, the levels of inventories were reduced and the current year LIFO index was less than 100% due to lower material costs. This reduction resulted in a liquidation of LIFO inventory quantities carried at higher costs prevailing in prior years as compared with the cost of fiscal year 2007 purchases, the effect of which decreased the cost of sales by $413,000. During fiscal year 2006, the current year LIFO index was less than 100% which decreased the cost of sales by $52,000. During fiscal year 2005, inventories were reduced. This reduction resulted in a liquidation of LIFO inventory quantities carried at lower costs prevailing in prior years as compared with the cost of fiscal year 2005 purchases, the effect of which decreased cost of sales in fiscal year 2005 by $23,000.
28
Note 3—Long-term Debt and Other Credit Arrangements
In February 2001, the Company borrowed $3.1 million under a bank loan collateralized by certain machinery and equipment, with the loan repayable in 60 equal monthly installments plus interest. In February 2002, and June 2003, it borrowed an additional $250,000 and $1.2 million, respectively, under the loan, and the monthly payments were recalculated to amortize the loan balance over the remaining term of the original loan. At April 30, 2006, the loan had been fully satisfied. At April 30, 2005, the balance of the loan of $931,000 was payable within 12 months, and the net carrying value of collateralized assets under the loan was $2,946,000.
Monthly interest payments under the bank loan were calculated at the lower of (1) the LIBOR Market Index Rate plus 1.75%, or (2) the lender’s Prime Rate minus 0.75%. The borrowing rate was 4.75% at April 30, 2005. The loan included certain financial covenants as to tangible net worth, funds flow coverage, current ratio, and ratio of liabilities to tangible net worth.
The Company entered into an interest rate swap agreement in fiscal year 2002 to mitigate future fluctuations in interest rates. Under the agreement, $1.5 million of the outstanding principal amount of the bank loan effectively converted to a fixed rate of 6.37% on May 1, 2002. The notional amount of this interest rate hedge was reduced in the same proportion as the principal balance of the bank loan over the remaining term of the bank loan. The interest rate swap agreement matured February 28, 2006. The fair value of this cash flow hedge (net of tax) was a loss of $2,000 at April 30, 2005, which is reflected as an adjustment to stockholders’ equity in the consolidated financial statements.
The Company has an unsecured revolving credit facility for borrowings of up to $9$12 million that expires in December 2006.2007. There were advances of $8,216,000$3,489,000 outstanding under this facility as of April 30, 2006.2007. Monthly interest payments are payable under the facility calculated at the lower of (1) the LIBOR Market Index Rate plus 1.75%, or (2) the lender’s Prime Rate minus 1.00%. The borrowing rate was 6.75%7.07% and 4.85%6.75% at April 30, 2007 and 2006, and 2005, respectively. The loan includes a financial covenant with respect to the Company’s tangible net worth. At April 30, 2007 the Company was in compliance with the financial covenant.
In fiscal years 2007, 2006, and 2005, the Company entered into several lease arrangements to fund a new Enterprise Resource Planning (ERP) system that were classified as capital leases for accounting purposes. The lease arrangements were primarily for software costs and have a term of 44 months. Scheduled lease payments, including interest, are $329,000$431,000 for fiscal year 2007.2008.
Note 4—Income Taxes
Income tax expense (benefit) consisted of the following:
$ in thousands | 2006 | 2005 | 2004 | |||||||||
Current tax expense: | ||||||||||||
Federal | $ | 219 | $ | (114 | ) | $ | 993 | |||||
State and local | (215 | ) | (32 | ) | — | |||||||
Foreign | 350 | 220 | 160 | |||||||||
Total current tax expense | 354 | 74 | 1,153 | |||||||||
Deferred tax expense (benefit): | ||||||||||||
Foreign | (18 | ) | (1 | ) | — | |||||||
Federal | (307 | ) | (505 | ) | (142 | ) | ||||||
State and local | 259 | (56 | ) | (390 | ) | |||||||
Total deferred tax expense (benefit) | (66 | ) | (562 | ) | (532 | ) | ||||||
Net income tax expense (benefit) | $ | 288 | $ | (488 | ) | $ | 621 | |||||
29
$ in thousands | 2007 | 2006 | 2005 | |||||||||
Current tax expense (benefit): | ||||||||||||
Federal | $ | (72 | ) | $ | 219 | $ | (114 | ) | ||||
State and local | (4 | ) | (215 | ) | (32 | ) | ||||||
Foreign | 437 | 350 | 220 | |||||||||
Total current tax expense | 361 | 354 | 74 | |||||||||
Deferred tax expense (benefit): | ||||||||||||
Foreign | (5 | ) | (18 | ) | (1 | ) | ||||||
Federal | 438 | (307 | ) | (505 | ) | |||||||
State and local | 108 | 259 | (56 | ) | ||||||||
Total deferred tax expense (benefit) | 541 | (66 | ) | (562 | ) | |||||||
Net income tax expense (benefit) | $ | 902 | $ | 288 | $ | (488 | ) | |||||
The reasons for the differences between the above net income tax expense (benefit) and the amounts computed by applying the statutory federal income tax rates to earnings before income taxes are as follows:
$ in thousands | 2006 | 2005 | 2004 | 2007 | 2006 | 2005 | ||||||||||||||||||
Income tax expense (benefit) at statutory rate | $ | 237 | $ | (215 | ) | $ | 708 | $ | 834 | $ | 237 | $ | (215 | ) | ||||||||||
State and local taxes, net of federal income tax benefit (expense) | (59 | ) | (56 | ) | 96 | 57 | (59 | ) | (56 | ) | ||||||||||||||
Tax credits | (52 | ) | (247 | ) | (139 | ) | (45 | ) | (52 | ) | (247 | ) | ||||||||||||
Effects of differing US and foreign tax rates | (26 | ) | 48 | 33 | 57 | (26 | ) | 48 | ||||||||||||||||
Increase in valuation allowance | 88 | — | — | 11 | 88 | — | ||||||||||||||||||
Other items, net | 100 | (18 | ) | (77 | ) | (12 | ) | 100 | (18 | ) | ||||||||||||||
Net income tax expense (benefit) | $ | 288 | $ | (488 | ) | $ | 621 | $ | 902 | $ | 288 | $ | (488 | ) | ||||||||||
Significant items comprising deferred tax assets and liabilities as of April 30 were as follows:
$ in thousands | 2006 | 2005 | 2007 | 2006 | ||||||||||||
Deferred tax assets: | ||||||||||||||||
Accrued employee benefit expenses | $ | 89 | $ | 80 | $ | 87 | $ | 89 | ||||||||
Allowance for doubtful accounts | 168 | 266 | 98 | 168 | ||||||||||||
Inventory reserves and capitalized costs | 104 | 90 | 89 | 104 | ||||||||||||
Deferred compensation | 1,084 | 974 | 1,250 | 1,084 | ||||||||||||
Net operating loss carryforwards | 865 | 1,257 | 221 | 865 | ||||||||||||
Tax credits | 1,305 | 1,431 | 982 | 1,305 | ||||||||||||
Prepaid pension (SFAS No. 158 adjustment) | 1,257 | — | ||||||||||||||
Other | 46 | 44 | 33 | 46 | ||||||||||||
Total deferred tax assets | 3,661 | 4,142 | 4,017 | 3,661 | ||||||||||||
Deferred tax liabilities: | ||||||||||||||||
Book basis in excess of tax basis of property, plant and equipment | (1,578 | ) | (2,191 | ) | (1,517 | ) | (1,578 | ) | ||||||||
Prepaid pension | (1,827 | ) | (1,826 | ) | (1,969 | ) | (1,827 | ) | ||||||||
Other | (37 | ) | (60 | ) | (37 | ) | (37 | ) | ||||||||
Total deferred tax liabilities | (3,442 | ) | (4,077 | ) | (3,523 | ) | (3,442 | ) | ||||||||
Less: valuation allowance | (88 | ) | — | (69 | ) | (88 | ) | |||||||||
Net deferred tax assets | $ | 131 | $ | 65 | $ | 425 | $ | 131 | ||||||||
At April 30, 2006,2007, the Company had federal tax loss carryforwards in the amount of $800,000$151,000 expiring beginning in 2025 and state loss carryforwards in the amount of $65,000$70,000 expiring at various times, primarily beginning in 2018. The Company also had tax credit carryforwards in the amount of $357,000$440,000 expiring beginning in 2020 and state tax credit carryforwards in the amount of $948,000$542,000 expiring beginning in 2006.2007. Due to the expiration schedule of the state credits and a review of future taxable income required to utilize such credits before their expiration, a valuation allowance in the amount of $88,000$69,000 was recorded at April 30, 20062007 to reflect the potential expiration of a portion of the credits in future years.
Note 5—Stock Options
During fiscal year 1992, the stockholders approved the 1991 Key Employee Stock Option Plan, and the plan was subsequently amended to increase the number of shares available for options under the plan to 230,000. During fiscal year 2001, the stockholders approved the 2000 Key Employee Stock Option Plan, which allowed the Company to grant options on 100,000 shares of the Company’s
30
common stock. Under both plans, options are granted at not less than the fair market value at the date of grant and options are exercisable in such installments, for such terms (up to 10 years), and at such times, as the Board of Directors may determine at the time of the grant. At April 30, 2006,2007, there were no shares available for future grants under the 1991 plan, and there were 39,35041,100 shares available for future grants under the 2000 plan. No options were granted in fiscal years 2007, 2006, 2005, and 2004.
During fiscal year 1994, the stockholders approved the 1993 Stock Option Plan for Directors, which allowed the grant of options on 40,000 shares of the Company’s common stock. Each non-employee directors received an option to purchase 5,000 shares of the common stock on the effective date of the plan or on the date of commencement of service as a director. Options are exercisable in four equal, annual installments and expire five years from the date of grant. Options were granted at the fair market value at the date of grant. At April 30, 2006, no shares were available for future grants under the plan.2005.
The Company utilized treasury stock to satisfy stock options exercised during fiscal years 2007, 2006 2005 and 2004.2005. Stock option activity and weighted average exercise price is summarized as follows:
| 2006 | 2005 | 2004 | 2007 | 2006 | 2005 | |||||||||||||||||||||||||||||||
| Options | Price | Options | Price | Options | Price | Options | Price | Options | Price | Options | Price | |||||||||||||||||||||||||
Outstanding at beginning of year | 177,100 | $ | 9.93 | 191,100 | $ | 9.81 | 213,853 | $ | 9.65 | 159,780 | $ | 10.03 | 177,100 | $ | 9.93 | 191,100 | $ | 9.81 | ||||||||||||||||||
Granted | — | — | — | — | — | — | — | — | — | — | — | — | ||||||||||||||||||||||||
Canceled | (10,000 | ) | 9.27 | (10,500 | ) | 9.80 | (15,228 | ) | 10.12 | (6,750 | ) | 9.78 | (10,000 | ) | 9.27 | (10,500 | ) | 9.80 | ||||||||||||||||||
Exercised | (500 | ) | 2.75 | (3,500 | ) | 3.79 | (7,525 | ) | 4.52 | (2,500 | ) | 8.13 | (500 | ) | 2.75 | (3,500 | ) | 3.79 | ||||||||||||||||||
Outstanding at end of year | 166,600 | $ | 9.99 | 177,100 | $ | 9.93 | 191,100 | $ | 9.81 | 157,350 | 10.03 | 166,600 | 9.99 | 177,100 | 9.93 | |||||||||||||||||||||
Exercisable at end of year | 159,780 | $ | 10.03 | 152,117 | $ | 10.04 | 134,384 | $ | 9.97 | 157,350 | 10.03 | 159,780 | 10.03 | 152,117 | 10.04 | |||||||||||||||||||||
The options outstanding and exercisable and the weighted average exercise price within the following price ranges at April 30, 20062007 are as follows:
Exercise price range | $8.125-$9.55 | $9.95-$12.00 | $8.125-$9.55 | $9.95-$12.00 | ||||||||
Options outstanding | 75,500 | 91,100 | ||||||||||
Options outstanding and exercisable | 71,250 | 86,100 | ||||||||||
Weighted average exercise price | $ | 9.09 | $ | 10.74 | $ | 9.12 | $ | 10.79 | ||||
Weighted average remaining contractual life (years) | 4.93 | 3.25 | 4.04 | 2.44 | ||||||||
Note 6—Accumulated Other Comprehensive Income
The options exercisableCompany’s other comprehensive income (loss) consists of unrealized gains and weighted average exercise price withinlosses on the following price ranges at April 30, 2006translation of the assets, liabilities, and equity of its foreign subsidiaries, unrecognized gains and losses on cash flow hedges (consisting of interest rate swaps), and additional minimum pension liability adjustments, net of income taxes.
The before tax income (loss), related income tax effect, and accumulated balances are as follows:
Exercise price range | $8.125-$9.55 | $9.95-$12.00 | ||||
Options exercisable | 68,680 | 91,100 | ||||
Weighted average exercise price | $ | 9.09 | $ | 10.74 | ||
$ in thousands | Foreign Currency Translation Adjustment | Unrecognized Gains (Losses) On Cash Flow Hedge | Minimum Pension Liability Adjustment | Accumulated Other Comprehensive Income (Loss) | |||||||||||
Balance at April 30, 2004 | $ | 49 | $ | (13 | ) | $ | — | $ | 36 | ||||||
Other comprehensive income | 7 | 11 | — | 18 | |||||||||||
Balance at April 30, 2005 | 56 | (2 | ) | — | 54 | ||||||||||
Other comprehensive income | 57 | 2 | — | 59 | |||||||||||
Balance at April 30, 2006 | 113 | — | — | 113 | |||||||||||
Other comprehensive income | 166 | — | — | 166 | |||||||||||
Adoption of SFAS No. 158 | — | — | (3,369 | ) | (3,369 | ) | |||||||||
Income tax effect of SFAS No. 158 | — | — | 1,257 | 1,257 | |||||||||||
Balance at April 30, 2007 | $ | 279 | — | $ | (2,112 | ) | $ | (1,833 | ) | ||||||
Note 6—Comprehensive Income
The Company entered into one interest rate swap agreement effective May 1, 2002 related to its long-term debt. The interest rate swap agreement matured in February 28, 2006. For its foreign subsidiaries, assets and liabilities are translated at exchange rates prevailing on the balance sheet date. Revenues and expenses are translated at weighted average exchange rates prevailing during the period, and any resulting translation adjustments are reported separately in stockholders’ equity.
31
A reconciliation of net earnings (loss) andCompany’s total comprehensive income (loss) for fiscal years 2007, 2006, 2005, and 20042005 is summarized as follows:
$ in thousands | 2006 | 2005 | 2004 | 2007 | 2006 | 2005 | ||||||||||||||
Net earnings (loss) | $ | 193 | $ | (147 | ) | $ | 1,462 | $ | 1,540 | $ | 193 | $ | (147 | ) | ||||||
Change in fair value of cash flow hedge, net of income tax | 2 | 11 | 18 | |||||||||||||||||
Change in cumulative foreign currency translation adjustment | 57 | 7 | 27 | |||||||||||||||||
Other comprehensive income | 166 | 59 | 18 | |||||||||||||||||
Total comprehensive income (loss) | $ | 252 | $ | (129 | ) | $ | 1,507 | $ | 1,706 | $ | 252 | $ | (129 | ) | ||||||
Note 7—Commitments and Contingencies
During fiscal years 2007, 2006 and 2005, the Company entered into several leases related to the implementation of a new ERP System that were classified as capital leases. The Company entered into a 10-year operating lease for a new distribution center in fiscal year 2003. The Company also leases some of its machinery and equipment under non-cancelable operating leases. Most of these leases provide the Company with renewal and purchase options, and most leases of machinery and equipment have certain early cancellation rights. Rent expense for these operating leases was $1,892,000, $1,637,000, $1,302,000, and $1,219,000$1,302,000 in fiscal years 2007, 2006, 2005, and 2004,2005, respectively. Future minimum payments under the above non-cancelable lease arrangements for the years ended April 30 are as follows:
$ in thousands | Operating | Capital | Operating | Capital | ||||||||||
2007 | $ | 1,552 | $ | 329 | ||||||||||
2008 | 1,343 | 329 | $ | 1,441 | $ | 431 | ||||||||
2009 | 1,215 | 252 | 1,309 | 367 | ||||||||||
2010 | 1,031 | 67 | 1,079 | 181 | ||||||||||
2011 | 827 | — | 839 | 10 | ||||||||||
2012 | 735 | — | ||||||||||||
Thereafter | 1,215 | — | 352 | — | ||||||||||
Total minimum lease payments | $ | 7,183 | 977 | 5,755 | 989 | |||||||||
Less: amount representing interest | — | (134 | ) | — | (153 | ) | ||||||||
Capital lease obligation | — | $ | 843 | $ | — | $ | 836 | |||||||
The Company is involved in certain claims and legal proceedings in the normal course of business which management believes will not have a material adverse effect on the Company’s financial condition or results of operations.
Note 8—Retirement Benefits
Defined Benefit Plans
In September 2006, the FASB issued SFAS No. 158, which requires that the Company recognize the funded status of its defined benefit plans in its financial statements as of April 30,2007, with changes in the funded status recognized through comprehensive income, net of tax, in the year in which they occur. The Company adopted SFAS No. 158 effective April 30, 2007, and the incremental effect of applying it on individual line items in the consolidated balance sheet as of April 30, 2007 is as follows:
$ in thousands | Before Application of SFAS No. 158 | Adjustment | After Application of SFAS No. 158 | ||||||||
Prepaid pension cost | $ | 5,280 | $ | (3,369 | ) | $ | 1,911 | ||||
Deferred income taxes assets | — | 129 | 129 | ||||||||
Total other assets | 7,583 | (2,112 | ) | 5,471 | |||||||
Total assets | 47,352 | (2,112 | ) | 45,240 | |||||||
Deferred income taxes liabilities | 1,128 | (1,128 | ) | — | |||||||
Total liabilities | 22,320 | (1,128 | ) | 21,192 | |||||||
Accumulated other comprehensive income (loss) | 279 | (2,112 | ) | (1,833 | ) | ||||||
Total stockholders’ equity | 26,160 | (2,112 | ) | 24,048 | |||||||
The Company has non-contributory defined benefit pension plans covering substantially all salaried and hourly employees. In February 2005, these plans were amended as of April 30, 2005. No further benefits have been, or will be, earned under the plans subsequent to the amendment date, and no additional participants will be added to the plans. The defined benefit plan for salaried employees provide
provides pension benefits that are based on each employee’s years of service and average annual compensation during the last 10 consecutive calendar years of employment as of April 30, 2005. The benefit plan for hourly employees provides benefits at stated amounts based on years of service as of April 30, 2005. theThe Company uses an April 30 measurement date for its defined benefit plans. The change in projected benefit obligations and the change in fair value of plan assets for the
32
non-contributory defined benefit pension plans for each of the years ended April 30 are summarized as follows:
$ in thousands | 2006 | 2005 | 2007 | 2006 | ||||||||||||
Accumulated Benefit Obligation, April 30 | $ | 14,118 | $ | 13,777 | $ | 14,619 | $ | 14,118 | ||||||||
Change in Projected Benefit Obligations | ||||||||||||||||
Projected benefit obligations, beginning of year | $ | 13,777 | $ | 12,896 | $ | 14,118 | $ | 13,777 | ||||||||
Service cost | — | 514 | — | — | ||||||||||||
Interest cost | 797 | 852 | 842 | 797 | ||||||||||||
Curtailment | — | (1,972 | ) | — | — | |||||||||||
Actuarial loss | 116 | 1,992 | 262 | 116 | ||||||||||||
Actual benefits paid | (572 | ) | (505 | ) | (603 | ) | (572 | ) | ||||||||
Projected Benefit obligations, end of year | $ | 14,118 | $ | 13,777 | $ | 14,619 | $ | 14,118 | ||||||||
Change in Plan Assets | ||||||||||||||||
Fair value of plan assets, beginning of year | $ | 14,043 | $ | 11,373 | $ | 15,678 | $ | 14,043 | ||||||||
Actual return (loss) on plan assets | 2,207 | 675 | ||||||||||||||
Actual return on plan assets | 1,454 | 2,207 | ||||||||||||||
Actual company contributions | — | 2,500 | — | — | ||||||||||||
Actual benefits paid | (572 | ) | (505 | ) | (603 | ) | (572 | ) | ||||||||
Fair value of plan assets, end of year | $ | 15,678 | $ | 14,043 | $ | 16,529 | $ | 15,678 | ||||||||
Funded Status and Prepaid | ||||||||||||||||
Funded status of plans | $ | 1,560 | $ | 266 | $ | 1,911 | $ | 1,560 | ||||||||
Unrecognized net loss | 3,338 | 4,465 | — | 3,338 | ||||||||||||
Prepaid pension cost | $ | 4,898 | $ | 4,731 | $ | 1,911 | $ | 4,898 | ||||||||
Amounts Recognized in the Consolidated Statement of Financial Position | ||||||||||||||||
Prepaid pension cost | $ | 4,898 | $ | 4,731 | $ | 1,911 | $ | 4,898 | ||||||||
Amounts Recognized in Accumulated Other Comprehensive Income | ||||||||||||||||
Net actuarial loss | $ | 3,369 | — | |||||||||||||
Weighted-Average Assumptions Used to Determine Benefit Obligations at April 30 | ||||||||||||||||
Discount rate | 6.00 | % | 5.75 | % | 6.00 | % | 6.00 | % | ||||||||
Rate of compensation increase | N/A | N/A | N/A | N/A | ||||||||||||
Weighted-Average Assumptions Used to Determine Net Periodic Benefit Cost for Years Ended April 30 | ||||||||||||||||
Discount rate | 5.75 | % | 6.75 | % | 6.00 | % | 5.75 | % | ||||||||
Expected long-term return on plan assets | 9.00 | % | 9.00 | % | 9.00 | % | 9.00 | % | ||||||||
Rate of compensation increase | N/A | 3.5-6.5 | % | N/A | N/A | |||||||||||
As permitted under Paragraph 26 of FASB No. 87, the amortization of any prior service cost is determined using a straight-line amortization of the cost over the average remaining service period of employees expected to receive benefits under the plan. The components of the net periodic pension costs for each of the three years ended April 30 are as follows:
$ in thousands | 2006 | 2005 | 2004 | 2007 | 2006 | 2005 | ||||||||||||||||||
Service cost | $ | — | $ | 514 | $ | 483 | $ | — | $ | — | $ | 514 | ||||||||||||
Interest cost | 797 | 852 | 799 | 842 | 797 | 852 | ||||||||||||||||||
Expected return on plan assets | (1,239 | ) | (1,004 | ) | (828 | ) | (1,386 | ) | (1,239 | ) | (1,004 | ) | ||||||||||||
Amortization of prior service cost | — | 11 | 11 | — | — | 11 | ||||||||||||||||||
Recognition of net loss | 275 | 238 | 321 | 163 | 275 | 238 | ||||||||||||||||||
Net periodic pension cost (income) | $ | (167 | ) | $ | 611 | $ | 786 | $ | (381 | ) | $ | (167 | ) | $ | 611 | |||||||||
FAS 88 Curtailment Expense | $ | — | $ | 28 | $ | — | $ | — | $ | — | $ | 28 | ||||||||||||
The estimated net actuarial loss for the defined benefit pension plans that will be amortized from accumulated other comprehensive income into net periodic benefit cost during the fiscal year 2008 is $142,000.
The Company’s funding policy is to contribute to the plans when pension laws and economics either require or encourage funding. The Company made contributions of $2,500,000 and $750,000 to the plans in fiscal years 2005 and 2004, respectively.year 2005. No contributions were made to the plans in fiscal yearyears 2007 and 2006. No Company contributions are anticipated for fiscal year 2007.2008.
33
The following benefit payments are expected to be paid formfrom the benefit plans in the fiscal years ended April 30:
$ in thousands | Amount | Amount | ||||
2007 | $ | 613 | ||||
2008 | $ | 652 | $ | 655 | ||
2009 | $ | 695 | 718 | |||
2010 | $ | 749 | 773 | |||
2011 | $ | 787 | 806 | |||
2012-2016 | $ | 4,642 | ||||
2012 | 849 | |||||
2013-2017 | $ | 5,016 | ||||
The Company employs a building block approach in determining the long-term rate of return for plan assets. Historical markets are studied and long-term historical relationships between equities and fixed-income securities are preserved consistent with the widely accepted capital market principle that assets with higher volatility generate a greater return over the long-term. Current market factors such as inflation and interest rates are evaluated before long-term capital market assumptions are determined. The expected long-term portfolio return is established via a building block approach with proper consideration of diversification and rebalancing. Peer data and historical returns are also reviewed to check for reasonability and appropriateness.
The Company uses the average monthly yields for the Moody’s Aa corporate bond index as the primary benchmark for establishing the discount rate used for measuring GAAP pension obligations. The credit quality of the bonds that underlie this index is consistent with SFAS 87 and other SEC staff guidance. In addition, the current estimated duration of the Company’s pension obligations is about 14 years. The Company’s understanding is that the duration of the bonds that comprise the Moody’s Index is estimated to be about 13 years. Based on that information, there does not appear to be a significant mismatch that would cause the Moody’s Index to be an inappropriate benchmark. A 1% increase/decrease in the discount rate for fiscal years 20062007 and 20052006 would decrease/increase pension expense by approximately $128,000 and $130,000, and $231,000, respectively.
The Company used an analysis of the actual pay increase experience from 1998 to 2003 for plan participants, along with the Company’s expectations for future pay growth, to develop an age-graded salary scale which was used in determining the rate of compensation increase assumptions for fiscal year 2005. The rate of compensation increase assumption is not applicable forto the determination of the benefit obligations at April 30, 20062007 and 20052006 or determinations of future obligations or expense, due to the cessation of benefit accruals.
The Company employs a total return investment approach, whereby a mix of equities and fixed-income investments are used to attempt to maximize the long-term return ofon plan assets for a prudent level of risk. Risk tolerance is established through careful consideration of plan liabilities, plan funded status, and corporate financial condition. The investment portfolio contains a diversified blend of equity and fixed-income investments. Furthermore, equity investments are diversified across U.S. and non-U.S. stocks, as well as growth, value, and small and large capitalizations. The target allocations based on the Company’s investment policy werewas 65% and 70% in equity securities and 35% and 30% in fixed-income securities at April 30, 20062007 and 2005, respectively.2006. A 1% increase/decrease in the expected return on assets for fiscal years 20062007 and 20052006 would decrease/increase pension expense by approximately $138,000$154,000 and $111,000,$138,000, respectively. Plan assets by asset categories as of April 30, 20062007 and 20052006 were as follows:
$ in thousands Asset Category | 2006 | 2005 | ||||||||
| Amount | % | Amount | % | |||||||
Equity securities Fixed income securities Cash and cash equivalents | $ | 9,797 5,721 160 | 62 37 1 | $ | 8,178 1,702 4,163 | 58 12 30 | ||||
Totals | $ | 15,678 | 100 | $ | 14,043 | 100 | ||||
34
Cash and cash equivalents at April 30, 2005 include the Company’s contributions to the plans of $2,500,000, which had not yet been diversified into target asset categories.
$ in thousands | 2007 | 2006 | ||||||||
| Asset Category | Amount | % | Amount | % | ||||||
Equity securities | $ | 10,787 | 65 | $ | 9,797 | 62 | ||||
Fixed income securities | 5,619 | 34 | 5,721 | 37 | ||||||
Cash and cash equivalents | 123 | 1 | 160 | 1 | ||||||
Totals | $ | 16,529 | 100 | $ | 15,678 | 100 | ||||
Defined Contribution Plan
The Company has a defined contribution plan covering substantially all salaried and hourly employees. The plan provides benefits to all employees who have attained age 21, completed three months of service, and who elect to participate. In fiscal yearsyear 2005, and 2004, the Company made matching contributions equal to 50% of the qualifying employee contribution, up to a maximum employer contribution of 2% of the participant’s compensation. Effective May 1, 2005, the plan was amended to provide that the Company make matching contributions equal to 100% of the employee’s qualifying contribution up to 3% of the employee’s compensation, and makes matching contributions equal to 50% of the employee’s contributions between 3% and 5% of the employee’s compensation, resulting in a maximum employer contribution equal to 4% of the employee’s compensation. Additionally, effective May 1, 2005, the plan was amended to provide that the Company make a non-matching contribution for participants employed by the Company on December 31 of each year equal to 1% of the participant’s qualifying compensation for that calendar year. The Company’s contributions to the plan in fiscal years 2007, 2006, and 2005 were $737,000, $588,000, and 2004 were $588,000, $246,000, respectively.
Note 9—Segment Information
The Company’s operations are classified into two business segments: Domestic Operations and $270,000, respectively.International Operations. The Domestic Operations segment principally designs, manufactures, and installs scientific and technical furniture, including steel and wood laboratory cabinetry, fume hoods, flexible systems, worksurfaces, workstations, workbenches, and computer enclosures. The International Operations segment, which consists of three foreign subsidiaries as defined in Note 1, provides both the Company’s products and services, including facility design, detailed engineering, construction, and project management from the planning stage through testing and commissioning of laboratories.
Intersegment transactions are recorded at normal profit margins. All intercompany balances and transactions have been eliminated. Corporate expenses have not been allocated to the business segments.
The following table shows revenues, earnings, and other financial information by business segment for each of the three years ended April 30:
$ in thousands | Domestic Operations | International Operations | Corporate | Total | |||||||||||
Fiscal Year 2007 | |||||||||||||||
Revenues from external customers | $ | 66,585 | $ | 14,856 | $ | — | $ | 81,441 | |||||||
Intersegment revenues | 3,251 | 968 | (4,219 | ) | — | ||||||||||
Depreciation | 1,898 | 54 | — | 1,952 | |||||||||||
Operating earnings (loss) before income taxes | 3,889 | 1,393 | (2,541 | ) | 2,741 | ||||||||||
Income tax expense (benefit) | 1,353 | 433 | (884 | ) | 902 | ||||||||||
Minority interest in subsidiaries | — | (299 | ) | — | (299 | ) | |||||||||
Net earnings (loss) | 2,536 | 661 | (1,657 | ) | 1,540 | ||||||||||
Segment assets | 38,085 | 7,155 | — | 45,240 | |||||||||||
Expenditures for segment assets | 1,661 | 63 | — | 1,724 | |||||||||||
Revenues (excluding intersegment) to customers in foreign countries | 1,027 | 14,856 | — | 15,883 | |||||||||||
Fiscal Year 2006 | |||||||||||||||
Revenues from external customers | 72,027 | $ | 12,044 | — | 84,071 | ||||||||||
Intersegment revenues | 3,188 | 877 | (4,065 | ) | — | ||||||||||
Depreciation | 1,984 | 43 | — | 2,027 | |||||||||||
Operating earnings (loss) before income taxes | 1,081 | 1,052 | (1,436 | ) | 697 | ||||||||||
Income tax expense (benefit) | 132 | 331 | (175 | ) | 288 | ||||||||||
Minority interest in subsidiaries | — | (216 | ) | — | (216 | ) | |||||||||
Net earnings (loss) | 949 | 505 | (1,261 | ) | 193 | ||||||||||
Segment assets | 44,484 | 5,988 | — | 50,472 | |||||||||||
Expenditures for segment assets | 1,695 | 191 | — | 1,886 | |||||||||||
Revenues (excluding intersegment) to customers in foreign countries | 631 | 12,044 | — | 12,675 | |||||||||||
Fiscal Year 2005 | |||||||||||||||
Revenues from external customers | 67,838 | 5,643 | — | 73,481 | |||||||||||
Intersegment revenues | 817 | 715 | (1,532 | ) | — | ||||||||||
Depreciation | 2,012 | 36 | — | 2,048 | |||||||||||
Operating earnings (loss) before income taxes | 1,534 | 615 | (2,672 | ) | (523 | ) | |||||||||
Income tax expense (benefit) | 954 | 219 | (1,661 | ) | (488 | ) | |||||||||
Minority interest in subsidiaries | — | (112 | ) | — | (112 | ) | |||||||||
Net earnings (loss) | 580 | 284 | (1,011 | ) | (147 | ) | |||||||||
Segment assets | 43,010 | 3,202 | — | 46,212 | |||||||||||
Expenditures for segment assets | 965 | 11 | — | 976 | |||||||||||
Note 9—10—Consolidated Quarterly Data ((Unaudited)Unaudited)
Selected quarterly financial data for fiscal years 20062007 and 20052006 were as follows:
$ in thousands, except per share amounts | First Quarter | Second Quarter | Third Quarter | Fourth Quarter | First Quarter | Second Quarter | Third Quarter | Fourth Quarter | ||||||||||||||||||||
2007 | ||||||||||||||||||||||||||||
Net sales | $ | 19,294 | $ | 21,385 | $ | 18,041 | $ | 22,721 | ||||||||||||||||||||
Gross profit | 3,128 | 4,080 | 3,624 | 4,254 | ||||||||||||||||||||||||
Net earnings | 133 | 569 | 321 | 517 | ||||||||||||||||||||||||
Net earnings per share | ||||||||||||||||||||||||||||
Basic | 0.05 | 0.23 | 0.13 | 0.21 | ||||||||||||||||||||||||
Diluted | 0.05 | 0.23 | 0.13 | 0.21 | ||||||||||||||||||||||||
Cash dividends per share | 0.07 | 0.07 | 0.07 | 0.07 | ||||||||||||||||||||||||
2006 | ||||||||||||||||||||||||||||
Net sales | $ | 20,308 | $ | 22,319 | $ | 17,724 | $ | 23,720 | 20,308 | 22,319 | 17,724 | 23,720 | ||||||||||||||||
Gross profit | 3,386 | 3,485 | 2,446 | 3,091 | 3,386 | 3,485 | 2,446 | 3,091 | ||||||||||||||||||||
Net earnings (loss) | 763 | 239 | (555 | ) | (254 | ) | 763 | 239 | (555 | ) | (254 | ) | ||||||||||||||||
Net earnings (loss) per share | ||||||||||||||||||||||||||||
Basic | 0.31 | 0.10 | (0.22 | ) | (0.11 | ) | 0.31 | 0.10 | (0.22 | ) | (0.11 | ) | ||||||||||||||||
Diluted | 0.31 | 0.10 | (0.22 | ) | (0.11 | ) | 0.31 | 0.10 | (0.22 | ) | (0.11 | ) | ||||||||||||||||
Cash dividends per share | 0.07 | 0.07 | 0.07 | 0.07 | 0.07 | 0.07 | 0.07 | 0.07 | ||||||||||||||||||||
2005 | ||||||||||||||||||||||||||||
Net sales | $ | 20,288 | $ | 18,365 | $ | 15,623 | $ | 19,205 | ||||||||||||||||||||
Gross profit | 3,376 | 3,553 | 2,037 | 3,518 | ||||||||||||||||||||||||
Net earnings (loss) | 193 | 108 | (742 | ) | 294 | |||||||||||||||||||||||
Net earnings (loss) per share | ||||||||||||||||||||||||||||
Basic | 0.08 | 0.04 | (0.30 | ) | 0.12 | |||||||||||||||||||||||
Diluted | 0.08 | 0.04 | (0.30 | ) | 0.12 | |||||||||||||||||||||||
Cash dividends per share | 0.07 | 0.07 | 0.07 | 0.07 | ||||||||||||||||||||||||
35
CONSENTCONSENTS OF INDEPENDENT REGISTERED PUBLIC ACCOUNTING FIRMS
Cherry, Bekaert & Holland, L.L.P.
We hereby consent to the incorporation by reference in the Registration Statements on Form S-8 (No. 333-18417 and No. 333-98963) of Kewaunee Scientific Corporation of our report dated June 26, 2006July 12, 2007 relating to the financial statements and financial statement schedule, which report appears in this Form 10-K.
CHERRY, BEKAERT & HOLLAND, L.L.P.
Charlotte, North Carolina
July 11, 200612, 2007
PricewaterhouseCoopers LLP
We hereby consent to the incorporation by reference in the Registration Statements on Form S-8 (No. 333-18417 and No. 333-98963) of Kewaunee Scientific Corporation of our report dated June 15, 2005 relating to the financial statements and financial statement schedule, which appears in this Form 10-K.
PricewaterhouseCoopers LLP
Charlotte, North Carolina
July 11, 2006
3616, 2007
KEWAUNEE SCIENTIFIC CORPORATION
SCHEDULE I—I - VALUATION AND QUALIFYING ACCOUNTS
($ IN THOUSANDS)in thousands)
Balance at of Year | Bad Debt Expense | Deductions* | Balance at End of Year | |||||||||||||||||||||||
Allowance for Doubtful Accounts: | Balance at Beginning of Year | Bad Debt Expense | Deductions* | Balance at End of Year | ||||||||||||||||||||||
Year ended April 30, 2007 | $ | 450 | $ | 136 | $ | (324 | ) | $ | 262 | |||||||||||||||||
Year ended April 30, 2006 | $ | 688 | $ | 288 | $ | (526 | ) | $ | 450 | 688 | 288 | (526 | ) | 450 | ||||||||||||
Year ended April 30, 2005 | $ | 858 | $ | 520 | $ | (690 | ) | $ | 688 | 858 | 520 | (690 | ) | 688 | ||||||||||||
Year ended April 30, 2004 | $ | 494 | $ | 454 | $ | (90 | ) | $ | 858 | |||||||||||||||||
| * | Uncollectible accounts written off, net of recoveries. |
37
Item 9. Changes |
We filed an 8-K/A dated July 14, 2005 reporting a change in our certifying accountant to Cherry, Bekaert & Holland, L.L.P. from PricewaterhouseCoopers LLP.and Disagreements with Accountants on Accounting and Financial Disclosure
None
Item 9A. Controls and Procedures
We maintain disclosure controls and procedures that are intended to ensure that the information required to be disclosed in our Exchange Act filings is properly and timely recorded, processed, summarized and reported. Our management, including the Chief Executive Officer and Chief Financial Officer, have conducted an evaluation of the effectiveness of disclosure controls and procedures as of April 30, 20062007 pursuant to Exchange Act Rule 13a-14. Based on that evaluation, the Chief Executive Officer and Chief Financial Officer concluded that the disclosure controls and procedures are effective to provide reasonable assurance that we are able to collect, process, record, and disclose, within the required time periods, the information we are required to disclose in the reports filed with the Securities and Exchange Commission. In designing disclosure controls and procedures, we recognize that any controls and procedures, no matter how well designed and operated, can provide only reasonable assurance of achieving desired control objectives, and that management necessarily is required to apply its judgment in evaluating the cost-benefit relationship of possible controls and procedures. Nevertheless, we believe that our disclosure controls and procedures are effective.
There have been no significant changes in our internal controls over financial reporting that occurred during our fourth fiscal quarter that hashave materially affected, or isare reasonably likely to materially affect, our internal controls over financial reporting.
None.
38