
UNITED STATES
SECURITIES AND EXCHANGE COMMISSION
Washington, D.C. 20549
FORM 10–KForm 10-K
(Mark One)
x | ANNUAL REPORT PURSUANT TO SECTION 13 OR 15(d) OF THE SECURITIES EXCHANGE ACT OF 1934 |
For the fiscal year ended May 31, 20062009
ORor
¨ | TRANSITION REPORT PURSUANT TO SECTION 13 OR 15(d) OF THE SECURITIES EXCHANGE ACT OF 1934 |
For the transition period from to
Commission File Number 1-8399
WORTHINGTON INDUSTRIES, INC.
(Exact nameName of Registrant as specifiedSpecified in its charter)Charter)
Ohio | 31-1189815 | |||
| (State or | Organization) | (I.R.S. Employer Identification No.) | ||
200 Old Wilson Bridge Road, Columbus, Ohio | 43085 | |||
| (Address of | Principal Executive Offices) | (Zip Code) |
Registrant’s telephone number, including area | (614) 438-3210 | ||
Securities registered pursuant to Section 12(b) of the Act:
Title of Common Shares, Without Par Value | Name of New York Stock Exchange |
Securities registered pursuant to Section 12(g) of the Act: None
Indicate by check mark if the registrant is a well-known seasoned issuer, as defined in Rule 405 of the Securities Act. | Yes x No ¨ |
Indicate by check mark if the Registrant is a well-known seasoned issuer, as defined in Rule 405 of the Securities Act.
YES x NO ¨
Indicate by check mark if the Registrantregistrant is not required to file reports pursuant to Section 13 or Section 15(d) of the Act.
Yes ¨ No x |
YES ¨ NO x
Indicate by check mark whether the Registrantregistrant (1) has filed all reports required to be filed by Section 13 or 15(d) of the Securities Exchange Act of 1934 during the preceding 12 months (or for such shorter period that the Registrantregistrant was required to file such reports), and (2) has been subject to such filing requirements for the past 90 days.
YES Yes x NO No ¨
Indicate by check mark whether the registrant has submitted electronically and posted on its corporate Web site, if any, every Interactive Data File required to be submitted and posted pursuant to Rule 405 of Regulation S-T (§232.405 of this chapter) during the preceding 12 months (or for such shorter period that the registrant was required to submit and post such files). Yes ¨ No ¨
Indicate by check mark if disclosure of delinquent filers pursuant to Item 405 of Regulation S-K (§ 229.405 of this chapter) is not contained herein, and will not be contained, to the best of Registrant’sregistrant’s knowledge, in definitive proxy or information statements incorporated by reference in Part III of this Form 10-K or any amendment to this Form 10-K. ¨
Indicate by check mark whether the Registrantregistrant is a large accelerated filer, an accelerated filer, a non-accelerated filer, or a non-accelerated filer.smaller reporting company. See definitionthe definitions of “large accelerated filer,” “accelerated filerfiler” and large accelerated filer”“smaller reporting company” in Rule 12b-2 of the Exchange Act. (Check one):
Large accelerated filerx Accelerated filer¨ Non-accelerated filer¨ Smaller reporting company ¨
�� (Do not check if a smaller reporting company)
Indicate by check mark whether the Registrantregistrant is a shell company (as defined in Rule 12b-2 of the Exchange Act).
YES Yes ¨ NO No x
The aggregate market value of the Common Shares (the only common equity) of the Registrant held by non-affiliates of the Registrant, based oncomputed by reference to the closing price on the New York Stock Exchange on November 30, 200528, 2008, the last business day of the registrant’s most recently completed second fiscal quarter, was approximately $1,757,447,872.$1,423,212,576.
TheIndicate the number of Registrant’sshares outstanding of each of the registrant’s classes of common stock, as of the latest practicable date. On July 24, 2009, the number of Common Shares issued and outstanding as of August 1, 2006, was 88,807,354.79,092,675.
DOCUMENT INCORPORATED BY REFERENCEREFERENCE:
Selected portions of the Registrant’s definitive Proxy Statement to be furnished to shareholders of the Registrant in connection with the Annual Meeting of Shareholders to be held on September 27, 2006,30, 2009, are incorporated by reference into Part III of this Annual Report on Form 10-K to the extent provided herein.
| ii | ||||||
Item 1. | 1 | |||||
Item 1A. | ||||||
Item 1B. | ||||||
Item 2. | ||||||
Item 3. | ||||||
Item 4. | ||||||
Supplemental | ||||||
Item. | ||||||
Item 5. | ||||||
Item 6. | ||||||
Item 7. | Management’s Discussion and Analysis of Financial Condition and Results of Operations | |||||
Item 7A. | Quantitative and Qualitative Disclosures | |||||
Item 8. | ||||||
Item 9. | Changes in and Disagreements | |||||
Item 9A. | ||||||
Item 9B. | ||||||
Item 10. | Directors, | |||||
Item 11. | ||||||
Item 12. | ||||||
Item 13. | Certain Relationships and Related Transactions, and Director Independence | |||||
Item 14. | ||||||
Item 15. | ||||||
| 95 | ||||||
| E-1 | ||||||
i
Selected statements contained in this Annual Report on Form 10-K, including, without limitation, in “PART I – Item 1. – Business” and “PART II – Item 7. – Management’s Discussion and Analysis of Financial Condition and Results of Operations,” constitute “forward-looking statements” as that term is used in the Private Securities Litigation Reform Act of 1995 (the “Act”). These forward-looking statements include, without limitation, statements relating to:
• | business plans or future or expected performance, |
• | projected capacity and working capital needs; |
• | demand trends for the Company or its markets; |
| • | pricing trends for raw materials and finished goods; |
• | anticipated capital expenditures and asset sales; |
• | anticipated improvements and efficiencies in operations, sales and sourcing and the results thereof; |
| • | anticipated impacts of transformation efforts; |
| • | projected timing, results, benefits, costs, charges and expenditures related to |
• | the alignment of operations with demand; |
| • | the ability to develop or take advantage of future opportunities, new products and markets; |
• | expectations for Company and customer inventories, jobs and orders; |
• | expectations for the economy and |
• | expected benefits from transformation plans, cost reduction efforts and other new |
• | expectations for improving earnings, margins or shareholder value; |
| • | effects of judicial rulings; and |
• | other non-historical matters. |
Because they are based on beliefs, estimates and assumptions, forward-looking statements are inherently subject to risks and uncertainties that could cause actual results to differ materially from those projected. Any number of factors could affect actual results, including, without limitation:limitation, those that follow:
• |
|
|
|
|
|
|
|
|
|
|
|
|
|
|
|
|
|
|
|
| the effect of national, regional and worldwide economic conditions generally and within major product markets, including a prolonged or substantial economic downturn; |
• | the effect of |
| • | product demand and pricing; |
| • | changes in product mix, product substitution and market acceptance of the Company’s products; |
| • | fluctuations in pricing, quality or availability of raw materials (particularly steel), supplies, transportation, utilities and other items required by operations; |
| • | effects of facility closures and the consolidation of operations; |
| • | the effect of financial difficulties, consolidation and other changes within the steel, automotive, construction and other industries in which the Company participates; |
| • | failure to maintain appropriate levels of inventories; |
| • | financial difficulties (including bankruptcy filings) of original equipment manufacturers, end-users and customers, suppliers, joint venture partners and others with whom the Company does business; |
| • | failure to maintain, or any adverse changes in, our existing committed credit facilities, or our credit ratings; |
| • | the ability to realize targeted expense reductions from head count reductions, facility closures and other cost reduction efforts; |
| • | the ability to realize other cost savings and operational, sales and sourcing improvement and efficiencies, and other expected benefits from transformation initiatives, on a timely basis; |
| • | the overall success of, and the ability to integrate, newly-acquired businesses and achieve synergies therefrom; |
ii
| • | capacity levels and efficiencies, and other expected benefits from transformation initiatives within facilities and within the industry as a whole; |
| • | the effect of disruption in the business of suppliers, customers, facilities and shipping operations due to adverse weather, casualty events, equipment |
• | changes in customer demand, inventories, spending patterns, product choices, and supplier choices; |
• | risks associated with doing business internationally, including economic, political and social instability, and foreign currency |
• | the ability to improve and maintain processes and business practices |
• |
|
• | deviation of actual results from estimates and/or assumptions used by the Company in the application of its significant accounting policies; |
• | level of imports and import prices in the Company’s markets; |
| • | the impact of judicial rulings and governmental regulations, both in the United States and abroad; and |
• | other risks described from time to time in |
We note these factors for investors as contemplated by the Act. It is impossible to predict or identify all potential risk factors. Consequently, you should not consider the foregoing list to be a complete set of all potential risks and uncertainties. Any forward-looking statements in this Annual Report on Form 10-K are based on current information as of the date of this Annual Report on Form 10-K, and we assume no obligation to correct or update any such statements in the future, except as required by applicable law.
iiiii
General Overview
Worthington Industries, Inc., an is a corporation formed under the laws of the State of Ohio corporation (individually, the “Registrant” or “Worthington Industries” or, together with its subsidiaries, “Worthington”collectively, “we,” “our,” “Worthington,” or “Company”),. Founded in 1955, Worthington is primarily a diversified metal processing company, focused on value-added steel processing and manufactured metal products, such as metal framing, pressure cylinders, automotive past-modelpast- and current-model year service stampings and, through joint ventures, metal ceiling grid systems and laser-welded blanks.
Worthington was founded in 1955 and as of August 1, 2006, operates 46 manufacturing facilities worldwide and holds equity positions in seven joint ventures, which operate an additional 15 manufacturing facilities worldwide.
Worthington is headquartered at 200 Old Wilson Bridge Road, Columbus, Ohio 43085, telephone (614) 438-3210. The common shares of Worthington Industries are traded on the New York Stock Exchange under the symbol WOR.
Worthington made changes during the second quarter of the fiscal year ended May 31, 2006 (“fiscal 2006”) to the internal organizational and reporting structure, affecting the composition of its business segments. The Automotive Body Panels reporting segment, consisting of The Gerstenslager Company, which was previously combined with Steel Processing in the Processed Steel Products reportable segment, was moved to the “Other” category and the Processed Steel Products reportable segment was renamed Steel Processing. Dietrich Construction Group was formed and includes Dietrich Building Systems, which was previously included in the Metal Framing reportable segment, Dietrich Residential Construction, and a research and development project in China. Dietrich Construction Group is now included in the Construction Services reporting segment, and is reported in the “Other” category. All segment financial information for the prior periods has been reclassified to reflect these changes.
Operations are currently reported in three principal reportable segments: Steel Processing, Metal Framing and Pressure Cylinders. All financial information included in this Annual Report on Form 10-K for periods prior to the second quarter of fiscal 2006 has been reclassified to reflect the segment changes discussed in the immediately preceding paragraph. The Steel Processing segment consists of the Worthington Steel business unit (“Worthington Steel”). The Metal Framing segment consists of the Dietrich Metal Framing business unit (“Dietrich”). The Pressure Cylinders segment consists of the Worthington Cylinder business unit (“Worthington Cylinders”). The “Other” category includes the Automotive Body Panels, Construction Services and Steel Packaging operating segments and also includes income and expense items not allocated to the reportable segments.
Worthington holds equity positions in seven joint ventures, further discussed below under the subheading “Joint Ventures.” One joint venture is consolidated while the remaining six joint ventures are unconsolidated.
During fiscal 2006, the Steel Processing, Metal Framing and Pressure Cylinders segments served approximately 1,050, 2,075 and 2,325 customers, respectively, located primarily in the United States. Foreign sales account for less than 10% of consolidated net sales and are comprised primarily of sales to customers in Canada and Europe. No single customer accounts for over 5% of consolidated net sales.
Worthington Industries maintains an Internet web site at www.worthingtonindustries.com. This uniform resource locator, or URL, is an inactive textual reference only and is not intended to incorporate Worthington Industries’ web site into this Annual Report on Form 10-K. Annual reportsReports on Form 10-K, quarterly reportsQuarterly Reports on Form 10-Q, current reportsCurrent Reports on Form 8-K and amendments to those reports, filed or furnished pursuant to Section 13(a) or 15(d) of the Securities Exchange Act of 1934, as amended (the “Exchange Act”), are available free of charge, on or through the Worthington Industries web site, as soon as reasonably practicable after such material is electronically filed with, or furnished to, the Securities and Exchange Commission (the “SEC”).
Business Segments
At the end of the fiscal year ended May 31, 2009 (“fiscal 2009”), the Company had 41 manufacturing facilities worldwide and held equity positions in six joint ventures, which operated an additional 19 manufacturing facilities worldwide.
The Company has three principal reportable business segments: Steel Processing, Metal Framing and Pressure Cylinders. The Steel Processing business segment consists of the Worthington Steel business unit (“Worthington Steel”). The Metal Framing business segment consists of the Dietrich Metal Framing business unit (“Dietrich”). The Pressure Cylinders business segment consists of the Worthington Cylinder business unit (“Worthington Cylinders”). All other business units not included in these three reportable business segments are combined and disclosed in the ‘Other’ category, which also includes income and expense items not allocated to the business segments. The Other category includes the Automotive Body Panels, Construction Services and Steel Packaging business units.
Worthington holds equity positions in six joint ventures, which are further discussed below under the subheading “Joint Ventures.” Only one of the six joint ventures is consolidated and its operating results are reported in the Steel Processing business segment.
During fiscal 2009, the Steel Processing, Metal Framing and Pressure Cylinders business segments served approximately 1,100, 3,900 and 2,000 customers, respectively, located primarily in the United States. Foreign sales accounted for approximately 9% of consolidated net sales and were comprised primarily of sales to customers in Canada and Europe. No single customer accounted for over 5% of consolidated net sales. Further reportable business segment data is provided in “Item 8. – Financial Statements and Supplementary Data – Notes to Consolidated Financial Statements – Note H – Segment Data” of this Annual Report on Form 10-K. That data is incorporated herein by reference.
Transformation Plan
In fiscal 2008, we initiated a Transformation Plan (the "Plan") with the overall goal to improve the Company's sustainable earnings potential, asset utilization and operational performance. The Plan is being implemented over a three-year period and focuses on cost reduction, margin expansion and organizational capability improvements, and in the process seeks to drive excellence in three core competencies: sales, operations and supply chain management. The Plan is comprehensive in scope and includes aggressive diagnostic and implementation phases in the Steel Processing and Metal Framing business segments.
We retained a consulting firm to assist in the development and implementation of the Plan. The services provided by this firm included diagnostic tools, performance improvement technologies, project management techniques, benchmarking information, and insights that directly relate to the Plan. Internal transformation teams have also been formed and are dedicated to the Plan efforts. As of May 31, 2009, responsibility for executing the Plan has been successfully transitioned to our internal transformation teams.
Plan initiatives executed to date include facility closings, head count reductions, other cost reductions, an enhanced and more focused commercial sales effort, improved operating efficiencies, a consolidated sourcing and supply chain strategy, and a continued emphasis on safety. The positive results of these efforts, however, have been over-shadowed by the negative impact of the recessionary business conditions.
Pre-tax restructuring charges associated with the Plan totaled $43,041,000 for fiscal 2009. See “Item 8. – Financial Statements and Supplementary Data – Notes to Consolidated Financial Statements – Note N – Restructuring,” of this Annual Report on Form 10-K for further information on restructuring charges. We anticipate that we will incur an additional $6,000,000 in restructuring charges during the fiscal year ending May 31, 2010.
Recent Developments
On June 13, 2005,2, 2008, Worthington Industries announced that its board of directors had authorized the repurchase of up to 10.0 millionpurchased substantially all of the outstanding common sharesassets of The Sharon Companies Ltd. (“Worthington Industries.Stairs”) for $37,150,000. Worthington Stairs designs and manufactures steel egress stair systems for the commercial construction market, and operates one manufacturing facility in Akron, Ohio. It operates as part of the Construction Services segment, Worthington Integrated Building Systems, LLC (“WIBS”). The purchases may be made from time to time, on the open market or in private transactions, with consideration givenpurchase price was allocated to the market priceacquired assets and assumed liabilities based on their estimated fair values at the date of acquisition, with goodwill representing the excess of the common shares,purchase price over the naturefair value allocated to the net assets. The purchase price allocated to intangible assets will be amortized over a weighted average life of other investment opportunities, cash flows from operations and general economic conditions. No repurchases of common shares pursuant to this authorization occurred during fiscal 2006.13 years.
On September 27, 2005, Dietrich entered intoJuly 31, 2008, our Worthington Steelpac Systems, LLC (“Steelpac”) subsidiary purchased the assets of Laser Products (“Laser”) for $3,425,000. Laser is a joint development agreement with NOVA Chemicals Corporationsteel rack fabricator primarily serving the auto industry. The purchase price was allocated to evaluateworking capital, fixed assets, and commercialize novel construction products that combine the structural benefits of light-gauge steel framing with the thermalcustomer list. The purchase price allocated to customer list will be amortized over ten years.
On October 1, 2008, Worthington expanded and moisture retardant properties of expandable polystyrene. On July 20, 2006,modified Worthington announced that Dietrich had formed a 50:50Specialty Processing (“WSP”), our joint venture with NOVA ChemicalsUnited States Steel Corporation (“U.S. Steel”). U.S. Steel contributed ProCoil Company L.L.C., its steel processing facility in Canton, Michigan that is intendedslits, cuts-to-length and presses blanks from steel coils to developdesired specifications, and manufacture durable, energy-saving composite construction productsalso provides laser welding services and systems.warehouses material for automotive customers. Worthington contributed its steel processing subsidiary in Taylor, Michigan that slits, cuts-to-length and tension levels steel coils, plus $2,500,000 in cash. After the contributions, Worthington owns 51% and U.S. Steel owns 49% of WSP. The joint venture’s current focusventure will continue to be accounted for using the equity method as both parties have equal control. WSP is on developing cost-effective insulated metal framing panels intendedexpected to remove significant obstacles to using steel framing products for exterior walls in areas where interior/exterior temperature variations may cause condensation.
On September 29, 2005, Worthington Industries amended and restated its $435,000,000 long-term unsecured revolving credit facility. The amended and restated facility provides for an extensionbetter serve the changing needs of the revolving credit commitmentsautomotive and flat-rolled customers by allowing each of the three entities to September 2010; replacesmaximize their individual processing specialties with this expansion of the leverage ratio (debt-to-EBITDA) financial covenant with an interest coverage ratio (EBITDA-to-interest expense) financial covenant; and reduces the facility fees payable. Borrowings under the amended and restated facility may be used to fund general corporate purposes including working capital, capital expenditures, acquisitions and dividends. The facility was unused at May 31, 2006.joint venture.
On
During October 17, 2005, Worthington acquired the remaining 50%2008, we sold our 49% equity interest in Dietrich Residential Construction, LLC from its partner, Pacific Steel Construction,Canessa Worthington Slovakia s.r.o. for $3,773,000 cash and debt assumptionapproximately $3,700,000 to the Magnetto Group, the other member of $4,153,000. This acquisition provides panelizing capabilities and further opens the door to United States military housing and residential housing markets.joint venture. The gain on the transaction was immaterial.
In November 2005, Dietrich launched the “UltraSTEEL™” drywall metal framing line in Florida. As of May 31, 2006, the “UltraSTEEL™” product line had been introduced into markets in the Southeast and Northeast and machinery conversions were underway to make “UltraSTEEL™” products in the Midwest and Southwest. A license from Hadley Industries PLC (“Hadley”) grants Dietrich the exclusive rights to manufacture and sell metal framing using Hadley’s patented “UltraSTEEL™” technology in North America. In February 2006, Dietrich entered into an exclusive sublicensing arrangement with Clark-Western, which will become the only other producer of “UltraSTEEL™” metal framing products for the North American market.
On November 30, 2005, Worthington acquired the remaining 40%During January 2009, we sold our 60% equity interest in DietrichAegis Metal Framing, Canada,LLC for approximately $24,000,000 to MiTek Industries, Inc. from, the minority shareholder, Encore Coils Holdings Ltd., for $3,003,000 cash.other member of the joint venture. This resulted in a pre-tax gain of $8,331,000.
On April 25, 2006, Worthington SteelDuring May 2009, we sold itsour 50% equity interest in Acerex, S.A. de C.V.Accelerated Building Technologies, LLC to NOVA Chemicals Corporation, the other member of the joint venture. The sales price and loss on the transaction were immaterial.
On June 1, 2009, we purchased the assets related to the business of Piper Metal Forming Corporation (“Piper”), U.S. Respiratory, Inc. and Pacific Cylinders, Inc., for approximately $10,000,000, subject to closing adjustments. Piper is a joint venture operating amanufacturer of aluminum high pressure cylinders, and impact extruded steel processing facilityand aluminum parts, serving the medical, automotive, defense, oil services and other commercial markets, with one manufacturing location in Monterrey, Mexico, to its partner Ternium, S.A.New Albany, Mississippi. U.S. Respiratory provides value-added assembly and distribution of Piper’s medical cylinder products. Pacific Cylinders provides West Coast distribution from Diamond Springs, California. The revenues of this group were approximately $30,000,000 for $44,604,000 cash.the 2008 calendar year. These assets will be included in our Pressure Cylinders business segment.
Steel Processing
The Steel Processing reportablebusiness segment consists of the Worthington Steel business unit.unit, and includes Precision Specialty Metals, Inc., a specialty stainless processor located in Los Angeles, California (“PSM”), and Spartan Steel Coating, LLC (“Spartan”), a consolidated joint venture which operates a cold-rolled hot dipped galvanizing line. For fiscal 2006,2009, the fiscal year ended May 31, 20052008 (“fiscal 2005”2008”), and the fiscal year ended May 31, 20042007 (“fiscal 2004”2007”), the percentage of consolidated net sales generated by the Steel Processing segment was 51.3%45%, 58.8%48%, and 53.2%49%, respectively.
Worthington Steel is one of America’s largest independent intermediate processors of flat-rolled steel. It occupies a niche in the steel industry by focusing on products requiring exact specifications. These products cannot typically cannot be supplied as efficiently by steel mills or steel end-users.end-users of these products.
The Steel Processing business segment, including Spartan, owns and operates eightnine manufacturing facilities – one each located in Alabama,California, Indiana, Kentucky, Maryland, and Michigan, and South Carolina and three located in Ohio. The consolidated joint venture, Spartan Steel Coating, LLC (“Spartan”), ownsOhio – and operates aleases one manufacturing facility in Michigan.Alabama.
Worthington Steel serves approximately 1,0501,100 customers from these facilities, principally in the automotive, construction, lawn and garden, hardware, furniture, office equipment, electrical control, tubing, leisure and recreation, appliance, farm implements,agricultural, HVAC, container, and aerospace markets. Automotive-related customers have historically represented approximately half of this business segment’s net sales. No single customer represented greater than 8%6% of net sales for the Steel Processing business segment during fiscal 2006.2009.
Worthington Steel buys coils of steel from major integrated steel mills and mini-mills and processes them to the precise type, thickness, length, width, shape, temper and surface quality required by customer specifications. Computer-aided processing capabilities include, among others:
pickling, a chemical process using an acidic solution to remove surface oxide which develops on hot-rolled steel;
slitting, which cuts steel to specific widths;
cold reduction,reducing, which achieves close tolerances of thickness and temper by rolling;
hot-dipped galvanizing, which coats steel with zinc and zinc alloys through a hot-dipped process;
hydrogen annealing, a thermal process that changes the hardness and certain metallurgical characteristics of steel;
cutting-to-length, which cuts flattened steel to exact lengths;
tension leveling, a method of applying pressure to achieve precise flatness tolerances for steel;
edging, which conditions the edges of the steel by imparting round, smooth or knurled edges;
non-metallic coatingscoating including dry lube,lubrication, acrylic and paint; and
configured blanking, which stamps steel into specific shapes.
Worthington Steel also toll processes steel for steel mills, large end-users, service centers, and other processors. Toll processing is different from typical steel processing becausein that the mill, end-user, or other party retains title to the steel and has the responsibility for selling the end product. Toll processing enhances Worthington Steel’s participation in the market for wide sheet steel and large standard orders, which is a market generally served by steel mills rather than by intermediate steel processors.
The steel processing industry is fragmented and highly competitive. There are many competitors, including other independent intermediate processors. Competition is primarily on the basis of price, product quality, and the ability to meet delivery requirements, and price.requirements. Technical service and support for material testing and customer-specific applications enhance the quality of products (See “Item 1. – Business – Technical Services”). However, the extent to which technical service capability has improved Worthington Steel’s competitive position has not been quantified. Worthington Steel’s ability to meet tight delivery schedules is, in part, based on the proximity of our facilities to customers, suppliers and one another. The extent to which plant location has impacted Worthington Steel’s competitive position has not been quantified. Processed steel products are priced competitively, primarily based on market factors, including, among other things, competitive market pricing, the cost and availability of raw materials, transportation and shipping costs, and overall economic conditions in the United States and abroad.
Metal Framing
The Metal Framing reportablebusiness segment, consisting of the Dietrich Metal Framing business unit, designs and produces metal framing components and systems and related accessories for the commercial and residential construction markets within the United States and Canada. For fiscal 2006,2009, fiscal 2005,2008, and fiscal 2004,2007, the percentage of consolidated net sales generated by the Metal Framing segment was 27.5%25%, 27.4%26%, and 27.4%26%, respectively.
Metal Framing products include steel studs and track, floor and wall system components, roof trusses and other building product accessories, such as metal corner bead, lath, lath accessories, clips, fasteners and vinyl beadsbead and trim.
In November 2005, Dietrich successfully launched its “UltraSTEEL™” drywall metal framing product line in Florida. The “UltraSTEEL™” product line is being readily accepted by architects, engineers and material specifiers for its performance capabilities and by contractors for its ease of use. As of May 31, 2006, “UltraSTEEL™” had also been introduced into additional markets in the Southeast and Northeast and machinery conversions were underway to make “UltraSTEEL™” products in the Midwest and Southwest for sales in those markets. In February 2006, Dietrich entered into an exclusive sublicensing agreement with Clark-Western, which will become the only other producer of “UltraSTEEL™” metal framing products for the North American market.
The Metal Framing business segment has 2315 operating facilities located throughout the United States: one each in Colorado, Florida, Georgia, Hawaii, Illinois, Indiana, Kansas, Maryland, Massachusetts,and New Jersey, South Carolina and Washington; two each in Arizona, California, Indiana, Ohio, and Texas; and three in Florida.Texas. This business segment also has threetwo operating facilities in Canada: one each in British Columbia Ontario and Quebec.Ontario.
Dietrich is the largest metal framing manufacturer in the United States, supplying between 40% and 45%approximately one-third of the metal framing products and accessories sold in the United States. Dietrich is the second largest metal framing manufacturer in Canada with a market share of between 15%25% and 20%30%. Dietrich serves approximately 2,0753,900 customers, primarily consisting of wholesale distributors, commercial and residential building contractors, and mass merchandisers. During fiscal 2006,2009, Dietrich’s twothree largest customers represented approximately 15%17%, 10% and 12%10%, respectively, of the net sales for the business segment, while no other customer represented more than 5%3% of net sales for the business segment.
The light-gauge metal framing industry is very competitive. Dietrich competes with seven large regional or national competitors and numerous small, more localized competitors, primarily on the basis of quality,price, service, breadth of product line and price.quality. As is the case in the Steel Processing business segment, the proximity of facilities to customers and their project sites provides a service advantage and impacts freight and shipping costs. TheDietrich’s products sold are transported by both common and dedicated carriers. The extent to which facility location has impacted Dietrich’s competitive position has not been quantified.
Dietrich uses numerous trademarks and patents in its business. Dietrich licenses from Hadley Industries the “UltraSTEEL™“UltraSTEEL®” registered trademark and the United States and Canadian patents to manufacture “UltraSTEEL™“UltraSTEEL®” metal framing and accessory products. The “Spazzer®“Spazzer®” trademark is used in connection with wall component products that are the subject of four United States patents, onetwo foreign patent,patents, one pending United States patent application, and several pending foreign patent applications. The trademark “TradeReady®“TradeReady®” is used in connection with floor-system products that are the subject of four United States patents, seventeennumerous foreign patents, one pending United States patent application, and fiveseveral pending foreign patent applications. The “Clinch-On®“Clinch-On®” trademark is used east of the RockiesRocky Mountains in connection with corner bead and metal trim products for gypsum wallboard. Dietrich licenses the “SLP-TRK®“PRO X®” trademarkand the “SLP-TRK®" trademarks as well as the patent to manufacture “SLP-TRK®”"SLP-TRK®" slotted track in the United States and “Pro XR” header system from Brady Construction Innovations, Inc. Aegis Metal Framing, LLC, an unconsolidated joint venture, uses the “Ultra-Span®” registered trademark in connection with certain patents for proprietary roof trusses. Dietrich intends to continue to use and renew these registered trademarks. Dietrich also has a number of other patents, trademarks and trade names relating to specialized products. The Metal Framing business segment intends to continue to use these trademarks and renew its registered trademarks.
Pressure Cylinders
The Pressure Cylinders segment consists of the Worthington Cylinders business unit. For fiscal 2006,2009, fiscal 2005,2008, and fiscal 2004,2007, the percentage of consolidated net sales generated by Worthington Cylinders was 15.9%20%, 13.3%19%, and 13.8%18%, respectively.
Worthington Cylinders operates eight manufacturing facilities:facilities with three in Ohio one in Wisconsin, and one each in Wisconsin, Austria, Canada, the Czech Republic and Portugal.
The Pressure Cylinders business segment produces a diversified line of pressure cylinders, including low-pressure liquefied petroleum gas (“LPG”) and refrigerant gas cylinders andcylinders; high-pressure and industrial/specialty gas cylinders.cylinders; airbrake tanks; and certain consumer products. LPG cylinders are sold to manufacturers, distributors and mass merchandisers and are used to hold fuel for gas barbecue grills, recreational vehicle equipment, residential and light commercial heating systems, industrial forklifts, propane-fueled camping equipment, hand held torches, and commercial/residential cooking (the latter, generally outside North America).
Refrigerant gas cylinders are sold primarily to major refrigerant gas producers and distributors and are used to hold refrigerant gases for commercial, residential, and residentialautomotive air conditioning and refrigeration systems and for automotive air conditioning systems. High-pressure and industrial/specialty gas cylinders are sold primarily to gas producers and distributors as containers for gases used in: cutting and welding metals; breathing (medical, diving and firefighting); semiconductor production; beverage delivery; and compressed natural gas systems. Worthington Cylinders also produces recovery tanks for refrigerant gases, air reservoirs for truck and trailer original equipment manufacturers, and “Balloon Time®” helium kits which include non-refillable cylinders. While a large percentage of cylinder sales are made to major accounts, Worthington Cylinders has approximately 2,3252,000 customers. During fiscal 2006,2009, no single customer represented more than 9%10% of net sales for the business segment.
Worthington Cylinders produces low-pressure steel cylinders with refrigerant capacities of 15 to 1,000 lbs.pounds and steel and aluminum cylinders with LPG capacities of 14.1 oz.ounces to 420 lbs.pounds. Low-pressure cylinders are produced by precision stamping, drawing, welding and/or brazing component parts to customer specifications. They are then tested, painted and packaged, as required. High-pressure steel cylinders are manufactured by several processes, including deep drawing, tube spinning and billet piercing.
In the United States and Canada, high-pressure and low-pressure cylinders are primarily manufactured in accordance with U.S. Department of Transportation and Transport Canada specifications. Outside the United States and Canada, cylinders are manufactured according to European norm specifications, as well as various other international standards.
In the United States and Canada, Worthington Cylinders has one principal domestic competitor in the low-pressure non-refillable refrigerant market, one principal domestic competitor in the low-pressure LPG cylinder market, and two principal domestic competitors in the high-pressure cylinder market. There are also several smaller foreign competitors in these markets. Worthington Cylinders believes that it has the largest domestic market share in both low-pressure cylinder markets. In the European high-pressure cylinder market, there are several competitors. Worthington Cylinders believes that it is a leading producer in both the high-pressure cylinder and low-pressure non-refillable cylinder markets in Europe. As with Worthington’s other business segments, competition is on the basis ofbased upon price, service price and quality.
The Pressure Cylinders business segment uses the trade name “Worthington Cylinders” to conduct business and the registered trademark “Balloon Time®” to market low-pressure helium balloon kitskits; the trademark “FLAMESAVER™” to market certain LP gas cylinders; the trademark “WORTHINGTON PRO GRADE™” to market certain LPG cylinders, hand torch cylinders and camping fuel cylinders; and the trademark “MAP-PRO™” to market certain hand torch cylinders. The Pressure Cylinders business segment intends to continue to use these trademarks and renew thisits registered trademark. This intellectual property is important totrademarks.
As noted under “Recent Developments”, the recently acquired Piper business will be included in the Pressure Cylinders segment but is not considered material.business segment.
Other
The “Other” category consists of reporting segments that do not meet the materiality tests for purposes of separate disclosure and other corporate related entities. These reportingbusiness segments are Automotive Body Panels, Construction Services and Steel Packaging, which includes the Worthington Steelpac business unit (“Steelpac”).Packaging.
The Automotive Body Panels reportingbusiness segment consistingconsists of theThe Gerstenslager business unit,Company (“Gerstenslager”), which is ISO/TS 16949:2002 and ISO14001 certified. Gerstenslager provides stamping, blanking, assembly, painting, packaging, die management, warehousing, distribution management and other services to customers, primarily in the automotive industry. Gerstenslager operates two facilities in Ohio. Gerstenslager is a major supplier to the automotive past-model year market and manages more than 3,0003,600 finished good part numbers and more than 11,00012,500 stamping dies/fixture sets for the past- and current-model year automotive and truck manufacturers, both domestic and transplant.
The Construction Services reportingbusiness segment operates out of three facilities, one each in Tennessee, Washington, and Ohio. This business segment consists of Dietrich Building Systems,the WIBS business unit which includes Worthington Mid-Rise Construction, Inc., which designs and builds mid-rise light-gauge steel framed commercial structures and multi-family housing units; Dietrich ResidentialWorthington Military Construction, Inc., which is involved in the supply and construction of metal framing products for, and in the framing of, single family housing, with a focus on military; and Worthington Stairs, a mid-rise light-gaugemanufacturer of pre-engineered steel framed construction project in China entered into primarily for research and development purposes.egress stair solutions.
The Steel Packaging business segment consists of Steelpac, which is an ISO-9001: 2000 certified manufacturer of engineered, recyclable steel shipping solutions,solutions. Steelpac operates three facilities, one each in Indiana, Ohio and Pennsylvania. Steelpac designs and manufactures reusable custom crates,platforms, racks, and pallets made of steel for supporting, protecting and handling products throughout the shipping process for industries such as automotive, lawn and garden and recreational vehicles.
Segment Financial Data
Financial information for the reportable business segments is provided in “Item 8. – Financial Statements and Supplementary Data – Notes to Consolidated Financial Statements – Note H – Industry Segment Data.”Data” of this Annual Report on Form 10-K. That financial information is incorporated herein by reference.
Financial Information About Geographic Areas
Foreign operations represented 9%, 9%, and exports represent less than 10%8% of production and consolidated net sales.sales for fiscal 2009, fiscal 2008, and fiscal 2007, respectively. Summary information about ourWorthington’s foreign operations is set forth in “Item 8. – Financial Statements and Supplementary Data – Notes to Consolidated Financial Statements – Note A – Summary of Significant Accounting Policies – Risks and Uncertainties.”Uncertainties” of this Annual Report on Form 10-K. That summary information is incorporated herein by reference. For fiscal 20062009, fiscal 2008, and fiscal 2005,2007, Worthington had operations in North America and Europe, while prior years included operations in South America.Europe. Net sales by geographic region are provided in “Item 8. – Financial Statements and Supplementary Data – Notes to Consolidated Financial Statements – Note H – Industry Segment Data.”–Segment Data” of this Annual Report on Form 10-K. That information is incorporated herein by reference.
Suppliers
The primary raw material purchased by Worthington is steel. We purchase steel from major primary producers of steel, both domestic and foreign. The amount purchased from any particular supplier varies from year-to-year depending on a number of factors including market conditions, then current relationships and prices and terms offered. In nearly all market conditions, particularly now, steel is available from a number of suppliers and generally any supplier relationship or contract can and has been replaced with little or no significant interruption to our business. In fiscal 2006,2009, Worthington purchased approximately four1.7 million tons of steel (58% hot-rolled, 30% galvanized, and 12% cold-rolled) on a consolidated basis. Steel is purchased in large quantities at regular intervals from major primary producers, both domestic and foreign. In the Steel Processing business segment, steel is primarily purchased and processed based on specific customer orders. The Metal Framing and Pressure Cylinders business segments purchase steel to meet production schedules. For certain raw materials, there are more limited suppliers, for example, hydrogen and zinc, which are generally purchased at market prices. Since there are a limited number of suppliers in the hydrogen and zinc markets, if delivery from a major supplier is disrupted due to a force majeure type occurrence, it may be difficult to obtain an alternative supply. Raw materials are generally purchased in the open market on a negotiated spot-market basis at prevailing market prices. Supply contracts are also entered into, some of which have fixed pricing. During fiscal 2006,2009, the Company purchased steel from the following major suppliers, of steel were, in alphabetical order: AK Steel Corporation; ArcelorMittal; California Steel Industries, Inc; Gallatin Steel Company; Mittal Steel; North Star BlueScope Steel LLC; Nucor Corporation; SeverStalSeverstal North America, USInc.; Steel Dynamics, Inc.; Stemcor Holdings Limited; United States Steel Corporation; and WCI Steel, Inc.USS-POSCO Industries. Alcoa, Inc. was the primary aluminum supplier for the Pressure Cylinders business segment in fiscal 2006.2009. Major suppliers of zinc to the Steel Processing business segment were, in alphabetical order: Considar Metal Marketing (a/k/a HudBay); Industrias Peñoles; Teck Cominco Limited; U. S. Zinc; and Xstrata Zinc Canada. Approximately 20.5 million pounds of zinc were purchased in fiscal 2009. Worthington believes its supplier relationships are good.
Technical Services
Worthington employs a staff of engineers and other technical personnel and maintains fully-equipped modernfully equipped laboratories to support operations. These facilities enable verification, analysis and documentation of the physical, chemical, metallurgical and mechanical properties of raw materials and products. Technical service personnel also work in conjunction with the sales force to determine the types of flat-rolled steel required for customer needs. Additionally, technical service personnel design and engineer metal framing structures and provide sealed shop drawings to the building construction markets. To provide these services, Worthington
maintains a continuing program of developmental engineering with respect to product characteristics and performance under varying conditions. Laboratory facilities also perform metallurgical and chemical testing as dictated by the regulations of the U.S. Department of Transportation, Transport Canada, and other associated agencies, along with International Organization for Standardization (ISO) and customer requirements. All design work complies with applicable current local and national building code requirements. An IAS (International Accreditations Service, Incorporated) accredited product-testing laboratory supports these design efforts.
Seasonality and Backlog
Our financial resultsSales are generally lowerweaker in the third quarter of ourthe fiscal year, primarily due to reduced activity in the building and construction industry as a result of the weather, as well as customer plant shutdowns in the automotive industry due to holidays. Sales are generally strongest in the fourth quarter of the fiscal year when all of the segments are normally operating at seasonal peaks.
We do not believe backlog is a significant indicator of our business.
Employees
As of May 31, 2006,2009, Worthington employed approximately 8,2006,400 employees in its operations, excluding theincluding unconsolidated joint ventures, approximately 11%ventures. Approximately 13% of whomthese employees were coveredrepresented by collective bargaining agreements, including those at the Hammond facility as discussed below.units. Worthington believes it has good relationships with its employees in general, including those covered by collective bargaining agreements. However, the union employees at the Dietrich facility in Hammond, Indiana have been on strike since May 5, 2006, as the parties have not reached
agreement on a new contract covering the facility. The Hammond facility has continued to operate during this time period at approximately 90% of pre-strike production levels.units.
Joint Ventures
As part of a strategy to selectively develop new products, markets, and technological capabilities and to expand an international presence, while mitigating the risks and costs associated with those activities, Worthington participates in one consolidated and sixfive unconsolidated joint ventures.
Consolidated
Spartan Steel Coating, LLC, (“Spartan”)is a 52%-owned consolidated joint venture with Severstal North America, Inc. (“Severstal”), located in Monroe, Michigan. It operates a cold-rolled, hot-dipped galvanizing facilityline for toll processing steel coils into galvanized and galvannealed products intended primarily for the automotive industry. Spartan's financial results are fully consolidated into the Steel Processing segment. The equity ownership of Severstal is shown as minority interest on the Company’s consolidated balance sheets and its portion of operating income is eliminated in Monroe, Michigan.miscellaneous expense on the Company’s consolidated statements of earnings.
Unconsolidated
Aegis Metal Framing,LEFCO Worthington, LLC ("LEFCO Worthington"), a 60%49%-owned joint venture with MiTekLEFCO Industries, Inc., headquarteredLLC, is a minority business enterprise which offers engineered wooden crates, specialty pallets, and steel rack systems for a variety of industries. LEFCO Worthington operates one manufacturing facility in Chesterfield, Missouri, offers design, estimating and management software, a full line of metal framing products, and integrated professional engineering services to light-gauge metal component manufacturers and contractors.Cleveland, Ohio.
Dietrich/NOVA, LLC,Serviacero Planos, S.A. de C.V. ("Serviacero Worthington"), a 50%-owned joint venture with NOVA Chemicals Corporation, evaluates, develops, tests, manufactures, sellsInverzer, S.A. de C.V., operates three facilities in Mexico, one each in Leon, Queretaro, and otherwise commercializes construction products which combine or useMonterrey. The Monterrey facility, opened in combination light-gaugemid-July 2009, has not been included as part of our location count. Serviacero Worthington provides steel framing productsprocessing services such as slitting, multi-blanking and styreniccutting-to-length to customers in a variety of industries including automotive, appliance, electronics and copolymer resin products.heavy equipment.
TWB Company, LLCL.L.C. (“TWB”), a 50%45%-owned joint venture with ThyssenKrupp Steel North America, Inc., is a leading North American supplier of tailor welded blanks. TWB produces laser-welded blanks for use in the automotive industry for products such as inner-door panels.panels, bodysides, rails and pillars. TWB operates facilities in Prattville, Alabama; Monroe, Michigan; Columbus, Indiana; and SaltilloPuebla, Ramos Arizpe (Saltillo) and Hermosillo, Mexico.
Viking & Worthington Steel Enterprise, LLC, a 49%-owned joint venture with Bainbridge Steel, LLC, an affiliate of Viking Industries, LLC, operates a steel processing TWB closed its Columbus, Indiana facility in Valley City, Ohio, and is a qualified minority business enterprise.during fiscal 2009.
Worthington Armstrong Venture (“WAVE”), a 50%-owned joint venture with Armstrong Ventures, Inc., a subsidiary of Armstrong World Industries, Inc., is one of the three leading global manufacturers and multiple smaller international manufacturers of suspended ceilingsuspension grid systems for concealed and lay-in panel ceilings.ceilings used in commercial and residential ceiling markets. WAVE operates seven facilities in five countries: Aberdeen, Maryland; Benton Harbor, Michigan; and North Las Vegas, Nevada;Nevada, within the United States; Shanghai, the Peoples Republic of China; Team Valley, United Kingdom; Valenciennes, France; and Madrid, Spain.
Worthington Specialty Processing,WSP, a 50%51%-owned joint venture with U.S. Steel, Corporation (“U.S. Steel”)operates three steel processing facilities located in Canton, Jackson and Taylor, Michigan, operateswhich are managed by Worthington Steel. WSP serves primarily as a toll processor for U.S. Steel.Steel and others. Its services include slitting, blanking, cutting-to-length, laser welding, tension leveling and warehousing.
See “Item 8. – Financial Statements and Supplementary Data – Notes to Consolidated Financial Statements – Note J – Investments in Unconsolidated Affiliates” for further information about Worthington’s participation in unconsolidated joint ventures.
Environmental Regulation
Worthington’s manufacturing facilities, generally in common with those of similar industries making similar products, are subject to many federal, state and local requirements relating to the protection of the environment. Worthington continually examines ways to reduce emissions and waste and to decrease costs related to environmental compliance. The cost of compliance or capital expenditures for environmental control facilities required to meet environmental requirements are not anticipated to be material when compared with overall costs and capital expenditures and, accordingly, are not anticipated to have a material effect on ourthe financial position, results of operations, or cash flows, or the competitive position of the Company.
Future results and the market price for Worthington Industries’ common shares are subject to numerous risks, many of which are driven by factors that cannot be controlled or predicted. The following discussion, as well as other sections of this Annual Report on Form 10-K, including “Item 7. – Management’sManagement's Discussion and Analysis of Financial Condition and Results of Operations,” describe certain business risks. Consideration should be given to the risk factors described below as well as those in the Safe Harbor Statement at the beginning of this Annual Report on Form 10-K, in conjunction with reviewing the forward-looking statements and other information contained in this Annual Report on Form 10-K.
Raw Material Prices
Our future operating results may be affected by fluctuations in raw material prices.Our principal raw material is flat-rolled steel, which we purchase from multiple primary steel producers. The steel industry as a whole is very cyclical, and at times availability and pricing can be volatile due to a number of factors beyond our control. These factors include general economic conditions, domestic and worldwide demand, curtailed production at major mills due to factors such as equipment breakdowns, repairs or catastrophic events, labor costs or problems, competition, import duties, tariffs, energy costs, availability and cost of steel inputs (e.g. ore, scrap, coke, energy, etc.), currency exchange rates and those other factors described under “Raw Material Availability.” This volatility can significantly affect our steel costs. In an environment of increasing prices for steel and other raw materials, competitive conditions may impact how much of the price increases we can pass on to our customers and to the extent we are unable to pass on future price increases in our raw materials to our customers, our financial results could be adversely affected. Also, if steel prices in general decrease, competitive conditions may impact how quickly we must reduce our prices to our customers and we could be forced to use higher-priced raw materials to complete orders for which the sales prices have decreased.
Raw Material Availability
The costs of manufacturing our products and the ability to supply our customers could be negatively impacted if we experience interruptions in deliveries of needed raw materials or supplies.If for any reason our supply of flat-rolled steel or other key raw materials, such as aluminum and zinc, is curtailed or we are otherwise unable to obtain the quantities we need at competitive prices, our business could suffer and our financial results could be adversely affected. Such interruptions might result from a number of factors including events such as a shortage of capacity in the supplier base or of the raw materials, energy or the inputs needed to make steel or other supplies, financial difficulties of suppliers, significant events affecting their facilities, significant weather events, those factors listed under “Raw Material Prices” or other factors beyond our control. Further, the number of suppliers has decreased in recent years due to industry consolidation and the financial difficulties of certain suppliers, and consolidation may continue. Accordingly, if delivery from a major supplier is disrupted, it may be more difficult to obtain an alternative supply than in the past.
Inventories
Our business could be harmed if we fail to maintain proper inventory levels.We are required to maintain substantial inventories to accommodate the needs of our customers, including in many cases, short lead times and just-in-time delivery requirements. Although we typically have customer orders in hand prior to placement of our raw material orders for Steel Processing, we anticipate and forecast customer demand for all business segments. We purchase raw materials on a regular basis in an effort to maintain our inventory at levels that we believe are sufficient to satisfy the anticipated needs of our customers based upon orders, customers volume expectations, historic buying practices and market conditions. Inventory levels in excess of customer demand may result in the use of higher-priced inventory to fill orders reflecting lower sales prices, if steel prices have significantly decreased. These events could adversely affect our financial results. Conversely, if we underestimate demand for our products or if our suppliers fail to supply quality products in a timely manner, we may experience inventory shortages. Inventory shortages might result in unfilled orders, negatively impact customer relationships, and result in lost revenues, any of which could harm our business and adversely affect our financial results.
Economic or Industry Downturns
Downturns or weaknessThe current global recession has adversely affected and is likely to continue to adversely affect our business and our industries, as well as the industries of many of our customers and suppliers. The volatile domestic and global recessionary climate is having significant negative impacts on our business. The global recession has resulted in a significant decrease in customer demand throughout nearly all of our markets, including our two largest markets – construction and automotive. The impacts of government approved and proposed measures to aid economic recovery, including economic stimulus legislation and assistance to automotive manufacturers and others, are currently unknown. Overall, operating levels across our businesses have fallen and may remain at depressed levels until economic conditions improve and demand increases.
Continued volatility in the United States and worldwide capital and credit markets has impacted and is likely to continue to significantly impact our end markets and result in continued negative impacts on demand, increased credit and collection risks and other adverse effects on our business. The domestic and worldwide capital and credit markets have experienced and are experiencing significant volatility, disruptions and dislocations with respect to price and credit availability. These have caused diminished availability of credit and other capital in our end markets, including automotive and construction, and for participants in, and the customers of, those markets. There is continued uncertainty as to when and if the capital and credit markets will improve and the impact this period of volatility will have on our end markets and business in general.
The construction and automotive industries account for a significant portion of our net sales, and reductions in demand from these industries have adversely impacted and are likely to continue to adversely affect our business. The overall downturn in the economy, the disruption in capital and credit markets, declining real estate values and reduced consumer spending have caused significant reductions in demand from our end markets in general, and in particular, the construction and automotive end markets.
Demand in the commercial and residential construction markets has weakened as it has become more difficult for companies and consumers to obtain credit for construction projects and the economic slowdown has caused delays in or cancellations of construction projects.
The domestic auto industry is currently experiencing a very difficult operating environment, which has resulted in keyand will likely continue to result in lower levels of vehicle production and an associated decrease in demand for products sold to the automotive industry. Many automotive manufacturers and their suppliers have reduced production levels and eliminated manufacturing capacity, through the closure of facilities, extension of temporary shutdowns, reduction in operations, and other cost reduction actions. The difficulties faced by these industries such as commercial construction or automotive, mayare likely to continue to adversely affect our business.
Financial difficulties and bankruptcy filings by the Company’s customers which may cause the demand forcould have an adverse impact on our products and services to decline and adversely affect our financial results.business. Many of our customers are in industriesexperiencing extremely challenging financial conditions. General Motors and businesses thatChrysler have gone through bankruptcy proceedings and both companies have implemented plans to significantly reduce production capacity and their dealership networks. Certain other customers have filed or are cyclical in nature and affected by changes in general economic conditions or conditions specific to their respective markets, such as the commercial construction and automotive industries. Product demand in our customer’s end markets is based on numerous factors such as interest rates, general economic conditions, consumer confidence,contemplating filing bankruptcy petitions. These and other factors beyond our control. Downturnscustomers may be in demand from the commercial construction industry, the automotive industryneed of additional capital or any of the other industries we serve, or a decrease in the margins that we can realize from sales of our productscredit to customers in any of these industries, could adversely affect our financial results.
Reduced commercial construction activity, especially office building, could negatively impact our financial results.continue operations. The commercial construction market is a key end market with approximately 41% of our net sales going to that market in fiscal 2006. If commercial construction activity in the United States, in general, or by one or more of our major customers, in particular, were to be reduced significantly, it could negatively affect our salesbankruptcies and financial results.
Reduced automotive/truck production and the financial difficulties of customers in this market could negatively impact our financial results. The automotive and truck market remains a key customer group with approximately 33% of our net sales derived from that market in fiscal 2006. Total domestic automotive production in fiscal 2006 was at a relatively high level on an historical basis. If domestic automotive production, in general, or by one or more of our major domestic customers, in particular, were to be reduced significantly, it could negatively affect our sales and financial results.
The financial difficulties and internal strategies of customers could adversely affect us.A portion of our business is highly dependent on automotive manufacturers, many of which have publicly announced plans to reduce production levels and eliminate excess manufacturing capacity including plans to eliminate jobs and reduce costs. The financial difficulties of certain customers and theand/or failure in their efforts under way by our customers to obtain credit or otherwise improve their overall financial condition could result in numerous changes that are beyond our control,within the markets we serve, including additional unannounced customer plant closings, decreased production, reduced demand, changes in product mix, or distribution patterns, volume reductions, labor disruptions, changes or disruptions in our accounts receivable, mandatory reductions or other unfavorable changes in our pricing,the prices, terms or service conditions or market share losses, as well aswe are able to obtain, and other changes wethat may not accurately anticipate. These events could adverselyresult in decreased purchases from us and otherwise negatively impact our business. These conditions also increase the risk that our customers may default on their payment obligations to us, particularly customers in hard hit industries such as automotive and construction.
The overall weakness among automotive manufacturers and their suppliers has increased the risk that at least some of the Company's customers, which are suppliers to the automotive industry, could have further financial results.difficulties. The same is true of the Company's customers in other industries, including construction, which are also experiencing significant financial weakness. Should the economy or any applicable market not improve, the risk of bankruptcy filings by the Company's customers will continue to increase. Such filings may result in not only in a reduction in sales, but also in a loss associated with the potential inability to collection outstanding accounts receivables. While the Company takes steps intended to mitigate the impact of financial difficulties and potential bankruptcy filings by its customers, these matters could have a negative impact on the Company's business.
The loss of significant volume from key customers could adversely affect us.us. In fiscal 2006,2009, our largest customer accounted for approximately 5%4% of our consolidated gross sales, and our ten largest customers
accounted for approximately 25%22% of our consolidated gross sales. A significant loss of, or decrease in, business from any of these customers could have an adverse effect on our sales and financial results if we cannot obtain replacement business. Also, due to consolidation in the industries we serve, including the commercial construction, automotive and retail industries, our gross sales may be increasingly sensitive to deterioration in the financial condition of, or other adverse developments with respect to, one or more of our top customers.
Raw Material Pricing and Availability
The costs of manufacturing our products and the ability to supply our customers could be negatively impacted if we experience interruptions in deliveries of needed raw materials or supplies. If, for any reason, our supply of flat-rolled steel or other key raw materials, such as aluminum and zinc, is curtailed or we are otherwise unable to obtain the quantities we need at competitive prices, our business could suffer and our financial results could be adversely affected. Such interruptions might result from a number of factors including events such as a shortage of capacity in the supplier base or of the raw materials, energy or the inputs needed to make steel or other supplies, failure of suppliers to fulfill their supply obligations, financial difficulties of suppliers, significant events affecting supplier facilities, significant weather events, those factors listed in the immediately following paragraphs or other factors beyond our control. Further, the number of suppliers has decreased in recent years due to industry consolidation and the financial difficulties of certain suppliers, and consolidation may continue. Accordingly, if delivery from a major supplier is disrupted, it may be more difficult to obtain an alternative supply than in the past.
Our future operating results may be affected by fluctuations in raw material prices. Our principal raw material is flat-rolled steel, which we purchase from multiple primary steel producers. The steel industry as a whole has been cyclical, and at times availability and pricing can be volatile due to a number of factors beyond our control. These factors include general economic conditions, domestic and worldwide demand, curtailed production at major mills due to factors such as equipment breakdowns, repairs or catastrophic events, labor costs or problems, competition, import duties, tariffs, energy costs, availability and cost of steel inputs (e.g. ore, scrap, coke, energy, etc.), currency exchange rates, and other factors described immediately in the preceding paragraph. This volatility can significantly affect our steel costs.
In an environment of increasing prices for steel and other raw materials, competitive conditions may impact how much of the price increases we can pass on to our customers. To the extent we are unable to pass on future price increases in our raw materials to our customers, our financial results could be adversely affected. Also, if steel prices decrease, in general, competitive conditions may impact how quickly we must reduce our prices to our customers and we could be forced to use higher-priced raw materials to complete orders for which the selling prices have decreased. Decreasing steel prices may also require the Company to write-down the value of its inventory to reflect current market pricing, as was the case during fiscal 2009. These write-downs are discussed further in "Item 7 – Management's Discussion and Analysis of Financial Condition and Results of Operations."
Inventories
Our business could be harmed if we fail to maintain proper inventory levels. We are required to maintain sufficient inventories to accommodate the needs of our customers including, in many cases, short lead times and just-in-time delivery requirements. Although we typically have customer orders in hand prior to placement of our raw material orders for Steel Processing, we anticipate and forecast customer demand for all business segments. We purchase raw materials on a regular basis in an effort to maintain our inventory at levels that we believe are sufficient to satisfy the anticipated needs of our customers based upon orders, customer volume expectations, historic buying practices and market conditions. Inventory levels in excess of customer demand may result in the use of higher-priced inventory to fill orders reflecting lower selling prices, if steel prices have significantly decreased. These events could adversely affect our financial results. Conversely, if we underestimate demand for our products or if our suppliers fail to supply quality products in
a timely manner, we may experience inventory shortages. Inventory shortages might result in unfilled orders, negatively impacting our customer relationships, and resulting in lost revenues, any of which could harm our business and adversely affect our financial results.
Competition
Our business is highly competitive, and increased competition could negatively impact our financial results. Generally, the markets in which we conduct business are highly competitive. Competition for most of our products is primarily on the basis of price, product quality, and our ability to meet delivery requirements, and price.requirements. The current economic recession has also resulted in significant open capacity which could increase competitive presence. Increased competition could cause us to lose market share, increase expenditures, lower our margins or offer additional services at a higher cost to us, which could adversely impact our financial results.
Material Substitution
In certain applications, steel competes with other materials, such as aluminum (particularly in the automobile industry), cement and wood (particularly in the construction industry), composites, glass and plastic.Prices of all of these materials fluctuate widely and differences between them and steel prices may adversely affect
demand for our products and/or encourage substitution, which could adversely affect prices and demand for steel products. The high cost of steel relative to other materials can make material substitution more attractive for certain uses.
Freight and Energy
The availability and cost of freight and energy, such as electricity, natural gas and diesel fuel, is important in the manufacture and transport of our products.Our operating costs increase when energy costs rise. During periods of increasing freight and energy costs, we might not be able to fully recover our operating cost increases through price increases without reducing demand for our products. Our financial results could be adversely affected if we are unable to pass all of the increases on to our customers or if we are unable to obtain the necessary freight and energy. Also, increasing energy costs could put a strain on the transportation of materials and products if it forces certain transporters to close.
Information Systems
We are subject to information system security risks and systems integration issues that could disrupt our internal operations.We are dependent upon information technology for the distribution of information internally and also to our customers and suppliers. This information technology is subject to damage or interruption from a variety of sources, including but not limited to computer viruses, security breaches and defects in design. There also could be system or network disruptions if new or upgraded business management systems are defective or are not installed properly.properly, or are not properly integrated into operations. We are currently in the process of implementingrecently implemented a new software-based enterprise resource planning system (“ERP”). For more information related to the new ERP, see “Part II – Item 9A. – Controls and Procedures – New ERP System.” system. Various measures have been implemented to manage our risks related to information system and network disruptions, but a system failure or failure to implement new systems properly could negatively impact our operations and financial results.
Business Disruptions
Disruptions to our business or the business of our customers or suppliers, could adversely impact our operations and financial results.Business disruptions, including increased costs for or interruptions in the supply of energy or raw materials, resulting from shortages of supply or transportation, from severe weather events such(such as hurricanes, floods blizzards,and blizzards), from casualty events such(such as explosions, fires or material equipment breakdown,breakdown), from acts of terrorism, from pandemic disease, from labor disruptions, or from other
events such(such as required maintenance shutdowns, canshutdowns), could cause interruptions to our businesses as well as the operations of our customers and suppliers. Such interruptionsWhile we maintain insurance coverage that can offset some losses relating to certain types of these events, some could have an adverse effect on our operations and financial results.results and we can be adversely impacted to the extent any such losses are not covered by insurance or cause some other adverse impact to the Company.
Foreign
Economic, political and other risks associated with foreign operations could adversely affect our international financial results.Although the substantial majority of our business activity takes place in the United States, we derive a portion of our revenues and earnings from operations in foreign countries, and are subject to risks associated with doing business internationally. Our sales originating outside the United States represented approximately 10% of our consolidated net sales in fiscal 2006. We have wholly-owned facilities in Austria, Canada, the Czech Republic and Portugal and joint venture facilities in China, France, Mexico, Spain and the United Kingdom. The risks of doing business in foreign countries include the potential for adverse changes in the local political climate, in diplomatic relations between foreign countries and the United States or in government policies, laws or regulations,regulations; terrorist activity that may cause social disruption,disruption; logistical and communications challenges,challenges; costs of complying with a variety of laws and regulations,regulations; difficulty in staffing and managing geographically diverse operations,operations; deterioration of foreign economic conditions,conditions; currency rate fluctuations,fluctuations; foreign exchange restrictions,restrictions; differing local business practices and cultural considerations,considerations; restrictions on imports and exports or sources of supplysupply; and changes in duties or taxes. We believe that our business activities outside of the United States involve a higher degree of risk than our domestic activities.
The global recession and the volatility of worldwide capital and credit markets have impacted and will likely continue to significantly impact our foreign customers and markets. This has decreased demand in our foreign operations and is having significant negative impacts on our business. See in general the discussion under“Economic or Industry Downturns”.
Joint Ventures
A change in the relationship between the members of our joint ventures may have an adverse effect on that joint venture. Worthington has been successful in the development and operation of various joint ventures, and equity in net income from our joint ventures, particularly WAVE, has been important to our financial results. We believe an important element in the success of any joint venture is a solid relationship between the members of that joint venture. If there is a change in ownership, a change of control, a change in management or other event with respect to a member that adversely impacts the relationship between the members, it may adversely impact the joint venture.
Acquisitions
We may not be able to consummate, manage and integrate future acquisitions successfully.Some of our growth has been through acquisitions. We continue to seek additional businesses to acquire in the future. There are no assurances, however, that any acquisition opportunities will arise or, if they do, that they will be consummated, or that any
needed additional financing will be available on satisfactory terms when required. In addition, acquisitions involve risks that the businesses acquired will not perform in accordance with expectations, that business judgments concerning the value, strengths and weaknesses of businesses acquired will prove incorrect, that the acquired businesses may not be integrated successfully and that the acquisitions may strain our management resources.
Accounting & Tax Estimates
We are required to make accounting and tax-related estimates and judgments in preparing our consolidated financial statements.In preparing our consolidated financial statements in accordance with accounting principles generally accepted in the United States, we make certain estimates and assumptions that affect the
accounting for and recognition of assets, liabilities, revenues and expenses. These estimates and assumptions must be made because certain information that is used in the preparation of our consolidated financial statements is dependent on future events, or cannot be calculated with a high degree of precision from data available or is not capable of being readily calculated based on generally accepted methodologies.available. In some cases, these estimates are particularly difficult to determine and we must exercise significant judgment. The estimates and the assumptions having the greatest amount of uncertainty, subjectivity and complexity are related to our accounting for bad debts, returns and allowances, inventory, self-insurance reserves, derivatives, stock-based compensation, deferred income taxes, and asset and goodwill impairments. Actual results could differ materially from the estimates and assumptions that we use, which could have a material adverse effect on our financial condition and results of operations.
Claims and Insurance
Adverse claims experience, to the extent not covered by insurance, may have an adverse effect on our financial results.We self-insure a significant portion of our potential liability for workers’workers' compensation, costs, product liability, claims and recall exposure, general liability, claims,property, automobile liability, stop loss and employee medical claims and casualty risks.claims. In order to reduce risk, and better manage our overall loss exposure, we purchase stop-loss or other insurance from highly rated licensed insurance carriers that covers most claims in excess of the deductible or retained amounts. We maintain an accrual for the estimated cost to resolve open claims as well as an estimate of the cost of claims that have been incurred but not reported. The occurrence of a significant claims, losses on recalls, our failure to adequately reserve for such claims, a significant cost increase to maintain our insurance, or the failure of our insurance provider to perform, could have an adverse impact on our financial results.condition and results of operations.
Principal Shareholder
Our principal shareholder may have the ability to exert significant influence in matters requiring a shareholder vote and could delay, deter or prevent a change in control of Worthington Industries.Pursuant to our charter documents, certain matters such as those in which a person would attempt to acquire or take control of the Company, must be approved by the vote of the holders of common shares representing at least 75% of Worthington Industries’ outstanding voting power. Approximately 15.9%24% of our outstanding common shares may be votedare beneficially owned by John H.P. McConnell, our Founder.Chairman of the Board and Chief Executive Officer. As a result of his voting power, John H.beneficial ownership, Mr. McConnell may have the ability to exert significant influence in these matters and other proposals upon which our shareholders vote upon.vote.
Credit Ratings
Rating agencies may downgrade our credit ratings, which could make it more difficult for us to raise capital and it could increase our financing costs. Any downgrade in our credit ratings may make raising capital more difficult, may increase the cost and affect the terms of future borrowings, may affect the terms under which we purchase goods and services, and may limit our ability to take advantage of potential business opportunities. The rate on some of our credit facilities is tied to our credit rating. Any downgrade would likely result in an increase in the current cost of our revolving credit facility.
Difficult Financial Markets
Should we be required to raise capital in the current financing environment, potential outcomes might include higher borrowing costs, less available capital, more stringent terms and tighter covenants, or in extreme conditions, an inability to raise capital. Although the Company currently has significant borrowing availability under its existing credit facilities, should those facilities become unavailable due to covenant or other defaults, or should we otherwise be required to raise capital outside existing facilities, given the current uncertainty in the financial markets, our ability to access capital and the terms under which we do so may change. Any adverse change in our access to capital or the terms of our borrowings, including increased costs, would have a negative impact on the Company.
Impairment Charges
Continued or enhanced weakness in the economy, our markets, and our results could result in future asset impairments, which would reduce our reported earnings and net worth. We review the carrying value of our long-lived assets, including intangible assets with finite useful lives, whenever events or changes in circumstances indicate that the carrying value of an asset or a group of assets may not be recoverable. When a potential impairment is indicated, accounting standards require a charge to be recognized in the consolidated financial statements if the carrying amount of an asset or group of assets exceeds the fair value of that asset or group of assets. The loss recognized would be the difference between the fair value and the carrying amount of the asset or group of assets.
Item 1B. — Unresolved Staff Comments
Worthington Industries has no unresolved SEC staff comments.None.
Item 2. — PropertiesProperties.
General
The principal corporate offices of Worthington Industries, as well as the corporate offices for Worthington Cylinders, and Worthington Steel, and Dietrich are located in a leased office building in Columbus, Ohio.Ohio, containing approximately 117,700 square feet. Worthington also owns three facilities used for administrative and medical purposes in Columbus, Ohio, containing an aggregate of approximately 166,000 square feet. As of May 31, 2006,2009, Worthington owned or leased a total of approximately 9,200,0009,000,000 square feet of space for operations, of which approximately 8,800,0007,500,000 square feet is(8,500,000 square feet with warehouses) was devoted to manufacturing, product distribution and sales offices. Major leases contain renewal options for periods of up to ten years. For information concerning rental obligations, see the discussion of contractual obligations under
“Item “Item 7. – Management’s Discussion and Analysis of Financial Condition and Results of Operations –Contractual Cash Obligations and Other Commercial Commitments”Commitments” as well as “Item 8. – Financial Statements and Supplementary Data – Notes to Consolidated Financial Statements – Note L – Operating Leases.”Leases” of this Annual Report on Form 10-K. Distribution and office facilities provide adequate space for operations and are well maintained and suitable.
Excluding joint ventures, Worthington operates 4641 manufacturing facilities and twoeleven warehouses. The facilities are generally well maintained and in good operating condition, and are believed to be sufficient to meet current needs.
Steel Processing
The Steel Processing reportablebusiness segment, which includes the consolidated joint venture Spartan, operates eightnine manufacturing facilities, seveneight of which are ownedwholly-owned, containing approximately 2,990,000 square feet, and one of which is leased.leased, containing approximately 150,000 square feet. These facilities are located in Alabama, California, Indiana, Kentucky, Maryland, Michigan, and Ohio (3)., and South Carolina. This business segment also maintains aowns one warehouse in Ohio containing approximately 110,000 square feet and one warehouse in California containing approximately 60,000 square feet. As noted above, this business segment’s corporate offices are located in Columbus, Ohio. In addition, the segment includes Spartan, a consolidated joint venture which owns and operates a manufacturing facility in Michigan.
Metal Framing
The Metal Framing business segment operates 2617 manufacturing facilities: 2315 in the United States and threetwo in Canada. In the United States, these facilities are located in Arizona (2), California (2), Colorado, Florida, (3), Georgia, Hawaii, Illinois, Indiana, (2), Kansas, Maryland, Massachusetts, New Jersey, Ohio (2), South Carolina,and Texas (2), and Washington. The. In Canada, the facilities in Canada are located in British Columbia Ontario and Quebec.Ontario. Of these manufacturing facilities, 12eight are leased containing
approximately 640,000 square feet and nine are owned containing approximately 1,400,000 square feet. This segment operates three warehouses – one warehouse in Ohio which is owned and contains approximately 314,000 square feet and two in Canada which are leased and 14 are owned.contain approximately 66,000 square feet. This business segment also owns and operates an administrative facility containing approximately 37,000 square feet in Indiana; and leases administrative space in three locations containing approximately 30,000 square feet in California, Indiana, and Pennsylvania. During fiscal 2009, Metal Framing corporate and administrative offices were closed and moved from Pennsylvania to Columbus, Ohio. As part of the Plan announced by the Company in PittsburghSeptember 2007, this business segment has ceased manufacturing operations at two owned and Blairsville, Pennsylvania.five leased facilities. The two owned facilities are currently up for sale. Of the leased facilities, one lease expired concurrently with the closing of the facility and the other four leases, which expire between 2010 and 2015, are being offered for subletting.
Pressure Cylinders
The Pressure Cylinders business segment operates eight manufacturing facilities. Theowned manufacturing facilities located in Ohio (3), Wisconsin, Austria, Canada, the Czech Republic and Portugal containing approximately 1,200,000 square feet and two owned warehouses in Austria and the Czech Republic are all owned, and thecontaining approximately 96,000 square feet. The newly acquired Piper operation owns one manufacturing facilities locatedfacility in Wisconsin and Portugal are leased.Mississippi, which has not been included in this count.
Other
Steelpac operates three facilities, one each in Indiana, Ohio and Pennsylvania. The manufacturing facilities in Indiana and Pennsylvania are leased manufacturingand contain approximately 290,000 square feet; and the facility located in Pennsylvania.Ohio is owned and contains approximately 18,000 square feet. Gerstenslager owns and operates two manufacturing facilities, both located in Ohio, containing approximately 1,100,000 square feet; and leases approximately 200,000 square feet in one warehouse in Ohio. The Construction Services hasbusiness segment operates manufacturing facilities in Tennessee and Washington and leases approximately 6,300 square feet for three administrative offices in Ohio,Hawaii, Tennessee and China. Worthington Stairs leases one manufacturing facility in Ohio, which contains approximately 200,000 square feet.
Joint Ventures
The Spartan consolidated joint venture owns and operates one manufacturing facility in Michigan, which is included in the number disclosed above for the Steel Processing business segment. The unconsolidated joint ventures operate 14a total of 18 manufacturing facilities, located in Indiana,Alabama, Maryland, Michigan (3)(6), Missouri, Nevada and Ohio, domestically, and in China, France, Mexico (2)(5), Spain and the United Kingdom, internationally. The Serviacero Worthington joint venture opened a manufacturing facility in Monterrey, Mexico in mid-July 2009, which is not included in this count.
Various legal actions, which generally have arisen in the ordinary course of business, are pending against Worthington. None of this pending litigation, individually or collectively, is expected to have a material adverse effect on ourthe financial position, results of operation or cash flows.flows of the Company.
Item 4. — Submission of Matters to a Vote of Security Holders
NoneNo response required.
Supplemental Item.Item — Executive Officers of the Registrant.Registrant
The following table lists the names, positions held and ages of the Registrant’s executive officers as of August 1, 2006:July 30, 2009:
Name | Age | Position(s) with the Registrant | Present Office Held Since | Age | Position(s) with the Registrant | Present Office Held Since | ||||||
John P. McConnell | 52 | Chairman of the Board and Chief Executive Officer | 1996 | 55 | Chairman of the Board and Chief Executive Officer; a Director | 1996 | ||||||
John S. Christie | 56 | President and Chief Financial Officer | 2004 | |||||||||
George P. Stoe | 63 | President and Chief Operating Officer | 2008 | |||||||||
B. Andrew Rose | 39 | Vice President and Chief Financial Officer | 2008 | |||||||||
Dale T. Brinkman | 53 | Vice President-Administration, General Counsel and Secretary | 2000 | 56 | Vice President-Administration, General Counsel and Secretary | 2000 | ||||||
Harry A. Goussetis | 52 | President, Worthington Cylinder Corporation | 2006 | 55 | President, Worthington Cylinder Corporation | 2005 | ||||||
Joe W. Harden | 56 | President, The Worthington Steel Company | 2003 | |||||||||
Lester V. Hess | 51 | Treasurer | 2006 | |||||||||
Edmund L. Ponko, Jr. | 48 | President, Dietrich Industries, Inc. | 2001 | |||||||||
Matthew A. Lockard | 40 | Vice President-Corporate Development and Treasurer | 2009 | |||||||||
John E. Roberts | 54 | President, Dietrich Industries, Inc. | 2007 | |||||||||
Ralph V. Roberts | 59 | Senior Vice President-Marketing | 2001 | 62 | Senior Vice President-Marketing; President, Worthington Integrated Building Systems, LLC | 2006 | ||||||
George P. Stoe | 60 | Executive Vice President and Chief Operating Officer | 2006 | |||||||||
Mark A. Russell | 46 | President, The Worthington Steel Company | 2007 | |||||||||
Eric M. Smolenski | 39 | Vice President-Human Resources | 2005 | |||||||||
Richard G. Welch | 48 | Controller | 2000 | 51 | Controller | 2000 | ||||||
Virgil L. Winland | 58 | Senior Vice President-Manufacturing | 2001 | 61 | Senior Vice President-Manufacturing | 2001 | ||||||
John P. McConnell has served as Worthington Industries’ Chief Executive Officer since June 1993, as a director of Worthington Industries continuously since 1990, and as Chairman of the Board of Worthington Industries since September 1996. Mr. McConnell also serves as the ChairmanChair of the Executive Committee of Worthington Industries’ Board of Directors. Mr. McConnellHe has served in various positions with Worthington Industries since 1975.
John S. ChristieGeorge P. Stoe has served as President and as a director of Worthington Industries continuously since June 1999. He became interim Chief FinancialOperating Officer of Worthington Industries in September 2003 and Chief Financial Officer in January 2004.since October 2008. He also served as Executive Vice President and Chief Operating Officer of Worthington Industries from June 1999 until September 2003.December 2005 to October 2008. He previously served as President of Worthington Cylinder Corporation from January 2003 to December 2005.
B. Andrew ‘Andy’ Rose has served as Vice President and Chief Financial Officer of Worthington Industries since December 2008. From 2007 through 2008, he served as a senior investment professional with MCG Capital Corporation, a $1.1 billion investment company; and from 2002 to 2007, was a founding partner at Peachtree Equity Partners, L.P., a $170 million private equity firm backed by Goldman Sachs, where he managed debt and equity recapitalizations for manufacturing, distribution and service firms, served on the Board of Directors of various companies, advised management on growth strategies and operations and managed the firm's institutional investor base. Prior to 2002, he was vice president of private equity at Wachovia Capital Associates.
Dale T. Brinkman has served as Worthington Industries’ Vice President-Administration since December 1998 and General Counsel since September 1982. He has been Secretary of Worthington Industries since September 2000 and served as Assistant Secretary of Worthington Industries from September 1982 to September 2000.
Harry A. Goussetis has served as President of Worthington Cylinder Corporation since December 2005. He served as Vice President Human Resources for Worthington Industries fromFrom January 2001 to December 2005, Mr. Goussetis served as Vice President-Human Resources for Worthington Industries, and he held various other positions with Worthington Industries from November 1983 to January 2001.
Joe W. Harden
Matthew A. Lockard has served as PresidentTreasurer of The Worthington Steel CompanyIndustries since February 2003.2009, and as Vice President-Corporate Development since July 2005. From February 1999 through February 2003,April 2001 to July 2005, Mr. HardenLockard served as President of Buckeye Steel Castings Company in Columbus, Ohio, which filed a voluntary petition under the Federal Bankruptcy Act in December 2002.
Lester V. Hess has servedVice President-Global Business Development for Worthington Industries as Treasurer since February 2006. Prior thereto he served Worthington Industries as Assistant Treasurer from November 2003 to February 2006; and as Director of Treasury from August 2002 to November 2003. Prior to August 2002,Cylinder Corporation. Mr. HessLockard served in various accounting and financeother positions with MeadWestvaco Corporation (formerly, The Mead Corporation), a $6 billion global packaging company, for more than five years.
Edmund L. Ponko, Jr.John E. Roberts has served as President of Dietrich Industries, Inc. since June 2001. PriorOctober 2007, and prior thereto, Mr. Ponko served Dietrich Industries, Inc. as Executiveits Vice President of Sales and Marketing from 1998June 2007 to 2001, as marketing managerOctober 2007. He was Regional General Manager, Director of Sales and Marketing for Owens Corning, a producer of residential and commercial building materials, from 1987 to 1998, and as a sales representative from 1981 to 1987.June 1996 through June 2007.
Ralph V. Roberts has served as President of Worthington Integrated Building Systems, LLC since November 2006; and has been Senior Vice President-Marketing of Worthington Industries since January 2001. From June 1998 through January 2001, he served as President of The Worthington Steel Company. Prior to that time, Mr. Roberts servedCompany, and he held various other positions with Worthington Industries sincefrom December 1973 in various positions,to June 1998, including Vice President-Corporate Development and PresidentChief Executive Officer of the WAVE joint venture.
George P. StoeMark A. Russell has served as President of The Worthington Steel Company since February 2007. From August 2004 through February 2007, Mr. Russell was a partner in Russell & Associates, an acquisition group formed to acquire aluminum products companies. Mr. Russell served as Chief Executive Officer of Indalex Inc., a producer of extruded aluminum products, from January 2002 to March 2004.
Eric M. Smolenski has served as Vice PresidentPresident-Human Resources for Worthington Industries since January 2004. From January 2001 to January 2004, Mr. Smolenski served as the Director of Corporate Human Resources Services, and Chief Operatinghe served in various other positions with Worthington Industries from January 1994 to January 2001.
Richard G. Welch served as Principal Financial Officer of Worthington Industries since December 2005 and as President of Worthington Cylinder Corporationon an interim basis from January 2003August 2008 to December 2005. Mr. Stoe served2008. He currently serves as President of Zinc Corporation of America, the nation’s largest zinc producer, located in Monaca, Pennsylvania, from November 2000 until May 2002.
Richard G. WelchCorporate Controller, a position he has served as Controller of Worthington Industriesheld since March 2000. HePrior thereto, he served as Assistant Controller of Worthington Industries from September 1999 to March 2000.
Virgil L. Winland has served as Senior Vice President-Manufacturing of Worthington Industries since January 2001. He has served in various other positions with Worthington Industries sincefrom 1971 to January 2001, including President of Worthington Cylinder Corporation from June 19961998 through January 2001.
Executive officers serve at the pleasure of the directors of the Registrant. There are no family relationships among any of the Registrant’sRegistrant's executive officers or directors. No arrangements or understandings exist pursuant to which any individual has been, or is to be, selected as an executive officer of the Registrant.
Item 5.–—Market for Registrant’sRegistrant's Common Equity, Related Stockholder Matters and Issuer Purchases of Equity Securities
Common Shares Information
The common shares of Worthington Industries, Inc. (“Worthington Industries”) trade on the New York Stock Exchange (“NYSE”) under the symbol “WOR”"WOR" and are listed in most newspapers as “WorthgtnInd.”"WorthgtnInd." As of August 1, 2006,July 24, 2009, Worthington Industries had approximately 8,2008,171 registered shareholders. The following table sets forth (i) the low and high closing prices and the closing price per share for Worthington Industries’ common shares for each quarter of fiscal 20052009 and fiscal 2006,2008, and (ii) the cash dividends per share declared on Worthington Industries’ common shares duringfor each quarter of fiscal 20052009 and fiscal 2006.2008.
Cash Dividends Declared | ||||||||||
| Market Price | ||||||||||
| Low | High | Closing | ||||||||
Fiscal 2005 Quarter Ended | ||||||||||
August 31, 2004 | $18.62 | $20.59 | $20.35 | $0.16 | ||||||
November 30, 2004 | $19.32 | $22.71 | $21.51 | $0.16 | ||||||
February 28, 2005 | $18.93 | $21.48 | $20.95 | $0.17 | ||||||
May 31, 2005 | $15.36 | $21.01 | $16.76 | $0.17 | ||||||
Fiscal 2006 Quarter Ended | ||||||||||
August 31, 2005 | $15.56 | $18.11 | $18.10 | $0.17 | ||||||
November 30, 2005 | $18.29 | $21.08 | $20.29 | $0.17 | ||||||
February 28, 2006 | $18.96 | $20.89 | $19.60 | $0.17 | ||||||
May 31, 2006 | $16.85 | $21.19 | $17.03 | $0.17 | ||||||
| Market Price | Cash Dividends Declared | |||||||||||
| Low | High | Closing | ||||||||||
Fiscal 2009 Quarter Ended | ||||||||||||
August 31, 2008 | $ | 16.65 | $ | 24.11 | $ | 17.60 | $ | 0.17 | ||||
November 30, 2008 | $ | 8.83 | $ | 18.99 | $ | 13.28 | $ | 0.17 | ||||
February 28, 2009 | $ | 8.20 | $ | 13.89 | $ | 8.20 | $ | 0.17 | ||||
May 31, 2009 | $ | 7.15 | $ | 15.88 | $ | 13.99 | $ | 0.10 | ||||
Fiscal 2008 Quarter Ended | ||||||||||||
August 31, 2007 | $ | 19.60 | $ | 23.00 | $ | 21.16 | $ | 0.17 | ||||
November 30, 2007 | $ | 20.38 | $ | 25.86 | $ | 21.19 | $ | 0.17 | ||||
February 29, 2008 | $ | 14.58 | $ | 22.87 | $ | 17.59 | $ | 0.17 | ||||
May 31, 2008 | $ | 16.00 | $ | 19.94 | $ | 19.94 | $ | 0.17 | ||||
Dividends are declared at the discretion of the boardWorthington Industries’ Board of directors.Directors. Worthington IndustriesIndustries’ Board of Directors declared quarterly dividends of $0.17 per common share in fiscal 2006.2008 and fiscal 2009, until reducing the dividend declared in the fourth quarter of fiscal 2009 to $0.10 per common share. The boardBoard of directorsDirectors reviews the dividend quarterly and establishes the dividend rate based upon Worthington Industries’ financial condition, results of operations, capital requirements, current and projected cash flows, business prospects and other factors which the directors may deem relevant. While Worthington Industries has paid a dividend every quarter since becoming a public company in 1968, there is no guarantee that this will continue in the future.
Shareholder Return Performance
The following information in this Item 5 of this Annual Report on Form 10-K is not deemed to be “soliciting material” or to be “filed” with the Securities and Exchange Commission or subject to Regulation 14A or 14C under the Securities Exchange Act of 1934, as amended (the “Exchange Act”), or to the liabilities of Section 18 of the Exchange Act, and will not be deemed to be incorporated by reference into any filing under the Securities Act of 1933, as amended, or the Exchange Act, except to the extent we specifically incorporate such information into such a filing.
The following table provides information about purchases madegraph compares the five-year cumulative return on Worthington Industries’ common shares, the S&P Midcap 400 Index and the S&P 1500 Steel Composite Index. The graph assumes that $100 was invested at May 31, 2004, in Worthington Industries’ common shares and each index.
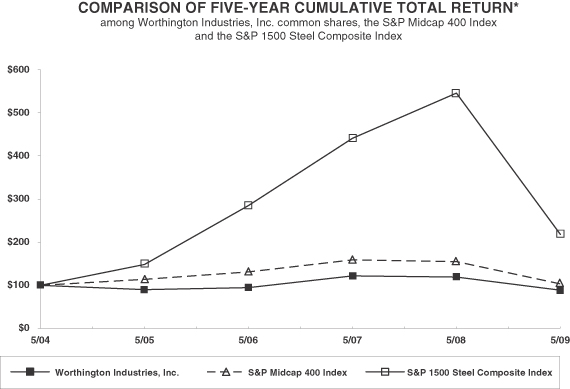
* $100 invested on 5/31/04 in common shares or index. Assumes reinvestment of dividends when received. Fiscal year ending May 31.
| 5/04 | 5/05 | 5/06 | 5/07 | 5/08 | 5/09 | |||||||||||||
Worthington Industries, Inc. | $ | 100.00 | $ | 90.43 | $ | 95.26 | $ | 122.38 | $ | 119.66 | $ | 88.62 | ||||||
S&P Midcap 400 Index | $ | 100.00 | $ | 113.98 | $ | 131.73 | $ | 159.64 | $ | 155.64 | $ | 103.50 | ||||||
S&P 1500 Steel Composite Index | $ | 100.00 | $ | 148.71 | $ | 286.02 | $ | 442.86 | $ | 547.94 | $ | 218.69 | ||||||
Data and graph provided by Zacks Investment Research, Inc. Copyright© 2009, Standard & Poor's, a division of The McGraw-Hill Companies, Inc. All rights reserved. Used with permission.
Worthington Industries became a part of the S&P Midcap 400 Index on December 17, 2004. The S&P 1500 Steel Composite Index, of which Worthington Industries is a component, is the most specific index relative to the largest line of business of Worthington Industries and its subsidiaries. At May 31, 2009, the S&P 1500 Steel Composite Index included 12 steel related companies from the S&P 500, S&P Midcap 400 and S&P 600 indices: AK Steel Holding Corporation; Allegheny Technologies Incorporated; A.M. Castle & Co.; Carpenter Technology Corporation; Cliffs Natural Resources Inc.; Commercial Metals Company; Nucor Corporation; Olympic Steel, Inc.; Reliance Steel & Aluminum Co.; Steel Dynamics, Inc.; United States Steel Corporation; and Worthington Industries.
Issuer Purchases of Equity Securities
No common shares of Worthington Industries were purchased by, or on behalf of, Worthington Industries or any “affiliated purchaser” (as defined in Rule 10b – 18(a) (3) under the Securities Exchange Act of 1934)Act) during the fiscal quarter ended May 31, 2009. The following table provides information about the number of common shares of Worthington Industries during each month ofthat may yet be purchased under the fiscal quarter ended May 31, 2006:publicly announced repurchase authorization:
Period | Total Number
| Average Price Paid per Common Share | Total Number
| Maximum Number of Common Shares that May Yet Be Purchased Under the Plans or Programs |
(1) | |||||||
March 1-31, | - | - | - | |||||||||
| 8,449,500 | ||||||||||||
April 1-30, | - | - | - | |||||||||
| 8,449,500 | ||||||||||||
May 1-31, | - | - | - | |||||||||
| 8,449,500 | ||||||||||||
Total | - | - | - | |||||||||
On June 13, 2005, Worthington Industries announced that the board of directors had authorized the repurchase of up to 10,000,000 of its outstanding common shares. The common shares may be purchased from time to time, with consideration given to the market price of the common shares, the nature of other investment opportunities, cash flows from operations and general economic conditions. Repurchases may be made on the open market or through privately negotiated transactions. During the fourth quarter of fiscal 2006, there were no repurchases of common shares.
| (1) | The number shown represents, as of the end of each period, the maximum number of common shares that could be purchased under the publicly announced repurchase authorization then in effect. On September 26, 2007, Worthington Industries announced that the Board of Directors had authorized the repurchase of up to 10,000,000 of Worthington Industries’ outstanding common shares. A total of 8,449,500 common shares were available under this repurchase authorization as of May 31, 2009. The common shares available for repurchase under this authorization may be purchased from time to time, with consideration given to the market price of the common shares, the nature of other investment opportunities, cash flows from operations, general economic conditions and other appropriate factors. Repurchases may be made on the open market or through privately negotiated transactions. |
Item 6. -— Selected Financial Data
| Fiscal Years Ended May 31, | Fiscal Year Ended May 31, | |||||||||||||||||||||||||||||||||||||||
| In thousands, except per share | 2006 | 2005 | 2004 | 2003 | 2002 | 2009 | 2008 | 2007 | 2006 | 2005 | ||||||||||||||||||||||||||||||
FINANCIAL RESULTS | ||||||||||||||||||||||||||||||||||||||||
Net sales | $ | 2,897,179 | $ | 3,078,884 | $ | 2,379,104 | $ | 2,219,891 | $ | 1,744,961 | $ | 2,631,267 | $ | 3,067,161 | $ | 2,971,808 | $ | 2,897,179 | $ | 3,078,884 | ||||||||||||||||||||
Cost of goods sold | 2,525,545 | 2,580,011 | 2,003,734 | 1,916,990 | 1,480,184 | 2,456,533 | 2,711,414 | 2,610,176 | 2,525,545 | 2,580,011 | ||||||||||||||||||||||||||||||
Gross margin | 371,634 | 498,873 | 375,370 | 302,901 | 264,777 | 174,734 | 355,747 | 361,632 | 371,634 | 498,873 | ||||||||||||||||||||||||||||||
Selling, general and administrative expense | 214,030 | 225,915 | 195,785 | 182,692 | 165,885 | 210,046 | 231,602 | 232,487 | 214,030 | 225,915 | ||||||||||||||||||||||||||||||
Impairment charges and other | - | 5,608 | 69,398 | (5,622 | ) | 64,575 | ||||||||||||||||||||||||||||||||||
Goodwill impairment | 96,943 | - | - | - | - | |||||||||||||||||||||||||||||||||||
Restructuring charges and other | 43,041 | 18,111 | - | - | 5,608 | |||||||||||||||||||||||||||||||||||
Operating income | 157,604 | 267,350 | 110,187 | 125,831 | 34,317 | |||||||||||||||||||||||||||||||||||
Operating income (loss) | (175,296 | ) | 106,034 | 129,145 | 157,604 | 267,350 | ||||||||||||||||||||||||||||||||||
Miscellaneous income (expense) | (1,524 | ) | (7,991 | ) | (1,589 | ) | (7,240 | ) | (3,224 | ) | (6,858 | ) | (6,348 | ) | (4,446 | ) | (1,524 | ) | (7,991 | ) | ||||||||||||||||||||
Nonrecurring losses | - | - | - | (5,400 | ) | (21,223 | ) | - | - | - | - | - | ||||||||||||||||||||||||||||
Gain on sale of Acerex | 26,609 | |||||||||||||||||||||||||||||||||||||||
Gain on sale of unconsolidated affiliates | 8,331 | - | - | 26,609 | - | |||||||||||||||||||||||||||||||||||
Interest expense | (26,279 | ) | (24,761 | ) | (22,198 | ) | (24,766 | ) | (22,740 | ) | (20,734 | ) | (21,452 | ) | (21,895 | ) | (26,279 | ) | (24,761 | ) | ||||||||||||||||||||
Equity in net income of unconsolidated affiliates | 56,339 | 53,871 | 41,064 | 29,973 | 23,110 | 48,589 | 67,459 | 63,213 | 56,339 | 53,871 | ||||||||||||||||||||||||||||||
Earnings from continuing operations before income | 212,749 | 288,469 | 127,464 | 118,398 | 10,240 | |||||||||||||||||||||||||||||||||||
Income tax expense | 66,759 | 109,057 | 40,712 | 43,215 | 3,738 | |||||||||||||||||||||||||||||||||||
Earnings (loss) from continuing operations before income taxes | (145,968 | ) | 145,693 | 166,017 | 212,749 | 288,469 | ||||||||||||||||||||||||||||||||||
Income tax expense (benefit) | (37,754 | ) | 38,616 | 52,112 | 66,759 | 109,057 | ||||||||||||||||||||||||||||||||||
Earnings from continuing operations | 145,990 | 179,412 | 86,752 | 75,183 | 6,502 | |||||||||||||||||||||||||||||||||||
Discontinued operations, net of taxes | - | - | - | - | - | |||||||||||||||||||||||||||||||||||
Extraordinary item, net of taxes | - | - | - | - | - | |||||||||||||||||||||||||||||||||||
Cumulative effect of accounting change, net of taxes | - | - | - | - | - | |||||||||||||||||||||||||||||||||||
Earnings (loss) from continuing operations | (108,214 | ) | 107,077 | 113,905 | 145,990 | 179,412 | ||||||||||||||||||||||||||||||||||
Net earnings | $ | 145,990 | $ | 179,412 | $ | 86,752 | $ | 75,183 | $ | 6,502 | ||||||||||||||||||||||||||||||
Net earnings (loss) | $ | (108,214 | ) | $ | 107,077 | $ | 113,905 | $ | 145,990 | $ | 179,412 | |||||||||||||||||||||||||||||
Earnings per share - diluted: | ||||||||||||||||||||||||||||||||||||||||
Earnings (loss) per share – diluted: | ||||||||||||||||||||||||||||||||||||||||
Continuing operations | $ | 1.64 | $ | 2.03 | $ | 1.00 | $ | 0.87 | $ | 0.08 | $ | (1.37 | ) | $ | 1.31 | $ | 1.31 | $ | 1.64 | $ | 2.03 | |||||||||||||||||||
Discontinued operations, net of taxes | - | - | - | - | - | |||||||||||||||||||||||||||||||||||
Extraordinary item, net of taxes | - | - | - | - | - | |||||||||||||||||||||||||||||||||||
Cumulative effect of accounting change, net of taxes | - | - | - | - | - | |||||||||||||||||||||||||||||||||||
Net earnings per share | $ | 1.64 | $ | 2.03 | $ | 1.00 | $ | 0.87 | $ | 0.08 | ||||||||||||||||||||||||||||||
Net earnings (loss) per share | $ | (1.37 | ) | $ | 1.31 | $ | 1.31 | $ | 1.64 | $ | 2.03 | |||||||||||||||||||||||||||||
Continuing operations: | ||||||||||||||||||||||||||||||||||||||||
Depreciation and amortization | $ | 59,116 | $ | 57,874 | $ | 67,302 | $ | 69,419 | $ | 68,887 | $ | 64,073 | $ | 63,413 | $ | 61,469 | $ | 59,116 | $ | 57,874 | ||||||||||||||||||||
Capital expenditures (including acquisitions and | 66,904 | 112,937 | 30,089 | 139,673 | 60,100 | |||||||||||||||||||||||||||||||||||
Capital expenditures (including acquisitions and investments) | 109,491 | 97,343 | 90,418 | 66,904 | 112,937 | |||||||||||||||||||||||||||||||||||
Cash dividends declared | 60,110 | 57,942 | 55,312 | 54,938 | 54,667 | 48,115 | 54,640 | 58,380 | 60,110 | 57,942 | ||||||||||||||||||||||||||||||
Per share | $ | 0.68 | $ | 0.66 | $ | 0.64 | $ | 0.64 | $ | 0.64 | $ | 0.61 | $ | 0.68 | $ | 0.68 | $ | 0.68 | $ | 0.66 | ||||||||||||||||||||
Average shares outstanding - diluted | 88,976 | 88,503 | 86,950 | 86,537 | 85,929 | |||||||||||||||||||||||||||||||||||
Average common shares outstanding – diluted | 78,903 | 81,898 | 87,002 | 88,976 | 88,503 | |||||||||||||||||||||||||||||||||||
FINANCIAL POSITION | ||||||||||||||||||||||||||||||||||||||||
Current assets | $ | 996,241 | $ | 938,333 | $ | 833,110 | $ | 506,246 | $ | 490,340 | $ | 598,935 | $ | 1,104,970 | $ | 969,383 | $ | 996,241 | $ | 938,333 | ||||||||||||||||||||
Current liabilities | 490,786 | 545,443 | 475,060 | 318,171 | 339,351 | 372,080 | 664,895 | 420,494 | 490,786 | 545,443 | ||||||||||||||||||||||||||||||
Working capital | $ | 505,455 | $ | 392,890 | $ | 358,050 | $ | 188,075 | $ | 150,989 | $ | 226,855 | $ | 440,075 | $ | 548,889 | $ | 505,455 | $ | 392,890 | ||||||||||||||||||||
Net fixed assets | $ | 546,904 | $ | 552,956 | $ | 555,394 | $ | 743,044 | $ | 766,596 | $ | 521,505 | $ | 549,944 | $ | 564,265 | $ | 546,904 | $ | 552,956 | ||||||||||||||||||||
Total assets | 1,900,397 | 1,830,005 | 1,643,139 | 1,478,069 | 1,457,314 | 1,363,829 | 1,988,031 | 1,814,182 | 1,900,397 | 1,830,005 | ||||||||||||||||||||||||||||||
Total debt** | 252,684 | 388,432 | 289,768 | 292,028 | 295,613 | |||||||||||||||||||||||||||||||||||
Total debt | 239,393 | 380,450 | 276,650 | 252,684 | 388,432 | |||||||||||||||||||||||||||||||||||
Shareholders’ equity | 945,306 | 820,836 | 680,374 | 636,294 | 606,256 | 706,069 | 885,377 | 936,001 | 945,306 | 820,836 | ||||||||||||||||||||||||||||||
Per share | $ | 10.66 | $ | 9.33 | $ | 7.83 | $ | 7.40 | $ | 7.09 | $ | 8.94 | $ | 11.16 | $ | 11.02 | $ | 10.66 | $ | 9.33 | ||||||||||||||||||||
Shares outstanding | 88,691 | 87,933 | 86,856 | 85,949 | 85,512 | |||||||||||||||||||||||||||||||||||
Common shares outstanding | 78,998 | 79,308 | 84,908 | 88,691 | 87,933 | |||||||||||||||||||||||||||||||||||
The acquisition of The Sharon Companies Ltd. assets has been reflected since June 2008. The acquisition of the Western Cylinder Assetscapital stock of Precision Specialty Metals, Inc. has been includedreflected since August 2006. The acquisition of Western Industries, Inc. assets has been reflected since September 2004. The disposition of certain assets related to the Decatur, assetsAlabama steel processing facility has been reflected since August 2004. The acquisition of Unimast Incorporated has been included since July 2002. All financial data includes the results of The Gerstenslager Company, which was acquired in February 1997 through a pooling of interests. The acquisition of Dietrich Industries, Inc. has been included since February 1996.
* Includes $113,000 of Worthington Industries, Inc. common shares exchanged for shares of The Gerstenslager Company during fiscal year ended May 31, 1997.
** Excludes Debt Exchangeable for Common Stock of Rouge Industries, Inc. of $52,497, $75,745 and $88,494 at May 31, 1999, 1998 and 1997, respectively.
FINANCIAL RESULTS Net sales Cost of goods sold Gross margin Selling, general and administrative expense Impairment charges and other Operating income Miscellaneous income (expense) Nonrecurring losses Gain on sale of Acerex Interest expense Equity in net income of unconsolidated Earnings from continuing operations Income tax expense Earnings from continuing operations Discontinued operations, net of taxes Extraordinary item, net of taxes Cumulative effect of accounting change, net of taxes Net earnings Earnings per share - diluted: Continuing operations Discontinued operations, net of taxes Extraordinary item, net of taxes Cumulative effect of accounting change, net of taxes Net earnings per share Continuing operations: Depreciation and amortization Capital expenditures (including Cash dividends declared Per share Average shares outstanding - diluted FINANCIAL POSITION Current assets Current liabilities Working capital Net fixed assets Total assets Total debt** Shareholders’ equity Per share Shares outstanding Fiscal Years Ended May 31, In thousands, except per share 2001 2000 1999 1998 1997 1996 $ 1,826,100 $ 1,962,606 $ 1,763,072 $ 1,624,449 $ 1,428,346 $ 1,126,492 1,581,178 1,629,455 1,468,886 1,371,841 1,221,078 948,505 244,922 333,151 294,186 252,608 207,268 177,987 173,264 163,662 147,990 117,101 96,252 78,852 6,474 - - - - - 65,184 169,489 146,196 135,507 111,016 99,135 (928 ) 2,653 5,210 1,396 906 1,013 - (8,553 ) - - - - (33,449 ) (39,779 ) (43,126 ) (25,577 ) (18,427 ) (8,687 )
affiliates 25,201 26,832 24,471 19,316 13,959 28,710
before income taxes 56,008 150,642 132,751 130,642 107,454 120,171 20,443 56,491 49,118 48,338 40,844 46,130 35,565 94,151 83,633 82,304 66,610 74,041 - - (20,885 ) 17,337 26,708 26,932 - - - 18,771 - - - - (7,836 ) - - - $ 35,565 $ 94,151 $ 54,912 $ 118,412 $ 93,318 $ 100,973 $ 0.42 $ 1.06 $ 0.90 $ 0.85 $ 0.69 $ 0.76 - - (0.23 ) 0.18 0.27 0.28 - - - 0.19 - - - - (0.08 ) - - - $ 0.42 $ 1.06 $ 0.59 $ 1.22 $ 0.96 $ 1.04 $ 70,582 $ 70,997 $ 64,087 $ 41,602 $ 34,150 $ 26,931
acquisitions and investments)* 64,943 72,649 132,458 297,516 287,658 275,052 54,762 53,391 52,343 51,271 45,965 40,872 $ 0.64 $ 0.61 $ 0.57 $ 0.53 $ 0.49 $ 0.45 85,623 88,598 93,106 96,949 96,841 96,822 $ 449,719 $ 624,229 $ 624,255 $ 642,995 $ 594,128 $ 505,104 306,619 433,270 427,725 410,031 246,794 167,585 $ 143,100 $ 190,959 $ 196,530 $ 232,964 $ 347,334 $ 337,519 $ 836,749 $ 862,512 $ 871,347 $ 933,158 $ 691,027 $ 544,052 1,475,862 1,673,873 1,686,951 1,842,342 1,561,186 1,282,424 324,750 525,072 493,313 501,950 417,883 317,997 649,665 673,354 689,649 780,273 715,518 667,318 $ 7.61 $ 7.85 $ 7.67 $ 8.07 $ 7.40 $ 6.91 85,375 85,755 89,949 96,657 96,711 96,505
* Includes $113,000 of Worthington Industries, Inc. common shares exchanged for shares of The Gerstenslager Company during fiscal year ended May 31, 1997.
** Excludes Debt Exchangeable for Common Stock of Rouge Industries, Inc. of $52,497, $75,745 and $88,494 at May 31, 1999, 1998 and 1997, respectively.
Item 7. –— Management’s Discussion and Analysis of Financial Condition and Results of Operations
Selected statements contained in this “Item 7. – Management’s Discussion and Analysis of Financial Condition and Results of Operations” constitute “forward-looking statements” as that term is used in the Private Securities Litigation Reform Act of 1995. Such forward-looking statements are based, in whole or in part, on management’s beliefs, estimates, assumptions and currently available information. For a more detailed discussion of what constitutes a forward-looking statement and of some of the factors that could cause actual results to differ materially from such forward-looking statements, please refer to the “Safe Harbor Statement” in the beginning of this Annual Report on Form 10-K and “Part I -– Item 1A. – Risk Factors” of this Annual Report on Form 10-K.
OverviewIntroduction
Worthington Industries, Inc., together with its subsidiaries (collectively, “we,” “our,” “Worthington,” or the “Company”), is primarily a diversified metal processing company, that focusesfocused on value-added steel processing and manufactured metal products. products, such as metal framing, pressure cylinders, automotive past- and current-model year service stampings and, through joint ventures, metal ceiling grid systems and laser-welded blanks. Our number one goal is to increase shareholder value, which we seek to accomplish by optimizing existing operations, developing and commercializing new products and applications, and pursuing strategic acquisitions and joint ventures.
As of May 31, 2006,2009, excluding our joint ventures, we operated 4741 manufacturing facilities worldwide, principally in three reportable business segments: Steel Processing, Metal Framing and Pressure Cylinders. Other business segments, which are immaterial for purposes of separate disclosure, include Automotive Body Panels, Construction Services, and Steel Packaging. We also held equity positions in 6six joint ventures, which operated 1519 manufacturing facilities worldwide as of May 31, 2006.
Several changes occurred during fiscal 2006 in our internal organizational and reporting structures. The Automotive Body Panels operating segment, consisting of The Gerstenslager Company, which was previously combined with Steel Processing in the Processed Steel Products segment, was moved to the “Other” category, and the Processed Steel Products segment was renamed Steel Processing. Dietrich Construction Group was formed and includes Dietrich Building Systems, Inc. (which was previously included in the Metal Framing segment), Dietrich Residential Construction, LLC (“DRC”), and a research and development project in China. Dietrich Construction Group is now included in the Construction Services operating segment, which is reported in the “Other” category. The “Other” category now includes the Automotive Body Panels, Construction Services and Steel Packaging operating segments and also includes income and expense items not allocated to the reportable segments. All prior period segment financial2009. For more information has been restated to reflect the changes mentioned above.
The following discussion and analysis of business strategy, key economic and industry indicators, steel pricing, and the results of operations and financial condition of Worthington, should be read in conjunction with our consolidated financial statements included in “Item 8. – Financial Statements and Supplementary Data.”
Business Strategy
Our number one goal is to increase shareholder value. We believe that our business strategy, centered on our core competency of adding value to flat-rolled steel, provides an excellent platform to deliver that value. Our focus is to grow shareholder value by effectively managing and growing our Company’s downstream, value-added capabilities. Each of our reportable business segments—Steel Processing, Metal Framing, Pressure Cylinders—and our largest joint venture holds a leadership position in its market, which we expect to leverage and grow. We have the capacity in each of our business segments, please refer to handle additional sales growth without significantly increasing capital investment.
The three primary ways we seek to accomplish our strategic goal are optimizing existing operations; developing and commercializing new products and applications; and pursuing strategic acquisitions and joint ventures. Over the last several years,“Item 1. – Business” of Part I of this focus has resulted in investing in growth markets and products, consolidating facilities and divesting certain non-strategic assets or other assets that were not delivering appropriate returns. We will continue our efforts to optimize existing operations by improving efficiencies, consolidating operations when necessary, and reducing the costs and risks of our existing operations.
Although no individual customer provides more than five percent of our consolidated net sales, diversifying our customer base through new products and new applications for existing products is a priority. We are developing new products and services in our Steel Processing segment. We are developing and testing innovative building products and systems to expand the application of metal framing, and we have developed and acquired, and will continue to develop and acquire, new pressure cylinder products.
We have added products and operations, including joint ventures, which we believe complement our existing business and strengths. Our strong balance sheet provides the financial flexibility to acquire or invest in companies that further extend our product lines or penetrate new markets. Because of our success with joint ventures and alliances, we continue to look for additional opportunities where we can bring together complementary skill sets, manage our risk and effectively invest our capital. Some of these joint ventures and alliances have served as entry points into markets not previously served and have resulted in later buyouts of the other joint venture parties.
During fiscal 2006, we took the following actions:
On September 22, 2005, we announced to the North American market, Dietrich “UltraSTEEL™” metal framing products using patented technology of Hadley Industries PLC. The licensing agreement grants us the exclusive rights to manufacture and sell light-gauge steel framing using the “UltraSTEEL™” technology in North America. Our Metal Framing plants are converting a significant portion of their manufactured products to “UltraSTEEL™”. On February 27, 2006, Dietrich Metal Framing announced an exclusive sublicensing agreement with Clark-Western for the “UltraSTEEL™” products. Having a second manufacturer of these products should help to make them more readily available in the marketplace and accelerate their adoption as a preferred product.
On September 27, 2005, Dietrich entered into a joint development agreement with NOVA Chemicals Corporation to evaluate and commercialize novel construction products that combine the structural benefits of light-gauge steel framing with the thermal and moisture retardant properties of expandable polystyrene. The relationship became an 50:50 unconsolidated joint venture in July 2006. The joint venture’s current focus isAnnual Report on developing cost-effective, insulated metal framing panels intended to remove significant obstacles to using steel framing products for exterior walls in areas where interior/exterior temperature variations may cause condensation.
On October 17, 2005, we acquired the remaining 50% interest in Dietrich Residential Construction, LLC (“DRC”) from our partner, Pacific Steel Construction (“Pacific”) for cash of $3.8 million and debt assumption of $4.2 million. The acquisition was recorded using the purchase accounting method, and the results of DRC, which were previously reported as an unconsolidated joint venture, have been included in the consolidated results of the “Other” category since the date of acquisition. DRC provides panelizing capabilities and opens the door to United States military and residential housing markets.
On November 30, 2005, we acquired the remaining 40% interest in Dietrich Metal Framing Canada, Inc. (“DMFC”), from the minority shareholder, Encore Coils Holdings Ltd. (“Encore”) for $3.0 million cash. The joint venture had been formed in November 2004 as a platform to provide our Metal Framing segment’s light-gauge steel framing, proprietary products, building systems and services to the Canadian construction market. The acquisition was recorded using the purchase accounting method, and 100% of the results of DMFC, which had been previously reduced by the minority interest, have been included in the consolidated results of the Metal Framing segment since the date of acquisition.
On March 2, 2006, we announced the planned closure of our Metal Framing manufacturing facility in LaPorte, Indiana. Forty-nine people were employed at this location. Operations ceased during June 2006. The facility processed small-walled, galvanized steel coils, which have become increasingly scarce over the past several years. The move to “UltraSTEEL™” further decreased our need for the processing capabilities of the LaPorte facility.
On April 25, 2006, we sold our 50% equity interest in Acerex, S.A. de C.V. (“Acerex”), a joint venture operating a steel processing facility in Monterrey, Mexico, to our partner Ternium, S.A. (“Ternium”) for $44.6 million cash. This sale resulted in a pre-tax gain of $26.6 million. The joint venture was formed in 1994 with Hylsa, S.A. de C.V., which was recently acquired by
Ternium. This ownership change prompted the sale of the joint venture. We remain interested in the Mexican steel processing market and are exploring opportunities to continue the success that we have enjoyed there for over a decade.Form 10-K.
Key Economic and Industry IndicatorsOverview
To better understand the markets in which each ofDuring our business segments operates and the performance of those segments, we monitor certain economic and industry data. During the fiscal year ended May 31, 20062009 (“fiscal 2006”2009”), Gross Domestic Productwe experienced challenges and rapidly changing business conditions unlike any we have ever experienced. Record earnings in our first quarter, due to record high prices of hot-rolled steel, were erased by a large loss in our second quarter due to the global financial crisis and recession. Demand in most of our markets plummeted, and steel prices underwent a severe and rapid decline, producing an environment of selling high priced inventory into a declining price market. This required us to write-down our steel inventories to the lower-of-cost-or-market, an impact of $105.0 million, $4.4 million of which related to our Serviacero joint venture. In addition, the declining economy and construction market deterioration resulted in a $96.9 million write-off of the goodwill associated with our Metal Framing segment. Our third and fourth fiscal quarters saw a continued decline in steel prices and demand in most of the markets we serve.
Market & Industry Overview
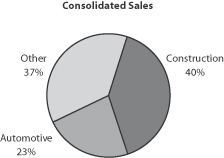
For fiscal 2009, our sales breakdown by end user market is illustrated by the chart below. Substantially all of the sales of our Metal Framing business segment and the Construction Services business segment, as well as approximately 25% of the sales for the Steel Processing business segment, are to expand, up 3.4% over the fiscal year ended May 31, 2005construction market, both residential and non-residential. We estimate that approximately 10% of our consolidated sales, or one-fourth of our construction market sales, are to the residential market. While the market price of steel significantly impacts this business, there are other key indicators that are meaningful in analyzing construction market demand including U.S. gross domestic product (“fiscal 2005”U.S. GDP”).
Commercial, the Dodge Index of construction contracts, and trends in the relative price of framing lumber and steel. Construction is also the predominant end market for approximately 41%our largest joint venture, Worthington Armstrong Venture (“WAVE”). The sales of WAVE are not consolidated in our results; however, adding our ownership percentage of WAVE’s construction market sales to our reported sales would not materially change the sales breakdown in the chart.
The automotive industry is the largest consumer of flat-rolled steel and thus the largest end market for our Steel Processing operations. Approximately half of the sales of our netSteel Processing business segment, and substantially all of the sales improved in fiscal 2006 as indicated byof the U.S. Census Bureau’s Index of Private Construction Spending, which was 8% above fiscal 2005. AccordingAutomotive Body Panels business segment, are to this same index, our largest construction market sector, office buildings, improved 11%. These improvements increased demand, which generally leads to rising prices.
The hurricanes that hit the Gulf Coast states during the first part of fiscal 2006 had no direct impact on our facilities. However, some Metal Framing customers’ plants, representing approximately 2-3% of Metal Framing’s business, were shut down temporarily. While we estimate that recovery in the region may take several years, the rebuilding effort should benefit demand. The hurricanes were also a factor in the increase in zinc, energy and transportation costs. Excluding the impact of volume, these costs were $17.4 million higher than in fiscal 2005.
The automotive end market, which represents approximately 33% of our net sales, had mixed results. Totalmarket. North American vehicle production, was 3% higher than last year. However, “Big Three” automotive (collectively, DaimlerChrysler AG,primarily by Chrysler, Ford Motor Co. and General Motors Corp.(the “Big Three automakers”) production was down 2% compared, has a considerable impact on the customers within these two segments. These segments are also impacted by the market price of steel and, to last year. Whilea lesser extent, the market price of commodities used in their operations, such as zinc, natural gas and diesel fuel. The majority of the sales of two of our tons shipped directlyunconsolidated joint ventures also go to the Big Three increased 29% over last year,automotive end market. These sales are not consolidated in our totalresults; however, adding our ownership percentage of joint venture automotive volumes decreased slightly from fiscal 2005. market sales to our reported sales would not materially change the sales breakdown in the previous chart.
The financial conditionsales of some automotive manufacturersour Pressure Cylinders and suppliers has deterioratedSteel Packaging business segments, and approximately 30% of the sales of our Steel Processing business segment, are to other markets such as appliance, leisure and recreation, distribution and transportation, HVAC, lawn and garden, and consumer specialty products. Given the many different product lines that make up these sales and the debtwide variety of several automotive manufacturers and automotive suppliers has been rated below investment grade. In recent years, certain automotive suppliers have filed voluntary petitionsend markets, it is very difficult to list the key market indicators that drive this portion of our business. However, we believe that the trend in U.S. GDP growth is a good economic indicator for Chapter 11 bankruptcy protection. analyzing these segments.
We are concerned aboutuse the viability of several other automotive suppliers and continuefollowing information to monitor their status.our costs and major end markets:
| Fiscal Year Ended May 31, | Inc / (Dec) | |||||||||||||||||||
| 2009 | 2008 | 2007 | 2009 vs. 2008 | 2008 vs. 2007 | ||||||||||||||||
U.S. GDP (% growth year-over-year) | -1.0 | % | 2.4 | % | 2.1 | % | -3.4 | % | 0.3 | % | ||||||||||
Hot-Rolled Steel ($ per ton)1 | $ | 726 | $ | 636 | $ | 571 | $ | 90 | $ | 65 | ||||||||||
Big Three Auto Build (000s vehicles)2 | 5,606 | 8,643 | 9,509 | (3,037 | ) | (866 | ) | |||||||||||||
No. America Auto Build (000s vehicles)2 | 9,880 | 14,662 | 15,068 | (4,782 | ) | (406 | ) | |||||||||||||
Dodge Index | 98 | 130 | 139 | (32 | ) | (9 | ) | |||||||||||||
Framing Lumber ($ per 1,000 board ft)3 | $ | 230 | $ | 269 | $ | 286 | $ | (39 | ) | $ | (17 | ) | ||||||||
Zinc ($ per pound)4 | $ | 0.65 | $ | 1.24 | $ | 1.65 | $ | (0.59 | ) | $ | (0.41 | ) | ||||||||
Natural Gas ($ per mcf)5 | $ | 7.02 | $ | 7.66 | $ | 6.73 | $ | (0.64 | ) | $ | 0.93 | |||||||||
Retail Diesel Prices, All types ($ per gallon)6 | $ | 3.17 | $ | 3.41 | $ | 2.77 | $ | (0.24 | ) | $ | 0.64 | |||||||||
Steel Pricing1 CRU Index; annual average 2 CSM Autobase 3 Random Lengths; annual average 4 LME Zinc; annual average 5 NYMEX Henry Hub Natural Gas; annual average 6 Energy Information Administration; annual average
During the last several fiscal years, the steel industry experienced unprecedented steel price fluctuations. Early in the fiscal year ended May 31, 2004 (“fiscal 2004”), the People’s Republic of China (“China”) was a net importer of steel as its demand for steel exceeded its production capabilities, increasing the demand for steel in the worldwide market and reducing the availability of foreign steel in the United States of America (“U.S.”). A weaker U.S. dollar and higher transportation costs made foreign steel more expensive than domestic steel, further reducing the supply of imports to the U.S. As China increased its production capabilities, it required more steel-making raw materials, especially coke and scrap steel. This resulted in shortages of these key raw materials, fueling further increases in steel prices. Finally, the consolidationGDP growth rate trends are generally indicative of the steel industry within the U.S. reduced the availability of steel. All of these factors combined during this period of time to cause an unprecedented increasestrength in steel prices, which peakeddemand and, in September 2004.
Since then, China increased steel production significantly, contributing to global supply and placing significant downward pressure on steel prices. In addition, excess inventories and lower production from automotive and other key metalworking sectors reduced demand. As a result, benchmark commodity steel prices began to weaken and continued to decline through the end of our fiscal 2006 first quarter. However, since our fiscal 2006 first quarter, steel prices have increased 23% due to improved overall demand, constrained domestic supply, and lower levels of available imports. On average, published benchmark commodity steel pricesmany cases, pricing for our fiscal 2006 were lower by $119 per ton, or 18% from last fiscal year, because ofproducts. Historically, we have seen that decreasing U.S. GDP growth rates year-over-year can have a negative effect on our results, as a weaker economy generally weakerhurts demand and greater supply.
pricing for our products. The following graph shows the volatility of steel prices over the last four years:
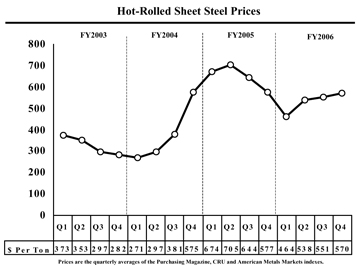
The consolidation of the industry around the globe has set the stage for a more disciplined approachopposite is also generally true. Changes in U.S. GDP growth rates can also signal changes in conversion costs related to production and pricing. Domestically,selling, general and administrative (“SG&A”) expenses. However, these are all general assumptions, which do not hold true in all cases.
In recent quarters, the concentration of steel production owned by the top three producers has doubled, along with their market share, to approximately 70%. Globally, consolidation has resulted in a significant shiftchange in the amountmarket price of production capacity owned byhot-rolled steel has been one of the private sector. Prior to 2000, approximately 25% of steel-producing assets were privately owned versus more than 75% today. Combined with strong regional growth in Asiamost significant factors impacting selling prices and Eastern Europe, industry consolidation has produced anmaterially impacted our earnings. In a rising price environment, which may lead to steel pricing being much less volatile than wassuch as we experienced during the preceding 10 years.
Volatile steel prices combined withfirst quarter of fiscal 2009, our first-in first-out (“FIFO”) inventory flow, can have a dramatic affect on the results of our operations. In a rising steel-price environment, our reported income is oftenare generally favorably impacted as lower-priced inventory, acquired during thematerial, purchased in previous two to three months,periods, flows through cost of goods sold while our selling prices increase at a faster pace to meetcover current replacement costs. On the rising costother hand, when steel prices fall, as they did during the second, third and fourth quarters of steel. In a decreasing steel-price environment, the inverse often occurs asfiscal 2009, we typically have higher-priced inventory on hand flowsmaterial flowing through cost of goods sold while selling prices compress to what the market will bear, negatively impacting our results. Although the annual average steel price shown above was higher in fiscal 2009 than fiscal 2008, it was the 61% decline in the monthly average hot-rolled steel prices from September 2008 to May 2009 that affected our results.
No single customer makes up more than 5% of our consolidated net sales. While our automotive business is largely driven by Big Three production schedules, our customer base is much broader and includes many of their suppliers as well. Seasonal automotive shutdowns in July and December can cause weaker demand in our first and third quarters. During fiscal 2009, production schedules for domestic automakers were severely depressed, not only in July and December, but also throughout the second half of our fiscal year due to the uncertain financial markets, declining demand, the recessionary economic climate and the financial difficulties of General Motors and Chrysler. We continue to pursue customer diversification beyond the Big Three automakers and their suppliers, and, in recent quarters, we have increased our business in other markets such as energy and agriculture.
The Dodge Index represents the value of total construction contracts, including residential and non-residential building construction. This overall index serves as a broad indicator of the construction markets in which we participate, as it tracks actual construction starts. The relative pricing of framing lumber, an alternative construction material with which we compete, can also affect our Metal Framing business segment, as certain applications may permit the use of this alternative building material.
The market trends of certain other commodities such as zinc, natural gas and diesel fuel can be important to us as they represent a significant portion of our cost of goods sold, both directly through our plant operations and indirectly through transportation and freight. A drop in the price of any of these commodities could decrease our cost of goods sold, and the reverse is also true. For fiscal 2009, any benefit recognized from lower commodity prices was more than offset by the drop in demand and steel pricing decline.
State of our Business
Our results reflect the rapid decline in demand and steel pricing associated with the global economic recession and its impact on end markets that first took hold in our second fiscal quarter. Steel pricing and demand continued to fall during the third and fourth quarters.
In fiscal 2008, we embarked on a cost reduction initiative that grew into a broader Transformation Plan (“the Plan”). In addition, the Plan has provided us with the strategy to combat the global economic recession. The Plan includes a focus on cost reduction, margin expansion, and organizational capability improvements, as well as an effort to develop excellence in three core competencies: sales, operations and supply chain management. The Plan is comprehensive in scope and includes aggressive diagnostic and implementation phases in our Steel Processing and Metal Framing business segments. The goal of the Plan is to increase our Company’s sustainable earnings potential.
Our initial cost reduction efforts identified opportunities for $39.0 million in annual savings in overhead expense reductions, early retirements, and plant closures. In addition, we have continued to focus on reducing costs, increasing asset utilization and driving improvements in our operations, from which we have seen positive results. However, given the current market and economic conditions, particularly those related to our Steel Processing and Metal Framing business segments, we face difficulties in the next quarter, especially since it is a historically slow seasonal quarter for the automotive industry. As a result of the Plan and in response to the challenging recessionary environment, we executed, or announced, the following structural changes to our business in fiscal 2009:
A workforce reduction of approximately 1,200 primarily in our Steel Processing and Metal Framing business segments through a combination of plant closings and permanent job reductions. These reductions are expected to be sustainable even when demand returns as a result of improving operating efficiency through the Plan diagnostics. Additionally, several locations are operating on a reduced work week.
The closure of three facilities, one Steel Processing (Louisville, Kentucky) and two Metal Framing (Renton, Washington and Lunenburg, Massachusetts). In addition, two Metal Framing facilities suspended operations indefinitely (Miami, Florida and Phoenix, Arizona). See “Item 8. – Financial Statements and Supplementary Data – Notes to Consolidated Financial Statements – Note N – Restructuring” for more information on headcount reductions and facility closures.
The sale of our interests in three joint ventures: our 49% equity interest in Canessa Worthington Slovakia s.r.o. (“Slovakia”); our 60% equity interest in Aegis Metal Framing, LLC (“Aegis”); and our selling prices decrease. This results50% equity interest in whatAccelerated Building Technologies, LLC (“ABT”). See “Item 8. – Financial Statements and Supplementary Data – Notes to Consolidated Financial Statements – Note J – Investments in Unconsolidated Affiliates” for more information on these actions.
The expansion of our Worthington Specialty Processing (“WSP”) joint venture with United States Steel Corporation (“U.S. Steel”), which further consolidated more of the partners’ steel processing operations in eastern Michigan. U.S. Steel contributed Procoil Company, LLC, its steel processing facility in Canton, Michigan, and we refercontributed Worthington Steel Taylor, our steel processing subsidiary in Taylor, Michigan, plus $2.5 million of cash, increasing our ownership interest from 50% to as inventory holding gains or losses.51%.
As a result of these and other reductions, we have incurred restructuring charges associated with the Plan totaling $61.2 million to date including charges of $43.0 million during fiscal 2009. We striveanticipate we will incur an additional $6.0 million in restructuring charges related to limit this impactthe Plan for our next fiscal year, which ends May 31, 2010 (“fiscal 2010”).
We have also implemented several cost reduction initiatives for the first quarter of fiscal 2010, which includes: a one week shut-down of four Steel Processing facilities; suspension of holiday pay for eligible employees; a pay-reduction of up to 20% for salaried employees with a 25% reduction for the Chief Executive Officer of Worthington; a 20% reduction in meeting fees for the board of directors; and a suspension of the Company’s 401(k) match for all employees. We reduced the fourth quarter dividend to $0.10 per share, a $0.07 reduction from the dividend of $0.17 per share declared in each of the first, second, and third quarters. On June 12, 2009, we redeemed $118.5 million of the $138.0 million outstanding 6.70% Notes due
December 1, 2009 (“Notes”) for $1,025 per $1,000 principal amount of Notes, plus accrued and unpaid interest. The repurchase was funded by controlling inventory levelsa combination of cash on hand and monitoring our selling prices.borrowings under existing credit facilities in an effort to reduce interest expense.
Results of Operations
Fiscal 20062009 Compared to Fiscal 20052008
Consolidated Operations
The impactfollowing table presents consolidated operating results:
| Fiscal Year Ended May 31, | ||||||||||||||||||
| Dollars in millions | 2009 | % of Net sales | 2008 | % of Net sales | Increase/ (Decrease) | |||||||||||||
Net sales | $ | 2,631.3 | 100.0 | % | $ | 3,067.2 | 100.0 | % | $ | (435.9 | ) | |||||||
Cost of goods sold | 2,456.6 | 93.4 | % | 2,711.5 | 88.4 | % | (254.9 | ) | ||||||||||
Gross margin | 174.7 | 6.6 | % | 355.7 | 11.6 | % | (181.0 | ) | ||||||||||
Selling, general and administrative expense | 210.0 | 8.0 | % | 231.6 | 7.6 | % | (21.6 | ) | ||||||||||
Goodwill impairment and restructuring charges | 140.0 | 5.3 | % | 18.1 | 0.6 | % | 121.9 | |||||||||||
Operating income (loss) | (175.3 | ) | -6.7 | % | 106.0 | 3.5 | % | (281.3 | ) | |||||||||
Gain on sale of Aegis Metal Framing, LLC | 8.3 | 0.3 | % | - | 0.0 | % | 8.3 | |||||||||||
Miscellaneous and interest expense | (27.6 | ) | -1.0 | % | (27.8 | ) | -0.9 | % | (0.2 | ) | ||||||||
Equity in net income of unconsolidated affiliates | 48.6 | 1.8 | % | 67.5 | 2.2 | % | (18.9 | ) | ||||||||||
Income tax (expense) benefit | 37.8 | 1.4 | % | (38.6 | ) | -1.3 | % | (76.4 | ) | |||||||||
Net earnings (loss) | $ | (108.2 | ) | -4.1 | % | $ | 107.1 | 3.5 | % | $ | (215.2 | ) | ||||||
Net earnings for fiscal 2009 decreased $215.2 million from the prior year, resulting in a net loss of inventory holding gains and losses continued$108.2 million.
Net sales decreased $435.9 million to be a major factor when comparing our results against$2,631.3 million from the prior year. Average hot-rollDecreased volumes, primarily in our Steel Processing and Metal Framing business segments, lowered sales by $736.6 million. Higher average selling prices were 18% lower during fiscal 2006 versus fiscal 2005. Operating income forthroughout the twelve months ended May 31, 2006, was negatively impactedfirst half of the year more than offset the dramatic drop in prices in the second half of the year, resulting in an increase to sales of $300.6 million.
Gross margin decreased $181.0 million from the prior year primarily due to depressed volumes and declining spreads. Volumes declined 39% in Steel Processing and 31% in Metal Framing, which reduced the gross margin by an$61.8 million and $40.5 million, respectively. In addition, the declining spreads resulted in inventory holding loss estimated at $7.9write-downs of $100.6 million.
SG&A expense decreased $21.6 million while operating income for fiscal 2005 contained an estimated inventory holding gain of $78.5 million.
A majority of our full-time employees receive a significant portion of their compensation through profit sharing and bonuses, which are tied tofrom the performance of our Company. When earnings are up, so is profit sharing
and bonus expense, and when earnings are down, so is profitprior year. Profit sharing and bonus expense. Becauseexpenses were lower by $27.0 million, but were partially offset by increased bad debt expenses of this relationship, profit sharing and bonus expense tends to minimize the volatility of earnings.
The following table presents our consolidated operating results for the fiscal years indicated:
| 2006 | 2005 | |||||||||||||
| In millions, except per share | Actual | % of Net Sales | % Change | Actual | % of Net Sales | |||||||||
Net sales | $ | 2,897.2 | 100.0% | -6% | $ | 3,078.9 | 100.0% | |||||||
Cost of goods sold | 2,525.6 | 87.2% | -2% | 2,580.0 | 83.8% | |||||||||
Gross margin | 371.6 | 12.8% | -26% | 498.9 | 16.2% | |||||||||
Selling, general and administrative expense | 214.0 | 7.4% | -5% | 225.9 | 7.3% | |||||||||
Impairment charges and other | - | 5.6 | 0.2% | |||||||||||
Operating income | 157.6 | 5.4% | -41% | 267.4 | 8.7% | |||||||||
Other income (expense): | ||||||||||||||
Miscellaneous expense | (1.5 | ) | (8.0 | ) | ||||||||||
Gain on sale of Acerex | 26.6 | 0.9% | - | |||||||||||
Interest expense | (26.3 | ) | -0.9% | 6% | (24.8 | ) | -0.8% | |||||||
Equity in net income of unconsolidated affiliates | 56.3 | 1.9% | 4% | 53.9 | 1.7% | |||||||||
Earnings before income taxes | 212.7 | 7.3% | -26% | 288.5 | 9.4% | |||||||||
Income tax expense | 66.7 | 2.3% | -39% | 109.1 | 3.5% | |||||||||
Net earnings | $ | 146.0 | 5.0% | -19% | $ | 179.4 | 5.8% | |||||||
Average common shares outstanding - diluted | 89.0 | 88.5 | ||||||||||||
Earnings per share - diluted | $ | 1.64 | -19% | $ | 2.03 | |||||||||
Net earnings decreased $33.4$6.9 million to $146.0 million for fiscal 2006, from $179.4 million for fiscal 2005. Diluted earnings per share decreased $0.39 per share to $1.64 per share from $2.03 per share for the prior fiscal year. Net sales decreased 6%, or $181.7 million, to $2,897.2 million for fiscal 2006 from $3,078.9 million for fiscal 2005. The decrease was due to lower selling prices, reflecting the lower steel prices that prevailed during fiscal 2006 versus fiscal 2005, which reduced net sales by $228.9 million. Higher overall volumes slightly offset the negative impact of the decline in selling prices. The volume increase was primarily due to increased volumes in the Metal Framing and Pressure Cylinders segments and in Construction Services, which is included in the Other category, but the impact of these volume increases was somewhat offset by slightly lower volumesautomotive accounts in the Steel Processing and Automotive Body Panels business segments.
Goodwill impairment charges of $97.0 million and pre-tax restructuring charges of $43.0 million were recognized for fiscal 2009 compared to $18.1 million in restructuring charges in fiscal 2008. The goodwill impairment for the Metal Framing business segment due largelywas recorded in the second quarter, as key assumptions used in previous valuations related to the sale ofeconomy and construction market no longer supported the cold millgoodwill balance. The restructuring charges in Decatur, Alabama, inboth years related to the first quarter of fiscal 2005.
Gross margin decreased 26%, or $127.3 million,Plan, and included costs related to $371.6 million for fiscal 2006 from $498.9 million for fiscal 2005. The decrease was due to a $138.2 million decline in pricing spread and a $7.2 million increase in direct labor and manufacturing expenses, partially offset by an increase in overall volume of $18.1 million. The increase in direct labor and manufacturing expenses was mainly due to increases in freight, zinc, and energy expenses. Gross margin as a percentage of net sales decreased to 12.8% for fiscal 2006 compared to 16.2% for fiscal 2005.
SG&A expense, as a percentage of net sales, increased to 7.4% for fiscal 2006 compared to 7.3% of net sales for the prior year. In total, SG&A expense decreased 5%, or $11.9 million, to $214.0 million for fiscal 2006 from $225.9 million for fiscal 2005. This decrease was primarily due to a $19.6 million decrease in profit sharing and bonus expense resulting from lower earnings and a $9.7 million reduction in bad debt expense, offset by increases in professional fees, of $7.4 million, wages of $7.3 million,job reductions, and insurance and taxes of $1.9 million. The reduction in bad debt expense reflects the favorable settlement of our claim infacility closures.
We recognized a large bankruptcy case in fiscal 2006.
Miscellaneous expense decreased $6.5 million in fiscal 2006 compared to fiscal 2005. This was due to an increase in, and higher returns on, cash and short-term investments and the reduced minority interest elimination for our consolidated joint venture due to its lower earnings.
Results for fiscal 2006 include a $26.6 million pre-tax gain of $8.3 million on the sale of our 50% equity interest in AcerexAegis to our partner, Ternium.MiTek Industries, Inc. in January 2009.
Interest expense increased 6% or $1.5 million due to higher average borrowings.
Equity in net income of unconsolidated affiliates of $48.6 million was largely made up of earnings from our WAVE joint venture, which were down 13%. Our other joint ventures also experienced declines in their earnings. Aegis earnings were down year over year largely because of the sale, WSP’s loss increased by $2.6 million and inventory write-downs at our Serviacero joint venture negatively impacted our results by $4.4 million. See “Item 8. – Financial Statements and Supplementary Data – Notes to $56.3 millionConsolidated Financial Statements – Note J – Investments in Unconsolidated Affiliates” for further information about our participation in unconsolidated joint ventures.
Due to the pre-tax loss for fiscal 2006 from $53.92009, an income tax benefit of $37.8 million, foror 25.9% of the pre-tax loss, was recorded. This compares to the $38.6 million tax expense, or 26.5% of the pre-tax income, recorded in fiscal 2005,2008. The change in the effective income tax rate is primarily due to increased earningsthe change in the mix of income among the jurisdictions in which we do business, as well as the portion of the WAVE joint venture, partially offset by a $6.0 million adjustmentgoodwill impairment that is not deductible for the under-accrual of income taxes over the last five years at our Acerex joint venture. The unconsolidated joint ventures generated $810.3 million in sales and net income of $108.7 million during fiscal 2006. Joint venture income has been a consistent and significant contributor to our profitability over the last several years. Our aggregate annual return on the investment in these joint ventures has averaged 43%. The joint ventures are also a source of cash to us, and aggregate annual distributions have ranged from $12 to $57 million.
Income tax expense decreased 39%, or $42.4 million, mainly due to lower earnings. However, the effective tax rate also decreased to 31.4% for fiscal 2006 from 37.8% for fiscal 2005. The rate decrease was due to higher foreign earnings that were taxed at a lower rate, modifications to the corporate tax laws for the state of Ohio that reduced tax expense, deferred tax adjustments for foreign earnings, offset by special taxes on foreign earnings repatriations and the sale of Acerex. The rate was further reduced by the elimination of the reserves established for the disallowance of investment tax credits in the State of Ohio when the program was ruled unconstitutional by the Sixth Circuit Court of Appeals in fiscal 2005. This reserve became unnecessary due to the recent ruling by the U.S. Supreme Court, which vacated the Sixth Circuit’s ruling.purposes.
Segment Operations
Steel Processing
Our Steel Processing segment represented approximately 51% of consolidated net sales in fiscal 2006. The steel-pricing environment and the automotive industry, which accounts for approximately 60% of this segment’s net sales, significantly impacted the results of this segment. After having risen steadily for the first four months of fiscal 2005 to an all time high in September 2004, steel prices declined significantly for the next twelve months. As a result, average steel prices were significantly lower in fiscal 2006 than in fiscal 2005, which led to a reduced spread between our average selling price and material cost. In addition, sales to the automotive market in fiscal 2006 were 8% lower than in fiscal 2005.
Effective August 1, 2004, we sold our Decatur, Alabama, steel-processing facility and its cold-rolling assets (“Decatur”) to Nucor Corporation (“Nucor”) for $80.4 million cash. The assets sold at Decatur included the land and buildings, the four-stand tandem cold mill, the temper mill, the pickle line and the annealing furnaces. The sale excluded the slitting and cut-to-length assets and net working capital. The retained assets provide basic steel-processing services to our customers at the Decatur site, which is leased from Nucor. A pre-tax charge of $5.6 million, mainly related to contract termination costs, was recognized during the first quarter of fiscal 2005.
The following table presents a summary of operating results for the Steel Processing business segment for the fiscal yearsperiods indicated:
| 2006 | 2005 | Fiscal Year Ended May 31, | |||||||||||||||||||||||||||
| Dollars in millions, tons in thousands | Actual | % of Net Sales | % Change | Actual | % of Net Sales | ||||||||||||||||||||||||
| Dollars in millions | 2009 | % of Net sales | 2008 | % of Net sales | Increase/ (Decrease) | ||||||||||||||||||||||||
Net sales | $ | 1,486.2 | 100.0% | -14% | $ | 1,719.3 | 100.0% | $ | 1,183.0 | 100.0 | % | $ | 1,463.2 | 100.0 | % | $ | (280.2 | ) | |||||||||||
Cost of goods sold | 1,347.6 | 90.7% | -10% | 1,492.2 | 86.8% | 1,167.4 | 98.7 | % | 1,313.5 | 89.8 | % | (146.1 | ) | ||||||||||||||||
Gross margin | 138.6 | 9.3% | -39% | 227.1 | 13.2% | 15.6 | 1.3 | % | 149.7 | 10.2 | % | (134.1 | ) | ||||||||||||||||
Selling, general and administrative expense | 76.8 | 5.2% | -19% | 94.4 | 5.5% | 79.8 | 6.7 | % | 92.8 | 6.3 | % | (13.0 | ) | ||||||||||||||||
Impairment charges and other | - | 5.6 | 0.3% | ||||||||||||||||||||||||||
Restructuring charges | 3.9 | 0.3 | % | 1.1 | 0.1 | % | 2.8 | ||||||||||||||||||||||
Operating income | $ | 61.8 | 4.2% | -51% | $ | 127.1 | 7.4% | ||||||||||||||||||||||
Operating income (loss) | $ | (68.1 | ) | -5.8 | % | $ | 55.8 | 3.8 | % | $ | (123.9 | ) | |||||||||||||||||
Tons shipped | 3,611 | -1% | 3,663 | ||||||||||||||||||||||||||
Material cost | $ | 1,139.1 | 76.6% | -10% | $ | 1,267.9 | 73.7% | $ | 991.4 | $ | 1,105.7 | $ | (114.3 | ) | |||||||||||||||
Tons shipped (in thousands) | 2,011 | 3,286 | (1,275 | ) | |||||||||||||||||||||||||
Net sales and operating income (loss) highlights were as follows:
Net sales decreased $280.2 million from the prior year to $1,183.0 million. The decrease was attributable to weakened demand in the automotive and construction markets, the two largest markets served by our Steel Processing business segment.
Operating income decreased 51%, or $65.3by $123.9 million compared to $61.8 million, or 4.2%last year, resulting in an operating loss of net sales, in fiscal 2006 from $127.1 million, or 7.4% of net sales, for fiscal 2005. Net sales decreased 14%, or $233.1 million, to $1,486.2 million from $1,719.3 million, due to a decrease in pricing of $144.5 million$68.1 million. Weakened demand, caused by the global recession, and a decrease in volume of $88.6 million, of which $79.6 million was due to the sale of certain Decatur assets. Gross margin declined 39%, or $88.5 million, to $138.6 million, or 9.3% of net sales, for fiscal 2006 versus $227.1 million, or 13.2% of net sales, for fiscal 2005. A narrowercompressed spread between average selling priceprices and material cost, and a decreasecosts resulted in volume, reduced gross margin by $81.5inventory write-downs of $62.6 million and $12.3were the main drivers behind the operating loss. SG&A expense was $13.0 million respectively. Gross margin was favorably impacted by a $13.7 million decrease inlower than the prior year, primarily due to lower profit sharing and bonus expense due to lower earnings and a $3.8 million reductionexpenses. Restructuring charges in manufacturing expenses at our Decatur facility, partially offset by increases for freight, zinc and natural gas expense. SG&A expense decreased $17.6 million, to 5.2% of net sales in fiscal 2006, down from 5.5% of net sales for fiscal 2005. The decline in SG&A expense was largely due to a decrease of $13.1 million in profit sharing and bonus expense, resulting from lower earnings, and a $9.4 million decrease in bad debt expense comparedboth years related to the prior year. The reduction in bad debt expense reflects the favorable settlement of our claim in a large bankruptcy case in fiscal 2006.Plan.
Metal Framing
Our Metal Framing segment represented approximately 28% of consolidated net sales during fiscal 2006. Volumes for fiscal 2006 increased 7% compared to fiscal 2005. We believe the improved demand reflects a combination of factors including a general increase in commercial construction, rebuilding in Florida after the hurricanes of fiscal 2005, and an expansion into Canada.
The following table presents a summary of operating results for the Metal Framing business segment for the fiscal yearsperiods indicated:
| 2006 | 2005 | Fiscal Year Ended May 31, | ||||||||||||||||||||||||||||
| Dollars in millions, tons in thousands | Actual | % of Net Sales | % Change | Actual | % of Net Sales | |||||||||||||||||||||||||
| Dollars in millions | 2009 | % of Net sales | 2008 | % of Net sales | Increase/ (Decrease) | |||||||||||||||||||||||||
Net sales | $ | 796.3 | 100.0% | -6% | $ | 843.9 | 100.0% | $ | 661.0 | 100.0 | % | $ | 788.8 | 100.0 | % | $ | (127.8 | ) | ||||||||||||
Cost of goods sold | 673.3 | 84.6% | 4% | 648.4 | 76.8% | 638.1 | 96.5 | % | 729.1 | 92.4 | % | (91.0 | ) | |||||||||||||||||
Gross margin | 123.0 | 15.4% | -37% | 195.5 | 23.2% | 22.9 | 3.5 | % | 59.7 | 7.6 | % | (36.8 | ) | |||||||||||||||||
Selling, general and administrative expense | 76.3 | 9.6% | -7% | 81.7 | 9.7% | 54.9 | 8.3 | % | 67.0 | 8.5 | % | (12.1 | ) | |||||||||||||||||
Goodwill impairment and restructuring charges | 110.6 | 16.7 | % | 9.0 | 1.1 | % | 101.6 | |||||||||||||||||||||||
Operating income | $ | 46.7 | 5.9% | -59% | $ | 113.8 | 13.5% | |||||||||||||||||||||||
Operating loss | $ | (142.6 | ) | -21.6 | % | $ | (16.3 | ) | -2.1 | % | $ | (126.3 | ) | |||||||||||||||||
Tons shipped | 704 | 7% | 657 | |||||||||||||||||||||||||||
Material cost | $ | 508.6 | 63.9% | 2% | $ | 498.0 | 59.0% | $ | 502.1 | $ | 557.3 | $ | (55.2 | ) | ||||||||||||||||
Tons shipped (in thousands) | 459 | 666 | (207 | ) | ||||||||||||||||||||||||||
Operating incomeNet sales and operating loss highlights were as follows:
Net sales decreased $67.1$127.8 million from the prior year to $46.7$661.0 million. Lower volumes reduced sales by $242.0 million, or 5.9% of net sales,which more than offset the $114.2 million benefit from higher average selling prices realized primarily in fiscal 2006 from $113.8 million, or 13.5% of net sales, for fiscal 2005. The primary driverthe first half of the decrease wasyear.
The operating loss of $142.6 million increased from a $16.3 million loss last year and included a $97.0 million goodwill impairment charge recorded in the narrower spread between average selling price and material costsecond fiscal quarter. In addition, rapidly declining steel prices resulted in an inventory write-down of $84.9 million,$38.0 million. Weak volumes were partially offset by an increase in volume of $20.5 million. Net sales decreased 6%, or $47.6 million, to $796.3 million in fiscal 2006lower SG&A expenses realized from $843.9 million for fiscal 2005 due to the impact of lower pricing of $117.0 million, partially offset by the impact of an increase in volume of $69.4 million. Gross margin decreased $72.5 million from $195.5 million to $123.0 millionplant closures and as a percentage of net sales, was 15.4% compared to 23.2% for the comparable period in the prior year. SG&A expense decreased because of a reduction in profit sharing and bonus expense of $10.6 million resulting from lower earnings.headcount reductions.
Pressure Cylinders
Our Pressure Cylinders segment represented approximately 16% of consolidated net sales during fiscal 2006. This segment had an increase in net sales and record operating income in fiscal 2006.
The following table presents a summary of operating results for the Pressure Cylinders business segment for the fiscal yearsperiods indicated:
| 2006 | 2005 | Fiscal Year Ended May 31, | ||||||||||||||||||||||||||
| Dollars in millions, units in thousands | Actual | % of Net Sales | % Change | Actual | % of Net Sales | |||||||||||||||||||||||
| Dollars in millions | 2009 | % of Net sales | 2008 | % of Net sales | Increase/ (Decrease) | |||||||||||||||||||||||
Net sales | $ | 461.9 | 100.0% | 13% | $ | 408.3 | 100.0% | $ | 537.4 | 100.0 | % | $ | 578.8 | 100.0 | % | $ | (41.4 | ) | ||||||||||
Cost of goods sold | 367.2 | 79.5% | 10% | 334.1 | 81.8% | 429.8 | 80.0 | % | 457.2 | 79.0 | % | (27.4 | ) | |||||||||||||||
Gross margin | 94.7 | 20.5% | 28% | 74.2 | 18.2% | 107.6 | 20.0 | % | 121.6 | 21.0 | % | (14.0 | ) | |||||||||||||||
Selling, general and administrative expense | 45.4 | 9.8% | 12% | 40.6 | 10.0% | 45.4 | 8.4 | % | 51.5 | 8.9 | % | (6.1 | ) | |||||||||||||||
Restructuring charges | 1.0 | 0.2 | % | 0.1 | 0.0 | % | 0.9 | |||||||||||||||||||||
Operating income | $ | 49.3 | 10.7% | 47% | $ | 33.6 | 8.2% | $ | 61.2 | 11.4 | % | $ | 70.0 | 12.1 | % | $ | (8.8 | ) | ||||||||||
Units shipped | 48,621 | 36,704 | ||||||||||||||||||||||||||
Material cost | $ | 221.8 | 48.0% | 12% | $ | 197.5 | 48.4% | $ | 257.5 | $ | 273.1 | $ | (15.6 | ) | ||||||||||||||
Units shipped (in thousands) | 47,639 | 48,058 | (419 | ) | ||||||||||||||||||||||||
Net sales and operating income highlights were as follows:
Net sales of $537.4 million decreased by $41.4 million from fiscal 2008. An unfavorable change in the sales mix combined with lower North American volumes, reduced sales by $38.7 million. Weaker foreign currencies relative to the U.S. dollar negatively impacted reported U.S. dollar sales of the non-U.S. operations by $9.0 million compared to last year.
Operating income increased 47%, or $15.7decreased $8.8 million from last year. Gross margin declined to $49.3 million, or 10.7%20.0% of net sales from 21.0% as lower volumes combined with a lower spread between average selling prices and material costs to result in fiscal 2006 from $33.6a $14.0 million or 8.2% of net sales, for fiscal 2005. Net sales increased 13%, or $53.6 million, to $461.9 milliondecline in fiscal 2006 from $408.3 million for fiscal 2005. The full-year impact of the September 2004 acquisition of the net assets of the propane and specialty gas cylinder business of Western Industries, Inc. (“Western Cylinder Assets”) contributed $23.0 million to this increase, other North American net sales contributed $12.6 million and improved European sales contributed $18.0 million. Unit volumes were flat, excluding units from the Western Cylinder Assets. Gross margin was 20.5% of net sales in fiscal 2006 compared to 18.2% for fiscal 2005. The
improved gross margin was primarily due tofor the full-year contribution of the Western Cylinder Assets and improved operating results of our European operations. The Austrian facility experienced increased unit volumes and expanded operating margins compared to fiscal 2005. The Portugal facility ceased production of its unprofitable liquefied petroleum gas cylinders in the first quarter of fiscal 2005, resulting in significantly improved gross margin in fiscal 2006 as a percentage of net sales. The Czech Republic facility expanded its air tank production in fiscal 2005, but incurred high labor and manufacturing expense during the expansion start-up in fiscal 2005. SG&A expense increased $4.8 million in fiscal 2006 from the prior year due the settlement of two product liability claims totaling $2.4 million and a $2.1 million increase in costs related to the full-year operation of the acquired Western Cylinder Assets.year.
Other
The “Other” category includes the Automotive Body Panels, Construction Services and Steel Packaging operatingbusiness segments, which are immaterial for purposes of separate disclosure, and also includesalong with income and expense items not allocated to the operatingbusiness segments.
The following table presents a summary of operating results for the Other category for the fiscal yearsperiods indicated:
| 2006 | 2005 | Fiscal Year ended May 31, | ||||||||||||||||||||||||||||||
| Dollars in millions | Actual | % of Net Sales | % Change | Actual | % of Net Sales | 2009 | % of Net sales | 2008 | % of Net sales | Increase/ (Decrease) | ||||||||||||||||||||||
Net sales | $ | 152.9 | 100.0% | 42% | $ | 107.4 | 100.0% | $ | 249.9 | 100.0 | % | $ | 236.4 | 100.0 | % | $ | 13.5 | |||||||||||||||
Cost of goods sold | 137.4 | 89.9% | 30% | 105.3 | 98.0% | 221.3 | 88.6 | % | 211.8 | 89.6 | % | 9.5 | ||||||||||||||||||||
Gross margin | 15.5 | 10.1% | 638% | 2.1 | 2.0% | 28.6 | 11.4 | % | 24.6 | 10.4 | % | 4.0 | ||||||||||||||||||||
Selling, general and administrative expense | 15.7 | 10.3% | 71% | 9.2 | 8.6% | 29.9 | 12.0 | % | 20.2 | 8.5 | % | 9.7 | ||||||||||||||||||||
Restructuring charges | 24.5 | 9.8 | % | 7.9 | 3.3 | % | 16.6 | |||||||||||||||||||||||||
Operating loss | $ | (0.2 | ) | -0.1% | 97% | $ | (7.1 | ) | -6.6% | $ | (25.8 | ) | -10.3 | % | $ | (3.5 | ) | -1.5 | % | $ | (22.3 | ) | ||||||||||
Operating loss decreased by $6.9 million to $0.2 million in fiscal 2006 from anNet sales and operating loss of $7.1highlights were as follows:
Net sales increased $13.5 million from fiscal 2008. Net sales in fiscal 2005 for all three operating segments inConstruction Services increased $28.6 million over the Other category,prior year primarily due to the Worthington Stairs acquisition in June 2008, and higher volumes in both the mid-rise and military construction business units. This was partially offset by an improvement$18.8 million decline in results for Autosales in Automotive Body Panels, which offset losseswas negatively impacted by the downturn in Construction Services. Net sales increased 42%, or $45.5the automotive market.
The operating loss widened by $22.3 million versus last year due to $152.9$24.5 million in fiscal 2006 from $107.4restructuring charges related to the Plan, which included professional fees, employee severance and relocation expenses. In addition, SG&A expenses increased $9.7 million due to the acquisition of Worthington Stairs and higher bad debt expense in fiscal 2005 due primarily to increased sales in theAutomotive Body Panels. The results of Construction Services operating segment. Gross margin was 10.1% of net sales in fiscal 2006 compared to 2.0% in fiscal 2005. SG&A expense increased $6.5 million fromimproved significantly over the prior year due to sales growth in the Construction Services operating segment.both its military and mid-rise construction end markets.
Fiscal 20052008 Compared to Fiscal 20042007
Consolidated Operations
The following table presents our consolidated operating results for the fiscal years indicated:results:
| 2005 | 2004 | Fiscal Year Ended May 31, | ||||||||||||||||||||||||||||||
| In millions, except per share | Actual | % of Net Sales | % Change | Actual | % of Net Sales | |||||||||||||||||||||||||||
| Dollars in millions | 2008 | % of Net sales | 2007 | % of Net sales | Increase/ (Decrease) | |||||||||||||||||||||||||||
Net sales | $ | 3,078.9 | 100.0% | 29% | $ | 2,379.1 | 100.0% | $ | 3,067.2 | 100.0 | % | $ | 2,971.8 | 100.0 | % | $ | 95.4 | |||||||||||||||
Cost of goods sold | 2,580.0 | 83.8% | 29% | 2,003.7 | 84.2% | 2,711.5 | 88.4 | % | 2,610.2 | 87.8 | % | 101.3 | ||||||||||||||||||||
Gross margin | 498.9 | 16.2% | 33% | 375.4 | 15.8% | 355.7 | 11.6 | % | 361.6 | 12.2 | % | (5.9 | ) | |||||||||||||||||||
Selling, general and administrative expense | 225.9 | 7.3% | 15% | 195.8 | 8.2% | 231.6 | 7.6 | % | 232.5 | 7.8 | % | (0.9 | ) | |||||||||||||||||||
Impairment charges and other | 5.6 | 0.2% | 69.4 | 3.0% | ||||||||||||||||||||||||||||
Restructuring charges | 18.1 | 0.6 | % | - | 0.0 | % | 18.1 | |||||||||||||||||||||||||
Operating income | 267.4 | 8.7% | 143% | 110.2 | 4.6% | 106.0 | 3.5 | % | 129.1 | 4.3 | % | (23.1 | ) | |||||||||||||||||||
Other income (expense): | ||||||||||||||||||||||||||||||||
Miscellaneous expense | (8.0 | ) | (1.6 | ) | ||||||||||||||||||||||||||||
Other expense, net | (6.3 | ) | -0.2 | % | (4.4 | ) | -0.1 | % | 1.9 | |||||||||||||||||||||||
Interest expense | (24.8 | ) | -0.8% | 12% | (22.2 | ) | -0.9% | (21.5 | ) | -0.7 | % | (21.9 | ) | -0.7 | % | (0.4 | ) | |||||||||||||||
Equity in net income of unconsolidated affiliates | 53.9 | 1.7% | 31% | 41.1 | 1.7% | |||||||||||||||||||||||||||
Earnings before income taxes | 288.5 | 9.4% | 126% | 127.5 | 5.4% | |||||||||||||||||||||||||||
Equity in net income of unconsolidated affiliate | 67.5 | 2.2 | % | 63.2 | 2.1 | % | 4.3 | |||||||||||||||||||||||||
Income tax expense | 109.1 | 3.5% | 168% | 40.7 | 1.8% | (38.6 | ) | -1.3 | % | (52.1 | ) | -1.8 | % | (13.5 | ) | |||||||||||||||||
Net earnings | $ | 179.4 | 5.8% | 107% | $ | 86.8 | 3.6% | $ | 107.1 | 3.5 | % | $ | 113.9 | 3.8 | % | $ | (6.8 | ) | ||||||||||||||
Average common shares outstanding - diluted | 88.5 | 86.9 | ||||||||||||||||||||||||||||||
Earnings per share - diluted | $ | 2.03 | 103% | $ | 1.00 | |||||||||||||||||||||||||||
Net earnings increased $92.6 million to $179.4 million for fiscal 2005,2008 decreased $6.8 million from $86.8 million for fiscal 2004. Fiscal 2005 diluted earnings per share increased $1.032007 to $2.03 per share from $1.00 per share in fiscal 2004.$107.1 million.
Net sales increased 29%, or $699.8$95.4 million to $3,078.9$3,067.2 million infrom fiscal 2005 from $2,379.1 million for fiscal 2004. Virtually all2007. Most of the increase in net sales was due to higher pricing, as volumes excluding acquisitions($63.4 million), stronger foreign currencies relative to the U.S. dollar ($31.3 million) and divestitures, were down on a comparative year-over-year basis for Metal Framing andmarginal increase in average selling prices. Volume increases boosted sales in nearly all of our business segments, especially Construction Services, where sales increased $36.5 million.
Gross margin decreased $5.9 million from fiscal 2007 primarily due to declines in our Pressure Cylinders business segment as a result of lower average selling prices in local currencies in Europe and up slightly for Steel Processing.
Gross margin increased 33%, or $123.5 million, to $498.9 million for fiscal 2005 from $375.4 million for fiscal 2004. A favorable pricing spread accounted for $127.6 millionmaterial costs. All of the increase, offset by a $5.3 million increase in direct labor and manufacturing expenses. Collectively, these factorsour other business segments reported increased gross margin as a percentage of net salesdue to 16.2% in fiscal 2005 from 15.8% in fiscal 2004.stronger volumes.
SG&A expense decreased to 7.3% of net sales in$0.9 million from fiscal 2005 compared to 8.2% of net sales in fiscal 2004. In total, SG&A expense increased $30.1 million, to $225.92007. The Plan provided $15.2 million in fiscal 2005 from $195.8 million in fiscal 2004. This was mainly due to a $16.6 million increase in profit sharing expense,SG&A savings, which was up significantly due to record earnings; a $9.9 million increase in professional fees;largely offset by increased compensation, depreciation and a $2.7 million increase in bad debt expense. The increase in professional fees was due to $5.5
Restructuring charges of $18.1 million of additional expenses associated with meeting the requirements of the Sarbanes-Oxley Act of 2002 (“SOX”) and $5.3 million was due to the ongoing implementation of our enterprise resource planning system (“ERP”). The increase in bad debt expense was a result of the increased collection risk of certain customers.
Impairment charges and other for fiscal 2004 included a $67.4 million pre-tax charge for the impairment of certain assets and other related costs at the Decatur, Alabama, steel-processing facility and a $2.0 million pre-tax charge for the impairment of certain assets related to the European operationsPlan.
Equity in net income of Pressure Cylinders. An additional pre-tax chargeunconsolidated affiliates of $5.6$67.5 million mainly due to contract termination costs related towas largely made up of earnings from our WAVE joint venture, which increased $5.8 million over fiscal 2007. Increased earnings from WAVE and the saleaddition of the Decatur facility,
was recognized during the first quarter of fiscal 2005. Refer to$3.1 million in earnings from Serviacero Worthington were offset by decreased earnings at WSP, TWB Company, L.L.C. (“TWB”), and certain other joint ventures. See “Item 8. – Financial Statements and Supplementary Data – Notes to Consolidated Financial Statements – Note NJ – Impairment Charges and Restructuring Expense”Investments in Unconsolidated Affiliates” for more information.
Miscellaneous expensefurther information about our participation in fiscal 2005 increased $6.4 million from fiscal 2004, largely due to a $4.3 million higher elimination for the minority shareholder’s interest in the net earnings of our consolidated joint ventures. Fiscal 2004 included a $3.6 million gain from the settlement of a hedge position with the Enron bankruptcy estate while fiscal 2005 also included a $1.1 million increase in interest income.
Interest expense increased 12%, or $2.6 million, to $24.8 million in fiscal 2005 from $22.2 million in fiscal 2004, due to higher average debt balances.
Equity in net income of unconsolidated affiliates increased 31%, or $12.8 million, to $53.9 million in fiscal 2005 from $41.1 million in fiscal 2004. Five of our seven unconsolidated joint ventures had strong double-digit increases in earnings. Collectively, the unconsolidated joint ventures generated approximately $767.0 million in sales in fiscal 2005, which were not reflected in consolidated net sales.ventures.
Income tax expense increased infor fiscal 2005 compared to fiscal 2004 due to a higher level of2008 decreased $13.5 million and the effective income and various tax adjustments. Our effective tax rate was 37.8% for fiscal 2005 and 31.9% for fiscal 2004. The rate change was mainly due26.5% compared to a net unfavorable adjustment of $2.6 million31.4% in fiscal 2005 compared2007. The decrease in income tax was primarily because of lower earnings and a lower effective income tax rate. The decrease in the effective income tax rate was primarily because of adjustments to favorable adjustments of $7.7 million recorded in fiscal 2004. The fiscal 2005 net adjustment was comprised of an unfavorable $4.3 million adjustment due to a ruling by the Sixth Circuit Court of Appeals that the state of Ohio’s investment tax credit program was unconstitutionalour current and was partially offset by a $1.7 million favorable adjustment for the revision ofdeferred estimated tax liabilities resulting from tax audit settlements and related developments. The $7.7 million favorable adjustments in fiscal 2004 were comprised of a $6.3 million credit for the favorable resolution of certain tax audits and a $1.4 million credit for an adjustment to deferred taxes.change in the mix of our foreign earnings.
Segment Operations
Steel Processing
Our Steel Processing segment represented 56% of consolidated net sales in fiscal 2005. The steel pricing environment and the automotive industry significantly impacted this segment’s results. After rising steadily in early fiscal 2005, steel prices declined from their peak in September of 2004. Overall, the price of steel in fiscal 2005 was significantly higher than in fiscal 2004. Our ability to raise prices to our customers contributed to an improved spread between our average selling price and material cost. Sales volume to the automotive market for fiscal 2005 was 3% higher than for fiscal 2004, due to market share gains and involvement in better selling product lines. Big Three automotive production volumes were down about 4% for the same period, while North American vehicle production for all manufacturers stayed relatively flat.
Effective August 1, 2004, we sold our Decatur, Alabama, steel-processing facility and its cold-rolling assets to Nucor for $80.4 million in cash. The assets sold at Decatur included the land and buildings, the four-stand tandem cold mill, the temper mill, the pickle line and the annealing furnaces. The sale excluded the slitting and cut-to-length assets and net working capital. We continue to serve customers by providing steel-processing services at the Decatur site under a long-term building lease with Nucor.
As a result of the sale, we recorded a $67.4 million pre-tax charge during the fourth quarter of fiscal 2004, primarily for the impairment of assets at the Decatur, Alabama, facility. All but an estimated $0.8 million of the pre-tax charge was non-cash. An additional pre-tax charge of $5.6 million, mainly relating to contract termination costs, was recognized during the first quarter of fiscal 2005.
The following table presents a summary of operating results for the Steel Processing business segment for the fiscal yearsperiods indicated:
| 2005 | 2004 | Fiscal Year Ended May 31, | ||||||||||||||||||||||||||
| Dollars in millions, tons in thousands | Actual | % of Net Sales | % Change | Actual | % of Net Sales | |||||||||||||||||||||||
| Dollars in millions | 2008 | % of Net sales | 2007 | % of Net sales | Increase/ (Decrease) | |||||||||||||||||||||||
Net sales | $ | 1,719.3 | 100.0% | 36% | $ | 1,265.3 | 100.0% | $ | 1,463.2 | 100.0 | % | $ | 1,460.7 | 100.0 | % | $ | 2.5 | |||||||||||
Cost of goods sold | 1,492.2 | 86.8% | 36% | 1,099.0 | 86.9% | 1,313.5 | 89.8 | % | 1,313.2 | 89.9 | % | 0.3 | ||||||||||||||||
Gross margin | 227.1 | 13.2% | 37% | 166.3 | 13.1% | 149.7 | 10.2 | % | 147.5 | 10.1 | % | 2.2 | ||||||||||||||||
Selling, general and administrative expense | 94.4 | 5.5% | 14% | 83.1 | 6.6% | 92.8 | 6.3 | % | 92.1 | 6.3 | % | 0.7 | ||||||||||||||||
Impairment charges and other | 5.6 | 0.3% | 67.4 | 5.3% | ||||||||||||||||||||||||
Restructuring charges | 1.1 | 0.1 | % | - | 0.0 | % | 1.1 | |||||||||||||||||||||
Operating income | $ | 127.1 | 7.4% | 704% | $ | 15.8 | 1.2% | $ | 55.8 | 3.8 | % | $ | 55.4 | 3.8 | % | $ | 0.4 | |||||||||||
Tons shipped | 3,663 | -3% | 3,766 | |||||||||||||||||||||||||
Material cost | $ | 1,267.9 | 73.7% | 50% | $ | 843.7 | 66.7% | $ | 1,105.7 | $ | 1,106.5 | $ | (0.8 | ) | ||||||||||||||
Tons shipped (in thousands) | 3,286 | 3,282 | 4 | |||||||||||||||||||||||||
Net sales and operating income highlights were as follows:
Net sales increased $2.5 million from fiscal 2007 to $1,463.2 million. The increase was attributable to a full year of operations at our stainless steel processing facility, Precision Specialty Metals, Inc. (“PSM”), compared to nine and one-half months of operations in fiscal 2007. Increased sales at PSM were partially offset by decreases in net sales at our carbon steel processing facilities, due to decreased average selling prices early in fiscal 2008 and lower volumes.
Operating income increased $111.3$0.4 million compared to $127.1fiscal 2007. Gross margin improved $2.2 million due to an increased spread between average selling prices and material cost, largely in fiscal 2005 from $15.8 million in fiscal 2004. Excluding the effectfourth quarter of the “impairment chargesfiscal year, offset by higher freight expense, wages and other” line item from each year, operating income increased $49.5 million, to $132.7 million, or 7.7% of net sales, in fiscal 2005 from $83.2 million, or 6.6% of net sales, in fiscal 2004. This increaseutilities. SG&A expense was up slightly, primarily due to a larger spreadhigher allocation of $51.2corporate expenses. Restructuring charges of $1.1 million between average selling pricerelated to employee early retirements and material cost and a decrease in expenses largely due to the sale of the Decatur assets. Net sales increased 36%, or $454.0 million, to $1,719.3 million from $1,265.3 million because of increased pricing. Volumes declined slightly compared to the prior fiscal year, but excluding the volumes associated with the assets sold at Decatur in each year, tons shipped increased 3.7% compared to the prior period. SG&A expense for fiscal 2005 was $94.4 million, an increase of $11.3 million from $83.1 million for fiscal 2004; however, as a percentage of net sales, SG&A declined due to the significant increase in net sales. The increase in SG&A was largely due to an increase in profit sharing and bonus expense of $6.5 million; higher bad debt expense of $3.4 million resulting from the increased collection risk of certain customers, including Tower Automotive; and additional expenses of $2.7 million associated with meeting SOX requirements.severance.
Metal Framing
Fiscal 2005 represented the best year in the history of the Metal Framing segment. This was primarily due to the wider spread between average selling price and material cost. During fiscal 2005, as spread continued to drive profitability, volumes slowed due to the weak commercial and office construction market. Even though volumes declined in fiscal 2005 compared to fiscal 2004, there were signs that the commercial construction market was improving late in the year. Certain commercial construction indices generally trended higher in fiscal 2005 compared to fiscal 2004, while our largest market, office buildings, declined in activity. In general, commercial construction activity had been depressed for over three years.
During the second quarter of fiscal 2005, we entered into an unconsolidated joint venture with Pacific. The focus of this joint venture was on the military housing construction market. Our Metal Framing segment sold steel framing products to the joint venture for its projects. The operating results of the joint venture were included in “Equity in net income of unconsolidated affiliates” on the Consolidated Statement of Earnings for fiscal 2005. During the second quarter of fiscal 2006, we purchased the interest of Pacific (see “Item 8 – Financial Statements and Supplementary Data - Notes to Consolidated Financial Statements – Note Q-Acquisitions” and “Business Strategy” above).
Also during the second quarter of fiscal 2005, we formed a consolidated joint venture with Encore, operating under the name Dietrich Metal Framing Canada. This joint venture was formed to manufacture steel framing products for the Canadian market and to offer a variety of proprietary products supplied by our Metal Framing facilities in the U. S. During fiscal 2005, this joint venture was a 60%-owned Canadian limited liability company for which the assets and results of operations were consolidated in our Metal Framing segment.
The following table presents a summary of operating results for the Metal Framing business segment for the fiscal yearsperiods indicated:
| 2005 | 2004 | Fiscal Year Ended May 31, | ||||||||||||||||||||||||||||
| Dollars in millions, tons in thousands | Actual | % of Net Sales | % Change | Actual | % of Net Sales | |||||||||||||||||||||||||
| Dollars in millions | 2008 | % of Net sales | 2007 | % of Net sales | Increase/ (Decrease) | |||||||||||||||||||||||||
Net sales | $ | 843.9 | 100.0% | 30% | $ | 651.6 | 100.0% | $ | 788.8 | 100.0 | % | $ | 771.4 | 100.0 | % | $ | 17.4 | |||||||||||||
Cost of goods sold | 648.4 | 76.8% | 26% | 515.7 | 79.1% | 729.0 | 92.4 | % | 711.7 | 92.3 | % | 17.3 | ||||||||||||||||||
Gross margin | 195.5 | 23.2% | 44% | 135.9 | 20.9% | 59.8 | 7.6 | % | 59.7 | 7.7 | % | 0.1 | ||||||||||||||||||
Selling, general and administrative expense | 81.7 | 9.7% | 22% | 67.1 | 10.3% | 67.0 | 8.5 | % | 68.9 | 8.9 | % | (1.9 | ) | |||||||||||||||||
Restructuring charges | 9.0 | 1.1 | % | - | 0.0 | % | 9.0 | |||||||||||||||||||||||
Operating income | $ | 113.8 | 13.5% | 65% | $ | 68.8 | 10.6% | |||||||||||||||||||||||
Operating loss | $ | (16.2 | ) | -2.1 | % | $ | (9.2 | ) | -1.2 | % | $ | (7.0 | ) | |||||||||||||||||
Tons shipped | 657 | -16% | 781 | |||||||||||||||||||||||||||
Material cost | $ | 498.0 | 59.0% | 38% | $ | 359.7 | 55.2% | $ | 557.3 | $ | 547.6 | $ | 9.7 | |||||||||||||||||
Tons shipped (in thousands) | 666 | 644 | 22 | |||||||||||||||||||||||||||
Operating income increased $45.0 million, to a record $113.8 million in fiscal 2005 from $68.8 million in fiscal 2004. The primary driver for the increase was a $95.1 million expansion in the spread between average selling price
Net sales and material cost. operating loss highlights were as follows:
Net sales increased 30%, or $192.3$17.4 million from fiscal 2007 to $843.9 million$788.8 million. The increase in fiscal 2005 from $651.6 million in fiscal 2004. This increasenet sales was due to a 54% increase inhigher volumes ($28.3 million) offset by lower average selling price, which increased net sales by $286.0prices ($10.9 million).
The operating loss of $16.2 million offset by a 16% volume decrease, which reduced net sales by $93.8 million. Gross margin increased 44% to $195.5was $7.0 million from $135.9 million inworse than fiscal 2004, mostly due to an increase in the spread between average selling price and material cost, partially offset by a $41.2 million impact due to lower sales volume. Even though SG&A expense increased $14.6 million, it decreased as a percentage of net sales to 9.7% in fiscal 2005 from 10.3% in fiscal 2004 due to the significant increase in net sales. SG&A expense increased2007 primarily due to a $9.2$9.0 million increase in profit sharing and bonus expense, additional expenses of $3.7 million for professional fees mainly due to the ERP implementation and $1.3 million associated with meeting SOX requirements. The combined impact of the factors discussed above was an increase in operating income as a percentage of net sales to 13.5%restructuring charges recorded in fiscal 2005 from 10.6% in fiscal 2004.
Pressure Cylinders
We acquired the Western Cylinder Assets on September 17, 2004. This business manufactures 14.1 oz. and 16.4 oz. disposable cylinders for products such as hand torches, propane-fueled camping equipment, portable heaters and tabletop grills. These new product lines generated $45.8 million of net sales for us in fiscal 2005 after the acquisition.
In Europe, we have been successful with high-pressure and refrigerant cylinders, but struggled with the liquefied petroleum gas (“LPG”) cylinders due2008. Metal Framing was able to market overcapacity and declining demand. As a result, an impairment charge on certain of our Portugal LPG assets was recordedreturn to operating profitability in the fourth quarter of fiscal 2004 and production of2008, but that was not enough to make up for the LPG cylinders at the Portugal facility ceased during the first quarter of fiscal 2005.
On October 13, 2004, we purchased the 49% interest of our minority partnerlosses earlier in the joint venture that operates a pressure cylinder manufacturing facility in Hustopece, Czech Republic.fiscal year. Overall volumes were up over fiscal 2007 contributing $8.9 million to gross margin; however, improved volumes were entirely offset by lower spreads between average selling prices and material cost and increased conversion costs. SG&A decreased $1.9 million as we began to recognize benefits from the Plan. Restructuring charges of $9.0 million were associated with the Plan.
Pressure Cylinders
The following table presents a summary of operating results for the Pressure Cylinders business segment for the fiscal yearsperiods indicated:
| 2005 | 2004 | Fiscal Year Ended May 31, | ||||||||||||||||||||||||||
| Dollars in millions, units in thousands | Actual | % of Net Sales | % Change | Actual | % of Net Sales | |||||||||||||||||||||||
| Dollars in millions | 2008 | % of Net sales | 2007 | % of Net sales | Increase/ (Decrease) | |||||||||||||||||||||||
Net sales | $ | 408.3 | 100.0% | 24% | $ | 328.7 | 100.0% | $ | 578.8 | 100.0 | % | $ | 544.8 | 100.0 | % | $ | 34.0 | |||||||||||
Cost of goods sold | 334.1 | 81.8% | 27% | 262.6 | 79.9% | 457.2 | 79.0 | % | 411.1 | 75.5 | % | 46.1 | ||||||||||||||||
Gross margin | 74.2 | 18.2% | 12% | 66.1 | 20.1% | 121.6 | 21.0 | % | 133.7 | 24.5 | % | (12.1 | ) | |||||||||||||||
Selling, general and administrative expense | 40.6 | 9.9% | 17% | 34.7 | 10.6% | 51.5 | 8.9 | % | 49.1 | 9.0 | % | 2.4 | ||||||||||||||||
Impairment charges and other | - | 2.0 | 0.6% | |||||||||||||||||||||||||
Restructuring charges | 0.1 | 0.0 | % | - | 0.0 | % | 0.1 | |||||||||||||||||||||
Operating income | $ | 33.6 | 8.2% | 14% | $ | 29.4 | 8.9% | $ | 70.0 | 12.1 | % | $ | 84.6 | 15.5 | % | $ | (14.6 | ) | ||||||||||
Units shipped | 36,704 | 150% | 14,670 | |||||||||||||||||||||||||
Material cost | $ | 197.5 | 48.4% | 38% | $ | 142.6 | 43.4% | $ | 273.1 | $ | 251.1 | $ | 22.0 | |||||||||||||||
Units shipped (in thousands) | 48,058 | 44,891 | 3,167 | |||||||||||||||||||||||||
OperatingNet sales and operating income highlights were as follows:
Net sales of $578.8 million increased 14%, or $4.2by $34.0 million over fiscal 2007. Stronger foreign currencies relative to $33.6the U.S. dollar positively impacted reported U.S. dollar sales of the non-U.S. operations by $26.9 million compared to fiscal 2007. This was offset by a $9.8 million decline in fiscal 2005sales from $29.4 millionour European operations in fiscal 2004.local currencies, primarily as a result of lower average selling prices. The remaining increase in net sales was due to improved volumes in our 14.1 ounce and 16.4 ounce cylinders and higher volumesselling prices across most North American product lines.
Operating income decreased $14.6 million from fiscal 2007. Gross margin declined to 21.0% of $19.6sales from 24.5% as the lower average selling prices in European local currencies and increased material costs resulted in a $12.1 million partially offset by a decline in the spread between average selling price and material cost of $11.6 million. Net sales increased 24%, or $79.6 million, to $408.3 million due to higher sales volumes, with $45.8 million of this increase attributable to the purchase of the Western Cylinder Assets. The strength of foreign currencies against the U.S. dollar also contributed $10.2 million to net sales. Grossgross margin increased $8.1 million to $74.2 million for fiscal 2005 from $66.1 million for fiscal 2004. Although SG&A expense decreased slightly as a percentage of net sales, the dollar expense increased $5.9 million primarily due to $2.9 million of expenses related to the purchase of the Western Cylinder Assets (which included $1.7 million of amortization expense of customer list intangible assets), an increase in profit sharing and bonus expense of $1.7 million, and additional expenses of $0.6 million associated with meeting SOX requirements.2008.
Other
The “Other” category includes the Automotive Body Panels, Construction Services and Steel Packaging reportingbusiness segments, which are immaterial for purposes of separate disclosure, and also includesalong with income and expense items not allocated to the operatingbusiness segments.
The following table presents a summary of operating results for the Other category for the fiscal yearsperiods indicated:
| 2005 | 2004 | Fiscal Year ended May 31, | ||||||||||||||||||||||||||||||
| Dollars in millions | Actual | % of Net Sales | % Change | Actual | % of Net Sales | 2008 | % of Net sales | 2007 | % of Net sales | Increase/ (Decrease) | ||||||||||||||||||||||
Net sales | $ | 107.4 | 100.0% | -20% | $ | 133.5 | 100.0% | $ | 236.4 | 100.0 | % | $ | 194.9 | 100.0 | % | $ | 41.5 | |||||||||||||||
Cost of goods sold | 105.3 | 98.0% | -17% | 126.4 | 94.7% | 211.9 | 89.6 | % | 174.2 | 89.4 | % | 37.7 | ||||||||||||||||||||
Gross margin | 2.1 | 2.0% | -70% | 7.1 | 5.3% | 24.5 | 10.4 | % | 20.7 | 10.6 | % | 3.8 | ||||||||||||||||||||
Selling, general and administrative expense | 9.2 | 8.6% | -16% | 10.9 | 8.2% | 20.2 | 8.5 | % | 22.4 | 11.5 | % | (2.2 | ) | |||||||||||||||||||
Restructuring charges | 7.9 | 3.3 | % | - | 0.0 | % | 7.9 | |||||||||||||||||||||||||
Operating loss | $ | (7.1 | ) | -6.6% | -87% | $ | (3.8 | ) | -2.8% | $ | (3.6 | ) | -1.5 | % | $ | (1.7 | ) | -0.9 | % | $ | (1.9 | ) | ||||||||||
OperatingNet sales and operating loss increased $3.3highlights were as follows:
The $41.5 million to $7.1 million, or 6.6% of net sales forincrease in fiscal 2008 was almost entirely attributable to the year from $3.8Construction Services business segment driven by higher volumes in the military construction group.
The operating loss widened by $1.9 million or 2.8% of net sales, forversus fiscal 2004. Net sales were $107.4 million for the year compared2007 due to $133.5$7.9 million in fiscal 2004restructuring charges. These charges included professional fees and early retirement and severance costs largely related to corporate employees. Gross margin improved $3.8 million due to the impactoperating performance of lower volume of $25.8 million. Gross margin decreased $5.0 million, to $2.1 million, from $7.1 million and, as a percentage of net sales, was 2.0% compared to 5.3% in the prior year, primarilyConstruction Services business segment, which improved significantly over fiscal 2007 due to a narrower spread between average selling pricecombination of higher volumes in the military construction group and material cost andstronger margins for the decrease in volume. SG&A expense decreased from $10.9 million in fiscal 2004 to $9.2 million in fiscal 2005, but increased as a percentage of net sales from 8.2% in fiscal 2004 to 8.6% in fiscal 2005.mid-rise construction projects.
Liquidity and Capital Resources
DuringCash and cash equivalents at the end of fiscal 2006,2009 decreased $17.5 million compared to the end of fiscal 2008. The following table summarizes consolidated cash flows.
| Fiscal Years Ended May 31, | ||||||||
Cash Flow Summary (in millions) | 2009 | 2008 | ||||||
Net cash provided by operating activities | $ | 254.3 | $ | 180.5 | ||||
Net cash used by investing activities | (53.3 | ) | (70.7 | ) | ||||
Net cash used by financing activities | (218.5 | ) | (74.3 | ) | ||||
Increase (decrease) in cash and cash equivalents | (17.5 | ) | 35.5 | |||||
Cash and cash equivalents at beginning of period | 73.8 | 38.3 | ||||||
Cash and cash equivalents at end of period | $ | 56.3 | $ | 73.8 | ||||
We believe we generated $227.1 million inhave access to adequate resources to meet our needs for normal operating costs, mandatory capital expenditures, mandatory debt redemptions, dividend payments and working capital for our existing businesses. These resources include cash from operating activities. This was primarily the result of $146.0 million in net earnings, an $11.6 million increase in accounts receivable and an $81.7 million increase of in accounts payable during the period. The difference between the netcash equivalents, cash provided by operating activities and unused lines of credit. Given the current uncertainty in the financial markets, our ability to access capital and the terms under which we can do so may change. Should the Company be required to raise capital in this environment, potential outcomes might include higher borrowing costs, less available capital, more stringent terms and tighter covenants, or in extreme conditions, an inability to raise capital.
Operating activities
Our business is cyclical and cash flows from operating activities may fluctuate during the year and from year-to-year due to economic conditions. We rely on cash and short-term financing to meet cyclical increases in working capital needs. Cash requirements generally rise during periods of increased economic activity or increasing raw material prices due to higher levels of inventory and accounts receivable. During economic slowdowns, or periods of decreasing raw material costs, cash requirements generally decrease as a result of the reduction of inventories and accounts receivable. With lower cash requirements, we are typically able to reduce, or eliminate, short-term debt.
Net cash provided by operating activities was $254.3 million and $180.5 million in fiscal 2006 compared2009 and fiscal 2008, respectively. A significant amount of cash was generated in fiscal 2009 by a large decrease in net working capital. Inventories, receivables and accounts payable all decreased significantly due to fiscal 2005 was primarily the result of changes in accounts receivablelower current and inventory, which were reflective of the decline of steel prices, discussed above, and increased accounts payable.
projected sales volumes, coupled with lower raw material costs. Consolidated net working capital was $505.5$226.9 million at May 31, 2006,2009, compared to $392.9$440.1 million at May 31, 2005. 2008.
We review our receivables on an ongoing basis to ensure that they are properly valued. Based on this review, we have increased our allowances by $7.6 million to $12.5 million since May 31, 2008. This increase is principally tied to customers in the automotive industry; and, based on our current information, we believe our allowances are sized appropriately. However, if the economic environment and market conditions do not improve, particularly in the automotive and construction markets where our exposure is greatest, additional reserves may be required.
As noted above, while an economic slowdown adversely affects sales, it generally decreases working capital needs. As the impact or ramifications of the current economic slowdown become known, we will continue to adjust operating activities and cash needs accordingly.
Investing activities
Net cash used by investing activities was $53.3 million and $70.7 million in fiscal 2009 and fiscal 2008, respectively.
Capital expenditures by reportable business segment represent cash used for investment in property, plant and equipment and are presented below:
| Fiscal Year Ended May 31, | ||||||
| In millions | 2009 | 2008 | ||||
Steel Processing | $ | 25.0 | $ | 7.2 | ||
Metal Framing | 4.5 | 6.8 | ||||
Pressure Cylinders | 26.6 | 16.5 | ||||
Other | 8.1 | 17.0 | ||||
| $ | 64.2 | $ | 47.5 | |||
The $112.6Steel Processing business segment capital expenditures increased $17.8 million increase was mainly attributablein fiscal 2009 compared to fiscal 2008, due primarily to capacity expansion at our Delta, Ohio, steel galvanizing plant.
The Pressure Cylinders business segment capital expenditures increased $10.1 million in fiscal 2009 compared to fiscal 2008, due to an increaseupgrade of the capabilities at our Austrian Pressure Cylinders facility.
Capital expenditures for the Other category decreased $8.9 million in inventoryfiscal 2009 compared to fiscal 2008. This was due primarily to decreased expenditures related to our enterprise resource planning system, based on the stage of $33.6 millionthe project, as well as decreases resulting from completion of other various projects and a decreaseconscious effort to reduce spending in current maturitiesthis area.
Net cash used by investing activities decreased $17.4 million during fiscal 2009 compared to fiscal 2008. This was due primarily to the fiscal 2009 receipt of long-term debt of $143.4 million, partially offset bydistributions from an increase in accounts payable of $82.7 million.
Our primary investing and financing activities included distributing $60.0 million in dividends to shareholders, and spending $60.1 million on capital projects, including $14.3 million for our ERP system, $7.4 million for a furnace upgrade at our Spartanunconsolidated joint venture galvanizing facility and $5.5in excess of the Company’s cumulative equity in the earnings of that joint venture. This cash flow of $23.5 million forwas included in investing activities in the UltraSTEELTMconversion project. Weconsolidated statements of cash flows due to the nature of the distribution as a return of investment, rather than a return on investment. Distributions from unconsolidated joint ventures that did not exceed the Company’s cumulative equity in the earnings of respective joint ventures are included as operating cash flows in the consolidated statements of cash flows. In fiscal year 2008, there were no distributions from unconsolidated joint ventures classified as investing cash flows. In fiscal 2009, lower acquisitions/investments also invested $16.4 million in a new aircraft which represented progress payments on an estimated purchase price of $l9.3 million. This investment is recorded in assets held for sale as the aircraft will be sold and leased back during fiscal 2007. It will replace an existing leased aircraft.
We generated $9.1 million in cash from the issuance of common shares through option exercises and $47.8 millioncombined with higher proceeds from the sale of assets includingto partially offset the increase in capital spending noted above. The cash used in our acquisition of the assets of The Sharon Companies Ltd. in fiscal 2009 was slightly less than the cash used in the fiscal 2008 investment in the Serviacero Worthington joint venture. Additionally, the proceeds from the sale of our interestinvestments in Acerex. Major ongoing projects include our ERP project, the furnace upgrade at Spartan,Aegis, Slovakia and ABT joint ventures, as well as the conversion to UltraSTEELTM production for our Metal Framing segment.
Our short-term liquidity needs are primarily met by a $435.0 million long-term revolving credit facility; a $100.0 million trade accounts receivable securitization facility and $40.0 millionsales of other assets in uncommitted discretionary credit lines. Duringfiscal 2009, were slightly higher than the third quarter of fiscal 2006, a $20.0 million discretionary credit line was terminated. All credit facilities and lines were unused as of May 31, 2006 and May 31, 2005. Our 7 1/8% Senior Notes matured on May 15, 2006, and were fully paid.
On September 29, 2005, we amended and restated our $435.0 million long-term revolving credit facility to extendproceeds received from the maturity to September 2010 and to replace the leverage ratio (debt-to-EBITDA) financial covenant with an interest coverage ratio (EBITDA-to-interest expense) financial covenant of not less than 3.25 times. The amended and restated facility also reduces the facility fees payable and provides liquidity beyond the maturity of our 6.70% Notes due in December 2009. The proceeds of the amended and restated facility may be used for general corporate purposes including working capital, capital expenditures, acquisitions and dividends.
Uncommitted lines of credit are extended to us on a discretionary basis. Because the outstanding principal amounts can be adjusted daily, these uncommitted lines typically provide us with the greatest amount of funding flexibility compared to our other sourcessale of short-term capital.investments in fiscal 2008.
At May 31, 2006, our total debt was $252.7 million compared to $388.4 million at May 31, 2005. Our debt to total capitalization ratio was 21.1% at May 31, 2006, down from 32.1% at May 31, 2005.
On June 13, 2005, we announced that our board of directors authorized the repurchase of up to 10.0 million of our outstanding common shares. The purchases mayInvestment activities are largely discretionary and future investment activities could be made from time to time, on the open marketreduced significantly or in private transactions, with consideration given to the market price of the common shares, the nature of other investment opportunities, cash flows from operations and generaleliminated as economic conditions. During fiscal 2006, there were no repurchases of common shares.
conditions warrant. We assess acquisition opportunities as they arise. Additional financingarise, and such opportunities may be required if we decide to makerequire additional acquisitions.financing. There can be no assurance, however, that any such opportunities will arise, that any such acquisitions will be consummated, or that any needed additional financing will be available on satisfactory terms when required. Absent any new
Financing activities
Net cash used by financing activities was $218.5 million and $74.3 million in fiscal 2009 and fiscal 2008, respectively. The increased net use of cash for financing activities of $144.2 million was largely driven by the payment of borrowings during fiscal 2009, versus the proceeds from issuance in fiscal 2008. The majority of that activity is reflected in the amounts outstanding under the revolving credit facility, as discussed below. The decreased level of common share repurchase activity in fiscal 2009 compared to fiscal 2008, also discussed below, offsets, to some extent, the impact from net payments on borrowings.
Long-term debt – Our senior unsecured long-term debt is rated “investment grade” by both Moody’s Investors Service, Inc. (Baa2) and Standard & Poor’s Ratings Group (BBB). We typically use the net proceeds from long-term debt for acquisitions, refinancing outstanding debt, capital expenditures and general corporate purposes. As of May 31, 2009, we anticipatewere in compliance with our long-term debt covenants. Our long-term debt agreements do not include ratings triggers or material adverse change provisions.
Subsequent to May 31, 2009, we completed a cash tender offer for our 6.7% notes due December 1, 2009. The Company purchased $118.5 million of the then $138.0 million outstanding principal amount. The consideration paid was $1,025 per $1,000 principal amount, plus accrued and unpaid interest.
Short-term debt – We maintain a $435.0 million revolving credit facility, which expires in May 2013, except for a $35.0 million commitment by one lender, which expires in September 2010. We were in compliance with our short-term debt covenants at May 31, 2009. Our short-term debt agreements do not include ratings triggers or material adverse change provisions. Current borrowings under this revolving credit facility have maturities of less than one year and given that cash, short-term investments, cash providedwe intend to repay them within the next year, they have been classified as notes payable. However, we can also extend the term of amounts borrowed by renewing these borrowings for the term of the facility. We have the option to borrow at rates equal to an applicable margin over the LIBOR, Prime or Fed Funds rates. The applicable margin is determined by our credit rating. At May 31, 2009, borrowings under the revolving credit facility bore interest at rates based on LIBOR. We had $434.0 million available to us under this facility at May 31, 2009, compared to $309.6 million available to us at May 31, 2008.
Our most restrictive debt covenants require us to maintain an interest coverage ratio (adjusted EBITDA divided by operating activitiesinterest expense, on a trailing 12-month basis) of at least 3.25 times and unused borrowing capacity shoulda consolidated indebtedness to capitalization ratio of not more than 55%. These covenants are tested at the end of each fiscal quarter. At May 31, 2009, the interest coverage ratio was 8.72 times and the consolidated indebtedness to capitalization ratio was 32%.
We also have a $100.0 million revolving trade accounts receivable securitization facility, of which $60.0 million was utilized at May 31, 2009, and $100.0 million at May 31, 2008. See the description that follows under “Off-Balance Sheet Arrangements.” The securitization facility is backed by a committed liquidity facility that expires during January 2011.
We also provided $8.3 million in letters of credit for third-party beneficiaries as of May 31, 2009. The letters of credit secure potential obligations to certain bond and insurance providers. These letters can be sufficientdrawn at any time at the option of the beneficiaries.
Common shares – We maintained our quarterly dividend declared during the first three quarters of fiscal 2009 at $0.17 per common share. The dividend declared during the fiscal quarter ended May 31, 2009 was reduced to fund expected normal operating costs,$0.10 per common share. We paid dividends working capital,on our common shares of $53.7 million and capital expenditures$55.6 million in fiscal 2009 and fiscal 2008, respectively.
At its meeting on September 27, 2006, the Board of Directors of Worthington Industries reconfirmed its authorization to repurchase up to 10,000,000 of Worthington’s outstanding common shares, which had initially been announced on June 13, 2005. This repurchase authorization was completed during December 2007. On September 26, 2007, Worthington announced that the Board of Directors had authorized the repurchase of up to an additional 10,000,000 of Worthington’s outstanding common shares. A total of 8,449,500 common shares remained available under this repurchase authorization as of May 31, 2009. The common shares available for our existing businesses.repurchase under this authorization may be purchased from time to time, with consideration given to the market price of the common shares, the nature of other investment opportunities, cash flows from operations, general economic conditions and other relevant considerations. Repurchases may be made on the open market or through privately negotiated transactions. During fiscal 2009 and fiscal 2008, we spent $12.4 million and $125.8 million, respectively, on common share repurchases.
Dividend Policy
We currently have no material contractual or regulatory restrictions on the payment of dividends. Dividends are declared at the discretion of our boardthe Board of directors. Our boardDirectors of directorsWorthington. The Board reviews the dividend quarterly and establishes the dividend rate based upon our financial condition, results of operations, capital requirements, current and projected cash flows, business prospects and other factors which are deemed relevant.relevant factors. While we have paid a dividend every quarter since becoming a public company in 1968, there is no guarantee that this will continue in the future.
Contractual Cash Obligations and Other Commercial Commitments
The following table summarizes our contractual cash obligations as of May 31, 2006.2009. Certain of these contractual obligations are reflected on our consolidated balance sheet, while others are disclosed as future obligations under accounting principles generally accepted in the U.S.United States.
| Payments Due by Period | Payments Due by Period | |||||||||||||||||||||||||||||
| In millions | Total | Less Than 1 Year | 1 - 3 Years | 4 - 5 Years | After 5 Years | Total | Less Than 1 Year | 1 - 3 Years | 4 - 5 Years | After 5 Years | ||||||||||||||||||||
Notes payable | $ | 1.0 | $ | 1.0 | $ | - | $ | - | $ | - | ||||||||||||||||||||
Current maturities of long-term debt | 138.0 | 138.0 | - | - | - | |||||||||||||||||||||||||
Long-term debt | $ | 245.0 | $ | - | $ | - | $ | 145.0 | $ | 100.0 | 100.4 | - | - | 0.2 | 100.2 | |||||||||||||||
Interest expense on long-term debt | 86.9 | 15.0 | 30.1 | 20.4 | 21.4 | 32.0 | 5.3 | 10.7 | 10.7 | 5.3 | ||||||||||||||||||||
Operating leases | 68.3 | 10.9 | 21.0 | 16.4 | 20.0 | 45.1 | 11.1 | 17.2 | 10.5 | 6.3 | ||||||||||||||||||||
Unconditional purchase obligations | 30.7 | 2.4 | 4.7 | 4.7 | 18.9 | 23.7 | 2.4 | 4.7 | 4.7 | 11.9 | ||||||||||||||||||||
Total contractual cash obligations | $ | 430.9 | $ | 28.3 | $ | 55.8 | $ | 186.5 | $ | 160.3 | $ | 340.2 | $ | 157.8 | $ | 32.6 | $ | 26.1 | $ | 123.7 | ||||||||||
The interest expense on long-term debt is computed by using the fixed rates of interest on the debt, including impacts of the related interest rate swap hedge. The unconditional purchase obligations are to secure access to a facility used to regenerate acid used in three steel processing facilities. These threeour Steel Processing facilities are to deliver their spent acid for processing annually through fiscal 2019. Due to the uncertainty regarding the timing of future cash outflows associated with our unrecognized tax benefits of $3.9 million, we are unable to make a reliable estimate of the periods of cash settlement with the respective tax authorities and have not included such amount in the contractual obligations table above.
During the fiscal quarter ended May 31, 2009, the Company redeemed $7.0 million of its then $145.0 million outstanding principal amount of 6.7% notes due December 1, 2009 (the “Notes”). Subsequent to May 31, 2009, we completed a cash tender offer for the Notes, redeeming an additional $118.5 million of outstanding principal amount. The consideration paid for the subsequent redemption was $1,025 per $1,000 principal amount, plus accrued and unpaid interest.
The following table summarizes our other commercial commitments as of May 31, 2006.2009. These commercial commitments are not reflected on our consolidated balance sheet.
| Commitment Expiration per Period | Commitment Expiration by Period | |||||||||||||||||||||||||||||
| In millions | Total | Less Than 1 Year | 1 - 3 Years | 4 - 5 Years | After 5 Years | Total | Less Than 1 Year | 1 - 3 Years | 4 - 5 Years | After 5 Years | ||||||||||||||||||||
Lines of credit | $ | 435.0 | $ | - | $ | - | $ | 435.0 | $ | - | ||||||||||||||||||||
Guarantees (aircraft residual values) | $ | 17.9 | $ | 17.9 | $ | - | $ | - | $ | - | ||||||||||||||||||||
Standby letters of credit | 11.5 | 11.5 | - | - | - | 8.3 | 8.3 | - | - | - | ||||||||||||||||||||
Guarantees | 4.7 | 4.7 | - | - | - | |||||||||||||||||||||||||
Total commercial commitments | $ | 451.2 | $ | 16.2 | $ | - | $ | 435.0 | $ | - | $ | 26.2 | $ | 26.2 | $ | - | $ | - | $ | - | ||||||||||
Off BalanceOff-Balance Sheet Arrangements
We maintain a $100.0 million revolving trade accounts receivable securitization facility which expires in January 2011. This facility was available throughout fiscal 2009 and fiscal 2008. Transactions under the facility have been accounted for as a sale under the provisions of SFAS No. 140,Accounting for Transfers and Servicing ofFinancial Assets and Extinguishments of Liabilities. Pursuant to the terms of the facility, certain of our subsidiaries sell their accounts receivable without recourse, on a revolving basis, to Worthington Receivables Corporation (“WRC”), a wholly-owned, consolidated, bankruptcy-remote subsidiary. In turn, WRC may sell without recourse, on a revolving basis, up to $100.0 million of undivided ownership interests in this pool of accounts receivable to a multi-sell, asset-backed commercial paper conduit (the “Conduit”). Purchases
by the Conduit are financed with the sale of A1/P1 commercial paper. We retain an undivided interest in this pool and are subject to risk of loss based on the collectability of the receivables from this retained interest. Because the amount eligible to be sold excludes receivables more than 90 days past due, receivables offset by an allowance for doubtful accounts because of bankruptcy or other cause, receivables from foreign customers, concentrations over limits with specific customers and certain reserve amounts, we believe additional risk of loss is minimal. The book value of the retained portion of the pool of accounts receivable approximates fair value. Accounts receivable sold under this facility are excluded from accounts receivable in the consolidated financial statements. As of May 31, 2009, the pool of eligible accounts receivable was $92.4 million, and $60.0 million of undivided ownership interests in this pool of accounts receivable had nobeen sold.
We do not have guarantees or other off-balance sheet financing arrangements that we believe are reasonably likely to have a material off balance sheet arrangementscurrent or future effect on our financial condition, changes in financial condition, revenue or expenses, results of operations, liquidity, capital expenditures or capital resources. However, as of May 31, 2009, the Company was party to operating leases for aircraft in which the Company has guaranteed residual values at the termination of the leases. The maximum obligation under these terms is approximately $17.9 million at May 31, 2006.2009. Based on current facts and circumstances, the Company has estimated the likelihood of payment pursuant to this guarantee, and determined that the fair value of the obligation based on those likely outcomes is not material.
Recently Issued Accounting Standards
In November 2004,September 2006, the Financial Accounting Standards Board (“FASB”)FASB issued Statement of Financial Accounting Standards (“SFAS”)SFAS No. 151,157,Inventory Costs, an amendment of ARBFair Value Measurements, to establish a framework for measuring fair value and expand disclosures about fair value measurements. SFAS No. 43, Chapter 4 (“SFAS 151”).
SFAS 151 amends the guidance in Accounting Research Bulletin No. 43, Chapter 4,Inventory Pricing to clarify the accounting157 was effective for abnormal amounts of idle facility expense, freight, handling costfinancial assets and wasted material (spoilage). In addition, SFAS 151 requires that allocation of fixed production overhead to the costs of conversion be based on the normal capacity of the production facilities. SFAS 151liabilities after May 31, 2008, and for non-financial assets and liabilities is effective for inventory costs incurred beginning June 1, 2006. We doafter May 31, 2009. SFAS No. 157 has not expect the adoption of SFAS 151had, and is not expected to have, a material impact on our consolidated financial position or results of operations.statements.
In December 2004,2007, the FASB issued SFAS No. 123141 (revised 2004),Share-Based Payment(“SFAS 123(R)”).SFAS 123(R) is a revision of SFAS 123 and it supercedes APB No. 25 and amends 2007) (“SFAS No. 95,141(R)”),StatementBusiness Combinations,to improve the relevance, representational faithfulness and comparability of Cash Flows.Generally, the approachinformation that a reporting entity provides in its financial reports about a business combination and its effects. SFAS 123(R)No. 141(R) applies prospectively to business combinations after May 31, 2009, and will affect the accounting treatment of future acquisitions that we may consummate.
In December 2007, the FASB issued SFAS No. 160,Noncontrolling Interests In Consolidated Financial Statements – an amendment of ARB No. 51,to improve the relevance, comparability and transparency of the financial information that a reporting entity provides in its consolidated financial statements by establishing accounting and reporting standards for the noncontrolling interest (minority interest) in a subsidiary and for the deconsolidation of a subsidiary. SFAS No. 160 is similar to the approach described in SFAS 123. However, SFAS 123(R) requires all share-based payments to employees, including grants of employee stock options, to be recognizedeffective June 1, 2009, and will require a change in the income statement based on their fair values. Proforma disclosure will notpresentation of the minority interest in the consolidated financial statements.
In April 2008, the FASB issued FASB Staff Position (“FSP”) No. FAS 142-3,Determination of the Useful Life of Intangible Assets (“FSP No. 142-3”). FSP 142-3 amends the factors that should be an alternative.considered in developing renewal or extension assumptions used to determine the useful life of a recognized intangible asset under SFAS 123(R)No. 142,Goodwill and Other Intangible Assets. FSP 142-3 is effective for allfinancial statements issued for fiscal years beginning after JuneDecember 15, 2005, and thus will become effective for us beginning in the2008, as well as interim periods within those fiscal year ending May 31, 2007 (“fiscal 2007”).years. The adoption of SFAS 123(R)’s fair value methodthis pronouncement will have an impact on resultsaffect the accounting treatment of operations, although it will have no impact on the Company’s overall financial position. Stock option expense after the adoption of SFAS 123(R) is not expected to be materially different than the expense reported in “Item 8. – Financial Statements and Supplementary Data – Notes to Consolidated Financial Statements – Note A – Summary of Significant Accounting Policies”, but this will not be known until a full analysis of the impact of SFAS 123(R) is completed. The impact will largely depend on levels of share-based payments granted in the future.future acquisitions that we may consummate.
In July 2006,November 2008, the FASB issued FASB Interpretation No. 48,ratified EITF Issue 08-6,Equity Method Investment Accounting for Uncertainty in Income Taxes—an interpretation of FASB Statement No. 109Considerations(“FIN 48”, (“EITF Issue 08-06”), which clarifies the accounting for uncertaintycertain transactions and impairment considerations involving equity method investments. EITF Issue 08-06 is effective for fiscal years beginning on or after December 15, 2008, and interim periods within those years. We do not expect EITF Issue 08-06 to have a material impact on our consolidated financial statements.
In December 2008, the FASB issued FSP No. FAS 132(R)-1,Employers’ Disclosures about Postretirement Benefit Plan Assets – an amendment of FASB Statement No. 132(R) (“FSP FAS 132(R)-1”). FSP FAS 132(R)-1 expands the disclosure requirements under FASB Statement No. 132(R),Employers’ Disclosures about Pensions and Other Postretirement Benefits to include disclosure on investment policies and strategies, major categories of plan assets, fair value measurements for each major category of plan assets segregated by fair value hierarchy level as defined in tax positions. This InterpretationSFAS 157, the effect of fair value measurements using Level 3 inputs on changes in plan assets for the period, and significant concentrations of risk within plan assets. FSP FAS 132(R)-1 is effective for financial statements issued for fiscal years ending after December 15, 2009. The adoption of this standard will require expanded disclosure in the notes to the Company’s consolidated financial statements but will not impact our consolidated financial statements.
In April 2009, the FASB issued FSP No. FAS 141(R)-1,Accounting for Assets Acquired and Liabilities Assumed in a Business Combination That Arise from Contingencies (“FSP No. 141(R)-1”). FSP No. 141(R)-1 requires that assets acquired and liabilities assumed in a business combination that arise from contingencies be recognized at fair value if fair value can be reasonably estimated. FSP No. 141(R)-1 is effective for business combinations with an acquisition date on or after June 1, 2009. The adoption of this pronouncement will affect the accounting treatment of future acquisitions that we recognizemay consummate.
In April 2009, the FASB issued FSP No. FAS 157-4,Determining Fair Value When the Volume and Level of Activity for the Asset or Liability Have Significantly Decreased and Identifying Transactions That Are Not Orderly (“FSP No. 157-4”). FSP No. 157-4 provides guidance on how to determine the fair value of assets and liabilities under SFAS No. 157 in the current economic environment and reemphasizes that the objective of a fair value measurement remains an exit price. If we were to conclude that there has been a significant decrease in the volume and level of activity of the asset or liability in relation to normal market activities, quoted market values may not be representative of fair value and we may conclude that a change in valuation technique or the use of multiple valuation techniques may be appropriate. FSP No. 157-4 is effective for interim and annual periods ending after June 15, 2009. We do not expect FSP No. 157-4 to have a material impact on our consolidated financial statements.
In April 2009, the FASB issued FSP FAS 115-2 and FAS 124-2,Recognition and Presentation of Other-Than-Temporary Impairments(“FSP No. 115-2 and 124-2”). FSP No. 115-2 and 124-2 amends the other-than-temporary impairment guidance for debt securities to improve presentation and disclosure of other-than-temporary impairments of debt and equity securities in the financial statements. FSP No. 115-2 and 124-2 is effective for all reporting periods ending after June 15, 2009. We do not expect FSP FSP No. 115-2 and 124-2 to have a material impact on our consolidated financial statements.
In April 2009, the FASB issued FSP No. FAS 107-1 and APB 28-1,Interim Disclosures about Fair Value of Financial Instruments(“FSP No. 107-1 and APB 28-1”). FSP No. 107-1 and APB 28-1 amends SFAS No. 107,Disclosures about Fair Value of Financial Instruments, to require disclosures about fair value of financial instruments in interim as well as in annual financial statements. FSP No. 107-1 and APB 28-1 also amends APB Opinion No. 28, “Interim Financial Reporting,” to require those disclosures in all interim financial statements. FSP No. 107-1 and APB 28-1 is effective for all reporting periods ending after June 15, 2009. We do not expect FSP No. 107-1 and APB 28-1 to have a material impact on our consolidated financial statements.
In May 2009, the FASB issued SFAS No. 165,Subsequent Events (“SFAS No. 165”). SFAS No. 165 establishes general standards of accounting for and disclosure of events that occur after the balance sheet date but before financial statements the impact of a tax position, if that positionare issued. SFAS No. 165 is more likely than not of being sustained on audit, based on the technical merits of the position. The provisions of FIN 48 are effective as of the beginning of our 2007 fiscal year, with the cumulative effect of the change in accounting principle recorded as an adjustment to opening retained earnings.for interim or annual financial periods ending after June 15, 2009. We are currently evaluating the impact of adoptingthis statement.
In June 2009, the FASB issued SFAS No. 166,Accounting for Transfers of Financial Assets – an amendment of FASB Statement No. 140(“SFAS No. 166”). SFAS No. 166 amends the guidance on transfers of financial assets and impacts new transfers of many types of financial assets (e.g., factoring arrangements and sales of trade
receivables, mortgages and installment loans). SFAS No. 166 is effective for fiscal years beginning after November 15, 2009, and in interim periods within those fiscal years. We are currently evaluating the impact of this statement.
In June 2009, the FASB issued SFAS No. 167,Amendments to FASB Interpretation No. 46(R)(“SFAS No. 167”). SFAS No. 167 amends the consolidation guidance for variable-interest entities (“VIE”) under FIN 4846(R). SFAS No. 167 makes significant changes to the model for determining who should consolidate a VIE, and also addresses how often this assessment should be performed. SFAS No. 167 is effective for fiscal years beginning after November 15, 2009. We are currently evaluating the impact of this statement.
In June 2009, the FASB issued SFAS No. 168, The FASB Accounting Standards Codificationand the Hierarchy of Generally Accepted Accounting Principles – a replacement of FASB Statement No. 162 (“SFAS No. 168”). On the effective date of this Statement, the Codification will supersede all then-existing non-SEC accounting and reporting standards. All other non-grandfathered, non-SEC accounting literature not included in the Codification will become non-authoritative. This Statement is effective for financial statements issued for interim and annual periods ending after September 15, 2009. We do not expect this pronouncement to have a material impact on our consolidated financial statements.
Environmental
We believe environmental issues will not have a material effect on capital expenditures, future results of operations or financial position.
Inflation
The effects of inflation on our operations were not significant during the periods presented in the consolidated financial statements.
Critical Accounting Policies
The discussion and analysis of our financial condition and results of operations are based upon our consolidated financial statements, which have been prepared in accordance with accounting principles generally accepted in the U.S.United States. The preparation of these consolidated financial statements requires us to make estimates and assumptions that affect the reported amounts of assets and liabilities and the disclosure of contingent assets and liabilities at the date of the consolidated financial statements and the reported amounts of revenues and expenses during the reporting period.periods. We continually evaluate our estimates, including those related to our valuation of receivables, inventories, intangible assets, accrued liabilities, income and other tax accruals and contingencies and litigation. We base our estimates on historical experience and various other assumptions that we believe to be reasonable under the circumstances. These results form the basis for making judgments about the carrying values of assets and liabilities that are not readily apparent from other sources. Critical accounting policies are defined as those that reflect our significant judgments and uncertainties that could potentially result in materially different results under different assumptions and conditions. Although actual results historically have not deviated significantly from those determined using our estimates, as discussed below, our financial position or results of operations could be materially different if we were to report under different conditions or to use different assumptions in the application of such policies. We believe the following accounting policies are the most critical to us since these are the primary
areas where financial information is subject to our estimates, assumptions and judgment in the preparation of our consolidated financial statements.
Revenue Recognition:We recognize revenue upon transfer of title and risk of loss provided evidence of an arrangement exists, pricing is fixed and determinable and collectibilitythe ability to collect is probable. In circumstances where the collection of payment is highly questionable at the time of shipment, we defer
recognition of revenue until payment is collected. We provide an allowance for returns and allowances based on experience and current customer activities. As of May 31, 2009 and May 31, 2008, we had deferred $9.3 million and $9.1 million, respectively, of revenue related to pricing disputes.
Within our Construction Services we recognizebusiness segment, which represented less than 5.0% of consolidated net sales for each of the last three fiscal years, revenue is recognized on a percentage-of-completion method.
Receivables: We review our receivables on a monthlyan ongoing basis to ensure that they are properly valued and collectible. This is accomplished through two contra-receivable accounts: returns and allowances and allowance for doubtful accounts. Returns and allowances are used to record estimates of returns or other allowances resulting from quality, delivery, discounts or other issues affecting the value of receivables. This account is estimated based on historical trends and current market conditions, with the offset to net sales.
The allowance for doubtful accounts is used to record the estimated risk of loss related to the customers’ abilityinability to pay. This allowance is maintained at a level that we consider appropriate based on factors that affect collectibility,collectability, such as the financial health of the customer, historical trends of charge-offs and recoveries and current and projected economic and market conditions. As we monitor our receivables, we identify customers that may have a problem paying,payment problems, and we adjust the allowance accordingly, with the offset to selling, general and administrative (“SG&A&A”) expense. Account balances are charged off against the allowance when recovery is considered remote.
We review our receivables on an ongoing basis to ensure that they are properly valued and collectible. Based on this review, we have increased our allowances by $7.6 million to $12.5 million since May 31, 2008. This increase is principally tied to customers in the automotive industry; and, based on our current information, we believe our allowances are sized appropriately. However, if the economic environment and market conditions do not improve, particularly in the automotive and construction markets where our exposure is greatest, additional reserves may be required.
While we believe theseour allowances are adequate, changes in economic conditions, the financial health of customers and bankruptcy settlements could impact our future earnings.
Inventory Valuation: Our inventory is valued at the lower of cost or market, with cost determined using a first-in, first-out method. To ensure that inventory is not stated above the current market value requires the significant use of estimates to determine the replacement cost, cost to complete, normal profit margin and ultimate selling price of the inventory. The rapid decline in steel prices during fiscal 2009 resulted in a situation where, based on our estimates, our inventories were recorded at values in excess of current market prices. As a result, we recorded charges of $105.0 million related to inventory write-downs during fiscal 2009.
Impairment of Long-Lived Assets: We review the carrying value of our long-lived assets, including intangible assets with finite useful lives, whenever events or changes in circumstances indicate that the carrying value of an asset or a group of assets may not be recoverable. AccountingWhen a potential impairment is indicated, accounting standards require an impairmenta charge to be recognized in the financial statements if the carrying amount of an asset or group of assets exceeds the undiscounted cash flows generated byfair value of that asset or group of assets. The loss recognized would be the difference between the fair value and the carrying amount of the asset or group of assets.
AnnuallyDue to continued deterioration in business and market conditions during fiscal 2009, we determined that certain indicators of impairment were present, as defined by SFAS No. 144,Accounting for the Impairment or Disposal of Long-Lived Assets.Therefore, long-lived assets, including intangible assets with finite useful lives, were subsequently tested for impairment during the fourth quarter of fiscal 2009. Recoverability of the identified asset groups was tested using future cash flow projections based on management’s long range estimates of market conditions. The sum of the undiscounted future cash flows related to each asset group was more than the net book value for each of the asset groups; therefore, no impairment loss was indicated at May 31, 2009.
We test our goodwill balances for impairment annually, during the fourth quarter, and more frequently if events or changes in circumstances indicate that goodwill may be impaired. We test goodwill at the endbusiness segment level as we have determined that the characteristics of our fiscal third quarter, we review goodwillthe reporting units within each business segment are similar and allow for impairmenttheir aggregation to the business segment level for testing purposes. The test consists of determining the fair value of the business segments, using discounted cash flows, and comparing the present value techniqueresult to determinethe carrying values of the business segments. If the estimated fair value of a business segment exceeds its carrying value, there is no impairment. If the carrying amount of the business segment exceeds its estimated fair value, an impairment of the goodwill associated with each reporting entity. There are three significant setsis indicated. The amount of values used to determinethe impairment is determined by establishing the fair value:value of all assets and liabilities of the business segment, excluding the goodwill, and comparing the total to the estimated future discountedfair value of the business segment. The difference represents the fair value of the goodwill and if it is lower than the book value of the goodwill, the difference is recorded as a loss in the consolidated statements of earnings.
Due to industry changes, weakness in the construction market and the depressed results in the Metal Framing business segment over the last year, we tested the value of goodwill related to this business segment for impairment on a quarterly basis. Given the significant decline in the economy during the second quarter of fiscal 2009 and its impact on the construction market, we revised the forecasted cash flows capitalizationand discount rate and tax rates.assumptions used in our previous valuations of this business segment. The estimated future discountedforecasted cash flows usedwere revised downward due to the significant decline in, and the model are based on planned growth with an assumed perpetual growth rate.future uncertainty of, the economy. The capitalizationdiscount rate, is based on our current cost of debt and equity capital. Tax rates are maintainedcapital, was changed due to the increased risk in our forecast. After reviewing the revised valuation and the fair value estimates of the remaining assets, it was determined that the value of the business no longer supported its $96.9 million goodwill balance. As a result, the full amount of goodwill was written-off in the second quarter ended November 30, 2008.
Subsequent to the second quarter write-off noted above, and as of February 28, 2009, the total goodwill balance was $98.3 million. Of this amount, $73.6 million related to the Pressure Cylinders business segment and $24.7 million related to the Construction Services business segment, $18.0 million of which resulted from the June 2008 acquisition of substantially all of the assets of The Sharon Companies Ltd. (See “Item 8 – Financial Statements and Supplementary Data – Notes to Consolidated Financial Statements – Note Q – Acquisitions”). During the quarter ended February 28, 2009, we tested the value of the goodwill balances in the Construction Services business segment as weakness in the construction market continued. For the test, we assumed the revenue trend rate would range from down 1.1% to up 7.5% as we expect a recovery in the latter years of the forecast due to pent-up demand and future growth in the market share of our Construction Services business segment. We set the discount rate at current levels.12%, up from the 10% used in the fiscal 2008 annual testing but lower than the 14% used for the Metal Framing business segment test in the second quarter of fiscal 2009. We believe this was appropriate due to increased uncertainty in the market place since the end of fiscal 2008, and the cash flows for the Construction Services business segment being more predictable than those of the Metal Framing business segment. Based on this test, there was no indication of impairment. We also performed the same test using a 14% discount rate, which also indicated no impairment.
During the fourth quarter of fiscal 2009, the Company completed its annual test of goodwill. No additional impairments were identified during the Company’s annual assessment of goodwill. Future declines in the market and deterioration in earnings could lead to additional impairment of goodwill and other long-lived assets.
Accounting for Derivatives and Other Contracts at Fair Value:We use derivatives in the normal course of business to manage our exposure to fluctuations in commodity prices, foreign currency and interest rates. These derivatives are based on quoted market values. These estimatesThe fair values are based upon valuation methodologies deemed appropriate in the circumstances; however, the use of different assumptions could affect the estimated fair values.
Stock-Based Compensation:We currently account forAll share-based awards to employees, including grants of employee and non-employee stock option plans underoptions, are recorded as expense in the recognition and measurement principlesconsolidated statements of APB Opinion No. 25,Accounting for Stock Issued to Employees, and the related interpretations.No stock-based employee compensation cost is reflected in net earnings as all options granted under our plans had an exercise price equal to thebased on their fair market value of the underlying common shares on the grant date. Beginning in fiscal 2007, we will be required to record an expense for our stock-based compensation plans using the fair value method prescribed in SFAS No. 123(R). Had we accounted for stock-based compensation plans using this fair value method, we estimate that diluted earnings per share would have been reduced by $0.03 per share in fiscal 2006, $0.03 in fiscal 2005 and $0.02 in fiscal 2004.values.
Income Taxes: In accordance with the provisions of SFASStatement of Financial Accounting Standards (“SFAS”) No. 109,Accounting for Income Taxes (“SFAS 109”), we account for income taxes using the asset and liability method. The asset and liability method requires the recognition of deferred tax assets and liabilities for expected future tax consequences of temporary differences that currently exist between the tax basis and financial reporting basis of our assets and liabilities. In assessing the
realizability of deferred tax assets, we consider whether it is more likely than not that some, or a portion, of the deferred tax assets will not be realized. We provide a valuation allowance for deferred income tax assets when in our judgment, based upon currently available information and other factors, it is more likely than not that a portion of such deferred income tax assets will not be realized. The determination
In accordance with FASB Interpretation No. 48,Accounting for Uncertainty in Income Taxes – an interpretation of FASB Statement No. 109, tax benefits from uncertain tax positions that are recognized in the need for a valuation allowance isfinancial statements are measured based on an on-going evaluationthe largest benefit that has a greater than fifty percent likelihood of current information including, among other things, estimates of future earnings in different tax jurisdictions and the expected timing of deferred income tax asset reversals. We believe that the determination to record a valuation allowance to reduce deferred income tax assets is a critical accounting estimate because it is based on an estimate of future taxable income in the various tax jurisdictions in which we do business, which is susceptible to change and may or may not occur, and because the impact of adjusting a valuation allowance may be material.being realized upon ultimate settlement.
We have a reservereserves for taxes and associated interest and penalties that are determined in accordance with FIN 48, that may become payable in future years as a result of audits by taxing authorities. It is our policy to record these in income tax expense. While we believe the positions taken on previously filed tax returns are appropriate, we have established the tax and interest reserves in recognition that various taxing authorities may challenge our positions. The tax reserves are analyzed periodically, and adjustments are made as events occur to warrant adjustment to the reserve,reserves, such as lapsing of applicable statutes of limitations, conclusion of tax audits, additional exposure based on current calculations, identification of new issues, release of administrative guidance or court decisions affecting a particular tax issue.
Self-Insurance Reserves:We are largely self-insured with respect to workers’ compensation, general and auto liability, property damage, employee medical claims and other potential losses. In order to reduce risk and better manage overall loss exposure, we purchase stop-loss insurance that covers individual claims in excess of the deductible amounts. We maintain reserves for the estimated cost to settle open claims as well as an estimate of the cost of claims that have been incurred but not reported. These estimates are based on third-party actuarial valuations that take into consideration the historical average claim volume, the average cost for settled claims, current trends in claim costs, changes in our business and workforce, general economic factors and other assumptions believed to be reasonable under the circumstances. The estimated reserves for these liabilities could be affected if future occurrences and claims differ from assumptions used and historical trends. Facility consolidations, a focus on and investment in safety initiatives and an emphasis on property loss prevention and product quality hashave resulted in an improvement in our loss history and the related assumptions used to analyze thesethe self-insurance reserves. This improvement resulted in areductions to these reserves of $1.2 million in fiscal 2009 and $5.3 million reduction to these insurance reserves that was recorded during the second quarter ofin fiscal 2006.2008. We will continue to review these reserves on a quarterly basis, or more frequently if factors dictate a more frequent review is warranted.
The critical accounting policies discussed herein are not intended to be a comprehensive list of all of our accounting policies. In many cases, the accounting treatment of a particular transaction is specifically dictated by accounting principles generally accepted in the United States, with no need for our judgment in their application. There are also areas in which our judgment in selecting an available alternative would not produce a materially different result.
Item 7A. –— Quantitative and Qualitative Disclosures About Market Risk
In the normal course of business, we are exposed to various market risks. We continually monitor these risks and regularly develop appropriate strategies to manage them. Accordingly, from time to time, we may enter into certain derivative financial and commodity instruments. These instruments are used solely to mitigate market exposure and are not used for trading or speculative purposes.
Interest Rate Risk
We entered into an interest rate swap in October 2004, which was amended December 17, 2004. The swap hadhas a notional amount of $100$100.0 million to hedge changes in cash flows attributable to changes in the LIBOR rate associated with the December 17, 2004, issuance of the unsecured Floating Rate Senior Notes due December 17, 2014. See “Item 8 – Financial Statements and Supplementary Data – Notes to Consolidated Financial Statements – Note C – Debt.”Debt” of this Annual Report on Form 10-K. The critical terms of the derivative correspond with the critical terms of the underlying exposure. The interest rate swap was executed with a highly rated financial institution. No credit loss is anticipated. We pay a fixed rate of 4.46% and receive a variable rate based on six-month LIBOR. A sensitivity analysis of changes in the interest rate yield curve associated
with our interest rate swap indicates that a 10% parallel decline in the yield curve would reducenot materially impact the fair value of our interest rate swap by $3.2 million.swap. A sensitivity analysis of changes in the interest rates on our variable rate debt indicates that a 10% increase in those rates would not have materially impacted our net results. Based on the terms of the noted derivative contract, such changes would also be expected to materially offset against each other.
Foreign Currency Risk
The translation of foreign currencies into U.S.United States dollars subjects the Companyus to exposure related to fluctuating exchange rates. Derivative instruments are not used to manage this risk. However, the Company doesrisk; however, we do make limited use of forward contracts to manage exposure to certain intercompanyinter-company loans with our foreign affiliates. Such contracts limit exposure to both favorable and unfavorable currency fluctuations. At May 31, 2006,2009, the difference between the contract and book value of these instruments was not material to the Company’sour consolidated financial position, results of operations or cash flows. A 10% change in the exchange rate to the U.S. dollar forward rate is not expected to materially impact theour consolidated financial position, results of operations, or cash flows. A sensitivity analysis of changes in the U.S. dollar on these foreign currency-denominated contracts indicates that if the U.S. dollar uniformly weakened by 10% against all of these currency exposures, the fair value of these instruments would decrease by $4.7 million.not be materially impacted. Any resulting changes in fair value would be offset by changes in the underlying hedged balance sheet position. A sensitivity analysis of changes in the currency exchange rates of our foreign locations indicates that a 10% increase in those rates would not have materially impacted our net results. The sensitivity analysis assumes a paralleluniform shift in all foreign currency exchange rates. The assumption that exchange rates change in paralleluniformity may overstate the impact of changing exchange rates on assets and liabilities denominated in a foreign currency.
Commodity Price Risk
We are exposed to market risk for price fluctuations on purchases of steel, natural gas, zinc (see additional information below regarding natural gas and zinc) and other raw materials and utility requirements. The Company attemptsWe attempt to negotiate the best prices for commodities and to competitively price products and services to reflect the fluctuations in market prices.
Derivative financial instruments are selectivelyhave been used to manage a portion of our exposure to fluctuations in the cost of zinc and natural gas and zinc.gas. These contracts covercovered periods commensurate with known or expected exposures through calendar 2008. No derivatives are held for trading purposes. No credit loss is anticipated, as the counterparties to these agreements are major financial institutions that are highly rated. Thepurposes, and no active commodity derivatives are classified as cash flow hedges. The effective portions of the changeswere in the fair values of these derivatives are recorded in other comprehensive income and are reclassified to cost of goods sold in the period in which earnings are impacted by the hedged items or in the period that the transaction no longer qualifies as a cash flow hedge. There were no transactions that ceased to qualify as a cash flow hedge in fiscal 2006.
A sensitivity analysis of changes in the price of hedged commodities indicates that a 10% decline in zinc prices would reduce the fair value of our hedge position by $4.0 million. A similar 10% decline in natural gas prices would reduce the fair value of the natural gas hedge position by $1.0 million. Any resulting changes in fair value would be recorded as adjustments to other comprehensive income.place at May 31, 2009.
Notional transaction amounts and fairFair values for the outstanding derivative positions as of May 31, 20062009 and 20052008 are summarized below. Fair values of the derivatives do not consider the offsetting underlying hedged item.
May 31, 2006 | May 31, 2005 | Change In Fair Value | Fair Value At May 31, | Change In Fair Value | ||||||||||||||||||||||||
| In millions | Notional Amount | Fair Value | Notional Amount | Fair Value | 2009 | 2008 | ||||||||||||||||||||||
Zinc | $ | 11.2 | $ | 28.3 | $ | 15.5 | $ | 5.7 | $ | 22.6 | $ | - | $ | 3.1 | $ | (3.1 | ) | |||||||||||
Natural gas | 6.6 | 3.3 | 10.1 | 2.5 | 0.8 | - | 1.5 | (1.5 | ) | |||||||||||||||||||
Foreign currency | 0.4 | (0.1 | ) | 0.5 | ||||||||||||||||||||||||
Interest rate | 100.0 | 7.6 | 100.0 | (1.0 | ) | 8.6 | (7.9 | ) | (0.3 | ) | (7.6 | ) | ||||||||||||||||
| $ | (7.5 | ) | $ | 4.2 | $ | (11.7 | ) | |||||||||||||||||||||
Safe Harbor
Quantitative and qualitative disclosures about market risk include forward-looking statements with respect to management’s opinion about risks associated with ourthe use of derivative instruments. These statements are based on certain assumptions with respect to market prices and industry supply of, and demand for, steel products and certain raw materials. To the extent these assumptions prove to be inaccurate, future outcomes with respect to hedging programs may differ materially from those discussed in the forward-looking statements.
Item 8. –— Financial Statements and Supplementary Data
Report of Independent Registered Public Accounting Firm
The Board of Directors and Shareholders
Worthington Industries, Inc.:
We have audited the accompanying consolidated balance sheets of Worthington Industries, Inc. and subsidiaries as of May 31, 20062009 and 2005,2008, and the related consolidated statements of earnings, shareholders’ equity, and cash flows for each of the years in the three-year period ended May 31, 2006.2009. In connection with our audits of the consolidated financial statements, we also have audited the financial statement schedule of valuation and qualifying accounts. These consolidated financial statements and financial statement schedule are the responsibility of the Company’s management. Our responsibility is to express an opinion on these consolidated financial statements and financial statement schedule based on our audits.
We conducted our audits in accordance with the standards of the Public Company Accounting Oversight Board (United States). Those standards require that we plan and perform the audit to obtain reasonable assurance about whether the financial statements are free of material misstatement. An audit includes examining, on a test basis, evidence supporting the amounts and disclosures in the financial statements. An audit also includes assessing the accounting principles used and significant estimates made by management, as well as evaluating the overall financial statement presentation. We believe that our audits provide a reasonable basis for our opinion.
In our opinion, the consolidated financial statements referred to above present fairly, in all material respects, the financial position of Worthington Industries, Inc. and subsidiaries as of May 31, 20062009 and 2005,2008, and the results of their operations and their cash flows for each of the years in the three-year period ended May 31, 2006,2009, in conformity with U.S. generally accepted accounting principles. Also in our opinion, the related financial statement schedule, when considered in relation to the basic consolidated financial statements taken as a whole, presents fairly, in all material respects, the information set forth therein.
We also have audited, in accordance with the standards of the Public Company Accounting Oversight Board (United States), the effectiveness of Worthington Industries, Inc. and subsidiaries’’s internal control over financial reporting as of May 31, 2006,2009, based on criteria established inInternal Control—Control – Integrated Framework issued by the Committee of Sponsoring Organizations of the Treadway Commission (COSO), and our report dated August 11, 2006, July 30, 2009,expressed an unqualified opinion on management’s assessmentthe effectiveness of and the effective operation of,Company’s internal control over financial reporting.
/s/KPMG LLP |
Columbus, Ohio
|
|
August 11, 2006July 30, 2009
WORTHINGTON INDUSTRIES, INC.
CONSOLIDATED BALANCE SHEETS
(Dollars in thousands)
| May 31, | May 31, | ||||||||||||
| 2006 | 2005 | 2009 | 2008 | ||||||||||
| ASSETS | |||||||||||||
Current assets: | |||||||||||||
Cash and cash equivalents | $ | 56,216 | $ | 57,249 | $ | 56,319 | $ | 73,772 | |||||
Short-term investments | 2,173 | - | |||||||||||
Receivables, less allowances of $4,964 and $11,225 at May 31, 2006 and 2005 | 404,553 | 404,506 | |||||||||||
Receivables, less allowances of $12,470 and $4,849 at May 31, 2009 and 2008 | 182,881 | 384,354 | |||||||||||
Inventories: | |||||||||||||
Raw materials | 266,818 | 227,718 | 141,082 | 350,256 | |||||||||
Work in process | 104,244 | 97,168 | 57,612 | 123,106 | |||||||||
Finished products | 88,295 | 100,837 | 71,878 | 119,599 | |||||||||
Total inventories | 270,572 | 592,961 | |||||||||||
| 459,357 | 425,723 | ||||||||||||
Income taxes receivable | 29,749 | - | |||||||||||
Assets held for sale | 23,535 | 4,644 | 707 | 1,132 | |||||||||
Deferred income taxes | 15,854 | 19,490 | 24,868 | 17,966 | |||||||||
Prepaid expenses and other current assets | 34,553 | 26,721 | 33,839 | 34,785 | |||||||||
Total current assets | 996,241 | 938,333 | 598,935 | 1,104,970 | |||||||||
Investments in unconsolidated affiliates | 123,748 | 136,856 | 100,395 | 119,808 | |||||||||
Goodwill | 177,771 | 168,267 | 101,343 | 183,523 | |||||||||
Other intangible assets, net of accumulated amortization of $15,328 and $11,432 at May 31, 2009 and 2008 | 23,642 | 13,709 | |||||||||||
Other assets | 55,733 | 33,593 | 18,009 | 16,077 | |||||||||
Property, plant and equipment: | |||||||||||||
Land | 19,595 | 20,632 | 30,960 | 34,241 | |||||||||
Buildings and improvements | 234,091 | 231,651 | 242,558 | 249,624 | |||||||||
Machinery and equipment | 815,638 | 801,289 | 879,871 | 901,067 | |||||||||
Construction in progress | 27,904 | 18,124 | 22,783 | 11,758 | |||||||||
| 1,097,228 | 1,071,696 | ||||||||||||
Total property, plant and equipment | 1,176,172 | 1,196,690 | |||||||||||
Less accumulated depreciation | 550,324 | 518,740 | 654,667 | 646,746 | |||||||||
| 546,904 | 552,956 | ||||||||||||
Total property, plant and equipment, net | 521,505 | 549,944 | |||||||||||
Total assets | $ | 1,900,397 | $ | 1,830,005 | $ | 1,363,829 | $ | 1,988,031 | |||||
| LIABILITIES AND SHAREHOLDERS’ EQUITY | |||||||||||||
LIABILITIES AND SHAREHOLDERS' EQUITY | |||||||||||||
Current liabilities: | |||||||||||||
Accounts payable | $ | 362,883 | $ | 280,181 | $ | 136,215 | $ | 356,129 | |||||
Notes payable | 7,684 | - | 980 | 135,450 | |||||||||
Accrued compensation, contributions to employee benefit plans and related taxes | 49,784 | 56,773 | 34,503 | 59,619 | |||||||||
Dividends payable | 15,078 | 14,950 | 7,916 | 13,487 | |||||||||
Other accrued items | 36,483 | 45,867 | 49,488 | 68,545 | |||||||||
Income taxes payable | 18,874 | 4,240 | 4,965 | 31,665 | |||||||||
Current maturities of long-term debt | - | 143,432 | 138,013 | - | |||||||||
Total current liabilities | 490,786 | 545,443 | 372,080 | 664,895 | |||||||||
Other liabilities | 55,249 | 56,262 | 65,400 | 49,785 | |||||||||
Long-term debt | 245,000 | 245,000 | 100,400 | 245,000 | |||||||||
Deferred income taxes | 114,610 | 119,462 | 82,986 | 100,811 | |||||||||
Contingent liabilities and commitments - Note G | - | - | |||||||||||
Total liabilities | 620,866 | 1,060,491 | |||||||||||
Contingent liabilities and commitments – Note G | |||||||||||||
Minority interest | 49,446 | 43,002 | 36,894 | 42,163 | |||||||||
Shareholders’ equity: | |||||||||||||
Preferred shares, without par value; authorized - 1,000,000 shares; issued and outstanding - none | - | - | |||||||||||
Common shares, without par value; authorized - 150,000,000 shares; issued and outstanding, 2006 - 88,691,204 shares, 2005 - 87,933,202 shares | - | - | |||||||||||
Shareholders' equity: | |||||||||||||
Preferred shares, without par value; authorized – 1,000,000 shares; issued and outstanding – none | - | - | |||||||||||
Common shares, without par value; authorized – 150,000,000 shares; issued and outstanding, | - | - | |||||||||||
Additional paid-in capital | 159,328 | 149,167 | 183,051 | 174,900 | |||||||||
Cumulative other comprehensive income (loss), net of taxes of $ (10,287) and $(2,628) at May 31, 2006 and 2005 | 27,116 | (1,313 | ) | ||||||||||
Cumulative other comprehensive income, net of taxes of $3,251 and $78 at May 31, 2009 and 2008 | 4,457 | 24,633 | |||||||||||
Retained earnings | 758,862 | 672,982 | 518,561 | 685,844 | |||||||||
Total shareholders' equity | 706,069 | 885,377 | |||||||||||
| 945,306 | 820,836 | ||||||||||||
Total liabilities and shareholders' equity | $ | 1,363,829 | $ | 1,988,031 | |||||||||
Total liabilities and shareholders’ equity | $ | 1,900,397 | $ | 1,830,005 | |||||||||
See notes to consolidated financial statementsstatements.
WORTHINGTON INDUSTRIES, INC.
CONSOLIDATED STATEMENTS OF EARNINGS
(In thousands, except per share)
| Fiscal Years Ended May 31, | ||||||||||||
| 2006 | 2005 | 2004 | ||||||||||
Net sales | $ | 2,897,179 | $ | 3,078,884 | $ | 2,379,104 | ||||||
Cost of goods sold | 2,525,545 | 2,580,011 | 2,003,734 | |||||||||
Gross margin | 371,634 | 498,873 | 375,370 | |||||||||
Selling, general and administrative expense | 214,030 | 225,915 | 195,785 | |||||||||
Impairment charges and other | - | 5,608 | 69,398 | |||||||||
Operating income | 157,604 | 267,350 | 110,187 | |||||||||
Other income (expense): | ||||||||||||
Miscellaneous expense | (1,524 | ) | (7,991 | ) | (1,589 | ) | ||||||
Gain on sale of Acerex | 26,609 | - | - | |||||||||
Interest expense | (26,279 | ) | (24,761 | ) | (22,198 | ) | ||||||
Equity in net income of unconsolidated affiliates | 56,339 | 53,871 | 41,064 | |||||||||
Earnings before income taxes | 212,749 | 288,469 | 127,464 | |||||||||
Income tax expense | 66,759 | 109,057 | 40,712 | |||||||||
Net earnings | $ | 145,990 | $ | 179,412 | $ | 86,752 | ||||||
Average common shares outstanding - basic | 88,288 | 87,646 | 86,312 | |||||||||
Earnings per share - basic | $ | 1.65 | $ | 2.05 | $ | 1.01 | ||||||
Average common shares outstanding - diluted | 88,976 | 88,503 | 86,950 | |||||||||
Earnings per share - diluted | $ | 1.64 | $ | 2.03 | $ | 1.00 | ||||||
| Fiscal Years Ended May 31, | ||||||||||||
| 2009 | 2008 | 2007 | ||||||||||
Net sales | $ | 2,631,267 | $ | 3,067,161 | $ | 2,971,808 | ||||||
Cost of goods sold | 2,456,533 | 2,711,414 | 2,610,176 | |||||||||
Gross margin | 174,734 | 355,747 | 361,632 | |||||||||
Selling, general and administrative expense | 210,046 | 231,602 | 232,487 | |||||||||
Goodwill impairment | 96,943 | - | - | |||||||||
Restructuring charges | 43,041 | 18,111 | - | |||||||||
Operating income (loss) | (175,296 | ) | 106,034 | 129,145 | ||||||||
Other income (expense): | ||||||||||||
Miscellaneous expense | (6,858 | ) | (6,348 | ) | (4,446 | ) | ||||||
Gain on sale of Aegis | 8,331 | - | - | |||||||||
Interest expense | (20,734 | ) | (21,452 | ) | (21,895 | ) | ||||||
Equity in net income of unconsolidated affiliates | 48,589 | 67,459 | 63,213 | |||||||||
Earnings (loss) before income taxes | (145,968 | ) | 145,693 | 166,017 | ||||||||
Income tax expense (benefit) | (37,754 | ) | 38,616 | 52,112 | ||||||||
Net earnings (loss) | $ | (108,214 | ) | $ | 107,077 | $ | 113,905 | |||||
Average common shares outstanding – basic | 78,903 | 81,232 | 86,351 | |||||||||
Earnings (loss) per share – basic | $ | (1.37 | ) | $ | 1.32 | $ | 1.32 | |||||
Average common shares outstanding – diluted | 78,903 | 81,898 | 87,002 | |||||||||
Earnings (loss) per share – diluted | $ | (1.37 | ) | $ | 1.31 | $ | 1.31 | |||||
See notes to consolidated financial statements.
WORTHINGTON INDUSTRIES, INC.
CONSOLIDATED STATEMENTS OF SHAREHOLDERS’SHAREHOLDERS' EQUITY
(Dollars in thousands, except per share)
| Additional Paid- in Capital | Cumulative Other Comprehensive Income (Loss), Net of Tax | Retained Earnings | Total | Additional Paid-in Capital | Cumulative Other Comprehensive Income (Loss), Net of Tax | Retained Earnings | Total | ||||||||||||||||||||||||||||||||||||
| Common Shares | Common Shares | ||||||||||||||||||||||||||||||||||||||||||
| Shares | Amount | Shares | Amount | ||||||||||||||||||||||||||||||||||||||||
Balance at June 1, 2003 | 85,948,636 | $ | - | $ | 121,390 | $ | (5,168 | ) | $ | 520,072 | $ | 636,294 | |||||||||||||||||||||||||||||||
Balance at June 1, 2006 | 88,691,204 | $ | - | $ | 159,328 | $ | 27,116 | $ | 758,862 | $ | 945,306 | ||||||||||||||||||||||||||||||||
Comprehensive income: | |||||||||||||||||||||||||||||||||||||||||||
Net earnings | - | - | - | - | 86,752 | 86,752 | - | - | - | - | 113,905 | 113,905 | |||||||||||||||||||||||||||||||
Unrealized gain on investment | - | - | - | 94 | - | 94 | - | - | - | (296 | ) | - | (296 | ) | |||||||||||||||||||||||||||||
Foreign currency translation | - | - | - | (1,747 | ) | - | (1,747 | ) | - | - | - | 4,507 | - | 4,507 | |||||||||||||||||||||||||||||
Minimum pension liability | - | - | - | 1,015 | - | 1,015 | - | - | - | 34 | - | 34 | |||||||||||||||||||||||||||||||
Cash flow hedges | - | - | - | 3,413 | - | 3,413 | - | - | - | (7,586 | ) | - | (7,586 | ) | |||||||||||||||||||||||||||||
Total comprehensive income | 89,527 | 110,564 | |||||||||||||||||||||||||||||||||||||||||
Adjustment to initially apply SFAS 158 | - | - | - | (594 | ) | - | (594 | ) | |||||||||||||||||||||||||||||||||||
Common shares issued | 907,006 | - | 11,357 | - | - | 11,357 | 666,272 | - | 12,242 | - | - | 12,242 | |||||||||||||||||||||||||||||||
Cash dividends declared ($0.64 per share) | - | - | - | - | (55,312 | ) | (55,312 | ) | |||||||||||||||||||||||||||||||||||
Other | - | - | (1,492 | ) | - | - | (1,492 | ) | |||||||||||||||||||||||||||||||||||
Stock-based compensation | - | - | 3,480 | - | - | 3,480 | |||||||||||||||||||||||||||||||||||||
Purchases and retirement of common shares | (4,449,000 | ) | - | (8,142 | ) | - | (68,475 | ) | (76,617 | ) | |||||||||||||||||||||||||||||||||
Cash dividends declared ($0.68 per share) | - | - | - | - | (58,380 | ) | (58,380 | ) | |||||||||||||||||||||||||||||||||||
Balance at May 31, 2004 | 86,855,642 | - | 131,255 | (2,393 | ) | 551,512 | 680,374 | ||||||||||||||||||||||||||||||||||||
Balance at May 31, 2007 | 84,908,476 | - | 166,908 | 23,181 | 745,912 | 936,001 | |||||||||||||||||||||||||||||||||||||
Comprehensive income: | |||||||||||||||||||||||||||||||||||||||||||
Net earnings | - | - | - | - | 179,412 | 179,412 | - | - | - | - | 107,077 | 107,077 | |||||||||||||||||||||||||||||||
Unrealized gain on investment | - | - | - | 164 | - | 164 | |||||||||||||||||||||||||||||||||||||
Foreign currency translation | - | - | - | 698 | - | 698 | - | - | - | 13,080 | - | 13,080 | |||||||||||||||||||||||||||||||
Minimum pension liability | - | - | - | (332 | ) | - | (332 | ) | |||||||||||||||||||||||||||||||||||
Pension liability adjustment | - | - | - | 590 | - | 590 | |||||||||||||||||||||||||||||||||||||
Cash flow hedges | - | - | - | 550 | - | 550 | - | - | - | (12,218 | ) | - | (12,218 | ) | |||||||||||||||||||||||||||||
Total comprehensive income | 180,492 | 108,529 | |||||||||||||||||||||||||||||||||||||||||
Common shares issued | 1,077,560 | - | 17,917 | - | - | 17,917 | 851,080 | - | 15,318 | - | - | 15,318 | |||||||||||||||||||||||||||||||
Cash dividends declared ($0.66 per share) | - | - | - | (57,942 | ) | (57,942 | ) | ||||||||||||||||||||||||||||||||||||
Stock-based compensation | - | - | 4,010 | - | - | 4,010 | |||||||||||||||||||||||||||||||||||||
Gain from TWB Company, L.L.C. dilution | - | - | 1,944 | - | - | 1,944 | |||||||||||||||||||||||||||||||||||||
Purchases and retirement of common shares | (6,451,500 | ) | - | (13,280 | ) | - | (112,505 | ) | (125,785 | ) | |||||||||||||||||||||||||||||||||
Cash dividends declared ($0.68 per share) | - | - | - | - | (54,640 | ) | (54,640 | ) | |||||||||||||||||||||||||||||||||||
Balance at May 31, 2008 | 79,308,056 | - | 174,900 | 24,633 | 685,844 | 885,377 | |||||||||||||||||||||||||||||||||||||
Comprehensive loss: | |||||||||||||||||||||||||||||||||||||||||||
Net loss | - | - | - | - | (108,214 | ) | (108,214 | ) | |||||||||||||||||||||||||||||||||||
Foreign currency translation | - | - | - | (9,866 | ) | - | (9,866 | ) | |||||||||||||||||||||||||||||||||||
Pension liability adjustment | - | - | - | (4,766 | ) | - | (4,766 | ) | |||||||||||||||||||||||||||||||||||
Cash flow hedges | - | - | - | (5,544 | ) | - | (5,544 | ) | |||||||||||||||||||||||||||||||||||
Total comprehensive loss | (128,390 | ) | |||||||||||||||||||||||||||||||||||||||||
Common shares issued | 339,561 | - | 3,875 | - | - | 3,875 | |||||||||||||||||||||||||||||||||||||
Stock-based compensation | 5,767 | 5,767 | |||||||||||||||||||||||||||||||||||||||||
Purchases and retirement of common shares | (650,000 | ) | - | (1,448 | ) | - | (10,954 | ) | (12,402 | ) | |||||||||||||||||||||||||||||||||
Cash dividends declared ($0.61 per share) | - | - | - | - | (48,115 | ) | (48,115 | ) | |||||||||||||||||||||||||||||||||||
Other | - | - | (5 | ) | - | - | (5 | ) | - | - | (43 | ) | - | - | (43 | ) | |||||||||||||||||||||||||||
Balance at May 31, 2005 | 87,933,202 | - | 149,167 | (1,313 | ) | 672,982 | 820,836 | ||||||||||||||||||||||||||||||||||||
Comprehensive income: | |||||||||||||||||||||||||||||||||||||||||||
Net earnings | - | - | - | - | 145,990 | 145,990 | |||||||||||||||||||||||||||||||||||||
Unrealized gain on investment | - | - | - | 139 | - | 139 | |||||||||||||||||||||||||||||||||||||
Foreign currency translation | - | - | - | 8,711 | - | 8,711 | |||||||||||||||||||||||||||||||||||||
Minimum pension liability | - | - | - | 2,473 | - | 2,473 | |||||||||||||||||||||||||||||||||||||
Cash flow hedges | - | - | - | 17,106 | - | 17,106 | |||||||||||||||||||||||||||||||||||||
Balance at May 31, 2009 | 78,997,617 | $ | - | $ | 183,051 | $ | 4,457 | $ | 518,561 | $ | 706,069 | ||||||||||||||||||||||||||||||||
Total comprehensive income | 174,419 | ||||||||||||||||||||||||||||||||||||||||||
Common shares issued | 758,002 | - | 10,161 | - | - | 10,161 | |||||||||||||||||||||||||||||||||||||
Cash dividends declared ($0.68 per share) | - | - | - | - | (60,110 | ) | (60,110 | ) | |||||||||||||||||||||||||||||||||||
Balance at May 31, 2006 | 88,691,204 | $ | - | $ | 159,328 | $ | 27,116 | $ | 758,862 | $ | 945,306 | ||||||||||||||||||||||||||||||||
See notes to consolidated financial statementsstatements.
WORTHINGTON INDUSTRIES, INC.
CONSOLIDATED STATEMENTS OF CASH FLOWS
(Dollars in thousands)
| Fiscal Years Ended May 31, | Fiscal Years Ended May 31, | |||||||||||||||||||||||
| 2006 | 2005 | 2004 | 2009 | 2008 | 2007 | |||||||||||||||||||
Operating activities: | ||||||||||||||||||||||||
Net earnings | $ | 145,990 | $ | 179,412 | $ | 86,752 | ||||||||||||||||||
Adjustments to reconcile net earnings to net cash provided by operating activities: | ||||||||||||||||||||||||
Net earnings (loss) | $ | (108,214 | ) | $ | 107,077 | $ | 113,905 | |||||||||||||||||
Adjustments to reconcile net earnings (loss) to net cash provided by operating activities: | ||||||||||||||||||||||||
Bad debt expense | 8,307 | 1,398 | (903 | ) | ||||||||||||||||||||
Depreciation and amortization | 59,116 | 57,874 | 67,302 | 64,073 | 63,413 | 61,469 | ||||||||||||||||||
Impairment charges and other | - | 5,608 | 69,398 | |||||||||||||||||||||
Goodwill impairment | 96,943 | - | - | |||||||||||||||||||||
Restructuring charges, non-cash | 8,925 | 5,169 | - | |||||||||||||||||||||
Provision for deferred income taxes | (12,645 | ) | (1,496 | ) | (22,508 | ) | (25,479 | ) | (3,228 | ) | (3,068 | ) | ||||||||||||
Equity in net income of unconsolidated affiliates, net of distributions received | 702 | (25,351 | ) | (28,912 | ) | |||||||||||||||||||
Equity in net income of unconsolidated affiliates, net of distributions | 8,491 | (8,539 | ) | 68,510 | ||||||||||||||||||||
Minority interest in net income of consolidated subsidiaries | 6,088 | 8,963 | 4,733 | 4,529 | 6,969 | 5,409 | ||||||||||||||||||
Net loss (gain) on sale of assets | 6,079 | 2,641 | (3,127 | ) | ||||||||||||||||||||
Gain on sale of Acerex | (26,609 | ) | - | - | ||||||||||||||||||||
Net loss on sale of assets | 1,317 | 3,756 | 826 | |||||||||||||||||||||
Stock-based compensation | 5,767 | 4,173 | 3,480 | |||||||||||||||||||||
Excess tax benefits – stock-based compensation | (433 | ) | (2,035 | ) | (2,370 | ) | ||||||||||||||||||
Gain on sale of Aegis | (8,331 | ) | - | - | ||||||||||||||||||||
Changes in assets and liabilities: | ||||||||||||||||||||||||
Accounts receivable | 11,616 | (50,661 | ) | (175,290 | ) | |||||||||||||||||||
Receivables | 226,690 | 5,569 | 8,312 | |||||||||||||||||||||
Inventories | (33,788 | ) | (59,236 | ) | (94,073 | ) | 329,892 | (144,474 | ) | 20,491 | ||||||||||||||
Prepaid expenses and other current assets | (9,186 | ) | (10,195 | ) | 12,841 | (20,805 | ) | 8,252 | (2,078 | ) | ||||||||||||||
Other assets | (563 | ) | (831 | ) | 90 | (643 | ) | (1,546 | ) | 4,898 | ||||||||||||||
Accounts payable and accrued expenses | 79,114 | (72,933 | ) | 162,383 | (321,798 | ) | 138,822 | (99,283 | ) | |||||||||||||||
Other liabilities | 1,152 | (1,524 | ) | (222 | ) | (14,905 | ) | (4,255 | ) | 833 | ||||||||||||||
Net cash provided by operating activities | 227,066 | 32,271 | 79,367 | 254,326 | 180,521 | 180,431 | ||||||||||||||||||
Investing activities: | ||||||||||||||||||||||||
Investment in property, plant and equipment, net | (60,128 | ) | (46,318 | ) | (29,599 | ) | (64,154 | ) | (47,520 | ) | (57,691 | ) | ||||||||||||
Investment in aircraft | (16,435 | ) | - | - | ||||||||||||||||||||
Acquisitions, net of cash acquired | (6,776 | ) | (65,119 | ) | - | (42,199 | ) | (2,225 | ) | (31,727 | ) | |||||||||||||
Investment in unconsolidated affiliate | - | (1,500 | ) | (490 | ) | |||||||||||||||||||
Distributions from (investments in) unconsolidated affiliates, net | 20,362 | (47,598 | ) | (1,000 | ) | |||||||||||||||||||
Proceeds from sale of assets | 3,225 | 89,488 | 5,662 | 6,883 | 1,025 | 18,237 | ||||||||||||||||||
Proceeds from sale of Acerex | 44,604 | - | - | |||||||||||||||||||||
Proceeds from sale of unconsolidated affiliates | 25,863 | - | - | |||||||||||||||||||||
Purchases of short-term investments | (493,860 | ) | (72,875 | ) | - | - | - | (25,562 | ) | |||||||||||||||
Sales of short-term investments | 491,687 | 72,875 | - | - | 25,562 | 2,173 | ||||||||||||||||||
Net cash used by investing activities | (37,683 | ) | (23,449 | ) | (24,427 | ) | (53,245 | ) | (70,756 | ) | (95,570 | ) | ||||||||||||
Financing activities: | ||||||||||||||||||||||||
Proceeds from short-term borrowings | 7,684 | - | (1,145 | ) | ||||||||||||||||||||
Proceeds from long-term debt, net | - | 99,409 | - | |||||||||||||||||||||
Net proceeds from (payments on) short-term borrowings | (142,385 | ) | 103,800 | 31,650 | ||||||||||||||||||||
Principal payments on long-term debt | (143,416 | ) | (2,381 | ) | (1,234 | ) | (7,241 | ) | - | (7,691 | ) | |||||||||||||
Proceeds from issuance of common shares | 9,138 | 14,673 | 10,644 | 3,899 | 13,171 | 9,866 | ||||||||||||||||||
Excess tax benefits – stock-based compensation | 433 | 2,035 | 2,370 | |||||||||||||||||||||
Payments to minority interest | (3,840 | ) | (8,360 | ) | (7,200 | ) | (7,152 | ) | (11,904 | ) | (3,360 | ) | ||||||||||||
Repurchase of common shares | (12,402 | ) | (125,785 | ) | (76,617 | ) | ||||||||||||||||||
Dividends paid | (59,982 | ) | (56,891 | ) | (55,167 | ) | (53,686 | ) | (55,587 | ) | (59,018 | ) | ||||||||||||
Net cash provided (used) by financing activities | (190,416 | ) | 46,450 | (54,102 | ) | |||||||||||||||||||
Net cash used by financing activities | (218,534 | ) | (74,270 | ) | (102,800 | ) | ||||||||||||||||||
Increase (decrease) in cash and cash equivalents | (1,033 | ) | 55,272 | 838 | (17,453 | ) | 35,495 | (17,939 | ) | |||||||||||||||
Cash and cash equivalents at beginning of year | 57,249 | 1,977 | 1,139 | 73,772 | 38,277 | 56,216 | ||||||||||||||||||
Cash and cash equivalents at end of year | $ | 56,216 | $ | 57,249 | $ | 1,977 | $ | 56,319 | $ | 73,772 | $ | 38,277 | ||||||||||||
See notes to consolidated financial statements.
WORTHINGTON INDUSTRIES, INC.
NOTES TO CONSOLIDATED FINANCIAL STATEMENTS
Fiscal Years Ended May 31, 2006, 20052009, 2008 and 20042007
Note A – Summary of Significant Accounting Policies
Consolidation: The consolidated financial statements include the accounts of Worthington Industries, Inc. and consolidated subsidiaries (the(collectively, “we,” “our,” “Worthington,” or the “Company”). Spartan Steel Coating, LLC (owned 52%) is fully consolidated with the equity owned by the partnerother joint venture member shown as minority interest on the consolidated balance sheet,sheets, and its portion of net income or loss is includedearnings (loss) eliminated in miscellaneous income or expense. Investments in unconsolidated affiliates are accounted for using the equity method. Significant intercompany accounts and transactions are eliminated.
Use of Estimates: The preparation of financial statements in conformity with accounting principles generally accepted in the United States requires management to make estimates and assumptions that affect the amounts reported in the financial statements and accompanying notes. Actual results could differ from those estimates.
Cash and Cash Equivalents: The Company considersWe consider all highly liquid investments purchased with aan original maturity of three months or less to be cash equivalents.
Inventories: Inventories are valued at the lower of cost or market. Cost is determined using the first-in, first-out method for all inventories. The rapid decline in steel prices during fiscal 2009 resulted in a situation where, based on our estimates, our inventories were recorded at values in excess of current market prices. As a result, we recorded $105,015,000 of write-downs in the value of our inventories during fiscal 2009. Of this amount, $100,604,000 related to the consolidated operations of the Steel Processing and Metal Framing business segments and is recorded within the consolidated statement of earnings in cost of goods sold, while $4,411,000 related to our portion of the loss recorded by our Mexican steel processing joint venture, and is recorded in equity in net income of unconsolidated affiliates.
Derivative Financial Instruments: The Company doesWe do not engage in currency or commodity speculation and generally entersenter into derivativesderivative instruments only to hedge specific interest, foreign currency or commodity transactions. All derivativesderivative instruments are accounted for using mark-to-market accounting. The accounting for changes in the fair value of a derivative instrument depends on whether it has been designated and qualifies as part of a hedging relationship and, if so, the reason for holding it. Gains orand losses from these transactions offseton fair value hedges are recognized in current period earnings in the same line item as the underlying hedged item. The effective portion of gains orand losses of the assets, liabilities or transactions being hedged. Current assets and other assets include derivative fair values at May 31, 2006 of $13,868,000 and $25,307,000, respectively. If aon cash flow derivative is terminated and the cash flows remain probable, the amount inhedges are deferred as a component of cumulative other comprehensive income remains and will be reclassified to netare recognized in earnings whenat the time the hedged cash flow occurs.item affects earnings, in the same line item as the underlying hedged item. Ineffectiveness of the hedges during the fiscal year ended May 31, 20062009 (“fiscal 2006”2009”), the fiscal year ended May 31, 20052008 (“fiscal 2005”2008”) and the fiscal year ended May 31, 20042007 (“fiscal 2004”2007”) was immaterialimmaterial. The consolidated statements of earnings classification of gains and was reportedlosses related to derivative instruments that do not qualify for hedge accounting is determined based on the underlying intent of the instruments. Cash flows related to derivative instruments are generally classified in the consolidated statements of cash flows within operating activities.
For hedging relationships to qualify under Statement of Financial Accounting Standards (“SFAS”) No. 133,Accounting for Derivative Instruments and Hedging Activities (“SFAS 133”), we formally document the hedging relationship and its risk management objective and the hedge strategy, the hedging instrument, the hedge item, the nature of the risk being hedged, how the hedge instrument effectiveness against offsetting the hedged risk will be assessed prospectively and retrospectively, and a description of the method of measuring ineffectiveness.
Derivative instruments are executed only with highly rated financial institutions. No credit loss is anticipated on existing instruments, and no such material losses have been experienced to date. The Company continues to monitor its positions, as well as the credit ratings of counterparties to those positions.
We discontinue hedge accounting when it is determined that the derivative instrument is no longer effective in offsetting cash flows of the hedged item, the derivative instrument expires or is sold, is terminated or is no longer designated as a hedging instrument because it is unlikely that a forecasted transaction will occur or we determine that designation of the hedging instrument is no longer appropriate. In all situations in which hedge accounting is discontinued and the derivative instrument is retained, we continue to carry the derivative instrument at its fair value on the consolidated balance sheets and recognize any subsequent changes in its fair value in net earnings. When it is probable that a forecasted transaction will not occur, we discontinue hedge accounting and recognize immediately in net earnings gains and losses that were accumulated in other income (expense). The commodity derivatives hedge exposure through 2008.comprehensive income.
Refer to “Note T – Derivative Instruments and Hedging Activities” for additional information regarding the consolidated balance sheets location and the risk classification of the Company’s derivative instruments.
Investments in Unconsolidated Affiliates: Securities and Exchange Commission (“SEC”) Staff Accounting Bulletin No. 51,Accounting for Sales of Stock by a Subsidiary (“SAB 51”), provides guidance on accounting for the effect of changes in an unconsolidated affiliate's stock or equity on the parent's investment in that unconsolidated affiliate. SAB 51 allows election of an accounting policy of recording such increases or decreases in a parent's investment either in net earnings or in equity. We record such increases or decreases to our equity as additional paid-in capital.
Fair Value of Financial Instruments:Instruments: The non-derivative financial instruments included in the carrying amounts of cash and cash equivalents, short-term investments, account and notereceivables, income tax receivables, other assets, accounts and accountnotes payable, accrued expenses and note payables,income taxes payable, approximate fair values. The fair value of long-term debt, including current maturities, based upon quoted market prices, was $250,206,000$242,136,000 and $408,101,000$252,073,000 at May 31, 20062009 and 2005,2008, respectively.
Risks and Uncertainties: As of May 31, 2006,2009, the Company, includingtogether with our unconsolidated affiliates, operated 6260 production facilities in 2322 states and 10 countries. The Company’sOur largest markets are the construction and the automotive and automotive supply markets, which comprise approximately 41%comprised 40% and 33%23%, respectively, of the Company’s net sales. Foreign operations and exports represent less than 10% of the Company’s production,our consolidated net sales in fiscal 2009. Our foreign operations represented 9% of consolidated net sales, had earnings that offset 17% of consolidated domestic pre-tax loss and represented 24% of consolidated net assets. Approximately 11%13% of the Company’sCompany's consolidated labor force is coveredrepresented by collective bargaining agreements. These numbers include 95agents. This includes 352 employees who were covered by a contract that expired on May 5, 2006 that is currently being renegotiated. Of the remainingwhose labor contracts none expire or will otherwise require renegotiation within onethe fiscal year fromending May 31, 2006.2010. The concentration of credit risks from financial instruments related to the markets served by the Company is not expected to have a material adverse effect on the Company’sCompany's consolidated financial position, cash flows or future results of operations.
In fiscal 2009, our largest customer accounted for approximately 4% of our consolidated gross sales, and our ten largest customers accounted for approximately 22% of our consolidated gross sales. A significant loss of, or decrease in, business from any of these customers could have an adverse effect on our sales and financial results if we cannot obtain replacement business. Also, due to consolidation in the industries we serve, including the construction, automotive and retail industries, our gross sales may be increasingly sensitive to deterioration in the financial condition of, or other adverse developments with respect to, one or more of our top customers.
The volatile domestic and global recessionary climate, the disruption in capital and credit markets, declines in real estate values and reduced consumer spending are having significant negative impacts on our business. The global recession has resulted in a significant decrease in customer demand throughout nearly all of our markets, including our two largest – construction and automotive.
Demand in the commercial and residential construction markets has weakened as it has become more difficult for companies and consumers to obtain credit for construction projects and the economic slowdown has caused delays in or cancellations of construction projects. Our automotive business is largely driven by the production schedules of General Motors, Ford and Chrysler, as well as their suppliers. The domestic auto industry is currently experiencing a very difficult operating environment, which has resulted in and will likely continue to result in lower levels of vehicle production and an associated decrease in demand for products sold to the automotive industry. Many automotive manufacturers and their suppliers are having financial difficulties and have reduced production levels and eliminated manufacturing capacity. Similar difficulties are being experienced in our other markets and by our customers in those markets. While the Company has taken actions to mitigate the impact of these conditions, if they persist, they could continue to adversely impact the Company’s consolidated position, cash flows and future results of operations.
Our principal raw material is flat-rolled steel, which we purchase from multiple primary steel producers. The steel industry as a whole has been cyclical, and at times availability and pricing can be volatile due to a number of factors beyond our control. This volatility can significantly affect our steel costs. In an environment of increasing prices for steel and other raw materials, competitive conditions may impact how much of the price increases we can pass on to our customers. To the extent we are unable to pass on future price increases in our raw materials to our customers, our financial results could be adversely affected. Also, if steel prices decrease, in general, competitive conditions may impact how quickly we must reduce our prices to our customers and we could be forced to use higher-priced raw materials to complete orders for which the selling prices have decreased. Also, decreased steel prices can require the Company to write-down the value of its inventory to reflect current market pricing, as was the case during fiscal 2009. Further, the number of suppliers has decreased in recent years due to industry consolidation and the financial difficulties of certain suppliers, and consolidation may continue. Accordingly, if delivery from a major supplier is disrupted, it may be more difficult to obtain an alternative supply than in the past.
Receivables: We review our receivables on an ongoing basis to ensure that they are properly valued and collectible. This is accomplished through two contra-receivable accounts: returns and allowances and allowance for doubtful accounts. Returns and allowances are used to record estimates of returns or other allowances resulting from quality, delivery, discounts or other issues affecting the value of receivables. This account is estimated based on historical trends and current market conditions, with the offset to net sales. The allowance for doubtful accounts is used to record the estimated risk of loss related to the customers’ inability to pay. This allowance is maintained at a level that we consider appropriate based on factors that affect collectability, such as the financial health of the customer, historical trends of charge-offs and recoveries, and current economic and market conditions. As we monitor our receivables, we identify customers that may have payment problems, and we adjust the allowance accordingly, with the offset to Selling, general and administrative expense. Account balances are charged off against the allowance when recovery is considered remote.
Based on the ongoing review of receivables, we have increased our allowances by $7.6 million to $12.5 million since May 31, 2008. This increase is principally tied to customers in the automotive industry; and, based on our current information, we believe our allowances are sized appropriately. However, if the economic environment and market conditions do not improve, particularly in the automotive and construction markets where our exposure is greatest, additional reserves may be required.
Property and Depreciation: Property, plant and equipment are carried at cost and depreciated using the straight-line method. Buildings and improvements are depreciated over 10 to 40 years and machinery and equipment over 3 to 20 years. Depreciation expense was $56,769,000$60,178,000 for fiscal 2006, $55,409,0002009, $61,154,000 for fiscal 2005,2008, and $66,545,000$59,478,000 for fiscal 2004.2007. Accelerated depreciation methods are used for income tax purposes.
Goodwill and Other Long-Lived Assets: We use the purchase method of accounting for any business combinations initiated after June 30, 2002, and recognize amortizable intangible assets separately from
goodwill. The purchase price in an acquisition is allocated to the acquired assets and assumed liabilities based on their estimated fair values at the date of acquisition, with goodwill representing the excess of the purchase price over the fair value allocated to the net assets. Under SFAS No. 142,Goodwill and Other Intangible Assets, goodwill and indefinite-lived intangible assets are no longer amortized but are reviewed for impairment. The annual impairment test is performed during the fourth quarter of each fiscal year. We have no intangible assets with indefinite lives other than goodwill.
We review the carrying value of our long-lived assets, including intangible assets with finite useful lives, whenever events or changes in circumstances indicate that the carrying value of an asset or a group of assets may not be recoverable. When a potential impairment is indicated, accounting standards require a charge to be recognized in the financial statements if the carrying amount of an asset or group of assets exceeds the fair value of that asset or group of assets. The loss recognized would be the difference between the fair value and the carrying amount of the asset or group of assets.
The Company’s impairment testing for both goodwill and other long-lived assets, including intangible assets with finite useful lives, are based on discounted cash flow models that require significant judgment and require assumptions about future volume trends, revenue and expense growth rates; and, in addition, external factors such as changes in economic trends and cost of capital. Significant changes in any of these assumptions could impact the outcomes of the tests performed.
Planned Maintenance Activities:The Company usesWe use the deferral method to account for costs of planned maintenance shutdowns. Under this method, the costs of a qualifying shutdown are capitalized and amortized on a straight-line basis into maintenance expense until the next anticipated shutdown. In no case will the amortization period exceed twelve months.
Leases:Certain lease agreements contain fluctuating or escalating payments and rent holiday periods. The related rent expense is recorded on a straight-line basis over the length of the lease term. Leasehold improvements made by the lessee, that arewhether funded by the lessee or by landlord allowances or incentives are recorded as leasehold improvement assets and will be amortized over the shorter of the economic life or the lease term. These incentives are also recorded as deferred rent and amortized as reductions in rent expense over the lease term.
Capitalized Interest: The Company capitalizesWe capitalize interest in connection with the construction of qualified assets. Under this policy, the Companywe capitalized interest of $638,000$346,000 in fiscal 2006, $158,0002009, $146,000 in fiscal 20052008, and $22,000$1,757,000 in fiscal 2004.2007.
Stock-Based Compensation: At May 31, 2006, the Company2009, we had stock optionstock-based compensation plans for employees and non-employee directors which are described more fully in “Note F – Stock-Based Compensation.” The Company accounts for these plans under the recognition and measurement principles of Accounting Principles Board (“APB”) Opinion No. 25,Accounting for Stock Issued to Employees, and the related interpretations. No stock-based employee compensation cost is reflected in net earnings, as all options granted under the plans had an exercise price equal to the fair market value of the underlying common shares on the date of the grant. Pro forma information regarding net earnings and earnings per share is required by Statement of Financial Accounting Standards (“SFAS”) No. 123,Accounting for Stock-Based Compensation, as amended by SFAS No. 148,Accounting for Stock-Based Compensation – Transition and Disclosure. This information is required to be determined as if the Company had accounted for its options granted after December 31, 1994, under the fair value method prescribed by that Statement.
In December 2004, the Financial Accounting Standards Board (“FASB”) issued SFAS No. 123 (revised 2004),Share-Based Payment(“SFAS 123(R)”).SFAS 123(R) is a revision of SFAS 123 and it supercedes APB No. 25 and amends SFAS No. 95,Statement of Cash Flows.Generally, the approach in SFAS 123(R) is similar to the approach described in SFAS 123. However, SFAS 123(R) requires allAll share-based payments to employees,awards, including grants of employeestock options, to be recognizedare recorded as expense in the income statementconsolidated statements of earnings based on their fair values. Pro forma disclosure will not be an alternative. SFAS 123(R) is effective for all fiscal years beginning after June 15, 2005, and thus will become effective for the Company beginning in fiscal 2007.
The adoption of SFAS 123(R)’s fair value method will not materially impact the Company’s results of operations or overall financial position. Stock option expense after the adoption of SFAS 123(R) is not expected to be materially different than the expense reported in the table below, but this will not be known until a full analysis of the impact of SFAS 123(R) is completed. The impact will largely depend on levels of share-based payments granted in the future.
On March 29, 2005, the Securities and Exchange Commission (“SEC”) issued Staff Accounting Bulletin No. 107 (“SAB 107”). SAB 107 provides interpretations expressing the views of the SEC staff regarding the interaction between SFAS 123(R) and certain SEC rules and regulations, and provides the staff’s views regarding the valuation of share-based payment arrangements for public companies. SAB 107 does not modify any of SFAS 123(R)’s conclusions or requirements.
The weighted average fair value of stock options granted in fiscal 2006, fiscal 2005 and fiscal 2004 was $3.62, $3.14, and $2.82, respectively, based on the Black Scholes option pricing model with the following weighted average assumptions:
| 2006 | 2005 | 2004 | ||||
Assumptions used: | ||||||
Dividend yield | 3.58% | 3.33% | 4.04% | |||
Expected volatility | 25.00% | 25.00% | 26.00% | |||
Risk-free interest rate | 4.38% | 3.88% | 3.88% | |||
Expected lives (years) | 6.6 | 6.6 | 6.2 |
The following table illustrates the effect on net earnings and earnings per share if the Company had accounted for the stock option plans under the fair value method of accounting, as required by SFAS 123, for the years ended May 31:
| In thousands, except per share | 2006 | 2005 | 2004 | ||||||
Net earnings, as reported | $ | 145,990 | $ | 179,412 | $ | 86,752 | |||
Deduct: total stock-based employee compensation expense determined | 2,381 | 1,977 | 1,328 | ||||||
Pro forma net earnings | $ | 143,609 | $ | 177,435 | $ | 85,424 | |||
Earnings per share: | |||||||||
Basic, as reported | $ | 1.65 | $ | 2.05 | $ | 1.01 | |||
Basic, pro forma | 1.63 | 2.02 | 0.99 | ||||||
Diluted, as reported | 1.64 | 2.03 | 1.00 | ||||||
Diluted, pro forma | 1.61 | 2.00 | 0.98 | ||||||
Revenue Recognition:The Company recognizesWe recognize revenue upon transfer of title and risk of loss provided evidence of an arrangement exists, pricing is fixed and determinable and collectibilitycollectability is probable. In circumstances where the collection of payment is highly questionable at the time of shipment, the Company deferswe defer recognition of revenue until payment is collected. The Company provides an allowanceWe provide for expected returns and allowances based on experience and current customer activities. As of May 31, 2009 and May 31, 2008, we had deferred $9,304,000 and $9,140,000, respectively, of revenue related to pricing disputes. Within the Construction Services operatingbusiness segment, which represented less than 5% of consolidated net sales for each of the last three fiscal years, revenue is recognized on a percentage-of-completion method. Taxes collected from customers on revenues are reported on a net basis (excluded from revenues).
Advertising Expense:The Company expensesWe expense advertising costs as incurred. Advertising expense was $3,571,000, $3,924,000$4,813,000, $4,220,000, and $3,024,000$4,117,000 for fiscal 2006,2009, fiscal 20052008 and fiscal 2004,2007, respectively.
Shipping and Handling Fees and Costs:Shipping and handling fees billed to customers are included in net sales, and shipping and handling costs incurred by the Company are included in cost of goods sold.
Environmental Costs: Environmental costs are capitalized if the costs extend the life of the property, increase its capacity, and/or mitigate or prevent contamination from future operations. Costs related to environmental contamination treatment and clean-upclean up are charged to expense.
Statements of Cash Flows:Supplemental cash flow information for the years ended May 31 is as follows:
| In thousands | 2006 | 2005 | 2004 | 2009 | 2008 | 2007 | ||||||||||||
Interest paid | $ | 28,372 | $ | 25,039 | $ | 21,889 | ||||||||||||
Interest paid, net of amount capitalized | $ | 20,964 | $ | 21,442 | $ | 21,884 | ||||||||||||
Income taxes paid, net of refunds | 67,163 | 155,901 | 4,749 | 41,679 | 29,641 | 49,600 | ||||||||||||
We use the “cumulative earnings” approach for determining cash flow presentation of distributions from our unconsolidated joint ventures. Distributions received on the investments are included in our consolidated statements of cash flows in operating activities, unless the cumulative distributions exceed our portion of cumulative equity in earnings of the joint venture, in which case the excess distributions are deemed to be returns of the investment and are classified as investing activity in our consolidated statements of cash flows.
Income Taxes: In accordance with the provisions of SFAS No. 109,Accounting for Income Taxes (“SFAS 109”), the Company accountswe account for income taxes using the asset and liability method. The asset and liability method
requires the recognition of deferred tax assets and liabilities for expected future tax consequences of temporary differences that currently exist between the tax basis and financial reporting basis of the Company’sour assets and liabilities. In assessing the realizability of deferred tax assets, the Company considerswe consider whether it is more likely than not that some, or a portion, of the deferred tax assets will not be realized. The Company providesWe provide a valuation allowance for deferred income tax assets when it is more likely than not that a portion of such deferred income tax assets will not be realized.
The CompanyIn accordance with FASB Interpretation No. 48,Accounting for Uncertainty in Income Taxes—an interpretation of FASB Statement No. 109, tax benefits from uncertain tax positions that are recognized in the consolidated financial statements are measured based on the largest benefit that has a reservegreater than fifty percent likelihood of being realized upon ultimate settlement.
We have reserves for taxes and associated interest and penalties that may become payable as a result of auditsare determined in future periodsaccordance with respect to previously filed tax returns included in long-term liabilities. It is the Company’s policy to establish reserves for taxesFIN 48, that may become payable in future years as a result of an examinationaudits by taxing authorities. The Company establishesIt is our policy to record these in income tax expense. While we believe the positions taken on previously filed tax returns are appropriate, we have established the tax and interest reserves based upon management’s assessment of exposure associated with permanent tax differences, tax credits, interest expense, and penalties applied to temporary difference adjustments.in recognition that various taxing authorities may challenge our positions. The tax reserves are analyzed periodically, and adjustments are made as events occur to warrant adjustment to the reserves.
Asset Retirement Obligations:In March 2005, the FASB issued FASB Interpretation No. 47 (“FIN 47”),Accounting for Conditional Asset Retirement Obligations, an interpretationreserves, such as lapsing of SFAS No. 143, which clarifies thatapplicable statutes of limitations, conclusion of tax audits, additional exposure based on current calculations, identification of new issues, release of administrative guidance or court decisions affecting a liability for the performance of an asset retirement activity should be recorded if the obligation to perform such activity is unconditional, whether or not the timing or method of settlement may be conditional on a future event. FIN 47 became effective for the fiscal 2006 consolidated financial statements. The current estimation of any ultimate legal obligation to remediate properties, either in the course of future remodeling, demolition or construction, or as a transferred liability to a buyer, and the related asset and cumulative catch-up of any accretion or depreciation, was immaterial to our consolidated financial position and results of operations.particular tax issue.
Recently Issued Accounting Standards: In November 2004,September 2006, the FASB issued SFAS No. 151,157,Inventory CostsFair Value Measurements (“, to establish a framework for measuring fair value and expand disclosures about fair value measurements. SFAS 151”). SFAS 151 amends the guidance in ARB No. 43, Chapter 4,Inventory Pricing to clarify the accounting157 was effective for abnormal amounts of idle facility expense, freight, handling costfinancial assets and wasted material (spoilage). In addition, SFAS 151 requires that allocation of fixed production overhead to the costs of conversion be based on the normal capacity of the production facilities. SFAS 151liabilities after May 31, 2008, and for non-financial assets and liabilities is effective for inventory costs incurred during fiscal years beginning after June 15, 2005. The Company doesMay 31, 2009. SFAS No. 157 has not expect the adoption of SFAS 151had, and is not expected to have, a material impact on our consolidated financial statements.
In December 2007, the FASB issued SFAS No. 141 (revised 2007) (“SFAS No. 141(R)”),Business Combinations,to improve the relevance, representational faithfulness and comparability of the information that a reporting entity provides in its financial reports about a business combination and its effects. SFAS No. 141(R) applies prospectively to business combinations after May 31, 2009, and is not expected to materially impact our consolidated financial position andor results of operations.
In July 2006,December 2007, the FASB issued SFAS No. 160,Noncontrolling Interests In Consolidated Financial Statements – an amendment of ARB No. 51,to improve the relevance, comparability and transparency of the financial information that a reporting entity provides in its consolidated financial statements by establishing accounting and reporting standards for the noncontrolling interest (minority interest) in a subsidiary and for the deconsolidation of a subsidiary. SFAS No. 160 is effective June 1, 2009, and will affect the accounting treatment of future acquisitions that we may consummate.
In April 2008, the FASB issued FASB InterpretationStaff Position (“FSP”) No. 48,FAS 142-3,Determination of the Useful Life of Intangible Assets (“FSP No. 142-3”). FSP 142-3 amends the factors that should be considered in developing renewal or extension assumptions used to determine the useful life of a recognized intangible asset under SFAS No. 142,Goodwill and Other Intangible Assets. FSP 142-3 is effective for financial statements issued for fiscal years beginning after December 15, 2008, as well as interim periods within those fiscal years. We are currently in the process of evaluating the impact of adopting this pronouncement.
In November 2008, the FASB ratified EITF Issue 08-6,Equity Method Investment Accounting for Uncertainty in Income Taxes—an interpretation of FASB Statement No. 109Considerations(“FIN 48”, (“EITF Issue 08-06”), which clarifies the accounting for uncertaintycertain transactions and impairment considerations involving equity method investments. EITF Issue 08-06 is effective for fiscal years beginning on or after December 15, 2008, and interim periods within those years. We do not expect EITF Issue 08-06 to have a material impact on our consolidated financial statements.
In December 2008, the FASB issued FSP No. FAS 132(R)-1,Employers’ Disclosures about Postretirement Benefit Plan Assets – an amendment of FASB Statement No. 132(R) (“FSP FAS 132(R)-1”). FSP FAS 132(R)-1 expands the disclosure requirements under FASB Statement No. 132(R),Employers’ Disclosures about Pensions and Other Postretirement Benefits to include disclosure on investment policies and strategies, major categories of plan assets, fair value measurements for each major category of plan assets segregated by fair value hierarchy level as defined in tax positions. This InterpretationSFAS 157, the effect of fair value measurements using Level 3 inputs on changes in plan assets for the period, and significant concentrations of risk within plan assets. FSP FAS 132(R)-1 is effective for financial statements issued for fiscal years ending after December 15, 2009. The adoption of this standard will require expanded disclosure in the notes to the Company’s consolidated financial statements but will not impact our consolidated financial statements.
In April 2009, the FASB issued FSP No. FAS 141(R)-1,Accounting for Assets Acquired and Liabilities Assumed in a Business Combination That Arise from Contingencies (“FSP No. 141(R)-1”). FSP No. 141(R)-1 requires that assets acquired and liabilities assumed in a business combination that arise from contingencies be recognized at fair value if fair value can be reasonably estimated. FSP No. 141(R)-1 is effective for business combinations with an acquisition date on or after June 1, 2009. The adoption of this pronouncement will affect the accounting treatment of future acquisitions that we recognizemay consummate.
In April 2009, the FASB issued FSP No. FAS 157-4,Determining Fair Value When the Volume and Level of Activity for the Asset or Liability Have Significantly Decreased and Identifying Transactions That Are Not Orderly (“FSP No. 157-4”). FSP No. 157-4 provides guidance on how to determine the fair value of assets and liabilities under SFAS No. 157 in the current economic environment and reemphasizes that the objective of a fair value measurement remains an exit price. If we were to conclude that there has been a significant decrease in the volume and level of activity of the asset or liability in relation to normal market activities, quoted market values may not be representative of fair value and we may conclude that a change in valuation technique or the use of multiple valuation techniques may be appropriate. FSP No. 157-4 is effective for interim and annual periods ending after June 15, 2009. We do not expect FSP No. 157-4 to have a material impact on our consolidated financial statements.
In April 2009, the FASB issued FSP FAS 115-2 and FAS 124-2,Recognition and Presentation of Other-Than-Temporary Impairments(“FSP No. 115-2 and 124-2”). FSP No. 115-2 and 124-2 amends the other-than-temporary impairment guidance for debt securities to improve presentation and disclosure of other-than-
temporary impairments of debt and equity securities in the financial statements. FSP No. 115-2 and 124-2 is effective for all reporting periods ending after June 15, 2009. We do not expect FSP FSP No. 115-2 and 124-2 to have a material impact on our consolidated financial statements.
In April 2009, the FASB issued FSP No. FAS 107-1 and APB 28-1,Interim Disclosures about Fair Value of Financial Instruments(“FSP No. 107-1 and APB 28-1”). FSP No. 107-1 and APB 28-1 amends SFAS No. 107,Disclosures about Fair Value of Financial Instruments, to require disclosures about fair value of financial instruments in interim as well as in annual financial statements. FSP No. 107-1 and APB 28-1 also amends APB Opinion No. 28, “Interim Financial Reporting,” to require those disclosures in all interim financial statements. FSP No. 107-1 and APB 28-1 is effective for all reporting periods ending after June 15, 2009. We do not expect FSP No. 107-1 and APB 28-1 to have a material impact on our consolidated financial statements.
In May 2009, the FASB issued SFAS No. 165,Subsequent Events (“SFAS No. 165”). SFAS No. 165 establishes general standards of accounting for and disclosure of events that occur after the balance sheet date but before financial statements the impact of a tax position, if that positionare issued. SFAS No. 165 is more likely than not of being sustained on audit, based on the technical merits of the position. The provisions of FIN 48 are effective as of the beginning of our 2007 fiscal year, with the cumulative effect of the change in accounting principle recorded as an adjustment to opening retained earnings.for interim or annual financial periods ending after June 15, 2009. We are currently evaluating the impact of adoptingthis statement.
In June 2009, the FASB issued SFAS No. 166,Accounting for Transfers of Financial Assets – an amendment of FASB Statement No. 140(“SFAS No. 166”). SFAS No. 166 amends the guidance on transfers of financial assets and impacts new transfers of many types of financial assets (e.g., factoring arrangements and sales of trade receivables, mortgages and installment loans). SFAS No. 166 is effective for fiscal years beginning after November 15, 2009, and in interim periods within those fiscal years. We are currently evaluating the impact of this statement.
In June 2009, the FASB issued SFAS No. 167,Amendments to FASB Interpretation No. 46(R)(“SFAS No. 167”). SFAS No. 167 amends the consolidation guidance for variable-interest entities (“VIE”) under FIN 4846(R). SFAS No. 167 makes significant changes to the model for determining who should consolidate a VIE, and also addresses how often this assessment should be performed. We are currently evaluating the impact of this statement.
In June 2009, the FASB issued SFAS No. 168, The FASB Accounting Standards Codificationand the Hierarchy of Generally Accepted Accounting Principles – a replacement of FASB Statement No. 162 (“SFAS No. 168”). On the effective date of this Statement, the Codification will supersede all then-existing non-SEC accounting and reporting standards. All other non-grandfathered, non-SEC accounting literature not included in the Codification will become non-authoritative. This Statement is effective for financial statements issued for interim and annual periods ending after September 15, 2009. We do not expect this pronouncement to have a material impact on our consolidated financial statements.
Note B – Shareholders’ Equity
Preferred Shares: The Worthington Industries, Inc. Amended Articles of Incorporation authorize two classes of preferred shares and their relative voting rights. The boardBoard of directorsDirectors of Worthington Industries, Inc. is empowered to determine the issue prices, dividend rates, amounts payable upon liquidation and other terms of the preferred shares when issued. No preferred shares are issued or outstanding.
Common SharesShares:: At its meeting on September 27, 2006, the Board of Directors of Worthington Industries, Inc. reconfirmed its authorization to repurchase up to 10,000,000 of Worthington Industries, Inc.’s outstanding common shares, which had initially been announced on June 13, 2005. This repurchase authorization was completed during December 2007. On September 26, 2007, Worthington Industries, Inc. announced on June 13, 2005, that its boardthe Board of directorsDirectors had authorized the repurchase of up to ten million, or approximately 11%,an additional 10,000,000 of the thenWorthington Industries, Inc.’s outstanding common shares. A total of 8,449,500 common shares remained available under this repurchase authorization as of May 31, 2009. The purchasescommon shares available for purchase
under this authorization may be madepurchased from time to time, on the open market or in private transactions, with consideration given to the market price of the common shares, the nature of other investment opportunities, cash flows from operations and general economic conditions. No repurchases of common shares pursuant to this authorization occurred during fiscal 2006.Repurchases may be made on the open market or through privately negotiated transactions.
Comprehensive Income:Income (Loss): The components of other comprehensive income (loss) and related tax effects for the years ended May 31, were as follows:
| In thousands | 2006 | 2005 | 2004 | ||||||||
Other comprehensive income (loss): | |||||||||||
Unrealized gain on investment | $ | 139 | $ | 164 | $ | 94 | |||||
Foreign currency translation, net of tax of $677, $(756) and $0 in 2006, 2005 and 2004 | 8,711 | 698 | (1,747 | ) | |||||||
Minimum pension liability, net of tax of $ 28, $203 and $(492) in 2006, 2005 and 2004 | 2,473 | (332 | ) | 1,015 | |||||||
Cash flow hedges, net of tax of $(8,364), $ (661) and $(2,628) in 2006, 2005 and 2004 | 17,106 | 550 | 3,413 | ||||||||
Other comprehensive income, net of tax | $ | 28,429 | $ | 1,080 | $ | 2,775 | |||||
| In thousands | 2009 | 2008 | 2007 | |||||||||
Other comprehensive income (loss): | ||||||||||||
Unrealized loss on investment | $ | - | $ | - | $ | (296 | ) | |||||
Foreign currency translation, net of tax of $0, $0 and $212 in 2009, 2008 and 2007 | (9,866 | ) | 13,080 | 4,507 | ||||||||
Pension liability adjustment, net of tax of $14, $(44) and $(139) in 2009, 2008 and 2007 | (4,766 | ) | 590 | 34 | ||||||||
Cash flow hedges, net of tax of $3,187, $6,290 and $4,300 in 2008, 2007 and 2006 | (5,544 | ) | (12,218 | ) | (7,586 | ) | ||||||
Other comprehensive income (loss), net of tax | $ | (20,176 | ) | $ | 1,452 | $ | (3,341 | ) | ||||
The components of cumulative other comprehensive income, (loss), net of tax, at May 31 were as follows:
| In thousands | 2006 | 2005 | 2009 | 2008 | ||||||||||||
Unrealized gain on investment | $ | 291 | $ | 152 | ||||||||||||
Foreign currency translation | 6,460 | (2,251 | ) | $ | 14,176 | $ | 24,042 | |||||||||
Minimum pension liability | (276 | ) | (2,749 | ) | ||||||||||||
Defined benefit pension liability | (5,012 | ) | (246 | ) | ||||||||||||
Cash flow hedges | 20,641 | 3,535 | (4,707 | ) | 837 | |||||||||||
Cumulative other comprehensive income (loss), net of tax | $ | 27,116 | $ | (1,313 | ) | |||||||||||
Cumulative other comprehensive income, net of tax | $ | 4,457 | $ | 24,633 | ||||||||||||
Reclassification adjustments for cash flow hedges in fiscal 2006,2009, fiscal 2005,2008, and fiscal 20042007 were $4,382,000$445,000 (net of tax of $2,686,000)$234,000), $1,402,000$7,514,000 (net of tax of $859,000)$3,719,000), and $248,000$9,046,000 (net of tax of $152,000)$4,617,000), respectively.
The estimated net amount of the existing gains or losses in other comprehensive income at May 31, 2006,2009 expected to be reclassified into net earnings within the succeeding twelve months was $8,598,000$743,000 (net of tax of $5,270,000)$391,000). This amount was computed using the fair value of the cash flow hedges at May 31, 2006,2009, and will change before actual reclassification from other comprehensive income to net earnings during the fiscal 2007.year ending May 31, 2010.
Note C – Debt
Debt at May 31 is summarized as follows:
| In thousands | 2006 | 2005 | 2009 | 2008 | ||||||||
Short-term notes payable | $ | 7,684 | $ | - | ||||||||
7.125% senior notes due May 15, 2006 | - | 142,409 | ||||||||||
6.700% senior notes due December 1, 2009 | 145,000 | 145,000 | ||||||||||
Notes payable | $ | 980 | $ | 135,450 | ||||||||
6.7% senior notes due December 1, 2009 | 138,000 | 145,000 | ||||||||||
Floating rate senior notes due December 17, 2014 | 100,000 | 100,000 | 100,000 | 100,000 | ||||||||
Other | - | 1,023 | 413 | - | ||||||||
Total debt | 252,684 | 388,432 | 239,393 | 380,450 | ||||||||
Less current maturities and short-term notes payable | 7,684 | 143,432 | ||||||||||
Less current maturities and notes payable | 138,993 | 135,450 | ||||||||||
Total long-term debt | $ | 245,000 | $ | 245,000 | $ | 100,400 | $ | 245,000 | ||||
At May 31, 2009, notes payable consisted of $980,000 of borrowings under our revolving credit facility, described below. The average variable rate was 0.90% at May 31, 2009, and is based on our senior unsecured long-term debt ratings assigned by Standard & Poor’s Ratings Group and Moody’s Investors Service, Inc. At May 31, 2008, our notes payable consisted of $125,450,000 of borrowings under our revolving credit facility and $10,000,000 of borrowings on uncommitted credit lines. The average variable rate was 3.16% at May 31, 2008.
On May 6, 2008, we amended our $435,000,000 five-year revolving credit facility, which had been due to expire on September 29, 2005, Worthington Industries, Inc. amended and restated its $435,000,000 long-term revolving credit facility.2010. The amendment providesextended the commitment date to May 6, 2013, except for an extension ofa $35,000,000 commitment by one lender that will expire on September 29, 2010. In addition, the facility commitments to September 2010; replaces the leverage ratio (debt-to-EBITDA) financial covenant with an interest coverage ratio (EBITDA-to-interest expense) financial covenant and reducesamendment increased the facility fees payable. The borrowingsand applicable percentage for base rate and Eurodollar loans. Borrowings under the amended and
restatedthis facility may be used to fund general corporate purposes including working capital, capital expenditures, acquisitions and dividends.
Worthington Industries, Inc. payshave maturities of less than one year. We pay facility fees on the unused credit amount under its revolving credit facility.commitment amount. Interest rates on borrowings under the revolving credit facility and related facility fees are determined by Worthington Industries, Inc.’sbased on our senior unsecured long-term debt ratings as assigned by Standard & Poor’sPoor's Ratings ServicesGroup and Moody’sMoody's Investors Service. Service, Inc. We had $434,020,000 available to us under this facility at May 31, 2009, compared to $309,550,000 available to us at May 31, 2008.
The covenants in the revolving credit facility include, among others, maintenance of a debt-to-totalconsolidated indebtedness to capitalization ratio of not more than 55% at the end of any fiscal quarter and maintenance of an interest coverage ratio for any period of four consecutive quarters, calculated at the end of any fiscal quarter, of not less than 3.25 times through maturity. The CompanyAt May 31, 2009, the interest coverage ratio was 8.72 times while the consolidated indebtedness to capitalization ratio was 32%. We were in compliance with all covenants under the revolving credit facility at May 31, 2006. There was no outstanding balance under the facility at2009.
As of May 31, 2006 and 2005.
In July 2004, Worthington Industries, Inc. amended2009, we had $138,000,000 of 6.7% senior notes due December 1, 2009. During the fiscal quarter ended May 31, 2009, the Company redeemed $7,000,000 of its then $235,000,000 revolving credit facility to increase its size to $435,000,000 and to eliminate certain covenants.
Effective December 17, 2004, Worthington Industries, Inc. issued $100,000,000 in aggregate$145,000,000 outstanding principal amount of unsecured Floating Rate Senior Notes6.7% notes due December 1, 2009. See “Note V – Subsequent Events” for additional details regarding the 6.7% senior notes due December 1, 2009.
The floating rate senior notes are due on December 17, 2014 (the “2014(“2014 Notes”) through a private placement. The 2014 Notesand bear interest at a variable rate equal to six-month LIBOR plus 80 basis points. This rate was 5.46%3.02% as of May 31, 2006.2009. However, we entered into an interest rate swap agreement whereby we receive interest on the $100,000,000 notional amount at the six-month LIBOR rate and we pay interest on the same notional amount at a fixed rate of 4.46%, effectively fixing the interest rate at 5.26%. The 2014 Notes are callable at Worthington Industries, Inc.’s option,par, at par, on or after December 17, 2006.our option. The covenants in the 2014 Notes, as amended December 19, 2006, include among others, maintenance of a debt-to-totalconsolidated indebtedness to capitalization ratio, calculated at the end of each fiscal quarter, of not more than 55% and maintenance of a debt-to-EBITDAan interest coverage ratio, for any period of four consecutive quarters, calculated at the end of any fiscal quarter, of not moreless than 3.253.0 times through maturity. The CompanyAt May 31, 2009, the interest coverage ratio was 8.72 times while the consolidated indebtedness to capitalization ratio was 32%. We were in compliance with all covenants under the 2014 Notes at May 31, 2006.
In anticipation of the issuance of the 2014 Notes, the Company entered into an interest rate swap agreement in October 2004, which was amended in December 2004. Under the terms of the agreement, the Company receives interest on a $100,000,000 notional amount at the six-month LIBOR rate and the Company pays interest on the same notional amount at a fixed rate of 4.46%.
At May 31, 2006, the Company’s short-term notes payable represented debt of foreign operations consisting of a term loan bearing interest at a variable rate of 3.4%, which is guaranteed by Worthington Industries, Inc. This rate is determined by Worthington Industries, Inc’s senior unsecured long-term debt ratings as assigned by Standard & Poor’s ratings Services and Moody’s Investors Service. The covenants reflect those of the $435,000,000 revolving credit facility listed above.2009.
Principal payments due on long-term debt in the next five fiscal years, and the remaining years thereafter, are as follows:
| In thousands | ||||||
2007 | $ | - | ||||
2008 | - | |||||
2009 | - | |||||
2010 | 145,000 | $ | 138,013 | |||
2011 | - | - | ||||
2012 | - | |||||
2013 | 80 | |||||
2014 | 80 | |||||
Thereafter | 100,000 | 100,240 | ||||
Total | $ | 245,000 | $ | 238,413 | ||
Note D – Income Taxes
Earnings (loss) before income taxes for the years ended May 31 include the following components:
| In thousands | 2006 | 2005 | 2004 | ||||||
Pre-tax earnings: | |||||||||
United States based operations | $ | 194,427 | $ | 271,831 | $ | 119,658 | |||
Non - United States based operations | 18,322 | 16,638 | 7,806 | ||||||
| $ | 212,749 | $ | 288,469 | $ | 127,464 | ||||
Pre-tax earnings (loss): United States based operations Non - United States based operationsIn thousands 2009 2008 2007 $ (174,934 ) $ 95,418 $ 106,246 28,966 50,275 59,771 $ (145,968 ) $ 145,693 $ 166,017
Significant components of income tax expense (benefit) for the years ended May 31 were as follows:
| In thousands | 2006 | 2005 | 2004 | 2009 | 2008 | 2007 | ||||||||||||||||||
Current: | ||||||||||||||||||||||||
Federal | $ | 56,911 | $ | 94,295 | $ | 52,720 | $ | (21,609 | ) | $ | 29,969 | $ | 38,644 | |||||||||||
State and local | 8,343 | 13,387 | 7,061 | 3,146 | 2,617 | 1,617 | ||||||||||||||||||
Foreign | 14,150 | 2,871 | 3,439 | 6,188 | 9,258 | 14,919 | ||||||||||||||||||
| 79,404 | 110,553 | 63,220 | (12,275 | ) | 41,844 | 55,180 | ||||||||||||||||||
Deferred: | ||||||||||||||||||||||||
Federal | (6,051 | ) | (4,434 | ) | (19,034 | ) | (19,393 | ) | (3,038 | ) | (2,402 | ) | ||||||||||||
State | (1,950 | ) | 3,634 | (2,229 | ) | (4,359 | ) | (1,601 | ) | (334 | ) | |||||||||||||
Foreign | (4,644 | ) | (696 | ) | (1,245 | ) | (1,727 | ) | 1,411 | (332 | ) | |||||||||||||
| (12,645 | ) | (1,496 | ) | (22,508 | ) | (25,479 | ) | (3,228 | ) | (3,068 | ) | |||||||||||||
| $ | 66,759 | $ | 109,057 | $ | 40,712 | $ | (37,754 | ) | $ | 38,616 | $ | 52,112 | ||||||||||||
Tax benefits related to the exercise of optionsstock-based compensation that were credited to additional paid-in capital were $1,279,000, $3,542,000$433,000, $2,035,000 and $446,000$2,370,000 for fiscal 2006,2009, fiscal 2005,2008 and fiscal 2004, respectively.2007. Tax benefits (expenses) related to foreign currency translation adjustments that were credited to (deducted from) other comprehensive income were $677,000, $(756,000),$0, $0 and $0$212,000 for fiscal 2006,2009, fiscal 2005,2008 and fiscal 2004, respectively.2007. Tax benefits (expenses) related to minimumdefined benefit pension liability that were credited to (deducted from) other comprehensive income were $28,000, $203,000,$14,000, ($44,000) and $(492,000)$(139,000) for fiscal 2006,2009, fiscal 2005,2008 and fiscal 2004 respectively.2007. Tax expensesbenefits (expenses) related to cash flow hedges that were credited to (deducted from) other comprehensive income were $(8,364,000), $(661,000),$3,187,000, $6,290,000 and $(2,628,000)$4,300,000 for fiscal 2006,2009, fiscal 2005,2008 and fiscal 2004, respectively.
The reconciliation of the differences between the effective income tax rate and the statutory federal income tax rate for the years ended May 31 is as follows:
| 2006 | 2005 | 2004 | ||||
Federal statutory rate | 35.0% | 35.0% | 35.0% | |||
State and local income taxes, net of federal tax benefit | 3.6 | 3.0 | 2.5 | |||
Reversal of income tax accruals for favorable resolution of tax audits and change in estimate of deferred tax | (1.4) | (0.2) | (6.1) | |||
Non-U.S. income taxes at other than 35% | (4.1) | (1.3) | (0.4) | |||
Ohio income tax law change | (2.3) | - | - | |||
Special foreign earnings repatriations and sale of non-U.S. company | 2.5 | - | - | |||
Deferred tax adjustment for foreign earnings | (2.2) | - | - | |||
Other | 0.3 | 1.3 | 0.9 | |||
Effective tax rate | 31.4% | 37.8% | 31.9% | |||
The Company establishes reserves based upon management’s assessment of exposure associated with permanent tax differences, tax credits, interest expense, and penalties applied to temporary difference adjustments and tax return positions.2007. The tax reserves are analyzed periodically and adjustments are made as events occur to warrant adjustment to the reserve. As a result of the favorable resolution of certain tax audits and related developments, the Company decreased the tax reserve by $2,261,000, $2,112,000 and $3,377,000 for fiscal 2006, fiscal 2005 and fiscal 2004, respectively.
The Company adjusted deferred taxes in fiscal 2006 and fiscal 2005, resulting in a $5,599,000 decrease and $1,628,000 increase, respectively, in income tax expense. Fiscal 2006 included a $4,623,000 adjustment for an over-accrual of deferred tax liabilitiesbenefits related to the foreign earningsgain from the dilution of the WAVE joint venture and a $4,346,000 deferred tax liability adjustment for the Ohio tax law changes, discussed below, offset by a $3,370,000 adjustment for changesour interest in estimated tax liabilities.
On June 30, 2005, the state of Ohio enacted various changes to its tax laws. One change is the phase-out of the Ohio franchise tax, which is generally based on federal taxable income. This phase-out is scheduled to occur at the rate of 20% per year for 2006 through 2010. The Company’s accrual for income taxes for fiscal 2005 included 100% of the expected Ohio franchise tax liability. As a result of the law change, only 80% of that liability was due. As such, theTWB Company, made an adjustment to reduce its accrued income taxes. In addition,L.L.C. (“TWB”), as a result of various changesour partner’s contribution to Ohio’s tax laws, the Company adjusted its deferred taxes by $4,346,000.this unconsolidated joint venture, credited to additional paid-in capital were $1,031,000 for fiscal 2008 (see “Note J – Investments in Unconsolidated Affiliates”).
American Jobs Creation Act
The American Jobs Creation Act of 2004 (“the Act”) provides a deduction for income from qualified domestic production activities, which is phased in from 2006 through 2011. The effectA reconciliation of the phase-in of this new deduction resulted in a decrease in the effectivefederal statutory tax rate of 35 percent to total tax provisions (benefits) follows:
| 2009 | 2008 | 2007 | |||||||
Federal statutory rate | 35.0 | % | 35.0 | % | 35.0 | % | |||
State and local income taxes, net of federal tax benefit | 1.6 | 0.7 | 1.5 | ||||||
Change in income tax accruals for resolution of tax audits and change in estimate of deferred tax | (0.1 | ) | (1.7 | ) | 1.1 | ||||
Non-U.S. income taxes at other than 35% | 3.9 | (4.6 | ) | (3.6 | ) | ||||
Goodwill impairment non-deductible | (13.9 | ) | - | - | |||||
Other | (0.6 | ) | (2.9 | ) | (2.6 | ) | |||
Effective tax rate | 25.9 | % | 26.5 | % | 31.4 | % | |||
In June 2006, the FASB issued FASB Interpretation No. 48,Accounting for fiscal year 2006 of less than 1 percentage-point. Under the guidanceUncertainty in FASB Staff Position SFAS 109-1,ApplicationIncome Taxes – an interpretation of FASB Statement No. 109 Accounting for Income Taxes, (“FIN 48”). The interpretation addresses the determination of whether tax benefits claimed, or expected to be claimed, on a tax return should be recorded in the Tax Deductionfinancial statements. Under FIN 48, a tax benefit may be recognized from an uncertain tax position only if it is more likely than not that the tax position will be sustained on Qualified Production Activities Providedexamination by the American Jobs Creation Acttaxing authorities, including resolution of 2004,any related appeals or litigation processes, based on the deduction willtechnical merits of the position. The tax benefits recognized in the financial statements from such a position should be treatedmeasured based on the largest benefit that has a greater than fifty percent likelihood of being realized upon ultimate settlement. FIN 48 also provides guidance on income tax related issues such as a “special deduction” as describedderecognition, classification, interest and penalties, accounting treatment in SFAS 109. As such,interim periods and increased disclosure requirements.
On June 1, 2007, we adopted the special deduction hasprovisions of FIN 48. There was no effect on deferredour consolidated financial position or cumulative adjustment to our beginning retained earnings as a result of the implementation. However, certain amounts have been reclassified on the consolidated balance sheets in order to comply with the requirements of the interpretation.
The total amount of unrecognized tax assetsbenefits was $3,897,000, $2,093,000 and liabilities existing$16,826,000 as of May 31, 2009, May 31, 2008 and June 1, 2007, respectively. The total amount of unrecognized tax benefits that, if recognized, would affect the enactment date. Rather,effective tax rate was $2,703,000 as of May 31, 2009. Unrecognized tax benefits are the impactdifferences between a tax position taken, or expected to be taken in a tax return, and the benefit recognized for accounting purposes pursuant to FIN 48. Accrued amounts of this deduction willinterest and penalties related to unrecognized tax benefits are recognized as part of income tax expense within our consolidated statement of earnings. As of May 31, 2009, May 31, 2008 and June 1, 2007, we had accrued liabilities of $1,143,000, $720,000 and $5,056,000, respectively, for interest and penalties within the unrecognized tax benefits.
A tabular reconciliation of unrecognized tax benefits follows:
Balance at June 1, 2008 | $ | 2,093 | ||
Increases – tax positions taken in prior years | 2,282 | |||
Decreases – tax positions taken in prior years | (170 | ) | ||
Increases – current tax positions | 185 | |||
Decreases – current tax positions | (74 | ) | ||
Settlements | 92 | |||
Lapse of statutes of limitations | (511 | ) | ||
Balance at May 31, 2009 | $ | 3,897 | ||
Approximately $806,000 of the liability for unrecognized tax benefits is expected to be reportedsettled in the periodnext twelve months due to the expiration of statutes of limitations in whichvarious tax jurisdictions. While it is expected that the deduction is claimed on the Company’s tax return.
The Act also created a temporary incentive for U.S. corporations to repatriate accumulated income earned abroad by providing an 85 percent dividends-received deduction for certain dividends from controlled foreign corporations. During fiscal 2006, the Company both approved a plan for reinvestment and repatriated a cash dividend amount of $42,157,000,unrecognized tax benefits will change in the next twelve months, any change is not expected to have a material impact on our consolidated financial position, results of which $41,395,000 qualified for the 85 percent dividends-received deduction. Pursuant to the plan for reinvestment, during 2006 the Company made expenditures for capital additions and improvements and other qualifying amounts at its domestic facilities in excessoperations or cash flows.
Following is a summary of the $42,157,000 cash dividend amount. As a result, the Company recorded a relatedtax years open to examination by major tax jurisdiction:
U.S. Federal – 2000 – 2003; 2006 and forward
U.S. State and Local – 2002 and forward
Austria – 2002 and forward
Canada – 2005 and forward
We also adjusted our deferred taxes in fiscal 2009, fiscal 2008 and fiscal 2007, resulting in an increase (decrease) of $1,316,000, $(2,057,000), and $917,000 in income tax expense, of $1,702,000 for the cash dividend repatriation.respectively.
Taxes on Foreign Income
– Pre-tax income for fiscal 2006, 2005 and 2004earnings attributable to foreign sources arefor fiscal 2009, fiscal 2008 and fiscal 2007 were as noted above. Without regard to the one-time repatriation discussed above, asAs of May 31, 2006,2009, and based on the tax laws in effect at that time, it
remains the Company’sour intention to continue to indefinitely reinvest itsour undistributed foreign earnings, except for the foreign earnings of itsour TWB joint venture. Accordingly, where this election has been made, no deferred tax liability has been recorded for those foreign earnings. Undistributed earnings of itsour consolidated foreign subsidiaries net of the $42,157,000 repatriation, at May 31, 2006,2009, amounted to $34,420,000.$242,778,000. If such earnings were not permanently reinvested, a deferred tax liability of approximately $13,160,000$29,823,000 would have been required.
The components of the Company’sour deferred tax assets and liabilities as of May 31 were as follows:
| In thousands | 2006 | 2005 | 2009 | 2008 | ||||||||||||
Deferred tax assets: | ||||||||||||||||
Accounts receivable | $ | 3,204 | $ | 5,820 | $ | 4,511 | $ | 2,300 | ||||||||
Inventories | 3,535 | 3,181 | 5,228 | 6,021 | ||||||||||||
Accrued expenses | 16,209 | 20,642 | 17,941 | 18,609 | ||||||||||||
Net operating loss carryforwards | 17,841 | 17,374 | 20,573 | 17,989 | ||||||||||||
Tax credit carryforwards | 2,841 | 2,276 | 2,423 | 2,473 | ||||||||||||
Income taxes | 1,025 | 1,277 | ||||||||||||||
Stock-based compensation | 4,465 | 2,362 | ||||||||||||||
Derivative contracts | 2,465 | - | ||||||||||||||
Other | 754 | 1,041 | ||||||||||||||
Total deferred tax assets | 44,655 | 50,570 | 58,360 | 50,795 | ||||||||||||
Valuation allowance for deferred tax assets | (15,931 | ) | (17,858 | ) | (14,729 | ) | (13,248 | ) | ||||||||
Net deferred tax assets | 28,724 | 32,712 | 43,631 | 37,547 | ||||||||||||
Deferred tax liabilities: | ||||||||||||||||
Property, plant and equipment | 98,505 | 106,287 | 77,454 | 97,057 | ||||||||||||
Derivative contracts | 11,413 | 2,969 | - | 1,247 | ||||||||||||
Undistributed earnings of unconsolidated affiliates | 13,557 | 23,393 | 15,802 | 17,207 | ||||||||||||
Income taxes | 273 | 862 | ||||||||||||||
Other | 38 | 35 | 1,010 | 380 | ||||||||||||
Total deferred tax liabilities | 123,513 | 132,684 | 94,539 | 116,753 | ||||||||||||
Net deferred tax liability | $ | 94,789 | $ | 99,972 | ||||||||||||
Net deferred tax liabilities | $ | 50,908 | $ | 79,206 | ||||||||||||
The above amounts are classified in the consolidated balance sheets as of May 31 as follows:
| In thousands | 2006 | 2005 | 2009 | 2008 | ||||||||
Current assets: | ||||||||||||
Deferred income taxes | $ | 15,854 | $ | 19,490 | $ | 24,868 | $ | 17,966 | ||||
Other assets: | ||||||||||||
Deferred income taxes | 3,967 | - | 7,210 | 3,639 | ||||||||
Noncurrent liabilities: | ||||||||||||
Deferred income taxes | 114,610 | 119,462 | 82,986 | 100,811 | ||||||||
Net deferred tax liabilities | $ | 94,789 | $ | 99,972 | $ | 50,908 | $ | 79,206 | ||||
At May 31, 2006, the Company2009, we had tax benefits for federal net operating loss carryforwards of $785,000$258,000 that expire from fiscal 20072010 to fiscal 2019.2020. These net operating loss carryforwards are subject to utilization limitations. At May 31, 2006, the Company2009, we had tax benefits for state net operating loss carryforwards of $11,893,000$16,022,000 that expire from fiscal 20072010 to fiscal 20242030 and state credit carryforwards of $30,000.$1,330,000 that expire from fiscal 2010 to fiscal 2024. At May 31, 2006, the Company2009, we had tax benefits for foreign net operating loss carryforwards of $5,162,000$4,293,000 for income tax purposes that expire from fiscal 20072010 to fiscal 2011.2029. At May 31, 2006, the Company2009, we had tax benefits for foreign tax credit carryforwards of $2,812,000.$1,158,000 that expire in fiscal 2019.
A valuation allowance of $15,931,000$14,729,000 has been recognized to offset the deferred tax assets related to the net operating loss carryforwards and foreign tax credit carryforwards.carryforwards and certain state tax credits. The valuation allowance includes $3,597,000$1,153,000 for federal, $11,251,000$11,997,000 for state and $1,083,000$1,579,000 for foreign. The majority of the federal valuation allowance relates to the foreign tax credit with the remainder relating to the net operating loss carryforward. The majority of the state valuation allowance relates to owning the Decatur, Alabama facility while the majority of the foreign valuation allowance relates to operations in the Czech Republic and China. The Company hasBased on our history of profitability and taxable income projections, we have determined that it is more likely than not that there will not be sufficient taxable income in future years to utilize all of thedeferred tax assets are realizable, except for certain net operating loss carryforwards.carryforwards and tax credits.
Note E – Employee Pension Plans
The Company providesWe provide retirement benefits to employees mainly through contributory, deferred profit sharing plans. Company contributionsContributions to the deferred profit sharing plans are determined as a percentage of the
Company’sour pre-tax income before profit sharing, with contributions guaranteed to represent at least 3% of the participants’ compensation. Starting in January 2003, the Company began matchingDuring fiscal 2009, fiscal 2008 and fiscal 2007, we matched employee contributions at 50% up to defined maximums. The CompanyWe also hashave one defined benefit plan, The Gerstenslager Company Bargaining Unit Employees’ Pension Plan. That defined benefit planPlan (the “Gerstenslager Plan”). The Gerstenslager Plan is a non-contributory pension plan, which covers certain employees based on age and length of service. CompanyOur contributions comply with ERISA’sERISA's minimum funding requirements.
As partEffective May 31, 2007, we adopted the recognition provisions of its consolidation plan announced in fiscal 2002, the Company recognized in the restructuring charge actual curtailment losses on plan assetsSFAS No. 158,Employers’ Accounting for Defined Benefit Pension and Other Postretirement Plans – an Amendment of $3,135,000 in fiscal 2003. The loss primarily resulted fromFASB Statements No. 87, 88, 106 and 132(R) (“SFAS No. 158”), which required the recognition of actuarial gains or losses, prior service costs or credits and transition assets or obligations that had previously been deferred. The adoption did not materially impact our consolidated financial position or results of terminated employees inoperations. Beginning with fiscal 2009, the Malvern,Company adopted the NRM Truckingmeasurement date provisions of SFAS No. 158. The measurement date provisions require plan assets and the Jackson defined benefit plans. During fiscal 2003 and fiscal 2004, the Internal Revenue Service and the Pension Benefit Guaranty Corporation approved The Notice of Intentobligations to Terminate and Freeze the Malvern, NRM Trucking and Jackson plans. Annuity contracts were purchased in fiscal 2004 and fiscal 2003 to settle the liabilities under these plans. During fiscal 2004, the liabilitiesbe measured as of the Malvern, NRM Trucking and Jackson plans were settled through annuity purchases requiring additional employer contributionsdate of $5,991,000.the year-end financial statements. The Company previously measured its pension benefits obligation as of March 31 each year. The adoption of the measurement date provisions of SFAS No. 158 did not have a material effect on the Company’s consolidated financial position or results of operations for fiscal 2009.
The following table summarizes the components of net periodic pension cost excluding the amounts recorded as part of the restructuring charge, for the definedGerstenslager Plan (the “defined benefit plan”) and the defined contribution plans for the years ended May 31:
| In thousands | 2006 | 2005 | 2004 | |||||||||
Defined benefit plan: | ||||||||||||
Service cost | $ | 700 | $ | 696 | $ | 703 | ||||||
Interest cost | 719 | 646 | 600 | |||||||||
Actual return on plan assets | (1,621 | ) | (622 | ) | (2,160 | ) | ||||||
Net amortization and deferral | 1,149 | 323 | 2,222 | |||||||||
Net pension cost on defined benefit plan | 947 | 1,043 | 1,365 | |||||||||
Defined contribution plans | 9,663 | 10,776 | 9,920 | |||||||||
Total pension cost | $ | 10,610 | $ | 11,819 | $ | 11,285 | ||||||
The following actuarial assumptions were used for the Company’s defined benefit plan: | ||||||||||||
| 2006 | 2005 | 2004 | ||||||||||
To determine benefit obligation: | ||||||||||||
Discount rate | 6.03 | % | 5.61 | % | 5.75 | % | ||||||
To determine net periodic pension cost: | ||||||||||||
Discount rate | 5.61 | % | 5.75 | % | 6.00 | % | ||||||
Expected long-term rate of return | 8.00 | % | 7.00 | % | 7.00 | % | ||||||
Rate of compensation increase | n/a | n/a | n/a | |||||||||
| In thousands | 2009 | 2008 | 2007 | |||||||||
Defined benefit plan: | ||||||||||||
Service cost | $ | 615 | $ | 599 | $ | 610 | ||||||
Interest cost | 1,146 | 900 | 818 | |||||||||
Actual return on plan assets | (3,774 | ) | 496 | (1,257 | ) | |||||||
Net amortization and deferral | 2,501 | (1,538 | ) | 396 | ||||||||
Net periodic pension cost on defined benefit plan | 488 | 457 | 567 | |||||||||
Defined contribution plans | 8,455 | 11,641 | 9,694 | |||||||||
Total retirement plan cost | $ | 8,943 | $ | 12,098 | $ | 10,261 | ||||||
The following actuarial assumptions were used for our defined benefit plan:
| 2009 | 2008 | 2007 | |||||||
To determine benefit obligation: | |||||||||
Discount rate | 7.45 | % | 6.82 | % | 6.14 | % | |||
To determine net periodic pension cost: | |||||||||
Discount rate | 6.92 | % | 6.14 | % | 6.03 | % | |||
Expected long-term rate of return | 8.00 | % | 8.00 | % | 8.00 | % | |||
Rate of compensation increase | n/a | n/a | n/a |
To calculate the discount rate, we used the expected cash flows of the benefit payments and the Citigroup Pension Index. The expected long-term rate of return on the defined benefit plan in fiscal 20062009, fiscal 2008 and fiscal 20052007 was based on the actual historical returns adjusted for a change in the frequency of lump sum settlements upon retirement. The expected long-term rate of return on the defined benefit plan for fiscal 2004 was based on historical returns.
The following tables provide a reconciliation of the changes in the projected benefit obligation and fair value of plan assets and the funded status for the defined benefit plan during fiscal 20062009 and fiscal 20052008 as of the March 31respective measurement date:dates:
| In thousands | 2006 | 2005 | May 31, 2009 | March 31, 2008 | ||||||||||||
Change in benefit obligation | ||||||||||||||||
Benefit obligation, beginning of year | $ | 13,356 | $ | 11,844 | $ | 14,329 | $ | 14,626 | ||||||||
Service cost | 700 | 696 | 615 | 599 | ||||||||||||
Interest cost | 719 | 646 | 1,146 | 900 | ||||||||||||
Actuarial (gain) loss | (935 | ) | 302 | |||||||||||||
Actuarial gain | (1,390 | ) | (1,577 | ) | ||||||||||||
Benefits paid | (144 | ) | (131 | ) | (400 | ) | (219 | ) | ||||||||
Benefit obligation, end of year | $ | 13,696 | $ | 13,357 | $ | 14,300 | $ | 14,329 | ||||||||
Change in plan assets | ||||||||||||||||
Fair value, beginning of year | $ | 9,237 | $ | 8,746 | $ | 15,420 | $ | 16,135 | ||||||||
Actual return on plan assets | 1,621 | 622 | (3,774 | ) | (496 | ) | ||||||||||
Company contributions | 2,659 | - | ||||||||||||||
Benefits paid | (144 | ) | (131 | ) | (400 | ) | (219 | ) | ||||||||
Fair value, end of year | $ | 13,373 | $ | 9,237 | $ | 11,246 | $ | 15,420 | ||||||||
Funded Status | $ | (3,054 | ) | $ | 1,091 | |||||||||||
Unrecognized net actuarial loss | 932 | 2,776 | ||||||||||||||
Unrecognized prior service cost | 700 | 939 | ||||||||||||||
Minimum pension liability | (1,632 | ) | (3,715 | ) | ||||||||||||
Amounts recognized in the consolidated balance sheets consist of: | ||||||||||||||||
Noncurrent assets | $ | - | $ | 1,091 | ||||||||||||
Noncurrent liabilities | (3,054 | ) | - | |||||||||||||
Cumulative other comprehensive income | 4,527 | 869 | ||||||||||||||
Accrued benefit cost | $ | (323 | ) | $ | (4,120 | ) | ||||||||||
Amounts recognized in cumulative other comprehensive income consist of: | ||||||||||||||||
Net loss | 4,527 | 650 | ||||||||||||||
Prior service cost | - | 219 | ||||||||||||||
Total | $ | 4,527 | $ | 869 | ||||||||||||
Plan with benefit obligation in excess of fair value of plan assets: | ||||||||||||||||
Projected and accumulated benefit obligation | $ | 13,696 | $ | 13,357 | ||||||||||||
Fair value of plan assets | 13,373 | 9,237 | ||||||||||||||
Funded status | $ | (323 | ) | $ | (4,120 | ) | ||||||||||
The following table shows other changes in plan assets and benefit obligations recognized in other comprehensive income during the fiscal year ended May 31:
| In thousands | 2009 | 2008 | ||||||
Net actuarial loss | $ | 3,877 | $ | 201 | ||||
Amortization of prior service cost | (219 | ) | (240 | ) | ||||
Total recognized in other comprehensive income | $ | 3,658 | $ | (39 | ) | |||
Total recognized in net periodic benefit cost and other comprehensive income | $ | 4,146 | $ | 417 | ||||
The estimated net loss and prior service cost for the defined benefit plan that will be amortized from accumulated other comprehensive income into net periodic pension cost over the fiscal year ending May 31, 2010 are $258,000 and $0, respectively.
Plan assets for the defined benefit plan consistconsisted principally of the following as of the March 31respective measurement date:dates:
| 2006 | 2005 | May 31, 2009 | March 31, 2008 | |||||||
Asset category | ||||||||||
Equity securities | 70% | 70% | 61 | % | 68 | % | ||||
Debt securities | 30% | 30% | 38 | % | 32 | % | ||||
Other | 1 | % | - | |||||||
Total | 100% | 100% | 100 | % | 100 | % | ||||
Equity securities include no employer stock. The investment policy and strategy for the defined benefit plan is as follows:is: (i) The plan’s objectives are long-term in nature andwith liquidity requirements that are anticipated to be minimal due to the projected normal retirement date of the average employee and the current average age of participants.participants; (ii) The plan’s objective is to earn nominal returns, net of investment fees, equal to or in excess of the actuarial assumptionassumptions of the plan.plan; and (iii) Theto include a strategic asset allocation includesof 60-80% equities, including international, and 20-40% fixed income investments.
Contributions Employer contributions of $1,429,000 are expected to be made to the defined benefit plan are expected to be approximately $2,000,000 during fiscal 2007.2010. The following estimated future benefits, which reflect expected future service, as appropriate, are expected to be paid:
| In thousands | |||
2007 | $ | 148 | |
2008 | 166 | ||
2009 | 229 | ||
2010 | 256 | ||
2011 | 315 | ||
2012-2016 | 3,001 | ||
| In thousands | |||
2010 | $ | 330 | |
2011 | 364 | ||
2012 | 429 | ||
2013 | 520 | ||
2014 | 581 | ||
2015-2019 | 4,687 | ||
Austrian commercialCommercial law requires the Companyus to pay severance and service benefits to employees.employees at our Austrian Pressure Cylinders location. Severance benefits must be paid to all employees hired before December 31, 2002. Employees hired after that date are covered under a governmental plan that requires the Companyus to pay benefits as a percentage of compensation (included in payroll tax withholdings). Service benefits are based on a percentage of compensation and years of service. The accrued liability for these unfunded plans was $5,361,000$6,539,000 and $5,017,000$6,879,000 at May 31, 20062009 and 2005,2008, respectively, and was included in ‘Other liabilities’.other liabilities on the consolidated balance sheets. Net periodic pension cost for these plans was $580,000, $570,000,$694,000, $587,000 and $550,000$588,000 for fiscal 2006, 20052009, fiscal 2008 and 2004,fiscal 2007, respectively. The assumed salary rate increase was 3.5 %3.5% for each of fiscal 2006, 2005,2009, fiscal 2008 and 2004.fiscal 2007, respectively. The discount rate at May 31, 2006, 20052009, 2008 and 20042007 was 4.70%6.20%, 5.61%6.00% and 5.25%4.80%, respectively. This discount rate is based on a published corporate bond rate with a term approximating the estimated benefit payment cash flows and is consistent with European and Austrian regulations.
Note F – Stock-Based Compensation
Under itsour employee stock optionand non-employee directors stock-based compensation plans, the Companywe may grant incentive or non-qualified stock options, restricted common shares and performance shares to employees, and non-qualified stock options and restricted common shares to non-employee directors. A total of 16,749,000 shares of Worthington common shares have been authorized for issuance in connection with the
stock-based compensation plans in place at May 31, 2009. The stock options may be granted to purchase common shares at not less than 100% of fair market value on the date of grant and non-qualified stock options at a price determined by the Compensation and Stock Option Committee. The Company also has a plan for non-employee directors. Under this plan, the Company makes annual grants of non-qualified stock options to purchase common shares at an exercise price equal to 100% of the fair market value of the underlying common shares on the date of grant. All outstanding stock options are non-qualified stock options. The exercise price of all stock options granted has been set at 100% of the fair market value of the underlying common shares on the date of grant. Generally, the stock options granted to employees vest and become exercisable at the rate of 20% per year beginning one year from the date of grant and expire ten years after the date of grant. The non-qualified stock options granted to non-employee directors vest and become exercisable on the first to occur of (a) the first anniversary of the date of grant and (b) as to any option granted as of the date of an annual meeting of shareholders of Worthington Industries, Inc., the date on which the next annual meeting of shareholders is held following the date of grant. In addition to the stock options previously discussed, we have awarded to certain employees, performance shares that are contingent (i.e., vest) upon achieving corporate targets for cumulative corporate economic value added, earnings per share growth and, in the case of business unit executives, business unit operating income targets for the three-year periods ending May 31, 2009, 2010 and 2011. These performance share awards will be paid, to the extent earned, in common shares of Worthington Industries, Inc. in the fiscal quarter following the end of the applicable three-year performance period. The restricted shares granted to non-employee directors are valued at the closing market price of common shares of Worthington Industries, Inc. on the date of the grant. The restricted shares vest under the same parameters applicable to non-employee director stock options discussed above.
Non-Qualified Stock Options
SFAS No. 123(R), Share-Based Payment (“SFAS No. 123(R)”) requires all share-based awards, including grants of stock options, be recorded as expense in the statement of earnings based on their fair values. In adopting SFAS No. 123(R), we selected the modified prospective transition method. This method requires that compensation expense be recorded prospectively over the remaining vesting period of the stock options on a straight-line basis using the fair value of the stock options on the date of grant.
We calculate the fair value of the stock options using the Black-Scholes option pricing model and certain assumptions. The computation of fair values for all stock options use the following assumptions: The expected volatility is based on the historical volatility of the common shares of Worthington Industries, Inc., and the risk-free interest rate is based on the United States Treasury strip rate for the expected term of the stock options. The expected term was developed using the historical exercise experience. The dividend yield is based on annualized current dividends and an average quoted price of Worthington common shares over the preceding annual period.
The table below sets forth the non-qualified stock options granted during each of the last three fiscal years ended May 31. For each grant, the option price was equal to the closing market price of the underlying common shares at each respective grant date. The fair values of these stock options were based on the Black-Scholes option-pricing model, calculated at the respective grant dates. The calculated pre-tax stock-based compensation expense for these stock options, which is after an estimate for forfeitures, will be recognized on a straight-line basis over the vesting period of the stock options.
| 2009 | 2008 | 2007 | |||||||
Granted (in thousands) | 606 | 1,849 | 799 | ||||||
Weighted average price, per share | $ | 18.75 | $ | 21.34 | $ | 18.15 | |||
Weighted average grant date fair value, per share | $ | 5.57 | $ | 6.24 | $ | 4.08 | |||
Pre-tax stock-based compensation (in thousands) | $ | 2,734 | $ | 9,346 | $ | 2,641 | |||
The weighted average fair value of stock options granted in fiscal 2009, fiscal 2008 and fiscal 2007 was based on the Black-Scholes option pricing model with the following weighted average assumptions:
| 2009 | 2008 | 2007 | |||||||
Assumptions used: | |||||||||
Dividend yield | 3.40 | % | 3.28 | % | 3.60 | % | |||
Expected volatility | 35.10 | % | 35.05 | % | 38.10 | % | |||
Risk-free interest rate | 3.50 | % | 3.96 | % | 5.00 | % | |||
Expected life (years) | 6.0 | 6.5 | 6.5 |
The following table summarizes the Company’stables summarize our activities in respect of stock option plansoptions for the years ended May 31:
| 2006 | 2005 | 2004 | 2009 | 2008 | 2007 | |||||||||||||||||||||||||||||||
| In thousands, except per share | Stock
Options | Weighted
Average
Price | Stock
Options | Weighted
Average
Price | Stock
Options | Weighted
Average
Price | Stock Options | Weighted Average Price | Stock Options | Weighted Average Price | Stock Options | Weighted Average Price | ||||||||||||||||||||||||
Outstanding, beginning of year | 5,803 | $ | 15.48 | 5,395 | $ | 13.86 | 5,942 | $ | 13.49 | 5,958 | $ | 17.84 | 5,241 | $ | 16.33 | 5,588 | $ | 16.09 | ||||||||||||||||||
Granted | 762 | 17.18 | 2,035 | 19.23 | 762 | 15.15 | 606 | 18.75 | 1,849 | 21.34 | 799 | 18.15 | ||||||||||||||||||||||||
Exercised | (773 | ) | 12.12 | (1,040 | ) | 13.12 | (795 | ) | 11.58 | (318 | ) | 13.55 | (840 | ) | 15.72 | (673 | ) | 14.87 | ||||||||||||||||||
Expired | (200 | ) | 14.46 | (16 | ) | 18.61 | (174 | ) | 20.09 | |||||||||||||||||||||||||||
Forfeited | (204 | ) | 18.16 | (587 | ) | 17.75 | (514 | ) | 14.80 | (296 | ) | 20.08 | (276 | ) | 18.99 | (299 | ) | 17.85 | ||||||||||||||||||
Outstanding, end of year | 5,588 | 16.09 | 5,803 | 15.48 | 5,395 | 13.86 | 5,750 | 18.16 | 5,958 | 17.84 | 5,241 | 16.33 | ||||||||||||||||||||||||
Exercisable at end of year | 2,702 | 14.33 | 2,581 | 13.41 | 3,200 | 14.18 | 3,185 | 16.83 | 2,714 | 15.37 | 2,680 | 14.81 | ||||||||||||||||||||||||
| Number of Stock Options (in thousands) | Weighted Average Remaining Contractual Life (in years) | Aggregate Intrinsic Value (in thousands) | |||||
May 31, 2009 | |||||||
Outstanding | 5,750 | 6.10 | $ | 12,663 | |||
Exercisable | 3,185 | 4.63 | 10,551 | ||||
May 31, 2008 | |||||||
Outstanding | 5,958 | 6.47 | 15,116 | ||||
Exercisable | 2,714 | 4.34 | 12,474 | ||||
May 31, 2007 | |||||||
Outstanding | 5,241 | 6.02 | 25,078 | ||||
Exercisable | 2,680 | 4.52 | 16,907 | ||||
During fiscal 2009, the total intrinsic value of stock options exercised was $1,424,000. The total amount of cash received from employees exercising stock options was $3,899,000 during fiscal 2009, and the related net tax benefit realized from the exercise of these stock options was $433,000 during the same period.
The following table summarizes information about non-vested stock option awards for stock options outstanding and exercisable atthe year ended May 31, 2006:2009:
| Outstanding | Exercisable | |||||||||||
| In thousands, except per share | Number | Weighted Average Exercise Price | Weighted Average Remaining Contractual Life | Number | Weighted Average Exercise Price | |||||||
Exercise prices between | ||||||||||||
$ 9.00 and $ 13.00 | 1,315 | $ | 11.32 | 3.8 | 1,315 | $ | 11.32 | |||||
$15.00 and $ 21.35 | 4,273 | 17.55 | 7.1 | 1,387 | 17.18 | |||||||
| Number of Stock Options (in thousands) | Weighted Average Grant Date Fair Value Per Share | |||||
Non-vested, beginning of year | 3,244 | $ | 5.44 | |||
Granted | 606 | 5.57 | ||||
Vested | (789 | ) | 5.51 | |||
Forfeited | (496 | ) | 4.74 | |||
Non-vested, end of year | 2,565 | $ | 5.59 | |||
Under APB No. 25,Restricted Common Shares
The table below sets forth the Company has not recognizedrestricted common shares we granted during each of the last three fiscal years ended May 31. The fair values of these restricted common shares were equal to the closing market prices of the underlying common shares at their respective grant dates. The calculated pre-tax stock-based compensation expense for these restricted common shares will be recognized on a straight-line basis over their respective vesting periods.
| 2009 | 2008 | 2007 | |||||||
Granted | 22,850 | 11,150 | 11,150 | ||||||
Weighted average grant date fair value, per share | $ | 15.95 | $ | 22.95 | $ | 17.30 | |||
Pre-tax stock-based compensation (in thousands) | $ | 364 | $ | 256 | $ | 193 | |||
The calculated pre-tax stock-based compensation expense of $5,767,000 ($3,777,000 after-tax) for fiscal 2009, $4,173,000 ($2,898,000 after-tax) for fiscal 2008 and $3,480,000 ($2,401,000 after-tax) for fiscal 2007 was recorded in selling, general and administrative expense. At May 31, 2009, the total unrecognized compensation cost related to options, as no options have been granted at a price belownon-vested awards was $10,371,000, which will be expensed over the fair market price on the date of grant. See “Note A – Summary of Significant Accounting Policies – Stock-Based Compensation” for pro forma disclosures required by SFAS No. 148.next five fiscal years.
Note G – Contingent Liabilities and Commitments
The Company is a defendantWe are defendants in certain legal actions. In the opinion of management, the outcome of these actions, which is not clearly determinable at the present time, would not significantly affect the Company’sour consolidated financial position or future results of operations. The Company believesWe believe that environmental issues will not have a material effect on our capital expenditures, consolidated financial position or future results of operations.
To secure access to a facility used to regenerate acid used in certain steel processingSteel Processing locations, the Company haswe have entered into unconditional purchase obligations with a third party under which three of the Company’s steel processingour Steel Processing facilities deliver their spent acid for processing annually through fiscal 2019. In addition, the Company iswe are required to pay for freight and utilities used in processing itsregenerating the spent acid. Total net payments to this third party were $4,948,000, $5,359,000 and $5,048,000 for fiscal 2009, fiscal 2008 and fiscal 2007, respectively. The aggregate amount of required future payments at May 31, 2006,2009, is as follows (in thousands):
2007 | $ | 2,367 | ||||
2008 | 2,367 | |||||
2009 | 2,367 | |||||
2010 | 2,367 | $ | 2,367 | |||
2011 | 2,367 | 2,367 | ||||
2012 | 2,367 | |||||
2013 | 2,367 | |||||
2014 | 2,367 | |||||
Thereafter | 18,936 | 11,835 | ||||
Total | $ | 30,771 | $ | 23,670 | ||
The CompanyWe may terminate the unconditional purchase obligations by assuming or otherwise repayingpurchasing this facility. At May 31, 2009, the cost of this purchase option was not expected to exceed certain debt of the supplier related to the facility, which was $12,805,000 at May 31, 2006.
At the closing of the sale of the Decatur facility on August 1, 2004, the unconditional purchase obligation associated with Decatur was eliminated. The estimated termination cost was recorded in first quarter of fiscal 2005. See “Note N – Impairment Charges and Restructuring Expense” for more information.approximately $6,780,000.
Note H –Segment– Segment Data
Several changes occurred during the second quarter of fiscal 2006 in the Company’s internal organizational and reporting structures, affecting the composition of the Company’s reportable segments. The Automotive Body Panels operating segment, consisting of The Gerstenslager Company, which was previously combined with Steel Processing in the Processed Steel Products segment, was moved to the “Other” category, and the Processed Steel Products segment was renamed Steel Processing. Dietrich Construction Group was formed and includes Dietrich Building Systems (previously included in the Metal Framing segment), Dietrich Residential Construction (was an unconsolidated joint venture and is now wholly-owned), and a research and development project in China. The “Other” category now includes the Automotive Body Panels, Construction Services and Steel Packaging operating
segments and also includes income and expense items not allocated to the reportable segments. Summarized financial information for the Company’s reportable segments is shown in the following table. All prior period financial information has been reclassified to reflect the segment changes mentioned above.
The Company’sOur operations include three reportable business segments: Steel Processing, Metal Framing and Pressure Cylinders. Factors used to identify these business segments include the products and services provided by each business segment as well as the management reporting structure used by the Company.used. A discussion of each business segment is outlined below.
Steel Processing: The Steel Processing business segment consists of the Worthington Steel business unit. Worthington Steel is an intermediate processor of flat-rolled steel and stainless steel. This business segment’s processing capabilities include pickling, slitting,pickling; slitting; cold reduction,reducing; hot-dipped galvanizing,galvanizing; hydrogen annealing, cutting-to-length,annealing; cutting-to-length; tension leveling, edging,leveling; edging; non-metallic coatings,coating, including dry lube,lubrication, acrylic and paint,paint; configured blankingblanking; and stamping. Worthington Steel sells to customers principally in the automotive, construction, lawn and garden, hardware, furniture, office equipment, electrical control, tubing, leisure and recreation, appliance, farm implements,agricultural, HVAC, container and aerospace markets. Worthington Steel also toll processes steel for steel mills, large end-users, service centers, and other processors. Toll processing is different from typical steel processing in that the mill, end-user, or other party retains title to the steel and has the responsibility for selling the end product.
Metal Framing: ThisThe Metal Framing business segment consists of the Dietrich Metal Framing business unit, which designs and produces metal framing components and systems and related accessories for the commercial and residential construction markets within the United States and Canada. Dietrich’s customers primarily consist of wholesale distributors, commercial and residential building contractors and mass merchandisers.
Pressure Cylinders: ThisThe Pressure Cylinders business segment consists of the Worthington Cylinders business unit. Worthington Cylinders produces a diversified line of pressure cylinders, including low-pressure liquefied petroleum gas (“LPG”) cylinders,and refrigerant gas cylinders andcylinders; high-pressure and industrial/specialty gas cylinders.cylinders; airbrake tanks; and certain consumer products. The LPG cylinders are used to hold fuel for gas barbecue grills, recreational vehicle equipment, residential and light commercial heating systems, industrial forklifts, hand held torches, propane-fueled camping equipment and commercial/residential cooking (the latter, generally outside North America). Refrigerant gas cylinders hold refrigerant gases for commercial, residential and residentialautomotive air conditioning and refrigeration systems and for automotive air conditioning systems. High-pressure and industrial/specialty
gas cylinders are containers for gases used in the following: cutting and welding metals; breathing (medical, diving and firefighting); semiconductor production; beverage delivery; and compressed natural gas systems. Worthington Cylinders also produces recovery tanks for refrigerant gases, air reservoirs for truck and trailer original equipment manufacturers and non-refillable cylinders for “Balloon Time®” helium kits.
Other: ThisIncluded in the Other category consists of operatingare business segments that do not fit into the reportable business segments, and are immaterial for purposes of separate disclosure, and other corporate related entities. The operatingThese business segments are: Automotive Body Panels, which consists of The Gerstenslager Company (“Gerstenslager”); Construction Services which consists of the Dietrich Construction Group companies; and Steel Packaging, which consistsPackaging. Each of Worthington Steelpac Systems, LLC (“Steelpac”).these business segments is explained in more detail below.
Automotive Body Panels: This operatingbusiness segment consists of the Gerstenslager business unit which provides services including stamping, blanking, assembly, painting, packaging, die management, warehousing, distribution management and other services to customers, primarily in the automotive industry.
Construction Services:This business segment consists of the Worthington Integrated Building Systems (“WIBS”) business unit which includes Worthington Mid-Rise Construction, Services includes businesses focusing on the constructionInc., which designs and supply of metal framing forbuilds mid-rise light-gauge steel framed commercial structures military housing, single and multi-family housing units; Worthington Military Construction, Inc., which is involved in the supply and international construction opportunitiesof metal framing products for, and in the framing of, single family housing, with a focus on China. Construction Services is made upmilitary; and Worthington Stairs, LLC, a manufacturer of Dietrich Building Systems, Dietrich Residential Construction and a research and development project in China.pre-engineered steel egress stair solutions.
Steel Packaging: This operatingbusiness segment consists of Worthington Steelpac Systems, LLC (“Steelpac”), which designs and manufactures reusable custom steel platforms, racks and pallets made of steel for supporting, protecting and handling products throughthroughout the entire shipping process servicing thefor customers in industries such as automotive, lawn and garden and recreational vehicle markets.vehicles.
The accounting policies of the operatingbusiness segments are described in “Note A – Summary of Significant Accounting Policies.” The Company evaluatesWe evaluate business segment performance based on operating income. Inter-segment sales are not material.
Summarized financial information for the Company’sour reportable business segments as of, and for the indicated years ended, May 31, is shown in the following table. The “Other” category includes corporate related items, results of immaterial operations, and income and expense not allocable to the reportable segments.
| In thousands | 2006 | 2005 | 2004 | 2009 | 2008 | 2007 | ||||||||||||||||||
Net sales | ||||||||||||||||||||||||
Steel Processing | $ | 1,486,165 | $ | 1,719,312 | $ | 1,265,276 | $ | 1,183,013 | $ | 1,463,202 | $ | 1,460,665 | ||||||||||||
Metal Framing | 796,272 | 843,866 | 651,601 | 661,024 | 788,788 | 771,406 | ||||||||||||||||||
Pressure Cylinders | 461,875 | 408,271 | 328,692 | 537,373 | 578,808 | 544,826 | ||||||||||||||||||
Other | 152,867 | 107,435 | 133,535 | 249,857 | 236,363 | 194,911 | ||||||||||||||||||
Total | $ | 2,897,179 | $ | 3,078,884 | $ | 2,379,104 | $ | 2,631,267 | $ | 3,067,161 | $ | 2,971,808 | ||||||||||||
Operating income | ||||||||||||||||||||||||
Operating income (loss) | ||||||||||||||||||||||||
Steel Processing | $ | 61,765 | $ | 127,090 | $ | 15,752 | $ | (68,149 | ) | $ | 55,799 | $ | 55,382 | |||||||||||
Metal Framing | 46,735 | 113,747 | 68,763 | (142,598 | ) | (16,215 | ) | (9,159 | ) | |||||||||||||||
Pressure Cylinders | 49,275 | 33,575 | 29,376 | 61,175 | 70,004 | 84,649 | ||||||||||||||||||
Other | (171 | ) | (7,062 | ) | (3,704 | ) | (25,724 | ) | (3,554 | ) | (1,727 | ) | ||||||||||||
Total | $ | 157,604 | $ | 267,350 | $ | 110,187 | $ | (175,296 | ) | $ | 106,034 | $ | 129,145 | |||||||||||
Depreciation and amortization | ||||||||||||||||||||||||
Steel Processing | $ | 25,944 | $ | 26,779 | $ | 25,662 | ||||||||||||||||||
Metal Framing | 15,683 | 16,907 | 16,628 | |||||||||||||||||||||
Pressure Cylinders | 10,680 | 10,454 | 9,858 | |||||||||||||||||||||
Other | 11,766 | 9,273 | 9,321 | |||||||||||||||||||||
Total | $ | 64,073 | $ | 63,413 | $ | 61,469 | ||||||||||||||||||
Pre-tax restructuring charges | ||||||||||||||||||||||||
Steel Processing | $ | 22,898 | $ | 21,914 | $ | 33,761 | $ | 3,917 | $ | 1,096 | $ | - | ||||||||||||
Metal Framing | 16,231 | 14,113 | 14,661 | 13,593 | 8,979 | - | ||||||||||||||||||
Pressure Cylinders | 10,853 | 10,929 | 8,749 | 1,045 | 103 | - | ||||||||||||||||||
Other | 9,134 | 10,918 | 10,131 | 24,486 | 7,933 | - | ||||||||||||||||||
Total | $ | 59,116 | $ | 57,874 | $ | 67,302 | $ | 43,041 | $ | 18,111 | $ | - | ||||||||||||
Total assets | ||||||||||||||||||||||||
Steel Processing | $ | 812,024 | $ | 781,049 | $ | 790,214 | $ | 469,701 | $ | 942,885 | $ | 815,070 | ||||||||||||
Metal Framing | 498,409 | 496,155 | 468,881 | 226,285 | 527,446 | 476,100 | ||||||||||||||||||
Pressure Cylinders | 277,300 | 268,862 | 168,496 | 355,717 | 437,159 | 357,696 | ||||||||||||||||||
Other | 312,664 | 283,939 | 215,548 | 312,126 | 80,541 | 165,316 | ||||||||||||||||||
Total | $ | 1,900,397 | $ | 1,830,005 | $ | 1,643,139 | $ | 1,363,829 | $ | 1,988,031 | $ | 1,814,182 | ||||||||||||
Capital expenditures | ||||||||||||||||||||||||
Steel Processing | $ | 14,303 | $ | 5,887 | $ | 4,622 | $ | 24,975 | $ | 7,157 | $ | 14,030 | ||||||||||||
Metal Framing | 19,700 | 20,549 | 9,962 | 4,467 | 6,770 | 15,657 | ||||||||||||||||||
Pressure Cylinders | 7,916 | 4,925 | 3,182 | 26,618 | 16,540 | 14,068 | ||||||||||||||||||
Other | 18,209 | 14,957 | 11,833 | 8,094 | 17,053 | 13,936 | ||||||||||||||||||
Total | $ | 60,128 | $ | 46,318 | $ | 29,599 | $ | 64,154 | $ | 47,520 | $ | 57,691 | ||||||||||||
Net sales by geographic region for the years ended May 31 are shown in the following table:
| In thousands | 2006 | 2005 | 2004 | 2009 | 2008 | 2007 | ||||||||||||||||||||||
United States | $ | 2,734,341 | $ | 2,935,879 | $ | 2,259,609 | $ | 2,395,430 | l | l | $ | 2,786,679 | l | l | $ | 2,719,240 | ||||||||||||
Canada | 24,760 | 22,906 | 24,680 | 66,467 | 74,623 | 60,340 | ||||||||||||||||||||||
Europe | 138,078 | 120,099 | 94,815 | 169,370 | 205,859 | 192,228 | ||||||||||||||||||||||
Total | $ | 2,897,179 | $ | 3,078,884 | $ | 2,379,104 | $ | 2,631,267 | $ | 3,067,161 | $ | 2,971,808 | ||||||||||||||||
Net fixed assets by geographic region for the years endedas of May 31 are shown in the following table:
| In thousands | 2006 | 2005 | 2004 | 2009 | 2008 | 2007 | ||||||||||||
United States | $ | 520,410 | $ | 526,756 | $ | 528,596 | $ | 472,078 | $ | 505,988 | $ | 528,181 | ||||||
Canada | 2,218 | 2,378 | 2,552 | 2,567 | 8,025 | 8,995 | ||||||||||||
Europe | 24,276 | 23,822 | 24,246 | 46,860 | 35,931 | 27,089 | ||||||||||||
Total | $ | 546,904 | $ | 552,956 | $ | 555,394 | $ | 521,505 | $ | 549,944 | $ | 564,265 | ||||||
Note I – Related Party Transactions
The Company purchasesWe purchase from, and sellssell to, affiliated companies certain raw materials and services at prevailing market prices. Net sales to affiliated companies for fiscal 2006,2009, fiscal 20052008 and fiscal 20042007 totaled $30,503,000, $27,674,000,$18,550,000, $25,962,000 and $18,960,000,$34,915,000, respectively. Purchases from affiliated companies for fiscal 2006,2009, fiscal 2005,2008 and fiscal 20042007 totaled $9,063,000, $13,652,000,$2,799,000, $10,680,000 and $9,669,000,$6,394,000, respectively. Accounts receivable from affiliated companies were $1,922,000$3,301,000 and $3,178,000$5,107,000 at May 31, 20062009 and 2005,2008, respectively. Accounts payable to affiliated companies were $1,674,000$155,000 and $1,520,000$136,000 at May 31, 20062009 and 2005,2008, respectively.
Note J – Investments in Unconsolidated Affiliates
The Company’sOur investments in affiliated companies, which are not controlled through majority ownership or otherwise, are accounted for using the equity method. At May 31, 2006,2009, these equity investments, and the percentage interest owned, consisted ofof: Worthington Armstrong Venture (“WAVE”) (50%), TWB Company, LLC (50%L.L.C. (45%), Worthington Specialty Processing Inc.(“WSP”) (51%), Serviacero Planos, S.A. de C.V. (50%), and LEFCO Worthington, LLC (49%). WSP is considered to be jointly controlled and not consolidated due to substantive participating rights of the minority partner.
During May 2009, we sold our 50% equity interest in Accelerated Building Technologies, LLC to NOVA Chemicals Corporation, the other member of the joint venture. The sales price and loss on the transaction were immaterial.
During January 2009, we sold our 60% equity interest in Aegis Metal Framing, LLC (60%)for approximately $24,000,000 to MiTek Industries, Inc., the other member of the joint venture. This resulted in a gain of $8,331,000.
During October 2008, we sold our 49% equity interest in Canessa Worthington Slovakia s.r.o. for approximately $3,700,000 to the Magnetto Group, the other member of the joint venture. The gain on the transaction was immaterial.
On October 1, 2008, we expanded and modified WSP, our joint venture with United States Steel Corporation (“U.S. Steel”). U.S. Steel contributed ProCoil Company, L.L.C., its steel processing facility in Canton, Michigan, and we contributed $2,500,000 of cash and Worthington Steel Taylor, our steel processing subsidiary in Taylor, Michigan, which had a book value of $13,851,000.
On June 2, 2008, we made an additional capital contribution of $392,000 to Viking & Worthington Steel Enterprise, LLC (“VWS”) (49%VWSE”). The other member in the joint venture did not make its contribution as required by the operating agreement. As a result, we now own 100% of VWSE, which has been fully consolidated in our financial statements since the beginning of fiscal 2009. VWSE has closed its manufacturing operations and its business is being handled by the consolidated operations of the Steel Processing business segment.
On April 25, 2006, the Worthington Steel sold its 50% equity interest in Acerex,March 1, 2008, our TWB joint venture acquired ThyssenKrupp Tailored Blanks S.A. de C.V., the Mexican laser welding subsidiary of ThyssenKrupp Steel North America, Inc. (“ThyssenKrupp”), to expand TWB’s
presence in Mexico. The acquisition was made through a joint venture operatingcontribution of capital by ThyssenKrupp, and as a steel processing facility in Monterrey, Mexico, to its partner Ternium, S.A. for $44,604,000 cash, resultingresult, ThyssenKrupp owns 55% of TWB, and Worthington owns 45%. This resulted in a dilution gain of pre-tax $26,609,000. As a result$1,944,000 (net of the sale, a foreign currency translation losstaxes of $5,875,000$1,031,000) and was reclassified from cumulative other comprehensive income.recorded as additional paid-in capital.
On October 25, 2007, we acquired a 49% interest in crate and pallet maker LEFCO Industries, LLC, a minority business enterprise. The resulting joint venture, called LEFCO Worthington, LLC, offers engineered wooden crates, specialty pallets and steel rack systems for a variety of industries.
On September 17, 2005, the Company2007, Worthington acquired the remaininga 50% interest in Serviacero Planos of Dietrich Residential Construction, LLC (“DRC”) from Pacific Steel Construction Inc. (“Pacific”) for $3,773,000 cashcentral Mexico. This joint venture is known as Serviacero Planos, S.A de C.V. The purchase price of the investment was $41,767,000. The investment exceeded the book value of the underlying equity in net assets by $22,258,000. Of this excess amount, $12,828,000 was allocated based on the fair value of those underlying net assets and debt assumption of $4,153,000. The results of DRC, which were previously reported aswill be amortized to equity in net income of an unconsolidated affiliate, have been included inaffiliates over the consolidated results sinceremaining useful lives of those assets, with the dateremainder of acquisition.$9,430,000 allocated to goodwill.
On June 27, 2003, Worthington Steel joined with Bainbridge Steel, LLC (“Bainbridge”), an affiliate of Viking Industries, LLC, a qualified minority business enterprise (“MBE”), to form VWS as a joint venture in which Worthington Steel has a 49% interest and Bainbridge has a 51% interest. VWS purchased substantially all of the assets of Valley City Steel, LLC in Valley City, Ohio, for approximately $5,700,000. Bainbridge manages the operations of the joint venture, and Worthington Steel provides assistance in operations, selling and marketing. The parties operate VWS as an MBE.
The CompanyWe received distributions from unconsolidated affiliates totaling $57,040,000$80,580,000, $58,920,000 and $28,520,000$131,723,000 in fiscal 20062009, fiscal 2008 and fiscal 2005,2007, respectively. During the fiscal year ended May 31, 2009, we received distributions from WAVE in excess of our investment balance, which created a negative balance in our investment account of $18,240,000 at May 31, 2009. The accounting treatment of excess distributions for a general partnership is to reclassify the negative balance to the liability section of the balance sheet, which was done during fiscal 2009. This liability is included in other liabilities on the consolidated balance sheet at May 31, 2009. We will continue to record equity in net income from WAVE as a debit to the investment account, and when it becomes positive, it will again be shown as an asset on the balance sheet. If it becomes obvious that any excess distribution may not be returned (upon joint venture liquidation or for other reasons), we will record any balance in the liability as immediate income or gain.
We use the “cumulative earnings” approach for determining cash flow presentation of distributions from our unconsolidated joint ventures. Distributions received on the investments are included in our consolidated statements of cash flows in operating activities, unless the cumulative distributions exceed our portion of cumulative equity in earnings of the joint venture, in which case the excess distributions are deemed to be returns of the investment and included in our consolidated statements of cash flows as an investing cash flow. During fiscal 2009, the Company received distributions from an unconsolidated joint venture in excess of the Company’s cumulative equity in the earnings of that joint venture. This cash flow of $23.5 million was included in investing activities in the consolidated statements of cash flows due to the nature of the distribution as a return of investment, rather than a return on investment. In fiscal year 2008, there were no distributions from unconsolidated joint ventures classified as investing cash flows.
FinancialCombined financial information for affiliated companies accounted for using the equity method as of, and for the years ended, May 31, was as follows:
| In thousands | 2006 | 2005 | 2004 | 2009 | 2008 | 2007 | ||||||||||||
Cash | $ | 93,877 | $ | 111,070 | $ | 76,613 | $ | 72,103 | $ | 79,538 | $ | 64,190 | ||||||
Other current assets | 163,718 | 204,238 | 170,231 | 165,615 | 225,469 | 154,797 | ||||||||||||
Noncurrent assets | 109,841 | 142,065 | 141,449 | 167,779 | 194,169 | 102,261 | ||||||||||||
Current maturities of long-term debt | 3,158 | 56,000 | 55,500 | |||||||||||||||
Other current liabilities | 81,176 | 99,894 | 88,250 | |||||||||||||||
Total assets | $ | 405,497 | $ | 499,176 | $ | 321,248 | ||||||||||||
Current liabilities | $ | 57,995 | $ | 124,258 | $ | 81,439 | ||||||||||||
Long-term debt | 37,813 | 33,362 | 32,687 | 150,596 | 101,411 | 124,214 | ||||||||||||
Other noncurrent liabilities | 6,049 | 3,061 | 3,040 | 24,373 | 34,394 | 7,228 | ||||||||||||
Equity | 172,533 | 239,113 | 108,367 | |||||||||||||||
Total liabilities and equity | $ | 405,497 | $ | 499,176 | $ | 321,248 | ||||||||||||
Net sales | 810,271 | 767,041 | 604,243 | $ | 719,635 | $ | 745,437 | $ | 652,178 | |||||||||
Gross margin | 188,109 | 163,947 | 133,218 | 175,832 | 206,927 | 183,603 | ||||||||||||
Depreciation and amortization | 18,479 | 20,234 | 19,369 | 14,044 | 13,056 | 14,164 | ||||||||||||
Interest expense | 3,346 | 3,421 | 2,804 | 3,708 | 7,575 | 3,701 | ||||||||||||
Income tax expense | 18,318 | 4,168 | 2,650 | 7,101 | 8,974 | 6,674 | ||||||||||||
Net earnings | 108,672 | 100,307 | 79,625 | 102,071 | 134,925 | 124,456 | ||||||||||||
The Company’sAt May 31, 2009, cumulative distributions from our unconsolidated affiliates, net of tax, exceeded our share of undistributedthe cumulative earnings of unconsolidatedfrom those affiliates was $44,294,000 at May 31, 2006.by $7,360,000. This is due to the excess distributions, noted above, from WAVE.
Note K – Earnings (Loss) Per Share
The following table sets forth the computation of basic and diluted earnings (loss) per share for the years ended May 31:
| In thousands, except per share | 2006 | 2005 | 2004 | ||||||
Numerator (basic & diluted): | |||||||||
Net earnings – income available to common shareholders | $ | 145,990 | $ | 179,412 | $ | 86,752 | |||
Denominator: | |||||||||
Denominator for basic earnings per share – weighted average shares | 88,288 | 87,646 | 86,312 | ||||||
Effect of dilutive securities – stock options | 688 | 857 | 638 | ||||||
Denominator for diluted earnings per share – adjusted weighted average shares | 88,976 | 88,503 | 86,950 | ||||||
Earnings per share – basic | $ | 1.65 | $ | 2.05 | $ | 1.01 | |||
Earnings per share – diluted | 1.64 | 2.03 | 1.00 | ||||||
| In thousands, except per share | 2009 | 2008 | 2007 | |||||||
Numerator (basic & diluted): | ||||||||||
Net earnings (loss) – income available to common shareholders | $ | (108,214 | ) | $ | 107,077 | $ | 113,905 | |||
Denominator: | ||||||||||
Denominator for basic earnings (loss) per share –weighted average common shares | 78,903 | 81,232 | 86,351 | |||||||
Effect of dilutive securities | - | 666 | 651 | |||||||
Denominator for diluted earnings per share –adjusted weighted average common shares | 78,903 | 81,898 | 87,002 | |||||||
Earnings (loss) per share – basic | $ | (1.37 | ) | $ | 1.32 | $ | 1.32 | |||
Earnings (loss) per share – diluted | (1.37 | ) | 1.31 | 1.31 | ||||||
Stock options covering 2,137,798, 2,319,218,5,979,781, 1,346,625 and 854,9351,818,813 common shares for fiscal 2006,2009, fiscal 20052008 and fiscal 20042007, respectively, have been excluded from the computation of diluted earnings per share because the effect would have been anti-dilutive for those periods.
Note L – Operating Leases
The Company leasesWe lease certain property and equipment from third parties under non-cancelable operating lease agreements. Rent expense under operating leases was $12,637,000$15,467,000 $14,188,000 and $13,926,000 in fiscal 2006, $10,328,000 in2009, fiscal 2005,
2008 and $6,221,000 in fiscal 2004.2007, respectively. Future minimum lease payments for non-cancelable operating leases having an initial or remaining term in excess of one year at May 31, 2006,2009, are as follows:
| In thousands | |||
2007 | $ | 10,881 | |
2008 | 10,960 | ||
2009 | 10,085 | ||
2010 | 9,069 | ||
2011 | 7,347 | ||
Thereafter | 19,985 | ||
Total | $ | 68,327 | |
The Company invested $16,400,000 in a new aircraft, which represented progress payments on an estimated purchase price of $19,300,000. This investment was recorded in assets held for sale as the aircraft will be sold and leased back during fiscal 2007.
| In thousands | |||
2010 | $ | 11,094 | |
2011 | 9,434 | ||
2012 | 7,773 | ||
2013 | 6,215 | ||
2014 | 4,265 | ||
Thereafter | 6,339 | ||
Total | $ | 45,120 | |
Note M – Sale of Accounts Receivable
The Company and certain of its subsidiariesWe maintain a $100,000,000 revolving trade accounts receivable securitization facility.facility which expires in January 2011. Transactions under the facility have been accounted for as a sale under the provisions of SFAS No. 140,Accounting for Transfers and Servicing of Financial Assets and Extinguishments of Liabilities. Pursuant to the terms of the facility, thesecertain of our subsidiaries sell their accounts receivable without recourse, on a revolving basis, to Worthington Receivables Corporation (“WRC”), a wholly-owned, consolidated, bankruptcy-remote subsidiary. In turn, WRC may sell without recourse, on a revolving basis, up to $100,000,000 of undivided ownership interests in this pool of accounts receivable to independent third parties. The Company retainsa multi-sell, asset-backed commercial paper conduit (the “Conduit”). Purchases by the Conduit are financed with the sale of A1/P1 commercial paper. We retain an undivided interest in this pool and isare subject to risk of loss based on the collectibilitycollectability of the receivables from this retained interest. Because the amount eligible to be sold excludes receivables more than 90 days past due, receivables offset by an allowance for doubtful accounts because of bankruptcy or other cause, receivables from foreign customers, concentrations over limits with specific customers and certain reserve amounts, the Company believeswe believe additional risk of loss is minimal. Facility fees of $103,000, $887,000,$2,628,000, $341,000 and $1,641,000$580,000 were incurred during fiscal 2006,2009, fiscal 20052008 and fiscal 2004,2007, respectively, and were recorded as miscellaneous expense. The book value of the retained portion of the pool of accounts receivable approximates fair value. The Company continues to service the accounts receivable. No servicing asset or liability has been recognized, as the Company’s costWe continue to service the accounts receivable is expectedsold to approximate the servicing income.WRC.
As of May 31, 2006,2009, the pool of eligible accounts receivable was $92,400,000, and 2005, no$60,000,000 of undivided interestownership interests in this pool of accounts receivable had been sold. If sold, theThe proceeds from the sale would beare reflected as a reduction of accounts receivable on the consolidated balance sheets and asin net cash provided by operating cash flowsactivities in the consolidated statements of cash flows.
Note N – Impairment ChargesRestructuring
In the first quarter of fiscal 2008, we announced the initiation of a Transformation Plan (the “Plan”) with the overall goal to increase the Company’s sustainable earnings potential, asset utilization and Restructuring Expenseoperational performance. The Plan is being implemented over a three-year period and focuses on cost reduction, margin expansion and organizational capability improvements, and in the process seeks to drive excellence in three core competencies: sales, operations and supply chain management. The Plan is comprehensive in scope and includes aggressive diagnostic and implementation phases in the Steel Processing and Metal Framing business segments.
Effective August 1, 2004,We retained a consulting firm to assist in the development and implementation of the Plan. The services provided by this firm include diagnostic tools, performance improvement technologies, project management
techniques, benchmarking information and insights that directly relate to the Plan. Accordingly, the fees of the consulting firm have been included in restructuring charges. The services began at the onset of the Plan and have concluded as of May 31, 2009. Internal transformation teams have been formed and are now dedicated to the Plan efforts.
To date, the following actions have been taken:
On September 25, 2007, we announced the closure or downsizing of five locations in our Metal Framing business segment. These actions were completed as of May 31, 2008.
We reduced headcount company-wide through a combination of voluntary retirement and severance packages.
On October 23, 2008, we announced the closure of two facilities, one Steel Processing (Louisville, Kentucky) and one Metal Framing (Renton, Washington), and headcount reductions of 282. The Louisville facility closed on February 28, 2009, and the Renton facility closed on December 31, 2008.
During the first quarter of fiscal 2009, the Metal Framing corporate offices were moved from Pittsburgh and Blairsville, Pennsylvania to Columbus, Ohio.
On December 5, 2008, we announced the closure and suspension of operations at three Metal Framing facilities and headcount reductions in Steel Processing of 186 and in Metal Framing of 125. The Lunenburg, Massachusetts facility closed on February 28, 2009, and operations were suspended in Miami, Florida and Phoenix, Arizona on February 28, 2009.
The positive results of these efforts, however, have been over-shadowed by the negative impact of the recessionary business conditions. The continuing focus of the Plan is to sustain the benefits already attained, to identify and implement additional initiatives, and to position the Company closedto improve profitability over historic levels as demand recovers in end-markets.
In connection with the salePlan, a total of its Decatur, Alabama, steel-processing facility$61,152,000 has been recorded to date as restructuring charges in the consolidated statements of earnings: $43,041,000 was incurred in fiscal 2009, and its cold-rolling assets to Nucor Corporation (“Nucor”)$18,111,000 was incurred during fiscal 2008. Restructuring charges for $80,392,000 cash. The sale excluded the slittingfiscal 2009 are summarized as follows:
| In thousands | 5/31/2008 Liability | Expense | Payments | Adjustments | 5/31/2009 Liability | |||||||||||
Early retirement and severance | $ | 1,143 | $ | 8,242 | $ | (6,265 | ) | $ | 81 | $ | 3,201 | |||||
Professional Fees and Other costs | 1,710 | �� | 25,874 | (26,585 | ) | - | 999 | |||||||||
| $ | 2,853 | 34,116 | $ | (32,850 | ) | $ | 81 | $ | 4,200 | |||||||
Non-cash charges | 8,925 | |||||||||||||||
Total | $ | 43,041 | ||||||||||||||
Non-cash charges represent asset impairment charges and cut-to-length assets and net working capitalaccelerated depreciation expense associated with this facility. The Company remains in a portionstrategic decisions made as part of the Decatur facility under a long-term leasePlan. Cash expenditures of $32,850,000 associated with Nucor and continuesimplementing the Plan were paid during fiscal 2009, with the remainder of 2009 cash restructuring charges to serve customers requiring steel processing services in the Company’s core business of slitting and cutting-to-length. As a result of a sale agreement entered into on May 26, 2004, the Company recorded a $67,400,000 pre-tax charge during its fourth quarter ended May 31, 2004. The charge included $66,642,000 for the impairment of assets at the Decatur facility and $758,000 for severance and employee related costs. The severance and employee related costs were due to the elimination of 40 administrative, production and other employee positions. The after-tax impact of this charge was $41,788,000 or $0.48 per diluted share. An additional pre-tax charge of $5,608,000, mainly relating to contract termination costs, was recognizedbe paid during the first quarter of fiscal 2005. As2010. Certain cash payments associated with lease terminations, however, may be paid over the remaining lease terms. An estimated $6,000,000 million of May 31, 2005, 35 employees were terminated, andadditional restructuring charges are expected to be incurred in fiscal 2010, the Company paid severance and other employee related costsmajority of $471,000.
Alsowhich will be incurred during the fourthfirst quarter ended Mayending August 31, 2004,2009. These expected remaining costs will not include a significant amount of professional fees, as responsibility for executing the Company took an impairment charge of $1,998,000 on certain of its European LPG assets. The after-tax impact of this charge was $1,239,000 or $0.01 per diluted share. The CompanyPlan has had success in the European high-pressure and refrigerant cylinder product lines, but thebeen successfully transitioned to our internal transformation teams.
LPG market was challenged by overcapacity and declining demand. The impairment was recorded as a write-down of original cost to fair market value with future depreciation expense to be based on this value.
Note O – Goodwill and Other IntangiblesLong-Lived Assets
The Company adopted SFAS No. 141,Business Combinations, and SFAS No. 142,Goodwill and Other Intangible Assets, effective June 2001. SFAS No. 141 requires theWe use of the purchase method of accounting for any business combinations initiated after June 30, 2002, and further clarifies the criteria to recognize amortizable intangible assets separately from goodwill. Under SFAS No. 142,Goodwill and Other Intangible Assets, goodwill and indefinite-lived intangible assets are no longer amortized but are reviewed for impairment. The annual impairment test wasis performed during the fourth quartersquarter of each fiscal 2006 and fiscal 2005, andyear. We have no goodwill was written off as a result. The Company has no intangiblesintangible assets with indefinite lives other than goodwill.
We review the carrying value of our long-lived assets, including intangible assets with finite useful lives, whenever events or changes in circumstances indicate that the carrying value of an asset or a group of assets may not be recoverable. When a potential impairment is indicated, accounting standards require a charge to be recognized in the financial statements if the carrying amount of an asset or group of assets exceeds the fair value of that asset or group of assets. The loss recognized would be the difference between the fair value and the carrying amount of the asset or group of assets.
Due to continued deterioration in business and market conditions during fiscal 2009, we determined that certain indicators of impairment were present, as defined by SFAS No. 144,Accounting for the Impairment or Disposal of Long-Lived Assets.Therefore, long-lived assets, including intangible assets with finite useful lives, were subsequently tested for impairment during the fourth quarter of fiscal 2009. Recoverability of the identified asset groups was tested using future cash flow projections based on management’s long range estimates of market conditions. The sum of the undiscounted future cash flows related to each asset group was more than the net book value for each of the asset groups; therefore, no impairment loss was indicated at May 31, 2009.
We test our goodwill balances for impairment annually, during the fourth quarter, and more frequently if events or changes in circumstances indicate that goodwill may be impaired. We test goodwill at the business segment level as we have determined that the characteristics of the reporting units within each business segment are similar and allow for their aggregation to the business segment level for testing purposes. The test consists of determining the fair value of the business segments, using discounted cash flows, and comparing the result to the carrying values of the business segments. If the estimated fair value of a business segment exceeds its carrying value, there is no impairment. If the carrying amount of the business segment exceeds its estimated fair value, an impairment of the goodwill is indicated. The amount of the impairment is determined by establishing the fair value of all assets and liabilities of the business segment, excluding the goodwill, and comparing the total to the estimated fair value of the business segment. The difference represents the fair value of the goodwill and if it is lower than the book value of the goodwill, the difference is recorded as a loss in the consolidated statements of earnings.
Due to industry changes, weakness in the construction market and the depressed results in the Metal Framing business segment over the last year, we have tested this business segment for impairment on a quarterly basis. Given the significant decline in the economy during fiscal 2009 and its impact on the construction market, we revised the forecasted cash flows and discount rate assumptions used in our previous valuations of this business segment. The forecasted cash flows were revised downward due to the significant decline in, and the future uncertainty of, the economy. The discount rate, based on our current cost of debt and equity capital, was changed due to the increased risk in our forecast. After reviewing the revised valuation and the fair value estimates of the remaining assets, it was determined that the value of the business no longer supported its $96,943,000 goodwill balance. As a result, the full amount was written-off in the second quarter ended November 30, 2008.
Subsequent to the second quarter write-off noted above, and as of February 28, 2009, the total goodwill balance was $98,293,000. Of this amount, $73,643,000 related to the Pressure Cylinders business segment and $24,650,000 related to the Construction Services business segment, $17,950,000 of which resulted from the June 2008 acquisition of substantially all of the assets of The Sharon Companies Ltd. (See “Note Q –
Acquisitions”). During the quarter ended February 28, 2009, we tested the value of the goodwill balances in the Construction Services business segment as weakness in the construction market continued. For the test, we assumed the revenue trend rate would range from down 1.1% to up 7.5% as we expect a recovery in the latter years of the forecast due to pent-up demand and future growth in the market share of our Construction Services business segment. We set the discount rate at 12%, up from the 10% used in the fiscal 2008 annual testing but lower than the 14% used for the Metal Framing business segment test in the second quarter of fiscal 2009. We believe this was appropriate due to increased uncertainty in the market place since the end of fiscal 2008, and the cash flows for the Construction Services business segment being more predictable than those of the Metal Framing business segment. Based on this test, there was no indication of impairment. We also performed the same test using a 14% discount rate, which also indicated no impairment.
During the fourth quarter of fiscal 2009, the Company completed its annual test of goodwill. No additional impairments were identified during the Company’s annual assessment of goodwill. Future declines in the market and deterioration in earnings could lead to additional impairment of goodwill and other long-lived assets.
Goodwill by business segment is summarized as follows at May 31:
| In thousands | 2006 | 2005 | 2009 | 2008 | ||||||||
Metal Framing | $ | 97,010 | $ | 95,361 | $ | - | $ | 97,316 | ||||
Pressure Cylinders | 74,357 | 72,906 | 76,692 | 79,507 | ||||||||
Other | 6,404 | - | 24,651 | 6,700 | ||||||||
Total | $ | 177,771 | $ | 168,267 | $ | 101,343 | $ | 183,523 | ||||
The changedecrease in Metal Framing goodwill isfor the Pressure Cylinders business segment was due primarily to foreign currency impacts. The increase in goodwill for the Other category was due to the acquisition of the minority interest in Dietrich Metal Framing Canada, Inc. (“DMFC”). The change in Pressure Cylinders goodwill is due to foreign currency translation adjustments. The change in Other goodwill is due to the acquisitionsubstantially all of the minority interest in DRC.assets of The Sharon Companies Ltd., as noted above.
Other amortizableAmortizable intangible assets are summarized as follows at May 31:
| 2006 | 2005 | 2009 | 2008 | |||||||||||||||||||||
| In thousands | Cost | Accumulated
Amortization | Cost | Accumulated
Amortization | Cost | Accumulated Amortization | Cost | Accumulated Amortization | ||||||||||||||||
Patents and trademarks | $ | 10,618 | $ | 4,126 | $ | 10,191 | $ | 3,296 | $ | 14,119 | $ | 7,655 | $ | 11,364 | $ | 6,217 | ||||||||
Customer relationships | 7,238 | 3,211 | 7,200 | 1,693 | 19,981 | 5,845 | 12,258 | 4,534 | ||||||||||||||||
Non-compete agreement | 1,900 | 1,286 | 1,520 | 681 | ||||||||||||||||||||
Other | 2,970 | 542 | - | - | ||||||||||||||||||||
Total | $ | 17,856 | $ | 7,337 | $ | 17,391 | $ | 4,989 | $ | 38,970 | $ | 15,328 | $ | 25,142 | $ | 11,432 | ||||||||
The increase in amortizable intangible assets was due to the acquisition of substantially all of the assets of The Sharon Companies Ltd. on June 2, 2008 (See “Note Q – Acquisitions”). Amortization expense was $2,348,000, $2,465,000,$3,896,000, $2,258,000 and $757,000$1,991,000 for fiscal 2006,2009, fiscal 20052008 and fiscal 2004.2007, respectively. These intangible assets are amortized on the straight-line method over their estimated useful lifeslives, which range from 2 to 1520 years.
Estimated amortization expense for these intangiblesintangible assets for the next five fiscal years is as follows:
| In thousands | |||
2007 | $ | 1,154 | |
2008 | 1,154 | ||
2009 | 1,154 | ||
2010 | 1,154 | ||
2011 | 1,136 | ||
2010 2011 2012 2013 2014In thousands $ 3,681 2,749 2,397 1,989 1,905
Note P – Guarantees and Warranties
The Company does not have guarantees that it believes are reasonably likely to have a material current or future effect on our financial condition, changes in financial condition, revenue or expenses, results of operations, liquidity, capital expenditures or capital resources. However, as of May 31, 2009, the Company was party to operating leases for aircraft in which the Company has guaranteed residual values at the termination of the leases. The maximum obligation under these terms was approximately $17,938,000 million at May 31, 2009. Based on current facts and circumstances, the Company has estimated the likelihood of payment pursuant to these guarantees, and determined that the fair value of the obligations based on those likely outcomes is not material.
The Company also had in place $8,260,000 of outstanding stand-by letters of credit as of May 31, 2009. These letters of credit were issued to third party service providers and had no amounts drawn against them at May 31, 2009. Fair value of theses guarantee instruments, based on premiums paid, was not material at May 31, 2009.
We have established reserves for anticipated sales returns and allowances, including limited warranties on certain products. The liability for sales returns and allowances is primarily based on historical experience and current information. The liability amounts related to warranties were immaterial at May 31, 20062009 and 2005.2008.
Note Q – Acquisitions
On November 30, 2005, the Company acquired the remaining 40% interest in DMF Canada from the minority shareholder, Encore Coils Holdings Ltd., for $3,003,000 cash. The acquisition was recorded using the purchase accounting method, and 100% of the results of DMF Canada, which were previously reduced by the minority interest, have been included in the consolidated results of the Metal Framing segment since the date of acquisition. The excess of the purchase price over the historical book value of $1,649,000 was allocated to goodwill. On November 5, 2004, the Company had formed a 60%-owned consolidated Canadian metal framing joint venture with Encore, operating under the name Dietrich Metal Framing Canada, Inc. At the time the Company contributed an aggregate of $1,700,000 to the joint venture.
On October 17, 2005, the Company acquired the remaining 50% interest in DRC from its partner, Pacific, for $3,773,000 cash and debt assumption of $4,153,000. The acquisition was recorded using the purchase accounting method, and the results of DRC, which were previously reported as equity in net income of an unconsolidated affiliate, have been included in the consolidated results of the “Other” category since the date of acquisition. The excess of the purchase price over the historical book value of $6,404,000 was allocated to goodwill.
Pro forma results, including the acquired businesses above since the beginning of the earliest period presented, would not be materially different than actual results.
On October 13, 2004, the Company purchased for $1,125,000 the 49% interest of the minority partner in the joint venture that operates a pressure cylinder manufacturing facility in Hustopece, Czech Republic. The purchase price was allocated to goodwill.
On September 17, 2004, the CompanyJune 2, 2008, Worthington purchased substantially all of the net assets of the propane and specialty gas cylinder business of Western Industries, Inc.The Sharon Companies Ltd. (“Western Cylinder Assets”Sharon Stairs”). This business operates in Wisconsin for $37,150,000. Sharon Stairs, now referred to as Worthington Stairs, LLC, designs and manufactures 14.1 oz.steel egress stair systems for the commercial construction market, and 16.4 oz. disposable cylinders for products suchoperates one manufacturing facility in Akron, Ohio. It operates as hand torches, propane-fueled camping equipment, portable heaters and tabletop grills. The Western Cylinder Assets were purchased for $65,119,000 in cash and were included in the Company’s Pressure Cylinders segment as of September 17, 2004. Pro forma results, including the acquired business since the beginningpart of the earliest period presented, would not be materially different than actual results.
WIBS business segment. The purchase price was allocated to the acquired assets and assumed liabilities based on their estimated fair values at the date of acquisition. Goodwill is defined asacquisition, with goodwill representing the excess of the purchase price over the fair value allocated to the net assets. The purchase price allocated to intangible assets will be amortized over a weighted average life of 13 years.
The allocation was as follows:
| In thousands | |||
Current assets | $ | 8,520 | |
Intangible assets | 12,440 | ||
Property, plant and equipment, net | 2,500 | ||
Total assets | 23,460 | ||
Current liabilities | 3,841 | ||
Other liabilities | 19 | ||
Long-term debt | 400 | ||
Identifiable net assets | 19,200 | ||
Goodwill | 17,950 | ||
Total purchase price | $ | 37,150 | |
Cash flows used to determine the purchase price included strategic and synergistic benefits (investment value) specific to us, which resulted in a purchase price in excess of the fair value of identifiable assets. Since the fair values assigned to the acquired assets could only assume strategies and synergies of market participants, that additional investment value specific to us was included in goodwill. The purchase price included fair values of other assets that were not identifiable, not separately recognizable per accounting rules (e.g. assembled workforce), or of immaterial value. The purchase price also included a going-concern element that represents our ability to earn a higher rate of return on a group of assets than would be expected on the separate assets as determined during the valuation process. Goodwill of $17,950,000 related to the Sharon Stairs asset purchase is expected to be deductible for income tax purposes.
On July 31, 2008, our Steelpac subsidiary purchased the assets of Laser Products (“Laser”) for $3,425,000. Laser is a steel rack fabricator primarily serving the auto industry. The purchase price was allocated to working capital, fixed assets and the customer list. The purchase price allocated to the customer list will be amortized over ten years.
On August 16, 2006, we purchased 100% of the capital stock of PSM for $31,727,000, net of cash acquired. PSM is a specialty stainless steel processor located in Los Angeles, California and is included in our Steel Processing business segment. The purchase price is subject to change due to targeted earn-outs of up to $8,500,000 through August 2009. The purchase price was allocated to the acquired assets and assumed liabilities based on their estimated fair values at the date of acquisition and included the accrual of $4,784,000 of the earn-out as it was deemed to be probable of payment and the fair value of the identifiable net assets exceeded the purchase price. In fiscal 2009 and fiscal 2008, adjustments to the future expected earn-out amounts were made based on actual earned amounts and related payments. The purchase price allocation was updated accordingly for these changes in the expected future earn-out.
The final allocation was as follows:
| In thousands | |||
Current assets | $ | 8,376 | |
Goodwill | 48,789 | ||
Intangibles | 7,200 | ||
Property, plant and equipment | 5,866 | ||
Total assets | 70,231 | ||
Other current liabilities | 5,112 | ||
Total liabilities | 5,112 | ||
Net cash paid | $ | 65,119 | |
| In thousands | ||||
Current assets | $ | 15,732 | ||
Intangible assets | 5,965 | |||
Property, plant and equipment, net | 17,671 | |||
Total assets | 39,368 | |||
Current liabilities | 3,968 | |||
Identifiable net assets | 35,400 | |||
Earnout liability | 1,100 | |||
Total purchase price | 34,300 | |||
Less: cash acquired | (2,573 | ) | ||
Purchase price, net of cash | $ | 31,727 | ||
AllThe purchase price allocated to intangible assets will be amortized over a weighted average life of 9 years.
Operating results of the goodwill amount willabove-mentioned businesses acquired have been included in the consolidated statements of earnings from the respective acquisition dates forward. Pro forma results, including the acquired businesses described above since the beginning of fiscal 2009, would not be materially different than actual results.
Note R – Business Interruption
On January 5, 2008, Severstal North America, Inc. (“Severstal”) experienced a furnace outage. Severstal is a primary steel supplier to, and a minority partner in, our Spartan Steel Coating, LLC joint venture (“Spartan”). Severstal is also a steel supplier to some of our other Steel Processing locations and to our Pressure Cylinders business segment. Business interruption losses were incurred in the form of lost sales and added costs for material, freight, scrap and other items. The additional expenses incurred for material costs, freight and scrap in excess of our deductible, for tax purposes. Intangibles include relationships, contracts, and customer lists that are being amortized generally over 2 -15 years.have been offset by proceeds from our insurance company. Net proceeds of $5,749,000 from final settlement of the insurance claim were recorded in cost of goods sold during the third quarter ended February 28, 2009 to offset the reduced profit from lost sales at Spartan. Miscellaneous expense was increased $2,760,000, as our partner’s portion of the net proceeds was eliminated from our consolidated earnings.
Note RS – Fair Value
Effective June 1, 2008, we adopted SFAS No. 157,Fair Value Measurements (“SFAS No. 157”). SFAS No. 157 establishes a framework for measuring fair value and expands disclosures about fair value measurements. SFAS No. 157 was effective for our financial assets and liabilities after May 31, 2008, and is effective for our non-financial assets and liabilities after May 31, 2009. Adoption of SFAS No. 157 for our financial assets and liabilities did not have a material impact on our consolidated financial statements. Adopting SFAS No. 157 for our non-financial assets and liabilities is not expected to materially impact our consolidated financial statements.
SFAS No. 157 clarifies that fair value is an exit price, representing the amount that would be received to sell an asset or paid to transfer a liability in an orderly transaction between market participants. Fair value should be determined based on assumptions that market participants would use in pricing an asset or liability. SFAS No. 157 uses a three-tier hierarchy that classifies assets and liabilities based on the inputs used in the valuation methodologies. In accordance with SFAS No. 157, we measured our derivative instruments at fair value. We classified these as level 2 assets and liabilities for purposes of SFAS No. 157 as they are based upon models utilizing market observable inputs and credit risk.
At May 31, 2009, our financial assets and liabilities measured at fair value on a recurring basis were as follows:
| In thousands | Quoted Prices in Active Markets (Level 1) | Significant Other Observable Inputs (Level 2) | Significant Unobservable Inputs (Level 3) | Totals | ||||||||
Assets | ||||||||||||
Foreign currency derivative instruments | $ | - | $ | 1,135 | $ | - | $ | 1,135 | ||||
Liabilities | ||||||||||||
Foreign currency derivative instruments | $ | - | $ | 769 | $ | - | $ | 769 | ||||
Interest rate derivative instruments | - | 7,899 | - | 7,899 | ||||||||
Total liabilities | $ | - | $ | 8,668 | $ | - | $ | 8,668 | ||||
Refer to “Note T – Derivative Instruments and Hedging Activities” for additional information regarding the consolidated balance sheets location and the risk classification of the Company’s derivative instruments.
NOTE T – Derivative Instruments and Hedging Activities
Interest Rate Risk – We entered into an interest rate swap in October 2004, which was amended December 17, 2004. The swap had a notional amount of $100,000,000 to hedge changes in cash flows attributable to changes in the LIBOR rate associated with the December 17, 2004 issuance of the unsecured Floating Rate Senior Notes due December 17, 2014. See “Note C – Debt.” We pay a fixed rate of 4.46% and receive a variable rate based on six-month LIBOR. The interest rate derivative is classified as a cash flow hedge per SFAS 133. The effective portion of the change in the fair value of the derivative is recorded in other comprehensive income and is reclassified to interest expense in the period in which earnings are impacted by the hedged items or in the period that the transaction no longer qualifies as a cash flow hedge.
Foreign Currency Risk – The translation of foreign currencies into United States dollars subjects the Company to exposure related to fluctuating exchange rates. Derivative instruments are not used to manage this risk; however, the Company does make use of forward contracts to manage exposure to certain inter-company loans with our foreign affiliates. Such contracts limit exposure to both favorable and unfavorable currency fluctuations. At May 31, 2009, the difference between the contract and book value was not material to the Company’s consolidated financial position, results of operations or cash flows. The changes in the fair value of the derivative instruments are recorded either in the consolidated balance sheets under foreign currency translation or in net earnings in the same period in which foreign currency translation or net earnings are impacted by the hedged items.
Commodity Price Risk – The Company attempts to negotiate the best prices for commodities and to competitively price products and services to reflect the fluctuations in market prices. Derivative instruments are used to manage a portion of our exposure to fluctuations in the cost of steel, natural gas, zinc and other raw materials and utility requirements. These instruments cover periods commensurate with known or expected exposures, and no such instruments were in place at May 31, 2009. No derivatives instruments are held for trading purposes. The effective portion of the changes in the fair value of cash flow derivatives are recorded in other comprehensive income and reclassified to cost of goods sold in the period in which earnings are impacted by the hedged items or in the period that the transaction no longer qualifies as a cash flow hedge. For derivative instruments that do not qualify for hedge accounting under SFAS 133, changes in fair value are recorded in cost of goods sold.
Refer to “Note A – Summary of Significant Accounting Policies” and “Note S – Fair Value” for additional information regarding the accounting treatment and Company policy for derivative instruments, as well as how fair value is determined for the Company’s derivative instruments. The fair value of derivative instruments at May 31, 2009 is summarized in the following table:
| (in thousands) | Balance Sheet Location | Fair Value | Balance Sheet Location | Fair Value | ||||||
Derivative instruments designated as hedging instruments under SFAS 133: | ||||||||||
Interest rate contracts | Receivables | $ | - | Accounts payable | $ | 1,134 | ||||
| Other assets | - | Other liabilities | 6,765 | |||||||
Totals | - | 7,899 | ||||||||
Derivative instruments not designated as hedging instruments under SFAS 133: | ||||||||||
Foreign exchange contracts | Receivables | 1,135 | Accounts payable | - | ||||||
| Other assets | - | Other accrued items | 769 | |||||||
Totals | 1,135 | 769 | ||||||||
Total Derivative Instruments | $ | 1,135 | $ | 8,668 | ||||||
The effect of derivative instruments on the consolidated statement of earnings is summarized in the following tables:
| (in thousands) | Gain (Loss) Recognized in OCI (Effective Portion) | Location of Gain (Loss) Reclassified from Accumulated OCI (Effective Portion) | Gain (Loss) Reclassified from Accumulated OCI (Effective Portion) | Location of Gain (Loss) (Ineffective Portion) Excluded from Effectiveness Testing | Gain (Loss) (Ineffective Portion) Excluded from Effectiveness Testing | ||||||||||
For the fiscal year ended May 31, 2009: | |||||||||||||||
Interest rate contracts | $ | (7,997 | ) | Interest expense | $ | (1,627 | ) | Interest expense | $ | - | |||||
Commodity contracts | (847 | ) | Cost of goods sold | 2,306 | Cost of goods sold | - | |||||||||
Totals | $ | (8,844 | ) | $ | 679 | $ | - | ||||||||
Derivative instruments not designated as hedging instruments under SFAS 133:
| Gain (Loss) Recognized in Earnings | ||||||
| (in thousands) | Location of Gain (Loss) Recognized in Earnings | Fiscal Year Ended May 31, 2009 | ||||
Commodity contracts | Cost of goods sold | $ | (1,433 | ) | ||
Foreign exchange contracts | Miscellaneous expense | 5,570 | ||||
Totals | $ | 4,137 | ||||
The gain (loss) on these derivative instruments significantly offset the gain (loss) on the hedged items.
Note U – Quarterly Results of Operations (Unaudited)
The following is a summary of the unaudited quarterly consolidated results of operations for fiscal 20062009 and 2005:fiscal 2008:
| In thousands, except per share | Three Months Ended | Three Months Ended | ||||||||||||||||||||||||
Fiscal 2006 | August 31 | November 30 | February 28 | May 31 | ||||||||||||||||||||||
| Fiscal 2009 | August 31 | November 30 | February 28 | May 31 | ||||||||||||||||||||||
Net sales | $ | 913,222 | $ | 745,350 | $ | 501,125 | $ | 471,570 | ||||||||||||||||||
Gross margin | 151,902 | (54,419 | ) | 39,921 | 37,330 | |||||||||||||||||||||
Net earnings (loss) | 68,624 | (164,654 | ) | 1,554 | (13,738 | ) | ||||||||||||||||||||
Earnings (loss) per share - basic | $ | 0.87 | $ | (2.09 | ) | $ | 0.02 | $ | (0.17 | ) | ||||||||||||||||
Earnings (loss) per share - diluted | 0.86 | (2.09 | ) | 0.02 | (0.17 | ) | ||||||||||||||||||||
| Fiscal 2008 | August 31 | November 30 | February 29 | May 31 | ||||||||||||||||||||||
Net sales | $ | 694,147 | $ | 699,516 | $ | 681,548 | $ | 821,968 | $ | 758,955 | $ | 713,664 | $ | 725,667 | $ | 868,875 | ||||||||||
Gross margin | 75,352 | 103,408 | 78,902 | 113,972 | 78,785 | 70,010 | 75,727 | 131,225 | ||||||||||||||||||
Net earnings | 28,407 | 39,028 | 19,157 | 59,398 | 20,168 | 14,740 | 18,302 | 53,867 | ||||||||||||||||||
Earnings per share - basic | $ | 0.32 | $ | 0.44 | $ | 0.22 | $ | 0.67 | $ | 0.24 | $ | 0.18 | $ | 0.23 | $ | 0.68 | ||||||||||
Earnings per share - diluted | 0.32 | 0.44 | 0.21 | 0.67 | 0.24 | 0.18 | 0.23 | 0.68 | ||||||||||||||||||
Fiscal 2005 | August 31 | November 30 | February 28 | May 31 | ||||||||||||||||||||||
Net sales | $ | 769,340 | $ | 745,168 | $ | 747,414 | $ | 816,962 | ||||||||||||||||||
Gross margin | 159,644 | 124,518 | 109,152 | 105,559 | ||||||||||||||||||||||
Net earnings | 57,859 | 47,623 | 33,122 | 40,808 | ||||||||||||||||||||||
Earnings per share - basic | $ | 0.66 | $ | 0.54 | $ | 0.38 | $ | 0.46 | ||||||||||||||||||
Earnings per share - diluted | 0.66 | 0.54 | 0.37 | 0.46 | ||||||||||||||||||||||
The sum of the quarterly earnings (loss) per share data presented in the table may not equal the annual results due to rounding and the impact of dilutive securities on the annual versus the quarterly earnings (loss) per share calculations.
Results for the fourth quarter of fiscal 2009 (ended May 31, 2009) were negatively impacted by $6,044,000 of restructuring expense.The restructuring expense primarily related to previously announced plant closures in the Metal Framing business segment and professional fees in the Other category. During the fourth quarter of fiscal 2009, results were also negatively impacted by an inventory write-down adjustment totaling $6,278,000. The inventory adjustment was necessitated by continued decline in demand and steel pricing within the Steel Processing business segment. The combined negative impact of these items was $0.15 per diluted share.
Results for the third quarter of fiscal 2009 (ended February 28, 2009) were negatively impacted by $16,309,000 of restructuring expense, or $0.10 per diluted share. The restructuring expense primarily related to previously announced plant closures in the Metal Framing business segment and professional fees in the Other category.
Results for the second quarter of fiscal 2009 (ended November 30, 2008) were negatively impacted by $11,936,000 of restructuring expense, or $0.10 per diluted share. The restructuring expense primarily related to previously announced plant closures in the Metal Framing business segment and professional fees in the Other category. During the second quarter of fiscal 2009, results were also negatively impacted by an inventory write-down adjustment totaling $98,021,000, or $0.86 per diluted share. The inventory adjustment was necessitated by the speed and severity of the decline in demand and steel pricing within the Steel Processing and Metal Framing business segments. Additionally, results for the second quarter of fiscal 2009 were negatively impacted by $96,943,000 of goodwill balance write-off, or $1.07 per diluted share. The goodwill balance write-off was the result of a revised valuation and the fair value estimates of the remaining assets of the Metal Framing business segment, where it was determined that the value of the business no longer supported the goodwill balance.
Results for the first quarter of fiscal 2006 ended2009 (ended August 31, 2005,2008), were positivelynegatively impacted by a $5,251,000 reduction in taxes,$8,752,000 of restructuring expense or $0.06$0.08 per diluted share,share. The restructuring expense primarily related to the modification of corporate tax lawspreviously announced plant closures in the stateMetal Framing business segment and professional fees in the Other category.
Results for the fourth quarter of Ohio enacted June 30, 2005.fiscal 2008 (ended May 31, 2008), were negatively impacted by $4,894,000 of restructuring expense or $0.04 per diluted share.The restructuring expense primarily related to previously announced plant closures in the Metal Framing business segment and professional fees in the Other category. To maintain consistency in the treatment of these professional fees, certain professional fees totaling $3,300,000 reported in the previous three quarters of fiscal 2008 in selling, general and administrative expense were reclassified to restructuring charges in those quarters.
Results for the third quarter of fiscal 2008 (ended February 29, 2008), were negatively impacted by $4,179,000 of restructuring expense or $0.03 per diluted share. The restructuring expense primarily related to previously announced plant closures in the Metal Framing business segment and professional fees in the Other category.
Results for the second quarter of fiscal 2006 ended2008 (ended November 30, 2005,2007), were positivelynegatively impacted by a $5,300,000 reduction in insurance reserves,$4,602,000 of restructuring expense or $0.04 per diluted share. These reserves are supported by a third party actuarial analysis of loss history. DueThe restructuring expense primarily related to facility consolidations, focus on and investment in safety initiatives, and an emphasis on property loss prevention and product quality, loss history had improved significantly. This improvement was reflectedpreviously announced plant closures in the actuarial analysis of loss historyMetal Framing business segment and resulted in this favorable reduction to reserves.
Results for the third quarter of fiscal 2006 ended February 28, 2006, included three corrections related to prior periods, which negatively impacted net earnings and diluted earnings per share by $3,200,000, and $0.04, respectively. A description of the issues and the impact of the corrections are as follows:
Under-accrual of income taxes over the last five years at the Acerex, S.A. de C.V. (“Acerex”) joint venture in Mexico resulted in a $6,062,000 decrease in equity in net income of unconsolidated affiliates.
Under-accrual of consulting expenses during the previous five quarters resulted in a $3,985,000 increase to selling, general and administrative (“SG&A”) expense.
Over-accrualprofessional fees in the consolidated income tax provision over the last nine years relating to the foreign earnings of our Worthington Armstrong Venture (“WAVE”) joint venture resulted in a $3,200,000 reduction to income tax expense.Other category.
The net impact of these corrections was not material to earnings for any previously reported fiscal year or to the trend of earnings.
Results for the fourth quarter of fiscal 2006 ended May 31, 2006, were positively impacted by a $26,604,000 pre-tax gain, or $0.14 per diluted share, from the sale of a 50% interest in a Mexican steel processing joint venture.
Results for the first quarter of fiscal 2005 ended2008 (ended August 31, 2004,2007), were reducednegatively impacted by $4,436,000 of restructuring expense or $0.04 per diluted share. The restructuring expense primarily related to previously announced plant closures in the Metal Framing business segment and professional fees in the Other category.
Note V – Subsequent Events
On June 12, 2009, we redeemed $118.5 million of the then $138.0 million outstanding 6.7% Notes due December 1, 2009 (“Notes”). The consideration paid for the Notes was $1,025 per $1,000 principal amount of Notes, plus accrued and unpaid interest. The repurchase was funded by a $5,608,000 pre-tax charge relatedcombination of cash on hand and borrowings under existing credit facilities in an effort to the sale of the Decatur, Alabama, cold mill and related assets. This charge was mainly due to contract termination costs that could not be accrued until the sale closed, which occurred on August 1, 2004, and other adjustments to the charge recorded at May 31, 2004. The impact of this charge was a reduction in net earnings of $3,538,000 ($0.04 per diluted share).
Results for the second quarter of fiscal 2005 ended November 30, 2004, were increased by $1,735,000 ($0.01 per diluted share) due to a reduction in estimated tax liabilities from favorable tax audit settlements and related developments.
Results for the third quarter of fiscal 2005 ended February 28, 2005, were reduced by $4,290,000 ($0.05 per diluted share) due to a one-time state tax adjustment recorded in that quarter. In January 2005, the Sixth Circuit Court of Appeals held the state of Ohio’s investment tax credit program unconstitutional.
Note S – Subsequent Event (Unaudited)
On July 20, 2006, the Company announced that it had formed a 50:50 joint venture with NOVA Chemicals Corporation that is intended to develop and manufacture durable, energy-saving composite construction products and systems.reduce interest expense.
SCHEDULE II – VALUATION AND QUALIFYING ACCOUNTS
WORTHINGTON INDUSTRIES, INC. AND SUBSIDIARIES
|
|
| ||||||||
|
| |||||||||
Year Ended May 31, 2006:
| ||||||||||
Deducted from asset accounts: Allowance for possible losses on trade accounts receivable | $11,225,000 | $(4,685,000) | $193,000(A) | $1,769,000(B) | $4,964,000 | |||||
Year Ended May 31, 2005:
| ||||||||||
Deducted from asset accounts: Allowance for possible losses on trade accounts receivable | $6,870,000 | $5,583,000 | $104,000(A) | $1,332,000(B) | $11,225,000 | |||||
Year Ended May 31, 2004:
| ||||||||||
Deducted from asset accounts: Allowance for possible losses on trade accounts receivable | $5,267,000 | $2,491,000 | $108,000(A) | $997,000(B) | $6,870,000 | |||||
| COL. A. | COL. B. | COL. C. | COL. D. | COL. E. | ||||||||||||||||||
| Description | Balance at Beginning of Period | Additions | Deductions – Describe | Balance at End of Period | ||||||||||||||||||
| Charged to Costs and Expenses | Charged to Other Accounts – Describe | |||||||||||||||||||||
Year Ended May 31, 2009:
Deducted from asset accounts: Allowance for possible losses on trade accounts receivable | $4,849,000 | 8,472,000 | 217,000 (A) | 1,068,000 (B) | $12,470,000 | |||||||||||||||||
Year Ended May 31, 2008:
Deducted from asset accounts: Allowance for possible losses on trade accounts receivable | $3,641,000 | 1,496,000 | 127,000 (A) | 415,000 (B) | $4,849,000 | |||||||||||||||||
Year Ended May 31, 2007:
Deducted from asset accounts: Allowance for possible losses on trade accounts receivable | $4,964,000 | 399,000 | 1,000 (A) | 1,723,000 (B) | $3,641,000 | |||||||||||||||||
Note A – Miscellaneous amounts.
Note B – UncollectibleUncollectable accounts charged to the allowance.allowance
See accompanying Report of Independent Registered Public Accounting Firm
Item 9. –— Changes in and Disagreements withWith Accountants on Accounting and Financial Disclosure
Not applicable.
Item 9A. –— Controls and Procedures
Evaluation of Disclosure Controls and Procedures
We maintain disclosure controls and procedures (as[as defined in Rules 13a-15(e) and 15d-15(e) under the Securities Exchange Act of 1934, as amended (the “Exchange Act”))] that are designed to provide reasonable assurance that information required to be disclosed in the reports that we file or submit under the Exchange Act is recorded, processed, summarized and reported within the time periods specified in the Securities and Exchange Commission’s rules and forms, and that such information is accumulated and communicated to our management, including our principal executive officer and our principal financial officer, as appropriate, to allow timely decisions regarding required disclosure.
Because of inherent limitations, disclosure controls and procedures, no matter how well designed and operated, can only provide reasonable, and not absolute, assurance that the objectives of disclosure controls and procedures are met.
Management, with the participation of our principal executive officer and our principal financial officer, performed an evaluation of the effectiveness of our disclosure controls and procedures as of the end of the fiscal year covered by this Annual Report on Form 10-K.10-K (the fiscal year ended May 31, 2009). Based on that evaluation, our principal executive officer and our principal financial officer have concluded that such disclosure controls and procedures were effective at a reasonable assurance level as of the end of the fiscal year covered by this Annual Report on Form 10-K10-K.
Changes in Internal Control Over Financial Reporting
There were no changes in our internal control over financial reporting that occurred in the last fiscal quarter (the fiscal quarter ended May 31, 2009) that have materially affected, or are reasonably likely to ensure that material information relating to Worthington Industries, Inc. andmaterially affect, our consolidated subsidiaries is made known to them, particularly during the period for which periodic reports of Worthington Industries, Inc., including this Annual Report on Form 10-K, are being prepared.internal control over financial reporting.
Annual Report of Management on Internal Control Over Financial Reporting
Management is responsible for establishing and maintaining adequate internal control over financial reporting to provide reasonable assurance regarding the reliability of our financial reporting and the preparation of financial statements for external purposes in accordance with accounting principles generally accepted in the United States. Internal control over financial reporting includes those policies and procedures that (i) pertain to the maintenance of records that, in reasonable detail, accurately and fairly reflect the transactions and dispositions of the assets of Worthington Industries, Inc. and our consolidated subsidiaries; (ii) provide reasonable assurance that transactions are recorded as necessary to permit preparation of financial statements in accordance with accounting principles generally accepted in the United States, and that receipts and expenditures of Worthington Industries, Inc. and our consolidated subsidiaries are being made only in accordance with authorizations of management and directors of Worthington Industries, Inc. and our consolidated subsidiaries, as appropriate; and (iii) provide reasonable assurance regarding prevention or timely detection of unauthorized acquisition, use or disposition of the assets of Worthington Industries, Inc. and our consolidated subsidiaries that could have a material effect on the financial statements.
Management, with the participation of our principal executive officer and our principal financial officer, assessedevaluated the effectiveness of our internal control over financial reporting as of May 31, 2006,2009, the end of our fiscal year. Management based its assessment on criteria established inInternal Control-IntegratedControl – Integrated Framework issued by the Committee of Sponsoring Organizations of the Treadway Commission. Management’s assessment included evaluation of such elements as the design and operating effectiveness of key financial reporting controls, process documentation, accounting policies and our overall control environment. This assessment is supported by testing and monitoring performed under the direction of management.
Because of its inherent limitations, internal control over financial reporting may not prevent or detect misstatements. Also, projections of any evaluationsevaluation of effectiveness to future periods are subject to the risk that controls may become inadequate because of changes in conditions, or that the degree of compliance with the
policies or procedures may deteriorate. Accordingly, even an effective system of internal control over financial reporting will provide only reasonable assurance with respect to financial statement preparation.
During fiscal 2006, we acquired the remaining 50% interest in Dietrich Residential Construction, LLC (“DRC”) and the remaining 40% interest in Dietrich Metal Framing Canada, Inc. (“DMFC”), from the minority shareholders. As permitted by the Securities and Exchange Commission, management excluded DRC and DMFC from management’s assessment of internal control over financial reporting as of May 31, 2006. Combined, these businesses constituted approximately 0.6% of consolidated net assets as of May 31, 2006, and 1.5% of consolidated net sales for the fiscal year ended May 31, 2006. DRC and DMFC will be included in management’s assessment of internal control over financial reporting for Worthington Industries, Inc. and its consolidated subsidiaries as of May 31, 2007.
Based on the assessment of our internal control over financial reporting, management has concluded that our internal control over financial reporting was effective at a reasonable assurance level as of May 31, 2006, to provide reasonable assurance regarding the reliability of financial reporting and the preparation of financial statements for external reporting purposes in accordance with accounting principles generally accepted in the United States. We reviewed the2009. The results of management’s assessment were reviewed with the Audit Committee of the Board of Directors of Worthington Industries, Inc.
Additionally, our independent registered public accounting firm, KPMG LLP, independently assessed the effectiveness of our internal control over financial reporting and issued the accompanying Attestation Report of Independent Registered Public Accounting Firm.
Report of Independent Registered Public Accounting Firm
The Board of Directors and Shareholders
Worthington Industries, Inc.:
We have audited management’s assessment, included in the accompanying Annual Report of Management on Internal Control over Financial Reporting, that Worthington Industries, Inc. and subsidiaries maintained effective’s internal control over financial reporting as of May 31, 2006,2009, based on criteria established in Internal Control—Control – Integrated Framework issued by the Committee of Sponsoring Organizations of the Treadway Commission (COSO). Worthington Industries, Inc. and subsidiaries’’s management is responsible for maintaining effective internal control over financial reporting and for its assessment of the effectiveness of internal control over financial reporting.reporting, included in the accompanying Annual Report of Management on Internal Control Over Financial Reporting. Our responsibility is to express an opinion on management’s assessment and an opinion on the effectiveness of the Company’s internal control over financial reporting based on our audit.
We conducted our audit in accordance with the standards of the Public Company Accounting Oversight Board (United States). Those standards require that we plan and perform the audit to obtain reasonable assurance about whether effective internal control over financial reporting was maintained in all material respects. Our audit included obtaining an understanding of internal control over financial reporting, evaluating management’s assessment,assessing the risk that a material weakness exists, and testing and evaluating the design and operating effectiveness of internal control andbased on the assessed risk. Our audit also included performing such other procedures as we considered necessary in the circumstances. We believe that our audit provides a reasonable basis for our opinion.
A company’s internal control over financial reporting is a process designed to provide reasonable assurance regarding the reliability of financial reporting and the preparation of financial statements for external purposes in accordance with generally accepted accounting principles. A company’s internal control over financial reporting includes those policies and procedures that (1) pertain to the maintenance of records that, in reasonable detail, accurately and fairly reflect the transactions and dispositions of the assets of the company; (2) provide reasonable assurance that transactions are recorded as necessary to permit preparation of financial statements in accordance with generally accepted accounting principles, and that receipts and expenditures of the company are being made only in accordance with authorizations of management and directors of the company; and (3) provide reasonable assurance regarding prevention or timely detection of unauthorized acquisition, use, or disposition of the company’s assets that could have a material effect on the financial statements.
Because of its inherent limitations, internal control over financial reporting may not prevent or detect misstatements. Also, projections of any evaluation of effectiveness to future periods are subject to the risk that controls may become inadequate because of changes in conditions, or that the degree of compliance with the policies or procedures may deteriorate.
In our opinion, management’s assessment that Worthington Industries, Inc. and subsidiaries maintained effective internal control over financial reporting as of May 31, 2006, is fairly stated, in all material respects, based on criteria established in Internal Control—Integrated Framework issued by the Committee of Sponsoring Organizations of the Treadway Commission (COSO). Also, in our opinion, Worthington Industries, Inc. and subsidiaries maintained, in all material respects, effective internal control over financial reporting as of May 31, 2006,2009, based on criteria established inInternal Control—Control – Integrated Framework issued by the Committee of Sponsoring Organizations of the Treadway Commission (COSO).
Worthington Industries, Inc. and subsidiaries acquired the remaining 50% interest in Dietrich Residential Construction, LLC (“DRC”) and the remaining 40% interest in Dietrich Metal Framing Canada, Inc. (“DMFC”) during fiscal 2006. Management excluded from its assessment of the effectiveness of Worthington Industries, Inc. and subsidiaries’ internal control over financial reporting as of May 31, 2006, DRC’s and DMFC’s internal control over financial reporting. Combined, these businesses constituted approximately 0.6% of consolidated net assets as of May 31, 2006, and 1.5% of consolidated net sales for the year then ended. Our audit of internal control over financial reporting of Worthington Industries, Inc. and subsidiaries also excluded an evaluation of the internal control over financial reporting of DRC and DMFC.Commission.
We also have audited, in accordance with the standards of the Public Company Accounting Oversight Board (United States), the consolidated balance sheets of Worthington Industries, Inc. and subsidiaries as of May 31, 20062009 and 2005,2008, and the related consolidated statements of earnings, shareholders’ equity, and cash flows for each of the years in the three-year period ended May 31, 2006,2009, and our report dated August 11, 2006July 30, 2009 expressed an unqualified opinion on those consolidated financial statements.
/s/ KPMG LLP |
Columbus, Ohio
August 11, 2006
Changes in Internal Control Over Financial Reporting
There were no changes, except for the continued implementation of the new enterprise resource planning (“ERP”) system mentioned below, which occurred during our fourth fiscal quarter of the period covered by this Annual Report of Form 10-K (the fiscal quarter ended May 31, 2006), in our internal control over financial reporting (as defined in Rule 13a-15(f) under the Securities Exchange Act of 1934) that have materially affected, or are reasonably likely to materially affect, our internal control over financial reporting.
We are in the process of implementing a new software-based ERP system throughout much of Worthington Industries, Inc. and our consolidated subsidiaries. Implementing a new system results in changes to business processes and related controls. We believe that we are adequately controlling the transition to the new processes and controls and that there will be no negative impact to our internal control environment. In fact, one of the expected benefits of the fully implemented ERP system is an enhancement of our internal control over financial reporting.July 30, 2009
There is nothing to be reported under this Item 9B.
PART III
Item 10. — Directors, Executive Officers and Corporate Governance
Directors, Executive Officers and Persons Nominated or Chosen to Become Directors or Executive Officers
The Compensation and Stock Option Committeeinformation required by Item 401 of SEC Regulation S-K concerning the Board of Directorsdirectors of Worthington Industries, Inc. (the “Compensation Committee”(“Worthington Industries” or the “Registrant”) has implemented a long-term incentive program in which executive officers and other key employeesthe nominees for re-election as directors of Worthington Industries Inc. and its subsidiaries (collectively, the “Company”) participate, which anticipates consideration of long-term performance awards based upon achieving measurable financial criteria over a multiple-year period. Under this program, performance awards have been granted under the Worthington Industries, Inc. 1997 Long-Term Incentive Plan (the “1997 LTIP”) with payouts based upon achieving performance levels over a three-year period. For corporate executives and employees, payouts of performance awards are generally tied to achieving specific levels (threshold, target and maximum) of corporate economic value added and earnings per share for the performance period with each performance measure carrying a 50% weighting. For business unit executives and employees, corporate economic value added and earnings per share measures
together carry a 50% weighting and an operating income measure for the appropriate business unit is weighted 50%. If the performance level falls between “threshold” and “target” or between “target” and “maximum”, the award is prorated. Under the 1997 LTIP, the level of payouts, if any, is determined by the Compensation Committee after financial results for the applicable performance period are available and are generally paid within three months following the end of the applicable performance period. Cash performance awards may be paid in cash, in common shares of Worthington Industries, Inc., or other property or any combination thereof, at the sole discretion of the Compensation Committee at the time of payment. Performance share awards will be paid in common shares of Worthington Industries, Inc.
Grants and payouts of long-term incentive awards under the 1997 LTIP have been shown in the Proxy Statements of Worthington Industries, Inc. under the heading “EXECUTIVE COMPENSATION.” Information on cash performance awards and performance share awards granted to named executive officers of Worthington Industries, Inc. on May 19, 2006 and payout of performance awards granted under the 1997 LTIP for the three-year period ended May 31, 2006 will be shown under the headings “EXECUTIVE COMPENSATION – Long-Term Incentive Plan Awards” and “EXECUTIVE COMPENSATION – Summary of Cash and Other Compensation,” respectively, in the Proxy Statement of Worthington Industries, Inc. for the Annual Meeting of Shareholders to be held on September 27, 200630, 2009 (the “2006“2009 Annual Meeting”) is incorporated herein by reference from the disclosure to be included under the caption “PROPOSAL 1: ELECTION OF DIRECTORS” in Worthington Industries’ definitive Proxy Statement relating to the 2009 Annual Meeting (“Worthington Industries’ Definitive 2009 Proxy Statement”). In addition, Worthington Industries, Inc. reported, which will be filed pursuant to SEC Regulation 14A not later than 120 days after the cash performance awards and performance share awards granted on May 19, 2006 to the named executive officersend of Worthington Industries, Inc., in the Current Report on Form 8-K dated and filed May 25, 2006 (SEC File No. 1-8399)Industries’ fiscal 2009 (the “May 25, 2006 Form 8-K”).
The relevant portions of the 2006 Proxy Statement are incorporated by reference into “Item 11. – Executive Compensation” of this Annual Report on Form 10-K. The 1997 LTIP is filed as Exhibit 10(e) of the Annual Report on Form 10-K filed by Worthington Industries, Inc., a Delaware corporation, for the fiscal year ended May 31, 1997 (SEC File No. 0-4016) and incorporated by reference as Exhibit 10.7 of this Annual Report on Form 10-K and the form of letter evidencing performance award granted under the 1997 LTIP with targets for the three-year period ending May 31, 2009, is filed as Exhibit 10.24 of this Annual Report on Form 10-K.
Item 10. – Directors and Executive Officers of the Registrant
In accordance with General Instruction G(3) of Form 10-K, theThe information regarding directors required by Item 401 of SEC Regulation S-K concerning the executive officers of Worthington Industries is incorporated herein by reference from material which will bethe disclosure included under the heading “PROPOSAL 1: ELECTION OF DIRECTORS” incaption “Supplemental Item – Executive Officers of the 2006 Proxy Statement. The information regarding executive officers required by Item 401 of SEC Regulation S-K is includedRegistrant” in Part I of this Annual Report on Form 10-K under the heading “Supplemental Item. - Executive Officers10-K.
Compliance with Section 16(a) of the Registrant.” Exchange Act
The information required by Item 405 of SEC Regulation S-K is incorporated herein by reference from material which willthe disclosure to be included under the heading “SECTIONcaption “SECURITY OWNERSHIP OF CERTAIN BENEFICIAL OWNERS AND MANAGEMENT – Section 16(a) BENEFICIAL OWNERSHIP REPORTING COMPLIANCE”Beneficial Ownership Reporting Compliance” in the 2006Worthington Industries’ Definitive 2009 Proxy Statement.
Procedures by which Shareholders may Recommend Nominees to Worthington Industries’ Board of Directors
Information concerning the Registrant’s Audit Committee and the determinationprocedures by the Registrant’swhich shareholders of Worthington Industries may recommend nominees to Worthington Industries’ Board of Directors that at least one member of the Audit Committee qualifies as an “audit committee financial expert”, as that term is defined in Item 401(h)(2) of SEC Regulation S-K, is incorporated herein by reference from the information which willdisclosure to be included under the headings “PROPOSAL 1: ELECTION OF DIRECTORS – Committees of the Board – Committees of the Board” and “PROPOSAL 1: ELECTION OF DIRECTORS – Committees of the Board – Audit Committee” in the 2006 Proxy Statement. Information concerning the nomination process for director candidates is incorporated herein by reference from the information which will be included under the headingscaptions “PROPOSAL 1: ELECTION OF DIRECTORS – Committees of the Board – Nominating and Governance Committee” and “CORPORATE GOVERNANCE – Nominating Procedures” in Worthington Industries’ Definitive 2009 Proxy Statement. These procedures have not materially changed from those described in Worthington Industries’ Definitive Proxy Statement for the 2008 Annual Meeting of Shareholders held on September 24, 2008.
Audit Committee
The information required by Items 407(d)(4) and 407(d)(5) of SEC Regulation S-K is incorporated herein by reference from the disclosure to be included under the caption “PROPOSAL 1: ELECTION OF DIRECTORS – Nominating Procedures”Committees of the Board – Audit Committee” in the 2006Worthington Industries’ Definitive 2009 Proxy Statement.
The Registrant’sCode of Conduct; Committee Charters; Corporate Governance Guidelines; Charter of Lead Independent Director
Worthington Industries’ Board of Directors has adopted Charters for each of the Audit Committee, the Compensation and Stock Option Committee, the Executive Committee and the Nominating and Governance Committee as well as Corporate Governance Guidelines as contemplated by the applicable sections of the New York Stock Exchange Listed Company Manual. Worthington Industries’ Board of Directors has also adopted a Charter of the Lead Independent Director of Worthington Industries’ Board of Directors.
In accordance with the requirements of Section 303A.10 of the New York Stock Exchange Listed Company Manual, the Board of Directors of the RegistrantWorthington Industries has adopted a Business Code of Conduct covering the directors, officers and employees of the Registrant,Worthington Industries and its subsidiaries, including the Registrant’sWorthington Industries’ Chairman of the Board and Chief Executive Officer (the principal executive officer), the Registrant’sWorthington Industries’ Vice President and Chief Financial Officer (the principal financial officer) and the Registrant’sWorthington Industries’ Controller (the principal accounting officer). The Registrant will disclose the following events, if they occur, in a current report on Form 8-K to be filed with the “Corporate Governance” page of the “Investor Relations” section of the Registrant’s web site located at www.worthingtonindustries.comSEC within the time periodrequired four business days following their occurrence as required byoccurrence: (A) the applicable rules of the SECdate and the requirements of Section 303A.10 of the New York Stock Exchange Listed Company Manual: (A) the nature of any amendment to a provision of the Registrant’s BusinessWorthington Industries’ Code of Conduct that (i) applies to the Registrant’sWorthington Industries’ principal executive officer, principal financial officer, principal accounting officer or controller, or persons performing similar functions, (ii) relates to any element of the “code of ethics” definition enumerated in Item 406(b) of SEC Regulation S-K, and (iii) is not a technical, administrative or other non-substantive amendment; and (B) a description of any waiver (including the nature of the waiver, the name of the person to whom the waiver was granted and the date of the waiver), including an implicit waiver, from a provision of the Business Code of Conduct granted to the Registrant’sWorthington Industries’ principal executive officer, principal financial officer, principal accounting officer or controller, or persons performing similar functions, that relates to one or more of the itemselements of the “code of ethics” definition set forth in Item 406(b) of SEC Regulation S-K. In addition, Worthington Industries will disclose any waivers from the provisions of the Code of Conduct granted to a director or executive officer of Worthington Industries in a current report on Form 8-K to be filed with the SEC within the required four business days following their occurrence.
The text of each of the Charter of the Audit Committee, the Charter of the Compensation and Stock Option Committee, the Charter of the Executive Committee, the Charter of the Nominating and Governance Committee, the Charter of the Lead Independent Director, the Corporate Governance Guidelines and the Business Code of Conduct is posted on the “Corporate Governance” page of the “Investor Relations” section of the Registrant’sWorthington Industries’ web site located at www.worthingtonindustries.com. Interested persons and shareholders of Worthington Industries may also obtain copies of each of these documents, without charge, by writing to the Investor Relations Department of the RegistrantWorthington Industries at Worthington Industries, Inc., 200 Old Wilson Bridge Road, Columbus, Ohio 43085, Attention: AllisonCatherine M. Sanders.Lyttle. In addition, a copy of the Business Code of Conduct was filed as Exhibit 14 to the Registrant’s AnnualQuarterly Report on Form 10-K10-Q for the fiscal yearquarterly period ended May 31, 2004.February 28, 2009.
Item 11. –— Executive Compensation
In accordance with General Instruction G(3) of Form 10-K, theThe information required by this Item 11402 of SEC Regulation S-K is incorporated herein by reference from the material which willdisclosure to be included in the 2006 Proxy Statement under the headings “PROPOSAL 1: ELECTIONcaptions “EXECUTIVE COMPENSATION” and “COMPENSATION OF DIRECTORS - Compensation of Directors” and “EXECUTIVE COMPENSATION.” Such incorporationDIRECTORS” in Worthington Industries’ Definitive 2009 Proxy Statement.
The information required by reference shall not be deemed to specifically incorporate by reference the information referred to in Item 402(a)(8)407(e)(4) of SEC Regulation S-K.S-K is incorporated herein by reference from the disclosure to be included under the caption “CORPORATE GOVERNANCE – Compensation Committee Interlocks and Insider Participation” in Worthington Industries’ Definitive 2009 Proxy Statement.
The information required by Item 407(e)(5) of SEC Regulation S-K is incorporated herein by reference from the disclosure to be included under the caption “EXECUTIVE COMPENSATION – Compensation Committee Report” in Worthington Industries’ Definitive 2009 Proxy Statement.
Item 12. –— Security Ownership of Certain Beneficial Owners and Management and Related Stockholder Matters
In accordance with General Instruction G(3)Ownership of Form 10-K, theCommon Shares of Worthington Industries
The information required by this Item 12 with respect to the security ownership403 of certain beneficial owners and managementSEC Regulation S-K is incorporated herein by reference from the material which will be included in the 2006 Proxy Statement under the heading “SECURITY OWNERSHIP OF CERTAIN BENEFICIAL OWNERS AND MANAGEMENT.” The information required by this Item 12 with respectdisclosure to securities authorized for issuance under equity compensation plans is incorporated herein by reference from the material which will be included in the 2006 Proxy Statement under the heading “EXECUTIVE COMPENSATION – Equity Compensation Plan Information.”
Item 13. – Certain Relationships and Related Transactions
In accordance with General Instruction G(3) of Form 10-K, the information required by this Item 13 is incorporated herein by reference to the information for John H. McConnell and John P. McConnell which will be included under the headingcaption “SECURITY OWNERSHIP OF CERTAIN BENEFICIAL OWNERS AND MANAGEMENT” in the 2006Worthington Industries’ Definitive 2009 Proxy Statement andStatement.
Equity Compensation Plan Information
The information required by Item 201(d) of SEC Regulation S-K is incorporated herein by reference tofrom the material which willdisclosure to be included under the headingcaption “EQUITY COMPENSATION PLAN INFORMATION” in Worthington Industries’ Definitive 2009 Proxy Statement.
Item 13. — Certain Relationships and Related Transactions, and Director Independence
Certain Relationships and Related Person Transactions
The information required by Item 404 of SEC Regulation S-K is incorporated herein by reference from the disclosure in respect of John P. McConnell to be included under the caption “SECURITY OWNERSHIP OF CERTAIN BENEFICIAL OWNERS AND MANAGEMENT” and from the disclosure to be included under the caption “TRANSACTIONS WITH CERTAIN RELATED PARTIES”PERSONS” in Worthington Industries’ Definitive 2009 Proxy Statement.
Director Independence
The information required by Item 407(a) of SEC Regulation S-K is incorporated herein by reference from the 2006disclosure to be included under the caption “CORPORATE GOVERNANCE – Director Independence” in Worthington Industries’ Definitive 2009 Proxy Statement.
Item 14. –— Principal Accountant Fees and Services
In accordance with General Instruction G(3) of Form 10-K, theThe information required by this Item 14 is incorporated herein by reference from the information which willdisclosure to be included in the 2006 Proxy Statement under the headingscaptions “AUDIT COMMITTEE MATTERS – Fees of Independent Registered Public Accounting Firm”Firm Fees” and “AUDIT COMMITTEE MATTERS – Pre-Approval of Services Performed by the Independent Registered Public Accounting Firm.”
Item 15. –— Exhibits, and Financial Statement Schedules
(a) | The following documents are filed as a part of this Annual Report on Form 10-K: |
| (1) | Consolidated Financial Statements: |
The consolidated financial statements (and report thereon) listed below are filed as a part of this Annual Report on Form 10-K:
Report of Independent Registered Public Accounting Firm (KPMG LLP)
Consolidated Balance Sheets as of May 31, 20062009 and 20052008
Consolidated Statements of Earnings for the fiscal years ended May 31, 2006, 20052009, 2008 and 20042007
Consolidated Statements of Shareholders’ Equity for the fiscal years ended May 31, 2006, 20052009, 2008 and 20042007
Consolidated Statements of Cash Flows for the fiscal years ended May 31, 2006, 20052009, 2008 and 20042007
Notes to Consolidated Financial Statements – fiscal years ended May 31, 2006, 20052009, 2008 and 20042007
| Financial Statement |
Schedule II – Valuation and Qualifying Accounts
All other financial statement schedules for which provision is made in the applicable accounting regulations of the SEC are omitted because they are not required or the required information required has been presented in the aforementioned consolidated financial statements.
| Listing of Exhibits: |
The exhibits listed on the “Index to Exhibits” beginning on page E-1 of this Annual Report on Form 10-K are filed with this Annual Report on Form 10-K or incorporated hereinin this Annual Report on Form 10-K by reference as noted in the “Index to Exhibits.” The “Index to Exhibits” specifically identifies each management contract or compensatory plan or arrangement required to be filed as an exhibit to this Annual Report on Form 10-K or incorporated hereinin this Annual Report on Form 10-K by reference.
(b) | Exhibits:The exhibits listed on the “Index to Exhibits” beginning on page E-1 of this Annual Report on Form 10-K are filed with this Annual Report on Form 10-K or incorporated |
(c) | Financial Statement Schedule:The financial statement schedule listed in Item 15(a)(2) above is filed |
Pursuant to the requirements of Section 13 or 15(d) of the Securities Exchange Act of 1934, the Registrant has duly caused this report to be signed on its behalf by the undersigned, thereunto duly authorized.
WORTHINGTON INDUSTRIES, INC. | ||||
Date: | By: |
| ||
John P. McConnell, | ||||
Chairman of the Board and Chief Executive Officer | ||||
Pursuant to the requirements of the Securities Exchange Act of 1934, this report has been signed below by the following persons on behalf of the Registrant and in the capacities and on the date indicated.
SIGNATURE | DATE | TITLE |
/s/ John P. McConnell |
| |||
John P. McConnell | July 30, 2009 | Director, Chairman of the Board and | ||
/s/ B. Andrew Rose |
| |||
| Chief Financial | |||
/s/ Richard G. Welch |
| |||
Richard G. Welch | July 30, 2009 |
| ||
* |
| |||
John B. Blystone | * | Director | ||
* Michael J. Endres | * | Director | ||
| ||||
* Peter Karmanos, Jr. | * | Director | ||
| ||||
* John R. Kasich | * | Director | ||
| ||||
* |
| |||
| ||||
| ||||
Carl A. Nelson, Jr. | * | Director | ||
* |
| |||
Sidney A. Ribeau | * | Director | ||
* |
| |||
Mary Schiavo | * | Director | ||
*The undersigned, by signing his name hereto, does hereby sign this report on behalf of each of the above-identified directors of the Registrant pursuant to powers of attorney executed by such directors, andwhich powers of attorney are filed with this report.report as exhibits.
*By: | /s/ John P. McConnell | Date: July 30, 2009 | ||||||
| ||||||||
| ||||||||
Attorney-In-Fact |
Exhibit | Description | Location | ||||
3.1 | Amended Articles of Incorporation of Worthington Industries, Inc., as filed with Ohio Secretary of State on October 13, 1998 | Incorporated herein by reference to Exhibit 3(a) | ||||
3.2 | Code of Regulations of Worthington Industries, Inc., as amended through September 28, 2000 [for SEC reporting compliance purposes only] | Incorporated herein by reference to Exhibit 3(b) | ||||
4.1 | Form of Indenture, dated as of May 15, 1996, between Worthington Industries, Inc. and PNC Bank, Ohio, National Association, as Trustee, relating to up to $450,000,000 of debt securities. [NOTE: Effective November 15, 2006, U.S. Bank National Association succeeded The Bank of New York Trust Company, N.A. (formerly known as Bank of New York) as successor Trustee; which in turn was successor Trustee | Incorporated herein by reference to Exhibit 4(a) | ||||
4.2 | Form of | Incorporated herein by reference to Exhibit 4(f) | ||||
4.3 | Second Supplemental Indenture, dated as of December 12, 1997, between Worthington Industries, Inc. and PNC Bank, Ohio, National Association, as Trustee. [NOTE: Effective November 15, 2006, U.S. Bank National Association succeeded The Bank of New York Trust Company, N.A. (formerly known as Bank of New York) as successor Trustee; which in turn was successor Trustee | Incorporated herein by reference to Exhibit 4(g) | ||||
4.4 | Third Supplemental Indenture, dated as of October 13, 1998, | Incorporated herein by reference to Exhibit 4(h) |
4.5 | Fourth Supplemental Indenture, dated as of May 10, 2002, between Worthington Industries, Inc. and | Incorporated by reference to Exhibit 4(h) | |||||||
| 4.6 |
| Incorporated herein by reference to Exhibit 10.1 to the Registrant’s Current Report on Form 8-K dated November 2, 2006 and filed with the SEC on the same date (SEC File No. 1-8399) | |||||||
| 4.7 | $435,000,000 Second Amended and Restated Revolving Credit Agreement, dated as of September 29, 2005, among Worthington Industries, Inc., as Borrower; the Lenders party thereto; PNC Bank, National Association, as Issuing Lender, Swingline Lender and Administrative Agent; and The Bank of Nova Scotia, as Syndication Agent and Sole Bookrunner; with The Bank of Nova Scotia and PNC Capital Markets, Inc. serving as Joint Lead Arrangers, and U.S. Bank National Association, Wachovia Bank, National Association and Comerica Bank serving as Co-Documentation Agents | Incorporated herein by reference to Exhibit 4.1 | |||||||
| 4.8 | First Amendment to Credit Agreement, dated as of May 6, 2008, among Worthington Industries, Inc., as Borrower; the Lenders party thereto; and PNC Bank, National Association, as Administrative Agent for the Lenders | Incorporated herein by reference to Exhibit 4.1 to the Registrant’s Current Report on Form 8-K dated May 8, 2008 and filed with the SEC on the same date (SEC File No. 1-8399) | ||||
| Note Purchase Agreement, dated December 17, 2004, between Worthington Industries, Inc. and Allstate Life Insurance Company, Connecticut General Life Insurance Company, United of Omaha Life Insurance Company and Principal Life Insurance Company | Incorporated herein by reference to Exhibit 4.1 | ||||
| Form of Floating Rate Senior Note due December 17, 2014 | Incorporated herein by reference to Exhibit 4.2 | ||||
| 4.11 |
| Incorporated herein by reference to Exhibit 4.2 to the Registrant’s Quarterly Report on Form 10-Q for the quarterly period ended November 30, 2006 (SEC File No. 1-8399) | ||||
| 4.12 | Agreement to furnish instruments and agreements defining rights of holders of long-term debt | Filed herewith | ||||
10.1 | Worthington Industries, Inc. Non-Qualified Deferred Compensation Plan effective March 1, 2000* | Incorporated herein by reference to Exhibit 10.1 | ||||
10.2 | Worthington Industries, Inc. Amended and Restated 2005 Non-Qualified Deferred Compensation | Incorporated herein by reference to Exhibit | ||||
|
|
| ||||
| Worthington Industries, Inc. Deferred Compensation Plan for Directors, as Amended and Restated, effective June 1, 2000* | Incorporated herein by reference to Exhibit 10(d) | ||||
| Worthington Industries, Inc. Amended and Restated 2005 Deferred Compensation Plan for | Incorporated herein by reference to Exhibit | ||||
| Worthington Industries, Inc. 1990 Stock Option Plan, as amended* | Incorporated herein by reference to Exhibit 10(b) | ||||
| Worthington Industries, Inc. Amended and Restated 1997 Long-Term Incentive Plan | Incorporated herein by reference to Exhibit | ||||
| Form of Non-Qualified Stock Option Agreement for non-qualified stock options granted under the Worthington Industries, Inc. 1997 Long-Term Incentive | Incorporated herein by reference to Exhibit 10.1 | ||||
| 10.8 |
| Incorporated herein by reference to Exhibit 10.3 to the Registrant’s Quarterly Report on Form 10-Q for the quarterly period ended November 30, 2008 (SEC File No. 1-8399) | ||||
| 10.9 | Form of Letter Evidencing Cash Performance Awards Granted under the Worthington Industries, Inc. | Incorporated herein by reference to Exhibit 10.21 to the Registrant’s Annual Report on Form 10-K for | ||||
| 10.10 | Form of Letter Evidencing Cash Performance Awards and Performance Share Awards Granted under the Worthington Industries, Inc. 1997 Long-Term Incentive Plan (now known as the Worthington Industries, Inc. Amended and Restated 1997 Long-Term Incentive Plan) – Targets for 3-Year Period Ending May 31, 2009* | Incorporated herein by reference to Exhibit 10.1 to the Registrant’s Current Report on Form 8-K dated May 25, 2006 and filed with the SEC on the same date (SEC File No. 1-8399) | ||||
| 10.11 | Form of Letter Evidencing Cash Performance Awards and Performance Share Awards Granted under the Worthington Industries, Inc. 1997 Long-Term Incentive Plan (now known as the Worthington Industries, Inc. Amended and Restated 1997 Long-Term Incentive Plan) – Targets for 3-Year Period Ending May 31, 2010* | Incorporated herein by reference to Exhibit 10.1 to the Registrant’s Current Report on Form 8-K dated June 27, 2007 and filed with the SEC on the same date (SEC File No. 1-8399) | ||||
10.12 | Form of Letter Evidencing Cash Performance Awards and Performance Share Awards Granted under the Worthington Industries, Inc. 1997 Long-Term Incentive Plan (now known as the Worthington Industries, Inc. Amended and Restated 1997 Long-Term Incentive Plan) – Targets for 3-Year Period Ending May 31, 2011* | Incorporated herein by reference to Exhibit 10.1 to the Registrant’s Current Report on Form 8-K dated June 21, 2008 and filed with the SEC on June 23, 2008 (SEC File No. 1-8399) | ||||
10.13 | Worthington Industries, Inc. Amended and Restated 2000 Stock Option Plan for Non-Employee Directors (Restatement effective as of November 1, 2008)* | Incorporated herein by reference to Exhibit 10.7 to the Registrant’s Quarterly Report on Form 10-Q for the quarterly period ended | ||||
| Form of Non-Qualified Stock Option Agreement for non-qualified stock options granted under the Worthington Industries, Inc. 2000 Stock Option Plan for Non-Employee | Incorporated herein by reference to Exhibit 10.2 | ||||
| Worthington Industries, Inc. Amended and Restated 2003 Stock Option Plan | Incorporated herein by reference to Exhibit | ||||
| Form of Non-Qualified Stock Option Agreement for non-qualified stock options granted under the Worthington Industries, Inc. 2003 Stock Option | Incorporated herein by reference to Exhibit 10.3 | ||||
10.17 | Worthington Industries, Inc. Amended and Restated 2006 Equity Incentive Plan for Non-Employee Directors (Restatement effective as of November 1, 2008)* | Incorporated herein by reference to Exhibit 10.9 to the Registrant’s Quarterly Report on Form 10-Q for the quarterly period ended November 30, 2008 (SEC File No. 1-8399) | ||||
10.18 | Form of Non-Qualified Stock Option Award Agreement under the Worthington Industries, Inc. 2006 Equity Incentive Plan for Non-Employee Directors (now known as the Worthington Industries, Inc. Amended and Restated 2006 Equity Incentive Plan for Non-Employee Directors) entered into by Worthington Industries, Inc. in order to evidence the grant of non-qualified stock options to non-employee directors of Worthington Industries, Inc. on September 27, 2006 and to be entered into by Worthington Industries, Inc. in order to evidence future grants of non-qualified stock options to non-employee directors of Worthington Industries, Inc.* | Incorporated herein by reference to Exhibit 10.2 to the Registrant’s Current Report on Form 8-K dated October 2, 2006 and filed with the SEC on the same date (SEC File No. 1-8399) | ||||
| Form of Restricted Stock Award Agreement under the Worthington Industries, Inc. 2006 Equity Incentive Plan for Non-Employee Directors (now known as the Worthington Industries, Inc. Amended and Restated 2006 Equity Incentive Plan for Non-Employee Directors) entered into by Worthington Industries, Inc. in order to evidence the grant of restricted stock on September 27, 2006 to non-employee directors of Worthington Industries, Inc. and to be entered into by Worthington Industries, Inc. in order to evidence future grants of restricted stock to non-employee directors of Worthington Industries, Inc.* | Incorporated herein by reference to Exhibit 10.3 to the Registrant’s Current Report on Form 8-K dated October 2, 2006 and filed with the SEC on the same date (SEC File No. 1-8399) | ||||
10.20 | Form of Non-Qualified Stock Option Award Agreement under the Worthington Industries, Inc. 2006 Equity Incentive Plan for Non-Employee Directors (now known as the Worthington Industries, Inc. Amended and Restated 2006 Equity Incentive Plan for Non-Employee Directors) entered into by Worthington Industries, Inc. in order to evidence the grant of non-qualified stock options to non-employee directors of Worthington Industries, Inc. on September 24, 2008* | Incorporated herein by reference to Exhibit 10.2 to the Registrant’s Quarterly Report on Form 10-Q for the quarterly period ended August 31, 2008 (SEC File No. 1-8399) | ||||
10.21 | Form of Restricted Stock Award Agreement under the Worthington Industries, Inc. 2006 Equity Incentive Plan for Non-Employee Directors (now known as the Worthington Industries, Inc. Amended and Restated 2006 Equity Incentive Plan for Non-Employee Directors) entered into by Worthington Industries, Inc. in order to evidence the grant of restricted stock to non-employee directors of Worthington Industries, Inc. on September 24, 2008* | Incorporated herein by reference to Exhibit 10.3 to the Registrant’s Quarterly Report on Form 10-Q for the quarterly period ended August 31, 2008 (SEC File No. 1-8399) | ||||
10.22 | Worthington Industries, Inc. Annual Incentive Plan for Executives (approved by shareholders on September 24, 2008)* | Incorporated herein by reference to Exhibit 10.1 to the Registrant’s Current Report on Form 8-K dated September 30, 2008 and filed with the SEC on the same date (SEC File No. 1-8399) | ||||
10.23 | Form of Letter Evidencing Cash Performance Bonus Awards Granted under the Worthington Industries, Inc. Annual Incentive Plan for Executives* | Filed herewith | ||||
10.24 | Receivables Purchase Agreement, dated as of November 30, 2000, among Worthington Receivables Corporation, as Seller, Worthington Industries, Inc., as Servicer, members of various purchaser groups from time to time party thereto and PNC Bank, National Association, as Administrator | Incorporated herein by reference to Exhibit 10(h)(i) to the Registrant’s Annual Report on Form 10-K for the fiscal year ended May 31, 2001 (SEC File No. 1-8399) | ||||
10.25 | Amendment No. 1 to Receivables Purchase Agreement, dated as of May 18, 2001, among Worthington Receivables Corporation, as Seller, Worthington Industries, Inc., as Servicer, members of various purchaser groups from time to time party thereto and PNC Bank, National Association, as Administrator | Incorporated herein by reference to Exhibit 10(h)(ii) to the Registrant’s Annual Report on Form 10-K for the fiscal year ended May 31, 2001 (SEC File No. 1-8399) | ||||
|
|
| ||||
| Amendment No. 2 to Receivables Purchase Agreement, dated as of May 31, 2004, among Worthington Receivables Corporation, as Seller, Worthington Industries, Inc., as Servicer, members of various purchaser groups from time to time party thereto | Incorporated herein by reference to Exhibit 10(g)(x) | ||||
| Amendment No. 3 to Receivables Purchase Agreement, dated as of January 27, 2005, among Worthington Receivables Corporation, as Seller, Worthington Industries, Inc., as Servicer, the members of the various purchaser groups from time to time party thereto and PNC Bank, National Association, as Administrator | Incorporated herein by reference to Exhibit 10.15 | ||||
| Amendment No. 4 to Receivables Purchase Agreement, dated as of January 25, 2008, among Worthington Receivables Corporation, as Seller, Worthington Industries, Inc., as Servicer, the members of the various purchaser groups from time to time party thereto and PNC Bank, National Association, as Administrator | Incorporated herein by reference to Exhibit 10.20 to the Registrant’s Annual Report on Form 10-K for the fiscal year ended May 31, 2008 (SEC File No. 1-8399) | ||||
10.29 | Amendment No. 5 to Receivables Purchase Agreement, dated as of January 22, 2009, among Worthington Receivables Corporation, as Seller, Worthington Industries, Inc., as Servicer, the members of the various purchaser groups from time to time party thereto and PNC Bank, National Association, as Administrator | Incorporated herein by reference to Exhibit 10.1 to the Registrant’s Quarterly Report on Form 10-Q for the quarterly period ended February 28, 2009 (SEC File No. 1-8399) | ||||
10.30 | Amendment No. 6 to Receivables Purchase Agreement, dated as of April 30, 2009, among Worthington Receivables Corporation, as Seller, Worthington Industries, Inc., as Servicer, the members of the various purchaser groups from time to time party thereto and PNC Bank, National Association, as Administrator | Filed herewith | ||||
10.31 | Purchase and Sale Agreement, dated as of November 30, 2000, between the various originators listed therein and Worthington Receivables Corporation | Incorporated herein by reference to Exhibit 10(h)(iii) | ||||
| Amendment No. 1, dated as of May 18, 2001, to Purchase and Sale Agreement, dated as of November 30, 2000, between the various originators listed therein and Worthington Receivables Corporation | Incorporated herein by reference to Exhibit 10(h)(iv) | ||||
|
| Incorporated herein by reference to Exhibit | ||||
|
|
| ||||
| Summary of Cash Compensation for Directors of Worthington Industries, Inc., effective June 1, |
| ||||
|
| Incorporated herein by reference to Exhibit | ||||
| Summary of Annual Base Salaries Approved for Named Executive Officers of Worthington Industries, Inc. * | Filed herewith | ||||
10.36 | Summary of Annual Cash Performance Bonus Awards, Long-Term Performance Awards and Stock Options granted for Fiscal 2010 for Named Executive Officers* | Filed herewith | ||||
10.37 | Summary of arrangement with John S. Christie, the Registrant’s former President and Chief Financial Officer, who took early retirement effective July 31, 2008* | Incorporated herein by reference to the discussion in “Item 5.02 – Departure of Directors or Certain Officers; Election of Directors; Appointment of Certain Officers; Compensatory Arrangements of Certain Officers” of the Registrant’s Current Report on Form 8-K dated May 5, 2008 and filed with the SEC on the same date (SEC File No. 1-8399) | ||||
10.38 | Form of | Incorporated herein by reference to Exhibit | ||||
10.39 | Form of Indemnification Agreement entered into between Worthington Industries, Inc. and | Incorporated herein by reference to Exhibit 10.33 to the | ||||
14 | Worthington Industries, Inc. Code of Conduct | Incorporated herein by reference to Exhibit 14 | ||||
21 | Subsidiaries of Worthington Industries, Inc. | Filed herewith | ||||
23.1 | Consent of Independent Registered Public Accounting Firm (KPMG LLP) | Filed herewith | ||||
23.2 | Consent of Independent | Filed herewith | ||||
24 | Powers of Attorney of Directors and Executive Officers of Worthington Industries, Inc. | Filed herewith | ||||
31.1 | Rule 13a | Filed herewith | ||||
31.2 | Rule 13a | Filed herewith | ||||
32.1 | Section 1350 | Filed herewith | ||||
32.2 | Section 1350 | Filed herewith | ||||
99.1 | Worthington Armstrong Venture consolidated financial statements as of December 31, | Filed herewith | ||||
| * |
| |||||
E-5E-9