

UNITED STATES
SECURITIES AND EXCHANGE COMMISSION
Washington, D.C. 20549
FORM 10-K
ANNUAL REPORT PURSUANT TO SECTION 13 OR 15(d) OF
THE SECURITIES EXCHANGE ACT OF 1934
For the fiscal year ended November 30, 20062008
Commission file number 1-11749
Lennar Corporation
(Exact name of registrant as specified in its charter)
| Delaware | 95-4337490 | |
(State or other jurisdiction of incorporation or organization) | (I.R.S. Employer Identification No.) |
700 Northwest 107th Avenue, Miami, Florida 33172
(Address of principal executive offices) (Zip Code)
Registrant’s telephone number, including area code (305) 559-4000
Securities registered pursuant to Section 12(b) of the Act:
Title of each class | Name of each exchange on which registered | |
Class A Common Stock, par value 10¢ | New York Stock Exchange | |
Class B Common Stock, par value 10¢ | New York Stock Exchange |
Securities registered pursuant to Section 12(g) of the Act:
NONE
Indicate by check mark if the registrant is a well-known seasoned issuer, as defined in Rule 405 of the Securities Act.
YES þ NO¨
Indicate by check mark if the registrant is not required to file reports pursuant to Section 13 or Section 15(d) of the Act. YES ¨ NO þ
Indicate by check mark whether the registrant (1) has filed all reports required to be filed by Section 13 or 15(d) of the Securities Exchange Act of 1934 during the preceding 12 months (or for such shorter period that the registrant was required to file such reports), and (2) has been subject to such filing requirements for the past 90 days. YES þ NO ¨
Indicate by check mark if disclosure of delinquent filers pursuant to Item 405 of Regulation S-K is not contained herein, and will not be contained, to the best of registrant’s knowledge, in definitive proxy or information statements incorporated by reference in Part III of this Form 10-K or any amendment to this Form 10-K. þ¨
Indicate by check mark whether the registrant is a large accelerated filer, an accelerated filer, or a non-accelerated filer. See definition of “accelerated filer and large accelerated filer” in Rule 12b-2 of the Exchange Act. (Check one):
Large accelerated filer þ | Accelerated filer ¨ | Non-accelerated filer ¨ |
Indicate by check mark whether the registrant is a shell company (as defined in Rule 12b-2 of the Act). YES ¨ NO þ
The aggregate market value of the registrant’s Class A and Class B common stock held by non-affiliates of the registrant (124,270,835(125,042,232 Class A shares and 10,843,1799,731,683 Class B shares) as of May 31, 2006,2008, based on the closing sale price per share as reported by the New York Stock Exchange on such date, was $6,431,999,899.$2,258,050,557.
As of JanuaryDecember 31, 2007,2008, the registrant had outstanding 127,302,839129,251,272 shares of Class A common stock and 31,234,56331,284,003 shares of Class B common stock.
DOCUMENTS INCORPORATED BY REFERENCE:
Related Section | Documents | |
III | Definitive Proxy Statement to be filed pursuant to Regulation 14A on or before March 30, |
PART I
Item 1. Business.
Overview of Lennar Corporation
We are one of the nation’s largest homebuilders and a provider of financial services. Our homebuilding operations include the construction and sale of single-family attached and detached homes, and to a lesser extent multi-level residential buildings, as well as the purchase, development and sale of residential land directly and through unconsolidated entities in which we have investments. We have grouped our homebuilding activities into threefour reportable segments, which we refer to as Homebuilding East, Homebuilding Central, Homebuilding West and Homebuilding West.Houston. Information about homebuilding activities in states in which our homebuilding activities are not economically similar to those in other states in the same geographic area is grouped under “Homebuilding Other.” Our reportable homebuilding segments and Homebuilding Other have divisionsoperations located in the following states:in:
East:Florida, Maryland, New Jersey and Virginia
Central:Arizona, Colorado and Texas (1)
West:California and Nevada
Houston: Houston, Texas
Other:Illinois, Minnesota, New York, North Carolina and South Carolina
| (1) | Texas in the Central reportable segment excludes Houston, Texas, which is its own reportable segment. |
We have one Financial Services reportable segment that provides mortgage financing, title insurance, closing services and other ancillary services (including personal lines insurance, high-speed Internet and cable television) for both buyers of our homes and others. We sell substantiallySubstantially all of the loans that we originate are sold in the secondary mortgage market.market on a servicing released, non-recourse basis; although, we remain liable for certain limited representations and warranties related to loan sales. Our Financial Services segment operates generally in the same states as our homebuilding segments,operations, as well as in other states. For financial information about both our homebuilding and financial services operations, you should review Management’s Discussion and Analysis of Financial Condition and Results of Operations, which is Item 7 of this Report, and our consolidated financial statements and the notes to our consolidated financial statements, which are included in Item 8 of this Report.
A Brief History of Our GrowthCompany
Our company was founded as a local Miami homebuilder in 1954. We completed our initial public offering in 1971, and listed our common stock on the New York Stock Exchange in 1972. During the 1980s and 1990s, we entered and expanded operations in some of our current major homebuilding markets including California, Florida and Texas through both organic growth and acquisitions such as Pacific Greystone Corporation in 1997, amongst others. In 1997, we completed the spin-off of our commercial real estate business to LNR Property Corporation. In 2000, we acquired U.S. Home Corporation, which expanded our operations into New Jersey, Maryland, Virginia, Minnesota and Colorado and strengthened our position in other states. During 2002 and 2003, we acquired several regional homebuilders, which brought us into new markets and strengthened our position in several existing markets. | ||
| ||
| ||
| ||
| ||
| ||
| ||
| ||
| ||
| ||
| ||
| ||
1
| ||
| ||
| ||
| ||
| ||
2006Recent Business Developments
During the second half of 2006, theThroughout 2007 and 2008, market conditions in the homebuilding industry deteriorated. As a result,were negatively impacted by broad-based pressures such as rising unemployment, falling home prices, increased foreclosures, tighter credit and volatile equity markets, which further eroded consumer confidence and depressed home sales. These market conditions resulted in higher than historical cancellation rates (26% and 30%, respectively, in 2008 and 2007) and lower net new orders (new orders were down 48% and 39%, respectively, in 2008 and 2007) for our company despite our continued use of sales incentives. The market has continued to become more competitive and we evaluatedhave responded to competitive market pressure to reduce prices through the use of sales incentives and price reductions, as well as, consolidating divisions, repositioning our product and reducing land purchases, construction costs and overhead. During 2008, we filed net operating loss (“ NOL”) carryback claims and received $877.0 million of federal and state tax refunds, net. In addition, we have received $251.0 million of federal tax refunds subsequent to November 30, 2008.
We continued evaluating our balance sheet quarterly for impairment on an asset-by-asset basis. Based on this assessment, induring the years ended November 30, 2008, 2007 and 2006, we recorded $340.5 million, $2,445.1 million and $501.8 million, respectively, of inventory adjustments, which included $195.5 million, $747.8 million and $280.5 million, respectively, in 2008, 2007 and 2006 of Statement of Financial Accounting Standards (“SFAS”) No. 144,Accounting for the Impairment of Long-lived Assets,(“SFAS 144”) valuation adjustments to finished homes, construction in progress and $126.4land on which we intend to build homes, $47.8 million, $1,167.3 million and $69.1
million, respectively, in 2008, 2007 and 2006 of SFAS 144 valuation adjustments to land we intend to sell or have sold to third parties and $97.2 million, $530.0 million and $152.2 million, respectively, in 2008, 2007 and 2006 of write-offs of deposits and pre-acquisition costs. The $1,167.3 million of valuation adjustments recorded in 2007 to land we intend to sell or have sold to third parties included $740.4 million of SFAS 144 valuation adjustments related to a portfolio of land we sold to a strategic land investment venture with Morgan Stanley Real Estate Fund II, L.P., an affiliate of Morgan Stanley & Co., Inc., which was formed in November 2007 and in which we have a 20% ownership interest. See Management’s Discussion and Analysis of Financial Condition and Results of Operations in Item 7 of this Report for further details on the aforementioned transaction and land investment venture.
Additionally, during the years ended November 30, 2008, 2007 and 2006, we recorded $205.0 million, $496.4 million and $140.9 million, respectively, of valuation adjustments to our investments in unconsolidated entities. Thisentities, which included $32.2 million, $364.2 million and $126.4 million, respectively, in 2008, 2007 and 2006 of our share of SFAS 144 valuation adjustments related to assets of our unconsolidated entities and $172.8 million, $132.2 million and $14.5 million, respectively, in 2008, 2007 and 2006 of valuation adjustments to our investments in unconsolidated entities in accordance with Accounting Principles Board Opinion No. 18,The Equity Method of Accounting for Investments in Common Stock (“APB 18”).
The valuation adjustments recorded were estimated based on market deterioration was driven primarilyconditions and assumptions made by excess supply as speculators reduced purchasesmanagement at the time the valuation adjustments were recorded, which may differ materially from actual results if market conditions or our assumptions change.
In June 2008, our LandSource Communities Development LLC (“LandSource”) unconsolidated joint venture and returned homesa number of its subsidiaries commenced proceedings under Chapter 11 of the Bankruptcy Code in the United States Bankruptcy Court for the District of Delaware. We own 16% of LandSource, and until 2007, we had owned 50%. In November 2008, our land purchase options with LandSource were terminated, thus we recognized a deferred profit of $101.3 million (net of $31.8 million of write-offs of option deposits and pre-acquisition costs and other write-offs) related to the market as well as negative customer sentiment surrounding2007 recapitalization of LandSource in which our ownership interest was reduced to 16%. The bankruptcy filing could result in LandSource losing some or all of the general homebuilding market. We also experienced slower sales (down 3% in 2006) and higher cancellation rates (29% in 2006) which have impacted mostproperties it owns, termination of our marketsmanagement agreement with LandSource, claims against us and therefore,a substantial reduction (or total elimination) of our 16% ownership interest in LandSource, which had a carrying value of zero at November 30, 2008.
For a number of years, we made greatercreated and participated in joint ventures that acquired and developed land for our homebuilding operations, for sale to third parties or for use of sales incentivesin their own homebuilding operations. Through these joint ventures, we reduced the amount we had to generate salesinvest in order to build-outassure access to potential future homesites, thereby mitigating certain risks associated with land acquisitions, and, in some instances, we obtained access to land to which we could not otherwise have obtained access or could not have obtained access on as favorable terms. Although these ventures served their initial intended purpose of risk mitigation, as the homebuilding market deteriorated from 2006 through 2008 and asset impairments resulted in the loss of equity, some of our inventory, deliverjoint venture partners became financially unable or unwilling to fulfill their obligations. As a result, during 2007 and 2008, we re-evaluated all of our backlogjoint venture arrangements, with particular focus on those ventures with recourse indebtedness, and convert inventory into cash. The usebegan to reduce the number of these sales incentivesjoint ventures in which we were participating and the recourse indebtedness of those joint ventures. As of November 30, 2008, we had a negative impact on gross margins.reduced the number of unconsolidated joint ventures in which we were participating to 116 from 261 unconsolidated joint ventures at November 30, 2006. As of November 30, 2008, we had also reduced our net recourse exposure related to unconsolidated joint ventures to $392.5 million from $1,102.9 million at November 30, 2006.
Homebuilding Operations
Overview
We primarily sell single-family attached and detached homes, and to a lesser extent, multi-level residential buildings, in communities targeted to first-time, move-up and active adult homebuyers. The average sales price of a Lennar home was $315,000$270,000 in fiscal 2006.2008, compared to $297,000 in fiscal 2007. We operate primarily under the Lennar brand name and market our homes primarily under our Everything’s Included® program.name.
Through our own efforts and unconsolidated entities in which we have investments, we are involved in all phases of planning and building in our residential communities including land acquisition, site planning, preparation and improvement of land and design, construction and marketing of homes. We view unconsolidated entities as a means to both expand our market opportunities and manage our risks. For additional information about our investments in and relationships with unconsolidated entities, see Management’s Discussion and Analysis of Financial Condition and Results of Operations in Item 7 of this Report.
Management and Operating Structure
We balance a local operating structure with centralized corporate level management. Decisions related to our overall strategy, acquisitions of land and businesses, risk management, financing, cash management and information systems are centralized at the corporate level. Our local operating structure encompasses both land and homebuildingconsists of divisions, which are managed by individuals who generally have significant experience in the homebuilding industry and, in most instances, in their particular markets. Our land divisionsThey are responsible for
2
operating decisions regarding land identification, entitlement and development, and the management of inventory levels for our planned growth. Our homebuilding divisions are responsible forcurrent volume levels, community development, home design, evenflow construction and marketing our homes primarily under our Everything’s Included® program.homes.
Diversified Program of Property Acquisition
During 2008, we significantly reduced our property acquisitions. We generally acquire land for development and for the construction of homes that we sell to homebuyers. Land is subject to specified underwriting criteria and is acquired through our diversified program of property acquisition consisting of the following:
Acquiring land directly from individual land owners/developers or homebuilders,homebuilders;
Acquiring local or regional homebuilders that own, or have options to purchase, land in strategic markets,markets;
Acquiring land through option contracts, which generally enables us to defer acquiringcontrol portions of properties owned by third parties (including land funds) and unconsolidated entities until we are readyhave determined whether to build homes on these properties,exercise the option; and
Acquiring parcels of land through joint ventures, primarily to reduce and share our risk, among other factors, by limiting the amount of our capital invested in land, while increasing our access to potential future homesites and allowing us to participate in strategic ventures. We also acquire land through option contracts with our joint ventures.
At November 30, 2006,2008, we owned 92,32574,681 homesites and had access through option contracts to an additional 189,27938,589 homesites, of which 94,75812,718 were through option contracts with third parties and 94,52125,871 were through option contracts with unconsolidated entities in which we have investments. At November 30, 2005,2007, we owned 102,68762,801 homesites and had access through option contracts to an additional 222,11985,870 homesites, of which 127,01322,877 were through option contracts with third parties and 95,10662,993 were through option contracts with unconsolidated entities in which we have investments.
Construction and Development
We generally supervise and control the development of land and the design and building of our residential communities with a relatively small labor force. We hire subcontractors for site improvements and virtually all of the work involved in the construction of homes. Generally, arrangements with our subcontractors provide that our subcontractors will complete specified work in accordance with price schedules and applicable building codes and laws. The price schedules may be subject to change to meet changes in labor and material costs or for other reasons. We believe that the sources and availability of raw materials to our subcontractors are adequate for our current and planned levels of operation. We generally do not own heavy construction equipment. We finance construction and land development activities primarily with cash generated from operations and public debt issuances, as well as cash borrowed under our revolving credit facility, commercial paper program and unsecured, fixed-rate notes.facility.
Marketing
We offer a diversified line of homes for first-time, move-up and active adult homebuyers. With homes priced from under $100,000 to above $1,000,000 andhomebuyers available in a variety of environments ranging from urban infill communities to golf course communities, we are focused on providing homes for a wide spectrum of buyers. Our Everything’s Included® marketing program simplifies the homebuying experience by including desirable features as standard items. This marketing program enables us to differentiate our homes from those of our competitors by creating value through standard upgrades and competitive pricing, while reducing construction and overhead costs through a simplified manufacturing process, product standardization and volume purchasing.communities. We sell our homes primarily from models that we have designed and constructed. During 2008, those homes had an average sales price of $270,000.
We employ sales associates who are paid salaries, commissions or both to complete on-site sales of homes. We also sell homes through independent brokers. We advertise our communities in newspapers, radio advertisements and other local and regional publications, on billboards and on the Internet, including our website, www.lennar.com. In addition, we advertise our active adult communities in areas where prospective active adult homebuyers live.
We have historically participated in charitable down-payment assistance programs for a small percentage of our homebuyers.programs. Through these programs, we make a donationmade donations to a non-profit organizationorganizations that providesprovided financial assistance to a homebuyer who would not otherwise have sufficient funds for a down payment. During 2008, 35% of our homebuyers utilized the charitable down-payment assistance programs. The FHA Modernization Act of 2008 eliminated these programs after September 30, 2008 and their elimination has had an adverse impact on home sales since that point.
3
Quality Service
We strive to continually improve homeowner customer satisfaction throughout the pre-sale, sale, construction, closing and post-closing periods. Through the participation of sales associates, on-site construction supervisors and customer care associates, all working in a team effort, we strive to create a quality homebuying experience for our customers, which we believe leads to enhanced customer retention and referrals.
The quality of our homes is substantially affected by the efforts of on-site management and others engaged in the construction process, by the materials we use in particular homes or by other similar factors. Currently, mostTo the extent bonuses have been paid, management team members’ bonus plans are, in part,incentives programs have consistently been contingent upon achieving certain customer satisfaction standards.
We currently have a “Heightened Awareness” program, which is a focused initiative designed to objectively evaluate and measure the quality of construction in our communities. In addition to our “Heightened Awareness” program, we have a quality assurance program in certain markets in which we employ third-party consultants to inspect our homes during the construction process. These inspectors provide us with inspection reports and follow-up verification. We also obtain independent surveys of selected customers through a third-party consultant and use the survey results to further improve our standard of quality and customer satisfaction.
We warrant our new homes against defective materialmaterials and workmanship for a minimum period of one year after the date of closing. Although we subcontract virtually all segments of construction to others and our contracts call for the subcontractors to repair or replace any deficient items related to their trade,trades, we are primarily responsible to the homebuyerhomebuyers for the correction of any deficiencies.
Deliveries
The table below indicates the number of deliveries for each of our homebuilding segments and Homebuilding Other during our last three fiscal years:
| 2006 | 2005 | 2004 | 2008 | 2007 | 2006 | |||||||
East | 14,859 | 11,220 | 10,438 | 4,957 | 9,840 | 14,859 | ||||||
Central | 17,069 | 15,448 | 13,126 | 2,442 | 7,020 | 11,287 | ||||||
West | 13,333 | 11,731 | 9,079 | 4,031 | 8,739 | 13,333 | ||||||
Houston | 2,736 | 4,380 | 5,782 | |||||||||
Other | 4,307 | 3,960 | 3,561 | 1,569 | 3,304 | 4,307 | ||||||
Total | 49,568 | 42,359 | 36,204 | 15,735 | 33,283 | 49,568 | ||||||
Of the total home deliveries listed above, 2,536, 1,477391, 1,701 and 1,015,2,536, respectively, represent deliveries from unconsolidated entities for the years ended November 30, 2006, 20052008, 2007 and 2004.
Despite the fact that deliveries for the full fiscal 2006 year increased in each of our homebuilding segments and Homebuilding Other, during the fourth quarter of 2006, deliveries were lower in our Homebuilding Central and West segments and Homebuilding Other, compared to the fourth quarter of 2005.2006.
Backlog
Backlog represents the number of homes under sales contracts. Homes are sold using sales contracts, which are generally accompanied by sales deposits. In some instances, purchasers are permitted to cancel sales contracts if they fail to qualify for financing or under certain other circumstances. We experienced a cancellation rate of 29%26% in 2006,2008, compared to 17%30% and 16%29%, respectively, in 20052007 and 2004. Although we experienced a significant increase2006. Substantially all homes currently in our cancellation rate during 2006, we remain focused on reselling these homes, which, in many instances, includes the use of higher sales incentives, to avoid the build up of excess inventory.backlog will be delivered within fiscal year 2009. We do not recognize revenue on homes under sales contracts until the sales are closed and title passes to the new homeowners, except for our multi-level residential buildings under construction for which revenue iswas recognized under percentage-of-completion accounting.
4accounting during 2006 and 2007. In 2008, we stopped recognizing revenues and expenses under percentage-of-completion accounting for our multi-level residential buildings under construction as a result of Emerging Issues Task Force 06-8,Applicability of the Assessment of a Buyer’s Continuing Investment under FASB Statement No. 66 for Sales of Condominiums (“EITF 06-8”) (see Note 1 in Item 8 of this Report).
The table below indicates the backlog dollar value for each of our homebuilding segments and Homebuilding Other as of the end of our last three fiscal years:
| 2006 | 2005 | 2004 | 2008 | 2007 | 2006 | |||||||||
| (In thousands) | (In thousands) | |||||||||||||
East | $ | 1,460,213 | 2,774,396 | 2,104,959 | $ | 202,791 | 587,100 | 1,460,213 | ||||||
Central | 850,472 | 1,210,257 | 911,303 | 23,736 | 67,344 | 590,487 | ||||||||
West | 1,328,617 | 2,374,646 | 1,597,185 | 108,779 | 408,280 | 1,328,617 | ||||||||
Houston | 57,785 | 128,340 | 259,985 | |||||||||||
Other | 341,126 | 524,939 | 441,826 | 63,179 | 193,073 | 341,126 | ||||||||
Total | $ | 3,980,428 | 6,884,238 | 5,055,273 | $ | 456,270 | 1,384,137 | 3,980,428 | ||||||
Of the dollar value of homes in backlog listed above, $478,707, $590,129$12,460, $182,664 and $644,839,$478,707, respectively, represent the backlog dollar value from unconsolidated entities at November 30, 2006, 20052008, 2007 and 2004.
As of December 31, 2006 and 2005, the backlog dollar value was $3.6 billion and $6.7 billion, respectively, of which $0.5 billion in 2006 and 2005 represents the backlog dollar value from unconsolidated entities.2006.
Financial Services Operations
Mortgage Financing
We provide a full spectrum ofprimarily originate conforming conventional, FHA-insured, and VA-guaranteed first and second lien residential mortgage loan products and other products to our homebuyers and others through our financial services subsidiaries, Universal American Mortgage Company, LLC and Eagle Home Mortgage, LLC, located generally in the same states as our homebuilding segments and Homebuilding Other,operations as well as other states. In 2006,2008, our financial services subsidiaries provided loans to 66%85% of our homebuyers who obtained mortgage financing in areas where we offered services. Because of the availability of mortgage loans from our financial services subsidiaries, as well as independent mortgage lenders, we believe access to financing has not been, and is not, a significant obstacle for most creditworthy purchasers of our homes.homes have access to financing.
During 2006,2008, we originated approximately 41,80018,300 mortgage loans totaling $10.5 billion.$4.3 billion, compared to 30,900 mortgage loans totaling $7.7 billion during 2007. Substantially all of thosethe loans werewe originate are sold within a short period in the secondary mortgage market on a servicing released, non-recourse basis; however,although, we remain liable for certain limited representations and warrantiesrepresentations. Therefore, we have little direct exposure related to loan sales.the residential mortgages we sell.
We have a corporate risk management policy under which we hedge our interest rate risk on rate-locked loan commitments and loans held-for-sale to mitigate exposure to interest rate fluctuations. We finance our mortgage loan activities with borrowings under our financial services subsidiaries’ warehouse lines of creditfacilities or from our general corporateoperating funds. Our syndicated warehouse repurchase facility matures in April 2009 ($125 million, plus a $50 million temporary accordion feature that expired in December 2008) and our warehouse repurchase facility matures in June 2009 ($150 million). We expect both facilities to be renewed or replaced with other facilities when they mature. Additionally, we recently entered into an on going 60-day committed repurchase facility for $75 million.
Title Insurance and Closing Services
We provide title insurance and title and closing services andas well as other ancillary services to our homebuyers and others. WeDuring 2008, we provided title and closing services for approximately 161,300105,900 real estate transactions, and issued approximately 195,70096,700 title insurance policies and provided title insurance underwriting during 2006 through subsidiaries ofour underwriter, North American Title Insurance Company. Title and closing services and title insurance underwriting are provided by agency subsidiaries in Arizona, California, Colorado, District of Columbia, Florida, Illinois, Maryland, Minnesota, Nevada, New Jersey, New York, Pennsylvania, Texas, Virginia and Wisconsin.Wisconsin.Title insurance services are provided in these same states, as well, as in Delaware and the Carolinas.
Communication Services
Lennar Communications Ventures oversees our interests and activities in relationships with providers of advanced communication services and provides cable television and high-speed Internet services to residents of our communities and others.others and oversees our interests and activities in relationships with providers of advanced communication services. We exited the Sacramento, California market during 2008. At December 31, 2006,2008, we had approximately 11,3003,100 subscribers across California, Florida andin Texas.
Seasonality
We have historically experienced variability in our results of operations from quarter-to-quarter due to the seasonal nature of the homebuilding business. Currently,Due to deteriorating market conditions, we are currently focusing our efforts, in all quarters, on assetinventory management and our homebuilding manufacturing process, in order to achieve a more evenflow production of home deliveries
5
throughout the year. Evenflow production involves determining the appropriate production levels based on demand in the market,deliver inventory and is driven by a defined production schedule designed to produce a more consistent level of starts and deliveries throughout the year in order to gain production efficiencies. If our efforts at evenflow production are successful, the result should be a reduction in inventory cycle time and more consistent start, completion and delivery dates.generate cash.
Competition
The residential homebuilding industry is highly competitive. We compete for homebuyers in each of the market regions where we operate with numerous national, regional and local homebuilders, as well as with resales of existing homes and with the rental housing market. Recently, lenders’ efforts to sell foreclosed homes have become an increasingly competitive factor. We compete for homebuyers on the basis of a number of interrelated factors including location, price, reputation, amenities, design, quality and financing. In addition to competition for homebuyers, we also compete with other homebuilders for desirable properties, raw materials and reliable, skilled labor. We compete for land buyers with third parties in our efforts to sell land to homebuilders and others. We believe we are competitive in the market regions where we operate primarily due to our:
Balance sheet, where we continue to focus on liquidity while maintaining a strong capital structure;inventory management and liquidity;
ExcellentAccess to land, position, particularly in land-constrained markets;
Intense focus on salesmanship and increasing our access to various marketing channels; and
Pricing to current market conditions through higher sales incentives offered to homebuyers.
Our financial services operations compete with other mortgage lenders, including national, regional and local mortgage bankers and brokers, banks, savings and loan associations and other financial institutions, in the origination and sale of mortgage loans. Principal competitive factors include interest rates and other features of mortgage loan products available to the consumer. We compete with other title insurance agencies and underwriters for closing services and title insurance. Principal competitive factors include service and price. We compete with other communication service providers in the sale of high-speed Internet and cable television services. Principal competitive factors include price, quality, service and availability.
Regulation
Homes and residential communities that we build must comply with state and local laws and regulations relating to, among other things, zoning, construction permits or entitlements, construction material requirements, density requirements, and requirements relating to building design and property elevation, building codes and handling of waste. These include laws requiring the use of construction materials that reduce the need for energy-consuming heating and cooling systems. These laws and regulations are subject to frequent change and often increase construction costs. In some instances, we must comply with laws that require commitments from us to provide roads and other offsite infrastructure to be in place prior to the commencement of new construction. These laws and regulations are usually administered by counties and municipalities and may result in fees and assessments or building moratoriums. In addition, certain new development projects are subject to assessments for schools, parks, streets and highways and other public improvements, the costs of which can be substantial.
The residential homebuilding industry is also subject to a variety of local, state and federal statutes, ordinances, rules and regulations concerning the protection of health and the environment. These environmental laws include such areas as storm water and surface water management, soil, groundwater and wetlands protection, subsurface conditions and air quality protection and enhancement. Environmental laws and existing conditions may result in delays, may cause us to incur substantial compliance and other costs and may prohibit or severely restrict homebuilding activity in environmentally sensitive regions or areas.
In recent years, several cities and counties in which we have developments have submitted to voters “slow growth” initiatives and other ballot measures that could impact the affordability and availability of land suitable for residential development within those localities. Although many of these initiatives have been defeated, we believe that if similar initiatives were approved, residential construction by us and others within certain cities or counties could be seriously impacted.
In order to make it possible for some of our homebuyers to obtain FHA-insured or VA-guaranteed mortgages, we must construct the homes they buy in compliance with regulations promulgated by those agencies.
6
Various states have statutory disclosure requirements relating to the marketing and sale of new homes. These disclosure requirements vary widely from state-to-state. In addition, some states require that each new home be registered with the state at or before the time title is transferred to a buyer (e.g., the Texas Residential Construction Commission Act).
In some states, we are required to be registered as a licensed contractor and comply with applicable rules and regulations. In various states, our new home consultants are required to be registered as licensed real estate agents and to adhere to the laws governing the practices of real estate agents.
Our mortgage and title subsidiaries must comply with applicable real estate laws and regulations. The subsidiaries are licensed in the states in which they do business and must comply with laws and regulations in those states. These laws and regulations include provisions regarding capitalization, operating procedures, investments, lending and privacy disclosures, forms of policies and premiums.
Our cable subsidiary is generally required to both secure a franchise agreement with each locality in which it operates and to satisfy requirements of the Federal Communications Commission in the ordinary conduct of its business.
A subsidiary of The Newhall Land and Farming Company, (“Newhall”) of which we currently, indirectly own 50%16%, provides water to a portion of Los Angeles County, California. This subsidiary is subject to extensive regulation by the California Public Utilities Commission. In December 2006, subsequent
Compliance Policy
We have a Code of Business and Ethics that requires every associate (i.e., employee) and officer to at all times deal fairly with the Company’s customers, subcontractors, suppliers, competitors and associates, and says that all our associates, officers and directors are expected to comply at all times with all applicable laws, rules and regulations. Despite this, there are instances in which subcontractors or others through which we do business engage in practices that do not comply with applicable regulations and guidelines. There have been instances in which some of our employees were aware of these practices and did not take steps to prevent them. When we learn of practices relating to homes we build or financing we provide that do not comply with applicable regulations or guidelines, we move actively to stop the non-complying practices as soon as possible and we have taken disciplinary action with regard to our fiscal year end, weemployees who were aware of the practices, including in some instances terminating their employment. Our Code of Business and LNR Property Corporation entered into an agreementEthics also has procedures in place that allows whistleblowers to admit a new strategic partner intosubmit their concerns regarding our LandSource joint venture, which owns Newhall (See Note 22operations, financial reporting, business integrity or any other related matter to the Audit Committee of our consolidated financial statements in Item 8Board of this Report).Directors and/or to the non-management directors of our Board of Directors, thus ensuring their protection from retaliation.
Employees
At December 31, 2006,2008, we employed 12,6054,704 individuals of whom 9,0182,940 were involved in our homebuilding operations and 3,5871,764 were involved in our financial services operations. We believeoperations, compared to November 30, 2007, when we employed 7,745 individuals of whom 5,150 were involved in our relations withhomebuilding operations and 2,595 were involved in our employees are good.financial services operations. We do not have collective bargaining agreements relating to any of our employees. However, we subcontract many phases of our homebuilding operations and some of the subcontractors we use have employees who are represented by labor unions.
Relationship with LNR Property Corporation
In 1997, we transferred our commercial real estate investment and management business to LNR Property Corporation (“LNR”), and spun-off LNR to our stockholders. As a result, LNR became a publicly-traded company, and the family of Stuart A. Miller, our President, Chief Executive Officer and a Director, which had voting control of us, became the controlling shareholder of LNR.
Since the spin-off, we have entered into a number of joint ventures and other transactions with LNR. Many of the joint ventures were formed to acquire and develop land, part of which was subsequently sold to us or other homebuilders for residential building and part of which was subsequently sold to LNR for commercial development. Because for a number of years after the spin-off LNR was controlled by Mr. Miller and his family, all significant transactions we or our subsidiaries engaged in with LNR or entities in which it had an interest were reviewed and approved by the Independent Directors Committee of our Board of Directors.
In January 2004, a company of which we and LNR each own 50% acquired The Newhall Land and Farming Company (“Newhall”) for approximately $1 billion. The purchase price was paid with (1) approximately $200 million we contributed to the jointly-owned company, (2) approximately $200 million LNR contributed to the jointly-owned company, (3) a $400 million term loan borrowed under $600 million of bank financing obtained by the jointly-owned company and another company of which we and LNR each owned 50% and (4) approximately $217 million from the proceeds of a sale by Newhall of income-producing properties to LNR. Newhall owns approximately 48,000 acres in California, including approximately 34,000 acres in north Los Angeles County that includes two master-planned communities. In connection with the acquisition, we agreed to purchase 687 homesites and received options to purchase an additional 623 homesites from Newhall.
On November 30, 2004, we and LNR each transferred our interests in most of our joint ventures to the jointly-owned company that had acquired Newhall, and that company was renamed LandSource Communities Development LLC (“LandSource”). In December 2006, subsequent to our fiscal year end, we and LNR entered into an agreement to admit a new strategic partner into our LandSource joint venture (See Note 22 to our consolidated financial statements in Item 8 of this Report).
7
In February 2005, LNR was acquired by a privately-owned entity. Although Mr. Miller’s family acquiredwas required to purchase a 20.4% financial interest in that privately-owned entity, this interest is non-voting and neither Mr. Miller nor anybodyanyone else in his family is an officer or director, or otherwise is involved in the management, of LNR or its parent. Nonetheless, because the Miller family has a 20.4% financial, non-voting, interest in LNR’s parent, significant transactions with LNR, or entities in which it has an interest, are stillhave historically been and continued to be reviewed and approved by the Independent Directors Committee of our Board of Directors.
LandSource Transactions
In January 2004, a company of which we and LNR each owned 50% acquired The Newhall Land and Farming Company (“Newhall”) for approximately $1 billion, including $200 million we contributed and $200 million that LNR contributed (the remainder came from borrowings and sales of properties to LNR). Subsequently, we and LNR each transferred our interests in most of our joint ventures to the jointly-owned company that had acquired Newhall, and that company was renamed LandSource Communities Development LLC (“LandSource”).
In February 2007, LandSource admitted MW Housing Partners as a new strategic partner. As part of the transaction, the joint venture obtained $1.6 billion of non-recourse financing, which consisted of a $200 million five-year Revolving Credit Facility, a $1.1 billion six-year Term Loan B Facility and a $244 million seven-year Second Lien Term Facility. The transaction resulted in a cash distribution to us of $707.6 million. Our resulting ownership of LandSource was 16%. As a result of the recapitalization, we recognized a pretax financial statement gain of $175.9 million in 2007.
In June 2008, our LandSource unconsolidated joint venture and a number of its subsidiaries commenced proceedings under Chapter 11 of the Bankruptcy Code in the United States Bankruptcy Court for the District of Delaware. In November 2008, our land purchase options with LandSource were terminated, thus we recognized a deferred profit of $101.3 million (net of $31.8 million of write-offs of option deposits and pre-acquisition costs and other write-offs) related to the 2007 recapitalization of LandSource. The bankruptcy filing could result in LandSource losing some or all of the properties it owns, termination of our management agreement with LandSource, claims against us and a substantial reduction (or total elimination) of our 16% ownership interest in LandSource, which had a carrying value of zero at November 30, 2008.
NYSE CertificationsCertification
We submitted our 20052007 Annual CEO Certification to the New York Stock Exchange on April 20, 2006.14, 2008. The certification was not qualified in any respect.
Available Information
Our corporate website is www.lennar.com. We make available on our website, free of charge, our Annual Report on Form 10-K, quarterly reports on Form 10-Q, current reports on Form 8-K and any amendments to these reports, as soon as reasonably practicable after we electronically file these documents with, or furnish them to, the Securities and Exchange Commission. Information on our website is not part of this document.
Our website also includes printable versions of our Corporate Governance Guidelines, our Code of Business Conduct and Ethics and the charters for each of our Audit, Compensation and Nominating and Corporate Governance Committees of our Board of Directors. Each of these documents is also available in print to any stockholder who requests a copy by addressing a request to:
Lennar Corporation
Attention: Office of the General Counsel
700 Northwest 107th Avenue
Miami, Florida 33172
Item 1A. Risk Factors.
If any of theThe following risks develop into actual events,may cause a material adverse effect upon our business, financial condition, results of operations, cash flows, strategies and prospects could be materially adversely affected.prospects.
Homebuilding Market and Economic Risks
The homebuilding industry is in the midst of a significant downturn. A significantcontinuing decline in demand for new homes coupled with an increase in the inventory of available new homes and alternatives to new homes could adversely affectsaffect our sales volume and pricing.pricing even more than has occurred to date.
In 2006,The homebuilding industry is in the homebuilding industrymidst of a significant downturn. As a result, we have experienced a significant decline in demand for newly built homes in manyalmost all of our markets. The decline followed an unusually long periodHomebuilders’ inventories of strong demand for new homes. Some of this strong demand resulted from “speculators” purchasing
unsold new homes with the intention of selling them at a profit, rather than with the intention of living in them. In many instances, the speculators do not have the financial resources to retain the purchased homes, and are selling these homes at depressed prices. Inventories of new homes have also increased as a result of increased cancellation rates on pending contracts as new homebuyers sometimes find it more advantageous to forfeit a deposit than to complete the purchase of the home. In addition, an oversupply of alternatives to new homes, such as rental properties and used homes (including foreclosed homes), has depressed prices and reduced margins. This combination of lower demand and higher inventories affects both the number of homes we can sell and the prices at which we can sell them. In 2007 and 2008, we experienced a significant decline in our sales results, significant reductions in our margins as a result of higher levels of sales incentives and price concessions, and a higher than normal cancellation rate. We have no basis for predicting how long demand and supply will remain out of balance in markets where we operate or whether, even if demand and supply come back in balance, sales volumes or pricing will return to prior levels.
Demand for new homes is sensitive to economic conditions over which we have no control.control, such as the availability of mortgage financing and the level of employment.
Demand for homes is sensitive to changes in economic conditions such as the level of employment, consumer confidence, consumer income, the availability of financing and interest rate levels. During 2007 and 2008, the mortgage lending industry experienced significant instability. As a result of increased default rates, particularly (but not entirely) with regard to sub-prime and other non-conforming loans, many lenders have reduced their willingness to make, and tightened their credit requirements with regard to, residential mortgage loans. Fewer loan products and stricter loan qualification standards have made it more difficult for some borrowers to finance the purchase of our homes. Although our finance company subsidiaries offer mortgage loans to potential buyers of most of the market experiencedhomes we build, we may no longer be able to offer financing terms that are attractive to our potential buyers. Lack of availability of mortgage financing at acceptable rates reduces demand for the homes we build, including in some increase in mortgage interest rates during 2006, mortgage interest rates remain lower than their historical averages. If mortgage interest rates increase or if anyinstances causing potential buyers to cancel contracts they have signed.
There has also been a substantial loss of these other economic factors adversely change nationally, orjobs in the markets where we operate, the abilityUnited States during 2008. People who are not employed or willingnessare concerned about loss of prospective buyerstheir jobs are unlikely to purchase new homes couldand may be forced to try to sell the homes they owned. Therefore, the current employment situation can adversely affectedaffect us both by reducing demand for the homes we build and cancellationsby increasing the supply of pending contracts could further increase, resulting in a decrease in our revenues and earnings.homes for sale.
8
Increasing interest rates could causeMortgage defaults forby homebuyers who financed homes using non-traditional financing products which could increaseare increasing the number of homes available for resale.
During the recent timeperiod of high demand in the homebuilding industry, many homebuyers financed their purchases using non-traditional adjustable rate or interest only mortgages or other mortgages, including sub-prime mortgages that involveinvolved at least during initial years, monthly payments that were significantly lower initial monthly payments.than those required by conventional fixed rate mortgages. As a result, new homes have beenbecame more affordable in recent years.affordable. However, as monthly payments for these homes increase either as a result of increasing adjustable interest rates or as a result of principal payments coming due, some of these homebuyers could defaulthave defaulted on their payments and havehad their homes foreclosed, which would increasehas increased the inventory of homes available for resale. This is likely to continue. Foreclosure sales and other distress sales may result in further declines in market prices for homes. In an environment of declining prices, many homebuyers may delay purchases of homes in anticipation of lower prices in the future. In addition, ifas lenders perceive deterioration in credit quality among homebuyers, lenders may eliminatehave been eliminating some of the available non-traditional and sub-prime financing products or increaseand increasing the qualifications needed for mortgages or adjustadjusting their terms to address any increased credit risk. In general, ifto the extent mortgage rates increase or lenders make it more difficult for prospective buyers to finance home purchases, it could becomebecomes more difficult or costly for customers to purchase our homes, which would havehas an adverse affecteffect on our sales volume.
We sell substantially allhave had to take significant write-downs of the loanscarrying values of the land we originate withinown and of our investments in unconsolidated entities, and a short periodcontinuing decline in land values could result in additional write-downs.
Some of the land we currently own was purchased at high prices. Also, we obtained options to purchase land at prices that no longer are attractive, and in connection with those options we made non-refundable deposits and, in some instances, agreed to incur pre-acquisition land development costs. When demand fell, we were required to take substantial write-downs of the carrying value of our land inventory and we elected not to exercise high price options, even though that required us to forfeit deposits and write-off pre-acquisition land development costs.
Additionally, as a result of these market conditions, we recorded significant valuation adjustments relating to our investments in unconsolidated entities. The valuation adjustments were SFAS 144 valuation adjustments to assets of our unconsolidated entities and APB 18 valuation adjustments to our investments in unconsolidated entities.
The combination of land value write-downs and forfeitures in addition to valuation adjustments relating to our investments in unconsolidated entities had a material negative effect on our operating results for fiscal 2006, 2007 and 2008, contributing to most of our net losses in fiscal 2007 and 2008. If market conditions continue to deteriorate, some of our assets may be subject to further write-downs in the secondary mortgage marketfuture, decreasing the assets reflected on a servicing released, non-recourse basis; however, we remain liable for certain limited representationsour balance sheet and warranties related to loan sales and certain limited repurchase obligations in the event of early borrower default.adversely affecting our stockholders’ equity.
Inflation can adversely affect us, particularly in a period of declining home sale prices.
Inflation can have a long-term impact on us because increasing costs of land, materials and labor may require us to attempt to increase the sale prices of homes in order to maintain satisfactory margins. However,Although an excess of supply over demand for new homes, such as the increased inventory of new homesone we are currently experiencing, requires that we decreasereduce prices, rather than increasing them, it does not necessarily result in orderreductions, or prevent increases, in the costs of materials and labor. Under those circumstances, the effect of cost increases is to attempt to maintain sales volume. This deflation in sales price, in addition to impacting ourreduce the margins on newthe homes also reduces the value of our land inventory andwe sell. That makes it more difficult for us to recover the full cost of previously purchased land, in new home sales prices or, if we choose,and has contributed to dispose of land assets. In addition, depressed land values may cause us to walk away from deposits on option contracts if we cannot satisfactorily renegotiate the purchase price of the optioned land.
A declinesignificant reductions in land values could result in impairment write-downs.
Some of the land we currently own was purchased at prices that reflected the recent high demand cycle in the homebuilding industry. As a result, during the fourth quarter of 2006 we recorded material inventory valuation adjustments. If market conditions continue to deteriorate, some of these assets may be subject to future impairment write-downs, decreasing the value of our assets as reflected on our balance sheet and adversely affecting our stockholders’ equity.land inventory.
We face significant competition in our efforts to sell homes.
The homebuilding industry is highly competitive. We compete in each of our markets with numerous national, regional and local homebuilders. This competition with other homebuilders could reduce the number of homes we deliver or cause us to accept reduced margins in order to maintain sales volume.
We also compete with the resale of existing homes, including foreclosed homes, sales by housing speculators and available rental housing. As demand for homes has slowed, competition, including competition with homes purchased for speculation rather than as places to live and competition with foreclosed homes, has created increased downward pressure on the prices at which we are able to sell homes, as well as upon the number of homes we can sell.
Operational Risks
Homebuilding is subject to warranty and liability claims in the ordinary course of business that can be significant.
As a homebuilder, we are subject to home warranty and construction defect claims arising in the ordinary course of business. We are also subject to liability claims arising in the course of construction activities. We record warranty and other reserves for the homes we sell based on historical experience in our markets and our judgment of the qualitative risks associated with the types of homes we built. We have, and many of our subcontractors have, general liability, property, errors and omissions, workers compensation and other business insurance. These insurance policies protect us against a portion of our risk of loss from claims, subject to certain self-insured retentions, deductibles and other coverage limits. However, because of the uncertainties inherent in these matters, we cannot provide assurance that our insurance coverage or our subcontractor arrangementssubcontractors’ insurance and financial resources will be adequate to address all warranty, construction defect and liability claims in the future. Additionally, the coverage offered by and the availability of general liability insurance for construction defects are currently limited and costly. As a result, an increasing number of our subcontractors are unable to obtain insurance, and we have in many cases waived our customary insurance requirements. There can be no assurance that coverage will not be further restricted and become even more costly.
9
Natural disasters and severe weather conditions could delay deliveries, increase costs and decrease demand for new homes in affected areas.
OurMany of our homebuilding operations are locatedconducted in many areas that are subject to natural disasters and severe weather. The occurrence of natural disasters or severe weather conditions can delay new home deliveries, increase costs by damaging inventories and negatively impact the demand for new homes in affected areas. Furthermore, if our insurance does not fully cover business interruptions or losses resulting from these events, our earnings,results of operations, liquidity or capital resources could be adversely affected.
Supply shortages and other risks related to the demand for skilled labor and building materials could increase costs and delay deliveries.
Increased costs or shortages of skilled labor and/or lumber, framing, concrete, steel and other building materials could cause increases in construction costs and construction delays. We generally are unable to pass on increases in construction costs to customers who have already entered into sales contracts, as those sales contracts generally fix the price of the homes at the time the contracts are signed, which may be well in advance of the construction of the home. Sustained increases in construction costs may, over time, erode our margins, particularly if pricing competition restricts our ability to pass on any additional costs of materials or labor, thereby decreasing our margins.
We may not be able to acquire land suitable for residential homebuilding at reasonable prices, which could increase our costs and reduce our revenues, earnings and margins.
Our long-term ability to build homes depends upon our acquiring land suitable for residential building at reasonable prices in locations where we want to build. During the past few years, we have experienced an increase in competition for suitable land as a result of land constraints in many of our markets. As competition for suitable land increases, and as available land is developed, the cost of acquiring additional suitable land could rise, and in some areas no suitable land may be available at reasonable prices. Any land shortages or any decrease in the supply of suitable land at reasonable prices could limit our ability to develop new communities or result in increased land costs that we are not able to pass through to our customers. This could adversely impact our revenues, earnings and margins.
Reduced numbers of home sales force us to absorb additional costs.
We incur many costs even before we begin to build homes in a community. These include costs of preparing land and installing roads, sewage and other utilities, as well as taxes and other costs related to ownership of the land on which we plan to build homes. Reducing the rate at which we build homes extends the length of time it takes us to recover these costs. Also, we frequently acquire options to purchase land and make deposits that will be forfeited if we do not exercise the options within specified periods. Because of current market conditions, we have had to terminate somea number of these options, resulting in forfeituresignificant forfeitures of deposits we made with regard to the options.
If our financial performance further declines, we may not be able to maintain compliance with the covenants in our credit facilities and senior debt securities.
Our credit facility imposes certain restrictions on our operations. The most significant restrictions relate to debt incurrence, sales of assets, cash distributions and investments by us and certain of our subsidiaries. In addition, our credit facility requires compliance with certain financial covenants, including a minimum adjusted consolidated tangible net worth requirement and a maximum permitted leverage ratio. Also, because we currently do not have investment grade debt ratings, we can only borrow up to specified percentages of the book values of various types of our assets, referred to in the credit agreement as our borrowing base. In January and November 2008, we completed amendments to the credit facility that modified the minimum adjusted consolidated tangible net worth requirement and restructured the borrowing base among other changes. The amendments also limit the amount of permissible joint venture recourse obligations, requiring that those obligations be reduced quarterly through July 2011. Under the November 2008 amendment, the commitment was reduced from $1.5 billion to $1.1 billion.
While $1.1 billion of borrowing capacity should be sufficient in the current depressed market, if markets strengthen, we might have to seek increased borrowing capacity.
While we currently are in compliance with the financial covenants in the amended credit agreement, if we had to record significant additional impairments in the future, they could cause us to fail to comply with the amended credit agreement debt covenants. In addition, if we default in the payment or performance of certain obligations relating to the debt of unconsolidated entities above a specified threshold amount, we would be in default under the amended credit agreement. Either of those events would give the lenders the right to cause any amounts we owe under that credit facility to become immediately due. If we were unable to repay the borrowings when they became due, that could entitle the holders of $2.2 billion of debt securities we have sold into the capital markets to cause the sums evidenced by those debt securities to become due immediately. We would not be able to repay those amounts without selling substantial assets, which we might have to do at prices well below the long term fair values, and the carrying values, of the assets.
We may be unable to obtain suitable financing and bonding for the development of our communities.
Our business requires that we are abledepends upon our ability to obtain financing for the development of our residential communities and to provide bonds to ensure the completion of our projects. We currently use our $2.7 billion credit facility to provide some of the financing we need. In addition, we have from time-to-time raised funds by selling debt securities into public and private capital markets.markets although this would be difficult to do under current market conditions. As is noted above, a recent amendment to our credit agreement reduced the commitment to $1.1 billion. The willingness of lenders to make funds available to us could behas been affected both by reductionsfactors relating to us as a borrower, and by a decrease in the amounts they are willingwillingness of banks and other lenders to lend to homebuilders generally, even if we continue to maintain a strong balance sheet.generally. If we were unable to finance the development of our communities through our credit facility or other debt, or if we were unable to provide required surety bonds for our projects, our business operations and revenues could suffer materially.
Our ability to continue to grow our business and operations in a profitable manner depends to a significant extent upon our ability to access capital on favorable terms.
Our ability to access capital on favorable terms has been an important factor in growing our business and operations in a profitable manner. Recently, each of the principal credit rating agencies lowered our credit rating, and we no longer have investment grade ratings. This will make it more difficult and costly for us to access the debt capital markets for funds we may require in order to implement our business plans and achieve our growth objectives. If we are subject to a further downgrade, it would exacerbate such difficulties.
The credit facilities of our Financial Services segment will expire in 2009.
Our Financial Services segment has a syndicated warehouse repurchase facility, which matures in April 2009 ($125 million, plus a $50 million temporary accordion feature that expired in December 2008) and a warehouse repurchase facility, which matures in June 2009 ($150 million). The Financial Services segment uses these facilities to finance its mortgage lending activities until the mortgage loans are sold to investors and expects both facilities to be renewed or replaced with other facilities when they mature. If we are unable to renew or replace these facilities when they mature in April 2009 and June 2009, it could seriously impede the activities of our Financial Services segment. The risk of inability to renew or replace these facilities may be significant if, as currently is the case, capital market participants are reluctant to purchase securities backed by residential mortgages.
Our competitive position could suffer if we were unable to take advantage of acquisition opportunities.
Our growth strategy depends in part on our ability to identify and purchase suitable acquisition candidates, as well as our ability to successfully integrate acquired operations into our business. Given current market conditions, executing this strategy by identifying opportunities to purchase at favorable prices companies that are having problems contending with the current difficult homebuilding environment may be particularly important. Not properly executing this strategy could put us at a disadvantage in our efforts to compete with other major homebuilders who are able to take advantage of such favorable acquisition opportunities.
10
Our ability to continue to grow our business and operations in a profitable manner depends to a significant extent upon our ability to access capital on favorable terms.
At present, our access to capital is enhanced by the fact that our senior debt securities have an investment-grade credit rating from each of the principal credit rating agencies. If we were to lose our investment-grade credit rating for any reason, it would become more difficult and costly for us to access the capital that is required in order to implement our business plans and achieve our growth objectives.
We might have difficulty integrating acquired companies into our operations.
The integration of operations of acquired companies with our operations, including the consolidation of systems, procedures, personnel and facilities, the relocation of staff, and the achievement of anticipated cost savings, economies of scale and other business efficiencies, presents significant challenges to our management, particularly if several acquisitions occur at the same time.
The performanceWe conduct some of our operations through unconsolidated joint ventures with independent third parties in which we do not have a controlling interest and we can be adversely impacted by joint venture partners’ failure to fulfill their obligations.
For a number of years, we created and participated in joint ventures that acquired and developed land for our homebuilding operations, for sale to third parties or for use in their own homebuilding operations. Through these joint ventures, we reduced the amount we had to invest in order to assure access to potential future homesites, and, in some instances, we obtained access to land to which we could not otherwise have obtained access or could not have obtained access on as favorable terms. However, as the homebuilding market deteriorated from 2006 through 2008, many of our joint venture partners is importantbecame financially unable or unwilling to fulfill their obligations.
Most joint ventures borrowed money to help finance their activities, and although recourse on the loans was generally limited to the continued success ofjoint ventures and their properties, frequently we and our joint venture strategies.partners were required to provide maintenance guarantees (guarantees that the values of the joint ventures’ assets would be at least specified percentages of their borrowings) or limited repayment guarantees.
Our joint venture strategy depends in large part on the ability of our joint venture partners to perform their obligations under our agreements with them. If a joint venture partner does not perform its obligations, we may be required to make significant financial expenditures or otherwise undertake the performance of obligations not satisfied by our partner at significant cost to us. Also, when we have guaranteed joint venture obligations, we have been given the right to be reimbursed by our joint venture partners for any amounts by which we pay more than our pro rata share of the joint ventures’ obligations. However, particularly if our joint venture partners are having financial problems, we may have difficulty collecting the sums they owe us, and therefore, we may be
required to pay a disproportionately large portion of the guaranteed amounts. In addition, because we lack a controlling interest in these joint ventures, we are usually unable to require that they sell assets, return invested capital or take any other action without the consent of at least one of our joint venture partners. As a result, without joint venture partner consent, we may be unable to liquidate our joint venture investments to generate cash. Even if we are able to liquidate joint venture investments, the amounts received upon liquidation may be insufficient to cover the costs we have incurred in satisfying joint venture obligations.
During 2007 and 2008, we began to reduce the number of joint ventures in which we participate and the recourse indebtedness of such joint ventures. However, the risks to us from joint ventures in which we are a participant are likely to continue at least as long as the value of residential properties continues to decline.
The unconsolidated entities in which we have investments may not be able to modify the terms of their debt arrangements.
Some of the unconsolidated entities’ debt arrangements contain financial covenants they may not be able to meet. Additionally, certain joint venture loan agreements have minimum number of homesite takedown requirements in which the joint ventures are required to sell a minimum amount of homesites over a stated amount of time. Due to the deterioration of the homebuilding market, many of the joint ventures are in the process of repaying, refinancing, renegotiating or extending our joint venture loans. This action may be required, for example, in the case of an expired maturity date or a failure to comply with the loan’s covenants. There can be no assurance that we will be able to successfully finance, refinance, renegotiate or extend, on terms we deem acceptable, all of the joint venture loans that we are currently in the process of negotiating. If we were unsuccessful in these efforts, we could be required to repay one or more of these loans.
We could be hurtinjured by the LandSource Chapter 11 filing.
LandSource was the largest joint venture in which we were a participant. Originally, we owned 50% of LandSource. However, in February 2007, LandSource admitted a new strategic partner and LandSource was recapitalized, which resulted in a cash distribution to us of $707.6 million, but reduced our ownership to 16%. In connection with the recapitalization, we entered into a new agreement to manage LandSource and received land purchase options from LandSource.
In June 2008, LandSource and a number of its subsidiaries commenced proceedings under Chapter 11 of the Bankruptcy Code. In November 2008, our land purchase options with LandSource were terminated (which resulted in us recognizing a deferred profit of $101.3 million, net of $31.8 million of write-offs, related to the 2007 recapitalization). It is possible that LandSource will seek to disaffirm our management agreement as well. It is also possible that LandSource will seek to recover at least some of what was distributed to us in the recapitalization.
We could be adversely impacted by the loss of key management personnel.
Our future success depends, to a significant degree, on the efforts of our senior management. Our operations could be adversely affected if key members of senior management cease to be active in our company. As a result of a decline in our stock price, previous retention mechanisms, such as equity awards, have diminished in value.
If our ability to resell mortgages to investors is impaired, we may be required to broker loans or fund them ourselves.
We sell substantially all of the loans we originate within a short period in the secondary mortgage market on a servicing released, non-recourse basis; although, we remain liable for certain limited representations and warranties related to loan sales. If there is a decline in the secondary mortgage market, our ability to sell mortgages could be adversely impacted and we could be required to fund our commitments to our buyers with our own financial resources or require our buyers to find other sources of financing. If we became unable to sell loans into the secondary mortgage market or directly to the Federal National Mortgage Association (“Fannie Mae”) and the Federal Home Loan Mortgage Corporation (“Freddie Mac”), we would either have to curtail our origination of mortgage loans, which among other things, could significantly reduce our ability to sell homes, or to commit our own funds to long term investments in mortgage loans, which could, among other things, delay the time when we recognize revenues from home sales on our statements of operations.
Our Financial Services segment could have difficulty financing its activities.be adversely affected by reduced demand for our homes.
A majority of the mortgage loans made by our Financial Services segment are made to buyers of homes we build. Therefore, a decrease in the demand for our homes adversely affects the financial results of this segment of our business.
If housing markets improve, we may not be able to acquire land suitable for residential homebuilding at reasonable prices, which could increase our costs and reduce our revenues, earnings and margins.
Our Financial Services segment has warehouse lineslong-term ability to build homes depends upon our acquiring land suitable for residential building at reasonable prices in locations where we want to build. For a number of credit totaling $1.4 billion. It usesyears, we experienced an increase in competition for suitable land as a result of land constraints in many of our markets. That increased the price we had to pay to acquire land. Then, when demand for new homes began to drop beginning in 2006, we started to reduce our land inventory to bring it in line with the reduced rate at which we were absorbing land into our operations. While the current low demand for new single family homes is making it possible to purchase land at prices far below those lineswe were required to finance its lending activities until it accumulates sufficient mortgage loanspay prior to 2006, in the long term, competition for suitable land is likely to increase again, and as available land is developed, the cost of acquiring additional suitable land could rise, and in some areas suitable land might not be available at reasonable prices. Any land shortages or any decrease in the supply of suitable land at reasonable prices could limit our ability to develop new communities or result in increased land costs that we are not able to sell them into the capital markets. These warehouse lines of credit mature in September 2007 ($700 million)pass through to our customers. This could adversely impact our revenues, earnings and in April 2008 ($670 million). If we are unable to renew or extend these debt arrangements when they mature, our Financial Services segment’s mortgage lending activities may be adversely affected.margins.
Regulatory Risks
Federal laws and regulations that adversely affect liquidity in the secondary mortgage market could hurt our business.
RecentChanges in federal laws and regulations could have the effect of curtailing the activities of the Federal National Mortgage Association (Fannie Mae)Fannie Mae and the Federal Home Loan Mortgage Corporation (Freddie Mac).Freddie Mac. These organizations provide significant liquidity to the secondary mortgage market. Any curtailment of their activities could increase mortgage interest rates and increase the effective cost of our homes, which could reduce demand for our homes and adversely affect our results of operations.
The federal financial institution agencies recently issued their final Interagency Guidance on Nontraditional Mortgage Products (“Guidance”). This Guidance applies to credit unions, banks and savings associations and their subsidiaries, and bank and savings association holding companies and their subsidiaries. Although the Guidance does not apply to independent mortgage companies, it likely will affect the origination operations of many mortgage companies that broker or sell nontraditional mortgage loan products to such entities. This Guidance could reduce the number of potential customers who could qualify for loans to purchase homes from us and others.
Government entities in regions where we operate have adopted or may adopt, slow or no growth initiatives, which could adversely affect our ability to build or timely build in these areas.
Some state and local governments in areas where we operate have approved, and others where we operate may approve, various slow growth or no growth homebuilding initiatives and other ballot measures that could negatively impact the availability of land and building opportunities within those jurisdictions. Approval of slow
11
growth, no growth or similar initiatives (including the effect of these initiatives on existing entitlements and zoning) could adversely affect our ability to build or timely build and sell homes in the affected markets and/or create additional administrative and regulatory requirements and costs, which, in turn, could have an adverse effect on our future revenues and earnings.
Compliance with federal, state and local regulations related to our business could create substantial costs both in time and money, and some regulations could prohibit or restrict some homebuilding ventures.
We are subject to extensive and complex laws and regulations that affect the land development and homebuilding process, including laws and regulations related to zoning, permitted land uses, levels of density, building design, elevation of properties, water and waste disposal and use of open spaces. In addition, we are subject to laws and regulations related to workers’ health and safety. We also are subject to a variety of local, state and federal laws and regulations concerning the protection of health and the environment. In some of the markets where we operate, we are required by law to pay environmental impact fees, use energy-saving construction materials and give commitments to municipalities to provide certain infrastructure such as roads and sewage systems. We generally are required to obtain permits, entitlements and approvals from local authorities to commence and carry out residential development or home construction. Such permits, entitlements and approvals may, from time-to-time, be opposed or challenged by local governments, neighboring property owners or other interested parties, adding delays, costs and risks of non-approval to the process. Our obligation to comply with the laws and regulations under which we operate, and our obligation to ensure that our employees, subcontractors and other agents comply with these laws and regulations, could result in delays in construction and land development, cause us to incur substantial costs and prohibit or restrict land development and homebuilding activity in certain areas in which we operate.
We can be injured by failures of persons who act on our behalf to comply with applicable regulations and guidelines.
Although we expect all of our associates (i.e., employees), officers and directors to comply at all times with all applicable laws, rules and regulations, there are instances in which subcontractors or others through whom we do business engage in practices that do not comply with applicable regulations or guidelines. Sometimes our employees have been aware of these practices but did not take steps to prevent them. When we learn of practices relating to homes we build or financing we provide that do not comply with applicable regulations or guidelines, we move actively to stop the non-complying practices as soon as possible and we have taken disciplinary action with regard to our employees who were aware of the practices, including in some instances terminating their employment. However, regardless of the steps we take after we learn of practices that do not comply with applicable regulations or guidelines, we can in some instances be subject to fines or other governmental penalties, and our reputation can be injured, due to the practices having taken place.
Tax law changes could make home ownership more expensive or less attractive.
Significant expenses of owning a home, including mortgage interest expense and real estate taxes, generally are deductible expenses for the purpose of calculating an individual’s federal, and in some cases state, taxable income, subject to various limitations under current tax law and policy.income. If the federal government or a state governmentwere to make changes to income tax laws as has been discussed recently, tothat eliminate or substantially reduce these income tax deductions, then the after-tax cost of owning a new home would increase substantially. This could adversely impact demand for, and/or sales prices of, new homes.
Recent proposed rule change by HUD could negatively impact our operations and revenue.
On November 17, 2008, the United States Department of Housing and Urban Development (“HUD”) issued a final rule (“Final Rule”) that amended the regulations pertaining to permissible affiliated business arrangements under the Real Estate Settlement Procedures Act (“RESPA”). The Final Rule has the effect of prohibiting homebuilders from providing incentives to their buyers for their buyers to use affiliated businesses. The Final Rule was to go into effect on January 16, 2009. A lawsuit has been filed against HUD alleging among other things that HUD did not have the statutory authority to prohibit such incentives. HUD has agreed to delay the implementation of the Final Rule until at least April 16, 2009 in order to give the court time to decide the legality of the Final Rule. If the Final Rule is implemented, it could have an adverse impact on our homebuilding, mortgage lending and title company operations.
Other Risks
We have a stockholder who can exercise significant influence over matters that are brought to a vote of our stockholders.
Stuart A. Miller, our President, Chief Executive Officer and a Director, has voting control, through personal holdings and family-owned entities, of Class A and Class B common stock that enables Mr. Miller to cast approximately 49% of the votes that may be cast by the holders of our outstanding Class A and Class B common stock combined. That probablyeffectively gives Mr. Miller the power to control the election of our directors and the approval of matters that are presented to our stockholders. Mr. Miller’s voting power might discourage someone from acquiring us or from making a significant equity investment in us, even if we needed the investment to meet our obligations and to operate our business. Also, because of his voting power, Mr. Miller may be able to authorize actions in matters that are contrary to our other stockholders’ desires.
Item 1B. Unresolved Staff Comments.
Not applicable.
12
Executive Officers of Lennar Corporation
Robert J. Strudler, who served as Chairman of our Board of Directors since 2004, passed away on November 7, 2006. Prior to Mr. Strudler’s appointment as Chairman in December 2004, he served as Lennar’s Vice Chairman and Chief Operating Officer from May 2000 through November 2004. As of the date of this Report, our Board of Directors has not appointed a new Chairman.
The following individuals are our executive officers as of February 8, 2007:January 26, 2009:
Name | Position | Age | ||
Stuart A. Miller | President and Chief Executive Officer | |||
Jonathan M. Jaffe | Vice President and Chief Operating Officer | |||
Richard Beckwitt | Executive Vice President | |||
Bruce E. Gross | Vice President and Chief Financial Officer | |||
| ||||
Diane J. Bessette | Vice President and | |||
Mark Sustana | Secretary and General Counsel | |||
David M. Collins | Controller | 39 |
Mr. Miller has served as our President and Chief Executive Officer since 1997 and is one of our Directors. Before 1997, Mr. Miller held various executive positions with us.
Mr. Jaffe has served as Vice President since 1994 and has served as our Chief Operating Officer since December 2004. Before that time, Mr. Jaffe served as a Regional President in our Homebuilding Division.operations. Additionally, prior to his appointment as Chief Operating Officer, Mr. Jaffe was one of our Directors from 1997 through June 2004.
Mr. Beckwitt has served as our Executive Vice President since March 2006. In this position, Mr. Beckwitt is involved in all operational aspects of our company, with a focus on new business and strategic growth opportunities.company. Mr. Beckwitt served on the Board of Directors of D.R. Horton, Inc. from 1993 to November 2003. From 1993 to March 2000, he held various executive officer positions at D.R. Horton, including President of the company.
Mr. Gross has served as Vice President and our Chief Financial Officer since 1997. Before that, Mr. Gross was Senior Vice President, Controller and Treasurer of Pacific Greystone Corporation.
Mr. Ames has served as Vice President since 1982 and has been responsible for Investor Relations since 2000.
Ms. Bessette joined us in 1995 and served as our Controller from 1997 to 2008. Since February 2008, she has served as our Controller since 1997.Treasurer. She was appointed a Vice President in 2000.
Mr. Sustana has served as our Secretary and General Counsel since 2005. Before joining Lennar, Mr. Sustana held various legal positions at GenTek, Inc., a manufacturer of communication products, industrial components and performance chemicals.
Mr. Collins joined us in 1998 and has served as our Controller since February 2008. Before becoming Controller, Mr. Collins served as our Executive Director of Financial Reporting.
Item 2. Properties.
We lease and maintain our executive offices in an office complex in Miami, Florida. We also lease and maintain regional offices in California and Texas. Our homebuilding and financial services offices are located in the markets where we conduct business, primarily in leased space. We believe that our existing facilities are adequate for our current and planned levels of operation.
Because of the nature of our homebuilding operations, significant amounts of property are held as inventory in the ordinary course of our homebuilding business. We discuss these properties in the discussion of our homebuilding operations in Item 1 of this Report.
13Item 3. Legal Proceedings.
We are party to various claims and lawsuits which arise in the ordinary course of business.business, but we do not consider the volume of our claims and lawsuits unusual given the number of homes we deliver and the fact that the lawsuits often relate to homes delivered several years before the lawsuits are commenced. Although the specific allegations in the lawsuits differ, they most of themcommonly involve claims that we failed to construct homes in particular communities in accordance with plans and specifications or applicable construction codes and seek reimbursement for sums allegedly needed to remedy the alleged deficiencies, assert contract issues or relate to personal injuries. Lawsuits of these types are common within the homebuilding industry. We are a plaintiff in many cases in which we seek contribution from our subcontractors for home repair costs. The costs incurred by us in construction defect lawsuits are offset by warranty reserves, our third party insurers, subcontractor insurers and indemnity contributions from subcontractors. We do not believe that the ultimate resolution of these claims
or lawsuits will have a material adverse effect on our business, financial position, results of operations or cash flows. From time-to-time, we also receive notices from environmental agencies regarding alleged violations of environmental laws. We typically settle these matters before they reach litigation for amounts that are not material to us.
In May 2008, we were named as the nominal defendant in a derivative suit in the United States District Court for the Southern District of Florida, Miami Division, entitledDoris Staehr, Derivatively on Behalf of Lennar Corporation v. Stuart A. Miller, et al., Case No. 08-20990-CIV, in which the plaintiff purports to assert claims for our benefit against some of our current and former officers and directors, primarily relating to allegedly inadequate or incorrect disclosures about the likelihood of a decline in the housing market and the effects it would have on us. We have moved to dismiss an amended complaint on the ground that the plaintiff failed to make a demand on our directors that under most circumstances is a prerequisite to a derivative suit. The actual defendants have moved to dismiss for that and other reasons. Because the suit is allegedly brought for our benefit, it does not seek any damages from us.
The following table discloses as of January 22, 2009, the approximate number of pending adversarial proceedings against us (including counterclaims against us in suits we brought) and the approximate number of pending suits by us, to the best of our knowledge. The table excludes simple mortgage foreclosures in which we have no interest and ordinary course disputes involving North American Title Group, Inc. It groups the proceedings against us by the amounts demanded in the complaints or a post-complaint demand. However, some complaints demand only the minimum amount required to bring suit in a particular forum, with the plaintiff intending to amend at a later point to insert a more specific claim for damages or to make some other damages assertion. Other complaints seek amounts many times the maximum conceivable damages. Accordingly, the groupings are not necessarily indicative of the amounts involved in the litigations.
Claims Against Lennar (and Lennar Claims Against Others) in Active Litigation or Arbitration as of January 22, 2009
| Amount of Claims Not Specified, or Lennar - - Asserted Without Counterclaim | Amount of Claims Against Lennar < $100,000 | Amount of Claims Against Lennar - $100,000 - $250,000 | Amount of Claims Against Lennar > $250,000 | Total Claims | |||||||
Construction | 52 | 46 | 15 | 90 | 203 | ||||||
Contract | 61 | 57 | 24 | 47 | 189 | ||||||
Premises liability/personal injury | 32 | 13 | 5 | 15 | 65 | ||||||
Employment | 5 | 3 | 3 | 7 | 18 | ||||||
Other | 62 | 28 | 10 | 25 | 125 | ||||||
Total | 212 | 147 | 57 | 184 | 600 | (1) | |||||
| Lennar is the plaintiff in 62 of |
Item 4. Submission of Matters to a Vote of Security Holders.
Not applicable.
14
PART II
Item 5. Market for Registrant’s Common Equity, Related Stockholder Matters and Issuer Purchases of Equity Securities.
Our Class A and Class B common stock are listed on the New York Stock Exchange under the symbols “LEN” and “LEN.B,” respectively. The following table shows the high and low sales prices for our Class A and Class B common stock for the periods indicated, as reported by the NYSE, and cash dividends declared per share:
Class A Common Stock High/Low Prices | Cash Dividends Per Class A Share | Class A Common Stock | Cash Dividends Per Class A Share | |||||||||||||||||||
Fiscal Quarter | 2006 | 2005 | 2006 | 2005 | 2008 | 2007 | 2008 | 2007 | ||||||||||||||
First | $ | 66.44 – 55.23 | $ | 62.49 – 44.15 | 16 | ¢ | 13 3/4 | ¢ | $21.64 – 11.98 | $ 56.54 – 48.33 | 16 | ¢ | 16 | ¢ | ||||||||
Second | $ | 62.38 – 47.30 | $ | 62.09 – 50.30 | 16 | ¢ | 13 3/4 | ¢ | $22.73 – 13.40 | $ 49.90 – 40.65 | 16 | ¢ | 16 | ¢ | ||||||||
Third | $ | 49.10 – 38.66 | $ | 68.86 – 57.46 | 16 | ¢ | 13 3/4 | ¢ | $17.22 – 9.33 | $ 45.90 – 26.92 | 16 | ¢ | 16 | ¢ | ||||||||
Fourth | $ | 53.00 – 41.79 | $ | 62.78 – 52.34 | 16 | ¢ | 16 | ¢ | $16.90 – 3.42 | $ 28.96 – 14.00 | 4 | ¢ | 16 | ¢ | ||||||||
Class B Common Stock High/Low Prices | Cash Dividends Per Class B Share | Class B Common Stock | Cash Dividends Per Class B Share | |||||||||||||||||||
Fiscal Quarter | 2006 | 2005 | 2006 | 2005 | 2008 | 2007 | 2008 | 2007 | ||||||||||||||
First | $ | 61.26 – 50.99 | $ | 57.40 – 40.81 | 16 | ¢ | 13 3/4 | ¢ | $20.10 – 11.14 | $ 52.42 – 45.27 | 16 | ¢ | 16 | ¢ | ||||||||
Second | $ | 57.55 – 43.71 | $ | 57.07 – 46.90 | 16 | ¢ | 13 3/4 | ¢ | $20.92 – 12.41 | $ 46.44 – 38.35 | 16 | ¢ | 16 | ¢ | ||||||||
Third | $ | 45.09 – 35.93 | $ | 64.00 – 53.50 | 16 | ¢ | 13 3/4 | ¢ | $15.43 – 8.46 | $ 42.53 – 25.61 | 16 | ¢ | 16 | ¢ | ||||||||
Fourth | $ | 48.97 – 39.25 | $ | 58.12 – 48.96 | 16 | ¢ | 16 | ¢ | $15.34 – 2.26 | $ 27.39 – 13.00 | 4 | ¢ | 16 | ¢ | ||||||||
As of JanuaryDecember 31, 2007,2008, the last reported sale price of our Class A common stock was $54.38$8.67 and the last reported sale price of our Class B common stock was $50.56.$6.48. As of JanuaryDecember 31, 2007,2008, there were approximately 1,1001,000 and 800700 holders of record, respectively, of our Class A and Class B common stock.
On January 10, 2007,13, 2009, our Board of Directors declared a quarterly cash dividend of $0.16$0.04 per share for both our Class A and Class B common stock, which is payable on February 15, 200713, 2009 to holders of record at the close of business on February 5, 2007.3, 2009. We regularly pay quarterly dividends as set forth inevaluate with our Board of Directors the table above. We currently expect that comparable cash dividends will continuedecision whether to be paid indeclare a dividend and the future although we have no commitment to do that.amount of the dividend.
In June 2001, our Board of Directors authorized a stock repurchase program to permit future purchases of up to 20 million shares of our outstanding common stock. During the three months and year ended November 30, 2006, we2008, there were no shares repurchased the following shares of our Class A and Class B common stock (table and footnote amounts in thousands, except per share amounts):under this program.
| Total Number of Shares Purchased | Average Price Paid Per Share | Total Programs | Maximum Number of Shares that May Yet be Purchased Under the Plans or Programs | |||||||||||
| Class | Class | |||||||||||||
Period | A | B | A | B | ||||||||||
December 1, 2005 to February 28, 2006* | 8 | — | $ | 63.48 | $ | — | — | 12,450 | ||||||
March 1, 2006 to May 31, 2006* | 4,555 | 447 | 54.40 | 48.56 | 5,000 | 7,450 | ||||||||
June 1, 2006 to August 31, 2006* | 56 | 672 | 44.62 | 40.93 | 672 | 6,778 | ||||||||
September 1, 2006 to September 30, 2006* | — | 1 | — | 43.52 | — | — | ||||||||
October 1, 2006 to October 31, 2006 | — | 285 | — | 43.51 | 285 | 6,493 | ||||||||
November 1, 2006 to November 30, 2006* | 1 | 249 | 50.21 | 43.46 | 249 | 6,244 | ||||||||
Total | 4,620 | 1,654 | $ | 54.30 | $ | 43.82 | 6,206 | |||||||
The information required by Item 201(d) of Regulation S-K is provided underin Item 12 of this document.Report.
Performance Graph
15
Comparison of Five - Year Cumulative Total Return
Fiscal Year Ended November 30
(2003=$100)
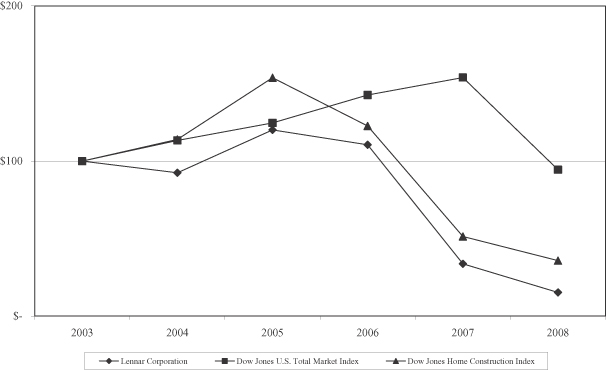
| 2003 | 2004 | 2005 | 2006 | 2007 | 2008 | ||||||||
Lennar Corporation | $ | 100 | 92 | 120 | 110 | 34 | 15 | ||||||
Dow Jones U.S. Home Construction Index | $ | 100 | 114 | 154 | 123 | 51 | 36 | ||||||
Dow Jones U.S. Total Market Index | $ | 100 | 113 | 125 | 143 | 154 | 94 | ||||||
Item 6. Selected Financial Data.
The following table sets forth our selected consolidated financial and operating information as of or for each of the years ended November 30, 20022004 through 2006.2008. The information presented below is based upon our historical financial statements, except for the results of operations of a subsidiary of the Financial Services segment’s title company that was sold in May 2005, which have been classified as discontinued operations. Share and per share amounts have been retroactively adjusted to reflect the effect of our April 2003 10% Class B common stock distribution and our January 2004 two-for-one stock split.
| At or for the Years Ended November 30, | |||||||||||
| 2006 | 2005 | 2004 (1) | 2003 (1) | 2002 (1) | |||||||
| (Dollars in thousands, except per share amounts) | |||||||||||
Results of Operations: | |||||||||||
Revenues: | |||||||||||
Homebuilding | $ | 15,623,040 | 13,304,599 | 10,000,632 | 8,348,645 | 6,751,301 | |||||
Financial services | $ | 643,622 | 562,372 | 500,336 | 556,581 | 482,008 | |||||
Total revenues | $ | 16,266,662 | 13,866,971 | 10,500,968 | 8,905,226 | 7,233,309 | |||||
Operating earnings from continuing operations: | |||||||||||
Homebuilding | $ | 986,153 | 2,277,091 | 1,548,488 | 1,164,089 | 834,056 | |||||
Financial services | $ | 149,803 | 104,768 | 110,731 | 153,719 | 126,941 | |||||
Corporate general and administrative expenses | $ | 193,307 | 187,257 | 141,722 | 111,488 | 85,958 | |||||
Loss on redemption of 9.95% senior notes | $ | — | 34,908 | — | — | — | |||||
Earnings from continuing operations before provision for income taxes | $ | 942,649 | 2,159,694 | 1,517,497 | 1,206,320 | 875,039 | |||||
Earnings from discontinued operations before provision for income taxes (2) | $ | — | 17,261 | 1,570 | 734 | 670 | |||||
Earnings from continuing operations | $ | 593,869 | 1,344,410 | 944,642 | 750,934 | 544,712 | |||||
Earnings from discontinued operations | $ | — | 10,745 | 977 | 457 | 417 | |||||
Net earnings | $ | 593,869 | 1,355,155 | 945,619 | 751,391 | 545,129 | |||||
Diluted earnings per share: | |||||||||||
Earnings from continuing operations | $ | 3.69 | 8.17 | 5.70 | 4.65 | 3.51 | |||||
Earnings from discontinued operations | $ | — | 0.06 | — | — | — | |||||
Net earnings | $ | 3.69 | 8.23 | 5.70 | 4.65 | 3.51 | |||||
Cash dividends declared per share—Class A common stock | $ | 0.64 | 0.573 | 0.513 | 0.144 | 0.025 | |||||
Cash dividends declared per share—Class B common stock | $ | 0.64 | 0.573 | 0.513 | 0.143 | 0.0225 | |||||
Financial Position: | |||||||||||
Total assets (3) | $ | 12,408,266 | 12,541,225 | 9,165,280 | 6,775,432 | 5,755,633 | |||||
Debt: | |||||||||||
Homebuilding | $ | 2,613,503 | 2,592,772 | 2,021,014 | 1,552,217 | 1,585,309 | |||||
Financial services | $ | 1,149,231 | 1,269,782 | 896,934 | 734,657 | 853,416 | |||||
Stockholders’ equity | $ | 5,701,372 | 5,251,411 | 4,052,972 | 3,263,774 | 2,229,157 | |||||
Shares outstanding (000s) | 158,155 | 157,559 | 156,230 | 157,836 | 142,811 | ||||||
Stockholders’ equity per share | $ | 36.05 | 33.33 | 25.94 | 20.68 | 15.61 | |||||
Homebuilding Data (including unconsolidated entities): | |||||||||||
Number of homes delivered | 49,568 | 42,359 | 36,204 | 32,180 | 27,393 | ||||||
New orders | 42,212 | 43,405 | 37,667 | 33,523 | 28,373 | ||||||
Backlog of home sales contracts | 11,608 | 18,565 | 15,546 | 13,905 | 12,108 | ||||||
Backlog dollar value | $ | 3,980,428 | 6,884,238 | 5,055,273 | 3,887,300 | 3,200,206 | |||||
| At or for the Years Ended November 30, | ||||||||||||||||
| 2008 | 2007 | 2006 | 2005 | 2004 (1) | ||||||||||||
| (Dollars in thousands, except per share amounts) | ||||||||||||||||
Results of Operations: | ||||||||||||||||
Revenues: | ||||||||||||||||
Homebuilding | $ | 4,263,038 | 9,730,252 | 15,623,040 | 13,304,599 | 10,000,632 | ||||||||||
Financial services | $ | 312,379 | 456,529 | 643,622 | 562,372 | 500,336 | ||||||||||
Total revenues | $ | 4,575,417 | 10,186,781 | 16,266,662 | 13,866,971 | 10,500,968 | ||||||||||
Operating earnings (loss) from continuing operations: | ||||||||||||||||
Homebuilding (2) | $ | (400,786 | ) | (2,913,999 | ) | 986,153 | 2,277,091 | 1,548,488 | ||||||||
Financial services (3) | $ | (30,990 | ) | 6,120 | 149,803 | 104,768 | 110,731 | |||||||||
Corporate general and administrative expenses | $ | (129,752 | ) | (173,202 | ) | (193,307 | ) | (187,257 | ) | (141,722 | ) | |||||
Loss on redemption of 9.95% senior notes | $ | — | — | — | (34,908 | ) | — | |||||||||
Earnings (loss) from continuing operations before (provision) benefit for income taxes | $ | (561,528 | ) | (3,081,081 | ) | 942,649 | 2,159,694 | 1,517,497 | ||||||||
Earnings from discontinued operations before (provision) for income taxes (4) | $ | — | — | — | 17,261 | 1,570 | ||||||||||
Earnings (loss) from continuing operations (5) | $ | (1,109,085 | ) | (1,941,081 | ) | 593,869 | 1,344,410 | 944,642 | ||||||||
Earnings from discontinued operations | $ | — | — | — | 10,745 | 977 | ||||||||||
Net earnings (loss) | $ | (1,109,085 | ) | (1,941,081 | ) | 593,869 | 1,355,155 | 945,619 | ||||||||
Diluted earnings (loss) per share: | ||||||||||||||||
Earnings (loss) from continuing operations | $ | (7.00 | ) | (12.31 | ) | 3.69 | 8.17 | 5.70 | ||||||||
Earnings from discontinued operations | $ | — | — | — | 0.06 | — | ||||||||||
Net earnings (loss) | $ | (7.00 | ) | (12.31 | ) | 3.69 | 8.23 | 5.70 | ||||||||
Cash dividends declared per share—Class A common stock | $ | 0.52 | 0.64 | 0.64 | 0.573 | 0.513 | ||||||||||
Cash dividends declared per share—Class B common stock | $ | 0.52 | 0.64 | 0.64 | 0.573 | 0.513 | ||||||||||
Financial Position: | ||||||||||||||||
Total assets (6) | $ | 7,424,898 | 9,102,747 | 12,408,266 | 12,541,225 | 9,165,280 | ||||||||||
Debt: | ||||||||||||||||
Homebuilding | $ | 2,544,935 | 2,295,436 | 2,613,503 | 2,592,772 | 2,021,014 | ||||||||||
Financial services | $ | 225,783 | 541,437 | 1,149,231 | 1,269,782 | 896,934 | ||||||||||
Stockholders’ equity | $ | 2,623,007 | 3,822,119 | 5,701,372 | 5,251,411 | 4,052,972 | ||||||||||
Shares outstanding (000s) | 160,558 | 159,887 | 158,155 | 157,559 | 156,230 | |||||||||||
Stockholders’ equity per share | $ | 16.34 | 23.91 | 36.05 | 33.33 | 25.94 | ||||||||||
Homebuilding Data (including unconsolidated entities): | ||||||||||||||||
Number of homes delivered | 15,735 | 33,283 | 49,568 | 42,359 | 36,204 | |||||||||||
New orders | 13,391 | 25,753 | 42,212 | 43,405 | 37,667 | |||||||||||
Backlog of home sales contracts | 1,599 | 4,009 | 11,608 | 18,565 | 15,546 | |||||||||||
Backlog dollar value | $ | 456,270 | 1,384,137 | 3,980,428 | 6,884,238 | 5,055,273 | ||||||||||
| (1) | In May 2005, |
| (2) | Homebuilding operating earnings (loss) from continuing operations include $340.5 million, $2,445.1 million, $501.8 million and $20.5 million, respectively, of SFAS 144 valuation adjustments for the years ended November 30, 2008, 2007, 2006 and 2005. In addition, it includes $32.2 million, $364.2 million and $126.4 million, respectively, of SFAS 144 valuation adjustments related to assets of our investments in unconsolidated entities for the years ended November 30, 2008, 2007 and 2006, and $172.8 million, $132.2 million and $14.5 million, respectively of APB 18 valuation adjustments to our investments in unconsolidated entities for the years ended November 30, 2008, 2007 and 2006. During the year ended November 30, 2007, homebuilding operating earnings (loss) from continuing operations also includes $190.2 million of goodwill impairments. There were no other material valuation adjustments for the years ended November 30, 2005 and 2004. |
| (3) | Financial Services operating loss from continuing operations for the year ended November 30, 2008 includes a $27.2 million impairment of the Financial Services segment’s goodwill. |
| (4) | Earnings from discontinued operations before provision for income taxes includes a gain of $15.8 million for the year ended November 30, 2005 related to the sale of a subsidiary of the Financial Services segment’s title company. |
| Earnings (loss) from continuing operations for the year ended November 30, 2008 includes a $730.8 million valuation allowance recorded against our deferred tax assets. |
| (6) | As of November 30, 2004, |
16
Item 7. Management’s Discussion and Analysis of Financial Condition and Results of Operations.
The following discussion and analysis of our financial condition and results of operations should be read in conjunction with “Selected Financial Data” and our audited consolidated financial statements and accompanying notes included elsewhere in this Report.
Special Note Regarding Forward-Looking Statements
Some of the statements in this Management’s Discussion and Analysis of Financial Condition and Results of Operations, and elsewhere in this Annual Report on Form 10-K, are “forward-looking statements,” as that term is defined in the Private Securities Litigation Reform Act of 1995. These forward-looking statements include statements regarding our business, financial condition, results of operations, cash flows, strategies and prospects. You can identify forward-looking statements by the fact that these statements do not relate strictly to historical or current matters. Rather, forward-looking statements relate to anticipated or expected events, activities, trends or results. Because forward-looking statements relate to matters that have not yet occurred, these statements are inherently subject to risks and uncertainties. Many factors could cause our actual activities or results to differ materially from the activities and results anticipated in forward-looking statements. These factors include those described under the caption “Risk Factors” in Item 1A of this Report. We do not undertake any obligation to update forward-looking statements.statements, except as required by Federal securities laws.
Outlook
DuringThe housing market continues to be compromised by the second halfmost significant domestic economic downturn in recent history. General economic pressures continue to drive down the volume and prices of 2006,homes being sold, as rising levels of foreclosures add inventory to an already saturated marketplace. Overall consumer sentiment has continued to deteriorate, resulting in fewer potential home purchasers willing to enter the market. These conditions have fostered a competitive need amongst homebuilders to drive pricing downward through the use of incentives, price reductions and incentivized brokerage fees. Although there is optimism that the new administration taking federal office will offer stimulus to fix the sliding housing environment, we currently do not have visibility as to when these deteriorating market conditions will subside. Whether or not there is additional federal stimulus, there could be further deterioration in market conditions, which may lead to additional valuation adjustments in the homebuilding industry deteriorated and we have not yet seen a recovery as we entered the first quarter of 2007. This market weakness is driven primarily by excess supply as speculators reduce purchases and return homes to the market as well as negative customer sentiment surrounding the general homebuilding market. We are experiencing slower sales (down 3% in 2006) and higher cancellations (29% in 2006) which have impacted most of our markets and, therefore, we are making greater use of sales incentives to generate sales in order to build-out our inventory, deliver our backlog and convert inventory into cash.future.
In ordermidst of this environment, we remained balance sheet focused with great emphasis on liquidity and positioning ourselves for future opportunities. We continued to reduce overhead in an effort to be “right-sized” for anticipated lower volume levels in fiscal 2009. In addition, we continued to carefully manage under these difficult conditions,our inventory levels through curtailing land purchases, reducing home starts and adjusting prices to deliver completed homes.
We also have diligently worked on restructuring, repositioning and reducing our joint ventures. We have reduced the number of joint ventures in which we have focused on generating cash flow and maintaining an “inventory neutral” position, which has created liquidity on our balance sheet.participate to 116 unconsolidated joint ventures at November 30, 2008, compared to 270 unconsolidated joint ventures at the peak in 2006. We have also renegotiatedreduced our net recourse indebtedness exposure with regard to joint ventures to $392.5 million at November 30, 2008, compared to $1.1 billion at the prices at which we have options or agreementspeak in 2006.
In 2009, cash generation will continue to purchase land, to bring them in line with current market prices. In order to generate cash flow, we have pricedbe our top priority. We will convert inventory to market; however, this has resulted in higher than normal sales incentives, leading to lower gross margins on home sales. As we look ahead to 2007, the strength ofcash and reduce both our balance sheet, together with our renegotiated land positions that reflect current market conditions, provide the foundation from whichpurchases and homebuilding starts. In addition, we will tryreduce our cash outflows by continuing to rebuildright-size our margins. Steps we expect to takeoverhead to improve margins include reducingour selling, general and administrative expenses to match current volume and reflect available efficiencies, reducing construction costs by negotiating lower prices, redesigning products to meet current market demand, and building on land at current market prices. We will also continue to carefully match our starts to demand, which we expect will cause deliveries in 2007 to be at least 20% lower than they were in 2006.as a percentage of revenues.
Results of Operations
Overview
Our net earnings from continuing operationsloss in 2006 were $593.9 million,2008 was $1.1 billion, or $3.69$7.00 per basic and diluted share, ($3.76compared to a net loss of $1.9 billion, or $12.31 per basic share), compared to $1.3 billion, or $8.17 perand diluted share, ($8.65 per basic share), in 2005.2007. The decrease incurrent year net earningsloss was attributable to depressedweakness in the housing market conditionsthat has persisted during 2006 that2008 and has impacted all of our Homebuilding segments’ operations. WhileOur gross margin percentage increased due to our deliverieslower inventory basis and continued focus on repositioning our product and reducing construction costs, despite Statement of Financial Accounting Standards (“SFAS”) No. 144,Accounting for the Impairment of Long-lived Assets, (“SFAS 144”) valuation adjustments and a decrease in the average sales price onof homes delivered increased, our gross margins decreased due to inventory valuation adjustments during the second half of 2006 and higher sales incentives offered to homebuyers in 2006,2008, compared to 2005.
172007. Our 2008 results were also impacted by a non-cash SFAS 109,Accounting for Income Taxes, (“SFAS 109”) valuation allowance of $730.8 million, or $4.61 per basic and diluted share, recorded against our deferred tax assets.
The following table sets forth financial and operational information for the years indicated related to our continuing operations. The results of operations of the homebuilders we acquired during these years2006 were not material to our consolidated financial statements and are included in the tables since the respective dates of the acquisitions.
| Years Ended November 30, | Years Ended November 30, | ||||||||||||||||||||
| 2006 | 2005 | 2004 | 2008 | 2007 | 2006 | ||||||||||||||||
| (Dollars in thousands, except average sales price) | (Dollars in thousands, except average sales price) | ||||||||||||||||||||
Homebuilding revenues: | |||||||||||||||||||||
Sales of homes | $ | 14,854,874 | 12,711,789 | 9,559,847 | $ | 4,150,717 | 9,462,940 | 14,854,874 | |||||||||||||
Sales of land | 768,166 | 592,810 | 440,785 | 112,321 | 267,312 | 768,166 | |||||||||||||||
Total homebuilding revenues | 15,623,040 | 13,304,599 | 10,000,632 | 4,263,038 | 9,730,252 | 15,623,040 | |||||||||||||||
Homebuilding costs and expenses: | |||||||||||||||||||||
Cost of homes sold | 12,114,433 | 9,410,343 | 7,275,446 | 3,641,090 | 8,892,268 | 12,114,433 | |||||||||||||||
Cost of land sold | 798,165 | 391,984 | 281,409 | 245,536 | 1,928,451 | 798,165 | |||||||||||||||
Selling, general and administrative | 1,764,967 | 1,412,917 | 1,072,912 | 655,255 | 1,368,358 | 1,764,967 | |||||||||||||||
Total homebuilding costs and expenses | 14,677,565 | 11,215,244 | 8,629,767 | 4,541,881 | 12,189,077 | 14,677,565 | |||||||||||||||
Equity in earnings (loss) from unconsolidated entities | (12,536 | ) | 133,814 | 90,739 | |||||||||||||||||
Management fees and other income, net | 66,629 | 98,952 | 97,680 | ||||||||||||||||||
Minority interest expense, net | 13,415 | 45,030 | 10,796 | ||||||||||||||||||
Gain on recapitalization of unconsolidated entity | 133,097 | 175,879 | — | ||||||||||||||||||
Goodwill impairments | — | (190,198 | ) | — | |||||||||||||||||
Equity in loss from unconsolidated entities | (59,156 | ) | (362,899 | ) | (12,536 | ) | |||||||||||||||
Management fees and other income (expense), net | (199,981 | ) | (76,029 | ) | 66,629 | ||||||||||||||||
Minority interest income (expense), net | 4,097 | (1,927 | ) | (13,415 | ) | ||||||||||||||||
Homebuilding operating earnings | 986,153 | 2,277,091 | 1,548,488 | ||||||||||||||||||
Homebuilding operating earnings (loss) | (400,786 | ) | (2,913,999 | ) | 986,153 | ||||||||||||||||
Financial services revenues | 643,622 | 562,372 | 500,336 | 312,379 | 456,529 | 643,622 | |||||||||||||||
Financial services costs and expenses | 493,819 | 457,604 | 389,605 | ||||||||||||||||||
Financial services costs and expenses (1) | 343,369 | 450,409 | 493,819 | ||||||||||||||||||
Financial services operating earnings | 149,803 | 104,768 | 110,731 | ||||||||||||||||||
Financial services operating earnings (loss) | (30,990 | ) | 6,120 | 149,803 | |||||||||||||||||
Total operating earnings | 1,135,956 | 2,381,859 | 1,659,219 | ||||||||||||||||||
Total operating earnings (loss) | (431,776 | ) | (2,907,879 | ) | 1,135,956 | ||||||||||||||||
Corporate general and administrative expenses | 193,307 | 187,257 | 141,722 | (129,752 | ) | (173,202 | ) | (193,307 | ) | ||||||||||||
Loss on redemption of 9.95% senior notes | — | 34,908 | — | ||||||||||||||||||
Earnings from continuing operations before provision for income taxes | $ | 942,649 | 2,159,694 | 1,517,497 | |||||||||||||||||
Earnings (loss) before (provision) benefit for income taxes | $ | (561,528 | ) | (3,081,081 | ) | 942,649 | |||||||||||||||
Gross margin on home sales | 18.4 | % | 26.0 | % | 23.9 | % | 12.3 | % | 6.0 | % | 18.4 | % | |||||||||
SG&A expenses as a % of revenues from home sales | 11.9 | % | 11.1 | % | 11.2 | % | 15.8 | % | 14.5 | % | 11.9 | % | |||||||||
Operating margin as a % of revenues from home sales | 6.6 | % | 14.9 | % | 12.7 | % | (3.5 | )% | (8.4 | )% | 6.6 | % | |||||||||
Gross margin on home sales excluding valuation adjustments (2) | 17.0 | % | 13.9 | % | 20.3 | % | |||||||||||||||
Operating margin as a % of revenues from home sales excluding valuation adjustments (2) | 1.2 | % | (0.5 | )% | 8.5 | % | |||||||||||||||
Average sales price | $ | 315,000 | 311,000 | 272,000 | $ | 270,000 | $ | 297,000 | 315,000 | ||||||||||||
| (1) | Financial Services costs and expenses for the year ended November 30, 2008 include a $27.2 million impairment of goodwill. |
| (2) | Gross margins on home sales excluding valuation adjustments and operating margin as a percentage of revenues from home sales excluding valuation adjustments are non-GAAP financial measures disclosed by certain of our competitors and have been presented because we find it useful in evaluating our performance and believe that it helps readers of our financial statements compare our operations with those of our competitors. |
20062008 versus 20052007
Revenues from home sales increased 17%decreased 56% in the year ended November 30, 20062008 to $14.9$4.2 billion from $12.7$9.5 billion in 2005.2007. Revenues were higherlower primarily due to a 15% increase51% decrease in the number of home deliveries and a 9% decrease in 2006.the average sales price of homes delivered in 2008. New home deliveries, excluding unconsolidated entities, increaseddecreased to 47,03215,344 homes in the year ended November 30, 20062008 from 40,88231,582 homes last year. In the year ended November 30, 2006,2008, new home deliveries were higherlower in each of our homebuilding segments and Homebuilding Other, compared to 2005.2007. The average sales price of homes delivered increaseddecreased to $315,000$270,000 in the year ended November 30, 20062008 from $311,000$297,000 in 2005 despite higher sales2007, due to reduced pricing. Sales incentives offered to homebuyers ($32,000were $48,700 and $48,000 per home delivered, respectively, in 2006, compared to $9,000 per home delivered in 2005).the years ended November 30, 2008 and 2007.
Despite the full year increases, there was a significant slowdown in new home sales throughout the country as the year progressed. As a result, during the fourth quarter of the year, revenues from home sales declined by 14%, new home deliveries declined by 4%, excluding unconsolidated entities, and the average sales price declined by 11%, compared with the same period of the prior year. The decline in average sales price resulted from our use of higher sales incentives.
Gross margins on home sales excluding inventorySFAS 144 valuation adjustments were $3.0 billion,$705.1 million, or 20.3%17.0%, in the year ended November 30, 2006,2008, compared to $3.3$1.3 billion, or 26.0%13.9%, in 2005.2007. Gross margin percentage on home sales, decreasedexcluding SFAS 144 valuation adjustments, improved compared to last year in all of our homebuilding segments and Homebuilding Other primarily due to higher sales incentives offered to homebuyers.our lower inventory basis and continued focus on repositioning our product and reducing construction costs. Gross margins on home sales including inventory valuation
18
adjustments were $2.7 billion,$509.6 million, or 18.4%12.3%, in the year ended November 30, 2006 due to $280.52008, which included $195.5 million of inventorySFAS 144 valuation adjustments, ($157.0compared to gross margins on home sales of $570.7 million, $27.1or 6.0%, in the year ended November 30, 2007, which included $747.8 million $79.0 millionof SFAS 144 valuation adjustments. Gross margins on home sales excluding SFAS 144 valuation adjustments is a non-GAAP financial measure disclosed by certain of our competitors and $17.4 million, respectively,has been presented because we find it useful in evaluating our Homebuilding East, Centralperformance and West segments and Homebuilding Other).believe that it helps readers of our financial statements compare our operations with those of our competitors.
Homebuilding interest expense (primarily included in cost of homes sold and cost of land sold) was $241.1$130.4 million in 2006,2008, compared to $187.2$203.7 million in 2005.2007. The increasedecrease in interest expense was due to higherlower interest costs resulting from higherlower average debt during 2006,2008, as well as increaseddecreased deliveries during 2006,2008, compared to 2005.2007. Our homebuilding debt to total capital ratio as of November 30, 20062008 was 31.4%49.2%, compared to 33.1%37.5% as of November 30, 2005.2007. Our net homebuilding debt to total capital ratio as of November 30, 2008 was 35.7% compared to 30.2% as of November 30, 2007. The net homebuilding debt to total capital ratio consists of net homebuilding debt (homebuilding debt less homebuilding cash) divided by total capital (net homebuilding debt plus stockholders’ equity).
Selling, general and administrative expenses aswere reduced by $713.1 million, or 52%, in the year ended November 30, 2008, compared to last year, primarily due to the consolidation of divisions, which resulted in reductions in associate headcount, variable selling expense and fixed costs. As a percentage of revenues from home sales, were 11.9%selling, general and 11.1%, respectively, for the years ended November 30, 2006 and 2005. The 80 basis point increase was primarily dueadministrative expenses increased to increases15.8% in broker commissions and advertising expenses, partially offset by lower incentive compensation expenses. Management fees of $37.4 million received during the year ended November 30, 20052008, from unconsolidated entities14.5% in which we had investments, which were previously recorded as a reduction of selling, general and administrative expenses, have been reclassified2007, due to management fees and other income, net in order to conform to the 2006 presentation.lower revenues.
LossLosses on land sales totaled $30.0$133.2 million in the year ended November 30, 2006, net2008, which included $47.8 million of $152.2SFAS 144 valuation adjustments and $97.2 million of write-offs of deposits and pre-acquisition costs ($80.5 million, $2.9 million, $44.0 million and $24.8 million, respectively, in our Homebuilding East, Central and West segments and Homebuilding Other) related to 24,235approximately 8,200 homesites under option that we do not intend to purchase and $69.1purchase. In the year ended November 30, 2007, losses on land sales totaled $1,661.1 million, which included $1,167.3 million of inventorySFAS 144 valuation adjustments ($24.7and $530.0 million $17.3 millionof write-offs of deposits and $27.1 million, respectively, in our Homebuilding East and Central segments and Homebuilding Other), comparedpre-acquisition costs related to gross profit from land sales of $200.8 million in 2005. approximately 36,900 homesites that were under option.
Equity in earnings (loss)loss from unconsolidated entities was ($12.5)$59.2 million in the year ended November 30, 2006,2008, which included $126.4$32.2 million of our share of SFAS 144 valuation adjustments ($25.5 million, $92.8 million and $8.1 million, respectively,related to assets of unconsolidated entities in our Homebuilding East and West segments and Homebuilding Other) to ourwhich we have investments, in unconsolidated entities, compared to equity in earningsloss from unconsolidated entities of $133.8 million last year. Management fees and other income, net, totaled $66.6$362.9 million in the year ended November 30, 2006, compared2007, which included $364.2 million of our share of SFAS 144 valuation adjustments related to $99.0assets of unconsolidated entities in which we have investments.
Management fees and other income (expense), net totaled ($200.0) million in 2005. Minority interest expense, net was $13.4 million and $45.0 million, respectively, in the yearsyear ended November 30, 20062008, which included $172.8 million of APB 18 valuation adjustments to our investments in unconsolidated entities and 2005. $25.0 million of write-offs of notes receivable, compared to management fees and other income (expense), net of ($76.0) million in the year ended November 30, 2007, which included $132.2 million of APB 18 valuation adjustments to our investments in unconsolidated entities.
Minority interest income (expense), net was $4.1 million in the year ended November 30, 2008, compared to minority interest income (expense), net of ($1.9) million in the year ended November 30, 2007.
Due to the termination of our rights to purchase certain assets from our LandSource unconsolidated joint venture, we recognized deferred profit of $101.3 million in the year ended November 30, 2008 (net of $31.8 million of write-offs of option deposits and pre-acquisition costs and other write-offs) related to the 2007 recapitalization of LandSource.
Sales of land, equity in earnings (loss)loss from unconsolidated entities, management fees and other income (expense), net and minority interest expense,income (expense), net may vary significantly from period to period depending on the timing of land sales and other transactions entered into by us and unconsolidated entities in which we have investments.
Operating earnings from continuing operationsloss for the Financial Services segment were $149.8was $31.0 million in the year ended November 30, 2006,2008, compared to $104.8operating earnings of $6.1 million in the same period last year. The increasedecline in profitability was
primarily due to a $17.7goodwill impairment of $27.2 million pretax gain generated from monetizing the segment’s personal lines insurance policies, as well as increased profitability fromrelated to the segment’s mortgage operations as a result of increased volume and profit per loan. Thefewer transactions in the segment’s title and mortgage capture rate (i.e., the percentage of our homebuyers, excluding cash settlements, who obtained mortgage financing from us in areas where we offered services) was 66% in both the years ended November 30, 2006 and 2005.operations.
Corporate general and administrative expenses aswere reduced by $43.5 million, or 25%, for the year ended November 30, 2008, compared to 2007. As a percentage of total revenues, were 1.2%corporate general and administrative expenses increased to 2.8% in the year ended November 30, 2006, compared to 1.4%2008, from 1.7% in the same period last year.year, due to lower revenues.
SFAS 109 requires a reduction of the carrying amounts of deferred tax assets by a valuation allowance, if based on available evidence, it is more likely than not that such assets will not be realized. As a result of our operational results for the year ended November 30, 2008, we have now incurred cumulative losses over the evaluation period we established in accordance with SFAS 109. Accordingly, based on our evaluation of available evidence including our cumulative losses in the evaluation period, our current level of profits and losses and current market conditions, we have recorded a $730.8 million non-cash valuation allowance against our deferred tax assets during the year ended November 30, 2008. In future periods, this valuation allowance could be reduced based on sufficient evidence indicating that it is more likely than not that a portion of the our deferred tax assets will be realized.
At November 30, 2006,2008, we owned 92,32574,681 homesites and had access to an additional 189,27938,589 homesites through either option contracts with third parties or agreements with unconsolidated entities in which we have investments. At November 30, 2006, 10%2008, 2% of the homesites we owned were subject to home purchase contracts. Our backlog of sales contracts was 11,6081,599 homes ($4.0 billion)456.3 million) at November 30, 2006,2008, compared to 18,5654,009 homes ($6.9 billion)1,384.1 million) at November 30, 2005. As a result of pricing our homes to market through the use of higher sales incentives, building out our inventory and delivering our backlog in an effort to maintain an “inventory neutral” position, our backlog declined in 2006.2007. The lower backlog was also attributable to the depressedchallenged market conditions during 2006,that persisted throughout 2008, which resulted in lower new orders in 2006,2008, compared to 2005. At November 30, 2006, our inventory balance was consistent with the balance at November 30, 2005.2007.
19
20052007 versus 20042006
Revenues from home sales increased 33%decreased 36% in 2005the year ended November 30, 2007 to $12.7$9.5 billion from $9.6$14.9 billion in 2004.2006. Revenues were higherlower primarily due to a 16% increase33% decrease in the number of home deliveries and a 15% increase6% decrease in the average sales price of homes delivered in 2005.2007. New home deliveries, excluding unconsolidated entities, increaseddecreased to 40,88231,582 homes in the year ended November 30, 20052007 from 35,18947,032 homes in 2004.2006. In 2005,the year ended November 30, 2007, new home deliveries were higherlower in each of our homebuilding segments and Homebuilding Other, compared to 2004.2006. The average sales price of homes delivered increaseddecreased to $311,000$297,000 in the year ended November 30, 20052007 from $272,000$315,000 in 2004.2006, primarily due to higher sales incentives offered to homebuyers ($48,000 per home delivered in 2007, compared to $32,000 per home delivered in 2006).
Gross margins on home sales excluding SFAS 144 valuation adjustments were $3.3$1.3 billion, or 26.0%13.9%, in the year ended November 30, 2005,2007, compared to $2.3$3.0 billion, or 23.9%20.3%, in 2004.2006. Gross margin percentage on home sales increased 210 basis pointsdecreased compared to 2006 in all of our homebuilding segments primarily due to higher sales incentives offered to homebuyers. Gross margins on home sales were $570.7 million, or 6.0%, in the year ended November 30, 2007, which included $747.8 million of SFAS 144 valuation adjustments, compared to gross margins on home sales of $2,740.4 million, or 18.4%, in the year ended November 30, 2006, which included $280.5 million of SFAS 144 inventory valuation adjustments. Gross margins on home sales excluding SFAS 144 valuation adjustments is a product mix favoringnon-GAAP financial measure disclosed by certain of our higher margin states, as well as a significant gross margin percentage improvementcompetitors and has been presented because we find it useful in Arizona, Californiaevaluating its performance and Florida.believe that it helps readers of our financial statements compare our operations with those of our competitors.
Homebuilding interest expense (primarily included in cost of homes sold and cost of land sold) was $187.2$203.7 million in 2005,2007, compared to $134.2$241.1 million in 2004.2006. The increasedecrease in interest expense was due to higherlower interest costs resulting from higherlower average debt during 2007, as well as increaseddecreased deliveries during 2005,2007, compared to 2004, due to the growth in our homebuilding operations.2006. Our homebuilding debt to total capital ratio as of November 30, 20052007 was 33.1%37.5%, compared to 33.3%31.4% as of November 30, 2004.2006. Our net homebuilding debt to total capital ratio as of November 30, 2007 was 30.2% compared to 25.5% as of November 30, 2006. The net homebuilding debt to total capital ratio consists of net homebuilding debt (homebuilding debt less homebuilding cash) divided by total capital (net homebuilding debt plus stockholders’ equity).
Selling, general and administrative expenses aswere reduced by $396.6 million, or 22%, in the year ended November 30, 2007, compared to 2006, primarily due to reductions in associate headcount and variable selling expenses. As a percentage of revenues from home sales, were 11.1%selling, general and administrative expenses increased to 14.5% in the year ended November 30, 2005, compared2007, from 11.9% in 2006. The 260 basis point increase was primarily due to 11.2% in the year ended November 30, 2004. Management fees of $37.4 million and $28.4 million received during the years ended November 30, 2005 and 2004, respectively, from unconsolidated entities in which we had investments, which were previously recorded as a reduction of selling, general and administrative expenses, have been reclassified to management fees and other income, net in order to conform to the 2006 presentation.lower revenues.
Gross profitLoss on land sales totaled $200.8$1,661.1 million in the year ended November 30, 2005,2007, which included $740.4 million of SFAS 144 valuation adjustments on the inventory acquired by the Morgan Stanley land investment venture discussed below, $426.9 million of SFAS 144 valuation adjustments and $530.0 million of write-offs of deposits and pre-acquisition costs related to 36,900 homesites under option that we do not intend to purchase. In the year ended November 30, 2006, loss on land sales totaled $30.0 million, which included $69.1 million of SFAS 144 valuation adjustments and $152.2 million of write-offs of deposits and pre-acquisition costs related to 24,200 homesites that were under option.
In November 2007, we and Morgan Stanley Real Estate Fund II, L.P., an affiliate of Morgan Stanley & Co., Inc., formed a strategic land investment venture to acquire, develop, manage and sell residential real estate. We acquired a 20% ownership interest and 50% voting rights in the land investment venture. Concurrent with the formation of the land investment venture, we sold a diversified portfolio of our land to the venture for $525 million. The properties acquired by the new entity consist of approximately 11,000 homesites in 32 communities located throughout the country. The properties sold by us had a net book value of approximately $1.3 billion. As part of the transaction, we entered into option agreements and obtained rights of first offer providing us the opportunity to purchase certain finished homesites. The exercise price of the options is based on a fixed percentage of the future home price. We have no obligation to exercise these options and cannot acquire a majority of the entity’s assets. We are managing the land investment venture’s operations and receive fees for our services. We will also receive disproportionate distributions if the investment venture exceeds certain financial targets.
Due to our continuing involvement, the transaction did not qualify as a sale under GAAP; thus, the inventory remained on our balance sheet in consolidated inventory not owned as of November 30, 2007. Additionally, the $445 million of net cash received from the transaction was recorded in liabilities related to consolidated inventory not owned in the consolidated balance sheet and classified as cash flows from financing activities in the consolidated statement of cash flows. In connection with the transaction, we recorded a SFAS 144 valuation adjustment of $740.4 million on the inventory sold to the land investment venture.
Equity in loss from unconsolidated entities was $362.9 million in the year ended November 30, 2007, which included $364.2 million of our share of SFAS 144 valuation adjustments related to the assets of our investments in unconsolidated entities, compared to $159.4equity in loss from unconsolidated entities of $12.5 million in 2004. Somethe year ended November 30, 2006, which included $126.4 million of these land sales were from consolidated joint ventures,our share of SFAS 144 valuation adjustments related to the assets of our investments in unconsolidated entities.
During the year ended November 30, 2007, we recorded goodwill impairments of $190.2 million related to our homebuilding operations.
Management fees and other income (expense), net, totaled ($76.0) million in the year ended November 30, 2007, which resultedincluded $132.2 million of APB 18 valuation adjustments to our investments in minority interest expense. unconsolidated entities, compared to management fees and other income (expense), net, of $66.6 million in the year ended November 30, 2006, net of $14.5 million of APB 18 valuation adjustments to our investments in unconsolidated entities.
Minority interest expense,income (expense), net from these land sales and other activities of the consolidated joint ventures was $45.0($1.9) million and $10.8($13.4) million, respectively, in the years ended November 30, 20052007 and 2004. Management fees and other income, net, totaled $99.0 million2006.
Sales of land, equity in the year ended November 30, 2005, compared to $97.7 million in 2004. Equity in earningsloss from unconsolidated entities, was $133.8 million in the year ended November 30, 2005, compared to $90.7 million in 2004. Sales of land, minority interest expense, net, management fees and other income (expense), net and equity in earnings from unconsolidated entitiesminority interest income (expense), net may vary significantly from period to period depending on the timing of land sales and other transactions entered into by us and unconsolidated entities in which we have investments.
In February 2007, our LandSource joint venture admitted MW Housing Partners as a new strategic partner. As part of the transaction, the joint venture obtained $1.6 billion of non-recourse financing, which consisted of a $200 million five-year Revolving Credit Facility, a $1.1 billion six-year Term Loan B Facility and a $244 million seven-year Second Lien Term Facility. The transaction resulted in a cash distribution to us of $707.6 million, but reduced our resulting ownership of LandSource to 16%. As a result of the recapitalization, we recognized a pretax gain of $175.9 million in 2007.
Operating earnings from continuing operations for the Financial Services segment were $104.8$6.1 million in the year ended November 30, 2005,2007, compared to $110.7$149.8 million in 2004.2006. The decrease was primarily due to reduceda decline in profitability from both the segment’s mortgage operations as a result of a more competitive mortgage environment in 2005, as well as a $6.5 million pretax gain generated from monetizing a majority of the segment’s alarm monitoring contracts in 2004. This decrease was partially offset by improved profitability from the segment’sand title operations and $28.4 million of partial write-offs of land seller notes receivable.
The decline in 2005. The segment’s mortgage capture rate (i.e.,profitability was due to the percentage of our homebuyers, excluding cash settlements, who obtained mortgage financing from us in areas where we offered services) was 66%overall weakness in the year ended November 30, 2005,housing market, which led to a decrease in volume and transactions for the mortgage and title operations compared to 71% in 2004. The decrease in the capture rate was a result of a more competitive mortgage environment. During 2005, we sold North American Exchange Company (“NAEC”), a subsidiary of the Financial Services’ title company, which generated a $15.8 million pretax gain.2006.
Corporate general and administrative expenses aswere reduced by $20.1 million, or 10%, in the year ended November 30, 2007, compared to 2006. As a percentage of total revenues, were 1.4%corporate general and 1.3%, respectively,administrative expenses increased to 1.7% in the yearsyear ended November 30, 2005 and 2004.2007, compared to 1.2% in 2006, primarily due to lower revenues.
At November 30, 2005,2007, we owned 102,68762,801 homesites and had access to an additional 222,11985,870 homesites through either option contracts with third parties or agreements with unconsolidated entities in which we have investments. At November 30, 2005, 14%2007, 5% of the homesites we owned were subject to home purchase contracts. Our backlog of sales contracts was 18,5654,009 homes ($6.91.4 billion) at November 30, 2005,2007, compared to 15,54611,608 homes ($5.14.0 billion) at November 30, 2004.2006. The higherlower backlog was primarily attributable to our growth and strong demand for our homes,weak market conditions that persisted during 2007, which resulted in higherlower new orders in 2005,2007, compared to 2004. As a result of acquisitions combined with our organic growth, inventories increased 53% during 2005, while revenues from sales of homes increased 33% for the year ended November 30, 2005, compared to 2004.2006.
20
Homebuilding Segments
Our Homebuilding operations construct and sell homes primarily for first-time, move-up and active adult homebuyers primarily under our Everything’s Included® program. Our land operations include the purchase, development and sale of land forLennar brand name. In addition, our homebuilding activities, as well as the sale ofoperations also purchase, develop and sell land to third parties. In certain circumstances, we diversify our operations through strategic alliances and minimize our risks by investing with third parties in joint ventures.
We have disaggregated our Houston homebuilding division from our Homebuilding Central reportable segment and have presented Houston as a separate reportable segment due to the division achieving a quantitative threshold set forth in SFAS No. 131,Disclosures About Segments of an Enterprise and Related Information(“SFAS 131”) as of and for the year ended November 30, 2008. All segment information related to prior years has been restated to conform to the fiscal 2008 presentation. The change in reportable segments has no effect on our consolidated financial position, results of operations or cash flows.
We have grouped our homebuilding activities into three reportable segments, which we refer to as Homebuilding East, Homebuilding Central and Homebuilding West. Information about homebuilding activities in states that doin which our homebuilding activities are not have economic characteristics that areeconomically similar to those in other states in the same geographic area is grouped under “Homebuilding Other.” References in this Management’s Discussion and Analysis of Financial Condition and Results of Operations to homebuilding segments are to those reportable segments.
At November 30, 2006,2008, our revised reportable homebuilding segments and Homebuilding Other consisted of homebuilding divisionsoperations located in the following states:in:
East:Florida, Maryland, New Jersey and Virginia.
Central:Arizona, Colorado and Texas. (1)
West:California and Nevada.
Houston: Houston, Texas.
Other:Illinois, Minnesota, New York, North Carolina and South Carolina.
| (1) | Texas in the Central reportable segment excludes Houston, Texas, which is its own reportable segment. |
The following tables set forth selected financial and operational information related to our homebuilding operations for the years indicated:
Selected Financial and Operational Data
| Years Ended November 30, | Years Ended November 30, | |||||||||||||
| 2006 | 2005 | 2004 | 2008 | 2007 | 2006 | |||||||||
| (In thousands) | (In thousands) | |||||||||||||
Revenues: | ||||||||||||||
East: | ||||||||||||||
Sales of homes | $ | 4,642,582 | 3,430,903 | 2,647,294 | $ | 1,252,725 | 2,691,198 | 4,642,582 | ||||||
Sales of land | 129,297 | 68,080 | 98,994 | 23,033 | 63,452 | 129,297 | ||||||||
Total East | 4,771,879 | 3,498,983 | 2,746,288 | 1,275,758 | 2,754,650 | 4,771,879 | ||||||||
Central: | ||||||||||||||
Sales of homes | 3,545,174 | 3,186,870 | 2,594,321 | 512,957 | 1,549,020 | 2,549,138 | ||||||||
Sales of land | 104,047 | 188,023 | 113,632 | 20,153 | 56,819 | 80,168 | ||||||||
Total Central | 3,649,221 | 3,374,893 | 2,707,953 | 533,110 | 1,605,839 | 2,629,306 | ||||||||
West: | ||||||||||||||
Sales of homes | 5,466,437 | 5,030,190 | 3,455,703 | 1,408,051 | 3,460,667 | 5,466,437 | ||||||||
Sales of land | 503,075 | 272,577 | 201,350 | 32,112 | 83,045 | 503,075 | ||||||||
Total West | 5,969,512 | 5,302,767 | 3,657,053 | 1,440,163 | 3,543,712 | 5,969,512 | ||||||||
Houston: | ||||||||||||||
Sales of homes | 542,288 | 815,250 | 996,036 | |||||||||||
Sales of land | 8,565 | 23,000 | 23,879 | |||||||||||
Total Houston | 550,853 | 838,250 | 1,019,915 | |||||||||||
Other: | ||||||||||||||
Sales of homes | 1,200,681 | 1,063,826 | 862,529 | 434,696 | 946,805 | 1,200,681 | ||||||||
Sales of land | 31,747 | 64,130 | 26,809 | 28,458 | 40,996 | 31,747 | ||||||||
Total Other | 1,232,428 | 1,127,956 | 889,338 | 463,154 | 987,801 | 1,232,428 | ||||||||
Total homebuilding revenues | $ | 15,623,040 | 13,304,599 | 10,000,632 | $ | 4,263,038 | 9,730,252 | 15,623,040 | ||||||
21
| Years Ended November 30, | ||||||||||
| 2008 | 2007 | 2006 | ||||||||
| (In thousands) | ||||||||||
Operating earnings (loss): | ||||||||||
East: | ||||||||||
Sales of homes | $ | (37,361 | ) | (366,153 | ) | 305,397 | ||||
Sales of land | (41,242 | ) | (400,830 | ) | (63,729 | ) | ||||
Goodwill impairments | — | (46,274 | ) | — | ||||||
Equity in loss from unconsolidated entities | (31,422 | ) | (58,069 | ) | (14,947 | ) | ||||
Management fees and other income (expense), net | (64,106 | ) | (20,910 | ) | 14,335 | |||||
Minority interest income (expense), net | 3,924 | (923 | ) | (4,402 | ) | |||||
Total East | (170,207 | ) | (893,159 | ) | 236,654 | |||||
Central: | ||||||||||
Sales of homes | (67,124 | ) | (110,663 | ) | 113,960 | |||||
Sales of land | (11,330 | ) | (142,330 | ) | (878 | ) | ||||
Goodwill impairments | — | (31,293 | ) | — | ||||||
Equity in earnings (loss) from unconsolidated entities | (1,310 | ) | (25,378 | ) | 7,931 | |||||
Management fees and other income (expense), net | (11,006 | ) | (18,834 | ) | 6,297 | |||||
Minority interest income (expense), net | (407 | ) | (85 | ) | 689 | |||||
Total Central | (91,177 | ) | (328,583 | ) | 127,999 | |||||
West: | ||||||||||
Sales of homes | (67,757 | ) | (347,018 | ) | 532,456 | |||||
Sales of land | (74,987 | ) | (950,316 | ) | 84,749 | |||||
Gain on recapitalization of unconsolidated entity | 133,097 | 175,879 | — | |||||||
Goodwill impairments | — | (43,955 | ) | — | ||||||
Equity in loss from unconsolidated entities | (25,113 | ) | (274,267 | ) | (6,449 | ) | ||||
Management fees and other income (expense), net | (100,597 | ) | (38,404 | ) | 38,918 | |||||
Minority interest income (expense), net | 440 | (723 | ) | (9,757 | ) | |||||
Total West | (134,917 | ) | (1,478,804 | ) | 639,917 | |||||
Houston: | ||||||||||
Sales of homes | 39,897 | 76,378 | 77,732 | |||||||
Sales of land | 807 | 1,151 | 5,989 | |||||||
Equity in loss from unconsolidated entities | (920 | ) | (752 | ) | (168 | ) | ||||
Management fees and other income (expense), net | (978 | ) | 2,878 | 3,834 | ||||||
Minority interest income, net | — | 22 | — | |||||||
Total Houston | 38,806 | 79,677 | 87,387 | |||||||
Other: | ||||||||||
Sales of homes | (13,283 | ) | (50,230 | ) | (54,071 | ) | ||||
Sales of land | (6,463 | ) | (168,814 | ) | (56,130 | ) | ||||
Goodwill impairments | — | (68,676 | ) | — | ||||||
Equity in earnings (loss) from unconsolidated entities | (391 | ) | (4,433 | ) | 1,097 | |||||
Management fees and other income (expense), net | (23,294 | ) | (759 | ) | 3,245 | |||||
Minority interest income (expense), net | 140 | (218 | ) | 55 | ||||||
Total Other | (43,291 | ) | (293,130 | ) | (105,804 | ) | ||||
Total homebuilding operating earnings (loss) | $ | (400,786 | ) | (2,913,999 | ) | 986,153 | ||||
| Years Ended November 30, | ||||||||||
| 2006 | 2005 | 2004 | ||||||||
| (In thousands) | ||||||||||
Operating earnings (loss): | ||||||||||
East: | ||||||||||
Sales of homes | $ | 305,397 | 602,000 | 365,795 | ||||||
Sales of land | (63,729 | ) | 24,112 | 43,712 | ||||||
Equity in earnings (loss) from unconsolidated entities | (14,947 | ) | 2,213 | 3,997 | ||||||
Management fees and other income, net | 14,335 | 13,839 | 42,635 | |||||||
Minority interest expense, net | (4,402 | ) | (900 | ) | (1,399 | ) | ||||
Total East | 236,654 | 641,264 | 454,740 | |||||||
Central: | ||||||||||
Sales of homes | 191,692 | 287,113 | 169,261 | |||||||
Sales of land | 5,111 | 45,623 | 38,569 | |||||||
Equity in earnings from unconsolidated entities | 7,763 | 15,103 | 4,672 | |||||||
Management fees and other income, net | 10,131 | 21,005 | 4,331 | |||||||
Minority interest income (expense), net | 689 | (368 | ) | 686 | ||||||
Total Central | 215,386 | 368,476 | 217,519 | |||||||
West: | ||||||||||
Sales of homes | 532,456 | 956,470 | 592,961 | |||||||
Sales of land | 84,749 | 132,713 | 74,677 | |||||||
Equity in earnings (loss) from unconsolidated entities | (6,449 | ) | 109,995 | 82,060 | ||||||
Management fees and other income, net | 38,918 | 58,733 | 42,507 | |||||||
Minority interest expense, net | (9,757 | ) | (43,762 | ) | (10,083 | ) | ||||
Total West | 639,917 | 1,214,149 | 782,122 | |||||||
Other: | ||||||||||
Sales of homes | (54,071 | ) | 42,946 | 83,472 | ||||||
Sales of land | (56,130 | ) | (1,622 | ) | 2,418 | |||||
Equity in earnings from unconsolidated entities | 1,097 | 6,503 | 10 | |||||||
Management fees and other income, net | 3,245 | 5,375 | 8,207 | |||||||
Minority interest income, net | 55 | — | — | |||||||
Total Other | (105,804 | ) | 53,202 | 94,107 | ||||||
Total homebuilding operating earnings | $ | 986,153 | 2,277,091 | 1,548,488 | ||||||
22
Summary of Homebuilding Data
At or for the Years Ended November 30, | ||||||
| 2006 | 2005 | 2004 | ||||
Deliveries | ||||||
East | 14,859 | 11,220 | 10,438 | |||
Central | 17,069 | 15,448 | 13,126 | |||
West | 13,333 | 11,731 | 9,079 | |||
Other | 4,307 | 3,960 | 3,561 | |||
Total | 49,568 | 42,359 | 36,204 | |||
Of the total home deliveries listed above, 2,536, 1,477 and 1,015, respectively, represent deliveries from unconsolidated entities for the years ended November 30, 2006, 2005 and 2004.
New Orders | ||||||
East | 11,290 | 11,096 | 11,550 | |||
Central | 16,120 | 15,926 | 13,626 | |||
West | 11,119 | 12,179 | 8,931 | |||
Other | 3,683 | 4,204 | 3,560 | |||
Total | 42,212 | 43,405 | 37,667 | |||
Of the new orders listed above, 1,921, 1,254 and 1,700, respectively, represent new orders from unconsolidated entities for the years ended November 30, 2006, 2005 and 2004.
Backlog—Homes | ||||||
East | 4,139 | 7,581 | 7,024 | |||
Central | 3,598 | 4,547 | 3,750 | |||
West | 2,991 | 4,883 | 3,472 | |||
Other | 880 | 1,554 | 1,300 | |||
Total | 11,608 | 18,565 | 15,546 | |||
Of the homes in backlog listed above, 1,089, 1,359 and 1,585, respectively, represent homes in backlog from unconsolidated entities at November 30, 2006, 2005 and 2004.
| At or for the Years Ended November 30, | ||||||||||||||
| 2008 | 2007 | 2006 | ||||||||||||
Deliveries | ||||||||||||||
East | 4,957 | 9,840 | 14,859 | |||||||||||
Central | 2,442 | 7,020 | 11,287 | |||||||||||
West | 4,031 | 8,739 | 13,333 | |||||||||||
Houston | 2,736 | 4,380 | 5,782 | |||||||||||
Other | 1,569 | 3,304 | 4,307 | |||||||||||
Total | 15,735 | 33,283 | 49,568 | |||||||||||
Of the total home deliveries listed above, 391, 1,701 and 2,536, respectively, represent deliveries from unconsolidated entities for the years ended November 30, 2008, 2007 and 2006. | Of the total home deliveries listed above, 391, 1,701 and 2,536, respectively, represent deliveries from unconsolidated entities for the years ended November 30, 2008, 2007 and 2006. | |||||||||||||
New Orders | ||||||||||||||
East | 3,953 | 7,492 | 11,290 | |||||||||||
Central | 2,280 | 5,055 | 10,292 | |||||||||||
West | 3,396 | 6,765 | 11,119 | |||||||||||
Houston | 2,416 | 3,621 | 5,828 | |||||||||||
Other | 1,346 | 2,820 | 3,683 | |||||||||||
Total | 13,391 | 25,753 | 42,212 | |||||||||||
Of the new orders listed above, 174, 1,091 and 1,921, respectively, represent new orders from unconsolidated entities for the years ended November 30, 2008, 2007 and 2006. | Of the new orders listed above, 174, 1,091 and 1,921, respectively, represent new orders from unconsolidated entities for the years ended November 30, 2008, 2007 and 2006. | |||||||||||||
Backlog—Homes | ||||||||||||||
East | 787 | 1,797 | 4,139 | |||||||||||
Central | 123 | 285 | 2,250 | |||||||||||
West | 247 | 942 | 2,991 | |||||||||||
Houston | 269 | 589 | 1,348 | |||||||||||
Other | 173 | 396 | 880 | |||||||||||
Total | 1,599 | 4,009 | 11,608 | |||||||||||
Of the homes in backlog listed above, 8 homes, 364 homes and 1,089 homes, respectively, represent homes in backlog from unconsolidated entities at November 30, 2008, 2007 and 2006. | Of the homes in backlog listed above, 8 homes, 364 homes and 1,089 homes, respectively, represent homes in backlog from unconsolidated entities at November 30, 2008, 2007 and 2006. | |||||||||||||
Backlog Dollar Value(In thousands) | ||||||||||||||
East | $ | 1,460,213 | 2,774,396 | 2,104,959 | $ | 202,791 | 587,100 | 1,460,213 | ||||||
Central | 850,472 | 1,210,257 | 911,303 | 23,736 | 67,344 | 590,487 | ||||||||
West | 1,328,617 | 2,374,646 | 1,597,185 | 108,779 | 408,280 | 1,328,617 | ||||||||
Houston | 57,785 | 128,340 | 259,985 | |||||||||||
Other | 341,126 | 524,939 | 441,826 | 63,179 | 193,073 | 341,126 | ||||||||
Total | $ | 3,980,428 | 6,884,238 | 5,055,273 | $ | 456,270 | 1,384,137 | 3,980,428 | ||||||
Of the dollar value of homes in backlog listed above, $478,707, $590,129$12,460, $182,664 and $644,839,$478,707, respectively, represent the backlog dollar value from unconsolidated entities at November 30, 2006, 20052008, 2007 and 2004.2006.
Backlog represents the number of homes under sales contracts. Homes are sold using sales contracts, which are generally accompanied by sales deposits. In some instances, purchasers are permitted to cancel sales if they fail to qualify for financing or under certain other circumstances. We experienced a cancellation rate of 29%rates in 2006, compared to 17%our homebuilding segments and 16% in 2005 and 2004, respectively. Homebuilding Other as follows:
| Years Ended November 30, | |||||||||
| 2008 | 2007 | 2006 | |||||||
Cancellation Rates | |||||||||
East | 31 | % | 34 | % | 32 | % | |||
Central | 22 | % | 29 | % | 29 | % | |||
West | 24 | % | 29 | % | 30 | % | |||
Houston | 27 | % | 32 | % | 24 | % | |||
Other | 23 | % | 20 | % | 22 | % | |||
Total | 26 | % | 30 | % | 29 | % | |||
During the fourth quarter of 2006,2008, our cancellation rate was 33%32%. Although we experiencedcontinued to experience a significant increase in ourhigher than normal cancellation rate during 2006,2008, we remainremained focused on reselling these homes, which, in many instances, would includeincluded the use of higher sales incentives (discussed below as a percentage of revenues from home sales) to avoid the build up of excess inventory. We do not recognize revenue on homes under sales contracts until the sales are closed and title passes to the new homeowners, except for our multi-level residential buildings under construction for which revenue iswas recognized under percentage-of-completion accounting.accounting during 2006 and 2007. In 2008, we stopped recognizing revenues and expenses under percentage-of-completion accounting for our multi-level residential buildings under construction as a result of Emerging Issues Task Force 06-8,Applicability of the Assessment of a Buyer’s Continuing Investment under FASB Statement No. 66 for Sales of Condominiums (“EITF 06-8”) (see Note 1 in Item 8 of this Report).
23
20062008 versus 20052007
East: Homebuilding revenues increaseddecreased in 2006,2008, compared to 2005,2007, primarily due to an increasea decrease in the number of home deliveries in Florida and an increase in the average sales price of homes delivered in Florida and New Jersey. Gross margins on home sales excluding inventory valuation adjustments were $1.0 billion, or 22.0%, in 2006, compared to $976.9 million or 28.5% in 2005. Gross margin percentage on home sales decreased compared to last year primarily due to higher sales incentives offered to homebuyers (11.4% in 2006, compared to 1.8% in 2005), particularly during the second half of the year. Gross margins on home sales including inventory valuation adjustments were $865.0 million, or 18.6%, in 2006 due to a total of $157.0 million of inventory valuation adjustments in all states.
Central: Homebuilding revenues increased in 2006, compared to 2005, primarily due to an increase in the number of home deliveries in Arizona and Texas, and an increase in the average sales price of homes delivered in Arizona and Colorado. Gross margins on home sales excluding inventory valuation adjustments were $631.5 million, or 17.8%, in 2006, compared to $657.7 million, or 20.6%, in 2005. Gross margin percentage on home sales decreased compared to last year primarily due to higher sales incentives offered to homebuyers (9.1% in 2006, compared to 5.3% in 2005), particularly during the second half of the year. Gross margins on home sales including inventory valuation adjustments were $604.4 million, or 17.1%, in 2006 due to $27.1 million of inventory valuation adjustments primarily in Arizona and Colorado.
West: Homebuilding revenues increased in 2006, compared to 2005, primarily due to an increase in the number of home deliveries in all of the states in this segment and an increase in the average sales price of homes delivered in Nevada, due to higher deliveries in Reno. Gross margins on home sales excluding inventory valuation adjustments were $1.2 billion, or 22.4%, in 2006, compared to $1.5 billion, or 29.3%, in 2005. Gross margin percentage on home sales decreased compared to last year primarily due to higher sales incentives offered to homebuyers (7.5% in 2006, compared to 1.5% in 2005), particularly during the second half of the year. Gross margins on home sales including inventory valuation adjustments were $1.1 billion, or 20.9%, in 2006 due to a total of $79.0 million of inventory valuation adjustments in all states.
Other: Homebuilding revenues increased in 2006, compared to 2005, primarily due to an increase in the number of home deliveries in the Carolinas, Minnesota and New York, and an increase in the average sales price of homes delivered in the Carolinas and New York. Gross margins from home sales excluding inventory valuation adjustments were $143.9 million, or 12.0%, in 2006, compared to $191.8 million, or 18.0%, in 2005. Gross margins on home sales decreased compared to last year primarily due to higher sales incentives offered to homebuyers (7.8% in 2006, compared to 4.7% in 2005), particularly during the second half of the year. Gross margins on home sales including inventory valuation adjustments were $126.5 million, or 10.5%, in 2006 due to $17.4 million of inventory valuation adjustments primarily in Illinois and Minnesota.
2005 versus 2004
East: Homebuilding revenues increased in 2005, compared to 2004, primarily due to an increase in the number of home deliveries and an increase in the average sales price of homes delivered in all of the states in this segment. Gross margins on home sales excluding SFAS 144 valuation adjustments were $976.9$241.3 million, or 28.5%19.3%, in 2005,2008, compared to $669.5$368.0 million, or 25.3%13.7%, in 2004.2007. Gross margin percentage on home sales increased compared to last year due to our lower inventory basis and continued focus on reducing costs. As a percentage of home sales revenues, sales incentives were 17.2% in 2008 and 16.9% in 2007. Gross margins on home sales increasedwere $164.5 million, or 13.1% in 2005 due primarily2008 including SFAS 144 valuation adjustments of $76.8 million, compared to highergross margins on home sales of $89.0 million, or 3.3%, in Florida.2007 including $279.1 million of SFAS 144 valuation adjustments.
Losses on land sales were $41.2 million in 2008 (including $19.0 million of write-offs of deposits and pre-acquisition costs related to land under option that we do not intend to purchase and $23.3 million of SFAS 144 valuation adjustments), compared to losses on land sales of $400.8 million in 2007 (including $119.6 million of write-offs of deposits and pre-acquisition costs related to land under option that we do not intend to purchase and $307.5 million of SFAS 144 valuation adjustments).
Central: Homebuilding revenues increaseddecreased in 2005,2008, compared to 2004,2007, primarily due to an increasea decrease in the number of home deliveries in all of the states in this segmentsegment. Gross margins on home sales excluding SFAS 144 valuation adjustments were $59.9 million, or 11.7%, in 2008, compared to $193.3 million, or 12.5%, in 2007. Gross margin percentage on home sales decreased compared to last year primarily due to higher sales incentives offered to homebuyers (15.9% in 2008, compared to 13.0% in 2007). Gross margins on home sales were $31.8 million, or 6.2% in 2008 including SFAS 144 valuation adjustments of $28.1 million, compared to gross margins on home sales of $102.0 million, or 6.6%, in 2007 including $91.4 million of SFAS 144 valuation adjustments.
Losses on land sales were $11.3 million in 2008 (including $6.0 million of write-offs of deposits and an increasepre-acquisition costs related to land under option that we do not intend to purchase and $12.4 million of SFAS 144 valuation adjustments), compared to losses on land sales of $142.3 million in 2007 (including $56.3 million of write-offs of deposits and pre-acquisition costs related to land under option that we do not intend to purchase and $79.1 million of SFAS 144 valuation adjustments).
West: Homebuilding revenues decreased in 2008, compared to 2007, primarily due to a decrease in the number of home deliveries and average sales price of homes delivered in all of the states in this segment. Gross margins on home sales excluding SFAS 144 valuation adjustments were $229.7 million, or 16.3%, in 2008,
compared to $451.0 million, or 13.0%, in 2007. Gross margin percentage on home sales increased compared to last year primarily due to our lower inventory basis and continued focus on reducing costs, despite higher sales incentives offered to homebuyers (15.3% in 2008, compared to 14.3% in 2007). Gross margins on home sales were $154.1 million, or 10.9% in 2008 including SFAS 144 valuation adjustments of $75.6 million, compared to gross margins on home sales of $119.1 million, or 3.4%, in 2007 including $331.8 million of SFAS 144 valuation adjustments.
Losses on land sales were $75.0 million in 2008 (including $62.4 million of write-offs of deposits and pre-acquisition costs related to land under option that we do not intend to purchase and $11.1 million of SFAS 144 valuation adjustments), compared to losses on land sales of $950.3 million in 2007 (including $310.8 million of write-offs of deposits and pre-acquisition costs related to land under option that we do not intend to purchase and $648.6 million of SFAS 144 valuation adjustments).
Houston: Homebuilding revenues decreased in 2008, compared to 2007, primarily due to a decrease in the number of home deliveries in this segment. Gross margins from home sales excluding SFAS 144 valuation adjustments were $106.2 million, or 19.6%, in 2008, compared to $174.5 million, or 21.4%, in 2007. Gross margin percentage on home sales decreased compared to last year primarily due to higher sales incentives offered to homebuyers (11.1% in 2008, compared to 7.7% in 2007). Gross margins on home sales were $103.9 million, or 19.2% in 2008 including SFAS 144 valuation adjustments of $2.3 million, compared to gross margins on home sales of $171.7 million, or 21.1%, in 2007 including $2.8 million of SFAS 144 valuation adjustments.
Gross profits on land sales were $0.8 million in 2008 (net of $0.7 million of write-offs of deposits and pre-acquisition costs related to land under option that we do not intend to purchase and $0.1 million of SFAS 144 valuation adjustments), compared to gains on land sales of $1.2 million in 2007 (net of $0.8 million of write-offs of deposits and pre-acquisition costs related to land under option that we do not intend to purchase and $1.8 million of SFAS 144 valuation adjustments).
Other: Homebuilding revenues decreased in 2008, compared to 2007, primarily due to a decrease in the number of home deliveries in all of the states in Homebuilding Other, and a decrease in the average sales price of homes delivered in all of the states in this segment except Texas.in Minnesota. Gross margins from home sales excluding SFAS 144 valuation adjustments were $68.0 million, or 15.7%, in 2008, compared to $131.7 million, or 13.9%, in 2007. Gross margin percentage on home sales increased compared to last year primarily due to our lower inventory basis and continued focus on reducing costs, despite higher sales incentives offered to homebuyers (13.6% in 2008, compared to 9.1% in 2007). Gross margins on home sales were $657.7$55.3 million, or 20.6%,12.7% in 2005,2008 including SFAS 144 valuation adjustments of $12.7 million, compared to $488.9 million, or 18.8%, in 2004. Grossgross margins on home sales increasedof $88.9 million, or 9.4%, in 2005 due2007 including $42.8 million of SFAS 144 valuation adjustments.
Losses on land sales were $6.5 million in 2008 (including $9.0 million of write-offs of deposits and pre-acquisition costs related to higher marginsland under option that we do not intend to purchase and $0.9 million of SFAS 144 valuation adjustments), compared to losses on land sales of $168.8 million in all2007 (including $42.4 million of the states in this segment.write-offs of deposits and pre-acquisition costs related to land under option that we do not intend to purchase and $130.3 million of SFAS 144 valuation adjustments).
2007 versus 2006
West:East: Homebuilding revenues increaseddecreased in 2005,2007, compared to 2004,2006, primarily due to an increasea decrease in the number of home deliveries in Florida and an increasea decrease in the average sales price of homes delivered in all of the states in this segment. Gross margins on home sales excluding SFAS 144 valuation adjustments were $1.5 billion,$368.0 million, or 29.3%13.7%, in 2005,2007, compared to $935.0$1,020.7 million, or 27.1%22.0%, in 2004.2006. Gross margins decreased compared to 2006 primarily due to higher sales incentives offered to homebuyers (16.9% in 2007, compared to 11.4% in 2006). Gross margins on home sales increasedwere $89.0 million, or 3.3% in 20052007 including SFAS 144 valuation adjustments of $279.1 million, compared to gross margins on home sales of $865.0 million, or 18.6%, in 2006 including $155.7 million of SFAS 144 valuation adjustments.
Losses on land sales were $400.8 million in 2007 (including $119.6 million of write-offs of deposits and pre-acquisition costs related to land under option that we do not intend to purchase and $307.5 million of SFAS 144 valuation adjustments), compared to losses on land sales of $63.7 million in 2006 (including $80.5 million of write-offs of deposits and pre-acquisition costs related to land under option that we do not intend to purchase and $24.7 million of SFAS 144 valuation adjustments).
Central: Homebuilding revenues decreased in 2007, compared to 2006, primarily due to higher margins in California.
Other: Homebuilding revenues increased in 2005, compared to 2004, primarily due to an increasea decrease in the number of home deliveries in all of the states in Homebuilding Other, except Illinois,this segment, and an increasea decrease in the average sales price of homes delivered in Arizona and Colorado. Gross margins on home sales excluding SFAS 144 valuation adjustments were $193.3 million, or 12.5%, in 2007, compared to $442.0 million, or 17.3%, in 2006. Gross margins decreased compared to 2006 primarily due to higher sales incentives offered to homebuyers (13.0% in 2007, compared to 10.2% in 2006). Gross margins on home sales were $102.0 million, or 6.6%, in 2007 including $91.4 million of SFAS 144 valuation adjustments, compared to gross margins on home sales of $414.9 million, or 16.3%, in 2006 including $27.1 million of SFAS 144 valuation adjustments primarily in Arizona and Colorado.
Losses on land sales were $142.3 million in 2007 (including $56.3 million of write-offs of deposits and pre-acquisition costs related to land under option that we do not intend to purchase and $79.1 million of SFAS 144 valuation adjustments), compared to losses on land sales of $0.9 million in 2006 (including $2.5 million of write-offs of deposits and pre-acquisition costs related to land under option that we do not intend to purchase and $16.3 million of SFAS 144 valuation adjustments).
West: Homebuilding revenues decreased in 2007, compared to 2006, primarily due to a decrease in the number of home deliveries and average sales price of homes delivered in all of the states in Homebuilding Other, except Minnesota.this segment. Gross margins fromon home sales excluding SFAS 144 valuation adjustments were $451.0 million, or 13.0%, in 2007, compared to $1,224.8 million, or 22.4%, in 2006. Gross margins decreased compared to 2006 primarily due to higher sales incentives offered to homebuyers (14.3% in 2007, compared to 7.5% in 2006). Gross margins on home sales were $191.8$119.1 million, or 18.0%3.4% in 2007 including SFAS 144 valuation adjustments of $331.8 million, compared to gross margins on home sales of $1,144.6 million, or 20.9%, in 2005,2006 including $80.2 million of SFAS 144 valuation adjustments in all states.
Losses on land sales were $950.3 million in 2007 (including $310.8 million of write-offs of deposits and pre-acquisition costs related to land under option that we do not intend to purchase and $648.6 million of SFAS 144 valuation adjustments), compared to $191.0gains on land sales of $84.7 million in 2006 (net of $44.0 million of write-offs of deposits and pre-acquisition costs related to land under option that we do not intend to purchase).
Houston: Homebuilding revenues decreased in 2007, compared to 2006, primarily due to a decrease in the number of home deliveries in this segment. Gross margins on home sales excluding SFAS 144 valuation adjustments were $174.5 million, or 22.1%21.4%, in 2004.2007, compared to $189.5 million, or 19.0%, in 2006. Gross margins on home sales decreased in 2005compared to 2006 primarily due to lowerhigher sales incentives offered to homebuyers (7.7% in 2007, compared to 5.9% in 2006). Gross margins on home sales were $171.7 million, or 21.1%, in Minnesota and Illinois, partially offset by an increase2007 including SFAS 144 valuation adjustments of $2.8 million, compared to gross margins on home sales of $189.5 million, or 19.0%, in the Carolinas.2006.
24Gross profits on land sales were of $1.2 million in 2007 (net of $0.8 million of write-offs of deposits and pre-acquisition costs related to land under option that we do not intend to purchase and $1.8 million of SFAS 144 valuation adjustments), compared to gains on land sales of $6.0 million in 2006 (including $0.5 million of write-offs of deposits and pre-acquisition costs related to land under option that we do not intend to purchase and $1.0 million of SFAS 144 valuation adjustments).
Other: Homebuilding revenues decreased in 2007, compared to 2006, primarily due to a decrease in the number of home deliveries in all of the states in this segment, and a decrease in the average sales price of homes delivered in Illinois. Gross margins on home sales excluding SFAS 144 valuation adjustments were $131.7 million, or 13.9%, in 2007, compared to $143.9 million, or 12.0%, in 2006. Gross margins on home sales decreased compared to 2006 primarily due to the decrease in homebuilding revenues and higher sales incentives offered to homebuyers (9.1% in 2007, compared to 7.8% in 2006). Gross margins on home sales were $88.9 million, or 9.4% in 2007 including SFAS 144 valuation adjustments of $42.8 million, compared to gross margins on home sales of $126.5 million, or 10.5%, in 2006 including $17.4 million of SFAS 144 valuation adjustments primarily in Arizona and Colorado.
Losses on land sales were $168.8 million in 2007 (including $42.4 million of write-offs of deposits and pre-acquisition costs related to land under option that we do not intend to purchase and $130.3 million of SFAS 144 valuation adjustments), compared to losses on land sales of $56.1 million in 2006 (including $24.8 million of write-offs of deposits and pre-acquisition costs related to land under option that we do not intend to purchase and $27.1 million of SFAS 144 valuation adjustments).
Financial Services Segment
We have one Financial Services reportable segment that provides mortgage financing, title insurance, closing services and other ancillary services (including personal lines insurance, high-speed Internet and cable television) for both buyers of our homes and others. The Financial Services segment sold substantiallySubstantially all of the loans it originatedthe Financial Services segment originates are sold in the secondary mortgage market on a servicing released, non-recourse basis; however,although, we remain liable for certain limited representations and warranties related to loan sales.representations. The following table sets forth selected financial and operational information relating to our Financial Services segment. The results of operations of companies we acquired during these years2006 were not material to our consolidated financial statements and are included in the table since the respective dates of the acquisitions.
| Years Ended November 30, | Years Ended November 30, | |||||||||||||||||||
| 2006 | 2005 | 2004 | 2008 | 2007 | 2006 | |||||||||||||||
| (Dollars in thousands) | (Dollars in thousands) | |||||||||||||||||||
Revenues | $ | 643,622 | 562,372 | 500,336 | $ | 312,379 | 456,529 | 643,622 | ||||||||||||
Costs and expenses | 493,819 | 457,604 | 389,605 | 343,369 | 450,409 | 493,819 | ||||||||||||||
Operating earnings from continuing operations | $ | 149,803 | 104,768 | 110,731 | ||||||||||||||||
Operating earnings (loss) (1) | $ | (30,990 | ) | 6,120 | 149,803 | |||||||||||||||
Dollar value of mortgages originated | $ | 10,480,000 | 9,509,000 | 7,517,000 | $ | 4,290,000 | 7,740,000 | 10,480,000 | ||||||||||||
Number of mortgages originated | 41,800 | 42,300 | 37,900 | 18,300 | 30,900 | 41,800 | ||||||||||||||
Mortgage capture rate of Lennar homebuyers | 66 | % | 66 | % | 71 | % | 85 | % | 73 | % | 66 | % | ||||||||
Number of title and closing service transactions | 161,300 | 187,700 | 187,700 | 105,900 | 136,300 | 161,300 | ||||||||||||||
Number of title policies issued | 195,700 | 193,900 | 185,100 | 96,700 | 146,200 | 195,700 | ||||||||||||||
| (1) | Financial Services costs and expenses and operating loss for the year ended November 30, 2008 include a $27.2 million impairment of goodwill. |
During 2007 and 2008, concern in the mortgage market about a likely increase in defaults (which, in fact, has occurred) led to tightening lending standards, which among other things, has resulted in a significant decline in the availability of sub-prime loans (loans to persons with a FICO score under 620) and Alt A loans (loans to persons with FICO scores of 620 or more who do not have conventional documentation of their incomes or net worths). Because we sell all the loans we originate, we had to conform our lending standards to the tightened industry standards. This reduced the number of persons who qualified for loans from us. During the year ended November 30, 2008, the number of sub-prime and Alt A loans made by our Financial Services segment to purchasers of our homes were negligible, compared to approximately 2% and 29%, respectively, of sub-prime and Alt A loans made during the year ended November 30, 2007.
Financial Condition and Capital Resources
At November 30, 2006,2008, we had cash and cash equivalents related to our homebuilding and financial services operations of $778.3$1,203.4 million, compared to $1.1 billion$795.2 million at November 30, 2005. The decrease in cash was primarily due to repayment of debt, a decrease in accounts payable and other liabilities, contributions to unconsolidated entities and repurchases of common stock, partially offset by our net earnings, distributions of capital from unconsolidated entities and proceeds from debt issuances.2007.
We finance our land acquisition and development activities, construction activities, financial services activities and general operating needs primarily with cash generated from our operations and public debt issuances, as well as cash borrowed under our revolving credit facility issuances of commercial paper and unsecured, fixed-rate notes and borrowings under our warehouse lines of credit.
Operating Cash Flow Activities
During 20062008 and 2005,2007, cash flows provided by operating activities amounted to $554.7$1,100.8 million and $323.0$444.5 million, respectively. During 2006,2008, cash flows provided by operating activities included a decrease in our inventory as a result of reduced land purchases, a reduction in construction in progress resulting from lower new home starts and write-offs and valuation adjustments pertaining to the respective inventory. In order to improve liquidity in 2008, we continued to focus our efforts on adjusting pricing to meet market conditions, as we pulled back production and curtailed land purchases where possible in order to keep our balance sheet positioned for future opportunities. Cash flows provided by operating activities were also impacted by a decrease in our receivables primarily related to the collection of our income tax receivables, a decrease in loans held-for-sale resulting from a decrease in our new home deliveries during the year and our deferred income tax provision. Cash flows provided by operating activities were partially offset by our net loss and a decrease in accounts payable and other liabilities primarily due to a decrease in our land purchases.
During 2007, cash flows provided by operating activities consisted primarily of net earnings, distributions of earnings from unconsolidated entities and the change in inventories including inventory write-offs and valuation adjustments, our equity in loss from unconsolidated entities including our share of valuation adjustments related to assets of the unconsolidated entities, partially offset by theour net loss, a deferred income tax benefit and a decrease in accounts payable and other liabilities.
During 2005, cash flows provided by operating activities consisted primarily of net earnings, an increase in accounts payable and other liabilities and distributions of earnings from unconsolidated entities partially offset by an increase in inventories due to an increase in construction in progress to support a significantly higher backlog and land purchases to facilitate future growth, an increase in receivables resulting primarily from land sales and equity in earnings from unconsolidated entities.
Investing Cash Flow Activities
Cash flows used in investing activities totaled $406.5$265.7 million during 2006,in the year ended November 30, 2008, compared to $1.0 billioncash provided by investing activities of $307.0 million in 2005. In 2006,2007. During the year ended November 30, 2008, we used $33.2contributed $403.7 million of cash for acquisitions and $729.3 million of cash was contributed to unconsolidated entities. This usage of cash was partially offset by $321.6entities, compared to $608.0 million ofin 2007. Our investing activities also included distributions of capital from unconsolidated entities. In 2005,entities of $87.8 million and $542.3 million, respectively, during the years ended November 30, 2008 and 2007. During 2007, we used $416.0 million of cash for acquisitions and $919.8 million of cash was contributed to unconsolidated entities. We also had an increase in financial services loans held-for-investment of $117.4 million. This usage of cash was partially offset by $466.8 million ofreceived distributions of capital from unconsolidated entities.$354.6 million in excess of our investment in LandSource due to its recapitalization.
25
Financing Cash Flow Activities
During 2008, our financing cash flow activities primarily related to net repayments under financial services debt, principal payments on other borrowings and dividends paid, partially offset by receipts related to minority interests.
During 2007, we sold a diversified portfolio of land to our land investment joint venture with Morgan Stanley Real Estate Fund II, L.P. for $525 million. As part of the transaction, we entered into option agreements and obtained rights of first offer, providing us the opportunity to purchase certain finished homesites. Due to our continuing involvement, the transaction did not qualify as a sale under GAAP; thus, the inventory remained on our balance sheet as of November 30, 2007. As a result of the transaction in 2007, we received $445 million of cash (net of our deposit on the homesites under option and our invested contribution to the land investment venture). During 2008, we exercised certain land option contracts from the land investment venture, reducing the liabilities reflected on our consolidated balance sheet related to consolidated inventory not owned by $48.4 million.
Homebuilding debt to total capital is aand net homebuilding debt to total capital are financial measuremeasures commonly used in the homebuilding industry and isare presented to assist in understanding the leverage of our homebuilding operations. ByManagement believes providing a measure of leverage of our homebuilding operations management believes that this measure enables readers of our financial statements to better understand our financial position and performance and we find it useful in evaluating our performance. Homebuilding debt to total capital as of November 30, 2006 and 2005 isnet homebuilding debt to total capital are calculated as follows:
| November 30, | ||||||||||||||
| 2006 | 2005 | 2008 | 2007 | |||||||||||
| (Dollars in thousands) | (Dollars in thousands) | |||||||||||||
Homebuilding debt | $ | 2,613,503 | 2,592,772 | $ | 2,544,935 | 2,295,436 | ||||||||
Stockholders’ equity | 5,701,372 | 5,251,411 | 2,623,007 | 3,822,119 | ||||||||||
Total capital | $ | 8,314,875 | 7,844,183 | $ | 5,167,942 | 6,117,555 | ||||||||
Homebuilding debt to total capital | 31.4 | % | 33.1 | % | 49.2 | % | 37.5 | % | ||||||
Homebuilding debt | $ | 2,544,935 | 2,295,436 | |||||||||||
Less: Homebuilding cash and cash equivalents | 1,091,468 | 642,467 | ||||||||||||
Net homebuilding debt | $ | 1,453,467 | 1,652,969 | |||||||||||
Net homebuilding debt to total capital (1) | 35.7 | % | 30.2 | % | ||||||||||
| (1) | Net homebuilding debt to total capital consists of net homebuilding debt (homebuilding debt less homebuilding cash and cash equivalents) divided by total capital (net homebuilding debt plus stockholders’ equity). |
The leverage ratio atAt November 30, 20062008, homebuilding debt to total capital was lower than the leverage ratio in thehigher compared to prior year because of the decrease in stockholders’ equity primarily due to our net loss as we made greater usea result of sales incentivesinventory valuation adjustments,
write-offs of option deposits and pre-acquisition costs, SFAS 144 valuation adjustments related to generate salesassets of unconsolidated entities, APB 18 valuation adjustments to investments in orderunconsolidated entities and a SFAS 109 valuation allowance against our deferred tax assets, all of which are non-cash items. At November 30, 2008, net homebuilding debt to build-out our inventory, deliver our backlogtotal capital was higher compared to November 30, 2007 due to a decrease in stockholders’ equity despite an increase in homebuilding cash and convert inventory into cash. This intensified focus on generating strong cash flow allowed us to strengthen our balance sheet and reduce the leverageequivalents of our homebuilding operations.$449.0 million.
In addition to the use of capital in our homebuilding and financial services operations, we actively evaluate various other uses of capital, which fit into our homebuilding and financial services strategies and appear to meet our profitability and return on capital goals. This may include acquisitions of, or investments in, other entities, the payment of dividends or repurchases of our outstanding common stock or debt. These activities may be funded through any combination of our credit facilities, issuances of commercial paper and unsecured, fixed-rate notes, cash generated from operations, sales of assets or the issuance of public debt, common stock or preferred stock.
The following table summarizes our homebuilding senior notes and other debts payable:
| November 30, | November 30, | |||||||||
| 2006 | 2005 | 2008 | 2007 | |||||||
| (Dollars in thousands) | (Dollars in thousands) | |||||||||
7 5/8% senior notes due 2009 | $ | 277,830 | 276,299 | $ | 280,976 | 279,491 | ||||
5.125% senior notes due 2010 | 299,766 | 299,715 | 299,877 | 299,825 | ||||||
5.95% senior notes due 2011 | 249,415 | — | 249,615 | 249,516 | ||||||
5.95% senior notes due 2013 | 345,719 | 345,203 | 346,851 | 346,268 | ||||||
5.50% senior notes due 2014 | 247,559 | 247,326 | 248,088 | 247,806 | ||||||
5.60% senior notes due 2015 | 501,957 | 502,127 | 501,618 | 501,804 | ||||||
6.50% senior notes due 2016 | 249,683 | — | 249,733 | 249,708 | ||||||
Senior floating-rate notes due 2007 | — | 200,000 | ||||||||
Senior floating-rate notes due 2009 | 300,000 | 300,000 | ||||||||
5.125% zero-coupon convertible senior subordinated notes due 2021 | — | 157,346 | ||||||||
Mortgage notes on land and other debt | 141,574 | 264,756 | 368,177 | 121,018 | ||||||
| $ | 2,613,503 | 2,592,772 | $ | 2,544,935 | 2,295,436 | |||||
Our average debt outstanding was $4.0$2.3 billion in 2006,2008, compared to $3.0$3.1 billion in 2005.2007. The average rate for interest incurred was 5.7%5.8% in both 20062008 and 2005.2007. Interest incurred related to homebuilding debt for the year ended November 30, 20062008 was $247.5$148.3 million, compared to $172.9$199.1 million in 2005.2007. The majority of our short-term financing needs, including financings for land acquisition and development activities and general operating needs, are met with cash generated from operations and funds available under our new senior unsecured revolving credit facility (the “New Facility”), which replaced our senior unsecured credit facility (the “Credit Facility”) in July 2006, and issuances of commercial paper and unsecured, fixed-rate notes..
The NewCredit Facility consists of a $2.7$1.1 billion revolving credit facility maturing in July 2011. The New Facility also includes access to an additional $0.5 billion of financing through an accordion feature, subject to additional commitments for a maximum aggregate commitmentOur borrowings under the NewCredit Facility are limited by a borrowing base calculation, consisting of $3.2specified percentages of various types of our assets. Under the Credit Facility, we are required to maintain a leverage ratio of 55% for the fourth quarter of 2008 and our 2009 fiscal year and a leverage ratio of 52.5% for our 2010 and 2011 fiscal years. If our minimum tangible net worth, as defined by our Credit Facility, goes below $1.6 billion, our Credit Facility would be reduced from $1.1 billion to $0.9 billion. In no event can our minimum tangible net worth, as defined by our Credit Facility, be less than $1.3 billion. At November 30, 2008, we believe we were in compliance with our debt covenants.
In addition to other requirements, the Credit Facility limits our investments in joint ventures and requires us to effect quarterly reductions of our maximum recourse exposure related to joint ventures in which we have investments by a total of $200 million by November 30, 2009 of which we have already made significant progress. We must also effect quarterly reductions during our 2010 fiscal year totaling $180 million and during the first six months of our 2011 fiscal year totaling $80 million. By May 31, 2011, our maximum recourse exposure related joint ventures in which we have investments cannot exceed $275 million.
The NewCredit Facility is guaranteed by substantially all of our subsidiaries other than finance company subsidiaries (which include mortgage and title insurance agency subsidiaries).subsidiaries. Interest rates on outstanding borrowings are LIBOR-based, with margins determined based on changes in our credit ratings, or an alternate base rate, as described
26
in the credit agreement. At November 30, 2006, we had no outstanding balance under the New Facility. During the yearyears ended November 30, 2006,2008 and 2007, the average daily borrowings under the Credit Facility were $21.3 million and the New Facility were $447.4 million.
We have a structured letter of credit facility (the “LC Facility”) with a financial institution. The purpose of the LC Facility is to facilitate the issuance of up to $200$143.2 million, of letters of credit on a senior unsecured basis. In connection with the LC Facility, the financial institution issued $200 million of their senior notes, which were linked to our performance on the LC Facility. If there is an event of defaultrespectively. At both November 30, 2008 and 2007, we had no outstanding balance under the LC Facility, including our failure to reimburse a draw against an issued letter of credit, the financial institution would assign its claim against us, to the extent of the amount due and payable by us under the LC Facility, to its noteholders in lieu of their principal repayment on their performance-linked notes.
AtCredit Facility. However, at November 30, 2006, we had2008 and 2007, $275.2 million and $443.5 million, respectively, of our total letters of credit outstanding in the amount of $1.4 billion, which includes $190.8 million outstandingdiscussed below, were collateralized against certain borrowings available under the LCCredit Facility. The majority of these
Our performance letters of credit outstanding were $167.5 millions and $390.2 million, respectively, at November 30, 2008 and 2007. Our financial letters of credit outstanding were $278.5 million and $424.2 million,
respectively, at November 30, 2008 and 2007. Performance letters of credit are generally posted with regulatory bodies to guarantee our performance of certain development and construction activities, orand financial letters of credit are generally posted in lieu of cash deposits on option contracts. Of
In June 2007, we redeemed our total letters$300 million senior floating-rate notes due 2009. The redemption price was $300.0 million, or 100% of creditthe principal amount of the outstanding $496.9 million were collateralized against certain borrowings available undernotes due 2009, plus accrued and unpaid interest as of the New Facility.redemption date.
In November 2006, we calledredeemed our $200 million senior floating-rate notes due 2007 (the “Floating-Rate Notes”).2007. The redemption price was $200.0 million, or 100% of the principal amount of the Floating-Rate Notes outstanding notes due 2007, plus accrued and unpaid interest as of the redemption date.
In April 2006, substantially all of our outstanding 5.125% zero-coupon convertible senior subordinated notes due 2021, (the “Convertible Notes”) were converted by the noteholders into 4.9 million Class A common shares. The Convertible Notes were convertible at a rate of 14.2 shares of our Class A common stock per $1,000 principal amount at maturity. Convertible Notes not converted by the noteholders were not material and were redeemed by us on April 4, 2006. The redemption price was $468.10 per $1,000 principal amount at maturity, which represented the original issue price plus accrued original issue discount to the redemption date.
In April 2006, we issued $250 million of 5.95% senior notes due 2011 and $250 million of 6.50% senior notes due 2016 (collectively, the “New Senior Notes”) at a priceprices of 99.766% and 99.873%, respectively, in a private placement.placement under SEC Rule 144A. Proceeds from the offering of the New Senior Notes, after initial purchaser’s discount and expenses, were $248.7 million and $248.9 million, respectively. We added the proceeds to our working capital to be used for general corporate purposes. Interest on the New Senior Notes is due semi-annually. The New Senior Notes are unsecured and unsubordinated, and substantially all of our subsidiaries other than finance company subsidiaries guarantee the New Senior Notes. In October 2006, we completed an exchange offer of the New Senior Notes for substantially identical notes registered under the Securities Act of 1933 (the “Exchange Notes”), with substantially all of the New Senior Notes being exchanged for the Exchange Notes. At November 30, 2006,2008 and 2007, the carrying valueamount of the Exchange Notes was $499.1 million.
In March 2006, we initiated a commercial paper program (the “Program”) under which we may, from time-to-time, issue short-term unsecured notes in an aggregate amount not to exceed $2.0 billion. This Program has allowed us to obtain more favorable short-term borrowing rates than we would obtain otherwise. The Program is exempt from the registration requirements of the Securities Act of 1933. Issuances under the Program are guaranteed by all of our wholly-owned subsidiaries that are also guarantors of our New Facility. The average daily borrowings under the Program from its inception through November 30, 2006 were $553.3 million.
We also have an arrangement with a financial institution whereby we can enter into short-term, unsecured, fixed-rate notes from time-to-time. During the year ended November 30, 2006, the average daily borrowings under these notes were $379.0 million.$499.3 million and $499.2 million, respectively.
In September 2005, we sold $300 million of 5.125% senior notes due 2010 (the “5.125% Senior Notes”) at a price of 99.905% in a private placement. Proceeds from the offering, after initial purchaser’s discount and expenses, were $298.2 million. We added the proceeds to our working capital to be used for general corporate purposes. Interest on the 5.125% Senior Notes is due semi-annually. The 5.125% Senior Notes are unsecured and unsubordinated. Substantially all of our subsidiaries other than finance company subsidiaries guaranteed the 5.125% Senior Notes. In 2006, we exchanged the 5.125% Senior Notes for registered notes. The registered notes have substantially identical terms as the 5.125% Senior Notes, except that the registered notes do not include transfer restrictions that are applicable to the 5.125% Senior Notes. At November 30, 2006,2008 and 2007, the carrying valueamount of the 5.125% Senior Notes was $299.9 million and $299.8 million.million, respectively.
27
In April 2005, we sold $300 million of 5.60% Senior Notes due 2015 (the “Senior Notes”) at a price of 99.771%. Proceeds from the offering, after initial purchaser’s discount and expenses, were $297.5 million. In July 2005, we sold $200 million of 5.60% Senior Notes due 2015 (the “Senior Notes”) at a price of 101.407%. The Senior Notes were the same issue as the Senior Notes we sold in April 2005. Proceeds from the offering, after initial purchaser’s discount and expenses, were $203.9 million. We added the proceeds of both offerings to our working capital to be used for general corporate purposes. Interest on the Senior Notes is due semi-annually. The Senior Notes are unsecured and unsubordinated. Substantially all of our subsidiaries other than finance company subsidiaries guaranteed the Senior Notes. The Senior Notes were subsequently exchanged for identical Senior Notes that had been registered under the Securities Act of 1933. At November 30, 2006,2008 and 2007, the carrying valueamount of the Senior Notes sold in April and July 2005 was $502.0 million.
In May 2005, we redeemed all of our outstanding 9.95% senior notes due 2010 (the “Notes”). The redemption price was $337.7$501.6 million or 104.975% of the principal amount of the Notes outstanding, plus accrued and unpaid interest as of the redemption date. The redemption of the Notes resulted in a $34.9$501.8 million, pretax loss.
In April 2005, we sold $300 million of 5.60% Senior Notes due 2015 (the “Senior Notes”) at a price of 99.771%. Substitute registered notes were subsequently issued for the April and July 2005 Senior Notes. Proceeds from the offering, after initial purchaser’s discount and expenses, were $297.5 million. We added the proceeds to our working capital to be used for general corporate purposes. Interest on the Senior Notes is due semi-annually. The Senior Notes are unsecured and unsubordinated. Substantially all of our subsidiaries other than finance company subsidiaries guaranteed the Senior Notes.respectively.
Substantially all of our subsidiaries, other than finance companywholly-owned subsidiaries have guaranteed all our Senior Notes and Floating Rate Notes (the “Guaranteed Notes”). The guarantees are full and unconditional and the guarantor subsidiaries are 100% directly and indirectly owned by Lennar Corporation. The principal reason our subsidiaries, other than finance companywholly-owned subsidiaries guaranteed the Guaranteed Notes is so holders of the Guaranteed Notes will have rights at least as great with regard to our subsidiaries as any other holders of a material amount of our unsecured debt. Therefore, the guarantees of the Guaranteed Notes will remain in effect while the guarantor subsidiaries guarantee a material amount of the debt of Lennar Corporation, as a separate entity, to others. At any time, however, when a guarantor subsidiary is no longer guaranteeing at least $75 million of Lennar Corporation’s debt other than the Guaranteed Notes, either directly or by guaranteeing other subsidiaries’ obligations as guarantors of Lennar Corporation’s debt, the
guarantor subsidiaries’ guarantee of the Guaranteed Notes will be suspended. Currently, the only debt the guarantor subsidiaries are guaranteeing other than the Guaranteed Notes is Lennar Corporation’s principal revolving bank credit line (currently the NewCredit Facility) and our Commercial Paper Program.. Therefore, if, the guarantor subsidiaries cease guaranteeing Lennar Corporation’s obligations under theits principal revolving bank credit line and are not guarantors of any new debt, the guarantor subsidiaries’ guarantees of the Guaranteed Notes will be suspended until such time, if any, as they again are guaranteeing at least $75 million of Lennar Corporation’s debt other than the Guaranteed Notes.
If the guarantor subsidiaries are guaranteeing thea revolving credit line totaling at least $75 million, we will treat the guarantees of the Guaranteed Notes as remaining in effect even during periods when Lennar Corporation’s borrowings under the revolving credit line is less than $75 million. Because it is possible that our banks will permit some or all of the guarantor subsidiaries to stop guaranteeing our revolving credit line, it is possible that, at some time or times in the future, the Guaranteed Notes will no longer be guaranteed by the guarantor subsidiaries.
At November 30, 2006,2008, our Financial Services segment had a syndicated warehouse lines of credit totaling $1.4 billionrepurchase facility, which matures in April 2009 ($125 million, plus a $50 million temporary accordion feature that expired in December 2008) and a warehouse repurchase facility, which matures in June 2009 ($150 million).
Our Financial Services segment uses these facilities to fund ourfinance its lending activities until the mortgage loan activities. Borrowingsloans are sold to investors and expects both facilities to be renewed or replaced with other facilities when they mature. At November 30, 2008 and 2007, borrowings under the lines of credit were $1.1 billion at November 30, 2006$209.5 million and $505.4 million, respectively, and were collateralized by mortgage loans and receivables on loans sold but not yet funded by the investorinvestors with outstanding principal balances of $1.3 billion. There are$286.7 million and $540.9 million, respectively, at November 30, 2008 and 2007. These facilities have several interest rate-pricing options, which fluctuate with market rates. The combined effective interest rate on the facilities at November 30, 20062008 was 6.1%3.5%. The warehouse lines of credit mature in September 2007 ($700 million) and in April 2008 ($670 million), at which time we expect the facilities to be renewed.
At November 30, 2006, we2008 and 2007, our Financial Services segment had advances under a different conduit funding agreement amounting to $1.7totaling $10.8 million and $11.8 million, respectively, which had an effective interest rate of 2.9% and 5.8%, respectively, at November 30, 2008 and 2007. During 2008, our Financial Services segment entered into a new on going 60-day committed repurchase facility for $75 million. As of November 30, 2008, it had advances under this facility totaling $5.2 million, which had an effective interest rate of 6.2% at November 30, 2006. We also had a $25 million revolving line of credit that matures in May 2007, at which time we expect the line of credit to be renewed. The line of credit is collateralized by certain assets of the Financial Services segment and stock of certain title subsidiaries. Borrowings under the line of credit were $23.7 million at November 30, 2006 and had an effective interest rate of 6.3% at November 30, 2006.3.7%.
We have various interest rate swap agreements, which effectively convert variable interest rates to fixed interest rates on $200 million of outstanding debt related to our homebuilding operations. The interest rate swaps mature at various dates through fiscal 2008 and fix the LIBOR index (to which certain of our debt interest rates
28
are tied) at an average interest rate of 6.8% at November 30, 2006. The net effect on our operating results is that interest on the variable-rate debt being hedged is recorded based on fixed interest rates. Counterparties to these agreements are major financial institutions. At November 30, 2006, the fair value of the interest rate swaps was a $2.1 million liability. Our Financial Services segment, in the normal course of business, uses derivative financial instruments to reduce its exposure to fluctuations in interest rates. The Financial Services segment enters into forward commitments and, to a lesser extent, option contracts to protect the value of loans held-for-sale from increases in market interest rates. We do not anticipate that we will suffer credit losses from counterparty non-performance.
We have met all of our quantifiable debt covenants. There have been no significant changes in our liquidity from the balance sheet date to the date of issuance of this Annual Report on Form 10-K.
Changes in Capital Structure
In June 2001, our Board of Directors authorized a stock repurchase program to permit the purchase of up to 20 million shares of our outstanding common stock. During 2008 and 2007, there were no material share repurchases of common stock under the stock repurchase program. During 2006, we repurchased a total of 6.2 million shares of our outstanding common stock under ourthe stock repurchase program for an aggregate purchase price including commissions of $320.1 million, or $51.59 per share. During 2005, we repurchased a total of 5.1 million shares of our Class A common stock under the stock repurchase program for an aggregate purchase price including commissions of $274.9 million, or $53.38 per share. As of November 30, 2006,2008, 6.2 million shares of common stock can be repurchased in the future under the program.
Treasury stock increased by 0.5 million Class A common shares and 0.8 million Class A common shares during the years ended November 30, 2008 and November 30, 2007, primarily related to forfeitures of restricted stock. In addition to the common shares purchased under our stock repurchase program during the year ended November 30, 2006, we repurchased approximately 0.1 million and 0.2 million Class A common shares during the years ended November 30, 2006 and 2005, respectively, related to the vesting of restricted stock and distribution of common stock from our deferred compensation plan.
In 2006, our annual dividend rate with regard to our Class A and Class B common stock was $0.64 per share per year (payable quarterly). In September 2005, ourOctober 2008, the Company’s Board of Directors voted to increasedecrease the annual dividend rate with regard to ourthe Company’s Class A and Class B common stock to $0.64$0.16 per share per year (payable quarterly) from $0.55$0.64 per share per year (payable quarterly). During 2008, 2007 and 2006, Class A and Class B common stockholders received per share annual dividends of $0.52, $0.64 and $0.64, respectively.
Based on our current financial condition and credit relationships, we believe that our operations and borrowing resources will provide for our current and long-term capital requirements at our anticipated levels of growth.activity.
Off-Balance Sheet Arrangements
Investments in Unconsolidated Entities
At November 30, 2008, we had equity investments in 116 unconsolidated entities, compared to 214 unconsolidated entities at November 30, 2007. Due to current market conditions, we are focused on continuing to reduce the number of unconsolidated entities that we have investments in. Our investments in unconsolidated entities by type of venture were as follows:
| November 30, | |||||
| 2008 | 2007 | ||||
| (In thousands) | |||||
Land development | $ | 633,652 | 738,481 | ||
Homebuilding | 133,100 | 195,790 | |||
Total investment | $ | 766,752 | 934,271 | ||
During 2008, as homebuilding market conditions remained challenged, we recorded $32.2 million of our share of SFAS 144 valuation adjustments related to the assets of unconsolidated entities in which we have investments, compared to $364.2 million for the year ended November 30, 2007. In addition, we recorded $172.8 million and $132.2 million, respectively, of APB 18 valuation adjustments to our investments in unconsolidated entities for the years ended November 30, 2008 and 2007. We will continue to monitor our investments in joint ventures and the recoverability of assets owned by those joint ventures.
We strategically invest in unconsolidated entities that acquire and develop land (1) for our homebuilding operations or for sale to third parties or (2) for the construction of homes for sale to third-party homebuyers. Through these entities, we primarily seek to reduce and share our risk by limiting the amount of our capital invested in land, while increasingobtaining access to potential future homesites and allowing us to participate in strategic ventures. The use of these entities also, in some instances, enables us to acquire land to which we could not otherwise obtain access, or could not obtain access on as favorable terms, without the participation of a strategic partner. Our partnersParticipants in these joint ventures (“JVs”) are land owners/developers, other homebuilders and financial or strategic partners. JVsJoint ventures with land owners/developers give us access to homesites owned or controlled by our partner. JVsJoint ventures with other homebuilders provide us with the ability to bid jointly with our partner for large land parcels. JVsJoint ventures with financial partners allow us to combine our homebuilding expertise with access to our partners’ capital. JVsJoint ventures with strategic partners allow us to combine our homebuilding expertise with the specific expertise (e.g. commercial or infill experience) of our partner. Each joint venture is governed by an executive committee consisting of members from the partners.
Although the strategic purposes of our JVsjoint ventures and the nature of our JVjoint ventures partners vary, the JVsjoint ventures are generally designed to acquire, develop and/or sell specific assets during a limited life-time. The JVsjoint ventures are typically structured through non-corporate entities in which control is shared with our venture partners. Each JVjoint venture is unique in terms of its funding requirements and liquidity needs. We and the other JVjoint venture participants typically make pro-rata cash contributions to the JV.joint venture. In many cases, our risk is limited to our equity contribution and potential future capital contributions. The capital contributions usually coincide in time with the acquisition of properties by the JV.joint venture. Additionally, most JVsjoint ventures obtain third-party debt to fund a portion of the acquisition, development and construction costs of their communities. The JVjoint venture agreements usually permit, but do not require, the JVsjoint ventures to make additional capital calls in the future.
29
Our investment in unconsolidated entities has grown in recent years primarily due However, capital calls relating to (1) our participation in a larger numberthe repayment of ventures in order to increase the number of homesites controlled while minimizing capital requirements and mitigating market risk and (2) the increase in land prices in recent years. At November 30, 2006, we had equity investments in approximately 260 unconsolidated entities. Our investments in unconsolidated entities arejoint venture debt under payment or maintenance guarantees generally land development ventures and homebuilding ventures, most of which are accounted for by the equity method of accounting.
Our investments in unconsolidated entities by type of venture were as follows:
| November 30, | |||||
| 2006 | 2005 | ||||
| (In thousands) | |||||
Land development | $ | 1,163,671 | 1,082,101 | ||
Homebuilding | 283,507 | 200,585 | |||
Total investment | $ | 1,447,178 | 1,282,686 | ||
During 2006, we experienced a slowdown in demand for homes in many markets and we increased sales incentives to maintain sales volumes. Primarily as a result of these market conditions, we recorded $126.4 million of valuation adjustments to our investment in unconsolidated entities for the year ended November 30, 2006. After the valuation adjustments, as of November 30, 2006, we believe that our investment in JVs is fully recoverable and it is unlikely that we will be called to perform on any of our guarantees that would have a material impact on our consolidated financial statements. We will continue to monitor our investments and the recoverability of assets owned by the JVs.required.
Under the terms of our JVjoint venture agreements, we generally have the right to share in earnings and distributions of the entities on a pro-rata basis based on our ownership percentage. Some JVjoint venture agreements provide for a different allocation of profit and cash distributions if and when the cumulative results of the JVjoint venture exceed specified targets (such as a specified internal rate of return). Our equity in earnings (loss) from unconsolidated entities excludes our pro-rata share of JVs’joint ventures’ earnings resulting from land sales to our homebuilding divisions. Instead, we account for those earnings as a reduction of our costs of purchasing the land from the JVs.joint ventures. This in effect defers recognition of our share of the JVs’joint ventures’ earnings related to these sales until we deliver a home and title passes to a third-party homebuyer.
In some instances, we are designated as the manager of the unconsolidated entity and receive fees for such services. In addition, we often enter into option contracts to acquire properties from our JVsjoint ventures, generally for market prices at specified dates in the future. Option contracts generally require us to make deposits using
cash or irrevocable letters of credit toward the exercise price. These option deposits generally approximate 10% of the exercise price.
We regularly monitor the results of our unconsolidated JVsjoint ventures and any trends that may affect their future liquidity or results of operations. JVsJoint ventures in which we have investments are subject to a variety of financial and non-financial debt covenants related primarily to equity maintenance, fair value of collateral and minimum homesite takedown or sale requirements. We monitor the performance of JVsjoint ventures in which we have investments on a regular basis to assess compliance with debt covenants. For those JVsjoint ventures not in compliance with the debt covenants, we evaluate and assess possible impairment of our investment. As of November 30, 2006, substantially all of our unconsolidated JVs were in compliance with their debt covenants in all material respects.
Our arrangements with JVsjoint ventures generally do not restrict our activities or those of the other participants. However, in certain instances, we agree not to engage in some types of activities that may be viewed as competitive with the activities of these ventures in the localities where the JVsjoint ventures do business.
As discussed above, the JVsjoint ventures in which we invest generally supplement equity contributions with third-party debt to finance their activities. In many instances, the debt financing is non-recourse, thus neither we nor the other equity partners are a party to the debt instruments. In other cases, we and the other partners agree to provide credit support in the form of repayment or maintenance guarantees.
Material contractual obligations of our unconsolidated JVsjoint ventures primarily relate to the debt obligations described above. The JVsjoint ventures generally do not enter into lease commitments because the entities are managed either by us, or another of the JVjoint venture participants, who supply the necessary facilities and employee services in exchange for market-based management fees. However, they do enter into management contracts with the participants who manage
30
them. Some JVsjoint ventures also enter into agreements with developers, which may be us or other JVjoint venture participants, to develop raw land into finished homesites or to build homes.
The JVsjoint ventures often enter into option agreements with buyers, which may include us or other JVjoint venture participants, to deliver homesites or parcels in the future at market prices. Option deposits are recorded by the JVsjoint ventures as liabilities until the exercise dates at which time the deposit and remaining exercise proceeds are recorded as revenue. Any forfeited deposit is recognized as revenue at the time of forfeiture. Our unconsolidated JVsjoint ventures generally do not enter into off-balance sheet arrangements.
As described above, the liquidity needs of JVsjoint ventures in which we have investments vary on an entity-by-entity basis depending on each entity’s purpose and the stage in its life cycle. During formation and development activities, the entities generally require cash, which is provided through a combination of equity contributions and debt financing, to fund acquisition and development of properties. As the properties are completed and sold, cash generated is available to repay debt and for distribution to the JV’sjoint venture’s members. Thus, the amount of cash available for a JVjoint venture to distribute at any given time is primarily a function of the scope of the JV’sjoint venture’s activities and the stage in the JV’sjoint venture’s life cycle.
We track our share of cumulative earnings and cumulative distributions of our JVs.joint ventures. For purposes of classifying distributions received from JVsjoint ventures in our statements of cash flows, cumulative distributions are treated as returnson capital to the extent of accumulated earnings.cumulative earnings and included in our consolidated statements of cash flows as operating activities. Cumulative distributions in excess of our share of cumulative earnings are treated as returnsof capital. Returns of capital and returns on capital are separately identified and reportedincluded in our consolidated statements of cash flows as investing activities and operating activities, respectively.activities.
At November 30, 2006,2008, the JVsunconsolidated entities in which we had investments had total assets of $10.1$7.8 billion and total liabilities of $6.4$5.1 billion, which included $5.0$4.1 billion of notes and mortgages payable.debt. These JVsunconsolidated entities usually finance their activities with a combination of partner equity and debt financing. As of November 30, 2006,2008, our equity in these JVsunconsolidated entities represented 39%29% of the entities’ total equity. equity, down from 34% at November 30, 2007. Indebtedness of an unconsolidated entity is secured by its own assets. There is no cross collateralization of debt to different unconsolidated entities. Some unconsolidated entities own multiple properties and other assets. We also do not use our investment in one unconsolidated entity as collateral for the debt in another unconsolidated entity or commingle funds among our unconsolidated entities.
In some instances,connection with a loan to an unconsolidated entity, we and our partners often guarantee to a lender either jointly and severally or on a several basis, any, or all of the following: (i) the completion of the development, in whole or in part, (ii) indemnification of the lender from environmental issues, (iii) indemnification of the lender from “bad boy acts” of the unconsolidated entity (or full recourse liability in the event of unauthorized transfer or
bankruptcy) and (iv) that the loan to value and/or loan to cost will not exceed a certain percentage (maintenance or remargining guarantee) or that a percentage of the outstanding loan will be repaid (repayment guarantee).
In connection with loans to an unconsolidated entity where there is a joint and several guarantee, we generally have guaranteed debta reimbursement agreement with our partner. The reimbursement agreement provides that neither party is responsible for more than its proportionate share of certain JVs. Ourthe guarantee. However, if our joint venture partner does not have adequate financial resources to meet its obligations under the reimbursement agreement, we may be liable for more than our proportionate share, up to our maximum exposure, which is the full amount covered by the joint and several guarantee.
The summary of guaranteesour net recourse exposure related to ourthe unconsolidated entities in which we have investments was as follows:
| November 30, 2006 | November 30, | ||||||||||
| (In thousands) | 2008 | 2007 | |||||||||
Sole recourse debt | $ | 18,920 | |||||||||
| (In thousands) | |||||||||||
Several recourse debt—repayment | 163,508 | $ | 78,547 | 123,022 | |||||||
Several recourse debt—maintenance | 560,823 | 167,941 | 355,513 | ||||||||
Joint and several recourse debt—repayment | 64,473 | 138,169 | 263,364 | ||||||||
Joint and several recourse debt—maintenance | 956,682 | 123,051 | 291,727 | ||||||||
Land seller debt recourse exposure | 12,170 | — | |||||||||
Lennar’s maximum recourse exposure | 1,764,406 | ||||||||||
Our maximum recourse exposure | 519,878 | 1,033,626 | |||||||||
Less joint and several reimbursement agreements with our partners | (661,486 | ) | (127,428 | ) | (238,692 | ) | |||||
Lennar’s net recourse exposure | $ | 1,102,920 | |||||||||
Our net recourse exposure | $ | 392,450 | 794,934 | ||||||||
The maintenance amountsrecourse debt exposure in the table above arerepresents our maximum exposure ofto loss which assumes thatfrom guarantees and does not take into account the fairunderlying value of the underlying collateral is zero. As of November 30, 2006, the fair values of the maintenance guarantees and repayment guarantees were not material.collateral.
Although we, in some instances, guarantee the indebtedness of unconsolidated entities in which we have an investment, our unconsolidated entities that have recourse debt have a significant amount of assets and equity. The summarized balance sheets of our unconsolidated entities with recourse debt were as follows:
| November 30, | |||||
| 2008 | 2007 | ||||
| (In thousands) | |||||
Assets | $ | 2,846,819 | 3,220,695 | ||
Liabilities | 1,565,148 | 2,311,216 | |||
Equity | 1,281,671 | 909,479 | |||
In addition, we and/or our partners occasionally grant liens on our respective interests in a JVsometimes guarantee the obligations of an unconsolidated entity in order to help secure a loan to that JV.entity. When we and/or our partners provide guarantees, the JVunconsolidated entity generally receives more favorable terms from its lenders than would otherwise be available to it. In a repayment guarantee, we and our JVventure partners guarantee repayment of a portion or all of the debt in the event of a default before the lender would have to exercise its rights against the collateral. The maintenance guarantees only apply if the value orof the collateral (generally land and improvements) is less than a specified percentage of the loan balance. If we are required to make a payment under a maintenance guarantee to bring the value of the collateral above the specified percentage of the loan balance, the payment wouldmay constitute a capital contribution or loan to the unconsolidated entity and increase our share of any funds the JVunconsolidated entity distributes. During 2006,the years ended November 30, 2008 and 2007, amounts paid under our maintenance guarantees were not material. As$74.0 million and $84.1 million, respectively. In accordance with Financial Accounting Standards Board (“FASB”) Interpretation No. 45,Guarantor’s Accounting and Disclosure Requirements for Guarantees, Including Indirect Guarantees of Indebtedness of Others,as of November 30, 2006, if there was2008, the fair values of the maintenance guarantees and repayment guarantees were not material. We believe that as of November 30, 2008, in the event we become legally obligated to perform under a guarantee of the obligations of an occurrence ofunconsolidated entity due to a triggering event or condition under a guarantee, most of the time the collateral wouldshould be sufficient to repay at least a significant portion of the obligation.obligation or we and our partners would contribute additional capital into the venture.
31In many of the loans to unconsolidated entities, we and another entity or entities generally related to our subsidiary’s joint venture partner(s), have been required to give guarantees of completion to the lenders. Those
completion guarantees may require that the guarantors complete the construction of the improvements for which the financing was obtained. If the construction was to be done in phases, very often the guarantee is to complete only the phases as to which construction has already commenced and for which loan proceeds were used. Under many of the completion guarantees, the guarantors are permitted, under certain circumstances, to use undisbursed loan proceeds to satisfy the completion of obligations, and in many of those cases, the guarantors only pay interest on those funds, with no repayment of the principal of such funds required.
In certain circumstances, we have placed performance letters of credit and surety bonds with municipalities for our joint ventures.
The total debt of the unconsolidated entities in which we have investments was as follows:
| November 30, | |||||
| 2008 | 2007 | ||||
| (In thousands) | |||||
Our net recourse exposure | $ | 392,450 | 794,934 | ||
Reimbursement agreements from partners | 127,428 | 238,692 | |||
Partner several recourse | 285,519 | 465,641 | |||
Non-recourse land seller debt or other debt | 90,519 | 202,048 | |||
Non-recourse debt with completion guarantees | 820,435 | 1,432,880 | |||
Non-recourse debt without completion guarantees | 2,345,707 | 1,982,475 | |||
Total debt | $ | 4,062,058 | 5,116,670 | ||
Some of the unconsolidated entities’ debt arrangements contain financial covenants. As market conditions remained challenged during the year ended November 30, 2008, we continued to closely monitor these covenants and the unconsolidated entities’ abilities to comply with them. In these challenged market conditions, some of the unconsolidated entities may have to request of their lenders waivers or amendments to debt agreements so that the unconsolidated entities would remain in compliance with such covenants. Additionally, unconsolidated entities may have to extend or refinance the debt if their operations are not on track to meet their projected cash flows. In instances in which we have guaranteed obligations of unconsolidated entities, the entities’ inability to comply with loan covenants could result in calls on our guarantees.
Summarized financial results forinformation on a combined 100% basis related to unconsolidated entities in which we had investments werethat are accounted for by the equity method was as follows:
| November 30, | ||||||||||||
Balance Sheet | 2006 | 2005 | ||||||||||
Balance Sheets | November 30, | |||||||||||
| �� | 2008 | 2007 | ||||||||||
| (In thousands) | (Dollars in thousands) | |||||||||||
Assets: | ||||||||||||
Cash | $ | 276,501 | 334,530 | |||||||||
Cash and cash equivalents | $ | 135,081 | 301,468 | |||||||||
Inventories | 8,955,567 | 7,615,489 | 7,115,360 | 7,941,835 | ||||||||
Other assets | 868,073 | 875,741 | 541,984 | 827,208 | ||||||||
| $ | 10,100,141 | 8,825,760 | $ | 7,792,425 | 9,070,511 | |||||||
Liabilities and equity: | ||||||||||||
Accounts payable and other liabilities | $ | 1,387,745 | 1,004,940 | $ | 1,042,002 | 1,214,374 | ||||||
Notes and mortgages payable | 5,001,625 | 4,486,271 | ||||||||||
Debt | 4,062,058 | 5,116,670 | ||||||||||
Equity of: | ||||||||||||
Lennar | 1,447,178 | 1,282,686 | 766,752 | 934,271 | ||||||||
Others | 2,263,593 | 2,051,863 | 1,921,613 | 1,805,196 | ||||||||
Total equity of unconsolidated entities | 2,688,365 | 2,739,467 | ||||||||||
| $ | 10,100,141 | 8,825,760 | ||||||||||
| $ | 7,792,425 | 9,070,511 | ||||||||||
Our equity in its unconsolidated entities | 29 | % | 34 | % | ||||||||
Debt to total capital of our JVsunconsolidated entities is calculated as follows:
| November 30, | November 30, | |||||||||||||
| 2006 | 2005 | 2008 | 2007 | |||||||||||
| (Dollars in thousands) | (Dollars in thousands) | |||||||||||||
Debt | $ | 5,001,625 | 4,486,271 | $ | 4,062,058 | 5,116,670 | ||||||||
Equity | 3,710,771 | 3,334,549 | 2,688,365 | 2,739,467 | ||||||||||
Total capital | $ | 8,712,396 | 7,820,820 | $ | 6,750,423 | 7,856,137 | ||||||||
Debt to total capital of our JVs | 57.4 | % | 57.4 | % | ||||||||||
Debt to total capital of our unconsolidated entities | 60.2 | % | 65.1 | % | ||||||||||
Debt to total capital of our unconsolidated entities (excluding LandSource) | 49.8 | % | 61.1 | % | ||||||||||
| Years Ended November 30, | ||||||||||
Statements of Earnings | 2006 | 2005 | 2004 | |||||||
| (Dollars in thousands) | ||||||||||
Revenues | $ | 2,651,932 | 2,676,628 | 1,641,018 | ||||||
Costs and expenses: | 2,588,196 | 2,020,470 | 1,199,243 | |||||||
Net earnings of unconsolidated entities | $ | 63,736 | 656,158 | 441,775 | ||||||
Our share of net earnings | $ | 24,918 | 241,631 | 148,868 | ||||||
Our share of net earnings (loss)—recognized (1) | $ | (12,536 | ) | 133,814 | 90,739 | |||||
Our cumulative share of net earnings—deferred at November 30 | $ | 99,360 | 151,182 | 120,817 | ||||||
Our investment in unconsolidated entities | $ | 1,447,178 | 1,282,686 | 856,422 | ||||||
Equity of the unconsolidated entities | $ | 3,710,771 | 3,334,549 | 1,795,010 | ||||||
Our investment % in the unconsolidated entities | 39.0 | % | 38.5 | % | 47.7 | % | ||||
In November 2007, we sold a portfolio of land to a strategic land investment venture with Morgan Stanley Real Estate Fund II, L.P., an affiliate of Morgan Stanley & Co., Inc., in which we have a 20% ownership interest and 50% voting rights. We also manage the land investment venture’s operations and receive fees for our services. As part of the transaction, we entered into option agreements and obtained rights of first offer providing us the opportunity to purchase certain finished homesites. We have no obligation to exercise the options and cannot acquire a majority of the entity’s assets. Due to our continuing involvement, the transaction did not qualify as a sale under GAAP; thus, the inventory has remained on our consolidated balance sheet in consolidated inventory not owned. As a result of the transaction, the land investment venture recorded the purchase of the portfolio of land as inventory. As of November 30, 2008, the portfolio of land (including land development costs) of $538.4 million is reflected as inventory in the summarized condensed financial information related to unconsolidated entities in which we have investments.
Statements of Operations and Selected Information | Years Ended November 30, | |||||||||
| 2008 | 2007 | 2006 | ||||||||
| (Dollars in thousands) | ||||||||||
Revenues | $ | 862,728 | 2,060,279 | 2,651,932 | ||||||
Costs and expenses | 1,394,601 | 3,075,696 | 2,588,196 | |||||||
Net earnings (loss) of unconsolidated entities | $ | (531,873 | ) | (1,015,417 | ) | 63,736 | ||||
Our share of net earnings (loss) (1) | $ | (55,598 | ) | (353,946 | ) | 24,918 | ||||
Our share of net loss—recognized (1) | $ | (59,156 | ) | (362,899 | ) | (12,536 | ) | |||
Our cumulative share of net earnings—deferred at November 30 | $ | 21,491 | 34,731 | 99,360 | ||||||
Our investments in unconsolidated entities | $ | 766,752 | 934,271 | 1,447,178 | ||||||
Equity of the unconsolidated entities | $ | 2,688,365 | 2,739,467 | 3,710,771 | ||||||
Our investment % in the unconsolidated entities | 29 | % | 34 | % | 39 | % | ||||
| (1) | For the |
On December 29, 2006,In June 2008, the LandSource Communities Development LLC (“LandSource”) unconsolidated joint venture and a number of its subsidiaries commenced proceedings under Chapter 11 of the Bankruptcy Code in the United States Bankruptcy Court for the District of Delaware. We own 16% of LandSource, and until 2007, we had owned 50%. In November 2008, our land purchase options with LandSource were terminated, thus we recognized a deferred profit of $101.3 million (net of $31.8 million of write-offs of option deposits and LNR reachedpre-acquisition costs and other write-offs) related to the 2007 recapitalization of LandSource. The bankruptcy filing could result in LandSource losing some or all of the properties it owns, termination of our management agreement with LandSource, claims against us and a definitive agreement to admitsubstantial reduction (or total elimination) of our 16% ownership interest in LandSource, which had a carrying value of zero at November 30, 2008.
In February 2007, the LandSource joint venture admitted MW Housing Partners as a new strategic partner into our LandSourcepartner. As part of the transaction, the joint venture.venture obtained $1.6 billion of non-recourse financing, which consisted of a $200 million five-year Revolving Credit Facility, a $1.1 billion six-year Term Loan B Facility and a $244 million seven-year Second Lien Term Facility. The transaction will resultresulted in a cash distribution to us andof $707.6 million. As a result, our current partner, LNR,ownership in LandSource was reduced to 16%. As a result of approximately $660 million each. Forthe recapitalization, we recognized a pretax financial statement purposes,gain of $175.9 million during the transaction is expected to generate earnings of approximately $500 million for us, of which approximately $125 million will beyear ended November 30, 2007. During the year ended November 30, 2007, we also recognized at closing and a potential of approximately $375 million could be realized over future years. The new partner will contribute cash and property with a combined value of approximately $900 million. Subsequent to the transaction, in addition to options we will have on certain LandSource assets, we will also have $153$24.7 million of specific performance options onprofit deferred at the time of the recapitalization of the LandSource joint venture in management fees and other LandSource assets. Following the contribution and refinancing, our and LNR’s interest in LandSource will be diluted to 19% each, and the new partner will be issued a 62% interest in LandSource. The transaction is expected to close during our first quarter of 2007.
32income (expense), net.
Option Contracts
In our homebuilding operations, we haveoften obtain access to land through option contracts, which generally enables us to defer acquiringcontrol portions of properties owned by third parties (including land funds) and unconsolidated entities until we are readyhave determined whether to build homes on them.exercise the option.
A majority of our option contracts require a non-refundable cash deposit or irrevocable letter of credit based on a percentage of the purchase price of the land. These option deposits generally approximate 10% of the exercise price. These options are generally rolling options, in which we acquire homesites based on pre-determined take-down schedules. Our option contracts oftensometimes include price escalators,adjustment provisions, which adjust the purchase price of the land to its approximate fair value at the time of acquisition or are based on fair value at the acquisition.time of takedown. The exercise periods of our option contracts vary on a case-by-case basis, but generally range from one-to-ten years.
Our investments in option contracts are recorded at cost unless those investments are determined to be impaired, in which case our investments are written down to fair value. We review option contracts for impairment during each reporting period in accordance with SFAS 144 and SFAS No. 144,67,Accounting for the Impairment or DisposalCosts and Initial Rental Operations of Long-lived Assets,Real Estate Projects (“SFAS 144”). The most significant indicator of impairment is a decline in the fair value of the optioned property such that the purchase and development of the optioned property would no longer meet our targeted return on investment. Such declines could be caused by a variety of factors including increased competition, decreases in demand or changes in local regulations that adversely impact the cost of development. Changes in any of these factors would cause us to re-evaluate the likelihood of exercising our land options.
EachSome option contract containscontracts contain a predetermined take-down schedule for the optioned land parcels. However, in almost all instances, we are not required to purchase land in accordance with those take-down schedules. In substantially all instances, we have the right and ability to not exercise our option and forfeit our deposit without further penalty, other than termination of the option and loss of any unapplied portion of our deposit and pre-acquisition costs. Therefore, in substantially all instances, we do not consider the take-down price to be a firm contractual obligation.
When we permit an optionintend not to terminate or walk away fromexercise an option, we write-off any unapplied deposit and pre-acquisition costs.costs associated with the option contract. For the yearyears ended November 30, 2008, 2007 and 2006, we wrote-off $97.2 million, $530.0 million and $152.2 million, respectively, of option deposits and pre-acquisition costs related to 24,2358,200 homesites, 36,900 homesites and 24,200 homesites, respectively, under option that we do not intend to purchase, compared to $15.1 million in 2005.purchase.
In very limited cases, the land seller can enforce the take-down schedule by requiring us to exercise our option. We record the option contract as a financing arrangement when required in accordance with SFAS No. 49,Accounting for Product Financing Arrangements, and record the optioned property and related take-down liability in our consolidated financial statements.
We evaluated all option contracts for land when entered into or upon a reconsideration event and determined we were the primary beneficiary of certain of these option contracts. Although we do not have legal title to the optioned land, under FIN 46(R), we, if we are deemed to be the primary beneficiary, are required to consolidate the land under option at the purchase price of the optioned land. During 2006 and 2005, the effect of the consolidation of these option contracts was an increase of $548.7 million and $516.3 million, respectively, to consolidated inventory not owned with a corresponding increase to liabilities related to consolidated inventory not owned in our consolidated balance sheets as of November 30, 2006 and 2005. This increase was offset primarily by the exercising of our options to acquire land under certain contracts previously consolidated under FIN 46(R), resulting in a net increase in consolidated inventory not owned of $1.8 million. To reflect the purchase price of the inventory consolidated under FIN 46(R), we reclassified $80.7 million of related option deposits from land under development to consolidated inventory not owned in the accompanying consolidated balance sheet as of November 30, 2006. The liabilities related to consolidated inventory not owned represent the difference between the purchase price of the optioned land and our cash deposits.
At November 30, 2006 and 2005, our exposure to loss related to our option contracts with third parties and unconsolidated entities consisted of our non-refundable option deposits and advanced costs totaling $785.9 million and $741.6 million, respectively. Additionally, we posted $553.4 million of letters of credit in lieu of cash deposits under certain option contracts as of November 30, 2006.
33
The table below indicates the number of homesites owned and homesites to which we had access through option contracts with third parties (“optioned”) or unconsolidated joint ventures in which we have investments (“JVs”) (i.e., controlled homesites) for each of our homebuilding segments and Homebuilding Other at November 30, 20062008 and 2005:2007:
| Controlled | |||||||||||||||||||||||||
November 30, 2006 | Optioned | JVs | Total | Owned | Total | ||||||||||||||||||||
November 30, 2008 | Controlled Homesites | Owned | Total | ||||||||||||||||||||||
| Optioned | JVs | Total | |||||||||||||||||||||||
East | 42,733 | 17,898 | 60,631 | 36,169 | 96,800 | 8,705 | 4,444 | 13,149 | 25,688 | 38,837 | |||||||||||||||
Central | 27,435 | 30,815 | 58,250 | 21,887 | 80,137 | 1,820 | 5,991 | 7,811 | 14,501 | 22,312 | |||||||||||||||
West | 17,959 | 43,789 | 61,748 | 22,390 | 84,138 | 203 | 12,078 | 12,281 | 18,776 | 31,057 | |||||||||||||||
Houston | 1,461 | 2,654 | 4,115 | 7,389 | 11,504 | ||||||||||||||||||||
Other | 6,631 | 2,019 | 8,650 | 11,879 | 20,529 | 529 | 704 | 1,233 | 8,327 | 9,560 | |||||||||||||||
Total | 94,758 | 94,521 | 189,279 | 92,325 | 281,604 | ||||||||||||||||||||
Percentage | 34 | % | 33 | % | 67 | % | 33 | % | 100 | % | |||||||||||||||
Total homesites | 12,718 | 25,871 | 38,589 | 74,681 | 113,270 | ||||||||||||||||||||
| Controlled | |||||||||||||||||||||||||
November 30, 2005 | Optioned | JVs | Total | Owned | Total | ||||||||||||||||||||
November 30, 2007 | Controlled Homesites | Owned Homesites | Total Homesites | ||||||||||||||||||||||
| Optioned | JVs | Total | |||||||||||||||||||||||
East | 60,954 | 15,930 | 76,884 | 39,259 | 116,143 | 14,888 | 14,091 | 28,979 | 24,014 | 52,993 | |||||||||||||||
Central | 29,794 | 31,284 | 61,078 | 27,704 | 88,782 | 3,470 | 12,679 | 16,149 | 7,848 | 23,997 | |||||||||||||||
West | 26,345 | 45,609 | 71,954 | 24,477 | 96,431 | 1,243 | 30,800 | 32,043 | 15,300 | 47,343 | |||||||||||||||
Houston | 2,313 | 3,694 | 6,007 | 7,071 | 13,078 | ||||||||||||||||||||
Other | 9,920 | 2,283 | 12,203 | 11,247 | 23,450 | 963 | 1,729 | 2,692 | 8,568 | 11,260 | |||||||||||||||
Total | 127,013 | 95,106 | 222,119 | 102,687 | 324,806 | ||||||||||||||||||||
Total homesites | 22,877 | 62,993 | 85,870 | 62,801 | 148,671 | ||||||||||||||||||||
Percentage | 39 | % | 29 | % | 68 | % | 32 | % | 100 | % | |||||||||||||||
We evaluated all option contracts for land when entered into or upon a reconsideration event to determine whether we are the primary beneficiary of certain of these option contracts. Although we do not have legal title to the optioned land, under FASB Interpretation No. 46(R),Consolidation of Variable Interest Entities, (“FIN 46R”), if we are deemed to be the primary beneficiary, we are required to consolidate the land under
option at the purchase price of the optioned land. During the year ended November 30, 2008, the effect of consolidation of these option contracts was an increase of $32.4 million to consolidated inventory not owned with a corresponding increase to liabilities related to consolidated inventory not owned in our consolidated balance sheet as of November 30, 2008. This increase was offset primarily by our exercise of options to acquire land under certain contracts previously consolidated, resulting in a net decrease in consolidated inventory not owned of $141.3 million. To reflect the purchase price of the inventory consolidated under FIN 46R, we reclassified $2.5 million of related option deposits from land under development to consolidated inventory not owned in the accompanying consolidated balance sheet as of November 30, 2008. The liabilities related to consolidated inventory not owned primarily represent the difference between the option exercise prices for the optioned land and our cash deposits.
Our exposure to loss related to our option contracts with third parties and unconsolidated entities consisted of our non-refundable option deposits and pre-acquisition costs totaling $191.2 million and $317.1 million, respectively, at November 30, 2008 and 2007. Additionally, we had posted $89.5 million and $193.3 million, respectively, of letters of credit in lieu of cash deposits under certain option contracts as of November 30, 2008 and 2007.
Contractual Obligations and Commercial Commitments
The following table summarizes our contractual debt obligations at November 30, 2006:2008:
| Payments Due by Period | |||||||||||
Contractual Obligations | Total | Less than 1 year | 1 to 3 years | 3 to 5 years | More than 5 years | ||||||
| (In thousands) | |||||||||||
Homebuilding—Senior notes and other debts payable | $ | 2,613,503 | 87,298 | 613,940 | 567,347 | 1,344,918 | |||||
Financial services—Notes and other debts payable | 1,149,231 | 1,149,005 | 171 | 31 | 24 | ||||||
Interest commitments under interest bearing debt* | 866,827 | 162,778 | 273,463 | 198,041 | 232,545 | ||||||
Operating leases | 284,446 | 92,481 | 107,213 | 57,478 | 27,274 | ||||||
Total contractual cash obligations | $ | 4,914,007 | 1,491,562 | 994,787 | 822,897 | 1,604,761 | |||||
Contractual Obligations | Payments Due by Period | ||||||||||
| Total | Less than 1 year | 1 to 3 years | 3 to 5 years | More than 5 years | |||||||
| (In thousands) | |||||||||||
Homebuilding—Senior notes and other debts payable | $ | 2,544,935 | 427,542 | 730,516 | 387,438 | 999,439 | |||||
Financial services—Notes and other debts payable | 225,783 | 225,682 | 46 | 42 | 13 | ||||||
Interest commitments under interest bearing debt (1) | 570,929 | 126,520 | 208,084 | 145,401 | 90,924 | ||||||
Operating leases | 169,116 | 48,411 | 68,716 | 28,229 | 23,760 | ||||||
Total contractual obligations (2) | $ | 3,510,763 | 828,155 | 1,007,362 | 561,110 | 1,114,136 | |||||
| Interest commitments on variable interest-bearing debt are determined based on the interest rate as of November 30, |
| (2) | Total contractual obligations exclude our FASB Interpretation No. 48,Accounting for Uncertainty in Income Taxes—on Interpretation of FASB Statement No. 109, (“FIN 48”) liability of $100.2 million as of November 30, 2008 because we were unable to make reasonable estimates as to the period of cash settlement with the respective taxing authorities. |
We are subject to the usual obligations associated with entering into contracts (including option contracts) for the purchase, development and sale of real estate in the routine conduct of our business. Option contracts for the purchase of land generally enable us to defer acquiring portions of properties owned by third parties and unconsolidated entities until we are readyhave determined whether to build homes on them.exercise our option. This reduces our financial risk associated with land holdings. At November 30, 2006,2008, we had access to 189,27938,589 homesites through option contracts with third parties and unconsolidated entities in which we have investments. At November 30, 2006,2008, we had $785.9$191.2 million of non-refundable option deposits and advancedpre-acquisition costs related to certain of these homesites. Additionally, we posted $553.4homesites and $89.5 million of letters of credit posted in lieu of cash deposits under certain option contracts as ofcontracts.
At November 30, 2006.
We are committed, under various2008, we had letters of credit outstanding in the amount of $446.0 million (which included the $89.5 million of letters of credit discussed above). These letters of credit are generally posted either with regulatory bodies to performguarantee our performance of certain development and construction activities and provide certain guaranteesor in the normal courselieu of business. Outstanding letters of credit under these arrangements totaled $1.4 billion (which included the $553.4 million of letters of credit noted above)cash deposits on option contracts. Additionally, at November 30, 2006. Additionally,2008, we had outstanding performance and surety bonds related to site improvements at various projects with estimated(including certain projects in our joint ventures) of $1.1 billion. Although significant development and construction activities have been completed related to these site improvements, these bonds are generally not released until all of the development and construction activities are completed. As of November 30, 2008, there were approximately $444.2 million, or 42%, of costs to complete of $1.8 billion.related to these site improvements. We do not believe there will bepresently anticipate any draws upon these letters of credit or bonds, but if there were any such draws occur, we do not believe these drawsthey would have a material effect on our financial position, results of operations or cash flows.
34
Our Financial Services segment had a pipeline of loan applications in process of $2.9 billion$710.8 million at November 30, 2006.2008. Loans in process for which interest rates were committed to the borrowers and builder commitments for loan programs totaled approximately $323.9$248.8 million as of November 30, 2006.2008. Substantially all of these commitments were for periods of 60 days or less. Since a portion of these commitments is expected to expire
without being exercised by the borrowers or borrowers may not meet certain criteria at the time of closing, the total commitments do not necessarily represent future cash requirements.
Our Financial Services segment uses mandatory mortgage-backed securities (“MBS”) forward commitments, and MBS option contracts and investor commitments to hedge itsour mortgage-related interest rate exposure during the period from when it extends an interest rate lock to a loan applicant until the time at which the loan is sold to an investor.exposure. These instruments involve, to varying degrees, elements of credit and interest rate risk. Credit risk is managed by entering intoassociated with MBS forward commitments, and MBS option contracts only with investment banks with primary dealer status and loan sales transactions with permanentis managed by limiting our counterparties to investment banks, federally regulated bank affiliates and other investors meeting our credit standards. Our risk, in the event of default by the purchaser, is the difference between the contract price and fair value.value of the MBS forward commitments and option contracts. At November 30, 2006,2008, we had open commitments amounting to $335.0$332.0 million to sell MBS with varying settlement dates through January 2007.February 2009.
The following sections discuss economic conditions, market and financing risk, seasonality and interest rates and changing prices that may have an impact on our business:
Economic Conditions
During 2006,Throughout 2007 and 2008, market conditions in the homebuilding industry weakenedwere negatively impacted by broad-based pressures such as rising unemployment, falling home prices, increased foreclosures, tighter credit and we have not yet seen a recovery as we entered the first quartervolatile equity markets, which further eroded consumer confidence and depressed home sales. These market conditions resulted in high cancellation rates of 26% and 30%, respectively, in 2008 and 2007. This market deterioration has been driven primarily by excess supply as speculators reduced purchases and returned homes to the market as well as negative customer sentiment surrounding the general homebuilding market. We experienced slower sales (down 3% in 2006) and higher cancellations (29% in 2006) which have impacted most ofDespite our markets and therefore, we made greatercontinued use of sales incentives, ($32,000our net new orders were down 48% and 39%, respectively, in 2008 and 2007. Our sales incentives were $48,700 per home delivered in 2006, compared to $9,000and $48,000 per home delivered, respectively in 2005) to generate sales in order to achieve our delivery goals which resulted in lower inventory levels.2008 and 2007. A continued decline in the prices for new homes could adversely affect both our revenues and margins, as well as the carrying valueamount of our inventory and other investments.
Market and Financing Risk
We finance our contributions to JVs, land acquisition and development activities, construction activities, financial services activities and general operating needs primarily with cash generated from operations and public debt issuances, as well as cash borrowed under our revolving credit facility issuance of commercial paper and unsecured, fixed-rate notes and borrowings under our warehouse lines of credit. We also purchase land under option agreements, which enables us to acquirecontrol homesites whenuntil we are readyhave determined whether to build homes on them. Theexercise the option. We tried to manage the financial risks of adverse market conditions associated with land holdings are managed by what we believed to be prudent underwriting of land purchases in areas we viewviewed as desirable growth markets, careful management of the land development process and, until 2007 and 2008, limitation of risks by using partners to share the costs of purchasing and developing land, as well as obtaining access to land through option contracts. Although we believed our land underwriting standards were conservative, we did not anticipate the severe decline in land values and the sharply reduced demand for new homes encountered throughout 2007 and 2008.
Seasonality
We have historically experienced variability in our results of operations from quarter-to-quarter due to the seasonal nature of the homebuilding business. Currently,Due to challenged market conditions, we are currently focusing our efforts, in all quarters, on assetinventory management and our homebuilding manufacturing process, in order to achieve a more evenflow production of home deliveries throughout the year. Evenflow production involves determining the appropriate production levels based on demand in the market,deliver inventory and is driven by a defined production schedule designed to produce a consistent level of starts and deliveries throughout the year in order to gain production efficiencies. If our efforts at evenflow production are successful, the result should be a reduction in inventory cycle time and more accurate start, completion and delivery dates.generate cash.
Interest Rates and Changing Prices
Inflation can have a long-term impact on us because increasing costs of land, materials and labor result in a need to increase the sales prices of homes. In addition, inflation is often accompanied by higher interest rates, which can have a negative impact on housing demand and the costs of financing land development activities and housing construction. Rising interest rates, as well as increased materials and labor costs, may reduce gross margins. An increase in material and labor costs is particularly a problem during a period of declining home prices. During 2008, increased costs of materials and labor along with a more normalizeddecrease in home sales price appreciation in
35
2006 compared to previous years, haveprices contributed to lower gross margins and in certain instances tosignificant inventory valuation adjustments. In recent years, the increases in these costs have followed the general rate of inflation and hence have not had a significant adverse impact on us. In addition,Converserly, deflation can impact the value of real estate and make it difficult for us to recover our land costs. Therefore, either inflation or deflation could adversely impact our future results of operations.
New Accounting Pronouncements
In June 2006, the FASB issued Interpretation No. 48,Accounting for Uncertainty in Income Taxes-an interpretation of SFAS 109,(“FIN 48”). FIN 48 provides interpretive guidance for the financial statement recognition and measurement of a tax position taken or expected to be taken in a tax return. FIN 48 is effective for fiscal years beginning after December 15, 2006 (our fiscal year beginning December 1, 2007). We are currently reviewing the effect of this Interpretation on our consolidated financial statements.
In September 2006, the FASB issued SFAS No. 157,Fair Value Measurements, (“SFAS 157”). SFAS 157 defines fair value, establishes a framework for measuring fair value in generally accepted accounting principles and expands disclosures about fair value measurements. SFAS 157 iswas effective for our financial statements issued for fiscal years beginning after November 15, 2007 (our fiscal year beginningassets and liabilities on December 1, 2007),2007. The FASB deferred the provisions of SFAS 157 relating to nonfinancial assets and interim periods within those fiscal years.liabilities; implementation by us is now required on December 1, 2008. SFAS 157 has not and is not expected to materially affect how we determine fair value.value, but has resulted and will result in certain additional disclosures.
In September 2006,December 2007, the SecuritiesFASB issued SFAS No. 141 (revised 2007), Business Combinations, (“SFAS 141R”). SFAS 141R broadens the guidance of SFAS 141, extending its applicability to all transactions and Exchange Commission Staff issued Staff Accounting Bulletin 108,Consideringother events in which one entity obtains control over one or more other businesses. It broadens the Effectsfair value measurement and recognition of Prior Year Misstatements when Quantifying Misstatements in Current Year Financial Statements, (“SAB 108”). SAB 108 addresses howassets acquired, liabilities assumed and interests transferred as a result of business combinations. SFAS 141R expands on required disclosures to improve the statement users’ abilities to evaluate the nature and financial effects of prior year uncorrected financial statement misstatements should be considered in current year financial statements. SAB 108 requires registrants to quantify misstatements using both balance sheet and income statement approaches and to evaluate whether either approach results in quantifying an error that is material in light of relative quantitative and qualitative factors. SAB 108business combinations. SFAS 141R is effective for annual financial statements coveringbusiness combinations that close on or after December 1, 2009. We do not expect the first fiscal year ending after November 15, 2006 (our fiscal year ended November 30, 2006). SAB 108 did notadoption of SFAS 141R to have ana material effect on our consolidated financial statements.
In November 2006,December 2007, the FASB issued Emerging Issues Task Force IssueSFAS No. 06-8,160,ApplicabilityNoncontrolling Interests in Consolidated Financial Statements – an amendment of the Assessment of a Buyers Continuing Investment under FASB StatementARB No. 66, Accounting for Sales of Real Estate, for Sales of Condominiums,51(“EITF 06-8”, (“SFAS 160”). EITF 06-8 establishesSFAS 160 requires that a company should evaluatenoncontrolling interest in a subsidiary be reported as equity and the adequacyamount of consolidated net income specifically attributable to the buyer’s continuingnoncontrolling interest be identified in the consolidated financial statements. It also calls for consistency in the manner of reporting changes in the parent’s ownership interest in a subsidiary and requires fair value measurement of any noncontrolling equity investment retained in determining whether to recognize profit under the percentage-of-completion method. EITF 06-8a deconsolidation. SFAS 160 is effective for the first annual reporting period beginning after March 15, 2007 (ourour fiscal year beginning December 1, 2007)2009. We are evaluating the impact the adoption of SFAS 160 will have on our consolidated financial statements.
In March 2008, the FASB issued SFAS No. 161,Disclosures About Derivative Instruments and Hedging Activities – an amendment of FASB Statement No. 133, (“SFAS 161”). SFAS 161 expands the disclosure requirements in SFAS No. 133,Accounting for Derivative Instruments and Hedging Activities, regarding an entity’s derivative instruments and hedging activities. SFAS 161 is effective for our fiscal year beginning December 1, 2008. We do not expect the adoption of SFAS 161 to have a material effect on our consolidated financial statements.
In December 2008, the FASB issued FASB Staff Position (“FSP”) FAS 140-4 and FIN 46(R)-8,Disclosure by Public Entities (Enterprises) About Transfers of Financial Assets and Interests in Variable Interest Entities. The purpose of the FSP is to promptly improve disclosures by public companies until the pending amendments to FASB Statement No. 140,Accounting for Transfers and Servicing of Financial Assets and Extinguishment of Liabilities, (“SFAS 140”), and FIN 46R are finalized and approved by the FASB. The FSP amends SFAS 140 to require public companies to provide additional disclosures about transferor’s continuing involvement with transferred financial assets. It also amends FIN 46R by requiring public companies to provide additional disclosures regarding their involvement with variable interest entities. This FSP is effective for our fiscal year beginning December 1, 2008. The FSP will not have a material effect of this EITF is not expected to be material toon our consolidated financial statements.
Critical Accounting Policies and Estimates
Our accounting policies are more fully described in Note 1 of the notes to our consolidated financial statements included in Item 8 of this document. As discussed in Note 1, the preparation of financial statements in conformity with accounting principles generally accepted in the United States of America requires management to make estimates and assumptions about future events that affect the amounts reported in our consolidated financial statements and accompanying notes. Future events and their effects cannot be determined with absolute certainty. Therefore, the determination of estimates requires the exercise of judgment. Actual results could differ from those estimates, and such differences may be material to our consolidated financial statements. Listed below are those policies and estimates that we believe are critical and require the use of significant judgment in their application.
Homebuilding Operations
Revenue Recognition
Revenues from sales of homes are recognized when sales are closed and title passes to the new homeowner, the new homeowner’s initial and continuing investment is adequate to demonstrate a commitment to pay for the home, the new homeowner’s receivable is not subject to future subordination and we do not have a substantial continuing involvement with the new home in accordance with SFAS No. 66,Accounting for Sales of Real Estate,(“SFAS 66”). Revenues from sales of land are recognized when a significant down payment is received, the earnings process is complete, title passes and collectibilitycollectability of the receivable is reasonably assured. We believe that the accounting policy related to revenue recognition is a critical accounting policy because of the significance of revenue recognition.revenue.
36
Inventories
Inventories are stated at cost unless the inventory within a community is determined to be impaired, in which case the impaired inventory would beis written down to fair value. Inventory costs include land, land development and home construction costs, real estate taxes, deposits on land purchase contracts and interest related to development and construction. Land, land development, amenities and other costs are accumulated by specific area and allocated to homes within the respective areas.
We evaluate our inventoryreview inventories for impairment during each reporting period in accordance withon a community by community basis. SFAS 144. Accounting standards require144 requires that if the sum of the undiscounted future cash flows expected to result frombe generated by an asset isare less than its carrying amount, an impairment charge should be recorded to write down the carrying valueamount of such asset to its fair value.
In conducting our review for indicators of impairment on a community level, we evaluate, among other things, the margins on homes that have been delivered, margins under sales contracts in backlog, projected margins with regard to future home sales over the life of the asset, an asset impairment must be recognized in the consolidated financial statements. The amount of impairment is calculated by subtractingcommunity, projected margins with regard to future land sales, and the fair value of the assetland itself. We pay particular attention to communities in which inventory is moving at a slower than anticipated absorption pace and communities whose average sales price and/or margins are trending downward and are anticipated to continue to trend downward. From this review we identify communities whose carrying values exceed their undiscounted cash flows.
We estimate the fair value of our communities using a discounted cash flow model. These projected cash flows for each community are significantly impacted by estimates related to market supply and demand, product type by community, homesite sizes, sales pace, sales prices, sales incentives, construction costs, sales and marketing expenses, the local economy, competitive conditions, labor costs, costs of materials and other factors for that particular community. The determination of fair value also requires discounting the estimated cash flows at a rate commensurate with the inherent risks associated with the assets and related estimated cash flow streams. The discount rate used in determining each asset’s fair value depends on the community’s projected life and development stage. We generally use a 20% discount rate, subject to the perceived risks associated with the community’s cash flow streams relative to its inventory. For example, construction in progress inventory which is closer to completion will generally require a lower discount rate than land under development in communities consisting of multiple phases spanning several years of development.
We estimate fair values of inventory evaluated for impairment under SFAS 144 based on market conditions and assumptions made by management at the time the inventory is evaluated, which may differ materially from actual results if market conditions or our assumptions change. For example, further market deterioration or changes in our assumptions may lead to us incurring additional impairment charges on previously impaired inventory, as well as on inventory not currently impaired, but for which indicators of impairment may arise if further market deterioration occurs.
We also have access to land inventory through option contracts, which generally enables us to defer acquiring portions of properties owned by third parties and unconsolidated entities until we have determined whether to exercise our option. A majority of our option contracts require a non-refundable cash deposit or irrevocable letter of credit based on a percentage of the purchase price of the land. Our option contracts are recorded at cost. In determining whether to walk-away from an option contract, we evaluate the option primarily based upon the expected cash flows from the carrying valueproperty that is the subject of the asset.option. If we intend to walk-away from an option contract, we record a charge to earnings in the period such decision is made for the deposit amount and related pre-acquisition costs associated with the option contract.
We believe that the accounting related to inventory valuation and impairment is a critical accounting estimatepolicy because: (1) assumptions inherent in the valuation of our inventory are highly subjective and susceptible to
change and (2) the impact of recognizing impairments on our inventory has been and could continue to be material to our consolidated balance sheets and statementsfinancial statements. Our evaluation of earnings. We evaluate our inventory for impairment, periodically on an asset-by-asset basis. This evaluationas discussed above, includes two critical assumptions with regard to future homesite sales prices, cost of sales and absorption.many assumptions. The two critical assumptions include the timing of the homesitehome sales within a community, management’s projections of selling prices and costs and the discount rate applied to determineestimate the fair value of the homesites within a community on the balance sheet date. Our assumptions on the timing of homesitehome sales are critical because the homebuilding industry has historically been cyclical and sensitive to changes in economic conditions such as interest rates, credit availability, unemployment levels and unemployment levels.consumer sentiment. Changes in these economic conditions could materially affect the projected sales price, costs to develop ourthe homesites and/or absorption.absorption rate in a community. Our assumptionassumptions on discount rates isare critical because the selection of a discount rate affects the estimated fair value of the homesites.homesites within a community. A higher discount rate reduces the estimated fair value of the homesites within the community, while a lower discount rate increases the estimated fair value of the homesites.homesites within a community. Because of changes in economic and market conditions and assumptions and estimates required of management in valuing inventory during these changing market conditions, actual results could differ materially from management’s assumptions and may require material inventory impairment charges to be recorded in the future.
During the years ended November 30, 20062008, 2007 and 2005,2006, we recorded $501.8$340.5 million, $2,445.1 million and $20.5$501.8 million, respectively, of inventory adjustments, which included $280.5$195.5 million, of homebuilding inventory valuation adjustments in 2006, $152.2$747.8 million and $15.1$280.5 million, respectively, in 2008, 2007 and 2006, of SFAS 144 valuation adjustments to finished homes, construction in progress and 2005land on which we intend to build homes, $47.8 million, $1,167.3 million and $69.1 million, respectively, in 2008, 2007 and 2006, of SFAS 144 valuation adjustments to land we intend to sell or have sold to third parties and $97.2 million, $530.0 million and $152.2 million, respectively, in 2008, 2007 and 2006 of write-offs of deposits and pre-acquisition costscosts. The $1,167.3 million of SFAS 144 valuation adjustments recorded in 2007 to land we intend to sell or have sold to third parties includes $740.4 million of SFAS 144 valuation adjustments related to land under option that we do not intend to purchase and $69.1 million and $5.4 million, respectively, in 2006 and 2005the portfolio of land inventory valuation adjustments. During the year endedwe sold to our strategic land investment venture with Morgan Stanley Real Estate Fund II, L.P., an affiliate of Morgan Stanley & Co., Inc., which was formed in November 30, 2004, we recorded $16.8 million of write-offs of deposits and pre-acquisition costs related to land under option that we do not intend to purchase. These2007. The SFAS 144 valuation adjustments were calculatedestimated based on current market conditions and assumptions made by our management at the time the valuation adjustments were recorded, which may differ materially from actual results if market conditions or our assumptions change. See Note 2 of the notes to our consolidated financial statements included in Item 8 of this document for details related to valuation adjustments and write-offs by reportable segment and homebuilding other.
Warranty Costs
Although we subcontract virtually all aspects of construction to others and our contracts call for the subcontractors to repair or replace any deficient items related to their trade,trades, we are primarily responsible to correct any deficiencies. Additionally, in some instances, we may be held responsible for the actions of or losses incurred by subcontractors. Warranty reserves are established at an amount estimated to be adequate to cover potential costs for materials and labor with regard to warranty-type claims expected to be incurred subsequent to the delivery of a home. Reserves are determined based upon historical data and trends with respect to similar product types and geographical areas. We believe the accounting estimate related to the reserve for warranty costs is a critical accounting estimate because the estimate requires a large degree of judgment.
At November 30, 2006,2008, the reserve for warranty costs was $172.6$129.4 million. While we believe that the reserve for warranty costs is adequate, there can be no assurances that historical data and trends will accurately predict our actual warranty costs. Additionally, there can be no assurances that future economic or financial developments might not lead to a significant change in the reserve.
Investments in Unconsolidated Entities
We frequentlystrategically invest in unconsolidated entities that acquire and develop land (1) for sale to us in connection with our homebuilding operations or for sale to third parties.parties or (2) for construction of homes for sale third-party homebuyers. Our partners generally are unrelated homebuilders, land owners/developers and financial or other strategic partners.
37
Most of the unconsolidated entities through which we acquire and develop land are accounted for by the equity method of accounting because we are not the primary beneficiary, as defined under FASB Interpretation No. 46(R),Consolidation of Variable Interest Entities,FIN 46R, and we have a significant, but less than controlling, interest in the entities. We record our investments in these entities in our consolidated balance sheets as “Investments in Unconsolidated Entities” and our pro-rata share of the entities’ earnings or losses in our consolidated statements of earningsoperations as “Equity in Earnings (Loss) from Unconsolidated Entities,” as described in Note 64 of the notes to our consolidated financial statements. Advances to these entities are included in the investment balance.
Management uses its judgment when determining if we are the primary beneficiary of, or have a controlling interest in, an unconsolidated entity. Factors considered in determining whether we have significant influence or we have control include risk and reward sharing, experience and financial condition of the other partners, voting rights, involvement in day-to-day capital and operating decisions and continuing involvement. The accounting policy relating to the use of the equity method of accounting is a critical accounting policy due to the judgment required in determining whether we are the primary beneficiary or have control or significant influence.
As of November 30, 2006,2008, we believe that the equity method of accounting is appropriate for our investments in unconsolidated entities where we are not the primary beneficiary and we do not have a controlling interest, but rather share control with our partners. At November 30, 2006,2008, the unconsolidated entities in which we had investments had total assets of $10.1$7.8 billion and total liabilities of $6.4$5.1 billion.
We evaluate our investments in unconsolidated entities for impairment during each reporting period in accordance with Accounting Principles Board (“APB”) Opinion No. 18,The Equity Method of Accounting for Investments in Common Stock.APB 18. A series of operating losses of an investee or other factors may indicate that a decrease in the value of our investment in the unconsolidated entity has occurred which is other-than-temporary. The amount of impairment recognized is the excess of the investment’s carrying amount over its estimated fair value.
Additionally, we consider various qualitative factors to recognizedetermine if a decrease in the value of our investment is calculated by subtractingother-than-temporary. These factors include age of the venture, intent and ability for us to retain our investment in the entity, financial condition and long-term prospects of the entity and relationships with the other partners and banks. If we believe that the decline in the fair value of the asset from the carrying valueinvestment is temporary, then no impairment is recorded.
The evaluation of the asset. Our evaluationour investment in unconsolidated entities includes two critical assumptions: (1) projected future distributions from the unconsolidated entities and (2) discount rates applied to the future distributions.
Our assumptions on the projected future distributions from the unconsolidated entities are dependent on market conditions. Specifically, distributions are dependent on cash to be generated from the sale of inventory by the unconsolidated entities. Such inventory is also reviewed for potential impairment by the unconsolidated entities in accordance with SFAS 144. The unconsolidated entities generally use a 20% discount rate in their SFAS 144 reviews for impairment, subject to the perceived risks associated with the community’s cash flow streams relative to its inventory. If a valuation adjustment is recorded by an unconsolidated entity in accordance with SFAS 144, our proportionate share of it is reflected in our equity in earnings (loss) from unconsolidated entities with a corresponding decrease to our investment in unconsolidated entities. In certain instances, we may be required to record additional losses relating to our investment in unconsolidated entities under APB 18; such losses are included in management fees and other income (expense), net. We believe our assumptions on the projected future distributions from the unconsolidated entities are critical because the operating results of the unconsolidated entities from which the projected distributions are derived are dependent on the status of the homebuilding industry, which has historically been cyclical and sensitive to changes in economic conditions such as interest rates, credit availability, unemployment levels and unemployment levels.consumer sentiment. Changes in these economic conditions could materially affect the projected operational results of the unconsolidated entities from which the distributions are derived. Our assumption
We believe our assumptions on discount rates isare also critical accounting policies because the selection of athe discount raterates also affects the estimated fair value of our investment in the unconsolidated entities. A higher discount rate reduces the estimated fair value of our investment in the unconsolidated entities, while a lower discount rate increases the estimated fair value of our investment in the unconsolidated entities. During the years ended November 30, 2005 and 2004, we did not record any material valuation adjustments to our investment in unconsolidated entities; however, during the year ended November 30, 2006, we recorded $126.4 million of valuation adjustments. Because of changes in economic conditions, actual results could differ materially from management’s assumptions and may require material valuation adjustments to our investments in unconsolidated entities to be recorded in the future.
During the years ended November 30, 2008, 2007 and 2006, we recorded $205.0 million, $496.4 million and $140.9 million, respectively, of valuation adjustments to our investments in unconsolidated entities, which included $32.2 million, $364.2 million and $126.4 million, respectively, in 2008, 2007 and 2006, of our share of SFAS 144 valuation adjustments related to assets of our unconsolidated entities and $172.8 million, $132.2 million and $14.5 million, respectively, in 2008, 2007 and 2006, of valuation adjustments to our investments in unconsolidated entities in accordance with APB 18. These valuation adjustments were calculated based on market conditions and assumptions made by management at the time the valuation adjustments were recorded, which may differ materially from actual results if market conditions or our assumptions change. See Note 2 of the notes to our consolidated financial statements included in Item 8 of this document for details related to valuation adjustments and write-offs by reportable segment and homebuilding other.
Financial Services Operations
Revenue Recognition
Loan origination revenues, net of direct origination costs, and gains and losses from the sale of loans and loan servicing rights are recognized when the loans are sold and shipped to an investor. Premiums from title insurance policies are recognized as revenue on the effective datesdate of the policies. Escrow fees and loan origination revenues are recognized at the time the related real estate transactions are completed, usually upon the close of escrow. Gains and losses from the sale of loans and the expected net future cash flows related to the associated servicing of a loan are included in the measurement of all written loan commitments that are accounted for at fair value through earnings at the time of commitment. Interest income on loans held-for-sale and loans held-for-investment is recognized as earned over the terms of the mortgage loans based on the contractual interest rates. In all circumstances, we do not recognize revenue until the earnings process is complete and collectibility of the receivable is reasonably assured. We believe that the accounting policy related to revenue recognition is a critical accounting policy because of the significance of revenue recognition.revenue.
Allowance for Loan and Other Losses
We provide an allowance for loan losses by taking into consideration various factors such as past loan loss experience, present economic conditions and other factors considered relevant by management. Anticipated changes in economic conditions, which may influence the level of the allowance, are considered in the evaluation by management when the likelihood of the changes can be reasonably determined. This analysis is based on judgments and estimates and may change in response to economic developments or other conditions that may
38
influence borrowers’ financial conditions or prospects. At November 30, 2006,2008, the allowance for loan losses was $1.8 million. While we$20.4 million, compared to $11.1 million at November 30, 2007. We believe that the 20062008 year-end allowance is adequate, particularly in view of the fact that we usually sell the loans in the secondary mortgage market on a non-recourse basis within 6030 days after we originate them, remainingthem. Since we remain liable for certain representations and warranties, there can be no assurances that further deterioration in the housing market and future economic or financial developments, including general interest rate increases or a slowdown in the economy, might not lead to increased provisions to the allowance or a higher occurrence of loan charge-offs.write-offs. This allowance requires management’s judgment and estimate. For these reasons, we believe that the accounting estimate related to the allowance for loan losses is a critical accounting estimate.
We provide an allowancea reserve for estimated title and escrow losses based upon management’s evaluation of claims presented and estimates for any incurred but not reported claims. The allowancereserve is established at a level that management estimates to be sufficient to satisfy those claims where a loss is determined to be probable and the amount of such loss can be reasonably estimated. The allowancereserve for title and escrow losses for both known and incurred but not reported claims is considered by management to be adequate for such purposes.
Homebuilding and Financial Services Operations
Goodwill
Goodwill represents the excess of the purchase price paid over the fair value of the net assets acquired in business combinations. The process of determining goodwill requires judgment. Evaluating goodwill for impairment involves the determination of the fair value of our reporting units.units in which we have recorded goodwill. A reporting unit is a component of an operating segment for which discrete financial information is available and reviewed by management on a regular basis. Inherent in suchthe determination of fair value determinationsof our reporting units are certain judgmentsestimates and estimates,judgments, including the interpretation of current economic indicators and market valuations andas well as our strategic plans with regard to our operations. To the extent additional information arises or our strategies change, it is possible that our conclusion regarding goodwill impairment could change, which could have a material effect on our financial position and results of operations. For these reasons, we believe that the accounting estimate related to goodwill impairment is a critical accounting estimate.
We review goodwill annually (or whenever indicators of impairment exist) for impairment in accordance with SFAS No. 142,Goodwill and Other Intangible Assets.Assets,(“SFAS 142”). Due to the continued deterioration in market conditions as a result of tightening mortgage credit standards and other factors, we evaluated the carrying value of our Financial Services segment’s goodwill for impairment in both our third and fourth quarters of 2008. During the third quarter of 2008, we impaired $27.2 million of our Financial Services segment’s goodwill. We also performed our annual impairment test of goodwill in the fourth quarter of 2008 and no additional impairments were recorded.
During the year ended November 30, 2007, we impaired $190.2 million of goodwill related to our homebuilding operations. We did not record impairment charges during the year ended November 30, 2006. As of November 30, 2008 and 2007, there were no material identifiable intangible assets, other than goodwill.
During the year ended November 30, 2007, we used an equally weighted combination of the market and income approaches to determine the fair value of our reporting units when performing our impairment test of goodwill in accordance with SFAS 142.
The market approach establishes fair value by comparing our company to other publicly traded guideline companies or by analysis of actual transactions of similar businesses or assets sold. We wrote off all of our homebuilding operation’s goodwill during the year ended November 30, 2007. As a result, our recorded goodwill of $61.2 million as of SeptemberNovember 30, 20062007 was attributed entirely to our Financial Services segment. For our review of the Financial Services segment’s goodwill during the third and fourth quarters of 2008, we determined the fair value of our Financial Services segment based entirely on the income approach due to a lack of guideline companies with adequate comparisons to our Financial Services segment on a stand alone basis.
The income approach establishes fair value by methods which discount or capitalize earnings and/or cash flow by a discount or capitalization rate that goodwill wasreflects market rate of return expectations, market conditions and the risk of the relative investment. We used a discounted cash flow method when applying the income approach. This analysis includes operating income, interest expense, taxes, incremental working capital and long-term debt, as well as other factors. The projections used in the analysis are for a five-year period and represent what we consider to be normalized earnings.
In determining the fair value of our Financial Services segment under the income approach, our expected cash flows are affected by various assumptions. The most significant assumptions affecting our expected cash flows are the discount rate, projected revenue growth rate and operating profit margin. The impact of a change in any of our significant underlying assumptions +/- 1% would not impaired.result in a materially different fair value.
At November 30, 2006,2008 and November 30, 2007, goodwill was $257.8 million. While we believe that no impairment existed as$34.0 million and $61.2 million, respectively. Our goodwill of $34.0 million at November 30, 2006, there can be no assurances that future economic or financial developments, including general interest rate increases or a slowdown2008 is recorded in the economy, might not lead to an impairment of goodwill.our Financial Services segment.
Valuation of Deferred Tax Assets
We record income taxes under the asset and liability method, whereby deferred tax assets and liabilities are recognized based on the future tax consequences attributable to temporary differences between the financial statement carrying amounts of existing assets and liabilities and their respective tax bases and attributable to operating loss and tax credit carryforwards. Deferred tax assets and liabilities are measured using enacted tax rates expected to apply in the years in which the temporary differences are expected to be recovered or paid. The effect on deferred tax assets and liabilities of a change in tax rates is recognized in earnings in the period when the changes are enacted.
SFAS 109 requires a reduction of the carrying amounts of deferred tax assets by a valuation allowance if, based on the available evidence, it is more likely than not that such assets will not be realized. Accordingly, the need to establish valuation allowances for deferred tax assets are assessed periodically by us based on the SFAS 109 more-likely-than-not realization threshold criterion. In the assessment for a valuation allowance, appropriate consideration is given to all positive and negative evidence related to the realization of the deferred tax assets. This assessment considers, among other matters, the nature, frequency and severity of current and cumulative losses, forecasts of future profitability, the duration of statutory carryforward periods, our experience with operating loss and tax credit carryforwards not expiring unused and tax planning alternatives. Based on our assessment, the uncertain and volatile market conditions and the fact that we are now in a cumulative loss position over the evaluation period, we recorded a non-cash deferred tax asset valuation allowance of $730.8 million in the year ended November 30, 2008. In future periods, the allowance could be reduced based on sufficient evidence indicating that it is more likely than not that a portion of our deferred tax assets will be realized. At November 30, 2008, we had no net deferred tax assets, compared to net deferred tax assets of $746.9 million at November 30, 2007.
We believe that the accounting estimate for the valuation of deferred tax assets is a critical accounting estimate because judgment is required in assessing the likely future tax consequences of events that have been recognized in our financial statements or tax returns. We base our estimate of deferred tax assets and liabilities on current tax laws and rates and, in certain cases, business plans and other expectations about future outcomes. Changes in existing tax laws or rates could affect actual tax results and future business results, which may affect the amount of deferred tax liabilities or the valuation of deferred tax assets over time. Our accounting for deferred tax consequences represents our best estimate of future events. Although it is possible there will be changes that are not anticipated in our current estimates, we believe it is unlikely such changes would have a material period-to-period impact on our financial position or results of operations.
At November 30, 2006, our net deferred tax asset was $307.2 million. Based on our assessment, it appears more likely than not that the net deferred tax asset will be realized through future taxable earnings.
Share-Based Payments
We have share-based awards outstanding under four different plans which provide for the granting of stock options and stock appreciation rights and awards of restricted common stock (“nonvested shares”) to key officers, employees and directors. The exercise prices of stock options and stock appreciation rights may not be
39
less than the market value of the common stock on the date of the grant. No options granted under the plans may be exercisable until at least six months after the date of the grant. Thereafter, exercises are permitted in installments determined when options are granted. Each stock option and stock appreciation right will expire on a date determined at the time of the grant, but not more than ten years after the date of the grant.
Prior to December 1, 2005, we accountedWe account for stock option awards granted under our share-based paymentthe plans in accordance with the recognition and measurement provisions of APB Opinion No. 25,Accounting for Stock Issued to Employees, (“APB 25”) and related Interpretations, as permitted by Statement of Financial Accounting Standards (“SFAS”) No. 123,Accounting for Stock-Based Compensation,(“SFAS 123”). Share-based employee compensation expense was not recognized in our consolidated statements of earnings prior to December 1, 2005, as all stock option awards granted under the plans had an exercise price equal to or greater than the market value of the common stock on the date of the grant. Effective December 1, 2005, we adopted the provisions of SFAS No. 123 (revised 2004),Share-Based Payment, (“SFAS 123R”). Effective December 1, 2005, we adopted SFAS 123R using the modified-prospective-transition method. Under this transition method, compensation expense recognized during the year ended November 30, 2006 included: (a) compensation expense for all share-based awards granted prior to, but not yet vested as of, December 1, 2005, based on the grant date fair value estimated in accordance with the original provisions of SFAS 123, and (b) compensation expense for all share-based awards granted subsequent to December 1, 2005, based on the grant date fair value estimated in accordance with the provisions of SFAS 123R. In accordance with the modified-prospective-transition method, results for prior periods have not been restated. The adoption of SFAS 123R resulted in a charge to net earnings of $0.11 per diluted share during 2006.
We believe that the accounting estimate for share based payments is a critical accounting estimate because the calculation of share-based employee compensation expense involves estimates that require management’s judgments. These estimates include the fair value of each of our stock option awards, which are estimated on the date of grant using a Black-Scholes option-pricing model as discussed in Note 1513 of the notes to our consolidated financial statements included under Item 8 of this document. The fair value of our stock option awards, which are subject to graded vesting, is expensed on a straight-line basis over the vesting life of the options. Expected volatility is based on an average of (1) historical volatility of our stock and (2) implied volatility from traded options on our stock. The risk-free rate for periods within the contractual life of the stock option award is based on the yield curve of a zero-coupon U.S. Treasury bond on the date the stock option award is granted with a maturity equal to the expected term of the stock option award granted. We use historical data to estimate stock option exercises and forfeitures within our valuation model. The expected life of stock option awards granted is derived from historical exercise experience under our share-based payment plans and represents the period of time that stock option awards granted are expected to be outstanding.
Prior to the adoption of SFAS 123R, we presented all tax benefits related to deductions resulting from the exercise of stock options as cash flows from operating activities in the consolidated statements of cash flows. SFAS 123R requires that cash flows resulting from tax benefits related to tax deductions in excess of the compensation expense recognized for those options (excess tax benefits) be classified as financing cash flows.
Item 7A. Quantitative and Qualitative Disclosures About Market Risk.
We are exposed to market risks related to fluctuations in interest rates on our investments, debt obligations, loans held-for-sale and loans held-for-investment. We utilize derivative instruments, including interest rate swaps, in conjunction with our overall strategy to manage our exposure to changes in interest rates. We also utilize forward commitments and option contracts to mitigate the risks associated with our mortgage loan portfolio.
The table on the following pagebelow provides information at November 30, 20062008 about our significant derivative financial instruments and other financial instruments that are sensitive to changes in interest rates. For investments available-for-sale, loans held-for-sale, loans held-for-investment and investments held-to-maturity, senior notes and other debts payable and notes and other debts payable, the table presents principal cash flows and related weighted average effective interest rates by expected maturity dates and estimated fair values at November 30, 2006.2008. Weighted average variable interest rates are based on the variable interest rates at November 30, 2006. For interest rate swaps, the table presents notional amounts and weighted average interest rates by contractual maturity dates and estimated fair values at November 30, 2006. Notional amounts are used to calculate the contractual cash flows to be exchanged under the contracts. Our trading investments do not have interest rate sensitivity, and therefore, are also excluded from the following table.2008.
See Management’s Discussion and Analysis of Financial Condition and Results of Operations in Item 7 and Notes 1 and 1716 of the notes to consolidated financial statements in Item 8 for a further discussion of these items and our strategy of mitigating our interest rate risk.
40
Information Regarding Interest Rate Sensitivity
Principal (Notional) Amount by
Expected Maturity and Average Interest Rate
November 30, 20062008
| Years Ending November 30, | Fair Value at November 30, 2006 | Years Ending November 30, | Thereafter | Total | Fair Value at November 30, 2008 | |||||||||||||||||||||||||||||||||||||||||||
| 2007 | 2008 | 2009 | 2010 | 2011 | Thereafter | Total | 2009 | 2010 | 2011 | 2012 | 2013 | |||||||||||||||||||||||||||||||||||||
| (Dollars in millions) | (Dollars in millions) | |||||||||||||||||||||||||||||||||||||||||||||||
ASSETS | ||||||||||||||||||||||||||||||||||||||||||||||||
Financial services: | ||||||||||||||||||||||||||||||||||||||||||||||||
Loans held-for-sale, net: | ||||||||||||||||||||||||||||||||||||||||||||||||
Fixed rate | $ | — | — | — | — | — | 331.4 | 331.4 | 331.4 | $ | — | — | — | — | — | 189.8 | 189.8 | 189.8 | ||||||||||||||||||||||||||||||
Average interest rate | — | — | — | — | — | 7.0 | % | 7.0 | % | — | — | — | — | — | — | 5.6 | % | 5.6 | % | — | ||||||||||||||||||||||||||||
Variable rate | $ | — | — | — | — | — | 152.3 | 152.3 | 152.3 | $ | — | — | — | — | — | 0.3 | 0.3 | 0.3 | ||||||||||||||||||||||||||||||
Average interest rate | — | — | — | — | — | 6.8 | % | 6.8 | % | — | — | — | — | — | — | 8.8 | % | 8.8 | % | — | ||||||||||||||||||||||||||||
Loans held-for-investment and investments held-to-maturity: | ||||||||||||||||||||||||||||||||||||||||||||||||
Fixed rate | $ | 218.7 | 3.6 | 5.7 | 4.3 | 0.3 | 14.8 | 247.4 | 245.4 | $ | 48.1 | 4.5 | 0.7 | 0.8 | 0.9 | 15.6 | 70.6 | 70.7 | ||||||||||||||||||||||||||||||
Average interest rate | 5.8 | % | 7.4 | % | 9.5 | % | 6.8 | % | 9.2 | % | 8.5 | % | 6.1 | % | — | 1.3 | % | 6.8 | % | 8.6 | % | 8.7 | % | 8.7 | % | 8.6 | % | 3.5 | % | — | ||||||||||||||||||
Variable rate | $ | — | — | — | — | 0.1 | 1.7 | 1.8 | 1.8 | $ | 0.1 | 0.1 | 0.1 | 0.1 | — | 6.5 | 6.9 | 6.9 | ||||||||||||||||||||||||||||||
Average interest rate | — | — | — | — | 6.1 | % | 6.1 | % | 6.1 | % | — | 7.2 | % | 7.2 | % | 7.2 | % | 7.2 | % | — | 7.2 | % | 7.2 | % | — | |||||||||||||||||||||||
LIABILITIES | ||||||||||||||||||||||||||||||||||||||||||||||||
Homebuilding: | ||||||||||||||||||||||||||||||||||||||||||||||||
Senior notes and other debts payable: | ||||||||||||||||||||||||||||||||||||||||||||||||
Fixed rate | $ | 62.0 | 6.0 | 278.0 | 317.9 | 249.4 | 1,344.9 | 2,258.2 | 2,270.9 | $ | 301.3 | 302.5 | 249.6 | — | 346.9 | 999.4 | 2,199.7 | 1,440.5 | ||||||||||||||||||||||||||||||
Average interest rate | 2.6 | % | 7.9 | % | 7.6 | % | 5.3 | % | 6.0 | % | 5.8 | % | 5.9 | % | — | 7.1 | % | 5.1 | % | 6.0 | % | — | 6.0 | % | 5.8 | % | 5.9 | % | — | |||||||||||||||||||
Variable rate | $ | 25.3 | 30.0 | 300.0 | — | — | — | 355.3 | 355.3 | $ | 126.2 | 155.8 | 22.6 | — | 40.6 | — | 345.2 | 345.2 | ||||||||||||||||||||||||||||||
Average interest rate | 9.6 | % | 9.3 | % | 6.1 | % | — | — | — | 6.7 | % | — | 5.0 | % | 3.8 | % | 2.7 | % | — | 5.2 | % | — | 4.3 | % | — | |||||||||||||||||||||||
Financial services: | ||||||||||||||||||||||||||||||||||||||||||||||||
Notes and other debts payable: | ||||||||||||||||||||||||||||||||||||||||||||||||
Fixed rate | $ | 0.1 | 0.1 | — | — | — | — | 0.2 | 0.2 | |||||||||||||||||||||||||||||||||||||||
Average interest rate | 7.2 | % | 7.8 | % | — | — | — | — | 7.7 | % | — | |||||||||||||||||||||||||||||||||||||
Variable rate | $ | 1,149.0 | 0.1 | 0.1 | — | — | — | 1,149.2 | 1,149.2 | $ | 225.6 | — | — | — | — | — | 225.6 | 225.6 | ||||||||||||||||||||||||||||||
Average interest rate | 6.1 | % | 7.1 | % | 7.2 | % | — | — | — | 6.1 | % | — | 3.4 | % | — | — | — | — | — | 3.4 | % | — | ||||||||||||||||||||||||||
OTHER FINANCIAL INSTRUMENTS | ||||||||||||||||||||||||||||||||||||||||||||||||
Homebuilding liabilities: | ||||||||||||||||||||||||||||||||||||||||||||||||
Interest rate swaps: | ||||||||||||||||||||||||||||||||||||||||||||||||
Variable to fixed—notional amount | $ | 130.3 | 69.7 | — | — | — | — | 200.0 | 2.1 | |||||||||||||||||||||||||||||||||||||||
Average pay rate | 6.8 | % | 6.8 | % | — | — | — | — | 6.8 | % | — | |||||||||||||||||||||||||||||||||||||
Average receive rate | LIBOR | LIBOR | — | — | — | — | — | |||||||||||||||||||||||||||||||||||||||||
41
Management’s Annual Report on Internal Control Over Financial Reporting
Our management is responsible for establishing and maintaining adequate internal control over financial reporting, as such term is defined in Exchange Act Rule 13a-15(f). Under the supervision and with the participation of our management, including our CEO and CFO, we conducted an evaluation of the effectiveness of our internal control over financial reporting based on the framework inInternal Control—Integrated Frameworkissued by the Committee of Sponsoring Organizations of the Treadway Commission. Based on our evaluation under the framework inInternal Control—Integrated Framework,our management concluded that our internal control over financial reporting was effective as of November 30, 2006. Our management’s assessment of the2008. The effectiveness of our internal control over financial reporting as of November 30, 20062008 has been audited by Deloitte & Touche LLP, an independent registered public accounting firm, as stated in their attestation report which is included herein.
42
REPORT OF INDEPENDENT REGISTERED PUBLIC ACCOUNTING FIRM
To the Board of Directors and Stockholders of Lennar Corporation
We have audited management’s assessment, included in the accompanying Management’s Annual Report on Internal Control Over Financial Reporting, thatinternal control over financial reporting of Lennar Corporation and subsidiaries (the “Company”) maintained effective internal control over financial reporting as of November 30, 2006,2008, based on the criteria established inInternal Control—Integrated Framework issued by the Committee of Sponsoring Organizations of the Treadway Commission. The Company’s management is responsible for maintaining effective internal control over financial reporting and for its assessment of the effectiveness of internal control over financial reporting.reporting, included in the accompanying Management’s Annual Report on Internal Control Over Financial Reporting. Our responsibility is to express an opinion on management’s assessment and an opinion on the effectiveness of the Company’s internal control over financial reporting based on our audit.
We conducted our audit in accordance with the standards of the Public Company Accounting Oversight Board (United States). Those standards require that we plan and perform the audit to obtain reasonable assurance about whether effective internal control over financial reporting was maintained in all material respects. Our audit included obtaining an understanding of internal control over financial reporting, evaluating management’s assessment,assessing the risk that a material weakness exists, testing and evaluating the design and operating effectiveness of internal control based on the assessed risk, and performing such other procedures as we considered necessary in the circumstances. We believe that our audit provides a reasonable basis for our opinions.opinion.
A company’s internal control over financial reporting is a process designed by, or under the supervision of, the company’s principal executive and principal financial officers, or persons performing similar functions, and effected by the company’s board of directors, management, and other personnel to provide reasonable assurance regarding the reliability of financial reporting and the preparation of financial statements for external purposes in accordance with generally accepted accounting principles. A company’s internal control over financial reporting includes those policies and procedures that (1) pertain to the maintenance of records that, in reasonable detail, accurately and fairly reflect the transactions and dispositions of the assets of the company; (2) provide reasonable assurance that transactions are recorded as necessary to permit preparation of financial statements in accordance with generally accepted accounting principles, and that receipts and expenditures of the company are being made only in accordance with authorizations of management and directors of the company; and (3) provide reasonable assurance regarding prevention or timely detection of unauthorized acquisition, use, or disposition of the company’s assets that could have a material effect on the financial statements.
Because of the inherent limitations of internal control over financial reporting, including the possibility of collusion or improper management override of controls, material misstatements due to error or fraud may not be prevented or detected on a timely basis. Also, projections of any evaluation of the effectiveness of the internal control over financial reporting to future periods are subject to the risk that the controls may become inadequate because of changes in conditions, or that the degree of compliance with the policies or procedures may deteriorate.
In our opinion, management’s assessment that the Company maintained effective internal control over financial reporting as of November 30, 2006, is fairly stated, in all material respects, based on the criteria established inInternal Control—Integrated Framework issued by the Committee of Sponsoring Organizations of the Treadway Commission. Also in our opinion, the Company maintained, in all material respects, effective internal control over financial reporting as of November 30, 2006,2008, based on the criteria established inInternal Control—Integrated Framework issued by the Committee of Sponsoring Organizations of the Treadway Commission.
We have also audited, in accordance with the standards of the Public Company Accounting Oversight Board (United States), the consolidated financial statements as of and for the year ended November 30, 20062008 of the Company and our report dated February 8, 2007January 26, 2009 expressed an unqualified opinion on those financial statements.
/s/ DELOITTE & TOUCHE LLP
Certified Public Accountants
Miami, Florida
February 8, 2007
43January 26, 2009
Item 8. Financial Statements and Supplementary Data.
| Item 8. | Financial Statements and Supplementary Data. |
REPORT OF INDEPENDENT REGISTERED PUBLIC ACCOUNTING FIRM
To the Board of Directors and Stockholders of Lennar Corporation
We have audited the accompanying consolidated balance sheets of Lennar Corporation and subsidiaries (the “Company”) as of November 30, 20062008 and 2005,2007, and the related consolidated statements of earnings,operations, stockholders’ equity, and cash flows for each of the three years in the period ended November 30, 2006.2008. These financial statements are the responsibility of the Company’s management. Our responsibility is to express an opinion on these financial statements based on our audits.
We conducted our audits in accordance with the standards of the Public Company Accounting Oversight Board (United States). Those standards require that we plan and perform the audit to obtain reasonable assurance about whether the financial statements are free of material misstatement. An audit includes examining, on a test basis, evidence supporting the amounts and disclosures in the financial statements. An audit also includes assessing the accounting principles used and significant estimates made by management, as well as evaluating the overall financial statement presentation. We believe that our audits provide a reasonable basis for our opinion.
In our opinion, such consolidated financial statements present fairly, in all material respects, the financial position of Lennar Corporation and subsidiaries as of November 30, 20062008 and 2005,2007 and the results of their operations and their cash flows for each of the three years in the period ended November 30, 2006,2008, in conformity with accounting principles generally accepted in the United States of America.
We have also audited, in accordance with the standards of the Public Company Accounting Oversight Board (United States), the effectiveness of the Company’s internal control over financial reporting as of November 30, 2006,2008, based on the criteria established inInternal Control—Integrated Framework issued by the Committee of Sponsoring Organizations of the Treadway Commission and our report dated February 8, 2007January 26, 2009 expressed an unqualified opinion on management’s assessment of the effectiveness of the Company’s internal control over financial reporting and an unqualified opinion on the effectiveness of the Company’s internal control over financial reporting.
/s/ DELOITTE & TOUCHE LLP
Certified Public Accountants
Miami, Florida
February 8, 2007
44January 26, 2009
LENNAR CORPORATION AND SUBSIDIARIES
CONSOLIDATED BALANCE SHEETS
November 30, 20062008 and 20052007
| 2006 | 2005 | 2008 | 2007 | |||||||||||
| (In thousands, except per share amounts) | (In thousands, except per share amounts) | |||||||||||||
| ASSETS | ||||||||||||||
Homebuilding: | ||||||||||||||
Cash | $ | 661,662 | 909,557 | |||||||||||
Cash and cash equivalents | $ | 1,091,468 | 642,467 | |||||||||||
Restricted cash | 24,796 | 22,681 | 8,828 | 35,429 | ||||||||||
Receivables, net | 159,043 | 299,232 | 94,520 | 207,691 | ||||||||||
Income tax receivables | 255,460 | 881,525 | ||||||||||||
Inventories: | ||||||||||||||
Finished homes and construction in progress | 4,447,748 | 4,625,563 | 2,080,345 | 2,180,670 | ||||||||||
Land under development | 3,011,408 | 2,867,463 | 1,741,407 | 1,500,075 | ||||||||||
Consolidated inventory not owned | 372,327 | 370,505 | 678,338 | 819,658 | ||||||||||
Total inventories | 7,831,483 | 7,863,531 | 4,500,090 | 4,500,403 | ||||||||||
Investments in unconsolidated entities | 1,447,178 | 1,282,686 | 766,752 | 934,271 | ||||||||||
Goodwill | 196,638 | 195,156 | ||||||||||||
Other assets | 474,090 | 266,747 | 99,802 | 863,152 | ||||||||||
| 10,794,890 | 10,839,590 | 6,816,920 | 8,064,938 | |||||||||||
Financial services | 1,613,376 | 1,701,635 | 607,978 | 1,037,809 | ||||||||||
Total assets | $ | 12,408,266 | 12,541,225 | $ | 7,424,898 | 9,102,747 | ||||||||
| LIABILITIES AND STOCKHOLDERS’ EQUITY | ||||||||||||||
Homebuilding: | ||||||||||||||
Accounts payable | $ | 751,496 | 876,830 | $ | 246,727 | 376,134 | ||||||||
Liabilities related to consolidated inventory not owned | 333,723 | 306,445 | 592,777 | 719,081 | ||||||||||
Senior notes and other debts payable | 2,613,503 | 2,592,772 | 2,544,935 | 2,295,436 | ||||||||||
Other liabilities | 1,590,564 | 1,997,824 | 834,873 | 1,129,791 | ||||||||||
| 5,289,286 | 5,773,871 | 4,219,312 | 4,520,442 | |||||||||||
Financial services | 1,362,215 | 1,437,700 | 416,833 | 731,658 | ||||||||||
Total liabilities | 6,651,501 | 7,211,571 | 4,636,145 | 5,252,100 | ||||||||||
Minority interest | 55,393 | 78,243 | 165,746 | 28,528 | ||||||||||
Stockholders’ equity: | ||||||||||||||
Preferred stock | — | — | — | — | ||||||||||
Class A common stock of $0.10 par value per share | ||||||||||||||
Authorized: 2006 and 2005-300,000 shares | ||||||||||||||
Issued: 2006-136,886 shares; 2005-130,247 shares | 13,689 | 13,025 | ||||||||||||
Class B common stock of $0.10 par value per share | ||||||||||||||
Authorized: 2006 and 2005-90,000 shares | ||||||||||||||
Issued: 2006-32,874 shares; 2005-32,781 shares | 3,287 | 3,278 | ||||||||||||
Class A common stock of $0.10 par value per share | 14,050 | 13,931 | ||||||||||||
Class B common stock of $0.10 par value per share | 3,296 | 3,296 | ||||||||||||
Additional paid-in capital | 1,753,695 | 1,486,988 | 1,944,626 | 1,920,386 | ||||||||||
Retained earnings | 4,539,137 | 4,046,563 | 1,273,159 | 2,496,933 | ||||||||||
Deferred compensation plan; 2006-172 Class A common shares and 17 Class B common shares; 2005-439 Class A common shares and 44 Class B common shares | (1,586 | ) | (4,047 | ) | ||||||||||
Deferred compensation plan; 2007—36 Class A common shares and 4 Class B common shares | — | (332 | ) | |||||||||||
Deferred compensation liability | 1,586 | 4,047 | — | 332 | ||||||||||
Treasury stock, at cost; 2006-9,951 Class A common shares and 1,653 Class B common shares; 2005-5,468 Class A common shares | (606,395 | ) | (293,222 | ) | ||||||||||
Treasury stock, at cost; 2008—11,229 Class A common shares and 1,680 Class B common shares; 2007—10,705 Class A common shares and 1,679 Class B common shares | (612,124 | ) | (610,366 | ) | ||||||||||
Accumulated other comprehensive loss | (2,041 | ) | (5,221 | ) | — | (2,061 | ) | |||||||
Total stockholders’ equity | 5,701,372 | 5,251,411 | 2,623,007 | 3,822,119 | ||||||||||
Total liabilities and stockholders’ equity | $ | 12,408,266 | 12,541,225 | $ | 7,424,898 | 9,102,747 | ||||||||
See accompanying notes to consolidated financial statements.
45
LENNAR CORPORATION AND SUBSIDIARIES
CONSOLIDATED STATEMENTS OF EARNINGSOPERATIONS
Years Ended November 30, 2006, 20052008, 2007 and 20042006
| 2006 | 2005 | 2004 | ||||||
| (Dollars in thousands, except per share amounts) | ||||||||
Revenues: | ||||||||
Homebuilding | $ | 15,623,040 | 13,304,599 | 10,000,632 | ||||
Financial services | 643,622 | 562,372 | 500,336 | |||||
Total revenues | 16,266,662 | 13,866,971 | 10,500,968 | |||||
Costs and expenses: | ||||||||
Homebuilding (1) | 14,677,565 | 11,215,244 | 8,629,767 | |||||
Financial services | 493,819 | 457,604 | 389,605 | |||||
Corporate general and administrative | 193,307 | 187,257 | 141,722 | |||||
Total costs and expenses | 15,364,691 | 11,860,105 | 9,161,094 | |||||
Equity in earnings (loss) from unconsolidated entities (2) | (12,536 | ) | 133,814 | 90,739 | ||||
Management fees and other income, net | 66,629 | 98,952 | 97,680 | |||||
Minority interest expense, net | 13,415 | 45,030 | 10,796 | |||||
Loss on redemption of 9.95% senior notes | — | 34,908 | — | |||||
Earnings from continuing operations before provision for income taxes | 942,649 | 2,159,694 | 1,517,497 | |||||
Provision for income taxes | 348,780 | 815,284 | 572,855 | |||||
Net earnings from continuing operations | 593,869 | 1,344,410 | 944,642 | |||||
Discontinued operations: | ||||||||
Earnings from discontinued operations before provision for income taxes | — | 17,261 | 1,570 | |||||
Provision for income taxes | — | 6,516 | 593 | |||||
Net earnings from discontinued operations | — | 10,745 | 977 | |||||
Net earnings | $ | 593,869 | 1,355,155 | 945,619 | ||||
Basic earnings per share: | ||||||||
Earnings from continuing operations | $ | 3.76 | 8.65 | 6.08 | ||||
Earnings from discontinued operations | — | 0.07 | 0.01 | |||||
Net earnings | $ | 3.76 | 8.72 | 6.09 | ||||
Diluted earnings per share: | ||||||||
Earnings from continuing operations | $ | 3.69 | 8.17 | 5.70 | ||||
Earnings from discontinued operations | — | 0.06 | — | |||||
Net earnings | $ | 3.69 | 8.23 | 5.70 | ||||
| 2008 | 2007 | 2006 | ||||||||
| (Dollars in thousands, except per share amounts) | ||||||||||
Revenues: | ||||||||||
Homebuilding | $ | 4,263,038 | 9,730,252 | 15,623,040 | ||||||
Financial services | 312,379 | 456,529 | 643,622 | |||||||
Total revenues | 4,575,417 | 10,186,781 | 16,266,662 | |||||||
Costs and expenses: | ||||||||||
Homebuilding (1) | 4,541,881 | 12,189,077 | 14,677,565 | |||||||
Financial services (2) | 343,369 | 450,409 | 493,819 | |||||||
Corporate general and administrative | 129,752 | 173,202 | 193,307 | |||||||
Total costs and expenses | 5,015,002 | 12,812,688 | 15,364,691 | |||||||
Gain on recapitalization of unconsolidated entity | 133,097 | 175,879 | — | |||||||
Goodwill impairments | — | (190,198 | ) | — | ||||||
Equity in loss from unconsolidated entities (3) | (59,156 | ) | (362,899 | ) | (12,536 | ) | ||||
Management fees and other income (expense), net (4) | (199,981 | ) | (76,029 | ) | 66,629 | |||||
Minority interest income (expense), net | 4,097 | (1,927 | ) | (13,415 | ) | |||||
Earnings (loss) before (provision) benefit for income taxes | (561,528 | ) | (3,081,081 | ) | 942,649 | |||||
(Provision) benefit for income taxes (5) | (547,557 | ) | 1,140,000 | (348,780 | ) | |||||
Net earnings (loss) | $ | (1,109,085 | ) | (1,941,081 | ) | 593,869 | ||||
Basic earnings (loss) per share | $ | (7.00 | ) | (12.31 | ) | 3.76 | ||||
Diluted earnings (loss) per share | $ | (7.00 | ) | (12.31 | ) | 3.69 | ||||
| (1) | Homebuilding costs and expenses include |
| (2) | Financial Services costs and expenses for the year ended November 30, 2008 include a $27.2 million impairment of goodwill. |
| (3) | Equity in |
| (4) | Management fees and other income (expense), net includes $172.8 million, $132.2 million and $14.5 million, respectively, of APB 18 valuation adjustments to the Company’s investments in unconsolidated entities for the years ended November 30, 2008, 2007 and 2006. |
| (5) | (Provision) benefit for income taxes for the year ended November 30, |
See accompanying notes to consolidated financial statements.
46
LENNAR CORPORATION AND SUBSIDIARIES
CONSOLIDATED STATEMENTS OF STOCKHOLDERS’ EQUITY
Years Ended November 30, 2006, 20052008, 2007 and 20042006
| 2006 | 2005 | 2004 | 2008 | 2007 | 2006 | |||||||||||||||
| (Dollars in thousands) | (Dollars in thousands) | |||||||||||||||||||
Class A common stock: | ||||||||||||||||||||
Beginning balance | $ | 13,025 | 12,372 | 12,533 | $ | 13,931 | 13,689 | 13,025 | ||||||||||||
Conversion of 5.125% zero-coupon convertible senior subordinated notes to Class A common shares | 488 | 409 | — | |||||||||||||||||
Par value of retired treasury stock | — | — | (240 | ) | ||||||||||||||||
Conversion of convertible senior subordinated notes to Class A common shares | — | — | 488 | |||||||||||||||||
Employee stock and director plans | 176 | 244 | 79 | 119 | 242 | 176 | ||||||||||||||
Balance at November 30, | 13,689 | 13,025 | 12,372 | 14,050 | 13,931 | 13,689 | ||||||||||||||
Class B common stock: | ||||||||||||||||||||
Beginning balance | 3,278 | 3,260 | 3,251 | 3,296 | 3,287 | 3,278 | ||||||||||||||
Employee stock plans | 9 | 18 | 9 | — | 9 | 9 | ||||||||||||||
Balance at November 30, | 3,287 | 3,278 | 3,260 | 3,296 | 3,296 | 3,287 | ||||||||||||||
Additional paid-in capital: | ||||||||||||||||||||
Beginning balance | 1,486,988 | 1,275,216 | 1,354,003 | 1,920,386 | 1,753,695 | 1,486,988 | ||||||||||||||
Conversion of 5.125% zero-coupon convertible senior subordinated notes to Class A common shares | 157,406 | 127,869 | — | |||||||||||||||||
Conversion of other debt | — | — | 25 | |||||||||||||||||
Conversion of convertible senior subordinated notes to Class A common shares, including tax benefit | — | 95,978 | 157,406 | |||||||||||||||||
Employee stock and director plans | 82,342 | 37,807 | 14,449 | 12,940 | 47,235 | 82,342 | ||||||||||||||
Tax benefit from employee stock plans and vesting of restricted stock | 15,705 | 39,180 | 13,142 | |||||||||||||||||
Retirement of treasury stock | — | — | (109,404 | ) | ||||||||||||||||
Tax (provision) benefit from employee stock plans and vesting of restricted stock | (6,139 | ) | 5,171 | 15,705 | ||||||||||||||||
Amortization of restricted stock and performance-based stock options | 11,254 | 6,916 | 3,001 | 17,439 | 18,307 | 11,254 | ||||||||||||||
Balance at November 30, | 1,753,695 | 1,486,988 | 1,275,216 | 1,944,626 | 1,920,386 | 1,753,695 | ||||||||||||||
Retained earnings: | ||||||||||||||||||||
Beginning balance | 4,046,563 | 2,780,637 | 1,914,963 | 2,496,933 | 4,539,137 | 4,046,563 | ||||||||||||||
Net earnings | 593,869 | 1,355,155 | 945,619 | |||||||||||||||||
Net earnings (loss) | (1,109,085 | ) | (1,941,081 | ) | 593,869 | |||||||||||||||
Cash dividends—Class A common stock | (80,860 | ) | (70,495 | ) | (63,252 | ) | (67,220 | ) | (80,984 | ) | (80,860 | ) | ||||||||
Cash dividends—Class B common stock | (20,435 | ) | (18,734 | ) | (16,693 | ) | (16,267 | ) | (20,139 | ) | (20,435 | ) | ||||||||
FIN 48 cumulative effect adjustment | (24,681 | ) | — | — | ||||||||||||||||
EITF 06-8 cumulative effect adjustment | (6,521 | ) | — | — | ||||||||||||||||
Balance at November 30, | 4,539,137 | 4,046,563 | 2,780,637 | 1,273,159 | 2,496,933 | 4,539,137 | ||||||||||||||
Deferred compensation plan: | ||||||||||||||||||||
Beginning balance | (4,047 | ) | (6,410 | ) | (4,919 | ) | (332 | ) | (1,586 | ) | (4,047 | ) | ||||||||
Deferred compensation activity | 2,461 | 2,363 | (1,491 | ) | 332 | 1,254 | 2,461 | |||||||||||||
Balance at November 30, | $ | (1,586 | ) | (4,047 | ) | (6,410 | ) | $ | — | (332 | ) | (1,586 | ) | |||||||
See accompanying notes to consolidated financial statements.
47
LENNAR CORPORATION AND SUBSIDIARIES
CONSOLIDATED STATEMENTS OF STOCKHOLDERS’ EQUITY—(Continued)
Years Ended November 30, 2006, 20052008, 2007 and 20042006
| 2006 | 2005 | 2004 | ||||||||
| (Dollars in thousands) | ||||||||||
Deferred compensation liability: | ||||||||||
Beginning balance | $ | 4,047 | 6,410 | 4,919 | ||||||
Deferred compensation activity | (2,461 | ) | (2,363 | ) | 1,491 | |||||
Balance at November 30, | 1,586 | 4,047 | 6,410 | |||||||
Treasury stock, at cost: | ||||||||||
Beginning balance | (293,222 | ) | (3,938 | ) | — | |||||
Employee stock plans | (3,125 | ) | (14,385 | ) | (4,020 | ) | ||||
Purchases of treasury stock | (320,104 | ) | (274,899 | ) | (109,562 | ) | ||||
Reissuance of treasury stock | 10,056 | — | — | |||||||
Retirement of treasury stock | — | — | 109,644 | |||||||
Balance at November 30, | (606,395 | ) | (293,222 | ) | (3,938 | ) | ||||
Accumulated other comprehensive loss: | ||||||||||
Beginning balance | (5,221 | ) | (14,575 | ) | (20,976 | ) | ||||
Unrealized gains arising during period on interest rate swaps, net of tax | 2,853 | 10,049 | 6,734 | |||||||
Unrealized gains arising during period on available-for-sale investment securities, net of tax | 7 | 185 | 53 | |||||||
Reclassification adjustment for gains included in net earnings for available-for-sale investment securities, net of tax | (245 | ) | — | — | ||||||
Change to the Company’s portion of unconsolidated entity’s minimum pension liability, net of tax | 565 | (880 | ) | (386 | ) | |||||
Balance at November 30, | (2,041 | ) | (5,221 | ) | (14,575 | ) | ||||
Total stockholders’ equity | $ | 5,701,372 | 5,251,411 | 4,052,972 | ||||||
Comprehensive income | $ | 597,049 | 1,364,509 | 952,020 | ||||||
| 2008 | 2007 | 2006 | ||||||||
| (Dollars in thousands) | ||||||||||
Deferred compensation liability: | ||||||||||
Beginning balance | $ | 332 | 1,586 | 4,047 | ||||||
Deferred compensation activity | (332 | ) | (1,254 | ) | (2,461 | ) | ||||
Balance at November 30, | — | 332 | 1,586 | |||||||
Treasury stock, at cost: | ||||||||||
Beginning balance | (610,366 | ) | (606,395 | ) | (293,222 | ) | ||||
Employee stock plans | (1,758 | ) | (3,971 | ) | (3,125 | ) | ||||
Purchases of treasury stock | — | — | (320,104 | ) | ||||||
Reissuance of treasury stock | — | — | 10,056 | |||||||
Balance at November 30, | (612,124 | ) | (610,366 | ) | (606,395 | ) | ||||
Accumulated other comprehensive loss: | ||||||||||
Beginning balance | (2,061 | ) | (2,041 | ) | (5,221 | ) | ||||
Unrealized gains arising during period on interest rate swaps, | — | 1,002 | 2,853 | |||||||
Unrealized gain (loss) on Company’s portion of unconsolidated entity’s interest rate swap liability, net of tax | 2,061 | (2,061 | ) | — | ||||||
Unrealized gains arising during period on available-for-sale investment securities, net of tax | — | — | 7 | |||||||
Reclassification adjustment for loss included in net loss for interest rate swaps, net of tax | — | 338 | — | |||||||
Reclassification adjustment for gains included in net earnings for available-for-sale investment securities, net of tax | — | — | (245 | ) | ||||||
Change to the Company’s portion of unconsolidated entity’s minimum pension liability, net of tax | — | 701 | 565 | |||||||
Balance at November 30, | — | (2,061 | ) | (2,041 | ) | |||||
Total stockholders’ equity | $ | 2,623,007 | 3,822,119 | 5,701,372 | ||||||
Comprehensive income (loss) | $ | (1,107,024 | ) | (1,941,101 | ) | 597,049 | ||||
See accompanying notes to consolidated financial statements.
48
LENNAR CORPORATION AND SUBSIDIARIES
CONSOLIDATED STATEMENTS OF CASH FLOWS
Years Ended November 30, 2006, 20052008, 2007 and 20042006
| 2006 | 2005 | 2004 | ||||||||
| (Dollars in thousands) | ||||||||||
Cash flows from operating activities: | ||||||||||
Net earnings from continuing operations | $ | 593,869 | 1,344,410 | 944,642 | ||||||
Adjustments to reconcile net earnings from continuing operations to net cash provided by operating activities: | ||||||||||
Depreciation and amortization | 45,431 | 58,253 | 52,572 | |||||||
Amortization of discount/premium on debt, net | 4,580 | 14,389 | 17,713 | |||||||
Gain on sale of personal lines insurance policies | (17,714 | ) | — | — | ||||||
Equity in (earnings) loss from unconsolidated entities, net of $126.4 million of valuation adjustments to the Company’s investments in unconsolidated entities in 2006 | 12,536 | (133,814 | ) | (90,739 | ) | |||||
Distribution of earnings from unconsolidated entities | 174,979 | 221,131 | 128,535 | |||||||
Minority interest expense, net | 13,415 | 45,030 | 10,796 | |||||||
Share-based compensation expense | 36,632 | 6,916 | 3,001 | |||||||
Tax benefits from share-based awards | 8,602 | 39,180 | 13,142 | |||||||
Deferred income tax provision (benefit) | (198,005 | ) | 10,220 | 81,532 | ||||||
Loss on redemption of 9.95% senior notes | — | 34,908 | — | |||||||
Inventory write-offs and valuation adjustments | 501,786 | 20,542 | 16,769 | |||||||
Changes in assets and liabilities, net of effect from acquisitions: | ||||||||||
(Increase) decrease in receivables | 47,843 | (221,275 | ) | (385,204 | ) | |||||
Increase in inventories, net of inventory write-offs and valuation adjustments | (371,268 | ) | (1,708,033 | ) | (886,963 | ) | ||||
(Increase) decrease in other assets | 9,253 | (30,150 | ) | (1,289 | ) | |||||
(Increase) decrease in financial services loans held-for-sale | 78,922 | (114,657 | ) | 94,948 | ||||||
Increase (decrease) in accounts payable and other liabilities | (386,211 | ) | 741,690 | 418,573 | ||||||
Net earnings from discontinued operations | — | 10,745 | 977 | |||||||
Adjustment to reconcile net earnings from discontinued operations to net cash provided by operating activities (including gain on sale of discontinued operations of ($15,816) in 2005) | — | (16,510 | ) | 1,187 | ||||||
Net cash provided by operating activities | 554,650 | 322,975 | 420,192 | |||||||
Cash flows from investing activities: | ||||||||||
(Increase) decrease in restricted cash | (2,115 | ) | (11,129 | ) | 32,584 | |||||
Additions to operating properties and equipment | (26,783 | ) | (21,747 | ) | (27,389 | ) | ||||
Contributions to unconsolidated entities | (729,304 | ) | (919,817 | ) | (751,211 | ) | ||||
Distributions of capital from unconsolidated entities | 321,610 | 466,800 | 330,614 | |||||||
(Increase) decrease in financial services loans held-for-investment | 70,970 | (117,359 | ) | 1,211 | ||||||
Purchases of investment securities | (108,626 | ) | (37,350 | ) | (48,562 | ) | ||||
Proceeds from sales of investment securities | 82,492 | 36,078 | 34,376 | |||||||
Proceeds from sale of business | — | 17,000 | — | |||||||
Proceeds from sale of personal lines insurance policies | 18,500 | — | — | |||||||
Acquisitions, net of cash acquired | (33,213 | ) | (416,049 | ) | (105,730 | ) | ||||
Net cash used in investing activities | (406,469 | ) | (1,003,573 | ) | (534,107 | ) | ||||
Cash flows from financing activities: | ||||||||||
Net borrowings (repayments) under financial services debt | (120,858 | ) | 372,849 | 162,277 | ||||||
Net proceeds from senior floating-rate notes due 2007 | — | — | 199,300 | |||||||
Net proceeds from senior floating-rate notes due 2009 | — | — | 298,500 | |||||||
Net proceeds from 5.125% senior notes | — | 298,215 | — | |||||||
Net proceeds from 5.50% senior notes | — | — | 245,480 | |||||||
Net proceeds from 5.60% senior notes | — | 501,460 | — | |||||||
Net proceeds from 5.95% senior notes | 248,665 | — | — | |||||||
Net proceeds from 6.50% senior notes | 248,933 | — | — | |||||||
Redemption of senior floating-rate notes due 2007 | (200,000 | ) | — | — | ||||||
Redemption of 9.95% senior notes | — | (337,731 | ) | — | ||||||
Proceeds from other borrowings | 2,489 | 53,198 | — | |||||||
| 2008 | 2007 | 2006 | ||||||||
| (Dollars in thousands) | ||||||||||
Cash flows from operating activities: | ||||||||||
Net earnings (loss) | $ | (1,109,085 | ) | (1,941,081 | ) | 593,869 | ||||
Adjustments to reconcile net earnings (loss) to net cash provided by operating activities: | ||||||||||
Depreciation and amortization | 32,399 | 54,303 | 45,431 | |||||||
Amortization of discount/premium on debt, net | 2,662 | 2,461 | 4,580 | |||||||
Gain on recapitalization of unconsolidated entity | (133,097 | ) | (175,879 | ) | — | |||||
Gain on sale of personal lines insurance policies | — | — | (17,714 | ) | ||||||
Equity in loss from unconsolidated entities, including $32.2 million, $364.2 million and $126.4 million, respectively, of the Company’s share of SFAS 144 valuation adjustments related to assets of unconsolidated entities in 2008, 2007 and 2006 | 59,156 | 362,899 | 12,536 | |||||||
Distribution of earnings from unconsolidated entities | 21,069 | 106,883 | 174,979 | |||||||
Minority interest (income) expense, net | (4,097 | ) | 1,927 | 13,415 | ||||||
Share-based compensation expense | 29,871 | 35,478 | 36,632 | |||||||
Tax (provision) benefits from share-based awards | (6,139 | ) | 5,171 | 15,705 | ||||||
Excess tax benefits from share-based awards | — | (4,590 | ) | (7,103 | ) | |||||
Deferred income tax provision (benefit) | 772,508 | (438,817 | ) | (198,005 | ) | |||||
Valuation adjustments and write-offs of option deposits and pre-acquisition costs, notes receivables and goodwill impairments | 565,465 | 2,767,522 | 501,786 | |||||||
Changes in assets and liabilities, net of effect from acquisitions: | ||||||||||
(Increase) decrease in restricted cash | 4,624 | (10,633 | ) | (2,115 | ) | |||||
(Increase) decrease in receivables | 828,646 | (542,400 | ) | 47,843 | ||||||
(Increase) decrease in inventories, excluding valuation adjustments and write-offs of option deposits and pre-acquisition costs | 292,264 | 666,228 | (371,268 | ) | ||||||
Decrease in other assets | 7,166 | 48,509 | 9,253 | |||||||
Decrease in financial services loans held-for-sale | 83,622 | 190,254 | 78,922 | |||||||
Decrease in accounts payable and other liabilities | (346,200 | ) | (683,722 | ) | (386,211 | ) | ||||
Net cash provided by operating activities | 1,100,834 | 444,513 | 552,535 | |||||||
Cash flows from investing activities: | ||||||||||
Net (additions) disposals of operating properties and equipment | 1,390 | 81 | (26,783 | ) | ||||||
Contributions to unconsolidated entities | (403,709 | ) | (607,957 | ) | (729,304 | ) | ||||
Distributions of capital from unconsolidated entities | 87,802 | 542,346 | 321,610 | |||||||
Distributions in excess of investment in unconsolidated entity | — | 354,644 | — | |||||||
Decrease in financial services loans held-for-investment | 5,006 | 18,130 | 70,970 | |||||||
Purchases of investment securities | (176,514 | ) | (107,791 | ) | (108,626 | ) | ||||
Proceeds from sales and maturities of investment securities | 220,322 | 107,530 | 82,492 | |||||||
Proceeds from sale of personal lines insurance policies | — | — | 18,500 | |||||||
Acquisitions, net of cash acquired | — | — | (33,213 | ) | ||||||
Net cash provided by (used in) investing activities | (265,703 | ) | 306,983 | (404,354 | ) | |||||
Cash flows from financing activities: | ||||||||||
Net repayments under financial services debt | (315,654 | ) | (607,794 | ) | (120,858 | ) | ||||
Net proceeds from 5.95% senior notes | — | — | 248,665 | |||||||
Net proceeds from 6.50% senior notes | — | — | 248,933 | |||||||
Redemption of senior floating-rate notes due 2007 | — | — | (200,000 | ) | ||||||
Redemption of senior floating-rate notes due 2009 | — | (300,000 | ) | — | ||||||
Proceeds from other borrowings | 3,548 | 32,178 | 2,489 | |||||||
Partial redemption of 7 5/8% senior notes due 2009 | (322 | ) | — | — | ||||||
Principal payments on other borrowings | (132,055 | ) | (188,544 | ) | (150,793 | ) | ||||
Net proceeds from sale of land to an unconsolidated land investment venture | — | 445,000 | — | |||||||
Exercise of land options contracts from an unconsolidated land investment venture | (48,434 | ) | — | — | ||||||
See accompanying notes to consolidated financial statements.
49
LENNAR CORPORATION AND SUBSIDIARIES
CONSOLIDATED STATEMENTS OF CASH FLOWS—(Continued)
Years Ended November 30, 2006, 20052008, 2007 and 20042006
| 2006 | 2005 | 2004 | 2008 | 2007 | 2006 | |||||||||||||||
| (Dollars in thousands) | (Dollars in thousands) | |||||||||||||||||||
Principal payments on other borrowings | (150,793 | ) | (190,240 | ) | (404,089 | ) | ||||||||||||||
Net payments related to minority interests | (71,351 | ) | (33,181 | ) | (18,396 | ) | ||||||||||||||
Receipts related to minority interests | 154,275 | 9,008 | 1,449 | |||||||||||||||||
Payments related to minority interests | (3,240 | ) | (45,553 | ) | (72,800 | ) | ||||||||||||||
Excess tax benefits from share-based awards | 7,103 | — | — | — | 4,590 | 7,103 | ||||||||||||||
Common stock: | ||||||||||||||||||||
Issuances | 31,131 | 38,069 | 14,537 | 224 | 21,588 | 31,131 | ||||||||||||||
Repurchases | (323,229 | ) | (289,284 | ) | (113,582 | ) | (1,758 | ) | (3,971 | ) | (323,229 | ) | ||||||||
Dividends | (101,295 | ) | (89,229 | ) | (79,945 | ) | (83,487 | ) | (101,123 | ) | (101,295 | ) | ||||||||
Net cash provided by (used in) financing activities | (429,205 | ) | 324,126 | 304,082 | ||||||||||||||||
Net cash used in financing activities | (426,903 | ) | (734,621 | ) | (429,205 | ) | ||||||||||||||
Net increase (decrease) in cash | $ | (281,024 | ) | (356,472 | ) | 190,167 | ||||||||||||||
Cash at beginning of year | 1,059,343 | 1,415,815 | 1,225,648 | |||||||||||||||||
Net increase (decrease) in cash and cash equivalents | $ | 408,228 | 16,875 | (281,024 | ) | |||||||||||||||
Cash and cash equivalents at beginning of year | 795,194 | 778,319 | 1,059,343 | |||||||||||||||||
Cash at end of year | $ | 778,319 | 1,059,343 | 1,415,815 | ||||||||||||||||
Cash and cash equivalents at end of year | $ | 1,203,422 | 795,194 | 778,319 | ||||||||||||||||
Summary of cash: | ||||||||||||||||||||
Summary of cash and cash equivalents: | ||||||||||||||||||||
Homebuilding | $ | 661,662 | 909,557 | 1,310,920 | $ | 1,091,468 | 642,467 | 661,662 | ||||||||||||
Financial services | 116,657 | 149,786 | 104,895 | 111,954 | 152,727 | 116,657 | ||||||||||||||
| $ | 778,319 | 1,059,343 | 1,415,815 | $ | 1,203,422 | 795,194 | 778,319 | |||||||||||||
Supplemental disclosures of cash flow information: | ||||||||||||||||||||
Cash paid for interest, net of amounts capitalized | $ | 28,731 | 15,844 | — | $ | 37,949 | 32,731 | 28,731 | ||||||||||||
Cash paid for income taxes, net | $ | 915,743 | 571,498 | 278,444 | ||||||||||||||||
Cash (received) paid for income taxes, net | $ | (877,039 | ) | 214,848 | 915,743 | |||||||||||||||
Supplemental disclosures of non-cash investing and financing activities: | ||||||||||||||||||||
Conversion of debt to equity | $ | 157,894 | 128,278 | 25 | ||||||||||||||||
Purchases of inventory financed by sellers | $ | 36,810 | 159,078 | 45,892 | ||||||||||||||||
Conversion of debt to equity, including tax benefit | $ | — | 95,978 | 157,894 | ||||||||||||||||
Purchases of inventories financed by sellers | $ | 2,384 | 10,253 | 36,810 | ||||||||||||||||
Non-cash contributions to unconsolidated entities | $ | 39,491 | — | — | $ | 27,434 | 73,822 | 39,491 | ||||||||||||
Non-cash distributions from unconsolidated entities | $ | 25,329 | 74,498 | 31,311 | $ | 56,913 | 14,036 | 25,329 | ||||||||||||
Issuance of common stock for employee compensation | $ | 38,150 | — | — | $ | — | 7,391 | 38,150 | ||||||||||||
Consolidation/deconsolidation of previously unconsolidated/consolidated entities, net: | ||||||||||||||||||||
Receivables | $ | (232 | ) | 20,100 | — | $ | 34,346 | 4,093 | (232 | ) | ||||||||||
Inventories | $ | 188,191 | 153,005 | 92,614 | $ | 647,466 | 238,060 | 188,191 | ||||||||||||
Investments in unconsolidated entities | $ | (38,354 | ) | (26,103 | ) | (4,903 | ) | $ | (183,647 | ) | (69,767 | ) | (38,354 | ) | ||||||
Other assets | $ | 6,563 | 6,423 | 1,919 | $ | 620 | 1,625 | 6,563 | ||||||||||||
Other debts payable | $ | (81,455 | ) | (81,006 | ) | (48,099 | ) | $ | (371,811 | ) | (173,239 | ) | (81,455 | ) | ||||||
Other liabilities | $ | (40,588 | ) | (49,401 | ) | (21,331 | ) | $ | (88,774 | ) | 6,981 | (40,588 | ) | |||||||
Minority interest | $ | (34,125 | ) | (23,018 | ) | (20,200 | ) | $ | (38,200 | ) | (7,753 | ) | (34,125 | ) | ||||||
Acquisitions: | ||||||||||||||||||||
Fair value of assets acquired, including cash of $0 in 2006, $0 in 2005 and $1,392 in 2004 | $ | 23,843 | 409,262 | 88,822 | ||||||||||||||||
Fair value of assets acquired | $ | — | — | 23,843 | ||||||||||||||||
Goodwill recorded | 10,518 | 13,781 | 26,656 | — | — | 10,518 | ||||||||||||||
Fair value of liabilities assumed | (1,148 | ) | (6,994 | ) | (8,356 | ) | — | — | (1,148 | ) | ||||||||||
Cash paid | $ | 33,213 | 416,049 | 107,122 | $ | — | — | 33,213 | ||||||||||||
See accompanying notes to consolidated financial statements.
50
LENNAR CORPORATION AND SUBSIDIARIES
NOTES TO CONSOLIDATED FINANCIAL STATEMENTS
1. Summary of Significant Accounting Policies
Basis of Consolidation
The accompanying consolidated financial statements include the accounts of Lennar Corporation and all subsidiaries, partnerships and other entities in which Lennar Corporation has a controlling interest and variable interest entities (see Note 18)16) in which Lennar Corporation is deemed the primary beneficiary (the “Company”). The Company’s investments in both unconsolidated entities in which a significant, but less than controlling, interest is held and in variable interest entities in which the Company is not deemed to be the primary beneficiary are accounted for by the equity method. All significant intercompany transactions and balances have been eliminated in consolidation.
Use of Estimates
The preparation of financial statements in conformity with accounting principles generally accepted in the United States of America requires management to make estimates and assumptions that affect the amounts reported in the consolidated financial statements and accompanying notes. Actual results could differ from those estimates.
Changes in Accounting Principles
On December 1, 2007, the Company adopted Financial Accounting Standards Board (“FASB”)Interpretation No. 48, Accounting for Uncertainty in Income Taxes—an interpretation of FASB Statement No. 109, (“FIN 48”) which provides interpretative guidance for the financial statement recognition and measurement of a tax position taken or expected to be taken in a tax return. As a result, the Company recognized the effect of the change in accounting principle through a cumulative–effect charge of $24.7 million to retained earnings as of December 1, 2007 (see Income Taxes and Note 9).
On December 1, 2007, in accordance with Emerging Issues Task Force 06-8,Applicability of the Assessment of a Buyer’s Continuing Investment under FASB Statement No. 66 for Sales of Condominiums, (“EITF 06-8”) the Company changed its method of recognizing revenues and expenses on its multi-level residential buildings under construction from percentage-of-completion accounting to recognizing revenues when sales are closed and title passes to the new homeowner, the new homeowner’s initial and continuing investment is adequate to demonstrate a commitment to pay for the home, the receivable from the new homeowner is not subject to future subordination and the Company does not have a substantial continuing involvement with the new home in accordance with Statement of Financial Accounting Standards (“SFAS”) No. 66,Accounting for Sales of Real Estate, (“SFAS 66”). As a result, the Company recognized the effect of the change in accounting principle through a cumulative-effect charge of $6.5 million to retained earnings as of December 1, 2007.
On March 1, 2008, the Company adopted Staff Accounting Bulletin (“SAB”) No. 109,Written Loan Commitments Recorded at Fair Value through Earnings, (“SAB 109”). SAB 109 revises and rescinds portions of SAB No. 105,Application of Accounting Principles to Loan Commitments, and expresses the current view of the SEC that, consistent with the guidance in SFAS No. 156,Accounting for Servicing of Financial Assets, and SFAS No.159,The Fair Value Option for Financial Assets and Financial Liabilities, (“SFAS 159”) the expected net future cash flows related to the associated servicing of loans should be included in the measurement of the fair value of all written loan commitments that are accounted for at fair value through earnings. SFAS 159 permits entities to choose to measure various financial instruments and certain other items at fair value on a contract-by-contract basis. Under SFAS 159, the Company elected the fair value option for residential mortgage loans held-for-sale originated subsequent to February 29, 2008. As a result of the adoption of these accounting pronouncements, the Company’s loss before benefit for income taxes was reduced by $5.3 million in 2008.
Share-Based Payments
The Company has share-based awards outstanding under four different plans which provide for the granting of stock options and stock appreciation rights and awards of restricted common stock (“nonvested shares”) to key officers, employees and directors. The exercise prices of stock options and stock appreciation rights may not be less than the market value of the common stock on the date of the grant. No options granted under the plans may
LENNAR CORPORATION AND SUBSIDIARIES
NOTES TO CONSOLIDATED FINANCIAL STATEMENTS—(Continued)
be exercisable until at least six months after the date of the grant. Thereafter, exercises are permitted in installments determined when options are granted. Each stock option and stock appreciation right will expire on a date determined at the time of the grant, but not more than ten years after the date of the grant.
Prior to December 1, 2005, theThe Company accountedaccounts for stock option awards granted under the plans in accordance with the recognition and measurement provisions of Accounting Principles Board (“APB”) Opinion No. 25,Accounting for Stock Issued to Employees, (“APB 25”) and related Interpretations, as permitted by Statement of Financial Accounting Standards (“SFAS”) No. 123,Accounting for Stock-Based Compensation,(“SFAS 123”). Share-based employee compensation expense was not recognized in the Company’s consolidated statements of earnings prior to December 1, 2005, as all stock option awards granted under the plans had an exercise price equal to or greater than the market value of the common stock on the date of the grant. Effective December 1, 2005, the Company adopted the provisions of SFAS No. 123 (revised 2004),Share-Based Payment, (“SFAS 123R”). Effective December 1, 2005, the Company adopted SFAS 123R using the modified-prospective-transition method. Under this transition method, compensation expense recognized during the year ended November 30, 2006 included: (a) compensation expense for all share-based awards granted prior to, but not yet vested as of, December 1, 2005, based on the grant date fair value estimated in accordance with the original provisions of SFAS 123, and (b) compensation expense for all share-based awards granted subsequent to December 1, 2005, based on the grant date fair value estimated in accordance with the provisions of SFAS 123R. In accordance with the modified-prospective-transition method, results for prior periods have not been restated.
As a result of adopting SFAS 123R, the charge to earnings before provision for income taxes for the year ended November 30, 2006 was $25.6 million. The impact of adopting SFAS 123R on net earnings for the year ended November 30, 2006 was $18.5 million. The impact of adopting SFAS 123R on basic and diluted earnings per share for the year ended November 30, 2006 was $0.12 per share and $0.11 per share, respectively. See Note 15 for details related to share-based payments.
Revenue Recognition
Revenues from sales of homes are recognized when the sales are closed and title passes to the new homeowner, the new homeowner’s initial and continuing investment is adequate to demonstrate a commitment to pay for the home, the new homeowner’s receivable is not subject to future subordination and the Company does not have a substantial continuing involvement with the new home in accordance with SFAS No. 66,Accounting for Sales of Real Estate(“SFAS 66”).66. Revenues from sales of land are recognized when a significant down payment is received, the earnings process is complete, title passes and the collectibilitycollectability of the receivablesreceivable is reasonably assured.
51
LENNAR CORPORATION AND SUBSIDIARIES
NOTES TO CONSOLIDATED FINANCIAL STATEMENTS—(Continued)
Advertising Costs
The Company expenses advertising costs as incurred. Advertising costs were $65.7 million, $120.4 million and $155.5 million, $82.3 million and $60.3 millionrespectively, for the years ended November 30, 2006, 20052008, 2007 and 2004, respectively.2006.
Cash and Cash Equivalents
The Company considers all highly liquid investments purchased with original maturities of three months or less to be cash equivalents. Due to the short maturity period of the cash equivalents, the carrying amounts of these instruments approximate their fair values. Cash and cash equivalents as of November 30, 20062008 and 20052007 included $135.9$9.8 million and $193.6$23.3 million, respectively, of cash primarily held in escrow for approximately three days.
Restricted Cash
Restricted cash consists of customer deposits on home sales held in restricted accounts until title transfers to the homebuyer, as required by the state and local governments in which the homes were sold.
Income Tax Receivables
Income tax receivables consist of tax refunds that the Company expects to receive within one year. As of November 30, 2008 and 2007, there were $255.5 million and $881.5 million, respectively, of income tax receivables. Subsequent to November 30, 2008, the Company has received $251.0 million of tax refunds.
Inventories
Inventories are stated at cost unless the inventory within a community is determined to be impaired, in which case the impaired inventory would beis written down to fair value. Inventory costs include land, land development and home construction costs, real estate taxes, deposits on land purchase contracts and interest related to development and construction. The Company reviews inventories for impairment during each reporting period in accordance with SFAS No. 144,Accounting for the Impairment or Disposal of Long-lived Assets, (“SFAS 144”). The Company evaluates long-lived assets for impairment based on the projected undiscounted future cash flows of the assets. Write-downs of inventories deemed to be impaired are recorded as adjustments to the cost basis of the respective inventories. During the years ended November 30, 2006 and 2005, the Company recorded $501.8 million and $20.5 million, respectively, of inventory adjustments, which included $280.5 million of homebuilding inventory valuation adjustments in 2006 (no adjustments in 2005), $152.2 million and $15.1 million, respectively, in 2006 and 2005 of write-offs of deposits and pre-acquisition costs related to land under option that the Company does not intend to purchase and $69.1 million and $5.4 million, respectively, in 2006 and 2005 of land inventory valuation adjustments. During the year ended November 30, 2004, the Company recorded $16.8 million of write-offs of deposits and pre-acquisition costs related to land under option that it does not intend to purchase. These valuation adjustments were calculated based on current market conditions and assumptions made by management, which may differ materially from actual results if market conditions change.
Construction overhead and selling expenses are expensed as incurred. Homes held-for-sale are classified as inventories until delivered. Land, land development, amenities and other costs are accumulated by specific area and allocated to homes within the respective areas. The Company reviews inventories for impairment during each reporting period on a community by community basis. SFAS No. 144,Accounting for the Impairment or Disposal of Long-lived Assets,(“SFAS 144”) requires that if the undiscounted cash flows expected to be generated by an asset are less than its carrying amount, an impairment charge should be recorded to write down the carrying amount of such asset to its fair value.
LENNAR CORPORATION AND SUBSIDIARIES
NOTES TO CONSOLIDATED FINANCIAL STATEMENTS—(Continued)
In conducting its review for indicators of impairment on a community level, the Company evaluates, among other things, the margins on homes that have been delivered, margins under sales contracts in backlog, projected margins with regard to future home sales over the life of the community, projected margins with regard to future land sales and the fair value of the land itself. The Company pays particular attention to communities in which inventory is moving at a slower than anticipated absorption pace and communities whose average sales price and/or margins are trending downward and are anticipated to continue to trend downward. From this review the Company identifies communities whose carrying values exceed their undiscounted cash flows.
The Company estimates the fair value of its communities using a discounted cash flow model. The projected cash flows for each community are significantly impacted by estimates related to market supply and demand, product type by community, homesite sizes, sales pace, sales prices, sales incentives, construction costs, sales and marketing expenses, the local economy, competitive conditions, labor costs, costs of materials and other factors for that particular community. The determination of fair value also requires discounting the estimated cash flows at a rate commensurate with the inherent risks associated with the assets and related estimated cash flow streams. The discount rate used in determining each asset’s fair value depends on the community’s projected life and development stage. The Company generally uses a 20% discount rate, subject to the perceived risks associated with the community’s cash flow streams relative to its inventory. For example, construction in progress inventory, which is closer to completion, will generally require a lower discount rate than land under development in communities consisting of multiple phases spanning several years of development.
The Company estimates fair values of inventory evaluated for impairment under SFAS 144 based on market conditions and assumptions made by management at the time the inventory is evaluated, which may differ materially from actual results if market conditions or assumptions change. For example, further market deterioration or changes in assumptions may lead to the Company incurring additional impairment charges on previously impaired inventory, as well as on inventory not currently impaired but for which indicators of impairment may arise if further market deterioration occurs.
The Company also has access to land inventory through option contracts, which generally enables the Company to control portions of properties owned by third parties and unconsolidated entities (including land funds) until it has determined whether to exercise its option. A majority of the Company’s option contracts require a non-refundable cash deposit or irrevocable letter of credit based on a percentage of the purchase price of the land. The Company’s option contracts are recorded at cost. In determining whether to walk-away from an option contract, the Company evaluates the option primarily based upon its expected cash flows from the property under option. If the Company intends to walk away from an option contract, it records a charge to earnings (loss) in the period such decision is made for the deposit amount and related pre-acquisition costs associated with the option contract.
During the years ended November 30, 2008, 2007 and 2006, the Company recorded $340.5 million, $2,445.1 million and $501.8 million, respectively, of inventory adjustments, which included $195.5 million, $747.8 million and $280.5 million, respectively, in 2008, 2007 and 2006 of SFAS 144 valuation adjustments to finished homes, construction in progress and land on which the Company intends to build homes, $47.8 million, $1,167.3 million and $69.1 million, respectively, in 2008, 2007 and 2006 of SFAS 144 valuation adjustments to land the Company intends to sell or has sold to third parties and $97.2 million, $530.0 million and $152.2 million, respectively, in 2008, 2007 and 2006 of write-offs of deposits and pre-acquisition costs. The $1,167.3 million of valuation adjustments recorded in 2007 to land the Company intends to sell or has sold to third parties included $740.4 million of SFAS 144 valuation adjustments related to the portfolio of land the Company sold to its strategic land investment venture with Morgan Stanley Real Estate Fund II, L.P., an affiliate of Morgan Stanley & Co., Inc., which was formed in November 2007. The SFAS 144 valuation adjustments were calculated based on market conditions and assumptions made by management at the time the valuation adjustments were recorded, which may differ materially from actual results if market conditions or assumptions change. See Note 2 for details of valuation adjustments and write-offs by reportable segment and Homebuilding Other.
Investments in Unconsolidated Entities
The Company evaluates its investments in unconsolidated entities for impairment during each reporting period in accordance with APB Opinion No. 18,The Equity Method of Accounting for Investments in Common
LENNAR CORPORATION AND SUBSIDIARIES
NOTES TO CONSOLIDATED FINANCIAL STATEMENTS—(Continued)
Stock(“APB 18”). A series of operating losses of an investee or other factors may indicate that a decrease in value of the Company’s investment in the unconsolidated entity has occurred which is other-than-temporary. The amount of impairment recognized is the excess of the investment’s carrying amount over its estimated fair value.
Additionally, the Company considers various qualitative factors to determine if a decrease in the value of the investment is other-than-temporary. These factors include age of the venture, intent and ability for the Company to retain its investment in the entity, financial condition and long-term prospects of the entity and relationships with the other partners and banks. If the Company believes that the decline in the fair value of the investment is temporary, then no impairment is recorded.
The evaluation of the Company’s investment in unconsolidated entities includes two critical assumptions made by management: (1) projected future distributions from the unconsolidated entities and (2) discount rates applied to the future distributions.
The Company’s assumptions on the projected future distributions from the unconsolidated entities are dependent on market conditions. Specifically, distributions are dependent on cash to be generated from the sale of inventory by the unconsolidated entities. Such inventory is also reviewed for potential impairment by the unconsolidated entities in accordance with SFAS 144. The unconsolidated entities generally use a 20% discount rate in their SFAS 144 reviews for impairment, subject to the perceived risks associated with the community’s cash flow streams relative to its inventory. If a valuation adjustment is recorded by an unconsolidated entity in accordance with SFAS 144, the Company’s proportionate share is reflected in the Company’s equity in earnings (loss) from unconsolidated entities with a corresponding decrease to its investment in unconsolidated entities. In certain instances, the Company may be required to record additional losses relating to its investment in unconsolidated entities under APB 18, if the Company’s investment in the unconsolidated entity, or a portion thereof, is deemed to be unrecoverable through its disposition. These losses are included in management fees and other income (expense), net.
During the years ended November 30, 2008, 2007 and 2006, the Company recorded $205.0 million, $496.4 million and $140.9 million, respectively, of valuation adjustments to its investments in unconsolidated entities, which included $32.2 million, $364.2 million and $126.4 million, respectively, in 2008, 2007 and 2006 of the Company’s share of SFAS 144 valuation adjustments related to the assets of the Company’s unconsolidated entities and $172.8 million, $132.2 million and $14.5 million, respectively, in 2008, 2007, and 2006 of valuation adjustments to investments in unconsolidated entities in accordance with APB 18. These valuation adjustments were calculated based on market conditions and assumptions made by management at the time the valuation adjustments were recorded, which may differ materially from actual results if market conditions change. See Note 2 for details of valuation adjustments and write-offs by reportable segment and Homebuilding Other.
The Company tracks its share of cumulative earnings and cumulative distributions of its joint ventures (“JVs”). For purposes of classifying distributions received from JVs in the Company’s consolidated statements of cash flows, cumulative distributions are treated as returnson capital to the extent of cumulative earnings and included in the Company’s consolidated statements of cash flows as operating activities. Cumulative distributions in excess of the Company’s share of cumulative earnings are treated as returnsof capital and included in the Company’s consolidated statements of cash flows as investing activities.
Interest and Real Estate Taxes
Interest and real estate taxes attributable to land and homes are capitalized as inventories while they are being actively developed. Interest related to homebuilding and land, including interest costs relieved from inventories, is included in cost of homes sold and cost of land sold. Interest expense related to the financial services operations is included in its costs and expenses.
During 2006, 2005the years ended November 30, 2008, 2007 and 2004,2006, interest incurred by the Company’s homebuilding operations related to homebuilding debt was $247.5$148.3 million, $172.9$199.1 million and $137.9$232.1 million, respectively; interest capitalized into inventories was $226.3$120.7 million, $171.1$196.7 million and $137.6$226.3 million, respectively; and interest expense primarily included in cost of homes sold and cost of land sold was $130.4 million, $203.7 million and $241.1 million, $187.2 million and $134.2 million, respectively.
LENNAR CORPORATION AND SUBSIDIARIES
NOTES TO CONSOLIDATED FINANCIAL STATEMENTS—(Continued)
Operating Properties and Equipment
Operating properties and equipment are recorded at cost and are included in other assets in the consolidated balance sheets. The assets are depreciated over their estimated useful lives using the straight-line method. At the time operating properties and equipment are disposed of, the asset and related accumulated depreciation are removed from the accounts and any resulting gain or loss is credited or charged to earnings. The estimated useful life for operating properties is thirty years, for furniture, fixtures and equipment is two to ten years and for leasehold improvements is five years or the life of the lease, whichever is shorter. Operating properties are reviewed for possible impairment if there are indicators that their carrying amounts are not recoverable. No impairments were recorded during the periods presented.
52
LENNAR CORPORATION AND SUBSIDIARIES
NOTES TO CONSOLIDATED FINANCIAL STATEMENTS—(Continued)
Investment Securities
Investment securities are classified as available-for-sale unless they are classified as trading or held-to-maturity. Securities classified as trading are carried at fair value and unrealized holding gains and losses are recorded in earnings. Securities classified as held-to-maturity are carried at amortized cost because they are purchased with the intent and ability to hold to maturity. Available-for-sale securities are recorded at fair value. Any unrealized holding gains or losses on available-for-sale securities are reported as accumulated other comprehensive gain or loss, which is a separate component of stockholders’ equity, net of tax, until realized.
At November 30, 20062008 and 2005,2007, investment securities classified as held-to-maturity totaled $59.6$19.1 million and $32.1$61.5 million, respectively, and were included in the assets of the Financial Services segment. The held-to-maturity securities consist mainly of certificates of deposit and U.S. treasury securities. At November 30, 20062008 and 2005, the Company had investment securities classified as trading that totaled $8.5 million and $8.7 million, respectively, and were included in other assets of the Homebuilding operations. The trading securities are comprised mainly of marketable equity mutual funds designated to approximate the Company’s liabilities under its deferred compensation plan. Additionally, at November 30, 2006,2007, the Company had no investment securities classified as available-for-sale, compared to $8.9 million in the prior year included in other assets of the Homebuilding operations. The available-for-sale securities were comprised of municipal bonds with an original maturity of 20 years and were sold in 2006.trading or available-for-sale.
Derivative Financial Instruments
SFAS No. 133,Accounting for Derivative Instruments and Hedging Activities, (“SFAS 133”), as amended and interpreted, establishes accounting and reporting standards for derivative instruments and for hedging activities by requiring that all derivatives be recognized in the balance sheet and measured at fair value. Gains or losses resulting from changes in the fair value of derivatives are recognized in earnings or recorded in other comprehensive income or loss and recognized in the statement of earningsoperations when the hedged item affects earnings, depending on the purpose of the derivatives and whether they qualify for hedge accounting treatment.
The Company’s policy is to designate at a derivative’s inception the specific assets, liabilities, or future commitments being hedged and monitor the derivative to determine if it remains an effective hedge. The effectiveness of a derivative as a hedge is based on a high correlation between changes in its value and changes in the value of the underlying hedged item. The Company recognizes gains or losses for amounts received or paid when the underlying transaction settles. The Company does not enter into or hold derivatives for trading or speculative purposes.
The Company has various interest rate swap agreements, which effectively convert variable interest rates to fixed interest rates on $200.0 million of outstanding debt related to its homebuilding operations. The swap agreements have been designated as cash flow hedges and, accordingly, are reflected at their fair value in other liabilities in the consolidated balance sheets at November 30, 2006 and 2005. The related loss is deferred, net of tax, in stockholders’ equity as accumulated other comprehensive loss. The Company accounts for its interest rate swaps using the shortcut method, as described in SFAS 133. Amounts to be received or paid as a result of the swap agreements are recognized as adjustments to interest incurred on the related debt instruments. The Company believes that there will be no ineffectiveness related to the interest rate swaps and therefore no portion of the accumulated other comprehensive loss will be reclassified into future earnings. The net effect on the Company’s operating results is that interest on the variable-rate debt being hedged is recorded based on fixed interest rates.
The Financial Services segment, in the normal course of business, uses derivative financial instruments to reduce its exposure to fluctuations in mortgage-related interest rates. The segment enters intouses mortgage-backed securities (“MBS”) forward commitments, and, to a lesser extent, MBS option contracts and investor commitments to protect the value of fixed rate-locked loan commitments and loans held-for-sale from fluctuations in marketmortgage-related interest rates. These derivative financial instruments are designated ascarried at fair value hedges, and, accordingly, for all qualifying and highly effective fair value hedges,with the changes in the fair value of the derivative and the loss or gain on the hedged asset related to the risk being hedged are recorded currentlyincluded in earnings.
53
LENNAR CORPORATION AND SUBSIDIARIES
NOTES TO CONSOLIDATED FINANCIAL STATEMENTS—(Continued)Financial Services revenues.
Goodwill
Goodwill represents the excess of the purchase price over the fair value of the net assets acquired in business combinations. Evaluating goodwill for impairment involves the determination of the fair value of the Company’s reporting units in which the Company has recorded goodwill. A reporting unit is a component of an operating segment for which discrete financial information is available and reviewed by the Company’s management on a regular basis. Inherent in the determination of fair value of the Company’s reporting units are certain estimates and judgments, including the interpretation of current economic indicators and market valuations as well as the Company’s strategic plans with regard to its operations. To the extent additional
LENNAR CORPORATION AND SUBSIDIARIES
NOTES TO CONSOLIDATED FINANCIAL STATEMENTS—(Continued)
information arises or the Company’s strategies change, it is possible that the Company’s conclusion regarding goodwill impairment could change, which could have a significant effect on the Company’s financial position and results of operations.
At November 30, 20062008 and 2005,2007, goodwill was $257.8$34.0 million and $253.1$61.2 million, respectively. The goodwill balance at November 30, 2008 and 2007 relates to the Financial Services segment and is included in the assets of that segment. During fiscal 2008, the Company impaired $27.2 million of the Financial Services segment’s goodwill. During fiscal 2007, the Company impaired all of its homebuilding goodwill. During fiscal 2006, the Company’s goodwill had a net increase of $4.7 million primarily due to an acquisition by the Financial Services segment and payment of contingent consideration related to prior period acquisitions. During fiscal 2005, the Company’s goodwill increased $13.8 million due to 2005 acquisitions and payment of contingent consideration related to prior period acquisitions. Goodwill is included in the assets of the Homebuilding segments ($196.6 million and $195.2 million, respectively, at November 30, 2006 and 2005) and the assets of the Financial Services segment ($61.2 million and $58.0 million, respectively, at November 30, 2006 and 2005) in the consolidated balance sheets.
The Company reviews goodwill annually (or whenever indicators of impairment exist) for impairment in accordance with SFAS No. 142,Goodwill and Other Intangible Assets. Due to continued deterioration in market conditions as a result of tightening mortgage credit standards and other factors, the Company evaluated the carrying amount of the Financial Services segment’s goodwill for impairment in both its third and fourth quarter of 2008. During the third quarter of 2008, the Company impaired $27.2 million of the Financial Services segment’s goodwill.
The Company performed its annual impairment test of goodwill asin the fourth quarter of September 30, 20062008, and determined thatno additional impairment charges for the Financial Services segment’s goodwill was not impaired. No impairment was recorded during the years endedwere necessary. As of both November 30, 2006, 2005 or 2004. As of November 30, 20062008 and 2005,2007, there were no material identifiable intangible assets, other than goodwill.
Income Taxes
Income taxes are accounted for in accordance with SFAS No. 109,Accounting for Income Taxes,(“SFAS 109”). Under SFAS 109,The Company records income taxes under the asset and liability method, whereby deferred tax assets and liabilities are determinedrecognized based on the future tax consequences attributable to temporary differences between the financial reportingstatement carrying values and tax basesamounts of existing assets and liabilities and their respective tax bases and attributable to operating loss and tax credit carryforwards. Deferred tax assets and liabilities are measured by using enacted tax rates expected to apply to taxable income in the years in which thosethe temporary differences are expected to reverse.be recovered or paid. The effect on deferred tax assets and liabilities of a change in tax rates is recognized in earnings in the period when the changes are enacted.
SFAS 109 requires a reduction of the carrying amounts of deferred tax assets by a valuation allowance if, based on the available evidence, it is more likely than not that such assets will not be realized. Accordingly, the need to establish valuation allowances for deferred tax assets is assessed periodically by the Company based on the SFAS 109 more-likely-than-not realization threshold criterion. In the assessment for a valuation allowance, appropriate consideration is given to all positive and negative evidence related to the realization of the deferred tax assets. This assessment considers, among other matters, the nature, frequency and severity of current and cumulative losses, forecasts of future profitability, the duration of statutory carryforward periods, the Company’s experience with operating loss and tax credit carryforwards not expiring unused and tax planning alternatives. Based on the Company’s assessment, the uncertain and volatile market conditions and the fact that the Company is now in a cumulative loss position over the evaluation period, the Company recorded a non-cash deferred tax asset valuation allowance of $730.8 million in the year ended November 30, 2008. In future periods, the allowance could be reduced based on future sufficient evidence indicating that it is more likely than not that a portion of the deferred tax assets will be realized. At November 30, 2008, the Company had no net deferred tax assets. At November 30, 2007, the Company’s net deferred tax assets were $746.9 million and were included in Other Assets.
Effective December 1, 2007, the Company adopted the provisions of FIN 48, which provides interpretative guidance for the financial statement recognition and measurement of a tax position taken or expected to be taken in a tax return. Effective with the Company’s adoption of FIN 48, interest related to unrecognized tax benefits is now recognized in the financial statements as a component of (provision) benefit for income taxes. Interest and penalties related to unrecognized tax benefits were previously recorded in management fees and other income (expense), net in the Company’s statements of operations.
LENNAR CORPORATION AND SUBSIDIARIES
NOTES TO CONSOLIDATED FINANCIAL STATEMENTS—(Continued)
Product Warranty
Warranty and similar reserves for homes are established at an amount estimated to be adequate to cover potential costs for materials and labor with regard to warranty-type claims expected to be incurred subsequent to the delivery of a home. Reserves are determined based on historical data and trends with respect to similar product types and geographical areas. The Company constantlyregularly monitors the warranty reserve and makes adjustments to its pre-existing warranties in order to reflect changes in trends and historical data as information becomes available. Warranty reserves are included in other liabilities in the consolidated balance sheets. The activity in the Company’s warranty reserve was as follows:
| November 30, | November 30, | |||||||||||||
| 2006 | 2005 | 2008 | 2007 | |||||||||||
| (In thousands) | (In thousands) | |||||||||||||
Warranty reserve, beginning of year | $ | 144,916 | 116,826 | $ | 164,841 | 172,571 | ||||||||
Warranties issued during the period | 170,020 | 145,519 | 45,338 | 102,384 | ||||||||||
Adjustments to pre-existing warranties from changes in estimates | 25,487 | 31,766 | 15,042 | 51,816 | ||||||||||
Payments | (167,852 | ) | (149,195 | ) | (95,772 | ) | (161,930 | ) | ||||||
Warranty reserve, end of year | $ | 172,571 | 144,916 | $ | 129,449 | 164,841 | ||||||||
Self-Insurance
Certain insurable risks such as general liability, medical and workers’ compensation are self-insured by the Company up to certain limits. Undiscounted accruals for claims under the Company’s self-insurance program are based on claims filed and estimates for claims incurred but not yet reported.
Minority Interest
The Company has consolidated certain joint ventures because the Company either was determined to be the primary beneficiary pursuant to Financial Accounting Standards Board (“FASB”)FASB Interpretation No. 46(R) (“FIN 46(R)”),Consolidation of Variable Interest Entities, (“FIN 46R”), or has a controlling interest in these joint ventures. Therefore, the entities’ financial statements are consolidated in the Company’s consolidated financial statements and the other partners’ equity is recorded as minority interest. At November 30, 20062008 and 2005,2007, minority interest was $55.4$165.7 million and $78.2$28.5 million, respectively. Minority interest expense,income (expense), net was $13.4$4.1 million, $45.0($1.9) million and $10.8($13.4) million, respectively, for the years ended November 30, 2006, 20052008, 2007 and 2004.
54
LENNAR CORPORATION AND SUBSIDIARIES
NOTES TO CONSOLIDATED FINANCIAL STATEMENTS—(Continued)2006.
Earnings (loss) per Share
Earnings (loss) per share is accounted for in accordance with SFAS No. 128,Earnings per Share, which requires a dual presentation of basic and diluted earnings per share on the face of the consolidated statementstatements of earnings.operations. Basic earnings (loss) per share is computed by dividing net earnings (loss) attributable to common stockholders by the weighted average number of common shares outstanding for the period. Diluted earnings per share reflects the potential dilution that could occur if securities or other contracts to issue common stock were exercised or converted into common stock or resulted in the issuance of common stock that then shared in the earnings of the Company.
Financial Services
Loan origination revenues, net of direct origination costs and gains and losses from the sale of loans and loan servicing rights are recognized when the loans are sold and shipped to an investor. Premiums from title insurance policies are recognized as revenue on the effective datesdate of the policies. Escrow fees and loan origination revenues are recognized at the time the related real estate transactions are completed, usually upon the close of escrow. Gains and losses from the sale of loans and the expected net future cash flows related to the associated servicing of a loan are included in the measurement of all written loan commitments that are accounted for at fair value through earnings at the time of commitment. Interest income on loans held-for-sale and loans held-for-investment is recognized as earned over the terms of the mortgage loans based on the contractual interest rates.
Loans held-for-sale by the Financial Services segment that are designated as hedged assets are carried at fair value because the effect ofand changes in fair value are reflected in the carrying amount of the loans and in earnings. Premiums and discounts recorded on these loans are presented as an adjustment to the carrying amount of the loans and are not amortized.
LENNAR CORPORATION AND SUBSIDIARIES
WhenNOTES TO CONSOLIDATED FINANCIAL STATEMENTS—(Continued)
The Company elected the segment sellsfair value option for its loans held-for-sale for mortgage loans originated subsequent to February 29, 2008 in the secondary mortgage market,accordance with SFAS 159, which permits entities to measure various financial instruments and certain other items at fair value on a gain or loss is recognized to the extentcontract-by-contract basis. Management believes that the sales proceeds exceed, or are less than,election of the bookfair value option for loans held-for-sale improves financial reporting by mitigating volatility in reported earnings caused by measuring the fair value of the loans. loans and the derivative instruments used to economically hedge them without having to apply complex hedge accounting provisions. In addition, the Company adopted SAB 109 on March 1, 2008, requiring the recognition of the fair value of its rights to service a mortgage loan as revenue upon entering into an interest rate lock loan commitment with a borrower. The fair value of these servicing rights is included in the Company’s loans held-for-sale as of November 30, 2008. Prior to March 1, 2008, the fair value of the servicing rights was not recognized until the related loan was sold. Fair value of the servicing rights is determined based on values in the Company’s servicing sales contracts. At November 30, 2008, loans held-for-sale, all of which were accounted for at fair value, had an aggregate fair value of $190.1 million and an aggregate outstanding principal balance of $185.2 million.
Substantially all of thesethe loans wereoriginated are sold within a short period in the secondary mortgage market on a servicing released, non-recourse basis; however,although, the Company remains liable for certain limited representations and warranties related to loan sales. Loan origination fees, net of direct origination costs, are deferred and recognized as a component of the gain or loss when loans are sold.
Loans for which the segment has the positive intent and ability to hold to maturity consist of mortgage loans carried at cost, net of unamortized discounts. Discounts are amortized over the estimated lives of the loans using the interest method. Interest income on loans held-for-sale is recognized as earned over the term of the mortgage loans based on the contractual interest rates.
The segment also provides an allowance for loan losses. The provision recorded and the adequacy of the related allowance is determined by the Company’s management’s continuing evaluation of the loan portfolio in light of past loan loss experience, credit worthiness and nature of underlying collateral, present economic conditions and other factors considered relevant by the Company’s management. Anticipated changes in economic factors, which may influence the level of the allowance, are considered in the evaluation by the Company’s management when the likelihood of the changes can be reasonably determined. While the Company’s management uses the best information available to make such evaluations, future adjustments to the allowance may be necessary as a result of future economic and other conditions that may be beyond management’s control.
New Accounting Pronouncements
In June 2006, the FASB issued Interpretation No. 48,Accounting for Uncertainty in Income Taxes-an interpretation of SFAS 109,(“FIN 48”). FIN 48 provides interpretive guidance for the financial statement recognition and measurement of a tax position taken or expected to be taken in a tax return. FIN 48 is effective for fiscal years beginning after December 15, 2006 (the Company’s fiscal year beginning December 1, 2007). The Company is currently reviewing the effect of this Interpretation on its consolidated financial statements.
In September 2006, the FASB issued SFAS No. 157,Fair Value Measurements, (“SFAS 157”). SFAS 157 defines fair value, establishes a framework for measuring fair value in generally accepted accounting principles and expands disclosures about fair value measurements. SFAS 157 iswas effective for the Company’s financial statements issued for fiscal years beginning after November 15, 2007 (the Company’s fiscal year beginningassets and liabilities on December 1, 2007),2007. The FASB deferred the provisions of SFAS 157 relating to nonfinancial assets and interim periods within those fiscal years.liabilities; implementation by the Company is now required on December 1, 2008. SFAS 157 has not and is not expected to materially affect how the Company determines fair value.value, but has resulted and will result in certain additional disclosures (see Note 15).
55In December 2007, the FASB issued SFAS No. 141 (revised 2007),Business Combinations, (“SFAS 141R”). SFAS 141R broadens the guidance of SFAS 141, extending its applicability to all transactions and other events in which one entity obtains control over one or more other businesses. It broadens the fair value measurement and recognition of assets acquired, liabilities assumed and interests transferred as a result of business combinations. SFAS 141R expands on required disclosures to improve the statement users’ abilities to evaluate the nature and financial effects of business combinations. SFAS 141R is effective for business combinations that close on or after December 1, 2009. The Company does not expect the adoption of SFAS 141R to have a material effect on its consolidated financial statements.
In December 2007, the FASB issued SFAS No. 160,Noncontrolling Interests in Consolidated Financial Statements—an amendment of ARB No. 51, (“SFAS 160”). SFAS 160 requires that a noncontrolling interest in a subsidiary be reported as equity and the amount of consolidated net income specifically attributable to the noncontrolling interest be identified in the consolidated financial statements. It also calls for consistency in the manner of reporting changes in the parent’s ownership interest in a subsidiary and requires fair value
LENNAR CORPORATION AND SUBSIDIARIES
NOTES TO CONSOLIDATED FINANCIAL STATEMENTS—(Continued)
In September 2006, the Securities and Exchange Commission (“SEC”) Staff issued Staff Accounting Bulletin 108,Considering the Effectsmeasurement of Prior Year Misstatements when Quantifying Misstatementsany noncontrolling equity investment retained in Current Year Financial Statements, (“SAB 108”). SAB 108 addresses how the effects of prior year uncorrected financial statement misstatements should be considered in current year financial statements. SAB 108 requires registrants to quantify misstatements using both balance sheet and income statement approaches and to evaluate whether either approach results in quantifying an error that is material in light of relative quantitative and qualitative factors. SAB 108a deconsolidation. SFAS 160 is effective for annual financial statements covering the first fiscal year ending after November 15, 2006 (the Company’s fiscal year ended November 30, 2006)beginning December 1, 2009. The Company is evaluating the impact the adoption of SFAS 160 will have on its consolidated financial statements.
In March 2008, the FASB issued SFAS No. 161,Disclosures About Derivative Instruments and Hedging Activities—an amendment of FASB Statement No. 133, (“SFAS 161”). SAB 108 didSFAS 161 expands the disclosure requirements in SFAS 133 regarding an entity’s derivative instruments and hedging activities. SFAS 161 is effective for the Company’s fiscal year beginning December 1, 2008. The Company does not expect the adoption of SFAS 161 to have ana material effect on the Company’sits consolidated financial statements.
In November 2006,December 2008, the FASB issued Emerging Issues Task Force Issue No. 06-8,FASB Staff Position (“FSP”) FAS 140-4 and FIN 46(R)-8,ApplicabilityDisclosure by Public Entities (Enterprises) About Transfers of Financial Assets and Interests in Variable Interest Entities. The purpose of the Assessment of a Buyers Continuing Investment underFSP is to promptly improve disclosures by public companies until the pending amendments to FASB Statement No. 66, 140,Accounting for SalesTransfers and Servicing of Real Estate, for SalesFinancial Assets and Extinguishment of Condominiums,Liabilities(“EITF 06-8”, (“SFAS 140”). EITF 06-8 establishes that a company should evaluate, and FIN 46R, are finalized and approved by the adequacy of the buyer’sFASB. The FSP amends SFAS 140 to require public companies to provide additional disclosures about transferor’s continuing investment in determining whetherinvolvement with transferred financial assets. It also amends FIN 46R by requiring public companies to recognize profit under the percentage-of-completion method. EITF 06-8provide additional disclosures regarding their involvement with variable interest entities. This FSP is effective for the first annual reporting period beginning after March 15, 2007 (the Company’s fiscal year beginning December 1, 2007).2008. The FSP will not have a material effect of this EITF is not expected to be material toon the Company’s consolidated financial statements.
Reclassifications
Certain prior year amounts in the consolidated financial statements have been reclassified to conform with the 20062008 presentation. These reclassifications had no impact on reported net earnings.
2. Discontinued Operations
In May 2005, the Company sold North American Exchange Company (“NAEC”), a subsidiary of the Financial Services segment’s title company, which generated a $15.8 million pretax gain. NAEC’s revenues were $3.3 million and $3.9 million, respectively, for the years ended November 30, 2005 and 2004. As of November 30, 2005, there were no remaining assets or liabilities of discontinued operations.
3. Acquisitions
During 2006, the Company did not have any material acquisitions. During 2005, the Company expanded its presence through homebuilding acquisitions in all of its homebuilding segments and Homebuilding Other. In connection with these acquisitions and contingent consideration related to prior period acquisitions, the Company paid $416.0 million. The results of operations of these acquisitions are included in the Company’s results of operations since their respective acquisition dates. The pro forma effect of these acquisitions on the results of operations is not presented as the effect is not material. Total goodwill associated with these acquisitions and contingent consideration related to acquisitions prior to 2005 was $13.8 million.
During 2004, the Company expanded its presence through homebuilding acquisitions in all of its homebuilding segments, expanded its mortgage operations in Oregon and Washington and expanded its title and closing business into Minnesota through the acquisition of Title Protection, Inc. In connection with these acquisitions and contingent consideration related to prior period acquisitions, the Company paid $105.7 million, net of cash acquired. The results of operations of these acquisitions are included in the Company’s results of operations since their respective acquisition dates. The pro forma effect of these acquisitions on the results of operations is not presented as the effect is not material. Total goodwill associated with these acquisitions and contingent consideration related to acquisitions prior to 2004 was $26.7 million.operations.
4.2. Operating and Reporting Segments
The Company’s operating segments are aggregated into reportable segments in accordance with SFAS No. 131,Disclosures About Segments of an Enterprise and Related Information(“SFAS 131”), based primarily upon similar economic characteristics, geography and product type. The Company’s reportable segments consist of:
(1) Homebuilding East (2) Homebuilding Central (3) Homebuilding West (4) Homebuilding Houston (5) Financial Services |
56
LENNAR CORPORATION AND SUBSIDIARIES
NOTES TO CONSOLIDATED FINANCIAL STATEMENTS—(Continued)Due to the consolidation of many of the Company’s operating divisions as well as the performance of its Houston Homebuilding division, Houston currently meets the reportable segment criteria set forth in SFAS 131. Therefore, the Company has changed its segment presentation to include Homebuilding Houston as a reportable segment. Currently, the Company’s homebuilding operating segments are aggregated into four reportable segments, which include Homebuilding East, Homebuilding Central, Homebuilding West and Homebuilding Houston. Previously, the Company presented only three homebuilding reportable segments, which included Homebuilding East, Homebuilding Central and Homebuilding West. All prior year segment information has been restated to conform to the fiscal 2008 presentation. The change in reportable segments has no effect on the Company’s consolidated financial position, results of operations or cash flows for the periods presented.
Information about homebuilding activities in states which our homebuilding activities are not economically similar to other states in the same geographic area is grouped under “Homebuilding Other,” which is not considered a reportable segment in accordance with SFAS 131.
LENNAR CORPORATION AND SUBSIDIARIES
NOTES TO CONSOLIDATED FINANCIAL STATEMENTS—(Continued)
Operations of the Company’s homebuilding segments primarily include the saleconstruction and constructionsale of single-family attached and detached homes, and to a lesser extent, multi-level residential buildings, as well as the purchase, development and sale of residential land directly and through the Company’s unconsolidated entities. The Company’s revised reportable homebuilding segments, and all other homebuilding operations not required to be reported separately, have divisionsoperations located in the following states:in:
East:Florida, Maryland, New Jersey and Virginia
Central:Arizona, Colorado and Texas (1)
West:California and Nevada
Houston: Houston, Texas
Other:Illinois, Minnesota, New York, North Carolina and South Carolina
| (1) | Texas in the Central reportable segment excludes Houston, Texas, which is its own reportable segment. |
Operations of the Financial Services segment include mortgage financing, title insurance, closing services and other ancillary services (including personal lines insurance, high-speed Internet and cable television) for both buyers of the Company’s homes and others. Substantially all of the loans the Financial Services segment originated wereoriginates are sold in the secondary mortgage market on a servicing released, non-recourse basis; however,although, the Company remains liable for certain limited representations and warranties related to loan sales. The Financial Services segment operates generally in the same states as the Company’s homebuilding segments,operations, as well as other states.
Evaluation of segment performance is based primarily on operating earnings from continuing operations(loss) before provision(provision) benefit for income taxes. Operating earnings (loss) for the homebuilding segments consist of revenues generated from the sales of homes and land, gain on recapitalization of unconsolidated entity, equity in earnings (loss) from unconsolidated entities, and management fees and other income (expense), net and minority interest income (expense), net, less the cost of homes and land sold and selling, general and administrative expenses and minority interest expense, net. Operating earningsexpenses. Homebuilding operating loss for the year ended November 30, 2008 includes the following:
SFAS 144 valuation adjustments to finished homes, construction in progress (“CIP”) and land on which the Company intends to build homes,
SFAS 144 valuation adjustments to land the Company intends to sell or has sold to third parties,
Write-offs of option deposits and pre-acquisition costs related to land under option that the Company does not intend to purchase,
SFAS 144 valuation adjustments related to assets of unconsolidated entities in which the Company has investments, recorded in equity in earnings (loss) from unconsolidated entities, and
APB 18 valuation adjustments to the Company’s investments in unconsolidated entities and write-offs of certain notes receivable, recorded in management fees and other income (expense), net.
Financial Services segmentoperating earnings (loss) consist of revenues generated from mortgage financing, title insurance, closing services and other ancillary services (including personal lines insurance, high-speed Internet and cable television) less the cost of such services, and certain selling, general and administrative expenses incurred by the Financial Services segment.segment and goodwill impairments. Financial Services operating earnings for the year ended November 30, 2008 includes a write-off of a portion of the Financial Services segment’s goodwill.
Each reportable segment follows the same accounting policies described in Note 1—“Summary of Significant Accounting Policies” to the consolidated financial statements. Operational results of each segment are not necessarily indicative of the results that would have occurred had the segment been an independent, stand-alone entity during the periods presented.
57
LENNAR CORPORATION AND SUBSIDIARIES
NOTES TO CONSOLIDATED FINANCIAL STATEMENTS—(Continued)
Financial information relating to the Company’s operations was as follows:
| November 30, | November 30, | ||||||||||||||
| 2006 | 2005 | 2008 | 2007 | 2006 | |||||||||||
| (In thousands) | (In thousands) | ||||||||||||||
Assets: | |||||||||||||||
Homebuilding East | $ | 3,326,371 | 3,454,318 | $ | 1,588,299 | 1,630,086 | 3,326,371 | ||||||||
Homebuilding Central | 1,651,848 | 1,682,593 | 774,412 | 809,128 | 1,320,320 | ||||||||||
Homebuilding West | 3,972,562 | 4,187,525 | 2,022,787 | 2,477,661 | 3,972,562 | ||||||||||
Homebuilding Houston | 267,628 | 267,893 | 331,528 | ||||||||||||
Homebuilding Other | 1,164,304 | 1,131,146 | 849,726 | 708,266 | 1,164,304 | ||||||||||
Financial Services | 1,613,376 | 1,701,635 | 607,978 | 1,037,809 | 1,613,376 | ||||||||||
Corporate and unallocated | 679,805 | 384,008 | 1,314,068 | 2,171,904 | 679,805 | ||||||||||
Total assets | $ | 12,408,266 | 12,541,225 | $ | 7,424,898 | 9,102,747 | 12,408,266 | ||||||||
Investments in unconsolidated entities: | |||||||||||||||
Homebuilding East | $ | 241,490 | 240,210 | $ | 94,897 | 166,839 | 241,490 | ||||||||
Homebuilding Central | 180,768 | 170,791 | 178,618 | 181,816 | 155,643 | ||||||||||
Homebuilding West | 974,404 | 814,129 | 451,719 | 515,548 | 974,404 | ||||||||||
Homebuilding Houston | 21,820 | 29,797 | 25,125 | ||||||||||||
Homebuilding Other | 50,516 | 57,556 | 19,698 | 40,271 | 50,516 | ||||||||||
Total investments in unconsolidated entities | $ | 1,447,178 | 1,282,686 | $ | 766,752 | 934,271 | 1,447,178 | ||||||||
Goodwill: | |||||||||||||||
Homebuilding East | $ | 49,135 | 47,653 | $ | — | — | 49,135 | ||||||||
Homebuilding Central | 31,587 | 31,587 | — | — | 31,587 | ||||||||||
Homebuilding West | 46,640 | 46,640 | — | — | 46,640 | ||||||||||
Homebuilding Other | 69,276 | 69,276 | — | — | 69,276 | ||||||||||
Financial Services | 61,205 | 57,988 | 34,046 | 61,222 | 61,205 | ||||||||||
Total goodwill | $ | 257,843 | 253,144 | $ | 34,046 | 61,222 | 257,843 | ||||||||
| Years Ended November 30, | |||||||||||||||
| 2008 | 2007 | 2006 | |||||||||||||
| (In thousands) | |||||||||||||||
Revenues: | |||||||||||||||
Homebuilding East | $ | 1,275,758 | 2,754,650 | 4,771,879 | |||||||||||
Homebuilding Central | 533,110 | 1,605,839 | 2,629,306 | ||||||||||||
Homebuilding West | 1,440,163 | 3,543,712 | 5,969,512 | ||||||||||||
Homebuilding Houston | 550,853 | 838,250 | 1,019,915 | ||||||||||||
Homebuilding Other | 463,154 | 987,801 | 1,232,428 | ||||||||||||
Financial Services | 312,379 | 456,529 | 643,622 | ||||||||||||
Total revenues (1) | $ | 4,575,417 | 10,186,781 | 16,266,662 | |||||||||||
Operating earnings (loss): | |||||||||||||||
Homebuilding East | $ | (170,207 | ) | (893,159 | ) | 236,654 | |||||||||
Homebuilding Central | (91,177 | ) | (328,583 | ) | 127,999 | ||||||||||
Homebuilding West (2) | (134,917 | ) | (1,478,804 | ) | 639,917 | ||||||||||
Homebuilding Houston | 38,806 | 79,677 | 87,387 | ||||||||||||
Homebuilding Other | (43,291 | ) | (293,130 | ) | (105,804 | ) | |||||||||
Financial Services (3) | (30,990 | ) | 6,120 | 149,803 | |||||||||||
Total operating earnings (loss) | (431,776 | ) | (2,907,879 | ) | 1,135,956 | ||||||||||
Corporate and unallocated | (129,752 | ) | (173,202 | ) | (193,307 | ) | |||||||||
Earnings (loss) before (provision) benefit for income taxes | $ | (561,528 | ) | (3,081,081 | ) | 942,649 | |||||||||
| Years Ended November 30, | ||||||||||
| 2006 | 2005 | 2004 | ||||||||
| (In thousands) | ||||||||||
Revenues: | ||||||||||
Homebuilding East | $ | 4,771,879 | 3,498,983 | 2,746,288 | ||||||
Homebuilding Central | 3,649,221 | 3,374,893 | 2,707,953 | |||||||
Homebuilding West | 5,969,512 | 5,302,767 | 3,657,053 | |||||||
Homebuilding Other | 1,232,428 | 1,127,956 | 889,338 | |||||||
Financial Services | 643,622 | 562,372 | 500,336 | |||||||
Total revenues | $ | 16,266,662 | 13,866,971 | 10,500,968 | ||||||
Operating earnings (loss): | ||||||||||
Homebuilding East | $ | 236,654 | 641,264 | 454,740 | ||||||
Homebuilding Central | 215,386 | 368,476 | 217,519 | |||||||
Homebuilding West | 639,917 | 1,214,149 | 782,122 | |||||||
Homebuilding Other | (105,804 | ) | 53,202 | 94,107 | ||||||
Financial Services | 149,803 | 104,768 | 110,731 | |||||||
Corporate and unallocated (1) | (193,307 | ) | (222,165 | ) | (141,722 | ) | ||||
Earnings from continuing operations before provision for income taxes | $ | 942,649 | 2,159,694 | 1,517,497 | ||||||
| (1) |
| (2) | Includes $133.1 million and |
| (3) | Includes a $17.7 million pretax gain for the year ended November 30, 2006 from monetizing the Financial Services segment’s personal lines insurance policies. |
During the year ended November 30, 2006, the Company recorded $501.8 million of inventory valuation adjustments, which included $280.5 million of homebuilding inventory valuation adjustments ($157.0 million, $27.1 million, $79.0 million and $17.4 million, respectively, in the Company’s Homebuilding East, Central and
58
LENNAR CORPORATION AND SUBSIDIARIES
NOTES TO CONSOLIDATED FINANCIAL STATEMENTS—(Continued)
West segmentsValuation adjustments and Homebuilding Other), $152.2 millionwrite-offs relating to the Company’s operations were as follows:
| Years Ended November 30, | |||||||
| 2008 | 2007 | 2006 | |||||
| (In thousands) | |||||||
SFAS 144 valuation adjustments to finished homes, CIP and land on which the Company intends to build homes: | |||||||
East | $ | 76,791 | 279,064 | 155,749 | |||
Central | 28,142 | 91,354 | 27,138 | ||||
West | 75,614 | 331,827 | 80,207 | ||||
Houston | 2,262 | 2,836 | — | ||||
Other | 12,709 | 42,762 | 17,375 | ||||
Total | 195,518 | 747,843 | 280,469 | ||||
SFAS 144 valuation adjustments to land the Company intends to sell or has sold to third parties: | |||||||
East | 23,251 | 307,534 | 24,702 | ||||
Central | 12,369 | 79,101 | 16,327 | ||||
West | 11,094 | 648,628 | — | ||||
Houston | 137 | 1,762 | 991 | ||||
Other | 940 | 130,269 | 27,057 | ||||
Total | 47,791 | 1,167,294 | 69,077 | ||||
Write-offs of option deposits and pre-acquisition costs: | |||||||
East | 18,989 | 119,645 | 80,483 | ||||
Central | 6,024 | 56,304 | 2,470 | ||||
West | 62,447 | 310,795 | 44,000 | ||||
Houston | 745 | 813 | 481 | ||||
Other | 8,967 | 42,424 | 24,806 | ||||
Total | 97,172 | 529,981 | 152,240 | ||||
Company’s share of SFAS 144 valuation adjustments related to assets of unconsolidated entities: | |||||||
East | 7,241 | 55,157 | 25,484 | ||||
Central | 1,732 | 29,585 | — | ||||
West | 22,675 | 273,679 | 92,776 | ||||
Houston | — | — | — | ||||
Other | 597 | 5,741 | 8,177 | ||||
Total | 32,245 | 364,162 | 126,437 | ||||
APB 18 valuation adjustments to investments in unconsolidated entities: | |||||||
East | 54,340 | 42,200 | — | ||||
Central | 11,197 | 14,552 | — | ||||
West | 90,193 | 68,883 | 12,165 | ||||
Houston | — | — | — | ||||
Other | 17,060 | 6,571 | 2,305 | ||||
Total | 172,790 | 132,206 | 14,470 | ||||
Write-offs of notes receivable: | |||||||
East | 10,200 | — | — | ||||
Central | — | — | — | ||||
West | 10,222 | — | — | ||||
Houston | — | — | — | ||||
Other | 4,596 | — | — | ||||
Total | 25,018 | — | — | ||||
Goodwill impairments: | |||||||
East | — | 46,274 | — | ||||
Central | — | 31,293 | — | ||||
West | — | 43,955 | — | ||||
Houston | — | — | — | ||||
Other | — | 68,676 | — | ||||
Total | — | 190,198 | — | ||||
Financial Services write-offs of notes receivable | — | 28,426 | 2,713 | ||||
Financial Services goodwill impairments | 27,176 | — | — | ||||
Total valuation adjustments and write-offs of option deposits and pre-acquisition costs, goodwill and notes receivable | $ | 597,710 | 3,160,110 | 645,406 | |||
LENNAR CORPORATION AND SUBSIDIARIES
NOTES TO CONSOLIDATED FINANCIAL STATEMENTS—(Continued)
During 2008, market conditions continued to deteriorate in the homebuilding industry. The existing market conditions combined with a high number of foreclosures, weakened consumer confidence and reduced credit availability in the financial markets have resulted in an increase in the supply of new and existing homes for sale, as well as intensified competitive pressures to sell those homes. These market conditions, together with a deceleration in sales pace, have resulted in lower home sales prices, higher than historical sales incentives, and led to valuation adjustments and write-offs.
Further deterioration in the homebuilding market may cause additional pricing pressures and slower absorption, which may lead to additional valuation adjustments and write-offs in the future. In addition, market conditions may cause the Company to re-evaluate its strategy regarding certain assets that could result in further valuation adjustments and/or additional write-offs of option deposits and pre-acquisition costs ($80.5 million, $2.9 million, $44.0 million and $24.8 million, respectively, indue to the Company’s Homebuilding East, Central and West segments and Homebuilding Other) related to 24,235 homesites underabandonment of those option that the Company does not intend to purchase and $69.1 million of land inventory valuation adjustments ($24.7 million, $17.3 million and $27.1 million, respectively, in the Company’s Homebuilding East and Central segments and Homebuilding Other). contracts.
| Years Ended November 30, | ||||||||||
| 2008 | 2007 | 2006 | ||||||||
| (In thousands) | ||||||||||
Homebuilding interest expense: | ||||||||||
Homebuilding East | $ | 39,215 | 62,150 | 62,326 | ||||||
Homebuilding Central | 12,990 | 37,417 | 39,156 | |||||||
Homebuilding West | 38,182 | 73,579 | 108,687 | |||||||
Homebuilding Houston | 7,768 | 7,172 | 6,452 | |||||||
Homebuilding Other | 10,944 | 23,382 | 24,445 | |||||||
Corporate and unallocated | 21,258 | — | — | |||||||
Total homebuilding interest expense | $ | 130,357 | 203,700 | 241,066 | ||||||
Financial Services interest income, net | $ | 12,391 | 37,553 | 64,524 | ||||||
Depreciation and amortization: | ||||||||||
Homebuilding East | $ | 4,395 | 10,505 | 7,051 | ||||||
Homebuilding Central | 2,428 | 3,614 | 3,770 | |||||||
Homebuilding West | 14,644 | 24,211 | 19,373 | |||||||
Homebuilding Houston | 1,104 | 1,006 | 1,051 | |||||||
Homebuilding Other | 1,678 | 4,994 | 3,950 | |||||||
Financial Services | 6,095 | 10,143 | 8,594 | |||||||
Corporate and unallocated | 19,492 | 18,137 | 12,698 | |||||||
Total depreciation and amortization | $ | 49,836 | 72,610 | 56,487 | ||||||
Net additions (disposals) to operating properties and equipment: | ||||||||||
Homebuilding East | $ | 40 | (5,391 | ) | 5,073 | |||||
Homebuilding Central | 33 | (127 | ) | 2,198 | ||||||
Homebuilding West | 85 | (2,182 | ) | 4,556 | ||||||
Homebuilding Houston | 20 | 1,715 | 47 | |||||||
Homebuilding Other | (398 | ) | 348 | 2,704 | ||||||
Financial Services | 1,657 | 4,206 | 6,244 | |||||||
Corporate and unallocated | (2,827 | ) | 1,350 | 5,961 | ||||||
Total net additions (disposals) to operating properties and equipment | $ | (1,390 | ) | (81 | ) | 26,783 | ||||
Equity in earnings (loss) from unconsolidated entities: | ||||||||||
Homebuilding East | $ | (31,422 | ) | (58,069 | ) | (14,947 | ) | |||
Homebuilding Central | (1,310 | ) | (25,378 | ) | 7,931 | |||||
Homebuilding West | (25,113 | ) | (274,267 | ) | (6,449 | ) | ||||
Homebuilding Houston | (920 | ) | (752 | ) | (168 | ) | ||||
Homebuilding Other | (391 | ) | (4,433 | ) | 1,097 | |||||
Total equity in earnings (loss) from unconsolidated entities | $ | (59,156 | ) | (362,899 | ) | (12,536 | ) | |||
During the yearyears ended November 30, 2006, the Company also recorded $126.4 million of valuation adjustments ($25.5 million, $92.8 million2008, 2007 and $8.1 million, respectively, in the Company’s Homebuilding East and West segments and Homebuilding Other) to the Company’s investments in unconsolidated entities.
| Years Ended November 30, | ||||||||
| 2006 | 2005 | 2004 | ||||||
| (In thousands) | ||||||||
Homebuilding interest expense: | ||||||||
Homebuilding East | $ | 62,326 | 35,231 | 28,992 | ||||
Homebuilding Central | 45,608 | 41,203 | 34,118 | |||||
Homebuilding West | 108,687 | 91,954 | 58,871 | |||||
Homebuilding Other | 24,445 | 18,766 | 12,212 | |||||
Total homebuilding interest expense | $ | 241,066 | 187,154 | 134,193 | ||||
Financial Services interest income, net | $ | 64,524 | 33,989 | 27,003 | ||||
Depreciation and amortization: | ||||||||
Homebuilding East | $ | 7,051 | 5,241 | 4,250 | ||||
Homebuilding Central | 4,821 | 4,271 | 5,785 | |||||
Homebuilding West | 19,373 | 19,623 | 12,753 | |||||
Homebuilding Other | 3,950 | 3,353 | 2,677 | |||||
Financial Services | 8,594 | 10,346 | 9,725 | |||||
Corporate and unallocated | 12,698 | 22,335 | 20,383 | |||||
Total depreciation and amortization | $ | 56,487 | 65,169 | 55,573 | ||||
Additions to operating properties and equipment: | ||||||||
Homebuilding East | $ | 5,073 | 1,097 | 1,878 | ||||
Homebuilding Central | 2,245 | 1,017 | 534 | |||||
Homebuilding West | 4,556 | 3,540 | 675 | |||||
Homebuilding Other | 2,704 | 556 | 35 | |||||
Financial Services | 6,244 | 10,008 | 19,837 | |||||
Corporate and unallocated | 5,961 | 5,529 | 4,430 | |||||
Total additions to operating properties and equipment | $ | 26,783 | 21,747 | 27,389 | ||||
Equity in earnings (loss) from unconsolidated entities: | ||||||||
Homebuilding East | $ | (14,947 | ) | 2,213 | 3,997 | |||
Homebuilding Central | 7,763 | 15,103 | 4,672 | |||||
Homebuilding West | (6,449 | ) | 109,995 | 82,060 | ||||
Homebuilding Other | 1,097 | 6,503 | 10 | |||||
Total equity in earnings (loss) from unconsolidated entities | $ | (12,536 | ) | 133,814 | 90,739 | |||
During 2006, 2005 and 2004, interest included in the homebuilding segments’ and Homebuilding Other’s cost of homes sold was $207.5$99.3 million, $168.8$168.4 million and $128.0$207.5 million, respectively. During 2006, 2005the years ended November 30, 2008, 2007 and 2004,2006, interest included in the homebuilding segments’ and Homebuilding Other’s cost of land sold was $12.4$3.4 million, $16.5$9.4 million and $5.8$12.4 million, respectively. All other interest related to the homebuilding segments and Homebuilding Other is included in management fees and other income (expense), net.
59
LENNAR CORPORATION AND SUBSIDIARIES
NOTES TO CONSOLIDATED FINANCIAL STATEMENTS—(Continued)
5.3. Receivables
| November 30, | November 30, | |||||||||||||
| 2006 | 2005 | 2008 | 2007 | |||||||||||
| (In thousands) | (In thousands) | |||||||||||||
Accounts receivable | $ | 123,211 | 103,275 | $ | 51,491 | 166,017 | ||||||||
Mortgages and notes receivable | 37,473 | 198,376 | 76,002 | 59,877 | ||||||||||
| 160,684 | 301,651 | 127,493 | 225,894 | |||||||||||
Allowance for doubtful accounts | (1,641 | ) | (2,419 | ) | (32,973 | ) | (18,203 | ) | ||||||
| $ | 159,043 | 299,232 | $ | 94,520 | 207,691 | |||||||||
The Company’s accountsAccounts receivable result primarily from the sale of land. The Company performs ongoing credit evaluations of its customers. The Companycustomers and generally does not require collateral for accounts receivable. Mortgages and notes receivable are generally collateralized by the property sold to the buyer. Allowances are maintained for potential credit losses based on historical experience, present economic conditions and other factors considered relevant by the Company.
6.4. Investments in Unconsolidated Entities
Summarized condensed financial information on a combined 100% basis related to unconsolidated entities in which the Company has investments that are accounted for primarily by the equity method was as follows:
| November 30, | November 30, | |||||||||||
| 2006 | 2005 | |||||||||||
Balance Sheets | 2008 | 2007 | ||||||||||
| (In thousands) | (Dollars in thousands) | |||||||||||
Assets: | ||||||||||||
Cash | $ | 276,501 | 334,530 | |||||||||
Cash and cash equivalents | $ | 135,081 | 301,468 | |||||||||
Inventories | 8,955,567 | 7,615,489 | 7,115,360 | 7,941,835 | ||||||||
Other assets | 868,073 | 875,741 | 541,984 | 827,208 | ||||||||
| $ | 10,100,141 | 8,825,760 | $ | 7,792,425 | 9,070,511 | |||||||
Liabilities and equity: | ||||||||||||
Accounts payable and other liabilities | $ | 1,387,745 | 1,004,940 | $ | 1,042,002 | 1,214,374 | ||||||
Notes and mortgages payable | 5,001,625 | 4,486,271 | ||||||||||
Debt | 4,062,058 | 5,116,670 | ||||||||||
Equity of: | ||||||||||||
The Company | 1,447,178 | 1,282,686 | 766,752 | 934,271 | ||||||||
Others | 2,263,593 | 2,051,863 | 1,921,613 | 1,805,196 | ||||||||
Total equity of unconsolidated entities | 2,688,365 | 2,739,467 | ||||||||||
| $ | 10,100,141 | 8,825,760 | ||||||||||
| $ | 7,792,425 | 9,070,511 | ||||||||||
The Company’s equity in its unconsolidated entities | 29 | % | 34 | % | ||||||||
| Years Ended November 30, | ||||||||
| 2006 | 2005 | 2004 | ||||||
| (In thousands) | ||||||||
Revenues | $ | 2,651,932 | 2,676,628 | 1,641,018 | ||||
Costs and expenses | 2,588,196 | 2,020,470 | 1,199,243 | |||||
Net earnings of unconsolidated entities | $ | 63,736 | 656,158 | 441,775 | ||||
Company’s share of net earnings (loss)—recognized (1) | $ | (12,536 | ) | 133,814 | 90,739 | |||
| Years Ended November 30, | ||||||||||
Statements of Operations | 2008 | 2007 | 2006 | |||||||
| (In thousands) | ||||||||||
Revenues | $ | 862,728 | 2,060,279 | 2,651,932 | ||||||
Costs and expenses | 1,394,601 | 3,075,696 | 2,588,196 | |||||||
Net earnings (loss) of unconsolidated entities | $ | (531,873 | ) | (1,015,417 | ) | 63,736 | ||||
The Company’s share of net loss—recognized (1) | $ | (59,156 | ) | (362,899 | ) | (12,536 | ) | |||
| (1) | For the |
LENNAR CORPORATION AND SUBSIDIARIES
NOTES TO CONSOLIDATED FINANCIAL STATEMENTS—(Continued)
The Company’s partners generally are unrelated homebuilders, land owners/developers and financial or other strategic partners. The unconsolidated entities follow accounting principles generally acceptedthat are in all material respects the United States of America.same as those used by the Company. The Company shares in the profits and losses of these unconsolidated entities generally in accordance with its ownership interests. In many instances, the Company is appointed as the
60
LENNAR CORPORATION AND SUBSIDIARIES
NOTES TO CONSOLIDATED FINANCIAL STATEMENTS—(Continued)
day-to-day manager of the unconsolidated entities and receives management fees and/or reimbursement of expenses for performing this function. During 2006, 2005the years ended November 30, 2008, 2007 and 2004,2006, the Company received management fees and reimbursement of expenses from the unconsolidated entities totaling $72.8$33.3 million, $58.6$52.1 million and $40.6$72.8 million, respectively.
The Company and/or its partners sometimes obtain options or enter into other arrangements under which the Company can purchase portions of the land held by the unconsolidated entities. Option prices are generally negotiated prices that approximate fair value when the Company receives the options. During the years ended November 30, 2008, 2007 and 2006, 2005 and 2004, $742.5$416.2 million, $431.2$977.5 million and $547.6$742.5 million, respectively, of the unconsolidated entities’ revenues were from land sales to the Company. The Company does not include in its equity in earnings (loss) from unconsolidated entities its pro rata share of unconsolidated entities’ earnings resulting from land sales to its homebuilding divisions. Instead, the Company accounts for those earnings as a reduction of the cost of purchasing the land from the unconsolidated entities. This in effect defers recognition of the Company’s share of the unconsolidated entities’ earnings related to these sales until the Company delivers a home and title passes to a third-party homebuyer.
The unconsolidated entities in which the Company has investments usually finance their activities with a combination of partner equity and debt financing. As of November 30, 2006, the Company’s equity in these unconsolidated entities represented 39% of the entities’ total equity. In some instances, the Company and its partners have guaranteed debt of certain unconsolidated entities.
In November 2007, the Company sold a portfolio of land consisting of approximately 11,000 homesites in 32 communities located throughout the country to a strategic land investment venture with Morgan Stanley Real Estate Fund II, L.P., an affiliate of Morgan Stanley & Co., Inc., in which the Company has a 20% ownership interest and 50% voting rights. The Company also manages the land investment venture’s operations and receives fees for its services. As part of the transaction, the Company entered into option agreements and obtained rights of first offer providing the Company the opportunity to purchase certain finished homesites. The Company has no obligation to exercise the options and cannot acquire a majority of the entity’s assets. Due to the Company’s continuing involvement, the transaction did not qualify as a sale by the Company under GAAP; thus, the inventory has remained on the Company’s consolidated balance sheet in consolidated inventory not owned. In 2007, the Company recorded a SFAS 144 valuation adjustment of $740.4 million on the inventory sold to the investment venture. As a result of the transaction, the land investment venture recorded the purchase of the portfolio of land as inventory. As of November 30, 2008, the portfolio of land (including land development costs) of $538.4 million is reflected as inventory in the summarized condensed financial information related to unconsolidated entities in which the Company has investments.
The summary of guaranteesthe Company’s net recourse exposure related to itsthe unconsolidated entities in which the Company has investments was as follows:
| November 30, 2006 | November 30, | ||||||||||
| (In thousands) | 2008 | 2007 | |||||||||
Sole recourse debt | $ | 18,920 | |||||||||
| (In thousands) | |||||||||||
Several recourse debt—repayment | 163,508 | $ | 78,547 | 123,022 | |||||||
Several recourse debt—maintenance | 560,823 | 167,941 | 355,513 | ||||||||
Joint and several recourse debt—repayment | 64,473 | 138,169 | 263,364 | ||||||||
Joint and several recourse debt—maintenance | 956,682 | 123,051 | 291,727 | ||||||||
Land seller debt recourse exposure | 12,170 | — | |||||||||
The Company’s maximum recourse exposure | 1,764,406 | 519,878 | 1,033,626 | ||||||||
Less joint and several reimbursement agreements with the Company’s partners | (661,486 | ) | (127,428 | ) | (238,692 | ) | |||||
The Company’s net recourse exposure | $ | 1,102,920 | $ | 392,450 | 794,934 | ||||||
The maintenance amountsrecourse debt exposure in the table above arerepresent the Company’s maximum recourse exposure ofto loss which assumes thatfrom guarantees and do not take into account the fairunderlying value of the underlying collateral is zero. As of November 30, 2006 and 2005,collateral. During the fair values of the maintenance guarantees and repayment guarantees were not material.year ended
LENNAR CORPORATION AND SUBSIDIARIES
NOTES TO CONSOLIDATED FINANCIAL STATEMENTS—(Continued)
November 30, 2008, the Company reduced its maximum recourse exposure related to unconsolidated joint ventures by $513.7 million.
The Company’s Credit Facility requires the Company to effect quarterly reductions of its maximum recourse exposure related to joint ventures in which it has investments by a total of $200 million by November 30, 2009 of which the Company has already made significant progress. The Company must also effect quarterly reductions during its 2010 fiscal year totaling $180 million and during the first six months of its 2011 fiscal year totaling $80 million. By May 31, 2011, the Company’s maximum recourse exposure related to joint ventures in which it has investments cannot exceed $275 million (See Note 7).
Although the Company, in some instances, guarantees the indebtedness of unconsolidated entities in which it has an investment, the Company’s unconsolidated entities that have recourse debt have significant amount of assets and equity. The summarized balance sheets of the Company’s unconsolidated entities with recourse debt were as follows:
| November 30, | |||||
| 2008 | 2007 | ||||
| (In thousands) | |||||
Assets | $ | 2,846,819 | 3,220,695 | ||
Liabilities | 1,565,148 | 2,311,216 | |||
Equity | 1,281,671 | 909,479 | |||
In addition, the Company and/or its partners occasionally grant liens on their interest in a joint venturesometimes guarantee the obligations of an unconsolidated entity in order to help secure a loan to that joint venture.entity. When the Company and/or its partners provide guarantees, the unconsolidated entity generally receives more favorable terms from its lenders than would otherwise be available to it. In a repayment guarantee, the Company and its venture partners guarantee repayment of a portion or all of the debt in the event of a default before the lender would have to exercise its rights against the collateral. The maintenance guarantees only apply if the value or the collateral (generally land and improvements) is less than a specified percentage of the loan balance. If the Company is required to make a payment under a maintenance guarantee to bring the value of the collateral above the specified percentage of the loan balance, the payment would constitute a capital contribution or loan to the unconsolidated entity and increase the Company’s share of any funds the unconsolidated entity distributes. During 2006,the years ended November 30, 2008 and 2007, amounts paid under the Company’s maintenance guarantees were not material. As$74.0 million and $84.1 million, respectively. In accordance with FASB Interpretation No. 45,Guarantor’s Accounting and Disclosure Requirements for Guarantees, Including Indirect Guarantees of Indebtedness of Others,as of November 30, 2006, if there was2008, the fair values of the maintenance guarantees and repayment guarantees were not material. The Company believes that as of November 30, 2008, in the event it becomes legally obligated to perform under a guarantee of the obligation of an occurrence ofunconsolidated entity due to a triggering event or condition under a guarantee, most of the time the collateral wouldshould be sufficient to repay at least a significant portion of the obligation.obligation or the Company and its partners would contribute additional capital into the venture.
In November 2003,many of the loans to unconsolidated entities, the Company and LNR Property Corporation (“LNR”) each contributedanother entity or entities generally related to the Company’s subsidiary’s joint venture partner(s), have been required to give guarantees of completion to the lenders. Those completion guarantees may require that the guarantors complete the construction of the improvements for which the financing was obtained. If the construction was to be done in phases, very often the guarantee is to complete only the phases as to which construction has already commenced and for which loan proceeds were used. Under many of the completion guarantees, the guarantors are permitted, under certain circumstances, to use undisbursed loan proceeds to satisfy the completion obligations, and in many of those cases, the guarantors pay interest only on those funds, with no repayment of the principal of such funds required.
Indebtedness of an unconsolidated entity is secured by its 50% interests in certainown assets. There is no cross collateralization of its jointly-owneddebt to different unconsolidated entities; however, some unconsolidated entities that had significant assetsown multiple properties and other assets. In connection with a loan to a new limited liability company named LandSource Communities Development LLC (“LandSource”) in exchange for 50% interests in LandSource. In addition, in July 2003,an unconsolidated entity, the Company and LNR formed,its partners often guarantee to a lender either jointly and obtained 50% interestsseverally or on a several basis, any, or all of the following: (i) the completion of the development, in NWHL, whichwhole or in January 2004 purchased The Newhall Landpart, (ii) indemnification of the lender from environmental issues, (iii) indemnification of the lender from “bad boy acts” of the unconsolidated entity (or full recourse liability in the event of unauthorized transfer or bankruptcy) and Farming Company (“Newhall”) for(iv) that the loan to value and/or loan to cost will not exceed a totalcertain percentage (maintenance or remargining guarantee) or that a percentage of approximately $1 billion. Newhall’s primary business is developing two master-planned communities in Los Angeles County, California.
61the outstanding loan will be repaid (repayment guarantee).
LENNAR CORPORATION AND SUBSIDIARIES
NOTES TO CONSOLIDATED FINANCIAL STATEMENTS—(Continued)
LandSource was formed asIn connection with loans to an unconsolidated entity where there is a vehicle to obtain financing based onjoint and several guarantee, the valueCompany generally has a reimbursement agreement with its partner. The reimbursement agreement provides that neither party is responsible for more than its proportionate share of the combined assetsguarantee. However, if the Company’s joint venture partner does not have adequate financial resources to meet its obligations under the reimbursement agreement, the Company may be liable for more than its proportionate share, up to its maximum recourse exposure, which is the full amount covered by the joint and several guarantee.
In certain instances, the Company has placed performance letters of credit and surety bonds with municipalities for its joint ventures.
The total debt of the joint ventureunconsolidated entities thatin which the Company has investments was as follows:
| November 30, | |||||
| 2008 | 2007 | ||||
| (In thousands) | |||||
The Company’s net recourse exposure | $ | 392,450 | 794,934 | ||
Reimbursement agreements from partners | 127,428 | 238,692 | |||
Partner several recourse | 285,519 | 465,641 | |||
Non-recourse land seller debt or other debt | 90,519 | 202,048 | |||
Non-recourse debt with completion guarantee | 820,435 | 1,432,880 | |||
Non-recourse debt without completion guarantee | 2,345,707 | 1,982,475 | |||
Total debt | $ | 4,062,058 | 5,116,670 | ||
LandSource Transactions
In January 2004, an unconsolidated entity of which the Company and LNR each owned 50% acquired The Newhall Land and Farming Company (“Newhall”) for approximately $1 billion, including $200 million the Company contributed and $200 million that LNR contributed (the remainder came from borrowings and sales of properties to LandSource. The Company and LNR used LandSource’s financing capacity, together withLNR). Subsequently, the financing value of Newhall’s assets, to obtain improved financing for part of the purchase price of Newhall and for working capital to be used by the LandSource subsidiaries and Newhall.
The Company and LNR each contributed approximately $200 milliontransferred their interests in most of their joint ventures to NWHL, and LandSource and NWHL jointly obtained $600 million of bank financing, of which $400 million was a term loan used in connection with the acquisition of Newhall (the remainder of the acquisition price was paid with proceeds of a sale of income-producing properties from Newhall to LNR for $217 million at the closing of the transaction). The remainder of the bank financing was a $200 million revolving credit facilityjointly-owned company that is available to finance operations ofhad acquired Newhall, and other property ownership and development companies that are jointly owned by the Company and LNR. The Company agreed to purchase 687 homesites ($132 million at November 30, 2006) and obtained options to purchase an additional 623 homesites from Newhall. The Company is not obligated with regard to the borrowings by LandSource and NWHL, except that the Company and LNR have made limited maintenance guarantees and have committed to complete any property development commitments in the event LandSource or NWHL defaults.
In November 2004, LandSource was merged into NWHL. NWHLcompany was renamed LandSource Communities Development LLC (“Merged LandSource”) upon completion.
In February 2007, the Company’s LandSource joint venture admitted MW Housing Partners as a new strategic partner. As part of the merger.transaction, the joint venture obtained $1.6 billion of non-recourse financing, which consisted of a $200 million five-year Revolving Credit Facility, a $1.1 billion six-year Term Loan B Facility and a $244 million seven-year Second Lien Term Facility. The transaction resulted in a cash distribution from LandSource to the Company of $707.6 million. As a result, the Company’s ownership in LandSource was reduced to 16%. As a result of the recapitalization, the Company recognized a pretax financial statement gain of $175.9 million during the year ended November 30, 2007.
In June 2008, LandSource and a number of its subsidiaries commenced proceedings under Chapter 11 of the Bankruptcy Code in the United States Bankruptcy Court for the District of Delaware. In November 2008, the Company’s land purchase options with LandSource were terminated, thus the Company recognized a deferred profit of $101.3 million (net of $31.8 million of write-offs of option deposits and pre-acquisition costs and other write-offs) related to the 2007 recapitalization of LandSource. The bankruptcy filing could result in LandSource losing some or all of the properties it owns, termination of the Company’s management agreement with LandSource, claims against the Company and LNR may use Mergeda substantial reduction (or total elimination) of the Company’s 16% ownership interest in LandSource, for future joint ventures. The consolidated assets and liabilitieswhich had a carrying value of Merged LandSource were $1.5 billion and $888.8 million, respectively,zero at November 30, 2006 and $1.4 billion and $767.5 million, respectively, at November 30, 2005. The Company’s investment in Merged LandSource was $329.1 million and $332.7 million at November 30, 2006 and 2005, respectively. In December 2006, subsequent to the Company’s fiscal year end, the Company and LNR entered into an agreement to admit a new strategic partner into their Merged LandSource joint venture (See Note 22).2008.
LENNAR CORPORATION AND SUBSIDIARIES
7.NOTES TO CONSOLIDATED FINANCIAL STATEMENTS—(Continued)
The following is summarized financial information related to the LandSource unconsolidated entity. The amounts presented below represent carrying amounts and have not been adjusted for the previously disclosed LandSource bankruptcy. These amounts are included in the summarized condensed financial information presented previously for the unconsolidated entities in which the Company has investments that are accounted for by the equity method.
Balance Sheets | November 30, | ||||||
| 2008 | 2007 | ||||||
| (In thousands) | |||||||
Assets: | |||||||
Cash and cash equivalents | $ | 35,589 | 106,535 | ||||
Inventories | 1,418,971 | 1,502,254 | |||||
Other assets | 326,951 | 354,295 | |||||
| $ | 1,781,511 | 1,963,084 | |||||
Liabilities and equity: | |||||||
Accounts payable and other liabilities | $ | 439,752 | 425,126 | ||||
Debt | 1,371,041 | 1,255,779 | |||||
Equity of: | |||||||
The Company | — | 15,172 | |||||
Others | (29,282 | ) | 267,007 | ||||
Total equity of unconsolidated entities | (29,282 | ) | 282,179 | ||||
| $ | 1,781,511 | 1,963,084 | |||||
The Company’s interest in LandSource | 16 | % | 16 | % | |||
| Years Ended November 30, | ||||||||
Statements of Operations | 2008 | 2007 | 2006 | |||||
| (In thousands) | ||||||||
Revenues | $ | 125,086 | 647,088 | 296,175 | ||||
Costs and expenses | 456,237 | 590,482 | 254,993 | |||||
Net earnings (loss) of LandSource | $ | (331,151 | ) | 56,606 | 41,182 | |||
5. Operating Properties and Equipment
| November 30, | November 30, | |||||||||||||
| 2006 | 2005 | 2008 | 2007 | |||||||||||
| (In thousands) | (In thousands) | |||||||||||||
Operating properties | $ | 13,120 | 12,203 | $ | 1,300 | 6,683 | ||||||||
Leasehold improvements | 33,896 | 22,027 | 30,825 | 33,544 | ||||||||||
Furniture, fixtures and equipment | 45,922 | 37,966 | 31,911 | 36,682 | ||||||||||
| 92,938 | 72,196 | 64,036 | 76,909 | |||||||||||
Accumulated depreciation and amortization | (50,061 | ) | (41,544 | ) | (51,473 | ) | (52,991 | ) | ||||||
| $ | 42,877 | 30,652 | $ | 12,563 | 23,918 | |||||||||
Operating properties and equipment are included in other assets in the consolidated balance sheets.
8. Senior Notes and6. Other Debts PayableAssets
| November 30, | |||||
| 2006 | 2005 | ||||
| (Dollars in thousands) | |||||
7 5/8% senior notes due 2009 | $ | 277,830 | 276,299 | ||
5.125% senior notes due 2010 | 299,766 | 299,715 | |||
5.95% senior notes due 2011 | 249,415 | — | |||
5.95% senior notes due 2013 | 345,719 | 345,203 | |||
5.50% senior notes due 2014 | 247,559 | 247,326 | |||
5.60% senior notes due 2015 | 501,957 | 502,127 | |||
6.50% senior notes due 2016 | 249,683 | — | |||
Senior floating-rate notes due 2007 | — | 200,000 | |||
Senior floating-rate notes due 2009 | 300,000 | 300,000 | |||
5.125% zero-coupon convertible senior subordinated notes due 2021 | — | 157,346 | |||
Mortgage notes on land and other debt | 141,574 | 264,756 | |||
| $ | 2,613,503 | 2,592,772 | |||
Deferred tax assets, net (See Note 9) Other November 30, 2008 2007 (In thousands) — 741,598 99,802 121,554 $ 99,802 863,152
62
LENNAR CORPORATION AND SUBSIDIARIES
NOTES TO CONSOLIDATED FINANCIAL STATEMENTS—(Continued)
In July 2006, the Company replaced its senior unsecured Credit Facility (the “Credit Facility”) with a new7. Senior Notes and Other Debts Payable
| November 30, | |||||
| 2008 | 2007 | ||||
| (Dollars in thousands) | |||||
7 5/8% senior notes due 2009 | $ | 280,976 | 279,491 | ||
5.125% senior notes due 2010 | 299,877 | 299,825 | |||
5.95% senior notes due 2011 | 249,615 | 249,516 | |||
5.95% senior notes due 2013 | 346,851 | 346,268 | |||
5.50% senior notes due 2014 | 248,088 | 247,806 | |||
5.60% senior notes due 2015 | 501,618 | 501,804 | |||
6.50% senior notes due 2016 | 249,733 | 249,708 | |||
Mortgage notes on land and other debt | 368,177 | 121,018 | |||
| $ | 2,544,935 | 2,295,436 | |||
The Company’s senior unsecured revolving credit facility (the “New“Credit Facility”). The New Facility consists of a $2.7$1.1 billion revolving credit facility maturingthat matures in July 2011. The New Facility also includes access to an additional $0.5 billion of financing through an accordion feature, subject to additional commitments, for a maximum aggregate commitmentCompany’s borrowings under the NewCredit Facility are limited by a borrowing base calculation, consisting of $3.2specified percentages of various types of its assets. Under the Credit Facility, the Company is required to maintain a leverage ratio of 55% for the fourth quarter of 2008 and the Company’s 2009 fiscal year and a leverage ratio of 52.5% for its 2010 and 2011 fiscal years. If the Company’s minimum tangible net worth, as defined by the Credit Facility, goes below $1.6 billion, the Company’s Credit Facility would be reduced from $1.1 billion to $0.9 billion. In no event can the Company’s minimum tangible net worth, as defined by the Credit Facility, be less than $1.3 billion. At November 30, 2008, the Company believes it was in compliance with its financial debt covenants.
In addition to other requirements, the Credit Facility limits the Company’s investments in joint ventures and requires the Company to effect quarterly reductions of its maximum recourse exposure related to joint ventures in which the Company’s has investments by a total of $200 million by November 30, 2009 of which the Company has already made significant progress. The NewCompany must also effect quarterly reductions during its 2010 fiscal year totaling $180 million and during the first six months of its 2011 fiscal year totaling $80 million. By May 31, 2011, the Company’s maximum recourse exposure related to joint ventures in which it has investments cannot exceed $275 million.
The Credit Facility is guaranteed by substantially all of the Company’s subsidiaries other than finance company subsidiaries (which include mortgage and title insurance agency subsidiaries).subsidiaries. Interest rates on outstanding borrowings are LIBOR-based, with margins determined based on changes in the Company’s credit ratings, or an alternate base rate, as described in the credit agreement. At both November 30, 2006, the Company had no outstanding balance under the New Facility. At November 30, 2005,2008 and 2007, the Company had no outstanding balance under the Credit Facility.
The Company has a structured letter of credit facility (the “LC Facility”) with a financial institution. The purpose However, at November 30, 2008 and 2007, $275.2 million and $443.5 million, respectively, of the LC Facility is to facilitate the issuance of up to $200 million of letters of credit on a senior unsecured basis. In connection with the LC Facility, the financial institution issued $200 million of their senior notes, which were linked to the Company’s performance on the LC Facility. If there is an event of default under the LC Facility, including the Company’s failure to reimburse a draw against an issued letter of credit, the financial institution would assign its claim against the Company, to the extent of the amount due and payable by the Company under the LC Facility, to its noteholders in lieu of their principal repayment on their performance-linked notes. No material amounts have been drawn to date on any letters of credit issued under the LC Facility.
At November 30, 2006, the Company hadtotal letters of credit outstanding in the amount of $1.4 billion, which includes $190.8 million outstandingdiscussed below, were collateralized against certain borrowings available under the LCCredit Facility.
The majority of theseCompany’s performance letters of credit outstanding were $167.5 million and $390.2 million, respectively, at November 30, 2008 and 2007. The Company’s financial letters of credit outstanding were $278.5 million and $424.2 million, respectively, at November 30, 2008 and 2007. Performance letters of credit are generally posted with regulatory bodies to guarantee the Company’s performance of certain development and construction activities, orand financial letters of credit are generally posted in lieu of cash deposits on option contracts. OfAdditionally, at November 30, 2008, the Company had outstanding performance and surety bonds related to site improvements at various projects (including certain projects in the Company’s total lettersjoint ventures) of credit$1.1 billion. Although significant development and construction activities have been completed related to these site improvements, these bonds are generally not released until all development and construction activities are completed. As of November 30, 2008, there were approximately $444.2 million, or 42%, of costs to complete related to these site improvements. The Company does not presently anticipate any draws upon these bonds, but if any such draws occur, the Company does not believe they would have a material effect on its financial position, results of operations or cash flows.
In June 2007, the Company redeemed its $300 million senior floating-rate notes due 2009. The redemption price was $300.0 million, or 100% of the principal amount of the outstanding $496.9 million were collateralized against certain borrowings available undersenior floating-rate notes due 2009, plus accrued and unpaid interest as of the New Facility.redemption date.
LENNAR CORPORATION AND SUBSIDIARIES
NOTES TO CONSOLIDATED FINANCIAL STATEMENTS—(Continued)
In November 2006, the Company calledredeemed its $200 million senior floating-rate notes due 2007 (the “Floating-Rate Notes”).2007. The redemption price was $200.0 million, or 100% of the principal amount of the Floating-Rate Notes outstanding senior floating-rate notes due 2007, plus accrued and unpaid interest as of the redemption date.
In April 2006, substantially all the outstanding 5.125% zero-coupon convertible senior subordinated notes due 2021 (the “Convertible Notes”) were converted by the noteholders into 4.9 million Class A common shares. The Convertible Notes were convertible at a rate of 14.2 shares of the Company’s Class A common stock per $1,000 principal amount at maturity. Convertible Notes not converted by the noteholders were not material and were redeemed by the Company on April 4, 2006. The redemption price was $468.10 per $1,000 principal amount at maturity, which represented the original issue price plus accrued original issue discount to the redemption date.
In April 2006, the Company issued $250 million of 5.95% senior notes due 2011 and $250 million of 6.50% senior notes due 2016 (collectively, the “New Senior Notes”) at a priceprices of 99.766% and 99.873%, respectively, in a private placement.placement under SEC Rule 144A. Proceeds from the offering of the New Senior Notes, after initial purchaser’s discount and expenses, were $248.7 million and $248.9 million, respectively. The Company added the proceeds to its working capital to be used for general corporate purposes. Interest on the New Senior Notes is due semi-annually. The New Senior Notes are unsecured and unsubordinated, and substantially all of the Company’s subsidiaries other than finance company subsidiaries guarantee the New Senior Notes. In October 2006, the Company completed an exchange of the New Senior Notes for substantially identical notes registered under the Securities Act of 1933 (the “Exchange Notes”), with substantially all of the New Senior Notes being exchanged for Exchange Notes. At November 30, 2006,2008 and 2007, the carrying valueamount of the Exchange Notes was $499.1 million.
In March 2006, the Company initiated a commercial paper program (the “Program”) under which the Company may, from time-to-time, issue short-term unsecured notes in an aggregate amount not to exceed $2.0 billion. This Program has allowed the Company to obtain more favorable short-term borrowing rates than it would obtain otherwise. The Program is exempt from the registration requirements of the Securities Act of 1933. Issuances under the Program are guaranteed by all of the Company’s wholly-owned subsidiaries that are also guarantors of its New Facility. At November 30, 2006, no amounts were outstanding under the Program.
The Company also has an agreement with a financial institution whereby it can enter into short-term, unsecured, fixed-rate notes from time-to-time. At November 30, 2006, no amounts were outstanding related to these notes.
63
LENNAR CORPORATION AND SUBSIDIARIES
NOTES TO CONSOLIDATED FINANCIAL STATEMENTS—(Continued)$499.3 million and $499.2 million, respectively.
In September 2005, the Company sold $300 million of 5.125% senior notes due 2010 (the “5.125% Senior Notes”) at a price of 99.905% in a private placement. Proceeds from the offering, after initial purchaser’s discount and expenses, were $298.2 million. The Company added the proceeds to the Company’s working capital to be used for general corporate purposes. Interest on the 5.125% Senior Notes is due semi-annually. The 5.125% Senior Notes are unsecured and unsubordinated. Substantially all of the Company’s subsidiaries other than finance company subsidiaries guaranteed the 5.125% Senior Notes. In 2006, the Company exchanged the 5.125% Senior Notes for registered notes. The registered notes have substantially identical terms as the 5.125% Senior Notes, except that the registered notes do not include transfer restrictions that are applicable to the 5.125% Senior Notes. At November 30, 20062008 and 2005,2007, the carrying valueamount of the 5.125% Senior Notes was $299.8$299.9 million and $299.7$299.8 million, respectively.
In April 2005, the Company sold $300 million of 5.60% Senior Notes due 2015 (the “Senior Notes”) at a price of 99.771%. Proceeds from the offering, after initial purchaser’s discount and expenses, were $297.5 million. In July 2005, the Company sold $200 million of 5.60% Senior Notes due 2015 (the “Senior Notes”) at a price of 101.407%. The Senior Notes were the same issue as the Senior Notes the Company sold in April 2005. Proceeds from the offering, after initial purchaser’s discount and expenses, were $203.9 million. The Company added the proceeds of both offerings to the Company’sits working capital to be used for general corporate purposes. Interest on the Senior Notes is due semi-annually. The Senior Notes are unsecured and unsubordinated. Substantially all of the Company’s subsidiaries other than finance company subsidiaries guaranteed the Senior Notes. The Senior Notes were subsequently exchanged for identical Senior Notes that had been registered under the Securities Act of 1933. At November 30, 20062008 and 2005,2007, the carrying valueamount of the Senior Notes sold in April and July 2005 was $502.0$501.6 million and $502.1$501.8 million, respectively.
In May 2005, the Company redeemed all of its outstanding 9.95% senior notes due 2010 (the “Notes”). The redemption price was $337.7 million, or 104.975% of the principal amount of the Notes outstanding, plus accrued and unpaid interest as of the redemption date. The redemption of the Notes resulted in a $34.9 million pretax loss.
In April 2005, the Company sold $300 million of 5.60% Senior Notes due 2015 (the “Senior Notes”) at a price of 99.771%. Substitute registered notes were subsequently issued for the April and July 2005 Senior Notes. Proceeds from the offering, after initial purchaser’s discount and expenses, were $297.5 million. The Company added the proceeds to the Company’s working capital to be used for general corporate purposes. Interest on the Senior Notes is due semi-annually. The Senior Notes are unsecured and unsubordinated. Substantially all of the Company’s subsidiaries other than finance company subsidiaries guaranteed the Senior Notes.
In August 2004, the Company sold $250 million of 5.50% senior notes due 2014 (the “5.50% Senior Notes”) at a price of 98.842% in a private placement. Proceeds from the offering, after initial purchaser’s discount and expenses, were $245.5 million. The Company used the proceeds to repay borrowings under its Credit Facility. Interest on the 5.50% senior notesSenior Notes is due semi-annually. The 5.50% senior notes are unsecured and unsubordinated. Substantially all of the Company’s subsidiaries, other than finance company subsidiaries, guaranteed the 5.50% senior notes. At November 30, 2006 and 2005, the carrying value of the 5.50% senior notes was $247.6 million and $247.3 million, respectively.
In March and April 2004, the Company issued a total of $300 million of senior floating-rate notes due 2009 (the “Floating Rate Notes”), in a registered offering, which are callable at par beginning in March 2006. Proceeds from the offerings, after underwriting discount and expenses, were $298.5 million. The Company used the proceeds to partially prepay a portion of the Credit Facilities and added the remainder to the Company’s working capital to be used for general corporate purposes. Interest on the Floating Rate Notes is three-month LIBOR plus 0.75% (6.15% as of November 30, 2006) and is payable quarterly. The Floating RateSenior Notes are unsecured and unsubordinated. Substantially all of the Company’s subsidiaries other than finance company subsidiaries, guaranteed the Floating Rate5.50% Senior Notes. At November 30, 20062008 and 2005,2007, the carrying value of the Floating Rate5.50% Senior Notes was $300.0 million.$248.1 million and $247.8 million, respectively.
In February 2003, the Company issued $350 million of 5.95% senior notes due 2013 at a price of 98.287%. Substantially all of the Company’s subsidiaries other than finance company subsidiaries, guaranteed the 5.95% senior notes. At November 30, 20062008 and 2005,2007, the carrying valueamount of the 5.95% senior notes was $345.7$346.9 million and $345.2$346.3 million, respectively.
In February 1999, the Company issued $282 million of 7 5/8% 5/8% senior notes due 2009. Substantially all of the Company’s subsidiaries other than finance company subsidiaries, guaranteed the 7 5/8% 5/8% senior notes. At November 30, 20062008 and 2005,2007, the carrying valueamount of the 7 5/8% 5/8% senior notes was $277.8$281.0 million and $276.3$279.5 million, respectively.
64
LENNAR CORPORATION AND SUBSIDIARIES
NOTES TO CONSOLIDATED FINANCIAL STATEMENTS—(Continued) During the year ended November 30, 2008, the Company redeemed $0.3 million of the 7 5/8% senior notes.
At November 30, 2006,2008, the Company had mortgage notes on land and other debt bearing interest at rates up to 10.0% with an average interest rate of 6.1%. The notes are2.6% and due at various dates through 2010 and are collateralized by land.2013. At November 30, 20062008 and 2005,2007, the carrying valueamount of the mortgage notes on land and other debt was $141.6$368.2 million and $264.8$121.0 million, respectively.
LENNAR CORPORATION AND SUBSIDIARIES
NOTES TO CONSOLIDATED FINANCIAL STATEMENTS—(Continued)
The minimum aggregate principal maturities of senior notes and other debts payable during the five years subsequent to November 30, 20062008 and thereafter are as follows:
| Debt Maturities | |||
| (In thousands) | |||
2007 | $ | 87,298 | |
2008 | 35,949 | ||
2009 | 577,991 | ||
2010 | 317,932 | ||
2011 | 249,415 | ||
The remaining principal obligations are due subsequent to November 30, 2011. The Company’s debt arrangements contain certain financial covenants with which the Company was in compliance at November 30, 2006.
| Debt Maturities | |||
| (In thousands) | |||
2009 | $ | 427,542 | |
2010 | 458,267 | ||
2011 | 272,249 | ||
2012 | — | ||
2013 | 387,438 | ||
Thereafter | 999,439 | ||
9. Other Liabilities
| November 30, | |||||
| 2006 | 2005 | ||||
| (In thousands) | |||||
Income taxes currently payable | $ | 40,259 | 463,588 | ||
Accrued compensation | 302,038 | 396,614 | |||
Other | 1,248,267 | 1,137,622 | |||
| $ | 1,590,564 | 1,997,824 | |||
10.8. Financial Services Segment
The assets and liabilities related to the Financial Services segment were as follows:
| November 30, | November 30, | |||||||||
| 2006 | 2005 | 2008 | 2007 | |||||||
| (In thousands) | (In thousands) | |||||||||
Assets: | ||||||||||
Cash | $ | 116,657 | 149,786 | |||||||
Receivables, net | 633,004 | 675,877 | ||||||||
Loans held-for-sale, net | 483,704 | 562,510 | ||||||||
Cash and cash equivalents | $ | 111,954 | 152,727 | |||||||
Restricted cash | 21,977 | — | ||||||||
Receivables, net (1) | 133,641 | 280,526 | ||||||||
Loans held-for-sale (2) | 190,056 | 293,499 | ||||||||
Loans held-for-investment, net | 189,638 | 147,459 | 58,339 | 137,544 | ||||||
Investments held-to-maturity | 59,571 | 32,146 | 19,139 | 61,518 | ||||||
Goodwill | 61,205 | 57,988 | 34,046 | 61,222 | ||||||
Other | 69,597 | 75,869 | ||||||||
Other (3) | 38,826 | 50,773 | ||||||||
| $ | 1,613,376 | 1,701,635 | $ | 607,978 | 1,037,809 | |||||
Liabilities: | ||||||||||
Notes and other debts payable | $ | 1,149,231 | 1,269,782 | $ | 225,783 | 541,437 | ||||
Other | 212,984 | 167,918 | ||||||||
Other (4) | 191,050 | 190,221 | ||||||||
| $ | 1,362,215 | 1,437,700 | $ | 416,833 | 731,658 | |||||
| (1) | Receivables, net, primarily relate to loans shipped to investors that had not yet been funded as of November 30, 2008. |
| (2) | Loans held-for-sale relate to unshipped loans as of November 30, 2008 carried at fair value. |
| (3) | Includes mortgage loan commitments of $4.4 million carried at fair value as of November 30, 2008. |
| (4) | Includes forward contracts of $6.5 million carried at fair value as of November 30, 2008. |
At November 30, 2006,2008, the Financial Services segment had a syndicated warehouse lines of credit totaling $1.4 billionrepurchase facility, which matures in April 2009 ($125 million, plus a $50 million temporary accordion feature that expired in December 2008) and a warehouse repurchase facility, which matures in June 2009 ($150 million). The Financial Services segment uses these facilities to fundfinance its lending activities until the mortgage loan activities.loans are sold to investors and expects both facilities to be renewed or replaced with other facilities when they mature. Borrowings under the lines of credit were $1.1 billion$209.5 million and $1.2 billion,$505.4 million, respectively, at November 30, 20062008 and 20052007 and were collateralized by mortgage loans and receivables on loans
65
LENNAR CORPORATION AND SUBSIDIARIES
NOTES TO CONSOLIDATED FINANCIAL STATEMENTS—(Continued)
sold but not yet funded by investors with outstanding principal balances of $1.3 billion$286.7 million and $540.9 million, respectively, at November 30, 20062008 and 2005. There are several interest rate-pricing options, which fluctuate with market rates.2007. The combined effective interest rate on the warehouse lines of creditfacilities at November 30, 2006 and 20052008 was 6.1% and 5.1%, respectively. The warehouse lines of credit mature in September 2007 ($700 million) and in April 2008 ($670 million), at which time the Company expects the facilities to be renewed. 3.5%.
At November 30, 20062008 and 2005,2007, the Financial Services segment had advances under a different conduit funding agreement with a major financial institution amounting to $1.7totaling $10.8 million and $10.7$11.8 million, respectively. Borrowings under this agreement are collateralized by mortgage loans and had an effective interest rate of 6.2%2.9% and 5.0%5.8%, respectively, at November 30, 20062008 and 2005, respectively. The2007. During 2008, the Financial Services segment also hasentered into a $25 million revolving linenew on going 60-day committed repurchase facility for $75 million. As of credit that matures in May 2007, at which time the segment expects the line of credit to be renewed. The line of credit is collateralized by certain assets of the segment and stock of certain title subsidiaries. Borrowings under the line of credit were $23.7 million and $23.6 million at November 30, 2006 and 2005, respectively, and2008, it had advances under this facility totaling $5.2 million, which had an effective interest rate of 6.3% and 4.9% at November 30, 2006 and 2005, respectively.
11. Income Taxes
The provision (benefit) for income taxes consisted of the following:
From continuing operations | |||||||||
| Years Ended November 30, | |||||||||
| 2006 | 2005 | 2004 | |||||||
| (In thousands) | |||||||||
Current: | |||||||||
Federal | $ | 484,731 | 717,109 | 440,241 | |||||
State | 62,054 | 87,955 | 51,082 | ||||||
| 546,785 | 805,064 | 491,323 | |||||||
Deferred: | |||||||||
Federal | (173,616 | ) | 9,232 | 71,615 | |||||
State | (24,389 | ) | 988 | 9,917 | |||||
| (198,005 | ) | 10,220 | 81,532 | ||||||
| $ | 348,780 | 815,284 | 572,855 | ||||||
From discontinued operations | |||||||||
| Years Ended November 30, | |||||||||
| 2006 | 2005 | 2004 | |||||||
| (In thousands) | |||||||||
Current: | |||||||||
Federal | $ | — | 5,791 | 520 | |||||
State | — | 731 | 66 | ||||||
| — | 6,522 | 586 | |||||||
Deferred: | |||||||||
Federal | — | (5 | ) | 6 | |||||
State | — | (1 | ) | 1 | |||||
| — | (6 | ) | 7 | ||||||
| $ | — | 6,516 | 593 | ||||||
663.7%.
LENNAR CORPORATION AND SUBSIDIARIES
NOTES TO CONSOLIDATED FINANCIAL STATEMENTS—(Continued)
9. Income Taxes
The (provision) benefit for income taxes consisted of the following:
| Years Ended November 30, | ||||||||||
| 2008 | 2007 | 2006 | ||||||||
| (In thousands) | ||||||||||
Current: | ||||||||||
Federal | $ | 249,157 | 715,311 | (484,731 | ) | |||||
State | (24,206 | ) | (14,128 | ) | (62,054 | ) | ||||
| 224,951 | 701,183 | (546,785 | ) | |||||||
Deferred: | ||||||||||
Federal | (646,261 | ) | 282,263 | 173,616 | ||||||
State | (126,247 | ) | 156,554 | 24,389 | ||||||
| (772,508 | ) | 438,817 | 198,005 | |||||||
| $ | (547,557 | ) | 1,140,000 | (348,780 | ) | |||||
Deferred income taxes reflect the net tax effects of temporary differences between the carrying amounts of the assets and liabilities for financial reporting purposes and the amounts used for income tax purposes. The tax effects of significant temporary differences that give rise to the net deferred tax asset wereare as follows:
| November 30, | November 30, | ||||||||||
| 2006 | 2005 | 2008 | 2007 | ||||||||
| (In thousands) | (In thousands) | ||||||||||
Deferred tax assets: | |||||||||||
Inventory valuation adjustments | $ | 239,854 | 380,491 | ||||||||
Reserves and accruals | $ | 227,045 | 235,744 | 83,911 | 160,071 | ||||||
Inventory valuation adjustments | 208,433 | — | |||||||||
Net operating loss carryforward | 217,040 | 126,649 | |||||||||
Capitalized expenses | 139,695 | 83,727 | 44,436 | 84,261 | |||||||
Investments in unconsolidated entities | 18,456 | 35,508 | 36,614 | 33,699 | |||||||
Goodwill | 26,383 | 30,011 | |||||||||
Alternative minimum tax credits | 65,307 | — | |||||||||
Other | 65,227 | 26,463 | 68,681 | 19,594 | |||||||
Total deferred tax assets | 658,856 | 381,442 | 782,226 | 834,776 | |||||||
Valuation allowance | (730,836 | ) | — | ||||||||
Total deferred tax assets after valuation allowance | 51,390 | 834,776 | |||||||||
Deferred tax liabilities: | |||||||||||
Capitalized expenses | 12,556 | — | |||||||||
Completed contract reporting differences | 235,742 | 190,795 | — | 54,732 | |||||||
Section 461(f) deductions | 34,960 | 34,960 | |||||||||
Other | 80,954 | 44,592 | 38,834 | 33,186 | |||||||
Total deferred tax liabilities | 351,656 | 270,347 | 51,390 | 87,918 | |||||||
Net deferred tax asset | $ | 307,200 | 111,095 | $ | — | 746,858 | |||||
As a result of the valuation allowance against the Company’s net deferred tax assets, at November 30, 2008, the Company’s Homebuilding operations and the Financial Services segment did not have net deferred tax assets. At November 30, 2006 and 2005, the2007, Homebuilding segmentsoperations had a net deferred tax asset of $300.2assets totaling $741.6 million, and $104.5 million, respectively, which iswere included in other assets in the consolidated balance sheets.
At November 30, 2006 and 2005,2007, the Financial Services segment had a net deferred tax assetassets of $7.0$5.3 million, and $6.6 million, respectively, which iswere included in the other assets of the Financial Services segment.
LENNAR CORPORATION AND SUBSIDIARIES
NOTES TO CONSOLIDATED FINANCIAL STATEMENTS—(Continued)
SFAS 109 requires a reduction of the reductioncarrying amounts of deferred tax assets by a valuation allowance, if based on the weight of available evidence, it is more likely than not that such assets will not be realized. Accordingly, the need to establish valuation allowances for deferred tax assets is assessed periodically based on the SFAS 109 more-likely-than-not realization threshold criterion. In the assessment for a portion orvaluation allowance, appropriate consideration is given to all positive and negative evidence related to the realization of the deferred tax asset willassets. This assessment considers, among other matters, the nature, frequency and severity of current and cumulative losses, forecasts of future profitability, the duration of statutory carryforward periods, the Company’s experience with loss carryforwards not expiring unused and tax planning alternatives.
Based upon an evaluation of all available evidence, the Company established a valuation allowance against its deferred tax assets totaling $730.8 million during the fourth quarter of 2008. The Company’s cumulative loss position over the evaluation period and the current uncertain and volatile market conditions were significant negative evidence in assessing the need for a valuation allowance. In future periods, the allowance could be realized. Basedreduced based on management’s assessment,sufficient evidence indicating that it is more likely than not that a portion of the netCompany’s deferred tax assetassets will be realized through future taxable earnings.realized.
The American Jobs Creation Act of 2004 providedprovides a tax deduction on qualified domestic production activities under Internal Revenue Code Section 199. The tax benefit resulting from this deduction resulted in a 0.75% reductionis reflected in the effective tax rate for the year ended November 30, 2006. However, the Company did not recognize any benefit for the years ended November 30, 2007 and 2008 as a result of its pretax loss. In addition, a substantial portion of the November 30, 2006 tax benefit was reduced due to the carry back of the Company’s current and prior year pretax losses.
A reconciliation of the statutory rate and the effective tax rate was as follows:
| Percentage of Pretax Earnings | Percentage of Pretax Income (Loss) | |||||||||||||||||
| 2006 | 2005 | 2004 | 2008 | 2007 | 2006 | |||||||||||||
Statutory rate | 35.00 | % | 35.00 | % | 35.00 | % | 35.00 | % | 35.00 | % | 35.00 | % | ||||||
State income taxes, net of federal income tax benefit | 2.75 | % | 2.75 | % | 2.75 | % | 3.09 | 3.00 | 2.75 | |||||||||
Internal Revenue Code Section 199 benefit | (0.75 | )% | — | — | ||||||||||||||
Internal Revenue Code Section 199 impact | (0.29 | ) | (0.30 | ) | (0.75 | ) | ||||||||||||
Goodwill impairments and other | (1.60 | ) | (0.70 | ) | — | |||||||||||||
FIN 48 tax reserves and interest expense | (3.56 | ) | — | — | ||||||||||||||
Deferred tax asset valuation allowance | (130.15 | ) | — | — | ||||||||||||||
Effective rate | 37.00 | % | 37.75 | % | 37.75 | % | (97.51 | )% | 37.00 | % | 37.00 | % | ||||||
67Effective December 1, 2007, the Company adopted FIN 48, which provides interpretative guidance for the financial statement recognition and measurement of a tax position taken or expected to be taken in a tax return. As a result of the implementation of FIN 48, the Company recorded a $24.7 million cumulative-effect charge to its retained earnings on December 1, 2007. At the date of the adoption, the Company had $88.6 million of gross unrecognized tax benefits.
The following table summarizes the changes in gross unrecognized tax benefits from December 1, 2007 through November 30, 2008:
| November 30, 2008 | ||||
| (In thousands) | ||||
Gross unrecognized tax benefits, beginning of year | $ | 88,560 | ||
Decreases of prior year items | (2,605 | ) | ||
Increases of prior year items due to changes in tax law | 14,213 | |||
Gross unrecognized tax benefits, end of year | $ | 100,168 | ||
At November 30, 2008, the Company had $100.2 million of gross unrecognized tax benefits. If the Company were to recognize these tax benefits, $25.4 million would affect the Company’s effective tax rate.
LENNAR CORPORATION AND SUBSIDIARIES
NOTES TO CONSOLIDATED FINANCIAL STATEMENTS—(Continued)
The Company expects the total amount of unrecognized tax benefits to decrease by $62.0 million within twelve months as a result of the settlement of certain tax accounting items with the IRS with respect to the prior examination cycle that carried over to the current years under examination, and as a result of the conclusion of examinations with a number of state taxing authorities. The majority of these items were previously recorded as deferred tax liabilities and the settlement will not affect the Company’s tax rate.
Effective with the Company’s adoption of FIN 48, interest and penalties related to unrecognized tax benefits are now recognized in the financial statements as a component of (provision) benefit for income taxes. Interest and penalties related to unrecognized tax benefits were previously recorded in management fees and other income (expense), net in the Company’s statements of operations. At November 30, 2008, the Company had $33.5 million accrued for interest and penalties, of which $16.1 million was recorded during the year ended November 30, 2008 in accordance with FIN 48.
The IRS is currently examining the Company’s federal income tax returns for fiscal years 2005, 2006, 2007 and 2008 and certain state taxing authorities are examining various fiscal years. The final outcome of these examinations is not yet determinable. The statute of limitations for the Company’s major tax jurisdictions remains open for examination for fiscal years 2002 through 2007. For the 2008 tax year, the Company has been invited by the IRS to participate in a new examination program, Compliance Assurance Process “CAP”. This program operates as a contemporaneous exam throughout the year in order to keep exam cycles current and achieve a higher level of compliance.
12.At November 30, 2007, the Company had $6.8 million of reserves recorded in accordance with SFAS No. 5,Accounting for Contingencies, for income tax filing positions and related interest. This reserve was included in other liabilities in the consolidated balance sheets.
10. Earnings (Loss) Per Share
Basic and diluted earnings (loss) per share for the years ended November 30, 2006, 2005 and 2004 were calculated as follows:
| 2006 | 2005 | 2004 | |||||
(In thousands, except per share amounts) | |||||||
Numerator—Basic earnings per share: | |||||||
Earnings from continuing operations | $ | 593,869 | 1,344,410 | 944,642 | |||
Earnings from discontinued operations | — | 10,745 | 977 | ||||
Numerator for basic earnings per share—net earnings | $ | 593,869 | 1,355,155 | 945,619 | |||
Numerator—Diluted earnings per share: | |||||||
Earnings from continuing operations | $ | 593,869 | 1,344,410 | 944,642 | |||
Interest on 5.125% zero-coupon convertible senior subordinated notes due 2021, net of tax | 1,565 | 7,699 | 8,557 | ||||
Numerator for diluted earnings per share from continuing operations | 595,434 | 1,352,109 | 953,199 | ||||
Numerator for diluted earnings per share from discontinued operations | — | 10,745 | 977 | ||||
Numerator for diluted earnings per share—net earnings | $ | 595,434 | 1,362,854 | 954,176 | |||
Denominator: | |||||||
Denominator for basic earnings per share—weighted average shares | 158,040 | 155,398 | 155,398 | ||||
Effect of dilutive securities: | |||||||
Employee stock options and nonvested shares | 1,865 | 2,598 | 2,973 | ||||
5.125% zero-coupon convertible senior subordinated notes due 2021 | 1,466 | 7,526 | 8,969 | ||||
Denominator for diluted earnings per share—adjusted weighted average shares and | 161,371 | 165,522 | 167,340 | ||||
Basic earnings per share: | |||||||
Earnings from continuing operations | $ | 3.76 | 8.65 | 6.08 | |||
Earnings from discontinued operations | — | 0.07 | 0.01 | ||||
Net earnings | $ | 3.76 | 8.72 | 6.09 | |||
Diluted earnings per share: | |||||||
Earnings from continuing operations | $ | 3.69 | 8.17 | 5.70 | |||
Earnings from discontinued operations | — | 0.06 | — | ||||
Net earnings | $ | 3.69 | 8.23 | 5.70 | |||
| 2008 | 2007 | 2006 | |||||||
| (In thousands, except per share amounts) | |||||||||
Numerator for basic earnings (loss) per share—net earnings (loss) | $ | (1,109,085 | ) | (1,941,081 | ) | 593,869 | |||
Numerator—Diluted earnings (loss) per share: | |||||||||
Net earnings (loss) | $ | (1,109,085 | ) | (1,941,081 | ) | 593,869 | |||
Interest on 5.125% zero-coupon convertible senior subordinated notes due 2021, net of tax | — | — | 1,565 | ||||||
Numerator for diluted earnings (loss) per share—net earnings (loss) | $ | (1,109,085 | ) | (1,941,081 | ) | 595,434 | |||
Denominator: | |||||||||
Denominator for basic earnings (loss) per share—weighted average shares | 158,395 | 157,718 | 158,040 | ||||||
Effect of dilutive securities: | |||||||||
Employee stock options and nonvested shares | — | — | 1,865 | ||||||
5.125% zero-coupon convertible senior subordinated notes due 2021 | — | — | 1,466 | ||||||
Denominator for diluted earnings (loss) per share—adjusted weighted average shares and assumed conversions | 158,395 | 157,718 | 161,371 | ||||||
Basic earnings (loss) per share | $ | (7.00 | ) | (12.31 | ) | 3.76 | |||
Diluted earnings (loss) per share | $ | (7.00 | ) | (12.31 | ) | 3.69 | |||
Options to purchase 3.17.4 million shares, 4.9 million shares and 1.73.1 million shares, respectively, in total of Class A and Class B common stock were outstanding and anti-dilutive for the years ended November 30, 20062008, 2007 and 2004. For the year ended November 30, 2005, anti-dilutive options outstanding were not material.2006.
LENNAR CORPORATION AND SUBSIDIARIES
NOTES TO CONSOLIDATED FINANCIAL STATEMENTS—(Continued)
In 2001, the Company issued 5.125% zero-coupon convertible senior subordinated notes due 2021, (“Convertible Notes”). The indenture relating to the Convertible Notes provided that the Convertible Notes were convertible into the Company’s Class A common stock during limited periods after the market price of the Company’s Class A common stock exceeds 110% of the accreted conversion price at the rate of 14.2 Class A common shares per $1,000 face amount of notes at maturity, which would total 9.0 million shares. For this purpose, the “market price” is the average closing price of the Company’s Class A common stock over the last twenty trading days of a fiscal quarter.
In April 2006, substantially all of the Company’s outstanding Convertible Notes were converted by the noteholders into 4.9 million Class A common shares. Convertible Notes not converted by the noteholders were not material and were redeemed by the Company on April 4, 2006. During the year ended November 30, 2005, $288.7 million face value of Convertible Notes were converted to 4.1 million shares of the Company’s Class A common stock. The weighted average amount of shares issued upon conversion is included in the calculation of basic earnings per share from the date of conversion. The calculation of diluted earnings per share included 1.5 million shares for the year ended November 30, 2006 related to the dilutive effect of the Convertible Notes prior to conversion.
68
Comprehensive income (loss) represents changes in stockholders’ equity from non-owner sources. The components of comprehensive income (loss) were as follows:
| Years Ended November 30, | ||||||||||
| 2008 | 2007 | 2006 | ||||||||
| (In thousands) | ||||||||||
Net earnings (loss) | $ | (1,109,085 | ) | (1,941,081 | ) | 593,869 | ||||
Unrealized gains arising during period on interest rate swaps, net of tax (37%) | — | 1,002 | 2,853 | |||||||
Unrealized gain (loss) on Company’s portion of unconsolidated entity’s interest rate swap liability, net of tax (37%) | 2,061 | (2,061 | ) | — | ||||||
Unrealized gains arising during period on available-for-sale investment securities, net of tax (37%) | — | — | 7 | |||||||
Reclassification adjustment for loss included in net loss for interest rate swaps, net of tax (37%) | — | 338 | — | |||||||
Reclassification adjustment for gains included in net earnings for available-for-sale investment securities, net of tax (37%) | — | — | (245 | ) | ||||||
Change to the Company’s portion of unconsolidated entity’s minimum pension liability, net of tax (37%) | — | 701 | 565 | |||||||
Comprehensive income (loss) | $ | (1,107,024 | ) | (1,941,101 | ) | 597,049 | ||||
Accumulated other comprehensive loss consisted of the following at November 30, 2008 and 2007:
| November 30, | ||||||
| 2008 | 2007 | |||||
| (In thousands) | ||||||
Unrealized gain (loss) on Company’s portion of unconsolidated entity’s interest rate swap liability, net of tax | $ | — | (2,061 | ) | ||
Accumulated other comprehensive loss | $ | — | (2,061 | ) | ||
LENNAR CORPORATION AND SUBSIDIARIES
NOTES TO CONSOLIDATED FINANCIAL STATEMENTS—(Continued)
1.5 million shares for the year ended November 30, 2006, compared to 7.5 million and 9.0 million shares for the years ended 2005 and 2004, respectively, related to the dilutive effect of the Convertible Notes prior to conversion.
13. Comprehensive Income
Comprehensive income represents changes in stockholders’ equity from non-owner sources. The components of comprehensive income were as follows:
| Years Ended November 30, | ||||||||||
| 2006 | 2005 | 2004 | ||||||||
| (In thousands) | ||||||||||
Net earnings | $ | 593,869 | 1,355,155 | 945,619 | ||||||
Unrealized gains arising during period on interest rate swaps, net of tax | 2,853 | 10,049 | 6,734 | |||||||
Unrealized gains arising during period on available-for-sale investment securities, net of tax | 7 | 185 | 53 | |||||||
Reclassification adjustment for gains included in net earnings for available-for-sale investment securities, net of tax | (245 | ) | — | — | ||||||
Change to the Company’s portion of unconsolidated entity’s minimum pension liability, net of tax | 565 | (880 | ) | (386 | ) | |||||
Comprehensive income | $ | 597,049 | 1,364,509 | 952,020 | ||||||
The Company’s effective tax rate was 37.00% in 2006 and 37.75% in both 2005 and 2004.
Accumulated other comprehensive loss consisted of the following at November 30, 2006 and 2005:
| November 30, | |||||||
| 2006 | 2005 | ||||||
| (In thousands) | |||||||
Unrealized loss on interest rate swaps | $ | (1,340 | ) | (4,193 | ) | ||
Unrealized gain on available-for-sale investment securities | — | 238 | |||||
Unrealized loss on Company’s portion of unconsolidated entity’s minimum | (701 | ) | (1,266 | ) | |||
Accumulated other comprehensive loss | $ | (2,041 | ) | (5,221 | ) | ||
14.12. Capital Stock
Preferred Stock
The Company is authorized to issue 500,000 shares of preferred stock with a par value of $10 per share and 100 million shares of participating preferred stock with a par value of $0.10 per share. No shares of preferred stock or participating preferred stock have been issued as of November 30, 2006.2008.
Common Stock
During 2006, 2005 and 2004, Class A and Class B common stockholders received per share annual dividends of $0.64, $0.57 and $0.51, respectively. In September 2005,October 2008, the Company’s Board of Directors voted to increasedecrease the annual dividend rate with regard to the Company’s Class A and Class B common stock to $0.64$0.16 per share per year (payable quarterly) from $0.55$0.64 per share per year (payable quarterly). During the years ended November 30, 2008, 2007 and 2006, Class A and Class B common stockholders received per share annual dividends of $0.52, $0.64 and $0.64, respectively.
The only significant difference between the Class A common stock and Class B common stock is that Class A common stock entitles holders to one vote per share and the Class B common stock entitles holders to ten votes per share.
As of November 30, 2006,2008, Stuart A. Miller, the Company’s President, Chief Executive Officer and a Director, directly owned, or controlled through family-owned entities, shares of Class A and Class B common stock, which represented approximately 49% voting power of the Company’s stock.
In June 2001, the Company’s Board of Directors authorized a stock repurchase program to permit the purchase of up to 20 million shares of its outstanding common stock. During the years ended November 30, 2008 and 2007, there were no material share repurchases of common stock under the stock repurchase program. During the year ended November 30, 2006, the Company repurchased a
69
LENNAR CORPORATION AND SUBSIDIARIES
NOTES TO CONSOLIDATED FINANCIAL STATEMENTS—(Continued)
total of 6.2 million shares of theits outstanding common stock under the stock repurchase program for an aggregate purchase price including commissions of $320.1 million, or $51.59 per share. During 2005, the Company repurchased a total of 5.1 million shares of its outstanding Class A common stock under the stock repurchase program for an aggregate purchase price including commissions of $274.9 million, or $53.38 per share. During 2004, the Company granted approximately 2.4 million stock options to employees under the Company’s 2003 Stock Option and Restricted Stock Plan, and repurchased a similar number of shares of its outstanding Class A common stock under the stock repurchase program for an aggregate purchase price including commissions of approximately $109.6 million, or $45.64 per share. As of November 30, 2006,2008, 6.2 million shares of common stock can be repurchased in the future under the program.
Treasury stock increased by 0.5 million Class A common shares and 0.8 million Class A common shares during the years ended November 30, 2008 and November 30, 2007, primarily related to forfeitures of restricted stock. In addition to the common shares purchased under the Company’s stock repurchase program, during the year ended November 30, 2006, the Company repurchased approximately 0.1 million and 0.2 million Class A common shares during the years ended November 30, 2006 and 2005, respectively, related to the vesting of restricted stock and distributions of common stock from the Company’s deferred compensation plan.
Restrictions on Payment of Dividends
Other than to maintain compliance with certain covenants contained in the financial ratios and net worth required by the NewCredit Facility, there are no restrictions on the payment of dividends on common stock by the Company. There are no agreements which restrict the payment of dividends by subsidiaries of the Company other than to maintain the financial ratios and net worth requirements under the Financial Services segment’s warehouse lines of credit.
401(k) Plan
Under the Company’s 401(k) Plan (the ���Plan”“Plan”), contributions made by employees can be invested in a variety of mutual funds or proprietary funds provided by the Plan trustee. The Company may also make contributions for the benefit of employees. The Company records as compensation expense its contribution to the 401(k) Plan. This amount was $7.6 million in 2008, $15.2 million in 2007 and $19.0 million in 2006, $12.0 million in 2005 and $10.3 million in 2004.2006.
LENNAR CORPORATION AND SUBSIDIARIES
15.NOTES TO CONSOLIDATED FINANCIAL STATEMENTS—(Continued)
13. Share-Based Payments
The Company has share-based awards outstanding under four different plans which provide for the granting of stock options and stock appreciation rights and awards of restricted common stock (“nonvested shares”) to key officers, employees and directors. These awards are primarily issued in the form of new shares. The exercise prices of stock options and stock appreciation rights may not be less than the market value of the common stock on the date of the grant. No options granted under the plans may be exercisable until at least six months after the date of the grant. Thereafter, exercises are permitted in installments determined when options are granted. Each stock option and stock appreciation right will expire on a date determined at the time of the grant, but not more than ten years after the date of the grant.
Prior to December 1, 2005, theThe Company accountedaccounts for stock option awards granted under the plans in accordance with the recognition and measurement provisions of APB 25 and related Interpretations, as permitted by SFAS 123. Share-based employee compensation expense was not recognized in the Company’s consolidated statements of earnings prior to December 1, 2005, as all stock option awards granted under the plans had an exercise price equal to or greater than the market value of the common stock on the date of the grant.No. 123 (revised 2004),Share-Based Payment, (“SFAS 123R”). Effective December 1, 2005, the Company adopted the provisions of SFAS 123R using the modified-prospective-transition method. Under this transition method, compensation expense recognized during the year ended November 30, 2006 included: (a) compensation expense for all share-based awards granted prior to, but not yet vested as of December 1, 2005, based on the grant date fair value estimated in accordance with the original provisions of SFAS 123, and (b) compensation expense for all share-based awards granted subsequent to December 1, 2005, based on the grant date fair value estimated in accordance with the provisions of SFAS 123R. In accordance with the modified-prospective-transition method, results for prior periods have not been restated.
As a result of adopting SFAS 123R, the charge to earnings before provision for income taxes for the year ended November 30, 2006 was $25.6 million. The impact of adopting SFAS 123R on net earnings for the year ended November 30, 2006 was $18.5 million. The impact of adopting SFAS 123R on basic and diluted earnings per share for the year ended November 30, 2006 was $0.12 per share and $0.11 per share, respectively.
70
LENNAR CORPORATION AND SUBSIDIARIES
NOTES TO CONSOLIDATED FINANCIAL STATEMENTS—(Continued)
Prior to the adoption of SFAS 123R, the Company presented all tax benefits related to deductions resulting from the exercise of stock options as cash flows from operating activities in the consolidated statements of cash flows. SFAS 123R requires that cash flows resulting from tax benefits related to tax deductions in excess of the compensation expense recognized for those options (excess tax benefits) be classified as financing cash flows. As a result,For the year ended November 30, 2008, the Company did not have any excess tax benefits from shared-based awards. For the years ended November 30, 2007 and 2006, the Company classified $4.6 million and $7.1 million, respectively, of excess tax benefits as financing cash inflows for the year ended November 30, 2006.inflows.
The following table illustrates the effect on net earnings and earnings per share for the years ended November 30, 2005 and 2004, if the Company had applied the fair value recognition provisions of SFAS 123, as amended by SFAS No. 148,Accounting for Stock-Based Compensation-Transition and Disclosure, to stock options awards granted under the Company’s share-based payment plans. For purposes of this pro forma disclosure, the value of the stock option awards is estimated using a Black-Scholes option-pricing model and amortized to expense over the options’ vesting periods.
| Years Ended November 30, | |||||||
| 2005 | 2004 | ||||||
| (In thousands, except per share amounts) | |||||||
Net earnings, as reported | $ | 1,355,155 | 945,619 | ||||
Add: Total stock-based employee compensation expense included in reported net earnings, net of tax | 3,999 | 1,868 | |||||
Deduct: Total stock-based employee compensation expense determined under fair market value based method for all awards, net of tax | (16,912 | ) | (13,086 | ) | |||
Pro forma net earnings | $ | 1,342,242 | 934,401 | ||||
Earnings per share: | |||||||
Basic—as reported | $ | 8.72 | 6.09 | ||||
Basic—pro forma | $ | 8.64 | 6.01 | ||||
Diluted—as reported | $ | 8.23 | 5.70 | ||||
Diluted—pro forma | $ | 8.16 | 5.63 | ||||
Compensation expense related to the Company’s share-based awards for the yearyears ended November 30, 2008, 2007 and 2006 was $29.9 million, $35.5 million and $36.6 million, respectively, of which $12.4 million, $17.2 million and $25.6 million, respectively, related to stock options resulting from the adoption of SFAS 123Rand $17.4 million, $18.3 million and $11.0 million, related to nonvested shares. During the years ended November 30, 2005 and 2004, compensation expense related to the Company’s share-based awards was $6.9 million and $3.0 million, respectively, which primarily related to nonvested shares. The total income tax benefit recognized in the consolidated statementstatements of earningsoperations for share-based awards during the yearyears ended November 30, 2008, 2007 and 2006 was $10.0$9.4 million, $11.3 million and $11.2 million, respectively, of which $2.9 million, $4.5 million and $7.1 million, respectively, related to stock options resulting from the adoption of SFAS 123R and $2.9$6.5 million, related to nonvested shares. During the years ended November 30, 2005 and 2004, the income tax benefit recognized in the consolidated statements of earnings for share-based awards was $2.6$6.8 million and $1.1$4.1 million, respectively, all of which related to nonvested shares.
Cash received from stock options exercised during the years ended November 30, 2008, 2007 and 2006 2005was $0.2 million, $21.6 million, and 2004 was $31.1 million, $38.1 million and $14.5 million, respectively. There were no material tax deductions related to stock options exercised during the year ended November 30, 2008. The tax deductions related to stock options exercised during the years ended November 30, 2007 and 2006 2005 and 2004 were $12.1 million, $23.2$8.3 million and $8.6$12.1 million, respectively.
The fair value of each of the Company’s stock option awards is estimated on the date of grant using a Black-Scholes option-pricing model that uses the assumptions noted in the table below. The fair value of the Company’s stock option awards, which are subject to graded vesting, is expensed on a straight-line basis over the vesting life of the stock options. Expected volatility is based on an average of (1) historical volatility of the Company’s stock and (2) implied volatility from traded options on the Company’s stock. The risk-free rate for periods within the contractual life of the stock option award is based on the yield curve of a zero-coupon U.S. Treasury bond on the date the stock option award is granted with a maturity equal to the expected term of the stock option award granted. The Company uses historical data to estimate stock option exercises and forfeitures within its valuation model. The expected life of stock option awards granted is derived from historical exercise experience under the Company’s share-based payment plans and represents the period of time that stock option awards granted are expected to be outstanding.
71
LENNAR CORPORATION AND SUBSIDIARIES
NOTES TO CONSOLIDATED FINANCIAL STATEMENTS—(Continued)
The fair value of these options was determined at the date of the grant using the Black-Scholes option-pricing model. The significant weighted average assumptions for the years ended November 30, 2006, 20052008, 2007 and 20042006 were as follows:
| 2006 | 2005 | 2004 | 2008 | 2007 | 2006 | |||||||
Dividend yield | 1.1% | 1.0% | 1.1% | 3.2% - 4.7% | 1.3% - 2.7% | 1.1% | ||||||
Volatility rate | 31% - 34% | 27% - 34% | 27% - 36% | 43% - 60% | 30% - 34% | 31% - 34% | ||||||
Risk-free interest rate | 4.1% - 5.0% | 3.8% - 4.6% | 2.8% - 4.5% | 1.9% - 3.5% | 4.1% - 5.0% | 4.1% - 5.0% | ||||||
Expected option life (years) | 2.0 - 5.0 | 2.0 - 5.0 | 2.0 - 5.0 | 2.0 - 5.0 | 2.0 - 5.0 | 2.0 - 5.0 |
LENNAR CORPORATION AND SUBSIDIARIES
NOTES TO CONSOLIDATED FINANCIAL STATEMENTS—(Continued)
A summary of the Company’s stock option activity for the year ended November 30, 2006 is as follows:
| Stock Options | Weighted Average Exercise Price | Weighted Average Remaining Contractual Life | Aggregate Intrinsic Value (In thousands) | ||||||||
Outstanding at November 30, 2005 | 7,159,548 | $ | 35.92 | ||||||||
Grants | 1,799,100 | $ | 61.37 | ||||||||
Forfeited or expired | (563,860 | ) | $ | 48.38 | |||||||
Exercises | (1,194,076 | ) | $ | 26.11 | |||||||
Outstanding at November 30, 2006 | 7,200,712 | $ | 42.93 | 2.9 | $ | 87,242 | |||||
Vested and expected to vest in the future at November 30, 2006 | 6,358,637 | $ | 41.87 | 2.9 | $ | 83,361 | |||||
Exercisable at November 30, 2006 | 2,257,242 | $ | 28.27 | 2.4 | $ | 54,121 | |||||
Available for grant at November 30, 2006 | 3,458,027 | ||||||||||
A summary of the Company’s stock option activity for the years ended November 30, 2005 and 20042008 was as follows:
| 2005 | 2004 | |||||||||||
| Stock Options | Weighted Average Exercise Price | Stock Options | Weighted Average Exercise Price | |||||||||
Outstanding, beginning of year | 8,025,292 | $ | 28.26 | 6,660,968 | $ | 20.01 | ||||||
Grants | 1,581,125 | $ | 55.46 | 2,478,796 | $ | 46.42 | ||||||
Forfeited or expired | (541,853 | ) | $ | 34.02 | (240,386 | ) | $ | 33.17 | ||||
Exercises | (1,905,016 | ) | $ | 20.01 | (874,086 | ) | $ | 16.55 | ||||
Outstanding, end of year | 7,159,548 | $ | 35.92 | 8,025,292 | $ | 28.26 | ||||||
Exercisable, end of year | 1,390,848 | $ | 22.36 | 1,338,425 | $ | 15.87 | ||||||
Available for grant, end of year | 5,408,359 | 7,440,704 | ||||||||||
| Stock Options | Weighted Average Exercise Price | Weighted Average Remaining Contractual Life | Aggregate Intrinsic Value (In thousands) | ||||||||
Outstanding at November 30, 2007 | 6,338,165 | $ | 46.35 | ||||||||
Grants | 4,513,500 | $ | 13.57 | ||||||||
Forfeited or expired | (2,070,661 | ) | $ | 39.30 | |||||||
Exercises | (19,800 | ) | $ | 11.34 | |||||||
Outstanding at November 30, 2008 | 8,761,204 | $ | 31.50 | 3.1 years | $ | 180 | |||||
Vested and expected to vest in the future at November 30, 2008 | 8,173,972 | $ | 32.51 | 3.0 years | $ | 244 | |||||
Exercisable at November 30, 2008 | 2,738,041 | $ | 47.35 | 1.0 years | $ | 162 | |||||
Available for grant at November 30, 2008 | 4,215,063 | ||||||||||
The weighted average fair value of options granted during the years ended November 30, 2008, 2007 and 2006 2005was $3.85, $12.89 and 2004$17.27, respectively. For the year ended November 30, 2008, the total intrinsic value of options exercised during the year was $17.27, $16.02 and $13.27, respectively.not material. The total intrinsic value of options exercised during the years ended November 30, 2007 and 2006 2005was $22.3 million and 2004 was $36.1 million, $70.2 million and $27.6 million, respectively.
72
LENNAR CORPORATION AND SUBSIDIARIES
NOTES TO CONSOLIDATED FINANCIAL STATEMENTS—(Continued)
The fair value of nonvested shares is determined based on the average trading price of the Company’s common stock on the grant date. The weighted average fair value of nonvested shares granted during the years ended November 30, 2008, 2007 and 2006 was $15.11, $49.52 and 2005 was $57.09, and $61.93, respectively. There were no nonvested shares granted during the year ended November 30, 2004. A summary of the Company’s nonvested shares activity for the year ended November 30, 20062008 was as follows:
| Shares | Weighted Average Grant Date Fair Value | Shares | Weighted Average Grant Date Fair Value | |||||||||
Nonvested restricted shares at November 30, 2005 | 724,000 | $ | 61.65 | |||||||||
Nonvested restricted shares at November 30, 2007 | 1,700,591 | $ | 52.83 | |||||||||
Grants | 661,792 | $ | 57.09 | 1,172,978 | $ | 15.11 | ||||||
Vested | (72,744 | ) | $ | 60.99 | (423,642 | ) | $ | 54.02 | ||||
Forfeited | (51,280 | ) | $ | 59.23 | (427,004 | ) | $ | 45.16 | ||||
Nonvested restricted shares at November 30, 2006 | 1,261,768 | $ | 59.40 | |||||||||
Nonvested restricted shares at November 30, 2008 | 2,022,923 | $ | 32.33 | |||||||||
At November 30, 2006,2008, there was $74.0$61.8 million of unrecognized compensation expense related to unvested share-based awards granted under the Company’s share-based payment plans, of which $40.7$25.6 million relates to stock options and $33.4$36.2 million relates to nonvested shares. ThatThe unrecognized expense related to nonvested shares is expected to be recognized over a weighted-average period of 3.22.3 years. During the years ended November 30, 2008, 2007 and 2006, 2005 and 2004, 0.10.4 million nonvested shares, 0.50.3 million nonvested shares and 0.50.1 million nonvested shares, respectively, vested. The tax deductions(provision) benefit related to nonvested share activity during the years ended November 30, 2008, 2007 and 2006 2005 and 2004 were $3.7was ($6.1) million, $16.0($3.1) million and $4.5$3.7 million, respectively.
16.14. Deferred Compensation Plan
In June 2002, the Company adopted the Lennar Corporation Nonqualified Deferred Compensation Plan (the “Deferred Compensation Plan”) that allowsallowed a selected group of members of management to defer a portion of their salaries and bonuses and up to 100% of their restricted stock. All participant contributions to the Deferred Compensation Plan are vested. Salaries and bonuses that are deferred under the Deferred Compensation Plan are credited with earnings or losses based on investment decisions made by the participants. The cash contributions to the Deferred Compensation Plan are invested by the Company in various investment securities that arewere classified as trading.
Restricted stock is deferred under the Deferred Compensation Plan by surrendering the restricted stock in exchange for the right to receive in the future a number of shares equal to the number of restricted shares that are
LENNAR CORPORATION AND SUBSIDIARIES
NOTES TO CONSOLIDATED FINANCIAL STATEMENTS—(Continued)
surrendered. The surrender is reflected as a reduction in stockholders’ equity equal to the fair value of the restricted stock when it was issued, with an offsetting increase in stockholders’ equity to reflect a deferral of the compensation expense related to the surrendered restricted stock. Changes in the fair value of the shares that will be issued in the future are not reflected in the consolidated financial statements.
As of November 30, 2006,2007, approximately 172,00036,000 Class A common shares and 17,2003,600 Class B common shares of restricted stock had been surrendered in exchange for rights under the Deferred Compensation Plan, resulting in a reduction in stockholders’ equity of $1.6$0.3 million fully offset by an increase in stockholders’ equity to reflect the deferral of compensation in that amount. Shares that the Company is obligated to issue in the future under the Deferred Compensation Plan are treated as outstanding shares in both the Company’s basic and diluted earnings (loss) per share calculations for the years ended November 30, 2006, 20052007 and 2004.2006. In 2008, the Compensation Committee of the Company’s Board of Directors approved the termination of the Deferred Compensation Plan and $1.8 million in total in cash and shares of common stock was distributed to its participants.
17.15. Financial Instruments
The following table presents the carrying amounts and estimated fair values of financial instruments held by the Company at November 30, 20062008 and 2005,2007, using available market information and what the Company believes to be appropriate valuation methodologies. Considerable judgment is required in interpreting market data to develop the estimates of fair value. Accordingly, the estimates presented are not necessarily indicative of the amounts that the Company could realize in a current market exchange. The use of different market assumptions and/or estimation methodologies might have a material effect on the estimated fair value amounts. The table excludes cash, restricted cash, receivables and accounts payable, which had fair values approximating their carrying valuesamounts due to the short maturities of these instruments.
73
LENNAR CORPORATION AND SUBSIDIARIES
NOTES TO CONSOLIDATED FINANCIAL STATEMENTS—(Continued)
| November 30, | November 30, | |||||||||||||||||||
| 2006 | 2005 | 2008 | 2007 | |||||||||||||||||
| Carrying Amount | Fair Value | Carrying Amount | Fair Value | Carrying Amount | Fair Value | Carrying Amount | Fair Value | |||||||||||||
| (In thousands) | (In thousands) | |||||||||||||||||||
ASSETS | ||||||||||||||||||||
Homebuilding: | ||||||||||||||||||||
Investments—trading | $ | 8,544 | 8,544 | 8,660 | 8,660 | |||||||||||||||
Investments—available-for-sale | — | — | 8,883 | 8,883 | ||||||||||||||||
Financial services: | ||||||||||||||||||||
Loans held-for-sale, net | $ | 483,704 | 483,704 | 562,510 | 562,510 | |||||||||||||||
Loans held-for-investment, net | 189,638 | 187,672 | 147,459 | 145,219 | $ | 58,339 | 58,339 | 137,544 | 137,564 | |||||||||||
Investments—held-to-maturity | 59,571 | 59,546 | 32,146 | 32,149 | $ | 19,139 | 19,266 | 61,518 | 61,572 | |||||||||||
LIABILITIES | ||||||||||||||||||||
Homebuilding: | ||||||||||||||||||||
Senior notes and other debts payable | $ | 2,613,503 | 2,626,235 | 2,592,772 | 2,700,893 | $ | 2,544,935 | 1,785,692 | 2,295,436 | 1,905,502 | ||||||||||
Financial services: | ||||||||||||||||||||
Notes and other debts payable | $ | 1,149,231 | 1,149,231 | 1,269,782 | 1,269,782 | $ | 225,783 | 225,783 | 541,437 | 541,437 | ||||||||||
OTHER FINANCIAL INSTRUMENTS | ||||||||||||||||||||
Homebuilding liabilities: | ||||||||||||||||||||
Interest rate swaps | $ | 2,128 | 2,128 | 6,737 | 6,737 | |||||||||||||||
Financial services liabilities: | ||||||||||||||||||||
Commitments to originate loans | $ | 626 | 626 | 112 | 112 | |||||||||||||||
Forward commitments to sell loans and option contracts | (3,444 | ) | (3,444 | ) | 477 | 477 | ||||||||||||||
The following methods and assumptions are used by the Company in estimating fair values:
HomebuildingHomebuilding——Since there are no quoted market prices for investments classified as available-for-sale, the fair value is estimated from available yield curves for investments of similar quality and terms. The fair value for investments classified as trading is based on quoted market prices. For senior notes and other debts payable, the fair value of fixed-rate borrowings is based on quoted market prices. Variable-rateThe Company’s variable-rate borrowings are tied to market indices and therefore approximate fair value. The fair value for interest rate swaps is based on dealer quotations and generally represents an estimatedue to the short maturities associated with the majority of the amount the Company would pay or receive to terminate the agreement at the reporting date.instruments.
Financial services—The fair values above are based on quoted market prices, if available. The fair values for instruments that do not have quoted market prices are estimated by the Company on the basis of discounted cash flows or other financial information.
LENNAR CORPORATION AND SUBSIDIARIES
NOTES TO CONSOLIDATED FINANCIAL STATEMENTS—(Continued)
Fair Value Option
SFAS 157 provides a framework for measuring fair value, expands disclosures about fair value measurements and establishes a fair value hierarchy which prioritizes the inputs used in measuring fair value summarized as follows:
Level 1 | Fair value determined based on quoted prices in active markets for identical assets. | |
Level 2 | Fair value determined using significant other observable inputs. | |
Level 3 | Fair value determined using significant unobservable inputs. | |
The Homebuilding operations utilizeCompany’s financial instruments measured at fair value on a recurring basis are summarized below:
Financial Instruments | Fair Value Hierarchy | Fair Value at November 30, 2008 | ||||
| (In thousands) | ||||||
Loans held-for-sale (1) | Level 2 | $ | 190,056 | |||
Mortgage loan commitments | Level 2 | 4,382 | ||||
Forward contracts | Level 2 | (6,461 | ) | |||
| $ | 187,977 | |||||
| (1) | The difference between the aggregate fair value of $190.1 million and the aggregate unpaid principal balance of $185.2 million is $4.9 million. |
The Company elected the fair value option for its loans held-for-sale for mortgage loans originated subsequent to February 29, 2008 in accordance with SFAS 159, which permits entities to measure various financial instruments and certain other items at fair value on a contract-by-contract basis. Management believes that the election of the fair value option for loans held-for-sale improves financial reporting by mitigating volatility in reported earnings caused by measuring the fair value of the loans and the derivative instruments used to economically hedge them without having to apply complex hedge accounting provisions. In addition, the Company adopted SAB 109 on March 1, 2008, requiring the recognition of the fair value of its rights to service a mortgage loan as revenue upon entering into an interest rate swap agreementslock loan commitment with a borrower. The fair value of these servicing rights is included in the Company’s loans held-for-sale as of November 30, 2008. Prior to manage interest costsMarch 1, 2008, the fair value of the servicing rights was not recognized until the related loan was sold. Fair value of the servicing rights is determined based on values in the Company’s servicing sales contracts. Fair value of loans held for sale is based on independent quoted market prices, where available, or the prices for other mortgage whole loans with similar characteristics.
The assets accounted for under SFAS 159 are initially measured at fair value. Gains and hedge against risks associated with changing interest rates. Counterparties to these agreements are major financial institutions. Credit losses from counterparty non-performanceinitial measurement and subsequent changes in fair value are not anticipated. A majority ofrecognized in the Homebuilding operations’ variable interest rate borrowingsFinancial Services segment’s earnings (loss). The changes in fair values that are included in earnings (loss) are shown, by financial instrument and financial statement line item, below:
| Years Ended November 30, 2008 | ||||||||
| Loans held-for-sale | Mortgage loan commitments | Forward contracts | ||||||
| (In thousands) | ||||||||
Changes in fair value included in net earnings (loss): | ||||||||
Financial Services revenues | $ | 4,923 | 4,382 | (6,461 | ) | |||
Interest income on loans held-for-sale measured at fair value is calculated based on the LIBOR index. At November 30, 2006, the Homebuilding operations had three interest rate swap agreements outstanding with a total notional amount of $200 million, which will mature at various dates through fiscal 2008. These agreements fixed the LIBOR index at an average interest rate of 6.8% at November 30, 2006. The effectthe loan and recorded in interest income in the Financial Services’ statement of interest rate swap agreements on interest incurred and on the average interest rate was an increase of $3.8 million and 0.10%, respectively, for the year ended November 30, 2006, an increase of $11.0 million and 0.40%, respectively, for the year ended November 30, 2005 and an increase of $16.5 million and 0.89%, respectively, for the year ended November 30, 2004.operations.
The Financial Services segment had a pipeline of loan applications in process of $2.9 billion$710.8 million at November 30, 2006.2008. Loans in process for which interest rates were committed to the borrowers totaled approximately $323.9$248.8 million as of November 30, 2006.2008. Substantially all of these commitments were for periods of 60 days or less. Since a portion of these commitments is expected to expire without being exercised by the borrowers, the total commitments do not necessarily represent future cash requirements.
74
LENNAR CORPORATION AND SUBSIDIARIES
NOTES TO CONSOLIDATED FINANCIAL STATEMENTS—(Continued)
The Financial Services segment uses mandatory mortgage-backed securities (“MBS”) forward commitments, and MBS option contracts and investor commitments to hedge its mortgage-related interest rate exposure during the period from when it extends an interest rate lock to a loan applicant until the time at which the loan is sold to an investor.exposure. These instruments involve, to varying degrees, elements of credit and interest rate risk. Credit risk is managed by entering into MBS forward commitments, and MBS option contracts only with investment banks, with primary dealer statusfederally regulated bank affiliates and loan sales transactions with permanent investors meeting the segment’s credit standards. The segment’s risk, in the event of default by the purchaser, is the difference between the contract price and current fair value.value of the MBS forward commitments and option contracts. At November 30, 2006,2008, the segment had open commitments amounting to $335.0$332.0 million to sell MBS with varying settlement dates through January 2007.February 2009.
18.16. Consolidation of Variable Interest Entities
The Company follows FIN 46(R),46R, which requires the consolidation of certain entities in which an enterprise absorbs a majority of the entity’s expected losses, receives a majority of the entity’s expected residual returns, or both, as a result of ownership, contractual or other financial interests in the entity.
Unconsolidated Entities
At November 30, 2006,2008, the Company had investments in and advances to unconsolidated entities established to acquire and develop land for sale to the Company in connection with its homebuilding operations, for sale to third parties or for the construction of homes for sale to third-party homebuyers. The Company evaluated all agreements under FIN 46(R)46R during 20062008 that were entered into or had reconsideration events and it consolidated entities that at November 30, 20062008 had total combined assets and liabilities of $167.8$560.1 million and $123.3$274.6 million, respectively. Additionally, during 2008, the Company consolidated certain joint ventures and then bought out the respective partners at a later date, resulting in the consolidated joint ventures becoming wholly-owned. At November 30, 2008, the assets and liabilities of these entities amounted to $150.8 million and $62.1 million, respectively.
At November 30, 20062008 and 2005,2007, the Company’s recorded investment in unconsolidated entities was $1.4 billion$766.8 million and $1.3 billion,$934.3 million, respectively. The Company’s estimated maximum exposure to loss with regard to unconsolidated entities was primarily its recorded investments in these entities and the exposure under the guarantees discussed in Note 6.4.
Option Contracts
In the Company’s homebuilding operations, the Company hasobtains access to land through option contracts, which generally enables it to defer acquiringcontrol portions of properties owned by third parties (including land funds) and unconsolidated entities until the Company is readyhas determined whether to build homes on them.
At November 30, 2006,exercise the Company had access through option contracts to 189,279 homesites, of which 94,758 were through option contracts with third parties and 94,521 were through option contracts with unconsolidated entities in which the Company has investments. At November 30, 2005, the Company had access through option contracts to 222,119 homesites, of which 127,013 were through option contracts with third parties and 95,106 were through option contracts with unconsolidated entities in which the Company has investments.option.
A majority of the Company’s option contracts require a non-refundable cash deposit or irrevocable letter of credit based on a percentage of the purchase price of the land. These options are generally rolling options, in which the Company acquires homesites based on pre-determined take-down schedules. The Company’s option contracts oftensometimes include price escalators,adjustment provisions, which adjust the purchase price of the land to its approximate fair value at the time of acquisition, or are based on the acquisition. The exercise periodsfair value of the Company’s option contracts vary on a case-by-case basis, but generally range from one to ten years.land at the time of takedown.
The Company’s investments in option contracts are recorded at cost unless those investments are determined to be impaired, in which case the Company’s investments are written down to fair value. The Company reviews option contracts for impairment during each reporting period in accordance with SFAS 144. .The most significant indicator of impairment is a decline in the fair value of the optioned property such that the purchase and development of the optioned property would no longer meet the Company’s targeted return on investment. Such declines could be caused by a variety of factors including increased competition, decreases in demand or changes in local regulations that adversely impact the cost of development. Changes in any of these factors would cause the Company to re-evaluate the likelihood of exercising its land options.
75
LENNAR CORPORATION AND SUBSIDIARIES
NOTES TO CONSOLIDATED FINANCIAL STATEMENTS—(Continued)
EachSome option contract containscontracts contain a predetermined take-down schedule for the optioned land parcels. However, in almost all instances, the Company is not required to purchase land in accordance with those take-down schedules. In substantially all instances, the Company has the right and ability to not exercise its option and forfeit its deposit without further penalty, other than termination of the option and loss of any unapplied portion of its deposit and pre-acquisition costs. Therefore, in substantially all instances, the Company does not consider the take-down price to be a firm contractual obligation.
LENNAR CORPORATION AND SUBSIDIARIES
NOTES TO CONSOLIDATED FINANCIAL STATEMENTS—(Continued)
When the Company permits an optiondoes not intend to terminate or walks away fromexercise an option, it writes-offwrites off any unapplied deposit and pre-acquisition costs.costs associated with the option contract. For the yearyears ended November 30, 2008, 2007 and 2006, the Company wrote-off $97.2 million, $530.0 million and $152.2 million, respectively, of option deposits and pre-acquisition costs related to 24,235 homesitesland under option that it does not intend to purchase, compared to $15.1 million in 2005.purchase.
In very limited cases,The table below indicates the land seller can enforce the take-down schedule by requiringnumber of homesites owned and homesites to which the Company to exercisehad access through option contracts with third parties (“optioned”) or unconsolidated joint ventures in which the Company has investments (“JVs”) (i.e., controlled homesites) for each of its option. The Company records the option contract as a financing arrangement when required in accordance with SFAS No. 49,Accounting for Product Financing Arrangements,homebuilding segments and records the optioned propertyHomebuilding Other at November 30, 2008 and related take-down liability in its consolidated financial statements.2007:
| Controlled Homesites | ||||||||||
November 30, 2008 | Optioned | JVs | Total | Owned Homesites | Total Homesites | |||||
East | 8,705 | 4,444 | 13,149 | 25,688 | 38,837 | |||||
Central | 1,820 | 5,991 | 7,811 | 14,501 | 22,312 | |||||
West | 203 | 12,078 | 12,281 | 18,776 | 31,057 | |||||
Houston | 1,461 | 2,654 | 4,115 | 7,389 | 11,504 | |||||
Other | 529 | 704 | 1,233 | 8,327 | 9,560 | |||||
Total homesites | 12,718 | 25,871 | 38,589 | 74,681 | 113,270 | |||||
| Controlled Homesites | ||||||||||
November 30, 2007 | Optioned | JVs | Total | Owned Homesites | Total Homesites | |||||
East | 14,888 | 14,091 | 28,979 | 24,014 | 52,993 | |||||
Central | 3,470 | 12,679 | 16,149 | 7,848 | 23,997 | |||||
West | 1,243 | 30,800 | 32,043 | 15,300 | 47,343 | |||||
Houston | 2,313 | 3,694 | 6,007 | 7,071 | 13,078 | |||||
Other | 963 | 1,729 | 2,692 | 8,568 | 11,260 | |||||
Total homesites | 22,877 | 62,993 | 85,870 | 62,801 | 148,671 | |||||
The Company evaluated all option contracts for land when entered into or upon a reconsideration event and determined it was the primary beneficiary of certain of these option contracts. Although the Company does not have legal title to the optioned land, under FIN 46(R),46R, the Company, if it is deemed to be the primary beneficiary, is required to consolidate the land under option at the purchase price of the optioned land. During 2006 and 2005,the year ended November 30, 2008, the effect of the consolidation of these option contracts was an increase of $548.7$32.4 million and $516.3 million, respectively, to consolidated inventory not owned with a corresponding increase to liabilities related to consolidated inventory not owned in the accompanying consolidated balance sheets as of November 30, 20062008 and 2005.2007. This increase in 2008 was offset primarily by the Company exercising its options to acquire land under certain contracts previously consolidated, under FIN 46(R), resulting in a net increasedecrease in consolidated inventory not owned of $1.8 million.$141.3 million for the year ended November 30, 2008. To reflect the purchase price of the inventory consolidated under FIN 46(R),46R, the Company reclassified $80.7$2.5 million of related option deposits from land under development to consolidated inventory not owned in the accompanying consolidated balance sheet as of November 30, 2006.2008. The liabilities related to consolidated inventory not owned primarily represent the difference between the purchase price ofoption exercise prices for the optioned land and the Company’s cash deposits.
At November 30, 2006 and 2005, theThe Company’s exposure to loss related to its option contracts with third parties and unconsolidated entities consisted of its non-refundable option deposits and advancedpre-acquisition costs totaling $785.9$191.2 million and $741.6$317.1 million, respectively.respectively, at November 30, 2008 and 2007. Additionally, the Company had posted $553.4$89.5 million and $193.3 million, respectively, of letters of credit in lieu of cash deposits under certain option contracts as of November 30, 2006.2008 and 2007.
19.17. Commitments and Contingent Liabilities
The Company is party to various claims, legal actions and complaints arising in the ordinary course of business. In the opinion of management, the disposition of these matters will not have a material adverse effect on the Company’s consolidated financial condition, results of operations or cash flows of the Company.statements.
LENNAR CORPORATION AND SUBSIDIARIES
NOTES TO CONSOLIDATED FINANCIAL STATEMENTS—(Continued)
The Company is subject to the usual obligations associated with entering into contracts (including option contracts) for the purchase, development and sale of real estate, which it does in the routine conduct of its business. Option contracts for the purchase of land generally enable the Company to defer acquiringcontrol portions of properties owned by third parties (including land funds) and certain unconsolidated entities until the Company is readydetermines whether to build homes on them.exercise the option. The use of option contracts allows the Company to reduce the financial risks associated with long-term land holdings. At November 30, 2006,2008, the Company had access to acquire 189,27938,589 homesites through option contracts with third parties and agreements with unconsolidated entities in which the Company had investments. At November 30, 2006,2008, the Company had $785.9$191.2 million of non-refundable option deposits and advancedpre-acquisition costs related to certain of these homesites, which were included in inventories in the consolidated balance sheet.
At November 30, 2006 and 2005, the Company had $124.5 million and $69.3 million, respectively, of reserves recorded in accordance with SFAS No. 5,Accounting for Contingencies, for income tax filing positions and related interest based on the Company’s evaluation that uncertainty exists in sustaining the deductions. This reserve is included in other liabilities in the consolidated balance sheets.
76
LENNAR CORPORATION AND SUBSIDIARIES
NOTES TO CONSOLIDATED FINANCIAL STATEMENTS—(Continued)
The Company has entered into agreements to lease certain office facilities and equipment under operating leases. Future minimum payments under the non-cancelable leases in effect at November 30, 20062008 are as follows:
| Lease Payments | Lease Payments | |||||
| (In thousands) | (In thousands) | |||||
2007 | $ | 92,481 | ||||
2008 | 60,018 | |||||
2009 | 47,195 | $ | 48,411 | |||
2010 | 33,381 | 39,827 | ||||
2011 | 24,097 | 28,889 | ||||
2012 | 17,809 | |||||
2013 | 10,420 | |||||
Thereafter | 27,274 | 23,760 | ||||
Rental expense for the years ended November 30, 2008, 2007 and 2006 2005was $108.9 million, $150.1 million and 2004 was $140.6 million, $116.0respectively. Rental expense for the years ended November 30, 2008 and 2007 includes $27.7 million and $84.7$17.1 million, respectively.respectively, of SFAS No. 146,Accounting for Costs Associated with Exit or Disposal Activities, (“SFAS 146”), contract termination costs related to the abandonment of leases as a result of the Company’s efforts to consolidate its operations and reduce costs. In 2008, $18.8 million, $2.4 million and $6.5 million, respectively, of the SFAS 146 contract termination costs were included in selling, general and administrative expenses, corporate, general and administrative expenses and Financial Services’ costs and expenses. In 2007, $12.3 million and $4.8 million, respectively, of the SFAS 146 contract termination costs were included in selling, general and administrative expenses and Financial Services’ costs and expenses. There were no material SFAS 146 contract termination costs in 2006.
The Company is committed, under various letters of credit, to perform certain development and construction activities and provide certain guarantees in the normal course of business. Outstanding letters of credit under these arrangements totaled $1.4 billion$446.0 million at November 30, 2006.2008. The Company also had outstanding performance and surety bonds related to site improvements at various projects with estimated(including certain projects in the Company’s joint ventures) of $1.1 billion. Although significant development and construction activities have been completed related to these site improvements, these bonds are generally not released until all development and construction activities are completed. As of November 30, 2008, there were approximately $444.2 million, or 42%, of costs to complete of $1.8 billion.related to these site improvements. The Company does not believe there will bepresently anticipate any draws upon these bonds but if there were any, theythat would not have a material effect on the Company’sits consolidated financial position, results of operations or cash flows.
77statements.
LENNAR CORPORATION AND SUBSIDIARIES
NOTES TO CONSOLIDATED FINANCIAL STATEMENTS—(Continued)
20.18. Supplemental Financial Information
The Company’s obligations to pay principal, premium, if any, and interest under its NewCredit Facility, senior floating-rate notes due 2009, 7 5/8% senior notes due 2009, 5.125% senior notes due 2010, 5.95% senior notes due 2011, 5.95% senior notes due 2013, 5.50% senior notes due 2014, 5.60% senior notes due 2015 and 6.50% senior notes due 2016 are guaranteed by substantially all of the Company’s subsidiaries other than finance company subsidiaries. The guarantees are full and unconditional and the guarantor subsidiaries are 100% directly or indirectly owned by Lennar Corporation. The guarantees are joint and several, subject to limitations as to each guarantor designed to eliminate fraudulent conveyance concerns. The Company has determined that separate, full financial statements of the guarantors would not be material to investors and, accordingly, supplemental financial information for the guarantors is presented as follows:
Consolidating Balance Sheet
November 30, 20062008
| Lennar Corporation | Guarantor Subsidiaries | Non-Guarantor Subsidiaries | Eliminations | Total | Lennar Corporation | Guarantor Subsidiaries | Non-Guarantor Subsidiaries | Eliminations | Total | |||||||||||||||||||
| (In thousands) | (In thousands) | |||||||||||||||||||||||||||
| ASSETS | ||||||||||||||||||||||||||||
Homebuilding: | ||||||||||||||||||||||||||||
Cash, restricted cash and receivables, net | $ | 422,373 | 395,261 | 27,867 | — | 845,501 | ||||||||||||||||||||||
Cash and cash equivalents, restricted cash, receivables, net and income tax receivables | $ | 1,263,623 | 165,060 | 21,593 | — | 1,450,276 | ||||||||||||||||||||||
Inventories | — | 7,523,554 | 307,929 | — | 7,831,483 | — | 3,975,084 | 525,006 | — | 4,500,090 | ||||||||||||||||||
Investments in unconsolidated entities | — | 1,435,346 | 11,832 | — | 1,447,178 | — | 751,613 | 15,139 | — | 766,752 | ||||||||||||||||||
Goodwill | — | 196,638 | — | — | 196,638 | |||||||||||||||||||||||
Other assets | 360,708 | 104,200 | 9,182 | — | 474,090 | 30,420 | 64,515 | 4,867 | — | 99,802 | ||||||||||||||||||
Investments in subsidiaries | 7,839,517 | 486,461 | — | (8,325,978 | ) | — | 4,314,255 | 635,413 | — | (4,949,668 | ) | — | ||||||||||||||||
| 8,622,598 | 10,141,460 | 356,810 | (8,325,978 | ) | 10,794,890 | 5,608,298 | 5,591,685 | 566,605 | (4,949,668 | ) | 6,816,920 | |||||||||||||||||
Financial services | — | 25,108 | 1,588,268 | — | 1,613,376 | — | 8,332 | 599,646 | — | 607,978 | ||||||||||||||||||
Total assets | $ | 8,622,598 | 10,166,568 | 1,945,078 | (8,325,978 | ) | 12,408,266 | $ | 5,608,298 | 5,600,017 | 1,166,251 | (4,949,668 | ) | 7,424,898 | ||||||||||||||
LIABILITIES AND STOCKHOLDERS’ EQUITY | ||||||||||||||||||||||||||||
Homebuilding: | ||||||||||||||||||||||||||||
Accounts payable and other liabilities | $ | 605,834 | 1,644,304 | 91,922 | — | 2,342,060 | $ | 269,457 | 700,411 | 111,732 | — | 1,081,600 | ||||||||||||||||
Liabilities related to consolidated inventory not owned | — | 333,723 | — | — | 333,723 | — | 592,777 | — | — | 592,777 | ||||||||||||||||||
Senior notes and other debts payable | 2,471,928 | 53,720 | 87,855 | — | 2,613,503 | 2,176,758 | 130,126 | 238,051 | — | 2,544,935 | ||||||||||||||||||
Intercompany | (156,536 | ) | 288,570 | (132,034 | ) | — | — | 539,076 | (140,463 | ) | (398,613 | ) | — | — | ||||||||||||||
| 2,921,226 | 2,320,317 | 47,743 | — | 5,289,286 | 2,985,291 | 1,282,851 | (48,830 | ) | — | 4,219,312 | ||||||||||||||||||
Financial services | — | 6,734 | 1,355,481 | — | 1,362,215 | — | 2,911 | 413,922 | — | 416,833 | ||||||||||||||||||
Total liabilities | 2,921,226 | 2,327,051 | 1,403,224 | — | 6,651,501 | 2,985,291 | 1,285,762 | 365,092 | — | 4,636,145 | ||||||||||||||||||
Minority interest | — | — | 55,393 | — | 55,393 | — | — | 165,746 | — | 165,746 | ||||||||||||||||||
Stockholders’ equity | 5,701,372 | 7,839,517 | 486,461 | (8,325,978 | ) | 5,701,372 | 2,623,007 | 4,314,255 | 635,413 | (4,949,668 | ) | 2,623,007 | ||||||||||||||||
Total liabilities and stockholders’ equity | $ | 8,622,598 | 10,166,568 | 1,945,078 | (8,325,978 | ) | 12,408,266 | $ | 5,608,298 | 5,600,017 | 1,166,251 | (4,949,668 | ) | 7,424,898 | ||||||||||||||
78
LENNAR CORPORATION AND SUBSIDIARIES
NOTES TO CONSOLIDATED FINANCIAL STATEMENTS—(Continued)
Consolidating Balance Sheet
November 30, 20052007
| Lennar Corporation | Guarantor Subsidiaries | Non-Guarantor Subsidiaries | Eliminations | Total | Lennar Corporation | Guarantor Subsidiaries | Non-Guarantor Subsidiaries | Eliminations | Total | |||||||||||||||||||
| (In thousands) | (In thousands) | |||||||||||||||||||||||||||
| ASSETS | ||||||||||||||||||||||||||||
Homebuilding: | ||||||||||||||||||||||||||||
Cash, restricted cash and receivables, net | $ | 401,467 | 816,971 | 13,032 | — | 1,231,470 | ||||||||||||||||||||||
Cash and cash equivalents, restricted cash, receivables, net and income tax receivables | $ | 1,380,797 | 380,226 | 6,089 | — | 1,767,112 | ||||||||||||||||||||||
Inventories | — | 7,619,470 | 244,061 | — | 7,863,531 | — | 4,359,217 | 141,186 | — | 4,500,403 | ||||||||||||||||||
Investments in unconsolidated entities | — | 1,282,686 | — | — | 1,282,686 | — | 920,105 | 14,166 | — | 934,271 | ||||||||||||||||||
Goodwill | — | 195,156 | — | — | 195,156 | |||||||||||||||||||||||
Other assets | 80,838 | 121,354 | 64,555 | — | 266,747 | 778,901 | 83,252 | 999 | — | 863,152 | ||||||||||||||||||
Investments in subsidiaries | 7,150,775 | 500,342 | — | (7,651,117 | ) | — | 4,835,490 | 448,755 | — | (5,284,245 | ) | — | ||||||||||||||||
| 7,633,080 | 10,535,979 | 321,648 | (7,651,117 | ) | 10,839,590 | 6,995,188 | 6,191,555 | 162,440 | (5,284,245 | ) | 8,064,938 | |||||||||||||||||
Financial services | — | 29,341 | 1,672,294 | — | 1,701,635 | — | 14,899 | 1,022,910 | — | 1,037,809 | ||||||||||||||||||
Total assets | $ | 7,633,080 | 10,565,320 | 1,993,942 | (7,651,117 | ) | 12,541,225 | $ | 6,995,188 | 6,206,454 | 1,185,350 | (5,284,245 | ) | 9,102,747 | ||||||||||||||
LIABILITIES AND STOCKHOLDERS’ EQUITY | ||||||||||||||||||||||||||||
Homebuilding: | ||||||||||||||||||||||||||||
Accounts payable and other liabilities | $ | 1,026,281 | 1,783,582 | 64,791 | — | 2,874,654 | $ | 206,725 | 1,255,810 | 43,390 | — | 1,505,925 | ||||||||||||||||
Liabilities related to consolidated inventory not owned | — | 306,445 | — | — | 306,445 | — | 719,081 | — | — | 719,081 | ||||||||||||||||||
Senior notes and other debts payable | 2,328,016 | 250,642 | 14,114 | — | 2,592,772 | 2,174,418 | 24,903 | 96,115 | — | 2,295,436 | ||||||||||||||||||
Intercompany | (972,628 | ) | 1,066,147 | (93,519 | ) | — | — | 791,926 | (629,134 | ) | (162,792 | ) | — | — | ||||||||||||||
| 2,381,669 | 3,406,816 | (14,614 | ) | — | 5,773,871 | 3,173,069 | 1,370,660 | (23,287 | ) | — | 4,520,442 | |||||||||||||||||
Financial services | — | 7,729 | 1,429,971 | — | 1,437,700 | — | 304 | 731,354 | — | 731,658 | ||||||||||||||||||
Total liabilities | 2,381,669 | 3,414,545 | 1,415,357 | — | 7,211,571 | 3,173,069 | 1,370,964 | 708,067 | — | 5,252,100 | ||||||||||||||||||
Minority interest | — | — | 78,243 | — | 78,243 | — | — | 28,528 | — | 28,528 | ||||||||||||||||||
Stockholders’ equity | 5,251,411 | 7,150,775 | 500,342 | (7,651,117 | ) | 5,251,411 | 3,822,119 | 4,835,490 | 448,755 | (5,284,245 | ) | 3,822,119 | ||||||||||||||||
Total liabilities and stockholders’ equity | $ | 7,633,080 | 10,565,320 | 1,993,942 | (7,651,117 | ) | 12,541,225 | $ | 6,995,188 | 6,206,454 | 1,185,350 | (5,284,245 | ) | 9,102,747 | ||||||||||||||
79
LENNAR CORPORATION AND SUBSIDIARIES
NOTES TO CONSOLIDATED FINANCIAL STATEMENTS—(Continued)
Consolidating Statement of EarningsOperations
Year Ended November 30, 20062008
| Lennar Corporation | Guarantor Subsidiaries | Non-Guarantor Subsidiaries | Eliminations | Total | Lennar Corporation | Guarantor Subsidiaries | Non-Guarantor Subsidiaries | Eliminations | Total | ||||||||||||||||||||||
| (In thousands) | (In thousands) | ||||||||||||||||||||||||||||||
Revenues: | |||||||||||||||||||||||||||||||
Homebuilding | $ | — | 15,314,843 | 308,197 | — | 15,623,040 | $ | — | 4,262,154 | 288 | 596 | 4,263,038 | |||||||||||||||||||
Financial services | — | 9,497 | 687,091 | (52,966 | ) | 643,622 | — | 6,426 | 379,624 | (73,671 | ) | 312,379 | |||||||||||||||||||
Total revenues | — | 15,324,340 | 995,288 | (52,966 | ) | 16,266,662 | — | 4,268,580 | 379,912 | (73,075 | ) | 4,575,417 | |||||||||||||||||||
Costs and expenses: | |||||||||||||||||||||||||||||||
Homebuilding | — | 14,431,385 | 255,720 | (9,540 | ) | 14,677,565 | — | 4,549,804 | 2,458 | (10,381 | ) | 4,541,881 | |||||||||||||||||||
Financial services | — | 28,310 | 523,959 | (58,450 | ) | 493,819 | — | 3,359 | 391,854 | (51,844 | ) | 343,369 | |||||||||||||||||||
Corporate general and administrative | 193,307 | — | — | — | 193,307 | 129,752 | — | — | — | 129,752 | |||||||||||||||||||||
Total costs and expenses | 193,307 | 14,459,695 | 779,679 | (67,990 | ) | 15,364,691 | 129,752 | 4,553,163 | 394,312 | (62,225 | ) | 5,015,002 | |||||||||||||||||||
Gain on recapitalization of unconsolidated entity | — | 133,097 | — | — | 133,097 | ||||||||||||||||||||||||||
Equity in loss from unconsolidated entities | — | (12,536 | ) | — | — | (12,536 | ) | — | (59,156 | ) | — | — | (59,156 | ) | |||||||||||||||||
Management fees and other income, net | 15,024 | 62,387 | 4,242 | (15,024 | ) | 66,629 | |||||||||||||||||||||||||
Minority interest expense, net | — | — | 13,415 | — | 13,415 | ||||||||||||||||||||||||||
Management fees and other expense, net | (10,850 | ) | (199,981 | ) | — | 10,850 | (199,981 | ) | |||||||||||||||||||||||
Minority interest income, net | — | — | 4,097 | — | 4,097 | ||||||||||||||||||||||||||
Earnings (loss) before provision (benefit) for income taxes | (178,283 | ) | 914,496 | 206,436 | — | 942,649 | |||||||||||||||||||||||||
Provision (benefit) for income taxes | (65,965 | ) | 338,364 | 76,381 | — | 348,780 | |||||||||||||||||||||||||
Equity in earnings from subsidiaries | 706,187 | 130,055 | — | (836,242 | ) | — | |||||||||||||||||||||||||
Loss before (provision) benefit for income taxes | (140,602 | ) | (410,623 | ) | (10,303 | ) | — | (561,528 | ) | ||||||||||||||||||||||
(Provision) benefit for income taxes | (150,494 | ) | (400,398 | ) | 3,335 | — | (547,557 | ) | |||||||||||||||||||||||
Equity in loss from subsidiaries | (817,989 | ) | (6,968 | ) | — | 824,957 | — | ||||||||||||||||||||||||
Net earnings | $ | 593,869 | 706,187 | 130,055 | (836,242 | ) | 593,869 | ||||||||||||||||||||||||
Net loss | $ | (1,109,085 | ) | (817,989 | ) | (6,968 | ) | 824,957 | (1,109,085 | ) | |||||||||||||||||||||
Consolidating Statement of EarningsOperations
Year Ended November 30, 20052007
| Lennar Corporation | Guarantor Subsidiaries | Non-Guarantor Subsidiaries | Eliminations | Total | Lennar Corporation | Guarantor Subsidiaries | Non-Guarantor Subsidiaries | Eliminations | Total | ||||||||||||||||||||
| (Dollars in thousands) | (In thousands) | ||||||||||||||||||||||||||||
Revenues: | |||||||||||||||||||||||||||||
Homebuilding | $ | — | 12,908,793 | 395,806 | — | 13,304,599 | $ | — | 9,710,626 | 19,626 | — | 9,730,252 | |||||||||||||||||
Financial services | — | 9,109 | 586,424 | (33,161 | ) | 562,372 | — | 9,125 | 503,266 | (55,862 | ) | 456,529 | |||||||||||||||||
Total revenues | — | 12,917,902 | 982,230 | (33,161 | ) | 13,866,971 | — | 9,719,751 | 522,892 | (55,862 | ) | 10,186,781 | |||||||||||||||||
Costs and expenses: | |||||||||||||||||||||||||||||
Homebuilding | — | 10,922,398 | 297,221 | (4,375 | ) | 11,215,244 | — | 12,165,338 | 64,943 | (41,204 | ) | 12,189,077 | |||||||||||||||||
Financial services | — | 11,915 | 471,728 | (26,039 | ) | 457,604 | — | 22,063 | 451,804 | (23,458 | ) | 450,409 | |||||||||||||||||
Corporate general and administrative | 187,257 | — | — | — | 187,257 | 173,202 | — | — | — | 173,202 | |||||||||||||||||||
Total costs and expenses | 187,257 | 10,934,313 | 768,949 | (30,414 | ) | 11,860,105 | 173,202 | 12,187,401 | 516,747 | (64,662 | ) | 12,812,688 | |||||||||||||||||
Equity in earnings from unconsolidated entities | — | 133,814 | — | — | 133,814 | ||||||||||||||||||||||||
Gain on recapitalization of unconsolidated entity | — | 175,879 | — | — | 175,879 | ||||||||||||||||||||||||
Goodwill impairments | — | (190,198 | ) | — | — | (190,198 | ) | ||||||||||||||||||||||
Equity in loss from unconsolidated entities | — | (362,899 | ) | — | — | (362,899 | ) | ||||||||||||||||||||||
Management fees and other income (expense), net | (2,747 | ) | 97,588 | 1,364 | 2,747 | 98,952 | 8,800 | (76,029 | ) | — | (8,800 | ) | (76,029 | ) | |||||||||||||||
Minority interest expense, net | — | — | 45,030 | — | 45,030 | — | — | (1,927 | ) | — | (1,927 | ) | |||||||||||||||||
Loss on redemption of 9.95% senior notes | 34,908 | — | — | — | 34,908 | ||||||||||||||||||||||||
Earnings (loss) from continuing operations before provision (benefit) for income taxes | (224,912 | ) | 2,214,991 | 169,615 | — | 2,159,694 | |||||||||||||||||||||||
Provision (benefit) for income taxes | (84,904 | ) | 836,159 | 64,029 | — | 815,284 | |||||||||||||||||||||||
Earnings (loss) before (provision) benefit for income taxes | (164,402 | ) | (2,920,897 | ) | 4,218 | — | (3,081,081 | ) | |||||||||||||||||||||
(Provision) benefit for income taxes | 60,829 | 1,080,732 | (1,561 | ) | — | 1,140,000 | |||||||||||||||||||||||
Equity in earnings (loss) from subsidiaries | (1,837,508 | ) | 2,657 | — | 1,834,851 | — | |||||||||||||||||||||||
Earnings (loss) from continuing operations | (140,008 | ) | 1,378,832 | 105,586 | — | 1,344,410 | |||||||||||||||||||||||
Earnings from discontinued operations, net of tax | — | — | 10,745 | — | 10,745 | ||||||||||||||||||||||||
Equity in earnings from subsidiaries | 1,495,163 | 116,331 | — | (1,611,494 | ) | — | |||||||||||||||||||||||
Net earnings (loss) | $ | (1,941,081 | ) | (1,837,508 | ) | 2,657 | 1,834,851 | (1,941,081 | ) | ||||||||||||||||||||
Net earnings | $ | 1,355,155 | 1,495,163 | 116,331 | (1,611,494 | ) | 1,355,155 | ||||||||||||||||||||||
80
LENNAR CORPORATION AND SUBSIDIARIES
NOTES TO CONSOLIDATED FINANCIAL STATEMENTS—(Continued)
Consolidating Statement of EarningsOperations
Year Ended November 30, 20042006
| Lennar Corporation | Guarantor Subsidiaries | Non-Guarantor Subsidiaries | Eliminations | Total | Lennar Corporation | Guarantor Subsidiaries | Non-Guarantor Subsidiaries | Eliminations | Total | |||||||||||||||||||||
| (In thousands) | (In thousands) | |||||||||||||||||||||||||||||
Revenues: | ||||||||||||||||||||||||||||||
Homebuilding | $ | — | 9,688,964 | 311,668 | — | 10,000,632 | $ | — | 15,314,843 | 308,197 | — | 15,623,040 | ||||||||||||||||||
Financial services | — | 18,000 | 510,322 | (27,986 | ) | 500,336 | — | 9,497 | 687,091 | (52,966 | ) | 643,622 | ||||||||||||||||||
Total revenues | — | 9,706,964 | 821,990 | (27,986 | ) | 10,500,968 | — | 15,324,340 | 995,288 | (52,966 | ) | 16,266,662 | ||||||||||||||||||
Costs and expenses: | ||||||||||||||||||||||||||||||
Homebuilding | — | 8,385,081 | 247,681 | (2,995 | ) | 8,629,767 | — | 14,431,385 | 255,720 | (9,540 | ) | 14,677,565 | ||||||||||||||||||
Financial services | — | 14,736 | 399,860 | (24,991 | ) | 389,605 | — | 28,310 | 523,959 | (58,450 | ) | 493,819 | ||||||||||||||||||
Corporate general and administrative | 141,722 | — | — | — | 141,722 | 193,307 | — | — | — | 193,307 | ||||||||||||||||||||
Total costs and expenses | 141,722 | 8,399,817 | 647,541 | (27,986 | ) | 9,161,094 | 193,307 | 14,459,695 | 779,679 | (67,990 | ) | 15,364,691 | ||||||||||||||||||
Equity in earnings from unconsolidated entities | — | 90,739 | — | — | 90,739 | |||||||||||||||||||||||||
Management fees and other income (expense), net | — | 97,959 | (279 | ) | — | 97,680 | ||||||||||||||||||||||||
Equity in loss from unconsolidated entities | — | (12,536 | ) | — | — | (12,536 | ) | |||||||||||||||||||||||
Management fees and other income, net | 15,024 | 62,387 | 4,242 | (15,024 | ) | 66,629 | ||||||||||||||||||||||||
Minority interest expense, net | — | — | 10,796 | — | 10,796 | — | — | (13,415 | ) | — | (13,415 | ) | ||||||||||||||||||
Earnings (loss) from continuing operations before provision (benefit) for income taxes | (141,722 | ) | 1,495,845 | 163,374 | — | 1,517,497 | ||||||||||||||||||||||||
Provision (benefit) for income taxes | (53,500 | ) | 564,681 | 61,674 | — | 572,855 | ||||||||||||||||||||||||
Earnings (loss) from continuing operations | (88,222 | ) | 931,164 | 101,700 | — | 944,642 | ||||||||||||||||||||||||
Earnings from discontinued operations, net of tax | — | — | 977 | — | 977 | |||||||||||||||||||||||||
Earnings (loss) before (provision) benefit for income taxes | (178,283 | ) | 914,496 | 206,436 | — | 942,649 | ||||||||||||||||||||||||
(Provision) benefit for income taxes | 65,965 | (338,364 | ) | (76,381 | ) | — | (348,780 | ) | ||||||||||||||||||||||
Equity in earnings from subsidiaries | 1,033,841 | 102,677 | — | (1,136,518 | ) | — | 706,187 | 130,055 | — | (836,242 | ) | — | ||||||||||||||||||
Net earnings | $ | 945,619 | 1,033,841 | 102,677 | (1,136,518 | ) | 945,619 | $ | 593,869 | 706,187 | 130,055 | (836,242 | ) | 593,869 | ||||||||||||||||
LENNAR CORPORATION AND SUBSIDIARIES
81
Consolidating Statement of Cash Flows
Year Ended November 30, 2008
| Lennar Corporation | Guarantor Subsidiaries | Non-Guarantor Subsidiaries | Eliminations | Total | ||||||||||||
| (Dollars in thousands) | ||||||||||||||||
Cash flows from operating activities: | ||||||||||||||||
Net loss | $ | (1,109,085 | ) | (817,989 | ) | (6,968 | ) | 824,957 | (1,109,085 | ) | ||||||
Adjustments to reconcile net loss to net cash provided by operating activities | 1,291,030 | 1,459,469 | 284,377 | (824,957 | ) | 2,209,919 | ||||||||||
Net cash provided by operating activities | 181,945 | 641,480 | 277,409 | — | 1,100,834 | |||||||||||
Cash flows from investing activities: | ||||||||||||||||
Increase in investments in unconsolidated entities, net | — | (315,907 | ) | — | — | (315,907 | ) | |||||||||
Other | (423 | ) | 1,857 | 48,770 | — | 50,204 | ||||||||||
Net cash provided by (used in) investing activities | (423 | ) | (314,050 | ) | 48,770 | — | (265,703 | ) | ||||||||
Cash flows from financing activities: | ||||||||||||||||
Net repayments under financial services debt | — | — | (315,654 | ) | — | (315,654 | ) | |||||||||
Net repayments under other borrowings | — | (61,981 | ) | (66,526 | ) | — | (128,507 | ) | ||||||||
Partial redemption of 7 5/8% senior notes due 2009 | (322 | ) | — | — | — | (322 | ) | |||||||||
Exercise of land option contracts from an unconsolidated land investment venture | — | (48,434 | ) | — | — | (48,434 | ) | |||||||||
Net payments related to minority interests | — | — | 151,035 | — | 151,035 | |||||||||||
Common stock: | ||||||||||||||||
Issuances | 224 | — | — | — | 224 | |||||||||||
Repurchases | (1,758 | ) | — | — | — | (1,758 | ) | |||||||||
Dividends | (83,487 | ) | — | — | — | (83,487 | ) | |||||||||
Intercompany | 414,031 | (292,787 | ) | (121,244 | ) | — | — | |||||||||
Net cash provided by (used in) financing activities | 328,688 | (403,202 | ) | (352,389 | ) | — | (426,903 | ) | ||||||||
Net increase (decrease) in cash and cash equivalents | 510,210 | (75,772 | ) | (26,210 | ) | — | 408,228 | |||||||||
Cash and cash equivalents at beginning of year | 497,384 | 139,733 | 158,077 | — | 795,194 | |||||||||||
Cash and cash equivalents at end of year | $ | 1,007,594 | 63,961 | 131,867 | — | 1,203,422 | ||||||||||
LENNAR CORPORATION AND SUBSIDIARIES
NOTES TO CONSOLIDATED FINANCIAL STATEMENTS—(Continued)
Consolidating Statement of Cash Flows
Year Ended November 30, 2007
| Lennar Corporation | Guarantor Subsidiaries | Non-Guarantor Subsidiaries | Eliminations | Total | ||||||||||||
| (Dollars in thousands) | ||||||||||||||||
Cash flows from operating activities: | ||||||||||||||||
Net earnings (loss) | $ | (1,941,081 | ) | (1,837,508 | ) | 2,657 | 1,834,851 | (1,941,081 | ) | |||||||
Adjustments to reconcile net earnings (loss) to net cash provided by (used in) operating activities | (1,915,832 | ) | 5,305,931 | 830,346 | (1,834,851 | ) | 2,385,594 | |||||||||
Net cash provided by (used in) operating activities | (3,856,913 | ) | 3,468,423 | 833,003 | — | 444,513 | ||||||||||
Cash flows from investing activities: | ||||||||||||||||
Increase in investments in unconsolidated entities, net | — | (65,611 | ) | — | — | (65,611 | ) | |||||||||
Distributions in excess on investment in unconsolidated entity | — | 354,644 | — | — | 354,644 | |||||||||||
Other | (1,355 | ) | (16,353 | ) | 35,658 | — | 17,950 | |||||||||
Net cash provided by (used in) investing activities | (1,355 | ) | 272,680 | 35,658 | — | 306,983 | ||||||||||
Cash flows from financing activities: | ||||||||||||||||
Net repayments under financial services debt | — | — | (607,794 | ) | — | (607,794 | ) | |||||||||
Net proceeds from sale of land to an unconsolidated land investment venture | — | 445,000 | — | — | 445,000 | |||||||||||
Redemption of senior floating-rate notes due 2009 | (300,000 | ) | — | — | — | (300,000 | ) | |||||||||
Net repayments under other borrowings | — | (66,209 | ) | (90,157 | ) | — | (156,366 | ) | ||||||||
Net payments related to minority interests | — | — | (36,545 | ) | — | (36,545 | ) | |||||||||
Excess tax benefits from share-based awards | 4,590 | — | — | — | 4,590 | |||||||||||
Common stock: | ||||||||||||||||
Issuances | 21,588 | — | — | — | 21,588 | |||||||||||
Repurchases | (3,971 | ) | — | — | — | (3,971 | ) | |||||||||
Dividends | (101,123 | ) | — | — | — | (101,123 | ) | |||||||||
Intercompany | 4,313,723 | (4,198,614 | ) | (115,109 | ) | — | — | |||||||||
Net cash provided by (used in) financing activities | 3,934,807 | (3,819,823 | ) | (849,605 | ) | — | (734,621 | ) | ||||||||
Net increase (decrease) in cash and cash equivalents | 76,539 | (78,720 | ) | 19,056 | — | 16,875 | ||||||||||
Cash and cash equivalents at beginning of year | 420,845 | 218,453 | 139,021 | — | 778,319 | |||||||||||
Cash and cash equivalents at end of year | $ | 497,384 | 139,733 | 158,077 | — | 795,194 | ||||||||||
LENNAR CORPORATION AND SUBSIDIARIES
NOTES TO CONSOLIDATED FINANCIAL STATEMENTS—(Continued)
Consolidating Statement of Cash Flows
Year Ended November 30, 2006
| Lennar Corporation | Guarantor Subsidiaries | Non-Guarantor Subsidiaries | Eliminations | Total | Lennar Corporation | Guarantor Subsidiaries | Non-Guarantor Subsidiaries | Eliminations | Total | |||||||||||||||||||||||
| (Dollars in thousands) | (Dollars in thousands) | |||||||||||||||||||||||||||||||
Cash flows from operating activities: | ||||||||||||||||||||||||||||||||
Net earnings from continuing operations | $ | 593,869 | 706,187 | 130,055 | (836,242 | ) | 593,869 | |||||||||||||||||||||||||
Net earnings | $ | 593,869 | 706,187 | 130,055 | (836,242 | ) | 593,869 | |||||||||||||||||||||||||
Adjustments to reconcile net earnings to net cash provided by (used in) operating activities | (623,428 | ) | (764,757 | ) | 512,724 | 836,242 | (39,219 | ) | (623,428 | ) | (766,872 | ) | 512,724 | 836,242 | (41,334 | ) | ||||||||||||||||
Net cash provided by (used in) operating activities | (29,559 | ) | (58,570 | ) | 642,779 | — | 554,650 | (29,559 | ) | (60,685 | ) | 642,779 | — | 552,535 | ||||||||||||||||||
Cash flows from investing activities: | ||||||||||||||||||||||||||||||||
Increase in investments in unconsolidated entities, net | — | (407,694 | ) | — | — | (407,694 | ) | — | (407,694 | ) | — | — | (407,694 | ) | ||||||||||||||||||
Acquisitions, net of cash acquired | — | (30,329 | ) | (2,884 | ) | — | (33,213 | ) | — | (30,329 | ) | (2,884 | ) | — | (33,213 | ) | ||||||||||||||||
Other | (5,927 | ) | (6,766 | ) | 47,131 | — | 34,438 | (5,927 | ) | (4,651 | ) | 47,131 | — | 36,553 | ||||||||||||||||||
Net cash provided by (used in) investing activities | (5,927 | ) | (444,789 | ) | 44,247 | — | (406,469 | ) | (5,927 | ) | (442,674 | ) | 44,247 | — | (404,354 | ) | ||||||||||||||||
Cash flows from financing activities: | ||||||||||||||||||||||||||||||||
Net repayments under financial services debt | — | — | (120,858 | ) | — | (120,858 | ) | — | — | (120,858 | ) | — | (120,858 | ) | ||||||||||||||||||
Net proceeds from 5.95% senior notes | 248,665 | — | — | — | 248,665 | 248,665 | — | — | — | 248,665 | ||||||||||||||||||||||
Net proceeds from 6.50% senior notes | 248,933 | — | — | — | 248,933 | 248,933 | — | — | — | 248,933 | ||||||||||||||||||||||
Redemption of senior floating-rate notes due 2007 | (200,000 | ) | — | — | — | (200,000 | ) | (200,000 | ) | — | — | — | (200,000 | ) | ||||||||||||||||||
Net repayments under other debt | (2,336 | ) | (138,161 | ) | (7,807 | ) | — | (148,304 | ) | |||||||||||||||||||||||
Net repayments under other borrowings | (2,336 | ) | (138,161 | ) | (7,807 | ) | — | (148,304 | ) | |||||||||||||||||||||||
Net payments related to minority interests | — | — | (71,351 | ) | — | (71,351 | ) | — | — | (71,351 | ) | — | (71,351 | ) | ||||||||||||||||||
Excess tax benefits from share-based awards | 7,103 | — | — | — | 7,103 | 7,103 | — | — | — | 7,103 | ||||||||||||||||||||||
Common stock: | ||||||||||||||||||||||||||||||||
Issuances | 31,131 | — | — | — | 31,131 | 31,131 | — | — | — | 31,131 | ||||||||||||||||||||||
Repurchases | (323,229 | ) | — | — | — | (323,229 | ) | (323,229 | ) | — | — | — | (323,229 | ) | ||||||||||||||||||
Dividends | (101,295 | ) | — | — | — | (101,295 | ) | (101,295 | ) | — | — | — | (101,295 | ) | ||||||||||||||||||
Intercompany | 145,892 | 364,892 | (510,784 | ) | — | — | 145,892 | 364,892 | (510,784 | ) | — | — | ||||||||||||||||||||
Net cash provided by (used in) financing activities | 54,864 | 226,731 | (710,800 | ) | — | (429,205 | ) | 54,864 | 226,731 | (710,800 | ) | — | (429,205 | ) | ||||||||||||||||||
Net increase (decrease) in cash | 19,378 | (276,628 | ) | (23,774 | ) | — | (281,024 | ) | ||||||||||||||||||||||||
Cash at beginning of year | 401,467 | 495,081 | 162,795 | — | 1,059,343 | |||||||||||||||||||||||||||
Net increase (decrease) in cash and cash equivalents | 19,378 | (276,628 | ) | (23,774 | ) | — | (281,024 | ) | ||||||||||||||||||||||||
Cash and cash equivalents at beginning of year | 401,467 | 495,081 | 162,795 | — | 1,059,343 | |||||||||||||||||||||||||||
Cash at end of year | $ | 420,845 | 218,453 | 139,021 | — | 778,319 | ||||||||||||||||||||||||||
Cash and cash equivalents at end of year | $ | 420,845 | 218,453 | 139,021 | — | 778,319 | ||||||||||||||||||||||||||
82
LENNAR CORPORATION AND SUBSIDIARIES
NOTES TO CONSOLIDATED FINANCIAL STATEMENTS—(Continued)
Consolidating Statement of Cash Flows
Year Ended November 30, 2005
| Lennar Corporation | Guarantor Subsidiaries | Non-Guarantor Subsidiaries | Eliminations | Total | ||||||||||||
| (Dollars in thousands) | ||||||||||||||||
Cash flows from operating activities: | ||||||||||||||||
Net earnings from continuing operations | $ | 1,355,155 | 1,495,163 | 105,586 | (1,611,494 | ) | 1,344,410 | |||||||||
Net earnings from discontinued operations | — | — | 10,745 | — | 10,745 | |||||||||||
Adjustments to reconcile net earnings to net cash provided by (used in) operating activities | (1,091,091 | ) | (1,325,709 | ) | (226,874 | ) | 1,611,494 | (1,032,180 | ) | |||||||
Net cash provided by (used in) operating activities | 264,064 | 169,454 | (110,543 | ) | — | 322,975 | ||||||||||
Cash flows from investing activities: | ||||||||||||||||
Increase in investments in unconsolidated entities, net | — | (453,017 | ) | — | — | (453,017 | ) | |||||||||
Acquisitions, net of cash acquired | — | (414,079 | ) | (1,970 | ) | — | (416,049 | ) | ||||||||
Other | (5,463 | ) | (22,151 | ) | (106,893 | ) | — | (134,507 | ) | |||||||
Net cash used in investing activities | (5,463 | ) | (889,247 | ) | (108,863 | ) | — | (1,003,573 | ) | |||||||
Cash flows from financing activities: | ||||||||||||||||
Net borrowings under financial services short-term debt | — | — | 372,849 | — | 372,849 | |||||||||||
Net proceeds from 5.125% senior notes | 298,215 | — | — | — | 298,215 | |||||||||||
Net proceeds from 5.60% senior notes | 501,460 | — | — | — | 501,460 | |||||||||||
Redemption of 9.95% senior notes | (337,731 | ) | — | — | — | (337,731 | ) | |||||||||
Net repayments under other borrowings | — | (75,209 | ) | (61,833 | ) | — | (137,042 | ) | ||||||||
Net payments related to minority interests | — | — | (33,181 | ) | — | (33,181 | ) | |||||||||
Common stock: | ||||||||||||||||
Issuances | 38,069 | — | — | — | 38,069 | |||||||||||
Repurchases | (289,284 | ) | — | — | — | (289,284 | ) | |||||||||
Dividends | (89,229 | ) | — | — | — | (89,229 | ) | |||||||||
Intercompany | (1,090,578 | ) | 1,146,903 | (56,325 | ) | — | — | |||||||||
Net cash provided by (used in) financing activities | (969,078 | ) | 1,071,694 | 221,510 | — | 324,126 | ||||||||||
Net increase (decrease) in cash | (710,477 | ) | 351,901 | 2,104 | — | (356,472 | ) | |||||||||
Cash at beginning of year | 1,111,944 | 143,180 | 160,691 | — | 1,415,815 | |||||||||||
Cash at end of year | $ | 401,467 | 495,081 | 162,795 | — | 1,059,343 | ||||||||||
83
LENNAR CORPORATION AND SUBSIDIARIES
NOTES TO CONSOLIDATED FINANCIAL STATEMENTS—(Continued)
Consolidating Statement of Cash Flows
Year Ended November 30, 2004
| Lennar Corporation | Guarantor Subsidiaries | Non-Guarantor Subsidiaries | Eliminations | Total | ||||||||||||
| (Dollars in thousands) | ||||||||||||||||
Cash flows from operating activities: | ||||||||||||||||
Net earnings from continuing operations | $ | 945,619 | 1,033,841 | 101,700 | (1,136,518 | ) | 944,642 | |||||||||
Net earnings from discontinued operations | — | — | 977 | — | 977 | |||||||||||
Adjustments to reconcile net earnings to net cash provided by (used in) operating activities | (576,392 | ) | (857,956 | ) | (227,597 | ) | 1,136,518 | (525,427 | ) | |||||||
Net cash provided by (used in) operating activities | 369,227 | 175,885 | (124,920 | ) | — | 420,192 | ||||||||||
Cash flows from investing activities: | ||||||||||||||||
Increase in investments in unconsolidated entities, net | — | (420,597 | ) | — | — | (420,597 | ) | |||||||||
Acquisitions, net of cash acquired | — | (93,082 | ) | (12,648 | ) | — | (105,730 | ) | ||||||||
Other | (15,110 | ) | 17,955 | (10,625 | ) | — | (7,780 | ) | ||||||||
Net cash used in investing activities | (15,110 | ) | (495,724 | ) | (23,273 | ) | — | (534,107 | ) | |||||||
Cash flows from financing activities: | ||||||||||||||||
Net borrowings under financial services debt | — | — | 162,277 | — | 162,277 | |||||||||||
Net proceeds from senior floating-rate notes due 2007 | 199,300 | — | — | — | 199,300 | |||||||||||
Net proceeds from senior floating-rate notes due 2009 | 298,500 | — | — | — | 298,500 | |||||||||||
Net proceeds from 5.50% senior notes | 245,480 | — | — | — | 245,480 | |||||||||||
Net repayments under term loan B and other borrowings | (296,000 | ) | (74,721 | ) | (33,368 | ) | — | (404,089 | ) | |||||||
Net payments related to minority interests | — | — | (18,396 | ) | — | (18,396 | ) | |||||||||
Common stock: | ||||||||||||||||
Issuances | 14,537 | — | — | — | 14,537 | |||||||||||
Repurchases | (113,582 | ) | — | — | — | (113,582 | ) | |||||||||
Dividends | (79,945 | ) | — | — | — | (79,945 | ) | |||||||||
Intercompany | (403,966 | ) | 274,080 | 129,886 | — | — | ||||||||||
Net cash provided by (used in) financing activities | (135,676 | ) | 199,359 | 240,399 | — | 304,082 | ||||||||||
Net increase (decrease) in cash | 218,441 | (120,480 | ) | 92,206 | — | 190,167 | ||||||||||
Cash at beginning of year | 893,503 | 263,660 | 68,485 | — | 1,225,648 | |||||||||||
Cash at end of year | $ | 1,111,944 | 143,180 | 160,691 | — | 1,415,815 | ||||||||||
84
LENNAR CORPORATION AND SUBSIDIARIES
NOTES TO CONSOLIDATED FINANCIAL STATEMENTS—(Continued)
21.19. Quarterly Data (unaudited)
| First | Second | Third | Fourth | |||||||
| (In thousands, except per share amounts) | ||||||||||
2006 | ||||||||||
Revenues | $ | 3,240,659 | 4,577,503 | 4,182,435 | 4,266,065 | |||||
Gross profit from sales of homes | $ | 727,923 | 946,508 | 729,198 | 336,812 | |||||
Earnings (loss) before provision (benefit) for income taxes | $ | 409,606 | 515,472 | 328,055 | (310,484 | ) | ||||
Net earnings (loss) | $ | 258,052 | 324,747 | 206,675 | (195,605 | ) | ||||
Earnings (loss) per share: | ||||||||||
Basic | $ | 1.64 | 2.04 | 1.31 | (1.24 | ) | ||||
Diluted | $ | 1.58 | 2.00 | 1.30 | (1.24 | ) | ||||
2005 | ||||||||||
Revenues | $ | 2,405,731 | 2,932,974 | 3,498,332 | 5,029,934 | |||||
Gross profit from sales of homes | $ | 544,443 | 654,082 | 846,448 | 1,256,473 | |||||
Earnings from continuing operations before provision for income taxes | $ | 309,645 | 374,689 | 541,772 | 933,588 | |||||
Earnings from discontinued operations before provision for income taxes | $ | 726 | 16,535 | — | — | |||||
Net earnings | $ | 193,206 | 243,537 | 337,253 | 581,159 | |||||
Basic earnings per share: | ||||||||||
Earnings from continuing operations | $ | 1.25 | 1.51 | 2.18 | 3.70 | |||||
Earnings from discontinued operations | $ | — | 0.07 | — | — | |||||
Net earnings | $ | 1.25 | 1.58 | 2.18 | 3.70 | |||||
Diluted earnings per share: | ||||||||||
Earnings from continuing operations | $ | 1.17 | 1.42 | 2.06 | 3.54 | |||||
Earnings from discontinued operations | $ | — | 0.06 | — | — | |||||
Net earnings | $ | 1.17 | 1.48 | 2.06 | 3.54 | |||||
| First | Second | Third | Fourth | ||||||||||
| (In thousands, except per share amounts) | |||||||||||||
2008 | |||||||||||||
Revenues | $ | 1,062,913 | 1,127,916 | 1,106,540 | 1,278,048 | ||||||||
Gross profit from sales of homes | $ | 136,695 | 88,366 | 147,122 | 137,444 | ||||||||
Loss before benefit for income taxes | $ | (154,294 | ) | (173,182 | ) | (139,102 | ) | (94,950 | ) | ||||
Net loss (1) | $ | (88,216 | ) | (120,916 | ) | (88,964 | ) | (810,989 | ) | ||||
Loss per share: | |||||||||||||
Basic and diluted | $ | (0.56 | ) | (0.76 | ) | (0.56 | ) | (5.12 | ) | ||||
2007 | |||||||||||||
Revenues | $ | 2,792,080 | 2,875,943 | 2,341,853 | 2,176,905 | ||||||||
Gross profit from sales of homes | $ | 360,896 | 193,205 | 997 | 15,574 | ||||||||
Earnings (loss) before provision (benefit) for income taxes | $ | 108,925 | (383,272 | ) | (837,643 | ) | (1,969,091 | ) | |||||
Net earnings (loss) | $ | 68,623 | (244,205 | ) | (513,852 | ) | (1,251,647 | ) | |||||
Earnings (loss) per share: | |||||||||||||
Basic | $ | 0.44 | (1.55 | ) | (3.25 | ) | (7.92 | ) | |||||
Diluted | $ | 0.43 | (1.55 | ) | (3.25 | ) | (7.92 | ) | |||||
| (1) | Net loss during the three months ended November 30, 2008 includes a $730.8 million valuation allowance recorded against the Company’s deferred tax assets. |
Quarterly and year-to-date computations of per share amounts are made independently. Therefore, the sum of per share amounts for the quarters may not agree with per share amounts for the year.
22. Subsequent Event
On December 29, 2006, the Company and LNR reached a definitive agreement to admit a new strategic partner into their LandSource joint venture (See Note 6 for additional information related to the LandSource joint venture). The transaction will result in a cash distribution to the Company and its current partner, LNR, of approximately $660 million each. For financial statement purposes, the transaction is expected to generate earnings of approximately $500 million for the Company, of which approximately $125 million will be recognized at closing and a potential of approximately $375 million could be realized over future years. The new partner will contribute cash and property with a combined value of approximately $900 million. Subsequent to the transaction, in addition to options the Company will have on certain LandSource assets, the Company will also have $153 million of specific performance options on other LandSource assets. Following the contribution and refinancing, the Company’s and LNR’s interest in LandSource will be diluted to 19% each, and the new partner will be issued a 62% interest in LandSource. The transaction is expected to close during the Company’s first quarter of 2007.
85
Item 9. Changes in and Disagreements With Accountants on Accounting and Financial Disclosure.
Not applicable.
Item 9A. Controls and Procedures.
Evaluation of Disclosure Controls and Procedures
Our Chief Executive Officer and Chief Financial Officer participated in an evaluation by our management of the effectiveness of our disclosure controls and procedures as of the end of our fiscal quarter that ended on November 30, 2006.2008. Based on their participation in that evaluation, our CEO and CFO concluded that our disclosure controls and procedures were effective as of November 30, 20062008 to ensure that information required to be disclosed in our reports filed or submitted under the Securities Exchange Act of 1934 is recorded, processed, summarized and reported within the time periods specified in the Securities and Exchange Commissions’sCommission’s rules and forms, and to ensure that information required to be disclosed in our reports filed or submitted under the Securities Exchange Act of 1934 is accumulated and communicated to our management, including our CEO and CFO, as appropriate to allow timely decisions regarding required disclosures.
Our CEO and CFO also participated in an evaluation by our management of any changes in our internal control over financial reporting that occurred during the quarter ended November 30, 2006.2008. That evaluation did not identify any changes that have materially affected, or are reasonably likely to materially affect, our internal control over financial reporting.
Management’s Annual Report on Internal Control Over Financial Reporting and the Report of Independent Registered Public Accounting Firm obtained from Deloitte & Touche LLP are included elsewhere in this document.
Item 9B. Other Information.
Not applicable.
86
PART III
Item 10. Directors, and Executive Officers of the Registrant.and Corporate Governance.
The information required by this item for executive officers is set forth under the heading “Executive Officers of Lennar Corporation” in Part I. The other information called for by this item is incorporated by reference to our definitive proxy statement, which will be filed with the Securities and Exchange Commission not later than March 30, 20072009 (120 days after the end of our fiscal year).
Item 11. Executive Compensation.
The information required by this item is incorporated by reference to our definitive proxy statement, which will be filed with the Securities and Exchange Commission not later than March 30, 20072009 (120 days after the end of our fiscal year).
Item 12. Security Ownership of Certain Beneficial Owners and Management and Related Stockholder Matters.
The information required by this item is incorporated by reference to our definitive proxy statement, which will be filed with the Securities and Exchange Commission not later than March 30, 20072009 (120 days after the end of our fiscal year), except for the information required by Item 201(d) of Regulation S-K, which is provided below.
The following table summarizes our equity compensation plans as of November 30, 2006:2008:
Plan category | Number of shares to be issued upon exercise of outstanding options, warrants and rights (a)(1) | Weighted-average (b) | Number of shares remaining (c)(2) | ||||
Equity compensation plans approved by stockholders | 7,200,712 | $ | 42.93 | 3,458,027 | |||
Equity compensation plans not approved by stockholders | — | — | — | ||||
Total | 7,200,712 | $ | 42.93 | 3,458,027 | |||
Plan category | Number of shares to be issued upon exercise of outstanding options, warrants and rights (a)(1) | Weighted- average exercise price of outstanding options, warrants and rights (b) | Number of shares remaining available for future issuance under equity compensation plans (excluding shares reflected in column (a)) (c)(2) | ||||
Equity compensation plans approved by stockholders | 8,761,204 | $ | 31.50 | 4,215,063 | |||
Equity compensation plans not approved by stockholders | — | — | — | ||||
Total | 8,761,204 | $ | 31.50 | 4,215,063 | |||
| (1) | This amount includes approximately |
| (2) | Both Class A and Class B common stock may be issued. |
Item 13. Certain Relationships and Related Transactions.Transactions, and Director Independence.
The information required by this item is incorporated by reference to our definitive proxy statement, which will be filed with the Securities and Exchange Commission not later than March 30, 20072009 (120 days after the end of our fiscal year).
Item 14. Principal AccountantAccounting Fees and Services.
The information required by this item is incorporated by reference to our definitive proxy statement, which will be filed with the Securities and Exchange Commission not later than March 30, 20072009 (120 days after the end of our fiscal year).
87
Item 15. Exhibits and Financial Statement Schedules.
(a) Documents filed as part of this Report.
| 1. | The following financial statements are contained in Item 8: |
Financial Statements | Page in Report | |
Consolidated Balance Sheets as of November 30, | ||
| 2. | The following financial statement schedule is included in this Report: |
Financial Statement Schedule | Page in Report | |
Information required by other schedules has either been incorporated in the consolidated financial statements and accompanying notes or is not applicable to us.
| 3. | The following exhibits are filed with this Report or incorporated by reference: |
| 2.1 | | Separation and Distribution Agreement, dated June 10, 1997, between Lennar and LNR Property Corporation—Incorporated by reference to Exhibit 10.1 of the Registration Statement on Form 10 of LNR Property Corporation filed with the Commission on July 31, 1997. |
| 3.1 | | |
| Amended and Restated Certificate of Incorporation, dated April 28, 1998—Incorporated by reference to Exhibit 3(a) of the Company’s Annual Report on Form 10-K for the fiscal year ended November 30, 2004. |
| 3.2 | | Certificate of Amendment to Certificate of Incorporation, dated April 9, 1999—Incorporated by reference to Exhibit 3(a) of the Company’s Annual Report on Form 10-K for the fiscal year ended November 30, 1999. |
| 3.3 | | Certificate of Amendment to Certificate of Incorporation, dated April 8, 2003—Incorporated by reference to Annex IV of the Company’s Proxy Statement on Schedule 14A dated March 10, 2003. |
| 3.4 | ||
| 3.5 | Bylaws of the Company, as amended through June 28, 2005—Incorporated by reference to Exhibit 3.1 of the Company’s Quarterly Report on Form 10-Q for the quarter ended May 31, 2005. | |
| 3.6 | Amendment to Section 3.3 of the Bylaws of the Company, dated April 8, 2008—Incorporated by reference to Exhibit 3.2 of the Company’s Current Report on Form 8-K, dated April 8, 2008. | |
| 4.1 | Indenture, dated as of December 31, 1997, between Lennar and Bank One Trust Company, N.A., as trustee—Incorporated by reference to Exhibit 4 of the Company’s Registration Statement on Form S-3, Registration No. 333-45527, filed with the Commission on February 3, 1998. | |
| 4.2 |
| Second Supplemental Indenture, dated as of February 19, 1999, between Lennar and Bank One Trust Company, N.A., as trustee (relating to Lennar’s 7 5/8% Senior Notes due 2009)—Incorporated by reference to Exhibit 4.1 of the Company’s Current Report on Form 8-K, dated February 19, 1999. | |
88
| 4.3 |
| Third Supplemental Indenture, dated May 3, 2000, between Lennar and Bank One Trust Company, N.A., as successor trustee (relating to Lennar’s 7 5/8% Senior Notes due 2009) | |
| 4.4 | | Sixth Supplemental Indenture, dated February 5, 2003, between Lennar and Bank One Trust Company, N.A., as trustee (relating to 5.950% Senior Notes due 2013)—Incorporated by reference to Exhibit 4.1 of the Company’s Current Report on Form 8-K, dated January 31, 2003. | |
| 4.5 | | ||
| Indenture, dated August 12, 2004, between Lennar and J.P. Morgan Trust Company, N.A., as trustee (relating to Lennar’s 5.50% Senior Notes due 2014)—Incorporated by reference to Exhibit 4.1 of the Company’s Registration Statement on Form S-4, Registration No. 333-121130, filed with the Commission on December 10, 2004. |
| 4.6 | | Indenture, dated April 28, 2005, between Lennar and J.P. Morgan Trust Company, N.A., as trustee (relating to Lennar’s 5.60% Senior Notes due 2015)—Incorporated by reference to Exhibit 4.1 of the Company’s Registration Statement on Form S-4, Registration No. 333-127839, filed with the Commission on August 25, 2005. | |
| 4.7 | | Indenture, dated September 15, 2005, between Lennar and J.P. Morgan Trust Company, N.A., as trustee (relating to Lennar’s 5.125% Senior Notes due 2010)—Incorporated by reference to Exhibit 4.1 of the Company’s Registration Statement on Form S-4, Registration No. 333-130923, filed with the Commission on January 9, 2006. | |
| 4.8 | | Indenture, dated April 26, 2006, between Lennar and J.P. Morgan Trust Company, N.A., as trustee (relating to Lennar’s 5.95% Senior Notes due 2011)—Incorporated by reference to Exhibit 10.1 of the Company’s Current Report on Form 8-K, dated April 26, 2006. | |
| 4.9 | | Indenture, dated April 26, 2006, between Lennar and J.P. Morgan Trust Company, N.A., as trustee (relating to Lennar’s 6.50% Senior Notes due 2016)—Incorporated by reference to Exhibit 10.2 of the Company’s Current Report on Form 8-K, dated April 26, 2006. | |
| 10.1 | * | Amended and Restated Lennar Corporation 1997 Stock Option Plan—Incorporated by reference to Exhibit 10(a) of the Company’s Annual Report on Form 10-K for the fiscal year ended November 30, 1997. | |
| 10.2 | * | Lennar Corporation 2000 Stock Option and Restricted Stock Plan—Incorporated by reference to Exhibit 10 of the Company’s Quarterly Report on Form 10-Q for the quarter ended February 28, 2001. | |
| 10.3 | * | Lennar Corporation 2003 Stock Option and Restricted Stock Plan—Incorporated by reference to Annex VI of the Company’s Proxy Statement on Schedule 14A dated March 10, 2003. | |
| 10.4 | * | Lennar Corporation | |
| 10.5 | * | ||
| 10.6 | * | Lennar Corporation Employee Stock Ownership Plan and Trust—Incorporated by reference to the Company’s Registration Statement on Form S-8, Registration No. 2-89104. | |
| 10.7 | * | Amendment dated December 13, 1989 to Lennar Corporation Employee Stock Ownership Plan—Incorporated by reference to the Company’s Annual Report on Form 10-K for the fiscal year ended November 30, 1990. | |
| 10.8 | * | Lennar Corporation Employee Stock Ownership/401(k) Trust Agreement dated December 13, 1989—Incorporated by reference to the Company’s Annual Report on Form 10-K for the fiscal year ended November 30, 1990. | |
| 10.9 | * | Amendment dated April 18, 1990 to Lennar Corporation Employee Stock Ownership/401(k) Plan—Incorporated by reference to the Company’s Annual Report on Form 10-K for the fiscal year ended November 30, 1990. | |
89
| 10.10 | * | Lennar Corporation Nonqualified Deferred Compensation Plan—Incorporated by reference to Exhibit 10 of the Company’s Quarterly Report on Form 10-Q for the quarter ended August 31, 2002. | |
| 10.11 | |||
| Credit Agreement dated July 21, 2006 among Lennar, |
| 10.12 | |||
| 10.13 | Second Amendment to Credit Agreement dated January 23, 2008 among Lennar, the lenders named therein and JPMorgan Chase Bank, N.A., as Administrative Agent—Incorporated by reference to Exhibit 10.3 of the Company’s Current Report on Form 8-K, dated January 23, 2008. | ||
| 10.14 | Amended and Restated Loan Agreement dated September 25, 2006 between UAMC Capital, LLC, the lenders named therein and Calyon New York Branch, as Administrative Agent—Incorporated by reference to Exhibit 10.14 of the Company’s Annual Report on Form 10-K for the fiscal year ended November 30, | ||
| 10.15 | First Omnibus Amendment dated as of June 29, 2007 to Amended and Restated Loan Agreement dated September 25, 2006 between UAMC Capital, LLC, | ||
| 10.16 | Second Omnibus Amendment dated as of August 20, 2007 to Amended and Restated Loan Agreement dated September 25, 2006 between UAMC Capital, LLC, the lenders named therein and Calyon New York Branch, as Administrative Agent—Incorporated by reference to Exhibit 10.3 of the Company’s Quarterly Report on Form 10-Q for the quarter ended August 31, 2007. | ||
| 10.17 | Third Omnibus Amendment and Waiver dated as of January 23, 2008 to Amended and Restated Loan Agreement dated September 25, 2006 between UAMC Capital, LLC, the lenders named therein and Calyon New York Branch, as Administrative Agent—Incorporated by reference to Exhibit 10.17 of the Company’s Annual Report on Form 10-K for the fiscal year ended November 30, 2007. | ||
| 10.18 | * | Aircraft Time-Sharing Agreement, dated August 17, 2005, between U.S. Home Corporation and Stuart Miller—Incorporated by reference to Exhibit 10.1 of the Company’s Current Report on Form 8-K, dated August 17, 2005. | |
| 10.19 | * | Amendment No. 1 to Aircraft Time-Sharing Agreement, dated September 1, 2005, between U.S. Home Corporation and Stuart Miller—Incorporated by reference to Exhibit 10.16 of the Company’s Annual Report on Form 10-K for the fiscal year ended November 30, 2005. | |
| 10.20 | |||
| Third Amended and Restated Warehousing Credit and Security Agreement dated April 30, 2006, by and among, Universal American Mortgage Company, LLC, the other Borrowers named in the agreement, the Lender Parties named in the agreement and Residential Funding |
| 10.21 | Master Issuing and Paying Agency Agreement, dated March 29, 2006, between Lennar Corporation and JPMorgan Chase Bank, N.A.—Incorporated by reference to Exhibit 10.1 of the Company’s Current Report on Form 8-K, dated March 29, 2006. | ||
| 10.22 | |||
| 10.23 | Membership Interest Purchase Agreement, dated as of November 30, 2007, by and among Lennar, Lennar Homes of California, Inc., the Sellers named in the agreement and MS Rialto Residential Holdings, LLC.—Incorporated by reference to Exhibit 10.23 of the Company’s Annual Report on Form 10-K for the fiscal year ended November 30, 2007. | |
| 10.24 | Fourth Omnibus Amendment, dated as of February 28, 2008 to Amended and Restated Loan Agreement dated September 25, 2006 between UAMC Capital, LLC, the lenders names therein and Calyon New York Branch, as Administrative Agent—Incorporated by reference to Exhibit 10.1 of the Company’s Quarterly Report on Form 10-Q for the quarter ended February 29, 2008. | |
| 10.25 | Third Amendment to Credit Agreement, dated as of November 7, 2008 among Lennar, the lenders named therein and JPMorgan Chase Bank, N.A., as Administrative Agent—Incorporated by reference to Exhibit 10.1 of the Company’s Current Report on Form 8-K, dated | |
| 21 | List of subsidiaries. | |
| 23 | Consent of Independent Registered Public Accounting Firm. | |
| 31.1 | Rule 13a-14a/15d-14(a) Certification of Stuart A. Miller. | |
| 31.2 | Rule 13a-14a/15d-14(a) Certification of Bruce E. Gross. | |
| 32 | Section 1350 Certifications of Stuart A. Miller and Bruce E. Gross. | |
| * | Management contract or compensatory plan or arrangement. |
90
SIGNATURES
Pursuant to the requirements of Section 13 or 15(d) of the Securities Exchange Act of 1934, the registrant has duly caused this Report to be signed on its behalf by the undersigned, thereunto duly authorized.
LENNAR CORPORATION |
/s/ STUART A. MILLER |
| Stuart A. Miller |
| President, Chief Executive Officer and Director |
| Date: |
Pursuant to the requirements of the Securities Exchange Act of 1934, this Report has been signed below by the following persons on behalf of the registrant and in the capacities and on the dates indicated:
Principal Executive Officer: | ||||
Stuart A. Miller | /s/ | STUART A. MILLER | ||
President, Chief Executive Officer and Director | Date: | | ||
Principal Financial Officer: | ||||||
Bruce E. Gross | /s/ | BRUCE E. GROSS | ||||
Vice President and Chief Financial Officer | Date: | | ||||
Principal Accounting Officer: | ||||||
| /s/ | D | ||||
| Date: | | ||||
Directors: | ||||||
Irving Bolotin | /s/ | IRVING BOLOTIN | ||
| Date: | | |||
Steven L. Gerard | /s/ | STEVEN L. GERARD | ||
| Date: | | |||
Sherrill W. Hudson | /s/ | SHERRILL W. HUDSON | ||
| Date: | January 26, 2009 | |||
R. Kirk Landon | /s/ | R. KIRK LANDON | ||
| Date: | | |||
Sidney Lapidus | /s/ | SIDNEY LAPIDUS | ||
| Date: | | |||
Donna Shalala | /s/ | DONNA SHALALA | ||
| Date: | | |||
Jeffrey Sonnenfeld | /s/ | JEFFREY SONNENFELD | ||
| Date: | | |||
91
REPORT OF INDEPENDENT REGISTERED PUBLIC ACCOUNTING FIRM
To the Board of Directors and Stockholders of Lennar Corporation
We have audited the consolidated financial statements of Lennar Corporation and subsidiaries (the “Company”) as of November 30, 20062008 and 2005,2007, and for each of the three years in the period ended November 30, 2006, management’s assessment of the effectiveness of2008, and the Company’s internal control over financial reporting as of November 30, 2006, and the effectiveness of the Company’s internal control over financial reporting as of November 30, 2006,2008, and have issued our reports thereon dated February 8, 2007;January 26, 2009; such consolidated financial statements and reports are included elsewhere in this Form 10-K. Our audits also included the consolidated financial statement schedule of the Company listed in Item 15. This consolidated financial statement schedule is the responsibility of the Company’s management. Our responsibility is to express an opinion based on our audits. In our opinion, such consolidated financial statement schedule, when considered in relation to the basic consolidated financial statements taken as a whole, presents fairly, in all material respects, the information set forth therein.
/s/ DELOITTE & TOUCHE LLP
Certified Public Accountants
Miami, Florida
February 8, 2007
92January 26, 2009
LENNAR CORPORATION AND SUBSIDIARIES
Schedule II—Valuation and Qualifying Accounts
Years Ended November 30, 2006, 20052008, 2007 and 20042006
Beginning | Additions | Deductions | Ending | |||||||||||||||||||||
Description | Charged to costs and expenses | Charged to other accounts | Beginning balance | Additions | Deductions | Ending balance | ||||||||||||||||||
Description | Charged to costs and expenses | Charged to other accounts | ||||||||||||||||||||||
| (In thousands) | ||||||||||||||||||||||||
Year ended November 30, 2008 | ||||||||||||||||||||||||
Allowances deducted from assets to which they apply: | ||||||||||||||||||||||||
Allowances for doubtful accounts and notes receivable | $ | 18,750 | 17,584 | — | (2,382 | ) | 33,952 | |||||||||||||||||
Allowance for loan losses | $ | 11,145 | 14,696 | — | (5,457 | ) | 20,384 | |||||||||||||||||
Allowance against net deferred tax assets | $ | — | 730,836 | — | — | 730,836 | ||||||||||||||||||
Year ended November 30, 2007 | ||||||||||||||||||||||||
Allowances deducted from assets to which they apply: | ||||||||||||||||||||||||
Allowances for doubtful accounts and notes receivable | $ | 3,782 | 18,260 | — | (3,292 | ) | 18,750 | |||||||||||||||||
Allowance for loan losses | $ | 1,810 | 31,596 | 4,310 | (26,571 | ) | 11,145 | |||||||||||||||||
| (In thousands) | ||||||||||||||||||||||||
Year ended November 30, 2006 | ||||||||||||||||||||||||
Allowances deducted from assets to which they apply: | ||||||||||||||||||||||||
Allowances for doubtful accounts and notes receivable | $ | 2,782 | 2,190 | 154 | (1,344 | ) | 3,782 | $ | 2,782 | 2,190 | 154 | (1,344 | ) | 3,782 | ||||||||||
Allowance for loan losses | $ | 1,180 | 2,390 | 158 | (1,918 | ) | 1,810 | $ | 1,180 | 2,390 | 158 | (1,918 | ) | 1,810 | ||||||||||
Year ended November 30, 2005 | ||||||||||||||||||||||||
Allowances deducted from assets to which they apply: | ||||||||||||||||||||||||
Allowances for doubtful accounts and notes receivable | $ | 1,784 | 1,803 | — | (805 | ) | 2,782 | |||||||||||||||||
Allowance for loan losses | $ | 1,407 | 269 | 32 | (528 | ) | 1,180 | |||||||||||||||||
Year ended November 30, 2004 | ||||||||||||||||||||||||
Allowances deducted from assets to which they apply: | ||||||||||||||||||||||||
Allowances for doubtful accounts and notes receivable | $ | 2,088 | 737 | 43 | (1,084 | ) | 1,784 | |||||||||||||||||
Allowance for loan losses | $ | 3,090 | 51 | 149 | (1,883 | ) | 1,407 | |||||||||||||||||
93
EXHIBIT INDEXExhibit Index
Exhibit |
| |
| 21 | List of subsidiaries. | |
| 23 | Consent of Independent Registered Public Accounting Firm. | |
| 31.1 | Rule 13a-14a/15d-14(a) Certification of Stuart A. Miller. | |
| 31.2 | Rule 13a-14a/15d-14(a) Certification of Bruce E. Gross. | |
| 32 | Section 1350 Certifications of Stuart A. Miller and Bruce E. Gross. | |