UNITED STATES
SECURITIES AND EXCHANGE COMMISSION
Washington, D. C. 20549
FORM 10-K
x | ANNUAL REPORT PURSUANT TO SECTION 13 OR 15(d) OF THE SECURITIES EXCHANGE ACT OF 1934 FOR THE YEAR ENDED DECEMBER 31, |
¨ | TRANSITION REPORT PURSUANT TO SECTION 13 OR 15(d) OF THE SECURITIES EXCHANGE ACT OF 1934 FOR THE TRANSITION PERIOD FROM TO |
Commission File Number | Registrant | State of Incorporation | IRS Employer Identification Number | |||
| 1-7810 | Energen Corporation | Alabama | 63-0757759 | |||
| 2-38960 | Alabama Gas Corporation | Alabama | 63-0022000 |
605 Richard Arrington Jr. Boulevard North, Birmingham, Alabama 35203-2707
Telephone Number 205/326-2700
http://www.energen.com
Securities Registered Pursuant to Section 12(b) of the Act:
Title of Each Class | Exchange on Which Registered | |
| Energen Corporation Common Stock, $0.01 par value | New York Stock Exchange | |
| Energen Corporation Preferred Stock Purchase Rights | New York Stock Exchange |
Securities Registered Pursuant to Section 12(g) of the Act: NONE
Indicate by check mark if the registrants are a well-known seasoned issuer, as defined in Rule 405 of the Securities Act. YES x NO ¨
Indicate by check mark if the registrants are not required to file reports pursuant to Section 13 or Section 15(d) of the Act. YES ¨ NO x
Indicate by a check mark whether registrants (1) have filed all reports required to be filed by Section 13 or 15(d) of the Securities and Exchange Act of 1934 during the preceding 12 months (or for such shorter period that the registrants were required to file such reports) and (2) have been subject to such filing requirements for the past 90 days. YES x NO ¨
Indicate by a check mark if disclosure of delinquent filers pursuant to Item 405 of Regulation S-K (Section 229.405 of this chapter) is not contained herein and will not be contained, to the best of registrant’s knowledge, in definitive proxy or information statements incorporated by reference in Part III of this Form 10-K or any amendment to this Form 10-K. ¨
Indicate by check mark whether the registrant is a large accelerated filer, an accelerated filer, or a non-accelerated filer, (as definedor a smaller reporting company. See the definitions of “large accelerated filer,” “accelerated filer” and “smaller reporting company” in Rule 12b-2 of the Act).Exchange Act.
Energen Corporation |
| Accelerated filer ¨ | Non-accelerated filer ¨ | Smaller reporting company ¨ | ||||
Alabama Gas Corporation | Large accelerated filer ¨ | Accelerated filer ¨ |
| Smaller reporting company ¨ | ||||
Indicate by check mark whether the registrants are a shell company (as defined in Rule 12b-2 of the Exchange Act). YES ¨ NO x
Aggregate market value of the voting stock held by non-affiliates of the registrants as of June 30, 2006:29, 2007:
Energen Corporation | $ | 2,727,928,993 |
Energen Corporation | $3,886,440,012 |
Indicate number of shares outstanding of each of the registrant’s classes of common stock as of February 5, 2007:2008:
Energen Corporation | ||||
Alabama Gas Corporation | 1,972,052 shares | |||
Alabama Gas Corporation meets the conditions set forth in General Instruction I(1) (a) and (b) of Form 10-K and is therefore filing this form with the reduced disclosure format pursuant to General Instruction I(2).
DOCUMENTS INCORPORATED BY REFERENCE
Energen Corporation Proxy Statement to be filed on or about March 26, 200724, 2008 (Part III, Item 10-14)
INDUSTRY GLOSSARY
For a more complete definition of certain terms defined below, as well as other terms and concepts applicable to successful efforts accounting, please refer to Rule 4-10(a) of Regulation S-X,
promulgated pursuant to the Securities Act of 1933 and the Securities Exchange Act of 1934, each as amended.
Basis | The difference between the futures price for a commodity and the corresponding cash spot price. | |
Basin-Specific | A type of derivative contract whereby the contract’s settlement price is based on specific geographic basin indices. | |
Behind Pipe Reserves | Oil or gas reserves located above or below the currently producing zone(s) that cannot be extracted until a recompletion or pay-add occurs. | |
Call Option | A contract that gives the investor the right, but not the obligation, to buy the underlying commodity at a certain price on an agreed upon date. | |
Carried Interest | An agreement under which one party agrees to pay for a specified portion or for all of the development and operating costs of another party on a property in which both own a portion of the working interest. | |
Cash Flow Hedge | The designation of a derivative instrument to reduce exposure to variability in cash flows from the forecasted sale of oil, gas or natural gas liquids production whereby the gains (losses) on the derivative transaction are anticipated to offset the losses (gains) on the forecasted sale. | |
Collar | A financial arrangement that effectively establishes a price range between a floor and a ceiling for the underlying commodity. The purchaser bears the risk of fluctuation between the minimum (or floor) price and the maximum (or ceiling) price. | |
Development Costs | Costs necessary to gain access to, prepare and equip development wells in areas of proved reserves. | |
Development Well | A well drilled within the proved area of an oil or gas reservoir to the depth of a stratigraphic horizon known to be productive. | |
Downspacing | An increase in the number of available drilling locations as a result of a regulatory commission order. | |
Dry Well | An exploratory or a development well found to be incapable of producing either oil or gas in sufficient quantities to justify completion as an oil or gas well. | |
Exploration Expenses | Costs primarily associated with drilling unsuccessful exploratory wells in undeveloped properties, exploratory geological and geophysical activities, and costs of impaired and expired leaseholds. | |
Exploratory Well | A well drilled to find and produce oil or gas in an unproved area, to find a new reservoir in a field previously found to be productive of oil or gas in another reservoir, or to extend a known reservoir. | |
Futures Contract | An exchange-traded legal contract to buy or sell a standard quantity and quality of a commodity at a specified future date and price. Such contracts offer liquidity and minimal credit risk exposure but lack the flexibility of swap contracts. | |
Hedging | The use of derivative commodity instruments such as futures, swaps and collars to help reduce financial exposure to commodity price volatility. | |
Gross Revenues | Revenues reported after deduction of royalty interest payments. | |
Gross Well or Acre | A well or acre in which a working interest is owned. | |
Liquified Natural Gas (LNG) | Natural gas that is liquified by reducing the temperature to negative 260 degrees Fahrenheit. LNG typically is used to supplement traditional natural gas supplies during periods of peak demand. | |
Long-Lived Reserves | Reserves generally considered to have a productive life of approximately 10 years or more, as measured by the reserves-to-production ratio. | |
Natural Gas Liquids (NGL) | Liquid hydrocarbons that are extracted and separated from the natural gas stream. NGL products include ethane, propane, butane, natural gasoline and other hydrocarbons. | |
Net Well or Acre | A net well or acre is deemed to exist when the sum of fractional ownership working interests in gross wells or acres equals one. | |
Odorization | The adding of odorant to natural gas which is a characteristic odor so that leaks can be readily detected by smell. | ||
Operational Enhancement | Any action undertaken to improve production efficiency of oil and gas wells and/or reduce well costs. | ||
Operator | The company responsible for exploration, development and production activities for a specific project. | ||
Pay-Add | An operation within a currently producing wellbore that attempts to access and complete an additional pay zone(s) while maintaining production from the existing completed zone(s). | ||
Pay Zone | The formation from which oil and gas is produced. | ||
Production (Lifting) Costs | Costs incurred to operate and maintain wells. | ||
Productive Well | An exploratory or a development well that is not a dry well. | ||
Proved Developed Reserves | The portion of proved reserves which can be expected to be recovered through existing wells with existing equipment and operating methods. | ||
Proved Reserves | Estimated quantities of crude oil, natural gas and natural gas liquids that geological and engineering data demonstrate with reasonable certainty to be recoverable in future years from known reservoirs under existing economic and operating conditions. | ||
Proved Undeveloped Reserves (PUD) | The portion of proved reserves which can be expected to be recovered from new wells on undrilled proved acreage or from existing wells where a relatively major expenditure is required for completion. | ||
Put Option | A contract that gives the purchaser the right, but not the obligation, to sell the underlying commodity at a certain price on an agreed date. | ||
Recompletion | An operation within an existing wellbore whereby a completion in one pay zone is abandoned in order to attempt a completion in a different pay zone. | ||
| Ratio expressing years of supply determined by dividing the remaining recoverable reserves at year end by actual annual production volumes. The reserve-to-production ratio is a statistical indicator with certain limitations, including predictive value. The ratio varies over time as changes occur in production levels and remaining recoverable reserves. | ||
Secondary Recovery | The process of injecting water, gas, etc., into a formation in order to produce additional oil otherwise unobtainable by initial recovery efforts. | ||
Service Well | A well employed for the introduction into an underground stratum of water, gas or other fluid under pressure or disposal of salt water produced with oil or other waste. | ||
Sidetrack Well | A new section of wellbore drilled from an existing well. | ||
Swap | A contractual arrangement in which two parties, called counterparties, effectively agree to exchange or “swap” variable and fixed rate payment streams based on a specified commodity volume. The contracts allow for flexible terms such as specific quantities, settlement dates and location but also expose the parties to counterparty credit risk. | |
Transportation | Moving gas through pipelines on a contract basis for others. | |
Throughput | Total volumes of natural gas sold or transported by the gas utility. | |
Working Interest | Ownership interest in the oil and gas properties that is burdened with the cost of development and operation of the property. | |
Workover | A major remedial operation on a completed well to restore, maintain, or improve the well’s production such as deepening the well or plugging back to produce from a shallow formation. | |
-e | Following a unit of measure denotes that the oil and natural gas liquids components have been converted to cubic feet equivalents at a rate of 6 thousand cubic feet per barrel. | |
20062007 FORM 10-K ANNUAL REPORT
| Page | ||||||
| PART I | ||||||
Item 1. | 4 | |||||
Item 1A. | 11 | |||||
Item 1B. | 12 | |||||
Item 2. | 13 | |||||
Item 3. | ||||||
Item 4. | ||||||
Item 5. | ||||||
Item 6. | ||||||
Item 7. | Management’s Discussion and Analysis of Financial Condition and Results of Operations | |||||
Item 7A. | ||||||
Item 8. | ||||||
Item 9. | Changes in and Disagreements With Accountants on Accounting and Financial Disclosure | |||||
Item 9A. | ||||||
Item 10. | ||||||
Item 11. | ||||||
Item 12. | Security Ownership of Certain Beneficial Owners and Management and Related Stockholder Matters | |||||
Item 13. | Certain Relationships and Related Transactions, and Director Independence | |||||
Item 14. | ||||||
Item 15. | ||||||
(This page intentionally left blank.)blank)
This Form 10-K is filed on behalf of Energen Corporation (Energen or the Company)
and Alabama Gas Corporation (Alagasco).
Forward-Looking Statements:Certain statements in this report express expectations of future plans, objectives and performance of the Company and its subsidiaries and constitute forward-looking statements made pursuant to the Safe Harbor provision of the Private Securities Litigation Reform Act of 1995. Except as otherwise disclosed, the forward-looking statements do not reflect the impact of possible or pending acquisition,acquisitions, investments, divestitures or restructurings. The absence of errors in input data, calculations and formulas used in estimates, assumptions and forecasts cannot be guaranteed. Neither the Company nor Alagasco undertakes any obligation to correct or update any forward-looking statements whether as a result of new information, future events or otherwise.
All statements based on future expectations rather than on historical facts are forward-looking statements that are dependent on certain events, risks and uncertainties that could cause actual results to differ materially from those anticipated. Some of these include, but are not limited to, economic and competitive conditions, inflation rates, legislative and regulatory changes, financial market conditions, our ability to access the capital markets, future business decisions, utility customer growth and retention and usage per customer, litigation results and other uncertainties, all of which are difficult to predict.
Third Party Facilities: The forward-looking statements also assume generally uninterrupted access to third party oil and gas gathering, transportation, processing and storage facilities. Energen Resources Corporation, the Company’s oil and gas subsidiary, relies upon such facilities for access to markets for its production. Alagasco relies upon such facilities for access to natural gas supplies. Such facilities are typically limited in number and geographically concentrated. An extended interruption of access to or service from these facilities, whether caused by weather events, natural disaster, accident, mechanical failure, criminal act or otherwise, could result in material adverse financial consequences to Alagasco, Energen Resources and/or the Company.
Energen Resources’ Production:Production and Drilling: There are numerous uncertainties inherent in estimating quantities of proved oil and gas reserves and in projecting future rates of production and timing of development expenditures. The total amount or timing of actual future production may vary significantly from reserve and production estimates. In the event Energen Resources is unable to fully invest its planned acquisition, development and exploratory expenditures, future operating revenues, production, and proved reserves could be negatively affected. The drilling of development and exploratory wells can involve significant risks, including those related to timing, success rates and cost overruns, and these risks can be affected by lease and rig availability, complex geology and other factors. Anticipated drilling plans and capital expenditures may also change due to weather, manpower and equipment availability, changing emphasis by management and a variety of other factors which could result in actual drilling and capital expenditures being substantially different than currently planned.
Energen Resources’ Hedging: Although Energen Resources makes use of futures, swaps, options and fixed-price contracts to mitigate price risk, fluctuations in future oil, gas and natural gas liquids prices could materially affect the Company’s financial position, results of operations and cash flows; furthermore, such risk mitigation activities may cause the Company’s financial position and results of operations to be materially different from results that would have been obtained had such risk mitigation activities not occurred. The effectiveness of such risk mitigation assumes that counterparties maintain satisfactory credit quality. The effectiveness of such risk mitigation also assumes that actual sales volumes will generally meet or exceed the volumes subject to the futures, swaps, options and fixed-price contracts. A substantial failure to meet sales volume targets, whether caused by miscalculations, weather events, natural disaster, accident, mechanical failure, criminal act or otherwise, could leave Energen Resources financially exposed to its counterparties and result in material adverse financial consequences to Energen Resources and the Company. The adverse effect could be increased if the adverse event was widespread enough to move market prices against Energen Resources’ position.
Alagasco’s Hedging: Similarly, although Alagasco makes use of futures, swaps and fixed-price contracts to mitigate gas supply cost risk, fluctuations in future gas supply costs could materially affect its financial position and rates to customers. The effectiveness of Alagasco’s risk mitigation assumes that its counterparties in such activities maintain satisfactory credit quality. The effectiveness of such risk mitigation also assumes that Alagasco’s actual gas supply needs will generally meet or exceed the volumes subject to the futures, swaps and
fixed-price contracts. A substantial failure to experience projected gas supply needs, whether caused by miscalculations, weather events, natural disaster, accident, mechanical failure, criminal act or otherwise, could leave Alagasco financially exposed to its counterparties and result in material adverse financial consequences to Alagasco and the Company. The adverse effect could be increased if the adverse event was widespread enough to move market prices against Alagasco’s position.
Operations: Inherent in the gas distribution activities of Alagasco and the oil and gas production activities of Energen Resources and the gas distribution activities of Alagasco are a variety of hazards and operation risks, such as leaks, explosions and mechanical problems that could cause substantial financial losses. In addition, these risks could result in loss of human life, significant damage to property, environmental pollution, impairment of our operations and substantial losses to the Company. In accordance with customary industry practices, the Company maintains insurance against some, but not all, of these risks and losses. The location of pipeline and storage facilities near populated areas, including residential areas, commercial business centers and industrial sites, could increase the level of damages resulting from these risks. The occurrence of any of these events could adversely affect Alagasco’s, Energen Resources’ and/or the Company’s financial position, results of operations and cash flows.
Alagasco’s Service Territory: Alagasco’s utility customers are geographically concentrated in central and north Alabama. Significant economic, weather, natural disaster, criminal act or other events that adversely affect this region could adversely affect Alagasco and the Company.
| BUSINESS |
General
Energen Corporation, based in Birmingham, Alabama, is a diversified energy holding company engaged primarily in the development, acquisition, exploration and production of oil, natural gas and natural gas liquids in the continental United States and in the purchase, distribution and sale of natural gas principally in central and north Alabama. Its two principal subsidiaries are Energen Resources Corporation and Alabama Gas Corporation (Alagasco).
Energen was incorporated in Alabama in 1978. Alagasco was formed in 1948 by the merger of Alabama Gas Company into Birmingham Gas Company, the predecessors of which had been in existence since the mid-1800s. Alagasco became a public companypublicly traded in 1953. Energen Resources was formed in 1971 as a subsidiary of Alagasco. Energen was incorporated in 1978 in preparation for the 1979 corporate reorganization in which Alagasco and Energen Resources became a subsidiarysubsidiaries of Energen in a 1979 reorganization.Energen.
The Company maintains a Web site with the addresswww.energen.com. The Company does not include the information contained on its Web site as part of this report nor is the information incorporated by reference into this report. The Company makes available free of charge through its Web site the annual reports on Form 10-K, quarterly reports on Form 10-Q, current reports on Form 8-K, and any amendments to these reports. Also, these reports are available in print upon shareholder request. These reports are available as soon as reasonably practicable after being electronically filed with or furnished to the Securities and Exchange Commission. The Company’s Web site also includes its Code of Ethics, Corporate Governance Guidelines, Audit Committee Charter, Officers’ Review Committee Charter, Governance and Nominations Committee Charter and Finance Committee Charter, each of which is available in print upon shareholder request.
Financial Information About Industry Segments
The information required by this item is provided in Note 20,19, Industry Segment Information, in the Notes to Financial Statements.
Narrative Description of Business
Oil and Gas Operations
General: Energen’s oil and gas operations focus on increasing production and adding proved reserves through the development and acquisition of oil and gas properties. To a lesser extent,In addition, Energen Resources explores for and develops new reservoirs, primarily in areas in which it has an operating presence. All gas, oil and natural gas liquids production is sold to third parties. Energen Resources also provides operating services in the Black Warrior, San Juan and Permian basins for its joint interest and third parties. These services include overall project management and day-to-day decision-making relative to project operations.
At the end of 2006,2007, Energen Resources’ proved oil and gas reserves totaled 1,7231,754 billion cubic feet equivalent (Bcfe). Substantially all of these reserves are located in the San Juan Basin in New Mexico and Colorado, the Permian Basin in west Texas and the Black Warrior Basin in Alabama. Approximately 7982 percent of Energen Resources’ year-end reserves are proved developed reserves. Energen Resources’ reserves are long-lived, with a year-end reserves-to-production ratio of 18 years. Natural gas represents approximately 64 percent of Energen Resources’ proved reserves, with oil representing approximately 26 percent and natural gas liquids comprising the balance.
Growth Strategy: Energen has operated for more than ten years under a strategy to grow its oil and gas operations. Since the end of fiscal year 1995, Energen Resources has invested approximately $1.2 billion in property acquisitions, $1$1.3 billion in related development, and $168$209 million in exploration and related development. Energen Resources’ capital investment over the three-year period ending December 31,in 2008 and 2009 is currently expected to approximate $660 million.$579 million primarily for existing properties. The Company also may allocate additional capital during this three-yeartwo-year period for other oil and gas activities such as property acquisitions and the exploration and development of potential shale plays primarily in Alabama. The estimates above do not include amounts for capital related to potential acquisitions or development of these shale plays discussed below.
Energen Resources will considerseeks to acquire onshore North American property acquisitionsproperties which offer proved undeveloped and/or behind-pipe reserves as well as operational enhancement potential. Energen Resources prefers properties with long-lived reserves and multiple pay-zone opportunities; however, Energen Resources will consider acquisitions of other types of properties which meet its investment requirements, including acquisitions with limited unproved properties. In addition, Energen Resources may conduct limitedconducts exploration activities primarily in areas in which it has operations and remains open to considering exploration activities which complement its core expertise and meet its investment requirements. Following an acquisition, Energen Resources focuses on increasing production and reserves through development of the properties’ proved undeveloped reserves and behind-pipe reserve potential as well as engaging in other activities. These activities include development well drilling, limited exploration, behind-pipe recompletions, pay-adds, workovers, secondary recovery and operational enhancements. Energen Resources prefers to operate its properties in order to better control the nature and pace of development activities. Energen Resources operated approximately 91 percent of its proved reserves at December 31, 2007.
In October 2006, Energen Resources sold to Chesapeake Energy Corporation (Chesapeake) a 50 percent interest in its unproved lease position of approximately 200,000 acres in various shale plays in Alabama for $75 million.million and a $15 million carried drilling interest. In addition, the two companies signed an agreement to form an area of mutual interest (AMI) through which they will pursue new leases, exploration, development and operations on a 50-50 basis, for at least the next 10 years. Energen Resources and Chesapeake will also pay forcontinue to lease shared acreage in the AMI, which encompasses Alabama and some of Georgia, in advance of drilling. As of February 25, 2008, Energen Resources’ first $15 million of future drilling costs.net acreage position in Alabama shale totaled approximately 287,500 acres and represents multiple shale opportunities.
Energen Resources’ development activities can result in the addition of new proved reserves and can serve to reclassify proved undeveloped reserves to proved developed reserves. Proved reserve disclosures are provided annually, although changes to reserve classifications occur throughout the year. Accordingly, additions of new reserves from development activities can occur throughout the year and may result from numerous factors including, but not limited to, regulatory approvals for drilling unit downspacing that increase the number of
5
available drilling locations; changes in the economic or operating environments that allow previously uneconomic locations to be added; technological advances that make reserve locations available for development; successful development of existing proved undeveloped reserve locations that reclassify adjacent
probable locations to proved undeveloped reserve locations; increased knowledge of field geology and engineering parameters relative to oil and gas reservoirs; and changes in management’s intent to develop certain opportunities.
During the three years ended December 31, 2006,2007, the Company’s development efforts have added 307364 Bcfe of proved reserves from the drilling of 891975 gross development wells (including 27 sidetrack wells) and 227150 well recompletions and pay-adds. In 2006,2007, Energen Resources’ successful development wells and other activities added approximately 147127 Bcfe of proved reserves; the company drilled 309367 gross development wells (including 22 sidetrack wells), performed some 3934 well recompletions and pay-adds, and conducted other operational enhancements. Energen Resources’ production from continuing operations totaled 95.698.6 Bcfe in 20062007 and is estimated to total 95102 Bcfe in 2007,2008, including 93.5100 Bcfe of estimated production from proved reserves owned at December 31, 2006.2007. In 2009, production is estimated to be 108 Bcfe, including approximately 100 Bcfe produced from proved reserves currently owned.
Drilling Activity:The following table sets forth the total number of net productive and dry exploratory and development wells drilled:
Years ended December 31, | 2006 | 2005 | 2004 | 2007 | 2006 | 2005 | ||||||
Development: | ||||||||||||
Productive | 151.7 | 153.9 | 145.5 | 135.5 | 151.7 | 153.9 | ||||||
Dry | — | 1.7 | 1.0 | 1.0 | - | 1.7 | ||||||
Total | 151.7 | 155.6 | 146.5 | 136.5 | 151.7 | 155.6 | ||||||
Exploratory: | ||||||||||||
Productive | 40.1 | 4.1 | 7.5 | 21.7 | 40.1 | 4.1 | ||||||
Dry | 3.0 | — | 0.4 | 0.3 | 3.0 | - | ||||||
Total | 43.1 | 4.1 | 7.9 | 22.0 | 43.1 | 4.1 | ||||||
As of December 31, 2006,2007, the Company was participating in the drilling of 79 gross development wells, with the Company’s interest equivalent to 4.45 wells. In addition to the development wells drilled, the Company drilled 99.8, 35.9 33 and 45.933 net service wells during 2007, 2006 2005 and 2004,2005, respectively. As of December 31, 2006,2007, the Company was participating in the drilling of 21 gross service wells,well, with the Company’s interest equivalent to 1.9 wells.0.9 well.
Productive Wells and Acreage: The following table sets forth the total gross and net productive gas and oil wells as of December 31, 2006,2007, and developed and undeveloped acreage as of the latest practicable date prior to year-end:
| Gross | Net | Gross | Net | |||||
Gas wells | 3,943 | 2,228 | 4,101 | 2,333 | ||||
Oil wells | 2,828 | 1,502 | 3,161 | 1,587 | ||||
Developed acreage | 817,804 | 573,049 | 820,732 | 564,748 | ||||
Undeveloped acreage | 126,781 | 114,433 | 324,395 | 287,852 | ||||
There were 2717 wells with multiple completions in 2006.2007. All wells and acreage are located onshore in the United States, with the majority of the net undeveloped acreage located in Alabama.
Risk Management:Energen Resources attempts to lower the riskscommodity price risk associated with its oil and natural gas business.business through the use of futures, swaps and options. Energen Resources does not hedge more than 80 percent of its estimated annual production and generally does not hedge more than two fiscal years forward. Statement of Financial Accounting Standards (SFAS) No. 133, “Accounting for Derivative Instruments and Hedging Activities,” as amended requires all derivatives to be recognized on the balance sheet and measured at fair value. If a derivative is designated as a cash flow hedge, the effectiveness of the hedge, or the
6
degree that the gain (loss) for the hedging instrument offsets the loss (gain) on the hedged item, is measured at each reporting period. The effective portion of the gain or loss on the derivative instrument is recognized in other comprehensive income as a component of equity and subsequently reclassified into earnings when the forecasted transaction affects earnings. The ineffective portion of a derivative’s change in fair value is required to be recognized in earnings immediately. Derivatives that do not qualify for hedge treatment under SFAS No. 133 must be recorded at fair value with gains or losses recognized in operating revenues in the period of change.
The Company from time to time entersmay also enter into derivative transactions that do not qualify for cash flow hedge accounting but are considered by management to represent valid economic hedges and are accounted for as mark-to-market transactions. These economic hedges may include, but are not limited to, put options and swaps on non-operated or other properties for which all of the necessary information to qualify for cash flow hedge accounting is either not readily available or subject to change.
In the case of an acquisition, Energen Resources may hedge more than two years forward to protect targeted returns. Energen Resources prefers long-lived reserves and primarily uses the then-current oil and gas futures prices in its evaluation models, the prevailing swap curve and, for the longer-term, its own pricing assumptions.
See the Forward-Looking Statements in Item 7, Management’s Discussion and Analysis of Financial Condition and Results of Operations, and Item 1A, Risk Factors, for further discussion with respect to price and other risks.
Natural Gas Distribution
General: Alagasco is the largest natural gas distribution utility in the state of Alabama. Alagasco purchases natural gas through interstate and intrastate marketers and suppliers and distributes the purchased gas through its distribution facilities for sale to residential, commercial and industrial customers and other end-users of natural gas. Alagasco also provides transportation services to industrial and commercial customers located on its distribution system. These transportation customers, using Alagasco as their agent or acting on their own, purchase gas directly from producers, marketers or suppliers and arrange for delivery of the gas into the Alagasco distribution system. Alagasco charges a fee to transport such customer-owned gas through its distribution system to the customers’ facilities.
Alagasco’s service territory is located in central and parts of north Alabama and includes 178177 cities and communities in 28 counties. The aggregate population of the counties served by Alagasco is estimated to be 2.4 million. Among the cities served by Alagasco are Birmingham, the center of the largest metropolitan area in Alabama, and Montgomery, the state capital. During 2006,2007, Alagasco served an average of 420,558416,967 residential customers and 34,45634,200 commercial, industrial and transportation customers. The Alagasco distribution system includes approximately 10,10010,200 miles of main and more than 11,80011,900 miles of service lines, odorization and regulation facilities, and customer meters.
APSC Regulation:As an Alabama utility, Alagasco is subject to regulation by the Alabama Public Service Commission (APSC) which established the Rate Stabilization and Equalization (RSE) rate-setting process in 1983. RSE was extended in 2007, 2002, 1996, 1990, 1987 and 1985. On June 10, 2002,December 21, 2007, the APSC extended RSE for a six-yearseven-year period through January 1, 2008.December 31, 2014. Under the terms of the extension, RSE will continue after December 31, 2014, unless, after notice to the Company and a hearing, the APSC order,votes to modify or discontinue the RSE methodology. Alagasco’s allowed range of return on average equity remains 13.15 percent to 13.65 percent throughout the term of the order, subject to change in the event that the Commission, following a generic rate of return hearing, adjusts the returns on equity of all major energy utilities operating under a similar methodology.order. Alagasco is on a September 30 fiscal year for rate-setting purposes (rate year).
Under RSE, the APSC conducts quarterly reviews to determine, based on Alagasco’s projections and year-to-date performance, whether Alagasco’s return on average equity at the end of the rate year will be within the allowed range.range of return. Reductions in rates can be made quarterly to bring the projected return within the allowed range; increases, however, are allowed only once each rate year, effective December 1, and cannot exceed 4 percent of prior-year revenues. Prior to the December 21, 2007 extension, RSE limitslimited the utility’s equity upon which a return is permitted to 60 percent of total capitalization and providesprovided for certain cost control
7
measures designed to monitor Alagasco’s operations and maintenance (O&M) expense. Under the inflation-based cost control measurement established by the APSC, if the percentage change in O&M expense per customer fallsfell within a range of 1.25 points above or below the percentage change in the Consumer Price Index For All Urban Consumers (index range), no adjustment iswas required. If the change in O&M expense per customer exceedsexceeded the index range, three-quarters of the difference iswas returned to customers. To the extent the change iswas less than the index range, the utility benefitsbenefited by one-half of the difference through future rate adjustments.
The temperature adjustment rider to Alagasco’s rate tariff, approved by the APSC in 1990, was designed to mitigate the earnings impact of variances from normal temperatures. Alagasco calculates a temperature adjustment to customers’ monthly bills to substantially removemoderate the effectimpact of departures from normal temperatures on Alagasco’s earnings. This adjustment, however, is subject to certain limitations including regulatory limits on adjustments to increase customers’ bills. Other non-temperature weather conditions that may affect customer usage are not included such as the impact of wind velocity or cloud cover and the impact of any elasticity of demand as a result of high commodity prices. Adjustments to customers’ bills are made in the same billing cycle in which the weather variation occurs. Substantially all the customers to whom the temperature adjustment applies are residential, small commercial and small industrial. Alagasco’s rate schedules for natural gas distribution charges contain a Gas Supply Adjustment (GSA) rider that permits the pass-through to customers of changes in the cost of gas supply.
The APSC approved an Enhanced Stability Reserve (ESR) beginning October 1997, with an approved maximum funding level of $4 million, to which Alagasco may charge the full amount of: (1) extraordinary O&M expenses resulting fromforce majeure events such as storms, severe weather, and outages, when one or a combination of two such events results in more than $200,000 of additional O&M expense during a rate year; or (2) individual industrial and commercial customer revenue losses that exceed $250,000 during the rate year, if such losses cause Alagasco’s return on equity to fall below 13.15 percent. Following a year in which a charge against the ESR is made, the APSC provides for accretions to the ESR in an amount of no more than $40,000 monthly until the maximum funding level is achieved. Subsequent to the 2007 extension, Alagasco will not have accretions against the ESR until December 31, 2010 unless the Company incurs a significant natural disaster during the three-year period ended December 31, 2010 and receives approval from the APSC to resume accretions under the ESR.
Gas Supply: Alagasco’s distribution system is connected to two major interstate natural gas pipeline systems, Southern Natural Gas Company (Southern) and Transcontinental Gas Pipe Line Company (Transco). It is also connected to several intrastate natural gas pipeline systems and to Alagasco’s two liquified natural gas (LNG) facilities.
Alagasco purchases natural gas from various natural gas producers and marketers. Certain volumes are purchased under firm contractual commitments with other volumes purchased on a spot market basis. The purchased volumes are delivered to Alagasco’s system using a variety of firm transportation, interruptible transportation and storage capacity arrangements designed to meet the system’s varying levels of demand. Alagasco’s LNG facilities can provide the system with up to an additional 200,000 additional thousand cubic feet per day (Mcfd) of natural gas to meet peak day demand.
8
As of December 31, 2006,2007, Alagasco had the following contracts in place for firm natural gas pipeline transportation and storage services:
| December 31, | ||||
| (Mcfd) | ||||
Southern firm transportation | 152,933 | |||
Southern storage and no notice transportation | 251,679 | |||
Transco firm transportation | 70,000 | |||
Various intrastate transportation | 20,240 |
Competition and Rate Flexibility:The price of natural gas is a significant competitive factor in Alagasco’s service territory, particularly among large commercial and industrial transportation customers. Propane, coal and fuel oil are readily available, and many industrial customers have the capability to switch to alternate fuels and/or alternate sources of gas. In the residential and small commercial and industrial markets, electricity is the principal competitor. With the support of the APSC, Alagasco has implemented a variety of flexible rate strategies to help it compete for the large customer gas load in the marketplace. Rate flexibility remains critical as the utility faces competition for this load. To date, the utility has been effective in utilizing its flexible rate strategies to minimize bypass and price-based switching to alternate fuels and alternate sources of gas.
In 1994 Alagasco implemented the P Rate in response to the competitive challenge of interstate pipeline capacity release. Under this tariff provision, Alagasco releases much of its excess pipeline capacity and repurchases it as agent for its transportation customers under 12 month contracts. The transportation customers benefit from lower pipeline costs; Alagasco’s core market customers benefit, as well, since the utility uses the revenues received from the P Rate to decrease gas costs for its residential and its small commercial and industrial customers. In 2006,2007, approximately 300 of Alagasco’s transportation customers utilized the P Rate, and the resulting reduction in core market gas costs totaled more than $7.8 million.
The Competitive Fuel Clause (CFC) and Transportation Tariff also have been important to Alagasco’s ability to compete effectively for customer load in its service territory. The CFC allows Alagasco to adjust large customer rates on a case-by-case basis to compete with alternate fuels and alternate sources of gas. The GSA rider to Alagasco’s tariff allows the Company to recover a reduction in charges allowed under the CFC because the retention of any customer, particularly large commercial and industrial transportation customers, benefits all customers by recovering a portion of the system’s fixed costs. The Transportation Tariff allows Alagasco to transport gas for customers, rather than buy and resell it to them, and is based on Alagasco’s sales profit margin so that operating margins are unaffected. During 20062007 substantially all of Alagasco’s large commercial and industrial customer deliveries wereinvolved the transportation of customer-owned gas. In addition, Alagasco served as gas purchasing agent for more than 99 percent of its transportation customers. Alagasco also uses long-term special contracts as a vehicle for retaining large customer load. At the end of 2006, 662007, 65 of the utility’s largest commercial and industrial transportation customers were under special contracts of varying lengths.
Natural gas service available to Alagasco customers falls into two broad categories: interruptible and firm. Interruptible service contractually is subject to interruption by Alagasco for various reasons; the most common occurrence is curtailment of industrial customers during periods of peak core market heating demand. Interruptible service typically is provided to large commercial and industrial transportation customers who can reduce their gas consumption by adjusting production schedules or by switching to alternate fuels for the duration of the service interruption. More expensive firm service, on the other hand, generally is not subject to interruption and is provided to residential and to small commercial and industrial customers; these core market customers depend on natural gas primarily for space heating.
Growth: Customer growth presents a major challenge for Alagasco, given its mature, slow-growth service area. In 2006,2007 Alagasco’s average number of customers decreased 1 percent. Alagasco will continue to concentrate on maintaining its current penetration levels in the residential new construction market and generating additional revenue in the small and large commercial and industrial market segments.
9
Seasonality:Alagasco’s gas distribution business is highly seasonal since a material portion of the utility’s total sales and delivery volumes is to space heating customers. Alagasco’s rate tariff includes a temperature adjustment rider primarily for residential, small commercial and small industrial customers that substantially mitigatesmoderates the effectimpact of departures from normal temperatures on Alagasco’s earnings. The calculation is performed monthly, and adjustments are made to customers’ bills in the actual month the weather variation occurs.
Environmental Matters
Various environmental laws and regulations apply to the operations of Energen Resources and Alagasco. Historically, the cost of environmental compliance has not materially affected the Company’s financial position, results of operations or cash flows and is not expected to do so in the future; however, new regulations, enforcement policies, claims for damages or other events could result in significant unanticipated costs.
A discussion of certain litigation against Energen Resources in the state of Louisiana related to the restoration of oil fieldoilfield properties is included in Item 3.3, Legal Proceedings of Part I in this Form 10-K.
Alagasco is in the chain of title of nine former manufactured gas plant sites (four of which it still owns) and five manufactured gas distribution sites (one of which it still owns). An investigation of the sites does not indicate the present need for remediation activities. Management expects that, should remediation of any such sites be required in the future, Alagasco’s share, if any, of such costs will not materially affect the Company’s financial position.
Employees
The Company has approximately 1,5301,542 employees, of which Alagasco employs 1,1901,169 and Energen Resources employs 340.373. The Company believes that its relations with employees are good.
| RISK FACTORS |
Third Party Facilities: Energen Resources delivers to and Alagasco is served by third party facilities. These facilities include third party oil and gas gathering, transportation, processing and storage facilities. Energen Resources relies upon such facilities for access to markets for its production. Alagasco relies upon such facilities for access to natural gas supplies. Such facilities are typically limited in number and geographically concentrated. An extended interruption of access to or service from these facilities, whether caused by weather events, natural disaster, accident, mechanical failure, criminal act or otherwise could result in material adverse financial consequences to Alagasco, Energen Resources and/or the Company.
Energen Resources’ Production:Production and Drilling: There are numerous uncertainties inherent in estimating quantities of proved oil and gas reserves and in projecting future rates of production and timing of development expenditures. The total amount or timing of actual future production may vary significantly from reserve and production estimates. In the event Energen Resources is unable to fully invest its planned development, acquisition and exploratory expenditures, future operating revenues, production, and proved reserves could be negatively affected. The drilling of development and exploratory wells can involve significant risks, including those related to timing, success rates and cost overruns, and these risks can be affected by lease and rig availability, complex geology and other factors. Anticipated drilling plans and capital expenditures may also change due to weather, manpower and equipment availability, changing emphasis by management and a variety of other factors which could result in actual drilling and capital expenditures being substantially different than currently planned.
Energen Resources’ Hedging:Although Energen Resources makes use of futures, swaps, options and fixed-price contracts to mitigate price risk, fluctuations in future oil, gas and natural gas liquids prices could materially affect the Company’s financial position, results of operations and cash flows; furthermore, such risk mitigation activities may cause the Company’s financial position and results of operations to be materially different from results that would have been obtained had such risk mitigation activities not occurred. The effectiveness of such risk mitigation assumes that counterparties maintain satisfactory credit quality. The effectiveness of such risk mitigation also assumes that actual sales volumes will generally meet or exceed the volumes subject to the futures, swaps, options and fixed-price contracts. A substantial failure to meet sales volume targets, whether caused by miscalculations, weather events, natural disaster, accident, mechanical failure, criminal act or otherwise, could leave Energen Resources financially exposed to its counterparties and result in material adverse financial consequences to Energen Resources and the Company. The adverse effect could be increased if the adverse event was widespread enough to move market prices against Energen Resources’ position.
Alagasco’s Hedging:Similarly, although Alagasco makes use of futures, swaps and fixed-price contracts to mitigate gas supply cost risk, fluctuations in future gas supply costs could materially affect its financial position and rates to customers. The effectiveness of Alagasco’s risk mitigation assumes that its counterparties in such activities maintain satisfactory credit quality. The effectiveness of such risk mitigation also assumes that Alagasco’s actual gas supply needs will generally meet or exceed the volumes subject to the futures, swaps and fixed-price contracts. A substantial failure to experience projected gas supply needs, whether caused by miscalculations, weather events, natural disaster, accident, mechanical failure, criminal act or otherwise, could leave Alagasco financially exposed to its counterparties and result in material adverse financial consequences to Alagasco and the Company. The adverse effect could be increased if the adverse event was widespread enough to move market prices against Alagasco’s position.
Operations: Inherent in the gas distribution activities of Alagasco and the oil and gas production activities of Energen Resources are a variety of hazards and operation risks, such as leaks, explosions and mechanical problems that could cause substantial financial losses. In addition, these risks could result in loss of human life, significant damage to property, environmental pollution, impairment of operations and substantial losses to the Company. In accordance with customary industry practices, the Company maintains insurance against some, but not all, of these risks and losses. The location of pipeline and storage facilities near populated areas, including residential areas, commercial business centers and industrial sites, could increase the level of damages resulting from these risks. The occurrence of any of these events could adversely affect Alagasco’s, Energen Resources’ and/or the Company’s financial position, results of operations and cash flows.
Energen Resources Customer Concentration: Revenues and related accounts receivable from oil and gas operations primarily are generated from the sale of produced oil, natural gas and oilnatural gas liquids to energy marketing companies. Such sales are typically made on an unsecured credit basis with payment due the month following delivery. This concentration of sales to the energy marketing industry has the potential to affect the Company’s overall exposure to credit risk, either positively or negatively, in that the Company’s oil and gas purchasers may be affected similarly by changes in economic, industry or other conditions. Energen Resources considers the credit quality of its customers and, in certain instances, may require credit assurances such as a deposit, letter of credit or parent guarantee. The threefour largest oil, natural gas and natural gas liquids purchasers account for approximately 3422 percent, 1314 percent, 11 percent and 1110 percent, respectively, of Energen Resources’ estimated 20072008 production. Energen Resources’ other purchasers each bought less than 98 percent of production.
Alagasco’s Service Territory: Alagasco’s utility customers are geographically concentrated in central and north Alabama. Significant economic, weather, natural disaster, criminal act or other events that adversely affect this region could adversely affect Alagasco and the Company.
Access to Credit Markets: The Company and its subsidiaries rely on access to credit markets. The availability and cost of credit market access is significantly influenced by rating agency evaluations of the Company and of Alagasco. Events affecting credit market liquidity could increase borrowing costs or limit availability of funds.
| UNRESOLVED STAFF COMMENTS |
None
| PROPERTIES |
The corporate headquarters of Energen, Alagasco and Energen Resources are located in leased office space in Birmingham, Alabama. Energen Resources maintains offices in Midland, Lehman, Seminole, Westbrook and Penwell, Texas; in Farmington, New Mexico; in Brookwood and Tuscaloosa, Alabama; and in Arcadia, Louisiana. For a description of Energen Resources’ oil and gas properties, seeSee the discussion under Item 1-Business.1-Business for further information related to Energen Resources’ and Alagasco’s business operations. Information concerning Energen Resources’ production and reserves is summarized in the table below and included in Note 19,18, Oil and Gas Operations (Unaudited), in the Notes to Financial Statements. See Item 7 -Management’s Discussion and Analysis of Financial Condition and Results of Operations for a discussion of the future outlook and expectations for Energen Resources and Alagasco.
Oil and Gas Operations
Energen Resources focuses on increasing its production and proved reserves through the acquisition and development of onshore North American producing oil and gas properties. Energen Resources maintains offices in Arcadia, Louisiana; in Farmington, New Mexico; and in Midland, Texas. The Company also maintains offices in Lehman, Seminole, Westbrook and Penwell, Texas; and in Brookwood and Tuscaloosa, Alabama.
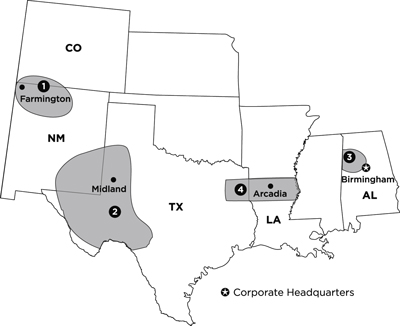
The major areas of operations include (1) the San Juan Basin, (2) the Permian Basin, (3) the Black Warrior Basin and (4) North Louisiana/East Texas as highlighted on the above map.
The following table sets forth the production volumes for the year ended December 31, 2007, and proved reserves and reserves-to-production ratio by area as of December 31, 2007:
Year Ended December 31, 2006 | December 31, 2006 | Year Ended December 31, 2007 | December 31, 2007 | December 31, 2007 | ||||||
Production Volumes (MMcfe) | Proved Reserves (MMcfe) | Production Volumes (MMcfe) | Proved Reserves (MMcfe) | Reserves-to- Production Ratio | ||||||
San Juan Basin | 44,845 | 919,862 | 47,517 | 943,423 | 19.85 years | |||||
Permian Basin | 27,181 | 496,959 | 28,655 | 501,920 | 17.52 years | |||||
Black Warrior Basin | 15,010 | 231,314 | 14,813 | 234,253 | 15.81 years | |||||
North Louisiana/East Texas | 8,094 | 69,464 | 7,187 | 68,653 | 9.55 years | |||||
Other | 465 | 5,212 | 433 | 5,403 | 12.48 years | |||||
Total | 95,595 | 1,722,811 | 98,605 | 1,753,652 | 17.78 years | |||||
13
The following table sets forth proved reserves by area as of December 31, 2007:
| Gas MMcf | Oil MBbl | NGL MBbl | ||||
San Juan Basin | 762,091 | 1,326 | 28,896 | |||
Permian Basin | 47,648 | 72,944 | 2,768 | |||
Black Warrior Basin | 234,253 | - | - | |||
North Louisiana/East Texas | 67,573 | 180 | - | |||
Other | 4,353 | 175 | - | |||
Total | 1,115,918 | 74,625 | 31,664 |
The following table sets forth proved developed reserves by area as of December 31, 2007:
| Gas MMcf | Oil MBbl | NGL MBbl | ||||
San Juan Basin | 569,800 | 1,320 | 25,805 | |||
Permian Basin | 44,042 | 59,553 | 2,543 | |||
Black Warrior Basin | 231,791 | - | - | |||
North Louisiana/East Texas | 53,526 | 161 | - | |||
Other | 4,351 | 175 | - | |||
Total | 903,510 | 61,209 | 28,348 |
Energen Resources files Form EIA-23 with the Department of Energy which reports gross proved reserves, including the working interest share of other owners, for properties operated by the Company. The proved reserves reported in the table above represent our share of proved reserves for all properties, based on our ownership interest in each property. For properties operated by Energen Resources, the difference between the proved reserves reported on Form EIA-23 and the gross reserves associated with the Company-owned proved reserves reported in the table above does not exceed five percent. Estimated proved reserves as of December 31, 2007 are based upon studies for each of our properties prepared by Company engineers and reviewed by Ryder Scott Company, L.P. and T. Scott Hickman and Associates, Inc., independent oil and gas reservoir engineers. Calculations were prepared using standard geological and engineering methods generally accepted by the petroleum industry and in accordance with SEC guidelines.
The following table sets forth the total net productive gas and oil wells by area as of December 31, 2007, and developed and undeveloped acreage as of the latest practicable date prior to year-end:
| Net Wells | Net Developed Acreage | Net Undeveloped Acreage | ||||
San Juan Basin | 1,390 | 302,202 | 1,413 | |||
Permian Basin | 1,579 | 87,851 | 3,309 | |||
Black Warrior Basin | 782 | 147,190 | 1,187 | |||
North Louisiana/East Texas | 159 | 20,675 | 55 | |||
Alabama Shale and Other | 10 | 6,830 | 281,888 | |||
Total | 3,920 | 564,748 | 287,852 |
Natural Gas Distribution
The properties of Alagasco consist primarily of its gas distribution system, which includes approximately 10,10010,200 miles of main and more than 11,80011,900 miles of service lines, odorization and regulation facilities, and customer meters. Alagasco also has two LNG facilities, four division commercial offices, three division business centers, two payment centers, three district offices, seven service centers, and other related property and equipment, some of which are leased by Alagasco.
| LEGAL PROCEEDINGS |
Energen and its affiliates are, from time to time, parties to various pending or threatened legal proceedings. Certain of these lawsuits include claims for punitive damages in addition to other specific relief. Based upon information presently available, and in light of available legal and other defenses, contingent liabilities arising from threatened and pending litigation are not considered material in relation to the respective financial positions of Energen and its
14
affiliates. It should be noted, however, that Energen and its affiliates conduct business in Alabama and other jurisdictions in which the magnitude and frequency of punitive or other damage awards may bear little or no relation to culpability or actual damages, thus making it difficult to predict litigation results.
Jefferson County, Alabama
In January 2006, RGGS Land and Minerals LTD, L.P. (RGGS) filed a lawsuit in Jefferson County, Alabama, alleging breach of contract with respect to Energen Resources’ calculation of certain allowed costs and failure to pay in a timely manner certain amounts due RGGS under a mineral lease. RGGS seeks a declaratory judgment with respect to the parties’ rights under the lease, reformation of the lease, monetary damages and termination of Energen Resources’ rights under the lease. The Occluded Gas Lease dated January 1, 1986 was originally between Energen Resources and United States Steel Corporation (U.S. Steel) as lessor. RGGS became the lessor under the lease as a result of a 2004 conveyance from U.S. Steel to RGGS. Approximately 120,000 acres in Jefferson and Tuscaloosa counties, Alabama, are subject to the lease. Separately on February 6, 2006, Energen Resources received notice of immediate lease termination from RGGS. During 2006,2007, Energen Resources’ production associated with the lease was approximately 1010.5 Bcf.
RGGS has adopted positions contrary to the seventeen years of course of dealing between Energen Resources and its original contracting partner, U.S. Steel. The Company believes that RGGS’ assertions are without merit and that the notice of lease termination is ineffective. Energen Resources intends to vigorously defend its rights under the lease. The Company remains in possession of the lease, believes that the likelihood of a judgment in favor of RGGS is remote, and has made no material accrual with respect to the litigation or purported lease termination.
Enron Corporation
Enron and Enron North America Corporation (ENA) have settled with Energen Resources and Alagasco related to the Enron and ENA bankruptcy proceedings. Under the settlement, Energen Resources was allowed claims in the bankruptcy cases against Enron and ENA of $12.5 million each. In December 2006, Energen Resources sold its claims against Enron and ENA for a gain of $6.7 million after-tax. All other claims have been released.
Legacy Litigation
During recent years, numerous lawsuits have been filed against oil production companies in Louisiana for restoration of oilfield properties. These suits are referred to in the industry as “legacy litigation” because they usually involve operations that were conducted on the affected properties many years earlier. Energen Resources is or has been a party to several legacy litigation lawsuits, most of which result from the operations of predecessor companies. Based upon information presently available, and in light of available legal and other defenses, contingent liabilities arising from legacy litigation in excess of the Company’s accrued provision for estimated liability are not considered material to the Company’s financial position.
Other
Various other pending or threatened legal proceedings are in progress currently, and the Company has accrued a provision for the estimated liability.
| SUBMISSION OF MATTERS TO A VOTE OF SECURITY HOLDERS |
No matters were submitted to a vote of security holders during the fourth quarter of 2006.
15
EXECUTIVE OFFICERS OF THE REGISTRANTS
Energen Corporation
Name | Age | Position (1) | ||
James T. McManus, II | 49 | Chairman, Chief Executive Officer and President of Energen and Chairman and Chief Executive Officer of Alagasco (2) | ||
Wm. Michael Warren, Jr. | 60 | (3) | ||
Charles W. Porter, Jr. | 43 | Vice President, Chief Financial Officer and Treasurer of Energen and Alagasco (4) | ||
John S. Richardson | 50 | President and Chief Operating Officer of Energen Resources (5) | ||
Dudley C. Reynolds | 55 | President and Chief Operating Officer of Alagasco (6) | ||
J. David Woodruff, Jr. | 51 | General Counsel and Secretary of Energen and Alagasco and Vice President-Corporate Development of Energen (7) | ||
Grace B. Carr | 52 | Vice President and Controller of Energen (8) | ||
| Notes: |
|
|
| |||
|
| |||||
|
| |||||
|
| |||||
|
| |||||
|
| |||||
|
| |||||
|
| |||||
|
| |||
(2) |
| |||
(3) | Mr. Warren retired from the Company at the end of 2007. He had been employed by the Company in various capacities since 1983 and served as Chairman of the Board and Chief Executive Officer of Energen and each of its subsidiaries since 1998. Mr. Warren was succeeded by Mr. McManus as Chief Executive officer effective July 1, 2007 and as Chairman of the Board of Energen and each of its subsidiaries effective January 1, 2008. Mr. Warren continues to serve as a Director of Energen and each of its subsidiaries. | |||
(4) | Mr. Porter has been employed by the Company in various financial capacities since 1989. He was elected Controller of Energen Resources in 1998. In 2001, he was elected Vice President – Finance of Energen Resources. He was elected Vice President, Chief Financial Officer and Treasurer of Energen and each of its subsidiaries effective January 1, 2007. | |||
(5) | Mr. Richardson has been employed by the Company in various capacities since 1985. He was elected Vice President – Acquisitions and Engineering of Energen Resources in 1997. He was elected Executive Vice President and Chief Operating Officer of Energen Resources effective January 1, 2006. He was elected President and Chief Operating Officer of Energen Resources effective January 23, 2008. |
16
(6) | Mr. Reynolds has been employed by the Company in various capacities since 1980. He was elected General Counsel and Secretary of Energen and each of its subsidiaries in April 1991. He was elected President and Chief Operating Officer of Alagasco effective January 1, 2003.
|
(7) |
| |||
(8) | Ms. Carr was employed by the Company in various capacities from January 1985 to April 1989. She was not employed from May 1989 through December 1997. She was elected Controller of Energen in January 1998 and elected Vice President and Controller of Energen in October 2001. |
| MARKET FOR REGISTRANT’S COMMON EQUITY, RELATED STOCKHOLDER MATTERS AND ISSUER PURCHASES OF EQUITY SECURITIES |
Quarterly Market Prices and Dividends Paid Per Share
Quarter ended(in dollars) | High | Low | Close | Dividends Paid | ||||
March 31, 2004 | 22.36 | 19.94 | 20.63 | .0925 | ||||
June 30, 2004 | 24.28 | 20.06 | 24.00 | .0925 | ||||
September 30, 2004 | 25.98 | 22.93 | 25.78 | .09625 | ||||
December 31, 2004 | 30.04 | 25.44 | 29.48 | .09625 | ||||
March 31, 2005 | 34.09 | 27.06 | 33.30 | .10 | ||||
June 30, 2005 | 35.64 | 28.65 | 35.05 | .10 | ||||
September 30, 2005 | 43.56 | 33.85 | 43.26 | .10 | ||||
December 31, 2005 | 44.31 | 34.50 | 36.32 | .10 | ||||
March 31, 2006 | 39.49 | 32.71 | 35.00 | .11 | ||||
June 30, 2006 | 38.42 | 32.16 | 38.41 | .11 | ||||
September 30, 2006 | 44.48 | 36.95 | 41.87 | .11 | ||||
December 31, 2006 | 47.60 | 38.50 | 46.94 | .11 |
Quarter ended(in dollars) | High | Low | Close | Dividends Paid | ||||
March 31, 2006 | 39.49 | 32.71 | 35.00 | .11 | ||||
June 30, 2006 | 38.42 | 32.16 | 38.41 | .11 | ||||
September 30, 2006 | 44.48 | 36.95 | 41.87 | .11 | ||||
December 31, 2006 | 47.60 | 38.50 | 46.94 | .11 | ||||
March 31, 2007 | 51.43 | 43.78 | 50.89 | .115 | ||||
June 30, 2007 | 60.49 | 51.05 | 54.94 | .115 | ||||
September 30, 2007 | 58.90 | 48.24 | 57.12 | .115 | ||||
December 31, 2007 | 70.41 | 56.81 | 64.23 | .115 |
Energen’s common stock is listed on the New York Stock Exchange under the symbol EGN. On January 23, 2007,February 8, 2008, there were 7,3907,135 holders of record of Energen’s common stock. At the date of this filing, Energen Corporation owned all the issued and outstanding common stock of Alabama Gas Corporation. Energen expects to pay annual cash dividends of $0.48 per share on the Company’s common stock in 2008. The amount and timing of all dividend payments is subject to the discretion of the Board of Directors and is based upon business conditions, results of operations, financial conditions and other factors.
The following table summarizes information concerning securities authorized for issuance under equity compensation plans:
Plan Category | Number of Securities to be Issued Upon Exercise of Outstanding Options | Weighted Average Exercise Price | Number of Securities Remaining Available for Future Issuance Under Equity Compensation Plans | Number of Securities to be Issued for Outstanding Options and Performance Share Awards | Weighted Average Exercise Price | Number of Securities Remaining Available for Future Issuance Under Equity Compensation Plans | |||||||
Equity compensation plans approved by security holders | 428,078 | $ | 15.35 | 2,223,336 | |||||||||
Equity compensation plans | 466,339 | $30.79 | 1,953,996 | ||||||||||
Equity compensation plans not approved by security holders | — | — | — | - | - | - | |||||||
Total | 428,078 | $ | 15.35 | 2,223,336 | 466,339 | $30.79 | 1,953,996 | ||||||
| * | These plans include the Company’s 1997 Stock Incentive Plan and the 1992 Energen Corporation Directors Stock Plan |
The following table summarizes information concerning purchases of equity securities by the issuer:
Period | Total Number of Shares Purchased* | Average Price Paid per Share | Total Number of Shares Purchased as Part of Publicly Announced Plans | Maximum Number of Shares that May Yet Be Purchased Under the Plans** | ||||||
October 1, 2006 through October 31, 2006 | 78 | * | $ | 40.52 | — | 9,992,700 | ||||
November 1, 2006 through November 30, 2006 | 1,218 1,000,000 | * | $ $ | 45.51 43.44 | — | 8,992,700 | ||||
December 1, 2006 through December 31, 2006 | 3,901 | * | $ | 47.02 | — | 8,992,700 | ||||
Total | 1,005,197 | $ | 43.46 | — | 8,992,700 | |||||
| Period | Total Number of Shares Purchased | | Average Price Paid per Share | Total Number of Shares Purchased as Part of Publicly Announced Plans | Maximum Number of Shares that May Yet Be Purchased Under the Plans** | ||||
October 1, 2007 through | - | - | - | 8,992,700 | |||||
November 1, 2007 through | - | - | - | 8,992,700 | |||||
December 1, 2007 through | 1,857 | * | $ 64.43 | - | 8,992,700 | ||||
Total | 1,857 | $ 64.43 | - | 8,992,700 |
* | Acquired in connection with tax withholdings and payment of exercise price on stock compensation plans. |
** | By resolution adopted May 24, 1994, and supplemented by a resolution adopted April 26, 2000 and June 24, 2006, the Board of Directors authorized the Company to repurchase up to 12,564,400 shares of the Company’s common stock. The resolutions do not have an expiration date. |
Share and per share data have been restated to reflect a 2-for-1 stock split effective June 1, 2005.
PERFORMANCE GRAPHOil and Gas Operations
General: Energen’s oil and gas operations focus on increasing production and adding proved reserves through the development and acquisition of oil and gas properties. In addition, Energen Resources explores for and develops new reservoirs, primarily in areas in which it has an operating presence. All gas, oil and natural gas liquids production is sold to third parties. Energen Resources also provides operating services in the Black Warrior, San Juan and Permian basins for its joint interest and third parties. These services include overall project management and day-to-day decision-making relative to project operations.
At the end of 2007, Energen Resources’ proved oil and gas reserves totaled 1,754 billion cubic feet equivalent (Bcfe). Substantially all of these reserves are located in the San Juan Basin in New Mexico and Colorado, the Permian Basin in west Texas and the Black Warrior Basin in Alabama. Approximately 82 percent of Energen Resources’ year-end reserves are proved developed reserves. Energen Resources’ reserves are long-lived, with a year-end reserves-to-production ratio of 18 years. Natural gas represents approximately 64 percent of Energen Resources’ proved reserves, with oil representing approximately 26 percent and natural gas liquids comprising the balance.
Growth Strategy: Energen has operated for more than ten years under a strategy to grow its oil and gas operations. Since the end of fiscal year 1995, Energen Resources has invested approximately $1.2 billion in property acquisitions, $1.3 billion in related development, and $209 million in exploration and related development. Energen Resources’ capital investment in 2008 and 2009 is currently expected to approximate $579 million primarily for existing properties. The Company also may allocate additional capital during this two-year period for other oil and gas activities such as property acquisitions and the exploration and development of potential shale plays primarily in Alabama. The estimates above do not include amounts for capital related to potential acquisitions or development of these shale plays discussed below.
Energen Resources seeks to acquire onshore North American properties which offer proved undeveloped and/or behind-pipe reserves as well as operational enhancement potential. Energen Resources prefers properties with long-lived reserves and multiple pay-zone opportunities; however, Energen Resources will consider acquisitions of other types of properties which meet its investment requirements, including acquisitions with unproved properties. In addition, Energen Resources conducts exploration activities primarily in areas in which it has operations and remains open to exploration activities which complement its core expertise and meet its investment requirements. Following an acquisition, Energen Resources focuses on increasing production and reserves through development of the properties’ undeveloped reserves and behind-pipe reserve potential as well as engaging in other activities. These activities include development well drilling, exploration, behind-pipe recompletions, pay-adds, workovers, secondary recovery and operational enhancements. Energen Resources prefers to operate its properties in order to better control the nature and pace of development activities. Energen Resources operated approximately 91 percent of its proved reserves at December 31, 2007.
In October 2006, Energen Resources sold to Chesapeake Energy Corporation (Chesapeake) a 50 percent interest in its unproved lease position of approximately 200,000 acres in various shale plays in Alabama for $75 million and a $15 million carried drilling interest. In addition, the two companies signed an agreement to form an area of mutual interest (AMI) through which they will pursue new leases, exploration, development and operations on a 50-50 basis, for at least the next 10 years. Energen Resources and Chesapeake continue to lease shared acreage in the AMI, which encompasses Alabama and some of Georgia, in advance of drilling. As of February 25, 2008, Energen Resources’ net acreage position in Alabama shale totaled approximately 287,500 acres and represents multiple shale opportunities.
Energen Resources’ development activities can result in the addition of new proved reserves and can serve to reclassify proved undeveloped reserves to proved developed reserves. Proved reserve disclosures are provided annually, although changes to reserve classifications occur throughout the year. Accordingly, additions of new reserves from development activities can occur throughout the year and may result from numerous factors including, but not limited to, regulatory approvals for drilling unit downspacing that increase the number of
5
available drilling locations; changes in the economic or operating environments that allow previously uneconomic locations to be added; technological advances that make reserve locations available for development; successful development of existing proved undeveloped reserve locations that reclassify adjacent probable locations to proved undeveloped reserve locations; increased knowledge of field geology and engineering parameters relative to oil and gas reservoirs; and changes in management’s intent to develop certain opportunities.
During the three years ended December 31, 2007, the Company’s development efforts have added 364 Bcfe of proved reserves from the drilling of 975 gross development wells (including 27 sidetrack wells) and 150 well recompletions and pay-adds. In 2007, Energen Resources’ successful development wells and other activities added approximately 127 Bcfe of proved reserves; the company drilled 367 gross development wells (including 22 sidetrack wells), performed some 34 well recompletions and pay-adds, and conducted other operational enhancements. Energen Resources’ production from continuing operations totaled 98.6 Bcfe in 2007 and is estimated to total 102 Bcfe in 2008, including 100 Bcfe of estimated production from proved reserves owned at December 31, 2007. In 2009, production is estimated to be 108 Bcfe, including approximately 100 Bcfe produced from proved reserves currently owned.
Drilling Activity:The following table sets forth the total number of net productive and dry exploratory and development wells drilled:
Years ended December 31, | 2007 | 2006 | 2005 | |||
Development: | ||||||
Productive | 135.5 | 151.7 | 153.9 | |||
Dry | 1.0 | - | 1.7 | |||
Total | 136.5 | 151.7 | 155.6 | |||
Exploratory: | ||||||
Productive | 21.7 | 40.1 | 4.1 | |||
Dry | 0.3 | 3.0 | - | |||
Total | 22.0 | 43.1 | 4.1 |
As of December 31, 2007, the Company was participating in the drilling of 9 gross development wells, with the Company’s interest equivalent to 5 wells. In addition to the development wells drilled, the Company drilled 99.8, 35.9 and 33 net service wells during 2007, 2006 and 2005, respectively. As of December 31, 2007, the Company was participating in the drilling of 1 gross service well, with the Company’s interest equivalent to 0.9 well.
Productive Wells and Acreage: The following table sets forth the total gross and net productive gas and oil wells as of December 31, 2007, and developed and undeveloped acreage as of the latest practicable date prior to year-end:
| Gross | Net | |||
Gas wells | 4,101 | 2,333 | ||
Oil wells | 3,161 | 1,587 | ||
Developed acreage | 820,732 | 564,748 | ||
Undeveloped acreage | 324,395 | 287,852 |
There were 17 wells with multiple completions in 2007. All wells and acreage are located onshore in the United States, with the majority of the net undeveloped acreage located in Alabama.
Risk Management:Energen Resources attempts to lower the commodity price risk associated with its oil and natural gas business through the use of futures, swaps and options. Energen Resources does not hedge more than 80 percent of its estimated annual production and generally does not hedge more than two fiscal years forward. Statement of Financial Accounting Standards (SFAS) No. 133, “Accounting for Derivative Instruments and Hedging Activities,” as amended requires all derivatives to be recognized on the balance sheet and measured at fair value. If a derivative is designated as a cash flow hedge, the effectiveness of the hedge, or the
6
degree that the gain (loss) for the hedging instrument offsets the loss (gain) on the hedged item, is measured at each reporting period. The effective portion of the gain or loss on the derivative instrument is recognized in other comprehensive income as a component of equity and subsequently reclassified into earnings when the forecasted transaction affects earnings. The ineffective portion of a derivative’s change in fair value is required to be recognized in earnings immediately. Derivatives that do not qualify for hedge treatment under SFAS No. 133 must be recorded at fair value with gains or losses recognized in operating revenues in the period of change.
The Company may also enter into derivative transactions that do not qualify for cash flow hedge accounting but are considered by management to represent valid economic hedges and are accounted for as mark-to-market transactions. These economic hedges may include, but are not limited to, put options and swaps on non-operated or other properties for which all of the necessary information to qualify for cash flow hedge accounting is either not readily available or subject to change.
In the case of an acquisition, Energen Resources may hedge more than two years forward to protect targeted returns. Energen Resources prefers long-lived reserves and primarily uses the then-current oil and gas futures prices in its evaluation models, the prevailing swap curve and, for the longer-term, its own pricing assumptions.
See the Forward-Looking Statements in Item 7, Management’s Discussion and Analysis of Financial Condition and Results of Operations, and Item 1A, Risk Factors, for further discussion with respect to price and other risks.
Natural Gas Distribution
General: Alagasco is the largest natural gas distribution utility in the state of Alabama. Alagasco purchases natural gas through interstate and intrastate marketers and suppliers and distributes the purchased gas through its distribution facilities for sale to residential, commercial and industrial customers and other end-users of natural gas. Alagasco also provides transportation services to industrial and commercial customers located on its distribution system. These transportation customers, using Alagasco as their agent or acting on their own, purchase gas directly from producers, marketers or suppliers and arrange for delivery of the gas into the Alagasco distribution system. Alagasco charges a fee to transport such customer-owned gas through its distribution system to the customers’ facilities.
Alagasco’s service territory is located in central and parts of north Alabama and includes 177 cities and communities in 28 counties. The aggregate population of the counties served by Alagasco is estimated to be 2.4 million. Among the cities served by Alagasco are Birmingham, the center of the largest metropolitan area in Alabama, and Montgomery, the state capital. During 2007, Alagasco served an average of 416,967 residential customers and 34,200 commercial, industrial and transportation customers. The Alagasco distribution system includes approximately 10,200 miles of main and more than 11,900 miles of service lines, odorization and regulation facilities, and customer meters.
APSC Regulation:As an Alabama utility, Alagasco is subject to regulation by the Alabama Public Service Commission (APSC) which established the Rate Stabilization and Equalization (RSE) rate-setting process in 1983. RSE was extended in 2007, 2002, 1996, 1990, 1987 and 1985. On December 21, 2007, the APSC extended RSE for a seven-year period through December 31, 2014. Under the terms of the extension, RSE will continue after December 31, 2014, unless, after notice to the Company and a hearing, the APSC votes to modify or discontinue the RSE methodology. Alagasco’s allowed range of return on average equity remains 13.15 percent to 13.65 percent throughout the term of the order. Alagasco is on a September 30 fiscal year for rate-setting purposes (rate year).
Under RSE, the APSC conducts quarterly reviews to determine, based on Alagasco’s projections and year-to-date performance, whether Alagasco’s return on average equity at the end of the rate year will be within the allowed range of return. Reductions in rates can be made quarterly to bring the projected return within the allowed range; increases, however, are allowed only once each rate year, effective December 1, and cannot exceed 4 percent of prior-year revenues. Prior to the December 21, 2007 extension, RSE limited the utility’s equity upon which a return is permitted to 60 percent of total capitalization and provided for certain cost control
7
measures designed to monitor Alagasco’s operations and maintenance (O&M) expense. Under the inflation-based cost control measurement established by the APSC, if the percentage change in O&M expense per customer fell within a range of 1.25 points above or below the percentage change in the Consumer Price Index For All Urban Consumers (index range), no adjustment was required. If the change in O&M expense per customer exceeded the index range, three-quarters of the difference was returned to customers. To the extent the change was less than the index range, the utility benefited by one-half of the difference through future rate adjustments.
Subsequent to the extension, the equity on which a return will be permitted will be phased down to 57 percent by December 31, 2008 and 55 percent by December 31, 2009. The changes to the O&M expense cost control measurement subsequent to the extension are as follows: annual changes in O&M expense will be measured on an aggregate basis rather than per customer; the percentage change in O&M expense must fall within a range of 0.75 points above or below the percentage change in the index range; non-recurring and/or recurring items that fluctuate based on situations demonstrated to be beyond Alagasco’s control may be excluded for the cost control measurement calculation; the O&M expense base for measurement purposes will continue to be set at the prior year’s actual O&M expense amount unless the Company exceeds the top of the index range in two successive years, in which case the base for the following year will be set at the top of the index range.
The temperature adjustment rider to Alagasco’s rate tariff, approved by the APSC in 1990, was designed to mitigate the earnings impact of variances from normal temperatures. Alagasco calculates a temperature adjustment to customers’ monthly bills to moderate the impact of departures from normal temperatures on Alagasco’s earnings. This adjustment, however, is subject to certain limitations including regulatory limits on adjustments to increase customers’ bills. Other non-temperature weather conditions that may affect customer usage are not included such as the impact of wind velocity or cloud cover and the impact of any elasticity of demand as a result of high commodity prices. Adjustments to customers’ bills are made in the same billing cycle in which the weather variation occurs. Substantially all the customers to whom the temperature adjustment applies are residential, small commercial and small industrial. Alagasco’s rate schedules for natural gas distribution charges contain a Gas Supply Adjustment (GSA) rider that permits the pass-through to customers of changes in the cost of gas supply.
The APSC approved an Enhanced Stability Reserve (ESR) beginning October 1997, with an approved maximum funding level of $4 million, to which Alagasco may charge the full amount of: (1) extraordinary O&M expenses resulting fromforce majeure events such as storms, severe weather, and outages, when one or a combination of two such events results in more than $200,000 of additional O&M expense during a rate year; or (2) individual industrial and commercial customer revenue losses that exceed $250,000 during the rate year, if such losses cause Alagasco’s return on equity to fall below 13.15 percent. Following a year in which a charge against the ESR is made, the APSC provides for accretions to the ESR in an amount of no more than $40,000 monthly until the maximum funding level is achieved. Subsequent to the 2007 extension, Alagasco will not have accretions against the ESR until December 31, 2010 unless the Company incurs a significant natural disaster during the three-year period ended December 31, 2010 and receives approval from the APSC to resume accretions under the ESR.
Energen Corporation — Comparison of Five-Year Cumulative Shareholder ReturnsGas Supply: Alagasco’s distribution system is connected to two major interstate natural gas pipeline systems, Southern Natural Gas Company (Southern) and Transcontinental Gas Pipe Line Company (Transco). It is also connected to several intrastate natural gas pipeline systems and to Alagasco’s two liquified natural gas (LNG) facilities.
Alagasco purchases natural gas from various natural gas producers and marketers. Certain volumes are purchased under firm contractual commitments with other volumes purchased on a spot market basis. The purchased volumes are delivered to Alagasco’s system using a variety of firm transportation, interruptible transportation and storage capacity arrangements designed to meet the system’s varying levels of demand. Alagasco’s LNG facilities can provide the system with up to an additional 200,000 thousand cubic feet per day (Mcfd) of natural gas to meet peak day demand.
8
As of December 31, 2007, Alagasco had the following contracts in place for firm natural gas pipeline transportation and storage services:
| December 31, 2007 | ||||
| (Mcfd) | ||||
Southern firm transportation | 152,933 | |||
Southern storage and no notice transportation | 251,679 | |||
Transco firm transportation | 70,000 | |||
Various intrastate transportation | 20,240 |
Competition and Rate Flexibility:The price of natural gas is a significant competitive factor in Alagasco’s service territory, particularly among large commercial and industrial transportation customers. Propane, coal and fuel oil are readily available, and many industrial customers have the capability to switch to alternate fuels and/or alternate sources of gas. In the residential and small commercial and industrial markets, electricity is the principal competitor. With the support of the APSC, Alagasco has implemented a variety of flexible rate strategies to help it compete for the large customer gas load in the marketplace. Rate flexibility remains critical as the utility faces competition for this load. To date, the utility has been effective in utilizing its flexible rate strategies to minimize bypass and price-based switching to alternate fuels and alternate sources of gas.
In 1994 Alagasco implemented the P Rate in response to the competitive challenge of interstate pipeline capacity release. Under this tariff provision, Alagasco releases much of its excess pipeline capacity and repurchases it as agent for its transportation customers under 12 month contracts. The transportation customers benefit from lower pipeline costs; Alagasco’s core market customers benefit, as well, since the utility uses the revenues received from the P Rate to decrease gas costs for its residential and its small commercial and industrial customers. In 2007, approximately 300 of Alagasco’s transportation customers utilized the P Rate, and the resulting reduction in core market gas costs totaled more than $7.8 million.
The Competitive Fuel Clause (CFC) and Transportation Tariff also have been important to Alagasco’s ability to compete effectively for customer load in its service territory. The CFC allows Alagasco to adjust large customer rates on a case-by-case basis to compete with alternate fuels and alternate sources of gas. The GSA rider to Alagasco’s tariff allows the Company to recover a reduction in charges allowed under the CFC because the retention of any customer, particularly large commercial and industrial transportation customers, benefits all customers by recovering a portion of the system’s fixed costs. The Transportation Tariff allows Alagasco to transport gas for customers, rather than buy and resell it to them, and is based on Alagasco’s sales profit margin so that operating margins are unaffected. During 2007 substantially all of Alagasco’s large commercial and industrial customer deliveries involved the transportation of customer-owned gas. In addition, Alagasco served as gas purchasing agent for more than 99 percent of its transportation customers. Alagasco also uses long-term special contracts as a vehicle for retaining large customer load. At the end of 2007, 65 of the utility’s largest commercial and industrial transportation customers were under special contracts of varying lengths.
Natural gas service available to Alagasco customers falls into two broad categories: interruptible and firm. Interruptible service contractually is subject to interruption by Alagasco for various reasons; the most common occurrence is curtailment of industrial customers during periods of peak core market heating demand. Interruptible service typically is provided to large commercial and industrial transportation customers who can reduce their gas consumption by adjusting production schedules or by switching to alternate fuels for the duration of the service interruption. More expensive firm service, on the other hand, generally is not subject to interruption and is provided to residential and to small commercial and industrial customers; these core market customers depend on natural gas primarily for space heating.
Growth: Customer growth presents a major challenge for Alagasco, given its mature, slow-growth service area. In 2007 Alagasco’s average number of customers decreased 1 percent. Alagasco will continue to concentrate on maintaining its current penetration levels in the residential new construction market and generating additional revenue in the small and large commercial and industrial market segments.
9
Seasonality:Alagasco’s gas distribution business is highly seasonal since a material portion of the utility’s total sales and delivery volumes is to space heating customers. Alagasco’s rate tariff includes a temperature adjustment rider primarily for residential, small commercial and small industrial customers that moderates the impact of departures from normal temperatures on Alagasco’s earnings. The calculation is performed monthly, and adjustments are made to customers’ bills in the actual month the weather variation occurs.
Environmental Matters
Various environmental laws and regulations apply to the operations of Energen Resources and Alagasco. Historically, the cost of environmental compliance has not materially affected the Company’s financial position, results of operations or cash flows and is not expected to do so in the future; however, new regulations, enforcement policies, claims for damages or other events could result in significant unanticipated costs.
A discussion of certain litigation against Energen Resources in the state of Louisiana related to the restoration of oilfield properties is included in Item 3, Legal Proceedings of Part I in this Form 10-K.
Alagasco is in the chain of title of nine former manufactured gas plant sites (four of which it still owns) and five manufactured gas distribution sites (one of which it still owns). An investigation of the sites does not indicate the present need for remediation activities. Management expects that, should remediation of any such sites be required in the future, Alagasco’s share, if any, of such costs will not materially affect the Company’s financial position.
Employees
The Company has approximately 1,542 employees, of which Alagasco employs 1,169 and Energen Resources employs 373. The Company believes that its relations with employees are good.
10
| ITEM 1A. | RISK FACTORS |
Third Party Facilities: Energen Resources delivers to and Alagasco is served by third party facilities. These facilities include third party oil and gas gathering, transportation, processing and storage facilities. Energen Resources relies upon such facilities for access to markets for its production. Alagasco relies upon such facilities for access to natural gas supplies. Such facilities are typically limited in number and geographically concentrated. An extended interruption of access to or service from these facilities, whether caused by weather events, natural disaster, accident, mechanical failure, criminal act or otherwise could result in material adverse financial consequences to Alagasco, Energen Resources and/or the Company.
Energen Resources’ Production and Drilling: There are numerous uncertainties inherent in estimating quantities of proved oil and gas reserves and in projecting future rates of production and timing of development expenditures. The total amount or timing of actual future production may vary significantly from reserve and production estimates. In the event Energen Resources is unable to fully invest its planned development, acquisition and exploratory expenditures, future operating revenues, production, and proved reserves could be negatively affected. The drilling of development and exploratory wells can involve significant risks, including those related to timing, success rates and cost overruns, and these risks can be affected by lease and rig availability, complex geology and other factors. Anticipated drilling plans and capital expenditures may also change due to weather, manpower and equipment availability, changing emphasis by management and a variety of other factors which could result in actual drilling and capital expenditures being substantially different than currently planned.
Energen Resources’ Hedging:Although Energen Resources makes use of futures, swaps, options and fixed-price contracts to mitigate price risk, fluctuations in future oil, gas and natural gas liquids prices could materially affect the Company’s financial position, results of operations and cash flows; furthermore, such risk mitigation activities may cause the Company’s financial position and results of operations to be materially different from results that would have been obtained had such risk mitigation activities not occurred. The effectiveness of such risk mitigation assumes that counterparties maintain satisfactory credit quality. The effectiveness of such risk mitigation also assumes that actual sales volumes will generally meet or exceed the volumes subject to the futures, swaps, options and fixed-price contracts. A substantial failure to meet sales volume targets, whether caused by miscalculations, weather events, natural disaster, accident, mechanical failure, criminal act or otherwise, could leave Energen Resources financially exposed to its counterparties and result in material adverse financial consequences to Energen Resources and the Company. The adverse effect could be increased if the adverse event was widespread enough to move market prices against Energen Resources’ position.
Alagasco’s Hedging:Similarly, although Alagasco makes use of futures, swaps and fixed-price contracts to mitigate gas supply cost risk, fluctuations in future gas supply costs could materially affect its financial position and rates to customers. The effectiveness of Alagasco’s risk mitigation assumes that its counterparties in such activities maintain satisfactory credit quality. The effectiveness of such risk mitigation also assumes that Alagasco’s actual gas supply needs will generally meet or exceed the volumes subject to the futures, swaps and fixed-price contracts. A substantial failure to experience projected gas supply needs, whether caused by miscalculations, weather events, natural disaster, accident, mechanical failure, criminal act or otherwise, could leave Alagasco financially exposed to its counterparties and result in material adverse financial consequences to Alagasco and the Company. The adverse effect could be increased if the adverse event was widespread enough to move market prices against Alagasco’s position.
Operations: Inherent in the gas distribution activities of Alagasco and the oil and gas production activities of Energen Resources are a variety of hazards and operation risks, such as leaks, explosions and mechanical problems that could cause substantial financial losses. In addition, these risks could result in loss of human life, significant damage to property, environmental pollution, impairment of operations and substantial losses to the Company. In accordance with customary industry practices, the Company maintains insurance against some, but not all, of these risks and losses. The location of pipeline and storage facilities near populated areas, including residential areas, commercial business centers and industrial sites, could increase the level of damages resulting from these risks. The occurrence of any of these events could adversely affect Alagasco’s, Energen Resources’ and/or the Company’s financial position, results of operations and cash flows.
11
Energen Resources Customer Concentration: Revenues and related accounts receivable from oil and gas operations primarily are generated from the sale of produced oil, natural gas and natural gas liquids to energy marketing companies. Such sales are typically made on an unsecured credit basis with payment due the month following delivery. This graph comparesconcentration of sales to the energy marketing industry has the potential to affect the Company’s overall exposure to credit risk, either positively or negatively, in that the Company’s oil and gas purchasers may be affected similarly by changes in economic, industry or other conditions. Energen Resources considers the credit quality of its customers and, in certain instances, may require credit assurances such as a deposit, letter of credit or parent guarantee. The four largest oil, natural gas and natural gas liquids purchasers account for approximately 22 percent, 14 percent, 11 percent and 10 percent, respectively, of Energen Resources’ estimated 2008 production. Energen Resources’ other purchasers each bought less than 8 percent of production.
Alagasco’s Service Territory: Alagasco’s utility customers are geographically concentrated in central and north Alabama. Significant economic, weather, natural disaster, criminal act or other events that adversely affect this region could adversely affect Alagasco and the Company.
Access to Credit Markets: The Company and its subsidiaries rely on access to credit markets. The availability and cost of credit market access is significantly influenced by rating agency evaluations of the Company and of Alagasco. Events affecting credit market liquidity could increase borrowing costs or limit availability of funds.
| ITEM 1B. | UNRESOLVED STAFF COMMENTS |
None
12
| ITEM 2. | PROPERTIES |
The corporate headquarters of Energen, Alagasco and Energen Resources are located in leased office space in Birmingham, Alabama. See the discussion under Item 1-Business for further information related to Energen Resources’ and Alagasco’s business operations. Information concerning Energen Resources’ production and reserves is summarized in the table below and included in Note 18, Oil and Gas Operations (Unaudited), in the Notes to Financial Statements. See Item 7 -Management’s Discussion and Analysis of Financial Condition and Results of Operations for a discussion of the future outlook and expectations for Energen Resources and Alagasco.
Oil and Gas Operations
Energen Resources focuses on increasing its production and proved reserves through the acquisition and development of onshore North American producing oil and gas properties. Energen Resources maintains offices in Arcadia, Louisiana; in Farmington, New Mexico; and in Midland, Texas. The Company also maintains offices in Lehman, Seminole, Westbrook and Penwell, Texas; and in Brookwood and Tuscaloosa, Alabama.
The major areas of operations include (1) the San Juan Basin, (2) the Permian Basin, (3) the Black Warrior Basin and (4) North Louisiana/East Texas as highlighted on the above map.
The following table sets forth the production volumes for the year ended December 31, 2007, and proved reserves and reserves-to-production ratio by area as of December 31, 2007:
Year Ended December 31, 2007 | December 31, 2007 | December 31, 2007 | ||||
| Production Volumes (MMcfe) | Proved Reserves (MMcfe) | Reserves-to- Production Ratio | ||||
San Juan Basin | 47,517 | 943,423 | 19.85 years | |||
Permian Basin | 28,655 | 501,920 | 17.52 years | |||
Black Warrior Basin | 14,813 | 234,253 | 15.81 years | |||
North Louisiana/East Texas | 7,187 | 68,653 | 9.55 years | |||
Other | 433 | 5,403 | 12.48 years | |||
Total | 98,605 | 1,753,652 | 17.78 years |
13
The following table sets forth proved reserves by area as of December 31, 2007:
| Gas MMcf | Oil MBbl | NGL MBbl | ||||
San Juan Basin | 762,091 | 1,326 | 28,896 | |||
Permian Basin | 47,648 | 72,944 | 2,768 | |||
Black Warrior Basin | 234,253 | - | - | |||
North Louisiana/East Texas | 67,573 | 180 | - | |||
Other | 4,353 | 175 | - | |||
Total | 1,115,918 | 74,625 | 31,664 |
The following table sets forth proved developed reserves by area as of December 31, 2007:
| Gas MMcf | Oil MBbl | NGL MBbl | ||||
San Juan Basin | 569,800 | 1,320 | 25,805 | |||
Permian Basin | 44,042 | 59,553 | 2,543 | |||
Black Warrior Basin | 231,791 | - | - | |||
North Louisiana/East Texas | 53,526 | 161 | - | |||
Other | 4,351 | 175 | - | |||
Total | 903,510 | 61,209 | 28,348 |
Energen Resources files Form EIA-23 with the Department of Energy which reports gross proved reserves, including the working interest share of other owners, for properties operated by the Company. The proved reserves reported in the table above represent our share of proved reserves for all properties, based on our ownership interest in each property. For properties operated by Energen Resources, the difference between the proved reserves reported on Form EIA-23 and the gross reserves associated with the Company-owned proved reserves reported in the table above does not exceed five percent. Estimated proved reserves as of December 31, 2007 are based upon studies for each of our properties prepared by Company engineers and reviewed by Ryder Scott Company, L.P. and T. Scott Hickman and Associates, Inc., independent oil and gas reservoir engineers. Calculations were prepared using standard geological and engineering methods generally accepted by the petroleum industry and in accordance with SEC guidelines.
The following table sets forth the total shareholder returns (assuming reinvestmentnet productive gas and oil wells by area as of dividends)December 31, 2007, and developed and undeveloped acreage as of the latest practicable date prior to year-end:
| Net Wells | Net Developed Acreage | Net Undeveloped Acreage | ||||
San Juan Basin | 1,390 | 302,202 | 1,413 | |||
Permian Basin | 1,579 | 87,851 | 3,309 | |||
Black Warrior Basin | 782 | 147,190 | 1,187 | |||
North Louisiana/East Texas | 159 | 20,675 | 55 | |||
Alabama Shale and Other | 10 | 6,830 | 281,888 | |||
Total | 3,920 | 564,748 | 287,852 |
Natural Gas Distribution
The properties of Alagasco consist primarily of its gas distribution system, which includes approximately 10,200 miles of main and more than 11,900 miles of service lines, odorization and regulation facilities, and customer meters. Alagasco also has two LNG facilities, four division commercial offices, three division business centers, two payment centers, three district offices, seven service centers, and other related property and equipment, some of which are leased by Alagasco.
| ITEM 3. | LEGAL PROCEEDINGS |
Energen and its affiliates are, from time to time, parties to various pending or threatened legal proceedings. Certain of these lawsuits include claims for punitive damages in addition to other specific relief. Based upon information presently available, and in light of available legal and other defenses, contingent liabilities arising from threatened and pending litigation are not considered material in relation to the respective financial positions of Energen and its
14
affiliates. It should be noted, however, that Energen and its affiliates conduct business in Alabama and other jurisdictions in which the Standard & Poor’s Composite Stock Index (S&P 500), anmagnitude and frequency of punitive or other damage awards may bear little or no relation to culpability or actual damages, thus making it difficult to predict litigation results.
Jefferson County, Alabama
In January 2006, RGGS Land and Minerals LTD, L.P. (RGGS) filed a lawsuit in Jefferson County, Alabama, alleging breach of contract with respect to Energen Resources’ calculation of certain allowed costs and failure to pay in a timely manner certain amounts due RGGS under a mineral lease. RGGS seeks a declaratory judgment with respect to the parties’ rights under the lease, reformation of the lease, monetary damages and termination of Energen Resources’ rights under the lease. The Occluded Gas Lease dated January 1, 1986 was originally between Energen Resources and United States Steel Corporation (U.S. Steel) as lessor. RGGS became the lessor under the lease as a result of a 2004 conveyance from U.S. Steel to RGGS. Approximately 120,000 acres in Jefferson and Tuscaloosa counties, Alabama, are subject to the lease. Separately on February 6, 2006, Energen Resources received notice of immediate lease termination from RGGS. During 2007, Energen Resources’ production associated with the lease was approximately 10.5 Bcf.
RGGS has adopted positions contrary to the seventeen years of course of dealing between Energen Resources and its original contracting partner, U.S. Steel. The Company believes that RGGS’ assertions are without merit and that the notice of lease termination is ineffective. Energen Resources intends to vigorously defend its rights under the lease. The Company remains in possession of the lease, believes that the likelihood of a judgment in favor of RGGS is remote, and has made no material accrual with respect to the litigation or purported lease termination.
Enron Corporation
Enron and Enron North America Corporation (ENA) have settled with Energen Resources and Alagasco related to the Enron and ENA bankruptcy proceedings. Under the settlement, Energen Resources was allowed claims in the bankruptcy cases against Enron and ENA of $12.5 million each. In December 2006, Energen Resources sold its claims against Enron and ENA for a gain of $6.7 million after-tax. All other claims have been released.
Legacy Litigation
During recent years, numerous lawsuits have been filed against oil production companies in Louisiana for restoration of oilfield properties. These suits are referred to in the industry peer index compiled byas “legacy litigation” because they usually involve operations that were conducted on the affected properties many years earlier. Energen Resources is or has been a party to several legacy litigation lawsuits, most of which result from the operations of predecessor companies. Based upon information presently available, and in light of available legal and other defenses, contingent liabilities arising from legacy litigation in excess of the Company’s accrued provision for estimated liability are not considered material to the Company’s financial position.
Other
Various other pending or threatened legal proceedings are in progress currently, and the Company (Peer Group),has accrued a provision for the Standard & Poor’s Supercomposite Oil & Gas Exploration & Production Index (S15OILP),estimated liability.
| ITEM 4. | SUBMISSION OF MATTERS TO A VOTE OF SECURITY HOLDERS |
No matters were submitted to a vote of security holders during the fourth quarter of 2007.
15
EXECUTIVE OFFICERS OF THE REGISTRANTS
Energen Corporation
Name | Age | Position (1) | ||
James T. McManus, II | 49 | Chairman, Chief Executive Officer and President of Energen and Chairman and Chief Executive Officer of Alagasco (2) | ||
Wm. Michael Warren, Jr. | 60 | (3) | ||
Charles W. Porter, Jr. | 43 | Vice President, Chief Financial Officer and Treasurer of Energen and Alagasco (4) | ||
John S. Richardson | 50 | President and Chief Operating Officer of Energen Resources (5) | ||
Dudley C. Reynolds | 55 | President and Chief Operating Officer of Alagasco (6) | ||
J. David Woodruff, Jr. | 51 | General Counsel and Secretary of Energen and Alagasco and Vice President-Corporate Development of Energen (7) | ||
Grace B. Carr | 52 | Vice President and Controller of Energen (8) | ||
| Notes: | (1) | All executive officers of Energen have been employed by Energen or a subsidiary for the past five years. Officers serve at the pleasure of the Board of Directors. | ||
(2) | Mr. McManus has been employed by the Company in various capacities since 1986. He was elected Executive Vice President and Chief Operating Officer of Energen Resources in October 1995 and President of Energen Resources in April 1997. He was elected President and Chief Operating Officer of Energen effective January 1, 2006 and Chief Executive Officer of Energen and each of its subsidiaries effective July 1, 2007. He was elected Chairman of the Board of Energen and each of its subsidiaries effective January 1, 2008. Mr. McManus serves as a Director of Energen and each of its subsidiaries. | |||
(3) | Mr. Warren retired from the Company at the end of 2007. He had been employed by the Company in various capacities since 1983 and served as Chairman of the Board and Chief Executive Officer of Energen and each of its subsidiaries since 1998. Mr. Warren was succeeded by Mr. McManus as Chief Executive officer effective July 1, 2007 and as Chairman of the Board of Energen and each of its subsidiaries effective January 1, 2008. Mr. Warren continues to serve as a Director of Energen and each of its subsidiaries. | |||
(4) | Mr. Porter has been employed by the Company in various financial capacities since 1989. He was elected Controller of Energen Resources in 1998. In 2001, he was elected Vice President – Finance of Energen Resources. He was elected Vice President, Chief Financial Officer and Treasurer of Energen and each of its subsidiaries effective January 1, 2007. | |||
(5) | Mr. Richardson has been employed by the Company in various capacities since 1985. He was elected Vice President – Acquisitions and Engineering of Energen Resources in 1997. He was elected Executive Vice President and Chief Operating Officer of Energen Resources effective January 1, 2006. He was elected President and Chief Operating Officer of Energen Resources effective January 23, 2008. |
16
(6) | Mr. Reynolds has been employed by the Company in various capacities since 1980. He was elected General Counsel and Secretary of Energen and each of its subsidiaries in April 1991. He was elected President and Chief Operating Officer of Alagasco effective January 1, 2003. | |||
(7) | Mr. Woodruff has been employed by the Company in various capacities since 1986. He was elected Vice President-Legal and Assistant Secretary of Energen and each of its subsidiaries in April 1991 and Vice President-Corporate Development of Energen in October 1995. He was elected General Counsel and Secretary of Energen and each of its subsidiaries effective January 1, 2003. | |||
(8) | Ms. Carr was employed by the Company in various capacities from January 1985 to April 1989. She was not employed from May 1989 through December 1997. She was elected Controller of Energen in January 1998 and elected Vice President and Controller of Energen in October 2001. |
17
| ITEM 5. | MARKET FOR REGISTRANT’S COMMON EQUITY, RELATED STOCKHOLDER MATTERS AND ISSUER PURCHASES OF EQUITY SECURITIES |
Quarterly Market Prices and the Standard & Poor’s Supercomposite Gas Utilities Index (S15GASUX). The graph assumes $100 invested at the per-share closing price of theDividends Paid Per Share
Quarter ended(in dollars) | High | Low | Close | Dividends Paid | ||||
March 31, 2006 | 39.49 | 32.71 | 35.00 | .11 | ||||
June 30, 2006 | 38.42 | 32.16 | 38.41 | .11 | ||||
September 30, 2006 | 44.48 | 36.95 | 41.87 | .11 | ||||
December 31, 2006 | 47.60 | 38.50 | 46.94 | .11 | ||||
March 31, 2007 | 51.43 | 43.78 | 50.89 | .115 | ||||
June 30, 2007 | 60.49 | 51.05 | 54.94 | .115 | ||||
September 30, 2007 | 58.90 | 48.24 | 57.12 | .115 | ||||
December 31, 2007 | 70.41 | 56.81 | 64.23 | .115 |
Energen’s common stock is listed on the New York Stock Exchange Composite Tapeunder the symbol EGN. On February 8, 2008, there were 7,135 holders of record of Energen’s common stock. At the date of this filing, Energen Corporation owned all the issued and outstanding common stock of Alabama Gas Corporation. Energen expects to pay annual cash dividends of $0.48 per share on December 31, 2001,the Company’s common stock in 2008. The amount and timing of all dividend payments is subject to the Company and eachdiscretion of the indices.Board of Directors and is based upon business conditions, results of operations, financial conditions and other factors.

As of December 31, | 2001 | 2002 | 2003 | 2004 | 2005 | 2006 | ||||||||||||
S&P 500 Index | $ | 100 | $ | 78 | $ | 100 | $ | 111 | $ | 117 | $ | 135 | ||||||
Energen | $ | 100 | $ | 121 | $ | 175 | $ | 255 | $ | 318 | $ | 416 | ||||||
Peer Group | $ | 100 | $ | 110 | $ | 138 | $ | 179 | $ | 234 | $ | 265 | ||||||
S15OILP Index | $ | 100 | $ | 101 | $ | 128 | $ | 175 | $ | 283 | $ | 293 | ||||||
S15GASUX | $ | 100 | $ | 68 | $ | 84 | $ | 99 | $ | 107 | $ | 134 | ||||||
Total shareholder return includes reinvested dividends. The Peer Group index includes the companies listed below: AGL Resources, Inc., Atmos Energy Corp., Cabot Oil & Gas Corp., Chesapeake Energy Corp., Comstock Resources, Inc., Denbury Resources, Inc., Encore Acquisition Co., Energy East Corp., Equitable Resources, Inc., Keyspan Corp., Laclede Group, Inc., MDU Resources Group, Inc., National Fuel Gas Co., New Jersey Resources Corp., Nicor Inc., Northwest Natural Gas Co., Oneok Inc., Peoples Energy Corp., Piedmont Natural Gas Co., Questar Corp., Quicksilver Resources, Inc., Range Resources Corp., Scana Corp., South Jersey Industries, Inc., Southwest Gas Corp., Southwestern Energy Co., St. Mary Land & Exploration Co., UGI Corp., Vectren Corp., WGL Holdings, Inc., Wisconsin Energy Corp., and XTO Energy, Inc.
| Plan Category | Number of Securities to be Issued for Outstanding Options and Performance Share Awards | Weighted Average Exercise Price | Number of Securities Remaining Available for Future Issuance Under Equity Compensation Plans | |||
Equity compensation plans | 466,339 | $30.79 | 1,953,996 | |||
Equity compensation plans not | - | - | - | |||
Total | 466,339 | $30.79 | 1,953,996 |
|
|
The selected financial data as set forth below should be read in conjunction withfollowing table summarizes information concerning purchases of equity securities by the Consolidated Financial Statements and the Notes to Financial Statements included in this Form 10-K.
SELECTED FINANCIAL AND COMMON STOCK DATA
Energen Corporationissuer:
Years ended December 31, (dollars in thousands, except per share amounts) | 2006 | 2005 | 2004 | 2003 | 2002 | |||||||||||
INCOME STATEMENT | ||||||||||||||||
Operating revenues | $ | 1,393,986 | * | $ | 1,128,394 | $ | 936,857 | $ | 841,631 | $ | 667,419 | |||||
Income from continuing operations before cumulative effect of change in accounting principle | $ | 273,523 | * | $ | 172,886 | $ | 127,305 | $ | 110,104 | $ | 70,204 | |||||
Net income | $ | 273,570 | * | $ | 173,012 | $ | 127,463 | $ | 110,654 | $ | 68,639 | |||||
Diluted earnings per average common share from continuing operations before cumulative effect of change in accounting principle | $ | 3.73 | * | $ | 2.35 | $ | 1.74 | $ | 1.54 | $ | 1.04 | |||||
Diluted earnings per average common share | $ | 3.73 | * | $ | 2.35 | $ | 1.74 | $ | 1.55 | $ | 1.01 | |||||
BALANCE SHEET | ||||||||||||||||
Total property, plant and equipment, net | $ | 2,252,414 | $ | 2,068,011 | $ | 1,783,059 | $ | 1,433,451 | $ | 1,351,554 | ||||||
Total assets | $ | 2,836,887 | $ | 2,618,226 | $ | 2,181,739 | $ | 1,778,232 | $ | 1,643,012 | ||||||
Long-term debt | $ | 582,490 | $ | 683,236 | $ | 612,891 | $ | 552,842 | $ | 512,954 | ||||||
Total shareholders’ equity | $ | 1,202,069 | $ | 892,678 | $ | 803,666 | $ | 699,032 | $ | 582,810 | ||||||
COMMON STOCK DATA | ||||||||||||||||
Annual dividend rate at period-end | $ | 0.44 | $ | 0.40 | $ | 0.385 | $ | 0.37 | $ | 0.36 | ||||||
Cash dividends paid per common share | $ | 0.44 | $ | 0.40 | $ | 0.3775 | $ | 0.365 | $ | 0.355 | ||||||
Diluted average common shares outstanding (000) | 73,278 | 73,715 | 73,117 | 71,434 | 67,677 | |||||||||||
Price range: | ||||||||||||||||
High | $ | 47.60 | $ | 44.31 | $ | 30.04 | $ | 21.00 | $ | 15.00 | ||||||
Low | $ | 32.16 | $ | 27.06 | $ | 19.94 | $ | 14.04 | $ | 10.83 | ||||||
Close | $ | 46.94 | $ | 36.32 | $ | 29.48 | $ | 20.52 | $ | 14.55 | ||||||
| Period | Total Number of Shares Purchased | | Average Price Paid per Share | Total Number of Shares Purchased as Part of Publicly Announced Plans | Maximum Number of Shares that May Yet Be Purchased Under the Plans** | ||||
October 1, 2007 through | - | - | - | 8,992,700 | |||||
November 1, 2007 through | - | - | - | 8,992,700 | |||||
December 1, 2007 through | 1,857 | * | $ 64.43 | - | 8,992,700 | ||||
Total | 1,857 | $ 64.43 | - | 8,992,700 |
* |
|
| ** | By resolution adopted May 24, 1994, and supplemented by a resolution adopted April 26, 2000 and June 24, 2006, the Board of Directors authorized the Company to repurchase up to 12,564,400 shares of the Company’s common stock. The resolutions do not have an |
All information has been restated to reflect a 2-for-1 stock split effective June 1, 2005.
SELECTED BUSINESS SEGMENT DATA18
Energen Corporation
Years ended December 31, (dollars in thousands) | 2006 | 2005 | 2004 | 2003 | 2002 | ||||||||||
OIL AND GAS OPERATIONS | |||||||||||||||
Operating revenues from continuing operations | |||||||||||||||
Natural gas | $ | 437,560 | $ | 365,635 | $ | 276,482 | $ | 235,022 | $ | 145,443 | |||||
Oil | 181,459 | 116,651 | 98,409 | 87,192 | 72,132 | ||||||||||
Natural gas liquids | 50,258 | 38,455 | 30,902 | 25,938 | 21,843 | ||||||||||
Other | 61,265 | 6,953 | 4,324 | 4,380 | 3,570 | ||||||||||
Total | $ | 730,542 | $ | 527,694 | $ | 410,117 | $ | 352,532 | $ | 242,988 | |||||
Production volumes from continuing operations | |||||||||||||||
Natural gas (MMcf) | 62,824 | 61,048 | 57,164 | 55,304 | 45,891 | ||||||||||
Oil (MBbl) | 3,645 | 3,316 | 3,434 | 3,411 | 2,989 | ||||||||||
Natural gas liquids (MMgal) | 76.3 | 70.5 | 68.2 | 66.6 | 71.9 | ||||||||||
Production volumes from continuing operations (MMcfe) | 95,596 | 91,020 | 87,513 | 85,291 | 74,093 | ||||||||||
Total production volumes (MMcfe) | 95,595 | 91,099 | 87,606 | 86,157 | 77,973 | ||||||||||
Proved reserves | |||||||||||||||
Natural gas (MMcf) | 1,096,429 | 1,080,161 | 1,019,436 | 886,307 | 803,748 | ||||||||||
Oil (MBbl) | 74,893 | 74,962 | 54,500 | 52,528 | 49,833 | ||||||||||
Natural gas liquids (MBbl) | 29,504 | 31,934 | 34,613 | 27,245 | 26,697 | ||||||||||
Total (MMcfe) | 1,722,811 | 1,721,537 | 1,554,114 | 1,364,945 | 1,262,928 | ||||||||||
Other data from continuing operations | |||||||||||||||
Lease operating expense (LOE) | |||||||||||||||
LOE and other | $ | 134,853 | $ | 104,241 | $ | 79,191 | $ | 67,833 | $ | 56,932 | |||||
Production taxes | 49,509 | 52,271 | 37,285 | 27,686 | 18,186 | ||||||||||
Total | $ | 184,362 | $ | 156,512 | $ | 116,476 | $ | 95,519 | $ | 75,118 | |||||
Depreciation, depletion and amortization | $ | 97,842 | $ | 89,340 | $ | 80,896 | $ | 79,495 | $ | 70,285 | |||||
Capital expenditures | $ | 259,678 | $ | 353,712 | $ | 403,936 | $ | 163,338 | $ | 305,476 | |||||
Operating income | $ | 405,149 | $ | 243,876 | $ | 180,379 | $ | 153,325 | $ | 78,680 | |||||
NATURAL GAS DISTRIBUTION | |||||||||||||||
Operating revenues | |||||||||||||||
Residential | $ | 426,066 | $ | 384,753 | $ | 340,229 | $ | 320,938 | $ | 277,088 | |||||
Commercial and industrial | 181,900 | 166,957 | 138,686 | 126,638 | 104,247 | ||||||||||
Transportation | 45,950 | 43,291 | 40,221 | 38,250 | 38,395 | ||||||||||
Other | 9,528 | 5,699 | 7,604 | 3,273 | 4,701 | ||||||||||
Total | $ | 663,444 | $ | 600,700 | $ | 526,740 | $ | 489,099 | $ | 424,431 | |||||
Gas delivery volumes (MMcf) | |||||||||||||||
Residential | 22,310 | 24,601 | 25,383 | 27,248 | 26,358 | ||||||||||
Commercial and industrial | 11,226 | 12,498 | 12,323 | 12,564 | 11,838 | ||||||||||
Transportation | 50,760 | 49,850 | 54,385 | 55,623 | 59,644 | ||||||||||
Total | 84,296 | 86,949 | 92,091 | 95,435 | 97,840 | ||||||||||
Average number of customers | |||||||||||||||
Residential | 420,558 | 425,110 | 425,673 | 427,413 | 425,630 | ||||||||||
Commercial, industrial and transportation | 34,456 | 34,936 | 35,248 | 35,463 | 35,601 | ||||||||||
Total | 455,014 | 460,046 | 460,921 | 462,876 | 461,231 | ||||||||||
Other data | |||||||||||||||
Depreciation and amortization | $ | 44,244 | $ | 42,351 | $ | 39,881 | $ | 37,171 | $ | 33,682 | |||||
Capital expenditures | $ | 76,157 | $ | 73,276 | $ | 58,208 | $ | 57,906 | $ | 65,815 | |||||
Operating income | $ | 74,274 | $ | 72,922 | $ | 66,199 | $ | 66,848 | $ | 59,370 | |||||
|
|
CRITICAL ACCOUNTING POLICIES
The Company’s consolidated financial statements are prepared in accordance with accounting principles generally accepted in the United States of America. Management has identified the following critical accounting policies in the application of existing accounting standards or in the implementation of new standards that involve significant judgments and estimates by the Company. The application of these accounting policies necessarily requires managements’ most subjective or complex judgments regarding estimates and projected outcomes of future events that could have a material impact on the financial statements:
Oil and Gas Operations
Accounting for Natural Gas and Oil Producing Activities and Related Reserves:General:The Company utilizes the successful efforts method of accounting for its natural gas and oil producing activities. Under this accounting method, acquisition and development costs of proved properties are capitalized and amortized on a units-of-production basis over the remaining life of total proved and proved developed reserves. Proved Energen’s oil and gas operations focus on increasing production and adding proved reserves arethrough the estimated quantities of crude oil, natural gasdevelopment and natural gas liquids that geological and engineering data demonstrate with reasonable certainty to be recoverable in future years from known reservoirs under existing economic and operating conditions. Accordingly, these estimates do not include probable or possible reserves. Estimated oil and gas reserves are based on currently available reservoir data and are subject to future revision. Estimates of physical quantitiesacquisition of oil and gas reserves have been determined by Company engineers. Independent oilproperties. In addition, Energen Resources explores for and develops new reservoirs, primarily in areas in which it has an operating presence. All gas, reservoir engineers have reviewed the estimates of proved reserves of natural gas, crude oil and natural gas liquids attributedproduction is sold to third parties. Energen Resources also provides operating services in the Company’s net interests inBlack Warrior, San Juan and Permian basins for its joint interest and third parties. These services include overall project management and day-to-day decision-making relative to project operations.
At the end of 2007, Energen Resources’ proved oil and gas reserves totaled 1,754 billion cubic feet equivalent (Bcfe). Substantially all of these reserves are located in the San Juan Basin in New Mexico and Colorado, the Permian Basin in west Texas and the Black Warrior Basin in Alabama. Approximately 82 percent of Energen Resources’ year-end reserves are proved developed reserves. Energen Resources’ reserves are long-lived, with a year-end reserves-to-production ratio of 18 years. Natural gas represents approximately 64 percent of Energen Resources’ proved reserves, with oil representing approximately 26 percent and natural gas liquids comprising the balance.
Growth Strategy: Energen has operated for more than ten years under a strategy to grow its oil and gas operations. Since the end of fiscal year 1995, Energen Resources has invested approximately $1.2 billion in property acquisitions, $1.3 billion in related development, and $209 million in exploration and related development. Energen Resources’ capital investment in 2008 and 2009 is currently expected to approximate $579 million primarily for existing properties. The Company also may allocate additional capital during this two-year period for other oil and gas activities such as property acquisitions and the exploration and development of potential shale plays primarily in Alabama. The estimates above do not include amounts for capital related to potential acquisitions or development of these shale plays discussed below.
Energen Resources seeks to acquire onshore North American properties which offer proved undeveloped and/or behind-pipe reserves as well as operational enhancement potential. Energen Resources prefers properties with long-lived reserves and multiple pay-zone opportunities; however, Energen Resources will consider acquisitions of other types of properties which meet its investment requirements, including acquisitions with unproved properties. In addition, Energen Resources conducts exploration activities primarily in areas in which it has operations and remains open to exploration activities which complement its core expertise and meet its investment requirements. Following an acquisition, Energen Resources focuses on increasing production and reserves through development of the properties’ undeveloped reserves and behind-pipe reserve potential as well as engaging in other activities. These activities include development well drilling, exploration, behind-pipe recompletions, pay-adds, workovers, secondary recovery and operational enhancements. Energen Resources prefers to operate its properties in order to better control the nature and pace of development activities. Energen Resources operated approximately 91 percent of its proved reserves at December 31, 2007.
In October 2006, Energen Resources sold to Chesapeake Energy Corporation (Chesapeake) a 50 percent interest in its unproved lease position of approximately 200,000 acres in various shale plays in Alabama for $75 million and a $15 million carried drilling interest. In addition, the two companies signed an agreement to form an area of mutual interest (AMI) through which they will pursue new leases, exploration, development and operations on a 50-50 basis, for at least the next 10 years. Energen Resources and Chesapeake continue to lease shared acreage in the AMI, which encompasses Alabama and some of Georgia, in advance of drilling. As of February 25, 2008, Energen Resources’ net acreage position in Alabama shale totaled approximately 287,500 acres and represents multiple shale opportunities.
Energen Resources’ development activities can result in the addition of new proved reserves and can serve to reclassify proved undeveloped reserves to proved developed reserves. Proved reserve disclosures are provided annually, although changes to reserve classifications occur throughout the year. Accordingly, additions of new reserves from development activities can occur throughout the year and may result from numerous factors including, but not limited to, regulatory approvals for drilling unit downspacing that increase the number of
5
available drilling locations; changes in the economic or operating environments that allow previously uneconomic locations to be added; technological advances that make reserve locations available for development; successful development of existing proved undeveloped reserve locations that reclassify adjacent probable locations to proved undeveloped reserve locations; increased knowledge of field geology and engineering parameters relative to oil and gas reservoirs; and changes in management’s intent to develop certain opportunities.
During the three years ended December 31, 2007, the Company’s development efforts have added 364 Bcfe of proved reserves from the drilling of 975 gross development wells (including 27 sidetrack wells) and 150 well recompletions and pay-adds. In 2007, Energen Resources’ successful development wells and other activities added approximately 127 Bcfe of proved reserves; the company drilled 367 gross development wells (including 22 sidetrack wells), performed some 34 well recompletions and pay-adds, and conducted other operational enhancements. Energen Resources’ production from continuing operations totaled 98.6 Bcfe in 2007 and is estimated to total 102 Bcfe in 2008, including 100 Bcfe of estimated production from proved reserves owned at December 31, 2007. In 2009, production is estimated to be 108 Bcfe, including approximately 100 Bcfe produced from proved reserves currently owned.
Drilling Activity:The following table sets forth the total number of net productive and dry exploratory and development wells drilled:
Years ended December 31, | 2007 | 2006 | 2005 | |||
Development: | ||||||
Productive | 135.5 | 151.7 | 153.9 | |||
Dry | 1.0 | - | 1.7 | |||
Total | 136.5 | 151.7 | 155.6 | |||
Exploratory: | ||||||
Productive | 21.7 | 40.1 | 4.1 | |||
Dry | 0.3 | 3.0 | - | |||
Total | 22.0 | 43.1 | 4.1 |
As of December 31, 2007, the Company was participating in the drilling of 9 gross development wells, with the Company’s interest equivalent to 5 wells. In addition to the development wells drilled, the Company drilled 99.8, 35.9 and 33 net service wells during 2007, 2006 and 2005, respectively. As of December 31, 2007, the Company was participating in the drilling of 1 gross service well, with the Company’s interest equivalent to 0.9 well.
Productive Wells and Acreage: The following table sets forth the total gross and net productive gas and oil wells as of December 31, 2006. The independent reservoir engineers have issued reports covering approximately 98 percent2007, and developed and undeveloped acreage as of the Company’s ending proved reserveslatest practicable date prior to year-end:
| Gross | Net | |||
Gas wells | 4,101 | 2,333 | ||
Oil wells | 3,161 | 1,587 | ||
Developed acreage | 820,732 | 564,748 | ||
Undeveloped acreage | 324,395 | 287,852 |
There were 17 wells with multiple completions in 2007. All wells and in their judgment these estimates were reasonableacreage are located onshore in the aggregate. The Company’s productionUnited States, with the majority of the net undeveloped reserves requires the installation or completion of related infrastructure facilities such as pipelines and the drilling of development wells.acreage located in Alabama.
Changes in oil and gas prices, operating costs and expected performance from the properties can result in a revision to the amount of estimated reserves held by the Company. If reserves are revised upward, earnings could be affected dueRisk Management:Energen Resources attempts to lower depreciation and depletion expense per unit of production. Likewise, if reserves are revised downward, earnings could be affected due to higher depreciation and depletion expense or due to an immediate writedown of the property’s book value if an impairment is warranted. The table below reflects an estimated increase in 2007 depreciation, depletion and amortization expensecommodity price risk associated with an assumed downward revision in the reported oil and gas reserve amounts at December 31, 2006.
(dollars in thousands) | Percentage Change in Oil & Gas Reserves From Reported Reserves as of December 31, 2006 | |||||||
| -5 | % | -10 | % | |||||
Estimated increase in depreciation expense for the year ended December 31, 2007, net of tax | $ | 3,600 | $ | 7,500 | ||||
Asset Impairments:Oil and gas proved properties periodically are assessed for possible impairment, generally on a field-by-field basis, using the estimated undiscounted future cash flows of each field. Impairment losses are recognized when the estimated undiscounted future cash flows are less than the current net book values of the properties in a field. The Company monitors its oil and natural gas properties as well asbusiness through the marketuse of futures, swaps and business environments in which it operates and makes assessments about events that could result in potential impairment issues. Such potential events may include, but are not limited to, substantial commodity price declines, unanticipated increased operating costs, and lower-than-expected production performance. If a material event occurs, Energen’s oil and gas subsidiary,options. Energen Resources Corporation, makes an estimatedoes not hedge more than 80 percent of undiscounted future cash flows to determine whether the asset is impaired. If the asset is impaired, the Company will record an impairment loss for the difference between the net book value of the propertiesits estimated annual production and the fair value of the properties. The fair value of the properties typically is estimated using discounted cash flows.
Cash flow and fair value estimates require Energen Resources to make projections and assumptions for pricing, demand, competition, operating costs, legal and regulatory issues, discount rates and other factors for manygenerally does not hedge more than two fiscal years into the future. These variables can, and often do, differ from the estimates and can have a positive or negative impact on the Company’s need for impairment or on the amount of impairment. In addition, further changes in the economic and business environment can impact the Company’s original and ongoing assessments of potential impairment.
Energen Resources adheres toforward. Statement of Financial Accounting Standards (SFAS) No.19, “Financial Accounting and Reporting by Oil and Gas Producing Companies,” for recognizing any impairment of capitalized costs to unproved properties. The greatest portion of these costs generally relates to the acquisition of leasehold costs. The costs are capitalized and periodically evaluated as to recoverability, based on changes brought about by economic factors and potential shifts in business strategy employed by management. The Company considers a combination of geologic and engineering factors to evaluate the need for impairment of these costs.
Derivatives: Energen Resources periodically enters into commodity derivative contracts to manage its exposure to oil, natural gas and natural gas liquids price volatility. SFAS No. 133, “Accounting for Derivative Instruments and Hedging Activities”Activities,” as amended requires all derivatives to be recognized on the balance sheet and measured at fair value. Realized gains and losses from derivativesIf a derivative is designated as a cash flow hedges arehedge, the effectiveness of the hedge, or the
6
degree that the gain (loss) for the hedging instrument offsets the loss (gain) on the hedged item, is measured at each reporting period. The effective portion of the gain or loss on the derivative instrument is recognized in oilother comprehensive income as a component of equity and gas production revenuessubsequently reclassified into earnings when the forecasted transaction occurs. Energen Resources from timeaffects earnings. The ineffective portion of a derivative’s change in fair value is required to time entersbe recognized in earnings immediately. Derivatives that do not qualify for hedge treatment under SFAS No. 133 must be recorded at fair value with gains or losses recognized in operating revenues in the period of change.
The Company may also enter into derivative transactions that do not qualify for cash flow hedge accounting but are considered by management to berepresent valid economic hedges. Gainshedges and lossesare accounted for as mark-to-market transactions. These economic hedges may include, but are not limited to, put options and swaps on non-operated or other properties for which all of the necessary information to qualify for cash flow hedge accounting is either not readily available or subject to change.
In the case of an acquisition, Energen Resources may hedge more than two years forward to protect targeted returns. Energen Resources prefers long-lived reserves and primarily uses the then-current oil and gas futures prices in its evaluation models, the prevailing swap curve and, for the longer-term, its own pricing assumptions.
See the Forward-Looking Statements in Item 7, Management’s Discussion and Analysis of Financial Condition and Results of Operations, and Item 1A, Risk Factors, for further discussion with respect to price and other risks.
Natural Gas Distribution
General: Alagasco is the largest natural gas distribution utility in the state of Alabama. Alagasco purchases natural gas through interstate and intrastate marketers and suppliers and distributes the purchased gas through its distribution facilities for sale to residential, commercial and industrial customers and other end-users of natural gas. Alagasco also provides transportation services to industrial and commercial customers located on its distribution system. These transportation customers, using Alagasco as their agent or acting on their own, purchase gas directly from producers, marketers or suppliers and arrange for delivery of the gas into the Alagasco distribution system. Alagasco charges a fee to transport such customer-owned gas through its distribution system to the customers’ facilities.
Alagasco’s service territory is located in central and parts of north Alabama and includes 177 cities and communities in 28 counties. The aggregate population of the counties served by Alagasco is estimated to be 2.4 million. Among the cities served by Alagasco are Birmingham, the center of the largest metropolitan area in Alabama, and Montgomery, the state capital. During 2007, Alagasco served an average of 416,967 residential customers and 34,200 commercial, industrial and transportation customers. The Alagasco distribution system includes approximately 10,200 miles of main and more than 11,900 miles of service lines, odorization and regulation facilities, and customer meters.
APSC Regulation:As an Alabama utility, Alagasco is subject to regulation by the Alabama Public Service Commission (APSC) which established the Rate Stabilization and Equalization (RSE) rate-setting process in 1983. RSE was extended in 2007, 2002, 1996, 1990, 1987 and 1985. On December 21, 2007, the APSC extended RSE for a seven-year period through December 31, 2014. Under the terms of the extension, RSE will continue after December 31, 2014, unless, after notice to the Company and a hearing, the APSC votes to modify or discontinue the RSE methodology. Alagasco’s allowed range of return on average equity remains 13.15 percent to 13.65 percent throughout the term of the order. Alagasco is on a September 30 fiscal year for rate-setting purposes (rate year).
Under RSE, the APSC conducts quarterly reviews to determine, based on Alagasco’s projections and year-to-date performance, whether Alagasco’s return on average equity at the end of the rate year will be within the allowed range of return. Reductions in rates can be made quarterly to bring the projected return within the allowed range; increases, however, are allowed only once each rate year, effective December 1, and cannot exceed 4 percent of prior-year revenues. Prior to the December 21, 2007 extension, RSE limited the utility’s equity upon which a return is permitted to 60 percent of total capitalization and provided for certain cost control
7
measures designed to monitor Alagasco’s operations and maintenance (O&M) expense. Under the inflation-based cost control measurement established by the APSC, if the percentage change in O&M expense per customer fell within a range of 1.25 points above or below the percentage change in the Consumer Price Index For All Urban Consumers (index range), no adjustment was required. If the change in fair valueO&M expense per customer exceeded the index range, three-quarters of derivative instruments that do not qualify for hedge accountingthe difference was returned to customers. To the extent the change was less than the index range, the utility benefited by one-half of the difference through future rate adjustments.
Subsequent to the extension, the equity on which a return will be permitted will be phased down to 57 percent by December 31, 2008 and 55 percent by December 31, 2009. The changes to the O&M expense cost control measurement subsequent to the extension are reportedas follows: annual changes in current period operating revenues,O&M expense will be measured on an aggregate basis rather than per customer; the percentage change in O&M expense must fall within a range of 0.75 points above or below the percentage change in the periodindex range; non-recurring and/or recurring items that fluctuate based on situations demonstrated to be beyond Alagasco’s control may be excluded for the cost control measurement calculation; the O&M expense base for measurement purposes will continue to be set at the prior year’s actual O&M expense amount unless the Company exceeds the top of the index range in two successive years, in which case the base for the following year will be set at the top of the index range.
The temperature adjustment rider to Alagasco’s rate tariff, approved by the APSC in 1990, was designed to mitigate the earnings impact of variances from normal temperatures. Alagasco calculates a temperature adjustment to customers’ monthly bills to moderate the impact of departures from normal temperatures on Alagasco’s earnings. This adjustment, however, is subject to certain limitations including regulatory limits on adjustments to increase customers’ bills. Other non-temperature weather conditions that may affect customer usage are not included such as the impact of wind velocity or cloud cover and the impact of any elasticity of demand as a result of high commodity prices. Adjustments to customers’ bills are made in the same billing cycle in which the hedge transactionweather variation occurs. Substantially all the customers to whom the temperature adjustment applies are residential, small commercial and small industrial. Alagasco’s rate schedules for natural gas distribution charges contain a Gas Supply Adjustment (GSA) rider that permits the pass-through to customers of changes in the cost of gas supply.
The APSC approved an Enhanced Stability Reserve (ESR) beginning October 1997, with an approved maximum funding level of $4 million, to which Alagasco may charge the full amount of: (1) extraordinary O&M expenses resulting fromforce majeure events such as storms, severe weather, and outages, when one or a combination of two such events results in more than $200,000 of additional O&M expense during a rate year; or (2) individual industrial and commercial customer revenue losses that exceed $250,000 during the rate year, if such losses cause Alagasco’s return on equity to fall below 13.15 percent. Following a year in which a charge against the ESR is settled.made, the APSC provides for accretions to the ESR in an amount of no more than $40,000 monthly until the maximum funding level is achieved. Subsequent to the 2007 extension, Alagasco will not have accretions against the ESR until December 31, 2010 unless the Company incurs a significant natural disaster during the three-year period ended December 31, 2010 and receives approval from the APSC to resume accretions under the ESR.
Gas Supply: Alagasco’s distribution system is connected to two major interstate natural gas pipeline systems, Southern Natural Gas Company (Southern) and Transcontinental Gas Pipe Line Company (Transco). It is also connected to several intrastate natural gas pipeline systems and to Alagasco’s two liquified natural gas (LNG) facilities.
Alagasco purchases natural gas from various natural gas producers and marketers. Certain volumes are purchased under firm contractual commitments with other volumes purchased on a spot market basis. The purchased volumes are delivered to Alagasco’s system using a variety of firm transportation, interruptible transportation and storage capacity arrangements designed to meet the system’s varying levels of demand. Alagasco’s LNG facilities can provide the system with up to an additional 200,000 thousand cubic feet per day (Mcfd) of natural gas to meet peak day demand.
8
As of December 31, 2007, Alagasco had the following contracts in place for firm natural gas pipeline transportation and storage services:
| December 31, 2007 | ||||
| (Mcfd) | ||||
Southern firm transportation | 152,933 | |||
Southern storage and no notice transportation | 251,679 | |||
Transco firm transportation | 70,000 | |||
Various intrastate transportation | 20,240 |
Competition and Rate Flexibility:The price of natural gas is a significant competitive factor in Alagasco’s service territory, particularly among large commercial and industrial transportation customers. Propane, coal and fuel oil are readily available, and many industrial customers have the capability to switch to alternate fuels and/or alternate sources of gas. In the residential and small commercial and industrial markets, electricity is the principal competitor. With the support of the APSC, Alagasco has implemented a variety of flexible rate strategies to help it compete for the large customer gas load in the marketplace. Rate flexibility remains critical as the utility faces competition for this load. To date, the utility has been effective in utilizing its flexible rate strategies to minimize bypass and price-based switching to alternate fuels and alternate sources of gas.
In 1994 Alagasco implemented the P Rate in response to the competitive challenge of interstate pipeline capacity release. Under this tariff provision, Alagasco releases much of its excess pipeline capacity and repurchases it as agent for its transportation customers under 12 month contracts. The transportation customers benefit from lower pipeline costs; Alagasco’s core market customers benefit, as well, since the utility uses the revenues received from the P Rate to decrease gas costs for its residential and its small commercial and industrial customers. In 2007, approximately 300 of Alagasco’s transportation customers utilized the P Rate, and the resulting reduction in core market gas costs totaled more than $7.8 million.
The Competitive Fuel Clause (CFC) and Transportation Tariff also have been important to Alagasco’s ability to compete effectively for customer load in its service territory. The CFC allows Alagasco to adjust large customer rates on a case-by-case basis to compete with alternate fuels and alternate sources of gas. The GSA rider to Alagasco’s tariff allows the Company to recover a reduction in charges allowed under the CFC because the retention of any customer, particularly large commercial and industrial transportation customers, benefits all customers by recovering a portion of the system’s fixed costs. The Transportation Tariff allows Alagasco to transport gas for customers, rather than buy and resell it to them, and is based on Alagasco’s sales profit margin so that operating margins are unaffected. During 2007 substantially all of Alagasco’s large commercial and industrial customer deliveries involved the transportation of customer-owned gas. In addition, Alagasco served as gas purchasing agent for more than 99 percent of its transportation customers. Alagasco also uses long-term special contracts as a vehicle for retaining large customer load. At the end of 2007, 65 of the utility’s largest commercial and industrial transportation customers were under special contracts of varying lengths.
Natural gas service available to Alagasco customers falls into two broad categories: interruptible and firm. Interruptible service contractually is subject to interruption by Alagasco for various reasons; the most common occurrence is curtailment of industrial customers during periods of peak core market heating demand. Interruptible service typically is provided to large commercial and industrial transportation customers who can reduce their gas consumption by adjusting production schedules or by switching to alternate fuels for the duration of the service interruption. More expensive firm service, on the other hand, generally is not subject to interruption and is provided to residential and to small commercial and industrial customers; these core market customers depend on natural gas primarily for space heating.
Growth: Customer growth presents a major challenge for Alagasco, given its mature, slow-growth service area. In 2007 Alagasco’s average number of customers decreased 1 percent. Alagasco will continue to concentrate on maintaining its current penetration levels in the residential new construction market and generating additional revenue in the small and large commercial and industrial market segments.
9
Seasonality:Alagasco’s gas distribution business is highly seasonal since a material portion of the utility’s total sales and delivery volumes is to space heating customers. Alagasco’s rate tariff includes a temperature adjustment rider primarily for residential, small commercial and small industrial customers that moderates the impact of departures from normal temperatures on Alagasco’s earnings. The calculation is performed monthly, and adjustments are made to customers’ bills in the actual month the weather variation occurs.
Environmental Matters
Various environmental laws and regulations apply to the operations of Energen Resources and Alagasco. Historically, the cost of environmental compliance has not materially affected the Company’s financial position, results of operations or cash flows and is not expected to do so in the future; however, new regulations, enforcement policies, claims for damages or other events could result in significant unanticipated costs.
A discussion of certain litigation against Energen Resources in the state of Louisiana related to the restoration of oilfield properties is included in Item 3, Legal Proceedings of Part I in this Form 10-K.
Alagasco is in the chain of title of nine former manufactured gas plant sites (four of which it still owns) and five manufactured gas distribution sites (one of which it still owns). An investigation of the sites does not enter into derivativesindicate the present need for remediation activities. Management expects that, should remediation of any such sites be required in the future, Alagasco’s share, if any, of such costs will not materially affect the Company’s financial position.
Employees
The Company has approximately 1,542 employees, of which Alagasco employs 1,169 and Energen Resources employs 373. The Company believes that its relations with employees are good.
10
| ITEM 1A. | RISK FACTORS |
Third Party Facilities: Energen Resources delivers to and Alagasco is served by third party facilities. These facilities include third party oil and gas gathering, transportation, processing and storage facilities. Energen Resources relies upon such facilities for access to markets for its production. Alagasco relies upon such facilities for access to natural gas supplies. Such facilities are typically limited in number and geographically concentrated. An extended interruption of access to or service from these facilities, whether caused by weather events, natural disaster, accident, mechanical failure, criminal act or otherwise could result in material adverse financial consequences to Alagasco, Energen Resources and/or the Company.
Energen Resources’ Production and Drilling: There are numerous uncertainties inherent in estimating quantities of proved oil and gas reserves and in projecting future rates of production and timing of development expenditures. The total amount or timing of actual future production may vary significantly from reserve and production estimates. In the event Energen Resources is unable to fully invest its planned development, acquisition and exploratory expenditures, future operating revenues, production, and proved reserves could be negatively affected. The drilling of development and exploratory wells can involve significant risks, including those related to timing, success rates and cost overruns, and these risks can be affected by lease and rig availability, complex geology and other financial instruments for trading purposes. Thefactors. Anticipated drilling plans and capital expenditures may also change due to weather, manpower and equipment availability, changing emphasis by management and a variety of other factors which could result in actual drilling and capital expenditures being substantially different than currently planned.
Energen Resources’ Hedging:Although Energen Resources makes use of derivativefutures, swaps, options and fixed-price contracts to mitigate price risk, may causefluctuations in future oil, gas and natural gas liquids prices could materially affect the Company’s financial position, results of operations and cash flowflows; furthermore, such risk mitigation activities may cause the Company’s financial position and results of operations to be materially different from results that would have been obtained had such risk mitigation activities not occurred.
Natural Gas Distribution The effectiveness of such risk mitigation assumes that counterparties maintain satisfactory credit quality. The effectiveness of such risk mitigation also assumes that actual sales volumes will generally meet or exceed the volumes subject to the futures, swaps, options and fixed-price contracts. A substantial failure to meet sales volume targets, whether caused by miscalculations, weather events, natural disaster, accident, mechanical failure, criminal act or otherwise, could leave Energen Resources financially exposed to its counterparties and result in material adverse financial consequences to Energen Resources and the Company. The adverse effect could be increased if the adverse event was widespread enough to move market prices against Energen Resources’ position.
Regulated Operations:Alagasco’s Hedging: Alabama Gas Corporation (Alagasco), Energen’s utility subsidiary, applies SFAS No. 71, “Accounting for the EffectsSimilarly, although Alagasco makes use of Certain Types of Regulation,”futures, swaps and fixed-price contracts to its regulated operations. This standard requires amitigate gas supply cost to be capitalized as a regulatory asset that otherwise would be charged to expense if it is probable that the cost is recoverablerisk, fluctuations in the future through regulated rates. Likewise, if current recovery is provided for a cost that will be incurred in the future, SFAS No. 71 requires the cost to be recognized as a regulatory liability. The Company anticipates SFAS No. 71 will continue as the applicable accounting standard forgas supply costs could materially affect its regulated operations. Alagasco’s rate setting methodology, Rate Stabilization and Equalization, has been in effect since 1983.
Consolidated
Employee Benefit Plans:In December 2006, the Company adopted SFAS No. 158, “Employers’ Accounting for Defined Benefit Pension and Other Postretirement Plans, an amendment of FASB Statements No. 87, 88, 106 and 132 (R)” (SFAS No. 158). This Standard retains the previous periodic expense calculation on an actuarial basis under the provisions of SFAS No. 87, “Employers’ Accounting for Pensions” and SFAS No. 106, “Employers’ Accounting for Postretirement Benefits Other than Pensions.” In addition, SFAS No. 158 requires an employer to recognize the net funded status of defined benefit pensions and other postretirement benefit plans (benefit plans) as an asset or liability in its statement of financial position and rates to recognizecustomers. The effectiveness of Alagasco’s risk mitigation assumes that its counterparties in such activities maintain satisfactory credit quality. The effectiveness of such risk mitigation also assumes that Alagasco’s actual gas supply needs will generally meet or exceed the volumes subject to the futures, swaps and fixed-price contracts. A substantial failure to experience projected gas supply needs, whether caused by miscalculations, weather events, natural disaster, accident, mechanical failure, criminal act or otherwise, could leave Alagasco financially exposed to its counterparties and result in material adverse financial consequences to Alagasco and the Company. The adverse effect could be increased if the adverse event was widespread enough to move market prices against Alagasco’s position.
Operations: Inherent in the gas distribution activities of Alagasco and the oil and gas production activities of Energen Resources are a variety of hazards and operation risks, such as leaks, explosions and mechanical problems that could cause substantial financial losses. In addition, these risks could result in loss of human life, significant damage to property, environmental pollution, impairment of operations and substantial losses to the Company. In accordance with customary industry practices, the Company maintains insurance against some, but not all, of these risks and losses. The location of pipeline and storage facilities near populated areas, including residential areas, commercial business centers and industrial sites, could increase the level of damages resulting from these risks. The occurrence of any of these events could adversely affect Alagasco’s, Energen Resources’ and/or the Company’s financial position, results of operations and cash flows.
11
Energen Resources Customer Concentration: Revenues and related accounts receivable from oil and gas operations primarily are generated from the sale of produced oil, natural gas and natural gas liquids to energy marketing companies. Such sales are typically made on an unsecured credit basis with payment due the month following delivery. This concentration of sales to the energy marketing industry has the potential to affect the Company’s overall exposure to credit risk, either positively or negatively, in that the Company’s oil and gas purchasers may be affected similarly by changes in economic, industry or other conditions. Energen Resources considers the funded status through comprehensive incomecredit quality of its customers and, in certain instances, may require credit assurances such as a deposit, letter of credit or parent guarantee. The four largest oil, natural gas and natural gas liquids purchasers account for approximately 22 percent, 14 percent, 11 percent and 10 percent, respectively, of Energen Resources’ estimated 2008 production. Energen Resources’ other purchasers each bought less than 8 percent of production.
Alagasco’s Service Territory: Alagasco’s utility customers are geographically concentrated in central and north Alabama. Significant economic, weather, natural disaster, criminal act or other events that adversely affect this region could adversely affect Alagasco and the Company.
Access to Credit Markets: The Company and its subsidiaries rely on access to credit markets. The availability and cost of credit market access is significantly influenced by rating agency evaluations of the Company and of Alagasco. Events affecting credit market liquidity could increase borrowing costs or limit availability of funds.
| ITEM 1B. | UNRESOLVED STAFF COMMENTS |
None
12
| ITEM 2. | PROPERTIES |
The corporate headquarters of Energen, Alagasco and Energen Resources are located in leased office space in Birmingham, Alabama. See the discussion under Item 1-Business for further information related to Energen Resources’ and Alagasco’s business operations. Information concerning Energen Resources’ production and reserves is summarized in the year in which the changes occur. As required by SFAS No. 158 as of December 31, 2006, the pension benefit obligation is the projected benefit obligation (PBO), a measurement of earned benefit obligations at expected retirement salary levels; for other postretirement plans, the benefit obligation is the accumulated postretirement benefit obligation (APBO), a measurement of earned postretirement benefit obligations expected to be paid to employees upon retirement. Prior to implementation of SFAS No. 158, the required pension benefit obligation was the accumulated benefit obligation (ABO), a measurement of earned benefit obligations at existing salary levels,table below and other postretirement obligations were not recorded as a liability on the statement of financial position. Alagasco established a regulatory asset for the portion of the total benefit obligation to be recovered through rates in future periods in accordance with SFAS No. 71.
Actuarial assumptions attempt to anticipate future events and are used in calculating the expenses and liabilities related to these plans. The calculation of the liability related to the Company’s benefit plans includes assumptions regarding the appropriate weighted average discount rate, the expected long-term rate of return on the plans’ assets and the estimated weighted average rate of increase in the compensation level of its employee base for defined benefit pension plans. The key assumptions used in determining these calculations are disclosedincluded in Note 5, Employee Benefit Plans,18, Oil and Gas Operations (Unaudited), in the Notes to Financial Statements.
In selecting the discount rate, consideration was given to Moody’s Aa corporate bond rates, along with See Item 7 -Management’s Discussion and Analysis of Financial Condition and Results of Operations for a yield curve applied to payments the Company expects to make out of its retirement plans. The yield curve is comprised of a broad base of Aa bonds with maturities between zero and thirty years. The discount rate was developed as the level equivalent rate that would produce the same present value as that using spot rates aligned with the projected benefit payments; the discount rate used to determine net periodic costs was 5.5 percent for eachdiscussion of the plansfuture outlook and expectations for Energen Resources and Alagasco.
Oil and Gas Operations
Energen Resources focuses on increasing its production and proved reserves through the acquisition and development of onshore North American producing oil and gas properties. Energen Resources maintains offices in Arcadia, Louisiana; in Farmington, New Mexico; and in Midland, Texas. The Company also maintains offices in Lehman, Seminole, Westbrook and Penwell, Texas; and in Brookwood and Tuscaloosa, Alabama.
The major areas of operations include (1) the San Juan Basin, (2) the Permian Basin, (3) the Black Warrior Basin and (4) North Louisiana/East Texas as highlighted on the above map.
The following table sets forth the production volumes for the year ended December 31, 2006. 2007, and proved reserves and reserves-to-production ratio by area as of December 31, 2007:
Year Ended December 31, 2007 | December 31, 2007 | December 31, 2007 | ||||
| Production Volumes (MMcfe) | Proved Reserves (MMcfe) | Reserves-to- Production Ratio | ||||
San Juan Basin | 47,517 | 943,423 | 19.85 years | |||
Permian Basin | 28,655 | 501,920 | 17.52 years | |||
Black Warrior Basin | 14,813 | 234,253 | 15.81 years | |||
North Louisiana/East Texas | 7,187 | 68,653 | 9.55 years | |||
Other | 433 | 5,403 | 12.48 years | |||
Total | 98,605 | 1,753,652 | 17.78 years |
13
The assumed ratefollowing table sets forth proved reserves by area as of returnDecember 31, 2007:
| Gas MMcf | Oil MBbl | NGL MBbl | ||||
San Juan Basin | 762,091 | 1,326 | 28,896 | |||
Permian Basin | 47,648 | 72,944 | 2,768 | |||
Black Warrior Basin | 234,253 | - | - | |||
North Louisiana/East Texas | 67,573 | 180 | - | |||
Other | 4,353 | 175 | - | |||
Total | 1,115,918 | 74,625 | 31,664 |
The following table sets forth proved developed reserves by area as of December 31, 2007:
| Gas MMcf | Oil MBbl | NGL MBbl | ||||
San Juan Basin | 569,800 | 1,320 | 25,805 | |||
Permian Basin | 44,042 | 59,553 | 2,543 | |||
Black Warrior Basin | 231,791 | - | - | |||
North Louisiana/East Texas | 53,526 | 161 | - | |||
Other | 4,351 | 175 | - | |||
Total | 903,510 | 61,209 | 28,348 |
Energen Resources files Form EIA-23 with the Department of Energy which reports gross proved reserves, including the working interest share of other owners, for properties operated by the Company. The proved reserves reported in the table above represent our share of proved reserves for all properties, based on assets isour ownership interest in each property. For properties operated by Energen Resources, the weighted averagedifference between the proved reserves reported on Form EIA-23 and the gross reserves associated with the Company-owned proved reserves reported in the table above does not exceed five percent. Estimated proved reserves as of expected long-term asset assumptions; the return on assets used to determine net periodic expense was 8.5 percentDecember 31, 2007 are based upon studies for each of our properties prepared by Company engineers and reviewed by Ryder Scott Company, L.P. and T. Scott Hickman and Associates, Inc., independent oil and gas reservoir engineers. Calculations were prepared using standard geological and engineering methods generally accepted by the applicable plans forpetroleum industry and in accordance with SEC guidelines.
The following table sets forth the year endedtotal net productive gas and oil wells by area as of December 31, 2006. 2007, and developed and undeveloped acreage as of the latest practicable date prior to year-end:
| Net Wells | Net Developed Acreage | Net Undeveloped Acreage | ||||
San Juan Basin | 1,390 | 302,202 | 1,413 | |||
Permian Basin | 1,579 | 87,851 | 3,309 | |||
Black Warrior Basin | 782 | 147,190 | 1,187 | |||
North Louisiana/East Texas | 159 | 20,675 | 55 | |||
Alabama Shale and Other | 10 | 6,830 | 281,888 | |||
Total | 3,920 | 564,748 | 287,852 |
Natural Gas Distribution
The estimated weighted average rateproperties of increaseAlagasco consist primarily of its gas distribution system, which includes approximately 10,200 miles of main and more than 11,900 miles of service lines, odorization and regulation facilities, and customer meters. Alagasco also has two LNG facilities, four division commercial offices, three division business centers, two payment centers, three district offices, seven service centers, and other related property and equipment, some of which are leased by Alagasco.
| ITEM 3. | LEGAL PROCEEDINGS |
Energen and its affiliates are, from time to time, parties to various pending or threatened legal proceedings. Certain of these lawsuits include claims for punitive damages in addition to other specific relief. Based upon information presently available, and in light of available legal and other defenses, contingent liabilities arising from threatened and pending litigation are not considered material in relation to the respective financial positions of Energen and its
14
affiliates. It should be noted, however, that Energen and its affiliates conduct business in Alabama and other jurisdictions in which the magnitude and frequency of punitive or other damage awards may bear little or no relation to culpability or actual damages, thus making it difficult to predict litigation results.
Jefferson County, Alabama
In January 2006, RGGS Land and Minerals LTD, L.P. (RGGS) filed a lawsuit in Jefferson County, Alabama, alleging breach of contract with respect to Energen Resources’ calculation of certain allowed costs and failure to pay in a timely manner certain amounts due RGGS under a mineral lease. RGGS seeks a declaratory judgment with respect to the parties’ rights under the lease, reformation of the lease, monetary damages and termination of Energen Resources’ rights under the lease. The Occluded Gas Lease dated January 1, 1986 was originally between Energen Resources and United States Steel Corporation (U.S. Steel) as lessor. RGGS became the lessor under the lease as a result of a 2004 conveyance from U.S. Steel to RGGS. Approximately 120,000 acres in Jefferson and Tuscaloosa counties, Alabama, are subject to the lease. Separately on February 6, 2006, Energen Resources received notice of immediate lease termination from RGGS. During 2007, Energen Resources’ production associated with the lease was approximately 10.5 Bcf.
RGGS has adopted positions contrary to the seventeen years of course of dealing between Energen Resources and its original contracting partner, U.S. Steel. The Company believes that RGGS’ assertions are without merit and that the notice of lease termination is ineffective. Energen Resources intends to vigorously defend its rights under the lease. The Company remains in possession of the lease, believes that the likelihood of a judgment in favor of RGGS is remote, and has made no material accrual with respect to the litigation or purported lease termination.
Enron Corporation
Enron and Enron North America Corporation (ENA) have settled with Energen Resources and Alagasco related to the Enron and ENA bankruptcy proceedings. Under the settlement, Energen Resources was allowed claims in the compensation levelbankruptcy cases against Enron and ENA of $12.5 million each. In December 2006, Energen Resources sold its claims against Enron and ENA for pay related plans covering a majoritygain of employees was 3.5 percent$6.7 million after-tax. All other claims have been released.
Legacy Litigation
During recent years, numerous lawsuits have been filed against oil production companies in Louisiana for restoration of oilfield properties. These suits are referred to in the year ended December 31, 2006.
The selectionindustry as “legacy litigation” because they usually involve operations that were conducted on the affected properties many years earlier. Energen Resources is or has been a party to several legacy litigation lawsuits, most of which result from the operations of predecessor companies. Based upon information presently available, and usein light of actuarial assumptions affectsavailable legal and other defenses, contingent liabilities arising from legacy litigation in excess of the amount of benefit expense recorded inCompany’s accrued provision for estimated liability are not considered material to the Company’s financial statements. The table below reflectsposition.
Other
Various other pending or threatened legal proceedings are in progress currently, and the Company has accrued a hypothetical 25 basis point change in assumed actuarial assumptions to pre-tax benefit expenseprovision for the year endedestimated liability.
| ITEM 4. | SUBMISSION OF MATTERS TO A VOTE OF SECURITY HOLDERS |
No matters were submitted to a vote of security holders during the fourth quarter of 2007.
15
EXECUTIVE OFFICERS OF THE REGISTRANTS
Energen Corporation
Name | Age | Position (1) | ||
James T. McManus, II | 49 | Chairman, Chief Executive Officer and President of Energen and Chairman and Chief Executive Officer of Alagasco (2) | ||
Wm. Michael Warren, Jr. | 60 | (3) | ||
Charles W. Porter, Jr. | 43 | Vice President, Chief Financial Officer and Treasurer of Energen and Alagasco (4) | ||
John S. Richardson | 50 | President and Chief Operating Officer of Energen Resources (5) | ||
Dudley C. Reynolds | 55 | President and Chief Operating Officer of Alagasco (6) | ||
J. David Woodruff, Jr. | 51 | General Counsel and Secretary of Energen and Alagasco and Vice President-Corporate Development of Energen (7) | ||
Grace B. Carr | 52 | Vice President and Controller of Energen (8) | ||
| Notes: | (1) | All executive officers of Energen have been employed by Energen or a subsidiary for the past five years. Officers serve at the pleasure of the Board of Directors. | ||
(2) | Mr. McManus has been employed by the Company in various capacities since 1986. He was elected Executive Vice President and Chief Operating Officer of Energen Resources in October 1995 and President of Energen Resources in April 1997. He was elected President and Chief Operating Officer of Energen effective January 1, 2006 and Chief Executive Officer of Energen and each of its subsidiaries effective July 1, 2007. He was elected Chairman of the Board of Energen and each of its subsidiaries effective January 1, 2008. Mr. McManus serves as a Director of Energen and each of its subsidiaries. | |||
(3) | Mr. Warren retired from the Company at the end of 2007. He had been employed by the Company in various capacities since 1983 and served as Chairman of the Board and Chief Executive Officer of Energen and each of its subsidiaries since 1998. Mr. Warren was succeeded by Mr. McManus as Chief Executive officer effective July 1, 2007 and as Chairman of the Board of Energen and each of its subsidiaries effective January 1, 2008. Mr. Warren continues to serve as a Director of Energen and each of its subsidiaries. | |||
(4) | Mr. Porter has been employed by the Company in various financial capacities since 1989. He was elected Controller of Energen Resources in 1998. In 2001, he was elected Vice President – Finance of Energen Resources. He was elected Vice President, Chief Financial Officer and Treasurer of Energen and each of its subsidiaries effective January 1, 2007. | |||
(5) | Mr. Richardson has been employed by the Company in various capacities since 1985. He was elected Vice President – Acquisitions and Engineering of Energen Resources in 1997. He was elected Executive Vice President and Chief Operating Officer of Energen Resources effective January 1, 2006. He was elected President and Chief Operating Officer of Energen Resources effective January 23, 2008. |
16
(6) | Mr. Reynolds has been employed by the Company in various capacities since 1980. He was elected General Counsel and Secretary of Energen and each of its subsidiaries in April 1991. He was elected President and Chief Operating Officer of Alagasco effective January 1, 2003. | |||
(7) | Mr. Woodruff has been employed by the Company in various capacities since 1986. He was elected Vice President-Legal and Assistant Secretary of Energen and each of its subsidiaries in April 1991 and Vice President-Corporate Development of Energen in October 1995. He was elected General Counsel and Secretary of Energen and each of its subsidiaries effective January 1, 2003. | |||
(8) | Ms. Carr was employed by the Company in various capacities from January 1985 to April 1989. She was not employed from May 1989 through December 1997. She was elected Controller of Energen in January 1998 and elected Vice President and Controller of Energen in October 2001. |
17
| ITEM 5. | MARKET FOR REGISTRANT’S COMMON EQUITY, RELATED STOCKHOLDER MATTERS AND ISSUER PURCHASES OF EQUITY SECURITIES |
Quarterly Market Prices and Dividends Paid Per Share
Quarter ended(in dollars) | High | Low | Close | Dividends Paid | ||||
March 31, 2006 | 39.49 | 32.71 | 35.00 | .11 | ||||
June 30, 2006 | 38.42 | 32.16 | 38.41 | .11 | ||||
September 30, 2006 | 44.48 | 36.95 | 41.87 | .11 | ||||
December 31, 2006 | 47.60 | 38.50 | 46.94 | .11 | ||||
March 31, 2007 | 51.43 | 43.78 | 50.89 | .115 | ||||
June 30, 2007 | 60.49 | 51.05 | 54.94 | .115 | ||||
September 30, 2007 | 58.90 | 48.24 | 57.12 | .115 | ||||
December 31, 2007 | 70.41 | 56.81 | 64.23 | .115 |
Energen’s common stock is listed on the New York Stock Exchange under the symbol EGN. On February 8, 2008, there were 7,135 holders of record of Energen’s common stock. At the date of this filing, Energen Corporation owned all the issued and outstanding common stock of Alabama Gas Corporation. Energen expects to pay annual cash dividends of $0.48 per share on the Company’s common stock in 2008. The amount and timing of all dividend payments is subject to the discretion of the Board of Directors and is based upon business conditions, results of operations, financial conditions and other factors.
The following table summarizes information concerning securities authorized for issuance under equity compensation plans:
| Plan Category | Number of Securities to be Issued for Outstanding Options and Performance Share Awards | Weighted Average Exercise Price | Number of Securities Remaining Available for Future Issuance Under Equity Compensation Plans | |||
Equity compensation plans | 466,339 | $30.79 | 1,953,996 | |||
Equity compensation plans not | - | - | - | |||
Total | 466,339 | $30.79 | 1,953,996 |
| * | These plans include the Company’s 1997 Stock Incentive Plan and the 1992 Energen Corporation Directors Stock Plan |
The following table summarizes information concerning purchases of equity securities by the issuer:
| Period | Total Number of Shares Purchased | | Average Price Paid per Share | Total Number of Shares Purchased as Part of Publicly Announced Plans | Maximum Number of Shares that May Yet Be Purchased Under the Plans** | ||||
October 1, 2007 through | - | - | - | 8,992,700 | |||||
November 1, 2007 through | - | - | - | 8,992,700 | |||||
December 1, 2007 through | 1,857 | * | $ 64.43 | - | 8,992,700 | ||||
Total | 1,857 | $ 64.43 | - | 8,992,700 |
| * | Acquired in connection with tax withholdings and payment of exercise price on stock compensation plans. |
| ** | By resolution adopted May 24, 1994, and supplemented by a resolution adopted April 26, 2000 and June 24, 2006, the Board of Directors authorized the Company to repurchase up to 12,564,400 shares of the Company’s common stock. The resolutions do not have an expiration date. |
18
PERFORMANCE GRAPH
Energen Corporation — Comparison of Five-Year Cumulative Shareholder Returns
This graph compares the total shareholder returns of Energen, the Standard & Poor’s Composite Stock Index (S&P 500), the Standard & Poor’s Supercomposite Oil & Gas Exploration & Production Index (S15OILP), and the Standard & Poor’s Supercomposite Gas Utilities Index (S15GASUX). The graph assumes $100 invested at the per-share closing price of the common stock on the New York Exchange Composite Tape on December 31, 2006:2002, in the Company and each of the indices. Total shareholder return includes reinvested dividends.
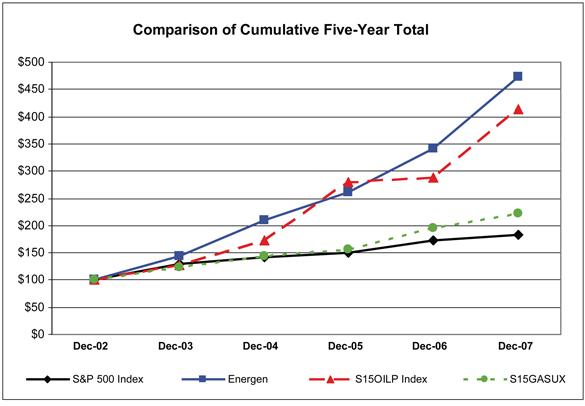
(dollars in thousands) | Pension expense | Postretirement Expense | ||||
Discount rate change | $ | 1,000 | $ | 100 | ||
Return on assets | $ | 400 | $ | 100 | ||
Compensation increase | $ | 600 | $ | — | ||
As of December 31, | 2002 | 2003 | 2004 | 2005 | 2006 | 2007 | ||||||||||||
S&P 500 Index | $ | 100 | $ | 129 | $ | 143 | $ | 150 | $ | 173 | $ | 183 | ||||||
Energen | $ | 100 | $ | 144 | $ | 210 | $ | 262 | $ | 343 | $ | 473 | ||||||
S15OILP Index | $ | 100 | $ | 127 | $ | 172 | $ | 279 | $ | 289 | $ | 413 | ||||||
S15GASUX | $ | 100 | $ | 124 | $ | 145 | $ | 157 | $ | 196 | $ | 223 | ||||||
19
| ITEM 6. | SELECTED FINANCIAL DATA |
The weighted average discount rate, return on plan assetsselected financial data as set forth below should be read in conjunction with the Consolidated Financial Statements and estimated rate of compensation increase usedthe Notes to Financial Statements included in the 2007 actuarial assumptions is 5.77 percent, 8.25 percent, and 4.22 percent, respectively.this Form 10-K.
SELECTED FINANCIAL AND COMMON STOCK DATA
Asset Retirement Obligation:Energen CorporationThe Company records the fair value
Years ended December 31, (dollars in thousands, except per share amounts) | 2007 | 2006 | 2005 | 2004 | 2003 | |||||||||||
INCOME STATEMENT | ||||||||||||||||
Operating revenues | $ | 1,435,060 | $ | 1,393,986 | * | $ | 1,128,394 | $ | 936,857 | $ | 841,631 | |||||
Income from continuing operations | $ | 309,212 | $ | 273,523 | * | $ | 172,886 | $ | 127,305 | $ | 110,104 | |||||
Net income | $ | 309,233 | $ | 273,570 | * | $ | 173,012 | $ | 127,463 | $ | 110,654 | |||||
Diluted earnings per average common share | $ | 4.28 | $ | 3.73 | * | $ | 2.35 | $ | 1.74 | $ | 1.54 | |||||
Diluted earnings per average common share | $ | 4.28 | $ | 3.73 | * | $ | 2.35 | $ | 1.74 | $ | 1.55 | |||||
BALANCE SHEET | ||||||||||||||||
Total property, plant and equipment, net | $ | 2,538,243 | $ | 2,252,414 | $ | 2,068,011 | $ | 1,783,059 | $ | 1,433,451 | ||||||
Total assets | $ | 3,079,653 | $ | 2,836,887 | $ | 2,618,226 | $ | 2,181,739 | $ | 1,778,232 | ||||||
Long-term debt | $ | 562,365 | $ | 582,490 | $ | 683,236 | $ | 612,891 | $ | 552,842 | ||||||
Total shareholders’ equity | $ | 1,378,658 | $ | 1,202,069 | $ | 892,678 | $ | 803,666 | $ | 699,032 | ||||||
COMMON STOCK DATA | ||||||||||||||||
Annual dividend rate at period-end | $ | 0.46 | $ | 0.44 | $ | 0.40 | $ | 0.385 | $ | 0.37 | ||||||
Cash dividends paid per common share | $ | 0.46 | $ | 0.44 | $ | 0.40 | $ | 0.3775 | $ | 0.365 | ||||||
Diluted average common shares outstanding (000) | 72,181 | 73,278 | 73,715 | 73,117 | 71,434 | |||||||||||
Price range: | ||||||||||||||||
High | $ | 70.41 | $ | 47.60 | $ | 44.31 | $ | 30.04 | $ | 21.00 | ||||||
Low | $ | 43.78 | $ | 32.16 | $ | 27.06 | $ | 19.94 | $ | 14.04 | ||||||
Close | $ | 64.23 | $ | 46.94 | $ | 36.32 | $ | 29.48 | $ | 20.52 |
| * | Includes an after-tax gain of $34.5 million, or $0.47 per diluted share, on the sale of a 50 percent interest in Energen Resources’ acreage position in Alabama shale to Chesapeake Energy Corporation. |
All information has been restated to reflect a liability for an asset retirement obligation (ARO) in the period in which it is incurred. Subsequent to initial measurement, liabilities are required to be accreted to their present value each period and capitalized costs are depreciated over the estimated useful life of the related assets. Upon settlement of the liability, the Company will settle the obligation for its recorded amount and recognize the resulting gain or loss. 2-for-1 stock split effective June 1, 2005.
20
SELECTED BUSINESS SEGMENT DATA
Energen Resources has an obligation to remove tangible equipment and restore land at the end of oil and gas production operations. Alagasco has certain removal cost obligations related to its gas distribution assets and a conditional asset retirement obligation to purge and cap its distribution and transmission lines upon abandonment. The estimate of future restoration and removal costs includes numerous assumptions and uncertainties, including but not limited to, inflation factors, discount rates, timing of settlement, and changes in contractual, regulatory, political, environmental, safety and public relations considerations.Corporation
Years ended December 31, (dollars in thousands) | 2007 | 2006 | 2005 | 2004 | 2003 | ||||||||||
OIL AND GAS OPERATIONS | |||||||||||||||
Operating revenues from continuing operations | |||||||||||||||
Natural gas | $ | 499,406 | $ | 437,560 | $ | 365,635 | $ | 276,482 | $ | 235,022 | |||||
Oil | 251,497 | 181,459 | 116,651 | 98,409 | 87,192 | ||||||||||
Natural gas liquids | 68,623 | 50,258 | 38,455 | 30,902 | 25,938 | ||||||||||
Other | 6,066 | 61,265 | 6,953 | 4,324 | 4,380 | ||||||||||
Total | $ | 825,592 | $ | 730,542 | $ | 527,694 | $ | 410,117 | $ | 352,532 | |||||
Production volumes from continuing operations | |||||||||||||||
Natural gas (MMcf) | 64,300 | 62,824 | 61,048 | 57,164 | 55,304 | ||||||||||
Oil (MBbl) | 3,879 | 3,645 | 3,316 | 3,434 | 3,411 | ||||||||||
Natural gas liquids (MMgal) | 77.2 | 76.3 | 70.5 | 68.2 | 66.6 | ||||||||||
Production volumes from continuing | 98,606 | 95,596 | 91,020 | 87,513 | 85,291 | ||||||||||
Total production volumes (MMcfe) | 98,605 | 95,595 | 91,099 | 87,606 | 86,157 | ||||||||||
Proved reserves | |||||||||||||||
Natural gas (MMcf) | 1,115,918 | 1,096,429 | 1,080,161 | 1,019,436 | 886,307 | ||||||||||
Oil (MBbl) | 74,625 | 74,893 | 74,962 | 54,500 | 52,528 | ||||||||||
Natural gas liquids (MBbl) | 31,664 | 29,504 | 31,934 | 34,613 | 27,245 | ||||||||||
Total (MMcfe) | 1,753,652 | 1,722,811 | 1,721,537 | 1,554,114 | 1,364,945 | ||||||||||
Other data from continuing operations | |||||||||||||||
LOE and other | $ | 148,280 | $ | 134,853 | $ | 104,241 | $ | 79,191 | $ | 67,833 | |||||
Production taxes | 53,798 | 49,509 | 52,271 | 37,285 | 27,686 | ||||||||||
Total | $ | 202,078 | $ | 184,362 | $ | 156,512 | $ | 116,476 | $ | 95,519 | |||||
Depreciation, depletion and amortization | $ | 114,241 | $ | 97,842 | $ | 89,340 | $ | 80,896 | $ | 79,495 | |||||
Capital expenditures | $ | 379,479 | $ | 259,678 | $ | 353,712 | $ | 403,936 | $ | 163,338 | |||||
Operating income | $ | 451,567 | $ | 405,149 | $ | 243,876 | $ | 180,379 | $ | 153,325 | |||||
NATURAL GAS DISTRIBUTION | |||||||||||||||
Operating revenues | |||||||||||||||
Residential | $ | 388,291 | $ | 426,066 | $ | 384,753 | $ | 340,229 | $ | 320,938 | |||||
Commercial and industrial | 164,903 | 181,900 | 166,957 | 138,686 | 126,638 | ||||||||||
Transportation | 49,255 | 45,950 | 43,291 | 40,221 | 38,250 | ||||||||||
Other | 7,019 | 9,528 | 5,699 | 7,604 | 3,273 | ||||||||||
Total | $ | 609,468 | $ | 663,444 | $ | 600,700 | $ | 526,740 | $ | 489,099 | |||||
Gas delivery volumes (MMcf) | |||||||||||||||
Residential | 20,665 | 22,310 | 24,601 | 25,383 | 27,248 | ||||||||||
Commercial and industrial | 10,593 | 11,226 | 12,498 | 12,323 | 12,564 | ||||||||||
Transportation | 51,448 | 50,760 | 49,850 | 54,385 | 55,623 | ||||||||||
Total | 82,706 | 84,296 | 86,949 | 92,091 | 95,435 | ||||||||||
Average number of customers | |||||||||||||||
Residential | 416,967 | 420,558 | 425,110 | 425,673 | 427,413 | ||||||||||
Commercial, industrial and transportation | 34,200 | 34,456 | 34,936 | 35,248 | 35,463 | ||||||||||
Total | 451,167 | 455,014 | 460,046 | 460,921 | 462,876 | ||||||||||
Other data | |||||||||||||||
Depreciation and amortization | $ | 47,136 | $ | 44,244 | $ | 42,351 | $ | 39,881 | $ | 37,171 | |||||
Capital expenditures | $ | 58,862 | $ | 76,157 | $ | 73,276 | $ | 58,208 | $ | 57,906 | |||||
Operating income | $ | 72,742 | $ | 74,274 | $ | 72,922 | $ | 66,199 | $ | 66,848 |
21
| ITEM 7. | MANAGEMENT’S DISCUSSION AND ANALYSIS OF FINANCIAL CONDITION AND RESULTS OF OPERATIONS |
RESULTS OF OPERATIONS
Consolidated Net Income
Energen Corporation’s net income for the year ended December 31, 20062007 totaled $273.6$309.2 million, or $3.73$4.28 per diluted share and compared favorably to the year ended December 31, 20052006 net income of $173$273.6 million, or $2.35$3.73 per diluted share. This 58.714.7 percent increase in earnings per diluted share (EPS) largely reflected the result of significantly higher prices for natural gas, oil and natural gas liquids and the impact of a 4.53 billion cubic feet equivalent (Bcfe) increase in production volumes from Energen Resources as well as anCorporation, Energen’s oil and gas subsidiary, partially offset by the prior year after-tax gain of approximately $34.5 million, or $0.47 per diluted share, on the sale of a 50 percent interest in Energen Resources’ leaseacreage position in variousAlabama shale plays in Alabama to Chesapeake Energy Corporation (Chesapeake). For the year ended December 31, 2006,2007, Energen Resources earned $237.6$273.2 million, as compared with $135.3$237.6 million in the previous year. AlagascoAlabama Gas Corporation (Alagasco), Energen’s utility subsidiary, generated net income of $37.3$36.8 million in the current year as compared with net income in the prior period of $37$37.3 million. For the year ended December 31, 2004,2005, Energen reported earnings of $127.5$173 million, or $1.74$2.35 per diluted share.
2007 vs 2006:For the year ended December 31, 2007, Energen Resources’ net income and income from continuing operations totaled $273.2 million and compared favorably to $237.6 million in the prior year. The primary factors positively influencing income from continuing operations included higher commodity prices of approximately $80 million after-tax, the impact of increased production volumes of approximately $14 million after-tax and the Section 199 Domestic Production Activities Deduction tax benefit on qualified oil and gas production income of approximately $7 million. Negatively affecting comparable income from continuing operations was the $34.5 million after-tax gain on the acreage position sale to Chesapeake recorded in the prior year, higher depreciation, depletion and amortization (DD&A) expense of approximately $10 million after-tax, higher lease operating expense of approximately $8 million after-tax, increased administrative expenses of approximately $3 million after-tax and a prior year $6.7 million after-tax gain on the sale of Energen Resources’ bankruptcy claim against Enron.
2006 vs 2005:Energen Resources’ net income rose 75.6 percent to $237.6 million in 2006. Energen Resources’ income from continuing operations totaled $237.6 million in 2006 as compared with $135.2 million in 2005. Discontinued operations in 2006 generated income of $47,000 as compared with income of $125,000 in 2005. The primary factors positively influencing income from continuing operations included higher2005 primarily due to increased commodity prices of approximately $77 million after-tax along with the impact of increased production volumes of approximately $16 million after-tax, the $34.5 million after-tax gain on the sale to Chesapeake sale and athe $6.7 million after-tax gain on the sale of Energen Resources’Enron bankruptcy claim against Enron. The primary negative influences on income from continuing operations were higher lease operating expense of approximately $19 million after-tax, higher depreciation, depletion and amortization (DD&A) expense of approximately $5 million after-tax and increased administrative expenses of approximately $5 million after-tax.
Alagasco earned net income of $37.3 million in 2006 as compared with net income of $37 million in 2005. This increase in earnings largely reflected the utility’s ability to earn on a higher level of equity partially offset by a decrease in customer usage. Alagasco’s return on average equity (ROE) was 13.1 percent in 2006 compared with 13.5 percent in 2005.
2005 vs 2004:For the year ended December 31, 2005, Energen Resources’ net income totaled $135.3 million as compared with $94.1 million for the 12 months ended December 31, 2004. Energen Resources’ income from continuing operations totaled $135.2 million in 2005 as compared with $93.9 million in 2004 primarily due to increased commodity prices of approximately $62 million after-tax along with the impact of increased production volumes of approximately $10 million after-tax.settlement. These increases were partially offset by higher lease operating expense of approximately $16 million after-tax, higher production taxes of approximately $9$19 million after-tax, increased DD&A expense of approximately $5 million after-tax and increased administrative expenses of approximately $5 million after-tax. Alagasco earnings increased to $37.3 million in 2006 from $37 million in 2005 from $33.8 million in 2004 largely as a result of $2 million after-tax increase arising from the utility earningutility’s ability to earn on a higher level of equity.equity and reductions in the prior year under the utility’s rate setting mechanism of $1.9 million after-tax largely offset by a decrease in customer usage and a $0.9 million after-tax reduction associated with the CCM giveback. Alagasco achieved a ROE of 13.1 percent in 2006 compared with 13.5 percent in 2005 compared with 12.8 percent in 2004.2005.
Operating Income
Consolidated operating income in 2007, 2006 and 2005 and 2004 totaled $522 million, $477.3 million $315.7 million and $244.8$315.7 million, respectively. This growth in operating income has been influenced by strong financial performance from Energen Resources under Energen’s diversified growth strategy, implemented in fiscal 1996. Alagasco also contributed to this growth instrategy. Alagasco’s operating income consistent with increases in the levels of equity upon which it has been ablerelatively flat for the three previous years as the utility’s ability to earn a return.return on a higher level of equity was offset by decreased customer usage and revenue reductions under its rate-setting mechanisms.
22
Oil and Gas Operations:Revenues from oil and gas operations rose in the current year largely as a result of increased commodity prices andas well as the impact of increased production volumes. Production increased primarily due to additional development activities in the San Juan and Permian basins partially offset by normal production declines. Revenue per unit of production for natural gas production increased 16.211.6 percent to $6.96$7.77 per thousand cubic feet (Mcf), oil revenue per unit of production rose 41.530.2 percent to $49.79$64.83 per barrel and natural gas liquids revenue per unit of production increased 2034.8 percent to an average price of $0.66$0.89 per gallon during 2006.2007. Production from continuing operations increased 5rose 3.1 percent to 95.698.6 Bcfe during 2006.2007. Natural gas production increased 2.3 percent to 64.3 billion cubic feet (Bcf) and oil volumes increased 6.4 percent to 3,879 thousand barrels (MBbl). Production of natural gas liquids increased 1.2 percent to 77.2 million gallons (MMgal).
In 2006, revenues from oil and gas operations increased primarily as a result of increased commodity prices and increased production volumes. Production increased primarily due to additional development activities in the San Juan Basin, accelerated workovers due to milder winter weather and increased volumes related to the purchase of Permian Basin oil properties in the fourth quarter of 2005. Negatively affecting production were normal production declines. Natural gas production rose 2.9 percent to 62.8 billion cubic feet (Bcf), oil volumes increased 9.9 percent to 3,645 thousand barrels (MBbl). Production of natural gas liquids increased 8.2 percent to 76.3 million gallons (MMgal).
In 2005, revenues from oil and gas operations increased primarily as a result of increased commodity prices, an increase in volumes related to the August 2004 acquisition of San Juan Basin coalbed methane properties and increased drilling of wells in North Louisiana. Partially offsetting these positive factors was a normal production decline in excess of new production coming on-line primarily in the Permian Basin. Revenue per unit of production related to natural gas increased 23.816.2 percent to $5.99$6.96 per Mcf, oil revenuesrevenue per unit of production rose 22.841.5 percent
to $35.18$49.79 per barrel and natural gas liquids revenue per unit of production increased 22.220 percent to an average price of $0.55$0.66 per gallon during the year ended December 31, 2005.2006. Production from continuing operations rose 4increased 5 percent to 9195.6 Bcfe in 2005.2006. Natural gas production increased 6.8rose 2.9 percent to 6162.8 Bcf, oil volumes declined 3.4increased 9.9 percent to 3,3163,645 MBbl and natural gas liquids production increased 3.48.2 percent to 70.576.3 MMgal.
Coalbed methane operating fees are calculated as a percentage of net proceeds on certain properties, as defined by the related operating agreements, and vary with changes in natural gas prices, production volumes and operating expenses. Revenues from operating fees were $6.1 million, $6.6 million and $8.7 million in 2007, 2006 and $6.6 million in2005, respectively. During 2006, 2005 and 2004, respectively. Energen Resources also recorded a $55.5 million pre-tax gain in other operating revenues for the sale of a 50 percent interest in Energen Resources’ leaseacreage position in Alabama shale to Chesapeake for various shale plays in Alabama.Chesapeake.
Years ended December 31, (in thousands, except sales price data) | 2006 | 2005 | 2004 | 2007 | 2006 | 2005 | |||||||||||||
Operating revenues from continuing operations | |||||||||||||||||||
Natural gas | $ | 437,560 | $ | 365,635 | $ | 276,482 | $ 499,406 | $ 437,560 | $ 365,635 | ||||||||||
Oil | 181,459 | 116,651 | 98,409 | 251,497 | 181,459 | 116,651 | |||||||||||||
Natural gas liquids | 50,258 | 38,455 | 30,902 | 68,623 | 50,258 | 38,455 | |||||||||||||
Operating fees | 6,553 | 8,674 | 6,648 | 6,119 | 6,553 | 8,674 | |||||||||||||
Other | 54,712 | (1,721 | ) | (2,324 | ) | (53 | ) | 54,712 | (1,721 | ) | |||||||||
Total operating revenues from continuing operations | $ | 730,542 | $ | 527,694 | $ | 410,117 | $ 825,592 | $ 730,542 | $ 527,694 | ||||||||||
Production volumes from continuing operations | |||||||||||||||||||
Natural gas (MMcf) | 62,824 | 61,048 | 57,164 | 64,300 | 62,824 | 61,048 | |||||||||||||
Oil (MBbl) | 3,645 | 3,316 | 3,434 | 3,879 | 3,645 | 3,316 | |||||||||||||
Natural gas liquids (MMgal) | 76.3 | 70.5 | 68.2 | 77.2 | 76.3 | 70.5 | |||||||||||||
Revenue per unit of production including effects of all derivative instruments | |||||||||||||||||||
Natural gas (per Mcf) | $ | 6.96 | $ | 5.99 | $ | 4.84 | $ 7.77 | $ 6.96 | $ 5.99 | ||||||||||
Oil (per barrel) | $ | 49.79 | $ | 35.18 | $ | 28.66 | $ 64.83 | $ 49.79 | $ 35.18 | ||||||||||
Natural gas liquids (per gallon) | $ | 0.66 | $ | 0.55 | $ | 0.45 | $ 0.89 | $ 0.66 | $ 0.55 | ||||||||||
Revenue per unit of production including effects of qualifying cash flow hedges | |||||||||||||||||||
Natural gas (per Mcf) | $ | 6.96 | $ | 6.36 | $ | 4.87 | $ 7.76 | $ 6.96 | $ 6.36 | ||||||||||
Oil (per barrel) | $ | 49.54 | $ | 35.18 | $ | 29.70 | $ 64.80 | $ 49.54 | $ 35.18 | ||||||||||
Natural gas liquids (per gallon) | $ | 0.66 | $ | 0.55 | $ | 0.45 | $ 0.89 | $ 0.66 | $ 0.55 | ||||||||||
Revenue per unit of production excluding effects of all derivative instruments | |||||||||||||||||||
Natural gas (per Mcf) | $ | 6.53 | $ | 7.81 | $ | 5.68 | $ 6.45 | $ 6.53 | $ 7.81 | ||||||||||
Oil (per barrel) | $ | 59.88 | $ | 51.61 | $ | 38.33 | $ 67.17 | $ 59.88 | $ 51.61 | ||||||||||
Natural gas liquids (per gallon) | $ | 0.80 | $ | 0.74 | $ | 0.59 | $ 0.98 | $ 0.80 | $ 0.74 | ||||||||||
Average production (lifting) cost (per Mcfe) | $ | 1.41 | $ | 1.15 | $ | 0.90 | $ 1.50 | $ 1.41 | $ 1.15 | ||||||||||
Average production tax (per Mcfe) | $ | 0.52 | $ | 0.57 | $ | 0.43 | $ 0.55 | $ 0.52 | $ 0.57 | ||||||||||
Average depreciation rate (per Mcfe) | $ | 1.00 | $ | 0.96 | $ | 0.90 | |||||||||||||
Average DD&A rate (per Mcfe) | $ 1.13 | $ 1.00 | $ 0.96 | ||||||||||||||||
Energen Resources may, in the ordinary course of business, be involved in the sale of developed or undeveloped properties. With respect to developed properties, sales may occur as a result of, but not limited to, disposing of non-strategic or marginal assets and accepting offers where the buyer gives greater value to a property than does Energen Resources. The Company is required to reflect gains and losses on the dispositions of these assets, the writedown of certain properties held-for-sale, and income or loss from the operations of the associated held-for-sale properties as discontinued operations under the provisions of SFAS No. 144,”Accounting for Impairment or Disposal of Long-Lived Assets”. Energen Resources had no proved property sales during 2006 or 2004. During 2005, Energen Resources recorded a pre-tax gain of $213,000 primarily from a proved property sale located in the Permian Basin.
23
Operations and maintenance (O&M) expense increased $28.7 million and $31.5 million in 2007 and $31.1 million in 2006, and 2005, respectively. Lease operating expense (excluding production taxes) in 2007 increased $13.4 million largely due to additional compression costs (approximately $2 million), increased repair and maintenance expense in the San Juan and Permian basins (approximately $7 million), higher transportation related to increased San Juan Basin production (approximately $3 million) and a general rise in field service costs. In 2006, lease operating expense (excluding production taxes) increased by $30.6 million due to a variety of factors including the December 2005 acquisition of Permian Basin oil properties (approximately $9 million), additional maintenance expense primarily in the San Juan Basin designed to increase production (approximately $2 million), increased workover expense (approximately $6 million), higher transportation costs (approximately $4 million), an increased number of wells in period comparisons increased workover expense, higher transportation costs and other overall cost increases. In 2005, lease
operating2007, administrative expense (excluding production taxes) increased by $25.1$16.6 million primarily due to increased workover and maintenance expense, increased ad valorem taxes, higher transportation costs and other overall cost increases related to increased commodity prices. Partially offsetting these increases were lower compliance costs related toa prior year regulationspre-tax gain of $10.7 million on the sale of Energen Resources’ bankruptcy claims against Enron and increased labor-related costs, including settlement charges for below-grade storage pits.the nonqualified supplemental retirement plans and the defined benefit pension plans of $2.3 million. Administrative expense decreased $2.6 million in 2006 largely due to athe $10.7 million pre-tax gain on the sale of Energen Resources’ bankruptcy claims against Enron; this gain was partially offset by higher labor-related costs. In 2005, administrative expense increased $7.5 million primarily due to labor-related costs. Exploration expense rose $3.5declined $1.3 million in 20062007 largely due to increaseddecreased exploratory efforts. In 2005,2006, exploration expense decreased $1.4rose $3.5 million.
DD&A expense increased $16.4 million in 2007 and $8.5 million in 2006 and $8.4 million in 2005.2006. The average depletionDD&A rates were $1.13 per Mcfe in 2007, $1.00 per Mcfe in 2006 and $0.96 per Mcfe in 2005 and $0.90 per Mcfe2005. The increase in 2004.the average 2007 DD&A rate, which contributed approximately $13 million, was primarily due to higher development costs along with a decline in prior year-end reserve prices. Increased production volumes also contributed approximately $3 million to the increase in DD&A expense in the current year. The increase in the average 2006 rates wererate contributed approximately $3.8 million and was largely due to higher depletion rates on oil properties purchased in the Permian Basin in December 2005 and higher rates due to a downward revision to estimated reserves resulting from a reduction in year-end reserve prices. Partially offsetting the higher rate was increased production in lower rate areas. The increase in the average 2005 depletion rates relates to a higher depletion rate on coalbed methane properties purchased in 2004 as well as a production mix that reflected a higher percentage of the Company’s shorter-lived North Louisiana/East Texas production. Increased production volumes also contributed approximately $4.4 million due to the 2006 increase in DD&A expense during 2006 and 2005.expense.
Energen Resources’ expense for taxes other than income taxes primarily reflected production-related taxes. Energen Resources recorded severance taxes of $53.8 million, $49.5 million and $52.3 million for 2007, 2006 and $37.32005, respectively. Severance taxes increased $4.3 million for 2006, 2005in 2007 over the prior year. Higher commodity market prices and 2004,the impact of increased production volumes contributed approximately $3 million and $1.6 million, respectively. Decreased severance taxes in 2006 resulted from lower natural gas commodity market prices largely offset by higher production volumes and increased oil and natural gas liquids commodity market prices. Increased 2005 severance taxes were the result of increased commodity market prices and production. Commodity market prices exclude the effects of derivative instruments for purposes of determining severance taxes.
Natural Gas Distribution:As discussed more fully in Note 2, Regulatory Matters, in the Notes to Financial Statements, Alagasco is subject to regulation by the Alabama Public Service Commission (APSC). On June 10, 2002,December 21, 2007, the APSC issued an order to extend the utility’s rate-setting mechanism. Under the terms of thatthe extension, RSE will continue after January 1, 2008,December 31, 2014, unless, after notice to the company and a hearing, the CommissionAPSC votes to either modify or discontinue its operation.the RSE methodology. Alagasco’s allowed range of return on equity remains 13.15 percent to 13.65 percent throughout the term of the order. Prior to the December 21, 2007 extension, RSE limited the utility’s equity upon which a return is permitted to 60 percent of total capitalization and provided for certain cost control measures designed to monitor Alagasco’s O&M expense. Subsequent to the extension, the equity on which a return will be permitted will be phased down to 57 percent by December 31, 2008 and 55 percent by December 31, 2009.
Prior to the extension, under the inflation-based CCM established by the APSC, if the percentage change in O&M expense per customer fell within a range of 1.25 points above or below the percentage change in the Consumer Price Index For All Urban Consumers (index range), no adjustment was required. If the change in O&M expense per customer exceeded the index range, three-quarters of the difference was returned to customers. To the extent the change was less than the index range, the utility benefited by one-half of the difference through future rate adjustments. The changes to the O&M expense cost control measurement subsequent to the extension are as follows: annual changes in O&M expense will be measured on an aggregate basis rather than per customer; the
24
percentage change in O&M expense must fall within a range of 0.75 points above or below the percentage change in the index range; certain items that fluctuate based on situations demonstrated to be beyond Alagasco’s control may be excluded for the cost control measurement calculation; the O&M expense base for measurement purposes will continue to be set at the prior year’s actual O&M expense amount unless the Company exceeds the top of the index range in two successive years, in which case the base for the following year will be set at the top of the index range.
Alagasco generates revenues through the sale and transportation of natural gas. The transportation rate does not contain an amount representing the cost of gas, and Alagasco’s rate structure allows similar margins on transportation and sales gas. Weather can cause variations in space heating revenues, but operating margins essentially remain unaffected due tothe financial impact is moderated by a temperature adjustment mechanism that requires Alagasco to adjust certain customer bills monthly to reflect changes in usage due to departures from normal temperatures. The temperature adjustment applies primarily to residential, small commercial and small industrial customers.
Alagasco’s natural gas and transportation sales revenues totaled $609.5 million, $663.4 million and $600.7 million in 2007, 2006 and $526.7 million in 2006, 2005, and 2004, respectively. Sales revenue in 2007 declined largely due to a decrease in gas costs of approximately $28 million and a decline in customer usage of approximately $27 million. In 2006, and 2005sales revenue increased primarily due to an increase in commodity gas costs approximately $82 million partially offset by a decrease in customer usage.usage of approximately $28 million. In 2007, weather was 7.9 percent warmer than in the prior year. Residential sales volumes declined 7.4 percent while commercial and industrial volumes decreased 5.6 percent. Transportation volumes rose 1.4 percent. In 2006, weather that was 2.5 percent warmer than in the prior year along with customer conservation related to higher gas costs contributed to a 9.3 percent decline in residential sales volumes while commercial and industrial volumes decreased 10.2 percent. Large transportationTransportation volumes increased 1.8 percent. In 2005, weather was 3.62007, lower gas costs along with decreased gas purchase volumes contributed to a 14.7 percent colder thandecrease in the prior year. Residential sales volumes declined 3.1 percent while commercial and industrial volumes increased 1.4 percent. Large transportation volumes decreased 8.3 percent. In 2006, higher commoditycost of gas. Higher gas costs partially offset by a decline in gas purchase volumes resulted in a 17.2 percent increase in cost of gas. Increased gas costs along with increased gas purchase volumes contributed to a 21.6 percent increase in cost of gas in 2005.2006.
O&M expense at the utility increased slightly in 2006 and 3.41.9 percent in 20052007 primarily due to increased labor-related costs (approximately $2 million), including settlement charges for the nonqualified supplemental retirement plans and the defined benefit pension plans of $3.4 million, largely offset by decreased bad debt expense (approximately $1 million). In 2006, O&M expense increased slightly primarily due to higher bad debt expense (approximately $1 million) and increased distribution maintenance expenses.expenses (approximately $1.7 million). These increases were offset by decreased labor-related expenses.expenses (approximately $4.5 million). The increase in O&M expense per customer for the rate yearsyear ended September 30, 2006 and 2004 werewas above the inflation-based Cost Control Measurement (CCM)CCM established by the APSC as part of the utility’s rate-setting
mechanism; as a result, three quarters of the differences, or $1.5 million and $1.2 million pre-tax, respectively, werewas returned to the customers through RSE (see Note 2, Regulatory Matters, in the Notes to Financial Statements). Alagasco’s O&M expense fell within the index range for the rate yearyears ended September 30, 2007 and 2005.
Depreciation expense rose 6.5 percent and 4.5 percent in 2007 and 6.2 percent in 2006, and 2005, respectively, due to normal growthextension and replacement of the utility’s distribution and replacement of its support systems. Alagasco’s expense for taxes other than income primarily reflects various state and local business taxes as well as payroll-related taxes. State and local business taxes generally are based on gross receipts and fluctuate accordingly.
Years ended December 31, (in thousands) | 2006 | 2005 | 2004 | 2007 | 2006 | 2005 | |||||||||||||||
Natural gas transportation and sales revenues | $ | 663,444 | $ | 600,700 | $ | 526,740 | $ 609,468 | $ 663,444 | $ 600,700 | ||||||||||||
Cost of natural gas | (373,097 | ) | (318,269 | ) | (261,800 | ) | (318,429 | ) | (373,097 | ) | (318,269 | ) | |||||||||
Operations and maintenance | (126,948 | ) | (126,041 | ) | (121,896 | ) | (129,351 | ) | (126,948 | ) | (126,041 | ) | |||||||||
Depreciation | (44,244 | ) | (42,351 | ) | (39,881 | ) | (47,136 | ) | (44,244 | ) | (42,351 | ) | |||||||||
Income taxes | (22,002 | ) | (22,360 | ) | (19,703 | ) | (21,636 | ) | (22,002 | ) | (22,360 | ) | |||||||||
Taxes, other than income taxes | (44,881 | ) | (41,117 | ) | (36,964 | ) | (41,810 | ) | (44,881 | ) | (41,117 | ) | |||||||||
Operating income | $ | 52,272 | $ | 50,562 | $ | 46,496 | $ 51,106 | $ 52,272 | $ 50,562 | ||||||||||||
Natural gas sales volumes (MMcf) | |||||||||||||||||||||
Residential | 22,310 | 24,601 | 25,383 | 20,665 | 22,310 | 24,601 | |||||||||||||||
Commercial and industrial | 11,226 | 12,498 | 12,323 | 10,593 | 11,226 | 12,498 | |||||||||||||||
Total natural gas sales volumes | 33,536 | 37,099 | 37,706 | 31,258 | 33,536 | 37,099 | |||||||||||||||
Natural gas transportation volumes (MMcf) | 50,760 | 49,850 | 54,385 | 51,448 | 50,760 | 49,850 | |||||||||||||||
Total deliveries (MMcf) | 84,296 | 86,949 | 92,091 | 82,706 | 84,296 | 86,949 | |||||||||||||||
25
Non-Operating Items
Consolidated:Interest expense in 2007 declined $1.6 million primarily due to lower borrowings at Energen Resources along with decreased interest expense associated with the May 2007 voluntary call of the $100 million Floating Rate Senior Notes due November 15, 2007. Also contributing to the decrease in interest expense at Alagasco was the January 2007 redemption of $34.4 million of 6.75% Notes maturing September 1, 2031 and $10 million of 7.97% Medium-Term Notes maturing September 23, 2026 partially offset by the issuance of $45 million in long-term debt with an interest rate of 5.9%. Interest expense in 2006 increased $1.9 million largely due to financing costs associated with higher storage gas inventories at Alagasco and an increase in interest rates associated with Energen’s $100 million Floating Rate Senior Notes issuedNotes. The average daily outstanding balance under short-term credit facilities was $67.7 million in November 2004. Interest expense in 2005 increased $4.1 million primarily due to the November 2004 issuance of $100 million of Floating Rate Senior Notes, Alagasco’s issuance of $80 million of long-term debt in January 2005 and Alagasco’s $80 million issuance of long-term debt in November 2005. Positively impacting interest expense was Alagasco’s redemption of $104.7 million of long-term debt during 2005 and 2004.2007. The average daily outstanding balance under short-term credit facilities was $63.7 million in 2006. The average daily outstanding balance under short-term credit facilities was2006 as compared to $17.7 million in 2005 as compared to $92.6 million in 2004.
2005. Income tax expense increased in the periods presented primarily due to higher pre-tax income. AsPartially offsetting the increase in income tax expense in 2007 was the after-tax impact of December 31, 2006, the amount of minimum tax credit that has been previously recognized and can be carried forward to reduce future regular tax liability is $1.3 million.Section 199 deduction (approximately $7 million after-tax).
FINANCIAL POSITION AND LIQUIDITY
The Company’s net cash from operating activities totaled $484.2 million, $482.9 million and $335.1 million in 2007, 2006 and $291.1 million in 2006, 2005, and 2004, respectively. Operating cash flow in 2007, 2006 2005 and 20042005 benefited from higher realized commodity prices and production volumes at Energen Resources. Negatively affecting operating cash flows during 2007 was an increase in income taxes payable related to depreciation and basis differences in the current period and the prior period utilization of minimum tax credit. In 2006, income from operations before income taxes included a pre-tax gain of $55.5 million related to the sale of a 50 percent interest in Energen Resources’ lease position in various shale plays in Alabama to Chesapeake;Chesapeake acreage sale; the cash proceeds from the sale are included in the investing activities on the Consolidated Statements of Cash Flows, as described more fully below. Working capital needs at Alagasco were reduced by declining gas costs for 2007. During the periods presented,2006 and 2005, working capital needs at Alagasco were primarilylargely affected by increased gas costs compared to the prior period and storage gas inventory. Other working capital items, which primarily are the result of changes in throughput and the timing of payments, combined to create the remaining increases for all years.
During 2007, the Company made net investments of $431.9 million. Energen Resources invested $54.6 million in property acquisitions, including an $18 million acquisition in the Permian Basin and approximately $32 million of unproved leaseholds (including approximately $28 million related to Alabama shale), $313.2 million for development costs including approximately $202 million to drill 345 gross development wells and $7.5 million for exploration. Utility expenditures in 2007 totaled $58.2 million and primarily represented extension and replacement of its distribution system and support facilities. During 2006, the Company made net investments of $256.9 million. Energen Resources invested $46.4 million in property acquisitions, $186.3 million for development costs including approximately $130.6 million to drill 309
gross development wells and $25.9 million for exploration. In December 2006, Energen Resources completed its purchase of gas properties located in the San Juan Basin from Dominion Resources, Inc. for approximately $30 million. The acquisition added approximately 19 Bcfe of proved reserves and had an effective date of December 1, 2006. Energen Resources sold certain properties during 2006, resulting in cash proceeds of $79.4 million including $75 million received from Chesapeake for a 50 percent interest in its lease position in certain unproved shale playsacreage in Alabama. Utility expenditures in 2006 totaled $76.2 million and primarily represented system distribution expansion and support facilities.$75.1 million. During 2005, cash used in investing activities totaled $400.7 million. Energen Resources invested $188.4 million in property acquisitions, $157.5 million for development costs including approximately $123 million to drill 294 gross development wells and $5.1 million for exploration. In December 2005, Energen Resources completed its purchase of oil properties located in the Permian Basin from a private company for a contract price of approximately $168 million. The acquisition added approximately 131 Bcfe of proved reserves and had an effective date of November 1, 2005.During 2005, Energen Resources sold certain properties during 2005, resulting in cash proceeds of $10.8 million. Utility expenditures in 2005 totaled $73.3 million. During 2004, the Company made net investments of $453.4 million. Energen Resources invested $274.4 million in property acquisitions, $124.6 million for development costs including approximately $89 million to drill 288 gross development wells and $5 million for exploration. Utility expenditures in 2004 totaled $58.2$72.4 million.
During 2006,2007, the Company added approximately 2015 Bcfe of reserves primarily from the San JuanPermian Basin acquisition. Also during 2006,2007, Energen Resources added 147127 Bcfe of reserves from discoveries and other additions, primarily the result of improved drilling technology that increased the number of proved undeveloped locations in the San Juan Basin as well as continued downspacing in the Permian Basin.Energen Resources added approximately 224167 Bcfe and 315224 Bcfe of reserves in 20052006 and 2004,2005, respectively.
26
The Company used $53.9 million for net financing activities in 2007 primarily for the early redemption of $100 million Floating Rate Senior Notes due November 15, 2007, $34.4 million of 6.75% Notes maturing September 1, 2031, $10 million of Medium-Term Notes, Series A, with an annual interest rate of 8.09% due September 15, 2026 and $10 million of 7.97% Medium-Term Notes maturing September 23, 2026. Partially offsetting these uses of cash was the January 2007 issuance by Alagasco of $45 million in long-term debt with an interest rate of 5.9% due January 15, 2037. In 2006, net cash used for financing activities totaled $224.4 million largely due to $84.3 million incurred from the buy-back of Energen common stock under its stock repurchase plan along with the repayment of short-term borrowings. In addition, long-term debt was reduced by $15.9 million for current maturities in 2006. The Company provided $69.8 million from net financing activities in 2005. In January 2005, Alagasco issued $40 million of long-term debt with an interest rate of 5.2 percent due January 15, 2020 and $40 million of long-term debt with an interest rate of 5.7 percent due January 15, 2035. In November 2005, Alagasco issued $80 million of long-term debt with an interest rate of 5.368 percent due December 1, 2015. Long-term debt was reduced by $84.8 million including Alagasco’s redemption of $18 million in Medium-Term Notes maturing June 27, 2007 to July 5, 2022 in August 2005 and $56.7 million of long-term debt maturing June 15, 2015 to June 27, 2025 in December 2005. In 2004, net cash provided from financing activities totaled $164.6 million. Long-term debt was reduced by $40.1 million for current maturities in 2004, including $30 million of Medium-Term Notes called by Alagasco in April 2004. For each of the years, net cash used in financing activities also reflected dividends paid to common stockholders.
Capital Expenditures
Oil and Gas Operations:Energen Resources spent a total of approximately $1 billion for capital projects during the years ended December 31, 2007, 2006 2005 and 2004.2005. Property acquisition expenditures totaled $509.2$289.5 million, development activities totaled $468.3$656.9 million, and exploratory expenditures totaled $36$38.5 million.
Years ended December 31, (in thousands) | 2006 | 2005 | 2004 | 2007 | 2006 | 2005 | ||||||||||||
Capital and exploration expenditures for: | ||||||||||||||||||
Property acquisitions | $ | 46,428 | $ | 188,403 | $ | 274,400 | $ | 54,626 | $ | 46,428 | $ | 188,403 | ||||||
Development | 186,264 | 157,458 | 124,588 | 313,220 | 186,264 | 157,458 | ||||||||||||
Exploration | 25,936 | 5,065 | 5,036 | 7,456 | 25,936 | 5,065 | ||||||||||||
Other | 4,411 | 3,037 | 1,988 | 5,667 | 4,411 | 3,037 | ||||||||||||
Total | 263,039 | 353,963 | 406,012 | 380,969 | 263,039 | 353,963 | ||||||||||||
Less exploration expenditures charged to income | 3,361 | 251 | 2,076 | 1,490 | 3,361 | 251 | ||||||||||||
Net capital expenditures | $ | 259,678 | $ | 353,712 | $ | 403,936 | $ | 379,479 | $ | 259,678 | $ | 353,712 | ||||||
Natural Gas Distribution:During the years ended December 31, 2007, 2006 2005 and 2004,2005, Alagasco invested $207.6$208.3 million for capital projects: $154.5$164.5 million for expansion, replacements and support of its distribution system and $53.1$43.7 million for support facilities including the replacement of liquifaction equipment and the development and implementation of information systems.
Years ended December 31, (in thousands) | 2006 | 2005 | 2004 | 2007 | 2006 | 2005 | ||||||||||||
Capital expenditures for: | ||||||||||||||||||
Renewals, replacements, system expansion and other | $ | 60,244 | $ | 53,381 | $ | 40,876 | $ | 50,924 | $ | 60,244 | $ | 53,381 | ||||||
Support facilities | 15,913 | 19,895 | 17,332 | 7,938 | 15,913 | 19,895 | ||||||||||||
Total | $ | 76,157 | $ | 73,276 | $ | 58,208 | $ | 58,862 | $ | 76,157 | $ | 73,276 | ||||||
FUTURE CAPITAL RESOURCES AND LIQUIDITY
As Energen continues to implement its diversified growth strategy, theThe Company plans to investcontinue investing significant capital in Energen Resources’s oil and gas production operations. In the three-year period ending December 31, 2009, the Company expects to spend approximately $660 million in its four major areas of operation. During the three year period, Energen Resources anticipates spending approximately $333 million on development of previously identified proved undeveloped reserves. For 2007,2008, the Company expects its oil and gas capital spending to total approximately $275$308 million, including $256$290 million for existing properties. Included in this $290 million is approximately $153 million for the development of previously identified proved undeveloped reserves. The Company expects capital spending to total approximately $271 million during 2009, including approximately $260 million for existing properties. Included in this $256$260 million is approximately $186$81 million for the development of previously identified proved undeveloped reserves.
27
Capital expenditures by area during 2008 are planned as follows:
Year ended December 31, (in thousands) | 2008 | ||
San Juan Basin | $ | 92,300 | |
Permian Basin | 162,150 | ||
Black Warrior Basin | 10,500 | ||
North Louisiana/East Texas | 25,300 | ||
Other | 17,350 | ||
Total | $ | 307,600 |
As of December 31, 2007, Energen Resources had approximately $28 million of unproved leaseholds costs related to its lease position in Alabama shale. As of February 25, 2008, Energen Resources’ net acreage position in Alabama shale totaled approximately 287,500 acres and represents multiple shale opportunities. In 2008, the Company will begin a 5 to 10 well test program. The Company has not included in its capital spending estimates discussed above any amounts associated with exploratory drilling and/or future potential development for the Alabama shale position.
Energen anticipates having the following drilling rigs and net wells by area during 2008. The drilling rigs presented below are operated while the net wells include operated and non-operated wells.
| Drilling Rigs | Net Wells | |||
San Juan Basin | 6 | 67 | ||
Permian Basin | 4 - 5 | 209 | ||
Black Warrior Basin | 1-2 | 31 | ||
North Louisiana/East Texas | 2 | 10 | ||
Total | 13 - 15 | 317 |
The Company also may allocate additional capital during this three-year period for other oil and gas activities such as property acquisitions, additional accelerated development of existing properties and the exploration and further development of potential shale playsacreage primarily in Alabama. Energen Resources’ ability to invest in property acquisitions is subject to market conditions and industry trends. Energen Resources may evaluate acquisition opportunities which arise in the marketplace and from time to time will pursue acquisitions that meet Energen’s acquisition criteria whichcriteria. Energen Resources’ ability to invest in property acquisitions is subject to market conditions and industry trends. Property acquisitions are not included in the aforementioned estimate of oil and gas investments and could result in capital expenditures different from those outlined above. In October 2006, Energen Resources sold to Chesapeake Energy Corporation (Chesapeake) a 50 percent interest in its unproved lease position of approximately 200,000 acres in various shale plays in Alabama for $75 million and a $15 million carried drilling interest. In addition, the two companies signed an agreement to form an area of mutual interest (AMI) through which they will pursue new leases, exploration, development and operations on a 50-50 basis, for at least the next 10 years. The Company has not included in its capital spending estimates above any amounts associated with potential development and/or exploratory drilling in the AMI.
To finance capital spending at Energen Resources, the Company primarily expects to use internally generated cash flow supplemented by its short-term credit facilities. The Company also may issue long-term debt and equity periodically to replace short-term obligations, enhance liquidity and provide for permanent financing. Energen has $100 million Floating Rate Senior Notes due November 2007 that it plans to repay using internally generated cash flow. Energen currently has available short-term credit facilities aggregating $415 million to help finance its growth plans and operating needs.
Energen also plans to consider stock repurchases as a capital investment option over the next 24-36 months.investment. In May 2006, Energen began a buy-back of its common stock under an existing stock repurchase plan. In June 2006, the Company’s Board of Directors authorized an additional 9 million shares of common stock for repurchase. Energen may buy shares from time to time on the open market or in negotiated purchases. The timing and amounts of any repurchases are subject to changes in market conditions. During 2006, the Company purchased 2.2 million shares at an average price of $39.08 per share. The Company did not repurchase shares of common stock for this program during 2007. The Company plans to continue utilizing internally generated cash flow to fund any future stock repurchases. During 2008, the Company anticipates purchasing approximately $27 million of Company common stock in conjunction with tax withholdings on its non-qualified deferred compensation plan and other stock compensation. The Company plans to utilize internally generated cash flows to fund these purchases of common stock.
Energen Resources has experienced various market driven conditions generally caused by the increased commodity price environment including, but not limited to, increased finding and development costs, higher workover and maintenance expenses, increased taxes and other field-service-related expenses. The Company anticipates influences such as weather, natural disasters, changes in global economics and political unrest will continue to contribute to increased commodity price volatility in the near term. Commodity price volatility will affect the Company’s revenue and associated cash flow available for investment.
For the 2006-2007 winter heating season, Alagasco has hedged or intends toAlagasco’s use storageof commodity price hedges for a portion of its estimated, weather-normalized, core-market gas supply purchases. The Company’s efforts to minimize commodity price volatility through hedgingneeds is reflected in Alagasco’sthe utility’s current rates. Alagasco’s rate schedules for natural gas distribution charges contain a Gas Supply Adjustment (GSA) rider which permits the pass-through to customers for changes in the cost of gas supply. The GSA rider is designed to capture the Company’s cost of natural gas and provides for a pass-through of gas cost fluctuations to customers without markup; the cost of gas includes the commodity cost, pipeline capacity, transportation and fuel costs, and risk management gains and losses. Sustained highhigher natural gas prices may decrease Alagasco’s customer base and could result in a further decline of per customer use and number of customers. The utility will continue to monitor its bad debt reserve and will make adjustments as required based on the evaluation of its receivables which are impacted by natural gas prices.
Alagasco maintains an investment in storage gas that is expected to average approximately $68$65 million in 20072008 but may vary depending upon the price of natural gas. During 20072008 and 2008,2009, Alagasco plans to invest approximately $59$69 million and $62$79 million, respectively, in utility capital expenditures for normal distribution and support systems. Over the three-year period ending December 31, 2009, Alagasco anticipates capital investments of approximately $185 million. The utility anticipates funding these capital requirements through internally generated capitalcash flow and the utilization of short-term credit facilities. Alagasco issued $45 million in long-term debt with an interest rate of 5.9% in January 2007 and recalled approximately $45redeemed $34.4 million of 6.75% Notes maturing September 1, 2031 and $10 million of 7.97% Medium-Term Notes maturing September 23, 2026 in the same period in order to capitalize on lower interest rates. In January 2005, Alagasco issued $80 million in long-term debt to repay amounts drawn on short-term credit facilities for capital expenditures and to refinance $30 million of Medium-Term Notes recalled by Alagasco in April 2004. In November 2005, Alagasco issued an additional $80 million of long-term debt largely to refinance $18 million of Medium-Term Notes maturing June 27, 2007 to July 5, 2022 and $56.7 million of long-term debt maturing June 15, 2015 to June 27, 2025 recalled by Alagasco in August 2005 and December 2005, respectively.
Access to capital is an integral part of the Company’s business plan. The Company regularly provides information to corporate rating agencies related to current business activities and future performance expectations. On September 25, 2007, Moody’s Investors Service (Moody’s) downgraded the debt rating of Energen to Baa3 senior unsecured from Baa2. Energen’s debt rating of Baa3 remains investment grade and reflects Moody’s assignment of increased exposure to the Company related to the growth of its oil and gas operations. Moody’s also confirmed the debt rating of Alagasco during this review as A1 senior unsecured. On October 31, 2007, Standard & Poor’s affirmed its BBB+ corporate credit rating on Energen and Alagasco; the outlook remained stable. While the Company expects to have ongoing access to its short-term credit facilities and the broader long-term markets, continued access could be adversely affected by future economic and business conditions orand credit rating downgrades. To help finance its growth plans and operating needs, the Company currently has available short-term credit facilities aggregating $415 million of which Energen has available $255 million, Alagasco has available $110 million and $50 million is available to either Company. At December 31, 2007, Energen and Alagasco’s corporateAlagasco had borrowings of $72 million and $62 million, respectively on its short-term credit ratings are currently rated BBB+ with a stable outlook by Standard & Poor’s. Moody’s Investors Service has currently rated Energen as Baa 2 senior unsecured and Alagasco as A1 senior unsecured with a stable outlook.facilities.
Dividends
Energen expects to pay annual cash dividends of $0.46$0.48 per share on the Company’s common stock in 2007.2008. The amount and timing of all dividend payments is subject to the discretion of the Board of Directors and is based upon business conditions, results of operations, financial conditions and other factors.
On April 27, 2005, Energen’s shareholders approved a 2-for-1 split of the Company’s common stock. The split was effected in the form of a 100 percent stock dividend and was effective on June 1, 2005, to shareholders of record on May 13, 2005. All share and per share amounts of capital stock outstanding have been adjusted to reflect the stock split.
Contractual Cash Obligations and Other Commitments
In the course of ordinary business activities, Energen enters into a variety of contractual cash obligations and other commitments. The following table summarizes the Company’s significant contractual cash obligations, other than hedging contracts, as of December 31, 2006.2007.
| Payments Due before December 31, | |||||||||||||||
(in thousands) | Total | 2007 | 2008-2009 | 2010-2011 | 2012 and Thereafter | ||||||||||
Short-term debt | $ | 58,000 | $ | 58,000 | $ | — | $ | — | $ | — | |||||
Long-term debt(1) | 683,756 | 100,000 | 10,000 | 155,000 | 418,756 | ||||||||||
Interest payments on debt(2) | 499,473 | 43,957 | 76,445 | 64,061 | 315,010 | ||||||||||
Purchase obligations(3) | 211,971 | 47,904 | 99,939 | 41,941 | 22,187 | ||||||||||
Capital lease obligations | — | — | — | — | — | ||||||||||
Operating leases | 46,177 | 3,772 | 6,582 | 6,234 | 29,589 | ||||||||||
Asset retirement obligations(4) | 462,078 | 4,433 | 2,682 | 6,509 | 448,454 | ||||||||||
Total contractual cash obligations | $ | 1,961,455 | $ | 258,066 | $ | 195,648 | $ | 273,745 | $ | 1,233,996 | |||||
29
| Payments Due before December 31, | |||||||||||||||
(in thousands) | Total | 2008 | 2009-2010 | 2011-2012 | | 2013 and Thereafter | |||||||||
Short-term debt | $ | 134,000 | $ | 134,000 | $ | - | $ | - | $ | - | |||||
Long-term debt(1) | 573,467 | 10,000 | 150,000 | 6,000 | 407,467 | ||||||||||
Interest payments on debt | 446,010 | 37,300 | 72,945 | 50,050 | 285,715 | ||||||||||
Purchase obligations(2) | 178,400 | 50,964 | 89,450 | 17,751 | 20,235 | ||||||||||
Capital lease obligations | - | - | - | - | - | ||||||||||
Operating leases | 46,147 | 4,128 | 8,092 | 7,339 | 26,588 | ||||||||||
Asset retirement obligations(3) | 491,444 | 5,069 | 7,311 | 2,106 | 476,958 | ||||||||||
Nonqualified supplemental | 35,111 | 3,126 | 4,811 | 4,711 | 22,463 | ||||||||||
Total contractual cash obligations | $ | 1,904,579 | $ | 244,587 | $ | 332,609 | $ | 87,957 | $ | 1,239,426 | |||||
(1) | Long-term cash obligations include |
(2) |
|
| Certain of the Company’s long-term gas procurement contracts for the supply, storage and delivery of natural gas include fixed charges of |
| Represents the estimated future asset retirement obligation on an undiscounted basis. |
Energen Resources operates in certain instances through joint ventures under joint operating agreements. Typically, the operator under a joint operating agreement enters into contracts, such as drilling contracts, for the benefit of all joint venture partners. Through the joint operating agreement, the non-operators reimburse, and in some cases advance, the funds necessary to meet the contractual obligations entered into by the operator. These obligations are typically shared on a working interest basis as defined in the joint operating contractual agreement.
The Company has two defined non-contributory pension plans and provides certain postretirement healthcare and life insurance benefits. The Company is not required to make any funding payments during 20072008 for the pension plans and does not currently plan to make discretionary contributions. The Company expects to make discretionary payments of approximately $371,000$2.2 million to postretirement benefit program assets during 2007.2008. The contractual obligations reported above exclude any payments the Company expects to make to postretirement benefit program assets.
The contractual obligations reported above exclude the Company’s liability of $8.5 million recognized under FASB Interpretation No. 48, “Accounting for Uncertainty in Income Taxes-an Interpretation of FASB Statement No. 109” (FIN 48) related to the Company’s provision for uncertain tax positions. The Company cannot make a reasonably reliable estimate of the amount and period of related future payments for such liability.
OUTLOOK
Oil and Gas Operations:Energen Resources plans to continue to implement its growth strategy with capital spending in 2007 through2008 and 2009 as outlined above. Production in 20072008 is estimated to be approximately 95102 Bcfe, including 93.5approximately 100 Bcfe of estimated production from proved reserves owned at December 31, 2006.2007. In 2008,2009, production is estimated to range from 97 to 99be 108 Bcfe, including approximately 92100 Bcfe produced from proved reserves currently owned. Production in 2009 could be in excess of 100 Bcfe. Production estimates above do not include amounts for potential future acquisitions or Alabama shales.shale.
Production volumes by area are expected to be as follows:
Years Ended December 31, (Bcfe) | 2008 | 2009 | ||
San Juan Basin | 50 | 54 | ||
Permian Basin | 30 | 34 | ||
Black Warrior Basin | 14 | 14 | ||
North Louisiana/East Texas | 8 | 6 | ||
Total | 102 | 108 |
During 2008 and 2009, Energen Resources expects an annualized decline rate of approximately 7 percent for its proved developed producing properties owned at December 31, 2007. During the same period, total production from proved properties is expected to increase approximately 1 percent and total production is expected to increase approximately 4 percent. Total production estimates do not include any production associated with the Alabama shale position.
30
In the event Energen Resources is unable to fully invest in its capital investment opportunities, future operating revenues, production and proved reserves could be negatively affected. Energen Resources’ major market risk exposure is in the pricing applicable to its oil and gas production. Historically, prices received for oil and gas production have been volatile because of seasonal weather patterns, national supply and demand factors and general economic conditions. Crude oil prices also are affected by quality differentials, worldwide political developments and actions of the Organization of Petroleum Exporting Countries. Basis differentials, like the underlying commodity prices, can be volatile because of regional supply and demand factors, including seasonal variations and the availability and price of transportation to consuming areas.
Revenues and related accounts receivable from oil and gas operations primarily are generated from the sale of produced oil, natural gas and oilnatural gas liquids to energy marketing companies. Such sales are typically made on an unsecured credit basis with payment due the month following delivery. This concentration of sales to the energy marketing industry has the potential to affect the Company’s overall exposure to credit risk, either positively or negatively, in that the Company’s oil and gas purchasers may be affected similarly by changes in economic, industry or other conditions. Energen Resources considers the credit quality of its customers and, in certain instances, may require credit assurances such as a deposit, letter of credit or parent guarantee. The threefour largest oil, natural gas and natural gas liquids purchasers account for approximately 3422 percent, 1314 percent, 11 percent and 1110 percent, respectively, of Energen Resources’ estimated 20072008 production. Energen Resources’ other purchasers each bought less than 98 percent of production.
Energen Resources periodically enters into derivative commodity instruments that qualify as cash flow hedges under SFAS No. 133 to hedge its price exposure to its estimated oil, natural gas and natural gas liquids production. Such instruments may include regulated natural gas and crude oil futures contracts traded on the New York Mercantile Exchange (NYMEX) and over-the-counter swaps, collars and basis hedges with major energy derivative product specialists. The counterparties to the commodity instruments are investment banks and energy-trading firms. In some contracts, the amount of credit allowed before Energen Resources must post collateral for out-of-the-money hedges varies depending on the credit rating of the Company. In cases where these arrangements exist, the credit ratings must be maintained at investment grade status to have any available counterparty credit. Adverse changes to the Company’s credit rating results in decreasing amounts of credit available under these contracts. The counterparties for these contracts do not extend credit to the Company in the event credit ratings are below investment grade. At December 31, 2006,2007, the counterparty agreements under which the Company had active positions did not include collateral posting requirements. Energen Resources was in a net gain position with all but twothree of its counterparties and was not required to post collateral. Energen Resources uses various counterparties for its over-the-counter derivatives. As of December 31, 2006, three counterparties represented approximately 94 percent of Energen Resources’ gain on fair value of derivatives.a net loss with the remaining four. The Company believes the creditworthiness of these counterparties is satisfactory. Hedge transactions are pursuant to standing authorizations by the Board of Directors, which do not permit speculative positions. Energen Resources does not hedge more than 80 percent of its estimated annual production and generally does not hedge this production more than two years forward. Production may be hedged for a longer period immediately following an acquisition in order to protect targeted returns.
Energen Resources entered into the following transactions for 20072008 and subsequent years:
Production Period | Total Hedged Volumes | Average Contract Price | Description | |||
Natural Gas | ||||||
| $ | NYMEX Swaps | ||||
| 2008 | $ | Basin Specific Swaps | ||||
| 24.7 Bcf | $7.81 Mcf | Basin Specific Swaps | |||
| $8.55 Mcf | NYMEX Swaps | ||||
| 2009 | *4.9 Bcf | $7.55 Mcf | Basin Specific Swaps | |||
| Natural Gas Basis Differential | ||||||
| 2008 | 12.0 Bcf | ** | Basis Swaps | |||
| Oil | ||||||
| 2008 | 3,203 MBbl | $ | NYMEX Swaps | |||
| $ | NYMEX Swaps | ||||
2009 | $ | NYMEX Swaps | ||||
2010 | 720 MBbl | $81.20 Bbl | NYMEX Swaps | |||
| Oil Basis Differential | ||||||
| ** | Basis Swaps | ||||
| ** | Basis Swaps | ||||
2009 | *156 MBbl | ** | Basis Swaps | |||
| Natural Gas Liquids | ||||||
| $ | Liquids Swaps | ||||
| 2009 | 20.2 MMGal | $1.05 Gal | Liquids Swaps | |||
| * | Contracts entered into subsequent to December 31, 2007 |
| ** | Average contract prices not meaningful due to the varying nature of each contract |
31
The Company has prepared a sensitivity analysis to evaluate the hypothetical effect that changes in the market value of crude oil, natural gas and natural gas liquids may have on the fair value of its derivative instruments. This analysis measured the impact on the commodity derivative instruments and, thereby, did not consider the underlying exposure related to the commodity. At December 31, 2006,2007, the Company estimatedwas in a net loss position of $110.6 million for derivative contracts and estimates that a 10 percent increase or decrease in the commodities prices would have resulted in a $65.4$116.8 million change in the fair value of open derivative contracts; however, gains and losses on derivative contracts are expected to be similarly offset by sales at the spot market price. The hypothetical change in fair value was calculated by multiplying the difference between the hypothetical price and the contractual price by the contractual volumes and did not include the impact of related taxes on actual cash prices.
Natural Gas Distribution:The extension of RSE in June 2002December 2007 provides Alagasco the opportunity to continue earning an allowed ROE between 13.15 percent and 13.65 percent through January 1, 2008.December 31, 2014. Under the terms of that extension, RSE will continue beyond that date, unless, after notice to the Company and a hearing, the APSC votes to modify or discontinue its operations. Alagasco’s rate schedules for natural gas distribution charges contain a Gas Supply Adjustment rider which permits the pass-through to customers for changes in the cost of gas supply. Also as discussed in Note 2, Regulatory Matters, in the Notes to Financial Statements, the utility’s CCM is based in part on the number of customers and the rate of inflation. Continued low inflation and significantly higher gas prices resulting in increased bad debt expense and/or the lack of customer growth could impact the utility’s ability to manage its
O&M expense per customer sufficiently for the inflation-based cost control requirements of RSE and may result in an average return on equity lower than the allowed range of return. Over this period, Alagasco has the potential for net income growth as the investmentIn addition, continued decreases in additional utility plant affects the level of equity requiredresidential customers and continued declines in use per customer in the business.residential and small commercial classes will make it more difficult for the utility to earn within its allowed range of return on equity. The utility continues to rely on rate flexibility to effectively preventdeter bypass of its distribution system.system by large industrial and commercial customers.
As required by SFAS No. 133, Alagasco recognizes all derivatives at fair value as either assets or liabilities on the balance sheet. Any gains or losses are passed through to customers using the mechanisms of the GSA in compliance with Alagasco’s APSC-approved tariff and are recognized as a regulatory asset or regulatory liability as required by SFAS No. 71. At December 31, 2006,2007, Alagasco recorded an $11.5a $0.4 million loss as a liability in accounts payable with a corresponding current regulatory asset of $11.5 million representing the fair value of derivatives. The gains or losses related to these derivative contracts, as adjusted for any changes in the fair value, will be recognized in the GSA during the first quarter of 2007.2008.
CRITICAL ACCOUNTING POLICIES AND ESTIMATES
The Company’s consolidated financial statements are prepared in accordance with accounting principles generally accepted in the United States of America. Management has identified the following critical accounting policies in the application of existing accounting standards or in the implementation of new standards that involve significant judgments and estimates by the Company. The application of these accounting policies necessarily requires managements’ most subjective or complex judgments regarding estimates and projected outcomes of future events that could have a material impact on the financial statements.
Oil and Gas Operations
Forward-Looking Statements:Accounting for Natural Gas and Oil Producing Activities and Related Reserves:The Company utilizes the successful efforts method of accounting for its natural gas and oil producing activities. Under this accounting method, acquisition and development costs of proved properties are capitalized and amortized on a units-of-production basis over the remaining life of total proved and proved developed reserves. Proved oil and gas reserves are the estimated quantities of crude oil, natural gas and natural gas liquids that geological and engineering data
32
demonstrate with reasonable certainty to be recoverable in future years from known reservoirs under existing economic and operating conditions. Accordingly, these estimates do not include probable or possible reserves. Estimated oil and gas reserves are based on currently available reservoir data and are subject to future revision. Estimates of physical quantities of oil and gas reserves have been determined by Company engineers. Independent oil and gas reservoir engineers have reviewed the estimates of proved reserves of natural gas, crude oil and natural gas liquids attributed to the Company’s net interests in oil and gas properties as of December 31, 2007. The independent reservoir engineers have issued reports covering approximately 98 percent of the Company’s ending proved reserves and in their judgment these estimates were reasonable in the aggregate. The Company’s production of undeveloped reserves requires the installation or completion of related infrastructure facilities such as pipelines and the drilling of development wells.
Changes in oil and gas prices, operating costs and expected performance from the properties can result in a revision to the amount of estimated reserves held by the Company. If reserves are revised upward, earnings could be affected due to lower depreciation and depletion expense per unit of production. Likewise, if reserves are revised downward, earnings could be affected due to higher depreciation and depletion expense or due to an immediate writedown of the property’s book value if an impairment is warranted. The table below reflects an estimated increase in 2008 depreciation, depletion and amortization expense associated with an assumed downward revision in the reported oil and gas reserve amounts at December 31, 2007:
| Percentage Change in Oil & Gas Reserves From Reported Reserves as of December 31, 2007 | ||||
(dollars in thousands) | -5% | -10% | ||
Estimated increase in DD&A expense for the | $ 3,900 | $ 8,200 | ||
Exploratory drilling costs are capitalized pending determination of proved reserves. If proved reserves are not discovered, the exploratory drilling costs are expensed. Other exploration costs, including geological and geophysical costs, are expensed as incurred.
Asset Impairments:Oil and gas proved properties periodically are assessed for possible impairment, generally on a field-by-field basis, using the estimated undiscounted future cash flows of each field. Impairment losses are recognized when the estimated undiscounted future cash flows are less than the current net book values of the properties in a field. The Company monitors its oil and gas properties as well as the market and business environments in which it operates and makes assessments about events that could result in potential impairment issues. Such potential events may include, but are not limited to, substantial commodity price declines, unanticipated increased operating costs, and lower-than-expected production performance. If a material event occurs, Energen Resources makes an estimate of undiscounted future cash flows to determine whether the asset is impaired. If the asset is impaired, the Company will record an impairment loss for the difference between the net book value of the properties and the fair value of the properties. The fair value of the properties typically is estimated using discounted cash flows.
Cash flow and fair value estimates require Energen Resources to make projections and assumptions for pricing, demand, competition, operating costs, legal and regulatory issues, discount rates and other factors for many years into the future. These variables can, and often do, differ from the estimates and can have a positive or negative impact on the Company’s need for impairment or on the amount of impairment. In addition, further changes in the economic and business environment can impact the Company’s original and ongoing assessments of potential impairment.
Energen Resources adheres to Statement of Financial Accounting Standards (SFAS) No.19, “Financial Accounting and Reporting by Oil and Gas Producing Companies,” for recognizing any impairment of capitalized costs to unproved properties. The greatest portion of these costs generally relates to the acquisition of leasehold costs. The costs are capitalized and periodically evaluated as to recoverability, based on changes brought about by economic factors and potential shifts in business strategy employed by management. The Company considers a combination of geologic and engineering factors to evaluate the need for impairment of these costs.
33
Derivatives: Energen Resources periodically enters into commodity derivative contracts to manage its exposure to oil, natural gas and natural gas liquids price volatility. SFAS No. 133, “Accounting for Derivative Instruments and Hedging Activities” as amended requires all derivatives to be recognized on the balance sheet and measured at fair value. Realized gains and losses from derivatives designated as cash flow hedges are recognized in oil and gas production revenues when the forecasted transaction occurs. Energen Resources may also enter into derivative transactions that do not qualify for cash flow hedge accounting but are considered by management to be valid economic hedges. Gains and losses from the change in fair value of derivative instruments that do not qualify for hedge accounting are reported in current period operating revenues, rather than in the period in which the hedge transaction is settled. Energen Resources does not enter into derivatives or other financial instruments for trading purposes. The use of derivative contracts to mitigate price risk may cause the Company’s financial position, results of operations and cash flow to be materially different from results that would have been obtained had such risk mitigation activities not occurred.
Natural Gas Distribution
Regulated Operations: Alagasco applies SFAS No. 71, “Accounting for the Effects of Certain Types of Regulation,” to its regulated operations. This standard requires a cost to be capitalized as a regulatory asset that otherwise would be charged to expense if it is probable that the cost is recoverable in the future through regulated rates. Likewise, if current recovery is provided for a cost that will be incurred in the future, SFAS No. 71 requires the cost to be recognized as a regulatory liability. The Company anticipates SFAS No. 71 will continue as the applicable accounting standard for its regulated operations. Alagasco’s rate setting methodology, Rate Stabilization and Equalization, has been in effect since 1983.
Consolidated
Employee Benefit Plans:In December 2006, the Company adopted SFAS No. 158, “Employers’ Accounting for Defined Benefit Pension and Other Postretirement Plans, an amendment of FASB Statements No. 87, 88, 106 and 132 (R)” (SFAS No. 158). This Standard retains the previous periodic expense calculation on an actuarial basis under the provisions of SFAS No. 87, “Employers’ Accounting for Pensions” and SFAS No. 106, “Employers’ Accounting for Postretirement Benefits Other than Pensions.” In addition, SFAS No. 158 requires an employer to recognize the net funded status of defined benefit pensions and other postretirement benefit plans (benefit plans) as an asset or liability in its statement of financial position and to recognize changes in the funded status through comprehensive income in the year in which the changes occur. As required by SFAS No. 158 as of December 31, 2006, the pension benefit obligation is the projected benefit obligation (PBO), a measurement of earned benefit obligations at expected retirement salary levels; for other postretirement plans, the benefit obligation is the accumulated postretirement benefit obligation (APBO), a measurement of earned postretirement benefit obligations expected to be paid to employees upon retirement. Prior to implementation of SFAS No. 158, the required pension benefit obligation was the accumulated benefit obligation (ABO), a measurement of earned benefit obligations at existing salary levels, and other postretirement obligations were not recorded as a liability on the statement of financial position. Alagasco established a regulatory asset for the portion of the total benefit obligation to be recovered through rates in future periods in accordance with SFAS No. 71.
Actuarial assumptions attempt to anticipate future events and are used in calculating the expenses and liabilities related to these plans. The calculation of the liability related to the Company’s benefit plans includes assumptions regarding the appropriate weighted average discount rate, the expected long-term rate of return on the plans’ assets and the estimated weighted average rate of increase in the compensation level of its employee base for defined benefit pension plans. The key assumptions used in determining these calculations are disclosed in Note 5, Employee Benefit Plans, in the Notes to Financial Statements.
In selecting the discount rate, consideration was given to Moody’s Aa corporate bond rates, along with a yield curve applied to payments the Company expects to make out of its retirement plans. The yield curve is comprised of a broad base of Aa bonds with maturities between zero and thirty years. The discount rate was developed as the level equivalent rate that would produce the same present value as that using spot rates aligned with the projected benefit payments; the discount rate used to determine net periodic costs was 5.77 percent for each of the plans for the year ended December 31, 2007. The assumed rate of return on assets is the weighted average of expected long-term asset assumptions; the return on assets used to determine net periodic expense was 8.25 percent for each of the applicable plans for the year ended December 31, 2007. The estimated weighted average rate of increase in the compensation level for pay related plans was 4.2 percent for the year ended December 31, 2007.
34
The selection and use of actuarial assumptions affects the amount of benefit expense recorded in the Company’s financial statements. The table below reflects a hypothetical 25 basis point change in assumed actuarial assumptions to pre-tax benefit expense for the year ended December 31, 2007:
(in thousands) | Pension Expense | Postretirement Expense | ||
Discount rate change | $ 900 | $ 100 | ||
Return on assets | $ 400 | $ 200 | ||
Compensation increase | $ 700 | $ - | ||
The weighted average discount rate, return on plan assets and estimated rate of compensation increase used in the 2008 actuarial assumptions is 6.18 percent, 8.25 percent, and 4.07 percent, respectively.
Asset Retirement Obligation:The Company records the fair value of a liability for an asset retirement obligation (ARO) in the period in which it is incurred. Subsequent to initial measurement, liabilities are required to be accreted to their present value each period and capitalized costs are depreciated over the estimated useful life of the related assets. Upon settlement of the liability, the Company will settle the obligation for its recorded amount and recognize the resulting gain or loss. Energen Resources has an obligation to remove tangible equipment and restore land at the end of oil and gas production operations. Alagasco has certain removal cost obligations related to its gas distribution assets and a conditional asset retirement obligation to purge and cap its distribution and transmission lines upon abandonment. The estimate of future restoration and removal costs includes numerous assumptions and uncertainties, including but not limited to, inflation factors, discount rates, timing of settlement, and changes in contractual, regulatory, political, environmental, safety and public relations considerations.
Uncertain Tax Positions:As of January 1, 2007, the Company accounts for uncertain tax positions in accordance with the provisions of FIN 48. The application of income tax law is inherently complex; laws and regulation in this area are voluminous and often ambiguous. As such, the Company is required to make many subjective assumptions and judgments regarding income tax exposures. Interpretations and guidance related to income tax laws and regulation change over time. It is possible that changes in the Company’s subjective assumptions and judgments could materially affect amounts recognized in the consolidated balance sheets and statements of income. Additional information related to the Company’s uncertain tax position is provided in Note 17, Recent Pronouncements of the Financial Accounting Standards Board, in the Notes to the Financial Statements.
FORWARD-LOOKING STATEMENTS
Certain statements in this report express expectations of future plans, objectives and performance of the Company and its subsidiaries and constitute forward-looking statements made pursuant to the Safe Harbor provision of the Private Securities Litigation Reform Act of 1995. Except as otherwise disclosed, the Company’s forward-looking statements do not reflect the impact of possible or pending acquisitions, investments, divestitures or restructurings. The absence of errors in input data, calculations and formulas used in estimates, assumptions and forecasts cannot be guaranteed. Neither the Company nor Alagasco undertakes any obligation to correct or update any forward-looking statements whether as a result of new information, future events or otherwise.
All statements based on future expectations rather than on historical facts are forward-looking statements that are dependent on certain events, risks and uncertainties that could cause actual results to differ materially from those anticipated. Some of these include, but are not limited to, economic and competitive conditions, inflation rates, legislative and regulatory changes, financial market conditions, our ability to access the capital markets, future business decisions, utility customer growth and retention and usage per customer, litigation results and other uncertainties, all of which are difficult to predict.
Third Party Facilities: The forward looking statements also assume generally uninterrupted access to third party oil and gas gathering, transportation, processing and storage facilities. Energen Resources relies upon such facilities
35
for access to markets for its production. Alagasco relies upon such facilities for access to natural gas supplies. Such facilities are typically limited in number and geographically concentrated. An extended interruption of access to or service from these facilities, whether caused by weather events, natural disaster, accident, mechanical failure, criminal act or otherwise, could result in material adverse financial consequences to Alagasco, Energen Resources and/or the Company.
Energen Resources’ Production:Production and Drilling: There are numerous uncertainties inherent in estimating quantities of proved oil and gas reserves and in projecting future rates of production and timing of development expenditures. The total amount or timing of actual future production may vary significantly from reserve and production estimates. In the event Energen Resources is unable to fully invest its planned acquisition, development and exploratory expenditures, future operating revenues, production, and proved reserves could be negatively affected. The drilling of development and exploratory wells can involve significant risks, including those related to timing, success rates and cost overruns, and these risks can be affected by lease and rig availability, complex geology and other factors. Anticipated drilling plans and capital expenditures may also change due to weather, manpower and equipment availability, changing emphasis by management and a variety of other factors which could result in actual drilling and capital expenditures being substantially different than currently planned.
Energen Resources’ Hedging: Although Energen Resources makes use of futures, swaps and fixed-price contracts to mitigate price risk, fluctuations in future oil, gas and natural gas liquids prices could materially affect the Company’s financial position, results of operations and cash flows; furthermore, such risk mitigation activities may cause the Company’s financial position and results of operations to be materially different from results that would have been obtained had such risk mitigation activities not occurred. The effectiveness of such risk mitigation assumes that counterparties maintain satisfactory credit quality. The effectiveness of such risk mitigation also assumes that actual sales volumes will generally meet or exceed the volumes subject to the futures, swaps and fixed price contracts. A substantial failure to meet sales volume targets whether caused by miscalculations, weather events, natural disaster, accident, criminal act or otherwise, could leave Energen Resources financially exposed to
its counterparties and result in material adverse financial consequences to Energen Resources and the Company. The adverse effect could be increased if the adverse event was widespread enough to move market prices against Energen Resources’ position.
Alagasco’s Hedging:Similarly, although Alagasco makes use of futures, swaps and fixed-price contracts to mitigate gas supply cost risk, fluctuations in future gas supply costs could materially affect its financial position and rates to customers. The effectiveness of Alagasco’s risk mitigation assumes that its counterparties in such activities maintain satisfactory credit quality. The effectiveness of such risk mitigation also assumes that Alagasco’s actual gas supply needs will generally meet or exceed the volumes subject to the futures, swaps and fixed price contracts. A substantial failure to experience projected gas supply needs, whether caused by miscalculations, weather events, natural disaster, accident, mechanical failure, criminal act or otherwise, could leave Alagasco financially exposed to its counterparties and result in material adverse financial consequences to Alagasco and the Company. The adverse effect could be increased if the adverse event was widespread enough to move market prices against Alagasco’s position.
Operations: Inherent in the gas distribution activities of Alagasco and the oil and gas production activities of Energen Resources are a variety of hazards and operation risks, such as leaks, explosions and mechanical problems that could cause substantial financial losses. In addition, these risks could result in loss of human life, significant damage to property, environmental pollution, impairment of operations and substantial losses to the Company. In accordance with customary industry practices, the Company maintains insurance against some, but not all, of these risks and losses. The location of pipeline and storage facilities near populated areas, including residential areas, commercial business centers and industrial sites, could increase the level of damages resulting from these risks. The occurrence of any of these events could adversely affect Alagasco’s, Energen Resources’ and/or the Company’s financial position, results of operations and cash flows.
Alagasco’s Service Territory: Alagasco’s utility customers are geographically concentrated in central and north Alabama. Significant economic, weather, natural disaster, criminal act or other events that adversely affect this region could adversely affect Alagasco and the Company.
36
RECENT PRONOUNCEMENTS OF THE FINANCIAL ACCOUNTING STANDARDS BOARD (FASB)
In June 2006,The Company adopted the FASB issued FASB Interpretation No.provisions of FIN 48 “Accounting for Uncertainty in Income Taxes-an Interpretationas of FASB Statement No. 109” (FIN 48) to address accounting for uncertainty in tax positions.January 1, 2007. This Interpretation prescribed a recognition threshold and measurement attribute for the financial statement recognition, measurement and disclosure of a tax position taken or expected to be taken in a tax return. As a result of the implementation of FIN 48, is effectivethe Company recognized an approximate $1.2 million increase in the liability for fiscal years beginning after December 15, 2006. The Company has analyzed FIN 48 and does not expect the adoption of this Interpretation will have a material impact to the Company. The cumulative effect of applying this Interpretation will be recordedunrecognized tax benefits which was accounted for as a decrease to the January 1, 2007 balance of retained earnings asearnings. As of the date of adoption and after the impact of recognizing the increase in liability noted above, the Company’s unrecognized tax benefits totaled $8.2 million. The amount of unrecognized tax benefits at January 1, 2007 that would favorably impact the Company’s effective tax rate, if recognized, was $3.4 million. The Company recognized potential accrued interest and penalties related to unrecognized tax benefits in income tax expense. As of January 1, 2007, the Company recognized approximately $484,000 in an amount not expected to exceed $1 million.potential interest (net of tax benefit) and penalties associated with uncertain tax positions.
During September 2006, the FASB issued SFAS No. 157, “Fair Value Measurements,” which clarifies the principle that fair value should be based on the assumptions market participants would use when pricing an asset or a liability and establishes a fair value hierarchy that prioritizes the information used to develop those assumptions. Under SFAS No. 157, fair value measurements would be separately disclosed by level within the fair value hierarchy effective for fiscal years beginning after November 15, 2007. The Company is currently evaluating the impact of this Statement. In February 2008, the FASB announced it will issue Final FASB Staff Positions (FSP’s) that will partially defer the effective date of SFAS No. 157 for one year for certain nonfinancial assets and nonfinancial liabilities and remove certain leasing transactions from the scope of SFAS No. 157. The Company will evaluate the impact of the FSP’s upon issuance.
In February 2007, the FASB issued SFAS No. 159, “The Fair Value Option for Financial Assets and Financial Liabilities,” which permits entities to measure financial instruments and certain other items at fair value to mitigate volatility in reported earnings. This Statement is effective for fiscal years beginning after November 15, 2007. The effect of this Standard on the Company is currently being evaluated.
In December 2007, the FASB issued SFAS No. 141 (revised 2007), “Business Combinations,” which will improve the relevance, representational faithfulness, and comparability of the information that a reporting entity provides in its financial reports about a business combination and its effects. This Statement applies prospectively to business combinations for which the acquisition date is on or after the beginning of the first fiscal year beginning on or after December 15, 2008. The Company is currently evaluating the impact of this Statement.
The FASB issued SFAS No. 160, “Noncontrolling Interests in Consolidated Financial Statements—an amendment of ARB No. 51,” in December 2007. SFAS No. 160 establishes accounting and reporting standards for ownership interests in subsidiaries held by parties other than the parent, the amount of consolidated net income attributable to the parent and to the noncontrolling interest, changes in a parent’s ownership interest, and the valuation of retained noncontrolling equity investments when a subsidiary is deconsolidated. SFAS No. 160 also establishes disclosure requirements that clearly identify and distinguish between the interests of the parent and the interests of the noncontrolling owners. This Statement is effective for fiscal years, and interim periods within those fiscal years, beginning on or after December 15, 2008. The effect of this Standard on the Company is currently being evaluated.
| QUANTITATIVE AND QUALITATIVE DISCLOSURES ABOUT MARKET RISK |
The information required by this item with respect to market risk is set forth in Item 7, Management’s Discussion and Analysis of Financial Condition and Results of Operations under the heading “Outlook” and in Note 8, Financial Instruments and Risk Management, in the Notes to Financial Statements.
| FINANCIAL STATEMENTS AND SUPPLEMENTARY DATA |
ENERGEN CORPORATION
ALABAMA GAS CORPORATION
INDEX TO FINANCIAL STATEMENTS
AND FINANCIAL STATEMENT SCHEDULES
| Page | ||||
1. | Financial Statements | |||
Energen Corporation | ||||
Consolidated Statements of Income for the years ended December 31, 2007, 2006 | ||||
Consolidated Balance Sheets as of December 31, | ||||
Consolidated Statements of Cash Flows for the years ended December 31, 2007, 2006 | ||||
Alabama Gas Corporation | ||||
Statements of Income for the years ended December 31, 2007, 2006 | ||||
Statements of Shareholder’s Equity for the years ended December 31, 2007, 2006 | ||||
Statements of Cash Flows for the years ended December 31, 2007, 2006 | ||||
2. | Financial Statement Schedules | |||
Energen Corporation | ||||
Alabama Gas Corporation | ||||
Schedules other than those listed above are omitted because they are not required, not applicable, or the required information is shown in the financial statements or notes thereto.
REPORT OF INDEPENDENT REGISTERED PUBLIC ACCOUNTING FIRM
To the Board of Directors and Shareholders of Energen Corporation:
We have completed integrated audits of Energen Corporation’s consolidated financial statements and of its internal control over financial reporting as of December 31, 2006, in accordance with the standards of the Public Company Accounting Oversight Board (United States). Our opinions, based on our audits, are presented below.
Consolidated financial statements and financial statement schedule
In our opinion, the consolidated financial statements listed in the accompanying index present fairly, in all material respects, the financial position of Energen Corporation and its subsidiaries at December 31, 20062007 and 2005,2006, and the results of their operations and their cash flows for each of the three years in the period ended December 31, 20062007 in conformity with accounting principles generally accepted in the United States of America. In addition, in our opinion, the financial statement schedule listed in the accompanying index presents fairly, in all material respects, the information set forth therein when read in conjunction with the related consolidated financial statements. TheseAlso in our opinion, the Company maintained, in all material respects, effective internal control over financial statements and financial statement schedule arereporting as of December 31, 2007, based on criteria established inInternal Control - Integrated Framework issued by the responsibilityCommittee of Sponsoring Organizations of the Treadway Commission (COSO). The Company’s management. Our responsibilitymanagement is to express an opinion onresponsible for these financial statements and financial statement schedule, for maintaining effective internal control over financial reporting and for its assessment of the effectiveness of internal control over financial reporting, appearing on Management’s Report on Internal Control Over Financial Reporting under Item 9A. Our responsibility is to express opinions on these financial statements, on the financial statement schedule, and on the Company’s internal control over financial reporting based on our integrated audits. We conducted our audits of these statements in accordance with the standards of the Public Company Accounting Oversight Board (United States). Those standards require that we plan and perform the auditaudits to obtain reasonable assurance about whether the financial statements are free of material misstatement. An auditmisstatement and whether effective internal control over financial reporting was maintained in all material respects. Our audits of the financial statements includesincluded examining, on a test basis, evidence supporting the amounts and disclosures in the financial statements, assessing the accounting principles used and significant estimates made by management, and evaluating the overall financial statement presentation. Our audit of internal control over financial reporting included obtaining an understanding of internal control over financial reporting, assessing the risk that a material weakness exists, and testing and evaluating the design and operating effectiveness of internal control based on the assessed risk. Our audits also included performing such other procedures as we considered necessary in the circumstances. We believe that our audits provide a reasonable basis for our opinion.opinions.
As discussed in Note 17, Recent Pronouncements of the Financial Accounting Standards Board, and Note 5, ofEmployee Benefit Plans, in the Notes to the Consolidated Financial Statements, at December 31, 2006, the Company adopted SFASFASB Interpretation No. 48, “Accounting for Uncertainty in Income Taxes-an Interpretation of FASB Statement No. 109” and Statement of Financial Accounting Standard (SFAS) No. 158, “Employers’ Accounting for Defined Benefit Pension and Other Postretirement Plans, an amendment of FASB Statements No. 87, 88, 106 and 132 (R).”
Internal control over financial reporting
Also, in our opinion, management’s assessment, included in Management’s Report on Internal Control over Financial Reporting appearing under Item 9A, that the Company maintained, effective internal control over financial reporting as ofJanuary 1, 2007 and December 31, 2006, based on criteria established inInternal Control - Integrated Framework issued by the Committee of Sponsoring Organizations of the Treadway Commission (COSO), is fairly stated, in all material respects, based on those criteria. Furthermore, in our opinion, the Company maintained, in all material respects, effective internal control over financial reporting as of December 31, 2006, based on criteria established inInternal Control - Integrated Framework issued by the COSO. The Company’s management is responsible for maintaining effective internal control over financial reporting and for its assessment of the effectiveness of internal control over financial reporting. Our responsibility is to express opinions on management’s assessment and on the effectiveness of the Company’s internal control over financial reporting based on our audit. We conducted our audit of internal control over financial reporting in accordance with the standards of the Public Company Accounting Oversight Board (United States). Those standards require that we plan and perform the audit to obtain reasonable assurance about whether effective internal control over financial reporting was maintained in all material respects. An audit of internal control over financial reporting includes obtaining an understanding of internal control over financial reporting, evaluating management’s assessment, testing and evaluating the design and operating effectiveness of internal control, and performing such other procedures as we consider necessary in the circumstances. We believe that our audit provides a reasonable basis for our opinions.respectively.
A company’s internal control over financial reporting is a process designed to provide reasonable assurance regarding the reliability of financial reporting and the preparation of financial statements for external purposes in accordance with generally accepted accounting principles. A company’s internal control over financial reporting
includes those policies and procedures that (i) pertain to the maintenance of records that, in reasonable detail, accurately and fairly reflect the transactions and dispositions of the assets of the company; (ii) provide reasonable assurance that transactions are recorded as necessary to permit preparation of financial statements in accordance with generally accepted accounting principles, and that receipts and expenditures of the company are being made only in accordance with authorizations of management and directors of the company; and (iii) provide reasonable assurance regarding prevention or timely detection of unauthorized acquisition, use, or disposition of the company’s assets that could have a material effect on the financial statements.
Because of its inherent limitations, internal control over financial reporting may not prevent or detect misstatements. Also, projections of any evaluation of effectiveness to future periods are subject to the risk that controls may become inadequate because of changes in conditions, or that the degree of compliance with the policies or procedures may deteriorate.
/s/ PricewaterhouseCoopers LLP
Birmingham, Alabama
February 27, 200725, 2008
39
REPORT OF INDEPENDENT REGISTERED PUBLIC ACCOUNTING FIRM
To the Board of Directors and Shareholder of Alabama Gas Corporation:
In our opinion, the financial statements of Alabama Gas Corporation listed in the accompanying index present fairly, in all material respects, the financial position of Alabama Gas Corporation at December 31, 20062007 and 2005,2006, and the results of its operations and its cash flows for each of the three years in the period ended December 31, 20062007 in conformity with accounting principles generally accepted in the United States of America. In addition, in our opinion, the financial statement schedule listed in the accompanying index presents fairly, in all material respects, the information set forth therein when read in conjunction with the related financial statements. These financial statements and financial statement schedule are the responsibility of the Company’s management; our responsibility is to express an opinion on these financial statements and financial statement schedule based on our audits. We conducted our audits of these statements in accordance with the standards of the Public Company Accounting Oversight Board (United States). Those standards require that we plan and perform the audit to obtain reasonable assurance about whether the financial statements are free of material misstatement. An audit includes examining, on a test basis, evidence supporting the amounts and disclosures in the financial statements, assessing the accounting principles used and significant estimates made by management, and evaluating the overall financial statement presentation. We believe that our audits provide a reasonable basis for our opinion.
As discussed in Note 5, ofEmployee Benefit Plans, in the Notes to the Consolidated Financial Statements, at December 31, 2006, the Company adopted SFAS No. 158, “Employers’ Accounting for Defined Benefit Pension and Other Postretirement Plans, an amendment of FASB Statements No. 87, 88, 106 and 132 (R).”, effective December 31, 2006.
/s/ PricewaterhouseCoopers LLP
Birmingham, Alabama
February 27, 2007
40
CONSOLIDATED STATEMENTS OF INCOME
Energen Corporation
Years ended December 31, (in thousands, except share data) | 2006 | 2005 | 2004 | |||||||||
Operating Revenues | ||||||||||||
Oil and gas operations | $ | 730,542 | $ | 527,694 | $ | 410,117 | ||||||
Natural gas distribution | 663,444 | 600,700 | 526,740 | |||||||||
Total operating revenues | 1,393,986 | 1,128,394 | 936,857 | |||||||||
Operating Expenses | ||||||||||||
Cost of gas | 373,097 | 315,622 | 259,889 | |||||||||
Operations and maintenance | 302,157 | 268,727 | 234,150 | |||||||||
Depreciation, depletion and amortization | 142,086 | 131,691 | 120,777 | |||||||||
Taxes, other than income taxes | 95,727 | 93,983 | 74,933 | |||||||||
Accretion expense | 3,619 | 2,647 | 2,265 | |||||||||
Total operating expenses | 916,686 | 812,670 | 692,014 | |||||||||
Operating Income | 477,300 | 315,724 | 244,843 | |||||||||
Other Income (Expense) | ||||||||||||
Interest expense | (48,652 | ) | (46,800 | ) | (42,743 | ) | ||||||
Other income | 951 | 2,163 | 2,945 | |||||||||
Other expense | (1,046 | ) | (710 | ) | (2,215 | ) | ||||||
Total other expense | (48,747 | ) | (45,347 | ) | (42,013 | ) | ||||||
Income From Continuing Operations Before Income Taxes | 428,553 | 270,377 | 202,830 | |||||||||
Income tax expense | 155,030 | 97,491 | 75,525 | |||||||||
Income From Continuing Operations | 273,523 | 172,886 | 127,305 | |||||||||
Discontinued Operations, Net of Taxes | ||||||||||||
Income (loss) from discontinued operations | (6 | ) | (6 | ) | 163 | |||||||
Gain (loss) on disposal of discontinued operations | 53 | 132 | (5 | ) | ||||||||
Income From Discontinued Operations | 47 | 126 | 158 | |||||||||
Net Income | $ | 273,570 | $ | 173,012 | $ | 127,463 | ||||||
Diluted Earnings Per Average Common Share* | ||||||||||||
Continuing operations | $ | 3.73 | $ | 2.35 | $ | 1.74 | ||||||
Discontinued operations | — | — | — | |||||||||
Net Income | $ | 3.73 | $ | 2.35 | $ | 1.74 | ||||||
Basic Earnings Per Average Common Share* | ||||||||||||
Continuing operations | $ | 3.77 | $ | 2.37 | $ | 1.75 | ||||||
Discontinued operations | — | — | 0.01 | |||||||||
Net Income | $ | 3.77 | $ | 2.37 | $ | 1.76 | ||||||
Diluted Average Common Shares Outstanding* | 73,278,277 | 73,714,602 | 73,117,253 | |||||||||
Basic Average Common Shares Outstanding* | 72,504,897 | 73,051,903 | 72,546,512 | |||||||||
|
|
Years ended December 31, (in thousands, except share data) | 2007 | 2006 | 2005 | |||||||||
Operating Revenues | ||||||||||||
Oil and gas operations | $ | 825,592 | $ | 730,542 | $ | 527,694 | ||||||
Natural gas distribution | 609,468 | 663,444 | 600,700 | |||||||||
Total operating revenues | 1,435,060 | 1,393,986 | 1,128,394 | |||||||||
Operating Expenses | ||||||||||||
Cost of gas | 318,429 | 373,097 | 315,622 | |||||||||
Operations and maintenance | 333,443 | 302,157 | 268,727 | |||||||||
Depreciation, depletion and amortization | 161,377 | 142,086 | 131,691 | |||||||||
Taxes, other than income taxes | 95,831 | 95,727 | 93,983 | |||||||||
Accretion expense | 3,948 | 3,619 | 2,647 | |||||||||
Total operating expenses | 913,028 | 916,686 | 812,670 | |||||||||
Operating Income | 522,032 | 477,300 | 315,724 | |||||||||
Other Income (Expense) | ||||||||||||
Interest expense | (47,100 | ) | (48,652 | ) | (46,800 | ) | ||||||
Other income | 2,668 | 951 | 2,163 | |||||||||
Other expense | (959 | ) | (1,046 | ) | (710 | ) | ||||||
Total other expense | (45,391 | ) | (48,747 | ) | (45,347 | ) | ||||||
Income From Continuing Operations Before Income Taxes | 476,641 | 428,553 | 270,377 | |||||||||
Income tax expense | 167,429 | 155,030 | 97,491 | |||||||||
Income From Continuing Operations | 309,212 | 273,523 | 172,886 | |||||||||
Discontinued Operations, Net of Taxes | ||||||||||||
Income (loss) from discontinued operations | 3 | (6 | ) | (6 | ) | |||||||
Gain on disposal of discontinued operations | 18 | 53 | 132 | |||||||||
Income From Discontinued Operations | 21 | 47 | 126 | |||||||||
Net Income | $ | 309,233 | $ | 273,570 | $ | 173,012 | ||||||
Diluted Earnings Per Average Common Share | ||||||||||||
Continuing operations | $ | 4.28 | $ | 3.73 | $ | 2.35 | ||||||
Discontinued operations | - | - | - | |||||||||
Net Income | $ | 4.28 | $ | 3.73 | $ | 2.35 | ||||||
Basic Earnings Per Average Common Share | ||||||||||||
Continuing operations | $ | 4.32 | $ | 3.77 | $ | 2.37 | ||||||
Discontinued operations | - | - | - | |||||||||
Net Income | $ | 4.32 | $ | 3.77 | $ | 2.37 | ||||||
Diluted Average Common Shares Outstanding | 72,180,861 | 73,278,277 | 73,714,602 | |||||||||
Basic Average Common Shares Outstanding | 71,591,551 | 72,504,897 | 73,051,903 | |||||||||
The accompanying Notes to Financial Statements are an integral part of these statements.
Energen Corporation
December 31, 2006 | December 31, 2005 | December 31, | December 31, | |||||||||||
(in thousands) | 2007 | 2006 | ||||||||||||
ASSETS | ||||||||||||||
Current Assets | ||||||||||||||
Cash and cash equivalents | $ | 10,307 | $ | 8,714 | $ 8,687 | $ 10,307 | ||||||||
Accounts receivable, net of allowance for doubtful accounts of $13,961 and $11,573 | 329,766 | 285,765 | ||||||||||||
Accounts receivable, net of allowance for doubtful accounts of $12,244 and $13,961 at December 31, 2007 and 2006, respectively | 254,154 | 329,766 | ||||||||||||
Inventories, at average cost | ||||||||||||||
Storage gas inventory | 68,769 | 71,179 | 78,064 | 68,769 | ||||||||||
Materials and supplies | 9,281 | 7,926 | 13,711 | 9,281 | ||||||||||
Liquified natural gas in storage | 3,766 | 3,795 | 3,502 | 3,766 | ||||||||||
Regulatory asset | 35,479 | 6,633 | 10,232 | 35,479 | ||||||||||
Deferred income taxes | — | 72,113 | 54,166 | - | ||||||||||
Prepayments and other | 32,211 | 22,366 | 26,514 | 32,211 | ||||||||||
Total current assets | 489,579 | 478,491 | 449,030 | 489,579 | ||||||||||
Property, Plant and Equipment | ||||||||||||||
Oil and gas properties, successful efforts method | 2,163,065 | 1,930,291 | 2,530,049 | 2,163,065 | ||||||||||
Less accumulated depreciation, depletion and amortization | 559,059 | 466,643 | 664,290 | 559,059 | ||||||||||
Oil and gas properties, net | 1,604,006 | 1,463,648 | 1,865,759 | 1,604,006 | ||||||||||
Utility plant | 1,060,562 | 999,011 | 1,108,392 | 1,060,562 | ||||||||||
Less accumulated depreciation | 421,075 | 401,232 | 448,053 | 421,075 | ||||||||||
Utility plant, net | 639,487 | 597,779 | 660,339 | 639,487 | ||||||||||
Other property, net | 8,921 | 6,584 | 12,145 | 8,921 | ||||||||||
Total property, plant and equipment, net | 2,252,414 | 2,068,011 | 2,538,243 | 2,252,414 | ||||||||||
Other Assets | ||||||||||||||
Regulatory asset | 38,385 | 33,436 | 32,238 | 38,385 | ||||||||||
Prepaid pension costs and postretirement assets | 19,975 | — | 20,054 | 19,975 | ||||||||||
Deferred charges and other | 36,534 | 38,288 | 40,088 | 36,534 | ||||||||||
Total other assets | 94,894 | 71,724 | 92,380 | 94,894 | ||||||||||
TOTAL ASSETS | $ | 2,836,887 | $ | 2,618,226 | $ 3,079,653 | $ 2,836,887 | ||||||||
The accompanying Notes to Financial Statements are an integral part of these statements.
CONSOLIDATED BALANCE SHEETS
Energen Corporation
| December 31, | December 31, | |||||||||||||||||
(in thousands, except share data) | December 31, 2006 | December 31, 2005 | 2007 | 2006 | ||||||||||||||
LIABILITIES AND SHAREHOLDERS’ EQUITY | ||||||||||||||||||
Current Liabilities | ||||||||||||||||||
Long-term debt due within one year | $ | 100,000 | $ | 15,000 | $ 10,000 | $ 100,000 | ||||||||||||
Notes payable to banks | 58,000 | 153,000 | 134,000 | 58,000 | ||||||||||||||
Accounts payable | 194,448 | 306,618 | 259,836 | 194,448 | ||||||||||||||
Accrued taxes | 42,960 | 44,324 | 40,857 | 42,960 | ||||||||||||||
Customers’ deposits | 21,094 | 20,767 | 21,425 | 21,094 | ||||||||||||||
Amounts due customers | 14,382 | 6,181 | 20,534 | 14,382 | ||||||||||||||
Accrued wages and benefits | 24,548 | 33,634 | 25,410 | 24,548 | ||||||||||||||
Regulatory liability | 33,871 | 53,496 | 32,154 | 33,871 | ||||||||||||||
Deferred income taxes | 15,354 | — | - | 5,594 | ||||||||||||||
Other | 65,985 | 55,289 | 62,014 | 65,985 | ||||||||||||||
Total current liabilities | 570,642 | 688,309 | 606,230 | 560,882 | ||||||||||||||
Long-term debt | 582,490 | 683,236 | 562,365 | 582,490 | ||||||||||||||
Deferred Credits and Other Liabilities | ||||||||||||||||||
Asset retirement obligation | 53,980 | 50,270 | 60,571 | 53,980 | ||||||||||||||
Pension liabilities | 32,504 | 15,739 | 31,985 | 32,504 | ||||||||||||||
Regulatory liability | 135,466 | 119,808 | 141,123 | 135,466 | ||||||||||||||
Deferred income taxes | 241,146 | 148,040 | 238,706 | 250,906 | ||||||||||||||
Other | 18,590 | 20,146 | 60,015 | 18,590 | ||||||||||||||
Total deferred credits and other liabilities | 481,686 | 354,003 | 532,400 | 491,446 | ||||||||||||||
Commitments and Contingencies | ||||||||||||||||||
Shareholders’ Equity | ||||||||||||||||||
Preferred stock, cumulative, $0.01 par value, 5,000,000 shares authorized | — | — | ||||||||||||||||
Shareholders’ Equity Preferred stock, cumulative, $0.01 par value, 5,000,000 shares authorized | - | - | ||||||||||||||||
Common shareholders’ equity | ||||||||||||||||||
Common stock, $0.01 par value; 150,000,000 shares authorized, | 737 | 735 | ||||||||||||||||
Common stock, $0.01 par value; 150,000,000 shares authorized, 74,190,786 shares issued at December 31, 2007 and 73,699,244 shares issued at December 31, 2006 | 742 | 737 | ||||||||||||||||
Premium on capital stock | 412,989 | 394,861 | 434,999 | 412,989 | ||||||||||||||
Capital surplus | 2,802 | 2,802 | 2,802 | 2,802 | ||||||||||||||
Retained earnings | 844,880 | 603,314 | 1,119,816 | 844,880 | ||||||||||||||
Accumulated other comprehensive loss, net of tax | ||||||||||||||||||
Accumulated other comprehensive gain (loss), net of tax | ||||||||||||||||||
Unrealized gain (loss) on hedges | 50,555 | (92,112 | ) | (65,057 | ) | 50,555 | ||||||||||||
Pension and postretirement plans, net of tax | (23,177 | ) | (13,707 | ) | (21,167 | ) | (23,177 | ) | ||||||||||
Deferred compensation on restricted stock | — | (2,123 | ) | |||||||||||||||
Deferred compensation plan | 13,956 | 11,907 | 16,121 | 13,956 | ||||||||||||||
Treasury stock, at cost; 3,253,337 shares and 1,066,935 shares at December 31, 2006 and 2005, respectively | (100,673 | ) | (12,999 | ) | ||||||||||||||
Treasury stock, at cost; 3,374,336 shares and 3,253,337 shares at December 31, 2007 and 2006, respectively | (109,598 | ) | (100,673 | ) | ||||||||||||||
Total shareholders’ equity | 1,202,069 | 892,678 | 1,378,658 | 1,202,069 | ||||||||||||||
TOTAL LIABILITIES AND SHAREHOLDERS’ EQUITY | $ | 2,836,887 | $ | 2,618,226 | $ 3,079,653 | $ 2,836,887 | ||||||||||||
The accompanying Notes to Financial Statements are an integral part of these statements.
CONSOLIDATED STATEMENTS OF SHAREHOLDERS’ EQUITY
Energen Corporation
(in thousands, except share data) |
Common Stock | Premium on | Capital | Retained | Accumulated Other Comprehensive Income (Loss) | Deferred | Deferred | Treasury | Total | |||||||||||||||||||||||||||
| Number of Shares | Par Value | |||||||||||||||||||||||||||||||||||
BALANCE DECEMBER 31, 2003 | 72,447,062 | $ | 724 | $ | 367,769 | $ | 2,802 | $ | 359,635 | $ | (30,595 | ) | $ | (1,258 | ) | $ | 17,063 | $ | (17,108 | ) | $ | 699,032 | ||||||||||||||
Net income | 127,463 | 127,463 | ||||||||||||||||||||||||||||||||||
Other comprehensive income (loss): | ||||||||||||||||||||||||||||||||||||
Current period change in fair value | (56,430 | ) | (56,430 | ) | ||||||||||||||||||||||||||||||||
Reclassification adjustment, net of | 52,678 | 52,678 | ||||||||||||||||||||||||||||||||||
Minimum pension liability, net of | (2,983 | ) | (2,983 | ) | ||||||||||||||||||||||||||||||||
Comprehensive income | 120,728 | |||||||||||||||||||||||||||||||||||
Purchase of treasury shares | (836 | ) | (836 | ) | ||||||||||||||||||||||||||||||||
Shares issued for: | ||||||||||||||||||||||||||||||||||||
Dividend reinvestment plan | 2,550 | — | 53 | 53 | ||||||||||||||||||||||||||||||||
Employee benefit plans | 716,346 | 8 | 9,112 | 427 | 9,547 | |||||||||||||||||||||||||||||||
Deferred compensation obligation | 11,856 | (11,856 | ) | — | ||||||||||||||||||||||||||||||||
Issuance of restricted stock | (2,807 | ) | (2,807 | ) | ||||||||||||||||||||||||||||||||
Amortization of restricted stock | 1,390 | 1,390 | ||||||||||||||||||||||||||||||||||
Stock based compensation | 465 | 465 | ||||||||||||||||||||||||||||||||||
Tax benefit from employee stock plans | 1,275 | 1,275 | ||||||||||||||||||||||||||||||||||
Long-range performance plan | 2,291 | 2,291 | ||||||||||||||||||||||||||||||||||
Cash dividends - $0.3775 per share | (27,472 | ) | (27,472 | ) | ||||||||||||||||||||||||||||||||
BALANCE DECEMBER 31, 2004 | 73,165,958 | 732 | 380,965 | 2,802 | 459,626 | (37,330 | ) | (2,675 | ) | 28,919 | (29,373 | ) | 803,666 | |||||||||||||||||||||||
Net income | 173,012 | 173,012 | ||||||||||||||||||||||||||||||||||
Other comprehensive income (loss): | ||||||||||||||||||||||||||||||||||||
Current period change in fair value | (163,947 | ) | (163,947 | ) | ||||||||||||||||||||||||||||||||
Reclassification adjustment, net of | 97,301 | 97,301 | ||||||||||||||||||||||||||||||||||
Minimum pension liability, net of | (1,843 | ) | (1,843 | ) | ||||||||||||||||||||||||||||||||
Comprehensive income | 104,523 | |||||||||||||||||||||||||||||||||||
Purchase of treasury shares | (2,459 | ) | (2,459 | ) | ||||||||||||||||||||||||||||||||
Shares issued for: | ||||||||||||||||||||||||||||||||||||
Employee benefit plans | 327,379 | 3 | 8,958 | 1,821 | 10,782 | |||||||||||||||||||||||||||||||
Deferred compensation obligation | (17,012 | ) | 17,012 | — | ||||||||||||||||||||||||||||||||
Issuance of restricted stock | (1,249 | ) | (1,249 | ) | ||||||||||||||||||||||||||||||||
Amortization of restricted stock | 1,801 | 1,801 | ||||||||||||||||||||||||||||||||||
Stock based compensation | 465 | 465 | ||||||||||||||||||||||||||||||||||
Tax benefit from employee stock plans | 2,487 | 2,487 | ||||||||||||||||||||||||||||||||||
Long-range performance plan | 1,986 | 1,986 | ||||||||||||||||||||||||||||||||||
Cash dividends - $0.40 per share | (29,324 | ) | (29,324 | ) | ||||||||||||||||||||||||||||||||
BALANCE DECEMBER 31, 2005 | 73,493,337 | 735 | 394,861 | 2,802 | 603,314 | (105,819 | ) | (2,123 | ) | 11,907 | $ | (12,999 | ) | 892,678 | ||||||||||||||||||||||
Net income | 273,570 | 273,570 | ||||||||||||||||||||||||||||||||||
Other comprehensive income (loss): | ||||||||||||||||||||||||||||||||||||
Current period change in fair value | 130,244 | 130,244 | ||||||||||||||||||||||||||||||||||
Reclassification adjustment, net of | 12,423 | 12,423 | ||||||||||||||||||||||||||||||||||
Minimum pension liability, net of | 5,686 | 5,686 | ||||||||||||||||||||||||||||||||||
Comprehensive income | 421,923 | |||||||||||||||||||||||||||||||||||
Adjustment to initially apply SFAS No. 158, net of tax of ($8,161) | (15,156 | ) | (15,156 | ) | ||||||||||||||||||||||||||||||||
Purchase of treasury shares | (87,566 | ) | (87,566 | ) | ||||||||||||||||||||||||||||||||
Shares issued for: | ||||||||||||||||||||||||||||||||||||
Employee benefit plans | 205,907 | 2 | 1,444 | 1,941 | 3,387 | |||||||||||||||||||||||||||||||
Deferred compensation obligation | 2,049 | (2,049 | ) | — | ||||||||||||||||||||||||||||||||
Reclassification of restricted stock awards | (2,123 | ) | 2,123 | — | ||||||||||||||||||||||||||||||||
Amortization of restricted stock | 2,252 | 2,252 | ||||||||||||||||||||||||||||||||||
Stock based compensation | 196 | 196 | ||||||||||||||||||||||||||||||||||
Tax benefit from employee stock plans | 1,980 | 1,980 | ||||||||||||||||||||||||||||||||||
Long-range performance plan | 14,501 | 14,501 | ||||||||||||||||||||||||||||||||||
Estimated forfeitures on stock based awards | (122 | ) | (122 | ) | ||||||||||||||||||||||||||||||||
Cash dividends - $0.44 per share | (32,004 | ) | (32,004 | ) | ||||||||||||||||||||||||||||||||
BALANCE DECEMBER 31, 2006 | 73,699,244 | $ | 737 | $ | 412,989 | $ | 2,802 | $ | 844,880 | $ | 27,378 | $ | — | $ | 13,956 | $ | (100,673 | ) | $ | 1,202,069 | ||||||||||||||||
|
Share and per share data have been restated to reflect a 2-for-1 stock split effective June 1, 2005. | ||||||||||||||||||||||||||||||||||||||||||||||||||||||||||||||||||||||||||||||||||||||||||||||||||||||||||||||||||||||||||||||||||||||||||||||||||||||||||||||||||||||||||||||||||||||||||||||||||||||||||||||||||||||||||||||||||||||||||||||||||||||||||||||||||||||||||||||||||||||||||||||||||||||||||||||||||||||||||||||||||||||||||||||||||||||||||||||||||||||||||||||||||||||||||||||||||||||||||||||||||||||||||||||||||||||||||||||||||||||||||||||||||||||||||||||||||||||||||||||||||||||||||||||||||||||||||||||||||||||||||||||||||||||||||||||||||||||||||||||||||||||||||||||||||||||||||||||||||||||||||||||||||||||||||||||||||||||||||||||||||||||||||||||||||||||||||||||||||||||||||||||||||||||||||||||||||||||||||||||||||||||||||||||||||||||||||||||||||||||||||||||||||||||||||||||||||||||||||||||||||||||||||||||||||||||||||||||||||||||||||||||||||||||||||||||||||||||||||||||||||||||||||||||||||||||||||||||||||||||||||||||||||||||||||||||||||||||||||||||||||||||||||||||||||||||||||||||||||||||
The accompanying Notes to Financial Statements are an integral part of these statements.
CONSOLIDATED STATEMENTS OF CASH FLOWS
Energen Corporation
Years ended December 31, (in thousands) | 2006 | 2005 | 2004 | 2007 | 2006 | 2005 | ||||||||||||||||||||||||
Operating Activities | ||||||||||||||||||||||||||||||
Net income | $ | 273,570 | $ | 173,012 | $ | 127,463 | $ | 309,233 | $ | 273,570 | $ | 173,012 | ||||||||||||||||||
Adjustments to reconcile net income to net cash provided by operating activities: | ||||||||||||||||||||||||||||||
Depreciation, depletion and amortization | 142,086 | 131,719 | 120,960 | 161,377 | 142,086 | 131,719 | ||||||||||||||||||||||||
Deferred income taxes | 98,209 | 58,608 | 67,423 | 1,162 | 98,209 | 58,608 | ||||||||||||||||||||||||
Deferred investment tax credits | — | — | (308 | ) | ||||||||||||||||||||||||||
Change in derivative fair value | (2,043 | ) | 2,328 | 212 | (970 | ) | (2,043 | ) | 2,328 | |||||||||||||||||||||
Gain on sale of assets | (55,916 | ) | (1,928 | ) | (135 | ) | (506 | ) | (55,916 | ) | (1,928 | ) | ||||||||||||||||||
Other, net | 4,255 | (5,912 | ) | (11,908 | ) | 20,035 | 4,255 | (5,912 | ) | |||||||||||||||||||||
Net change in: | ||||||||||||||||||||||||||||||
Accounts receivable, net | 9,249 | (70,944 | ) | (39,645 | ) | 71,810 | 9,249 | (70,944 | ) | |||||||||||||||||||||
Inventories | 1,084 | (20,276 | ) | (10,818 | ) | (13,461 | ) | 1,084 | (20,276 | ) | ||||||||||||||||||||
Accounts payable | 64,178 | 39,330 | 19,536 | (74,927 | ) | 64,178 | 39,330 | |||||||||||||||||||||||
Amounts due customers | (38,940 | ) | 12,890 | (1,166 | ) | 21,247 | (38,940 | ) | 12,890 | |||||||||||||||||||||
Other current assets and liabilities | (12,812 | ) | 16,297 | 19,518 | (10,833 | ) | (12,812 | ) | 16,297 | |||||||||||||||||||||
Net cash provided by operating activities | 482,920 | 335,124 | 291,132 | 484,167 | 482,920 | 335,124 | ||||||||||||||||||||||||
Investing Activities | ||||||||||||||||||||||||||||||
Additions to property, plant and equipment | (302,177 | ) | (230,715 | ) | (177,705 | ) | (373,857 | ) | (302,177 | ) | (230,715 | ) | ||||||||||||||||||
Acquisitions, net of cash acquired | (27,814 | ) | (179,268 | ) | (274,400 | ) | (56,323 | ) | (27,814 | ) | (179,268 | ) | ||||||||||||||||||
Proceeds from sale of assets | 75,429 | 10,832 | 461 | 1,295 | 75,429 | 10,832 | ||||||||||||||||||||||||
Other, net | (2,337 | ) | (1,573 | ) | (1,770 | ) | (2,994 | ) | (2,337 | ) | (1,573 | ) | ||||||||||||||||||
Net cash used in investing activities | (256,899 | ) | (400,724 | ) | (453,414 | ) | (431,879 | ) | (256,899 | ) | (400,724 | ) | ||||||||||||||||||
Financing Activities | ||||||||||||||||||||||||||||||
Payment of dividends on common stock | (32,004 | ) | (29,324 | ) | (27,472 | ) | (33,116 | ) | (32,004 | ) | (29,324 | ) | ||||||||||||||||||
Issuance of common stock | 833 | 10,782 | 9,600 | 2,051 | 833 | 10,782 | ||||||||||||||||||||||||
Purchase of treasury stock | (84,339 | ) | (2,459 | ) | (836 | ) | - | (84,339 | ) | (2,459 | ) | |||||||||||||||||||
Reduction of long-term debt | (15,898 | ) | (84,796 | ) | (40,083 | ) | (155,289 | ) | (15,898 | ) | (84,796 | ) | ||||||||||||||||||
Proceeds from issuance of long-term debt | — | 160,000 | 100,000 | 45,000 | - | 160,000 | ||||||||||||||||||||||||
Debt issuance costs | — | (2,378 | ) | (565 | ) | (494 | ) | - | (2,378 | ) | ||||||||||||||||||||
Net change in short-term debt | (95,000 | ) | 18,000 | 124,000 | 76,000 | (95,000 | ) | 18,000 | ||||||||||||||||||||||
Tax benefit on stock compensation | 10,937 | 1,980 | - | |||||||||||||||||||||||||||
Other | 1,980 | — | — | 1,003 | - | - | ||||||||||||||||||||||||
Net cash provided by (used in) financing activities | (224,428 | ) | 69,825 | 164,644 | (53,908 | ) | (224,428 | ) | 69,825 | |||||||||||||||||||||
Net change in cash and cash equivalents | 1,593 | 4,225 | 2,362 | (1,620 | ) | 1,593 | 4,225 | |||||||||||||||||||||||
Cash and cash equivalents at beginning of period | 8,714 | 4,489 | 2,127 | 10,307 | 8,714 | 4,489 | ||||||||||||||||||||||||
Cash and cash equivalents at end of period | $ | 10,307 | $ | 8,714 | $ | 4,489 | $ | 8,687 | $ | 10,307 | $ | 8,714 | ||||||||||||||||||
The accompanying Notes to Financial Statements are an integral part of these statements.
Alabama Gas Corporation
Years ended December 31, (in thousands) | 2006 | 2005 | 2004 | 2007 | 2006 | 2005 | ||||||||||||||||||
Operating Revenues | $ | 663,444 | $ | 600,700 | $ | 526,740 | $ | 609,468 | $ | 663,444 | $ | 600,700 | ||||||||||||
Operating Expenses | ||||||||||||||||||||||||
Cost of gas | 373,097 | 318,269 | 261,800 | 318,429 | 373,097 | 318,269 | ||||||||||||||||||
Operations and maintenance | 126,948 | 126,041 | 121,896 | 129,351 | 126,948 | 126,041 | ||||||||||||||||||
Depreciation | 44,244 | 42,351 | 39,881 | 47,136 | 44,244 | 42,351 | ||||||||||||||||||
Income taxes | ||||||||||||||||||||||||
Current | 19,745 | 20,556 | 9,690 | 15,415 | 19,745 | 20,556 | ||||||||||||||||||
Deferred | 2,257 | 1,804 | 10,321 | 6,221 | 2,257 | 1,804 | ||||||||||||||||||
Deferred investment tax credits | — | — | (308 | ) | ||||||||||||||||||||
Taxes, other than income taxes | 44,881 | 41,117 | 36,964 | 41,810 | 44,881 | 41,117 | ||||||||||||||||||
Total operating expenses | 611,172 | 550,138 | 480,244 | 558,362 | 611,172 | 550,138 | ||||||||||||||||||
Operating Income | 52,272 | 50,562 | 46,496 | 51,106 | 52,272 | 50,562 | ||||||||||||||||||
Other Income (Expense) | ||||||||||||||||||||||||
Allowance for funds used during construction | 951 | 792 | 1,247 | 611 | 951 | 792 | ||||||||||||||||||
Other income | 1,490 | 1,371 | 1,979 | 1,665 | 1,490 | 1,371 | ||||||||||||||||||
Other expense | (961 | ) | (701 | ) | (2,195 | ) | (868 | ) | (961 | ) | (701 | ) | ||||||||||||
Total other income | 1,480 | 1,462 | 1,031 | 1,408 | 1,480 | 1,462 | ||||||||||||||||||
Interest Charges | ||||||||||||||||||||||||
Interest on long-term debt | 12,836 | 13,752 | 10,672 | 11,956 | 12,836 | 13,752 | ||||||||||||||||||
Other interest charges | 3,618 | 1,308 | 3,065 | 3,740 | 3,618 | 1,308 | ||||||||||||||||||
Total interest charges | 16,454 | 15,060 | 13,737 | 15,696 | 16,454 | 15,060 | ||||||||||||||||||
Net Income | $ | 37,298 | $ | 36,964 | $ | 33,790 | $ | 36,818 | $ | 37,298 | $ | 36,964 | ||||||||||||
The accompanying Notes to Financial Statements are an integral part of these statements.
Alabama Gas Corporation
| December 31, | December 31, | |||||||||||||
(in thousands) | December 31, 2006 | December 31, 2005 | 2007 | 2006 | ||||||||||
ASSETS | ||||||||||||||
Property, Plant and Equipment | ||||||||||||||
Utility plant | $ | 1,060,562 | $ | 999,011 | $ 1,108,392 | $ 1,060,562 | ||||||||
Less accumulated depreciation | 421,075 | 401,232 | 448,053 | 421,075 | ||||||||||
Utility plant, net | 639,487 | 597,779 | 660,339 | 639,487 | ||||||||||
Other property, net | 163 | 169 | 157 | 163 | ||||||||||
Current Assets | ||||||||||||||
Cash | 8,765 | 7,169 | 7,335 | 8,765 | ||||||||||
Accounts receivable | ||||||||||||||
Gas | 159,101 | 194,447 | 139,761 | 159,101 | ||||||||||
Other | 10,708 | 7,524 | 6,336 | 10,708 | ||||||||||
Affiliated companies | — | 3,215 | ||||||||||||
Allowance for doubtful accounts | (13,200 | ) | (10,800 | ) | (11,500 | ) | (13,200 | ) | ||||||
Inventories, at average cost | ||||||||||||||
Storage gas inventory | 68,769 | 71,179 | 78,064 | 68,769 | ||||||||||
Materials and supplies | 4,199 | 4,144 | 3,866 | 4,199 | ||||||||||
Liquified natural gas in storage | 3,766 | 3,795 | 3,502 | 3,766 | ||||||||||
Regulatory asset | 35,479 | 6,633 | 10,232 | 35,479 | ||||||||||
Deferred income taxes | 13,251 | 13,284 | 25,179 | 25,222 | ||||||||||
Prepayments and other | 3,557 | 11,203 | 2,247 | 3,557 | ||||||||||
Total current assets | 294,395 | 311,793 | 265,022 | 306,366 | ||||||||||
Other Assets | ||||||||||||||
Regulatory asset | 38,385 | 33,436 | 32,238 | 38,385 | ||||||||||
Prepaid pension costs and postretirement assets | 15,369 | — | 15,831 | 15,369 | ||||||||||
Deferred charges and other | 6,326 | 6,857 | 7,226 | 6,326 | ||||||||||
Total other assets | 60,080 | 40,293 | 55,295 | 60,080 | ||||||||||
TOTAL ASSETS | $ | 994,125 | $ | 950,034 | $ 980,813 | $ 1,006,096 | ||||||||
The accompanying Notes to Financial Statements are an integral part of these statements.
BALANCE SHEETS
Alabama Gas Corporation
| December 31, | December 31, | |||||||||
(in thousands, except share data) | December 31, 2006 | December 31, 2005 | 2007 | 2006 | ||||||
LIABILITIES AND CAPITALIZATION | ||||||||||
Capitalization | ||||||||||
Preferred stock, cumulative, $0.01 par value, 120,000 shares authorized | $ | — | $ | — | $ - | $ - | ||||
Common shareholder’s equity | ||||||||||
Common stock, $0.01 par value; 3,000,000 shares authorized, 1,972,052 shares issued at December 31, 2006 and 2005, respectively | 20 | 20 | ||||||||
Common stock, $0.01 par value; 3,000,000 shares authorized, 1,972,052 shares issued at December 31, 2007 and 2006, respectively | 20 | 20 | ||||||||
Premium on capital stock | 31,682 | 31,682 | 31,682 | 31,682 | ||||||
Capital surplus | 2,802 | 2,802 | 2,802 | 2,802 | ||||||
Retained earnings | 250,560 | 236,957 | 261,979 | 250,560 | ||||||
Total common shareholder’s equity | 285,064 | 271,461 | 296,483 | 285,064 | ||||||
Long-term debt | 208,756 | 209,654 | 208,467 | 208,756 | ||||||
Total capitalization | 493,820 | 481,115 | 504,950 | 493,820 | ||||||
Current Liabilities | ||||||||||
Long-term debt due within one year | — | 5,000 | ||||||||
Notes payable to banks | 58,000 | 55,000 | 62,000 | 58,000 | ||||||
Accounts payable | 118,936 | 112,443 | 80,067 | 118,936 | ||||||
Affiliated companies | 18,130 | — | 4,934 | 18,130 | ||||||
Accrued taxes | 37,813 | 32,770 | 30,858 | 37,813 | ||||||
Customers’ deposits | 21,094 | 20,767 | 21,425 | 21,094 | ||||||
Amounts due customers | 14,382 | 6,181 | 20,534 | 14,382 | ||||||
Accrued wages and benefits | 9,714 | 11,449 | 10,062 | 9,714 | ||||||
Regulatory liability | 33,871 | 53,496 | 32,154 | 33,871 | ||||||
Other | 8,225 | 8,694 | 10,417 | 8,225 | ||||||
Total current liabilities | 320,165 | 305,800 | 272,451 | 320,165 | ||||||
Deferred Credits and Other Liabilities | ||||||||||
Deferred income taxes | 42,195 | 39,949 | 59,790 | 54,166 | ||||||
Regulatory liability | 135,466 | 119,808 | 141,123 | 135,466 | ||||||
Customer advances for construction and other | 2,479 | 3,362 | 2,499 | 2,479 | ||||||
Total deferred credits and other liabilities | 180,140 | 163,119 | 203,412 | 192,111 | ||||||
Commitments and Contingencies | ||||||||||
TOTAL LIABILITIES AND CAPITALIZATION | $ | 994,125 | $ | 950,034 | $ 980,813 | $ 1,006,096 | ||||
The accompanying Notes to Financial Statements are an integral part of these statements.
STATEMENTS OF SHAREHOLDER’S EQUITY
Alabama Gas Corporation
| Common Stock | Premium on Capital Stock | Capital Surplus | Retained Earnings | Total Shareholder’s | ||||||||||||||||||||||||||||||||||
(in thousands, except share data) | Number of Shares | Par Value | ||||||||||||||||||||||||||||||||||||
Balance December 31, 2003 | 1,972,052 | $ | 20 | $ | 31,682 | $ | 2,802 | $ | 215,869 | $ | 250,373 | |||||||||||||||||||||||||||
Net income | 33,790 | 33,790 | ||||||||||||||||||||||||||||||||||||
Cash dividends | (26,144 | ) | (26,144 | ) | ||||||||||||||||||||||||||||||||||
| Common Stock | | Total Shareholder’s | | |||||||||||||||||||||||||||||||||||
| Number of Shares |
| Par Value |
| Premium on Capital Stock |
| Capital Surplus |
| Retained Earnings |
| |||||||||||||||||||||||||||||
Balance December 31, 2004 | 1,972,052 | 20 | 31,682 | 2,802 | 223,515 | 258,019 | 1,972,052 | $ | 20 | $ | 31,682 | $ | 2,802 | $ | 223,515 | $ | 258,019 | |||||||||||||||||||||
Net income | 36,964 | 36,964 | 36,964 | 36,964 | ||||||||||||||||||||||||||||||||||
Cash dividends | (23,522 | ) | (23,522 | ) | (23,522 | ) | (23,522 | ) | ||||||||||||||||||||||||||||||
Balance December 31, 2005 | 1,972,052 | 20 | 31,682 | 2,802 | 236,957 | 271,461 | 1,972,052 | 20 | 31,682 | 2,802 | 236,957 | 271,461 | ||||||||||||||||||||||||||
Net income | 37,298 | 37,298 | 37,298 | 37,298 | ||||||||||||||||||||||||||||||||||
Cash dividends | (23,695 | ) | (23,695 | ) | (23,695 | ) | (23,695 | ) | ||||||||||||||||||||||||||||||
Balance December 31, 2006 | 1,972,052 | $ | 20 | $ | 31,682 | $ | 2,802 | $ | 250,560 | $ | 285,064 | 1,972,052 | 20 | 31,682 | 2,802 | 250,560 | 285,064 | |||||||||||||||||||||
Net income | 36,818 | 36,818 | ||||||||||||||||||||||||||||||||||||
Cash dividends | (25,399 | ) | (25,399 | ) | ||||||||||||||||||||||||||||||||||
Balance December 31, 2007 | 1,972,052 | $ | 20 | $ | 31,682 | $ | 2,802 | $ | 261,979 | $ | 296,483 | |||||||||||||||||||||||||||
The accompanying Notes to Financial Statements are an integral part of these statements.
Alabama Gas Corporation
Years ended December 31, (in thousands) | 2006 | 2005 | 2004 | 2007 | 2006 | 2005 | ||||||||||||||||||
Operating Activities | ||||||||||||||||||||||||
Net income | $ | 37,298 | $ | 36,964 | $ | 33,790 | $ | 36,818 | $ | 37,298 | $ | 36,964 | ||||||||||||
Adjustments to reconcile net income to net cash provided by operating activities: | ||||||||||||||||||||||||
Depreciation and amortization | 44,244 | 42,351 | 39,881 | 47,136 | 44,244 | 42,351 | ||||||||||||||||||
Deferred income taxes | 2,257 | 1,804 | 10,321 | 6,221 | 2,257 | 1,804 | ||||||||||||||||||
Deferred investment tax credits | — | — | (308 | ) | ||||||||||||||||||||
Other, net | (5,019 | ) | (3,025 | ) | (8,968 | ) | 3,036 | (5,019 | ) | (3,025 | ) | |||||||||||||
Net change in: | ||||||||||||||||||||||||
Accounts receivable, net | 37,260 | (48,623 | ) | (12,784 | ) | 19,501 | 37,260 | (48,623 | ) | |||||||||||||||
Inventories | 2,384 | (20,056 | ) | (9,406 | ) | (8,698 | ) | 2,384 | (20,056 | ) | ||||||||||||||
Accounts payable | 1,240 | 24,560 | 25,823 | (27,702 | ) | 1,240 | 24,560 | |||||||||||||||||
Amounts due customers | (38,940 | ) | 12,890 | (1,166 | ) | 21,247 | (38,940 | ) | 12,890 | |||||||||||||||
Other current assets and liabilities | 3,190 | 9,371 | 8,128 | (4,000 | ) | 3,190 | 9,371 | |||||||||||||||||
Net cash provided by operating activities | 83,914 | 56,236 | 85,311 | 93,559 | 83,914 | 56,236 | ||||||||||||||||||
Investing Activities | ||||||||||||||||||||||||
Additions to property, plant and equipment | (75,107 | ) | (72,388 | ) | (56,922 | ) | (58,154 | ) | (75,107 | ) | (72,388 | ) | ||||||||||||
Net advances from (to) parent company | 3,215 | (1,025 | ) | (39,480 | ) | - | 3,215 | (1,025 | ) | |||||||||||||||
Other, net | (1,963 | ) | (1,551 | ) | (1,655 | ) | (2,460 | ) | (1,963 | ) | (1,551 | ) | ||||||||||||
Net cash used in investing activities | (73,855 | ) | (74,964 | ) | (98,057 | ) | (60,614 | ) | (73,855 | ) | (74,964 | ) | ||||||||||||
Financing Activities | ||||||||||||||||||||||||
Payment of dividends on common stock | (23,695 | ) | (23,522 | ) | (26,144 | ) | (25,399 | ) | (23,695 | ) | (23,522 | ) | ||||||||||||
Reduction of long-term debt | (5,898 | ) | (84,796 | ) | (30,083 | ) | (45,289 | ) | (5,898 | ) | (84,796 | ) | ||||||||||||
Proceeds from issuance of long-term debt | — | 160,000 | — | 45,000 | - | 160,000 | ||||||||||||||||||
Debt issuance costs | — | (2,252 | ) | — | (494 | ) | - | (2,252 | ) | |||||||||||||||
Net advances from parent company | 18,130 | — | — | (13,196 | ) | 18,130 | - | |||||||||||||||||
Net change in short-term debt | 3,000 | (27,000 | ) | 71,000 | 4,000 | 3,000 | (27,000 | ) | ||||||||||||||||
Other | 1,003 | - | - | |||||||||||||||||||||
Net cash provided (used) by financing activities | (8,463 | ) | 22,430 | 14,773 | (34,375 | ) | (8,463 | ) | 22,430 | |||||||||||||||
Net change in cash and cash equivalents | 1,596 | 3,702 | 2,027 | (1,430 | ) | 1,596 | 3,702 | |||||||||||||||||
Cash and cash equivalents at beginning of period | 7,169 | 3,467 | 1,440 | 8,765 | 7,169 | 3,467 | ||||||||||||||||||
Cash and cash equivalents at end of period | $ | 8,765 | $ | 7,169 | $ | 3,467 | $ | 7,335 | $ | 8,765 | $ | 7,169 | ||||||||||||
The accompanying Notes to Financial Statements are an integral part of these statements.
1. SUMMARY OF SIGNIFICANT ACCOUNTING POLICIES
Energen Corporation (Energen or the Company) is a diversified energy holding company engaged primarily in the development, acquisition, exploration and production of oil and gas in the continental United States (oil and gas operations) and in the purchase, distribution, and sale of natural gas principally in central and north Alabama (natural gas distribution). The following is a description of the Company’s significant accounting policies and practices.
A. Principles of Consolidation
The accompanying consolidated financial statements include the accounts of the Company and its subsidiaries, principally Energen Resources Corporation and Alabama Gas Corporation (Alagasco), after elimination of all significant intercompany transactions in consolidation. Certain reclassifications have been made to conform the prior years’ financial statements to the current-year presentation.
B. Oil and Gas Operations
Property and Related Depletion: Energen Resources follows the successful efforts method of accounting for costs incurred in the exploration and development of oil, gas and natural gas liquid reserves. Lease acquisition costs are capitalized initially, and unproved properties are reviewed periodically to determine if there has been impairment of the carrying value, with any such impairment charged to exploration expense currently. All development costs are capitalized. Exploratory drilling costs are capitalized pending determination of proved reserves. If proved reserves are not discovered, the exploratory drilling costs are expensed. Other exploration costs, including geological and geophysical costs, are expensed as incurred. Depreciation, depletion and amortization expense is determined on a field-by-field basis using the units-of-production method based on proved reserves. Anticipated abandonment and restoration costs are capitalized and depreciated using the units-of-production method based on proved developed reserves. Gains and losses in the sale of certain oil and gas properties and any impairments of properties held-for-sale are reported as discontinued operations, with income or loss from operations of the associated properties reported as income or loss from discontinued operations. The results of operations for held-for-sale properties are reclassified and reported as discontinued operations for current and prior periods.
Operating Revenue: Energen Resources utilizes the sales method of accounting to recognize oil, gas and natural gas liquids production revenue. Under the sales method, revenues are based on actual sales volumes of commodities sold to purchasers. Over-production liabilities are established only when it is estimated that a property’s over-produced volumes exceed the net share of remaining reserves for such property. Energen Resources had no material production imbalances at December 31, 20062007 and 2005.2006.
Derivative Commodity Instruments: Energen Resources periodically enters into derivative commodity instruments to hedge its price exposure to its estimated oil, natural gas and natural gas liquids production. Such instruments may include regulated natural gas and crude oil futures contracts traded on the New York Mercantile Exchange (NYMEX) and over-the-counter swaps, collars and basis hedges with major energy derivative product specialists. The counterparties to the commodity instruments are investment banks and energy-trading firms. In some contracts, the amount of credit allowed before Energen Resources must post collateral for out-of-the-money hedges varies depending on the credit rating of the Company. In cases where these arrangements exist, the credit ratings must be maintained at investment grade status to have any available counterparty credit. Adverse changes to the Company’s credit rating results in decreasing amounts of credit available under these contracts. The counterparties for these contracts do not extend credit to the Company in the event credit ratings are below investment grade.
Energen Resources applies Statement of Financial Accounting Standard (SFAS) No. 133, “Accounting for Derivative Instruments and Hedging Activities,” as amended which requires all derivatives be recognized on the balance sheet and measured at fair value. If a derivative is designated as a cash flow hedge, the effectiveness of the hedge, or the degree that the gain (loss) for the hedging instrument offsets the loss (gain) on the hedged item is measured at each reporting period. The effective portion of the gain or loss on the derivative instrument is
51
recognized in other comprehensive income as a component of shareholders’ equity and subsequently reclassified to operating revenues when the forecasted transaction affects earnings. The ineffective portion of a derivative’s change in fair value is recognized in operating revenues immediately. Derivatives that do not qualify for hedge treatment under SFAS No. 133 are recorded at fair value with gains or losses recognized in operating revenues in the period of change. All derivative transactions are included in operating activities on the Consolidated Statements of Cash Flows.
Additionally, the Company may also enter into derivatives that do not qualify for cash flow hedge accounting but are considered by management to represent valid economic hedges and are accounted for as mark-to-market transactions. These economic hedges may include, but are not limited to, basis hedges without a corresponding NYMEX hedge, put options and hedges on non-operated or other properties for which all of the necessary information to qualify for cash flow hedge accounting is either not readily available or subject to change.
All hedge transactions are pursuant to standing authorizations by the Board of Directors, which do not permit speculative positions. The Company formally documents all relationships between hedging instruments and hedged items at the inception of the hedge, as well as its risk management objective and strategy for undertaking the hedge. This process includes specific identification of the hedging instrument and the hedge transaction, the nature of the risk being hedged and how the hedging instrument’s effectiveness in hedging the exposure to the hedged transaction’s variability in cash flows attributable to the hedged risk will be assessed. Both at the inception of the hedge and on an ongoing basis, the Company assesses whether the derivatives that are used in hedging transactions are highly effective in offsetting changes in cash flows of hedged items. The Company discontinues hedge accounting if a derivative has ceased to be a highly effective hedge. The maximum term over which Energen Resources has hedged exposures to the variability of cash flows is through December 31, 2009.2010.
Long-Lived Assets and Discontinued Operations: The Company applies SFAS No. 144, “Accounting for the Impairment or Disposal of Long-Lived Assets,” which requires the Company to reflect gains and losses on the sale of certain oil and gas properties and any impairments of properties held-for-sale be reported as discontinued operations, with income or loss from operations of the associated properties reported as income or loss from discontinued operations. The results of operations for certain held-for-sale properties are reclassified and reported as discontinued operations for prior periods in accordance with SFAS No. 144. Energen Resources may, in the ordinary course of business, be involved in the sale of developed or undeveloped properties. All assets held-for-sale are reported at the lower of the carrying amount or fair value.
C. Natural Gas Distribution
Utility Plant and Depreciation: Property, plant and equipment are stated at cost. The cost of utility plant includes an allowance for funds used during construction. Maintenance is charged for the cost of normal repairs and the renewal or replacement of an item of property which is less than a retirement unit. When property which represents a retirement unit is replaced or removed, the cost of such property is credited to utility plant and is charged to the accumulated reserve for depreciation. The estimated net removal costs on certain gas distribution assets isare charged through depreciation and recognized as a regulatory liability in accordance with regulatory accounting. Depreciation is provided on the straight-line method over the estimated useful lives of utility property at rates established by the Alabama Public Service Commission (APSC). Approved depreciation rates averaged approximately 4.5 percent in the years ended December 31, 2007, 2006 2005 and 2004.2005.
Inventories: Inventories, which consist primarily of gas stored underground, are stated at average cost.
Operating Revenue and Gas Costs: Alagasco records natural gas distribution revenues in accordance with its tariff established by the APSC. The margin and gas costs on service delivered to cycle customers but not yet billed are recorded in current assets as accounts receivable with a corresponding regulatory liability. Gas imbalances are settled on a monthly basis. Alagasco had no material gas imbalances at December 31, 20062007 and 2005.2006.
52
Regulatory Accounting: Alagasco is subject to the provisions of SFAS No. 71, “Accounting for the Effects of Certain Types of Regulation.” In general, SFAS No. 71 requires utilities to capitalize or defer certain costs or revenues, based upon approvals received from regulatory authorities, to be recovered from or refunded to customers in future periods.
Derivative Commodity Instruments:On December 4, 2000, the APSC authorized Alagasco to engage in energy-risk management activities. Accordingly, Alagasco from time to time entersmay enter into cash flow derivative commodity instruments to hedge its exposure to price fluctuations on its gas supply. As required by SFAS No. 133, Alagasco recognizes all derivatives as either assets or liabilities on the balance sheet. Any gains or losses are passed through to customers using the mechanisms of the Gas Supply Adjustment (GSA) rider in accordance with Alagasco’s APSC approved tariff and are recognized as a regulatory asset or regulatory liability as required by SFAS No. 71.
Taxes on revenues:Collections and payments of excise taxes are reported on a gross basis. These amounts are included in taxes other than income taxes on the consolidated statements of income as follows:
Years ended December 31, (in thousands) | 2006 | 2005 | 2004 | 2007 | 2006 | 2005 | |||||||||
Taxes on revenues | $ | 33,983 | $ | 30,899 | $ | 27,002 | $ 31,067 | $ 33,983 | $ 30,899 | ||||||
The collection and payment of utility gross receipts tax and utility service use tax are presented on a net basis.
D. Income Taxes
The Company uses the liability method of accounting for income taxes in accordance with SFAS No. 109, “Accounting for Income Taxes.” Under this method, a deferred tax asset or liability is recognized for the estimated future tax effects attributable to temporary differences between the financial statement basis and the tax basis of assets and liabilities as well as tax credit carryforwards. Deferred tax assets and liabilities are measured using enacted tax rates expected to apply to taxable income in the years in which those temporary differences are expected to be recovered or settled. The effect on deferred tax assets and liabilities of a change in tax rates is recognized in the period of the change. The Company and its subsidiaries file a consolidated federal income tax return. Consolidated federal income taxes are charged to appropriate subsidiaries using the separate return method.
E. Accounts Receivable and Allowance for Doubtful Accounts
Trade accounts receivable are recorded at the invoiced amounts and do not bear interest. The allowance for doubtful accounts is the Company’s best estimate of the amount of probable credit losses in the existing accounts receivable. The Company determines the allowance based on historical experience and reviews the allowance for doubtful accounts monthly. Account balances are charged against the allowance when it is anticipated the receivable will not be recovered.
F. Cash Equivalents
The Company includes highly liquid marketable securities and debt instruments purchased with a maturity of three months or less in cash equivalents.
G. Earnings Per Share
The Company’s basic earnings per share amounts have been computed based on the weighted-average number of common shares outstanding. Diluted earnings per share amounts reflect the assumed issuance of common shares for all potentially dilutive securities (see Note 9)9, Reconciliation of Earnings Per Share).
53
H. Stock-Based Compensation
The Company adopted SFAS No. 123 (revised 2004), “Share-Based Payment” (SFAS No. 123R), using the modified prospective application method for new awards effective January 1, 2006. The Company previously adopted the fair value recognition provisions of SFAS No. 123 as amended, “Accounting for Stock-Based Compensation,” prospectively for stock-based compensation effective January 1, 2003. As a result, the adoption of SFAS No. 123R did not have a significant impact to the Company since the expensing provisions were voluntarily adopted in 2003.
SFAS No. 123R requires that all share-based compensation awards be measured at fair value at the date of grant and expensed over the requisite vesting period. SFAS No. 123R requires forfeitures to be estimated at the time of grant and revised, if necessary, in subsequent periods if the actual forfeitures differ from those estimates. Prior to the adoption of SFAS No. 123R, the Company accounted for forfeitures upon occurrence. This change in method did not have a significant impact to the Company upon adoption of SFAS No. 123R.
The Company previously recognized all stock-based employee compensation expense over the stated vesting periods for each award. For awards granted prior to January 1, 2006, the Company recorded any unrecognized expense on the date of an employee’s retirement. For new awards granted to retirement eligible employees effective January 1, 2006, the Company began recognizing the entire compensation expense in the period of grant. If this method of expense recognition had been applied to all awards during 2007, 2006 and 2005, compensation expense would have been reduced by approximately $1.1 million, $2.1 million and $0.8 million, respectively.During 2004, the Company would have recognized approximately $1.2 million of additional compensation expense. The Company utilized the long-form method of calculating the available pool of windfall tax benefit. For 2007 and 2006, the Company recognized an excess tax benefit of $1.8$10.9 million and $2 million related to its stock-based compensation.
The following table illustrates the effect on net income and diluted and basic earnings per share as if the Company had applied the fair value recognition provisions of SFAS No. 123, superseded by SFAS No. 123R, to all outstanding and unvested employee share-based awards during 2005 and 2004:2005:
Years ended December 31, (in thousands) | 2005 | 2004 | ||||||
Net income | ||||||||
As reported | $ | 173,012 | $ | 127,463 | ||||
Stock based compensation expense included in reported net income, net of tax | 8,131 | 7,219 | ||||||
Stock based compensation expense determined under the fair value based method, net of tax | (6,238 | ) | (5,658 | ) | ||||
Pro forma | $ | 174,905 | $ | 129,024 | ||||
Diluted earnings per average common share* | ||||||||
As reported | $ | 2.35 | $ | 1.74 | ||||
Pro forma | $ | 2.37 | $ | 1.76 | ||||
Basic earnings per average common share* | ||||||||
As reported | $ | 2.37 | $ | 1.76 | ||||
Pro forma | $ | 2.39 | $ | 1.78 | ||||
| |||
| 2005 | ||
Net income | |||
As reported | $ 173,012 | ||
Stock based compensation expense included in reported net income, net of tax | 8,131 | ||
Stock based compensation expense determined under the fair value based method, net of tax | (6,238 | ) | |
Pro forma | $ 174,905 | ||
Diluted earnings per average common share | |||
As reported | $ 2.35 | ||
Pro forma | $ 2.37 | ||
Basic earnings per average common share | |||
As reported | $ 2.37 | ||
Pro forma | $ 2.39 |
There were no options granted in the years ended December 31, 2006 and 2005. In 2004, the Company used the Black-Scholes pricing model to calculate the fair values of the options awarded, which are included in the pro forma results above. Option awards were granted with an exercise price equal to the market price of the Company’s stock on the date of grant. For purposes of this valuation the following assumptions were used to derive the fair values: a seven-year option life based on historical experience; an annualized volatility rate, based on historical volatility, of 32.72 percent for the year ended December 31, 2004; a risk-free interest rate of 3.64 percent for the year ended December 31, 2004; and a dividend yield of 1.81 percent on options without dividend equivalents for the year ended December 31, 2004. Options with dividend equivalents assume no dividend yield for all periods presented. The weighted-average grant-date fair value for options granted without dividend equivalents during the year ended December 31, 2004 was $7.11.
I. Estimates
The preparation of financial statements in conformity with accounting principles generally accepted in the United States of America requires management to make estimates and assumptions that affect the reported amounts of assets and liabilities at the date of the financial statements and the reported amount of revenues and expenses during the reporting period. The major estimates and assumptions identified by management include,
but are not limited to, estimates of physical quantities of oil and gas reserves, periodic assessments of oil and gas properties for impairment, an assumption that SFAS No. 71 will continue as the applicable accounting standard for the Company’s regulated operations and estimates used in determining the Company’s obligations under its employee pension plans and asset retirement obligations. Due to the inherent uncertainty involved in making estimates, actual results reported in future periods may differ from the estimates.
54
J. Environmental Costs
Environmental compliance costs, including ongoing maintenance, monitoring and similar costs, are expensed as incurred. Environmental remediation costs are accrued when remedial efforts are probable and the cost can be reasonably estimated.
2. REGULATORY MATTERS
All of Alagasco’s utility operations are conducted in the state of Alabama. Alagasco is subject to regulation by the APSC which established the Rate Stabilization and Equalization (RSE) rate-setting process in 1983. RSE was extended with modifications in 2007, 2002, 1996, 1990, 1987 and 1985. On June 10, 2002,December 21, 2007, the APSC extended Alagasco’s rate-setting methodology, RSE, without change,with certain modifications as outlined below, for a six-yearseven-year period through January 1, 2008.December 31, 2014. Under the terms of thatthe extension, RSE will continue after January 1, 2008,December 31, 2014, unless, after notice to the Company and a hearing, the CommissionAPSC votes to either modify or discontinue its operations.the RSE methodology. Alagasco is on a September 30 fiscal year for rate-setting purposes (rate year) and reports on a calendar year for the Securities and Exchange Commission and all other financial accounting reporting purposes.
Alagasco’s allowed range of return on equity remains 13.15 percent to 13.65 percent throughout the term of the order, subject to change in the event that the Commission, following a generic rate of return hearing, adjusts the equity returns of all major energy utilities operating under a similar methodology.order. Under RSE the APSC conducts quarterly reviews to determine, based on Alagasco’s projections and year-to-date performance, whether Alagasco’s return on average equity at the end of the rate year will be within the allowed range of return. Reductions in rates can be made quarterly to bring the projected return within the allowed range; increases, however, are allowed only once each rate year, effective December 1, and cannot exceed 4 percent of prior-year revenues. Alagasco did not have a reduction in rates related to the return on average equity for rate years ended 2006 or 2004. As of September 30, 2007 and 2005, Alagasco had a $3.6 million and a $3.3 million pre-tax, respectively, reduction in revenues to bring the return on average equity to midpoint within the allowed range of return. Under the provisions of RSE, corresponding reductions in rates for 2007 were effective October 1, 2007 and December 1, 2007, and for 2005 effective December 1, 2005, Alagasco did not have a reduction in rates related to the return on average equity for rate year ended 2006. A $12 million, $14.3 million $15.8 million and $12.3$15.8 million annual increase in revenues became effective December 1, 2007, 2006, and 2005, and 2004, respectively.
Prior to the December 21, 2007 extension, RSE limitslimited the utility’s equity upon which a return is permitted to 60 percent of total capitalizationcapitalization. Subsequent to the extension, the equity on which a return will be permitted will be phased down to 57 percent by December 31, 2008 and provides for certain cost control measures designed55 percent by December 31, 2009.
Prior to monitor Alagasco’s operations and maintenance (O&M) expense. Underthe extension, under the inflation-based cost control measurementCost Control Measurement (CCM) established by the APSC, if the percentage change in O&Moperations and maintenance (O&M) expense per customer fallsfell within a range of 1.25 points above or below the percentage change in the Consumer Price Index For All Urban Consumers (index range), no adjustment iswas required. If the change in O&M expense per customer exceedsexceeded the index range, three-quarters of the difference iswas returned to customers. To the extent the change iswas less than the index range, the utility benefitsbenefited by one-half of the difference through future rate adjustments. The changes to the O&M expense cost control measurement subsequent to the extension are as follows: annual changes in O&M expense will be measured on an aggregate basis rather than per customer; the percentage change in O&M expense must fall within a range of 0.75 points above or below the percentage change in the index range; certain items that fluctuate based on situations demonstrated to be beyond Alagasco’s control may be excluded for the cost control measurement calculation; the O&M expense base for measurement purposes will continue to be set at the prior year’s actual O&M expense amount unless the Company exceeds the top of the index range in two successive years, in which case the base for the following year will be set at the top of the index range.
Alagasco’s O&M expense fell within the index range for the rate years ended September 30, 2007 and 2005. The increase in O&M expense per customer was above the index range for the rate yearsyear ended September 30, 2006 and 2004;2006; as a result, the utility had a $1.5 million pre-tax and $1.2 million pre-tax, respectively, decrease in revenues with correspondingthe related rate reductions under the provisions of RSE. Alagasco’s O&M expense fell within the index range for the rate year ended September 30, 2005.reduction effective December 1, 2006.
Alagasco calculates a temperature adjustment to customers’ monthly bills to substantially removemoderate the effectimpact of departures from normal temperatures on Alagasco’s earnings. Adjustments to customers’ bills are made in the same billing
55
cycle in which the weather variation occurs. The temperature adjustment applies primarily to residential, small commercial and small industrial customers. This adjustment, however, is subject to regulatory limitations on increases to customers’ bills. Other non-temperature weather related conditions that may affect customer usage are not included in the temperature adjustment such as the impact of wind velocity or cloud cover and the elasticity of demand as a result of higher commodity prices. Alagasco’s rate schedules for natural gas distribution charges contain a GSA rider, established in 1993, which permits the pass-through to customers of changes in the cost of gas supply to customers.supply.
The APSC approved an Enhanced Stability Reserve (ESR), beginning rate year 1998 with an approved maximum
funding level of $4 million, to which Alagasco may charge the full amount of: (1) extraordinary O&M expenses resulting fromforce majeure events such as storms, severe weather, and outages, when one or a combination of two such events results in more than $200,000 of additional O&M expense during a rate year; or (2) individual industrial and commercial customer revenue losses that exceed $250,000 during the rate year, if such losses cause Alagasco’s return on average equity to fall below 13.15 percent. During the year ended December 31, 2004, Alagasco charged $0.3 million against the ESR related to extraordinary maintenance cost resulting from certain weather events within Alagasco’s service territory. Following a year in which a charge against the ESR is made, the APSC provides for accretions to the ESR of no more than $40,000 monthly until the maximum funding level is achieved. ESR balances of $4 million and $3.7 million at December 31, 20062007 and 2005,2006, respectively, are included in the consolidated financial statements. Subsequent to the 2007 extension, Alagasco will not have accretions against the ESR until December 31, 2010 unless the Company incurs a significant natural disaster during the three-year period ended December 31, 2010 and receives approval from the APSC to resume accretions under the ESR.
The excess of total acquisition costs over book value of net assets of acquired municipal gas distribution systems is included in utility plant and is being amortized through Alagasco’s rate-setting mechanism on a straight-line basis over approximately 23 years. At December 31, 20062007 and 2005,2006, the net acquisition adjustments were $9.3$8.1 million and $10.4$9.3 million, respectively.
3. LONG-TERM DEBT AND NOTES PAYABLE
Long-term debt consisted of the following:
(in thousands) | December 31, 2007 | December 31, 2006 | ||
Energen Corporation: | ||||
Medium-term Notes, Series A and B, interest ranging from | $ 315,000 | $ 325,000 | ||
5% Notes, due October 1, 2013 | 50,000 | 50,000 | ||
Floating Rate Senior Notes | - | 100,000 | ||
Alabama Gas Corporation: | ||||
Medium-term Notes, Series A, interest of 7.57%, due September 20, 2011 | 5,000 | 15,000 | ||
6.75% Notes | - | 34,445 | ||
5.20% Notes, due January 15, 2020 | 40,000 | 40,000 | ||
5.70% Notes, due January 15, 2035 | 38,467 | 39,311 | ||
5.368% Notes, due December 1, 2015 | 80,000 | 80,000 | ||
5.90% Notes, due January 15, 2037 | 45,000 | - | ||
Total | 573,467 | 683,756 | ||
Less amounts due within one year | 10,000 | 100,000 | ||
Less unamortized debt discount | 1,102 | 1,266 | ||
Total | $ 562,365 | $ 582,490 | ||
(in thousands) | December 31, 2006 | December 31, 2005 | ||||
Energen Corporation: | ||||||
Medium-term Notes, Series A and B, interest ranging from 6.95% to 8.09%, for notes due July 15, 2008, to February 15, 2028 | $ | 325,000 | $ | 335,000 | ||
5% Notes, due October 1, 2013 | 50,000 | 50,000 | ||||
Floating Rate Senior Notes (5.72% at December 31, 2006), due November 15, 2007 | 100,000 | 100,000 | ||||
Alabama Gas Corporation: | ||||||
Medium-term Notes, Series A, interest ranging from 7.57% to 7.97%, for notes due September 20, 2011, to September 23, 2026 | 15,000 | 20,000 | ||||
6.75% Notes, due September 1, 2031 | 34,445 | 34,725 | ||||
5.20% Notes, due January 15, 2020 | 40,000 | 40,000 | ||||
5.70% Notes, due January 15, 2035 | 39,311 | 39,929 | ||||
5.368% Notes, due December 1, 2015 | 80,000 | 80,000 | ||||
Total | 683,756 | 699,654 | ||||
Less amounts due within one year | 100,000 | 15,000 | ||||
Less unamortized debt discount | 1,266 | 1,418 | ||||
Total | $ | 582,490 | $ | 683,236 | ||
56
The aggregate maturities of Energen’s long-term debt for the next five years are as follows:
Years ending December 31,(in thousands) | ||||||||
2007 | 2008 | 2009 | 2010 | 2011 | ||||
$ 100,000 | $ 10,000 | — | $ 150,000 | $ 5,000 | ||||
| Years ending December 31,(in thousands) | ||||||||
| 2008 | 2009 | 2010 | 2011 | 2012 | ||||
| $ 10,000 | - | $ 150,000 | $ 5,000 | $ 1,000 | ||||
The aggregate maturities of Alagasco’s long-term debt for the next five years are as follows:
Years ending December 31,(in thousands) | ||||||||
2007 | 2008 | 2009 | 2010 | 2011 | ||||
| — | — | — | — | $ 5,000 | ||||
| Years ending December 31,(in thousands) | ||||||||
| 2008 | 2009 | 2010 | 2011 | 2012 | ||||
| - | - | - | $ 5,000 | - | ||||
The Company is in compliance with the financial covenants under its various long-term debt agreements. Except as discussed below, debt covenants also address routine matters such as timely payment of principal and interest,
53
maintenance of corporate existence and restrictions on liens. Of theThe Company’s outstanding debt $300 million is subject to a cross default provision under Energen’s Indenture dated September 1, 1996 with The Bank of New York as Trustee. In the event Alagasco or Energen Resources had a debt default of more than $10 million it would also be considered an event of default by Energen under the 1996 Indenture. All of the Company’s debt is unsecured. No conditions exist under long-term debt agreements which could restrict the Company’s ability to pay dividends.
In May 2007, Energen voluntarily called $100 million Floating Rate Senior Notes due November 15, 2007. In April 2007, Energen voluntarily redeemed $10 million of Medium-Term Notes, Series A, with an annual interest rate of 8.09% due September 15, 2026. Associated with this redemption, the Company incurred a call premium of 4.045%. In January 2005,2007, Alagasco issued $40$45 million of long-term debt with an interest rate of 5.2 percent5.9% due January 15, 2020 and $40 million of long-term debt with an interest rate of 5.7 percent due January 15, 2035. In November 2005, Alagasco issued $80 million of long-term debt with an interest rate of 5.368 percent due December 1, 2015.2037. Alagasco used these long-term debt proceeds to repay amounts drawn on short-term credit facilities for capital expenditures and to refinance $30redeem the $34.4 million of Medium-Term6.75% Notes, recalled by Alagasco in April 2004. Alagasco’s long-term debt proceeds were also used to refinance $18maturing September 1, 2031 and $10 million of 7.97% Medium-Term Notes maturing June 27,September 23, 2026.
As of December 31, 2007, to July 5, 2022 and $56.7 million of long-term debt maturing June 15, 2015 to June 27, 2025 recalled by Alagasco in August 2005 and December 2005, respectively.
Energen and Alagascothe Company had short-term credit lines and other credit facilities with various financial institutions totaling $365aggregating $415 million of which Energen had available $255 million, Alagasco had available $110 million and $340$50 million respectively, available as of December 31, 2006,to either Company for working capital needs. Alagasco has been authorized by the APSC to borrow a maximum ofup to $200 million of its available credit lines at any one time byoutstanding under short-term lines of credit. As of December 31, 2007, the APSC. The Company is in compliance with the financial covenants under the various short-term loan agreements and except as discussed below, debt covenants address routine matters. Oneagreements. Certain of the Company’s credit facilities in the aggregate amount of $35$85 million, including $25$75 million for Energen and $10 million for Alagasco, hashave a covenant that the ratio of consolidated debt to consolidated capitalization will not exceed 0.65:1. As of December 31, 2006, the Company was in compliance with this requirement. The following is a summary of information relating to notes payable to banks:
(in thousands) | December 31, 2006 | December 31, 2005 | December 31, 2007 | December 31, 2006 | ||||||||
Energen outstanding | $ | — | $ | 98,000 | $ 72,000 | $ - | ||||||
Alagasco outstanding | 58,000 | 55,000 | 62,000 | 58,000 | ||||||||
Notes payable to banks | 58,000 | 153,000 | 134,000 | 58,000 | ||||||||
Available for borrowings | 307,000 | 167,000 | 281,000 | 307,000 | ||||||||
Total | $ | 365,000 | $ | 320,000 | $ 415,000 | $ 365,000 | ||||||
Energen maximum amount outstanding at any month-end | $ | 117,000 | $ | 153,000 | $ 134,000 | $ 117,000 | ||||||
Energen average daily amount outstanding | $ | 63,658 | $ | 17,688 | $ 67,734 | $ 63,658 | ||||||
Energen weighted average interest rates based on: | ||||||||||||
Average daily amount outstanding | 5.32 | % | 3.57 | % | 5.35% | 5.32% | ||||||
Amount outstanding at year-end | 5.70 | % | 4.81 | % | 4.64% | 5.70% | ||||||
Alagasco maximum amount outstanding at any month-end | $ | 58,000 | $ | 55,000 | $ 62,000 | $ 58,000 | ||||||
Alagasco average daily amount outstanding | $ | 37,104 | $ | 4,833 | $ 29,518 | $ 37,104 | ||||||
Alagasco weighted average interest rates based on: | ||||||||||||
Average daily amount outstanding | 5.43 | % | 3.63 | % | 5.39% | 5.43% | ||||||
Amount outstanding at year-end | 5.70 | % | 4.78 | % | 4.62% | 5.70% | ||||||
57
Energen’s total interest expense was $47,100,000, $48,652,000 $46,800,000 and $42,743,000$46,800,000 for the years ended December 31, 2007, 2006 2005 and 2004,2005, respectively. Total interest expense for Alagasco was $15,696,000, $16,454,000 $15,060,000 and $13,737,000$15,060,000 for the years ended December 31, 2007, 2006 and 2005, and 2004, respectively.
In January 2007, Alagasco issued $45 million of long-term debt with an interest rate of 5.9 percent due January 15, 2037. Alagasco used these long-term debt proceeds to redeem the $34.4 million of 6.75 percent Notes, maturing September 1, 2031 and $10 million of 7.97 percent Medium-Term Notes maturing September 23, 2026.
4. INCOME TAXES
The components of Energen’s income taxes consisted of the following:
Years ended December 31, (in thousands) | 2006 | 2005 | 2004 | ||||||
Taxes estimated to be payable currently: | |||||||||
Federal | $ | 47,799 | $ | 29,765 | $ | 7,261 | |||
State | 9,022 | 6,078 | 1,149 | ||||||
Total current | 56,821 | 35,843 | 8,410 | ||||||
Taxes deferred: | |||||||||
Federal | 93,605 | 59,685 | 58,956 | ||||||
State | 4,604 | 1,963 | 8,159 | ||||||
Total deferred | 98,209 | 61,648 | 67,115 | ||||||
Total income tax expense from continuing operations | $ | 155,030 | $ | 97,491 | $ | 75,525 | |||
Years ended December 31, (in thousands) | 2007 | 2006 | 2005 | ||||||
Taxes estimated to be payable currently: | |||||||||
Federal | $ | 149,787 | $ | 47,799 | $ | 29,765 | |||
State | 16,480 | 9,022 | 6,078 | ||||||
Total current | 166,267 | 56,821 | 35,843 | ||||||
Taxes deferred: | |||||||||
Federal | 838 | 93,605 | 59,685 | ||||||
State | 324 | 4,604 | 1,963 | ||||||
Total deferred | 1,162 | 98,209 | 61,648 | ||||||
Total income tax expense from continuing operations | $ | 167,429 | $ | 155,030 | $ | 97,491 |
For the years ended December 31, 20062007 and 2004,2006, Energen recorded a current income tax expense of $29,000$12,000 and $96,000,$29,000, respectively, related to income from discontinued operations. For the year ended December 31, 2005, Energen recorded a current income tax expense of $3,117,000 and a deferred tax benefit of $3,040,000 related to income from discontinued operations.
The components of Alagasco’s income taxes consisted of the following:
Years ended December 31, (in thousands) | 2006 | 2005 | 2004 | 2007 | 2006 | 2005 | ||||||||||||
Taxes estimated to be payable currently: | ||||||||||||||||||
Federal | $ | 17,472 | $ | 18,430 | $ | 8,581 | $ | 13,604 | $ | 17,472 | $ | 18,430 | ||||||
State | 2,273 | 2,126 | 1,109 | 1,811 | 2,273 | 2,126 | ||||||||||||
Total current | 19,745 | 20,556 | 9,690 | 15,415 | 19,745 | 20,556 | ||||||||||||
Taxes deferred: | ||||||||||||||||||
Federal | 1,999 | 1,597 | 8,834 | 5,510 | 1,999 | 1,597 | ||||||||||||
State | 258 | 207 | 1,179 | 711 | 258 | 207 | ||||||||||||
Total deferred | 2,257 | 1,804 | 10,013 | 6,221 | 2,257 | 1,804 | ||||||||||||
Total income tax expense | $ | 22,002 | $ | 22,360 | $ | 19,703 | $ | 21,636 | $ | 22,002 | $ | 22,360 | ||||||
58
Temporary differences and carryforwards which gave rise to Energen’s and Alagasco’s deferred tax assets and liabilities were as follows:
Energen Corporation
(in thousands) | December 31, 2006 | December 31, 2005 | ||||||||||||||
| Current | Noncurrent | Current | Noncurrent | |||||||||||||
Deferred tax assets: | ||||||||||||||||
Minimum tax credit | $ | — | $ | 1,267 | $ | — | $ | 34,786 | ||||||||
Pension and other costs | — | 10,767 | — | 8,693 | ||||||||||||
Unbilled and deferred revenue | 10,269 | — | 10,263 | — | ||||||||||||
Enhanced stability reserve and other regulatory costs | 2,009 | — | 1,393 | — | ||||||||||||
Allowance for doubtful accounts | 5,216 | — | 4,304 | — | ||||||||||||
Insurance accruals | 2,693 | — | 3,552 | — | ||||||||||||
Compensation accruals | 8,460 | — | 6,704 | — | ||||||||||||
Inventories | 889 | — | 865 | — | ||||||||||||
Other comprehensive income | — | 17,017 | 51,920 | 11,916 | ||||||||||||
Gas supply adjustment accruals | 1,309 | — | 991 | — | ||||||||||||
Other, net | 2,705 | 3,300 | 1,674 | 2,626 | ||||||||||||
Total deferred tax assets | 33,550 | 32,351 | 81,666 | 58,021 | ||||||||||||
Valuation allowance | (1,928 | ) | (770 | ) | (1,596 | ) | (452 | ) | ||||||||
Total deferred tax assets | 31,622 | 31,581 | 80,070 | 57,569 | ||||||||||||
Deferred tax liabilities: | ||||||||||||||||
Depreciation and basis differences | — | 261,960 | — | 196,916 | ||||||||||||
Pension and other costs | 9,760 | — | 7,164 | — | ||||||||||||
Minimum pension liability | — | 10,767 | — | 8,693 | ||||||||||||
Other comprehensive income | 35,523 | — | — | — | ||||||||||||
Other, net | 1,693 | — | 793 | — | ||||||||||||
Total deferred tax liabilities | 46,976 | 272,727 | 7,957 | 205,609 | ||||||||||||
Net deferred tax assets (liabilities) | $ | (15,354 | ) | $ | (241,146 | ) | $ | 72,113 | $ | (148,040 | ) | |||||
Alabama Gas Corporation
(in thousands) | December 31, 2006 | December 31, 2005 | December 31, 2007 | December 31, 2006 | ||||||||||||||||||||||||||
| Current | Noncurrent | Current | Noncurrent | Current | Noncurrent | Current | Noncurrent | |||||||||||||||||||||||
Deferred tax assets: | ||||||||||||||||||||||||||||||
Minimum tax credit | $ | - | $ | - | $ | - | $ | 1,267 | ||||||||||||||||||||||
Unbilled and deferred revenue | 10,648 | - | 10,269 | - | ||||||||||||||||||||||||||
Enhanced stability reserve and | 1,497 | - | 2,009 | - | ||||||||||||||||||||||||||
Allowance for doubtful accounts | 4,567 | - | 5,216 | - | ||||||||||||||||||||||||||
Insurance accruals | 2,564 | - | 2,693 | - | ||||||||||||||||||||||||||
Compensation accruals | 8,655 | - | 8,460 | - | ||||||||||||||||||||||||||
Inventories | 1,230 | - | 889 | - | ||||||||||||||||||||||||||
Other comprehensive income | 23,995 | 27,275 | - | 17,017 | ||||||||||||||||||||||||||
Gas supply adjustment accruals | 1,486 | - | 1,309 | - | ||||||||||||||||||||||||||
State net operating losses and other | - | 3,024 | - | 2,698 | ||||||||||||||||||||||||||
Other | 2,789 | 153 | 2,705 | 602 | ||||||||||||||||||||||||||
Total deferred tax assets | 57,431 | 30,452 | 33,550 | 21,584 | ||||||||||||||||||||||||||
Valuation allowance | (2,137 | ) | (887 | ) | (1,928 | ) | (770 | ) | ||||||||||||||||||||||
Total deferred tax assets | 55,294 | 29,565 | 31,622 | 20,814 | ||||||||||||||||||||||||||
Deferred tax liabilities: | ||||||||||||||||||||||||||||||
Depreciation and basis differences | - | 261,137 | - | 261,960 | ||||||||||||||||||||||||||
Pension and other costs | $ | — | $ | 10,767 | $ | — | $ | 8,693 | - | 6,094 | - | 9,760 | ||||||||||||||||||
Other comprehensive income | - | - | 35,523 | - | ||||||||||||||||||||||||||
Other | 1,128 | 1,040 | 1,693 | - | ||||||||||||||||||||||||||
Total deferred tax liabilities | 1,128 | 268,271 | 37,216 | 271,720 | ||||||||||||||||||||||||||
Net deferred tax assets (liabilities) | $ | 54,166 | $ (238,706 | ) | $ (5,594 | ) | $ (250,906 | ) | ||||||||||||||||||||||
| Alabama Gas Corporation | ||||||||||||||||||||||||||||||
(in thousands) | December 31, 2007 | December 31, 2006 | ||||||||||||||||||||||||||||
| Current | Noncurrent | Current | Noncurrent | |||||||||||||||||||||||||||
Deferred tax assets: | ||||||||||||||||||||||||||||||
Unbilled and deferred revenue | 10,269 | — | 10,263 | — | $ | 10,648 | $ | - | $ | 10,269 | $ | - | ||||||||||||||||||
Enhanced stability reserve and other regulatory costs | 2,009 | — | 1,393 | — | 1,497 | - | 2,009 | - | ||||||||||||||||||||||
Allowance for doubtful accounts | 4,991 | — | 4,083 | — | 4,348 | - | 4,991 | - | ||||||||||||||||||||||
Insurance accruals | 2,092 | — | 2,305 | — | 2,804 | - | 2,092 | - | ||||||||||||||||||||||
Compensation accruals | 3,639 | — | 3,303 | — | 3,132 | - | 3,639 | - | ||||||||||||||||||||||
Inventories | 889 | — | 865 | — | 1,230 | - | 889 | - | ||||||||||||||||||||||
Gas supply adjustment accruals | 1,309 | — | 991 | — | 1,486 | - | 1,309 | - | ||||||||||||||||||||||
Other, net | 830 | 487 | 821 | 534 | ||||||||||||||||||||||||||
Other | 704 | 115 | 830 | 487 | ||||||||||||||||||||||||||
Total deferred tax assets | 26,028 | 11,254 | 24,024 | 9,227 | 25,849 | 115 | 26,028 | 487 | ||||||||||||||||||||||
Deferred tax liabilities: | ||||||||||||||||||||||||||||||
Depreciation and basis differences | — | 42,682 | — | 40,483 | - | 48,892 | - | 42,682 | ||||||||||||||||||||||
Pension and other costs | 11,971 | — | 10,042 | — | - | 11,013 | - | 11,971 | ||||||||||||||||||||||
Minimum pension liability | — | 10,767 | — | 8,693 | ||||||||||||||||||||||||||
Other, net | 806 | — | 698 | — | ||||||||||||||||||||||||||
Other | 670 | - | 806 | - | ||||||||||||||||||||||||||
Total deferred tax liabilities | 12,777 | 53,449 | 10,740 | 49,176 | 670 | 59,905 | 806 | 54,653 | ||||||||||||||||||||||
Net deferred tax assets (liabilities) | $ | 13,251 | $ | (42,195 | ) | $ | 13,284 | $ | (39,949 | ) | $ | 25,179 | $ (59,790 | ) | $ 25,222 | $ (54,166 | ) | |||||||||||||
The Company files a consolidated federal income tax return with all of its subsidiaries. As of December 31, 2006,2007, the amount ofCompany has fully utilized the minimum tax credit carryforward that has beenwas previously recognized and canas a reduction of income tax expense. The minimum tax credit relates to alternative minimum taxes previously paid that are allowed to be carried forward indefinitely to reduceoffset future regularcash tax liability is $1.3 million.liabilities. The Company has a full valuation allowance recorded against a deferred tax asset of $2,698,000$3,024,000 arising from certain state net operating loss and charitable contribution carryforwards. The Company intends to fully reserve this asset until it is determined that it is more likely than not that the asset can be realized through future taxable income in the respective state taxing jurisdictions. No other valuation allowance with respect to deferred taxes is deemed necessary as the Company anticipates generating adequate future taxable income to realize the benefits of all remaining deferred tax assets on the consolidated balance sheets.
59
Total income tax expense for the Company differed from the amount which would have been provided by applying the statutory federal income tax rate of 35 percent to earnings before taxes from continuing operations as illustrated below:
Years ended December 31, (in thousands) | 2006 | 2005 | 2004 | |||||||||
Income tax expense from continuing operations at statutory federal income tax rate | $ | 149,994 | $ | 94,632 | $ | 70,991 | ||||||
Increase (decrease) resulting from: | ||||||||||||
Enhanced oil recovery tax credits | (380 | ) | (503 | ) | (456 | ) | ||||||
Deferred investment tax credits | — | — | (308 | ) | ||||||||
State income taxes, net of federal income tax benefit | 8,906 | 5,197 | 6,004 | |||||||||
Qualified Section 199 production activities deduction | (1,114 | ) | (1,060 | ) | — | |||||||
401(k) stock dividend deduction | (682 | ) | (667 | ) | (705 | ) | ||||||
Other, net | (1,694 | ) | (108 | ) | (1 | ) | ||||||
Total income tax expense from continuing operations | $ | 155,030 | $ | 97,491 | $ | 75,525 | ||||||
Effective income tax rate (%) | 36.18 | 36.06 | 37.24 | |||||||||
Years ended December 31, (in thousands) | 2007 | 2006 | 2005 | |||||||||
Income tax expense from continuing operations at | $ | 166,824 | $ | 149,994 | $ | 94,632 | ||||||
Increase (decrease) resulting from: | ||||||||||||
State income taxes, net of federal income tax benefit | 12,251 | 8,906 | 5,197 | |||||||||
Qualified Section 199 production activities deduction | (8,470 | ) | (1,114 | ) | (1,060 | ) | ||||||
401(k) stock dividend deduction | (637 | ) | (682 | ) | (667 | ) | ||||||
Other, net | (2,539 | ) | (2,074 | ) | (611 | ) | ||||||
Total income tax expense from continuing operations | $ | 167,429 | $ | 155,030 | $ | 97,491 | ||||||
Effective income tax rate (%) | 35.13 | 36.18 | 36.06 |
Total income tax expense for Alagasco differed from the amount which would have been provided by applying the statutory federal income tax rate of 35 percent to earnings before taxes from continuing operations as illustrated below:
Years ended December 31, (in thousands) | 2006 | 2005 | 2004 | 2007 | 2006 | 2005 | ||||||||||||||||||
Income tax expense at statutory federal income tax rate | $ | 20,755 | $ | 20,763 | $ | 18,723 | $ | 20,459 | $ | 20,755 | $ | 20,763 | ||||||||||||
Increase (decrease) resulting from: | ||||||||||||||||||||||||
Deferred investment tax credits | — | — | (308 | ) | ||||||||||||||||||||
State income taxes, net of federal income tax benefit | 1,666 | 1,673 | 1,504 | 1,643 | 1,666 | 1,673 | ||||||||||||||||||
Other, net | (419 | ) | (76 | ) | (216 | ) | (466 | ) | (419 | ) | (76 | ) | ||||||||||||
Total income tax expense | $ | 22,002 | $ | 22,360 | $ | 19,703 | $ | 21,636 | $ | 22,002 | $ | 22,360 | ||||||||||||
Effective income tax rate (%) | 37.10 | 37.69 | 36.83 | 37.01 | 37.10 | 37.69 | ||||||||||||||||||
Energen adopted the provisions of FASB Interpretation No. 48, “Accounting for Uncertainty in Income Taxes—an Interpretation of FASB Statement No. 109” (FIN 48) as of January 1, 2007. This Interpretation prescribed a recognition threshold and measurement attribute for the financial statement recognition, measurement and disclosure of a tax position taken or expected to be taken in a tax return. As a result of the implementation of FIN 48, the Company recognized an approximate $1.2 million increase in the liability for unrecognized tax benefits which was accounted for as a decrease to the January 1, 2007 retained earnings balance. A reconciliation of Energen’s beginning and ending amount of unrecognized tax benefits is as follows:
(in thousands) | ||||||
Balance as of 1/1/2007 | $ | 8,163 | ||||
Additions based on tax positions related to the current year | 1,162 | |||||
Additions for tax positions of prior years | 2,372 | |||||
Reductions for tax positions of prior years (lapse of statute of limitations) | (3,180 | ) | ||||
Balance as of 12/31/2007 | $ | 8,517 |
The amount of unrecognized tax benefits at December 31, 2007 that would favorably impact the Company’s effective tax rate, if recognized, is $2.5 million. The Company recognizes potential accrued interest and penalties related to unrecognized tax benefits in income tax expense. During the years ended December 31, 2007, 2006, and 2005, the Company recognized approximately $36,000 of expense, $155,000 of income, and $636,000 of expense for interest (net of tax benefit) and penalties, respectively. The Company had approximately $517,000 and $481,000 for the payment of interest (net of tax benefit) and penalties accrued at December 31, 2007, and 2006, respectively. The Company’s tax returns for years 2004-2006 remain open to examination by the Internal Revenue Service and major state taxing jurisdictions. The Company recognized approximately $1.8 million of previously unrecognized tax benefits in the current year as the result of the statute of limitations expiring for federal and state tax returns prior to 2004. This change recognized in the current year, which is reflected in the Company’s effective tax rate reconciliation as shown above, and the change in the unrecognized tax benefit expected within the next 12 months is not considered material to the financial statements.
60
The adoption of FIN 48 resulted in no adjustment to Alagasco’s January 1, 2007 retained earnings balance. A reconciliation of Alagasco’s beginning and ending amount of unrecognized tax benefits is as follows:
(in thousands) | ||||||
Balance as of 1/1/2007 | $ | 713 | ||||
Additions for tax positions of prior years | 578 | |||||
Reductions for tax positions of prior years (lapse of statute of limitations) | (336 | ) | ||||
Balance as of 12/31/2007 | $ | 955 |
None of Alagasco’s unrecognized tax benefits at December 31, 2007 would impact the Company’s effective tax rate, if recognized. The Company recognizes potential accrued interest and penalties related to unrecognized tax benefits in income tax expense. During the years ended December 31, 2007, 2006, and 2005, the Company recognized approximately $23,000 of expense, $36,000 of income, and $100,000 of expense for interest (net of tax benefit) and penalties, respectively. The Company had approximately $87,000 and $64,000 for the payment of interest (net of tax benefit) and penalties accrued at December 31, 2007, and 2006, respectively. The Company’s tax returns for years 2004-2006 remain open to examination by the Internal Revenue Service and the state of Alabama. The Company recognized approximately $214,000 of previously unrecognized tax benefits in the current year as the result of the statute of limitations expiring for federal and state tax returns prior to 2004. This change recognized in the current year and the change in the unrecognized tax benefit expected within the next 12 months is not considered material to the financial statements.
5. EMPLOYEE BENEFIT PLANS
In December 2006, the Company adopted SFAS No. 158, “Employers’ Accounting for Defined Benefit Pension and Other Postretirement Plans, an amendment of FASB Statements No. 87, 88, 106 and 132 (R)” (SFAS No. 158). This Standard retainsretained the previous periodic expense calculation on an actuarial basis under the provisions of SFAS No. 87, “Employers’ Accounting for Pensions” and SFAS No. 106, “Employers’ Accounting for Postretirement Benefits Other Than Pensions.” In addition, SFAS No. 158 requires an employer to recognize the net funded status of defined benefit pensions and other postretirement benefit plans (benefit plans) as an asset or liability in its statement of financial position and to recognize changes in the funded status through comprehensive income. Additional minimum pension liabilities (AML) and related intangible assets are derecognized upon adoption of the new Standard. For pension plans, the benefit obligation is the projected benefit obligation; for other postretirement plans, the benefit obligation is the accumulated postretirement benefit obligation. Alagasco established a regulatory asset for the portion of the obligation to be recovered in rates in future periods and a liability for the portion of the plan obligation to be provided through rates in the future in accordance with SFAS No. 71. SFAS No. 158 also requires an employer to measure the funded status of a plan as of the date of its year-end statement of financial position effective for fiscal years ending after December 15, 2008. The Company currently uses a September 30 valuation date for its benefit plans.plans and anticipates adopting the change in measurement date using the alternative method. During 2008, the Company expects a reduction to retained earnings of approximately $1.7 million to complete implementation of this Standard.
The following table summarizes the effect of required changes to the Company’s financial statements as of December 31, 2006 prior and subsequent to the adoption of SFAS No. 158.
(in thousands) | Prior to SFAS No. 158 Adoption | AML Adjustment | SFAS No. 158 Adjustment | Subsequent to SFAS No. 158 Adoption |
| Prior to SFAS No. 158 Adoption |
| AML Adjustment |
| | SFAS No. 158 | | | Subsequent to SFAS No. | ||||||||||||||
Prepaid pension costs | $ | 49,500 | $ | — | $ | (43,914 | ) | $ | 5,586 | $ | 49,500 | $ | - | $ | (43,914 | ) | $ | 5,586 | ||||||||||
Postretirement assets | $ | — | $ | — | $ | 14,389 | $ | 14,389 | $ | - | $ | - | $ | 14,389 | $ | 14,389 | ||||||||||||
Regulatory asset | $ | 22,807 | $ | (22,807 | ) | $ | 28,476 | $ | 28,476 | $ | 22,807 | $ | (22,807 | ) | $ | 28,476 | $ | 28,476 | ||||||||||
Other assets | $ | 3,337 | $ | (558 | ) | $ | (2,781 | ) | $ | — | $ | 3,337 | $ | (558 | ) | $ | (2,781 | ) | $ | - | ||||||||
Accumulated other comprehensive income, net of tax | $ | 13,707 | $ | (5,686 | ) | $ | 15,156 | $ | 23,177 | $ | 13,707 | $ | (5,686 | ) | $ | 15,156 | $ | 23,177 | ||||||||||
Pension liabilities | $ | 47,234 | $ | (32,113 | ) | $ | 21,016 | $ | 36,137 | $ | 47,234 | $ | (32,113 | ) | $ | 21,016 | $ | 36,137 | ||||||||||
Regulatory liability | $ | — | $ | — | $ | 7,220 | $ | 7,220 | $ | - | $ | - | $ | 7,220 | $ | 7,220 | ||||||||||||
61
Pension Plans:
The Company has two defined benefit non-contributory qualified pension plans. These plans cover substantially all employees. Pension benefits for the majority of the Company’s employees are based on years of service and final earnings; one plan is based on years of service and flat dollar amounts. The Company’s policy is to use the projected unit credit actuarial method for funding and financial reporting purposes. The Company also has certain nonqualified supplemental pension plans.plans covering certain officers of the Company.
The following table sets forth the combined funded status of the pension plans and their reconciliation with the related amounts in the Company’s consolidated financial statements. The effect of changes prior to implementation of SFAS No. 158 as well as the impact upon initial adoption of SFAS No. 158 are reflected below:
(in thousands) | 2006 | 2005 | ||||||||||||||
| 2007 | 2006 | |||||||||||||||
Accumulated benefit obligation (September 30) | $ | 164,207 | $ | 171,264 | $ | 161,437 | $ | 164,207 | ||||||||
Projected benefit obligation: | ||||||||||||||||
Balance at beginning of period | $ | 200,977 | $ | 185,691 | $ | 198,637 | $ | 200,977 | ||||||||
Service cost | 6,452 | 6,340 | 6,812 | 6,452 | ||||||||||||
Interest cost | 10,715 | 10,458 | 11,106 | 10,715 | ||||||||||||
Plan amendments | 154 | 168 | 2,538 | 154 | ||||||||||||
Actuarial (gain) loss | (4,525 | ) | 14,154 | |||||||||||||
Actuarial loss (gain) | 3,614 | (4,525 | ) | |||||||||||||
Benefits paid | (15,136 | ) | (15,834 | ) | (23,344 | ) | (15,136 | ) | ||||||||
Balance at end of period (September 30) | $ | 198,637 | $ | 200,977 | $ | 199,363 | $ | 198,637 | ||||||||
Plan assets: | ||||||||||||||||
Fair value of plan assets at beginning of period | $ | 140,211 | $ | 116,912 | $ | 160,936 | $ | 140,211 | ||||||||
Actual return on plan assets | 12,937 | 16,714 | 22,245 | 12,937 | ||||||||||||
Employer contributions | 22,924 | 22,419 | 16,807 | 22,924 | ||||||||||||
Benefits paid | (15,136 | ) | (15,834 | ) | (23,344 | ) | (15,136 | ) | ||||||||
Fair value of plan assets at end of period (September 30) | $ | 160,936 | $ | 140,211 | $ | 176,644 | $ | 160,936 | ||||||||
Before reflecting SFAS 158: | ||||||||||||||||
Amounts recognized in the consolidated balance sheets: | ||||||||||||||||
Funded status of plan | $ | (37,701 | ) | $ | (60,766 | ) | $ | - | $ | (37,701 | ) | |||||
Unrecognized actuarial loss | 67,125 | 78,182 | - | 67,125 | ||||||||||||
Unrecognized prior service cost | 4,330 | 4,901 | - | 4,330 | ||||||||||||
Unrecognized transition obligation | — | 4 | ||||||||||||||
Employer contributions (October 1 to December 31) | 7,150 | 12,217 | - | 7,150 | ||||||||||||
Accrued pension asset (December 31) | $ | 40,904 | $ | 34,538 | $ | - | $ | 40,904 | ||||||||
Prepaid benefit cost | 42,500 | 7,257 | - | 42,500 | ||||||||||||
Accrued benefit liability | (23,868 | ) | (32,169 | ) | - | (23,868 | ) | |||||||||
Intangible asset | 2,781 | 3,339 | - | 2,781 | ||||||||||||
Accumulated other comprehensive income | 12,340 | 43,893 | - | 12,340 | ||||||||||||
Net amount recognized (September 30) | $ | 33,753 | $ | 22,320 | $ | - | $ | 33,753 | ||||||||
After reflecting SFAS 158: | ||||||||||||||||
Funded status of plan | $ | (37,701 | ) | — | $ | (22,718 | ) | $ | (37,701 | ) | ||||||
Employer contributions (October 1 to December 31) | 7,150 | — | 50 | 7,150 | ||||||||||||
Net pension liability (December 31) | $ | (30,551 | ) | — | $ | (22,668 | ) | $ | (30,551 | ) | ||||||
Noncurrent assets | $ | 5,586 | — | $ | 12,443 | $ | 5,586 | |||||||||
Current liabilities | (3,633 | ) | — | (3,126 | ) | (3,633 | ) | |||||||||
Noncurrent liabilities | (32,504 | ) | — | (31,985 | ) | (32,504 | ) | |||||||||
Net liability recognized (December 31) | $ | (30,551 | ) | — | $ | (22,668 | ) | $ | (30,551 | ) | ||||||
Amounts recognized to accumulated other comprehensive income: | ||||||||||||||||
Prior service costs, net of tax of $1,011 | $ | 1,877 | — | |||||||||||||
Net actuarial loss, net of tax of $12,899 | 23,957 | — | ||||||||||||||
Prior service costs, net of tax of $0.9 million and $1 million | $ | 1,675 | $ | 1,877 | ||||||||||||
Net actuarial loss, net of tax of $11.1 million and $12.9 million | 20,525 | 23,957 | ||||||||||||||
Total accumulated other comprehensive income (December 31) | $ | 25,834 | — | $ | 22,200 | $ | 25,834 | |||||||||
62
Alagasco establishedrecognized a regulatory asset of $28.5$21.2 million and $22.8$28.5 million as of December 31, 20062007 and 2005,2006, respectively, for the portion of the obligation to be recovered through rates in future periods in accordance with
SFAS No. 71. Additionally, Alagasco also recognized a reductionan offset of $2 million and $3.2 million to a regulatory liability of $3.2 million as of December 31, 2007 and 2006, respectively, for the portion of the plan obligation to be provided through rates in future periods in accordance with SFAS No. 71.
Related to the Company’s nonqualified supplemental retirement plans, the Company has designated assets of $26.9$27.3 million and $24.6$26.9 million as of December 31, 20062007 and 2005,2006, respectively. While intended for payment of this benefit, these assets remain subject to the claims of the Company’s creditors and are not included in the fair value of plan assets in the above table. Accordingly, these assets are not recognized in the funded status of the plan.
Other changes in pension plan assets and projected benefit obligations recognized in other comprehensive income during 2007 were as follows:
(in thousands) | ||
Net actuarial loss experienced during the year | $ 1,312 | |
Net actuarial loss recognized as expense | (6,583) | |
Prior service cost recognized as expense | (321) | |
Total recognized in other comprehensive income (December 31) | $ (5,592) | |
Estimated amounts to be amortized from accumulated other comprehensive income into pension cost during 20072008 are as follows:
(in thousands) | |||
Amortization of prior service cost | $ | 320 | |
Amortization of net actuarial loss | $ | 3,313 | |
(in thousands) | ||
Amortization of prior service cost | $ 321 | |
Amortization of net actuarial loss | $ 2,706 | |
Weighted average rate assumptions used to determine the projected benefit obligations at the measurement date:
| September 30, 2006 | September 30, 2005 | September 30, 2007 | September 30, 2006 | ||||||||
Discount rate | 5.77 | % | 5.50 | % | 6.18 | % | 5.77% | ||||
Rate of compensation increase for pay-related plans | 4.22 | % | 3.58 | % | 4.07 | % | 4.22% | ||||
The components of net pension expense were:
Years ended December 31, (in thousands) | 2006 | 2005 | 2004 | 2007 | 2006 | 2005 | ||||||||||||||||||
Components of net periodic benefit cost: | ||||||||||||||||||||||||
Service cost | $ | 6,452 | $ | 6,400 | $ | 5,199 | $ | 6,812 | $ | 6,452 | $ | 6,400 | ||||||||||||
Interest cost | 10,715 | 10,458 | 9,414 | 11,106 | 10,715 | 10,458 | ||||||||||||||||||
Expected long-term return on assets | (11,990 | ) | (10,954 | ) | (9,890 | ) | (13,070 | ) | (11,990 | ) | (10,954 | ) | ||||||||||||
Transition amortization | 4 | 5 | 5 | - | 4 | 5 | ||||||||||||||||||
Prior service cost amortization | 726 | 916 | 589 | 918 | 726 | 916 | ||||||||||||||||||
Actuarial loss | 5,257 | 4,348 | 3,196 | 4,611 | 5,257 | 4,348 | ||||||||||||||||||
Settlement loss | 326 | — | — | 5,656 | 326 | - | ||||||||||||||||||
Net periodic expense | $ | 11,490 | $ | 11,173 | $ | 8,513 | $ | 16,033 | $ | 11,490 | $ | 11,173 | ||||||||||||
Net retirement expense for Alagasco was $6,812,000, $6,158,000 $6,288,000 and $5,175,000$6,288,000 for the years ended December 31, 2007, 2006 and 2005, respectively. The Company recognized settlement charges of $2.4 million in 2007 for the payment of lump sums from the nonqualified supplemental retirement plans. The Company also recognized a settlement charge of $3.2 million in the third quarter of 2007 for the payment of lump sums from a defined benefit
63
pension plan. This charge represented an acceleration of the unamortized actuarial losses as required under SFAS No. 88, “Employers’ Accounting for Settlements and 2004, respectively.Curtailments of Defined Benefit Pension Plans and for Termination Benefits.”
Weighted average rate assumptions to determine net periodic benefit costs for the period ending:
| December 31, 2006 | December 31, 2005 | December 31, 2004 | December 31, 2007 | | December 31, 2006 | | December 31, 2005 | | ||||||||||
Discount rate | 5.50 | % | 5.75 | % | 6.00 | % | 5.77 | % | 5.50 | % | 5.75 | % | ||||||
Expected long-term return on plan assets | 8.50 | % | 8.50 | % | 8.75 | % | 8.25 | % | 8.50 | % | 8.50 | % | ||||||
Rate of compensation increase for pay-related plans | 3.60 | % | 4.00 | % | 4.00 | % | 4.22 | % | 3.60 | % | 4.00 | % | ||||||
The Company’s weighted-average defined benefit pension plan asset allocations by asset category were as follows:
| Target | December 31, 2006 | December 31, 2005 | Target | December 31, 2007 | | December 31, 2006 | | |||||||||||
Asset category: | ||||||||||||||||||
Equity securities | 61 | % | 53 | % | 61 | % | 56 | % | 51 | % | 53 | % | ||||||
Debt securities | 31 | % | 31 | % | 28 | % | 32 | % | 29 | % | 31 | % | ||||||
Other | 8 | % | 16 | % | 11 | % | 12 | % | 20 | % | 16 | % | ||||||
Total | 100 | % | 100 | % | 100 | % | 100 | % | 100 | % | 100 | % | ||||||
Plan equity securities do not include the Company’s common stock. The Company is not required to make pension contributions in 20072008 and does not currently plan on making discretionary contributions.
Defined benefit pension plan payments, which reflect expected future service, are anticipated to be paid as follows:
(in thousands) | ||||||
2007 | $ | 13,263 | ||||
2008 | $ | 12,052 | $ | 16,672 | ||
2009 | $ | 12,995 | $ | 14,156 | ||
2010 | $ | 14,156 | $ | 14,231 | ||
2011 | $ | 14,300 | $ | 14,722 | ||
2012-2016 | $ | 95,862 | ||||
2012 | $ | 15,169 | ||||
2013-2017 | $ | 89,194 | ||||
Postretirement Health Care and Life Insurance Benefits:
In addition to providing pension benefits, the Company provides certain postretirement health care and life insurance benefits. Substantially all of the Company’s employees may become eligible for certain benefits if they reach normal retirement age while working for the Company. The projected unit credit actuarial method was used to determine the normal cost and actuarial liability.
64
The status of the postretirement benefit programs was as follows:
(in thousands) | 2006 | 2005 | ||||||
Projected postretirement benefit obligation: | ||||||||
Balance at beginning of period | $ | 70,229 | $ | 71,988 | ||||
Service cost | 1,217 | 1,423 | ||||||
Interest cost | 3,682 | 4,030 | ||||||
Plan amendment | — | (444 | ) | |||||
Actuarial gain | (7,758 | ) | (2,333 | ) | ||||
Benefits paid | (3,552 | ) | (4,435 | ) | ||||
Balance at end of period (September 30) | $ | 63,818 | $ | 70,229 | ||||
Plan assets: | ||||||||
Fair value of plan assets at beginning of period | $ | 73,552 | $ | 65,484 | ||||
Actual return on plan assets | 6,387 | 8,294 | ||||||
Employer contributions | 1,552 | 4,209 | ||||||
Benefits paid | (3,552 | ) | (4,435 | ) | ||||
Fair value of plan assets at end of period (September 30) | $ | 77,939 | $ | 73,552 | ||||
Before reflecting SFAS 158: | ||||||||
Amounts recognized in the consolidated balance sheets: | ||||||||
Funded status of plan | $ | 14,121 | $ | 3,323 | ||||
Unrecognized actuarial gain | (27,949 | ) | (19,626 | ) | ||||
Unrecognized net transition obligation | 13,409 | 15,326 | ||||||
Employer contributions (October 1 to December 31) | 268 | 626 | ||||||
Accrued benefit asset (liability) (December 31) | $ | (151 | ) | $ | (351 | ) | ||
After reflecting SFAS 158: | ||||||||
Funded status of plan | $ | 14,121 | — | |||||
Employer contributions (October 1 to December 31) | 268 | — | ||||||
Net pension asset (December 31) | $ | 14,389 | — | |||||
Noncurrent assets | $ | 14,389 | — | |||||
Current liabilities | — | — | ||||||
Noncurrent liabilities | — | — | ||||||
Net asset recognized (December 31) | $ | 14,389 | — | |||||
Amounts recognized to accumulated other comprehensive income: | ||||||||
Transition obligation, net of taxes of $640 | $ | 1,188 | — | |||||
Net actuarial gain, net of taxes of ($2,070) | (3,845 | ) | — | |||||
Total accumulated other comprehensive income (December 31) | $ | (2,657 | ) | — | ||||
(in thousands) | ||||||||
| 2007 | 2006 | |||||||
Projected postretirement benefit obligation: | ||||||||
Balance at beginning of period | $ | 63,818 | $ | 70,229 | ||||
Service cost | 1,022 | 1,217 | ||||||
Interest cost | 3,693 | 3,682 | ||||||
Actuarial (gain) loss | 14,395 | (7,758 | ) | |||||
Benefits paid | (3,953 | ) | (3,552 | ) | ||||
Balance at end of period (September 30) | $ | 78,975 | $ | 63,818 | ||||
Plan assets: | ||||||||
Fair value of plan assets at beginning of period | $ | 77,939 | $ | 73,552 | ||||
Actual return on plan assets | 11,493 | 6,387 | ||||||
Employer contributions | 1,181 | 1,552 | ||||||
Benefits paid | (3,953 | ) | (3,552 | ) | ||||
Fair value of plan assets at end of period (September 30) | $ | 86,660 | $ | 77,939 | ||||
Before reflecting SFAS 158: | ||||||||
Amounts recognized in the consolidated balance sheets: | ||||||||
Funded status of plan | $ | - | $ | 14,121 | ||||
Unrecognized actuarial gain | - | (27,949 | ) | |||||
Unrecognized net transition obligation | - | 13,409 | ||||||
Employer contributions (October 1 to December 31) | - | 268 | ||||||
Accrued benefit liability (December 31) | $ | - | $ | (151 | ) | |||
After reflecting SFAS 158: |
| |||||||
Funded status of plan | $ | 7,685 | $ | 14,121 | ||||
Employer contributions (October 1 to December 31) | 234 | 268 | ||||||
Net pension asset (December 31) | $ | 7,919 | $ | 14,389 | ||||
Noncurrent assets | $ | 7,919 | $ | 14,389 | ||||
Net asset recognized (December 31) | $ | 7,919 | $ | 14,389 | ||||
Amounts recognized to accumulated other comprehensive income (loss): | ||||||||
Transition obligation, net of taxes of $585 and $640 | $ | 1,086 | $ | 1,188 | ||||
Net actuarial gain, net of taxes of ($1,141) and ($2,070) | (2,119 | ) | (3,845 | ) | ||||
Total accumulated other comprehensive loss (December 31) | $ | (1,033 | ) | $ | (2,657 | ) | ||
Alagasco establishedrecognized a regulatory liability of $6.2 million and $10.5 million as of December 31, 2006.2007 and 2006, respectively. This amount will reduce recovery rates in future periods in accordance with SFAS No. 71.
Other changes in postretirement plan assets and projected benefit obligations recognized in other comprehensive income during 2007 were as follows:
(in thousands) | ||||
Net actuarial loss experienced during the year | $ | 2,464 | ||
Amortization of net actuarial gain | 279 | |||
Amortization of transition obligation | (246 | ) | ||
Total recognized in other comprehensive loss (December 31) | $ | 2,497 | ||
Estimated amounts to be amortized from accumulated other comprehensive income into benefit cost during 20072008 are as follows:
(in thousands) | ||||
Amortization of transition obligation | $ | 246 | ||
Amortization of net actuarial gain | $ | (281 | ) | |
(in thousands) | |||
Amortization of transition obligation | $ 259 | ||
Amortization of net actuarial gain | $ (120 | ) | |
Weighted average rate assumptions used to determine postretirement benefit obligations at the measurement date:
| September 30, 2006 | September 30, 2005 | September 30, 2007 | September 30, 2006 | ||||||||
Discount rate | 5.95 | % | 5.50 | % | 6.40 | % | 5.95% | ||||
Rate of compensation increase for pay-related plans | 3.70 | % | 3.50 | % | 3.65 | % | 3.70% | ||||
65
Net periodic postretirement benefit expense included the following:
Years ended December 31, (in thousands) | 2006 | 2005 | 2004 | 2007 | 2006 | 2005 | ||||||||||||||||||
Components of net periodic benefit cost: | ||||||||||||||||||||||||
Service cost | $ | 1,217 | $ | 1,423 | $ | 1,837 | $ | 1,023 | $ | 1,217 | $ | 1,423 | ||||||||||||
Interest cost | 3,682 | 4,030 | 4,216 | 3,693 | 3,682 | 4,030 | ||||||||||||||||||
Expected long-term return on assets | (4,858 | ) | (4,335 | ) | (4,253 | ) | (5,002 | ) | (4,858 | ) | (4,335 | ) | ||||||||||||
Actuarial gain | (884 | ) | (274 | ) | (414 | ) | (1,260 | ) | (884 | ) | (274 | ) | ||||||||||||
Prior service costs | — | 4 | 4 | — | — | 4 | ||||||||||||||||||
Transition amortization | 1,917 | 1,967 | 1,967 | 1,917 | 1,917 | 1,967 | ||||||||||||||||||
Net periodic expense | $ | 1,074 | $ | 2,815 | $ | 3,357 | $ | 371 | $ | 1,074 | $ | 2,815 | ||||||||||||
Net periodic postretirement benefit expense for Alagasco was $300,000, $971,000 $2,273,000 and $2,573,000$2,273,000 for the years ended December 31, 2007, 2006 2005 and 2004,2005, respectively.
Weighted average rate assumptions to determine net periodic benefit costs for the years ending:
| December 31, 2006 | December 31, 2005 | December 31, 2004 | December 31, 2007 | | December 31, 2006 | | December 31, 2005 | | ||||||||||
Discount rate | 5.50 | % | 5.75 | % | 5.94 | % | 5.95 | % | 5.50 | % | 5.75 | % | ||||||
Expected long-term return on plan assets | 8.50 | % | 8.50 | % | 8.75 | % | 8.25 | % | 8.50 | % | 8.50 | % | ||||||
Rate of compensation increase | 3.50 | % | 4.00 | % | 4.00 | % | 3.70 | % | 3.50 | % | 4.00 | % | ||||||
Assumed post-65 health care cost trend rates used to determine the postretirement benefit obligation at the measurement date:
| September 30, 2006 | September 30, 2005 | September 30, 2007 | September 30, 2006 | |||||||||
Health care cost trend rate assumed for next year | 10.00 | % | 10.00 | % | 9.50 | % | 10.00 | % | ||||
Rate to which the cost trend rate is assumed to decline | 5.00 | % | 5.00 | % | 5.50 | % | 5.00 | % | ||||
Year that rate reaches ultimate rate | 2011 | 2010 | 2011 | 2011 | ||||||||
Assumed health care cost trend rates used in determining the accumulated postretirement benefit obligation have an effect on the amounts reported. For example, increasing the weighted average health care cost trend rate by 1 percentage point would have the following effects:
(in thousands) | 1-Percentage Point Increase | ||
Effect on total of service and interest cost | $ | 423 | |
Effect on net postretirement benefit obligation | $ | 3,621 | |
(in thousands) | |||
| 1-Percentage Point Increase | |||
Effect on total of service and interest cost | $ | 306 | |
Effect on net postretirement benefit obligation | $ | 4,916 |
The Company’s weighted-average postretirement benefit program asset allocations by asset category were as follows:
| Target | December 31, 2006 | December 31, 2005 | Target | December 31, 2007 | | December 31, 2006 | | |||||||||||
Asset category: | ||||||||||||||||||
Equity securities | 70 | % | 71 | % | 71 | % | 70 | % | 70 | % | 71 | % | ||||||
Debt securities | 20 | % | 20 | % | 20 | % | 30 | % | 30 | % | 20 | % | ||||||
Other | 10 | % | 9 | % | 9 | % | 0 | % | 0 | % | 9 | % | ||||||
Total | 100 | % | 100 | % | 100 | % | 100 | % | 100 | % | 100 | % | ||||||
Equity securities for the postretirement benefit programs do not include the Company’s common stock. The Company expects to make discretionary contributions of $371,000$2.2 million to postretirement benefit program assets during 2007.2008.
66
The following postretirement benefit payments, which reflect expected future service, are anticipated to be paid:
(in thousands) | ||||||||
2007 | $ | 4,073 | ||||||
2008 | $ | 4,219 | $ | 4,867 | ||||
2009 | $ | 4,364 | $ | 5,088 | ||||
2010 | $ | 4,522 | $ | 5,303 | ||||
2011 | $ | 4,670 | $ | 5,519 | ||||
2012-2016 | $ | 24,701 | ||||||
2012 | $ | 5,689 | ||||||
2013-2017 | $ | 30,277 | ||||||
The following benefits reflect the expected prescription drug subsidy related to the Medicare Prescription Drug, Improvement and Modernization Act of 2003 (Act). The Act includes a prescription drug benefit under Medicare Part D as well as a federal subsidy beginning in 2007:
(in thousands) | |||||||||
2007 | $ | (367 | ) | ||||||
2008 | $ | (390 | ) | $ (363 | ) | ||||
2009 | $ | (410 | ) | $ (382 | ) | ||||
2010 | $ | (421 | ) | $ (393 | ) | ||||
2011 | $ | (427 | ) | $ (401 | ) | ||||
2012-2016 | $ | (2,120 | ) | ||||||
2012 | $ (405 | ) | |||||||
2013-2017 | $ (1,958 | ) | |||||||
For retirement plans and other postretirement plans, certain financial assumptions are used in determining the Company’s projected benefit obligation. These assumptions are examined periodically by the Company, and any required changes are reflected in the subsequent determination of projected benefit obligations.
The Company employs a total return investment approach whereby a mix of equities and fixed income investments are used to maximize the long-term return of plan assets with a prudent level of risk. Risk tolerance is established through consideration of plan liabilities, plan funded status, corporate financial condition, and market conditions.
The Company has developed an investment strategy that focuses on asset allocation, diversification and quality guidelines. The investment goals of the Company are to obtain an adequate level of return to meet future obligations of the plan by providing above average risk-adjusted returns with a risk exposure in the mid-range of comparable funds. Investment managers are retained by the Company to manage separate pools of assets. Funds are allocated to such managers in order to achieve an appropriate, diversified, and balanced asset mix. Comparative market and peer group benchmarks are utilized to ensure that investment managers are performing satisfactorily.
The Company based its expected return on long-term investment expectations. The Company considered past performance and current expectations for assets held by the plan as well as the expected long-term allocation of plan assets. At December 31, 2006,2007, the expected return on plan assets was 8.25%.
The Company has a long-term disability plan covering most employees. The Company had expense for the years ended December 31, 2007, 2006 and 2005 of $382,000, $304,000 and 2004 of $304,000, $483,000 and $938,000,$438,000, respectively.
6. COMMON STOCK PLANS*PLANS
Energen Employee Savings Plan (ESP):A majority of Company employees are eligible to participate in the ESP by electing to contribute a portion of their compensation to the ESP. The Company may match a percentage of the contributions and make these contributions in Company common stock (new issue or treasury shares) or in funds for the purchase of Company common stock. Prior to January 1, 2004, employees were allowed to invest their elective contributions in Company stock. Company stock is no longer an investment option for new elective contributions. Vested employees may diversify 100 percent of their ESP Company stock account into other ESP investment options regardless of whether the Company stock was acquired through elective contribution, Company match, Company contribution or reinvestment of earnings.options. The ESP also contains employee stock ownership plan provisions. At December 31, 2006,2007, total shares reserved for issuance equaled 1,080,108. Expense associated with Company contributions to the ESP was $5,237,000, $4,891,000 $4,650,000 and $4,210,000$4,650,000 for the years ended December 31, 2007, 2006 2005 and 2004,2005, respectively.
67
1997 Stock Incentive Plan and 1988 Stock Option Plan:The 1997 Stock Incentive Plan and the Energen 1988 Stock Option Plan provided for the grant of incentive stock options and non-qualified stock options to officers and key employees. The 1997 Stock Incentive Plan also provided for the grant of performance share awards and restricted stock. Under the 1997 Stock Incentive Plan, 5,600,000 shares of Company common stock were reserved for issuance with 1,986,4051,740,054 remaining for issuance as of December 31, 2006.2007. Under the 1988 Stock Option Plan, 1,080,000 shares of Company common stock reserved for issuance have been granted.
Performance Share Awards: The Energen 1997 Stock Incentive Plan provided for the grant of performance share awards, with each unit equal to the market value of one share of common stock, to eligible employees based on predetermined Company performance criteria at the end of a four-year award period. On January 25, 2006, the Company amended its 1997 Stock Incentive Plan to provide that payment of earned performance share awards be made in the form of Company common stock, with no portion of an award paid in cash. This amendment affected 29 participants. Prior to the amendment, payment of performance awards could be made in cash or in a combination of Company common stock or cash. The impact of this modification was not significant to the Company.
1997 Stock Incentive Plan performance share awards granted or modified after the adoption of SFAS No. 123R have been valued in a Monte Carlo model. The Monte Carlo model uses historical volatility and other variables to estimate the probability of satisfying the market condition of the award. For performance share awards granted prior to the adoption of SFAS No. 123R, the Company estimated fair value based on the quoted market price of the Company’s common stock and adjusted each period for the expected payout ratio.
No performance share awards were granted in 2007. A summary of performance share award activity as of December 31, 2006,2007, and transactions during the years ended December 31, 2007, 2006 2005 and 20042005 are presented below:
| 1997 Stock Incentive Plan | ||||||
| Shares | Weighted Average Price | |||||
Nonvested at December 31, 2003 | 599,640 | $ | 22.89 | |||
Granted | 136,300 | 21.38 | ||||
Paid | (145,860 | ) | 25.99 | |||
Forfeitures | (15,260 | ) | 14.37 | |||
Nonvested at December 31, 2004 | 574,820 | $ | 38.18 | |||
Granted | 117,540 | 29.16 | ||||
Paid | (214,640 | ) | 51.80 | |||
Nonvested at December 31, 2005 | 477,720 | $ | 40.26 | |||
Granted | 111,990 | 43.81 | ||||
Forfeitures | (847 | ) | 43.81 | |||
Nonvested at December 31, 2006 | 588,863 | $ | 40.81 | |||
| 1997 Stock Incentive Plan | |||||
| Shares | Weighted Average Price | ||||
Nonvested at December 31, 2004 | 574,820 | $ 38.18 | |||
Granted | 117,540 | 29.16 | |||
Paid | (214,640 | ) | 51.80 | ||
Nonvested at December 31, 2005 | 477,720 | 40.26 | |||
Granted | 111,990 | 43.81 | |||
Forfeitures | (847 | ) | 43.81 | ||
Nonvested at December 31, 2006 | 588,863 | 40.81 | |||
Paid | (225,960 | ) | 30.53 | ||
Nonvested at December 31, 2007 | 362,903 | $ 49.87 | |||
The Company recorded expense of $4,254,000, $8,779,000 $9,338,000 and $8,708,000$9,338,000 for the years ended December 31, 2007, 2006 2005 and 2004,2005, respectively, for performance share awards with a related deferred income tax benefit of $1,608,000, $3,319,000 $3,531,000 and $3,292,000,$3,531,000, respectively. As of December 31, 2006,2007, there was $5.3 million$1,963,000 of total unrecognized compensation cost related to performance share awards. These awards have a weighted average requisite service period of 1.721.27 years from the date of grant.
Stock Options: The 1997 Stock Incentive Plan and the Energen 1988 Stock Option Plan provided for the grant of incentive stock options, non-qualified stock options, or a combination thereof to officers and key employees. Options granted under the Plans provide for the purchase of Company common stock at not less than the fair market value on the date the option is granted. The sale or transfer of the shares is limited during certain periods. All outstanding options are incentive or non-qualified, vest within three years from date of grant, and expire 10 years from the grant date.
68
A summary of stock option activity as of December 31, 2006,2007, and transactions during the years ended December 31, 2007, 2006 2005 and 20042005 are presented below:
| 1997 Stock Incentive Plan | 1988 Stock Option Plan | 1997 Stock Incentive Plan | 1988 Stock Option Plan | |||||||||||||||||||
| Shares | Weighted Average Exercise Price | Shares | Weighted Average Exercise Price | Shares | Weighted Average Exercise Price | Shares | Weighted Average Exercise Price | |||||||||||||||
Outstanding at December 31, 2003 | 970,840 | $ | 11.97 | 206,000 | $ | 7.20 | ||||||||||||||||
Outstanding at December 31, 2004 | 695,240 | $ 13.72 | 58,000 | $ 7.39 | ||||||||||||||||||
Exercised | (80,140 | ) | 11.26 | (30,000 | ) | 5.77 | ||||||||||||||||
Forfeited | (1,700 | ) | 14.86 | - | - | |||||||||||||||||
Outstanding at December 31, 2005 | 613,400 | 14.04 | 28,000 | 9.13 | ||||||||||||||||||
Exercised | (206,322 | ) | 13.18 | (7,000 | ) | 9.13 | ||||||||||||||||
Outstanding at December 31, 2006 | 407,078 | 14.69 | 21,000 | 9.13 | ||||||||||||||||||
Granted | 82,760 | 21.38 | —�� | — | 239,545 | 46.71 | - | - | ||||||||||||||
Exercised | (349,960 | ) | 10.83 | (148,000 | ) | 7.12 | (180,284 | ) | 15.59 | (21,000 | ) | 9.13 | ||||||||||
Forfeited | (8,400 | ) | 12.26 | — | — | |||||||||||||||||
Outstanding at December 31, 2004 | 695,240 | 13.72 | 58,000 | 7.39 | ||||||||||||||||||
Exercised | (80,140 | ) | 11.26 | (30,000 | ) | 5.77 | ||||||||||||||||
Forfeited | (1,700 | ) | 14.86 | — | — | |||||||||||||||||
Outstanding at December 31, 2005 | 613,400 | 14.04 | 28,000 | 9.13 | ||||||||||||||||||
Exercised | (206,322 | ) | 13.18 | (7,000 | ) | 9.13 | ||||||||||||||||
Outstanding at December 31, 2006 | 407,078 | $ | 14.69 | 21,000 | $ | 9.13 | ||||||||||||||||
Exercisable at December 31, 2004 | 497,100 | $ | 10.62 | 58,000 | $ | 7.39 | ||||||||||||||||
Outstanding at December 31, 2007 | 466,339 | $ 30.79 | - | $ - | ||||||||||||||||||
Exercisable at December 31, 2005 | 415,260 | $ | 10.48 | 28,000 | $ | 9.13 | 415,260 | $ 10.48 | 28,000 | $ 9.13 | ||||||||||||
Exercisable at December 31, 2006 | 324,318 | $ | 12.98 | 21,000 | $ | 9.13 | 324,318 | $ 12.98 | 21,000 | $ 9.13 | ||||||||||||
Remaining reserved for issuance at December 31, 2006 | 1,986,405 | — | — | — | ||||||||||||||||||
Exercisable at December 31, 2007 | 226,794 | $ 13.97 | - | $ - | ||||||||||||||||||
Remaining reserved for issuance at | 1,740,054 | - | - | - | ||||||||||||||||||
The Company granted options for 232,285 shares during the first quarter of 2007 and 7,260 shares during the second quarter of 2007 with weighted-average grant-date fair values of $17.33 and $20.05, respectively. The Company uses the Black-Scholes pricing model to calculate the fair values of the options awarded. For purposes of this valuation the following assumptions were used to derive the fair values: a 6 year time of exercise; an annualized volatility rate of 27.3 percent and 25.2 percent for the first and second quarters of 2007, respectively; a risk-free interest rate of 4.75 percent and 5 percent for the first and second quarters of 2007, respectively; and a dividend yield of zero to reflect dividend protection in award provisions. The Company granted no stock options during 2006 and 2005. The Company granted 82,760 shares during 2004 which had a weighted average grant-date fair value of $7.11. The Company recorded stock option expense of $3,124,000, $196,000 $465,000 and $465,000 during the years ended December 31, 2007, 2006 and 2005, and 2004, respectively, for these shares with a related deferred tax benefit of $1,181,000, $41,000 $107,000 and $107,000 respectively.
The total intrinsic value of stock options exercised during the year ended December 31, 2006,2007, was $5,573,000.$7,161,000. During the year ended December 31, 2006,2007, the total intrinsic value of stock appreciation rights exercised was $1,034,000.$1,095,000. During the year ended December 31, 2006,2007, the Company received cash of $1,565,000$3,908,000 from the exercise of stock options and paid $608,000 in settlement of stock appreciation rights. Total intrinsic value for outstanding options as of December 31, 2006,2007, was $13.9 million$15,664,000 and $11.8 million$11,468,000 for exercisable options. The fair value of options vested for the year ended December 31, 20062007 was $3.3 million.$588,000. As of December 31, 2006,2007, there was no$1,038,000 of unrecognized compensation cost related to outstanding nonvested stock options.
The following table summarizes options outstanding as of December 31, 2006:2007:
1997 Stock Incentive Plan | 1997 Stock Incentive Plan | 1988 Stock Option Plan | 1997 Stock Incentive Plan | |||||||||||
Range of Exercise Prices | Shares | Weighted Average | Range of Exercise Prices | Shares | Weighted Average | Shares | Weighted Average Remaining Contractual Life | |||||||
$9.13-$9.41 | 50,502 | 2.27 years | $9.13 | 21,000 | 0.92 years | 34,102 | 1.43 years | |||||||
$13.72 | 87,600 | 3.83 years | — | — | — | 57,250 | 2.83 years | |||||||
$11.32 | 64,206 | 4.83 years | — | — | — | 37,880 | 3.83 years | |||||||
$14.86 | 122,010 | 6.08 years | — | — | — | 69,080 | 5.08 years | |||||||
$21.38 | 82,760 | 7.08 years | — | — | — | 28,482 | 6.08 years | |||||||
$9.13-$21.38 | 407,078 | 5.13 years | $9.13 | 21,000 | 0.92 years | |||||||||
$46.45 | 232,285 | 9.00 years | ||||||||||||
$55.08 | 7,260 | 9.50 years | ||||||||||||
$9.13-$55.08 | 466,339 | 6.52 years | ||||||||||||
69
The weighted average remaining contractual life of currently exercisable stock options is 4.413.88 years as of December 31, 2006.2007.
Restricted Stock: In addition, the 1997 Stock Incentive Plan provided for the grant of restricted stock which have been valued based on the quoted market price of the Company’s common stock at the date of grant. A summary of restricted stock activity as of December 31, 2006,2007, and transactions during the years ended December 31, 2007, 2006 2005 and 20042005 is presented below:
| 1997 Stock Incentive Plan | 1997 Stock Incentive Plan | ||||||||||
| Shares | Weighted Average Price | Shares | Weighted Average Price | ||||||||
Nonvested at December 31, 2003 | 141,274 | $ | 13.80 | ||||||||
Nonvested at December 31, 2004 | 221,028 | $ 18.99 | |||||||||
Granted | 131,520 | 21.90 | 44,040 | 29.16 | |||||||
Vested | (47,606 | ) | 11.81 | (21,424 | ) | 22.46 | |||||
Forfeited | (4,160 | ) | 17.02 | (1,200 | ) | 29.16 | |||||
Nonvested at December 31, 2004 | 221,028 | 18.99 | |||||||||
Nonvested at December 31, 2005 | 242,444 | 20.48 | |||||||||
Granted | 44,040 | 29.16 | 44,750 | 40.10 | |||||||
Vested | (21,424 | ) | 22.46 | (59,764 | ) | 14.99 | |||||
Forfeited | (1,200 | ) | 29.16 | (1,600 | ) | 29.16 | |||||
| �� | |||||||||||
Nonvested at December 31, 2005 | 242,444 | 20.48 | |||||||||
Nonvested at December 31, 2006 | 225,830 | 25.76 | |||||||||
Granted | 44,750 | 40.10 | 6,805 | 46.45 | |||||||
Vested | (59,764 | ) | 14.99 | (95,040 | ) | 21.18 | |||||
Forfeited | (1,600 | ) | 29.16 | ||||||||
Nonvested at December 31, 2006 | 225,830 | $ | 25.76 | ||||||||
Nonvested at December 31, 2007 | 137,595 | $ 29.94 | |||||||||
The Company recorded expense of $908,000, $2,252,000 $1,800,000 and $1,390,000$1,800,000 for the years ended December 31, 2007, 2006 2005 and 2004,2005, respectively, related to restricted stock, with a related deferred income tax benefit of $343,000, $851,000 $681,000 and $526,000,$681,000, respectively. As of December 31, 2006,2007, there was $1.7 million$1,092,000 of total unrecognized compensation cost related to nonvested restricted stock awards recorded in premium on capital stock. These awards have a requisite service period of 1.51.19 years from the date of grant. The Company has typically funded options, restricted stock obligations and performance share obligations through original issue shares.
2004 Stock Appreciation Rights Plan:The Energen 2004 Stock Appreciation Rights Plan provided for the payment of cash incentives measured by the long-term appreciation of Company stock. These awards are liability awards which settle in cash and are re-measured each reporting period until settlement. These awards have a three year requisite service period. Awards granted prior to January 1, 2006 were valued using the intrinsic value method. During 2007, 85,906 awards were granted with stock appreciation rights. These awards had a weighted average grant-date fair value of $26.79 as of December 31, 2007 which was calculated using the Black-Scholes pricing model. For purposes of this valuation the following assumptions were used to derive the fair value: an expected life of the award of 5.6 years; an annualized volatility rate of 24.2 percent; a risk-free interest rate of 3.58 percent; and a dividend yield of 0.7 percent. There were no awards granted with stock appreciation rights in 2006 or 2005. During 2004, 25,000 awards were granted with stock appreciation rights. Expense associated with stock appreciation rights of $1,933,000, $1,218,000 $1,326,000 and $916,000$1,326,000 was recorded for the years ended December 31, 2007, 2006 2005 and 2004,2005, respectively.
2005 Petrotech Incentive Plan:The Energen Resources’ 2005 Petrotech Incentive Plan provided for the grant of restricted stock equivalent units which may include market conditions. These awards are liability awards which settle in cash and are re-measured each reporting period until settlement.settlement and have a three year vesting period. Effective January 1, 2006, the fair value of the restricted stock equivalent units with a market condition was calculated using a Monte Carlo approach. Restricted stockStock equivalent units with service conditions were valued based on the Company’s stock price at the end of the period adjusted to remove the present value of future dividends. Prior to the implementation of SFAS No. 123R, these awards were valued using the Company’s common stock price at each period end.
During 2007, Energen Resources awarded 5,242 stock equivalent units none of which included a market condition. During 2006, Energen Resources awarded 25,720 restricted stock equivalent units of which 22,545 included a market condition. Energen Resources awarded 46,920 restricted stock equivalent units in 2005 of which 23,460 included a market condition. Energen Resources recognized expense of $2,389,000, $791,000 and $534,000 during 2007, 2006 and 2005, respectively, related to these units. There was no expense recognized during 2005 or 2004 related to these units.
70
1997 Deferred Compensation Plan:The 1997 Deferred Compensation Plan allowed officers and non-employee directors to defer certain compensation. Amounts deferred by a participant under the 1997 Deferred Compensation Plan are credited to accounts maintained for a participant in either a stock account or an investment account. The stock account tracks the performance of the Company’s common stock, including reinvestment of dividends. The investment account tracks the performance of certain mutual funds. The Company has funded, and presently plans to continue funding, a trust in a manner that generally tracks participants’ accounts under the 1997 Deferred Compensation Plan. While intended for payment of benefits under the 1997 Deferred Compensation Plan, the trust’s assets remain subject to the claims of the Company’s creditors. Amounts earned under the Deferred Compensation Plan and invested in Company common stock held by the trust have been recorded as treasury stock, along with the related deferred compensation obligation in the Consolidated Statements of Shareholders’ Equity.
Shareholder Rights Plan: On June 24, 1998, the Company adopted a Shareholder Rights Plan (the 1998 Plan) designed to protect shareholders from coercive or unfair takeover tactics. Under certain circumstances, the 1998 Plan provides shareholders with the right to acquire the Company’s Series 1998 Junior Participating Preferred Stock (or, in certain cases, securities of an acquiring person) at a significant discount. Terms and conditions are set forth in a Rights Agreement between the Company and its Rights Agent. Under the 1998 Plan, one half of a right is associated with each outstanding share of common stock. Rights outstanding under the 1998 Plan at December 31, 2006,2007, were convertible into 736,922741,908 shares of Series 1998 Junior Participating Preferred Stock (1/100 share of preferred stock for each full right) subject to adjustment upon occurrence of certain take-over related events. No rights were exercised or exercisable during the period. The price at which the rights would be exercised is $70 per right, subject to adjustment upon occurrence of certain take-over related events. In general, absent certain take-over related events as described in the Plan, the rights may be redeemed prior to the July 27, 2008 expiration for $0.01 per right.
1992 Energen Corporation Directors Stock Plan:In 1992 the Company adopted the Energen Corporation 1992 Directors Stock Plan to pay part of the compensation of its non-employee directors in shares of Company common stock. Under the Plan, 11,503 shares, 11,517 shares 12,116 shares and 10,80012,116 shares were awarded during the years ended December 31, 2007, 2006 2005 and 2004,2005, respectively, leaving 225,445213,942 shares reserved for issuance as of December 31, 2006.2007.
Dividend Reinvestment and Direct Stock Purchase Plan: The Company’s Dividend Reinvestment and Direct Stock Purchase Plan included a direct stock purchase feature which allowed purchases by non-shareholders. As of December 31, 2006,2007, 1,098,292 common shares were reserved under this Plan. Effective December 15, 2006, the Company suspended operations under the Plan and shareholders became eligible to reinvest dividends or make direct stock purchases using the Company’s stock transfer and dividend paying agent, The Bank of New York.
By resolution adopted May 25, 1994, and supplemented by a resolution adopted April 26, 2000 and June 24, 2006, the Board authorized the Company to repurchase up to 12,564,400 shares of the Company’s common stock. There were no shares repurchased pursuant to its repurchase authorization for the years ended December 31, 2007 and 2005. For the year ended December 31, 2006, the Company repurchased 2,158,000 shares pursuant to its repurchase authorization. There were no shares repurchased pursuant to its repurchase authorization for the years ended December 31, 2005 and 2004. As of December 31, 2006,2007, a total of 8,992,700 shares remain authorized for future repurchase. The Company also from time to time acquires shares in connection with participant elections under the Company’s stock compensation plans. For the years ended December 31, 2007, 2006 2005 and 2004,2005, the Company acquired 209,388 shares, 82,707 shares 67,957 shares and 36,04467,957 shares, respectively, in connection with its stock compensation plans.
|
|
7. COMMITMENTS AND CONTINGENCIES
Commitments and Agreements: Certain of Alagasco’s long-term gas procurement contracts for the supply, storage and delivery of natural gas include fixed charges of approximately $212$178 million through October 2015. Alagasco also is committed to purchase minimum quantities of gas at market-related prices or to pay certain costs in the event the minimum quantities are not taken. These purchase commitments are approximately 156.3135.2 Bcf through April 2015.
71
Environmental Matters:Various environmental laws and regulations apply to the operations of Energen Resources and Alagasco. Historically, the cost of environmental compliance has not materially affected the Company’s financial position, results of operations or cash flows and is not expected to do so in the future; however, new regulations, enforcement policies, claims for damages or other events could result in significant unanticipated costs.
A discussion of certain litigation in the state of Louisiana related to the restoration of oilfield properties is included below under Legal Matters.
Alagasco is in the chain of title of nine former manufactured gas plant sites (four of which it still owns), and five manufactured gas distribution sites (one of which it still owns). An investigation of the sites does not indicate the present need for remediation activities. Management expects that, should remediation of any such sites be required in the future, Alagasco’s share, if any, of such costs will not materially affect the financial position of Alagasco.
Legal Matters:Energen and its affiliates are, from time to time, parties to various pending or threatened legal proceedings. Certain of these lawsuits include claims for punitive damages in addition to other specified relief. Based upon information presently available, and in light of available legal and other defenses, contingent liabilities arising from threatened and pending litigation are not considered material in relation to the respective financial positions of Energen and its affiliates. It should be noted, however, that Energen and its affiliates conduct business in Alabama and other jurisdictions in which the magnitude and frequency of punitive and other damage awards may bear little or no relation to culpability or actual damages, thus making it difficult to predict litigation results.
Jefferson County, Alabama
In January 2006, RGGS Land and Minerals LTD, L.P. (RGGS) filed a lawsuit in Jefferson County, Alabama, alleging breach of contract with respect to Energen Resources’ calculation of certain allowed costs and failure to pay in a timely manner certain amounts due RGGS under a mineral lease. RGGS seeks a declaratory judgment with respect to the parties’ rights under the lease, reformation of the lease, monetary damages and termination of Energen Resources’ rights under the lease. The Occluded Gas Lease dated January 1, 1986 was originally between Energen Resources and United States Steel Corporation (U.S. Steel) as lessor. RGGS became the lessor under the lease as a result of a 2004 conveyance from U.S. Steel to RGGS. Approximately 120,000 acres in Jefferson and Tuscaloosa counties, Alabama, are subject to the lease. Separately on February 6, 2006, Energen Resources received notice of immediate lease termination from RGGS. During 2006,2007, Energen Resources’ production associated with the lease was approximately 1010.5 Bcf.
RGGS has adopted positions contrary to the seventeen years of course of dealing between Energen Resources and its original contracting partner, U.S. Steel. The Company believes that RGGS’ assertions are without merit and that the notice of lease termination is ineffective. Energen Resources intends to vigorously defend its rights under the lease. The Company remains in possession of the lease, believes that the likelihood of a judgment in favor of RGGS is remote, and has made no material accrual with respect to the litigation or purported lease termination.
Enron Corporation
During 2006, Enron and Enron North America Corporation (ENA) have settled with Energen Resources and Alagasco related to the Enron and ENA bankruptcy proceedings. Under the settlement, Energen Resources was allowed claims in the bankruptcy cases against Enron and ENA of $12.5 million each. In December 2006, Energen Resources sold its claims against Enron and ENA for a gain of $6.7 million after-tax. All other claims have been released.
Legacy Litigation
During recent years, numerous lawsuits have been filed against oil production companies in Louisiana for restoration of oilfield properties. These suits are referred to in the industry as “legacy litigation” because they usually involve operations that were conducted on the affected properties many years earlier. Energen Resources is
72
or has been a party to several legacy litigation lawsuits, most of which result from the operations of predecessor companies. Based upon information presently available, and in light of available legal and other defenses, contingent liabilities arising from legacy litigation in excess of the Company’s accrued provision for estimated liability are not considered material to the Company’s financial position.
Other
Various other pending or threatened legal proceedings are in progress currently, and the Company has accrued a provision for estimated liability.
Lease Obligations: Alagasco leases the Company’s headquarters building over a 25-year term and the related lease is accounted for as an operating lease. Under the terms of the lease, Alagasco has a renewal option; the lease does not contain a bargain purchase price or a residual value guarantee. Energen’s total lease payments related to leases included as operating lease expense were $18,212,000, $15,845,000 $13,628,000 and $10,638,000$13,628,000 for the years ended December 31, 2007, 2006 2005 and 2004,2005, respectively. Minimum future rental payments required after 20062007 under leases with initial or remaining noncancelable lease terms in excess of one year are as follows:
| Years Ending December 31,(in thousands) | ||||||||||||||||
| 2007 | 2008 | 2009 | 2010 | 2011 | 2012 and thereafter | |||||||||||
| $ | 3,772 | $ | 3,330 | $ | 3,252 | $ | 3,113 | $ | 3,121 | $ | 29,589 | |||||
| Years Ending December 31,(in thousands) | ||||||||||
| 2008 | 2009 | 2010 | 2011 | 2012 | 2013 and thereafter | |||||
| $ 4,128 | $ 4,258 | $ 3,834 | $ 3,661 | $ 3,678 | $ 26,588 | |||||
Alagasco’s total payments related to leases included as operating expense were $3,180,000, $3,310,000 $3,148,000 and $2,728,000$3,148,000 for the years ended December 31, 2007, 2006 2005 and 2004,2005, respectively. Minimum future rental payments required after 20062007 under leases with initial or remaining noncancelable lease terms in excess of one year are as follows:
| Years Ending December 31,(in thousands) | ||||||||||||||||
| 2007 | 2008 | 2009 | 2010 | 2011 | 2012 and thereafter | |||||||||||
| $ | 3,171 | $ | 3,102 | $ | 3,102 | $ | 3,113 | $ | 3,121 | $ | 29,589 | |||||
| Years Ending December 31,(in thousands) | ||||||||||
| 2008 | 2009 | 2010 | 2011 | 2012 | 2013 and thereafter | |||||
| $ 3,139 | $ 3,147 | $ 3,113 | $ 3,121 | $ 3,137 | $ 26,452 | |||||
8. FINANCIAL INSTRUMENTS AND RISK MANAGEMENT
Financial Instruments: The stated value of cash and cash equivalents, trade receivables (net of allowance), and short-term debt approximates fair value due to the short maturity of the instruments. The fair value of Energen’s long-term debt, including the current portion, with a carrying value of $683,756,000$573,467,000 would be $704,719,000$595,146,000 at December 31, 2006.2007. The fair value of Alagasco’s fixed-rate long-term debt, including the current portion, with a carrying value of $208,756,000$208,467,000 would be $203,622,000$203,237,000 at December 31, 2006.2007. The fair values were based on current market prices.
Alagasco purchases gas as an agent for certain of its large commercial and industrial customers. Alagasco has in certain instances provided commodity-related guarantees to counterparties in order to facilitate these agency purchases. Liabilities existing for gas delivered to customers subject to these guarantees are included in the consolidated balance sheet. In the event the customer for whom the guarantee was entered fails to take delivery of the gas, Alagasco can sell such gas for the customer, with the customer liable for any resulting loss. Although the substantial majority of purchases under these guarantees are for the customers’ current monthly consumption and are at current market prices, in some instances, the purchases are for an extended term at a fixed price. At December 31, 2006,2007, the fixed price purchased under these guarantees had a maximum term outstanding through December 20072008 with an aggregate purchase price of $11.3$9.3 million and a market value of $9.5$8.8 million.
Alagasco had an agreement with a financial institution whereby it could sell on an ongoing basis, with recourse, certain installment receivables related to its merchandising program. Effective February 1, 2004, Alagasco no longer sells its installment receivables. At December 31, 2006 and 2005, the balances of these installment receivables were $510,000 and $1,589,000, respectively. Receivables sold under this agreement were considered financial instruments with off-balance sheet risk. Alagasco’s exposure to credit loss in the event of non-performance by customers is represented by the balance of installment receivables. The fair value of these guarantees is recorded as a non-current other liability.
Price Risk: The Company applies SFAS No. 133 as amended which requires all derivatives to be recognized on the balance sheet and measured at fair value. If a derivative is designated as a cash flow hedge, the effectiveness of the hedge, or the degree that the gain (loss) for the hedging instrument offsets the loss (gain) on the hedged item, is measured at each reporting period. The effective portion of the gain or loss on the derivative instrument is recognized in other comprehensive income as a component of equity and subsequently reclassified into earnings in operating revenues when the forecasted transaction affects earnings. The ineffective portion of a derivative’s change in fair value is required to be recognized in operating revenues immediately. Derivatives that do not qualify for hedge treatment under SFAS No. 133 must be recorded at fair value with gains or losses recognized in operating revenues in the period of change.
73
Energen Resources periodically enters into cash flow derivative commodity instruments to hedge its price exposure on its estimated oil, natural gas and natural gas liquids production. In addition, Alagasco periodically enters into cash flow derivative commodity instruments to hedge its exposure to price fluctuations on its gas supply. Such instruments may include regulated natural gas and crude oil futures contracts traded on the New York Mercantile Exchange and over-the-counter swaps, collars and basis hedges with major energy derivative product specialists. The counterparties to the commodity instruments are investment banks and energy-trading firms. In some contracts, the amount of credit allowed before Energen Resources or Alagasco collateral must be posted for out-of-the-money hedges varies depending on the credit rating of the Company or Alagasco. In cases where these arrangements exist, the credit ratings must be maintained at investment grade status to have any available counterparty credit. Adverse changes to the Company’s or Alagasco’s credit rating results in decreasing amounts of credit available under these contracts. The counterparties for these contracts do not extend credit to the Company or Alagasco in the event credit ratings are below investment grade. At December 31, 2006,2007, the counterparty agreements under which the Company had active positions did not include collateral posting requirements. Energen Resources was in a net gain position with all but twothree of its counterparties and was not required to post collateral. Energen Resources used various counterparties for its over-the-counter derivatives as of December 31, 2006.a net loss with the remaining four. The Company believes the creditworthiness of these counterparties is satisfactory. The three largest counterparties represented approximately 3854 percent, 2928 percent and 2713 percent of Energen Resources’ gainloss on fair value of derivatives.
As of December 31, 2006, $582007, $37.4 million of deferred net gainslosses on derivative instruments recorded in accumulated other comprehensive income, net of tax, are expected to be reclassified and reported in earnings as operating revenues during the next twelve-month period. The actual amount that will be reclassified to earnings over the next year could vary materially from this amount due to changes in market conditions. Gains and losses on derivative instruments that are not accounted for as cash flow hedge transactions, as well as the ineffective portion of the change in fair value of derivatives accounted for as cash flow hedges, are included in operating revenues in the consolidated financial statements. The Company recorded a $0.8$0.7 million after-tax lossgain in 20062007 for the ineffective portion of the change in fair value of derivatives accounted for as cash flow hedges. Also, the Company recorded an after-tax gain of $0.5$0.2 million in 20062007 on contracts which did not meet the definition of cash flow hedges under SFAS No. 133. As of December 31, 2006,2007, all of the Company’s hedges met the definition of a cash flow hedge. During 2006,2007, the Company discontinued hedge accounting and reclassified gains of $0.5$0.2 million after-tax from OCI into operating revenues when Energen Resources determined it was probable certain forecasted volumes would not occur.
The Company had $31$39.9 million and $56.5$31 million included in current and noncurrent deferred income taxes on the consolidated balance sheets related to items included in other comprehensive income as of December 31, 20062007 and 2005,2006, respectively. The Company had $14 million and $93.3 million of current gains recorded in accounts receivable at December 31, 2006.2007 and 2006 respectively. At December 31, 20062007 and 2005,2006, the Company also had $0.7$79.9 million and $145.9$0.7 million, respectively, of current losses recorded in accounts payablepayable. The Company also had $47.1 million and $11.9 million at both December 31, 2007 and 2006, and 2005,respectively, of non-current losses recorded in deferred credits and other liabilities related to derivative contracts.
74
As of December 31, 2006,2007, Energen Resources entered into the following transactions for 20072008 and subsequent years:
Production Period | Total Hedged Volumes | Average Contract Price | Description | |||||
Natural Gas | ||||||||
2008 | $ | NYMEX Swaps | ||||||
| $ | Basin Specific Swaps | |||||||
2009 | 24.7 Bcf | $7.81 Mcf | Basin Specific Swaps | |||||
Natural Gas Basis Differential | ||||||||
2008 | 12.0 Bcf | * | Basis Swaps | |||||
Oil | ||||||||
2008 | $ | |||||||
| NYMEX Swaps | ||||||||
| 2009 | $71.03 Bbl | NYMEX Swaps | ||||||
| 2010 | 720 MBbl | $81.20 Bbl | NYMEX Swaps | |||||
Oil Basis Differential | ||||||||
| Basis Swaps | ||||||||
| Basis Swaps | ||||||||
Natural Gas Liquids | ||||||||
| $ | Liquids Swaps | |||||||
| 2009 | 20.2 MMGal | $1.05 Gal | Liquids Swaps | ||||
* | Average contract prices not meaningful due to the varying nature of each contract | ||||||
All hedge transactions are subject to the Company’s risk management policy, approved by the Board of Directors, which does not permit speculative positions. The Company formally documents all relationships between hedging instruments and hedged items at the inception of the hedge, as well as its risk management objective and strategy for undertaking the hedge. This process includes specific identification of the hedging instrument and the hedge transaction, the nature of the risk being hedged and how the hedging instrument’s effectiveness in hedging the exposure to the hedged transaction’s variability in cash flows attributable to the hedged risk will be assessed and measured. Both at the inception of the hedge and on an ongoing basis, the Company assesses whether the derivatives that are used in hedging transactions are highly effective in offsetting changes in cash flows of hedged items. The Company discontinues hedge accounting if a derivative has ceased to be a highly effective hedge. The maximum term over which Energen Resources has hedged exposures to the variability of cash flows is through December 31, 2009.2010.
At December 31, 2007, Alagasco recorded a $0.4 million loss as a liability in accounts payable with a corresponding current regulatory asset representing the fair value of derivatives. At December 31, 2006, Alagasco recorded an $11.5 million loss as a liability in accounts payable with a corresponding current regulatory asset of $11.5 million representing the fair value of derivatives. At December 31, 2005, Alagasco recognized a $6.3 million loss as a liability in accounts payable with a corresponding current regulatory asset of $6.3 million representing the fair value of derivatives. Additionally, as of December 31, 2006, Alagasco recorded a current regulatory liability and a corresponding receivable of $1.2 million related to certain interest rate treasury futures. These futures were entered into by the Company to reduce the interest rate risk associated with a $45 million debt issuance completed by Alagasco in January 2007.
Concentration of Credit Risk:Revenues and related accounts receivable from oil and gas operations primarily are generated from the sale of produced natural gas and oil to natural gas and oil marketing companies. Such sales are typically made on an unsecured credit basis with payment due the month following delivery. This concentration of sales to the energy marketing industry has the potential to affect the Company’s overall exposure to credit risk, either positively or negatively, in that the Company’s oil and gas purchasers may be affected similarly by changes in economic, industry or other conditions. Energen Resources considers the credit quality for its customers and, in certain instances, may require credit assurances such as a deposit, letter of credit or parent guarantee. The fourtwo largest oil and gas purchasers accounted for approximately 25 percent, 14 percent, 1235 percent and 1017 percent of Energen Resources’ accounts receivable for commodity sales as of December 31, 2006.2007. Energen Resources’ other purchasers each accounted for less than 89 percent of this accounts receivable as of December 31, 2006.2007. During the year ended December 31, 2006,2007, one purchaser accounted for approximately 1215 percent of the Company’s total operating revenues.
Natural gas distribution operating revenues and related accounts receivable are generated from state-regulated
utility natural gas sales and transportation to approximately 455,000451,000 residential, commercial and industrial customers located in central and north Alabama. A change in economic conditions may affect the ability of customers to meet their obligations; however, the Company believes that its provision for possible losses on uncollectible accounts receivable is adequate for its credit loss exposure.
75
9. RECONCILIATION OF EARNINGS PER SHARE*SHARE (EPS)
| 2006 | 2005 | 2004 | ||||||||||||||||||||||
Years ended December 31, (in thousands, except per share amounts) | Net Income | Shares | Per Share Amount | Net Income | Shares | Per Share Amount | Net Income | Shares | Per Share Amount | |||||||||||||||
Basic EPS | $ | 273,570 | 72,505 | $ | 3.77 | $ | 173,012 | 73,052 | $ | 2.37 | $ | 127,463 | 72,547 | $ | 1.76 | |||||||||
Effect of dilutive securities | ||||||||||||||||||||||||
Long-range performance shares | 408 | 208 | 212 | |||||||||||||||||||||
Stock options | 252 | 334 | 330 | |||||||||||||||||||||
Restricted stock | 113 | 121 | 28 | |||||||||||||||||||||
Diluted EPS | $ | 273,570 | 73,278 | $ | 3.73 | $ | 173,012 | 73,715 | $ | 2.35 | $ | 127,463 | 73,117 | $ | 1.74 | |||||||||
|
|
Years ended December 31, | ||||||||||||||||||
(in thousands, except per share amounts) | 2007 | 2006 | 2005 | |||||||||||||||
| Net Income | Shares | Per Share Amount | Net Income | Shares | Per Share Amount | Net Income | Shares | Per Share Amount | ||||||||||
Basic EPS | $ 309,233 | 71,592 | $ 4.32 | $ 273,570 | 72,505 | $ 3.77 | $ 173,012 | 73,052 | $ 2.37 | |||||||||
Effect of dilutive securities | ||||||||||||||||||
Performance share awards | 351 | 408 | 208 | |||||||||||||||
Stock options | 158 | 252 | 334 | |||||||||||||||
Non-vested restricted stock | 80 | 113 | 121 | |||||||||||||||
Diluted EPS | $ 309,233 | 72,181 | $ 4.28 | $ 273,570 | 73,278 | $ 3.73 | $ 173,012 | 73,715 | $ 2.35 | |||||||||
For the year ended December 31, 2007, the Company had 239,545 options that were excluded from the computation of diluted EPS, as their effect was non-dilutive. The Company had no options that were excluded from the computation of diluted EPS for years ended December 31, 2006 and 2005. For the years ended December 31, 2007, 2006 2005 and 2004,2005, the Company had no options or shares of non-vested restricted stock that were excluded from the computation of diluted EPS.
10. ASSET RETIREMENT OBLIGATIONS
The Company applies SFAS No. 143, “Accounting for Asset Retirement Obligations,” which requires the Company to record the fair value of a liability for an asset retirement obligation (ARO) in the period in which it is incurred. Subsequent to initial measurement, liabilities are required to be accreted to their present value each period and capitalized costs are depreciated over the estimated useful life of the related assets. Upon settlement of the liability, the Company will settle the obligation for its recorded amount and will record the resultingmay recognize a gain or loss.loss for differences between estimated and actual settlement costs.
In 2007, 2006 2005 and 2004,2005, Energen Resources recognized amounts representing expected future costs associated with site reclamation, facilities dismantlement, and plug and abandonment of wells as follows:
(in thousands) | ||||
Balance of ARO as of December 31, 2003 | $ | 26,515 | ||
Liabilities incurred during the year ended December 31, 2004 | 1,172 | |||
Liabilities settled during the year ended December 31, 2004 | (413 | ) | ||
Revision in estimated cash flows | 5,302 | |||
Accretion expense | 2,265 | |||
Balance of ARO as of December 31, 2004 | 34,841 | |||
Liabilities incurred during the year ended December 31, 2005 | 10,102 | |||
Liabilities settled during the year ended December 31, 2005 | (689 | ) | ||
Revision in estimated cash flows | 3,369 | |||
Accretion expense | 2,647 | |||
Balance of ARO as of December 31, 2005 | 50,270 | |||
Liabilities incurred during the year ended December 31, 2006 | 1,176 | |||
Liabilities settled during the year ended December 31, 2006 | (1,085 | ) | ||
Accretion expense | 3,619 | |||
Balance of ARO as of December 31, 2006 | $ | 53,980 | ||
(in thousands) | ||||
Balance of ARO as of December 31, 2004 | $ | 34,841 | ||
Liabilities incurred during the year ended December 31, 2005 | 10,102 | |||
Liabilities settled during the year ended December 31, 2005 | (689 | ) | ||
Revision in estimated cash flows | 3,369 | |||
Accretion expense | 2,647 | |||
Balance of ARO as of December 31, 2005 | 50,270 | |||
Liabilities incurred during the year ended December 31, 2006 | 1,176 | |||
Liabilities settled during the year ended December 31, 2006 | (1,085 | ) | ||
Accretion expense | 3,619 | |||
Balance of ARO as of December 31, 2006 | 53,980 | |||
Liabilities incurred during the year ended December 31, 2007 | 3,505 | |||
Liabilities settled during the year ended December 31, 2007 | (862 | ) | ||
Accretion expense | 3,948 | |||
Balance of ARO as of December 31, 2007 | $ | 60,571 |
As of December 31, 2005, theThe Company adoptedalso applies FIN 47, “Accounting for Conditional Asset Retirement Obligations,” which clarifies that if a legal obligation to perform an asset retirement activity exists but performance is conditional upon a future event, the liability is required to be recognized in accordance with SFAS 143 if the obligation can be reasonably measured. Alagasco recorded a conditional asset retirement obligationsobligation of $12.8$14.4 million and $13.5$12.8 million to purge and cap its gas pipelines upon abandonment as a regulatory liability under SFAS No. 71 as of December 31, 20062007 and 2005,2006, respectively. The costs associated with asset retirement obligations under FIN 47 are currently either being recovered in rates or are probable of recovery in future rates. Accordingly, the adoption of FIN 47 did not have an impact on the Company’s income statements.
76
Alagasco accrues removal costs on certain gas distribution assets over the useful lives of its property, plant and equipment through depreciation expense in accordance with rates approved by the APSC. In accordance with SFAS No. 71, the accumulated asset removal costs of $114.5$121.6 million and $105.4$114.5 million for December 31, 20062007 and 2005,2006, respectively, are included as regulatory liabilities in deferred credits and other liabilities on the consolidated balance sheets.
11. SUPPLEMENTAL CASH FLOW INFORMATION
Supplemental information concerning Energen’s cash flow activities was as follows:
Years ended December 31, (in thousands) | 2006 | 2005 | 2004 | 2007 | 2006 | 2005 | ||||||||||||
Interest paid, net of amount capitalized | $ | 48,879 | $ | 43,849 | $ | 40,557 | $ | 44,368 | $ | 48,879 | $ | 43,849 | ||||||
Income taxes paid | $ | 60,308 | $ | 32,879 | $ | 8,352 | $ | 154,187 | $ | 60,308 | $ | 32,879 | ||||||
Noncash investing activities: | ||||||||||||||||||
Capitalized depreciation | $ | 99 | $ | 96 | $ | 94 | $ | 97 | $ | 99 | $ | 96 | ||||||
Allowance for funds used during construction | $ | 951 | $ | 792 | $ | 1,247 | $ | 611 | $ | 951 | $ | 792 | ||||||
Noncash financing activities: | ||||||||||||||||||
Issuance of common stock for employee benefit plans | $ | 7,940 | $ | 2,410 | $ | 8,420 | ||||||||||||
Treasury stock acquired in connection with tax | $ | 6,760 | $ | 1,309 | $ | - | ||||||||||||
Under SFAS No. 143, the Company recorded a non-cash adjustment for accretion expense of $3.9 million, $3.6 million and $2.6 million during 2007, 2006 and $2.3 million during 2006, 2005, and 2004, respectively. In December 2006, the Company adopted SFAS No. 158, “Employers’ Accounting for Defined Benefit Pension and Other Postretirement Plans, an amendment of FASB Statements No. 87, 88, 106 and 132 (R).”. In adopting the standard, the Company recognized noncash adjustments to its financial statements as disclosed in Note 5, Employee Benefit Plans.
Supplemental information concerning Alagasco’s cash flow activities was as follows:
Years ended December 31, (in thousands) | 2006 | 2005 | 2004 | 2007 | 2006 | 2005 | |||||||||
Interest paid, net of amount capitalized | $ | 14,683 | $ | 12,664 | $ | 11,248 | $ 12,848 | $ 14,683 | $ 12,664 | ||||||
Income taxes paid | $ | 21,027 | $ | 22,456 | $ | 11,034 | $ 24,579 | $ 21,027 | $ 22,456 | ||||||
Noncash investing activities: | |||||||||||||||
Capitalized depreciation | $ | 99 | $ | 96 | $ | 94 | $ 97 | $ 99 | $ 96 | ||||||
Allowance for funds used during construction | $ | 951 | $ | 792 | $ | 1,247 | $ 611 | $ 951 | $ 792 | ||||||
12. LONG-LIVED ASSETS AND DISCONTINUED OPERATIONS
The Company applies SFAS No. 144, “Accounting for the Impairment or Disposal of Long-Lived Assets,” which retains the previous asset impairment requirements of SFAS No. 121, “Accounting for the Impairment of Long-Lived Assets and for Long-Lived Assets to be Disposed Of,” for loss recognition when the carrying value of an asset exceeds the sum of the undiscounted estimated future cash flows of the asset. In addition, SFAS No. 144 requires that gains and losses in the sale of certain oil and gas properties and impairments on certain properties held-for-sale be reported as discontinued operations, with income or loss from operations of the associated properties reported as income or loss from discontinued operations. The results of operations for held-for-sale properties are reclassified and reported as discontinued operations for prior periods in accordance with SFAS No. 144. Energen Resources may, in the ordinary course of business, be involved in the sale of developed or undeveloped properties. All assets held-for-sale must be reported at the lower of the carrying amount or fair value. Energen Resources had no proved property sales during 2006 or 2004. During 2005, Energen Resources recorded a pre-tax gain of $213,000 primarily from a proved property sale located in the Permian Basin.
The following are the results of operations from discontinued operations:
Years ended December 31, (in thousands, except per share data) | 2006 | 2005 | 2004 | |||||||||
Oil and gas revenues | $ | — | $ | 82 | $ | 531 | ||||||
Pretax income (loss) from discontinued operations | $ | (10 | ) | $ | (10 | ) | $ | 262 | ||||
Income tax expense (benefit) | (4 | ) | (4 | ) | 99 | |||||||
Income (Loss) from Discontinued Operations | (6 | ) | (6 | ) | 163 | |||||||
Gain (loss) on disposal of discontinued operations | 86 | 213 | (8 | ) | ||||||||
Income tax expense (benefit) | 33 | 81 | (3 | ) | ||||||||
Gain (Loss) on Disposal of Discontinued Operations | 53 | 132 | (5 | ) | ||||||||
Total Income from Discontinued Operations | $ | 47 | $ | 126 | $ | 158 | ||||||
Diluted Earnings Per Average Common Share* | ||||||||||||
Income (Loss) from Discontinued Operations | $ | — | $ | — | $ | — | ||||||
Gain (Loss) on Disposal of Discontinued Operations | — | — | — | |||||||||
Total Income (Loss) from Discontinued Operations | $ | — | $ | — | $ | — | ||||||
Basic Earnings Per Average Common Share* | ||||||||||||
Income from Discontinued Operations | $ | — | $ | — | $ | 0.01 | ||||||
Gain (Loss) on Disposal of Discontinued Operations | — | — | — | |||||||||
Total Income from Discontinued Operations | $ | — | $ | — | $ | 0.01 | ||||||
|
|
13. SUMMARIZED QUARTERLY FINANCIAL DATA(Unaudited)
The Company’s business is seasonal in character. The following data summarizes quarterly operating results. The summarized quarterly information may differ from amounts previously reported due to changes in the classification of properties reported as discontinued operations as required by SFAS No. 144 (see Note 12).
| Year Ended December 31, 2006 | Year Ended December 31, 2007 | |||||||||||||||||||
(in thousands, except per share amounts) | First | Second | Third | Fourth** | ||||||||||||||||
(in thousands, except per share amounts) | First | Second | Third | Fourth | ||||||||||||||||
Operating revenues | $ | 488,142 | $ | 282,374 | $ | 242,711 | $ | 380,759 | $ 492,661 | $ 314,922 | $ 276,022 | $ 351,455 | ||||||||
Operating income | $ | 151,735 | $ | 89,298 | $ | 75,669 | $ | 160,598 | $ 173,198 | $ 115,905 | $ 98,632 | $ 134,297 | ||||||||
Income from continuing operations | $ | 87,501 | $ | 49,602 | $ | 41,297 | $ | 95,123 | $ 103,881 | $ 67,903 | $ 58,014 | $ 79,414 | ||||||||
Net income | $ | 87,494 | $ | 49,601 | $ | 41,352 | $ | 95,123 | $ 103,882 | $ 67,903 | $ 58,034 | $ 79,414 | ||||||||
Diluted earnings per average common share | ||||||||||||||||||||
Continuing operations | $ | 1.18 | $ | 0.67 | $ | 0.56 | $ | 1.31 | $ 1.44 | $ 0.94 | $ 0.80 | $ 1.10 | ||||||||
Net income | $ | 1.18 | $ | 0.67 | $ | 0.56 | $ | 1.31 | $ 1.44 | $ 0.94 | $ 0.80 | $ 1.10 | ||||||||
Basic earnings per average common share | ||||||||||||||||||||
Continuing operations | $ | 1.19 | $ | 0.68 | $ | 0.57 | $ | 1.33 | $ 1.45 | $ 0.95 | $ 0.81 | $ 1.11 | ||||||||
Net income | $ | 1.19 | $ | 0.68 | $ | 0.57 | $ | 1.33 | $ 1.45 | $ 0.95 | $ 0.81 | $ 1.11 | ||||||||
| Year Ended December 31, 2005 | ||||||||||||
(in thousands, except per share amounts) | First | Second | Third | Fourth | ||||||||
Operating revenues | $ | 361,008 | $ | 241,624 | $ | 190,681 | $ | 335,081 | ||||
Operating income | $ | 105,130 | $ | 70,747 | $ | 41,071 | $ | 98,776 | ||||
Income from continuing operations | $ | 58,942 | $ | 37,572 | $ | 19,073 | $ | 57,299 | ||||
Net income | $ | 59,046 | $ | 37,573 | $ | 19,086 | $ | 57,307 | ||||
Diluted earnings per average common share* | ||||||||||||
Continuing operations | $ | 0.80 | $ | 0.51 | $ | 0.26 | $ | 0.77 | ||||
Net income | $ | 0.80 | $ | 0.51 | $ | 0.26 | $ | 0.78 | ||||
Basic earnings per average common share* | ||||||||||||
Continuing operations | $ | 0.81 | $ | 0.51 | $ | 0.26 | $ | 0.78 | ||||
Net income | $ | 0.81 | $ | 0.51 | $ | 0.26 | $ | 0.78 | ||||
77
| Year Ended December 31, 2006 | ||||||||
(in thousands, except per share amounts) | First | Second | Third | Fourth* | ||||
Operating revenues | $ 488,142 | $ 282,374 | $ 242,711 | $ 380,759 | ||||
Operating income | $ 151,735 | $ 89,298 | $ 75,669 | $ 160,598 | ||||
Income from continuing operations | $ 87,501 | $ 49,602 | $ 41,297 | $ 95,123 | ||||
Net income | $ 87,494 | $ 49,601 | $ 41,352 | $ 95,123 | ||||
Diluted earnings per average common share | ||||||||
Continuing operations | $ 1.18 | $ 0.67 | $ 0.56 | $ 1.31 | ||||
Net income | $ 1.18 | $ 0.67 | $ 0.56 | $ 1.31 | ||||
Basic earnings per average common share | ||||||||
Continuing operations | $ 1.19 | $ 0.68 | $ 0.57 | $ 1.33 | ||||
Net income | $ 1.19 | $ 0.68 | $ 0.57 | $ 1.33 | ||||
* |
|
| Includes an after-tax gain of $34.5 million on the sale of a 50 percent interest in Energen Resources’ |
Alagasco’s business is seasonal in character and influenced by weather conditions. The following data summarizes Alagasco’s quarterly operating results.
| Year Ended December 31, 2006 | Year Ended December 31, 2007 | |||||||||||||||||||||
(in thousands) | First | Second | Third | Fourth | First | Second | Third | Fourth | ||||||||||||||
Operating revenues | $ | 318,623 | $ | 113,196 | $ | 71,195 | $ | 160,430 | $ 298,628 | $ 111,566 | $ 67,599 | $ 131,675 | ||||||||||
Operating income (loss) | $ | 63,727 | $ | 2,711 | $ | (8,921 | ) | $ | 16,757 | $ 68,437 | $ 4,970 | $ (13,673) | $ 13,008 | |||||||||
Net income (loss) | $ | 37,369 | $ | (531 | ) | $ | (7,673 | ) | $ | 8,133 | $ 40,329 | $ 1,378 | $ (10,541) | $ 5,652 | ||||||||
| Year Ended December 31, 2005 | Year Ended December 31, 2006 | ||||||||||||||||||||
(in thousands) | First | Second | Third | Fourth | First | Second | Third | Fourth | |||||||||||||
Operating revenues | $ | 258,128 | $ | 107,197 | $ | 64,421 | $ | 170,954 | $ 318,623 | $ 113,196 | $ 71,195 | $ 160,430 | |||||||||
Operating income (loss) | $ | 66,404 | $ | 5,630 | $ | (11,025 | ) | $ | 11,913 | $ 63,727 | $ 2,711 | $ (8,921) | $ 16,757 | ||||||||
Net income (loss) | $ | 39,004 | $ | 1,073 | $ | (8,810 | ) | $ | 5,697 | $ 37,369 | $ (531) | $ (7,673) | $ 8,133 | ||||||||
14.13. ACQUISITION AND DISPOSTIONDISPOSITIONS OF OIL AND GAS PROPERTIES
During the year ended December 31, 2007, Energen Resources capitalized approximately $32 million of unproved leaseholds costs, more than $28 million of which was related to the Company’s acreage position in Alabama shale. Energen used its available cash and existing lines of credit to finance these unproved leasehold costs.
In May 2007, Energen Resources purchased oil properties in the Permian Basin for $18 million. To finance the acquisition, Energen used its available cash and existing lines of credit.
In December 2006, Energen Resources completed a purchase which expanded its operations in the San Juan Basin from Dominion Resources, Inc. effective December 1, 2006 for approximately $30 million. Energen used its available cash and existing lines of credit to finance the acquisition.
In October 2006, Energen Resources sold a 50 percent interest in its lease position in various shale plays in Alabama to Chesapeake Energy Corporation (Chesapeake) for cash and a carried drilling interest. In addition, the two companies have signed an agreement to form an area of mutual interest (AMI) to focus on the further exploration and development of these shale plays throughout Alabama and a part of Georgia. Energen Resources received $75 million in cash from Chesapeake for a 50 percent interest in Energen Resources’ existing shale lease position of approximately 200,000 net acres in Alabama. Chesapeake also will pay for Energen Resources’ first $15 million of future drilling costs. During 2007, no significant drilling costs were incurred. Energen Resources had a gain of approximately $34.5 million after-tax in the fourth quarter of 2006 resulting from this sale of its lease position.
In December 2006, Energen Resources completed a purchase which expanded its operations in the San Juan Basin from Dominion Resources Inc. effective December 1, 2006 for approximately $30 million. Energen used its available cash and existing lines of credit to finance the acquisition.
On December 15, 2005, Energen Resources completed a purchase of Permian Basin oil properties from a private company. The contract purchase price was approximately $168 million with an effective date of November 1, 2005. Energen used its available cash and existing lines of credit to finance the acquisition.78
On August 2, 2004, Energen Resources completed a purchase of San Juan Basin coalbed methane properties from a private company for approximately $273 million. The effective date of the acquisition was August 1, 2004. Energen used its short-term credit facilities and internally generated cash flows to finance the acquisition. A portion of the short-term debt incurred to finance the acquisition was repaid when Energen issued $100 million of Floating Rate Senior Notes in November 2004.
Summarized below are the consolidated results of operations for the year ended December 31, 2004, on an unaudited pro forma basis as if the August 2004 purchase of assets in the San Juan Basin had occurred at the beginning of 2004. The pro forma information is based on the Company’s consolidated results of operations for the ear ended December 31, 2004, and on the data provided by the seller. The pro forma financial information does not purport to be indicative of results of operations that would have occurred had the transaction occurred on the basis assumed above, nor are they indicative of results of the future operations of the combined enterprises.
Year ended December 31, (Unaudited) (in thousands, except per share data) | 2004 | ||
Operating revenues | $ | 949,203 | |
Income from continuing operations | $ | 128,109 | |
Net income | $ | 128,267 | |
Diluted earnings per average common share* | $ | 1.75 | |
Basic earnings per average common share* | $ | 1.77 | |
|
|
15.14. REGULATORY ASSETS AND LIABILITIES
The following table details regulatory assets and liabilities on the consolidated balance sheets:
Energen Corporation | ||||||||||||||||||||
(in thousands) | December 31, 2007 | December 31, 2006 | ||||||||||||||||||
| December 31, 2006 | December 31, 2005 | Current | Noncurrent | Current | Noncurrent | |||||||||||||||
Energen Corporation (in thousands) | Current | Noncurrent | Current | Noncurrent | ||||||||||||||||
Regulatory assets: | ||||||||||||||||||||
Pension asset | $ | — | $ | 28,476 | $ | — | $ | 22,807 | $ - | $ 21,160 | $ - | $ 28,476 | ||||||||
Accretion and depreciation for asset retirement obligation | — | 9,803 | — | 10,183 | - | 11,024 | - | 9,803 | ||||||||||||
Gas supply adjustment | 23,595 | — | — | — | 9,711 | - | 23,595 | - | ||||||||||||
Risk management activities | 11,543 | — | 6,291 | — | 376 | - | 11,543 | - | ||||||||||||
Other | 341 | 106 | 342 | 446 | 145 | 54 | 341 | 106 | ||||||||||||
Total regulatory assets | $ | 35,479 | $ | 38,385 | $ | 6,633 | $ | 33,436 | $ 10,232 | $ 32,238 | $ 35,479 | $ 38,385 | ||||||||
Regulatory liabilities: | ||||||||||||||||||||
Enhanced stability reserve | $ | 3,951 | $ | — | $ | 3,690 | $ | — | $ 3,951 | $ - | $ 3,951 | $ - | ||||||||
Gas supply adjustment | — | — | 22,326 | — | ||||||||||||||||
RSE adjustment | 1,460 | — | 2,943 | — | 3,445 | - | 1,460 | - | ||||||||||||
Unbilled service margin | 27,233 | — | 24,537 | — | 24,725 | - | 27,233 | - | ||||||||||||
Asset removal costs, net | — | 114,520 | — | 105,404 | - | 121,573 | - | 114,520 | ||||||||||||
Asset retirement obligation | — | 12,833 | — | 13,451 | - | 14,367 | - | 12,833 | ||||||||||||
Pension liability and postretirement benefits | — | 7,220 | — | — | ||||||||||||||||
Pension liability and postretirement | - | 4,188 | - | 7,220 | ||||||||||||||||
Other | 1,227 | 893 | — | 953 | 33 | 995 | 1,227 | 893 | ||||||||||||
Total regulatory liabilities | $ | 33,871 | $ | 135,466 | $ | 53,496 | $ | 119,808 | $ 32,154 | $ 141,123 | $ 33,871 | $ 135,466 | ||||||||
As described in Note 2, Regulatory Matters, Alagasco’s rates are established under the RSE rate-setting process and are based on average equity for the period. Alagasco’s rates are not adjusted to exclude a return on its investment in regulatory assets during the recovery period.
16.15. STOCK DIVIDEND
On April 27, 2005, Energen’s shareholders approved a 2-for-1 split of the Company’s common stock. The split was effected in the form of a 100 percent stock dividend and was payable on June 1, 2005, to shareholders of record on May 13, 2005. All share and per share amounts of capital stock outstanding have been adjusted to reflect the stock split. Effective April 29, 2005, the Restated Certificate of Incorporation of Energen Corporation was amended to increase the Company’s authorized common stock, par value $0.01 per share, from 75,000,000 shares to 150,000,000 shares.
17.16. TRANSACTIONS WITH RELATED PARTIES
Alagasco purchased natural gas of $2,731,000 and $2,112,000 from affiliates for the yearsyear ended December 31, 2005 and 2004, respectively.2005. These amounts were included in gas purchased for resale. All transactions were at market based pricing. Alagasco did not purchase natural gas from affiliated companies in 2007 or 2006.
The Company allocates certain corporate costs to Energen Resources and Alagasco based on the nature of the expense to be allocated using various factors including, but not limited to, total assets, earnings, or number of employees. The Company’s cash management program matches short-term cash surpluses with the needs of its
affiliates, to minimize borrowing from outside sources. Alagasco had net payables to affiliates of $4,934,000 and $18,130,000 at December 31, 2007 and 2006, and net receivables from affiliates of $3,215,000 at December 31, 2005.respectively. Interest income and expense between affiliates is calculated monthly based on the market weighted average interest rate. The weighted average interest rate during 2007 and 2006 was 5.39 percent and 2005 was 5.43 percent, and 3.63 percent, respectively.
79
18.17. RECENT PRONOUNCEMENTS OF THE FINANCIAL ACCOUNTING STANDARDS BOARD (FASB)
In June 2006,
The Company adopted the FASB issued FASB Interpretation No.provisions of FIN 48 “Accounting for Uncertainty in Income Taxes-an Interpretationas of FASB Statement No. 109” (FIN 48) to address accounting for uncertainty in tax positions.January 1, 2007. This Interpretation prescribed a recognition threshold and measurement attribute for the financial statement recognition, measurement and disclosure of a tax position taken or expected to be taken in a tax return. As a result of the implementation of FIN 48, is effectivethe Company recognized an approximate $1.2 million increase in the liability for fiscal years beginning after December 15, 2006. The Company has analyzed FIN 48 and does not expect the adoption of this Interpretation will have a material impact to the Company. The cumulative effect of applying this Interpretation will be recordedunrecognized tax benefits which was accounted for as a decrease to the January 1, 2007 balance of retained earnings asearnings. As of the date of adoption and after the impact of recognizing the increase in liability noted above, the Company’s unrecognized tax benefits totaled $8.2 million. The amount of unrecognized tax benefits at January 1, 2007 that would favorably impact the Company’s effective tax rate, if recognized, was $3.4 million. The Company recognized potential accrued interest and penalties related to unrecognized tax benefits in income tax expense. As of January 1, 2007, the Company recognized approximately $484,000 in an amount not expected to exceed $1 million.potential interest (net of tax benefit) and penalties associated with uncertain tax positions.
During September 2006, the FASB issued SFAS No. 157, “Fair Value Measurements,” which clarifies the principle that fair value should be based on the assumptions market participants would use when pricing an asset or a liability and establishes a fair value hierarchy that prioritizes the information used to develop those assumptions. Under SFAS No. 157, fair value measurements would be separately disclosed by level within the fair value hierarchy effective for fiscal years beginning after November 15, 2007. The Company is currently evaluating the impact of this Statement. In February 2008, the FASB announced it will issue Final FASB Staff Positions (FSP’s) that will partially defer the effective date of SFAS No. 157 for one year for certain nonfinancial assets and nonfinancial liabilities and remove certain leasing transactions from the scope of SFAS No. 157. The Company will evaluate the impact of the FSP’s upon issuance.
In February 2007, the FASB issued SFAS No. 159, “The Fair Value Option for Financial Assets and Financial Liabilities,” which permits entities to measure financial instruments and certain other items at fair value to mitigate volatility in reported earnings. This Statement is effective for fiscal years beginning after November 15, 2007. The effect of this Standard on the Company is currently being evaluated.
In December 2007, the FASB issued SFAS No. 141 (revised 2007), “Business Combinations,” which will improve the relevance, representational faithfulness, and comparability of the information that a reporting entity provides in its financial reports about a business combination and its effects. This Statement applies prospectively to business combinations for which the acquisition date is on or after the beginning of the first fiscal year beginning on or after December 15, 2008. The Company is currently evaluating the impact of this Statement.
The FASB issued SFAS No. 160, “Noncontrolling Interests in Consolidated Financial Statements—an amendment of ARB No. 51,” in December 2007. SFAS No. 160 establishes accounting and reporting standards for ownership interests in subsidiaries held by parties other than the parent, the amount of consolidated net income attributable to the parent and to the noncontrolling interest, changes in a parent’s ownership interest, and the valuation of retained noncontrolling equity investments when a subsidiary is deconsolidated. SFAS No. 160 also establishes disclosure requirements that clearly identify and distinguish between the interests of the parent and the interests of the noncontrolling owners. This Statement is effective for fiscal years, and interim periods within those fiscal years, beginning on or after December 15, 2008. The effect of this Standard on the Company is currently being evaluated.
19.18. OIL AND GAS OPERATIONS(Unaudited)
The following schedules detail historical financial data of the Company’s oil and gas operations. Certain reclassifications have been made to conform the prior years’ financial statements to the current-year presentation.
Capitalized Costs
(in thousands) | December 31, 2007 | December 31, 2006 | ||
Proved | $ 2,477,587 | $ 2,141,874 | ||
Unproved | 52,462 | 21,191 | ||
Total capitalized costs | 2,530,049 | 2,163,065 | ||
Accumulated depreciation, depletion, and amortization | 664,290 | 559,059 | ||
Capitalized costs, net | $ 1,865,759 | $ 1,604,006 |
(in thousands) | December 31, 2006 | December 31, 2005 | ||||
Proved | $ | 2,141,874 | $ | 1,911,588 | ||
Unproved | 21,191 | 18,703 | ||||
Total capitalized costs | 2,163,065 | 1,930,291 | ||||
Accumulated depreciation, depletion, and amortization | 559,059 | 466,643 | ||||
Capitalized costs, net | $ | 1,604,006 | $ | 1,463,648 | ||
80
Costs Incurred:The following table sets forth costs incurred in property acquisition, exploration and development activities and includes both capitalized costs and costs charged to expense during the year:
Years ended December31, (in thousands) | 2006 | 2005 | 2004 | |||||||||||||||
Years ended December 31, (in thousands) | 2007 | 2006 | 2005 | |||||||||||||||
Property acquisition: | ||||||||||||||||||
Proved | $ | 24,388 | $ | 170,338 | $ | 273,735 | $ | 22,439 | $ | 24,388 | $ | 170,338 | ||||||
Unproved | 22,040 | 18,065 | 665 | 32,187 | 22,040 | 18,065 | ||||||||||||
Exploration | 26,767 | 5,490 | 5,060 | 8,860 | 26,767 | 5,490 | ||||||||||||
Development | 187,734 | 158,025 | 125,211 | 315,852 | 187,734 | 158,025 | ||||||||||||
Total costs incurred | $ | 260,929 | $ | 351,918 | $ | 404,671 | $ | 379,338 | $ | 260,929 | $ | 351,918 | ||||||
Results of Continuing Operations From Producing Activities:The following table sets forth results of the Company’s oil and gas continuing operations from producing activities:
Years ended December 31, (in thousands) | 2006 | 2005 | 2004 | ||||||
Gross revenues | $ | 675,830 | $ | 529,415 | $ | 412,441 | |||
Production (lifting costs) | 184,362 | 156,512 | 116,476 | ||||||
Exploration expense | 4,181 | 676 | 2,100 | ||||||
Depreciation, depletion and amortization | 95,522 | 87,398 | 79,119 | ||||||
Accretion expense | 3,619 | 2,647 | 2,265 | ||||||
Income tax expense | 140,619 | 102,102 | 80,293 | ||||||
Results of continuing operation from producing activities | $ | 247,527 | $ | 180,080 | $ | 132,188 | |||
Years ended December 31, (in thousands) | 2007 | 2006 | 2005 | ||||||
Gross revenues | $ | 825,645 | $ | 675,830 | $ | 529,415 | |||
Production (lifting costs) | 202,078 | 184,362 | 156,512 | ||||||
Exploration expense | 2,894 | 4,181 | 676 | ||||||
Depreciation, depletion and amortization | 111,567 | 95,522 | 87,398 | ||||||
Accretion expense | 3,948 | 3,619 | 2,647 | ||||||
Income tax expense | 177,083 | 140,619 | 102,102 | ||||||
Results of continuing operation from producing activities | $ | 328,075 | $ | 247,527 | $ | 180,080 |
Oil and Gas Operations: The calculation of proved reserves is made pursuant to rules prescribed by the SEC. Such rules, in part, require that only proved categories of reserves be disclosed and that reserves and associated values be calculated using year-end prices and current costs. Changes to prices and costs could have a significant effect on the disclosed amount of reserves and their associated values. In addition, the estimation of reserves inherently requires the use of geologic and engineering estimates which are subject to revision as reservoirs are produced and developed and as additional information is available. Accordingly, the amount of actual future production may vary significantly from the amount of reserves disclosed. The proved reserves are located onshore in the United States of America.
Estimates of physical quantities of oil and gas proved reserves were determined by Company engineers. Ryder Scott Company, L.P. and T. Scott Hickman and Associates, Inc., independent oil and gas reservoir engineers, have reviewed the estimates of proved reserves of natural gas, oil and natural gas liquids that the Company has attributed to its net interests in oil and gas properties as of December 31, 2006.2007. Ryder Scott Company, L.P. reviewed the reserve estimates for coalbed methane in the Black Warrior and San Juan basins and substantially all of the Permian Basin reserves. T. Scott Hickman and Associates, Inc. reviewed the reserves for the North Louisiana and East Texas regions and the conventional reserves in the San Juan Basin. The independent reservoir engineers have issued reports covering approximately 98 percent of the Company’s ending proved reserves indicating that in their judgment the estimates are reasonable in the aggregate.
Year ended December 31, 2006 | Gas MMcf | Oil MBbl | NGL MBbl | ||||||||||||||||||
Year ended December 31, 2007 | Gas MMcf | Oil MBbl | NGL MBbl | Total Bcfe | |||||||||||||||||
Proved reserves at beginning of period | 1,080,161 | 74,962 | 31,934 | 1,096,429 | 74,893 | 29,504 | 1,722.8 | ||||||||||||||
Revisions of previous estimates | (40,458 | ) | (3,518 | ) | (1,449 | ) | 2,977 | (4,573 | ) | 1,999 | (12.5 | ) | |||||||||
Purchases | 19,561 | 81 | 24 | 483 | 2,202 | 145 | 14.6 | ||||||||||||||
Discoveries and other additions | 99,988 | 7,013 | 812 | ||||||||||||||||||
Extensions and discoveries | 80,328 | 5,982 | 1,855 | 127.4 | |||||||||||||||||
Production | (62,823 | ) | (3,645 | ) | (1,817 | ) | (64,299 | ) | (3,879 | ) | (1,839 | ) | (98.6 | ) | |||||||
Sales | — | — | — | ||||||||||||||||||
Proved reserves at end of period | 1,096,429 | 74,893 | 29,504 | 1,115,918 | 74,625 | 31,664 | 1,753.7 | ||||||||||||||
Proved developed reserves at end of period | 866,874 | 55,210 | 26,932 | 903,510 | 61,209 | 28,348 | 1,440.9 | ||||||||||||||
Year ended December 31, 2005 | Gas MMcf | Oil MBbl | NGL MBbl | ||||||
Proved reserves at beginning of period | 1,019,436 | 54,500 | 34,613 | ||||||
Revisions of previous estimates | 43,221 | 186 | (1,484 | ) | |||||
Purchases | 3,974 | 21,614 | 58 | ||||||
Discoveries and other additions | 75,742 | 1,979 | 429 | ||||||
Production | (61,117 | ) | (3,316 | ) | (1,681 | ) | |||
Sales | (1,095 | ) | (1 | ) | (1 | ) | |||
Proved reserves at end of period | 1,080,161 | 74,962 | 31,934 | ||||||
Proved developed reserves at end of period | 891,978 | 54,901 | 27,681 | ||||||
81
Year ended December 31, 2004 | Gas MMcf | Oil MBbl | NGL MBbl | ||||||
Proved reserves at beginning of period | 886,307 | 52,528 | 27,245 | ||||||
Revisions of previous estimates | (42,052 | ) | 594 | (5 | ) | ||||
Purchases | 194,607 | 24 | 8,422 | ||||||
Discoveries and other additions | 37,832 | 4,788 | 575 | ||||||
Production | (57,258 | ) | (3,434 | ) | (1,624 | ) | |||
Proved reserves at end of period | 1,019,436 | 54,500 | 34,613 | ||||||
Proved developed reserves at end of period | 810,083 | 47,792 | 28,079 | ||||||
Year ended December 31, 2006 | Gas MMcf | Oil MBbl | NGL MBbl | Total Bcfe | ||||||||
Proved reserves at beginning of period | 1,080,161 | 74,962 | 31,934 | 1,721.5 | ||||||||
Revisions of previous estimates | (40,458 | ) | (3,518 | ) | (1,449 | ) | (70.2 | ) | ||||
Purchases | 19,561 | 81 | 24 | 20.2 | ||||||||
Extensions and discoveries | 99,988 | 7,013 | 812 | 146.9 | ||||||||
Production | (62,823 | ) | (3,645 | ) | (1,817 | ) | (95.6 | ) | ||||
Proved reserves at end of period | 1,096,429 | 74,893 | 29,504 | 1,722.8 | ||||||||
Proved developed reserves at end of period | 866,874 | 55,210 | 26,932 | 1,359.7 | ||||||||
Year ended December 31, 2005 | Gas MMcf | Oil MBbl | NGL MBbl | Total Bcfe | ||||||||
Proved reserves at beginning of period | 1,019,436 | 54,500 | 34,613 | 1,554.1 | ||||||||
Revisions of previous estimates | 43,221 | 186 | (1,484 | ) | 35.4 | |||||||
Purchases | 3,974 | 21,614 | 58 | 134.0 | ||||||||
Extensions and discoveries | 75,742 | 1,979 | 429 | 90.2 | ||||||||
Production | (61,117 | ) | (3,316 | ) | (1,681 | ) | (91.1 | ) | ||||
Sales | (1,095 | ) | (1 | ) | (1 | ) | (1.1 | ) | ||||
Proved reserves at end of period | 1,080,161 | 74,962 | 31,934 | 1,721.5 | ||||||||
Proved developed reserves at end of period | 891,978 | 54,901 | 27,681 | 1,387.5 |
Energen Resources had nodownward reserve revisions during 2007 which totaled 12.5 Bcfe. The Black Warrior Basin had downward reserve revisions totaling 3 Bcfe of which approximately 6.1 Bcfe related to changes in year-end pricing which accelerated reversions in ownership partially offset by an estimated 3.1 Bcfe of upward revisions associated with improved performance. In the San Juan Basin, upward reserve revisions of 9.2 Bcfe were largely due to 25 Bcfe of estimated price-revisions partially offset by a 16 Bcfe decrease for the removal of proved property salesundeveloped locations due to new reservoir interpretations. Downward reserve revisions of 21.4 Bcfe in the Permian Basin were largely a result delayed waterflood responses estimated at 34.1 Bcfe partially offset by upward price revisions of approximately 12.7 Bcfe.
Energen Resources purchased 14.6 Bcfe of reserves during 2007 primarily related to the acquisition of oil properties in the Permian Basin.
During 2007, Energen Resources had extensions and discoveries of 127.4 Bcfe of which 65 percent were proved undeveloped reserves and 35 percent were proved developed reserves. Extension drilling resulted in discoveries of 109.7 Bcfe with exploratory drilling providing 17.7 Bcfe of discoveries. The Black Warrior Basin added 20.5 Bcfe of reserves primarily through the drilling or identification of 55 well locations. The San Juan Basin added 47.2 Bcfe of reserves through the drilling or identification of 92 well locations; additionally, 18 sidetrack wells added 12.9 Bcfe of reserves. The Permian Basin added 30.1 Bcfe of reserves through the drilling or identification of 128 well locations.
For the year ended December 31, 2006, Energen Resources had downward reserve revisions which totaled 70.2 Bcfe and were primarily the result of reduced year-end pricing. Purchases for 2006 added 20.2 Bcfe of reserves and related primarily to an acquisition of gas properties in the San Juan Basin. Extension and discoveries during 2006 or 2004.totaled 146.9 Bcfe of reserves, the majority of which related to extension drilling.
During 2005, Energen Resources had upward reserve revisions totaling 35.4 Bcfe largely due to changes in year-end pricing. Other reserve revisions related to changes in the reservoirs’ performance. Purchases for 2005 added 134 Bcfe of reserves and related primarily to the acquisition of oil properties in the Permian Basin. Energen Resources had extensions and discoveries during 2005 totaling 90.2 Bcfe of reserves, the majority of which related to extension drilling. During 2005, Energen Resources sold approximately 1.1 Bcfe of proved reserves, recording a net pre-tax gain of $1.7 million on certain properties in the Permian and Black Warrior basins.
Standardized Measure of Discounted Future Net Cash Flows Relating to Proved Oil and Gas Reserves: The standardized measure of discounted future net cash flows is not intended, nor should it be interpreted, to present the fair market value of the Company’s crude oil and natural gas reserves. An estimate of fair market value would
82
take into consideration factors such as, but not limited to, the recovery of reserves not presently classified as proved reserves, anticipated future changes in prices and costs, and a discount factor more representative of the time value of money and the risks inherent in reserve estimates. At December 31, 2007, 2006 2005 and 2004,2005, the Company had a deferred hedging loss of $104.9 million, a deferred hedging gain of $81.5 million, and a deferred hedging lossesloss of $148.6 million and $41.1 million, respectively, all of which are excluded from the calculation of standardized measure of future net cash flows.
Years ended December 31, (in thousands) | 2006 | 2005 | 2004 | 2007 | 2006 | 2005 | |||||||||
Future gross revenues | $ | 11,012,667 | $ | 14,252,735 | $ | 8,791,050 | $ 15,789,245 | $ 11,012,667 | $ 14,252,735 | ||||||
Future production costs | 3,909,649 | 4,168,061 | 2,797,556 | 4,682,021 | 3,909,649 | 4,168,061 | |||||||||
Future development costs | 556,131 | 357,408 | 222,519 | 471,655 | 556,131 | 357,408 | |||||||||
Future income tax expense | 2,062,210 | 3,268,157 | 1,923,094 | 3,501,519 | 2,062,210 | 3,268,157 | |||||||||
Future net cash flows | 4,484,677 | 6,459,109 | 3,847,881 | 7,134,050 | 4,484,677 | 6,459,109 | |||||||||
Discount at 10% per annum | 2,338,576 | 3,547,454 | 1,956,463 | 3,869,337 | 2,338,576 | 3,547,454 | |||||||||
Standardized measure of discounted future net cash flows relating to proved oil and gas reserves | $ | 2,146,101 | $ | 2,911,655 | $ | 1,891,418 | $ 3,264,713 | $ 2,146,101 | $ 2,911,655 | ||||||
Discounted future net cash flows before income taxes | $ | 2,827,411 | $ | 4,045,529 | $ | 2,542,760 | $ 4,470,808 | $ 2,827,411 | $ 4,045,529 | ||||||
Reserves and associated values were calculated using year-end prices and current costs. The following are the principal sources of changes in the standardized measure of discounted future net cash flows:
Years ended December 31, (in thousands) | Year Ended December 31, 2006 | Year Ended December 31, 2005 | Year Ended December 31, 2004 | Year Ended December 31, 2007 | Year Ended December 31, 2006 | Year Ended December 31, 2005 | |||||||||||||||
Balance at beginning of year | $ | 2,911,655 | $ | 1,891,418 | $ | 1,573,079 | $ 2,146,101 | $ 2,911,655 | $ 1,891,418 | ||||||||||||
Revisions to reserves proved in prior years: | |||||||||||||||||||||
Net changes in prices, production costs and future development costs | (1,489,312 | ) | 1,288,366 | 147,380 | 1,556,198 | (1,489,312 | ) | 1,288,366 | |||||||||||||
Net changes due to revisions in quantity estimates | (123,057 | ) | 90,952 | (58,378 | ) | (32,074 | ) | (123,057 | ) | 90,952 | |||||||||||
Development costs incurred, previously estimated | 86,554 | 101,740 | 83,404 | 215,155 | 86,554 | 101,740 | |||||||||||||||
Accretion of discount | 291,166 | 189,142 | 157,308 | 214,610 | 291,166 | 189,142 | |||||||||||||||
Other | 159,945 | (69,803 | ) | 9,093 | (135,935 | ) | 159,945 | (69,803 | ) | ||||||||||||
Total revisions | (1,074,704 | ) | 1,600,397 | 338,807 | 1,817,954 | (1,074,704 | ) | 1,600,397 | |||||||||||||
New field discoveries and extensions, net of future production and development costs | 253,277 | 235,832 | 133,714 | 327,564 | 253,277 | 235,832 | |||||||||||||||
Sales of oil and gas produced, net of production costs | (549,559 | ) | (595,439 | ) | (417,846 | ) | (598,720 | ) | (549,559 | ) | (595,439 | ) | |||||||||
Purchases | 39,481 | 199,319 | 300,183 | 28,468 | 39,481 | 199,319 | |||||||||||||||
Sales | — | (2,474 | ) | — | - | - | (2,474 | ) | |||||||||||||
Net change in income taxes | 565,951 | (417,398 | ) | (36,519 | ) | (456,654 | ) | 565,951 | (417,398 | ) | |||||||||||
Net change in standardized measure of discounted future net cash flows | (765,554 | ) | 1,020,237 | 318,339 | 1,118,612 | (765,554 | ) | 1,020,237 | |||||||||||||
Balance at end of year | $ | 2,146,101 | $ | 2,911,655 | $ | 1,891,418 | $ 3,264,713 | $ 2,146,101 | $ 2,911,655 | ||||||||||||
20.19. INDUSTRY SEGMENT INFORMATION
The Company is principally engaged in two business segments: the acquisition, development, exploration and production of oil and gas in the continental United States (oil and gas operations) and the purchase, distribution and sale of natural gas in central and north Alabama (natural gas distribution). The accounting policies of the segments are the same as those described in Note 1.1, Summary of Significant Accounting Policies. Certain reclassifications have been made to conform the prior years’ financial statements to the current year presentation.
(in thousands) | Year Ended December 31, 2006 | Year Ended December 31, 2005 | Year Ended December 31, 2004 | Year Ended December 31, 2007 | Year Ended December 31, 2006 | Year Ended December 31, 2005 | |||||||||||||||
Operating revenues from continuing operations | |||||||||||||||||||||
Oil and gas operations | $ | 730,542 | $ | 530,341 | $ | 412,028 | $ 825,592 | $ 730,542 | $ 530,341 | ||||||||||||
Natural gas distribution | 663,444 | 600,700 | 526,740 | 609,468 | 663,444 | 600,700 | |||||||||||||||
Eliminations and other | — | (2,647 | ) | (1,911 | ) | - | - | (2,647 | ) | ||||||||||||
Total | $ | 1,393,986 | $ | 1,128,394 | $ | 936,857 | $ 1,435,060 | $ 1,393,986 | $ 1,128,394 | ||||||||||||
Operating income (loss) from continuing operations | |||||||||||||||||||||
Oil and gas operations | $ | 405,149 | $ | 243,876 | $ | 180,379 | $ 451,567 | $ 405,149 | $ 243,876 | ||||||||||||
Natural gas distribution | 74,274 | 72,922 | 66,199 | 72,742 | 74,274 | 72,922 | |||||||||||||||
Subtotal | 479,423 | 316,798 | 246,578 | 524,309 | 479,423 | 316,798 | |||||||||||||||
Eliminations and corporate expenses | (2,123 | ) | (1,074 | ) | (1,735 | ) | (2,277 | ) | (2,123 | ) | (1,074 | ) | |||||||||
Total | $ | 477,300 | $ | 315,724 | $ | 244,843 | $ 522,032 | $ 477,300 | $ 315,724 | ||||||||||||
Depreciation, depletion and amortization expense from continuing operations | |||||||||||||||||||||
Oil and gas operations | $ | 97,842 | $ | 89,340 | $ | 80,896 | $ 114,241 | $ 97,842 | $ 89,340 | ||||||||||||
Natural gas distribution | 44,244 | 42,351 | 39,881 | 47,136 | 44,244 | 42,351 | |||||||||||||||
Total | $ | 142,086 | $ | 131,691 | $ | 120,777 | $ 161,377 | $ 142,086 | $ 131,691 | ||||||||||||
Interest expense | |||||||||||||||||||||
Oil and gas operations | $ | 33,542 | $ | 32,778 | $ | 29,660 | $ 32,673 | $ 33,542 | $ 32,778 | ||||||||||||
Natural gas distribution | 16,454 | 15,060 | 13,737 | 15,696 | 16,454 | 15,060 | |||||||||||||||
Subtotal | 49,996 | 47,838 | 43,397 | 48,369 | 49,996 | 47,838 | |||||||||||||||
Eliminations and other | (1,344 | ) | (1,038 | ) | (654 | ) | (1,269 | ) | (1,344 | ) | (1,038 | ) | |||||||||
Total | $ | 48,652 | $ | 46,800 | $ | 42,743 | $ 47,100 | $ 48,652 | $ 46,800 | ||||||||||||
Income tax expense (benefit) from continuing operations | |||||||||||||||||||||
Oil and gas operations | $ | 134,938 | $ | 76,362 | $ | 56,982 | $ 147,418 | $ 134,938 | $ 76,362 | ||||||||||||
Natural gas distribution | 22,002 | 22,360 | 19,703 | 21,636 | 22,002 | 22,360 | |||||||||||||||
Subtotal | 156,940 | 98,722 | 76,685 | 169,054 | 156,940 | 98,722 | |||||||||||||||
Other | (1,910 | ) | (1,231 | ) | (1,160 | ) | (1,625 | ) | (1,910 | ) | (1,231 | ) | |||||||||
Total | $ | 155,030 | $ | 97,491 | $ | 75,525 | $ 167,429 | $ 155,030 | $ 97,491 | ||||||||||||
Capital expenditures | |||||||||||||||||||||
Oil and gas operations | $ | 259,678 | $ | 353,712 | $ | 403,936 | $ 379,479 | $ 259,678 | $ 353,712 | ||||||||||||
Natural gas distribution | 76,157 | 73,276 | 58,208 | 58,862 | 76,157 | 73,276 | |||||||||||||||
Total | $ | 335,835 | $ | 426,988 | $ | 462,144 | $ 438,341 | $ 335,835 | $ 426,988 | ||||||||||||
Identifiable assets | |||||||||||||||||||||
Oil and gas operations | $ | 1,822,216 | $ | 1,637,244 | $ | 1,315,967 | $ 2,065,229 | $ 1,822,216 | $ 1,637,244 | ||||||||||||
Natural gas distribution | 994,125 | 946,819 | 837,557 | 980,813 | 1,006,096 | 946,819 | |||||||||||||||
Subtotal | 2,816,341 | 2,584,063 | 2,153,524 | 3,046,042 | 2,828,312 | 2,584,063 | |||||||||||||||
Eliminations and other | 20,546 | 34,163 | 28,215 | 33,611 | 8,575 | 34,163 | |||||||||||||||
Total | $ | 2,836,887 | $ | 2,618,226 | $ | 2,181,739 | $ 3,079,653 | $ 2,836,887 | $ 2,618,226 | ||||||||||||
Property, plant and equipment, net | |||||||||||||||||||||
Oil and gas operations | $ | 1,612,764 | $ | 1,470,063 | $ | 1,214,461 | $ 1,877,747 | $ 1,612,764 | $ 1,470,063 | ||||||||||||
Natural gas distribution | 639,650 | 597,948 | 568,598 | 660,496 | 639,650 | 597,948 | |||||||||||||||
Total | $ | 2,252,414 | $ | 2,068,011 | $ | 1,783,059 | $ 2,538,243 | $ 2,252,414 | $ 2,068,011 | ||||||||||||
SCHEDULE II - VALUATION AND QUALIFYING ACCOUNTS
Energen Corporation
Years ended December 31, (in thousands) | 2006 | 2005 | 2004 | |||||||||
ALLOWANCE FOR DOUBTFUL ACCOUNTS |
| |||||||||||
Balance at beginning of year | $ | 11,573 | $ | 10,472 | $ | 9,852 | ||||||
Additions: | ||||||||||||
Charged to income | 6,972 | 6,076 | 4,819 | |||||||||
Recoveries and adjustments | (232 | ) | (431 | ) | (290 | ) | ||||||
Net additions | 6,740 | 5,645 | 4,529 | |||||||||
Less uncollectible accounts written off | (4,352 | ) | (4,544 | ) | (3,909 | ) | ||||||
Balance at end of year | $ | 13,961 | $ | 11,573 | $ | 10,472 | ||||||
Alabama Gas Corporation
Years ended December 31, (in thousands) | 2007 | 2006 | 2005 | |||||||||
ALLOWANCE FOR DOUBTFUL ACCOUNTS |
| |||||||||||
Balance at beginning of year | $ | 13,961 | $ | 11,573 | $ | 10,472 | ||||||
Additions: | ||||||||||||
Charged to income | 5,610 | 6,972 | 6,076 | |||||||||
Recoveries and adjustments | (202 | ) | (232 | ) | (431 | ) | ||||||
Net additions | 5,408 | 6,740 | 5,645 | |||||||||
Less uncollectible accounts written off | (7,125 | ) | (4,352 | ) | (4,544 | ) | ||||||
Balance at end of year | $ | 12,244 | $ | 13,961 | $ | 11,573 | ||||||
Years ended December 31, (in thousands) | 2007 | 2006 | 2005 | |||||||||
ALLOWANCE FOR DOUBTFUL ACCOUNTS |
| |||||||||||
Balance at beginning of year | $ | 13,200 | $ | 10,800 | $ | 9,600 | ||||||
Additions: | ||||||||||||
Charged to income | 5,610 | 6,972 | 6,076 | |||||||||
Recoveries and adjustments | (197 | ) | (227 | ) | (342 | ) | ||||||
Net additions | 5,413 | 6,745 | 5,734 | |||||||||
Less uncollectible accounts written off | (7,113 | ) | (4,345 | ) | (4,534 | ) | ||||||
Balance at end of year | $ | 11,500 | $ | 13,200 | $ | 10,800 | ||||||
Years ended December 31, (in thousands) | 2006 | 2005 | 2004 | |||||||||
ALLOWANCE FOR DOUBTFUL ACCOUNTS |
| |||||||||||
Balance at beginning of year | $ | 10,800 | $ | 9,600 | $ | 9,100 | ||||||
Additions: | ||||||||||||
Charged to income | 6,972 | 6,076 | 4,819 | |||||||||
Recoveries and adjustments | (227 | ) | (342 | ) | (403 | ) | ||||||
Net additions | 6,745 | 5,734 | 4,416 | |||||||||
Less uncollectible accounts written off | (4,345 | ) | (4,534 | ) | (3,916 | ) | ||||||
Balance at end of year | $ | 13,200 | $ | 10,800 | $ | 9,600 | ||||||
85
ITEM 9. | CHANGES IN AND DISAGREEMENTS WITH ACCOUNTANTS ON ACCOUNTING AND FINANCIAL DISCLOSURE |
None
ITEM 9A. |
Energen Corporation
a. Conclusion Regarding Disclosure Controls and Procedures
Our chief executive officer and chief financial officer of Energen Corporation have evaluated the effectiveness of our disclosure controls and procedures as of the end of the period covered by this report. Based on that evaluation they have concluded that our disclosure controls and procedures are effective as of December 31, 2006,2007 at a reasonable assurance level.
b. Management’s Report On Internal Control Over Financial Reporting
Management of Energen Corporation is responsible for establishing and maintaining adequate internal control over financial reporting as defined in Rules 13a-15(f) and 15d-15(f) under the Securities Exchange Act of 1934. Energen Corporation’s internal control over financial reporting is a process designed to provide reasonable assurance regarding the reliability of financial reporting and the preparation of financial statements for external purposes in accordance with accounting principles generally accepted in the United States of America. Internal control over financial reporting includes those written policies and procedures that:
i | pertain to the maintenance of records that, in reasonable detail, accurately and fairly reflect the transactions and dispositions of the assets of Energen Corporation; |
ii | provide reasonable assurance that transactions are recorded as necessary to permit preparation of financial statements in accordance with accounting principles generally accepted in the United States of America, and that receipts and expenditures of Energen Corporation are being made only in accordance with authorization of management and directors of Energen Corporation; and |
iii | provide reasonable assurance regarding prevention or timely detection of unauthorized acquisition, use or disposition of assets that could have a material effect on the consolidated financial statements. |
Because of its inherent limitations, internal control over financial reporting may not prevent or detect misstatements. Also, projections of any evaluation of effectiveness to future periods are subject to the risk that controls may become inadequate because of changes in conditions, or that the degree of compliance with the policies or procedures may deteriorate.
Management assessed the effectiveness of Energen Corporation’s internal control over financial reporting as of December 31, 2006.2007. Management based this assessment on criteria for effective internal control over financial reporting described in “Internal Control -Integrated- Integrated Framework”issued by the Committee of Sponsoring Organizations of the Treadway Commission. Management’s assessment included an evaluation of the design of Energen Corporation’s internal control over financial reporting and testing of the operational effectiveness of its internal control over financial reporting. Management reviewed the results of its assessment with the Audit Committee of our Board of Directors.
Based on this assessment, management determined that, as of December 31, 2006,2007, Energen Corporation maintained effective internal control over financial reporting. Management’s assessment of theThe effectiveness of the Company’sEnergen Corporation’s internal control over financial reporting as of December 31, 20062007 has been audited by PricewaterhouseCoopers, LLP, ouran independent registered public accounting firm, as stated in their report which appears herein.
February 27, 2007
86
c. Changes in Internal Control Over Financial Reporting
Our chief executive officer and chief financial officer of Energen Corporation have concluded that during the most recent fiscal quarter covered by this report there were no changes in our internal control over financial reporting that materially affected or are reasonably likely to materially affect our internal control over financial reporting.
Alabama Gas Corporation
Our chief executive officer and chief financial officer of Alabama Gas Corporation have evaluated the effectiveness of our disclosure controls and procedures as of the end of the period covered by this report. Based on that evaluation they have concluded that our disclosure controls and procedures are effective as of December 31, 2007 at a reasonable assurance level.
b. Management’s Report On Internal Control Over Financial Reporting
Management of Alabama Gas Corporation is responsible for establishing and maintaining adequate internal control over financial reporting as defined in Rules 13a-15(f) and 15d-15(f) under the Securities Exchange Act of 1934. Alabama Gas Corporation’s internal control over financial reporting is a process designed to provide reasonable assurance regarding the reliability of financial reporting and the preparation of financial statements for external purposes in accordance with accounting principles generally accepted in the United States of America. Internal control over financial reporting includes those written policies and procedures that:
| i | pertain to the maintenance of records that, in reasonable detail, accurately and fairly reflect the transactions and dispositions of the assets of Alabama Gas Corporation; |
| ii | provide reasonable assurance that transactions are recorded as necessary to permit preparation of financial statements in accordance with accounting principles generally accepted in the United States of America, and that receipts and expenditures of Alabama Gas Corporation are being made only in accordance with authorization of management and directors of Alabama Gas Corporation; and |
| iii | provide reasonable assurance regarding prevention or timely detection of unauthorized acquisition, use or disposition of assets that could have a material effect on the consolidated financial statements. |
Because of its inherent limitations, internal control over financial reporting may not prevent or detect misstatements. Also, projections of any evaluation of effectiveness to future periods are subject to the risk that controls may become inadequate because of changes in conditions, or that the degree of compliance with the policies or procedures may deteriorate.
Management assessed the effectiveness of Alabama Gas Corporation’s internal control over financial reporting as of December 31, 2007. Management based this assessment on criteria for effective internal control over financial reporting described in“Internal Control - Integrated Framework”issued by the Committee of Sponsoring Organizations of the Treadway Commission. Management’s assessment included an evaluation of the design of Alabama Gas Corporation’s internal control over financial reporting and testing of the operational effectiveness of its internal control over financial reporting. Management reviewed the results of its assessment with the Audit Committee of our Board of Directors.
Based on this assessment, management determined that, as of December 31, 2007, Alabama Gas Corporation maintained effective internal control over financial reporting.
February 25, 2008
87
c. Changes in Internal Control Over Financial StatementsReporting
Our chief executive officer and chief financial officer of Alabama Gas Corporation have concluded that during the most recent fiscal quarter covered by this report there were no changes in our internal control over financial reporting that materially affected or are reasonably likely to materially affect our internal control over financial reporting.
88
ITEM 10. | DIRECTORS, EXECUTIVE OFFICERS AND CORPORATE GOVERNANCE |
Information regarding the executive officers of Energen is included in Part I. The other information required by Item 10 is incorporated herein by reference from Energen’s definitive proxy statement for the Annual Meeting of Shareholders to be held April 25, 2007.23, 2008. The definitive proxy statement will be filed on or about March 26, 2007.24, 2008.
ITEM 11. | EXECUTIVE COMPENSATION |
The information regarding executive compensation is incorporated herein by reference from Energen’s definitive proxy statement for the Annual Meeting of Shareholders to be held April 25, 2007.23, 2008.
ITEM 12. | SECURITY OWNERSHIP OF CERTAIN BENEFICIAL OWNERS AND MANAGEMENT AND RELATED STOCKHOLDER MATTERS |
a. Security Ownership of Certain Beneficial Owners
The information regarding the security ownership of the beneficial owners of more than five percent of Energen’s common stock is incorporated herein by reference from Energen’s definitive proxy statement for the Annual Meeting of Shareholders to be held April 25, 2007.23, 2008.
b. Security Ownership of Management
The information regarding the security ownership of management is incorporated herein by reference from Energen’s definitive proxy statement for the Annual Meeting of Shareholders to be held April 25, 2007.23, 2008.
c. Securities Authorized for Issuance Under Equity Compensation Plans
The information regarding securities authorized for issuance under equity compensation plans is included in Part 2 under Item 5.
ITEM 13. | CERTAIN RELATIONSHIPS AND RELATED TRANSACTIONS, AND DIRECTOR INDEPENDENCE |
The information regarding certain relationships and related transactions, and director independence is incorporated herein by reference from Energen’s definitive proxy statement for the Annual Meeting of Shareholders to be held April 25, 2007.23, 2008.
ITEM 14. | PRINCIPAL ACCOUNTANT FEES AND SERVICES |
The information regarding Principal Accountant Fees and Services is incorporated herein by reference from Energen’s definitive proxy statement for the Annual Meeting of Shareholders to be held April 25, 2007.
89
ITEM 15. | EXHIBITS AND FINANCIAL STATEMENT SCHEDULES |
a. Documents Filed as Part of This Report
(1) | Financial Statements |
The consolidated financial statements of Energen and the financial statements of Alagasco are included in Item 8 of this Form 10-K
(2) | Financial Statement Schedules |
The financial statement schedules are included in Item 8 of this Form 10-K
(3) | Exhibits |
The exhibits listed on the accompanying Index to Exhibits are filed as part of this Form 10-K
Energen Corporation
Alabama Gas Corporation
INDEX TO EXHIBITS
Item 14(a)(3)
Exhibit Number | Description | |
*3(a) | Restated Certificate of Incorporation of Energen Corporation (composite, as amended April 29, 2005) which was filed as Exhibit 3(a) to Energen’s Quarterly Report on Form 10-Q for the quarterly period ended March 31, 2005 | |
*3(b) | Articles of Amendment to Restated Certificate of Incorporation of Energen, designating Series 1998 Junior Participating Preferred Stock (July 27, 1998) which was filed as Exhibit 4(b) to Energen’s Post Effective Amendment No. 1 to Registration Statement on Form S-3 (Registration No. 333-00395) | |
*3(c) | Bylaws of Energen Corporation (as amended through October 30, 2002) which was filed as Exhibit 4(c) to Energen’s Registration Statement on Form S-8 (Registration No. 33-46641) | |
*3(d) | Articles of Amendment and Restatement of the Articles of Incorporation of Alabama Gas Corporation, dated September 27, 1995, which was filed as Exhibit 3(i) to the Registrant’s Annual Report on Form 10-K for the year ended September 30, 1995 | |
*3(e) | Bylaws of Alabama Gas Corporation (as amended through October | |
*4(a) | Rights Agreement, dated as of July 27, 1998, between Energen Corporation and First Chicago Trust Company of New York, Rights Agent, which was filed as Exhibit 1 to Energen’s Registration Statement on Form 8-A, dated July 10, 1998 | |
*4(b) | Form of Indenture between Energen Corporation and The Bank of New York, as Trustee, which was dated as of September 1, 1996 (the “Energen 1996 Indenture”), and which was filed as Exhibit 4(i) to the Registrant’s Registration Statement on Form S-3 (Registration No. 333-11239) | |
*4(b)(i) | Officers’ Certificate, dated September 13, 1996, pursuant to Section 301 of the Energen 1996 Indenture setting forth the terms of the Series A Notes which was filed as Exhibit 4(d)(i) to Energen’s Annual Report on Form 10-K for the year ended September 30, 2001 | |
*4(b)(ii) | Officers’ Certificate, dated July 8, 1997, pursuant to Section 301 of the Energen 1996 Indenture amending the terms of the Series A Notes which was filed as Exhibit 4(d)(ii) to Energen’s Annual Report on Form 10-K for the year ended September 30, 2001 | |
*4(b)(iii) | Amended and Restated Officers’ Certificate, dated February 27, 1998, setting forth the terms of the Series B Notes which was filed as Exhibit 4(d)(iii) to Energen’s Annual Report on Form 10-K for the year ended September 30, 2001 | |
*4(b)(iv) | Officers’ Certificate, dated October 3, 2003, pursuant to Section 301 of the Energen 1996 Indenture setting forth the terms of the 5 percent Notes due October 1, 2013, which was filed as Exhibit 4 to Energen’s Current Report on Form 8-K, dated October 3, 2003 | |
* |
| |
| Indenture dated as of November 1, 1993, between Alabama Gas Corporation and NationsBank of Georgia, National Association, Trustee, (“Alagasco 1993 Indenture”), which was filed as Exhibit 4(k) to Alabama Gas’ Registration Statement on Form S-3 (Registration No. 33-70466) |
91
*4(c)(i) |
| |
| Officers’ Certificate, dated January 14, 2005, pursuant to Section 301 of the Alagasco 1993 Indenture setting forth the terms of the 5.70 percent Notes due January 15, 2035, which was filed as Exhibit 4.3 to Alabama Gas’ Current Report on Form 8-K filed January 14, 2005 | |
*4(c) | Officers’ Certificate, dated January 14, 2005, pursuant to Section 301 of the Alagasco 1993 Indenture setting forth the terms of the 5.20 percent Notes due January 15, 2020, which was filed as Exhibit 4.4 to Alabama Gas’ Current Report on Form 8-K filed January 14, 2005 | |
*4(c) | Officers’ Certificate, dated November 17, 2005, pursuant to Section 301 of the Alagasco 1993 Indenture setting forth the terms of the 5.368 percent Notes due December 1, 2015, which was filed as Exhibit 4.2 to Alabama Gas’ Current Report on Form 8-K filed November 17, 2005 | |
*4(c) | Officers’ Certificate, dated January 16, 2007, pursuant to Section 301 of the Alagasco 1993 Indenture setting forth the terms of the 5.90 percent Notes due January 15, 2037, which was filed as Exhibit 4.2 to Alabama Gas’ Current Report on Form 8-K filed January 16, 2007 | |
*10(a) | Service Agreement Under Rate Schedule CSS (No. SSNG1), between Southern Natural Gas Company and Alabama Gas Corporation, dated as of September 1, 2005, which was filed as Exhibit 10(a) to Energen’s Annual Report on Form 10-K for the year ended December 31, 2005 | |
*10(b) | Firm Transportation Service Agreement Under Rate Schedule FT and/or FT-NN (No. FSNG1), between Southern Natural Gas Company and Alabama Gas Corporation dated as of September 1, 2005, which was filed as Exhibit 10(b) to Energen’s Annual Report on Form 10-K for the year ended December 31, 2005 | |
*10(c) | Form of Service Agreement Under Rate Schedule IT (No. 790420), between Southern Natural Gas Company and Alabama Gas Corporation, which was filed as Exhibit 10(b) to Energen’s Annual Report on Form 10-K for the year ended September 30, 1993 | |
*10(d) | Service Agreement between Transcontinental Gas Pipeline Corporation and Transco Energy Marketing Company as Agent for Alabama Gas Corporation, dated August 1, 1991 which was filed as Exhibit 3(e) to Energen’s Annual Report on Form 10-K for the year ended December 31, 2003 | |
*10(e) | Amendment to Service Agreement between Transcontinental Gas Pipeline Corporation and Alabama Gas Corporation, dated December 2, 2005, which was filed as Exhibit 10(e) to Energen’s Annual Report on Form 10-K for the year ended December 31, 2005 | |
*10(f) | Occluded Gas Lease, dated January 1, 1986 and First through Seventh Amendments, which was filed as Exhibit 10(f) to Energen’s Annual Report on Form 10-K for the year ended December 31, 2005 | |
*10(g) | Form of Executive Retirement Supplement Agreement between Energen Corporation and it’s executive officers (as revised October 2000) which was filed as Exhibit 10(c) to Energen’s Annual Report on Form 10-K for the year ended September 30, 2000 | |
*10(h) | Amendment to Executive Retirement Supplement Agreement with Mr. Warren, dated December 13, 2006, which was filed as Exhibit 99.2 to Energen’s Current Report on Form 8-K, filed December 14, 2006 | |
*10(i) | Amendment to Executive Retirement Supplement Agreement with Mr. Ketcham, dated December 13, 2006, which was filed as Exhibit 99.3 to Energen’s Current Report on Form 8-K, filed December 14, 2006 | ||
92
*10(j) | Form of Severance Compensation Agreement between Energen Corporation and it’s executive officers which was filed as Exhibit 99.1 to Energen’s Current Report on Form 8-K, dated January 29, 2007 | |
*10(k) | Energen Corporation | |
*10(l) |
| |
| Form of Stock Option Agreement under the Energen Corporation 1997 Stock Incentive Plan which was filed as Exhibit 10(a) to Energen’s Quarterly Report on Form 10-Q for the quarter ended September 30, 2004 | |
* | Form of Restricted Stock Agreement under the Energen Corporation 1997 Stock Incentive Plan which was filed as Exhibit 10(b) to Energen’s Quarterly Report on Form 10-Q for the quarter ended September 30, 2004 | |
* | Form of Performance Share Award under the Energen Corporation 1997 Stock Incentive Plan which was filed as Exhibit 10(c) to Energen’s Quarterly Report on Form 10-Q for the quarter ended September 30, 2004 | |
| Energen Corporation 1997 Deferred Compensation Plan | |
|
| |
| Energen Corporation 1992 Directors Stock Plan (as amended | |
* | Energen Corporation Annual Incentive Compensation Plan, as amended effective October 25, 2006 which was filed as Exhibit 99.1 to Energen’s Current Report on Form 8-K, filed October 30, 2006 | |
* | Energen Corporation Officer Split Dollar Life Insurance Plan, effective October 1, 1999 which was filed as Exhibit 10(l) to Energen’s Annual Report on Form 10-K for the year ended September 30, 2000 (File No. 1-7810) | |
* | Form of Split Dollar Life Insurance Plan Agreement under Energen Corporation Officer Split Dollar Life Insurance Plan which was filed as Exhibit 10(m) to Energen’s Annual Report on Form 10-K for the year ended September 30, 2000 (File No. 1-7810) | |
* | Officer Split Dollar Tax Matters Agreement which was filed as Exhibit 10(n) to Energen’s Annual Report on Form 10-K for the year ended September 30, 2000 (File No. 1-7810) | |
* | Energen Board of Directors resolution adopted as of May 14, 2004, terminating the Energen Corporation Officer Split Dollar Life Insurance Plan which was filed as Exhibit 10(u) to Energen’s Annual Report on Form 10K for the year ended December 31, 2005 | ||
21 | Subsidiaries of Energen Corporation | ||
23(a) | Consent of Registered Public Accounting Firm (PricewaterhouseCoopers LLP) | ||
23(b) | Consent of Registered Public Accounting Firm (PricewaterhouseCoopers LLP) | ||
23(c) | Consent of Independent Oil and Gas Reservoir Engineers (Ryder Scott Company, L.P.) | ||
23(d) | Consent of Independent Oil and Gas Reservoir Engineers (T. Scott Hickman and Associates, Inc.) | ||
31(a) | Energen Corporation Certification of Chief Executive Officer pursuant to Rule 13a-14(a) or 15d-14(a) | ||
93
31(b) | Energen Corporation Certification of Chief Financial Officer pursuant to Rule 13a-14(a) or 15d-14(a) | |
31(c) | Alabama Gas Corporation Certification of Chief Executive Officer pursuant to Rule 13a- 14(a) or 15d- 14(a) | |
31(d) | Alabama Gas Corporation Certification of Chief Financial Officer pursuant to Rule 13a- 14(a) or 15d- 14(a) | |
32 | Certification pursuant to Section 1350 | |
* | Incorporated by reference |
Pursuant to the requirements of Section 13 or 15(d) of the Securities and Exchange Act of 1934, the Registrants have duly caused this report to be signed on their behalf by the undersigned thereunto duly authorized.
ENERGEN CORPORATION
(Registrant)
ALABAMA GAS CORPORATION
(Registrant)
February | By | /s/ | ||
| ||||
Chairman, Energen Executive Officer of Alabama Gas Corporation | ||||
SIGNATURES
Pursuant to the requirements of the Securities and Exchange Act of 1934, this report has been signed by the following persons on behalf of the Registrants and in the capacities and on the dates indicated:
February | By | /s/ | ||
| ||||
Chairman, | ||||
| ||||
Alabama Gas Corporation | ||||
February | By | /s/ Charles W. Porter, Jr. | ||
Charles W. Porter, Jr. | ||||
Vice President, Chief Financial Officer and | ||||
Treasurer of Energen Corporation and Alabama Gas Corporation | ||||
February | By | /s/ Grace B. Carr | ||
Grace B. Carr | ||||
Vice President and Controller of Energen Corporation | ||||
February | By | /s/ Paula H. Rushing | ||
Paula H. Rushing | ||||
Vice President-Finance of Alabama Gas | ||||
Corporation | ||||
February | By | /s/ Julian W. Banton | ||
Julian W. Banton | ||||
Director | ||||
February | By | /s/ Kenneth W. Dewey | ||
Kenneth W. Dewey | ||||
Director | ||||
February 25, 2008 | By | /s/ James S. M. French | ||
James S. M. French | ||||
Director | ||||
February |
|
| ||
| ||||
| ||||
| By | /s/ Judy M. Merritt | ||
Judy M. Merritt | ||||
Director | ||||
February | By | /s/ Wm. Michael Warren, Jr. | ||
Wm. Michael Warren, Jr. | ||||
Director | ||||
February 25, 2008 | By | /s/ David W. Wilson | ||
David W. Wilson | ||||
Director | ||||
9096