UNITED STATES
SECURITIES AND EXCHANGE COMMISSION
Washington, D.C. 20549
FORM 10-K
| x | ANNUAL REPORT PURSUANT TO SECTION 13 OR 15(d) OF THE SECURITIES EXCHANGE ACT OF 1934 |
For the fiscal year endedDecember 31, 20062008
OR
| ¨ | TRANSITION REPORT PURSUANT TO SECTION 13 OR 15(d) OF THE SECURITIES EXCHANGE ACT OF 1934 |
For the transition period fromto
COMMISSION FILE NUMBER 001-12307
ZIONS BANCORPORATION
(Exact name of Registrant as specified in its charter)
UTAH | 87-0227400 | |
(State or other jurisdiction of
| (Internal Revenue Service Employer Identification Number) | |
|
| |
| (Address of principal executive offices) | (Zip Code) | |
Registrant’s telephone number, including area code: (801) 524-4787
Securities registered pursuant to Section 12(b) of the Act:
Title of Each Class | Name of Each Exchange on Which Registered | |
Guarantee related to 8.00% Capital Securities of Zions Capital Trust B | New York Stock Exchange | |
6% Subordinated Notes due September 15, 2015 | New York Stock Exchange | |
Depositary Shares each representing a 1/40th ownership interest in a share of Series A Floating-Rate Non-Cumulative Perpetual Preferred Stock | New York Stock Exchange | |
Depositary Shares each representing a 1/40th ownership interest in a share of Series C 9.5% Non-Cumulative Perpetual Preferred Stock | New York Stock Exchange | |
Common Stock, without par value | The NASDAQ Stock Market LLC |
Securities registered pursuant to Section 12(g) of the Act:None.
Indicate by check mark if the registrant is a well-known seasoned issuer, as defined in Rule 405 of the Securities Act.
Yes x No ¨
Indicate by check mark if the registrant is not required to file reports pursuant to Section 13 or Section 15(d) of the Act.
Yes ¨ No x
Indicate by check mark whether the registrant (1) has filed all reports required to be filed by Section 13 or 15(d) of the Securities Exchange Act of 1934 during the preceding 12 months (or for such shorter period that the registrant was required to file such reports), and (2) has been subject to such filing requirements for the past 90 days.
Yes x No ¨
Indicate by check mark if disclosure of delinquent filers pursuant to Item 405 of Regulation S-K (Section 229.405 of this chapter) is not contained herein, and will not be contained, to the best of registrant’s knowledge, in definitive proxy or information statements incorporated by reference in Part III of this Form 10-K or any amendment to this Form 10-K.¨
Indicate by check mark whether the registrant is a large accelerated filer, an accelerated filer, a non-accelerated filer, or a non-accelerated filer.smaller reporting company. See definitionthe definitions of “large accelerated filer,” “accelerated filer,” and large accelerated filer”“smaller reporting company” in Rule 12b-2 of the Exchange Act. (Check one):
Large accelerated filer x Accelerated filer ¨ Non-accelerated filer ¨ Smaller reporting company ¨
Indicate by check mark whether the registrant is a shell company (as defined in Rule 12b-2 of the Exchange Act).
Yes ¨ No x
Aggregate Market Value of Common Stock Held by Non-affiliates at June 30, 2006 | $ | 7,939,764,713 | |
Number of Common Shares Outstanding at February 16, 2007 | 109,997,378 shares | ||
Aggregate Market Value of Common Stock Held by Non-affiliates at June 30, 2008 | $ | 3,226,459,704 | |
Number of Common Shares Outstanding at February 20, 2009 | 115,337,627 shares |
Documents Incorporated by Reference:
Portions of the Company’s Proxy Statement (to be dated approximately March 16, 2007) for the Annual Meeting of Shareholders to be held May 4, 2007 – Incorporated into Part III
| Page | ||||
| Item 1. | ||||
| Item 1A. | ||||
| Item 1B. | ||||
| Item 2. | ||||
| Item 3. | ||||
| Item 4. | Submission of Matters to a Vote of Security | |||
| PART II | ||||
| Item 5. | ||||
| Item 6. | ||||
| Item 7. | Management’s Discussion and Analysis of Financial Condition and Results of Operations. | |||
| Item 7A. | ||||
| Item 8. | ||||
| Item 9. | Changes in and Disagreements with Accountants on Accounting and Financial Disclosure. | |||
| Item 9A. | ||||
| Item 9B. | ||||
| PART III | ||||
| Item 10. | ||||
| Item 11. | ||||
| Item 12. | Security Ownership of Certain Beneficial Owners and Management and Related Stockholder Matters. | |||
| Item 13. | Certain Relationships and Related Transactions, and Director Independence. | |||
| Item 14. | ||||
| PART IV | ||||
| Item 15. | ||||
FORWARD-LOOKING INFORMATION
Statements in this Annual Report on Form 10-K that are based on other than historical data are forward-looking within the meaning of the Private Securities Litigation Reform Act of 1995. Forward-looking statements provide current expectations or forecasts of future events and include, among others:
statements with respect to the beliefs, plans, objectives, goals, guidelines, expectations, anticipations, and future financial condition, results of operations and performance of Zions Bancorporation (“the parent”) and its subsidiaries (collectively “the Company”Company,” “Zions,” “we,” “our,” “us”);
statements preceded by, followed by or that include the words “may,” “could,” “should,” “would,” “believe,” “anticipate,” “estimate,” “expect,” “intend,” “plan,” “projects,” or similar expressions.
These forward-looking statements are not guarantees of future performance, nor should they be relied upon as representing management’s views as of any subsequent date. Forward-looking statements involve significant risks and uncertainties and actual results may differ materially from those presented, either expressed or implied, in this Annual Report on Form 10-K, including, but not limited to, those presented in the Management’s Discussion and Analysis. Factors that might cause such differences include, but are not limited to:
the Company’s ability to successfully execute its business plans, manage its risks, and achieve its objectives;
changes in political and economic conditions, including the political and economic effects of the current economic crisis and other major developments, including wars, military actions and terrorist attacks against the United States and related events;attacks;
changes in financial market conditions, either internationally, nationally or locally in areas in which the Company conducts its operations, including without limitation, reduced rates of business formation and growth, commercial and residential real estate development and real estate prices;
fluctuations in themarkets for equity, fixed-income, commercial paper and fixed-income markets;other securities, including availability, market liquidity levels, and pricing;
changes in interest rates, the quality and composition of the loan and securities portfolios, demand for loan products, deposit flows and competition;
acquisitions and integration of acquired businesses;
increases in the levels of losses, customer bankruptcies, claims and assessments;
changes in fiscal, monetary, regulatory, trade and tax policies and laws, including policies of the U.S. Department of Treasury and the Federal Reserve Board;
the Company’s participation or lack of participation in governmental programs implemented under the Emergency Economic Stabilization Act (“EESA”) and the American Recovery and Reinvestment Act (“ARRA”), including without limitation the Troubled Asset Relief Program (“TARP”), the Capital Purchase Program (“CPP”), and the Temporary Liquidity Guarantee Program (“TLGP”) and the impact of such programs and related regulations on the Company and on international, national, and local economic and financial markets and conditions;
the impact of the EESA and the ARRA and related rules and regulations on the business operations and competitiveness of the Company and other participating American financial institutions, including the impact of the executive compensation limits of these acts, which may impact the ability of the Company and other American financial institutions to retain and recruit executives and other personnel necessary for their businesses and competitiveness;
the impact of certain provisions of the EESA and ARRA and related rules and regulations on the attractiveness of governmental programs to mitigate the effects of the current economic crisis, including the risks that certain financial institutions may elect not to participate in such programs, thereby decreasing the effectiveness of such programs;
continuing consolidation in the financial services industry;
new litigation or changes in existing litigation;
success in gaining regulatory approvals, when required;
changes in consumer spending and savings habits;
increased competitive challenges and expanding product and pricing pressures among financial institutions;
demand for financial services in the Company’s market areas;
inflation and deflation;
technological changes and the Company’s implementation of new technologies;
the Company’s ability to develop and maintain secure and reliable information technology systems;
legislation or regulatory changes which adversely affect the Company’s operations or business;
the Company’s ability to comply with applicable laws and regulations; and
changes in accounting policies or procedures as may be required by the Financial Accounting Standards Board or regulatory agencies.agencies; and
increased costs of deposit insurance and changes with respect to Federal Deposit Insurance Corporation (“FDIC”) insurance coverage levels.
The Company specifically disclaims any obligation to update any factors or to publicly announce the result of revisions to any of the forward-looking statements included herein to reflect future events or developments.
AVAILABILITY OF INFORMATION
We also make available free of charge on our website,www.zionsbancorporation.com, annual reports on Form 10-K, quarterly reports on Form 10-Q, and current reports on Form 8-K and amendments to those reports filed or furnished pursuant to Section 13(a) or 15(d) of the Securities Exchange Act of 1934, as well as proxy statements, as soon as reasonably practicable after we electronically file such material with, or furnish it to, the U.S. Securities and Exchange Commission.
GLOSSARY OF ACRONYMS
ABS – Asset-Backed Security
AFS – Available-for-Sale
ALCO – Asset/Liability Committee
ALM – Asset-Liability Management
AML – Anti-Money Laundering
ARM – Adjustable Rate Mortgage
ARRA – American Recovery and Reinvestment Act
ATM – Automated Teller Machine
BCBS – Basel Committee on Banking Supervision
BSA – Bank Secrecy Act
CDARS – Certificate of Deposit Account Registry System
CDO – Collateralized Debt Obligation
CMC – Capital Management Committee
COSO – Committee of Sponsoring Organizations of the Treadway Commission
CPFF – Commercial Paper Funding Facility
CPP – Capital Purchase Program
CRA – Community Reinvestment Act
CRE – Commercial Real Estate
EESA – Emergency Economic Stabilization Act
EITF – Emerging Issues Task Force
ESOARS – Employee Stock Option Appreciation Rights Securities
FAMC – Federal Agricultural Mortgage Corporation
FASB – Financial Accounting Standards Board
FDIC – Federal Deposit Insurance Corporation
FHLB – Federal Home Loan Bank
FHLMC – Federal Home Loan Mortgage Corporation
FIN – FASB Interpretation
FINRA – Financial Industry Regulatory Authority
FNMA – Federal National Mortgage Association
FRB – Federal Reserve Board
FSP – FASB Staff Position
FTE – Full-Time Equivalent
GNMA – Government National Mortgage Association
HTM – Held-to-Maturity
ISDA – International Swap Dealer Association
LIBOR – London Inter-Bank Offering Rate
LTV – Loan-to-Value
MD&A – Management’s Discussion and Analysis
NPR – Notice of Proposed Rulemaking
NRSRO – Nationally Recognized Statistical Rating Organization
OCC – Office of the Comptroller of the Currency
OCI – Other Comprehensive Income
OREO – Other Real Estate Owned
OTC – Over-the-Counter
OTTI – Other-Than-Temporary-Impairment
PCAOB – Public Company Accounting Oversight Board
PDs – Probabilities of Default
QSPE – Qualifying Special-Purpose Entity
REIT – Real Estate Investment Trust
SBA – Small Business Administration
SBIC – Small Business Investment Company
SEC – Securities and Exchange Commission
SFAS – Statement of Financial Accounting Standards
TAF – Term Auction Facility
TARP – Troubled Asset Relief Program
TLGP – Temporary Liquidity Guarantee Program
VIE – Variable Interest Entity
| ITEM 1. | BUSINESS |
DESCRIPTION OF BUSINESS
Zions Bancorporation (“the Parent”) is a financial holding company organized under the laws of the State of Utah in 1955, and registered under the Bank Holding Company Act of 1956, as amended (the “BHC Act”). The Parent and its subsidiaries (collectively “the Company”) own and operate eight commercial banks with a total of 470 offices513 domestic branches at year-end 2006.2008. The Company provides a full range of banking and related services through its banking and other subsidiaries, primarily in Utah, California, Texas, Arizona, Nevada, Colorado, Idaho, Washington, and Oregon. Full-time equivalent employees totaled 10,61811,011 at year-end 2006.2008. For further information about the Company’s industry segments, see “Business Segment Results” on page 60 in Management’s Discussion and Analysis (“MD&A”) and Note 22 of the Notes to Consolidated Financial Statements. For information about the Company’s foreign operations, see “Foreign Operations” on page 58 in MD&A. The “Executive Summary” on page 18 in MD&A provides further information about the Company.
PRODUCTS AND SERVICES
The Company focuses on maintaining community-mindedproviding community banking services by continuously strengthening its core business lines of 1) small, medium-sized business and corporate banking; 2) commercial and residential development, construction and term lending; 3) retail banking; 4) treasury cash management and related products and services; 5) residential mortgage; 6) trust and 6)wealth management; and 7) investment activities. It operates eight different banks in ten Western and Southwestern states with each bank operating under a different name and each having its own board of directors, chief executive officer, and management team. The banks provide a wide variety of commercial and retail banking and mortgage lending products and services. They also provide a wide range of personal banking services to individuals, including home mortgages, bankcard, student and other installment loans, home equity lines of credit, checking accounts, savings accounts, time certificates of various types and maturities, trust services, safe deposit facilities, direct deposit, and 24-hour ATM access. In addition, certain banking subsidiaries provide services to key market segments through their Women’s Financial, Private Client Services, and Executive Banking Groups. We also offer wealth management services through a subsidiary, Contango Capital Advisors, Inc., (“Contango”) that was launched in 2004., and online brokerage services through Zions Direct.
In addition to these core businesses, the Company has built specialized lines of business in capital markets, public finance, and certain financial technologies, and is also a leader in U.S. Small Business Administration (“SBA”) lending. Through its eight banking subsidiaries, the Company provides SBA 7(a) loans to small businesses throughout the United States and is also one of the largest providers of SBA 504 financing in the nation. The Company owns an equity interest in the Federal Agricultural Mortgage Corporation (“Farmer Mac”) and is one of the nation’s top originatororiginators of secondary market agricultural real estate mortgage loans through Farmer Mac. The Company is a leader in municipal finance advisory and underwriting services. The Company also controls four venture capital funds that provide early-stage capital primarily for start-up companies located in the Western United States. Finally, the Company’s NetDeposit Inc. (“NetDeposit”) and P5, Inc. (“P5”) subsidiaries are national leaderssubsidiary is a leader in the provision of check imaging and clearing software and of web-based medical claims tracking and cash management services, respectively.
software.
COMPETITION
The Company operates in a highly competitive environment. The Company’s most direct competition for loans and deposits comes from other commercial banks, thrifts, and credit unions, including institutions that do not have a physical presence in our market footprint but solicit via the Internet and other means. In addition, the Company competes with finance companies, mutual funds, brokerage firms, securities dealers, investment banking companies, financial technology firms, and a variety of other types of companies. Many of these companies have fewer regulatory constraints and some have lower cost structures.
structures or tax burdens.
The primary factors in competing for business include pricing, convenience of office locations and other delivery methods, range of products offered, and the level of service delivered. The Company must compete effectively along all of these parameters to remain successful.
SUPERVISION AND REGULATION
The Parent is a bank holding company that has elected to become a financial holding company under the BHC Act. The Gramm-Leach-Bliley Act of 1999 (“the GLB Act”) provides a regulatory framework for financial holding companies, which have as their umbrella regulator the Federal Reserve Board (“FRB”). The functional regulation of the separately regulated subsidiaries of a holding company is conducted by each subsidiary’s primary functional regulator. To qualify for and maintain status as a financial holding company, a companythe Parent must satisfy certain ongoing criteria.
The GLB Act also provides federal regulations dealing with privacy for nonpublic personal information of individual customers, with which the Company must comply. In addition, the Company is subject to various other federal and state laws that deal with the use and disclosure of nonpublic personal information.
The Parent is a financial holding company and, as such, is subject to the BHC Act. The BHC Act requires the prior approval of the FRB for a financial holding company to acquire or hold more than 5% voting interest in any bank. The BHC Act allows, subject to certain limitations, interstate bank acquisitions and interstate branching by acquisition anywhere in the country.
The BHC Act restricts the Company’s nonbanking activities to those that are permitted for financial holding companies or that have been determined by the FRB to be financial in nature, incidental to financial activities, or complementary to a financial activity. The BHC Act does not place territorial restrictions on the activities of nonbank subsidiaries of financial holding companies.
The Company’s banking subsidiaries are also subject to various requirements and restrictions contained in both the laws of the United States and the states in which the banks operate. These include restrictions on:
transactions with affiliates;
the amount of loans to a borrower and its affiliates;
the nature and amount of any investments;
their ability to act as an underwriter of securities;
the opening of branches; and
the acquisition of other financial entities.
In addition, the Company’s subsidiary banks are subject to the provisions of the National Bank Act or the banking laws of their respective states, as well as the rules and regulations of the Office of the Comptroller of the Currency (“OCC”), the FRB, and the Federal Deposit Insurance Corporation (“FDIC”).FDIC. They are also under the supervision of, and are continually subject to periodic examination by, the OCC or their respective state banking departments, the FRB, and the FDIC. Many of our nonbank subsidiaries are also subject to regulation by the FRB and other applicable federal and state agencies. Our brokerage and investment advisory subsidiaries are regulated by the Securities and Exchange Commission (“SEC”), Financial Industry Regulatory Authority (“FINRA”) and/or state securities regulators. Our other nonbank subsidiaries may be subject to the laws and regulations of the federal government and/or the various states in which they conduct business.
The Company is subject to various requirements and restrictions contained in both the laws of the United States and the states in which its banks and other subsidiaries operate. These regulations include but are not limited to the following:
Laws and regulations regarding the availability, requirements and restrictions of a number of recently enacted governmental programs in which the Company participates, including the TARP and its associated CPP, the TLGP, the Term Auction Facility (“TAF”) and the Commercial Paper Funding Facility (“CPFF”), as well as certain conditions imposed by the EESA and ARRA and programs thereunder, including limitations on dividends on common stock in the CPP, and on executive compensation contained in the ARRA. Some of these programs, including specifically the CPP, contain provisions that allow the U.S. Government to unilaterally modify any term or provision of contracts executed under the program.
Requirements for approval of acquisitions and activities. The prior approval is required, in accordance with the BHC Act of the FRB, for a financial holding company to acquire or hold more than 5% voting interest in any bank. The BHC Act allows, subject to certain limitations, interstate bank acquisitions and interstate branching by acquisition anywhere in the country. The BHC Act also requires approval for certain nonbanking acquisitions and restricts the Company’s nonbanking activities to those that are permitted for financial holding companies or that have been determined by the FRB to be financial in nature, incidental to financial activities, or complementary to a financial activity.
��
Capital requirements. The FRB has established capital guidelines for financial holding companies. The OCC, the FDIC, and the FRB have also issued regulations establishing capital requirements for banks. Additional capital requirements, including taking additional capital from the U.S. Treasury in amounts and on terms yet to be defined, to be determined by “stress tests” not yet designed, may be required by the U.S. Treasury for banks larger than the Company, and could become required of the Company. There also is a risk that regional bank companies like Zions which are not deemed to be systemically important will be disadvantaged by not being allowed to participate in future government capital programs. The federal bank regulatory agencies have adopted and are proposing risk-based capital rules described below. Failure to meet capital requirements could subject the CompanyParent and its subsidiary banks to a variety of restrictions and enforcement remedies. See Note 19 of the Notes to Consolidated Financial Statements for information regarding capital requirements.
The U.S. federal bank regulatory agencies’ risk-based capital guidelines are based upon the 1988 capital accord (“Basel I”) of the Basel Committee on Banking Supervision (the “BCBS”). The BCBS is a committee of central banks and bank supervisors/regulators from the major industrialized countries that develops broad policy guidelines that each country’s supervisors can use to determine the
supervisory policies they apply. The BCBS has been working for a number of years on revisions to Basel I and in June 2004 releasedI. In December 2007, U.S. banking regulators published the final versionrule for Basel II implementation, requiring banks with over $250 billion in consolidated total assets or on-balance sheet foreign exposure of its proposed new capital framework with an update in November 2005 (“$10 billion (core banks) to adopt the Advanced Approach of Basel II”). II while allowing other banks to elect to “opt in.”
Basel II provides two approaches for setting capital standards for credit risk – an internal ratings-based approach tailored to individual institutions’ circumstances (which for many asset classes is itself broken into a “foundation” approach and an “advanced” or “A-IRB” approach, the availability of which is subject to additional restrictions) and a standardized approach that bases risk weightings on external credit assessments to a much greater extent than permitted in existing risk-based capital guidelines. Basel II also would setsets capital requirements for operational risk and refinerefines the existing capital requirements for market risk exposures. However, U.S. regulatory authorities consistently have taken the position that U.S. banks would not be permitted to utilize the “foundation” approach. Operational risk is defined by the proposal to mean the risk of direct or indirect loss resulting from inadequate or failed internal processes, people and systems, or from external events. Basel I does not include separate capital requirements for operational risk.
In September 2006, the U.S. banking and thrift agencies issued an interagency Advance Notice of Proposed Rulemaking (“NPR”) setting forth a definitive proposal for implementing Basel II in the United States that would apply only to internationally active banking organizations – defined as those with consolidated total assets of $250 billion or more or consolidated on-balance sheet
foreign exposures of $10 billion or more – but that other U.S. banking organizations could elect, but would not be required to apply. We doare not currently expect to be an early “opt in” bank holding company, as the Company does not have in place the data collection and analytical capabilities necessary to adopt Basel II.the Advanced Approach. However, we believe that the competitive advantages afforded to companies that do adopt the framework willAdvanced Approach may make it necessary for the Company to elect to “opt in” at some point,point. Whether or not this scenario emerges, our risk management will be well served by our continuing investment in more sophisticated analytical capabilities and we have begun investing in an enhanced data environment.
In July 2008, the required capabilities.U.S. banking regulators issued a proposed rule that would provide “non-core” banks with the option to adopt the Standardized Approach proposed in Basel II, replacing the previously proposed Basel 1A framework. While the Advanced Approach uses sophisticated mathematical models to measure and assign capital to specific risks, the Standardized Approach categorizes risks by type and then assigns capital requirements. We are evaluating the benefit of adopting the Standardized Approach and will make a decision following publication of the final rule.
Additional modifications of the Basel II regime continue to be proposed or adopted, but the requirements of the CPP and the ARRA appear to be “overriding” for the time being on any Basel II issues as they might apply to the Company.
Also, in December 2006,Requirements that the agencies issued another NPRParent serve as a source of strength for modificationsits banking subsidiaries. The FRB has a policy that a bank holding company is expected to act as a source of financial and managerial strength to each of its bank subsidiaries and, under appropriate circumstances, to commit resources to support each subsidiary bank. In addition, the Basel I framework for those banks not adopting Basel II, called Basel IA. The Basel IA NPR will allow non-Basel II banking organizations the choice of adopting allOCC may order an assessment of the revisions suggested inParent if the proposed NPR or continuingcapital of one of its national bank subsidiaries were to fall below capital levels required by the use of existing risk-based capital rules. The agencies have indicated their intent to have the A-IRB provisions for internationally active U.S. banking organizations first become effective in March 2009 and that those provisions and the Basel IA provisions for others will be implementedregulators.
Limitations on similar time frames.
Dividendsdividends payable by subsidiaries. A substantial portion of the Parent’s cash, which is used to pay dividends on our common and preferred stock and to pay principal and interest on our debt obligations, is derived from dividends paid by the Parent’s subsidiary banks to the Parentbanks. These dividends are subject to various legal and regulatory restrictions. These restrictions and the amount available for the payment of dividends at year-end areas summarized in Note 19 of the Notes to Consolidated Financial Statements.
The Financial Institutions Reform, Recovery, and Enforcement ActCross-guarantee requirements. All of 1989 provides that the Company’sParent’s subsidiary banks are insured by the FDIC. Each commonly controlled FDIC-insured bank subsidiaries arecan be held liable for any losslosses incurred, or reasonably expected to be incurred, by the FDIC due to another commonly controlled FDIC-insured bank being placed into receivership, and for any assistance provided by the FDIC to another commonly controlled FDIC-insured bank that is subject to certain conditions indicating that receivership is likely to occur in connection with the failureabsence of an affiliated insured bank.regulatory assistance.
TheSafety and soundness requirements. Federal and state laws require that our banks be operated in a safe and sound manner. We are subject to additional safety and soundness standards prescribed in the Federal Deposit Insurance CorporationCorporate Improvement Act of 1991, prescribesincluding standards for the safety and soundness of insured banks. These standards relaterelated to internal controls, information systems, internal audit, systems, loan documentation, credit underwriting, interest rate exposure, asset growth and compensation, as well as other operational and management standards deemed appropriate by the federal banking regulatory agencies.
Limitations on the amount of loans to a borrower and its affiliates.
The Limitations on transactions with affiliates.
Restrictions on the nature and amount of any investments and ability to underwrite certain securities.
Requirements for opening of branches and the acquisition of other financial entities.
Fair lending and truth in lending requirements to provide equal access to credit and to protect consumers in credit transactions.
Provisions of the GLB Act and other federal and state laws dealing with privacy for nonpublic personal information of individual customers.
Community Reinvestment Act (“CRA”) requirements. The CRA requires banks to help serve the credit needs in their communities, including credit to low and moderate income individuals. Should the Company or its subsidiaries fail to adequately serve their communities, penalties may be imposed including denials of applications to add branches, relocate, add subsidiaries and affiliates, and merge with or purchase other financial institutions.
Anti-money laundering regulations. The GLBBank Secrecy Act (“BSA”) and other federal laws require financial institutions to assist U.S. Government agencies to detect and prevent money laundering. Specifically, the BSA requires “satisfactory”financial institutions to keep records of cash purchases of negotiable instruments, file reports of cash transactions exceeding $10,000 (daily aggregate amount), and to report suspicious activity that might signify money laundering, tax evasion, or higher CRA compliance for insured depository institutions and their financial holding companies for them to engage in new financialother criminal activities. If one of the Company’s banks should receive a CRA rating of less than satisfactory, the Company could lose its status as a financial holding company.
On October 26, 2001, the President signed into law comprehensive anti-terrorism legislation known as the USA PATRIOT Act of 2001 (the “USA Patriot Act”). Title III of the Uniting and Strengthening of America by Providing Appropriate Tools Required to Intercept and Obstruct Terrorism Act of 2001 (“USA Patriot ActAct”) substantially broadens the scope of U.S. anti-money laundering laws and regulations by imposing significant new compliance and due diligence obligations, defining new crimes and related penalties, and expanding the extra-territorial jurisdiction of the United States. The U.S. Treasury Department has issued a number of implementing regulations, which apply various requirements of the USA Patriot Act to financial institutions. The Company’s bank and broker-dealer subsidiaries and mutual funds and private investment companies advised or sponsored by the Company’s subsidiaries must comply with these regulations. These regulations also impose new obligations on financial institutions to maintain appropriate policies, procedures and controls to detect, prevent and report money laundering and terrorist financing.
The Parent is subject to the disclosure and regulatory requirements of the Securities Act of 1933, as amended, and the Securities Exchange Act of 1934, as amended, both as administered by the SEC. As a company quoted on the NASDAQ Stock Market LLC (“Nasdaq”) Global Select Market, the Parent is subject to Nasdaq listing standards for quoted companies.
The Company has adopted appropriate policies, procedures and controlsis subject to address compliance with the requirements of these acts and will continue to make appropriate revisions to reflect any changes required.
Regulators, Congress, and state legislatures continue to enact rules, laws, and policies to regulate the financial services industry and to protect consumers. The nature of these laws and regulations and the effect of such policies on future business and earnings of the Company cannot be predicted.
On July 30, 2002, the Senate and the House of Representatives of the United States (Congress) enacted the Sarbanes-Oxley Act of 2002, a law thatwhich addresses, among other issues, corporate governance, auditing and accounting, executive compensation, and enhanced and timely disclosure of corporate information. The Nasdaq has also adopted corporate governance rules, which are intended to allow shareholders and investors to more easily and efficiently monitor the performance of companies and their directors.
The Board of Directors of the Parent has implemented a comprehensive system of strong corporate governance practices. This system includes Corporate Governance Guidelines, a Code of Business Conduct and Ethics for Employees, a Directors Code of Conduct, and charters for the Audit, Credit Review, Executive Compensation, and Nominating and Corporate Governance Committees. More information on the Company’s corporate governance practices is available on the Company’s website atwww.zionsbancorporation.com. (The Company’s website is not part of this Annual Report on Form 10-K.)
The Company has adopted policies, procedures and controls to address compliance with the requirements of the banking, securities and other laws and regulations described above or otherwise applicable to the Company. The Company intends to make appropriate revisions to reflect any changes required.
Regulators, Congress, and state legislatures continue to enact rules, laws, and policies to regulate the financial services industry and public companies and to protect consumers and investors. The nature of these laws and regulations and the effect of such policies on future business and earnings of the Company cannot be predicted.
GOVERNMENT MONETARY POLICIES
The earnings and business of the Company are affected not only by general economic conditions, but also by fiscal and other policies adopted by various governmental authorities. The Company is particularly affected by the monetary policies of the FRB, which affect short-term interest rates and the national supply of bank credit. The methods of monetary policytools available to the FRB which may be used to implement monetary policy include:
open-market operations in U.S. governmentGovernment securities;
adjustment of the discount rates or cost of bank borrowings from the FRB; and
imposing or changing reserve requirements against bank deposits.deposits;
term auction facilities collateralized by bank loans; and
other programs to purchase assets and inject liquidity directly in various segments of the economy.
These methods are used in varying combinations to influence the overall growth or contraction of bank loans, investments and deposits, and the interest rates charged on loans or paid for deposits.
In view of the changing conditions in the economy and the effect of the FRB’s monetary policies, it is difficult to predict future changes in loan demand, deposit levels and interest rates, or their effect on the business and earnings of the Company. FRB monetary policies have had a significant effect on the operating results of commercial banks in the past and are expected to continue to do so in the future.
| ITEM 1A. | RISK FACTORS |
The following list describes several risk factors which are significant to the Company:Company including but not limited to:
The United States and other countries are facing a severe economic crisis. In response the United States and other governments have established a variety of programs and policies designed to mitigate the effects of the crisis. Many of these programs and policies are unprecedented and untested and may not be effective or may have adverse consequences, whether anticipated or unanticipated. If these programs and policies are ineffective or result in substantial adverse developments, the economic crisis may become more severe or may continue for a substantial period of time. Any increase in the severity or duration of the economic crisis would adversely affect the Company.
The Company has chosen to participate in a number of new programs sponsored by the U.S. Government during the current financial and economic crisis, and in the future may elect to or be required to participate in these or other, as not yet enacted, programs. The company is therefore subject to the risk that these programs may not be available in the future, or that it will be forced to participate in programs that it does not believe to be in its best interest or that of its shareholders. These programs, including the TARP and its associated CPP, the TLGP, the TAF, and the CPFF, as well as the ARRA and EESA, contain important limitations on the Company’s conduct of its business, including limitations on dividends, repurchases of common stock, acquisitions, and executive compensation contained in the CPP and the ARRA. These limitations may adversely impact the Company’s ability to attract nongovernmental capital and to recruit and retain executive management and other personnel and its ability to compete with other American and foreign financial institutions. One of these programs, the CPP, contains provisions that allow the U.S. Government to unilaterally modify any term or provision of contracts executed under the program.
Certain provisions of the ESSA and ARRA and related rules and regulations may lead certain financial institutions to elect not to participate in governmental programs designed to mitigate the current economic crisis, thereby decreasing the effectiveness of such programs and creating additional stresses on employees and customers of and investors in American financial institutions.
Credit risk is one of our most significant risks. OverThe Company’s level of credit quality continued to weaken during 2008. The deterioration in credit quality is mainly related to the weakness in residential development and construction activity in the Southwest that started in the latter half of 2007. Although not to the degree experienced in the Southwestern states (generally Arizona, Nevada and California), some signs of deterioration began to surface in Utah and Idaho during the first quarter of 2008 and in the Texas market in the fourth quarter of 2008. Residential construction and land development loans in Arizona and Nevada remain the most troubled segments of the portfolio and account for the most meaningful declines in commercial real estate credit quality during the last three years we have experienced historically high levelshalf of 2008. We expect continued credit quality. We do not see any indicationsquality deterioration over the next few quarters. With the economy continuing to weaken, there is a risk that credit quality will deteriorate significantly, but it is unlikely that we willcould be able to maintain credit quality at these levels indefinitely. Economic conditions in the high growth geographical areas in whichadversely impacted throughout our banks operate have been strong, but events could result in weaker economic conditions including deterioration of property values that could significantly increase the Company’s credit risk.geographic footprint and for other loan types.
Net interest income is the largest component of the Company’s revenue. The management of interest rate risk for the Company and all bank subsidiaries is centralized and overseen by an Asset Liability Management Committee appointed by the Company’s Board of Directors. The Company has been successful in its interest rate risk management as evidenced by its achieving a relatively stable net interest rate margin over the last several years when interest rates have been volatile and the rate environment challenging. Factors beyond the Company’s control can significantly influence the interest rate environment and increase the Company’s risk. These factors include competitive pricing pressures for our loans and deposits, adverse shifts in the mix of deposits and other funding sources, and volatile market interest rates subject to general economic conditions and the policespolicies of governmental and regulatory agencies, in particular the FRB.
Funding availability, as opposed to funding cost, became a more important risk factor in the latter half of 2007 and in 2008, as a global liquidity crisis affected financial institutions generally, including the Company, and is expected to remain an issue in 2009. However, this global liquidity crisis was partially mitigated as the Company strengthened its capital and liquidity during the latter half of 2008, including raising approximately $300 million of common and preferred equity, a capital investment of $1.4 billion from the U.S. Treasury as part of the Treasury’s CPP, as well as its participation in the TAF, and the TLGP. See “Capital Management” on page 119 in MD&A and Notes 11 and 14 of the Notes to Consolidated Financial Statements for further information on funding availability.
It is expected that liquidity stresses will continue to be a risk factor in 2009 for the Company, the Parent and its affiliate banks, and for Lockhart Funding, LLC (“Lockhart”). Lockhart’s participation in the CPFF has mitigated these stresses for it; however, this program is currently scheduled to expire in October 2009.
Zions Bank sponsors an off-balance sheet qualifying special-purpose entity (“QSPE”), Lockhart, which funds its assets by issuing asset-backed commercial paper. Its assets include securities which are rated AAA and AA or guaranteed by the U.S. Government. Factors beyond the Company’s control can significantly influence whether Lockhart will remain as an off-balance sheet QSPE and whether the Company will be required to purchase, and possibly incur losses, on securities from Lockhart under the provisions of a Liquidity Agreement the Company provides to Lockhart. These factors include Lockhart’s inability to issue asset-backed commercial paper, expiration of the Federal Reserve’s CPFF without sufficient offsetting market demand for Lockhart’s commercial paper, rating agency downgrades of securities, and instability in the credit markets.
The Company’s on-balance sheet asset-backed securities investment portfolio includes collateralized debt obligations (“CDOs”) collateralized by trust preferred securities issued by banks, insurance companies, and real estate investment trusts (“REITs”) that may have some exposure to the subprime market and/or to other categories of distressed assets. In addition, asset-backed securities also include structured asset-backed collateralized debt obligations (“ABS CDOs”) (also known as diversified structured finance CDOs) purchased from Lockhart which have minimal exposure to subprime and home equity mortgage securitizations. Factors beyond the Company’s control can significantly influence the fair value of these securities and potential adverse changes to the fair value of these securities. These factors include but are not limited to rating agency downgrades of securities, defaults of debt issuers, lack of market pricing of securities, rating agency downgrades of monoline insurers that insure certain asset-backed securities, and continued instability in the credit markets. See “Investment Securities Portfolio” on page 85 for further details.
The Company is exposed to accounting, financial reporting, and regulatory/compliance risk. The Company provides to its customers a number of complex financial products and services. Estimates, judgments and interpretations of complex and changing accounting and regulatory policies are required in order to provide and account for these products and services. Identification, interpretation and implementation of complex and changing accounting standards as well as compliance with regulatory requirements, including the BSA and various Know Your Customer, Identity Theft Red Flag, and Anti-Money Laundering regulations, therefore pose an ongoing risk.
The Company is subject to risks associated with legal claims and litigation. The Company’s exposure to claims and litigation may increase as a result of stresses on customers, counterparties and others arising from the current economic crisis.
A failure in our internal controls could have a significant negative impact not only on our earnings, but also on the perception that customers, regulators and investors may have of the Company. We continue to devote a significant amount of effort, time and resources to improving our controls and ensuring compliance with complex accounting standards and regulations.
We have a number of business initiatives that, while we believe they will ultimately produce profits for our shareholders, currently generate expenses in excess of revenues. Two significant initiatives are Contango, a wealth management business started in 2004, and NetDeposit, a subsidiary that provides electronic check processing systems. Our management of these businesses takes into account the development of revenues and control of expenses so that results of operations are not adverse to an extent that is not warranted by the expected opportunities these businesses provide.
As noted previously, U.S. and international regulators have proposedadopted new capital standards commonly known as Basel II. These standards would apply toAs a number of our largest competitors and potentially give them a significant competitive advantage overbank holding company with less than $250 billion in consolidated total assets
and on-balance sheet foreign exposure of less than $10 billion, we can but are not required to adopt the Advanced Approach of Basel II. We have not as yet chosen to adopt it. However, these standards would apply to a number of our largest competitors and potentially give them a competitive advantage over banks that do not adopt these standards. |
From time to time the Company makes acquisitions. The success of any acquisition depends, in part, on our ability to realize the projected cost savings from the merger and on the continued growth and profitability of the acquisition target. We have been successful with most prior mergers, but it is possible that the merger and integration process with an acquisition target could result in the loss of key employees, disruptions in controls, procedures and policies, or other factors that could affect our ability to realize the projected savings and successfully retain and grow the target’s customer base.
The Company’s Board of Directors has established an Enterprise-Wide Risk Management policy and appointed an Enterprise Risk Management Committee in 2005 to oversee and implement the policy. In addition to credit and interest rate risk, the Committee also oversees and monitors the following risk areas: market risk, liquidity risk, operational risk, compliance risk, information technology risk, strategic risk, and reputation risk.
| ITEM 1B. | UNRESOLVED STAFF COMMENTS |
None.
| ITEM 2. | PROPERTIES |
At year-end 2006,December 31, 2008, the Company operated 470513 domestic branches, of which 225269 are owned and 245244 are on leased premises.leased. The Company also leases its headquarter offices in Salt Lake City, Utah. Other operationsoperation facilities are either owned or leased. The annual rentals under long-term leases for leased premises are determined under various formulas and factors, including operating costs, maintenance, and taxes. For additional information regarding leases and rental payments, see Note 18 of the Notes to Consolidated Financial Statements.
| ITEM 3. | LEGAL PROCEEDINGS |
The information contained in Note 18 of the Notes to Consolidated Financial Statements is incorporated by reference herein.
| ITEM 4. | SUBMISSION OF MATTERS TO A VOTE OF SECURITY HOLDERS |
None.
| ITEM 5. | MARKET FOR REGISTRANT’S COMMON EQUITY, RELATED STOCKHOLDER MATTERS AND ISSUER PURCHASES OF EQUITY SECURITIES |
MARKET INFORMATION
The Company’s common stock is traded on the Nasdaq Global Select Market under the symbol “ZION.” The last reported sale price of the common stock on Nasdaq on February 16, 200720, 2009 was $87.56$9.00 per share.
The following table sets forth, for the periods indicated, the high and low sale prices of the Company’s common stock, as quoted on Nasdaq:
| 2006 | 2005 | 2008 | 2007 | ||||||||||||||||
| High | Low | High | Low | High | Low | High | Low | ||||||||||||
1st Quarter | $ | 85.25 | 75.13 | 70.45 | 63.33 | $ | 57.05 | 39.31 | 88.56 | 81.18 | |||||||||
2nd Quarter | 84.18 | 76.28 | 75.17 | 66.25 | 51.15 | 29.46 | 86.00 | 76.59 | |||||||||||
3rd Quarter | 84.09 | 75.25 | 74.00 | 68.45 | 107.21 | 1 | 17.53 | 81.43 | 67.51 | ||||||||||
4th Quarter | 83.15 | 77.37 | 77.67 | 66.67 | 47.94 | 21.07 | 73.00 | 45.70 | |||||||||||
1 | This trading price was an anomaly resulting from electronic orders at the opening of the market on September 19, 2008 in response to the SEC’s announcement (prior to the market opening that day) of its temporary emergency action suspending short selling in financial companies. The closing price on September 19, 2008 was $52.83. |
During September 8-11, 2008, the Company issued $250 million of new common stock consisting of 7,194,079 shares at an average price of $34.75 per share. Net of issuance costs and fees, this issuance added $244.9 million to common stock.
As of February 16, 2007,20, 2009, there were 6,9826,224 holders of record of the Company’s common stock.
DIVIDENDS
The frequency and amount of common stock dividends paid during the last two years are as follows:
1st Quarter | 2nd Quarter | 3rd Quarter | 4th Quarter | ||||||
2006 | $ | 0.36 | 0.36 | 0.36 | 0.39 | ||||
2005 | 0.36 | 0.36 | 0.36 | 0.36 | |||||
| 1st Quarter | 2nd Quarter | 3rd Quarter | 4th Quarter | ||||||
2008 | $ | 0.43 | 0.43 | 0.43 | 0.32 | ||||
2007 | 0.39 | 0.43 | 0.43 | 0.43 | |||||
On January 26, 2007,2009, the Company’s Board of Directors approved a dividend of $0.39$0.04 per common share payable on February 21, 200725, 2009 to shareholders of record on February 7, 2007.11, 2009. This is a reduction from prior dividend levels in response to the deteriorating outlook for the Company and generally for the industry and the economy as a whole. The Company expects to continue its policy of paying regular cash dividends on a quarterly basis, although there is no assurance as to future dividends because they depend on future earnings, capital requirements, and financial condition.
On December 7, 2006, we issued 240,000We have 3,000,000 authorized shares of our Series A Floating-Rate Non-Cumulative Perpetual Preferred Stockpreferred stock without par value and with an aggregatea liquidation preference of $240 million, or $1,000 per share. TheAs of December 31, 2008, 240,000, 46,949, and 1,400,000 of preferred stock was offered in the form of 9,600,000 depositary shares with each depositary share representing a 1/40th ownership interest in a share of the preferred stock.series A, C, and D, respectively, have been issued. In general, preferred shareholders are entitled tomay receive asset distributions before common shareholders; however, preferred shareholders have no preemptive or conversion rights, and only limited voting rights pertaining generally with respect to amendments to the termscertain provisions of the preferred stock, or the issuance of senior preferred stock, as well asand the rightelection of directors. Preferred stock dividends reduce earnings available to elect two directorscommon shareholders and are paid quarterly in the event of certain defaults.arrears. The preferred stockredemption amount is not redeemable prior to December 15, 2011, but will be redeemable subsequent to that datecomputed at the Company’s option at theper share liquidation preference value plus any declared but unpaid dividends. The preferred stock dividend reduces earnings availableseries A and C shares are registered with the SEC.
to common shareholders and is computed at an annual rate equalThe Series D Fixed-Rate Cumulative Perpetual Preferred Stock was issued on November 14, 2008 to the greaterU.S. Department of three-month LIBOR plus 0.52%, or 4.0%the Treasury for $1.4 billion in a private placement exempt from registration. The EESA authorized the U.S. Treasury to appropriate funds to eligible financial institutions participating in the TARP Capital Purchase Program. The capital investment includes the issuance of preferred shares of the Company and a warrant to purchase common shares pursuant to a Letter Agreement and a Securities Purchase agreement (collectively “the Agreement”). The preferred shares are rankedpari passu with the Series A and C preferred shares. The dividend rate of 5% increases to 9% after the first five years. Dividend payments are made quarterly in arrears on the 15th day of March, June, September,February, May, August, and December, commencing on March 15, 2007.November. The warrant allows the U.S. Treasury to purchase up to 5,789,909 shares of the Company’s common stock exercisable over a 10-year period at a price per share of $36.27. The preferred shares and the warrant qualify for Tier 1 regulatory capital. The Agreement subjects the Company to certain restrictions and conditions including those related to common dividends, share repurchases, executive compensation, and corporate governance.
UnderWe recorded the termstotal $1.4 billion of the preferred stock agreements, in December 2006shares and the Company was required to declare the full quarterly dividendwarrant at their relative fair values of $3.8$1,292.2 million and set aside$107.8 million, respectively. The difference from the funds before it could resumepar amount of the repurchasepreferred shares is accreted to preferred stock over five years using the interest method with a corresponding adjustment to preferred dividends.
The Company cannot increase the common stock dividend above $0.32 per share without the consent of its common shares.
the U.S. Treasury until the third anniversary of the date of the investment, or November 14, 2011, unless prior to such third anniversary the senior preferred stock series D is redeemed in whole or the U.S. Treasury has transferred all of the senior preferred stock series D to third parties.
SECURITIES AUTHORIZED FOR ISSUANCE UNDER EQUITY COMPENSATION PLANS
The information contained in Item 12 of this Form 10-K is incorporated by reference herein.
SHARE REPURCHASES
The following table summarizes the Company’s share repurchases for the fourth quarter of 2006:2008:
Period | Total number of shares | Average price paid per share | Total number of shares purchased | Approximate dollar value of shares that may yet be purchased | Total number of shares repurchased1 | Average price paid per share | Total number of shares purchased as part of publicly announced plans or programs | Approximate dollar value of shares that may yet be purchased under the plan | ||||||||||||
October | 1,057 | $ | 80.68 | – | $ | 59,253,657 | 100 | $ | 34.99 | – | $ | 56,250,315 | ||||||||
November | 365 | 79.27 | – | 59,253,657 | 387 | 29.50 | – | 56,250,315 | ||||||||||||
December | 311,987 | 81.06 | 308,359 | 375,006,404 | 8,918 | 25.97 | – | 56,250,315 | ||||||||||||
Fourth quarter | 313,409 | 81.05 | 308,359 | 9,405 | 26.21 | – | ||||||||||||||
1 | All share repurchases during the fourth quarter of 2008 were made to pay for |
The Company has not repurchased any shares under the Common Stock Repurchase Plan since August 16, 2007. It is prohibited from repurchasing any common shares by terms of the CPP until the Company’s CPP capital has been repaid.
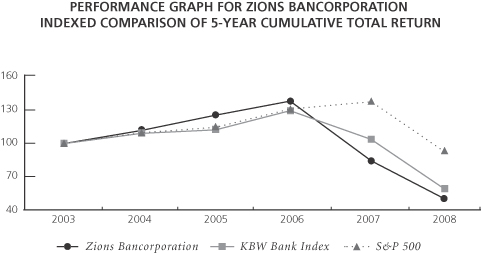
PERFORMANCE GRAPH
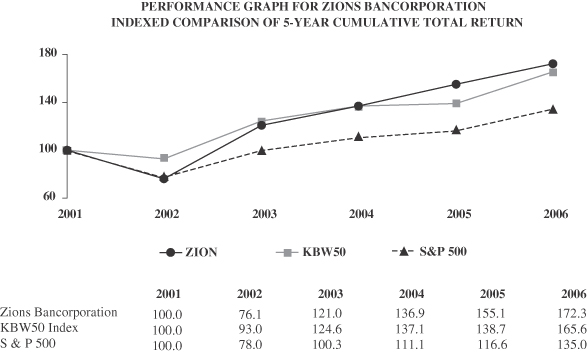
The following stock performance graph compares the five-year cumulative total return of Zions Bancorporation’s common stock with the Standard & Poor’s 500 Index and the KBW50 Index.KBW Bank Index which includes Zions Bancorporation. The KBW50KBW Bank Index is a market-capitalization weightedmarket capitalization-weighted bank stock index developed and published by Keefe, Bruyette & Woods, Inc., a nationalnationally recognized brokerage and investment banking firm specializing in bank stocks. The index is composed of 50 of the nation’s largest banking companies.24 geographically diverse stocks representing national money center banks and leading regional financial institutions. The stock performance graph is based upon an initial investment of $100 on December 31, 20012003 and assumes reinvestment of dividends.
| 2003 | 2004 | 2005 | 2006 | 2007 | 2008 | |||||||
Zions Bancorporation | 100.0 | 113.3 | 128.4 | 142.7 | 82.7 | 45.1 | ||||||
KBW Bank Index | 100.0 | 110.3 | 113.7 | 133.0 | 104.1 | 54.9 | ||||||
S&P 500 | 100.0 | 110.8 | 116.3 | 134.6 | 142.0 | 89.5 |
| ITEM 6. | SELECTED FINANCIAL DATA |
FINANCIAL HIGHLIGHTSFinancial Highlights
| (In millions, except per share amounts) | 2006/2005 CHANGE | 2006 | 2005 (3) | 2004 | 2003 | 2002 | 2008/2007 Change | 2008 | 2007 | 2006 | 20054 | 2004 | ||||||||||||||||||||
FOR THE YEAR | ||||||||||||||||||||||||||||||||
For the Year | ||||||||||||||||||||||||||||||||
Net interest income | +30% | $ | 1,764.7 | 1,361.4 | 1,160.8 | 1,084.9 | 1,025.7 | +5 | % | $ | 1,971.6 | 1,882.0 | 1,764.7 | 1,361.4 | 1,160.8 | |||||||||||||||||
Noninterest income | +26% | 551.2 | 436.9 | 431.5 | 500.7 | 386.2 | -54 | % | 190.7 | 412.3 | 551.2 | 436.9 | 431.5 | |||||||||||||||||||
Total revenue | +29% | 2,315.9 | 1,798.3 | 1,592.3 | 1,585.6 | 1,411.9 | -6 | % | 2,162.3 | 2,294.3 | 2,315.9 | 1,798.3 | 1,592.3 | |||||||||||||||||||
Provision for loan losses | +69% | 72.6 | 43.0 | 44.1 | 69.9 | 71.9 | +326 | % | 648.3 | 152.2 | 72.6 | 43.0 | 44.1 | |||||||||||||||||||
Noninterest expense | +31% | 1,330.4 | 1,012.8 | 923.2 | 893.9 | 858.9 | +5 | % | 1,475.0 | 1,404.6 | 1,330.4 | 1,012.8 | 923.2 | |||||||||||||||||||
Impairment loss on goodwill | -100% | – | 0.6 | 0.6 | 75.6 | – | 353.8 | – | – | 0.6 | 0.6 | |||||||||||||||||||||
Income from continuing operations before income taxes and minority interest | +23% | 912.9 | 741.9 | 624.4 | 546.2 | 481.1 | ||||||||||||||||||||||||||
Income taxes | +21% | 318.0 | 263.4 | 220.1 | 213.8 | 167.7 | ||||||||||||||||||||||||||
Income (loss) before income taxes and minority interest | -143 | % | (314.8 | ) | 737.5 | 912.9 | 741.9 | 624.4 | ||||||||||||||||||||||||
Income taxes (benefit) | -118 | % | (43.4 | ) | 235.8 | 318.0 | 263.4 | 220.1 | ||||||||||||||||||||||||
Minority interest | +817% | 11.8 | (1.6) | (1.7) | (7.2) | (3.7) | -163 | % | (5.1 | ) | 8.0 | 11.8 | (1.6 | ) | (1.7 | ) | ||||||||||||||||
Income from continuing operations | +21% | 583.1 | 480.1 | 406.0 | 339.6 | 317.1 | ||||||||||||||||||||||||||
Loss on discontinued operations | – | – | – | – | (1.8) | (28.4) | ||||||||||||||||||||||||||
Cumulative effect adjustment | – | – | – | – | – | (32.4) | ||||||||||||||||||||||||||
Net income | +21% | 583.1 | 480.1 | 406.0 | 337.8 | 256.3 | ||||||||||||||||||||||||||
Net earnings applicable to common shareholders | +21% | 579.3 | 480.1 | 406.0 | 337.8 | 256.3 | ||||||||||||||||||||||||||
Net income (loss) | -154 | % | (266.3 | ) | 493.7 | 583.1 | 480.1 | 406.0 | ||||||||||||||||||||||||
Net earnings (loss) applicable to common shareholders | -161 | % | (290.7 | ) | 479.4 | 579.3 | 480.1 | 406.0 | ||||||||||||||||||||||||
PER COMMON SHARE | ||||||||||||||||||||||||||||||||
Earnings from continuing operations – diluted | +4% | 5.36 | 5.16 | 4.47 | 3.74 | 3.44 | ||||||||||||||||||||||||||
Net earnings – diluted | +4% | 5.36 | 5.16 | 4.47 | 3.72 | 2.78 | ||||||||||||||||||||||||||
Net earnings – basic | +4% | 5.46 | 5.27 | 4.53 | 3.75 | 2.80 | ||||||||||||||||||||||||||
Per Common Share | ||||||||||||||||||||||||||||||||
Net earnings (loss) – diluted | -160 | % | (2.66 | ) | 4.42 | 5.36 | 5.16 | 4.47 | ||||||||||||||||||||||||
Net earnings (loss) – basic | -160 | % | (2.67 | ) | 4.47 | 5.46 | 5.27 | 4.53 | ||||||||||||||||||||||||
Dividends declared | +2% | 1.47 | 1.44 | 1.26 | 1.02 | 0.80 | -4 | % | 1.61 | 1.68 | 1.47 | 1.44 | 1.26 | |||||||||||||||||||
Book value (1) | +10% | 44.48 | 40.30 | 31.06 | 28.27 | 26.17 | ||||||||||||||||||||||||||
Book value1 | -10 | % | 42.65 | 47.17 | 44.48 | 40.30 | 31.06 | |||||||||||||||||||||||||
Market price – end | 82.44 | 75.56 | 68.03 | 61.34 | 39.35 | 24.51 | 46.69 | 82.44 | 75.56 | 68.03 | ||||||||||||||||||||||
Market price – high | 85.25 | 77.67 | 69.29 | 63.86 | 59.65 | |||||||||||||||||||||||||||
Market price – high2 | 57.05 | 88.56 | 85.25 | 77.67 | 69.29 | |||||||||||||||||||||||||||
Market price – low | 75.13 | 63.33 | 54.08 | 39.31 | 34.14 | 17.53 | 45.70 | 75.13 | 63.33 | 54.08 | ||||||||||||||||||||||
AT YEAR-END | ||||||||||||||||||||||||||||||||
At Year-End | ||||||||||||||||||||||||||||||||
Assets | +10% | 46,970 | 42,780 | 31,470 | 28,558 | 26,566 | +4 | % | 55,093 | 52,947 | 46,970 | 42,780 | 31,470 | |||||||||||||||||||
Net loans and leases | +15% | 34,668 | 30,127 | 22,627 | 19,920 | 19,040 | +7 | % | 41,859 | 39,088 | 34,668 | 30,127 | 22,627 | |||||||||||||||||||
Loans sold being serviced (2) | -24% | 2,586 | 3,383 | 3,066 | 2,782 | 2,476 | ||||||||||||||||||||||||||
Sold loans being serviced3 | -69 | % | 578 | 1,885 | 2,586 | 3,383 | 3,066 | |||||||||||||||||||||||||
Deposits | +7% | 34,982 | 32,642 | 23,292 | 20,897 | 20,132 | +12 | % | 41,316 | 36,923 | 34,982 | 32,642 | 23,292 | |||||||||||||||||||
Long-term borrowings | -9% | 2,495 | 2,746 | 1,919 | 1,843 | 1,310 | +1 | % | 2,622 | 2,591 | 2,495 | 2,746 | 1,919 | |||||||||||||||||||
Shareholders’ equity | +18% | 4,987 | 4,237 | 2,790 | 2,540 | 2,374 | ||||||||||||||||||||||||||
Shareholders’ equity: | ||||||||||||||||||||||||||||||||
Preferred equity | +559 | % | 1,582 | 240 | 240 | – | – | |||||||||||||||||||||||||
Common equity | -3 | % | 4,920 | 5,053 | 4,747 | 4,237 | 2,790 | |||||||||||||||||||||||||
PERFORMANCE RATIOS | ||||||||||||||||||||||||||||||||
Performance Ratios | ||||||||||||||||||||||||||||||||
Return on average assets | 1.32% | 1.43% | 1.31% | 1.20% | 0.97% | (0.50 | )% | 1.01 | % | 1.32 | % | 1.43 | % | 1.31 | % | |||||||||||||||||
Return on average common equity | 12.89% | 15.86% | 15.27% | 13.69% | 10.95% | (5.69 | )% | 9.57 | % | 12.89 | % | 15.86 | % | 15.27 | % | |||||||||||||||||
Efficiency ratio | 56.85% | 55.67% | 57.22% | 55.65% | 63.40% | 67.47 | % | 60.53 | % | 56.85 | % | 55.67 | % | 57.22 | % | |||||||||||||||||
Net interest margin | 4.63% | 4.58% | 4.27% | 4.41% | 4.52% | 4.18 | % | 4.43 | % | 4.63 | % | 4.58 | % | 4.27 | % | |||||||||||||||||
CAPITAL RATIOS (1) | ||||||||||||||||||||||||||||||||
Capital Ratios1 | ||||||||||||||||||||||||||||||||
Equity to assets | 10.62% | 9.90% | 8.87% | 8.89% | 8.94% | 11.80 | % | 10.00 | % | 10.62 | % | 9.90 | % | 8.87 | % | |||||||||||||||||
Tier 1 leverage | 7.86% | 8.16% | 8.31% | 8.06% | 7.56% | 9.99 | % | 7.37 | % | 7.86 | % | 8.16 | % | 8.31 | % | |||||||||||||||||
Tier 1 risk-based capital | 7.98% | 7.52% | 9.35% | 9.42% | 9.26% | 10.22 | % | 7.57 | % | 7.98 | % | 7.52 | % | 9.35 | % | |||||||||||||||||
Total risk-based capital | 12.29% | 12.23% | 14.05% | 13.52% | 12.94% | 14.32 | % | 11.68 | % | 12.29 | % | 12.23 | % | 14.05 | % | |||||||||||||||||
Tangible common equity | 5.89 | % | 5.70 | % | 5.98 | % | 5.28 | % | 6.80 | % | ||||||||||||||||||||||
Tangible equity | 8.86 | % | 6.17 | % | 6.51 | % | 5.28 | % | 6.80 | % | ||||||||||||||||||||||
SELECTED INFORMATION | ||||||||||||||||||||||||||||||||
Selected Information | ||||||||||||||||||||||||||||||||
Average common and common-equivalent shares (in thousands) | 108,028 | 92,994 | 90,882 | 90,734 | 92,079 | 109,145 | 108,523 | 108,028 | 92,994 | 90,882 | ||||||||||||||||||||||
Common dividend payout ratio | 27.10% | 27.14% | 28.23% | 27.20% | 28.58% | na | 37.82 | % | 27.10 | % | 27.14 | % | 28.23 | % | ||||||||||||||||||
Full-time equivalent employees | 10,618 | 10,102 | 8,026 | 7,896 | 8,073 | 11,011 | 10,933 | 10,618 | 10,102 | 8,026 | ||||||||||||||||||||||
Commercial banking offices | 470 | 473 | 386 | 412 | 415 | 513 | 508 | 470 | 473 | 386 | ||||||||||||||||||||||
ATMs | 578 | 600 | 475 | 553 | 588 | 625 | 627 | 578 | 600 | 475 | ||||||||||||||||||||||
1 | At year-end. |
2 | The actual high price was $107.21. However, this trading price was an anomaly resulting from electronic orders at the opening of the market on September 19, 2008 in response to the SEC’s announcement (prior to the market opening that day) of its temporary emergency action suspending short selling in financial companies. The closing price on September 19, 2008 was $52.83. |
3 | Amount represents the outstanding balance of loans sold and being serviced by the Company, excluding conforming first mortgage residential real estate loans. |
4 | Amounts for 2005 include Amegy Corporation at December 31, 2005 and for the month of December 2005. |
| ITEM 7. | MANAGEMENT’S DISCUSSION AND ANALYSIS OF FINANCIAL CONDITION AND RESULTS OF OPERATIONS |
MANAGEMENT’S DISCUSSION AND ANALYSIS
EXECUTIVE SUMMARY
Company Overview
Zions Bancorporation (“the Parent”) and subsidiaries (collectively “the Company,” “Zions,” “we,” “our,” “us”) together comprise a $47$55 billion financial holding company headquartered in Salt Lake City, Utah. TheAs of September 30, 2008, the Company iswas the twenty-second19th largest domestic bank holding company in terms of deposits, operatingdeposits. At December 31, 2008, the Company operated banking businesses through 470 offices513 domestic branches and 578625 ATMs in ten Western and Southwestern states: Arizona, California, Colorado, Idaho, Nevada, New Mexico, Oregon, Texas, Utah, and Washington. Our banking businesses include: Zions First National Bank (“Zions Bank”), in Utah and Idaho; California Bank & Trust (“CB&T”); Amegy Corporation (“Amegy”) and its subsidiary, Amegy Bank, in Texas; National Bank of Arizona (“NBA”); Nevada State Bank (“NSB”); Vectra Bank Colorado (“Vectra”), in Colorado and New Mexico; The Commerce Bank of Washington (“TCBW”); and The Commerce Bank of Oregon (“TCBO”).
The Company also operates a number of specialty financial services and financial technology businesses that conduct business on a regional or national scale. The Company is a national leader in Small Business Administration (“SBA”) lending, public finance advisory services, and software sales and cash management services related to “Check 21 Act” electronic imaging and clearing of checks. In addition, Zions is included in the Standard and Poor’s 500 (“S&P 500500”) and NASDAQ Financial 100 indices.
In operating its banking businesses, the Company seeks to combine the front office or customer facing advantages that it believes can result from decentralized organization and branding, with those that can come from centralized risk management, capital management and operations. In its specialty financial services and technology businesses, the Company seeks to develop a competitive advantage in a particular product, customer, or technology niche.
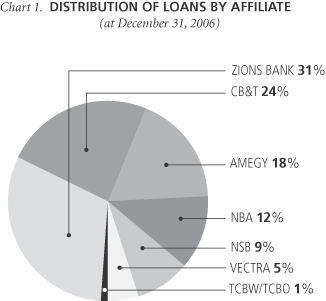
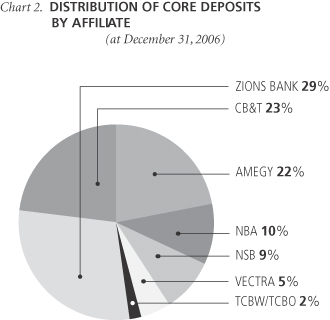
Banking BusinessesDistribution of Loans and Deposits
As shown in Charts 1 and 2 the Company’s loans and core deposits are widely diversified among the banking franchises the Company operates.
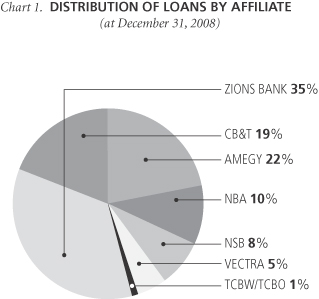
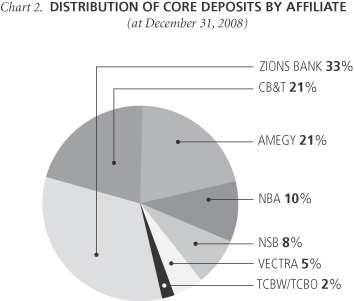
Note: Core deposits are defined as total deposits excluding
brokered deposits and time deposits $100,000 and over.
Business Strategies
We believe that the Company distinguishes itself by having a strategy for growth in its banking businesses that is unique for a bank holding company of its size. This growth strategy is driven by threefour key factors: (1) focus on high growth markets; (2) keep decisions aboutthat affect customers local; and (3) centralize technology and operations to achieve economies of scale.
Focus on High Growth Markets
Each of the states in which the Company conducts its banking businesses has experienced relatively high levels of historical economic growth and each ranks among the top one-third of the fastest growing states as ranked by population and household income growth projected by the U.S. Census Bureau. In addition,Despite slowdowns in population, employment, and key indicators of economic growth in some of these markets in 2008, which is expected to persist through much of 2009, the Company believes that over the medium to longer term all of these markets will continue to be among the fastest growing in the recent past these states have experienced relatively high levels of population growth compared to the rest of the country.
Schedule 1
DEMOGRAPHIC PROFILE
BY STATE
SCHEDULE 1
DEMOGRAPHIC PROFILE
BY STATE
(Dollar amounts in thousands)
| Number of branches | Deposits in market at 12/31/2006 (1) | Percent of Zions’ deposit base | Estimated 2006 total population (2) | Estimated population % change 2000-2006 (2) | Projected population % change 2006-2011 (2) | Estimated median household income 2006 (2) | Estimated % change | Projected % change | Number of branches 12/31/2008 | Deposits at 12/31/20081 | Percent of Zions’ deposit base | Estimated 2008 total population2 | Estimated population % change 2000-20082 | Projected population % change 2008-20132 | Estimated median household income 20082 | Estimated household income % change 2000-20082 | Projected household income % change 2008-20132 | |||||||||||||||||||||||||||
Utah | 112 | $ | 9,531,472 | 27.25% | 2,551,534 | 14.26% | 12.43% | $ | 56.4 | 23.38% | 18.39% | 116 | $ | 13,825,330 | 33.46 | % | 2,677,229 | 19.23 | % | 12.57 | % | $ | 60.3 | 30.76 | % | 16.05 | % | ||||||||||||||||||
California | 91 | 8,351,369 | 23.87 | 37,236,136 | 9.93 | 8.00 | 57.8 | 21.32 | 16.95 | 90 | 7,933,186 | 19.20 | 37,873,407 | 11.44 | 6.84 | 61.8 | 28.71 | 16.17 | |||||||||||||||||||||||||||
Texas | 77 | 7,329,258 | 20.95 | 23,786,899 | 14.08 | 10.96 | 49.3 | 23.35 | 17.56 | 83 | 8,625,056 | 20.88 | 24,627,546 | 17.51 | 11.32 | 52.4 | 30.15 | 18.32 | |||||||||||||||||||||||||||
Arizona | 53 | 3,675,458 | 10.51 | 6,135,872 | 19.59 | 16.09 | 51.3 | 26.44 | 21.27 | 79 | 3,896,531 | 9.43 | 6,630,722 | 28.24 | 17.47 | 55.3 | 34.92 | 20.13 | |||||||||||||||||||||||||||
Nevada | 72 | 3,378,945 | 9.66 | 2,575,444 | 28.88 | 22.95 | 55.1 | 23.42 | 18.06 | 77 | 3,512,195 | 8.50 | 2,730,425 | 35.35 | 20.00 | 58.1 | 29.19 | 16.17 | |||||||||||||||||||||||||||
Colorado | 38 | 1,665,988 | 4.76 | 4,821,136 | 12.09 | 9.08 | 58.5 | 23.82 | 18.03 | 40 | 2,071,894 | 5.01 | 4,962,478 | 14.87 | 9.04 | 62.5 | 31.06 | 16.75 | |||||||||||||||||||||||||||
Idaho | 24 | 519,211 | 1.48 | 1,475,700 | 14.05 | 11.75 | 46.6 | 23.59 | 17.88 | 25 | 781,523 | 1.89 | 1,549,062 | 19.06 | 12.67 | 50.4 | 32.55 | 20.34 | |||||||||||||||||||||||||||
Washington | 1 | 504,918 | 1.44 | 6,396,653 | 8.53 | 6.36 | 56.5 | 23.38 | 18.35 | 1 | 602,731 | 1.46 | 6,628,203 | 12.06 | 7.98 | 60.8 | 31.75 | 15.96 | |||||||||||||||||||||||||||
New Mexico | 1 | 16,385 | 0.05 | 1,956,417 | 7.55 | 6.07 | 41.5 | 21.56 | 16.62 | 1 | 32,647 | 0.08 | 2,029,633 | 11.21 | 7.66 | 44.7 | 29.69 | 18.71 | |||||||||||||||||||||||||||
Oregon | 1 | 8,742 | 0.03 | 3,694,335 | 7.98 | 6.28 | 50.1 | 22.23 | 17.56 | 1 | 35,403 | 0.09 | 3,814,725 | 11.13 | 7.61 | 53.5 | 29.54 | 17.71 | |||||||||||||||||||||||||||
Zions’ weighted average | 15.12 | 12.33 | 54.7 | 23.28 | 18.21 | 16.56 | 10.33 | 61.8 | 32.14 | 18.41 | |||||||||||||||||||||||||||||||||||
Aggregate national | 303,582,361 | 7.87 | 6.66 | 51.5 | 22.25 | 17.77 | 309,299,265 | 9.59 | 6.30 | 54.7 | 28.82 | 16.97 | |||||||||||||||||||||||||||||||||
1 | Excludes intercompany deposits. |
2 | Data Source: SNL Financial Database |
The Company seeks to grow both organically and through acquisitions in these banking markets. In 2005 we acquired Amegy Bank in Texas, which continued to enjoy very strong organic growth through 2006. In September 2006, we announced the pending acquisition of The Stockmen’s Bancorp, Inc. (“Stockmen’s”), a bank holding company with $1.2 billion in assets headquartered in Kingman, Arizona. On January 17, 2007, this acquisition was completed and Stockmen’s banking subsidiary, The Stockmen’s Bank, was merged into our NBA affiliate bank.
Within each of the states thatwhere the Company operates, we focus on the market segments that we believe present the best opportunities for us. We believe that these states over time have experienced higher rates of growth, business formation, and expansion than other states. We also believe that over the long term these states will continue to experience higher rates of commercial real estate development as local businesses strive to provide housing, shopping, business facilities and other amenities for their growing populations. As a result, aHowever, in the near term growth in many of our geographies and market segments has slowed markedly due to weakening economic conditions and loan demand. We have recently experienced net portfolio shrinkage in distressed residential real estate markets in the Southwest.
A common focus of all of Zions’ subsidiary banks is small and middle market business banking (including the personal banking needs of the executives and employees of those businesses) and commercial real estate development. In many cases, the Company’s relationship with its customers is primarily driven by the goal to satisfy their needs for credit to finance their expanding business opportunities. In addition to our commercial business, we also provide a broad base of consumer financial products in selected markets, including home mortgages, home equity credit lines, auto loans, and credit cards. This mix of business often leads to loan balances growing faster than internally generated deposits.deposits; this was particularly true in much of 2008 as loan growth significantly outpaced low cost core deposit growth. In addition, it has important implications for the Company’s management of certain risks, including interest rate and liquidity risks, which are discussed further in later sections of this document.
Keep Decisions AboutThat Affect Customers Local
The Company operates eight different community/regional banks, each under a different name, and each with its own charter, and each with its own chief executive officer and management team. This structure helps to ensure that decisions related to customers are made at a local level. In addition, each bank controls, among other things, allmost decisions related to its branding, market strategies, customer relationships, product pricing, and credit decisions (within the limits of established corporate policy). In this way we are able to differentiate our banks from much larger, “mass market” banking competitors that operate regional or national franchises under a common brand and often
around “vertical” product silos. We believe that this approach allows us to attract and retain exceptional management, and that it also results in providing service of the highest quality to our targeted customers. In addition, we believe that over time this strategy generates superior growth in our banking businesses.
Centralize Technology and Operations to Achieve Economies of Scale
We seek to differentiate the Company from smaller banks in two ways. First, we use the combined scale of all of the banking operations to create a broad product offering without the fragmentation of systems and operations that would typically drive up costs. Second, for certain products for which economies of scale are believed to be important, the Company “manufactures” the product centrally or outsources it from a third party. Examples include cash management, credit card administration, mortgage servicing, and deposit operations. In this way the Company seeks to create and maintain efficiencies while generating superior growth.
Specialty Financial ServicesCentralize and Technology BusinessesStandardize Policies and Management Controlling Key Risks
In additionWe seek to its communitystandardize policies and regional banking businesses, the Company operates a number of specialized businesses that in many cases are national in scope. These include a number of businesses in which the Company believes it ranks in the top ten institutions nationally such as SBA 7(a) loan originations, SBA 504 lending, public finance advisory and underwriting services, software and cash management servicespractices related to the electronic imagingmanagement of checks pursuantkey risks in order to assure a consistent risk profile in an otherwise decentralized management model. Among these key risks and functions are credit, interest rate, liquidity, and market risks. Although credit decisions are made locally within each affiliate bank, these decisions are made within the framework of a corporate credit policy that is standard among all of our affiliate banks. Each bank may amend the policy in a more conservative direction; however, it may not amend the policy in a more liberal direction. In that case, it must request a specific waiver from the Company’s Chief Credit Officer; in practice only a limited number of waivers have been granted. Similarly, the Credit Examination function is a corporate activity, reporting to the Check 21 Act, and the origination of farm mortgages sold to Farmer Mac.
High growth market opportunities are not always geographically defined. The Company continues to invest in several expanded or new initiatives that we believe present unusual opportunities for us, including the following:
National Real Estate Lending
This business consists of making SBA 504 and similar low loan-to-value, primarily owner-occupied, first mortgage small business commercial loans. During both 2006 and 2005, the Company originated directly and purchased from correspondents approximately $1.2 billion of these loans. During 2005 we securitized $707 million of these loans; no securitization was completed during 2006. A qualifying special-purpose entity (“QSPE”), Lockhart Funding, LLC (“Lockhart”), purchases the resultant securities after credit enhancement and funds them through the issuance of commercial paper.
NetDeposit and Related Services
NetDeposit, Inc. (“NetDeposit”) is a subsidiaryCredit Review Committee of the Parent that was createdBoard of Directors, and administratively reporting to develop and sell software and processes that facilitate electronic check clearing. With the implementationDirector of the Check 21 Act late in 2004, this company and its products are well positioned to take advantage of the revolution in check processing now underway in America. During 2006, NetDeposit reduced earnings by $0.07 per diluted share, compared to $0.08 per share in 2005. Revenues for 2006 increased almost 90% from 2005 and we have continued to increase our investment in this business.
The Company generates revenues in several ways from this business. First, NetDeposit licenses software, sells consulting services, and resells scanners to other banks and processors. Newly announced customers since January 1, 2006 include BOK Financial Corporation, Deutsche Bank, First National Bank of Arizona, and National City Bank. These activities initially generate revenue from scanner sales, consulting, and licensing fees. Deployment-related fees related to work station site licenses and check processing follow, but have been slower to increase than expected as deployment throughout the industry has been slower than expected.
Second, NetDeposit has licensed its softwareEnterprise Risk Management, who reports to the Company’s banks, which useCEO. This assures a reasonable consistency of loan quality grading and loan loss reserving practices among all affiliate banks.
Interest rate risk management, liquidity and market risk, and portfolio investments also are managed centrally by a Board-designated Asset Liability Management Committee pursuant to corporate policies regarding interest rate risk, liquidity, investments and derivatives.
Internal Audit also is a centralized, corporate function reporting to the capabilitiesAudit Committee of the softwareBoard of Directors, and administratively reporting to provide state-of-the art cash management servicesthe Director of Enterprise Risk Management, who reports to business customers and to correspondent banks. At year-end, over 4,500 Zions affiliate bank cash management customers were using NetDeposit, and we processed over $8.5 billionthe Company’s CEO.
Finally, the Board established an Enterprise Risk Management Committee in late 2005, which is supported by the Director of imaged checks from our cash management customers in the month of December.
Third, Zions Bank uses NetDeposit software to provide check-clearing services to correspondent banks. Zions Bank has contracts and co-marketing agreements with a number of bank processors and resellers, both domestically and abroad.
NetDepositEnterprise Risk Management. This Committee seeks to protect its intellectual property in business methods related to the electronic processingmonitor and clearing of checks. It has applied for several patents and was recently notified by the United States Patent and Trademark Office that it has been granted two patents.
Treasury Management
With the acquisition of Amegy Bank, Zions’ cash, or treasury, management capabilities were significantly enhanced. Zions believes that it has a significant opportunity to increase its treasury management penetration of commercial customers in its geographic territory, and increased its investment inmitigate as appropriate these capabilities in 2006. An increased level of investment in treasury management, both in technology and service and in sales, is expected to continue in 2007.
In addition to enhancing its general treasury management capabilities, Zions has made significant investments specifically in creating enhanced capabilities in services related to claims processing and reconciliation for medical providers. Included among these investments was the acquisition of the remaining minority interests in P5, Inc. (“P5”); Zions had for several years owned a majority interest in this start-up provider of web-based claims reconciliation services. At year-end 2006, P5 provided these services to over 800 medical practitioners, mostly pharmacy outlets. The Company is in the process of integrating P5’s services and other payment processing services into its more traditional treasury management productskey operating and services forstrategic risks throughout the medical provider industry.
Wealth ManagementMANAGEMENT’S OVERVIEW OF 2008 PERFORMANCE
We have extensive relationships with small and middle-market businesses and business owners that we believe present an unusual opportunity to offer wealth management services. AsThe “sub-prime mortgage” crisis became a result, the Company established a wealth management business, Contango Capital Advisors, Inc. (“Contango”), and launched the businessfinancial crisis in the latter half of 2004. The business offers financial2007 and tax planning, trustthe economy entered into an increasingly severe economic recession during 2008. In 2008, both financing and inheritance services, over-the-counter, exchange-tradedcapital became increasingly expensive and synthetic derivative and hedging strategies, quantitative asset allocation and risk management and a global array of investment strategies from equities and bonds through alternative and private equity investments. At year-end Contango had over $885 million of client assets under management and a strong pipeline of referrals from our affiliate banks as compared to over $170 million at December 31, 2005. At December 31, 2006,difficult for the Company had total discretionary assetsto obtain as the year went on. Finally, in mid-September, which saw in rapid succession the effective nationalization of Fannie Mae and Freddie Mac, the failure of Lehman Brothers, and the Federal “rescue” of insurance giant, American International Group Inc (“AIG”), essentially all capital and financial markets world-wide became extremely disrupted.
As this crisis unfolded and became more severe, the Federal Reserve Board (“FRB”) and later the U.S. Treasury took a series of increasingly strong and less conventional actions to try to mitigate the crisis. Starting in mid-2007 the FRB aggressively lowered short term interest rates; after a brief pause in mid-2008, this aggressive reduction resumed and left the target Fed Funds rate at an all-time low of 0-0.25% at year-end 2008. In 2008 the FRB introduced a number of programs to directly provide greater liquidity to a financial system under managementsevere stress, including trying to formally remove any stigma from Discount Window borrowings, followed by a series of $2.1 billion,
programs to inject liquidity directly into the banking system, such as the Term Auction Facility (“TAF”), and later into financial markets more broadly. As capital levels in the banking system became increasingly strained, active and possibly abusive short-selling of financial stocks, including assets managed by Contango, Amegy, and Western National Trust Company, a wholly owned subsidiary of Zions Bank. During 2006, Contango generated net losses of $0.07 per diluted share, unchanged from 2005. We expect that net losses will decline in 2007 and that the business will approach break-even late in 2007 or in 2008.
Employee Stock Option Appreciation Rights
In December 2004, the Financial Accounting Standards Board (“FASB”) issued Statement of Financial Accounting Standards (“SFAS”) No. 123R,Share-Based Payment, which is a revision of SFAS No. 123,Accounting for Stock-Based Compensation. We have developed a market-based method for the valuation of employee stock options for SFAS 123R purposes. This method uses an online auction to price a tracking instrument that measures the fair value of the option grant. On January 25, 2007, we received notice from the OfficeCompany, rose to unprecedented levels. This activity made it increasingly difficult for financial companies to raise additional capital without causing existing shareholders to incur high levels of the Chief Accountant ofownership dilution, and led the Securities and Exchange Commission (“SEC”) that they concur with our view that our tracking instrument, with modifications describedto enact a series of temporary bans on short-selling of financial stocks and certain abusive short-selling practices in the notification, is sufficiently designedfall of 2008. The Treasury’s Troubled Asset Relief Program (“TARP”) Capital Purchase Program (“CPP”) to be usedinvest in preferred stock of financial institutions was launched in September, followed by the FRB’s Commercial Paper Funding Facility (“CPFF”) program and the Federal Deposit Insurance Corporation’s (“FDIC”) Temporary Liquidity Guarantee Program (“TLGP”) in November. The CPP provided for SFAS 123R. Zionsthe direct investment of $350 billion of preferred equity into the banking system, while the TLGP provided a way for banks with maturing unsecured senior debt to refinance that debt with a guarantee provided by the FDIC. These programs and actions had the objective of preserving a functioning banking and financial system that could continue to finance economic activity during a time of severe financial and economic stress.
On October 3, 2008, the FDIC increased deposit insurance to $250,000 through December 31, 2009. In addition, the FDIC implemented a program to provide full deposit insurance coverage for noninterest-bearing transaction deposit accounts through December 31, 2009, unless insured banks elect to opt out of the program. The Company did not useopt out of this method to value its 2006 grant; however we intend to use the method to value our 2007 option grant. We also intend to market this method as a service to other SEC registrants.
MANAGEMENT’S OVERVIEW OF 2006 PERFORMANCE
program.
The crisis clearly adversely impacted the Company’s primary or “core” business consistsperformance and management focused a great deal of providing community and regional banking services to both individuals and businesses in ten Western and Southwestern states. We believe that this core banking business performed well during 2006. The Company experienced strong organic loan growth of over 15%, continued to experience excellent credit quality, and maintained a high and stable net interest margin in a difficult rate environment.
On December 3, 2005 we completed our acquisition of Amegy Bancorporation, Inc. The merger was accounted for under the purchase method of accounting and, accordingly, results of operations for 2005 include the results of Amegy only for the month of December. All comparisons to 2005 and prior periods reflectattention on managing the impact of the acquisition. In May 2006 the conversion of Amegy’s major systems to the Zions technology and operations platform was completed.
In September 2006 the Company announced the acquisition of The Stockmen’s Bancorp, Inc. headquartered in Kingman, Arizona. This acquisition was completed on January 17, 2007; consequently 2006 results were not impacted by the acquisition of Stockmen’s, but the acquisition will increase loans, deposits, revenue and expenses in 2007. As previously announced, the Company expects this acquisition to be about $0.03 dilutive to earnings per share in 2007, excluding merger related costs.
crisis.
The Company reported record earningsa net loss of $266.3 million for 20062008 as compared to net income of $579.3$493.7 million for 2007. Net loss applicable to common shareholders for 2008 was $290.7 million or $5.36$2.66 per diluted common share. This compares with $480.1net earnings applicable to common shareholders of $479.4 million or $5.16$4.42 per diluted share for 20052007 and $406.0$579.3 million or $4.47$5.36 per share for 2004.2006. Return on average common equity was 12.89%(5.69)% and return on average assets was (0.50)% in 2008, compared with 9.57% and 1.01% in 2007 and 12.89% and 1.32% in 2006, compared with 15.86% and 1.43% in 2005 and 15.27% and 1.31% in 2004.
2006.
The key drivers of the Company’s performance during 20062008 were as follows:
Schedule 2
SCHEDULE 2
KEY DRIVERS OF PERFORMANCE
20062008 COMPARED TO 20052007
Driver | 2006 | 2005 | Change | 2008 | 2007 | Change better/(worse) | |||||||||||
| (in billions) | (In billions) | ||||||||||||||||
Average net loans and leases | $ | 32.4 | 24.0 | 35% | $ | 41.0 | 36.8 | 11 | % | ||||||||
Average total noninterest-bearing deposits | 9.5 | 7.4 | 28% | 9.1 | 9.4 | (3 | )% | ||||||||||
Average total deposits | 32.8 | 24.9 | 32% | 37.6 | 35.8 | 5 | % | ||||||||||
| (in millions) | (In millions) | ||||||||||||||||
Net interest income | $ | 1,764.7 | 1,361.4 | 30% | $ | 1,971.6 | 1,882.0 | 5 | % | ||||||||
Provision for loan losses | 72.6 | 43.0 | 69% | (648.3 | ) | (152.2 | ) | (326 | )% | ||||||||
Impairment and valuation losses on securities | (317.1 | ) | (158.2 | ) | (100 | )% | |||||||||||
Goodwill Impairment | (353.8 | ) | – | nm | |||||||||||||
Net interest margin | 4.63% | 4.58% | 5bp | 4.18 | % | 4.43 | % | (25 | )bp | ||||||||
Nonperforming assets as a percentage of net loans and leases and other real estate owned | 0.24% | 0.30% | (6)bp | ||||||||||||||
Ratio of nonperforming assets to net loans and leases | 2.71 | % | 0.73 | % | (198 | )bp | |||||||||||
Efficiency ratio | 56.85% | 55.67% | 118bp | 67.47 | % | 60.53 | % | (694 | )bp | ||||||||
As illustrated by the previous schedule, thenm – not meaningful
bp – basis points
The Company’s earnings growthperformance in 20062008 compared to 20052007 reflected the following:
The acquisitionStrong loan growth, in the first half of Amegy, which closed in December 2005, and resulted in significant increases inthe year, followed by restrained loan growth throughout most balance sheet and income statement line items, and improvement in Amegys’ pre-acquisition efficiency ratio;of the second half of the year;
Strong organic loan growth;
Lagging organic deposit growth, particularly the lack of noninterest-bearing deposit growth until late in the year, resulting in a greater dependence on market rate funds;
A stableNet interest margin deterioration until the fourth quarter of the year, mainly due to financing loan growth with a more expensive mix of funding, the addition of lower net interest margin in a difficult interest rate environment,spread Lockhart Funding, LLC (“Lockhart”) commercial paper to the balance sheet, and pricing pressure on both loans and funding costs;deposits in a difficult liquidity environment experienced by most of the domestic financial system;
An increased provision for loan losses stemming mainly attributablefrom credit-quality deterioration in our Southwestern residential land acquisition, development and construction lending portfolios, but also some heightened provisions related to strong loan growth, butemerging credit quality stresses in other markets;
Significant impairment charges on the Company’s investment securities deemed “other-than-temporarily impaired” and valuation losses associated with securities purchased from Lockhart, a continued high level of credit quality;qualifying special-purpose entity (“QSPE”) securities conduit, pursuant to the Liquidity Agreement between Lockhart and Zions Bank. See “Off-Balance Sheet Arrangement” on page 96 for further details on Lockhart;
A higher ratio of expenses to revenue (“efficiency ratio”), which increased as a resultGoodwill impairment charges. In the fourth quarter the Company determined 100% of the Amegy acquisition, but declined throughgoodwill at its NBA, NSB, and Vectra banking subsidiaries and nearly all of the year as integration efficiencies were attained.goodwill at NetDeposit, LLC (“NetDeposit”) from merged company P5, Inc., (a small medical payments technology and services company) to be impaired.
We believe that the performance the Company experienced in 2006 was a direct resultcontinue to focus on managing four primary drivers of our focusing on five primary objectives:business performance: 1) organic loan and deposit growth, 2) maintaining credit quality, at high levels, 3) managing interest rate risk, 4) completing the conversion of Amegy onto Zions’ systems, and 5)4) controlling expenses.
However, in 2008 results also were significantly and adversely impacted by the effects of the global financial crisis on the Company’s securities portfolio, liquidity and capital levels.
Organic Loan and Deposit Growth
Since 2002,2004, the Company has experienced steady and strong loan growth and moderate deposit growth, augmented in 2005 and 2006 by the Amegy acquisition. Weacquisition, in 2007 by the Stockmen’s acquisition, and in 2008 by the Silver State acquisition (deposits only). From 2004 through 2006, we consider this performance to be primarily a direct result of steadily improvingstrong economic conditions throughout most of our geographical footprint, and of effectively executing our operating strategies. The continued strong organic loan growth in the latter half of 2007 may also have begun to reflect the increasing lack of nonbank sources of credit as global credit market conditions deteriorated sharply. Chart 34 depicts this growth.
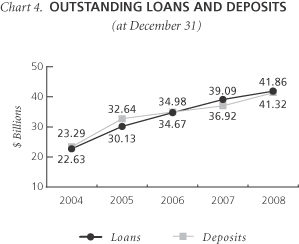
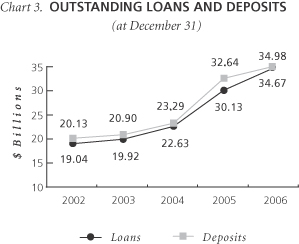
The Company experienced stronglittle or no net organic loan growth in 2008 in its three Southwestern banks (CB&T, NBA, and NSB), which were most heavily impacted by deteriorating conditions in the residential real estate markets. In these banks repayments and charge-offs of residential acquisition and development loans largely offset some growth in other types of lending.
Despite credit quality deterioration and net loan portfolio shrinkage in these three banks, the Company experienced actual period-end to period-end loan growth of 7.1% in 2008. However, $1.2 billion of the total loan growth of $2.8 billion reflected the required purchase from Lockhart of small business loans made and securitized in prior years. These loans were purchased due to Lockhart’s inability to sell commercial paper and a ratings downgrade that resulted not from deterioration in the loans, but rather from a downgrade of bond insurance company MBIA, which provided the credit enhancement of the AAA-rated securitization tranches. Excluding these purchases, all of its markets early in 2006, however, declining ratesthis organic loan growth totaled $1.6 billion, or 4.1%. All of residential housing development and constructionthis growth occurred in the West resultedfirst half of 2008. In the third quarter the Company actively held down net loan growth to mitigate the funding and capital strains mentioned earlier. In the fourth quarter, after funding strains and capital positions improved, the Company relaxed these self-imposed growth constraints. However, fourth quarter growth in significantly slower rates ofmany loan categories was offset by repayments and charge-offs in the Southwest residential acquisition and development portfolio. In 2008 net loan growth in itsour CB&T, NBA, and NSB subsidiaries in the latter halfwas negative due to these repayments and charge-offs of the year. In fact, total loans outstanding in CB&T and NSB actually declined in the fourth quarter compared to the third quarter of 2006. The Company expects that the slower rate of residential development and construction lending will continue to result in much slower or no net loan growth in CB&T, NBA, and NSB in at least the first half of 2007. However, commercial lending strengthened during 2006 particularly in Zions Bank and Amegy, but also in our Vectra and TCBW bank subsidiaries, and remained very strong in the latter half of the year. The result was net loan growth of $4.5 billion, or 15.1%, from year-end 2006 compared to year-end 2005, and a mix shift away from commercial real estate and towards commercial lending sectors in new loan originations.
secured loans.
Reflecting trends throughout the banking industry, the Company’s deposit growth in 2006 slowed significantly. Coreaverage core deposits grew only $552 million$1.8 billion or 5.7% from year-end 2005, a rate2007, including the effect of 1.8% – significantly laggingthe Silver State acquisition, which lagged the growth rate of loans. In addition, average noninterest-bearing
demand deposits only increaseddecreased by $56 million$0.3 billion from year-end 2005.2007. Thus, the Company increased its reliance on more costly sources of funding during the year.
In 2008 the Company reviewed opportunities to augment organic growth by the potential acquisition of several distressed and failed banks, but concluded only one—the purchase in September from the FDIC of the insured deposits and a minimal amount of loans of the failed Silver State Bank in Nevada. In February, 2009, the Company was the successful bidder in the FDIC disposition of the loans and deposits of the failed Alliance Bank in Southern California. This bid was made after the Company had conducted due diligence on the Alliance credit portfolio, and involved a credit loss sharing agreement with the FDIC. The Company believes that current economic stresses affecting a number of banking companies may result in more opportunities in 2009 to acquire distressed or failed banks, where risk can be mitigated, but this cannot be assured.
Maintaining Credit Quality at High Levels
The ratio of nonperforming assets to net loans and other real estate owned improved(“OREO”) increased to 0.24%2.71% at year-end, compared to 0.30%0.73% at the end of 2005.2007. Net loan charge-offs for 20062008 were $46$393.7 million, or 0.96% of average loans, compared to $25$63.6 million or 0.17% of average loans for 2005.2007. Charts 7 and 8 highlight net charge-offs by loan purpose and bank affiliate. The provision for loan losses during 20062008 increased significantly increased relative to 2005, driven in significant part by strong$648.3 million compared to $152.2 million for 2007. While the Company’s ratio of nonperforming assets to net loans and OREO is now higher than peer averages (see Chart 5), its net charge-off rate remains well below peer averages (see Chart 6). We believe that both of these trends reflect the collateral secured nature of many of the Company’s problem loans, which lead to higher nonaccrual levels and lower net losses than, for example, portfolios of peers with large unsecured credit card or other consumer loan growth andconcentrations.
All of these trends largely reflect the Amegy acquisition. The Company believes that it is unlikely thatimpact of deteriorating credit quality conditions in residential land acquisition and development and construction lending in the Southwest. In addition in the latter part of 2008, the Company began to see evidence of spillover (as evidenced by, for example, rising delinquency rates) of this deterioration into other geographies and components of its portfolio, including some segments of its residential first mortgage portfolio, commercial and industrial lending, and nonresidential commercial real estate construction lending. Due to the continuing and worsening recessionary economic conditions that unfolded late in 2008 and into 2009, we believe that stresses on our credit portfolio likely will improve further from these year-end levels; however, it also sees little signcontinue at least in the first half of significant deterioration in credit quality.2009 and possibly throughout the year and into 2010.
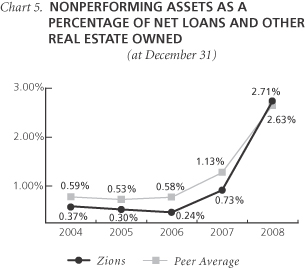
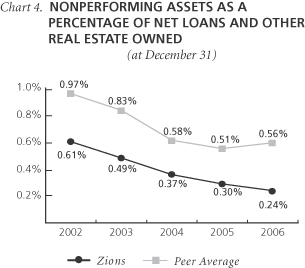
Note: Peer group is defined as bank holding companies
with assets > $10 billion.billion excluding banks providing
primarily trust services.
Peer data source: SNL Financial Database
Peer information for 2006 is from 3rd quarter 2006.
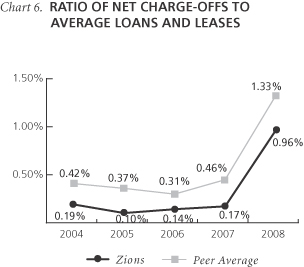
Managing Note: Peer group is defined as bank holding companies
with assets > $10 billion excluding banks providing
primarily trust services.
Peer data source: SNL Financial Database
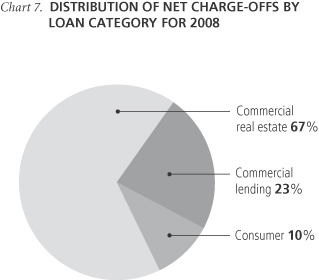
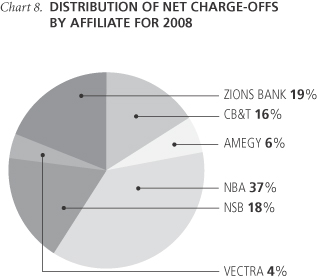
Interest Rate Risk
Our focus in managing interest rate risk is to not to take positions based upon management’s forecasts of interest rates, but rather to maintain a position of slight “asset-sensitivity.” This means that our assets, primarily loans, tend to reprice slightly more quickly than our liabilities.liabilities, primarily deposits. The Company makes extensive use of interest rate swaps to hedge interest rate risk in order to seek to achieve this desired position. This practice has enabled us to achieve a relatively stable net interest margin during periods of volatile interest rates, which is depicted in Chart 5.9. However, due to changes in newly originated and renewed loan spreads, changes in the relationship between the prime rate and London Inter-Bank Offer Rate (“LIBOR”), changes in the pattern of prime rate behavior in several of our banks, and other factors, our hedging strategy was more difficult to conduct in 2008. In particular we incurred nonhedge derivative losses in noninterest income, and a number of our interest
rate swaps became ineffective under the Financial Accounting Standards Board (“FASB”) Statement of Financial Accounting Standards (“SFAS”) No. 133,Accounting for Derivative Instruments and Hedging Activities, and were terminated. Nonetheless, on the whole our interest rate risk management believes its actions continued to result in one of the highest and most stable net interest margins in the industry. We believe that our risk position at December 31, 2008 was more “asset sensitive” than has typically been the case, reflecting in part a lessening of hedging activity due to the historically low interest rate environment.
Taxable-equivalent net interest income in 20062008 increased 29.4%4.6% over 2005. Excluding Amegy from 2006 and December 2005, taxable-equivalent net interest income increased 9.1%.2007. The net interest margin increaseddeclined to 4.63%a still high 4.18% for 2006, up2008, down from 4.58%4.43% for 2005.2007. The Company was able to achieve this performance despite the challengesrising levels of a flat-to-inverted yield curve,nonaccrual loans and other nonperforming assets, adverse changes in its funding mix, and significant pressures on both loan pricing and funding costs thatcosts. These factors resulted in a fairly steady compression, until the fourth quarter, of the net interest spread (the differencemargin.
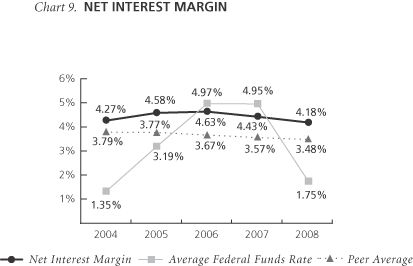
Note: Peer group is defined as bank holding companies
with assets > $10 billion excluding banks providing
primarily trust services.
Peer data source: SNL Financial Database
Throughout 2008 the relationships among a number of interest rates that are key drivers of the Company’s business deviated significantly, and for long periods, from normal. Of particular significance were the relationships between deposit rates, the average yieldprime rate, and LIBOR. Due to liquidity strains throughout the banking industry, rates on all interest-earning assets andbank deposits remained higher than would have been expected despite the averageunprecedented FRB actions to reduce rates. In some cases deposit rates in the Company’s markets appear to have remained high in part due to the particular stresses being felt by several large institutions that later failed or were sold. These pressures, combined with the lack of lower cost core deposit growth, kept the Company’s cost of allfunding its loans and other assets higher than might have been expected. These same stresses were felt world-wide, and until very late in 2008 LIBOR rates stayed unusually high in relation to risk-free rates, and in relation to lending rates, which generally followed the Fed Funds rates down as the FRB aggressively pushed that rate lower.
Strong loan growth in the first half of 2008 thus was funded primarily with interest-bearing deposits and nondeposit funding. Noninterest-bearing deposits, as noted, actually declined during the year, which pressured the net interest margin. Mitigating these funding sources).cost pressures were somewhat improved loan pricing spreads relative to LIBOR and prime rates during the year.
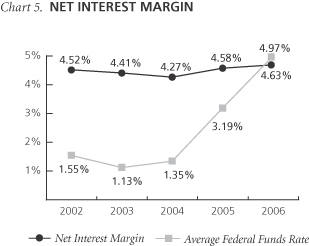
See the section “Interest Rate Risk” on page 87111 for more information regarding the Company’s asset-liability management (“ALM”) philosophy and practice and our interest rate risk management.
Controlling Expenses
During 20062008, the Company’s efficiency (expense-to-revenue) ratio increased to 56.9% compared to 55.7%67.5% from 60.5% for 2005.2007. The efficiency ratio is the relationship between noninterest expense and total taxable-equivalent revenue. The efficiency ratio deteriorated following the close of the Amegy acquisition, both due to Amegy’s higher pre-merger efficiency ratio relative to Zions and due to acquisition and integration related costs. However, after peakingincrease in the first quarter, the efficiency ratio improvedto 67.5% for 2008 was primarily due to the effect on revenue of the impairment and valuation losses on securities as cost synergiespreviously discussed. Because of the significant securities impairment and valuation losses, the Company believes that its efficiency ratio is not a particularly useful measure of how well operating expenses were realized.contained in 2007 and 2008; nor does it believe that this measure is particularly useful for its peers, many of which also experienced large losses and impairment charges as a result of market turmoil and deteriorating credit conditions. The Company’s efficiency ratio was 58.9% and 56.7% if the impairment and valuation losses on securities are excluded for 2008 and 2007, respectively. Noninterest expense increased 5.0% in 2008 compared to 2007. Over half of this increase resulted from further charge-downs of OREO and OREO expense; excluding the effects of changes in OREO expense, noninterest expense grew 1.7% in 2008 compared to 2007.

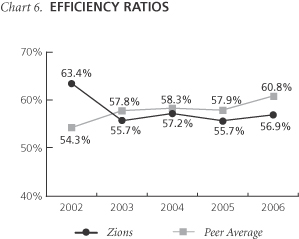
Note: Peer group is defined as bank holding companies
with assets > $10 billion.billion excluding banks providing
primarily trust services.
Peer data source: SNL Financial Database
Peer information for 2006Effects of Global Financial Crisis on the Company
It is from 3rd quarter 2006.now well recognized that during the period of roughly 2004-2006 a speculative bubble developed in residential housing in some of the Company’s key markets (including Arizona, Southern Nevada, and parts of California), and elsewhere in the United States. The volume of mortgage debt outstanding grew at unprecedented rates, fueled by record low interest rates and increasingly lax lending standards as reflected by so-called subprime, Alt-A, and other alternative mortgages. Median housing prices and housing starts both increased to record levels during this period. Home equity lending standards also deteriorated as lenders were lulled by low default rates and rising home prices.
The Company itself never originated subprime mortgages, had almost no direct exposure to these loans, and never offered residential option adjustable rate mortgage (“ARM”) or “negative amortization” loans. However, the Company has a significant business in financing residential land acquisition, development and construction
activity. The FRB began raising interest rates in 2005-2007 as it became increasingly apparent that the prevailing levels of housing activity were unsustainable. New housing starts hit a record of over 2 million units in each of 2005 and 2006. By December 2007, they had fallen to a revised annualized rate of approximately 1.1 million nationally, and by December 2008 had fallen further to about 550,000. This precipitous decline in housing activity has placed significant stress on a number of the Company’s homebuilder customers, and therefore on the Company’s loan portfolio in this sector. This portfolio peaked in mid-2006 as a percentage of the total loan portfolio and declined as a percentage of the total loan portfolio thereafter. Additionally, the portfolio began to shrink in dollar terms in the latter half of 2007 in the Southwestern markets, and continued to shrink throughout 2008 as a result of pay-downs, loan sales, charge-offs and foreclosures. Nonaccrual loans and provisions for loan losses began to increase significantly in late summer 2007, and continued to increase in 2008, as it became clearer that this housing slump would likely be longer and deeper than originally believed. It also became clear that in the latter months of 2008 the economic recession began to deepen and also became global, and likely would persist and possibly continue to deepen well into 2009. The Company therefore believes that nonaccrual loans, the provision for loan losses, and net charge-offs will likely remain elevated throughout this period.
A number of previously successful and respected financial institutions failed, were “rescued,” or acquired with governmental assistance in 2008, including in the United States: Bear Stearns in March, IndyMac Bank in July, Fannie Mae, Freddie Mac, Merrill Lynch and Lehman Brothers in September, and Wachovia and Washington Mutual in October. As this crisis unfolded, capital and funding markets became increasingly strained and eventually essentially ceased to function worldwide in mid-September. Market values of financial institutions globally, including that of the Company, plummeted, and issuance of new funding and capital became increasingly expensive or impossible.
Traditional markets for underwritten offerings of holding company unsecured senior debt effectively became closed to regional banking companies like Zions in the last few months of 2007 and remained closed through 2008. During this time, Zions had several hundred million dollars of senior debt funding that matured and needed to be replaced with new funding unless cash reserves were to be depleted. Zions successfully refunded or newly issued a total of $560 million of medium term senior notes from the second half of 2007 through August 2008 using its broker-dealer subsidiary, Zions Direct. During this time, it was one of a very few, if any, regional banking companies to successfully issue this type of debt financing. Similarly, the market for underwritten perpetual preferred stock offerings essentially closed to all regional banking companies after May 2008, but Zions again used Zions Direct to issue approximately $47 million of noncumulative perpetual preferred stock in July. Finally, in early September Zions became the last U.S. regional banking company to issue any significant amount of common equity in 2008 when it issued $250 million of common stock.
Beginning in January 2008, several of the Company’s affiliate banks began to bid for funds in the FRB’s TAF program and at a peak in December 2008, the Company had a total of $2.1 billion of such funds. By year-end this amount had declined to $1.8 billion and further declined to $0.5 billion by mid-February 2009. Lockhart also elected to participate in the FRB’s CPFF program, and at year-end had sold $80 million of its commercial paper to the FRB. In October the Company submitted an application for $1.4 billion of preferred capital under the Treasury’s CPP program, near the maximum $1.48 billion for which it was eligible. This application was approved and funded in November. In early December the Company and each of its affiliate banks elected to participate in the FDIC’s TLGP, and in January 2009 the Company issued the maximum amount of such debt for which it was eligible, $254.9 million. Taken together, these and other actions taken by the Company significantly improved both its holding company and bank liquidity and capital positions, and at year-end left the Company in a much stronger position to manage through the continuing economic downturn. However, as many normal capital and funding markets remained highly disrupted at the end of 2008, further stresses in 2009 may be anticipated.
These capital market stresses also had a significant impact on the Company’s investment securities portfolio. A total of $317 million of other-than-temporary-impairment (“OTTI”) and valuation charges were taken against earnings during 2008, compared to $158 million in 2007. In addition, reductions in fair value of
this portfolio that were recorded in Other Comprehensive Income (“OCI”) totaled $246 million in 2008, compared to $111 million in 2007. Collateralized debt obligation (“CDO”) securities became increasingly difficult to value in 2008 as normal markets for them ceased to exist, and under the provisions of SFAS 157, the Company switched to Level 3 model valuations for the great majority of them by year-end 2008 (see page 37 for further discussion of the Company’s valuation of these securities). Since the weakening economy continues to place stress on the underlying bank, insurance, and real estate exposures in many of these securities, the Company believes it is possible that further impairment charges and/or OCI impact may occur in 2009.
Capital and Return on Capital
As regulated financial institutions, the Parent and its subsidiary banks are required to maintain adequate levels of capital as measured by several regulatory capital ratios. One of our goals is to maintain capital levels that are at least “well capitalized” under regulatory standards. The Company and each of its banking subsidiaries metexceeded the “well capitalized” guidelines at December 31, 2006.2008. In addition, the Parent and certain of its banking subsidiaries have issued various debt securities that have been rated by the principal rating agencies. As a result, another goal is to maintain capital at levels consistent with an “investment grade” rating for these debt securities. The Company has maintained its “investment grade” debt ratings as have those of its bank subsidiaries that have ratings.
At year-end 20062008, the Company’s tangible common equity ratio increased to 5.98%5.89% compared to 5.28%5.70% at the end of 2005. In December 20062007. As noted previously, amid very difficult capital market conditions in the latter half of 2008, the Company issued $240strengthened its capital position by issuing $47 million of non-cumulativenoncumulative perpetual preferred stock; this additional capital raisedstock and $250 million of common equity. In November 2008 the Company’s tangible equity ratio to 6.51% at year-end. The Company announcedparticipated in the fourth quarterCPP (also known as TARP capital), and issued $1.4 billion of cumulative perpetual preferred stock with a common stock warrant attached to the U.S. Treasury. Further, in October 2008 the Company reduced the quarterly dividend on its common stock from $0.43 to $0.32 per share, and in January 2009 again reduced this dividend to $0.04 per share, in order to conserve capital in a highly uncertain environment.
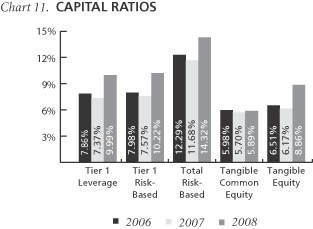
This series of actions resulted in capital ratios at Zions at year-end that it would targetwere higher than in over a decade for all ratios except the tangible common equity ratio of 6.25 - 6.50%, replacingratio. At December 31, 2008, the previously announcedCompany’s tangible common equity ratio target at the same level. In conjunction with these actions, the Company’s Board of Directors authorized a $400 million common stock buyback program,was 5.89% and the Company repurchased $25.0 million of its common stock in December 2006.tangible equity ratio was 8.86%.
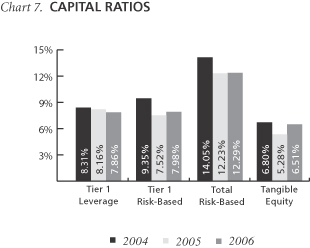
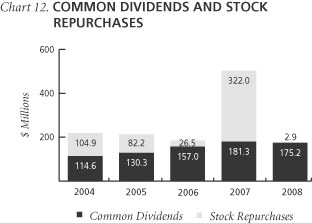
The Company continuesexpects that it (and the banking industry as a whole) may be required by market forces and/or regulation to believe thatoperate with higher capital ratios than in excess of that required to support the risks of the business in which it engages should be returned to the shareholders.recent past. In addition, the CPP capital preferred dividend increases from 5% to dividends,9% in 2013, making it much more expensive as a source of capital if not redeemed at or prior to that time. Thus, in addition to maintaining higher levels of capital, the Company currently expectsCompany’s capital structure may be subject to usegreater variation over the remaining $375 million stock buyback authorization during 2007.
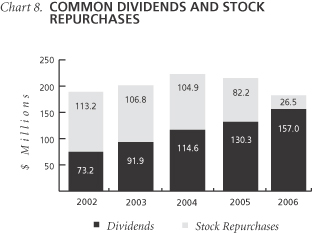
next few years than has been true historically.
In addition, we believe that the Company should engage or invest in business activities that provide attractive returns on equity. Chart 913 illustrates that as a result of earnings improvement, the exit of underperforming businesses and returning unneeded capital to the shareholders, the Company’s return on average common equity has improved in recent years.from 2004 to 2005. The decline in 2006 is due toresulted from the additional common equity held due to additional intangible assets (primarilythe acquisition of Amegy. The further decline in the return on average common equity in 2007 and again in 2008 resulted primarily from goodwill impairment, securities impairment charges, and core deposit intangibles) that resultedlarger provision for loan losses discussed previously, as well as from the premium paidadditional common equity issued to acquire Amegy.Stockmen’s.
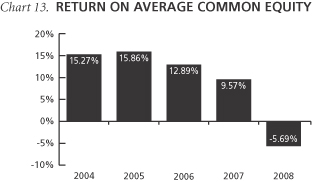

As depicted in Chart 10,14, tangible return on average tangible common equity further improved in 2006 as the Company continued to improve its core operating results.
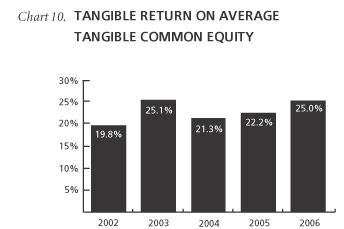

Note: Tangible return is net earnings applicable to common
shareholders plus after-tax amortization of core deposit and
other intangibles and impairment losses on goodwill.
Challenges to Operations
As detailed in Schedule 2 on page 21, several factors combined to improve the Company’s performance in 2006 from 2005. The Company continued to experience strong loan growth, but deposit growth lagged. The improving economic conditions that began in 2004 continued through 2005 and 2006, and spread to include essentially all of our markets during the past year. However, as noted, growth in residential real estate development and construction slowed considerably in the second half of 2006 in Arizona, Southern California, and Southern Nevada. Credit quality remained exceptional during the year as nonperforming assets and net charge-off percentages remained at historically low levels. The Company was able to slightly improve its net interest margin year over year during a period when other financial institutions were experiencing significant margin compression due to the challenging interest rate environment.
As we enter 2007,2009, we see severala number of significant challenges to improving performance.confronting the industry and our company.
We expectGlobal capital and funding markets remain under significant stress, and most observers believe that commercial real estate loans, which declined in CB&Tthe current U.S. and NSB in the fourth quarter,global economic recession may continue to decline in our Southwestern markets throughoutgrow more severe at least through the first half of 2007. However, commercial loan growth has been accelerating,2009. This continued economic weakness may lead to:
Further declines in value and potential OTTI charges on CDO securities we own that are largely collateralized by junior debt and trust preferred debt issued by banks and insurance companies.
Continued weakness in the residential housing construction markets, particularly in Zions Bank, AmegyArizona, Nevada and Vectra, which has kept aggregate loan growth robust.
Over the last two years, the Company has experienced historicallyCalifornia, but also in Utah and Idaho, resulting in continued high levels of credit quality. While we do not see any indications that loan quality will deteriorate significantly, it is unlikely we will be able to maintain credit quality at these levels for an indefinite period of time. The 2006 annual provision for loan losses was $73 million, an increase from 2005 of $30 million, and we expect thatnet charge-offs, loan loss provisions may continueand nonperforming assets, as well as higher levels of OREO expense due to continued declines in 2007 at levels similarreal estate collateral values.
A spread of weaker credit conditions to 2006 if loan growth remains strong.
During 2006 we saw increased pressure onother geographies served by the pricingCompany and to other types of both loans and deposits as the economy continued to expand and competition for good business increased.loans. In particular, deposit rates repriced upward at an increasing rate in the latter half of 20052008, we began to see increasing delinquency rates in some parts of the loan portfolio, including some parts of the residential first mortgage portfolio, nonresidential commercial real estate construction, and first halfcommercial and industrial loans. These indications of 2006,weakness had not yet resulted in significantly higher levels of net charge-offs by year-end 2008, but continued weakness may lead to higher levels of provisions and losses in 2009.
Capital and funding markets remain highly disrupted as we enter 2009. Some funding markets improved somewhat late in 2008, but these improvements may be largely due to the Federal Reserve continuedunprecedented efforts of the FRB and FDIC to raise short-term interest rates,inject liquidity into the financial system. It is highly uncertain how those markets will develop in 2009 and how they will react if and when this governmental support begins to be withdrawn. While the competition for deposits intensified.
We expect these pressures to continue in 2007, although perhaps not as severely if the Federal Reserve does not raise interest rates further. ForThese challenges and others are more information on our asset-liability management processes, see “Interest Rate and Market Risk Management”fully discussed under “Risk Factors” on page 86.11.
We anticipate that economic conditions will continue to be strong in our geographic footprint during 2007, with weakness in residential real estate as previously discussed. However, any number of unforeseen events could result in a weaker economy that in turn could negatively impact loan growth and credit quality.
Excluding the impact of the Stockmen’s acquisition, we expect to see moderate growth in both revenues and expenses during 2007, and believe that controlling operating expenses will continue to be an important factor in improving our overall performance. We will continue to see increased expense levels during 2007 for systems conversions at Stockmen’s and CB&T, but we expect these conversions to result in ongoing expense savings when completed. We are also investing in creating systems, data and processes that may enable us to qualify for the proposed Basel II capital requirements.
Compliance with regulatory requirements pose an ongoing challenge. A failure in our internal controls could have a significant negative impact not only on our earnings but also on the perception that customers, regulators and investors may have of the Company. We continue to devote a significant amount of effort, time and resources to improving our controls and ensuring compliance with these complex regulations.
We have a number of business initiatives that, while we believe they will ultimately produce profits for our shareholders, currently generate expenses in excess of revenues. Three significant initiatives are Contango, a wealth management business started in 2004, NetDeposit, our subsidiary that provides electronic check processing systems, and the increased investments in treasury management and medical claims capabilities discussed in the Executive Summary. We will need to manage these businesses carefully to ensure that expenses and revenues develop in a planned way and that profits are not impaired to an extent that is not warranted by the opportunities these businesses provide.
Finally, competition from credit unions continues to pose a significant challenge. The aggressive expansion of some credit unions, far beyond the traditional concept of a common bond, presents a competitive threat to Zions and many other banking companies. While this is an issue in all of our markets, it is especially acute in Utah where two of the five largest financial institutions (measured by local deposits) are credit unions that are exempt from all state and federal income tax.
CRITICAL ACCOUNTING POLICIES AND SIGNIFICANT ESTIMATES
The Notes to Consolidated Financial Statements contain a summary of the Company’s significant accounting policies. We believe that an understanding of certain of these policies, along with the related estimates that we are required to make in recording the financial transactions of the Company, is important in order to have a complete picture of the Company’s financial condition. In
addition, in arriving at these estimates, we are required to make complex and subjective judgments, many of which include a high degree of uncertainty. The following is a discussion of these critical accounting policies and significant estimates related to these policies. We have discussed each of these accounting policies and the related estimates with the Audit Committee of the Board of Directors.
We have included sensitivity schedules and other examples to demonstrate the impact of the changes in estimates made for various financial transactions. The sensitivities in these schedules and examples are hypothetical and should be viewed with caution. Changes in estimates are based on variations in assumptions and are not subject to simple extrapolation, as the relationship of the change in the assumption to the change in the amount of the estimate may not be linear. In addition, the effect of a variation in one assumption is in reality likely to cause changes in other assumptions, which could potentially magnify or counteract the sensitivities.
Fair Value Accounting
Securitization Transactions
The Company from time to time enters into securitization transactions that involve transfers of loans or other receivables to off-balance-sheet QSPEs. In most instances, we provide the servicing on these loans as a condition of the sale. In addition, as part of these transactions,Effective January 1, 2008, the Company may retainadopted SFAS No. 157,Fair Value Measurementsand SFAS No. 159,The Fair Value Option for Financial Assets and Financial Liabilities. SFAS 157 defines fair value, establishes a cash reserve account, an interest-only strip, or in some casesconsistent framework for measuring fair value, and enhances disclosures about fair value measurements. Adoption of SFAS 157 for the measurement of all nonfinancial assets and nonfinancial liabilities was delayed one year until January 1, 2009. The adoption of SFAS 157 did not have a subordinated tranche, all of which are considered to be retained interests in the securitized assets.
Whenever we initiate a securitization, the first determination that we must make in connection with the transaction is whether the transfer of the assets constitutes a sale under U.S. generally accepted accounting principles. If it does, the assets are removed from the Company’s consolidated balance sheet with a gain or loss recognized. Otherwise, the transfer is considered a financing, resulting in no gain or loss being recognized and the recording of a liabilitymaterial effect on the Company’s consolidated financial statements, but significantly expanded the disclosure requirements for fair value measurements.
SFAS 157 defines fair value as the exchange price that would be received for an asset or paid to transfer a liability (an exit price) in the principal or most advantageous market for the asset or liability in an orderly transaction between market participants on the measurement date. To measure fair value, SFAS 157 has established a hierarchy which requires an entity to maximize the use of observable inputs and minimize the use of unobservable inputs. This hierarchy uses three levels of inputs to measure the fair value of assets and liabilities as follows:
Level 1 – Quoted prices in active markets for identical assets or liabilities; includes certain U.S. Treasury and other U.S. Government and agency securities actively traded in over-the-counter markets; certain securities sold, not yet purchased; and certain derivatives.
Level 2 – Observable inputs other than Level 1 including quoted prices for similar assets or liabilities, quoted prices in less active markets, or other observable inputs that can be corroborated by observable market data; also includes derivative contracts whose value is determined using a pricing model with observable market inputs or can be derived principally from or corroborated by observable market data. This category generally includes certain U.S. Government and agency securities; certain CDO securities; corporate debt securities; certain private equity investments; certain securities sold, not yet purchased; and certain derivatives. See “Accounting for Derivatives” on page 44 for further details on fair value accounting for derivatives.
Level 3 – Unobservable inputs supported by little or no market activity for financial instruments whose value is determined using pricing models, discounted cash flow methodologies, or similar techniques, as well as instruments for which the determination of fair value requires significant management judgment or estimation. Additionally, observable inputs such as nonbinding single dealer quotes that are not corroborated by observable market data are included in this category. This category generally includes certain private equity investments and certain CDO securities.
The Company uses models when quotations are not available for certain securities or in markets where trading activity has slowed or ceased. When quotations are not available, and are not provided by third party pricing services, management judgment is necessary to determine fair value. In situations involving management judgment, fair value is determined using discounted cash flow analysis or other valuation models, which incorporate available market information, including appropriate benchmarking to similar instruments, analysis of default and recovery rates, estimation of prepayment characteristics and implied volatilities.
At December 31, 2008, approximately 6.0% of total assets, or $3.3 billion, consisted of financial instruments recorded at fair value on a recurring basis. Of this amount, $2.4 billion of these financial instruments used valuation methodologies involving market-based or market-derived information, collectively Level 1 and 2 measurements, to measure fair value. Approximately $895 million of these financial assets are measured using model-based techniques or nonbinding single dealer quotes, both of which constitute Level 3 measurements. At December 31, 2008, approximately 0.45% of total liabilities, or $221 million, consisted of financial instruments recorded at fair value on a recurring basis. At December 31, 2008, approximately 0.50% of total assets, or $276 million of financial assets were valued on a nonrecurring basis at Level 2.
Fair Value Option
SFAS 159 allows for the option to report certain financial assets and liabilities at fair value initially and at subsequent measurement dates with changes in fair value included in earnings. The option may be applied instrument by instrument, but is on an irrevocable basis. On January 1, 2008, the Company applied the fair value option to one available-for-sale real estate investment trust (“REIT”) trust preferred CDO security and three retained interests on selected small business loan securitizations. The REIT CDO and retained interests were valued using Level 3 models. The cumulative effect of adopting SFAS 159 reduced the beginning balance sheet. of retained earnings at January 1, 2008 by approximately $11.5 million, comprised of a decrease of $11.7 million for the REIT CDO and an increase of $0.2 million for the three retained interests. During 2008, the net change in fair value decreased pretax earnings by approximately $9.2 million, consisting of $7.1 million for the REIT CDO security and $2.1 million for the retained interests. These adjustments to fair value are included in fair value and nonhedge derivative income (loss) in the statement of income.
The financing treatmentCompany elected the fair value option for the REIT CDO security as part of a directional hedging program in an effort to hedge the credit exposure the Company has to homebuilders in its REIT CDO portfolio. Management selected this security because it had the most exposure to the homebuilder market compared to the other REIT CDO securities in the Company’s portfolio, both in dollar amount and as a percentage, and was therefore considered the most suitable for hedging. The fair value option adoption for the REIT CDO allows the Company to avoid the complex hedge accounting provisions under SFAS 133 associated with the implemented hedging program.
On June 23, 2008, Zions Bank purchased $787 million of securities from Lockhart, which comprised the entire remaining small business loan securitizations created by Zions Bank and held by Lockhart. As a result, the three small business securitization retained interests elected under the fair value option were included in this transaction and were part of the premium amount recorded with the loan balances at Zions Bank. See “Off-Balance Sheet Arrangement” on page 96 for further discussion of these securities purchased.
Estimates of Fair Value
The Company measures or monitors many of its assets and liabilities on a fair value basis. Fair value is used on a recurring basis for certain assets and liabilities in which fair value is the primary basis of accounting. Examples of these include derivative instruments, available-for-sale and trading securities, and private equity investments. Additionally, fair value is used on a nonrecurring basis to evaluate assets or liabilities for impairment or for disclosure purposes in accordance with SFAS No. 107,Disclosures about Fair Value of Financial Instruments. Examples of these nonrecurring uses of fair value include loans held for sale accounted
for at the lower of cost or fair value, impaired loans, long-lived assets, goodwill, and core deposit and other intangible assets. Depending on the nature of the asset or liability, the Company uses various valuation techniques and assumptions when estimating the instrument’s fair value. These valuation techniques and assumptions are in accordance with SFAS 157.
Fair value is the price that could have unfavorablebe received to sell an asset or paid to transfer a liability in an orderly transaction between market participants. If observable market prices are not available, then fair value is estimated using modeling techniques such as discounted cash flow analyses. These modeling techniques utilize assumptions that market participants would use in pricing the asset or the liability, including assumptions about the risk inherent in a particular valuation technique, the effect of a restriction on the sale or use of an asset, and the risk of nonperformance. To increase consistency and comparability in fair value measures, SFAS 157 established a three-level hierarchy to prioritize the inputs used in valuation techniques between observable inputs that reflect quoted prices in active markets, inputs other than quoted prices with observable market data, and unobservable data such as the Company’s own data or single dealer nonbinding pricing quotes.
Fair values for investment securities, trading assets, and most derivative financial implications includinginstruments are based on independent, third party market prices, or if identical market prices are not available they are based on the market prices of similar instruments if available. If market prices of similar instruments are not available, instruments are valued based on the best available data, some of which may not be readily observable in the market. The fair values of loans held for sale are typically based on quotes from market participants. The fair values of OREO and other repossessed assets are typically determined based on appraisals by third parties, less estimated selling costs.
Estimates of fair value are also required when performing an adverse effectimpairment analysis of long-lived assets, goodwill, and core deposit and other intangible assets. The Company reviews goodwill for impairment at the reporting unit level on Zions’ resultsan annual basis, or more often if events or circumstances indicate the carrying value may not be recoverable. The goodwill impairment test compares the fair value of operations and capital ratios. However, allthe reporting unit with its carrying value. If the carrying amount of the Company’s securitizations have been structured to meetinvestment in the existing criteria for sale treatment.
Another determination thatreporting unit exceeds its fair value, an additional analysis must be made is whether the special-purpose entity involved in the securitization is independent from the Company or whether it should be included in its consolidated financial statements. If the entity’s activities meet certain criteria for it to be considered a QSPE, no consolidation is required. Since all of the Company’s securitizations have been with entities that have met the requirements to be treated as QSPEs, they have met the existing accounting criteria for nonconsolidation.
Finally, we must make assumptionsperformed to determine the amount, if any, by which goodwill is impaired. In determining the fair value of gainthe Company’s reporting units, management uses discounted cash flow models which require assumptions about growth rates of the reporting units and the cost of equity. To the extent that adequate data is available, other valuation techniques relying on market data may be incorporated into the estimate of a reporting unit’s fair value. The selection and weighting of the various fair value techniques may result in a higher or lower fair value. Judgment is applied in determining the amount that is most representative of fair value. For long-lived assets and intangible assets subject to amortization, an impairment loss resulting fromis recognized if the securitization transactioncarrying amount of the asset is not likely to be recoverable and exceeds its fair value. In determining the fair value, management uses models which require assumptions about growth rates, the life of the asset, and/or the fair value of the assets. The Company tests long-lived assets for impairment whenever events or changes in circumstances indicate that their carrying amounts may not be recoverable.
Valuation of Collateralized Debt Obligations
The Company values CDO available-for-sale and held-to-maturity securities using several methodologies based on the appropriate fair value hierarchy consistent with currently available market information. At December 31, 2008, the Company valued substantially all of the CDO portfolio using Level 3 pricing methods as follows:
Schedule 3
CDO FAIR VALUES
| Held-to-maturity | Available-for-sale | ||||||||
| (In millions) | Amortized cost | Estimated fair value | Amortized cost | Estimated fair value | |||||
Trust preferred securities – bank and insurance: | |||||||||
Internal model | $ | 1,180 | 671 | 779 | 638 | ||||
Third party models | 8 | 6 | |||||||
Dealer quotes | 16 | 12 | |||||||
Level 2 | 12 | 11 | |||||||
| 1,188 | 677 | 807 | 661 | ||||||
Trust preferred securities – real estate investment trusts: | |||||||||
Third party models | 36 | 21 | 27 | 24 | |||||
| 36 | 21 | 27 | 24 | ||||||
Other: | |||||||||
Third party models | 76 | 51 | 4 | 4 | |||||
Dealer quotes | 21 | 10 | |||||||
Monoline CDS spreads | 72 | 53 | |||||||
Level 2 | 5 | 5 | |||||||
| 76 | 51 | 102 | 72 | ||||||
Total | $ | 1,300 | 749 | 936 | 757 | ||||
Internal Model
Four developments during 2008 influenced the Company to use a level 3 cash flow modeling approach to value essentially all of its bank and insurance trust preferred securities at December 31, 2008.
Market activity in the sector became increasingly limited, illiquid, disordered and dominated by, if not limited to, distressed or forced sellers. It became increasingly difficult to substantiate actual trading levels and the “willingness” of sellers executing at those levels. The determination of inactivity/ illiquidity was based on discussion with dealers and CDO managers specializing in the sector as well as a review of bid lists, execution levels of forced trades, and any other information available on trades.
Bank failures and announced deferrals of interest payments on trust preferred securities contained within the subsequent carryingCDOs impacted differently each tranche of each CDO held. Each tranche is unique in the amount of performing, deferring and defaulting collateral, remaining collateral quality and cash flow waterfall mechanics.
Rating agency watch listing and downgrading of CDO tranches occurred in May, July, August, and November. Each of S&P, Moody’s and Fitch either revised or were in the process of reassessing their ratings model assumptions. This resulted in an increasing lack of consistency in rating levels for CDO tranches. The matrix pricing methodology used from September 2007 to June of 2008 was dependent on securities being substantially similar. In management’s judgment, an operational definition of
“substantially similar” securities capable of supporting the requirements of Level 2 pricing could no longer be created without the addition of significant adjustments based on unobservable inputs beginning in July of 2008 and continuing through year-end 2008. |
| • | Finally, a joint statement of the SEC Office of the Chief Accountant and the FASB staff on September 30, 2008 and FASB’s October 10, 2008 issuance of FASB Staff Position (“FSP”) FAS 157-3,Determining the Fair Value of a Financial Asset When the Market for That Asset is Not Active, provided additional guidance on determining fair value of financial assets when the market for such assets is not active. These statements clarified when and how an entity might, given an inactive market, appropriately determine that the use of an income approach valuation technique (present value technique) that maximizes the use of relevant observable inputs and minimizes the use of unobservable inputs may be equally or more representative of fair value than a market approach valuation. |
In the third quarter of 2008, the Company began using a licensed third party model to value bank and insurance trust preferred CDOs. The model uses market-based estimates of expected loss for the retained interests.individual pieces of underlying collateral to arrive at a pool-level expected loss rate for each CDO. These loss assumptions are applied to the CDO’s structure to generate cash flow projections for each tranche of the CDO. The fair value of each tranche is determined by discounting its resultant loss-adjusted cash flows with appropriate market based discount rates. At December 31, 2008, the discount rate determination referenced several market inputs including current collateralized loan obligation spreads obtained from a third party.
The method for deriving loss expectation for collateral underlying the CDOs depends on whether the collateral is from a public or private company. For public companies, a term structure of Probabilities of Default (“PDs”) is obtained from a commercially available service. The service estimates PDs using a proprietary reduced form model derived using logistic regression on a historical default database. Because the service’s model requires equity valuation related inputs (along with other macro and firm specific inputs) to produce default probabilities, the service does not produce results for private firms and some very small public firms that do not have readily available market data.
For private companies (and the few small public companies not evaluated by the service) PDs are estimated based on credit ratings. The credit ratings come from two external rating sources; one specific to banks, and the other to insurers. The Company has credit ratings for each piece of collateral whether private or public. Using the PD data on the public companies obtained from the commercial service, the Company calculates the average PD for each credit rating level by industry. The rating level average is then applied to all corresponding credits within each rating level that do not have a PD from the commercial service.
The PDs for the underlying collateral are then used to develop CDO deal-level expected loss curves. An external service which models the unique cash-flow waterfall and structure of each CDO deal is used to generate tranche-level cash flows using the Company’s derived CDO deal-level loss assumptions (along with other relevant assumptions). The resultant cash-flows are discounted using current market spreads approximated from related product markets; these spreads differ depending upon the rating agency ratings (usually the Fitch rating) of the CDO, with higher spreads being applied to lower rated CDOs.
The Company did find evidence of one forced trade during the third quarter of 2008 in a tranche of a CDO that is owned by the Company. The forced trade occurred at a price of 35% of face value. This particular deal had amortized down considerably from issuance and the tranche was currently the most senior in the CDO. At the time of the trade the underlying collateral consisted of only five bank obligations and a Freddie Mac zero-coupon principal-only security strip due 2031. Two of the five bank obligations were from Wells Fargo Corporation, which also has publicly available secondary market trading levels on a similar public trust preferred issuance. Even under the assumption that all three of the non-Wells Fargo obligations in the CDO immediately defaulted with no recovery, the projected tranche cash-flows, discounted at the yield of the public Wells Fargo trust preferred issue, resulted in a value of 68% of face value. Based on this analysis, the observed trade at 35% does
not reflect the level at which an informed market participant would value the security. As a comparison, the Company’s model produced a price of 58%. The Company feels that the difference between the model price of 58% and the above outlined scenario price of 68% reflects an appropriate liquidity discount given the lack of activity in CDO markets compared to publicly traded trust preferred markets; this particular security is valued at December 31, 2008 by the Company at 55%.
The following schedule sets forth the sensitivity of the current CDO fair values using an internal model to changes in the most significant assumptions utilized in the model:
Schedule 4
SENSITIVITY OF BANK AND INSURANCE CDO VALUATIONS TO ADVERSE CHANGES OF CURRENT MODEL KEY VALUATION ASSUMPTIONS
| Bank and insurance CDOs at Level 3 | |||||||||||
| (Amounts in millions) | Held-to- maturity | Available- for-sale | |||||||||
Fair value balance at December 31, 2008 | $ | 671 | $ | 638 | |||||||
Expected cumulative credit losses1 | |||||||||||
Weighted average: | |||||||||||
Current defaulted or deferring securities2 | 7.9 | % | 10.0 | % | |||||||
1-year | 12.1 | % | 14.5 | % | |||||||
5-year | 17.7 | % | 20.6 | % | |||||||
30-year | 25.3 | % | 28.6 | % | |||||||
Decrease in fair value due to adverse change | 20 | % | $ | (22.6 | ) | $ | (1.6 | ) | |||
| 50 | % | (61.2 | ) | (4.3 | ) | ||||||
Discount rate3 | |||||||||||
Weighted average spread | 761bp | 311bp | |||||||||
Decrease in fair value due to adverse change | +100 | bp | $ | (64.7 | ) | $ | (67.2 | ) | |||
| +200 | bp | (120.0 | ) | (123.5 | ) | ||||||
1 | The Company uses an expected credit loss model which specifies cumulative losses at the 1-year, 5-year, and 30-year points from the data of valuation. |
2 | Weighted average percentage of collateral that is defaulted due to bank failures or deferring payment as allowed under the terms of security. |
3 | The discount rate is a spread over the LIBOR swap yield curve at the date of valuation. |
The adverse changes in expected cumulative credit losses resulted in a larger decrease in fair value for held-to-maturity (“HTM”) than available-for-sale (“AFS”) securities because the AFS portfolio is composed primarily of more senior CDO tranches. In determininggeneral these senior tranches receive accelerated principal payments under scenarios of high credit losses provided that the gain or loss, we usecredit losses do not exceed the available subordination in the CDO deal. By contrast more junior tranches which are in our HTM portfolio absorb credit losses and defer principal and interest payments upon increasing credit losses.
Third Party Models
At December 31, 2008, the Company utilized third party valuation services for sixteen securities with an aggregate amortized cost of $151 million in the Asset-Backed Security (“ABS”) CDO and trust preferred asset classes. These securities continued to have insufficient observable market data available to directly determine prices. The Company reviewed the methodologies employed by third party models. This included a review of all relevant data inputs and the appropriateness of key model assumptions. These assumptions thatincluded, but were not limited to, probability of default, collateral recovery rates, discount rates, over-collateralization levels, and rating transition probability matrices from rating agencies. The model valuations obtained from third party services
were evaluated for reasonableness including quarter to quarter changes in assumptions and comparison to other available data which included third party and internal model results and valuations. A range of value estimates is not provided because third party vendors utilized point estimates.
Dealer Quotes
The $37 million of asset-backed securities at amortized cost are valued using nonbinding and unadjusted dealer quotes. Multiple quotes are not available and the values provided are based on a combination of proprietary dealer quotes. Broker disclosure levels vary and the facts surrounding each securitization. Using alternativesCompany seeks to these assumptions could affectminimize dependence on this Level 3 source. Of the amount$37 million of gain or loss recognized onsecurities, approximately $18 million are AAA rated.
Monoline CDS Spreads
A total of $72 million at amortized cost of insured securities purchased out of Lockhart were valued using the transaction and, in turn, the Company’s results of operations. In valuing the retained interests, since quoted market prices of these interests are generally not available, we must estimate their value based on the present valuerelevant monoline insurers’ credit derivative levels.
See Note 4 of the futureNotes to Consolidated Financial Statements and “Investment Securities Portfolio” on page 85 for further information.
Other-than-Temporary-Impairment – Debt Investment Securities
We review investment debt securities on an ongoing basis for the presence of OTTI with formal reviews performed quarterly. OTTI losses on individual investment securities are recognized as a realized loss through earnings when it is probable that the Company will not collect all of the contractual cash flows associated with the securitizations. These value estimations requireor the Company is unable to makehold the securities to recovery. OTTI losses include credit losses and a number of assumptions including:
the method to use in computing the prepayments of the securitized loans;
the annualized prepayment speed of the securitized loans;
the weighted average life of the loans in the securitization;
the expected annual net credit loss rate; and
the discount rate for the residual cash flows.
liquidity.
Quarterly, the Company reviews its valuation assumptions for retained beneficial interests underThe Company’s OTTI evaluation process conforms with the rules contained in Emerging Issues Task Force (“EITF”) Issue No. 99-20,Recognition of Interest Income and Impairment on Purchased and Retained Beneficial Interests in Securitized Financial Assets, (“FSP No. EITF 99-20”)99-20-1, Amendments to the Impairment Guidance of EITF Issue No. 99-20, and SFAS No. 115,Accounting for Certain Investments in Debt and Equity Securities. These rules require the Company to periodically update its assumptions usedtake into consideration current market conditions, fair value in relationship to computecost, extent and nature of change in fair value, issuer rating changes and trends, volatility of earnings, current analysts’ evaluations, all available information relevant to the collectability of debt securities, our ability and intent to hold investments until a recovery of fair value, which may be maturity, and other factors when evaluating for the existence of OTTI in our securities portfolio.
On January 12, 2009, the FASB issued FSP EITF 99-20-1, Amendments to the Impairment Guidance of EITF Issue No. 99-20. This FSP is effective for interim and annual reporting periods ending after December 15, 2008, and shall be applied prospectively. The FSP amends EITF 99-20 by eliminating the requirement that a holder’s best estimate of cash flows be based upon those that “a market participant” would use. Instead, the FSP requires that OTTI be recognized as a realized loss through earnings when it is “probable” there has been an adverse change in the holder’s estimated cash flows for its retained beneficial interests and comparefrom the net present value of these cash flows previously projected, which is consistent with the impairment model in SFAS 115.
The Company recognized pretax OTTI losses of $304.0 million during 2008 and $108.6 million during 2007 on investment debt securities. All of the impairment for 2008 related to securities valued using Level 3 inputs. Management estimates that approximately $135 million of the impairment for 2008 related to credit impairment.
The decision to deem these securities OTTI was based on a specific analysis of the structure of each security and an evaluation of the underlying collateral using information and industry knowledge available to the carrying value. The Company complies with EITF 99-20 by quarterly evaluatingCompany. Future reviews for OTTI will consider the particular facts and updating its assumptions includingcircumstances during the default assumption as compared to the historical credit losses and the credit loss expectation of the portfolio, and its prepayment speed assumption as compared to the historical prepayment speeds and prepayment rate expectation. Changesreporting period in certain 2006 assumptions from 2005 for securizations were made in accordance with this process.
Schedule 3 summarizes the key economic assumptions that we used for measuring the values of the retained interests at the date of sale for securitizations during 2006, 2005, and 2004.review.
SCHEDULE 3
KEY ECONOMIC ASSUMPTIONS USED TO VALUE
RETAINED INTERESTS
| Home equity loans | Small business loans | |||
2006: | ||||
Prepayment method | na(1) | na(2) | ||
Annualized prepayment speed | na(1) | na(2) | ||
Weighted average life (in months) | 11 | na(2) | ||
Expected annual net loss rate | 0.10% | na(2) | ||
Residual cash flows discounted at | 15.0% | na(2) | ||
2005: | ||||
Prepayment method | na(1) | CPR(3) | ||
Annualized prepayment speed | na(1) | 4 - 15 Ramp in 25 months(4) | ||
Weighted average life (in months) | 12 | 69 | ||
Expected annual net loss rate | 0.10% | 0.40% | ||
Residual cash flows discounted at | 15.0% | 15.0% | ||
2004: | ||||
Prepayment method | na(1) | CPR(3) | ||
Annualized prepayment speed | na(1) | 10, 15 Ramp-up(5) | ||
Weighted average life (in months) | 11 | 64 | ||
Expected annual net loss rate | 0.10% | 0.50% | ||
Residual cash flows discounted at | 15.0% | 15.0% | ||
Schedule 4 sets forth the sensitivity of the current fair value of the capitalized residual cash flows at December 31, 2006 to immediate 10%Allowance and 20% adverse changes to those key assumptions that reflect the current portfolio assumptions.
SCHEDULE 4
SENSITIVITY OF RESIDUAL CASH FLOWS TO ADVERSE CHANGES
OF CURRENT PORTFOLIO KEY VALUATION ASSUMPTIONS
| (In millions of dollars and annualized percentage rates) | Home equity | Small business loans | ||||||
Carrying amount/fair value of capitalized residual cash flows | $ | 4.5 | 78.6 | |||||
Weighted average life (in months) | 11 | 32 - 62 | ||||||
Prepayment speed assumption | na | (1) | 12.5% - 28.0%(2) | |||||
Decrease in fair value due to adverse change | 10% | $ | 0.1 | 3.0 | ||||
| 20% | $ | 0.1 | 5.7 | |||||
Expected credit losses | 0.10 | % | 0.20% - 0.50% | |||||
Decrease in fair value due to adverse change | 10% | $ | 0.1 | 1.3 | ||||
| 20% | $ | 0.1 | 2.5 | |||||
Residual cash flows discount rate | 12.0 | % | 13.0% - 13.8% | |||||
Decrease in fair value due to adverse change | 10% | $ | 0.1 | 2.4 | ||||
| 20% | $ | 0.1 | 4.7 | |||||
Reserve for Credit Losses
Allowance for Loan Lossesloan losses
The allowance for loan losses represents our estimate of the losses that are inherent in the loan and lease portfolios. The determination of the appropriate level of the allowance is based on periodic evaluations of the portfolios along with other relevant factors. These evaluations are inherently subjective and require us to make numerous assumptions, estimates and judgments.
In analyzing the adequacy of the allowance for loan losses, we utilize a comprehensive loan grading system to determine the risk potential in the portfolio and also consider the results of independent internal credit reviews. To determine the adequacy of the allowance, the Company’s loan and lease portfolio is broken into segments based on loan type. For commercial loans, we use historical loss experience factors by loan segment, adjusted for changes in trends and conditions, to help determine an indicated allowance for each segment.segment based on individual loan grades. These factors are based on aevaluated and updated using migration analysis techniquetechniques and other considerations based on the makeup of the specific portfolio segment. The other considerations used in our analysis include volumes and trends of delinquencies, levels of nonaccrual loans, repossessions and bankruptcies, trends in criticized and classified loans, and expected losses on loans secured by real estate. In addition, new credit products and policies, current economic conditions, concentrations of credit risk, and the experience and abilities of lending personnel are also taken into consideration.
In addition to the segment evaluations, nonaccrual loans graded substandard or doubtful with an outstanding balance of $500 thousand or more are individually evaluated in accordance with SFAS No. 114,Accounting by Creditors for Impairment of a Loan,to determine the level of impairment and establish a specific reserve. A specific allowance ismay also be established for loans adversely graded loans below $500 thousand when it is determined that the risk associated with the loan differs significantly from the risk factor amounts established for its loan segment.segment and risk grade.
ForThe allowance for consumer loans we use a forecasting model based on internally generated portfolio delinquencies that employsis determined using historically developed loss experience “roll rates” to calculate losses. “Roll rates” are the rates at which accountsloans migrate from one delinquency level to the next higher level. Using average roll rates for the most recent twelve-month period and comparing projected losses to actual loss experience, the model estimates the expected losses in dollars for the forecasted period. By refreshing itthe model with updated data, the model establishes projectedit is able to project losses for a new twelve-month period each month, segmenting the portfolio into nine product groupings with similar risk profiles.
This methodology is an accepted industry practice, and the Company believes it has a sufficient volume of information to produce reliable projections.
As a final step to the evaluation process, we perform an additional review of the adequacy of the allowance based on the loan portfolio in its entirety. This enables us to mitigate, but not eliminate, the imprecision inherent in mostloan- and segment-level estimates of expected credit losses. This review of the allowance includes our judgmental consideration of any adjustments necessary for subjective factors such as economic uncertainties and excessive concentration risks.
There are numerous components that enter into the evaluation of the allowance for loan losses. Some are quantitative while others require us to make qualitative judgments. Although we believe that our processes for determining an appropriate level for the allowance adequately address all of the components that could potentially result in credit losses, the processes and their elements include features that may be susceptible to significant change. Any unfavorable differences between the actual outcome of credit-related events and our estimates and projections could require an additional provision for credit losses, which would negatively impact the Company’s results of operations in future periods. As an example, if a total of $250 million$1.0 billion of nonclassified loans were to be immediately classified as special mention, substandard and doubtful in the same proportion as the existing portfolio of the criticized and classified loans, the amount of the allowance for loan losses at December 31, 20062008 would increase by approximately $16$64 million. In addition, since the allowance for loan losses is assigned to the Company’s business segments that have loan portfolios, any earnings impact resulting from actual results differing from our estimates would have the largest impact on those segments with the largest loan portfolios, namely Zions Bank, CB&T and Amegy. This sensitivity analysis is hypothetical and has been provided only to indicate the potential impact that changes in the level of the criticized and classified
loans may have on the allowance estimation process. We believe that given the procedures that we follow in determining the potential losses in the loan portfolio, the various components used in the current estimation processes are appropriate.
We are in the process of developing potential changes to enhance our methodology for determining the allowance for loan losses. The potential changes include incorporating a two-factor grading system to include probability of default and loss given default. We currently anticipate that these changes will be phased in during 2007 and 2008.
Reserve for unfunded lending commitments
The Company has historically maintained a reserve for unfunded commitments, recorded in other liabilities. During the fourth quarter of 2008 refinements to this process were implemented to include all unfunded commitments, including the unfunded portions of partially funded credits, which were previously reserved for as part of the allowance for loan losses.
Nonmarketable Equity SecuritiesAccounting for Derivative Instruments and Hedging Activities, and were terminated. Nonetheless, on the whole our interest rate risk management believes its actions continued to result in one of the highest and most stable net interest margins in the industry. We believe that our risk position at December 31, 2008 was more “asset sensitive” than has typically been the case, reflecting in part a lessening of hedging activity due to the historically low interest rate environment.
Taxable-equivalent net interest income in 2008 increased 4.6% over 2007. The net interest margin declined to a still high 4.18% for 2008, down from 4.43% for 2007. The Company was able to achieve this performance despite rising levels of nonaccrual loans and other nonperforming assets, adverse changes in its funding mix, and significant pressures on funding costs. These factors resulted in a fairly steady compression, until the fourth quarter, of the net interest margin.
Note: Peer group is defined as bank holding companies
with assets > $10 billion excluding banks providing
primarily trust services.
Peer data source: SNL Financial Database
Throughout 2008 the relationships among a number of interest rates that are key drivers of the Company’s business deviated significantly, and for long periods, from normal. Of particular significance were the relationships between deposit rates, the prime rate, and LIBOR. Due to liquidity strains throughout the banking industry, rates on bank deposits remained higher than would have been expected despite the unprecedented FRB actions to reduce rates. In some cases deposit rates in the Company’s markets appear to have remained high in part due to the particular stresses being felt by several large institutions that later failed or were sold. These pressures, combined with the lack of lower cost core deposit growth, kept the Company’s cost of funding its loans and other assets higher than might have been expected. These same stresses were felt world-wide, and until very late in 2008 LIBOR rates stayed unusually high in relation to risk-free rates, and in relation to lending rates, which generally followed the Fed Funds rates down as the FRB aggressively pushed that rate lower.
Strong loan growth in the first half of 2008 thus was funded primarily with interest-bearing deposits and nondeposit funding. Noninterest-bearing deposits, as noted, actually declined during the year, which pressured the net interest margin. Mitigating these funding cost pressures were somewhat improved loan pricing spreads relative to LIBOR and prime rates during the year.
See the section “Interest Rate Risk” on page 111 for more information regarding the Company’s asset-liability management (“ALM”) philosophy and practice and our interest rate risk management.
Controlling Expenses
During 2008, the Company’s efficiency (expense-to-revenue) ratio increased to 67.5% from 60.5% for 2007. The efficiency ratio is the relationship between noninterest expense and total taxable-equivalent revenue. The increase in the efficiency ratio to 67.5% for 2008 was primarily due to the effect on revenue of the impairment and valuation losses on securities as previously discussed. Because of the significant securities impairment and valuation losses, the Company believes that its efficiency ratio is not a particularly useful measure of how well operating expenses were contained in 2007 and 2008; nor does it believe that this measure is particularly useful for its peers, many of which also experienced large losses and impairment charges as a result of market turmoil and deteriorating credit conditions. The Company’s efficiency ratio was 58.9% and 56.7% if the impairment and valuation losses on securities are excluded for 2008 and 2007, respectively. Noninterest expense increased 5.0% in 2008 compared to 2007. Over half of this increase resulted from further charge-downs of OREO and OREO expense; excluding the effects of changes in OREO expense, noninterest expense grew 1.7% in 2008 compared to 2007.
Note: Peer group is defined as bank holding companies
with assets > $10 billion excluding banks providing
primarily trust services.
Peer data source: SNL Financial Database
Effects of Global Financial Crisis on the Company
It is now well recognized that during the period of roughly 2004-2006 a speculative bubble developed in residential housing in some of the Company’s key markets (including Arizona, Southern Nevada, and parts of California), and elsewhere in the United States. The volume of mortgage debt outstanding grew at unprecedented rates, fueled by record low interest rates and increasingly lax lending standards as reflected by so-called subprime, Alt-A, and other alternative mortgages. Median housing prices and housing starts both increased to record levels during this period. Home equity lending standards also deteriorated as lenders were lulled by low default rates and rising home prices.
The Company either directly,itself never originated subprime mortgages, had almost no direct exposure to these loans, and never offered residential option adjustable rate mortgage (“ARM”) or “negative amortization” loans. However, the Company has a significant business in financing residential land acquisition, development and construction
activity. The FRB began raising interest rates in 2005-2007 as it became increasingly apparent that the prevailing levels of housing activity were unsustainable. New housing starts hit a record of over 2 million units in each of 2005 and 2006. By December 2007, they had fallen to a revised annualized rate of approximately 1.1 million nationally, and by December 2008 had fallen further to about 550,000. This precipitous decline in housing activity has placed significant stress on a number of the Company’s homebuilder customers, and therefore on the Company’s loan portfolio in this sector. This portfolio peaked in mid-2006 as a percentage of the total loan portfolio and declined as a percentage of the total loan portfolio thereafter. Additionally, the portfolio began to shrink in dollar terms in the latter half of 2007 in the Southwestern markets, and continued to shrink throughout 2008 as a result of pay-downs, loan sales, charge-offs and foreclosures. Nonaccrual loans and provisions for loan losses began to increase significantly in late summer 2007, and continued to increase in 2008, as it became clearer that this housing slump would likely be longer and deeper than originally believed. It also became clear that in the latter months of 2008 the economic recession began to deepen and also became global, and likely would persist and possibly continue to deepen well into 2009. The Company therefore believes that nonaccrual loans, the provision for loan losses, and net charge-offs will likely remain elevated throughout this period.
A number of previously successful and respected financial institutions failed, were “rescued,” or acquired with governmental assistance in 2008, including in the United States: Bear Stearns in March, IndyMac Bank in July, Fannie Mae, Freddie Mac, Merrill Lynch and Lehman Brothers in September, and Wachovia and Washington Mutual in October. As this crisis unfolded, capital and funding markets became increasingly strained and eventually essentially ceased to function worldwide in mid-September. Market values of financial institutions globally, including that of the Company, plummeted, and issuance of new funding and capital became increasingly expensive or impossible.
Traditional markets for underwritten offerings of holding company unsecured senior debt effectively became closed to regional banking companies like Zions in the last few months of 2007 and remained closed through 2008. During this time, Zions had several hundred million dollars of senior debt funding that matured and needed to be replaced with new funding unless cash reserves were to be depleted. Zions successfully refunded or newly issued a total of $560 million of medium term senior notes from the second half of 2007 through August 2008 using its broker-dealer subsidiary, Zions Direct. During this time, it was one of a very few, if any, regional banking companies to successfully issue this type of debt financing. Similarly, the market for underwritten perpetual preferred stock offerings essentially closed to all regional banking companies after May 2008, but Zions again used Zions Direct to issue approximately $47 million of noncumulative perpetual preferred stock in July. Finally, in early September Zions became the last U.S. regional banking company to issue any significant amount of common equity in 2008 when it issued $250 million of common stock.
Beginning in January 2008, several of the Company’s affiliate banks began to bid for funds in the FRB’s TAF program and at a peak in December 2008, the Company had a total of $2.1 billion of such funds. By year-end this amount had declined to $1.8 billion and further declined to $0.5 billion by mid-February 2009. Lockhart also elected to participate in the FRB’s CPFF program, and at year-end had sold $80 million of its commercial paper to the FRB. In October the Company submitted an application for $1.4 billion of preferred capital under the Treasury’s CPP program, near the maximum $1.48 billion for which it was eligible. This application was approved and funded in November. In early December the Company and each of its affiliate banks elected to participate in the FDIC’s TLGP, and in January 2009 the Company issued the maximum amount of such debt for which it was eligible, $254.9 million. Taken together, these and other actions taken by the Company significantly improved both its holding company and bank liquidity and capital positions, and at year-end left the Company in a much stronger position to manage through the continuing economic downturn. However, as many normal capital and funding markets remained highly disrupted at the end of 2008, further stresses in 2009 may be anticipated.
These capital market stresses also had a significant impact on the Company’s investment securities portfolio. A total of $317 million of other-than-temporary-impairment (“OTTI”) and valuation charges were taken against earnings during 2008, compared to $158 million in 2007. In addition, reductions in fair value of
this portfolio that were recorded in Other Comprehensive Income (“OCI”) totaled $246 million in 2008, compared to $111 million in 2007. Collateralized debt obligation (“CDO”) securities became increasingly difficult to value in 2008 as normal markets for them ceased to exist, and under the provisions of SFAS 157, the Company switched to Level 3 model valuations for the great majority of them by year-end 2008 (see page 37 for further discussion of the Company’s valuation of these securities). Since the weakening economy continues to place stress on the underlying bank, insurance, and real estate exposures in many of these securities, the Company believes it is possible that further impairment charges and/or OCI impact may occur in 2009.
Capital and Return on Capital
As regulated financial institutions, the Parent and its subsidiary banks are required to maintain adequate levels of capital as measured by several regulatory capital ratios. One of our goals is to maintain capital levels that are at least “well capitalized” under regulatory standards. The Company and each of its banking subsidiaries exceeded the “well capitalized” guidelines at December 31, 2008. In addition, the Parent and certain of its banking subsidiaries have issued various debt securities that have been rated by the principal rating agencies. As a result, another goal is to maintain capital at levels consistent with an “investment grade” rating for these debt securities. The Company has maintained its “investment grade” debt ratings as have those of its bank subsidiaries that have ratings.
At year-end 2008, the Company’s tangible common equity ratio increased to 5.89% compared to 5.70% at the end of 2007. As noted previously, amid very difficult capital market conditions in the latter half of 2008, the Company strengthened its capital position by issuing $47 million of noncumulative perpetual preferred stock and $250 million of common equity. In November 2008 the Company participated in the CPP (also known as TARP capital), and issued $1.4 billion of cumulative perpetual preferred stock with a common stock warrant attached to the U.S. Treasury. Further, in October 2008 the Company reduced the quarterly dividend on its common stock from $0.43 to $0.32 per share, and in January 2009 again reduced this dividend to $0.04 per share, in order to conserve capital in a highly uncertain environment.
This series of actions resulted in capital ratios at Zions at year-end that were higher than in over a decade for all ratios except the tangible common equity ratio. At December 31, 2008, the Company’s tangible common equity ratio was 5.89% and its tangible equity ratio was 8.86%.
The Company expects that it (and the banking industry as a whole) may be required by market forces and/or regulation to operate with higher capital ratios than in the recent past. In addition, the CPP capital preferred dividend increases from 5% to 9% in 2013, making it much more expensive as a source of capital if not redeemed at or prior to that time. Thus, in addition to maintaining higher levels of capital, the Company’s capital structure may be subject to greater variation over the next few years than has been true historically.
In addition, we believe that the Company should engage or invest in business activities that provide attractive returns on equity. Chart 13 illustrates that as a result of earnings improvement, the exit of underperforming businesses and returning unneeded capital to the shareholders, the Company’s return on average common equity improved from 2004 to 2005. The decline in 2006 resulted from the additional common equity held due to the acquisition of Amegy. The further decline in the return on average common equity in 2007 and again in 2008 resulted primarily from goodwill impairment, securities impairment charges, and larger provision for loan losses discussed previously, as well as from the additional common equity issued to acquire Stockmen’s.
As depicted in Chart 14, tangible return on average tangible common equity further improved in 2006 as the Company continued to improve its core operating results. However, it deteriorated significantly in 2007 and 2008 primarily as a result of the securities impairment and valuation losses and the increased provision for loan losses discussed previously.
Note: Tangible return is net earnings applicable to common
shareholders plus after-tax amortization of core deposit and
other intangibles and impairment losses on goodwill.
Challenges to Operations
As we enter 2009, we see a number of significant challenges confronting the industry and our company.
Global capital and funding markets remain under significant stress, and most observers believe that the current U.S. and global economic recession may grow more severe at least through the first half of 2009. This continued economic weakness may lead to:
Further declines in value and potential OTTI charges on CDO securities we own that are largely collateralized by junior debt and trust preferred debt issued by banks and insurance companies.
Continued weakness in the residential housing construction markets, particularly in Arizona, Nevada and California, but also in Utah and Idaho, resulting in continued high levels of net charge-offs, loan loss provisions and nonperforming assets, as well as higher levels of OREO expense due to continued declines in real estate collateral values.
A spread of weaker credit conditions to other geographies served by the Company and to other types of loans. In the latter half of 2008, we began to see increasing delinquency rates in some parts of the loan portfolio, including some parts of the residential first mortgage portfolio, nonresidential commercial real estate construction, and commercial and industrial loans. These indications of weakness had not yet resulted in significantly higher levels of net charge-offs by year-end 2008, but continued weakness may lead to higher levels of provisions and losses in 2009.
Capital and funding markets remain highly disrupted as we enter 2009. Some funding markets improved somewhat late in 2008, but these improvements may be largely due to the unprecedented efforts of the FRB and FDIC to inject liquidity into the financial system. It is highly uncertain how those markets will develop in 2009 and how they will react if and when this governmental support begins to be withdrawn. While the Company by many measures has higher levels of capital and funding than it has had in a very long time, the Company, like all financial institutions, at some point may need to access capital and funding markets to support its Small Business Investment Companies (“SBIC”), owns investmentsoperations. The conditions under which the Company can access those markets may remain highly uncertain in venture funds2009.
These challenges and others are more fully discussed under “Risk Factors” on page 11.
CRITICAL ACCOUNTING POLICIES AND SIGNIFICANT ESTIMATES
The Notes to Consolidated Financial Statements contain a summary of the Company’s significant accounting policies. We believe that an understanding of certain of these policies, along with the related estimates that we are required to make in recording the financial transactions of the Company, is important in order to have a complete picture of the Company’s financial condition. In addition, in arriving at these estimates, we are required to make complex and subjective judgments, many of which include a high degree of uncertainty. The following is a discussion of these critical accounting policies and significant estimates related to these policies. We have discussed each of these accounting policies and the related estimates with the Audit Committee of the Board of Directors.
We have included sensitivity schedules and other capital securities thatexamples to demonstrate the impact of the changes in estimates made for various financial transactions. The sensitivities in these schedules and examples are not publicly tradedhypothetical and should be viewed with caution. Changes in estimates are based on variations in assumptions and are not accountedsubject to simple extrapolation, as the relationship of the change in the assumption to the change in the amount of the estimate may not be linear. In addition, the effect of a variation in one assumption is in reality likely to cause changes in other assumptions, which could potentially magnify or counteract the sensitivities.
Fair Value Accounting
Effective January 1, 2008, the Company adopted SFAS No. 157,Fair Value Measurementsand SFAS No. 159,The Fair Value Option for usingFinancial Assets and Financial Liabilities. SFAS 157 defines fair value, establishes a consistent framework for measuring fair value, and enhances disclosures about fair value measurements. Adoption of SFAS 157 for the equity method. Since these nonmarketable securitiesmeasurement of all nonfinancial assets and nonfinancial liabilities was delayed one year until January 1, 2009. The adoption of SFAS 157 did not have no readily ascertainablea material effect on the Company’s consolidated financial statements, but significantly expanded the disclosure requirements for fair values, they are reported at amountsvalue measurements.
SFAS 157 defines fair value as the exchange price that we have estimatedwould be received for an asset or paid to be theirtransfer a liability (an exit price) in the principal or most advantageous market for the asset or liability in an orderly transaction between market participants on the measurement date. To measure fair values. In estimatingvalue, SFAS 157 has established a hierarchy which requires an entity to maximize the use of observable inputs and minimize the use of unobservable inputs. This hierarchy uses three levels of inputs to measure the fair value of each investment, we must apply judgmentassets and liabilities as follows:
Level 1 – Quoted prices in active markets for identical assets or liabilities; includes certain U.S. Treasury and other U.S. Government and agency securities actively traded in over-the-counter markets; certain securities sold, not yet purchased; and certain derivatives.
Level 2 – Observable inputs other than Level 1 including quoted prices for similar assets or liabilities, quoted prices in less active markets, or other observable inputs that can be corroborated by observable market data; also includes derivative contracts whose value is determined using a pricing model with observable market inputs or can be derived principally from or corroborated by observable market data. This category generally includes certain assumptions. Initially, we believe that an investment’s cost is the best indication of itsU.S. Government and agency securities; certain CDO securities; corporate debt securities; certain private equity investments; certain securities sold, not yet purchased; and certain derivatives. See “Accounting for Derivatives” on page 44 for further details on fair value provided that there have beenaccounting for derivatives.
Level 3 – Unobservable inputs supported by little or no significant positivemarket activity for financial instruments whose value is determined using pricing models, discounted cash flow methodologies, or negative developments subsequent to its acquisition that indicatesimilar techniques, as well as instruments for which the necessitydetermination of an adjustment to a fair value estimate. Ifrequires significant management judgment or estimation. Additionally, observable inputs such as nonbinding single dealer quotes that are not corroborated by observable market data are included in this category. This category generally includes certain private equity investments and certain CDO securities.
The Company uses models when such an event takes place, we adjust the investment’s costquotations are not available for certain securities or in markets where trading activity has slowed or ceased. When quotations are not available, and are not provided by an amount that we believe reflects the naturethird party pricing services, management judgment is necessary to determine fair value. In situations involving management judgment, fair value is determined using discounted cash flow analysis or other valuation models, which incorporate available market information, including appropriate benchmarking to similar instruments, analysis of the event. In addition, any minority interests in the Company’s SBICs reduce its sharedefault and recovery rates, estimation of any gains or losses incurred on these investments.prepayment characteristics and implied volatilities.
As ofAt December 31, 2006, the Company’s2008, approximately 6.0% of total investment in nonmarketable equity securities not accounted for using the equity method was $117.6 million,assets, or $3.3 billion, consisted of which its equity exposure to investments held by the SBICs, net of related minority interest of $41.2 million and SBA debt of $7.0 million, was $55.5 million. In addition, exposure to non-SBIC equity investments not accounted for by the equity method was $13.9 million.
The values that we have assigned to these securities where no market quotations exist are based upon available information and may not necessarily represent amounts that ultimately will be realized on these securities. Key information used in valuing these securities include the projected financial performance of these companies, the evaluation of the investee company’s management team, and other industry, economic and market factors. If there had been an active market for these securities, the carrying value may have been significantly different from the amounts reported. In addition, since Zions Bank and Amegy are the principal business segments holding these investments, they would experience the largest impact of any changes in the fair values of these securities.
Accounting for Goodwill
Goodwill arises from business acquisitions and represents the value attributable to the unidentifiable intangible elements in our acquired businesses. Goodwill is initiallyinstruments recorded at fair value on a recurring basis. Of this amount, $2.4 billion of these financial instruments used valuation methodologies involving market-based or market-derived information, collectively Level 1 and 2 measurements, to measure fair value. Approximately $895 million of these financial assets are measured using model-based techniques or nonbinding single dealer quotes, both of which constitute Level 3 measurements. At December 31, 2008, approximately 0.45% of total liabilities, or $221 million, consisted of financial instruments recorded at fair value on a recurring basis. At December 31, 2008, approximately 0.50% of total assets, or $276 million of financial assets were valued on a nonrecurring basis at Level 2.
Fair Value Option
SFAS 159 allows for the option to report certain financial assets and liabilities at fair value initially and at subsequent measurement dates with changes in fair value included in earnings. The option may be applied instrument by instrument, but is subsequently evaluatedon an irrevocable basis. On January 1, 2008, the Company applied the fair value option to one available-for-sale real estate investment trust (“REIT”) trust preferred CDO security and three retained interests on selected small business loan securitizations. The REIT CDO and retained interests were valued using Level 3 models. The cumulative effect of adopting SFAS 159 reduced the beginning balance of retained earnings at least annuallyJanuary 1, 2008 by approximately $11.5 million, comprised of a decrease of $11.7 million for the REIT CDO and an increase of $0.2 million for the three retained interests. During 2008, the net change in fair value decreased pretax earnings by approximately $9.2 million, consisting of $7.1 million for the REIT CDO security and $2.1 million for the retained interests. These adjustments to fair value are included in fair value and nonhedge derivative income (loss) in the statement of income.
The Company elected the fair value option for the REIT CDO security as part of a directional hedging program in an effort to hedge the credit exposure the Company has to homebuilders in its REIT CDO portfolio. Management selected this security because it had the most exposure to the homebuilder market compared to the other REIT CDO securities in the Company’s portfolio, both in dollar amount and as a percentage, and was therefore considered the most suitable for hedging. The fair value option adoption for the REIT CDO allows the Company to avoid the complex hedge accounting provisions under SFAS 133 associated with the implemented hedging program.
On June 23, 2008, Zions Bank purchased $787 million of securities from Lockhart, which comprised the entire remaining small business loan securitizations created by Zions Bank and held by Lockhart. As a result, the three small business securitization retained interests elected under the fair value option were included in this transaction and were part of the premium amount recorded with the loan balances at Zions Bank. See “Off-Balance Sheet Arrangement” on page 96 for further discussion of these securities purchased.
Estimates of Fair Value
The Company measures or monitors many of its assets and liabilities on a fair value basis. Fair value is used on a recurring basis for certain assets and liabilities in which fair value is the primary basis of accounting. Examples of these include derivative instruments, available-for-sale and trading securities, and private equity investments. Additionally, fair value is used on a nonrecurring basis to evaluate assets or liabilities for impairment or for disclosure purposes in accordance with SFAS No. 142,107,GoodwillDisclosures about Fair Value of Financial Instruments. Examples of these nonrecurring uses of fair value include loans held for sale accounted
for at the lower of cost or fair value, impaired loans, long-lived assets, goodwill, and Other Intangible Assets.core deposit and other intangible assets. Depending on the nature of the asset or liability, the Company uses various valuation techniques and assumptions when estimating the instrument’s fair value. These valuation techniques and assumptions are in accordance with SFAS 157.
Fair value is the price that could be received to sell an asset or paid to transfer a liability in an orderly transaction between market participants. If observable market prices are not available, then fair value is estimated using modeling techniques such as discounted cash flow analyses. These modeling techniques utilize assumptions that market participants would use in pricing the asset or the liability, including assumptions about the risk inherent in a particular valuation technique, the effect of a restriction on the sale or use of an asset, and the risk of nonperformance. To increase consistency and comparability in fair value measures, SFAS 157 established a three-level hierarchy to prioritize the inputs used in valuation techniques between observable inputs that reflect quoted prices in active markets, inputs other than quoted prices with observable market data, and unobservable data such as the Company’s own data or single dealer nonbinding pricing quotes.
Fair values for investment securities, trading assets, and most derivative financial instruments are based on independent, third party market prices, or if identical market prices are not available they are based on the market prices of similar instruments if available. If market prices of similar instruments are not available, instruments are valued based on the best available data, some of which may not be readily observable in the market. The fair values of loans held for sale are typically based on quotes from market participants. The fair values of OREO and other repossessed assets are typically determined based on appraisals by third parties, less estimated selling costs.
Estimates of fair value are also required when performing an impairment analysis of long-lived assets, goodwill, and core deposit and other intangible assets. The Company performs thisreviews goodwill for impairment at the reporting unit level on an annual test as of October 1 of each year. Evaluations are also performed on abasis, or more frequent basisoften if events or circumstances indicate the carrying value may not be recoverable. The goodwill impairment could have taken place. Such events could include, among others, a significant adverse change in the business climate, an adverse action by a regulator, an unanticipated change in the competitive environment, and a decision to change the operations or dispose of a reporting unit.
The first step in this evaluation process is to determine if a potential impairment exists in any of the Company’s reporting units and, if required from the results of this step, a second step measures the amount of any impairment loss. The computations required by steps 1 and 2 call for us to make a number of estimates and assumptions. In completing step 1, we determinetest compares the fair value of the reporting unit that is being evaluated. In determining the fair value, we generally calculate value using a combination of up to three separate methods: comparable publicly traded financial service companies in the Western and Southwestern states; comparable
acquisitions of financial services companies in the Western and Southwestern states; and the discounted present value of management’s estimates of future cash or income flows. Critical assumptions that are used as part of these calculations include:
selection of comparable publicly traded companies, based on location, size, and business composition;
selection of comparable acquisition transactions, based on location, size, business composition, and date of the transaction;
the discount rate applied to future earnings, based on an estimate of the cost of capital;
the potential future earnings of the reporting unit;
the relative weight given to the valuations derived by the three methods described.
with its carrying value. If step 1 indicates a potential impairment of a reporting unit, step 2 requires us to estimate the “implied fair value” of the reporting unit. This process estimates the fair value of the unit’s individual assets and liabilities in the same manner as if a purchase of the reporting unit were taking place. To do this we must determine the fair value of the assets, liabilities and identifiable intangible assets of the reporting unit based upon the best available information. If the value of goodwill calculated in step 2 is less than the carrying amount of goodwill forthe Company’s investment in the reporting unit exceeds its fair value, an impairment is indicated andadditional analysis must be performed to determine the carrying value ofamount, if any, by which goodwill is written down to the calculated value.
Since estimates are an integral part of the impairment computations, changes in these estimates could have a significant impact on any calculated impairment amount. Factors that may significantly affect the estimates include, among others, competitive forces, customer behaviors and attrition, changes in revenue growth trends, cost structures and technology, changes in discount rates, changes in stock and mergers and acquisitions market values, and changes in industry or market sector conditions.
During the fourth quarter of 2006, we performed our annual goodwill impairment evaluation for the entire organization, effective October 1, 2006. Step 1 was performed by using both market value and transaction value approaches for all reporting units and, in certain cases, the discounted cash flow approach was also used.impaired. In the market value approach, we identified a group of publicly traded banks that are similar in size and location to Zions’ subsidiary banks and then used valuation multiples developed from the group to apply to our subsidiary banks. In the transaction value approach, we reviewed the purchase price paid in recent mergers and acquisitions of banks similar in size to Zions’ subsidiary banks. From these purchase prices we developed a set of valuation multiples, which we applied to our subsidiary banks. In instances where the discounted cash flow approach was used, we discounted projected cash flows to their present value to arrive at our estimate of fair value.
Upon completion of step 1 of the evaluation process, we concluded that no potential impairment existed for any of the Company’s reporting units. In reaching this conclusion, we determined that the fair values of goodwill exceeded the recorded values of goodwill. Since this evaluation process required us to make estimates and assumptions with regard todetermining the fair value of the Company’s reporting units, management uses discounted cash flow models which require assumptions about growth rates of the reporting units and the cost of equity. To the extent that adequate data is available, other valuation techniques relying on market data may be incorporated into the estimate of a reporting unit’s fair value. The selection and weighting of the various fair value techniques may result in a higher or lower fair value. Judgment is applied in determining the amount that is most representative of fair value. For long-lived assets and intangible assets subject to amortization, an impairment loss is recognized if the carrying amount of the asset is not likely to be recoverable and exceeds its fair value. In determining the fair value, management uses models which require assumptions about growth rates, the life of the asset, and/or the fair value of the assets. The Company tests long-lived assets for impairment whenever events or changes in circumstances indicate that their carrying amounts may not be recoverable.
Valuation of Collateralized Debt Obligations
The Company values CDO available-for-sale and held-to-maturity securities using several methodologies based on the appropriate fair value hierarchy consistent with currently available market information. At December 31, 2008, the Company valued substantially all of the CDO portfolio using Level 3 pricing methods as follows:
Schedule 3
CDO FAIR VALUES
| Held-to-maturity | Available-for-sale | ||||||||
| (In millions) | Amortized cost | Estimated fair value | Amortized cost | Estimated fair value | |||||
Trust preferred securities – bank and insurance: | |||||||||
Internal model | $ | 1,180 | 671 | 779 | 638 | ||||
Third party models | 8 | 6 | |||||||
Dealer quotes | 16 | 12 | |||||||
Level 2 | 12 | 11 | |||||||
| 1,188 | 677 | 807 | 661 | ||||||
Trust preferred securities – real estate investment trusts: | |||||||||
Third party models | 36 | 21 | 27 | 24 | |||||
| 36 | 21 | 27 | 24 | ||||||
Other: | |||||||||
Third party models | 76 | 51 | 4 | 4 | |||||
Dealer quotes | 21 | 10 | |||||||
Monoline CDS spreads | 72 | 53 | |||||||
Level 2 | 5 | 5 | |||||||
| 76 | 51 | 102 | 72 | ||||||
Total | $ | 1,300 | 749 | 936 | 757 | ||||
Internal Model
Four developments during 2008 influenced the Company to use a level 3 cash flow modeling approach to value essentially all of its bank and insurance trust preferred securities at December 31, 2008.
Market activity in the sector became increasingly limited, illiquid, disordered and dominated by, if not limited to, distressed or forced sellers. It became increasingly difficult to substantiate actual trading levels and the “willingness” of sellers executing at those levels. The determination of inactivity/ illiquidity was based on discussion with dealers and CDO managers specializing in the sector as well as a review of bid lists, execution levels of forced trades, and any other information available on trades.
Bank failures and announced deferrals of interest payments on trust preferred securities contained within the CDOs impacted differently each tranche of each CDO held. Each tranche is unique in the amount of performing, deferring and defaulting collateral, remaining collateral quality and cash flow waterfall mechanics.
Rating agency watch listing and downgrading of CDO tranches occurred in May, July, August, and November. Each of S&P, Moody’s and Fitch either revised or were in the process of reassessing their ratings model assumptions. This resulted in an increasing lack of consistency in rating levels for CDO tranches. The matrix pricing methodology used from September 2007 to June of 2008 was dependent on securities being substantially similar. In management’s judgment, an operational definition of
“substantially similar” securities capable of supporting the requirements of Level 2 pricing could no longer be created without the addition of significant adjustments based on unobservable inputs beginning in July of 2008 and continuing through year-end 2008. |
| • | Finally, a joint statement of the SEC Office of the Chief Accountant and the FASB staff on September 30, 2008 and FASB’s October 10, 2008 issuance of FASB Staff Position (“FSP”) FAS 157-3,Determining the Fair Value of a Financial Asset When the Market for That Asset is Not Active, provided additional guidance on determining fair value of financial assets when the market for such assets is not active. These statements clarified when and how an entity might, given an inactive market, appropriately determine that the use of an income approach valuation technique (present value technique) that maximizes the use of relevant observable inputs and minimizes the use of unobservable inputs may be equally or more representative of fair value than a market approach valuation. |
In the third quarter of 2008, the Company began using a licensed third party model to value bank and insurance trust preferred CDOs. The model uses market-based estimates of expected loss for the individual pieces of underlying collateral to arrive at a pool-level expected loss rate for each CDO. These loss assumptions are applied to the CDO’s structure to generate cash flow projections for each tranche of the CDO. The fair value of each tranche is determined by discounting its resultant loss-adjusted cash flows with appropriate market based discount rates. At December 31, 2008, the discount rate determination referenced several market inputs including current collateralized loan obligation spreads obtained from a third party.
The method for deriving loss expectation for collateral underlying the CDOs depends on whether the collateral is from a public or private company. For public companies, a term structure of Probabilities of Default (“PDs”) is obtained from a commercially available service. The service estimates PDs using a proprietary reduced form model derived using logistic regression on a historical default database. Because the service’s model requires equity valuation related inputs (along with other macro and firm specific inputs) to produce default probabilities, the service does not produce results for private firms and some very small public firms that do not have readily available market data.
For private companies (and the few small public companies not evaluated by the service) PDs are estimated based on credit ratings. The credit ratings come from two external rating sources; one specific to banks, and the other to insurers. The Company has credit ratings for each piece of collateral whether private or public. Using the PD data on the public companies obtained from the commercial service, the Company calculates the average PD for each credit rating level by industry. The rating level average is then applied to all corresponding credits within each rating level that do not have a PD from the commercial service.
The PDs for the underlying collateral are then used to develop CDO deal-level expected loss curves. An external service which models the unique cash-flow waterfall and structure of each CDO deal is used to generate tranche-level cash flows using the Company’s derived CDO deal-level loss assumptions (along with other relevant assumptions). The resultant cash-flows are discounted using current market spreads approximated from related product markets; these spreads differ depending upon the rating agency ratings (usually the Fitch rating) of the CDO, with higher spreads being applied to lower rated CDOs.
The Company did find evidence of one forced trade during the third quarter of 2008 in a tranche of a CDO that is owned by the Company. The forced trade occurred at a price of 35% of face value. This particular deal had amortized down considerably from issuance and the tranche was currently the most senior in the CDO. At the time of the trade the underlying collateral consisted of only five bank obligations and a Freddie Mac zero-coupon principal-only security strip due 2031. Two of the five bank obligations were from Wells Fargo Corporation, which also has publicly available secondary market trading levels on a similar public trust preferred issuance. Even under the assumption that all three of the non-Wells Fargo obligations in the CDO immediately defaulted with no recovery, the projected tranche cash-flows, discounted at the yield of the public Wells Fargo trust preferred issue, resulted in a value of 68% of face value. Based on this analysis, the observed trade at 35% does
not reflect the level at which an informed market participant would value the security. As a comparison, the Company’s model produced a price of 58%. The Company feels that the difference between the model price of 58% and the above outlined scenario price of 68% reflects an appropriate liquidity discount given the lack of activity in CDO markets compared to publicly traded trust preferred markets; this particular security is valued at December 31, 2008 by the Company at 55%.
The following schedule sets forth the sensitivity of the current CDO fair values using an internal model to changes in the most significant assumptions utilized in the model:
Schedule 4
SENSITIVITY OF BANK AND INSURANCE CDO VALUATIONS TO ADVERSE CHANGES OF CURRENT MODEL KEY VALUATION ASSUMPTIONS
| Bank and insurance CDOs at Level 3 | |||||||||||
| (Amounts in millions) | Held-to- maturity | Available- for-sale | |||||||||
Fair value balance at December 31, 2008 | $ | 671 | $ | 638 | |||||||
Expected cumulative credit losses1 | |||||||||||
Weighted average: | |||||||||||
Current defaulted or deferring securities2 | 7.9 | % | 10.0 | % | |||||||
1-year | 12.1 | % | 14.5 | % | |||||||
5-year | 17.7 | % | 20.6 | % | |||||||
30-year | 25.3 | % | 28.6 | % | |||||||
Decrease in fair value due to adverse change | 20 | % | $ | (22.6 | ) | $ | (1.6 | ) | |||
| 50 | % | (61.2 | ) | (4.3 | ) | ||||||
Discount rate3 | |||||||||||
Weighted average spread | 761bp | 311bp | |||||||||
Decrease in fair value due to adverse change | +100 | bp | $ | (64.7 | ) | $ | (67.2 | ) | |||
| +200 | bp | (120.0 | ) | (123.5 | ) | ||||||
1 | The Company uses an expected credit loss model which specifies cumulative losses at the 1-year, 5-year, and 30-year points from the data of valuation. |
2 | Weighted average percentage of collateral that is defaulted due to bank failures or deferring payment as allowed under the terms of security. |
3 | The discount rate is a spread over the LIBOR swap yield curve at the date of valuation. |
The adverse changes in expected cumulative credit losses resulted in a larger decrease in fair value for held-to-maturity (“HTM”) than available-for-sale (“AFS”) securities because the AFS portfolio is composed primarily of more senior CDO tranches. In general these senior tranches receive accelerated principal payments under scenarios of high credit losses provided that the credit losses do not exceed the available subordination in the CDO deal. By contrast more junior tranches which are in our HTM portfolio absorb credit losses and defer principal and interest payments upon increasing credit losses.
Third Party Models
At December 31, 2008, the Company utilized third party valuation services for sixteen securities with an aggregate amortized cost of $151 million in the Asset-Backed Security (“ABS”) CDO and trust preferred asset classes. These securities continued to have insufficient observable market data available to directly determine prices. The Company reviewed the methodologies employed by third party models. This included a review of all relevant data inputs and the appropriateness of key model assumptions. These assumptions included, but were not limited to, probability of default, collateral recovery rates, discount rates, over-collateralization levels, and rating transition probability matrices from rating agencies. The model valuations obtained from third party services
were evaluated for reasonableness including quarter to quarter changes in assumptions and comparison to other available data which included third party and internal model results and valuations. A range of value estimates is not provided because third party vendors utilized point estimates.
Dealer Quotes
The $37 million of asset-backed securities at amortized cost are valued using nonbinding and unadjusted dealer quotes. Multiple quotes are not available and the values provided are based on a combination of proprietary dealer quotes. Broker disclosure levels vary and the Company seeks to minimize dependence on this Level 3 source. Of the $37 million of securities, approximately $18 million are AAA rated.
Monoline CDS Spreads
A total of $72 million at amortized cost of insured securities purchased out of Lockhart were valued using the relevant monoline insurers’ credit derivative levels.
See Note 4 of the Notes to Consolidated Financial Statements and “Investment Securities Portfolio” on page 85 for further information.
Other-than-Temporary-Impairment – Debt Investment Securities
We review investment debt securities on an ongoing basis for the presence of OTTI with formal reviews performed quarterly. OTTI losses on individual investment securities are recognized as a realized loss through earnings when it is probable that the Company will not collect all of the contractual cash flows or the Company is unable to hold the securities to recovery. OTTI losses include credit losses and a discount for liquidity.
The Company’s OTTI evaluation process conforms with the rules contained in Emerging Issues Task Force (“EITF”) Issue No. 99-20,Recognition of Interest Income and Impairment on Purchased and Retained Beneficial Interests in Securitized Financial Assets, FSP No. EITF 99-20-1, Amendments to the Impairment Guidance of EITF Issue No. 99-20, and SFAS No. 115,Accounting for Certain Investments in Debt and Equity Securities. These rules require the Company to take into consideration current market conditions, fair value in relationship to cost, extent and nature of change in fair value, issuer rating changes and trends, volatility of earnings, current analysts’ evaluations, all available information relevant to the collectability of debt securities, our ability and intent to hold investments until a recovery of fair value, which may differbe maturity, and other factors when evaluating for the existence of OTTI in our securities portfolio.
On January 12, 2009, the FASB issued FSP EITF 99-20-1, Amendments to the Impairment Guidance of EITF Issue No. 99-20. This FSP is effective for interim and annual reporting periods ending after December 15, 2008, and shall be applied prospectively. The FSP amends EITF 99-20 by eliminating the requirement that a holder’s best estimate of cash flows be based upon those that “a market participant” would use. Instead, the FSP requires that OTTI be recognized as a realized loss through earnings when it is “probable” there has been an adverse change in the holder’s estimated cash flows from the cash flows previously projected, which is consistent with the impairment model in SFAS 115.
The Company recognized pretax OTTI losses of $304.0 million during 2008 and $108.6 million during 2007 on investment debt securities. All of the impairment for 2008 related to securities valued using Level 3 inputs. Management estimates that approximately $135 million of the impairment for 2008 related to credit impairment.
The decision to deem these securities OTTI was based on a specific analysis of the structure of each security and an evaluation of the underlying collateral using information and industry knowledge available to the Company. Future reviews for OTTI will consider the particular facts and circumstances during the reporting period in review.
Allowance and Reserve for Credit Losses
Allowance for loan losses
The allowance for loan losses represents our estimate of the losses that are inherent in the loan and lease portfolios. The determination of the appropriate level of the allowance is based on periodic evaluations of the portfolios along with other relevant factors. These evaluations are inherently subjective and require us to make numerous assumptions, estimates and judgments.
In analyzing the adequacy of the allowance for loan losses, we utilize a comprehensive loan grading system to determine the risk potential in the portfolio and also consider the results of independent internal credit reviews. To determine the adequacy of the allowance, the Company’s loan and lease portfolio is broken into segments based on loan type. For commercial loans, we use historical loss experience factors by loan segment, adjusted for changes in trends and conditions, to help determine an indicated allowance for each segment based on individual loan grades. These factors are evaluated and updated using migration analysis techniques and other considerations based on the makeup of the specific portfolio segment. The other considerations used in our analysis include volumes and trends of delinquencies, levels of nonaccrual loans, repossessions and bankruptcies, trends in criticized and classified loans, and expected losses on loans secured by real estate. In addition, new credit products and policies, economic conditions, concentrations of credit risk, and the experience and abilities of lending personnel are also taken into consideration.
In addition to the segment evaluations, nonaccrual loans graded substandard or doubtful with an outstanding balance of $500 thousand or more are individually evaluated in accordance with SFAS No. 114,Accounting by Creditors for Impairment of a Loan,to determine the level of impairment and establish a specific reserve. A specific allowance may also be established for adversely graded loans below $500 thousand when it is determined that the risk associated with the loan differs significantly from these estimates. Such differencesthe risk factor amounts established for its loan segment and risk grade.
The allowance for consumer loans is determined using historically developed loss experience “roll rates” at which loans migrate from one delinquency level to the next higher level. Using average roll rates for the most recent twelve-month period and comparing projected losses to actual loss experience, the model estimates the expected losses in dollars for the forecasted period. By refreshing the model with updated data, it is able to project losses for a new twelve-month period each month, segmenting the portfolio into nine product groupings with similar risk profiles. This methodology is an accepted industry practice, and the Company believes it has a sufficient volume of information to produce reliable projections.
As a final step to the evaluation process, we perform an additional review of the adequacy of the allowance based on the loan portfolio in its entirety. This enables us to mitigate, but not eliminate, the imprecision inherent in loan- and segment-level estimates of expected credit losses. This review of the allowance includes our judgmental consideration of any adjustments necessary for subjective factors such as economic uncertainties and concentration risks.
There are numerous components that enter into the evaluation of the allowance for loan losses. Some are quantitative while others require us to make qualitative judgments. Although we believe that our processes for determining an appropriate level for the allowance adequately address all of the components that could potentially result in future impairmentcredit losses, the processes and their elements include features that may be susceptible to significant change. Any unfavorable differences between the actual outcome of goodwill
thatcredit-related events and our estimates and projections could require an additional provision for credit losses, which would in turn, negatively impact the Company’s results of operations in future periods. As an example, if a total of $1.0 billion of nonclassified loans were to be immediately classified as special mention, substandard and doubtful in the business segments wheresame proportion as the goodwillexisting portfolio of the criticized and classified loans, the amount of the allowance for loan losses at December 31, 2008 would increase by approximately $64 million. This sensitivity analysis is recorded. However, had our estimated fair valueshypothetical and has been 10% lower, there would stillprovided only to indicate the potential impact that changes in the level of the criticized and classified
loans may have been no indication of impairment for any of our reporting units.
Accounting for Derivatives
Our interest rate risk management strategy involves hedging the repricing characteristics of certain assets and liabilities so as to mitigate adverse effects on the Company’s net interest marginallowance estimation process. We believe that given the procedures we follow in determining the potential losses in the loan portfolio, the various components used in the current estimation processes are appropriate.
We are in the process of developing potential changes to enhance our methodology for determining the allowance for loan losses. The potential changes include incorporating a two-factor grading system to include probability of default and cash flows fromloss given default. We currently anticipate that these changes will be phased in interest rates. Whileduring 2009. Regardless of the methodology employed, we do not participateexpect current economic conditions may result in speculative derivatives trading, we consider it prudent to use certain derivative instruments to add stabilityincreases to the Company’s interest income and expense, to modify the duration of specific assets and liabilities, and to manage the Company’s exposure to interest rate movements. In addition, theALLL throughout 2009.
Reserve for unfunded lending commitments
The Company has historically maintained a program to provide derivative financial instruments to certain customers, acting as an intermediary in the transaction. Upon issuance, all of these customer derivatives are immediately “hedged” by offsetting derivative contracts, such that the Company has no net interest rate risk exposure resulting from the transaction.
All derivative instruments are carried on the balance sheet at fair value. As of December 31, 2006, thereserve for unfunded commitments, recorded amounts of derivative assets, classified in other assets, and derivative liabilities, classified in other liabilities,liabilities. During the fourth quarter of 2008 refinements to this process were $51.7 million and $63.2 million, respectively. Since there are no market value quotesimplemented to include all unfunded commitments, including the unfunded portions of partially funded credits, which were previously reserved for the specific derivative instruments that the Company holds, we must estimate their fair values. Generally this estimate is made by an independent third party using a standardized methodology that nets the discounted expected future cash receipts and cash payments (based on observable market inputs). These future net cash flows, however, are susceptible to change due primarily to fluctuations in interest rates. As a result, the estimated values of these derivatives will typically change over time as cash is received and paid and also as market conditions change. As these changes take place, they may have a positive or negative impact on our estimated valuations. However, based on the nature and limited purposespart of the derivatives that the Company employs, fluctuations in interest rates have only a modest effect on its results of operations.allowance for loan losses.
In addition to making the valuation estimates, we also face the risk that certain derivative instruments that have been designated as hedges and currently meet the strict hedge accounting requirements of SFAS No. 133,Accounting for Derivative Instruments and Hedging Activities, and were terminated. Nonetheless, on the whole our interest rate risk management believes its actions continued to result in one of the highest and most stable net interest margins in the industry. We believe that our risk position at December 31, 2008 was more “asset sensitive” than has typically been the case, reflecting in part a lessening of hedging activity due to the historically low interest rate environment.
Taxable-equivalent net interest income in 2008 increased 4.6% over 2007. The net interest margin declined to a still high 4.18% for 2008, down from 4.43% for 2007. The Company was able to achieve this performance despite rising levels of nonaccrual loans and other nonperforming assets, adverse changes in its funding mix, and significant pressures on funding costs. These factors resulted in a fairly steady compression, until the fourth quarter, of the net interest margin.
Note: Peer group is defined as bank holding companies
with assets > $10 billion excluding banks providing
primarily trust services.
Peer data source: SNL Financial Database
Throughout 2008 the relationships among a number of interest rates that are key drivers of the Company’s business deviated significantly, and for long periods, from normal. Of particular significance were the relationships between deposit rates, the prime rate, and LIBOR. Due to liquidity strains throughout the banking industry, rates on bank deposits remained higher than would have been expected despite the unprecedented FRB actions to reduce rates. In some cases deposit rates in the Company’s markets appear to have remained high in part due to the particular stresses being felt by several large institutions that later failed or were sold. These pressures, combined with the lack of lower cost core deposit growth, kept the Company’s cost of funding its loans and other assets higher than might have been expected. These same stresses were felt world-wide, and until very late in 2008 LIBOR rates stayed unusually high in relation to risk-free rates, and in relation to lending rates, which generally followed the Fed Funds rates down as the FRB aggressively pushed that rate lower.
Strong loan growth in the first half of 2008 thus was funded primarily with interest-bearing deposits and nondeposit funding. Noninterest-bearing deposits, as noted, actually declined during the year, which pressured the net interest margin. Mitigating these funding cost pressures were somewhat improved loan pricing spreads relative to LIBOR and prime rates during the year.
See the section “Interest Rate Risk” on page 111 for more information regarding the Company’s asset-liability management (“ALM”) philosophy and practice and our interest rate risk management.
Controlling Expenses
During 2008, the Company’s efficiency (expense-to-revenue) ratio increased to 67.5% from 60.5% for 2007. The efficiency ratio is the relationship between noninterest expense and total taxable-equivalent revenue. The increase in the efficiency ratio to 67.5% for 2008 was primarily due to the effect on revenue of the impairment and valuation losses on securities as previously discussed. Because of the significant securities impairment and valuation losses, the Company believes that its efficiency ratio is not a particularly useful measure of how well operating expenses were contained in 2007 and 2008; nor does it believe that this measure is particularly useful for its peers, many of which also experienced large losses and impairment charges as a result of market turmoil and deteriorating credit conditions. The Company’s efficiency ratio was 58.9% and 56.7% if the impairment and valuation losses on securities are excluded for 2008 and 2007, respectively. Noninterest expense increased 5.0% in 2008 compared to 2007. Over half of this increase resulted from further charge-downs of OREO and OREO expense; excluding the effects of changes in OREO expense, noninterest expense grew 1.7% in 2008 compared to 2007.
Note: Peer group is defined as bank holding companies
with assets > $10 billion excluding banks providing
primarily trust services.
Peer data source: SNL Financial Database
Effects of Global Financial Crisis on the Company
It is now well recognized that during the period of roughly 2004-2006 a speculative bubble developed in residential housing in some of the Company’s key markets (including Arizona, Southern Nevada, and parts of California), and elsewhere in the United States. The volume of mortgage debt outstanding grew at unprecedented rates, fueled by record low interest rates and increasingly lax lending standards as reflected by so-called subprime, Alt-A, and other alternative mortgages. Median housing prices and housing starts both increased to record levels during this period. Home equity lending standards also deteriorated as lenders were lulled by low default rates and rising home prices.
The Company itself never originated subprime mortgages, had almost no direct exposure to these loans, and never offered residential option adjustable rate mortgage (“ARM”) or “negative amortization” loans. However, the Company has a significant business in financing residential land acquisition, development and construction
activity. The FRB began raising interest rates in 2005-2007 as it became increasingly apparent that the prevailing levels of housing activity were unsustainable. New housing starts hit a record of over 2 million units in each of 2005 and 2006. By December 2007, they had fallen to a revised annualized rate of approximately 1.1 million nationally, and by December 2008 had fallen further to about 550,000. This precipitous decline in housing activity has placed significant stress on a number of the Company’s homebuilder customers, and therefore on the Company’s loan portfolio in this sector. This portfolio peaked in mid-2006 as a percentage of the total loan portfolio and declined as a percentage of the total loan portfolio thereafter. Additionally, the portfolio began to shrink in dollar terms in the latter half of 2007 in the Southwestern markets, and continued to shrink throughout 2008 as a result of pay-downs, loan sales, charge-offs and foreclosures. Nonaccrual loans and provisions for loan losses began to increase significantly in late summer 2007, and continued to increase in 2008, as it became clearer that this housing slump would likely be longer and deeper than originally believed. It also became clear that in the latter months of 2008 the economic recession began to deepen and also became global, and likely would persist and possibly continue to deepen well into 2009. The Company therefore believes that nonaccrual loans, the provision for loan losses, and net charge-offs will likely remain elevated throughout this period.
A number of previously successful and respected financial institutions failed, were “rescued,” or acquired with governmental assistance in 2008, including in the United States: Bear Stearns in March, IndyMac Bank in July, Fannie Mae, Freddie Mac, Merrill Lynch and Lehman Brothers in September, and Wachovia and Washington Mutual in October. As this crisis unfolded, capital and funding markets became increasingly strained and eventually essentially ceased to function worldwide in mid-September. Market values of financial institutions globally, including that of the Company, plummeted, and issuance of new funding and capital became increasingly expensive or impossible.
Traditional markets for underwritten offerings of holding company unsecured senior debt effectively became closed to regional banking companies like Zions in the last few months of 2007 and remained closed through 2008. During this time, Zions had several hundred million dollars of senior debt funding that matured and needed to be replaced with new funding unless cash reserves were to be depleted. Zions successfully refunded or newly issued a total of $560 million of medium term senior notes from the second half of 2007 through August 2008 using its broker-dealer subsidiary, Zions Direct. During this time, it was one of a very few, if any, regional banking companies to successfully issue this type of debt financing. Similarly, the market for underwritten perpetual preferred stock offerings essentially closed to all regional banking companies after May 2008, but Zions again used Zions Direct to issue approximately $47 million of noncumulative perpetual preferred stock in July. Finally, in early September Zions became the last U.S. regional banking company to issue any significant amount of common equity in 2008 when it issued $250 million of common stock.
Beginning in January 2008, several of the Company’s affiliate banks began to bid for funds in the FRB’s TAF program and at a peak in December 2008, the Company had a total of $2.1 billion of such funds. By year-end this amount had declined to $1.8 billion and further declined to $0.5 billion by mid-February 2009. Lockhart also elected to participate in the FRB’s CPFF program, and at year-end had sold $80 million of its commercial paper to the FRB. In October the Company submitted an application for $1.4 billion of preferred capital under the Treasury’s CPP program, near the maximum $1.48 billion for which it was eligible. This application was approved and funded in November. In early December the Company and each of its affiliate banks elected to participate in the FDIC’s TLGP, and in January 2009 the Company issued the maximum amount of such debt for which it was eligible, $254.9 million. Taken together, these and other actions taken by the Company significantly improved both its holding company and bank liquidity and capital positions, and at year-end left the Company in a much stronger position to manage through the continuing economic downturn. However, as many normal capital and funding markets remained highly disrupted at the end of 2008, further stresses in 2009 may be anticipated.
These capital market stresses also had a significant impact on the Company’s investment securities portfolio. A total of $317 million of other-than-temporary-impairment (“OTTI”) and valuation charges were taken against earnings during 2008, compared to $158 million in 2007. In addition, reductions in fair value of
this portfolio that were recorded in Other Comprehensive Income (“OCI”) totaled $246 million in 2008, compared to $111 million in 2007. Collateralized debt obligation (“CDO”) securities became increasingly difficult to value in 2008 as normal markets for them ceased to exist, and under the provisions of SFAS 157, the Company switched to Level 3 model valuations for the great majority of them by year-end 2008 (see page 37 for further discussion of the Company’s valuation of these securities). Since the weakening economy continues to place stress on the underlying bank, insurance, and real estate exposures in many of these securities, the Company believes it is possible that further impairment charges and/or OCI impact may occur in 2009.
Capital and Return on Capital
As regulated financial institutions, the Parent and its subsidiary banks are required to maintain adequate levels of capital as measured by several regulatory capital ratios. One of our goals is to maintain capital levels that are at least “well capitalized” under regulatory standards. The Company and each of its banking subsidiaries exceeded the “well capitalized” guidelines at December 31, 2008. In addition, the Parent and certain of its banking subsidiaries have issued various debt securities that have been rated by the principal rating agencies. As a result, another goal is to maintain capital at levels consistent with an “investment grade” rating for these debt securities. The Company has maintained its “investment grade” debt ratings as have those of its bank subsidiaries that have ratings.
At year-end 2008, the Company’s tangible common equity ratio increased to 5.89% compared to 5.70% at the end of 2007. As noted previously, amid very difficult capital market conditions in the latter half of 2008, the Company strengthened its capital position by issuing $47 million of noncumulative perpetual preferred stock and $250 million of common equity. In November 2008 the Company participated in the CPP (also known as TARP capital), and issued $1.4 billion of cumulative perpetual preferred stock with a common stock warrant attached to the U.S. Treasury. Further, in October 2008 the Company reduced the quarterly dividend on its common stock from $0.43 to $0.32 per share, and in January 2009 again reduced this dividend to $0.04 per share, in order to conserve capital in a highly uncertain environment.
This series of actions resulted in capital ratios at Zions at year-end that were higher than in over a decade for all ratios except the tangible common equity ratio. At December 31, 2008, the Company’s tangible common equity ratio was 5.89% and its tangible equity ratio was 8.86%.
The Company expects that it (and the banking industry as a whole) may be required by market forces and/or regulation to operate with higher capital ratios than in the recent past. In addition, the CPP capital preferred dividend increases from 5% to 9% in 2013, making it much more expensive as a source of capital if not redeemed at or prior to that time. Thus, in addition to maintaining higher levels of capital, the Company’s capital structure may be subject to greater variation over the next few years than has been true historically.
In addition, we believe that the Company should engage or invest in business activities that provide attractive returns on equity. Chart 13 illustrates that as a result of earnings improvement, the exit of underperforming businesses and returning unneeded capital to the shareholders, the Company’s return on average common equity improved from 2004 to 2005. The decline in 2006 resulted from the additional common equity held due to the acquisition of Amegy. The further decline in the return on average common equity in 2007 and again in 2008 resulted primarily from goodwill impairment, securities impairment charges, and larger provision for loan losses discussed previously, as well as from the additional common equity issued to acquire Stockmen’s.
As depicted in Chart 14, tangible return on average tangible common equity further improved in 2006 as the Company continued to improve its core operating results. However, it deteriorated significantly in 2007 and 2008 primarily as a result of the securities impairment and valuation losses and the increased provision for loan losses discussed previously.
Note: Tangible return is net earnings applicable to common
shareholders plus after-tax amortization of core deposit and
other intangibles and impairment losses on goodwill.
Challenges to Operations
As we enter 2009, we see a number of significant challenges confronting the industry and our company.
Global capital and funding markets remain under significant stress, and most observers believe that the current U.S. and global economic recession may grow more severe at least through the first half of 2009. This continued economic weakness may lead to:
Further declines in value and potential OTTI charges on CDO securities we own that are largely collateralized by junior debt and trust preferred debt issued by banks and insurance companies.
Continued weakness in the residential housing construction markets, particularly in Arizona, Nevada and California, but also in Utah and Idaho, resulting in continued high levels of net charge-offs, loan loss provisions and nonperforming assets, as well as higher levels of OREO expense due to continued declines in real estate collateral values.
A spread of weaker credit conditions to other geographies served by the Company and to other types of loans. In the latter half of 2008, we began to see increasing delinquency rates in some parts of the loan portfolio, including some parts of the residential first mortgage portfolio, nonresidential commercial real estate construction, and commercial and industrial loans. These indications of weakness had not yet resulted in significantly higher levels of net charge-offs by year-end 2008, but continued weakness may lead to higher levels of provisions and losses in 2009.
Capital and funding markets remain highly disrupted as we enter 2009. Some funding markets improved somewhat late in 2008, but these improvements may be largely due to the unprecedented efforts of the FRB and FDIC to inject liquidity into the financial system. It is highly uncertain how those markets will develop in 2009 and how they will react if and when this governmental support begins to be withdrawn. While the Company by many measures has higher levels of capital and funding than it has had in a very long time, the Company, like all financial institutions, at some point may need to access capital and funding markets to support its operations. The conditions under which the Company can access those markets may remain highly uncertain in 2009.
These challenges and others are more fully discussed under “Risk Factors” on page 11.
CRITICAL ACCOUNTING POLICIES AND SIGNIFICANT ESTIMATES
The Notes to Consolidated Financial Statements contain a summary of the Company’s significant accounting policies. We believe that an understanding of certain of these policies, along with the related estimates that we are required to make in recording the financial transactions of the Company, is important in order to have a complete picture of the Company’s financial condition. In addition, in arriving at these estimates, we are required to make complex and subjective judgments, many of which include a high degree of uncertainty. The following is a discussion of these critical accounting policies and significant estimates related to these policies. We have discussed each of these accounting policies and the related estimates with the Audit Committee of the Board of Directors.
We have included sensitivity schedules and other examples to demonstrate the impact of the changes in estimates made for various financial transactions. The sensitivities in these schedules and examples are hypothetical and should be viewed with caution. Changes in estimates are based on variations in assumptions and are not subject to simple extrapolation, as the relationship of the change in the assumption to the change in the amount of the estimate may not be linear. In addition, the effect of a variation in one assumption is in reality likely to cause changes in other assumptions, which could potentially magnify or counteract the sensitivities.
Fair Value Accounting
Effective January 1, 2008, the Company adopted SFAS No. 157,Fair Value Measurementsand SFAS No. 159,The Fair Value Option for Financial Assets and Financial Liabilities. SFAS 157 defines fair value, establishes a consistent framework for measuring fair value, and enhances disclosures about fair value measurements. Adoption of SFAS 157 for the measurement of all nonfinancial assets and nonfinancial liabilities was delayed one year until January 1, 2009. The adoption of SFAS 157 did not have a material effect on the Company’s consolidated financial statements, but significantly expanded the disclosure requirements for fair value measurements.
SFAS 157 defines fair value as the exchange price that would be received for an asset or paid to transfer a liability (an exit price) in the principal or most advantageous market for the asset or liability in an orderly transaction between market participants on the measurement date. To measure fair value, SFAS 157 has established a hierarchy which requires an entity to maximize the use of observable inputs and minimize the use of unobservable inputs. This hierarchy uses three levels of inputs to measure the fair value of assets and liabilities as follows:
Level 1 – Quoted prices in active markets for identical assets or liabilities; includes certain U.S. Treasury and other U.S. Government and agency securities actively traded in over-the-counter markets; certain securities sold, not yet purchased; and certain derivatives.
Level 2 – Observable inputs other than Level 1 including quoted prices for similar assets or liabilities, quoted prices in less active markets, or other observable inputs that can be corroborated by observable market data; also includes derivative contracts whose value is determined using a pricing model with observable market inputs or can be derived principally from or corroborated by observable market data. This category generally includes certain U.S. Government and agency securities; certain CDO securities; corporate debt securities; certain private equity investments; certain securities sold, not yet purchased; and certain derivatives. See “Accounting for Derivatives” on page 44 for further details on fair value accounting for derivatives.
Level 3 – Unobservable inputs supported by little or no market activity for financial instruments whose value is determined using pricing models, discounted cash flow methodologies, or similar techniques, as well as instruments for which the determination of fair value requires significant management judgment or estimation. Additionally, observable inputs such as nonbinding single dealer quotes that are not corroborated by observable market data are included in this category. This category generally includes certain private equity investments and certain CDO securities.
The Company uses models when quotations are not available for certain securities or in markets where trading activity has slowed or ceased. When quotations are not available, and are not provided by third party pricing services, management judgment is necessary to determine fair value. In situations involving management judgment, fair value is determined using discounted cash flow analysis or other valuation models, which incorporate available market information, including appropriate benchmarking to similar instruments, analysis of default and recovery rates, estimation of prepayment characteristics and implied volatilities.
At December 31, 2008, approximately 6.0% of total assets, or $3.3 billion, consisted of financial instruments recorded at fair value on a recurring basis. Of this amount, $2.4 billion of these financial instruments used valuation methodologies involving market-based or market-derived information, collectively Level 1 and 2 measurements, to measure fair value. Approximately $895 million of these financial assets are measured using model-based techniques or nonbinding single dealer quotes, both of which constitute Level 3 measurements. At December 31, 2008, approximately 0.45% of total liabilities, or $221 million, consisted of financial instruments recorded at fair value on a recurring basis. At December 31, 2008, approximately 0.50% of total assets, or $276 million of financial assets were valued on a nonrecurring basis at Level 2.
Fair Value Option
SFAS 159 allows for the option to report certain financial assets and liabilities at fair value initially and at subsequent measurement dates with changes in fair value included in earnings. The option may be applied instrument by instrument, but is on an irrevocable basis. On January 1, 2008, the Company applied the fair value option to one available-for-sale real estate investment trust (“REIT”) trust preferred CDO security and three retained interests on selected small business loan securitizations. The REIT CDO and retained interests were valued using Level 3 models. The cumulative effect of adopting SFAS 159 reduced the beginning balance of retained earnings at January 1, 2008 by approximately $11.5 million, comprised of a decrease of $11.7 million for the REIT CDO and an increase of $0.2 million for the three retained interests. During 2008, the net change in fair value decreased pretax earnings by approximately $9.2 million, consisting of $7.1 million for the REIT CDO security and $2.1 million for the retained interests. These adjustments to fair value are included in fair value and nonhedge derivative income (loss) in the statement of income.
The Company elected the fair value option for the REIT CDO security as part of a directional hedging program in an effort to hedge the credit exposure the Company has to homebuilders in its REIT CDO portfolio. Management selected this security because it had the most exposure to the homebuilder market compared to the other REIT CDO securities in the Company’s portfolio, both in dollar amount and as a percentage, and was therefore considered the most suitable for hedging. The fair value option adoption for the REIT CDO allows the Company to avoid the complex hedge accounting provisions under SFAS 133 associated with the implemented hedging program.
On June 23, 2008, Zions Bank purchased $787 million of securities from Lockhart, which comprised the entire remaining small business loan securitizations created by Zions Bank and held by Lockhart. As a result, the three small business securitization retained interests elected under the fair value option were included in this transaction and were part of the premium amount recorded with the loan balances at Zions Bank. See “Off-Balance Sheet Arrangement” on page 96 for further discussion of these securities purchased.
Estimates of Fair Value
The Company measures or monitors many of its assets and liabilities on a fair value basis. Fair value is used on a recurring basis for certain assets and liabilities in which fair value is the primary basis of accounting. Examples of these include derivative instruments, available-for-sale and trading securities, and private equity investments. Additionally, fair value is used on a nonrecurring basis to evaluate assets or liabilities for impairment or for disclosure purposes in accordance with SFAS No. 107,Disclosures about Fair Value of Financial Instruments. Examples of these nonrecurring uses of fair value include loans held for sale accounted
for at the lower of cost or fair value, impaired loans, long-lived assets, goodwill, and core deposit and other intangible assets. Depending on the nature of the asset or liability, the Company uses various valuation techniques and assumptions when estimating the instrument’s fair value. These valuation techniques and assumptions are in accordance with SFAS 157.
Fair value is the price that could be received to sell an asset or paid to transfer a liability in an orderly transaction between market participants. If observable market prices are not available, then fair value is estimated using modeling techniques such as discounted cash flow analyses. These modeling techniques utilize assumptions that market participants would use in pricing the asset or the liability, including assumptions about the risk inherent in a particular valuation technique, the effect of a restriction on the sale or use of an asset, and the risk of nonperformance. To increase consistency and comparability in fair value measures, SFAS 157 established a three-level hierarchy to prioritize the inputs used in valuation techniques between observable inputs that reflect quoted prices in active markets, inputs other than quoted prices with observable market data, and unobservable data such as the Company’s own data or single dealer nonbinding pricing quotes.
Fair values for investment securities, trading assets, and most derivative financial instruments are based on independent, third party market prices, or if identical market prices are not available they are based on the market prices of similar instruments if available. If market prices of similar instruments are not available, instruments are valued based on the best available data, some of which may not be readily observable in the market. The fair values of loans held for sale are typically based on quotes from market participants. The fair values of OREO and other repossessed assets are typically determined based on appraisals by third parties, less estimated selling costs.
Estimates of fair value are also required when performing an impairment analysis of long-lived assets, goodwill, and core deposit and other intangible assets. The Company reviews goodwill for impairment at the reporting unit level on an annual basis, or more often if events or circumstances indicate the carrying value may not be recoverable. The goodwill impairment test compares the fair value of the reporting unit with its carrying value. If the carrying amount of the Company’s investment in the reporting unit exceeds its fair value, an additional analysis must be performed to determine the amount, if any, by which goodwill is impaired. In determining the fair value of the Company’s reporting units, management uses discounted cash flow models which require assumptions about growth rates of the reporting units and the cost of equity. To the extent that adequate data is available, other valuation techniques relying on market data may be incorporated into the estimate of a reporting unit’s fair value. The selection and weighting of the various fair value techniques may result in a higher or lower fair value. Judgment is applied in determining the amount that is most representative of fair value. For long-lived assets and intangible assets subject to amortization, an impairment loss is recognized if the carrying amount of the asset is not likely to be recoverable and exceeds its fair value. In determining the fair value, management uses models which require assumptions about growth rates, the life of the asset, and/or the fair value of the assets. The Company tests long-lived assets for impairment whenever events or changes in circumstances indicate that their carrying amounts may not be recoverable.
Valuation of Collateralized Debt Obligations
The Company values CDO available-for-sale and held-to-maturity securities using several methodologies based on the appropriate fair value hierarchy consistent with currently available market information. At December 31, 2008, the Company valued substantially all of the CDO portfolio using Level 3 pricing methods as follows:
Schedule 3
CDO FAIR VALUES
| Held-to-maturity | Available-for-sale | ||||||||
| (In millions) | Amortized cost | Estimated fair value | Amortized cost | Estimated fair value | |||||
Trust preferred securities – bank and insurance: | |||||||||
Internal model | $ | 1,180 | 671 | 779 | 638 | ||||
Third party models | 8 | 6 | |||||||
Dealer quotes | 16 | 12 | |||||||
Level 2 | 12 | 11 | |||||||
| 1,188 | 677 | 807 | 661 | ||||||
Trust preferred securities – real estate investment trusts: | |||||||||
Third party models | 36 | 21 | 27 | 24 | |||||
| 36 | 21 | 27 | 24 | ||||||
Other: | |||||||||
Third party models | 76 | 51 | 4 | 4 | |||||
Dealer quotes | 21 | 10 | |||||||
Monoline CDS spreads | 72 | 53 | |||||||
Level 2 | 5 | 5 | |||||||
| 76 | 51 | 102 | 72 | ||||||
Total | $ | 1,300 | 749 | 936 | 757 | ||||
Internal Model
Four developments during 2008 influenced the Company to use a level 3 cash flow modeling approach to value essentially all of its bank and insurance trust preferred securities at December 31, 2008.
Market activity in the sector became increasingly limited, illiquid, disordered and dominated by, if not limited to, distressed or forced sellers. It became increasingly difficult to substantiate actual trading levels and the “willingness” of sellers executing at those levels. The determination of inactivity/ illiquidity was based on discussion with dealers and CDO managers specializing in the sector as well as a review of bid lists, execution levels of forced trades, and any other information available on trades.
Bank failures and announced deferrals of interest payments on trust preferred securities contained within the CDOs impacted differently each tranche of each CDO held. Each tranche is unique in the amount of performing, deferring and defaulting collateral, remaining collateral quality and cash flow waterfall mechanics.
Rating agency watch listing and downgrading of CDO tranches occurred in May, July, August, and November. Each of S&P, Moody’s and Fitch either revised or were in the process of reassessing their ratings model assumptions. This resulted in an increasing lack of consistency in rating levels for CDO tranches. The matrix pricing methodology used from September 2007 to June of 2008 was dependent on securities being substantially similar. In management’s judgment, an operational definition of
“substantially similar” securities capable of supporting the requirements of Level 2 pricing could no longer be created without the addition of significant adjustments based on unobservable inputs beginning in July of 2008 and continuing through year-end 2008. |
| • | Finally, a joint statement of the SEC Office of the Chief Accountant and the FASB staff on September 30, 2008 and FASB’s October 10, 2008 issuance of FASB Staff Position (“FSP”) FAS 157-3,Determining the Fair Value of a Financial Asset When the Market for That Asset is Not Active, provided additional guidance on determining fair value of financial assets when the market for such assets is not active. These statements clarified when and how an entity might, given an inactive market, appropriately determine that the use of an income approach valuation technique (present value technique) that maximizes the use of relevant observable inputs and minimizes the use of unobservable inputs may be equally or more representative of fair value than a market approach valuation. |
In the third quarter of 2008, the Company began using a licensed third party model to value bank and insurance trust preferred CDOs. The model uses market-based estimates of expected loss for the individual pieces of underlying collateral to arrive at a pool-level expected loss rate for each CDO. These loss assumptions are applied to the CDO’s structure to generate cash flow projections for each tranche of the CDO. The fair value of each tranche is determined by discounting its resultant loss-adjusted cash flows with appropriate market based discount rates. At December 31, 2008, the discount rate determination referenced several market inputs including current collateralized loan obligation spreads obtained from a third party.
The method for deriving loss expectation for collateral underlying the CDOs depends on whether the collateral is from a public or private company. For public companies, a term structure of Probabilities of Default (“PDs”) is obtained from a commercially available service. The service estimates PDs using a proprietary reduced form model derived using logistic regression on a historical default database. Because the service’s model requires equity valuation related inputs (along with other macro and firm specific inputs) to produce default probabilities, the service does not produce results for private firms and some very small public firms that do not have readily available market data.
For private companies (and the few small public companies not evaluated by the service) PDs are estimated based on credit ratings. The credit ratings come from two external rating sources; one specific to banks, and the other to insurers. The Company has credit ratings for each piece of collateral whether private or public. Using the PD data on the public companies obtained from the commercial service, the Company calculates the average PD for each credit rating level by industry. The rating level average is then applied to all corresponding credits within each rating level that do not have a PD from the commercial service.
The PDs for the underlying collateral are then used to develop CDO deal-level expected loss curves. An external service which models the unique cash-flow waterfall and structure of each CDO deal is used to generate tranche-level cash flows using the Company’s derived CDO deal-level loss assumptions (along with other relevant assumptions). The resultant cash-flows are discounted using current market spreads approximated from related product markets; these spreads differ depending upon the rating agency ratings (usually the Fitch rating) of the CDO, with higher spreads being applied to lower rated CDOs.
The Company did find evidence of one forced trade during the third quarter of 2008 in a tranche of a CDO that is owned by the Company. The forced trade occurred at a price of 35% of face value. This particular deal had amortized down considerably from issuance and the tranche was currently the most senior in the CDO. At the time of the trade the underlying collateral consisted of only five bank obligations and a Freddie Mac zero-coupon principal-only security strip due 2031. Two of the five bank obligations were from Wells Fargo Corporation, which also has publicly available secondary market trading levels on a similar public trust preferred issuance. Even under the assumption that all three of the non-Wells Fargo obligations in the CDO immediately defaulted with no recovery, the projected tranche cash-flows, discounted at the yield of the public Wells Fargo trust preferred issue, resulted in a value of 68% of face value. Based on this analysis, the observed trade at 35% does
not reflect the level at which an informed market participant would value the security. As a comparison, the Company’s model produced a price of 58%. The Company feels that the difference between the model price of 58% and the above outlined scenario price of 68% reflects an appropriate liquidity discount given the lack of activity in CDO markets compared to publicly traded trust preferred markets; this particular security is valued at December 31, 2008 by the Company at 55%.
The following schedule sets forth the sensitivity of the current CDO fair values using an internal model to changes in the most significant assumptions utilized in the model:
Schedule 4
SENSITIVITY OF BANK AND INSURANCE CDO VALUATIONS TO ADVERSE CHANGES OF CURRENT MODEL KEY VALUATION ASSUMPTIONS
| Bank and insurance CDOs at Level 3 | |||||||||||
| (Amounts in millions) | Held-to- maturity | Available- for-sale | |||||||||
Fair value balance at December 31, 2008 | $ | 671 | $ | 638 | |||||||
Expected cumulative credit losses1 | |||||||||||
Weighted average: | |||||||||||
Current defaulted or deferring securities2 | 7.9 | % | 10.0 | % | |||||||
1-year | 12.1 | % | 14.5 | % | |||||||
5-year | 17.7 | % | 20.6 | % | |||||||
30-year | 25.3 | % | 28.6 | % | |||||||
Decrease in fair value due to adverse change | 20 | % | $ | (22.6 | ) | $ | (1.6 | ) | |||
| 50 | % | (61.2 | ) | (4.3 | ) | ||||||
Discount rate3 | |||||||||||
Weighted average spread | 761bp | 311bp | |||||||||
Decrease in fair value due to adverse change | +100 | bp | $ | (64.7 | ) | $ | (67.2 | ) | |||
| +200 | bp | (120.0 | ) | (123.5 | ) | ||||||
1 | The Company uses an expected credit loss model which specifies cumulative losses at the 1-year, 5-year, and 30-year points from the data of valuation. |
2 | Weighted average percentage of collateral that is defaulted due to bank failures or deferring payment as allowed under the terms of security. |
3 | The discount rate is a spread over the LIBOR swap yield curve at the date of valuation. |
The adverse changes in expected cumulative credit losses resulted in a larger decrease in fair value for held-to-maturity (“HTM”) than available-for-sale (“AFS”) securities because the AFS portfolio is composed primarily of more senior CDO tranches. In general these senior tranches receive accelerated principal payments under scenarios of high credit losses provided that the credit losses do not exceed the available subordination in the CDO deal. By contrast more junior tranches which are in our HTM portfolio absorb credit losses and defer principal and interest payments upon increasing credit losses.
Third Party Models
At December 31, 2008, the Company utilized third party valuation services for sixteen securities with an aggregate amortized cost of $151 million in the Asset-Backed Security (“ABS”) CDO and trust preferred asset classes. These securities continued to have insufficient observable market data available to directly determine prices. The Company reviewed the methodologies employed by third party models. This included a review of all relevant data inputs and the appropriateness of key model assumptions. These assumptions included, but were not limited to, probability of default, collateral recovery rates, discount rates, over-collateralization levels, and rating transition probability matrices from rating agencies. The model valuations obtained from third party services
were evaluated for reasonableness including quarter to quarter changes in assumptions and comparison to other available data which included third party and internal model results and valuations. A range of value estimates is not provided because third party vendors utilized point estimates.
Dealer Quotes
The $37 million of asset-backed securities at amortized cost are valued using nonbinding and unadjusted dealer quotes. Multiple quotes are not available and the values provided are based on a combination of proprietary dealer quotes. Broker disclosure levels vary and the Company seeks to minimize dependence on this Level 3 source. Of the $37 million of securities, approximately $18 million are AAA rated.
Monoline CDS Spreads
A total of $72 million at amortized cost of insured securities purchased out of Lockhart were valued using the relevant monoline insurers’ credit derivative levels.
See Note 4 of the Notes to Consolidated Financial Statements and “Investment Securities Portfolio” on page 85 for further information.
Other-than-Temporary-Impairment – Debt Investment Securities
We review investment debt securities on an ongoing basis for the presence of OTTI with formal reviews performed quarterly. OTTI losses on individual investment securities are recognized as a realized loss through earnings when it is probable that the Company will not collect all of the contractual cash flows or the Company is unable to hold the securities to recovery. OTTI losses include credit losses and a discount for liquidity.
The Company’s OTTI evaluation process conforms with the rules contained in Emerging Issues Task Force (“EITF”) Issue No. 99-20,Recognition of Interest Income and Impairment on Purchased and Retained Beneficial Interests in Securitized Financial Assets, FSP No. EITF 99-20-1, Amendments to the Impairment Guidance of EITF Issue No. 99-20, and SFAS No. 115,Accounting for Certain Investments in Debt and Equity Securities. These rules require the Company to take into consideration current market conditions, fair value in relationship to cost, extent and nature of change in fair value, issuer rating changes and trends, volatility of earnings, current analysts’ evaluations, all available information relevant to the collectability of debt securities, our ability and intent to hold investments until a recovery of fair value, which may be maturity, and other factors when evaluating for the existence of OTTI in our securities portfolio.
On January 12, 2009, the FASB issued FSP EITF 99-20-1, Amendments to the Impairment Guidance of EITF Issue No. 99-20. This FSP is effective for interim and annual reporting periods ending after December 15, 2008, and shall be applied prospectively. The FSP amends EITF 99-20 by eliminating the requirement that a holder’s best estimate of cash flows be based upon those that “a market participant” would use. Instead, the FSP requires that OTTI be recognized as a realized loss through earnings when it is “probable” there has been an adverse change in the holder’s estimated cash flows from the cash flows previously projected, which is consistent with the impairment model in SFAS 115.
The Company recognized pretax OTTI losses of $304.0 million during 2008 and $108.6 million during 2007 on investment debt securities. All of the impairment for 2008 related to securities valued using Level 3 inputs. Management estimates that approximately $135 million of the impairment for 2008 related to credit impairment.
The decision to deem these securities OTTI was based on a specific analysis of the structure of each security and an evaluation of the underlying collateral using information and industry knowledge available to the Company. Future reviews for OTTI will consider the particular facts and circumstances during the reporting period in review.
Allowance and Reserve for Credit Losses
Allowance for loan losses
The allowance for loan losses represents our estimate of the losses that are inherent in the loan and lease portfolios. The determination of the appropriate level of the allowance is based on periodic evaluations of the portfolios along with other relevant factors. These evaluations are inherently subjective and require us to make numerous assumptions, estimates and judgments.
In analyzing the adequacy of the allowance for loan losses, we utilize a comprehensive loan grading system to determine the risk potential in the portfolio and also consider the results of independent internal credit reviews. To determine the adequacy of the allowance, the Company’s loan and lease portfolio is broken into segments based on loan type. For commercial loans, we use historical loss experience factors by loan segment, adjusted for changes in trends and conditions, to help determine an indicated allowance for each segment based on individual loan grades. These factors are evaluated and updated using migration analysis techniques and other considerations based on the makeup of the specific portfolio segment. The other considerations used in our analysis include volumes and trends of delinquencies, levels of nonaccrual loans, repossessions and bankruptcies, trends in criticized and classified loans, and expected losses on loans secured by real estate. In addition, new credit products and policies, economic conditions, concentrations of credit risk, and the experience and abilities of lending personnel are also taken into consideration.
In addition to the segment evaluations, nonaccrual loans graded substandard or doubtful with an outstanding balance of $500 thousand or more are individually evaluated in accordance with SFAS No. 114,Accounting by Creditors for Impairment of a Loan,to determine the level of impairment and establish a specific reserve. A specific allowance may also be established for adversely graded loans below $500 thousand when it is determined that the risk associated with the loan differs significantly from the risk factor amounts established for its loan segment and risk grade.
The allowance for consumer loans is determined using historically developed loss experience “roll rates” at which loans migrate from one delinquency level to the next higher level. Using average roll rates for the most recent twelve-month period and comparing projected losses to actual loss experience, the model estimates the expected losses in dollars for the forecasted period. By refreshing the model with updated data, it is able to project losses for a new twelve-month period each month, segmenting the portfolio into nine product groupings with similar risk profiles. This methodology is an accepted industry practice, and the Company believes it has a sufficient volume of information to produce reliable projections.
As a final step to the evaluation process, we perform an additional review of the adequacy of the allowance based on the loan portfolio in its entirety. This enables us to mitigate, but not eliminate, the imprecision inherent in loan- and segment-level estimates of expected credit losses. This review of the allowance includes our judgmental consideration of any adjustments necessary for subjective factors such as economic uncertainties and concentration risks.
There are numerous components that enter into the evaluation of the allowance for loan losses. Some are quantitative while others require us to make qualitative judgments. Although we believe that our processes for determining an appropriate level for the allowance adequately address all of the components that could potentially result in credit losses, the processes and their elements include features that may be susceptible to significant change. Any unfavorable differences between the actual outcome of credit-related events and our estimates and projections could require an additional provision for credit losses, which would negatively impact the Company’s results of operations in future periods. As an example, if a total of $1.0 billion of nonclassified loans were to be immediately classified as special mention, substandard and doubtful in the same proportion as the existing portfolio of the criticized and classified loans, the amount of the allowance for loan losses at December 31, 2008 would increase by approximately $64 million. This sensitivity analysis is hypothetical and has been provided only to indicate the potential impact that changes in the level of the criticized and classified
loans may have on the allowance estimation process. We believe that given the procedures we follow in determining the potential losses in the loan portfolio, the various components used in the current estimation processes are appropriate.
We are in the process of developing potential changes to enhance our methodology for determining the allowance for loan losses. The potential changes include incorporating a two-factor grading system to include probability of default and loss given default. We currently anticipate that these changes will be phased in during 2009. Regardless of the methodology employed, we expect current economic conditions may result in increases to the ALLL throughout 2009.
Reserve for unfunded lending commitments
The Company has historically maintained a reserve for unfunded commitments, recorded in other liabilities. During the fourth quarter of 2008 refinements to this process were implemented to include all unfunded commitments, including the unfunded portions of partially funded credits, which were previously reserved for as part of the allowance for loan losses.
Nonmarketable Equity Securities
The Company either directly, through its banking subsidiaries or through its Small Business Investment Companies (“SBIC”), owns investments in venture funds and other capital securities that are not publicly traded and are not accounted for using the equity method. Since these nonmarketable securities have no readily ascertainable fair values, they are reported at amounts we have estimated to be their fair values. In estimating the fair value of each investment, we must apply judgment using certain assumptions. Initially, we believe that an investment’s cost is the best indication of its fair value, provided that there have been no significant positive or negative developments subsequent to its acquisition that indicate the necessity of an adjustment to a fair value estimate. If and when such an event takes place, we adjust the investment’s cost by an amount that we believe reflects the nature of the event. In addition, any minority interests in the Company’s SBICs reduce its share of any gains or losses incurred on these investments.
As of December 31, 2008, the Company’s total investment in nonmarketable equity securities not accounted for using the equity method was $133.0 million, of which its equity exposure to investments held by the SBICs, net of related minority interest of $26.4 million, was $39.2 million. In addition, exposure to non-SBIC equity investments not accounted for by the equity method was $67.4 million.
The values we have assigned to these securities where no market quotations exist are based upon available information and may not necessarily represent amounts that ultimately will be realized on these securities. Key information used in valuing these securities include the projected financial performance of these companies, the evaluation of the investee company’s management team, and other industry, economic and market factors. If there had been an active market for these securities, the carrying value may have been significantly different from the amounts reported. In addition, since Zions Bank and Amegy are the principal business segments holding these investments, they would experience the largest impact of any changes in the fair values of these securities.
Accounting for Goodwill
Goodwill arises from business acquisitions and represents the value attributable to the unidentifiable intangible elements in our acquired businesses. Goodwill is initially recorded at fair value and is subsequently evaluated at least annually for impairment in accordance with SFAS No. 142,Goodwill and Other Intangible Assets. The Company performs this annual test as of October 1 of each year. Evaluations are also performed on a more frequent basis if events or circumstances indicate impairment could have taken place. Such events could include, among others, a significant adverse change in the business climate, an adverse action by a regulator, an unanticipated change in the competitive environment, and a decision to change the operations or dispose of a reporting unit.
The first step in this evaluation process is to determine if a potential impairment exists in any of the Company’s reporting units and, if required from the results of this step, a second step measures the amount of any impairment loss. The computations required by steps 1 and 2 require us to make a number of estimates and assumptions. In completing step 1, we determine the fair value of the reporting unit that is being evaluated. In determining the fair value, we generally calculate value using a combination of up to three separate methods: comparable publicly traded financial service companies in the Western and Southwestern states; comparable acquisitions of financial services companies in the Western and Southwestern states; and the discounted present value of management’s estimates of future cash or income flows. Critical assumptions that are used as part of these calculations include:
selection of comparable publicly traded companies, based on location, size, and business composition;
selection of market comparable acquisition transactions, based on location, size, business composition, and date of the transaction;
the discount rate applied to future earnings, based on an estimate of the cost of capital;
the potential future earnings of the reporting unit;
the relative weight given to the valuations derived by the three methods described;
the control premium associated with reporting units.
We use a similar methodology in evaluating impairment in nonbank subsidiaries but generally use companies and acquisition transactions nationally in the analysis.
If step 1 indicates a potential impairment of a reporting unit, step 2 requires us to estimate the “implied fair value” of the goodwill of the reporting unit. This process estimates the fair value of the unit’s individual assets and liabilities in the same manner as if a purchase of the reporting unit were taking place. To do this, we must determine the fair value of the assets, liabilities and identifiable intangible assets of the reporting unit based upon the best available information. We estimate the fair market value of all of the tangible assets, identifiable intangible assets and liabilities of the associated reporting units in accordance with the principals of SFAS 157. Loans, deposits with maturities, and debt are fair valued using standard software and assumptions used by Zions in its interest rate risk management processes and using other estimates such as credit assumptions to comply with SFAS 157. Deposits with no maturities are valued at book value. Larger occupied properties are appraised, while for smaller properties and furniture, fixtures and equipment, it is assumed that depreciated book value approximates fair market value. If the implied fair value of goodwill calculated in step 2 is less than the carrying amount of goodwill for the reporting unit, an impairment is indicated and the carrying value of goodwill is written down to the calculated value.
The Company applies a control premium to the market comparables pricing metrics used in the model to determine the reporting units’ equity values. Control premiums represents the ability of a controlling shareholder to benefit from synergies and other intangible assets that arise from control that might cause the fair value of a reporting unit as a whole to exceed its market capitalization. Based on a review of recent bank transactions within the Company’s geographic footprint, comparing market values 30 days prior to the announced transaction to the deal value, the Company determined that a control premium of 25% was appropriate.
Since estimates are an integral part of the impairment computations, changes in these estimates could have a significant impact on any calculated impairment amount. Factors that may significantly affect the estimates include, among others, competitive forces, customer behaviors and attrition, changes in revenue growth trends, cost structures and technology, changes in discount rates, changes in stock and mergers and acquisitions market values, and changes in industry or market sector conditions.
During the fourth quarter of 2008, we performed our annual goodwill impairment evaluation for the entire organization, effective October 1, 2008, and we also rolled forward our goodwill impairment evaluation to December 31, 2008 due to Company’s performance deterioration and market decline from October 1, 2008. This
roll-forward resulted in the recognition of additional impairment in the fourth quarter, compared to the impairment if only the October 1 analysis had been used. Step 1 was performed by using both market value and transaction value approaches for all reporting units and, in certain cases, the discounted cash flow approach was also used. In the market value approach, we identified a group of publicly traded banks using primarily size, location and business mix compared to Zions’ subsidiary banks. We then used valuation multiples, including a control premium, developed from this group to apply to our subsidiary banks. In the transaction value approach, we reviewed the purchase price paid in recent mergers and acquisitions of banks similar in size, location and business mix to Zions’ subsidiary banks. From these purchase prices we developed a set of valuation multiples, which we applied to our subsidiary banks. In instances where the discounted cash flow approach was used, we discounted projected cash flows to their present value to arrive at our estimate of fair value.
Upon completion of step 1 of the evaluation process, we concluded that potential impairment existed at the Company’s NBA, Vectra, NSB, and P5 reporting units. Step 2 was completed with the assistance of an independent valuation consultant and the Company’s internal valuation resources and resulted in $353.8 million of impairment losses. All the goodwill associated with NBA, Vectra and NSB and essentially all the goodwill at P5 was determined to be impaired. This evaluation process required us to make estimates and assumptions with regard to the fair value of the Company’s reporting units and actual values may differ significantly from these estimates. Such differences could result in future impairment of goodwill that would, in turn, negatively impact the Company’s results of operations and the business segments where the goodwill is recorded. Significant remaining amounts of goodwill at December 31, 2008 were as follows: Amegy – $1,249 million, CB&T – $379 million, and Zions Bank – $20 million.
At December 31, 2008, the Company’s book value exceeded the market value by approximately $2.1 billion. The Company reconciled book equity and market equity values as of December 31, 2008 in our year-end evaluation of any potential additional impairment by attempting to identify items priced into the market equity value but not in the book value of the Company. These reconciling items were based on market expectation of fair value between book and market equity including discounts to the loan portfolio, the Company’s exposure to Lockhart holding unrealized losses related to the off-balance sheet securities, and unrecognized and unrealized losses related to HTM securities held on balance sheet. We believe applying a 25% control premium associated with Company or reporting units and the above mentioned factors explains the $2.1 billion difference between book and market equity values.
We expect that the current disrupted market conditions may require us to evaluate goodwill more frequently, including quarterly, as the circumstances warrant. Any differences between estimated fair values and carrying values could result in future impairment of goodwill.
Accounting for Derivatives
Our interest rate risk management strategy involves hedging the repricing characteristics of certain assets and liabilities so as to mitigate adverse effects on the Company’s net interest margin and cash flows from changes in interest rates. While we do not participate in speculative derivatives trading, we consider it prudent to use certain derivative instruments to add stability to the Company’s interest income and expense, to modify the duration of specific assets and liabilities, and to manage the Company’s exposure to interest rate movements.
Additionally, the Company executes derivative instruments, including interest rate swaps and options, forward currency exchange contracts, and energy commodity swaps, with commercial banking customers to facilitate their respective risk management strategies. Those derivatives are immediately hedged by offsetting derivative contracts, such that the Company minimizes its net risk exposure resulting from such transactions. The Company does not use credit default swaps in its investment or hedging operations.
As of December 31, 2008, the recorded amounts of derivative assets, classified in other assets, and derivative liabilities, classified in other liabilities, were $642.3 million and $178.1 million, respectively. When quoted market prices are not available, the valuation of derivative instruments is determined using widely
accepted valuation techniques including discounted cash flow analysis on the expected cash flows of each derivative. This analysis reflects the contractual terms of the derivatives, including the period to maturity, and uses observable market-based inputs, including interest rate curves, foreign exchange rates, commodity prices, and implied volatilities. The estimates of fair value are made by an independent third party using a standardized methodology that nets the discounted expected future cash receipts and cash payments (based on observable market inputs). These future net cash flows, however, are susceptible to change due primarily to fluctuations in interest rates (most significantly), foreign exchange rates, and commodity prices. As a result, the estimated values of these derivatives will change over time as cash is received and paid and also as market conditions change. As these changes take place, they may have a positive or negative impact on our estimated valuations. Based on the nature and limited purposes of the derivatives that the Company employs, fluctuations in interest rates have only had a modest effect on its results of operations. As such, fluctuations are generally expected to be countered by offsetting changes in income, expense and/or values of assets and liabilities. However, the Company retains basis risk due to changes between the prime rate and LIBOR on nonhedge derivative basis swaps.
In addition to making the valuation estimates, we also face the risk that certain derivative instruments that have been designated as hedges and currently meet the strict hedge accounting requirements of SFAS 133, may not qualify in the future as “highly effective,” as defined by the Statement, as well as the risk that hedged transactions in cash flow hedging relationships may no longer be considered probable to occur. During 2006, no hedge ineffectiveness was required to be reported in earnings on the Company’s cash flow hedging relationships. Further, new interpretations and guidance related to SFAS 133 continue tomay be issued in the future, and we cannot predict the possible impact that they willsuch guidance may have on our use of derivative instruments in the future.
going forward.
Although the majority of the Company’s hedging relationships have been designated as cash flow hedges, for which hedge effectiveness is assessed and measured using a “long haul” approach, the Company also had five fair value hedging relationships outstanding as of December 31, 20062008 that were designated using the “shortcut” method, as described in SFAS 133, paragraph 68. The Company believes that the shortcut method continues to be appropriate for those hedges because we have precisely complied with the documentation requirements and each of the applicable shortcut criteria described in paragraph 68. During 2008, an immaterial amount of hedge ineffectiveness was required to be reported in earnings on the Company’s outstanding cash flow hedging relationships. In addition, the Company reclassified a loss of $1.7 million from other comprehensive income to earnings during 2008, as the hedged forecasted transactions related to certain terminated cash flow hedging relationships became probable not to occur. This loss is included in fair value and nonhedge derivative income (loss).
Derivative contracts can be exchange-traded or over-the-counter (“OTC”). The Company’s exchange-traded derivatives consist of forward currency exchange contracts, which are part of the Company’s services provided to commercial customers. Exchange-traded derivatives are classified as Level 1 in the fair value hierarchy, as the values of these derivatives are obtained from quoted prices in active markets for identical contracts.
The Company’s OTC derivatives consist of interest rate swaps and options, as well as energy commodity derivatives for customers. The Company has classified its OTC derivatives in Level 2 of the fair value hierarchy, as the significant inputs to the overall valuations are based on market-observable data or information derived from or corroborated by market-observable data, including market-based inputs to models, model calibration to market-clearing transactions, broker or dealer quotations, or alternative pricing sources with reasonable levels of price transparency. Where models are used, the selection of a particular model to value an OTC derivative depends upon the contractual terms of, and specific risks inherent in, the instrument as well as the availability of pricing information in the market. The Company generally uses similar models to value similar instruments. Valuation models require a variety of inputs, including contractual terms, market prices, yield curves, credit curves, measures of volatility, and correlations of such inputs. For OTC derivatives that trade in liquid markets, such as generic forwards, swaps and options, model inputs can generally be verified and model selection does not involve significant management judgment.
To comply with the provisions of SFAS 157, the Company incorporates credit valuation adjustments to appropriately reflect both its own nonperformance risk and the respective counterparty’s nonperformance risk in
Pension Accounting
As explained in detail in Note 20the fair value measurements of its OTC derivatives. The credit valuation adjustments are calculated by determining the total expected exposure of the Notesderivatives (which incorporates both the current and potential future exposure) and then applying each counterparty’s credit spread to Consolidated Financial Statements, we have a noncontributory defined benefit pension plan thatthe applicable exposure. For derivatives with two-way exposure, such as interest rate swaps, the counterparty’s credit spread is availableapplied to employees who have met specific eligibility requirements. Also as explainedthe Company’s exposure to the counterparty, and the Company’s own credit spread is applied to the counterparty’s exposure to the Company, and the net credit valuation adjustment is reflected in the Note,Company’s derivative valuations. The total expected exposure of a derivative is derived using market-observable inputs, such as of January 1, 2003, no new employees are eligible to participateyield curves and volatilities. For the Company’s own credit spread and for counterparties having publicly available credit information, the credit spreads over LIBOR used in the plancalculations represent implied credit default swap spreads obtained from a third party credit data provider. For counterparties without publicly available credit information, which are primarily commercial banking customers, the credit spreads over LIBOR used in the calculations are estimated by the Company based on current market conditions, including consideration of current borrowing spreads for similar customers and future benefit accruals were eliminated for most participants.
transactions, review of existing collateralization or other credit enhancements, and changes in credit sector and entity-specific credit information. In accounting for the plan, we must determine the obligation associated with the plan benefits and compare that with the assets that the plan owns. This requires us to incorporate numerous assumptions, including the expected rate of return on plan assets, the projected rate of increase of the salaries of the eligible employees and the discount rates to use in estimatingadjusting the fair value of its derivative contracts for the liability. The expected rateeffect of return on plan assets is intended to approximatenonperformance risk, the long-term rateCompany has considered the impact of return that we anticipate receiving onnetting and any applicable credit enhancements, such as collateral postings, current threshold amounts, mutual puts, and guarantees. Additionally, the plan’s investments, consideringCompany actively monitors counterparty credit ratings for significant changes.
As of December 31, 2008, the mixnet credit valuation adjustments reduced the settlement values of the Company’s derivative assets and liabilities by $12.5 million and $5.0 million, respectively. During 2008, the Company recognized a loss of $3.1 million related to credit valuation adjustments on nonhedge derivative instruments, which is included in noninterest income. Various factors impact changes in the credit valuation adjustments over time, including changes in the credit spreads of the parties to the contracts, as well as changes in market rates and volatilities, which affect the total expected exposure of the derivative instruments.
Although the Company has determined that the plan holds as investments, the expected return of those underlying investments, the diversification of those investments, and the re-balancing strategy employed. The projected rates of salary increases are management’s estimate of future pay increases that the remaining eligible employees will receive until their retirement. The discount rate reflects the yields available on long-term, high-quality fixed-income debt instruments with cash flows similar to the obligationsmajority of the plan, reset annually on the measurement date, which is December 31inputs used to value its derivatives fall within Level 2 of each year.
The annual pension expense is sensitive to the expected rate of return on plan assets. For example, for the year 2006 the expected rate of return on plan assets was 8.50%. For each 25 basis point change in this rate, the Company’s pension expense would change by approximately $300 thousand. In applying the expected rate of return on plan assets to our pension accounting, we base our calculations on the fair value hierarchy, the credit valuation adjustments associated with its derivatives utilize Level 3 inputs, such as estimates of plan assets, using an arithmetic methodcurrent credit spreads to calculateevaluate the expected returnlikelihood of default by itself and its counterparties. However, as of December 31, 2008, the Company has assessed the significance of the impact of the credit valuation adjustments on the plan assets.
The annual pension expense isoverall valuation of its derivative positions and has determined that the credit valuation adjustments are not significantly sensitivesignificant to the projected rateoverall valuation of increaseits derivatives. As a result, the Company has classified its OTC derivative valuations in Level 2 of salaries of the eligible employees. This is due to the limited number of employees who continue to actively accrue benefits within the plan.
The annual pension expense is also sensitive to the discount rate employed. For example, the discount rate used in the 2006 pension expense calculation was 5.60%. If this rate were 25 basis points lower, the pension expense would increase by approximately $280 thousand. If the rate were 25 basis points higher, the pension expense would decrease by approximately $270 thousand.
In estimating the annual pension expense and funded status associated with the defined benefit plan, we must make a number of assumptions and estimates based upon our judgment and also on information that we receive from an independent actuary. These assumptions and estimates are closely monitored and are reviewed at least annually for any adjustments that may be required.
In addition, we assumed obligations of a defined benefit plan when we acquired Amegy. That plan resulted from a previous acquisition by Amegy. The plan is also frozen and we are in the process of terminating it. The planned termination was considered in remeasuring the acquired plan projected benefit obligation at the date of the Amegy acquisition. The acquired plan projected benefit obligation exceeded the fair value hierarchy.
When appropriate, valuations are also adjusted for various factors such as liquidity and bid/offer spreads, which factors were deemed immaterial by the Company as of the plan assets by $2.1 million and was recorded as part of the purchase price allocation.
December 31, 2008.
Share-Based Compensation
As discussed in Note 17 of the Notes to Consolidated Financial Statements, effective January 1, 2006, we adopted SFAS No. 123R,123(R),Share-Based Payment, which requires all share-based payments to employees, including grants of employee stock options, to be recognized in the statement of income based on their fair values. SFAS 123R utilizes a “modified grant-date” approach in which the fair value of an equity award is estimated on the grant date without regard to service or performance vesting conditions. While under prior guidance we elected not to expense share-based compensation, we have disclosed in Note 17 the pro forma effect on net income as if our share-based compensation had been expensed.
We adopted SFAS 123R using the “modified prospective” transition method. Under this transition method, compensation expense is recognized beginning January 1, 2006 based on the requirements of SFAS 123R for all share-based payments granted after December 31, 2005, and based on the requirements of SFAS 123 for all awards granted to employees prior to January 1, 2006 that remain unvested as of that date. Results of operations for prior years have not been restated.
The Company has used the Black-Scholes option-pricing model to estimate the value of stock options for all stock option grants prior to 2007 and the pro forma expense for share-based compensation.off cycle stock option grants during 2007 and 2008. The assumptions used to apply this model include a weighted average risk-free interest rate, a weighted average expected life, an expected dividend yield, and an expected volatility. Use of these assumptions is subjective and requires judgment as described in Note 17.
From April 24–25, 2008, the Company successfully conducted an auction of its Employee Stock Option Appreciation Rights Securities (“ESOARS”). As allowed by SFAS 123(R), the Company used the results of that auction to value its primary grant of employee stock options issued on April 24, 2008. The value established was $5.73 per option, which the Company estimates is approximately 24% below its Black-Scholes model valuation
The most significant assumptions impacted by management’s judgment are the weighted average expected life and the expected volatility.
on that date. The Company performedrecorded the related estimated future settlement obligation of ESOARS as a sensitivity analysisliability in the balance sheet. The 2008 stock option expense for these grants was $2.2 million. If the ESOARS value was 10% lower, the expense would be $2.0 million and if the ESOARS value was 10% higher, the expense would be $2.4 million. Additionally, the primary grant of options in 2007 was valued with the results of an ESOARS auction in 2007. The number of stock options granted at the primary grant date on May 4, 2007 and April 24, 2008 were 963,680 and 1,542,238, respectively, or 91.4% and 60.8% of the impact of increasing and decreasing expected volatility 10% as well as the impact of increasing and decreasing the weighted average expected life by one year. The Company performed this analysis on thetotal stock options granted in 2006.2007 and 2008, respectively.
On October 22, 2007, the Company announced it had received notification from the SEC that its ESOARS are sufficiently designed as a market-based method for valuing employee stock options under SFAS 123(R). The following table shows the impact of these changes onSEC staff did not object to the Company’s view that the market-clearing price of ESOARS in the Company’s auction was a reasonable estimate of the fair value of the underlying employee stock options.
The accounting for stock option expense for the options granted in 2006:
SCHEDULE 5
SENSITIVITY OF BLACK-SCHOLES ASSUMPTIONS ON STOCK OPTION EXPENSE
(In thousands)
| |||
| |||
| |||
| |||
| |||
|
The adoption of SFAS 123R123(R) decreased income before income taxes by $17.5$13.1 million and net income by approximately $12.6$9.2 million for 2006,2008, or $0.12$0.08 per diluted share. See Note 17 for additional information on stock options and restricted stock.
Income Taxes
The Company is subject to the income tax laws of the United States, its states and other jurisdictions where it conducts business. These laws are complex and subject to different interpretations by the taxpayer and the various taxing authorities. In determining the provision for income taxes, management must make judgments and estimates about the application of these inherently complex laws, related regulations, and case law. In the process of preparing the Company’s tax returns, management attempts to make reasonable interpretations of the tax laws. These interpretations are subject to challenge by the tax authorities upon audit or to reinterpretationre-interpretation based on management’s ongoing assessment of facts and evolving case law.
On a quarterly basis, management assesses the reasonableness of its effective tax rate based upon its current best estimate of net income and the applicable taxes expected for the full year. Deferred tax assets and liabilities are also reassessed on a quarterly basis if business events or circumstances warrant. Reserves for contingent tax liabilities are reviewed quarterly for adequacy based upon developments in tax law and the status of examinations or audits. During 2008, the Company reduced its liability for unrecognized tax benefits by approximately $9.6 million, net of any federal and/or state tax benefits. Of this reduction, $5.2 million decreased the Company’s tax provision for 2008 and $4.4 million reduced tax-related balance sheet accounts. The Company has tax reserves at December 31, 20062008 of approximately $39$6.6 million, net of federal and/or state benefits, for uncertain tax positions primarily for various state tax contingencies in several jurisdictions.
Pending Adoption of Accounting Pronouncements
In July 2006,December 2007, the FASB issued SFAS No. 141 (revised 2007),Business Combinations (“141(R)”), which replaces SFAS No. 141,Business Combinations. SFAS 141(R) establishes principles and requirements for how an acquirer recognizes and measures in its financial statements the identifiable assets acquired, the liabilities assumed, any resulting goodwill, and any noncontrolling interest in the acquiree. SFAS 141(R) will require the Company to record fair value estimates of contingent consideration and certain other potential liabilities during the original purchase price allocation, expense acquisition costs as incurred, and does not permit certain restructuring activities previously allowed under EITF Issue No. 95-3,Recognition of Liabilities in Connection with a Purchase Business Combination,to be recorded as a component of purchase accounting. SFAS 141(R) also provides for disclosures to enable users of the financial statements to evaluate the nature and financial effects of the business combination. SFAS 141(R) is effective for the first annual reporting period beginning on or after December 15, 2008 and must be applied prospectively to business combinations completed on or after that date. The Company will adopt SFAS 141(R) as of January 1, 2009, as required. We have not determined the effect that the adoption of SFAS 141(R) will have on our consolidated financial statements, but the effect will generally be limited to future acquisitions in 2009, except for certain tax treatment of previous acquisitions.
SFAS 141(R) amended SFAS No. 109,Accounting for Income Taxes, and FASB Interpretation (“FIN”) No. 48, (“FIN 48”),Accounting for Uncertainty in Income Taxes. Previously, SFAS 109 and FIN 48, respectively, generally required post-acquisition adjustments to business combination related deferred tax asset valuation allowances and liabilities related to uncertain tax positions to be recorded as an interpretationincrease or decrease to goodwill. SFAS 141(R) does not permit this accounting and generally will require any such changes to be recorded in current period income tax expense. Thus, after SFAS 141(R) is adopted, all changes to valuation allowances and liabilities related to uncertain tax positions established in acquisition accounting (whether the combination was accounted for under SFAS 141 or SFAS 141(R)) must be recognized in current period income tax expense.
In December 2007, the FASB issued SFAS No. 160, Noncontrolling Interests in Consolidated Financial Statements – an amendment of Accounting Research Bulletin No. 51, which establishes accounting and reporting standards for noncontrolling interests (“minority interests”) in subsidiaries. SFAS 160 clarifies that a noncontrolling interest in a subsidiary should be accounted for as a component of equity (separate) from the parent’s equity, rather than in the liability or mezzanine section between liabilities and equity. Upon adoption, at December 31, 2008 and 2007 the Company will reclassify $27.3 million and $30.9 million respectively, from minority interest to a new line item, noncontrolling interests, to be in included in shareholders’ equity. Additionally, SFAS 160 requires consolidated net income to be reported at amounts that include the amounts attributable to both the parent and the noncontrolling interest. SFAS 160 also requires disclosure, on the face of the consolidated statement of income, of the amounts of consolidated net income attributable to the parent and to the noncontrolling interest. Currently, net income attributable to the noncontrolling interest generally is reported as an expense or other deduction in arriving at consolidated net income. SFAS 160 is effective for the first annual reporting period beginning on or after December 15, 2008 and must be applied prospectively, except for the presentation and disclosure requirements, which will apply retrospectively. The Company will adopt SFAS 160 as of January 1, 2009, as required. Other than the reclassification described above, the Company does not anticipate that SFAS 160 will have a material effect on the Company’s consolidated financial statements.
In February 2008, the FASB issued FASB Staff Position No. FAS 157-2, Effective Date of FASB Statement No. 109, Accounting for Income Taxes157,. Under which defers the guidanceeffective date of FIN 48, management estimates that these reserves may decrease by approximately $9 millionSFAS 157 to $13 million,fiscal years beginning after November 15, 2008, with respect to nonfinancial assets and nonfinancial liabilities which is subjectare not recognized or disclosed at fair value in the financial statements on a recurring basis. Therefore, we have deferred application of SFAS 157 to revision when management completessuch nonfinancial assets and nonfinancial liabilities until January 1, 2009.
In March 2008, the FASB issued SFAS No. 161,Disclosures about Derivative Instruments and Hedging Activities an analysisamendment of FASB Statement No. 133, which establishes enhanced disclosures about an entity’s derivative and hedging activities. SFAS 161 requires contextual discussion of the impactobjectives and strategies for using derivative instruments for risk management purposes in terms of FIN 48. As required by FIN 48 upon adoptionprimary underlying risk, disclosure of volume of derivative activity, and enhanced credit risk disclosures. Also, SFAS 161 requires additional tabular disclosures of fair value amounts, financial performance, financial position, and gains and losses on derivative and related hedged items. The Company will adopt SFAS 161 as of January 1, 2007, this difference2009, as required.
In June 2008, the FASB issued FSP No. EITF 03-6-1,Determining Whether Instruments Granted in Share-Based Payment Transactions Are Participating Securities. This FSP was issued to clarify that unvested share-based payment awards with a right to receive nonforfeitable dividends are participating securities. This FSP also provides guidance on how to allocate earnings to participating securities and compute basic earnings per share using the two-class method. This FSP is effective for fiscal years beginning after December 15, 2008, and interim periods within those fiscal years. The Company will be recorded in retained earningsadopt the FSP as a cumulative effect adjustment. See Note 15 of the Notes to Consolidated Financial Statements for additional information on income taxes.January 1, 2009, as required.
RESULTS OF OPERATIONS
As previously disclosed, the Company completed its acquisition of Amegy Bancorporation, Inc. in December 2005. All comparisons of 2006 to 2005 and prior periods reflect the effects of the Amegy acquisition.
Net Interest Income, Margin and Interest Rate Spreads
Net interest income is the difference between interest earned on assets and interest incurred on liabilities. Taxable-equivalent net interest income is the largest component of Zions’ revenue. For the year 2006,2008, it was 76.4%91.3% of our taxable-equivalent revenues, compared to 76.0%82.2% in 2007 and 76.4% in 2006. The increased
percentage for 20052008 and 73.3% in 2004.2007 was mainly due to the impairment and valuation losses on securities which reduced total taxable-equivalent revenues by $317.1 million and $158.2 million, respectively. On a taxable-equivalent basis, net interest income for 20062008 was up $406.6$87.3 million or 29.4%4.6% from 2005,2007, which was up $200.3$119.1 million or 16.9%6.7% from 2004.2006. The increase in taxable-equivalent net interest income for 20062008 and 2007 was mainly due to increased interest-earning assets driven by the significant increase in both earning assets and core deposits resulting from the Amegy acquisition, strong organic loan growth and the impactpartially offset by declines of increasing short-term interest rates on Zions’ asset-sensitive balance sheet, which resulted in a 525 basis point increasepoints in the net interest margin compared to 2005. The net interest margin for 2005 was up 312008 and 20 basis points from 2004.during 2007. The incremental tax rate used for calculating all taxable-equivalent adjustments was 35% for all years discussed and presented.
By its nature, net interest income is especially vulnerable to changes in the mix and amounts of interest-earning assets and interest-bearing liabilities. In addition, changes in the interest rates and yields associated with these assets and liabilities significantly impact net interest income. See “Interest Rate and Market Risk Management” on page 86110 for a complete discussion of how we manage the portfolios of interest-earning assets and interest-bearing liabilities and associated risk.
A gauge that we consistently use to measure the Company’s success in managing its net interest income is the level and stability of the net interest margin. The net interest margin was 4.18% in 2008 compared with 4.43% in 2007 and 4.63% in 2006 compared with 4.58% in 20052006. For the fourth quarter of 2008, the Company’s net interest margin was 4.20%, which benefited primarily from the capital investment from the U.S. Treasury, reduced deposit rates, and 4.27% in 2004. significantly lower borrowing costs.
The slightly increaseddecreased net interest margin for 2006 results mainly2008 compared to 2007 resulted from an improved earningincreased nonperforming assets reducing average asset mixyields, loan yields dropping more than deposit rates, a decline in noninterest-bearing demand deposits, competitive pricing pressures, and frompurchases of low yielding Lockhart commercial paper. Average loans and leases increased $4.2 billion and average money market investments increased $1.1 billion due to the impact of increasing short-term interest rates on Zions’ asset-sensitive balance sheet. In addition we significantly improved Amegy’s pre-acquisition earning asset mixthe capital investment from the U.S. Treasury and net interestpurchases of commercial paper from Lockhart. Average interest-bearing deposits increased $2.0 billion from 2007, with the increase being driven primarily by higher cost Internet money market, brokered deposits and foreign deposits. Average borrowed funds increased $3.0 billion compared to 2007 primarily due to increased borrowing from the Federal Home Loan Bank (“FHLB”) and the Federal Reserve. Average noninterest-bearing deposits declined $257 million compared to 2007 and were 24.3% of total average deposits for 2008, compared to 26.2% for 2007.
The margin compression for 2007 compared to 2006 resulted from the Company’s strong loan growth being funded mainly by applying Zions interest rate risk management strategies.higher cost deposit products and nondeposit borrowings, a decline in noninterest-bearing demand deposits, competitive pricing pressures, and purchases of Lockhart commercial paper. Higher yielding average loans and leases increased $8.4$4.4 billion from 2005 while lower yielding average money market investments and securities increased $128 million. For the fourth quarter of 2006 the Company’s net interest margin was 4.60%. However the Company’s funding mix actually shifted in an unfavorable direction in 2006 as core deposit growth slowed and earning asset growth was funded from more expensive sources. For example, average noninterest-bearing deposits were 29.8% of total average deposits for 2005, compared to 29.0% for 2006. Over the same period, average time deposits greater than $100,000 increased from 6.9% to 10.0% of total average deposits.
The increased margin for 2005 compared to 2004 resulted mainly from an improved asset and liability mix and from the impact of increasing short-term interest rates on Zions’ asset-sensitive balance sheet. Higher yielding average loans and leases increased $3.0 billion from 2004 while lower yielding average money market investments and securities decreased $0.5 billion. The netslightly by $32.4 million. Average interest-bearing deposits increased $3.2 billion from 2006 with most of the increase in interest-earnings assets was mainly funded by increases in lowerhigher cost average interest-bearing deposits which increased $1.6 billionInternet money market, time and average noninterest-bearing deposits which increased $1.1 billion, while averageforeign deposits. Average borrowed funds decreased $0.5 billion from 2004.increased $850 million compared to 2006.
The Company expects to continue its efforts to maintain a slightly “asset-sensitive” position with regard to interest rate risk. However, our estimates of the Company’s actual position are highly dependent upon changes in both short-term and long-term interest rates, modeling assumptions, and the actions of competitors and customers in response to those changes.
Throughout 2008, the FRB lowered the federal funds rate seven times by approximately 400 basis points. This decrease had a rapid impact on loans tied to LIBOR and the prime rate as these rates were lowered. Competitive pressures on deposit rates impeded our ability to fully reprice deposits as the FRB lowered rates, and rates paid to consumers for their deposits were lowered less than 400 basis points. This rate compression between loans and deposits had a negative impact on the net interest margin during 2008. We expect that these competitive pricing pressures may continue into 2009. See “Interest Rate Risk” on page 111 for further information.
Schedule 65 summarizes the average balances, the amount of interest earned or incurred and the applicable yields for interest-earning assets and the costs of interest-bearing liabilities that generate taxable-equivalent net interest income.
SCHEDULE 6Schedule 5
DISTRIBUTION OF ASSETS, LIABILITIES, AND SHAREHOLDERS’ EQUITY
AVERAGE BALANCE SHEETS, YIELDS AND RATES
| 2006 | 2005 | 2008 | 2007 | |||||||||||||||||||||||||||||
| (Amounts in millions) | Average balance | Amount of interest(1) | Average rate | Average balance | Amount of interest(1) | Average rate | Average balance | Amount of interest1 | Average rate | Average balance | Amount of interest1 | Average rate | ||||||||||||||||||||
ASSETS: | ||||||||||||||||||||||||||||||||
Money market investments | $ | 479 | 24.7 | 5.16% | $ | 988 | 31.7 | 3.21% | $ | 1,889 | 47.8 | 2.53 | % | $ | 834 | 43.7 | 5.24 | % | ||||||||||||||
Securities: | ||||||||||||||||||||||||||||||||
Held to maturity | 645 | 44.1 | 6.83 | 639 | 44.2 | 6.93 | ||||||||||||||||||||||||||
Available for sale | 4,992 | 285.5 | 5.72 | 4,021 | 207.7 | 5.16 | ||||||||||||||||||||||||||
Held-to-maturity | 1,516 | 101.3 | 6.68 | 684 | 47.7 | 6.97 | ||||||||||||||||||||||||||
Available-for-sale | 3,266 | 162.1 | 4.97 | 4,661 | 269.2 | 5.78 | ||||||||||||||||||||||||||
Trading account | 157 | 7.7 | 4.91 | 497 | 19.9 | 4.00 | 43 | 1.9 | 4.41 | 61 | 3.3 | 5.40 | ||||||||||||||||||||
Total securities | 5,794 | 337.3 | 5.82 | 5,157 | 271.8 | 5.27 | 4,825 | 265.3 | 5.50 | 5,406 | 320.2 | 5.92 | ||||||||||||||||||||
Loans: | ||||||||||||||||||||||||||||||||
Loans held for sale | 261 | 16.5 | 6.30 | 205 | 9.8 | 4.80 | 182 | 10.1 | 5.52 | 233 | 14.9 | 6.37 | ||||||||||||||||||||
Net loans and leases(2) | 32,134 | 2,463.9 | 7.67 | 23,804 | 1,618.0 | 6.80 | ||||||||||||||||||||||||||
Net loans and leases2 | 40,795 | 2,674.4 | 6.56 | 36,575 | 2,852.7 | 7.80 | ||||||||||||||||||||||||||
Total loans and leases | 32,395 | 2,480.4 | 7.66 | 24,009 | 1,627.8 | 6.78 | 40,977 | 2,684.5 | 6.55 | 36,808 | 2,867.6 | 7.79 | ||||||||||||||||||||
Total interest-earning assets | 38,668 | 2,842.4 | 7.35 | 30,154 | 1,931.3 | 6.40 | 47,691 | 2,997.6 | 6.29 | 43,048 | 3,231.5 | 7.51 | ||||||||||||||||||||
Cash and due from banks | 1,476 | 1,123 | 1,380 | 1,477 | ||||||||||||||||||||||||||||
Allowance for loan losses | (349) | (285) | (546 | ) | (391 | ) | ||||||||||||||||||||||||||
Goodwill | 1,887 | 746 | 1,937 | 2,005 | ||||||||||||||||||||||||||||
Core deposit and other intangibles | 181 | 66 | 137 | 181 | ||||||||||||||||||||||||||||
Other assets | 2,379 | 1,799 | 3,163 | 2,527 | ||||||||||||||||||||||||||||
Total assets | $ | 44,242 | $ | 33,603 | $ | 53,762 | $ | 48,847 | ||||||||||||||||||||||||
LIABILITIES: | ||||||||||||||||||||||||||||||||
Interest-bearing deposits: | ||||||||||||||||||||||||||||||||
Savings and NOW | $ | 5,129 | 75.3 | 1.47 | $ | 4,347 | 36.7 | 0.84 | $ | 4,446 | 35.6 | 0.80 | $ | 4,443 | 41.4 | 0.93 | ||||||||||||||||
Money market | 10,721 | 330.0 | 3.08 | 9,131 | 183.9 | 2.01 | 13,739 | 335.0 | 2.44 | 11,962 | 437.9 | 3.66 | ||||||||||||||||||||
Time under $100,000 | 2,065 | 77.4 | 3.75 | 1,523 | 41.7 | 2.74 | 2,695 | 96.2 | 3.57 | 2,529 | 110.7 | 4.38 | ||||||||||||||||||||
Time $100,000 and over | 3,272 | 142.6 | 4.36 | 1,713 | 54.7 | 3.19 | 4,382 | 161.9 | 3.69 | 4,779 | 231.2 | 4.84 | ||||||||||||||||||||
Foreign | 2,065 | 95.5 | 4.62 | 737 | 23.3 | 3.16 | 3,166 | 84.2 | 2.66 | 2,710 | 130.5 | 4.81 | ||||||||||||||||||||
Total interest-bearing deposits | 23,252 | 720.8 | 3.10 | 17,451 | 340.3 | 1.95 | 28,428 | 712.9 | 2.51 | 26,423 | 951.7 | 3.60 | ||||||||||||||||||||
Borrowed funds: | ||||||||||||||||||||||||||||||||
Securities sold, not yet purchased | 66 | 3.0 | 4.57 | 475 | 17.7 | 3.72 | 33 | 1.5 | 4.82 | 30 | 1.4 | 4.56 | ||||||||||||||||||||
Federal funds purchased and security repurchase agreements | 2,838 | 124.7 | 4.39 | 2,307 | 63.6 | 2.76 | 2,733 | 53.3 | 1.95 | 3,211 | 148.5 | 4.62 | ||||||||||||||||||||
Commercial paper | 220 | 11.4 | 5.20 | 149 | 5.0 | 3.36 | 110 | 4.2 | 3.84 | 256 | 13.8 | 5.41 | ||||||||||||||||||||
FHLB advances and other borrowings: | ||||||||||||||||||||||||||||||||
One year or less | 479 | 25.3 | 5.27 | 204 | 5.9 | 2.90 | 4,589 | 119.8 | 2.61 | 1,099 | 55.0 | 5.00 | ||||||||||||||||||||
Over one year | 148 | 8.6 | 5.80 | 228 | 11.5 | 5.05 | 128 | 7.4 | 5.73 | 131 | 7.6 | 5.77 | ||||||||||||||||||||
Long-term debt | 2,491 | 159.6 | 6.41 | 1,786 | 104.9 | 5.88 | 2,449 | 103.1 | 4.21 | 2,365 | 145.4 | 6.15 | ||||||||||||||||||||
Total borrowed funds | 6,242 | 332.6 | 5.33 | 5,149 | 208.6 | 4.05 | 10,042 | 289.3 | 2.88 | 7,092 | 371.7 | 5.24 | ||||||||||||||||||||
Total interest-bearing liabilities | 29,494 | 1,053.4 | 3.57 | 22,600 | 548.9 | 2.43 | 38,470 | 1,002.2 | 2.61 | 33,515 | 1,323.4 | 3.95 | ||||||||||||||||||||
Noninterest-bearing deposits | 9,508 | 7,417 | 9,145 | 9,401 | ||||||||||||||||||||||||||||
Other liabilities | 697 | 533 | 578 | 647 | ||||||||||||||||||||||||||||
Total liabilities | 39,699 | 30,550 | 48,193 | 43,563 | ||||||||||||||||||||||||||||
Minority interest | 34 | 26 | 29 | 36 | ||||||||||||||||||||||||||||
Shareholders’ equity: | ||||||||||||||||||||||||||||||||
Preferred equity | 16 | – | 432 | 240 | ||||||||||||||||||||||||||||
Common equity | 4,493 | 3,027 | 5,108 | 5,008 | ||||||||||||||||||||||||||||
Total shareholders’ equity | 4,509 | 3,027 | 5,540 | 5,248 | ||||||||||||||||||||||||||||
Total liabilities and shareholders’ equity | $ | 44,242 | $ | 33,603 | $ | 53,762 | $ | 48,847 | ||||||||||||||||||||||||
Spread on average interest-bearing funds | 3.78% | 3.97% | 3.68 | % | 3.56 | % | ||||||||||||||||||||||||||
Taxable-equivalent net interest income and net yield on interest-earning assets | 1,789.0 | 4.63% | 1,382.4 | 4.58% | 1,995.4 | 4.18 | % | 1,908.1 | 4.43 | % | ||||||||||||||||||||||
1 | Taxable-equivalent rates used where applicable. |
2 | Net of unearned income and fees, net of related costs. Loans include nonaccrual and restructured loans. |
| 2004 | 2003 | 2002 | ||||||||||||||||
Average balance | Amount of interest(1) | Average rate | Average balance | Amount of interest(1) | Average rate | Average balance | Amount of interest(1) | Average rate | ||||||||||
| $ 1,463 | 16.4 | 1.12% | $ | 1,343 | 13.0 | 0.97% | $ | 1,199 | 18.6 | 1.55% | ||||||||
| 500 | 34.3 | 6.86 | – | – | 43 | 2.3 | 5.34 | |||||||||||
| 3,968 | 174.5 | 4.40 | 3,736 | 171.5 | 4.59 | 3,209 | 170.0 | 5.30 | ||||||||||
| 732 | 29.6 | 4.04 | 711 | 24.7 | 3.47 | 611 | 22.1 | 3.62 | ||||||||||
| 5,200 | 238.4 | 4.59 | 4,447 | 196.2 | 4.41 | 3,863 | 194.4 | 5.03 | ||||||||||
| 159 | 5.1 | 3.16 | 220 | 8.3 | 3.77 | 210 | 9.4 | 4.50 | ||||||||||
| 20,887 | 1,252.8 | 6.00 | 19,105 | 1,194.2 | 6.25 | 17,904 | 1,245.4 | 6.96 | ||||||||||
| 21,046 | 1,257.9 | 5.98 | 19,325 | 1,202.5 | 6.22 | 18,114 | 1,254.8 | 6.93 | ||||||||||
| 27,709 | 1,512.7 | 5.46 | 25,115 | 1,411.7 | 5.62 | 23,176 | 1,467.8 | 6.33 | ||||||||||
| 1,026 | 953 | 939 | ||||||||||||||||
| (272) | (282) | (267) | ||||||||||||||||
| 648 | 711 | 744 | ||||||||||||||||
| 65 | 77 | 98 | ||||||||||||||||
| 1,760 | 1,630 | 1,606 | ||||||||||||||||
| $ 30,936 | $ | 28,204 | $ | 26,296 | ||||||||||||||
| $ 4,245 | 24.4 | 0.58 | $ | 3,810 | 23.4 | 0.62 | $ | 3,308 | 34.6 | 1.05 | ||||||||
| 8,572 | 96.8 | 1.13 | 8,064 | 88.2 | 1.09 | 7,268 | 130.0 | 1.79 | ||||||||||
| 1,436 | 27.5 | 1.92 | 1,644 | 36.9 | 2.25 | 1,911 | 62.1 | 3.25 | ||||||||||
| 1,244 | 29.2 | 2.35 | 1,290 | 33.3 | 2.58 | 1,487 | 50.5 | 3.40 | ||||||||||
| 338 | 4.4 | 1.30 | 186 | 1.7 | 0.89 | 106 | 1.5 | 1.42 | ||||||||||
| 15,835 | 182.3 | 1.15 | 14,994 | 183.5 | 1.22 | 14,080 | 278.7 | 1.98 | ||||||||||
| 625 | 24.2 | 3.86 | 538 | 20.4 | 3.80 | 394 | 16.4 | 4.17 | ||||||||||
| 2,682 | 32.2 | 1.20 | 2,605 | 25.5 | 0.98 | 2,528 | 39.1 | 1.55 | ||||||||||
| 201 | 3.0 | 1.51 | 215 | 3.0 | 1.41 | 359 | 7.5 | 2.09 | ||||||||||
| 252 | 2.9 | 1.14 | 145 | 1.9 | 1.32 | 533 | 10.3 | 1.93 | ||||||||||
| 230 | 11.7 | 5.08 | 237 | 12.3 | 5.19 | 240 | 12.4 | 5.18 | ||||||||||
| 1,659 | 74.3 | 4.48 | 1,277 | 57.3 | 4.48 | 874 | 56.3 | 6.45 | ||||||||||
| 5,649 | 148.3 | 2.62 | 5,017 | 120.4 | 2.40 | 4,928 | 142.0 | 2.88 | ||||||||||
| 21,484 | 330.6 | 1.54 | 20,011 | 303.9 | 1.52 | 19,008 | 420.7 | 2.21 | ||||||||||
| 6,269 | 5,259 | 4,522 | ||||||||||||||||
| 501 | 444 | 404 | ||||||||||||||||
| 28,254 | 25,714 | 23,934 | ||||||||||||||||
| 23 | 22 | 21 | ||||||||||||||||
| – | – | – | ||||||||||||||||
| 2,659 | 2,468 | 2,341 | ||||||||||||||||
| 2,659 | 2,468 | 2,341 | ||||||||||||||||
| $ 30,936 | $ | 28,204 | $ | 26,296 | ||||||||||||||
| 3.92% | 4.10% | 4.12% | ||||||||||||||||
| 1,182.1 | 4.27% | 1,107.8 | 4.41% | 1,047.1 | 4.52% | |||||||||||||
| 2006 | 2005 | 2004 | |||||||||||||||||||||||
| Average balance | Amount of interest1 | Average rate | Average balance | Amount of interest1 | Average rate | Average balance | Amount of interest1 | Average rate | |||||||||||||||||
| $ | 479 | 24.7 | 5.16 | % | $ | 988 | 31.7 | 3.21 | % | $ | 1,463 | 16.4 | 1.12 | % | |||||||||||
| 645 | 44.1 | 6.83 | 639 | 44.2 | 6.93 | 500 | 34.3 | 6.86 | |||||||||||||||||
| 4,992 | 285.5 | 5.72 | 4,021 | 207.7 | 5.16 | 3,968 | 174.5 | 4.40 | |||||||||||||||||
| 157 | 7.7 | 4.91 | 497 | 19.9 | 4.00 | 732 | 29.6 | 4.04 | |||||||||||||||||
| 5,794 | 337.3 | 5.82 | 5,157 | 271.8 | 5.27 | 5,200 | 238.4 | 4.59 | |||||||||||||||||
| 261 | 16.5 | 4.80 | 205 | 9.8 | 4.80 | 159 | 5.1 | 3.16 | |||||||||||||||||
| 32,134 | 2,463.9 | 6.80 | 23,804 | 1,618.0 | 6.80 | 20,887 | 1,252.8 | 6.00 | |||||||||||||||||
| 32,395 | 2,480.4 | 6.78 | 24,009 | 1,627.8 | 6.78 | 21,046 | 1,257.9 | 5.98 | |||||||||||||||||
| 38,668 | 2,842.4 | 6.40 | 30,154 | 1,931.3 | 6.40 | 27,709 | 1,512.7 | 5.46 | |||||||||||||||||
| 1,476 | 1,123 | 1,026 | |||||||||||||||||||||||
| (349 | ) | (285 | ) | (272 | ) | ||||||||||||||||||||
| 1,887 | 746 | 648 | |||||||||||||||||||||||
| 181 | 66 | 65 | |||||||||||||||||||||||
| 2,379 | 1,799 | 1,760 | |||||||||||||||||||||||
| $ | 44,242 | $ | 33,603 | $ | 30,936 | ||||||||||||||||||||
| $ | 5,129 | 75.3 | 1.47 | $ | 4,347 | 36.7 | 0.84 | $ | 4,245 | 24.4 | 0.58 | ||||||||||||||
| 10,721 | 330.0 | 3.08 | 9,131 | 183.9 | 2.01 | 8,572 | 96.8 | 1.13 | |||||||||||||||||
| 2,065 | 77.4 | 3.75 | 1,523 | 41.7 | 2.74 | 1,436 | 27.5 | 1.92 | |||||||||||||||||
| 3,272 | 142.6 | 4.36 | 1,713 | 54.7 | 3.19 | 1,244 | 29.2 | 2.35 | |||||||||||||||||
| 2,065 | 95.5 | 4.62 | 737 | 23.3 | 3.16 | 338 | 4.4 | 1.30 | |||||||||||||||||
| 23,252 | 720.8 | 3.10 | 17,451 | 340.3 | 1.95 | 15,835 | 182.3 | 1.15 | |||||||||||||||||
| 66 | 3.0 | 4.57 | 475 | 17.7 | 3.72 | 625 | 24.2 | 3.86 | |||||||||||||||||
| 2,838 | 124.7 | 4.39 | 2,307 | 63.6 | 2.76 | 2,682 | 32.2 | 1.20 | |||||||||||||||||
| 220 | 11.4 | 5.20 | 149 | 5.0 | 3.36 | 201 | 3.0 | 1.51 | |||||||||||||||||
| 479 | 25.3 | 5.27 | 204 | 5.9 | 2.90 | 252 | 2.9 | 1.14 | |||||||||||||||||
| 148 | 8.6 | 5.80 | 228 | 11.5 | 5.05 | 230 | 11.7 | 5.08 | |||||||||||||||||
| 2,491 | 159.6 | 6.41 | 1,786 | 104.9 | 5.88 | 1,659 | 74.3 | 4.48 | |||||||||||||||||
| 6,242 | 332.6 | 5.33 | 5,149 | 208.6 | 4.05 | 5,649 | 148.3 | 2.62 | |||||||||||||||||
| 29,494 | 1,053.4 | 3.57 | 22,600 | 548.9 | 2.43 | 21,484 | 330.6 | 1.54 | |||||||||||||||||
| 9,508 | 7,417 | 6,269 | |||||||||||||||||||||||
| 697 | 533 | 501 | |||||||||||||||||||||||
| 39,699 | 30,550 | 28,254 | |||||||||||||||||||||||
| 34 | 26 | 23 | |||||||||||||||||||||||
| 16 | – | – | |||||||||||||||||||||||
| 4,493 | 3,027 | 2,659 | |||||||||||||||||||||||
| 4,509 | 3,027 | 2,659 | |||||||||||||||||||||||
| $44,242 | $ | 33,603 | $ | 30,936 | |||||||||||||||||||||
| 3.78 | % | 3.97 | % | 3.92 | % | ||||||||||||||||||||
| 1,789.0 | 4.63 | % | 1,382.4 | 4.58 | % | 1,182.1 | 4.27 | % | |||||||||||||||||
Schedule 76 analyzes the year-to-year changes in net interest income on a fully taxable-equivalent basis for the years indicated. For purposes of calculating the yields in these schedules, the average loan balances also include the principal amounts of nonaccrual and restructured loans. However, interest received on nonaccrual loans is included in income only to the extent that cash payments have been received and not applied to principal reductions. In addition, interest on restructured loans is generally accrued at reduced rates.
Schedule 6
SCHEDULE 7
ANALYSIS OF INTEREST CHANGES DUE TO VOLUME AND RATE
| 2006 over 2005 | 2005 over 2004 | 2008 over 2007 | 2007 over 2006 | |||||||||||||||||||||||||||||
| Changes due to | Total changes | Changes due to | Total changes | Changes due to | Total changes | Changes due to | Total changes | |||||||||||||||||||||||||
| (In millions) | Volume | Rate(1) | Volume | Rate(1) | ||||||||||||||||||||||||||||
| (Amounts in millions) | Volume | Rate1 | Total changes | Volume | Rate1 | Total changes | ||||||||||||||||||||||||||
INTEREST-EARNING ASSETS: | ||||||||||||||||||||||||||||||||
Money market investments | $ | (16.3) | 9.3 | (7.0) | (5.3) | 20.6 | 15.3 | $ | 26.7 | (22.6 | ) | 4.1 | 18.6 | 0.4 | 19.0 | |||||||||||||||||
Securities: | �� | |||||||||||||||||||||||||||||||
Held to maturity | 0.5 | (0.6) | (0.1) | 9.6 | 0.3 | 9.9 | 55.6 | (2.0 | ) | 53.6 | 2.7 | 0.9 | 3.6 | |||||||||||||||||||
Available for sale | 53.7 | 24.1 | 77.8 | 2.5 | 30.7 | 33.2 | (69.5 | ) | (37.6 | ) | (107.1 | ) | (18.9 | ) | 2.6 | (16.3 | ) | |||||||||||||||
Trading account | (13.6) | 1.4 | (12.2) | (9.4) | (0.3) | (9.7) | (0.8 | ) | (0.6 | ) | (1.4 | ) | (4.7 | ) | 0.3 | (4.4 | ) | |||||||||||||||
Total securities | 40.6 | 24.9 | 65.5 | 2.7 | 30.7 | 33.4 | (14.7 | ) | (40.2 | ) | (54.9 | ) | (20.9 | ) | 3.8 | (17.1 | ) | |||||||||||||||
Loans: | ||||||||||||||||||||||||||||||||
Loans held for sale | 3.2 | 3.5 | 6.7 | 1.6 | 3.1 | 4.7 | (2.8 | ) | (2.0 | ) | (4.8 | ) | (1.7 | ) | 0.1 | (1.6 | ) | |||||||||||||||
Net loans and leases(2) | 619.1 | 226.8 | 845.9 | 186.8 | 178.4 | 365.2 | ||||||||||||||||||||||||||
Net loans and leases2 | 275.1 | (453.4 | ) | (178.3 | ) | 345.7 | 43.1 | 388.8 | ||||||||||||||||||||||||
Total loans and leases | 622.3 | 230.3 | 852.6 | 188.4 | 181.5 | 369.9 | 272.3 | (455.4 | ) | (183.1 | ) | 344.0 | 43.2 | 387.2 | ||||||||||||||||||
Total interest-earning assets | $ | 646.6 | 264.5 | 911.1 | 185.8 | 232.8 | 418.6 | $ | 284.3 | (518.2 | ) | (233.9 | ) | 341.7 | 47.4 | 389.1 | ||||||||||||||||
INTEREST-BEARING LIABILITIES: | ||||||||||||||||||||||||||||||||
Interest-bearing deposits: | ||||||||||||||||||||||||||||||||
Savings and NOW | $ | 7.4 | 31.2 | 38.6 | 0.8 | 11.5 | 12.3 | $ | – | (5.8 | ) | (5.8 | ) | (6.3 | ) | (27.6 | ) | (33.9 | ) | |||||||||||||
Money market | 35.8 | 110.3 | 146.1 | 6.8 | 80.3 | 87.1 | 43.2 | (146.1 | ) | (102.9 | ) | 41.1 | 66.8 | 107.9 | ||||||||||||||||||
Time under $100,000 | 17.5 | 18.2 | 35.7 | 1.8 | 12.4 | 14.2 | 5.9 | (20.4 | ) | (14.5 | ) | 19.0 | 14.3 | 33.3 | ||||||||||||||||||
Time $100,000 and over | 62.7 | 25.2 | 87.9 | 13.1 | 12.4 | 25.5 | (14.4 | ) | (54.9 | ) | (69.3 | ) | 71.5 | 17.1 | 88.6 | |||||||||||||||||
Foreign | 57.5 | 14.7 | 72.2 | 8.6 | 10.3 | 18.9 | 12.1 | (58.4 | ) | (46.3 | ) | 31.0 | 4.0 | 35.0 | ||||||||||||||||||
Total interest-bearing deposits | 180.9 | 199.6 | 380.5 | 31.1 | 126.9 | 158.0 | 46.8 | (285.6 | ) | (238.8 | ) | 156.3 | 74.6 | 230.9 | ||||||||||||||||||
Borrowed funds: | ||||||||||||||||||||||||||||||||
Securities sold, not yet purchased | (15.2) | 0.5 | (14.7) | (5.6) | (0.9) | (6.5) | 0.1 | – | 0.1 | (1.6 | ) | – | (1.6 | ) | ||||||||||||||||||
Federal funds purchased and security repurchase agreements | 17.2 | 43.9 | 61.1 | (4.5) | 35.9 | 31.4 | (9.3 | ) | (85.9 | ) | (95.2 | ) | 17.1 | 6.7 | 23.8 | |||||||||||||||||
Commercial paper | 3.0 | 3.4 | 6.4 | (0.8) | 2.8 | 2.0 | (5.6 | ) | (4.0 | ) | (9.6 | ) | 1.9 | 0.5 | 2.4 | |||||||||||||||||
FHLB advances and other borrowings: | ||||||||||||||||||||||||||||||||
One year or less | 12.1 | 7.3 | 19.4 | (0.5) | 3.5 | 3.0 | 91.1 | (26.3 | ) | 64.8 | 31.0 | (1.3 | ) | 29.7 | ||||||||||||||||||
Over one year | (4.0) | 1.1 | (2.9) | (0.1) | (0.1) | (0.2) | (0.1 | ) | (0.1 | ) | (0.2 | ) | (1.0 | ) | – | (1.0 | ) | |||||||||||||||
Long-term debt | 44.5 | 10.2 | 54.7 | 6.0 | 24.6 | 30.6 | 3.5 | (45.8 | ) | (42.3 | ) | (7.8 | ) | (6.4 | ) | (14.2 | ) | |||||||||||||||
Total borrowed funds | 57.6 | 66.4 | 124.0 | (5.5) | 65.8 | 60.3 | 79.7 | (162.1 | ) | (82.4 | ) | 39.6 | (0.5 | ) | 39.1 | |||||||||||||||||
Total interest-bearing liabilities | $ | 238.5 | 266.0 | 504.5 | 25.6 | 192.7 | 218.3 | $ | 126.5 | (447.7 | ) | (321.2 | ) | 195.9 | 74.1 | 270.0 | ||||||||||||||||
Change in taxable-equivalent net interest income | $ | 408.1 | (1.5) | 406.6 | 160.2 | 40.1 | 200.3 | $ | 157.8 | (70.5 | ) | 87.3 | 145.8 | (26.7 | ) | 119.1 | ||||||||||||||||
1 | Taxable-equivalent income used where applicable. |
2 | Net of unearned income and fees, net of related costs. Loans include nonaccrual and restructured loans. |
In the analysis of interest changes due to volume and rate, changes due to the volume/rate variance are allocated to volume with the following exceptions: when volume and rate both increase, the variance is allocated proportionately to both volume and rate; when the rate increases and volume decreases, the variance is allocated to the rate.
Provisions for Credit Losses
The provision for loan losses is the amount of expense that, based on our judgment, is required to maintain the allowance for loan losses at an adequate level.level based upon the inherent risks in the portfolio. The provision for unfunded lending commitments is used to maintain the allowancereserve for unfunded lending commitments at an adequate level. In determining adequate levels of the allowances,allowance and reserve, we perform periodic evaluations of the Company’s various portfolios, the levels of actual charge-offs, and statistical trends and other economic factors. See “Credit Risk Management” on page 7799 for more information on how we determine the appropriate level for the allowancesallowance for loan and lease losses and the reserve for unfunded lending commitments.
For the year 2006,2008, the provision for loan losses was $72.6$648.3 million, compared to $43.0$152.2 million for 20052007 and $44.1$72.6 million for 2004.2006. The increased provision for 2008 resulted mainly from significant deterioration in our credit quality, particularly from our exposure to residential land development and construction activity in the Southwest, with Arizona, California, and Nevada being most severely impacted, and also weakening in commercial loan portfolios. See “Nonperforming Assets” and “Allowance and Reserve for Credit Losses” on pages 104 and 106 for further details. Net loan and lease charge-offs increased from $25to $393.7 million in 2005 to $462008 up from $63.6 million in 2007 and $45.8 million in 2006. Both theThe $330.1 million increase during 2008 was driven by increased net charge-offs of $133.6 million at NBA, $68.9 million at NSB, $61.4 million at Zions Bank and provisions reflect the Company’s increased size after the Amegy acquisition. In addition, the higher provision for 2006 reflects the increased provisioning resulting from $4.5 billion of loan growth in 2006. In the fourth quarter, we incurred a loss on an equipment lease$38.7 million at CB&T, primarily related to an alleged accounting fraud at a water bottling company; our NBA affiliate had a $17.1 million participation in this lease. We recorded a charge-off of approximately $10.9 million during the fourth quarter related to this lease.
The lower provisions for both 2005residential land development and 2004 reflect improvements in various credit quality factors used in determining the appropriate level of the allowance for loan losses, including decreased levels of criticized and classifiedconstruction loans. Including the provision for unfunded lending commitments, the total provision for credit losses was $649.7 million for 2008, $154.0 million for 2007, and $73.8 million for 2006, $46.42006. The provision for loan losses was $285.2 million for 2005,the fourth quarter of 2008 and $44.5 millionnet charge-offs for 2004. From periodthe quarter were $179.7 million.
The Company’s expectation is that credit conditions will continue to period, the amountssoften in most of unfunded lending commitments may be subject to sizeable fluctuationour markets due to changescontinued weakening in general economic conditions. We expect provisioning and net charge-offs to continue at elevated levels for at least the timing and volume of loan originations and associated funding.
next several quarters.
Noninterest Income
Noninterest income represents revenues that the Company earns for products and services that have no interest rate or yield associated with them. Noninterest income for 20062008 comprised 23.6%8.7% of taxable-equivalent revenues reflecting the $317.1 million of impairment and valuation losses on securities which reduced noninterest income for 2008, compared to 24.0%17.8% for 20052007 and 26.7%23.6% for 2004.2006. Schedule 87 presents a comparison of the major components of noninterest income for the past three years.
The increases in total and individual categories of noninterest income for 2006 compared to 2005 were mainly due to the Amegy acquisition. Significant changes and trends in noninterest income categories not resulting from the Amegy acquisition are discussed as follows.
SCHEDULE 8Schedule 7
NONINTEREST INCOME
NONINTEREST INCOME
| (Amounts in millions) | 2006 | Percent change | 2005 | Percent change | 2004 | ||||||||
Service charges and fees on deposit accounts | $ | 166.7 | 29.4 % | $ | 128.8 | (2.2)% | $ | 131.7 | |||||
Loan sales and servicing income | 54.2 | (30.3) | 77.8 | (1.6) | 79.1 | ||||||||
Other service charges, commissions and fees | 166.8 | 49.9 | 111.3 | 18.9 | 93.6 | ||||||||
Trust and wealth management income | 27.5 | 26.1 | 21.8 | (22.1) | 28.0 | ||||||||
Income from securities conduit | 32.2 | (8.0) | 35.0 | (0.6) | 35.2 | ||||||||
Dividends and other investment income | 39.9 | 33.0 | 30.0 | (5.7) | 31.8 | ||||||||
Market making, trading and nonhedge derivative income | 18.5 | 17.8 | 15.7 | (10.8) | 17.6 | ||||||||
Equity securities gains (losses), net | 17.8 | 1,469.2 | (1.3) | 86.7 | (9.8) | ||||||||
Fixed income securities gains, net | 6.4 | 700.0 | 0.8 | (68.0) | 2.5 | ||||||||
Other | 21.2 | 24.7 | 17.0 | (22.0) | 21.8 | ||||||||
Total | $ | 551.2 | 26.2 % | $ | 436.9 | 1.3 % | $ | 431.5 | |||||
| (Amounts in millions) | 2008 | Percent change | 2007 | Percent change | 2006 | ||||||||||||
Service charges and fees on deposit accounts | $ | 207.0 | 12.7 | % | $ | 183.6 | 14.2 | % | $ | 160.8 | |||||||
Other service charges, commissions and fees | 167.7 | (1.7 | ) | 170.6 | 13.6 | 150.2 | |||||||||||
Trust and wealth management income | 37.7 | 3.3 | 36.5 | 21.7 | 30.0 | ||||||||||||
Capital markets and foreign exchange | 49.9 | 14.4 | 43.6 | 10.4 | 39.5 | ||||||||||||
Dividends and other investment income | 46.4 | (8.8 | ) | 50.9 | 27.6 | 39.9 | |||||||||||
Loan sales and servicing income | 24.4 | (36.6 | ) | 38.5 | (29.0 | ) | 54.2 | ||||||||||
Income from securities conduit | 5.5 | (69.8 | ) | 18.2 | (43.5 | ) | 32.2 | ||||||||||
Fair value and nonhedge derivative income (loss) | (48.0 | ) | (235.7 | ) | (14.3 | ) | (2,483.3 | ) | 0.6 | ||||||||
Equity securities gains, net | 0.8 | (95.5 | ) | 17.7 | (0.6 | ) | 17.8 | ||||||||||
Fixed income securities gains, net | 0.8 | (73.3 | ) | 3.0 | (53.1 | ) | 6.4 | ||||||||||
Impairment losses on investment securities and valuation losses on securities purchased from Lockhart Funding | (317.1 | ) | (100.4 | ) | (158.2 | ) | – | – | |||||||||
Other | 15.6 | (29.7 | ) | 22.2 | 13.3 | 19.6 | |||||||||||
Total | $ | 190.7 | (53.7 | )% | $ | 412.3 | (25.2 | )% | $ | 551.2 | |||||||
Noninterest income for 2006 increased $114.32008 decreased $221.6 million or 26.2%53.7% compared to 2005.2007. The largest componentscomponent of this decrease was the $158.9 million increase excludingin impairment and valuation losses on securities. Other significant components contributing to the noninterest income decrease in 2008 included loan sales and servicing income, income from securities conduit, fair value and nonhedge derivative loss, and net equity securities gains. Noninterest income for 2007 decreased $138.9 million or 25.2% compared to 2006 also reflecting the impact of the Amegy acquisition, was in net equity securities gains, which were $17.8$158.2 million in 2006 compared with netof impairment and valuation losses of $1.3 million in 2005 and net gains from fixed income securities, which increased $5.6 million. Noninterest income for 2005 increased $5.4 million or 1.3% compared to 2004. The most significant changes were in other service charges, commissions and fees which increased $17.7 million and equity securities losses which decreased $8.5 million.
on securities.
Service charges and fees on deposit accounts increased significantly in 2006 and declined moderately in 2005. The increase for 2006 was mainly as a result of the acquisition of Amegy. However, deposit service charges and fees increased in each quarter of 2006, reflecting the Company’s efforts to promote treasury management services to its customers, including NetDeposit remote deposit capture services. The 2005 decrease was mainly caused by higher earnings credits on commercial deposit accounts as market interest rates rose.
Loan sales and servicing income includes revenues from securitizations of loans as well as from revenues that we earn through servicing loans that have been sold to third parties. For 2006 loan sales and servicing income decreased 30.3% compared to 2005. The decrease was due to no small business loan securitization sale transactions in 2006, lower servicing fees from lower loan balances, and $7.1$23.4 million in retained interest write downs. These write downs resulted primarily from higher than expected loan prepayments2008 and changes$22.8 million in the interest rate environment as determined from our periodic evaluation of beneficial interests as required by EITF 99-20. For 2005, loan sales and servicing income decreased 1.6% compared to 2004.2007. The decreaseincrease was mainly due to decreased gains from the saleimpact of conforming residential loans sold servicing releasedfee increases across the Company, and fromreduced deposit account earnings credits due to lower interest rates. The increase in 2007 was mainly due to the saleimpact of home equity credit lines. See Note 6fee increases across the Company and the acquisition of the Notes to Consolidated Financial Statements for additional information on the Company’s securitization programs.Stockmen’s.
Other service charges, commissions, and fees, which is comprised of fiscal agent fees, Automated Teller Machine (“ATM”) fees, insurance commissions, bankcard merchant fees, debit card interchange fees, cash management fees, lending commitments, syndication and servicing fees and other miscellaneous fees, increased $55.5decreased $2.9 million, or 49.9%1.7% from 2005,2007, which was up 18.9%13.6% from 2004.2006. The 2006decrease in 2008 was principally due to lower lending related fees and official check fees offset by increased accounts receivable factoring fees, debit card fees, and cash management related fees. The cash management fees include remote check imaging fees, third-party ACH transaction fees, and web-based medical claims transaction fees. The increase in 2007 was primarily driven by debit card fees, and cash management related fees. The increase was primarily due to the Amegy acquisition. The increase for 2005 included $3.7offset by decreased insurance income of $5.0 million of fees earned by Amegy. Other significant increases for 2005 included increases in debit card interchange fees resulting from increased volumes, increased letterthe sale of credit fees and customer swap fees, and increased fees from the Company’s municipal finance business.
Grant Hatch insurance agency and certain other insurance assets completed during the first quarter of 2007.
Trust and wealth management income for 20062008 increased 26.1%3.3% compared to 2005,2007, which was down 22.1%up 21.7% compared to 2004.2006. The modest increase for 2008 was from slower organic growth in the trust and wealth management business and declines in fees due to lower balances of assets under management, primarily as a result of declines in market values of a number of asset classes. The increase for 2006 in fees is from the Amegy acquisition and increased fees2007 was from organic growth in the trust and wealth management business, including growth related to our Contango wealth management and associated trust business, as well as growth in the Amegy trust and wealth management business. Excluding
Capital markets and foreign exchange include trading income, public finance fees, foreign exchange income, and other capital market related fees and increased 14.4% from 2007, which was up 10.4% from 2006.
The increase in 2008 was primarily driven by increased trading income partially offset by lower public finance fees. The increase in 2007 was primarily the Amegy acquisition, trustresult of higher public finance fees.
Dividends and wealth managementother investment income consist of revenue from the Company’s bank-owned life insurance program and revenues from other investments. Revenues from other investments include dividends on FHLB stock, Federal Reserve Bank stock, and earnings from unconsolidated affiliates including certain alternative venture investments, and were $15.6 million in 2008, $23.0 million in 2007, and $13.3 million in 2006. The decreased income from other investments in 2008 is primarily due to a $14.1 million decrease in equity in earnings of Farmer Mac offset by a $6.0 million increase in earnings from Amegy’s alternative investments program. The decrease in earnings from Farmer Mac is mainly due to their losses in securities holdings in Lehman Brothers and Fannie Mae. Revenue from bank-owned life insurance programs was $30.7 million in 2008, $27.9 million in 2007, and $26.6 million in 2006.
Loan sales and servicing income includes revenues from securitizations of loans, gains and losses from sales of loans, as well as revenues that we earn through servicing loans that we sold to third parties. For 2008, loan sales and servicing income decreased 36.6% compared to 2007 and decreased 29.0% between 2007 and 2006. The decreased income for 2006 increased 4.1%2008 is mainly due to reduced servicing fees on securitized small business loans. Upon dissolution of securitization trusts as described in “Off-Balance Sheet Arrangement” on page 96, these loans were recorded on Zions Bank’s balance sheet and not serviced for investors. The decrease for 2007 compared to 2005.
2006 mainly resulted from lower servicing fees from lower loan balances, and retained interest impairment write-downs of $12.6 million in 2007. These write-downs resulted primarily from higher than expected loan prepayments, increased default assumptions, and changes in the interest rate environment as determined from our periodic evaluation of beneficial interests as required by EITF 99-20. As of December 31, 2008, the Company had no retained interests in small business securitizations recorded on the balance sheet. See Note 6 of the Notes to Consolidated Financial Statements for additional information on the Company’s securitization programs.
Income from securities conduit decreased $12.7 million or 69.8% for 2008 compared to 2007 and decreased 43.5% between 2007 and 2006. This income represents fees that we receive from Lockhart, a QSPE securities conduit, in return for liquidity management, an interest rate agreement, and administrative services that Zions Bank provides to the entity in accordance with a servicing agreement.conduit. The 8.0% decrease in income for 2006 comparedis due to 2005 resultedthe higher cost of asset-backed commercial paper used to fund Lockhart resulting from lower servicing fees on the investment holdingsdisruptions in the credit markets which began in August of 2007 and a decrease in the size of Lockhart’s securities portfolio. The book value of Lockhart’s securities portfolio declined to $738 million at December 31, 2008 from $2.1 billion at December 31, 2007, and from $4.1 billion at December 31, 2006 due to Zions’ required purchase of securities out of Lockhart and repayments of principal. We expect that the book value of the Lockhart portfolio will continue to decrease. Income from securities conduit will depend both on the amount of securities held in the portfolio and on the cost of the commercial paper used to fund those securities. See “Off-Balance Sheet Arrangement” on page 96, “Liquidity Management Actions” on page 93116, and Note 6 of the Notes to Consolidated Financial Statements for further information regarding securitizations and Lockhart.
Dividends and other investment income consist of revenue from the Company’s bank-owned life insurance program, dividends on securities holdings, and equity in earnings from other investments. Revenue from bank-owned life insurance programs was $26.6 million in 2006, $18.9 million in 2005, and $18.5 million in 2004. The increase for 2006 is due to Amegy. Revenues from investments include dividends on Federal Home Loan Bank (“FHLB”), Federal Reserve Bank stock, and equity earnings in unconsolidated affiliates and were $13.3 million in 2006, $11.1 million in 2005, and $13.3 million in 2004.
Market making, tradingFair value and nonhedge derivative income (loss) consists of the following:
Schedule 8
SCHEDULE 9
MARKET MAKING, TRADINGFAIR VALUE AND NONHEDGE DERIVATIVE INCOME (LOSS)
| (Amounts in millions) | 2006 | Percent change | 2005 | Percent change | 2004 | 2008 | Percent change | 2007 | Percent change | 2006 | |||||||||||||||||||||||
Market making and trading income | $ | 17.9 | 9.8 | % | $ | 16.3 | (4.7 | )% | $ | 17.1 | |||||||||||||||||||||||
Nonhedge derivative income | 0.6 | 200.0 | (0.6) | (220.0 | ) | 0.5 | |||||||||||||||||||||||||||
Nonhedge derivative income (loss) | $ | (36.2 | ) | (139.7 | )% | $ | (15.1 | ) | (2,257.1 | )% | $ | 0.7 | |||||||||||||||||||||
Fair value decreases on SFAS 159 instruments | (9.2 | ) | – | – | – | – | |||||||||||||||||||||||||||
Derivative fair value credit adjustments | (3.1 | ) | – | – | – | – | |||||||||||||||||||||||||||
Other | 0.5 | (37.5 | ) | 0.8 | 900.0 | (0.1 | ) | ||||||||||||||||||||||||||
Total | $ | 18.5 | $ | 15.7 | $ | 17.6 | $ | (48.0 | ) | (235.7 | )% | $ | (14.3 | ) | (2,483.3 | )% | $ | 0.6 | |||||||||||||||
Market making
The losses on nonhedge derivatives for 2008 and trading income increased $1.6 million or 9.8%2007 resulted from decreasing spreads between LIBOR and the prime rate during the second half of 2007. In an effort to employ the most liquid instrument available for Zions’ hedging program and execute transactions with the most economically favorable terms, it has been Zions’ practice to use LIBOR as compared to 2005. Excluding Amegy, market making and trading income decreased $5.2 million during 2006 mainly due tothe floating index on swaps executed with external counterparties. As a decision made to close our London trading office in the fourth quarter of 2005 and reduce the amountsignificant portion of the Company’s tradingloan assets are prime rate floating loans, many of the Company’s swaps are structured with a prime floating rate. In conjunction with the execution of swaps in responsewhich the Company receives a fixed rate and pays prime, Zions also executes a swap in which it pays LIBOR plus a spread and receives prime. The Company therefore has chosen to margin pressures. Trading revenue for 2005
declined mainly due to lower margins fromretain the odd-lot electronic bond trading business. Nonhedge derivative income was $0.6 million for 2006 compared to a loss of $0.6 millionprime-LIBOR basis risk in 2005, which included losses of $0.9 million from two ineffective cash flow hedges.
this hedging activity.
Net equity securities gains in 20062008 were $17.8$0.8 million as compared to net gains of $17.7 million in 2007 and $17.8 million in 2006. Net gains for 2008 included a $12.4 million gain on the VISA stock offering, a $7.7 million gain on the sale of an interest in a mutual fund management company, an $11.0 million impairment loss on the Company’s investment in Farmer Mac, and net losses of $1.3$8.4 million on venture capital equity investments. Net gains for 2007 included a $2.5 million gain on the sale of an investment in 2005a community bank and $9.8 million in 2004. The increase was primarily due to $19.7 million of net gains on venture capital equity investments recognized in 2006.of $15.4 million. Net of related minority interest of $10.0$5.4 million, income taxes and other expenses, venture capital investments contributed $4.1$2.6 million to net incomelosses in 2006,2008, compared to net income of $3.4 million for 2007 and $4.1 million for 2006.
Impairment losses on investment securities and valuation losses on securities purchased from Lockhart were $317.1 million in 2008 compared to $158.2 million in 2007. The 2008 losses consisted of impairment losses of $2.2$304.0 million on ABS, REIT trust preferred, and bank and insurance trust preferred CDOs and valuation losses of $13.1 million on securities purchased from Lockhart. During 2007 impairment losses on REIT trust preferred CDO securities were $108.6 million and valuation losses on securities purchased from Lockhart were $49.6 million. See “Other-than-Temporary-Impairment – Debt Investment Securities” on page 40, “Investment Securities Portfolio” on page 85 , and “Off-Balance Sheet Arrangement” on page 96 for 2005 and $4.5 million for 2004.
further discussion.
Other noninterest income for 20062008 was $21.2$15.6 million, compared to $17.0$22.2 million for 2005,2007 and $21.8$19.6 million for 2004.2006. The decrease in 2008 included reduced scanner sales to third party financial institutions. The increase in 2006 was primarily due to2007 included a $2.9 million gain on the acquisitionsale of Amegy and NetDeposit related revenue from scanner sales. Other noninterest income for 2004 included $5.3 million of litigation settlements.the Company’s insurance business during 2007.
Noninterest Expense
Noninterest expense for 20062008 increased 31.4%5.0% over 2005,2007, which was 9.7%5.6% higher than in 2004.2006. The percentage changes are2008 increase was impacted by the acquisition of Amegy, $20.5increased other real estate expense due to the deterioration in the Company’s loan credit quality. Excluding other real estate expense noninterest expense increased $24.4 million of merger related expenses, and debt extinguishment costs of $7.3 million in 2006.or 1.7% over 2007. Schedule 109 summarizes the major components of noninterest expense and provides a comparison of the components over the past three years. The increases in total and individual categories of noninterest expense for 2006 compared to 2005 were mainly due to the Amegy acquisition. Significant changes and trends in noninterest expense categories not resulting from the Amegy acquisition are discussed as follows.
Schedule 9
NONINTEREST EXPENSE
SCHEDULE 10
| (Amounts in millions) | 2008 | Percent change | 2007 | Percent change | 2006 | ||||||||||
Salaries and employee benefits | $ | 810.5 | 1.3 | % | $ | 799.9 | 6.4 | % | $ | 751.7 | |||||
Occupancy, net | 114.2 | 6.3 | 107.4 | 7.8 | 99.6 | ||||||||||
Furniture and equipment | 100.1 | 3.7 | 96.5 | 8.8 | 88.7 | ||||||||||
Other real estate expense | 50.4 | 1,045.5 | 4.4 | 4,300.0 | 0.1 | ||||||||||
Legal and professional services | 45.5 | 3.9 | 43.8 | 9.2 | 40.1 | ||||||||||
Postage and supplies | 37.5 | 2.7 | 36.5 | 10.3 | 33.1 | ||||||||||
Advertising | 30.7 | 14.1 | 26.9 | 1.5 | 26.5 | ||||||||||
FDIC premiums | 19.9 | 206.2 | 6.5 | 20.4 | 5.4 | ||||||||||
Impairment losses on long-lived assets | 3.1 | – | – | nm | 1.3 | ||||||||||
Merger related expense | 1.6 | (69.8 | ) | 5.3 | (74.1 | ) | 20.5 | ||||||||
Amortization of core deposit and other intangibles | 33.2 | (26.1 | ) | 44.9 | 4.4 | 43.0 | |||||||||
Other | 228.3 | (1.8 | ) | 232.5 | 5.5 | 220.4 | |||||||||
Total | $ | 1,475.0 | 5.0 | % | $ | 1,404.6 | 5.6 | % | $ | 1,330.4 | |||||
NONINTEREST EXPENSEnm – not meaningful
| (Amounts in millions) | 2006 | Percent change | 2005 | Percent change | 2004 | ||||||||
Salaries and employee benefits | $ | 751.7 | 31.0 % | $ | 573.9 | 8.0% | $ | 531.3 | |||||
Occupancy, net | 99.6 | 28.7 | 77.4 | 5.0 | 73.7 | ||||||||
Furniture and equipment | 88.7 | 30.1 | 68.2 | 3.6 | 65.8 | ||||||||
Legal and professional services | 40.1 | 15.2 | 34.8 | 7.4 | 32.4 | ||||||||
Postage and supplies | 33.1 | 23.0 | 26.9 | 4.7 | 25.7 | ||||||||
Advertising | 26.5 | 23.8 | 21.4 | 8.6 | 19.7 | ||||||||
Debt extinguishment cost | 7.3 | – | – | – | – | ||||||||
Impairment losses on long-lived assets | 1.3 | (58.1) | 3.1 | 342.9 | 0.7 | ||||||||
Restructuring charges | – | (100.0) | 2.4 | 118.2 | 1.1 | ||||||||
Merger related expense | 20.5 | 521.2 | 3.3 | – | – | ||||||||
Amortization of core deposit and other intangibles | 43.0 | 154.4 | 16.9 | 19.9 | 14.1 | ||||||||
Provision for unfunded lending commitments | 1.2 | (64.7) | 3.4 | 580.0 | 0.5 | ||||||||
Other | 217.4 | 20.0 | 181.1 | 14.5 | 158.2 | ||||||||
Total | $ | 1,330.4 | 31.4 % | $ | 1,012.8 | 9.7% | $ | 923.2 | |||||
The Company’s efficiency ratio was 67.5% for 2008 compared to 60.5% for 2007 and 56.9% for 2006 compared2006. The increase in the efficiency ratio for 2008 and 2007 was primarily due to 55.7%the previously discussed impairment and valuation losses on securities. The efficiency ratio was 58.9% for 20052008 and 57.2%56.7% for 2004.
2007 excluding the impairment and valuation losses on securities.
Salary costs for 20062008 increased 31.0%4.2% over 2005,2007, which were up 8.0%5.8% from 2004.2006. The increases for 2006 and 20052008 resulted primarilymainly from the acquisition of Amegy, and from increased incentive planmerit pay salary increases offset by reductions in variable pay. The salary costs and additional staffing related to the build out of our wealth management business, NetDeposit, and to other business expansion. The increase for 20062008 also included increased share-based compensation expense of approximately $22.6$31.8 million, up from $28.3 million for 2007. The increases for 2007 resulted mainly from merit pay salary increases and increased staffing related to the adoption of SFAS 123R.other business expansion. Employee health and insurance benefits for 2006 increased 26.8%2008 decreased 10.5% from 20052007, which increased 7.5%24.2% from 2004. The increase2006. Employee health and insurance expense for 2006 resulted2008 included an adjustment which reduced expense by approximately $3.0 million to reflect the elimination of a health insurance benefit. Retirement expense for 2008 decreased primarily frombecause no accrual was required for the acquisition of Amegy. The increase in employee benefits for 2005 is mainly the result of increased contributions to ourCompany’s profit sharing plan and increased employee matching contributions to our 401(k) plan. The profit sharing plan was enhanced as a replacement for a broad-based employee stock option plan that was discontinued in 2005. Salaries and employee benefits are shown in greater detail in Schedule 11.10.
Schedule 10
SCHEDULE 11
SALARIES AND EMPLOYEE BENEFITS
| (Dollar amounts in millions) | 2006 | Percent change | 2005 | Percent change | 2004 | 2008 | Percent change | 2007 | Percent change | 2006 | ||||||||||||||||||
Salaries and bonuses | $ | 641.1 | 31.7% | $ | 486.7 | 8.1% | $ | 450.2 | $ | 706.5 | 4.2 | % | $ | 678.1 | 5.8 | % | $ | 641.1 | ||||||||||
Employee benefits: | ||||||||||||||||||||||||||||
Employee health and insurance | 31.4 | 10.2 | 28.5 | 1.1 | 28.2 | 37.7 | (10.5 | ) | 42.1 | 24.2 | 33.9 | |||||||||||||||||
Retirement | 37.8 | 35.0 | 28.0 | 23.9 | 22.6 | 20.6 | (43.3 | ) | 36.3 | (4.0 | ) | 37.8 | ||||||||||||||||
Payroll taxes and other | 41.4 | 34.9 | 30.7 | 1.3 | 30.3 | 45.7 | 5.3 | 43.4 | 11.6 | 38.9 | ||||||||||||||||||
Total benefits | 110.6 | 26.8 | 87.2 | 7.5 | 81.1 | 104.0 | (14.6 | ) | 121.8 | 10.1 | 110.6 | |||||||||||||||||
Total salaries and employee benefits | $ | 751.7 | 31.0% | $ | 573.9 | 8.0% | $ | 531.3 | $ | 810.5 | 1.3 | % | $ | 799.9 | 6.4 | % | $ | 751.7 | ||||||||||
Full-time equivalent employees (“FTEs”) at December 31 | 10,618 | 5.1% | 10,102 | 25.9% | 8,026 | |||||||||||||||||||||||
Full-time equivalent (“FTE”) employees at December 31 | 11,011 | 0.7 | % | 10,933 | 3.0 | % | 10,618 | |||||||||||||||||||||
Legal and professional services
Occupancy expense increased 15.2% when$6.8 million or 6.3% compared to 2005,2007 which werewas up 7.4%7.8% from 2004.2006. The 2008 increase was impacted by higher facilities rent expense and higher facilities maintenance and includes $1.7 million of expense associated with damage to branches and other facilities caused by Hurricane Ike in 2006the third quarter of 2008. The 2007 increase was primarilyimpacted by higher facilities rent expense, higher facilities maintenance and utilities expense, and the resultimpact of the acquisition of AmegyStockmen’s.
Furniture and the ongoing consulting andequipment expense for 2008 increased $3.6 million or 3.7% compared to 2007, which was up 8.8% from 2006. The increase in 2007 was mainly due to increased maintenance contract IT professional costs related to technology and operational assets.
Other real estate expense increased to $50.4 million compared $4.4 million for 2007 and $0.1 million for 2006. The increase is primarily due to increased OREO balances and write-downs resulting from declining property values, mainly in Arizona and Nevada.
Advertising expense was $30.7 million in 2008, $26.9 million in 2007 and $26.5 million in 2006. The increased expense in 2008 included increased Internet related advertising expenses.
FDIC premiums for 2008 increased $13.4 million or 206.2% compared to 2007, which was up 20.4% from 2006. We expect this expense to increase in 2009.
Other noninterest expense for 2008 decreased $4.2 million or 1.8% compared to 2007, which was up 5.5% from 2006. The increase in 2007 included an $8.1 million Visa litigation accrual and a $4.0 million write-down on repossessed equipment, which was collateral for an equipment lease. The Visa litigation accrual represents an estimate of the planned CB&T systems conversion. The increases in 2005 were primarilyCompany’s proportionate share of a contingent obligation to indemnify Visa Inc. for certain litigation matters. During 2008 the Company reduced the Visa accrual by $5.6 million as a result of additional consulting services associated with various ongoing projects relating to systems conversionsVisa funding a litigation escrow account and upgrades.settling certain covered litigation.
Merger related expenses for 2006 and 2005 are mainly incremental costs associated with the integration and system conversions of Amegy. See Note 3 of the Notes to Consolidated Financial Statements for additional information on merger related expenses.
The $26.1 million increase in amortization of core deposit and other intangibles is mainly related to the Amegy acquisition.
Other noninterest expense grew 20.0% over the amount in 2005, which was up 14.5% from 2004. The increase for 2006 resulted primarily from the acquisition of Amegy. The increase in 2005 resulted from higher bankcard expenses due to increased activity, increased operational losses which were unusually low for 2004, increased scanner costs for the NetDeposit product, increased data processing costs and travel expense resulting from the Company’s major systems projects, and increased fidelity insurance premiums.
Impairment Losses on Goodwill
During the fourth quarter of 20062008, 2007 and 2005,2006, the Company completed the annual goodwill impairment analysis as required by SFAS 142 and concluded there was no142. The annual goodwill impairment on the goodwill balances.
As previously disclosed, during the third quarter of 2004, the Company made the decision to reorganize the operations at Zions Bank International Ltd. (formerly Van der Moolen UK Ltd.) (“ZBI”) as a result of disappointing operating performance. The decision resultedanalysis completed in terminating the Euro-denominated bond trading operations and downsizing the U.S. dollar-denominated bond trading operations. This reorganization also resulted in restructuring charges in 2004 of $1.0 million, an impairment write-down of goodwill of $0.6 million and impairment of other intangibles of $0.2 million. During the fourth quarter of 2005, the Company closed the London office of ZBI and recognized restructuring charges of $2.4 million and an2008 resulted in total impairment write-down oflosses on goodwill of $0.6 million.$353.8 million at the NBA, Vectra, NSB, and P5 reporting units.
The primary causes of the impairment losses on goodwill in three of our reporting units as of December 31, 2008 were declines in market values of comparable companies, declines in acquisition transaction values, and reduced earnings at the reporting units, which resulted primarily from deterioration in credit quality of loan portfolios. See “Accounting for Goodwill” on page 42 for further discussion of the goodwill impairment.
Foreign Operations
Zions Bank and Amegy bothSix of our subsidiary banks each operate a foreign branchesbranch in Grand Cayman, Grand Cayman Islands, B.W.I. The branches only accept deposits from qualified domestic customers. While deposits in these branches are not subject to Federal Reserve BoardFRB reserve requirements or Federal Deposit Insurance CorporationFDIC insurance requirements, there are no federal or state income tax benefits to the Company or any customers as a result of these operations.
Foreign deposits at December 31, 2006, 2005,2008, 2007 and 20042006 totaled $2.6 billion, $2.2$3.4 billion and $0.4$2.6 billion, respectively, and averaged $3.2 billion for 2008, $2.7 billion for 2007, and $2.1 billion for 2006, $0.7 billion for 2005, and $0.3 billion for 2004.2006. All of these foreign deposits were related to domestic customers of the banks. See Schedule 3032 on page 7393 for foreign loans outstanding.
In addition to the Grand Cayman branch, Zions Bank, through its wholly-owned subsidiary ZBI, had an office in the United Kingdom that provided sales support for its U.S. Dollar trading operations. The office was closed during the fourth quarter of 2005.
Income Taxes
The Company’s income tax expensebenefit for 20062008 was $318.0$43.4 million compared to $263.4income tax expense of $235.7 million for 20052007 and $220.1$318.0 million for 2004.2006. The Company’s effective income tax rates, including the effects of minority interest, were 14.0% in 2008, 32.3% in 2007, and 35.3% in 2006, 35.4% in 2005, and 35.2% in 2004.2006. See Note 15 of the Notes to Consolidated Financial Statements for more information on income taxes.
The average effective tax rate in 2008 was lower than in prior years mainly because of the nondeductible goodwill impairment charges. Also increased securities impairment charges, loan loss provision, and OREO charge-downs recorded in 2008 affected taxable revenue, thereby increasing the proportion of nontaxable income relative to total income. During 2008, the Company reduced its liability for unrecognized tax benefits by approximately $9.6 million, net of any federal and/or state tax benefits. Of this reduction, $5.2 million decreased the Company’s tax provision for 2008 and $4.4 million reduced tax-related balance sheet accounts.
During the fourth quarter of 2007, the Company reduced its liability for unrecognized tax benefits by approximately $12.2 million, net of any federal and/or state tax benefits. Of this reduction, $9.1 million decreased the Company’s tax provision for 2007 and $3.1 million reduced goodwill. The primary cause of the decrease was the closing of various state statutes of limitations and tax examinations. As a result of the recognition of certain tax benefits, accrued interest payable on unrecognized tax benefits was also reduced by approximately $2.8 million, net of any federal and/or state benefits. Since the Company classifies interest and penalties related to tax matters as a component of tax expense, the reduction in interest on unrecognized tax benefits also resulted in a decrease to the Company’s tax provision for 2007. The average effective tax rate in 2007 also was lower than in prior years because the securities impairment charges recorded in 2007 affected taxable revenue, thereby increasing the proportion of nontaxable income relative to total income.
In 2004, the Company signed an agreement that confirmed and implemented its award of a $100 million allocation of tax credit authority under the Community Development Financial Institutions Fund set up by the U.S. Government. Under the program, Zions has invested $90$100 million as of December 31, 2006,2008, in a wholly-owned subsidiary which makes qualifying loans and investments. In
return, Zions receives federal income tax credits that will be recognized over seven years, including the year in which the funds were invested in the subsidiary. Zions invested $60$10 million in its subsidiary in 2004, an additional $20 million in 2005,2006 and anothera final contribution of $10 million during 2006. Zions expects to fundunder the remaining $10 millionterms of our agreement during 2007. Income tax expense was reduced by $5.8 million for 2008, $5.6 million for 2007, and $4.5 million for 2006 $4.0 million for 2005, and $3.0 million for 2004 as a result of these tax credits. We expect that we will be able to reduce the Company’s federal income tax payments by a total of $39 million over the life of this award, which is expected to be for the years 2004 through 2013.
BUSINESS SEGMENT RESULTS
The Company manages its banking operations and prepares management reports with a primary focus on geographical area. Segments, other than the “Other” segment that are presented in the following discussion are based on geographical banking operations. The Other segment includes the Parent, Zions Management Services Company (“ZMSC”), nonbank financial service and financial technology subsidiaries, other smaller nonbank operating units, TCBO, which was opened during the fourth quarter of 2005 and is not yet significant, and eliminations of intercompany transactions.
Operating segment information is presented in the following discussion and in Note 22 of the Notes to Consolidated Financial Statements. The accounting policies of the individual segments are the same as those of the Company. The Company allocates centrally provided services to the business segments based upon estimated or actual usage of those services.
The Company previously had a program where interest rate swaps were recorded and managed by Zions Bank for the benefit of other banking subsidiaries and hedge income was allocated to the other banking subsidiaries. Starting in 2003, new interest rate swaps were recorded directly by the banking subsidiaries. For 2006, the amount of hedge income allocated (from) to Zions Bank on hedges remaining from the previous program was $0.6 million compared to $(0.2) million in 2005 and $(15.4) million in 2004. In the following schedules presenting operating segment information, the hedge income allocated to participating banking subsidiaries and the hedge income recognized directly by these banking subsidiaries are presented as separate line items.
Zions Bank and Subsidiaries
Zions Bank is headquartered in Salt Lake City, Utah and is primarily responsible for conducting the Company’s operations in Utah and Idaho. Zions Bank is the second2nd largest full-service commercial bank in Utah and the 11th6th largest in Idaho, as measured by domestic deposits booked in the state. Zions Bank alsooperates 112 full-service traditional branches and 29 banking centers in grocery stores. During the third quarter of 2008, Zions Bank entered into an agreement to exit 21 banking centers in grocery stores during the first quarter of 2009. The leases on these banking centers are being assumed by another bank and all loans and deposits will be transferred to nearby Zions Bank branch locations. Zions Bank includes some or allmost of the Company’s Capital Markets operations, which include Zions Direct, Inc., fixed income trading, correspondent banking, public finance, and trust and investment advisory, liquidity and hedging services for Lockhart. Zions Bank also includes Western National Trust Company. On January 1, 2008, Welman Holdings, Inc. (“Welman”), the parent of Contango Capital Advisors, Inc. (“Contango”), became a wealth management business launchedsubsidiary of the Parent. Results of operations for Zions Bank for 2007 and 2006 include Welman. In 2007 and 2006, Welman experienced after tax losses of $8.8 million and $7.9 million, respectively.
During 2008, the Utah economy added 2,500 new jobs or 0.2%, which was a much slower rate of increase than in the latter halfprior several years. Utah’s overall unemployment rate increased from 2.7% in 2007 to 3.7% in 2008. The goods production sector, including construction, contributed to the increased unemployment rate. Utah’s service sector did far better, adding approximately 12,000 jobs during 2008. Other growth areas in employment included education, health services and government and professional business services. Idaho ended 2008 with an unemployment rate of 2004,6.6% and Western National Trust Company, which together constitutea loss of 27,000 non-farm jobs. Both Utah and Idaho still significantly outperformed the Wealth Management Group,national unemployment rate of 7.2% as of December 2008. Softening home prices and slower real estate sales in both states contributed to the economic decline in 2008 and are also included in Zions Bank.expected to continue to be challenging through 2009.
SCHEDULE 12Schedule 11
ZIONS BANK
ZIONS BANK AND SUBSIDIARIES
(In millions)
| 2006 | 2005 | 2004 | ||||
CONDENSED INCOME STATEMENT | |||||||
Net interest income excluding hedge income | $ | 473.9 | 405.8 | 340.5 | |||
Hedge income (expense) recorded directly at subsidiary | (2.2) | 2.3 | 18.7 | ||||
Allocated hedge income (expense) | 0.6 | (0.2) | (15.4) | ||||
Net interest income | 472.3 | 407.9 | 343.8 | ||||
Noninterest income | 263.7 | 269.2 | 265.9 | ||||
Total revenue | 736.0 | 677.1 | 609.7 | ||||
Provision for loan losses | 19.9 | 26.0 | 24.7 | ||||
Noninterest expense | 426.1 | 391.1 | 350.4 | ||||
Impairment loss on goodwill | – | 0.6 | 0.6 | ||||
Income before income taxes and minority interest | 290.0 | 259.4 | 234.0 | ||||
Income tax expense | 98.1 | 85.4 | 77.6 | ||||
Minority interest | 0.1 | (0.1) | (0.3) | ||||
Net income | $ | 191.8 | 174.1 | 156.7 | |||
YEAR-END BALANCE SHEET DATA | |||||||
Total assets | $ | 14,823 | 12,651 | 11,880 | |||
Net loans and leases | 10,702 | 8,510 | 7,876 | ||||
Allowance for loan losses | 108 | 107 | 99 | ||||
Goodwill, core deposit and other intangibles | 27 | 27 | 30 | ||||
Noninterest-bearing demand deposits | 2,320 | 1,986 | 1,606 | ||||
Total deposits | 10,450 | 9,213 | 8,192 | ||||
Common equity | 972 | 836 | 756 | ||||
| (In millions) | 2008 | 2007 | 2006 | ||||||
CONDENSED INCOME STATEMENT | |||||||||
Net interest income | $ | 662.5 | 551.4 | 472.3 | |||||
Impairment losses on investment securities and valuation losses on securities purchased from Lockhart Funding | (92.5 | ) | (59.7 | ) | – | ||||
Other noninterest income | 207.3 | 236.8 | 263.7 | ||||||
Total revenue | 777.3 | 728.5 | 736.0 | ||||||
Provision for loan losses | 163.1 | 39.1 | 19.9 | ||||||
Noninterest expense | 463.4 | 463.2 | 426.1 | ||||||
Income before income taxes and minority interest | 150.8 | 226.2 | 290.0 | ||||||
Income tax expense | 44.0 | 72.2 | 98.1 | ||||||
Minority interest | 0.1 | 0.2 | 0.1 | ||||||
Net income | $ | 106.7 | 153.8 | 191.8 | |||||
YEAR-END BALANCE SHEET DATA | |||||||||
Total assets | $ | 20,778 | 18,446 | 14,823 | |||||
Total securities | 1,698 | 2,039 | 1,360 | ||||||
Net loans and leases | 14,734 | 12,997 | 10,702 | ||||||
Allowance for loan losses | 214 | 133 | 108 | ||||||
Goodwill, core deposit and other intangibles | 20 | 24 | 27 | ||||||
Noninterest-bearing demand deposits | 2,198 | 2,445 | 2,320 | ||||||
Total deposits | 16,118 | 11,644 | 10,450 | ||||||
Preferred equity | 250 | – | – | ||||||
Common equity | 1,044 | 1,048 | 972 | ||||||
Net income for Zions Bank increased 10.2%decreased 30.6% to $106.7 million for 2008 compared to $153.8 million for 2007 and $191.8 million for 2006 compared to $174.1 million for 2005 and $156.7 million for 2004. Results include the Wealth Management group which had after-tax net losses of $7.9 million in 2006, $6.2 million in 2005 and $3.9 million in 2004. Results for 2006 also include allocated interest income from hedges of $0.6 million compared with allocated interest expense of $0.2 million in 2005 and $15.4 million in 2004.
2006. The increase in earningsthe provision for loan losses of $124.0 million and the increase in impairment and valuation losses on securities of $32.8 million were the main factors causing the decrease in net income.
Nonperforming assets were $412.4 million at December 31, 2008 compared to $45.0 million one year ago, an increase of $367.4 million or 816.4%. This deterioration can be attributed to real estate secured loans which account for 79% of nonperforming loans. The ratio of nonperforming assets to net loans and other real estate owned at December 31, 2008 was 2.79% compared to 0.35% at December 31, 2007.
Net loan and lease charge-offs were $75.4 million for 2008 compared to $14.0 million for 2007 and $18.9 million for 2006. Total real estate secured net loan charge-offs were $35.3 million or 46.8% of total net charge-offs, including $29.9 million of net charge-offs related to construction and land development loans. Remaining net charge-offs are composed of $26.9 million in commercial loans and $13.2 million in consumer loans. The loan loss provision was $163.1 million for 2008 compared to $39.1 million for 2007 and $19.9 million for 2006.
The ratio of the allowance for loan losses to net loans and leases was 1.45%, 1.02% and 1.01% at December 31, 2008, 2007 and 2006, respectively.
Net interest income at Zions Bank for 2006 was driven by a 15.8%2008 increased 20.1%, or $64.4 million, increase$111.1 million. Average earning assets in net interest income. This increase resulted from strong loan growth2008 compared to 2007 are up $3.4 billion or 23.8%. During 2008, $1.2 billion in securities were purchased and recorded on the balance sheet as loans, as required by the Liquidity Agreement between Zions Bank and Lockhart. The primary trigger for these repurchases was the ratings downgrade of $2.2 billion, strong deposit growth, and an improved net interest margin. Balance sheet growth reflected strong economic conditions in Zions Bank’s primary markets, the bank’s successful sales efforts, and our decision not to securitize and sell anymonoline insurer that
provided the credit enhancement on the senior tranche of securitized small business loansloans. A smaller amount of securities were repurchased as required due to downgrades of the securities themselves. Finally, during 2008 Zions Bank also purchased varying amounts of commercial paper issued by Lockhart to fund its assets. Purchasing these securities and commercial paper contributed to the growth in 2006.average earning assets. The net interest margin increasedwas 3.77% for 2008, compared to 3.90% for 2007 and 3.89% for 2006, compared to 3.68% for 20052006. The biggest impact on margin compression has been the increase in nonperforming assets and 3.21% for 2004.
increased cost of deposits.
Noninterest income decreased 2.0%35.2% to $263.7$114.8 million compared to $269.2$177.1 million for 20052007 and $265.9$263.7 million for 2004.2006. The bank recognized impairment and valuation losses on securities of $92.5 million in 2008 and $59.7 million in 2007. Loan sales and servicing income declined $22.6 million as a result of prepayments, margin compression, no small business loan securitization in 2006, and $7.1to $17.3 million in pretax impairment charges on retained interests as previously discussed. A $9.52008 compared to $30.6 million increase in net gains on equity securities related2007, due to venturea decrease in average loans sold and other equity investments helped offset this decline, as did debit card interchange fees, which increased $8.7serviced. Fair value and nonhedge derivative loss was $28.6 million in 2008 compared to a loss of $15.0 million in 2007 and a gain of $0.7 million in 2006. Service chargesThe declines were mainly due to decreasing spreads between LIBOR and the prime rate which decreased nonhedge derivative income. Income from securities conduit was $5.5 million in 2008 compared to $18.2 million in 2007 and $32.2 million in 2006. The decrease in this income can be attributed to smaller spreads and average assets of the conduit being down significantly year over year. Trading income increased $5.3$8.6 million as a result ofin 2008 over 2007 primarily caused by the increased analysis feesspreads on commercial accounts. Income generatedcorporate bond trading.
Noninterest expense was $463.4 million in 2008, $463.2 million in 2007 and $426.1 million in 2006. Noninterest expense in 2007 and 2006 included $17.6 million and $14.3 million, respectively from providing servicesWelman. Salaries and employee benefits are down $17.8 million in 2008 compared to Lockhart declined by $2.82007. Welman’s salary and benefits expense was $12.0 million in 2007. Reductions in variable pay and employee benefits also contributed to this year over year decrease. Credit and OREO expenses are up $8.8 million. FDIC insurance increased $4.7 million. This is due to $32.2 million. Trading incomeincreased rates charged by FDIC as well as overall deposit growth. Bankcard expense increased $4.9 million caused by an increase in transaction volume as more customers utilize electronic payment methods. The efficiency ratio was 59.04% for 2008, as compared to 62.82% for 2007 and 57.15% for 2006.
Schedule 12
ZIONS BANK
| (Dollar amounts in millions) | 2008 | 2007 | 2006 | |||||||
PERFORMANCE RATIOS | ||||||||||
Return on average assets | 0.55 | % | 0.98 | % | 1.39 | % | ||||
Return on average common equity | 9.90 | % | 15.04 | % | 21.47 | % | ||||
Tangible return on average tangible common equity | 10.12 | % | 15.49 | % | 22.27 | % | ||||
Efficiency ratio | 59.04 | % | 62.82 | % | 57.15 | % | ||||
Net interest margin | 3.77 | % | 3.90 | % | 3.89 | % | ||||
RISK-BASED CAPITAL RATIOS | ||||||||||
Tier 1 leverage | 6.91 | % | 6.22 | % | 6.50 | % | ||||
Tier 1 risk-based capital | 8.32 | % | 6.84 | % | 7.26 | % | ||||
Total risk-based capital | 11.33 | % | 10.75 | % | 11.30 | % | ||||
CREDIT QUALITY | ||||||||||
Provision for loan losses | $ | 163.1 | 39.1 | 19.9 | ||||||
Net loan and lease charge-offs | 75.4 | 14.0 | 18.9 | |||||||
Ratio of net charge-offs to average loans and leases | 0.53 | % | 0.12 | % | 0.20 | % | ||||
Allowance for loan losses | $ | 214 | 133 | 108 | ||||||
Ratio of allowance for loan losses to net loans and leases | 1.45 | % | 1.02 | % | 1.01 | % | ||||
Nonperforming assets | $ | 412.4 | 45.0 | 17.1 | ||||||
Ratio of nonperforming assets to net loans and leases and other real estate owned | 2.79 | % | 0.35 | % | 0.16 | % | ||||
Accruing loans past due 90 days or more | $ | 83.5 | 36.5 | 8.5 | ||||||
Ratio of accruing loans past due 90 days or more to net loans and leases | 0.57 | % | 0.28 | % | 0.08 | % | ||||
OTHER INFORMATION | ||||||||||
Full-time equivalent employees | 2,525 | 2,668 | 2,687 | |||||||
Domestic offices: | ||||||||||
Traditional branches | 112 | 109 | 107 | |||||||
Banking centers in grocery stores | 29 | 29 | 29 | |||||||
Foreign office | 1 | 1 | 1 | |||||||
Total offices | 142 | 139 | 137 | |||||||
ATMs | 176 | 184 | 165 | |||||||
Net loans and leases grew $1.7 billion or 13.4%. Commercial lending increased $1.1 billion, commercial real estate loans are up $0.5 billion and consumer loans are up $0.1 billion in 2008 over 2007. Growth numbers include purchased securities that were recorded on balance sheet as loans as previously discussed.
Total deposits increased $4.5 billion or 38.4% in 2008 compared to 2007. $2.6 billion or 59.1% of this increase came from brokered deposits, inter-bank affiliate CDs were up $0.5 billion and money market deposits were up $0.9 billion over 2007. Our retail branch network saw significant improvement as well in growth during 4th quarter of 2008. The ratio of noninterest-bearing deposits to total deposits was 13.6% in 2008 and 21.0% in 2007.
Total securities declined by $5.5$341 million or 16.7% in 2008 compared to 2007. This decrease is mainly due to OTTI losses taken on securities that were subsequently sold to the Parent at fair value.
The total risk-based capital ratio at December 31, 2008 was 11.33% compared to 10.75% and 11.30% at December 31, 2007 and December 31, 2006, respectively. The increase in the total risk-based capital ratio for 2008 was mainly due to the restructuringissuance of trading operations previously discussed.qualifying tier 1 capital preferred stock of $250 million to the Parent in December 2008, a $159 million net decrease of qualifying tier 2 capital subordinated debt due to the Parent, and net income of $106.7 million.
Noninterest expense for 2006 increased $35.0 million or 8.9% from 2005. Increases for 2006 included a $15.3 million or 8.7% increase in salaries and benefits, of which $4.6 million was related to the expensing of stock options and restricted stock grants. Debt extinguishment costs related to the early retirement of trust-preferred debt accounted for $7.3 million of the increase. Bankcard expenses increased $4.8 million primarily because of volume increases in debit and credit card transactions.
Year-end deposits for 2006 increased 13.4% from 2005 or $1.2 billion compared to growth of $1.0 billion or 12.5% over 2004. Both the branch network and Internet Banking deposit products have contributed to this growth. In 2006, the mix of deposits improved with noninterest-bearing-demand deposits increasing 16.8%.
SCHEDULE 13
ZIONS BANK AND SUBSIDIARIES
| 2006 | 2005 | 2004 | ||||
PERFORMANCE RATIOS | ||||||
Return on average assets | 1.39% | 1.40% | 1.29% | |||
Return on average common equity | 21.47% | 22.22% | 21.24% | |||
Efficiency ratio | 57.15% | 56.95% | 56.46% | |||
Net interest margin | 3.89% | 3.68% | 3.21% | |||
OTHER INFORMATION | ||||||
Full-time equivalent employees | 2,687 | 2,517 | 2,563 | |||
Domestic offices: | ||||||
Traditional branches | 107 | 104 | 102 | |||
Banking centers in grocery stores | 29 | 30 | 31 | |||
Foreign office | 1 | 1 | 2 | |||
Total offices | 137 | 135 | 135 | |||
ATMs | 165 | 178 | 183 | |||
Nonperforming assets for Zions Bank were $17.1 million at December 31, 2006, down from $22.1 million at December 31, 2005. Accruing loans past due 90 days or more increased to $8.5 million compared to $4.4 million at year-end 2005. Net loan and lease charge-offs for 2006 were $18.9 million compared with $17.5 million for 2005. For 2006, Zions Bank’s loan loss provision was $19.9 million compared with $26.0 million for 2005 and $24.7 million for 2004. The decreased provision for 2006 was mainly driven by improved credit quality.
During 2004, Zions Investment Securities, Inc. introduced its new “Zions Direct” online trading platform and in 2005 the name of the company was changed to Zions Direct, Inc. Through Zions Direct, retail customers can execute online stock and bond trades for $10.95 per trade. Zions Direct customers also have access to more than 9,000 mutual funds and the ability to search one of the largest inventories of bonds through “Bonds for Less.” Zions Direct provides convenient access, free education and real-time information for executing trades, monitoring portfolios and conducting research.
During 2006,2008, Zions Bank ranked as Utah’s top SBA 7(a) lender for the thirteenth15th consecutive year and ranked first1st in Idaho’s Boise District for the fifthseventh consecutive year. US Banker Magazine awarded Zions Bank also expanded its National Real Estate Group, which makes real estate-secured loans at low loan-to-value ratios to small businesses across the country. The Group funded nearly $1.2 billion#2 Women’s Banking Team in new loans in both 2006 and 2005. Also, in 2006the nation. Zions Bank expanded its treasury management product offeringreceived Greenwich Excellence Awards in Overall Satisfaction (national and has seen positive results from this expansion.
western region) and Overall Satisfaction with Treasury Management (national and western region).
California Bank & Trust
CB&TCalifornia Bank & Trust is a full service commercial bank headquartered in San Diego, California, and is the fourteentheleventh largest financial institutionfull-service commercial bank in California as measured by domestic deposits booked in the state. ItCB&T operates 9190 full-service traditional branch offices and 7 loan production officesbranches throughout the state, and 7 loan production offices in other states.state. CB&T manages its branch network by a regional structure, allowing decision-making to remain as close as possible to the customer. These regions include San Diego, Los Angeles, Orange County, San Francisco, Sacramento, and the Central Valley. In addition to the regional structure, core businesses are managed functionally. These functions include retail banking, corporate and commercial banking, construction and commercial real estate financing, and SBA lending. CB&T plans to continue its emphasis on relationship banking providing commercial, real estate and consumer lending, depository services, international banking, cash management, and community development services.
California represents about 13% of the nation’s GDP. Like other parts of the Southwest, it has been experiencing significant declines in real estate values and the adverse effects of a recessionary economy. The state faces a serious budget shortfall that has been estimated at more than $40 billion. Its unemployment rate is 9.3% as of December 31, 2008. Any turnaround in economic prospects is not likely to happen quickly. Unemployment, home foreclosures, and bank credit problems are all increasing. CB&T is focused on maintaining its underwriting and pricing standards as it endeavors to develop new customer relationships among small business and middle market companies.
SCHEDULE 14
Schedule 13
CALIFORNIA BANK & TRUST
(In millions)
| 2006 | 2005 | 2004 | ||||
CONDENSED INCOME STATEMENT | |||||||
Net interest income excluding hedge income | $ | 487.9 | 451.0 | 396.4 | |||
Hedge income (expense) recorded directly at subsidiary | (18.5) | 0.4 | 13.8 | ||||
Net interest income | 469.4 | 451.4 | 410.2 | ||||
Noninterest income | 80.7 | 75.0 | 77.5 | ||||
Total revenue | 550.1 | 526.4 | 487.7 | ||||
Provision for loan losses | 15.0 | 9.9 | 10.7 | ||||
Noninterest expense | 244.6 | 243.9 | 234.1 | ||||
Income before income taxes | 290.5 | 272.6 | 242.9 | ||||
Income tax expense | 117.9 | 109.7 | 97.1 | ||||
Net income | $ | 172.6 | 162.9 | 145.8 | |||
YEAR-END BALANCE SHEET DATA | |||||||
Total assets | $ | 10,416 | 10,896 | 10,186 | |||
Net loans and leases | 8,092 | 7,671 | 7,132 | ||||
Allowance for loan losses | 95 | 91 | 86 | ||||
Goodwill, core deposit and other intangibles | 400 | 408 | 419 | ||||
Noninterest-bearing demand deposits | 2,824 | 2,952 | 2,652 | ||||
Total deposits | 8,410 | 8,896 | 8,329 | ||||
Common equity | 1,123 | 1,072 | 1,031 | ||||
CONDENSED INCOME STATEMENT Net interest income Impairment losses on investment securities Other noninterest income Total revenue Provision for loan losses Noninterest expense Income before income taxes Income tax expense Net income YEAR-END BALANCE SHEET DATA Total assets Total securities Net loans and leases Allowance for loan losses Goodwill, core deposit and other intangibles Noninterest-bearing demand deposits Total deposits Preferred equity Common equity(In millions) 2008 2007 2006 $ 414.3 434.8 469.4 (118.0 ) (79.2 ) – 82.6 87.3 80.7 378.9 442.9 550.1 82.9 33.5 15.0 239.0 230.8 244.6 57.0 178.6 290.5 18.4 71.2 117.9 $ 38.6 107.4 172.6 $ 10,137 10,156 10,416 654 951 1,255 7,867 7,792 8,092 116 105 95 386 390 400 2,338 2,509 2,824 7,964 8,082 8,410 158 – – 1,097 1,067 1,123
Net income increased 6.0%for CB&T decreased 64.1% to $38.6 million for 2008 compared to $107.4 million for 2007 and $172.6 million for 2006. The decrease in 2006 compared with $162.9 million for 2005, and $145.8 million for 2004. Loan growth, interest rate risk management, credit management, customer profitability management and expense control were the primary contributors to the positive results of operations for 2006 while the loss of deposits and higher cost of funding negatively impacted earnings.
Net interestnet income for 2006 increased $18.0 million or 4.0% to $469.4 million compared to $451.4 million for 2005 and $410.2 million for 2004. CB&T’s net interest margin was 4.81%, 4.91% and 4.78% for 2006, 2005 and 2004, respectively. The bank strives to maintain a slightly asset-sensitive position with regard to interest rate risk management, meaning that when market interest rates rise, the net interest margin increases. Net interest income in 2006 increased although the margin narrowed due to the flattening yield curve and the competitive pressures of increases in interest rates on deposits and increased reliance on higher cost nondeposit funding.
The efficiency ratio has improved in each of the past three years: 44.4% for 2006, 46.3% for 2005, and 47.9% for 2004. CB&T continues to focus on managing operating efficiencies and costs in relation to revenue. Total revenue was $550.1 million, an increase of 4.5% over $526.4 million in 2005. Noninterest expense grew to $244.6 million, an increase of 0.3% over $243.9 million in 2005. This modest expense growth was primarily due to strong controls over staffing levelsrecognition of impairment losses on investment securities, increased provision for loan losses and other variable expenses. Full-time equivalent employees declined to 1,659a lesser extent a decrease in net interest income.
Nonperforming assets were $147.0 million at December 2006 from 1,673 in December, 2005.
SCHEDULE 15
CALIFORNIA BANK & TRUST
| 2006 | 2005 | 2004 | ||||
PERFORMANCE RATIOS | ||||||
Return on average assets | 1.59% | 1.59% | 1.51% | |||
Return on average common equity | 15.40% | 15.53% | 14.52% | |||
Efficiency ratio | 44.42% | 46.29% | 47.93% | |||
Net interest margin | 4.81% | 4.91% | 4.78% | |||
OTHER INFORMATION | ||||||
Full-time equivalent employees | 1,659 | 1,673 | 1,722 | |||
Domestic offices: | ||||||
Traditional branches | 91 | 91 | 91 | |||
ATMs | 103 | 105 | 107 | |||
Net31, 2008 compared to $62.4 million one year ago, an increase of $84.6 million or 135.6%. Nonperforming assets include $135.0 million of nonperforming loans and leases grew $421$12.0 million or 5.5% in 2006of OREO for 2008 compared to 2005. Commercial, small business,$62.3 million of nonperforming loans and no OREO for 2007. The majority of the increase in nonperforming loans is attributable to deterioration of commercial real estate, construction, and commercial real estate loans grew modestly in 2006 compared to 2005, while consumer loans declined and residential real estate loans remained flat.land development loans. CB&T does not expect overall loan growthexperienced moderate increases in 2007 to be much different than 2006 given the tenuous business climate particularly in its primary Southern Californianonperforming commercial and residential real estate construction and development markets.
Total deposits declined $486 million or 5.5% in 2006 compared to 2005.mortgage loans. The ratio of noninterest-bearing deposits to total deposits was 33.6% and 33.2% for 2006 and 2005, respectively. Reflecting general banking conditions in California, CB&T was challenged in its deposit growth in 2006 and expects to continue to be challenged in 2007.
Nonperforming assets were $27.1 million at December 31, 2006 compared to $20.0 million one year ago. Nonperformingnonperforming assets to net loans and other real estate owned at December 31, 20062008 was 0.34%1.87% compared to 0.26%0.80% at December 31, 2005. 2007.
Net loan and lease charge-offs were $61.8 million for 2008 compared with $23.1 million for 2007 and $10.9 million for 2006 compared with $4.9 million for 2005. CB&T’s2006. Net charge-offs in 2008 were primarily construction, land and commercial real estate loans. The loan loss provision was $82.9 million for 2008 compared to $33.5 million for 2007 and $15.0 million for 2006 compared to $9.9 million for 2005. The ratio of the allowance for loan losses to nonperforming loans was 360.3% at year-end 2006 compared to 512.1% at year-end 2005.2006. The ratio of the allowance for loan losses to net loans and leases was 1.17%1.48% and 1.18%1.35% at December 31, 20062008 and 2005,2007, respectively.
Net interest income at CB&T for 2008 decreased 4.7%, or $20.5 million. This decrease was caused by the yield on earning assets declining more than the rate on interest-bearing funding sources. Average earning assets were $9.2 billion for 2008, essentially unchanged from $9.1 billion for 2007. Average interest-bearing deposits and borrowings grew modestly, being $6.7 billion and $6.4 billion for 2008 and 2007, respectively. The net interest margin was 4.51% for 2008, compared to 4.76% for 2007 and 4.81% for 2006. Considering that the Federal Funds rate declined by 400 basis points during 2008, CB&T’s net interest margin was relatively stable decreasing only 25 basis points compared to 2007. The margin stability was achieved through managing interest rate risk by utilizing interest rate swaps as hedges and pro-active product management.
Noninterest income, excluding impairment losses on securities, decreased 5.4% to $82.6 million compared to $87.3 million for 2007 which was up from $80.7 million for 2006. The bank recognized OTTI losses on securities of $118.0 million for 2008 compared to $79.2 million for 2007. The Parent purchased the impaired securities at fair value.
Noninterest expense for 2008 increased $8.2 million or 3.6% to $239.0 million from $230.8 million for 2007 and $244.6 million for 2006. At the time of CB&T’s data processing conversion to the Zion’s platform in August 2007, many functions were transferred to ZMSC. Primarily as a result of the transfer of personnel, centralization of functions and termination of outsourced data processing contracts, salaries and employee benefits, occupancy, and data processing for 2008 in aggregate decreased by $12.5 million to $151.4 million compared to $163.9 million for 2007. This decrease was offset by an increase in other expenses, including allocated affiliate services, of $20.7 million. Furniture and equipment and amortization of core deposit and other intangibles in aggregate decreased $4.8 million in 2008 compared to 2007 while advertising and OREO expense in aggregate increased $4.8 million in 2008 compared to 2007. The efficiency ratio was 63.03% for 2008 compared to 52.07% for 2007 and 44.42% for 2006. The pro forma efficiency ratio without the impairment losses on securities was 48.07% for 2008 and 44.18% for 2007.
Schedule 14
CALIFORNIA BANK & TRUST
| (Dollar amounts in millions) | 2008 | 2007 | 2006 | |||||||
PERFORMANCE RATIOS | ||||||||||
Return on average assets | 0.38 | % | 1.06 | % | 1.59 | % | ||||
Return on average common equity | 3.59 | % | 9.83 | % | 15.40 | % | ||||
Tangible return on average tangible common equity | 5.95 | % | 16.02 | % | 24.68 | % | ||||
Efficiency ratio | 63.03 | % | 52.07 | % | 44.42 | % | ||||
Net interest margin | 4.51 | % | 4.76 | % | 4.81 | % | ||||
RISK-BASED CAPITAL RATIOS | ||||||||||
Tier 1 leverage | 8.77 | % | 6.97 | % | 7.36 | % | ||||
Tier 1 risk-based capital | 8.33 | % | 7.33 | % | 7.19 | % | ||||
Total risk-based capital | 11.05 | % | 11.58 | % | 11.50 | % | ||||
CREDIT QUALITY | ||||||||||
Provision for loan losses | $ | 82.9 | 33.5 | 15.0 | ||||||
Net loan and lease charge-offs | 61.8 | 23.1 | 10.9 | |||||||
Ratio of net charge-offs to average loans and leases | 0.78 | % | 0.29 | % | 0.14 | % | ||||
Allowance for loan losses | $ | 116 | 105 | 95 | ||||||
Ratio of allowance for loan losses to net loans and leases | 1.48 | % | 1.35 | % | 1.17 | % | ||||
Nonperforming assets | $ | 147.0 | 62.4 | 27.1 | ||||||
Ratio of nonperforming assets to net loans and leases and other real estate owned | 1.87 | % | 0.80 | % | 0.34 | % | ||||
Accruing loans past due 90 days or more | $ | 7.4 | 13.0 | 3.5 | ||||||
Ratio of accruing loans past due 90 days or more to net loans and leases | 0.09 | % | 0.17 | % | 0.04 | % | ||||
OTHER INFORMATION | ||||||||||
Full-time equivalent employees | 1,474 | 1,572 | 1,659 | |||||||
Domestic offices: | ||||||||||
Traditional branches | 90 | 90 | 91 | |||||||
Foreign office | 1 | – | – | |||||||
Total offices | 91 | 90 | 91 | |||||||
ATMs | 103 | 103 | 103 | |||||||
Net loans and leases marginally increased $75 million or 1.0% in 2008 compared to 2007. Commercial loans, commercial real estate term loans, and consumer home equity loans grew $175 million, $188 million and $32 million, respectively, in 2008 compared to 2007, while construction and land development and 1-4 family residential loans declined $218 million and $95 million, respectively, for the same periods. Changing the mix of these major loan categories helped CB&T diversify its credit risks, particularly lowering the concentration in land and construction loans. CB&T continues to emphasize growing the commercial and small business loan portfolios and managing the run-off of construction and land development loans.
Total deposits declined $118 million or 1.5% in 2008 compared to 2007. The ratio of noninterest-bearing deposits to total deposits was 29.4% in 2008 and 31.0% in 2007. CB&T’s goal of relationship banking includes providing customers with checking accounts, treasury management services, sweep accounts and other deposit products. CB&T generally does not rely on noncore deposits such as brokered funds.
Total securities declined $297 million or 31.2% in 2008 compared to 2007. The change was driven primarily by the sales of the impaired securities to the Parent.
At December 31, 2008 tier 1 leverage, tier 1 risk-based and total risk-based capital ratios were 8.77%, 8.33% and 11.05%, respectively, compared to 6.97%, 7.33% and 11.58%, respectively, at December 31, 2007. The improvement in the tier 1 ratios was primarily due to the issuance of preferred stock to the Parent of $157.5 million in December 2008. Tier 1 capital was $873 million at the end of 2008 compared to $689 million at 2007. Total risk-based capital was $1.2 billion at the end of 2008 compared to $1.1 billion at 2007. This small change was due to the offsetting effects of the issuance of the preferred stock and the net redemption of $132.5 million of subordinated debt (which qualified as tier 2 capital) due to the Parent. The total risk-based capital ratio decreased due to an increase of risk-weighted assets to $10.5 billion compared to $9.4 billion at the end of 2008 and 2007, respectively.
Subsequent to year-end, on February 6, 2009, CB&T was the winning bidder for the assets and deposits of the failed Alliance Bank in Southern California. Alliance operated five branches and CB&T acquired approximately $1.1 billion of loans and $0.9 billion of deposits (including $0.4 billion of brokered deposits that we do not expect to retain) from the FDIC under a loss sharing agreement that affords significant credit risk protection to CB&T.
Amegy Corporation
Amegy is headquartered in Houston, Texas and operates Amegy Bank, the tenth8th largest full-service commercial bank in Texas as measured by domestic deposits in the state. Amegy operates 64offers 69 full-service traditional branches and 8three banking centers in grocery stores in the Houston metropolitan area, six traditional branches in the Dallas metropolitan area and five traditional branches and one loan production office in the Dallas metropolitan area. During the first quarter of 2007, Amegy continued its expansion into the attractive markets in Texas by opening its first location in San Antonio, a loan production office to serve the Central Texas market.Antonio. Amegy also operates a mortgage company (“Amegy Mortgage Company”), a broker-dealer (Amegy Investments, Inc)(“Amegy Investments”), an insurance agency (“Amegy Insurance Agency”), and a trust and private bank group, and a mortgage bank (Amegy Mortgage Company).
banking group.
The Texas economy iscontinued to outperform the eleventh largestnation with employers adding 153,600 jobs in the worldpast 12 months, compared with two-thirdsjob losses of all state economic activity occurring in2.6 million nationwide during the same period. Among the 15 states that reported employment growth from November 2007 to November 2008, Texas accounted for 71% of entire job gains. Amegy’s three primary markets – Houston, Dallas and San Antonio – continued to experience job growth in Houston2008, as well. Together, they and Dallas. Houston has a diversified economy driven by energy, healthcare, andother markets in Texas, have kept the state’s unemployment rate at or below the national average for 24 consecutive months. Recognized as an international business and in 2006 it added 75,500leader, the Houston Metropolitan Statistical Area (“MSA”) gained 57,300 jobs forfrom December 2007 to December 2008, growing 2.2% to a total of 2.5more than 2.6 million jobs. Dallas also has a diversified economyHouston outperformed the state, which grew 1.5%. The Dallas-Fort Worth-Arlington MSA, driven by the telecommunications, distributiontrade, transportation and transportation industries. The Dallas-Fort Worth metroplex added 80,400 jobs in 2006 forutilities industries, had job growth of 1.4% to a total of 2.9 million jobs. Themore than 3 million. A strong and growing healthcare industry helped San Antonio economy added approximately 27,000increase jobs in 2006 based on strong growth in healthcare, tourism, and trade with a growing manufacturing sector. In 2007 Amegy plansby 1.8% to continue its expansion in its primary markets and plans to open 5 traditional branches in the Houston market, 2 in the Dallas/Ft. Worth metroplex, and expand its branch presence in San Antonio.nearly 860,000 jobs.
Schedule 15
AMEGY CORPORATION
| (In millions) | 2008 | 2007 | 2006 | ||||
CONDENSED INCOME STATEMENT | |||||||
Net interest income | $ | 370.1 | 331.3 | 304.7 | |||
Noninterest income | 192.9 | 126.7 | 114.9 | ||||
Total revenue | 563.0 | 458.0 | 419.6 | ||||
Provision for loan losses | 71.9 | 21.2 | 7.8 | ||||
Noninterest expense | 305.2 | 295.6 | 283.5 | ||||
Income before income taxes and minority interest | 185.9 | 141.2 | 128.3 | ||||
Income tax expense | 60.5 | 46.7 | 39.5 | ||||
Minority interest | 0.3 | 0.1 | 1.8 | ||||
Net income | $ | 125.1 | 94.4 | 87.0 | |||
YEAR-END BALANCE SHEET DATA | |||||||
Total assets | $ | 12,406 | 11,675 | 10,366 | |||
Total securities | 693 | 895 | 1,266 | ||||
Net loans and leases | 9,129 | 7,902 | 6,352 | ||||
Allowance for loan losses | 116 | 68 | 55 | ||||
Goodwill, core deposit and other intangibles | 1,334 | 1,355 | 1,370 | ||||
Noninterest-bearing demand deposits | 2,709 | 2,243 | 2,245 | ||||
Total deposits | 8,625 | 8,058 | 7,329 | ||||
Preferred equity | 80 | – | – | ||||
Common equity | 2,049 | 1,932 | 1,805 | ||||
In 2006, Amegy completed its first full year as part of the Company with record levels of performance in many key areas. Net income for the year wasAmegy increased 32.5% to $125.1 million for 2008 compared to $94.4 million for 2007 and $87.0 million. The earnings performancemillion for the year was driven by record levels of loan growth and strong asset quality, record level of fee income in three of the fee income groups, and improved levels of net interest margin and operating expenses.
SCHEDULE 16
AMEGY CORPORATION
(In millions)
| 2006 | 2005 (1) | ||||
CONDENSED INCOME STATEMENT | ||||||
Net interest income excluding hedge income | $ | 306.0 | 25.5 | |||
Hedge expense recorded directly at subsidiary | (1.3 | ) | – | |||
Net interest income | 304.7 | 25.5 | ||||
Noninterest income | 114.9 | 9.0 | ||||
Total revenue | 419.6 | 34.5 | ||||
Provision for loan losses | 7.8 | – | ||||
Noninterest expense | 283.5 | 23.7 | ||||
Income before income taxes and minority interest | 128.3 | 10.8 | ||||
Income tax expense | 39.5 | 3.3 | ||||
Minority interest | 1.8 | – | ||||
Net income | $ | 87.0 | 7.5 | |||
YEAR-END BALANCE SHEET DATA | ||||||
Total assets | $ | 10,366 | 9,350 | |||
Net loans and leases | 6,352 | 5,389 | ||||
Allowance for loan losses | 55 | 49 | ||||
Goodwill, core deposit and other intangibles | 1,370 | 1,404 | ||||
Noninterest-bearing demand deposits | 2,245 | 2,145 | ||||
Total deposits | 7,329 | 6,905 | ||||
Common equity | 1,805 | 1,768 | ||||
Net income was driven by net interest income. The net interest margin for the year was 4.36%, resulting from strong loan growth, improved liability pricing, and an improved earning asset mix. Amegy maintained its strong sales culture, and 2006 was a record year in terms of new loan originations with period end loan growth of $963 million, or a 17.9% increase.2006. The increase in net income was primarily due to continued robust loan growth, gains realized on the termination of interest rate swap contracts (which were recognized immediately at the bank level, but which are being amortized over the remaining life of the contracts at the consolidated Zions Bancorporation level as described in the “Other” segment on page 82), strong fee income generation and only moderate increases in operating expenses. These positive factors were partially offset by an increased provision for loan losses and a decrease in the net interest margin.
Nonperforming assets were $56.7 million at December 31, 2008 compared to $45.6 million one year ago, an increase of $11.1 million or 24.3%. The increase in nonperforming assets was due to deterioration in the segment of the loan portfolio was primarily focused in the commercial and industrial sector with continued growth in the real estate lending groups; this growth reflected the vibrant Texas economy, and a stable and talented corps of relationship officers.
Noninterest income was $114.9 million for the year. Record fee income was produced by each of the Capital Markets, Letter of Credit, and Retail Services groups.
During 2006, Amegy converted to the Zions operating systems platform. Noninterest expenses were impacted by costs related to merger, severance,home builders, lot developers, and conversion activities. Total operating expenses for 2006 were $283.5 million. Merger related expenses incurred by Amegy during the year were $11.7 million. In additionincome producing property developers. Nonperforming assets to the merger related expenses incurred, amortization of core deposit and other intangibles totaled $28.4 million in 2006. Reflecting the impact of these merger related items, the efficiency ratio was 66.8% for 2006.
Deposits grew by 6.1% or $424 million to $7.3 billion, including $100 million of growth in noninterest-bearing demand deposits.
SCHEDULE 17
AMEGY CORPORATION
| 2006 | 2005 (1) | |||
PERFORMANCE RATIOS | ||||
Return on average assets | 0.93% | 0.97% | ||
Return on average common equity | 4.87% | 4.97% | ||
Efficiency ratio | 66.79% | 68.03% | ||
Net interest margin | 4.36% | 4.44% | ||
OTHER INFORMATION | ||||
Full-time equivalent employees | 1,599 | 1,983 | ||
Domestic offices: | ||||
Traditional branches | 69 | 67 | ||
Banking centers in grocery stores | 8 | 15 | ||
Foreign office | 1 | 1 | ||
Total offices | 78 | 83 | ||
ATMs | 129 | 130 | ||
Fiscal year 2006 was also one of Amegy’s best years in terms of asset quality. Net loan and lease charge-offs for the year were $1.9 million or 3 basis points of average outstanding loans. Nonaccrualnet loans and other real estate owned totaled $15.7at December 31, 2008 was 0.62% compared to 0.58% at December 31, 2007.
Net loan and lease charge-offs were $24.1 million at year-end, or 0.25%for 2008 compared with $9.0 million for 2007 and $1.9 million for 2006. Net loan and lease charge-offs in 2008 were primarily in the commercial and industrial loan portfolio. The loan loss provision was $71.9 million for 2008 compared to $21.2 million for 2007 and $7.8 million for 2006. The ratio of the allowance for loan losses to net loans and leases was 1.27% at December 31, 2008 and 0.86% and 0.87% at December 31, 2007 and 2006, respectively.
Net interest income increased by 11.7% for 2008 due to a 17.1%, or $1.4 billion increase in average earning assets and a reduction in the cost of funds. The net interest margin was 3.92% for 2008, compared to 4.13% for 2007 and 4.36% for 2006.
Noninterest income increased 52.2% to $192.9 million compared to $126.7 million for 2007 and $114.9 million for 2006. The largest increases in noninterest income were due to the income received from
ineffectiveness and the early termination of interest rate hedges of $36.6 million, an $11.8 million or 28.9% increase in service charge income and a $5.9 million or 189.7% increase in income on other real estate owned.equity investments.
Noninterest expense was actively managed during 2008 increasing only $9.6 million or 3.2% from 2007. Increases for 2008 included a $6.2 million or 4.7% increase in salaries and benefits, a $3.4 million increase in the cost of FDIC insurance and $1.7 million in expenses related to the recovery from Hurricane Ike in September. The efficiency ratio improved to 53.80% in 2008 from 63.83% in 2007 and 66.79% in 2006. The change in the efficiency ratio was largely due to the gains realized on the termination of interest rate swap contracts as well as from strict expense management and the benefits derived from the sharing of technology resources with Zions.
Schedule 16
AMEGY CORPORATION
| (Dollar amounts in millions) | 2008 | 2007 | 2006 | |||||||
PERFORMANCE RATIOS | ||||||||||
Return on average assets | 1.04 | % | 0.91 | % | 0.93 | % | ||||
Return on average common equity | 6.28 | % | 5.10 | % | 4.87 | % | ||||
Tangible return on average tangible common equity | 21.43 | % | 22.46 | % | 26.25 | % | ||||
Efficiency ratio | 53.80 | % | 63.83 | % | 66.79 | % | ||||
Net interest margin | 3.92 | % | 4.13 | % | 4.36 | % | ||||
RISK-BASED CAPITAL RATIOS1 | ||||||||||
Tier 1 leverage | 8.67 | % | 7.58 | % | 7.64 | % | ||||
Tier 1 risk-based capital | 8.10 | % | 6.90 | % | 7.19 | % | ||||
Total risk-based capital | 11.13 | % | 10.94 | % | 10.35 | % | ||||
CREDIT QUALITY | ||||||||||
Provision for loan losses | $ | 71.9 | 21.2 | 7.8 | ||||||
Net loan and lease charge-offs | 24.1 | 9.0 | 1.9 | |||||||
Ratio of net charge-offs to average loans and leases | 0.28 | % | 0.13 | % | 0.03 | % | ||||
Allowance for loan losses | $ | 116 | 68 | 55 | ||||||
Ratio of allowance for loan losses to net loans and leases | 1.27 | % | 0.86 | % | 0.87 | % | ||||
Nonperforming assets | $ | 56.7 | 45.6 | 15.7 | ||||||
Ratio of nonperforming assets to net loans and leases and other real estate owned | 0.62 | % | 0.58 | % | 0.25 | % | ||||
Accruing loans past due 90 days or more | $ | 5.5 | 3.8 | 9.7 | ||||||
Ratio of accruing loans past due 90 days or more to net loans and leases | 0.06 | % | 0.05 | % | 0.15 | % | ||||
OTHER INFORMATION | ||||||||||
Full-time equivalent employees | 1,756 | 1,694 | 1,599 | |||||||
Domestic offices: | ||||||||||
Traditional branches | 80 | 79 | 70 | |||||||
Banking centers in grocery stores | 3 | 8 | 8 | |||||||
Foreign office | 1 | 1 | 1 | |||||||
Total offices | 84 | 88 | 79 | |||||||
ATMs | 140 | 142 | 129 | |||||||
1 | Capital ratios are for Amegy Bank N.A. |
Net loans and leases expanded $1.2 billion or 15.5% to $9.1 billion in 2008 compared to $7.9 billion in 2007. Most categories of loans grew in 2008 compared to 2007, with over half of the total growth concentrated in the commercial lending portfolio. Amegy continues to be active in new loan originations by seeking borrowers meeting both its pricing and credit criteria.
Total deposits grew $567 million or 7.0% in 2008 compared to 2007, $466 million of this growth was in noninterest-bearing deposits. The ratio of noninterest-bearing deposits to total deposits was 31.4% in 2008 and 27.8% in 2007. Amegy continues to be a leader in providing treasury management services to commercial clients and in serving the retail and small business enterprises through its branch network.
Total securities declined $202 million or 22.6% in 2008 compared to 2007 through maturities, calls and principal pay-downs. This change was driven by a continuing effort to maximize balance sheet efficiency. Amegy did not recognize any impairment or valuation losses in its securities portfolio in either 2008 or 2007.
The total risk-based capital ratio at December 31, 2008 was 11.13% compared to 10.94% and 10.35% at December 31, 2007 and December 31, 2006, respectively. The increase in the total risk-based capital ratio for 2008 was mainly due to the issuance of qualifying tier 1 capital preferred stock of $80 million to the Parent in December 2008, a $133 million net decrease of qualifying tier 2 capital subordinated debt due to the Parent and net income of $125.1 million.
National Bank of Arizona
NBA, the Company’s financial institution responsible for operations inNational Bank of Arizona is headquartered in Tucson, Arizona, and is the fourth4th largest full-service commercial bank in Arizona as measured by domestic deposits booked in the state. NBA’s branch networkNBA operates 79 full-service traditional branches and provides a full range of banking services to its customers. During 2008, NBA expanded its depository base through the acquisition of certain Arizona depository customers held by Silver State Bank branches, a failed financial institution. The acquisition comprised less than 5% of the total deposit balance of NBA at the date of purchase.
The Arizona economy has been contracting since the 3rd quarter of 2007. Normally, the state’s economy follows the national economy; however, in this current recession, Arizona, along with many Western states lead this decline. The decline continued to be fairly severe during 2008. The state’s unemployment grew by over 56% to 6.1% in the twelve months ending October 31, 2008. The state’s population grew slightly in the same twelve month period by 1.6% to over 6.4 million. However, the pace of quarterly net migration into the state slowed to just over 8,000 in the third quarter of 2008, nearly a fourth of the level experienced in the same quarter in 2007. Statewide residential building permits dropped to just over 27,000, a decline of 43% in the fiscal year. Indications are that 2009 will remain challenging, as unemployment is presently located in 36 communities spanning the entire state. Arizona’sexpected to rise to nearly 8%, population growth continuesis anticipated to be onedecline to 1.2% and residential building permits are expected to decline approximately 22%. Projections for 2010 and beyond reflect a more positive trend, although remain modest in comparison to factors experienced by the strongeststate during a growth period of 2003-2006.
Schedule 17
NATIONAL BANK OF ARIZONA
| (In millions) | 2008 | 2007 | 2006 | |||||
CONDENSED INCOME STATEMENT | ||||||||
Net interest income | $ | 219.5 | 250.8 | 214.9 | ||||
Noninterest income | 46.8 | 33.4 | 25.4 | |||||
Total revenue | 266.3 | 284.2 | 240.3 | |||||
Provision for loan losses | 211.8 | 30.5 | 16.3 | |||||
Noninterest expense | 161.2 | 142.4 | 103.0 | |||||
Impairment loss on goodwill | 168.6 | – | – | |||||
Income (loss) before income taxes | (275.3 | ) | 111.3 | 121.0 | ||||
Income tax expense (benefit) | (56.7 | ) | 43.5 | 47.8 | ||||
Net income (loss) | $ | (218.6 | ) | 67.8 | 73.2 | |||
YEAR-END BALANCE SHEET DATA | ||||||||
Total assets | $ | 4,864 | 5,279 | 4,599 | ||||
Total securities | 204 | 258 | 199 | |||||
Net loans and leases | 4,146 | 4,585 | 4,066 | |||||
Allowance for loan losses | 124 | 65 | 43 | |||||
Goodwill, core deposit and other intangibles | 22 | 195 | 66 | |||||
Noninterest-bearing demand deposits | 916 | 1,100 | 1,160 | |||||
Total deposits | 3,923 | 3,871 | 3,695 | |||||
Preferred equity | 430 | – | – | |||||
Common equity | 355 | 581 | 346 | |||||
NBA experienced a net loss of $218.6 million in 2008, compared to net income of $67.8 million for 2007 and $73.2 million for 2006. The decrease in the entire country andnet results for NBA was primarily due to recognition of goodwill impairment totaling $168.6 million. As of December 31, 2008 all of NBA’s goodwill has been written off. Additionally, with the state is currently ranked the 16th largestworsening economic trends in Arizona, as noted above, credit-related costs increased significantly in the nation by population. Populationyear. During the year, the Company recorded a total loan loss provision of $211.8 million, and nearly doubled to $124 million the allowance for loan losses at year-end.
As clearly reflected in the state exceeds 6.2 million residents; the Phoenix and Tucson metropolitan areas together comprise over 80% of the state’s population – over 5 million people. The Arizona job market remains robust and among the leadersyear’s loan loss provision, NBA’s credit quality worsened in the nation with annual growth nearing the 5% markyear. The steady decline in 2006, which followed a year in which the growth exceeded this level.
Housing has fueled a large portionalmost every sector of the Arizona economy, for a number of years. The housing market did experience a 23% decline in 2006 as related to residential building permits, yet this followed a number of years with double digit increases. Despite the slowdownespecially notable in the residential housing market, residential building permitsreal estate sector, caused stress on the bank’s portfolio. Nonperforming assets were 66,062 for 2006,$273.0 million at December 31, 2008 compared to 85,835 in 2005, and 87,834 in 2004.$76.1 million one year prior, an increase of $196.9 million or 258.7%. The commercial real estate activity was not affected by the softening of the residential activity, as vacancy rates declined and per square foot rental rates increased in the metropolitan marketplaces. NBA is a recognized leader inbank’s exposure to real estate lending, in Arizona.
The continued strengthboth commercial and residential, contributed to the majority of the Arizona economy, coupled with the consistent growthincrease in the balance sheet of NBA, produced another record breaking year in terms of financial performance and growthnonperforming assets for the organization. Withyear. Nonperforming assets to net loans and other real estate owned at December 31, 2008 was 6.49% compared to 1.66% at December 31, 2007.
Net loan and lease charge-offs were $147.2 million for 2008 compared with $13.6 million for 2007 and $11.3 million for 2006. Net loan and lease charge-offs in 2008 were primarily related to the exception of housing starts, home prices,bank’s real estate portfolio, including real estate construction, land development and the rate of existing home sales, most driversland loans. The loan loss provision was $211.8 million for 2008 compared to $30.5 million for 2007 and $16.3 million for 2006. The ratio of the Arizona economy are expectedallowance for loan losses to remain strong for 2007. Thus the Arizona economy is expected to grow innet loans and leases was 2.98% and 1.42% at December 31, 2008 and 2007, but more moderately than in the prior two years.respectively.
SCHEDULE 18
NATIONAL BANK OF ARIZONA
| (In millions) | 2006 | 2005 | 2004 | ||||
CONDENSED INCOME STATEMENT | |||||||
Net interest income excluding hedge income | $ | 218.4 | 186.2 | 139.0 | |||
Hedge income (expense) recorded directly at subsidiary | (3.3) | 1.3 | 0.6 | ||||
Allocated hedge income (expense) | (0.2) | 0.1 | 4.0 | ||||
Net interest income | 214.9 | 187.6 | 143.6 | ||||
Noninterest income | 25.4 | 21.5 | 21.6 | ||||
Total revenue | 240.3 | 209.1 | 165.2 | ||||
Provision for loan losses | 16.3 | 5.2 | 4.0 | ||||
Noninterest expense | 103.0 | 97.8 | 86.1 | ||||
Income before income taxes | 121.0 | 106.1 | 75.1 | ||||
Income tax expense | 47.8 | 42.1 | 29.7 | ||||
Net income | $ | 73.2 | 64.0 | 45.4 | |||
YEAR-END BALANCE SHEET DATA | |||||||
Total assets | $ | 4,599 | 4,209 | 3,592 | |||
Net loans and leases | 4,066 | 3,698 | 3,129 | ||||
Allowance for loan losses | 43 | 38 | 33 | ||||
Goodwill, core deposit and other intangibles | 66 | 68 | 70 | ||||
Noninterest-bearing demand deposits | 1,160 | 1,191 | 930 | ||||
Total deposits | 3,695 | 3,599 | 3,046 | ||||
Common equity | 346 | 299 | 264 | ||||
NBA’s net income in 2006 rose by 14.4% to $73.2 million, following a 41.0% growth in earnings in 2005. Net interest income increasedat NBA for 2008 declined by 14.6%12.5%, or $31.3 million as compared to 2005.2007. This increasedecrease resulted from a 4.5% decline in NBA’s average earning assets, compression in the net interest income is directly attributable to the growth in earning assets, coupled with consistent strength in the net interest margin. margin arising from a highly competitive marketplace for deposit acquisition and retention, and increased nonperforming loans.
The net interest margin declined only slightly to 5.20% in 2006was 4.64% for 2008, compared to 5.23%5.08% for 2007 and 5.20% for 2006. Most short-term benchmark interest rates declined during the year; however, our ability to reduce customer deposit rates in 2005. The compression primarily reflects the increased reliance on noncore deposit funding to support continued loan growth. Funding coststandem was hampered by heightened bank competition for core deposits grew at a slightly slower pace than the increase in yields on earning assets.
liquidity.
Noninterest income increased 18.1% in 200640.1% to $46.8 million compared to 2005,$33.4 million for 2007 and $25.4 million for 2006. This increase is principally due to the recognition of income from interest rate swaps which became ineffective during the year. The bank maintains swap positions to hedge against interest rate risks, hedged against certain portfolio loans. When these positions are deemed ineffective, the swap is cancelled and the income or loss is recognized in turnnoninterest income. During 2008, the income from this activity was essentially flat$14.4 million compared with a minor loss in 2007. Additionally, noninterest income includes fees earned from customers on their transaction accounts, offset by customer earnings credit. With the interest rate market decline, the net fees earned by the bank increased. Bank service charges, which include net charges on transaction accounts and other fees, increased to $17.0 million, an increase of 15.5% when compared with 2007.
Noninterest expense for 2008 increased $18.8 million or 13.2% from 2007. The increase is principally the result of increases in OREO expense of $27.6 million and increased credit and collection costs of $2.8 million. The increase in OREO expense was primarily the result of continued declines in the value of foreclosed properties. Other significant components of noninterest expense include salaries and employee benefits, occupancy costs, and advertising, all of which were near or below levels experienced in 2007. The efficiency ratio was 60.45% for 2008, as compared to 2004. The noninterest income increases were primarily impacted by increases in business49.90% for 2007 and personal credit and debit card activity, favorable changes in service charge rates, and gains in venture fund investments. Despite the slowdown experienced in the residential real estate market, fees charged42.81% for residential development and construction lending remained flat compared to 2005.
Noninterest expense increased at a moderate pace of 5.3% over 2005 to $103.0 million, yielding positive operating leverage for 2006. Commensurate with the expanding opportunities and revenue growth in the retail and commercial banking areas, NBA expanded its work force to take advantage of these opportunities. Increased compensation costs related to these additional employees comprised the largest component of the noninterest expense increases. Overall NBA’s efficiency ratio improved nearly 4% in 2006 to 42.8% compared to 46.7% for 2005.Schedule 18
SCHEDULE 19
NATIONAL BANK OF ARIZONA
| 2006 | 2005 | 2004 | ||||||||||||||
| (Dollar amounts in millions) | 2008 | 2007 | 2006 | |||||||||||||
PERFORMANCE RATIOS | ||||||||||||||||
Return on average assets | 1.66% | 1.65% | 1.40% | (4.25 | )% | 1.25 | % | 1.66 | % | |||||||
Return on average common equity | 22.49% | 22.62% | 18.34% | (39.40 | )% | 11.36 | % | 22.49 | % | |||||||
Tangible return on average tangible common equity | (15.44 | )% | 18.55 | % | 28.76 | % | ||||||||||
Efficiency ratio | 42.81% | 46.67% | 51.94% | 60.45 | % | 49.90 | % | 42.81 | % | |||||||
Net interest margin | 5.20% | 5.23% | 4.83% | 4.64 | % | 5.08 | % | 5.20 | % | |||||||
RISK-BASED CAPITAL RATIOS | ||||||||||||||||
Tier 1 leverage | 15.19 | % | 7.29 | % | 6.37 | % | ||||||||||
Tier 1 risk-based capital | 17.49 | % | 7.51 | % | 7.03 | % | ||||||||||
Total risk-based capital | 18.76 | % | 10.95 | % | 10.83 | % | ||||||||||
CREDIT QUALITY | ||||||||||||||||
Provision for loan losses | $ | 211.8 | 30.5 | 16.3 | ||||||||||||
Net loan and lease charge-offs | 147.2 | 13.6 | 11.3 | |||||||||||||
Ratio of net charge-offs to average loans and leases | 3.34 | % | 0.29 | % | 0.29 | % | ||||||||||
Allowance for loan losses | $ | 124 | 65 | 43 | ||||||||||||
Ratio of allowance for loan losses to net loans and leases | 2.98 | % | 1.42 | % | 1.06 | % | ||||||||||
Nonperforming assets | $ | 273.0 | 76.1 | 12.2 | ||||||||||||
Ratio of nonperforming assets to net loans and leases and other real estate owned | 6.49 | % | 1.66 | % | 0.30 | % | ||||||||||
Accruing loans past due 90 days or more | $ | 17.0 | 11.8 | 2.3 | ||||||||||||
Ratio of accruing loans past due 90 days or more to net loans and leases | 0.41 | % | 0.26 | % | 0.06 | % | ||||||||||
OTHER INFORMATION | ||||||||||||||||
Full-time equivalent employees | 911 | 871 | 843 | 1,100 | 1,137 | 911 | ||||||||||
Domestic offices: | ||||||||||||||||
Traditional branches | 53 | 53 | 54 | 79 | 76 | 53 | ||||||||||
Foreign office | 1 | – | – | |||||||||||||
Total offices | 80 | 76 | 53 | |||||||||||||
ATMs | 55 | 53 | 53 | 73 | 69 | 55 | ||||||||||
Net loans and leases contracted $439 million or 9.6% in 2008 compared to 2007. Over 75% of this contraction occurred in commercial real estate loans as the bank reduced its exposure to real estate related transactions during 2008. NBA expects a similar decrease during 2009 as compared with 2008, due to continued reductions in commercial real estate loan exposure and lack of demand in this sector. The allowance for loan losses grew by $368$59 million for the year an increase of 10.0%, following an 18.2% growth rate in 2005. Combined,taking into account the two years’ growth totals $937 million. Loan growth remained strong in all sectors of NBA’s loan portfolio; the strongest growth waschallenging local economic conditions. The bank expects to continue its management and focus its attention on controlling its real estate portfolio exposure, while maintaining a positive and growing influence in the commercial real estate area, reflectingsector of the Arizona economy’s strength. Deposit growth, totaling $96market.
Total deposits increased by $52 million slowed appreciably whenor 1.3% in 2008 compared to 2005. Competitive pressures2007. The ratio of noninterest-bearing deposits to total deposits was 23.3% in 2008 and the entry of new financial institutions into the market during28.4% in 2007. During the year, placed pressure on attracting and retainingthe bank increased its level of brokered deposits to $136.6 million, which represents approximately 3.5% of total deposits for the organization. The bank anticipates a reasonable level of growth in deposits in 2009, despite its plan to reduce the level of brokered deposits.
Nonperforming assets increased to $12.2 millionThe total risk-based capital ratio at December 31, 2006,2008 was 18.76% compared to $9.7 million at year-end 2005. Nonaccrual loans10.95% and 10.83% at December 31, 2007 and December 31, 2006, equaled $6.0 million, down slightly when compared to balances at the end of 2005. Net charge-offs were $11.3 million for 2006, compared with $0.4 million for 2005.respectively. The provision for loan losses significantly increased to $16.3 million compared to $5.2 millionincrease in the prior year. This istotal risk-based capital ratio for 2008 was mainly due to the issuance of qualifying tier 1 capital preferred stock of $430 million to the Parent in December 2008, a direct result$110 million decrease of a single lease charge-off totaling approximately $10.9qualifying tier 2 capital subordinated debt due to the Parent and the net loss of $64.2 million, on a $17.1 million participation in an equipment lease, as previously disclosed on page 45 inexcluding the discussion of “Provisions for Credit Losses”. The remaining $6.2 million value of the impaired asset is included in NBA’s nonperforming assets at the end of the year.after-tax goodwill impairment.
Nevada State Bank
NSB,Nevada State Bank is headquartered in Las Vegas, Nevada, and is the fourthfifth largest full-service commercial bank in the stateNevada as measured by domestic deposits booked in the state. TravelNevada State Bank operates 44 full-service traditional branches and 32 banking centers in grocery stores throughout the State of Nevada and provides banking services to Nevada’s small and mid-sized businesses as well as retail consumers, with a focus on relationship banking.
During the third quarter of 2008 NSB entered into an agreement to exit 28 grocery store banking centers during the first quarter of 2009, with an eye towards improving our efficiencies and controlling costs while maintaining a vibrant branch network to service our customer base. The leases on these banking centers are being assumed by another bank and all loans and deposits will be transferred to nearby NSB branch locations. To compensate for the reduction of branch locations, we entered into an agreement with a national retailer to place ATMs at 45 of their locations and planned additions of 5 branches in proximity to former grocery store locations that had heavy customer volume.
During 2008, NSB acquired the insured deposits of Silver State Bank in an FDIC-assisted transaction. Total deposits acquired through this acquisition were $563 million, including certificates of deposits totaling $465 million. NSB retained 5 former Silver State Bank branches in the Las Vegas area.
The markets in which we operate are heavily dependent on travel/tourism and construction. During spring 2008, financial conditions in these sectors began to deteriorate dramatically. As of December 2008 and compared to December 2007, gaming revenues are down 22.3%, airline passenger count is down 13.3% and visitor volume is down 10.2%. During the same period in Clark County and Washoe County, NSB’s two biggest market areas, residential construction permits have declined 87.7% and 57.4%, respectively, and commercial construction permits declined 55.0% and 52.9%, respectively. These declining metrics have led to an increase in the Nevada unemployment rate to 7.9% at November 2008 compared to 5.3% one year earlier and a decline in the overall employment numbers of 1.2% during the same period. The consensus outlook for 2009 is that Nevada’s economy will remain challenged as residential foreclosures continue to mount and overall consumer spending, which correlates to travel and tourism constructionspending, is expected to remain suppressed given nationwide higher unemployment and mining are Nevada’s three largest industries. All sectorsgeneral uncertainty about the economy.
Schedule 19
NEVADA STATE BANK
| (In millions) | 2008 | 2007 | 2006 | |||||
CONDENSED INCOME STATEMENT | ||||||||
Net interest income | $ | 159.0 | 182.5 | 197.5 | ||||
Impairment losses on investment securities | (2.0 | ) | – | – | ||||
Other noninterest income | 42.8 | 32.9 | 31.2 | |||||
Total revenue | 199.8 | 215.4 | 228.7 | |||||
Provision for loan losses | 100.3 | 23.3 | 8.7 | |||||
Noninterest expense | 137.9 | 111.8 | 110.8 | |||||
Impairment loss on goodwill | 21.0 | – | – | |||||
Income (loss) before income taxes | (59.4 | ) | 80.3 | 109.2 | ||||
Income tax expense (benefit) | (13.6 | ) | 27.9 | 38.1 | ||||
Net income (loss) | $ | (45.8 | ) | 52.4 | 71.1 | |||
YEAR-END BALANCE SHEET DATA | ||||||||
Total assets | $ | 4,063 | 3,903 | 3,916 | ||||
Total securities | 194 | 412 | 415 | |||||
Net loans and leases | 3,200 | 3,231 | 3,214 | |||||
Allowance for loan losses | 82 | 56 | 35 | |||||
Goodwill, core deposit and other intangibles | 8 | 21 | 21 | |||||
Noninterest-bearing demand deposits | 912 | 929 | 1,002 | |||||
Total deposits | 3,514 | 3,304 | 3,401 | |||||
Preferred equity | 260 | – | – | |||||
Common equity | 259 | 261 | 273 | |||||
NSB had a net loss of $45.8 million for 2008 compared to net income of $52.4 million for 2007 and $71.1 million for 2006. The decrease in net income was primarily attributable to declining market conditions in the state of Nevada, as evidenced by increased loan loss provisioning, write downs of other real estate owned and a goodwill impairment charge. The net interest margin also declined, due to an adverse change in the deposit funding mix, the relatively lower value of noninterest-bearing deposits in a low rate environment, and an increase in nonperforming assets. Additionally, NSB experienced several non-recurring charges related to the acquisition of Silver State Bank and the planned exit from the 28 grocery store branches.
Nonperforming assets were $222.0 million at December 31, 2008 compared to $44.2 million one year ago, an increase of $177.8 million or 402.3%. The majority of the Silver State economy continueincrease is attributable to enjoy sound economic conditions, although indicators pointdeterioration of real estate construction, land development and land loans, particularly those loans with exposure to Nevada having a more modest expansion in the
near future due to some slowdown in the residential housing sector. Nevada should continuemarket. Nonperforming assets to rank among the better performing state economies, with job growth that is well above the national level. The economic outlook for the state remains positive for 2007.
SCHEDULE 20
NEVADA STATE BANK
| (In millions) | 2006 | 2005 | 2004 | ||||
CONDENSED INCOME STATEMENT | |||||||
Net interest income excluding hedge income | $ | 201.4 | 170.4 | 140.2 | |||
Hedge income (expense) recorded directly at subsidiary | (3.9) | 0.9 | 1.7 | ||||
Allocated hedge income | – | – | 1.5 | ||||
Net interest income | 197.5 | 171.3 | 143.4 | ||||
Noninterest income | 31.2 | 31.0 | 31.6 | ||||
Total revenue | 228.7 | 202.3 | 175.0 | ||||
Provision for loan losses | 8.7 | (0.4) | 3.4 | ||||
Noninterest expense | 110.8 | 106.2 | 96.4 | ||||
Income before income taxes | 109.2 | 96.5 | 75.2 | ||||
Income tax expense | 38.1 | 33.4 | 25.8 | ||||
Net income | $ | 71.1 | 63.1 | 49.4 | |||
YEAR-END BALANCE SHEET DATA | |||||||
Total assets | $ | 3,916 | 3,681 | 3,339 | |||
Net loans and leases | 3,214 | 2,846 | 2,549 | ||||
Allowance for loan losses | 35 | 28 | 29 | ||||
Goodwill, core deposit and other intangibles | 21 | 22 | 22 | ||||
Noninterest-bearing demand deposits | 1,002 | 1,122 | 1,032 | ||||
Total deposits | 3,401 | 3,171 | 2,951 | ||||
Common equity | 273 | 244 | 220 | ||||
NSB’s net income for 2006 increased 12.7% to $71.1 millionloans and other real estate owned at December 31, 2008 was 6.85% compared to $63.1 million for 2005 and $49.4 million for 2004. Net interest income grew to $197.5 million, or 15.3% from 2005, which was up 19.5% from 2004. The increase for both years reflects the growth1.37% at December 31, 2007. NSB expects stress in the loan portfolio along with improved net interest margins for the last two years.
Noninterest income for 2006 was $31.2 million, which was essentially unchanged compared to both 2005 and 2004.
Noninterest expense increased by 4.3% compared to 2005, which was up 10.2% from 2004. Salaries and benefits were the leading component of the increase in 2006, driven by the opening of new offices2009 and expansion of lending departments. Salaries were also the primary cause of the increase in 2005. NSB’s efficiency ratio was 48.4% for 2006, 52.4% for 2005 and 54.9% for 2004. The bank continuesnonperforming assets to focus on managing operating costs to improve its efficiency.
SCHEDULE 21
NEVADA STATE BANK
| 2006 | 2005 | 2004 | ||||
PERFORMANCE RATIOS | ||||||
Return on average assets | 1.82% | 1.78% | 1.55% | |||
Return on average common equity | 27.68% | 27.35% | 23.61% | |||
Efficiency ratio | 48.37% | 52.37% | 54.86% | |||
Net interest margin | 5.46% | 5.26% | 4.94% | |||
OTHER INFORMATION | ||||||
Full-time equivalent employees | 875 | 811 | 796 | |||
Domestic offices: | ||||||
Traditional branches | 37 | 34 | 33 | |||
Banking centers in grocery stores | 35 | 35 | 34 | |||
Total offices | 72 | 69 | 67 | |||
ATMs | 79 | 78 | 77 | |||
Even though residential development and construction have slowed in Southern Nevada, the construction industry is still benefiting from commercial building demand. Net loans grew by $368 million or 12.9% in 2006 compared to 2005, which was up 11.7% from 2004. Loan growth was primarily in the construction lending area.
Total deposits grew by $230 million or 7.3% in 2006 compared to 2005. Deposit growth continues to be a challenge as NSB competes with national retail banks. The ratio of interest-bearing deposits to total deposits continuescontinue to increase – 70.5% at December 31, 2006as market conditions remain challenging.
Net loan and lease charge-offs were $71.6 million for 2008 compared with 64.6% at December 31, 2005. NSB has expanded its business development groups$2.7 million for 2007 and their core business relationship focus in order to try to increase noninterest-bearing deposits in 2007.
Credit quality at NSB remained at a very high level during$1.0 million for 2006. Net loan and lease charge-offs in 2008 were $1.0primarily related to construction and land development loans, and to a lesser extent declining collateral values underlying residential and multi-family loans. The loan loss provision was $100.3 million for 20062008 compared with $0.5to $23.3 million for 2005. Nonperforming assets were $0.62007 and $8.7 million at December 31, or 0.02%for 2006. The ratio of the allowance for loan losses to net loans and leases was 2.58%, 1.73% and other1.10% at December 31, 2008, 2007 and 2006, respectively. Charge-offs are expected to continue in 2009, especially as nonperforming assets are disposed through sale or write-down.
NSB’s net interest income decreased in 2008 by 12.9%, or $23.5 million, due primarily to an overall reduction in the interest rate environment, but increases in nonperforming assets also pressured the margin. Also, the majority of growth in our deposit portfolio, which is our primary source of funding, was in interest-bearing deposits such as money market accounts. The net interest margin was 4.43% for 2008, compared to 5.06% for 2007 and 5.46% for 2006.
NSB recognized OTTI losses on investment securities of $2.0 million. In December 2008 the Parent purchased the impaired securities at fair value.
Other noninterest income increased 30.1% to $42.8 million compared to $32.9 million for 2007 and $31.2 million for 2006. The majority of the increase is attributable to gains on terminated interest rate swaps totaling $8.0 million, while service charges and fees on deposit accounts increased $1.5 million, or 8.3%, due to management’s focus on reducing service charge waivers and cross-selling of treasury management products.
Noninterest expense for 2008 increased $26.1 million or 23.3% from 2007. The largest driver of this increase was an increase of $11.8 million in OREO expense. Management has remained proactive in obtaining updated appraisals and marking down OREO holdings as property values have declined in NSB’s markets. Other increases for 2008 included a $3.9 million or 7.8% increase in salaries and benefits attributed to a modest increase in the number of FTE and payroll costs incurred due to the acquisition of Silver State Bank, much of which is nonrecurring. Additionally, salaries and benefits for 2007 included a reversal of certain variable compensation accruals. NSB also incurred several non-recurring, non-salaries charges related to the acquisition of Silver State Bank and the planned exit from the 28 grocery store branches. Finally, legal and credit collection costs increased along with the increase in nonperforming assets. The efficiency ratio was 68.96% for 2008, as compared to 51.82% for 2007 and 48.37% for 2006.
NSB incurred a goodwill impairment loss of $21.0 million during 2008, due to a decline in market values of banking companies in general and degradation in the short-term earnings potential of NSB. As of December 31, 2008, all of the goodwill has been written off.
Schedule 20
NEVADA STATE BANK
| (Dollar amounts in millions) | 2008 | 2007 | 2006 | |||||||
PERFORMANCE RATIOS | ||||||||||
Return on average assets | (1.18 | )% | 1.35 | % | 1.82 | % | ||||
Return on average common equity | (15.61 | )% | 19.90 | % | 27.68 | % | ||||
Tangible return on average tangible common equity | (9.04 | )% | 21.70 | % | 30.35 | % | ||||
Efficiency ratio | 68.96 | % | 51.82 | % | 48.37 | % | ||||
Net interest margin | 4.43 | % | 5.06 | % | 5.46 | % | ||||
RISK-BASED CAPITAL RATIOS | ||||||||||
Tier 1 leverage | 12.75 | % | 5.95 | % | 6.56 | % | ||||
Tier 1 risk-based capital | 14.31 | % | 6.59 | % | 7.37 | % | ||||
Total risk-based capital | 15.58 | % | 11.05 | % | 11.63 | % | ||||
CREDIT QUALITY | ||||||||||
Provision for loan losses | $ | 100.3 | 23.3 | 8.7 | ||||||
Net loan and lease charge-offs | 71.6 | 2.7 | 1.0 | |||||||
Ratio of net charge-offs to average loans and leases | 2.23 | % | 0.09 | % | 0.03 | % | ||||
Allowance for loan losses | $ | 82 | 56 | 35 | ||||||
Ratio of allowance for loan losses to net loans and leases | 2.58 | % | 1.73 | % | 1.10 | % | ||||
Nonperforming assets | $ | 222.0 | 44.2 | 0.6 | ||||||
Ratio of nonperforming assets to net loans and leases and other real estate owned | 6.85 | % | 1.37 | % | 0.02 | % | ||||
Accruing loans past due 90 days or more | $ | 14.5 | 8.9 | 18.3 | ||||||
Ratio of accruing loans past due 90 days or more to net loans and leases | 0.45 | % | 0.28 | % | 0.57 | % | ||||
OTHER INFORMATION | ||||||||||
Full-time equivalent employees | 863 | 854 | 875 | |||||||
Domestic offices: | ||||||||||
Traditional branches | 45 | 39 | 37 | |||||||
Banking centers in grocery stores | 32 | 35 | 35 | |||||||
Total offices | 77 | 74 | 72 | |||||||
ATMs | 85 | 81 | 79 | |||||||
Net loans and leases contracted $31 million or 1.0% in 2008 compared to 2007. The decline was primarily due to reductions in construction and land development loan balances of $129 million due to management’s intent to diversify the loan portfolio and the challenging market conditions present in Nevada. Commercial loans increased $63 million, partially offsetting the decline in construction and land development loans. Management intends to continue this trend of diversifying the loan portfolio into 2009 and expects construction loans to continue to decline.
Total deposits increased $210 million or 6.4% in 2008 compared to 2007, with the majority of growth occurring in savings and money market accounts. The ratio of noninterest-bearing deposits to total deposits was 26.0% in 2008 and 28.1% in 2007 with the decline caused by a general slowdown in the real estate owned. The provision for loan lossesindustry in 2006 was $8.7Nevada, and thus many of NSB’s customers carrying lower operating account balances. Brokered deposits consisted of $60.3 million for 2006of Certificate of Deposit Account Registry System (“CDARS”) CD’s at year-end, as the bank took back from CDARS balances equal to the amount of customer funds placed into them.
Total securities declined $218 million or 52.9% in 2008 compared to $(0.4) million for 2005;2007. The majority of the increasedecline was largelycaused by the maturity or sale of agency or U.S. Government sponsored agency securities. The proceeds from the sale and maturity of these securities were generally not reinvested due to loan growth, as credit quality indicators remain strong.balance sheet management considerations.
The total risk-based capital ratio at December 31, 2008 was 15.58% compared to 11.05% and 11.63% at December 31, 2007 and December 31, 2006, respectively. The increase in the total risk-based capital ratio for 2008 was mainly due to the issuance of qualifying tier 1 capital preferred stock of $260 million to the Parent in December 2008, a $112.5 million redemption of qualifying tier 2 capital subordinated debt due to the Parent and the net loss of $24.8 million, excluding the goodwill impairment.
Vectra Bank Colorado
Vectra Bank is headquartered in Denver, Colorado, and is the eleventhtenth largest full-service commercial bank in Colorado as measured by domestic deposits booked in the state. Vectra Bank operates 38 full-service traditional branches and two banking centers in grocery stores throughout the state of Colorado and one full-service traditional branch office in Farmington, New Mexico.
The Colorado economy has experienced a steadyslower growth during 2008, reflecting the impact of the economic climate during 2006downturn on the state. Job growth has slowed but the state still added 5,000 new jobs between November 2007 and 2005. Colorado’s jobNovember 2008 – an employment growth of 2.1% in both years exceeded the national rate of 1.4%, but lags that of neighboring Rocky Mountain States including Arizona, Idaho, Nevada and Utah. Colorado’s economy continues to diversify with0.2%. Weaker employment gains made in a broad range of industries covering both the service and goods producing sectors.
In 2005 and 2004, Vectra repositioned its delivery system to better serve corporate and business customers. As part of this restructuring, in 2004 Vectra sold two regional branch networks in agricultural areas, whichgrowth resulted in a reductionjobless rate of 5.8% in loan balancesNovember 2008, as compared to 4.0% a year earlier. While home prices have declined in Colorado, the housing market has faired better than many parts of the nation. According to an S&P/Case-Shiller measure of home values, housing prices in Denver (the largest housing market in the state) fell 5.2% year over year – one of the three smallest declines of 20 cities nation-wide measured in the index. Most regional economists expect Colorado to continue performing better than the nation as a whole. While the energy, education and health services sectors are expected to grow in 2009, the jobless rate will rise as the construction, financial and information sectors continue to deteriorate.
Schedule 21
VECTRA BANK COLORADO
| (In millions) | 2008 | 2007 | 2006 | |||||
CONDENSED INCOME STATEMENT | ||||||||
Net interest income | $ | 103.6 | 96.9 | 94.2 | ||||
Impairment losses on investment securities | (6.4 | ) | – | – | ||||
Other noninterest income | 29.9 | 28.1 | 26.8 | |||||
Total revenue | 127.1 | 125.0 | 121.0 | |||||
Provision for loan losses | 15.9 | 4.0 | 4.2 | |||||
Noninterest expense | 85.9 | 86.3 | 85.0 | |||||
Impairment loss on goodwill | 151.5 | – | – | |||||
Income (loss) before income taxes | (126.2 | ) | 34.7 | 31.8 | ||||
Income tax expense | 8.8 | 12.5 | 11.7 | |||||
Net income (loss) | $ | (135.0 | ) | 22.2 | 20.1 | |||
YEAR-END BALANCE SHEET DATA | ||||||||
Total assets | $ | 2,722 | 2,667 | 2,385 | ||||
Total securities | 267 | 329 | 336 | |||||
Net loans and leases | 2,065 | 1,987 | 1,725 | |||||
Allowance for loan losses | 27 | 26 | 24 | |||||
Goodwill, core deposit and other intangibles | – | 152 | 154 | |||||
Noninterest-bearing demand deposits | 460 | 485 | 510 | |||||
Total deposits | 2,127 | 1,752 | 1,712 | |||||
Preferred equity | 10 | – | – | |||||
Common equity | 191 | 329 | 314 | |||||
Vectra had a net loss of $135.0 million for 2008 compared to net income of $22.2 million for 2007 and $20.1 million for 2006. The net loss was due to an impairment loss on goodwill of $151.5 million. This impairment of all of the goodwill at Vectra is due to a decline in market values of banking companies in general and a decrease in the short-term earnings potential of Vectra. The write-off is a non-cash accounting adjustment that does not impact operations, liquidity or regulatory and tangible capital ratios of the bank. Additionally, the bank recognized a $6.4 million OTTI loss on a security during the fourth quarter of 2008. Excluding the goodwill and securities impairment charges, the bank had a profit of approximately $130 million and deposit balances of approximately $165 million. Vectra recorded a pretax gain of $0.7$20.4 million on these transactions in 2004. During 2006, Vectra continued to realize benefits from this repositioning strategy as it consolidated locations to improve bank efficiency.
SCHEDULE 22
VECTRA BANK COLORADO
| (In millions) | 2006 | 2005 | 2004 | ||||
CONDENSED INCOME STATEMENT | |||||||
Net interest income excluding hedge income | $ | 100.5 | 88.1 | 79.0 | |||
Hedge income (expense) recorded directly at subsidiary | (6.0) | 0.9 | 5.8 | ||||
Allocated hedge income (expense) | (0.3) | 0.1 | 7.3 | ||||
Net interest income | 94.2 | 89.1 | 92.1 | ||||
Noninterest income | 26.8 | 26.6 | 29.6 | ||||
Total revenue | 121.0 | 115.7 | 121.7 | ||||
Provision for loan losses | 4.2 | 1.6 | (0.7) | ||||
Noninterest expense | 85.0 | 86.8 | 92.6 | ||||
Income before income taxes | 31.8 | 27.3 | 29.8 | ||||
Income tax expense | 11.7 | 9.7 | 10.6 | ||||
Net income | $ | 20.1 | 17.6 | 19.2 | |||
YEAR-END BALANCE SHEET DATA | |||||||
Total assets | $ | 2,385 | 2,324 | 2,319 | |||
Net loans and leases | 1,725 | 1,539 | 1,465 | ||||
Allowance for loan losses | 24 | 21 | 20 | ||||
Goodwill, core deposit and other intangibles | 154 | 156 | 158 | ||||
Noninterest-bearing demand deposits | 510 | 541 | 486 | ||||
Total deposits | 1,712 | 1,636 | 1,577 | ||||
Common equity | 314 | 299 | 322 | ||||
Net income increased 14.2% to $20.1core operations. This performance also reflects elevated provision levels of $15.9 million in 2006, up from $17.62008, as compared to $4.0 million in 20052007 and $19.2$4.2 million in 2004. 2006.
Given the difficult economic environment, credit quality, while stressed, remained relatively strong at Vectra. Nonperforming assets were $27.1 million at December 31, 2008 compared to $10.4 million one year ago, an increase of $16.7 million. The ratio of nonperforming assets to net loans and other real estate owned at December 31, 2008 was 1.31% compared to 0.52% at December 31, 2007. Net loan and lease charge-offs were $13.6 million for 2008 compared with $1.3 million for 2007 and $1.7 million for 2006. The ratio of the allowance for loan losses to net loans and leases was 1.31% compared to 1.32% at December 31, 2007 and 1.37% at the end of 2006.
Net interest income at Vectra increased 5.7%6.9% to $94.2 million, up from $89.1$103.6 million in 20052008 due to a 12.6%, or $271 million increase in average earning assets and $92.1 milliona reduction in 2004.the cost of funds. The increases in net interest income and net interest margin was 4.31% for 2008, compared to 4.53% for 2007 and 4.73% for 2006. The margin declined during 2008 as yields on earning assets declined while competitive pressures on deposit pricing limited the reduction in 2006 were primarilyfunding costs.
Other noninterest income increased 6.4% to $29.9 million compared to $28.1 million for 2007 and $26.8 million for 2006. Other noninterest income rose year over year due to an improved earning asset mix. Vectra experienced growth in average loan balances that had higher yields than money market investments and securities, which declined in 2006.
generation of deposit service fees.
Noninterest expense was down $1.8for 2008 decreased $0.4 million or 2.1%0.5% from 2007. Salaries and employee benefits had a modest increase of $0.8 million or 1.9%, the majority of which related to $85.0annual merit increases and a modest increase in staff levels. Expense increases in other categories were more than offset by a decrease in core deposit intangible amortization in 2008 of $1.9 million. As a result of disciplined expense management, the bank continued to improve its efficiency ratio which was 67.19% for 2008, as compared to 68.78% for 2007 and 69.99% for 2006.
Schedule 22
VECTRA BANK COLORADO
| (Dollar amounts in millions) | 2008 | 2007 | 2006 | |||||||
PERFORMANCE RATIOS | ||||||||||
Return on average assets | (4.98 | )% | 0.90 | % | 0.87 | % | ||||
Return on average common equity | (45.35 | )% | 6.97 | % | 6.63 | % | ||||
Tangible return on average tangible common equity | 9.04 | % | 14.25 | % | 14.39 | % | ||||
Efficiency ratio | 67.19 | % | 68.78 | % | 69.99 | % | ||||
Net interest margin | 4.31 | % | 4.53 | % | 4.73 | % | ||||
RISK-BASED CAPITAL RATIOS | ||||||||||
Tier 1 leverage | 7.16 | % | 7.27 | % | 7.54 | % | ||||
Tier 1 risk-based capital | 7.82 | % | 7.15 | % | 7.53 | % | ||||
Total risk-based capital | 11.23 | % | 10.54 | % | 11.17 | % | ||||
CREDIT QUALITY | ||||||||||
Provision for loan losses | $ | 15.9 | 4.0 | 4.2 | ||||||
Net loan and lease charge-offs | 13.6 | 1.3 | 1.7 | |||||||
Ratio of net charge-offs to average loans and leases | 0.66 | % | 0.07 | % | 0.10 | % | ||||
Allowance for loan losses | $ | 27 | 26 | 24 | ||||||
Ratio of allowance for loan losses to net loans and leases | 1.31 | % | 1.32 | % | 1.37 | % | ||||
Nonperforming assets | $ | 27.1 | 10.4 | 9.3 | ||||||
Ratio of nonperforming assets to net loans and leases and other real estate owned | 1.31 | % | 0.52 | % | 0.54 | % | ||||
Accruing loans past due 90 days or more | $ | 1.7 | 3.4 | 1.4 | ||||||
Ratio of accruing loans past due 90 days or more to net loans and leases | 0.08 | % | 0.17 | % | 0.08 | % | ||||
OTHER INFORMATION | ||||||||||
Full-time equivalent employees | 568 | 551 | 575 | |||||||
Domestic offices: | ||||||||||
Traditional branches | 39 | 39 | 37 | |||||||
Banking centers in grocery stores | 2 | 2 | 2 | |||||||
Foreign office | 1 | – | – | |||||||
Total offices | 42 | 41 | 39 | |||||||
ATMs | 48 | 48 | 47 | |||||||
Net loans and leases expanded $78 million, from $86.8or 3.9%, to $2,065 million in 2005 and $92.62008 compared to $1,987 million in 2004. Vectra’s efficiency2007. The growth was primarily in commercial lending, partially offset by declines in commercial real estate loans. The bank’s liquidity position improved in 2008 as a result of moderate loan growth, and significant increases in deposit balances. Total deposits increased $375 million, or 21.4%, to $2,127 million in 2008 compared to $1,752 million in 2007. Increases in certificates of deposits and brokered funds account for the majority of deposit growth in 2008 reducing the ratio of 70.0% improved comparednoninterest-bearing deposits to an efficiency ratio of 74.7%total deposits to 21.6% in 2005 and 75.8%2008, down from 27.7% in 2004.2007. The bank continues to focus on revenue generationits relationship banking model, supporting its target small and expense management as a means of improving operational efficiency.
SCHEDULE 23
VECTRA BANK COLORADO
| 2006 | 2005 | 2004 | ||||
PERFORMANCE RATIOS | ||||||
Return on average assets | 0.87% | 0.76% | 0.80% | |||
Return on average common equity | 6.63% | 5.68% | 5.45% | |||
Efficiency ratio | 69.99% | 74.72% | 75.80% | |||
Net interest margin | 4.73% | 4.57% | 4.51% | |||
OTHER INFORMATION | �� | |||||
Full-time equivalent employees | 575 | 621 | 662 | |||
Domestic offices: | ||||||
Traditional branches | 37 | 40 | 38 | |||
Banking centers in grocery stores | 2 | 2 | 2 | |||
Total offices | 39 | 42 | 40 | |||
ATMs | 47 | 56 | 55 | |||
Net loans increased by 12.1%Total securities declined $62 million, or 18.8%, to $1,725 million from $1,539$267 million, in 2005 and $1,4652008 compared to $329 million in 2004. Deposits increased2007. The change included the sale of a $13 million CDO security to $1,712the Parent, on which Vectra recognized an OTTI loss of $6.4 million, from $1,636 million in 2005 and $1,577 million in 2004. normal prepayment and payoff activity on the securities portfolio.
The bank experienced growth in its core business groups including commercialtotal risk-based capital ratio at December 31, 2008 was 11.23% compared to 10.54% and real estate lending units.
Credit quality has continued to remain relatively strong11.17% at Vectra. Nonperforming assets declined to $9.3 million inDecember 31, 2007 and December 31, 2006, from $10.9 million in 2005 and $13.4 million in 2004. Net loan and lease charge-offs in 2006 were $1.7 million, up from $0.9 million in 2005 and down from $4.5 million in 2004. Despite a slightrespectively. The increase in net loan and lease charge-offsthe total risk-based capital ratio for 2008 was mainly due to the issuance of qualifying tier 1 capital preferred stock of $10 million to the Parent in 2006, net charge-offs as a percentage of average loans was only 0.10%. The provision for loan losses in 2006 was $4.2 million compared to $1.6 million in 2005 reflecting the loan growth in 2006.December 2008.
The Commerce Bank of Washington
TCBW consistsThe Commerce Bank of Washington is headquartered in Seattle, Washington, and operates out of a single office operatinglocated in the Seattle Washington area.central business district. Its business strategy focuses on serving the financial needs of commercial businesses, including professional service firms, and individuals by providing a high level of customer service delivered by seasoned professionals.
TCBW has been successful in serving this market within the greater Seattle areaSeattle/Puget Sound region by using couriers, bank by mail, remote deposit image capture, and other technology in lieu of a branch network.
The Pacific Northwest economy, which normally lags the general U.S. economy by 12 to 18 months, entered a recessionary period in the fourth quarter of 2008, as evidenced by job losses across nearly all industry sectors, increased unemployment, continuing declines in housing prices and home sale activity, and weakening in the commercial real estate markets. Foreclosures have risen dramatically, as well as personal bankruptcies. 2009 is expected to be a very challenging year in the region.
Schedule 23
THE COMMERCE BANK OF WASHINGTON
| (In millions) | 2008 | 2007 | 2006 | |||||
CONDENSED INCOME STATEMENT | ||||||||
Net interest income | $ | 33.8 | 35.1 | 33.6 | ||||
Impairment losses on investment securities | (1.3 | ) | – | – | ||||
Other noninterest income | 4.4 | 2.5 | 2.0 | |||||
Total revenue | 36.9 | 37.6 | 35.6 | |||||
Provision for loan losses | 1.1 | 0.3 | 0.5 | |||||
Noninterest expense | 14.8 | 14.4 | 13.9 | |||||
Income before income taxes | 21.0 | 22.9 | 21.2 | |||||
Income tax expense | 7.0 | 7.5 | 7.0 | |||||
Net income | $ | 14.0 | 15.4 | 14.2 | ||||
YEAR-END BALANCE SHEET DATA | ||||||||
Total assets | $ | 880 | 947 | 808 | ||||
Total securities | 199 | 326 | 336 | |||||
Net loans and leases | 588 | 509 | 428 | |||||
Allowance for loan losses | 6 | 5 | 5 | |||||
Noninterest-bearing demand deposits | 185 | 145 | 120 | |||||
Total deposits | 603 | 608 | 513 | |||||
Common equity | 75 | 67 | 56 | |||||
Net income for TCBW had strong earnings growthdecreased 9.1% to $14.0 million for 2008 compared to $15.4 million for 2007 and $14.2 million for 2006. The decrease in 2006net income was primarily due primarily to the increasea decline in the net interest margin from 2005 to 2006.
caused by the accelerated drop in the prime rate. In December TCBW terminated its ineffective interest rate swap portfolio which resulted in a pretax gain of $2.0 million. TCBW also incurred a $1.3 million pretax OTTI charge for a bank trust preferred CDO security.
Credit quality improved and net charge-offs were $212 thousandwas strong for the year. TCBW did not have any nonperforming assets at December 31, 2008 compared to $0.2 million at year-end 2007. However, some deterioration in 2006, down from $942 thousandother credit quality metrics occurred in 2005,the fourth quarter, reflecting the improved Western Washingtonrapidly weakening Pacific Northwest economy.
Net interest income at TCBW by $1.3 million, or 3.7% for 2008 compared to 2007. The net interest margin was 4.05 % for 2008, compared to 4.41% for 2007 and 4.53% for 2006. The reduction in the margin and net
SCHEDULEinterest income was primarily due to the heavy concentration of variable rate loans and securities on the balance sheet resulting in sensitivity to sharply declining interest rates.
Other noninterest income increased 76.0% to $4.4 million compared to $2.5 million for 2007 and $2.0 million for 2006. The increase is due to a pretax gain of $2.0 million from ineffective interest rate swaps that were subsequently terminated.
Noninterest expense for 2008 increased $0.4 million or 2.8% from 2007. Increases for 2008 included a $0.3 million increase in FDIC insurance and an overall decrease in salaries and employee benefits of $0.4 million, or 3.8%. The efficiency ratio was 39.52% for 2008, as compared to 37.68% for 2007 and 38.38% for 2006.
Schedule 24
THE COMMERCE BANK OF WASHINGTON
(In millions)
| 2006 | 2005 | 2004 | ||||
CONDENSED INCOME STATEMENT | |||||||
Net interest income excluding hedge income | $ | 35.5 | 29.7 | 23.2 | |||
Hedge income (expense) recorded directly at subsidiary | (1.8) | (0.1) | 1.6 | ||||
Allocated hedge income (expense) | (0.1) | – | 2.6 | ||||
Net interest income | 33.6 | 29.6 | 27.4 | ||||
Noninterest income | 2.0 | 1.6 | 2.2 | ||||
Total revenue | 35.6 | 31.2 | 29.6 | ||||
Provision for loan losses | 0.5 | 1.0 | 2.0 | ||||
Noninterest expense | 13.9 | 12.6 | 11.4 | ||||
Income before income taxes | 21.2 | 17.6 | 16.2 | ||||
Income tax expense | 7.0 | 5.5 | 4.9 | ||||
Net income | $ | 14.2 | 12.1 | 11.3 | |||
YEAR-END BALANCE SHEET DATA | |||||||
Total assets | $ | 808 | 789 | 726 | |||
Net loans and leases | 428 | 402 | 379 | ||||
Allowance for loan losses | 5 | 4 | 4 | ||||
Goodwill, core deposit and other intangibles | – | 1 | 1 | ||||
Noninterest-bearing demand deposits | 120 | 130 | 125 | ||||
Total deposits | 513 | 442 | 417 | ||||
Common equity | 56 | 50 | 50 | ||||
| (Dollar amounts in millions) | 2008 | 2007 | 2006 | |||||||
PERFORMANCE RATIOS | ||||||||||
Return on average assets | 1.57 | % | 1.82 | % | 1.78 | % | ||||
Return on average common equity | 20.11 | % | 25.89 | % | 27.11 | % | ||||
Tangible return on average tangible common equity | 20.11 | % | 25.89 | % | 27.68 | % | ||||
Efficiency ratio | 39.52 | % | 37.68 | % | 38.38 | % | ||||
Net interest margin | 4.05 | % | 4.41 | % | 4.53 | % | ||||
RISK-BASED CAPITAL RATIOS | ||||||||||
Tier 1 leverage | 8.66 | % | 7.45 | % | 7.38 | % | ||||
Tier 1 risk-based capital | 10.33 | % | 10.36 | % | 10.84 | % | ||||
Total risk-based capital | 13.32 | % | 13.46 | % | 14.50 | % | ||||
CREDIT QUALITY | ||||||||||
Provision for loan losses | $ | 1.1 | 0.3 | 0.5 | ||||||
Net loan and lease charge-offs (recoveries) | (0.1 | ) | (0.1 | ) | 0.2 | |||||
Ratio of net charge-offs to average loans and leases | (0.03 | )% | (0.02 | )% | 0.05 | % | ||||
Allowance for loan losses | $ | 6 | 5 | 5 | ||||||
Ratio of allowance for loan losses to net loans and leases | 1.05 | % | 1.01 | % | 1.11 | % | ||||
Nonperforming assets | $ | – | 0.2 | – | ||||||
Ratio of nonperforming assets to net loans and leases and other real estate owned | – | 0.04 | % | – | ||||||
Accruing loans past due 90 days or more | $ | – | – | – | ||||||
Ratio of accruing loans past due 90 days or more to net loans and leases | – | – | – | |||||||
OTHER INFORMATION | ||||||||||
Full-time equivalent employees | 69 | 60 | 56 | |||||||
Domestic offices: | ||||||||||
Traditional branches | 1 | 1 | 1 | |||||||
Foreign office | 1 | – | – | |||||||
Total offices | 2 | 1 | 1 | |||||||
Net income forloans and leases grew by $79 million or 15.5% in 2008 compared to 2007. The commercial lending portfolio grew by $55 million and commercial real estate loans grew by $24 million. TCBW was $14.2continues to emphasize growing the commercial and small business loan portfolios, as well as private banking relationships
Total deposits decreased $5 million for 2006, an increaseor 0.8% in 2008 compared to 2007; however average deposits increased by 6.4% or $34 million over the $12.1 million earned in 2005 and $11.3 million in 2004.same period. The 17.4% earnings increase for 2006 resulted from continued growth in loans and deposits, a significant increase in net interest margin, and an improvement in credit quality. Operational efficiencies also improved resulting in an efficiency ratio of 38.4%. Net interest income for 2006 increased 13.5% over 2005 while the net interest margin increasednoninterest-bearing deposits to 4.53% compared to 4.16% for 2005.
SCHEDULE 25
THE COMMERCE BANK OF WASHINGTON
| 2006 | 2005 | 2004 | ||||
PERFORMANCE RATIOS | ||||||
Return on average assets | 1.78% | 1.57% | 1.61% | |||
Return on average common equity | 27.11% | 24.26% | 22.89% | |||
Efficiency ratio | 38.38% | 39.25% | 37.31% | |||
Net interest margin | 4.53% | 4.16% | 4.18% | |||
OTHER INFORMATION | ||||||
Full-time equivalent employees | 56 | 61 | 57 | |||
Domestic offices: | ||||||
Traditional branches | 1 | 1 | 1 | |||
ATMs | – | – | – | |||
TCBW continued to grow in 2006 as total assets increased to $808 million, up from $789 million at December 31, 2005. Net loans increased to $428 million, up from $402 million at year-end 2005 and total deposits increased to $51330.7% in 2008 from 23.8% in 2007, partially due to the FDIC program to provide unlimited insurance on non-interest bearing demand deposits.
Total securities declined $127 million from $442 millionor 39.0% in 2008 compared to 2007. The change was driven by the maturity of short term agency securities no longer needed to collateralize the repurchase agreement portfolio and the Parent’s purchase of an impaired security at the endfair value.
The bank continued to be well capitalized in 2008, with a total risk-based capital ratio of 2005. TCBW anticipates another year of steady balance sheet13.32% at 2008, compared to 13.46% at 2007 and 14.50% at 2006. The modest decline was due to strong loan growth in 2007 with a stable net interest margin.
and 2008.
Other
“Other” includes the Parent and other various nonbanking subsidiaries, including nonbank financial services and financial technology subsidiaries and other smaller nonbank operating units, along with the elimination of transactions between segments.
The Other segment also includes ZMSC, which provides internal technology and operational services to affiliated operating businesses of the Company. ZMSC has 2,352 of the 2,656 FTE employees in the Other segment. ZMSC charges most of its costs to the affiliates on an approximate break-even basis.
For 2006 and 2005 theThe Other segment also includes TCBO, which was opened during the fourth quarter of 2005 and didhas not havehad a significant impact on the Company’s balance sheet and income statement for either year.statement. TCBO consists of a single banking office operating in the Portland, Oregon area. Its business strategies focus on serving the financial needs of businesses, professional service firms, executives and professionals. TCBO has performed well in its first year of operation. At December 31, 20062008, TCBO had net loans of $12.0$46 million compared to $26 million at the end of 2007 and deposits of $8.7 million. $35 million compared to $23 million at the end of 2007.
Also, the Other segment includes NetDeposit and Welman. NetDeposit is the merged company of P5, Inc., a company that provides and NetDeposit, Inc. NetDeposit generates revenues by selling hardware, software and services related to remote imaging, electronic capture and clearing of paper checks, and providing medical claims imaging, lockbox and web-based reconciliation and tracking services. The remaining minority interestNetDeposit protects, with patents, its intellectual property in business methods related to the electronic processing, clearing of P5checks, key aspects of Internet-based medical claims processing, and lending against medical claims submitted through the Internet.
Welman, including Contango, is a wealth management company that became a direct subsidiary of the Parent on January 1, 2008. We have extensive relationships with small and middle-market businesses and business owners that we believe present an unusual opportunity to offer wealth management services. Welman provides financial and tax planning, trust and inheritance services, over-the-counter, exchange-traded and synthetic derivative and hedging strategies, quantitative asset allocation and risk management and a global array of investment strategies from equities and bonds through alternative and private equity investments. At year-end, Contango had over $1.0 billion of client assets under management and a strong pipeline of referrals from our affiliate banks, as compared to over $1.3 billion under management at December 31, 2007; the decline is primarily due to declines in market value of assets, as Contango continued to increase its customer base during the year. In years prior to 2008, Welman was acquired in the fourth quartera subsidiary of 2006 which is the main reason for the increased goodwill and other intangibles in the Other segment.Zions Bank.
Schedule 25
OTHER
| (Dollar amounts in millions) | 2008 | 2007 | 2006 | |||||||
CONDENSED INCOME STATEMENT | ||||||||||
Net interest income | $ | 8.8 | (0.8 | ) | (21.9 | ) | ||||
Impairment losses on investment securities | (96.9 | ) | (19.3 | ) | – | |||||
Other noninterest income | (98.9 | ) | 22.8 | 6.5 | ||||||
Total revenue | (187.0 | ) | 2.7 | (15.4 | ) | |||||
Provision for loan losses | 1.3 | 0.3 | 0.2 | |||||||
Noninterest expense | 67.6 | 60.1 | 63.5 | |||||||
Impairment loss on goodwill | 12.7 | – | – | |||||||
Income (loss) before income taxes and minority interest | (268.6 | ) | (57.7 | ) | (79.1 | ) | ||||
Income tax expense (benefit) | (111.8 | ) | (45.7 | ) | (42.1 | ) | ||||
Minority interest | (5.5 | ) | 7.7 | 9.9 | ||||||
Net income (loss) | (151.3 | ) | (19.7 | ) | (46.9 | ) | ||||
Preferred stock dividend | 24.4 | 14.3 | 3.8 | |||||||
Net loss applicable to common shareholders | $ | (175.7 | ) | (34.0 | ) | (50.7 | ) | |||
YEAR-END BALANCE SHEET DATA | ||||||||||
Total assets | $ | (757 | ) | (126 | ) | (343 | ) | |||
Total securities | 600 | 651 | 600 | |||||||
Net loans and leases | 130 | 85 | 89 | |||||||
Allowance for loan losses | 2 | 1 | – | |||||||
Goodwill and other intangibles | 7 | 22 | 25 | |||||||
Noninterest-bearing demand deposits | (35 | ) | (238 | ) | (171 | ) | ||||
Total deposits | (1,558 | ) | (396 | ) | (528 | ) | ||||
Preferred equity | 394 | 240 | 240 | |||||||
Common equity | (150 | ) | (232 | ) | (142 | ) | ||||
OTHER INFORMATION | ||||||||||
Full-time equivalent employees | 2,656 | 2,397 | 2,256 | |||||||
Domestic offices: | ||||||||||
Traditional branches | 1 | 1 | 1 | |||||||
The net loss applicable to common shareholders for the Other segment was $175.7 million in 2008 compared to net losses of $34.0 million in 2007 and $50.7 million in 2006 compared to a2006. The increased net loss of $21.2 million in 2005 and $21.8 millionapplicable to common shareholders for 2004. Net interest loss for the other segment increased $20.9 million from 20052008 is mainly due to a $23.9 million increase at the Parent reflecting increased borrowingsimpairment losses on investment securities, goodwill impairment losses on P5 goodwill, intercompany hedge ineffectiveness eliminations, and increased preferred stock dividends mainly related to the Amegy acquisition and other Parent cash flow requirements. Noninterest expense for the Other segmentU.S. Treasury’s $1.4 billion preferred stock investment. Impairment losses on investment securities increased $12.8to $96.9 million from 2005. The increase includes a $7.2$19.3 million increasefor 2007, mainly due to impairment losses on bank and insurance trust preferred CDO securities. See further discussion in merger related expenses related to the Amegy systems conversions and $2.6 million of increased expense for TCBO.“Noninterest Income” on page 53. See “Capital Management” on page 99 of the “Capital Management Section”119 for an explanation of the preferred stock dividend.
SCHEDULE 26
OTHER
(Amounts in millions)
| 2006 | 2005 | 2004 | ||||
CONDENSED INCOME STATEMENT | |||||||
Net interest expense excluding hedge income | $ | (18.9) | (2.4) | (1.8) | |||
Hedge income (expense) recorded directly at subsidiary | (3.0) | 1.4 | 2.1 | ||||
Net interest income (expense) | (21.9) | (1.0) | 0.3 | ||||
Noninterest income | 6.5 | 3.0 | 3.1 | ||||
Total revenue | (15.4) | 2.0 | 3.4 | ||||
Provision for loan losses | 0.2 | (0.3) | – | ||||
Noninterest expense | 63.5 | 50.7 | 52.2 | ||||
Loss before income taxes and minority interest | (79.1) | (48.4) | (48.8) | ||||
Income tax benefit | (42.1) | (25.7) | (25.6) | ||||
Minority interest | 9.9 | (1.5) | (1.4) | ||||
Net loss | (46.9) | (21.2) | (21.8) | ||||
Preferred stock dividend | 3.8 | – | – | ||||
Net loss applicable to common shareholders | $ | (50.7) | (21.2) | (21.8) | |||
YEAR-END BALANCE SHEET DATA | |||||||
Total assets | $ | (343) | (1,120) | (572) | |||
Net loans and leases | 89 | 72 | 97 | ||||
Allowance for loan losses | – | – | – | ||||
Goodwill, core deposit and other intangibles | 25 | 1 | (2) | ||||
Noninterest-bearing demand deposits | (171) | (113) | (9) | ||||
Total deposits | (528) | (1,220) | (1,220) | ||||
Preferred equity | 240 | – | – | ||||
Common equity | (142) | (331) | 147 | ||||
OTHER INFORMATION | |||||||
Full-time equivalent employees | 2,256 | 1,565 | 1,383 | ||||
Domestic offices: | |||||||
Traditional branches | 1 | 1 | – | ||||
The Company has investedOther noninterest income was $(98.9) million in start-up and early-stage ventures through a variety of entities. Through certain2008 compared to $22.8 million in 2007. This decline in other noninterest income is mainly due to $59.6 million in hedge ineffectiveness income eliminations in 2008 for ineffective hedges at the subsidiary banks that were not ineffective for the Company has principally made nonmarketable investmentsconsolidated Company. Other reasons for the decrease include $15.4 million for intercompany derivative credit valuation income eliminations, $30.2 million for declines in net equity securities gains, $4.2 million for declines in net fixed income securities gains, $7.1 million of fair value decrease for a number of companies using four Small Business Investment Companies (“SBICs”). No new SBICs have been started since 2001. The Company recognized gains on these venture capital SBIC investments, net of expenses,security accounted for at fair value, and $7.7 million for declines in income taxes and minority interest, of $4.1 million in 2006, compared to losses of $2.2 million and $4.5 million in 2005 and 2004, respectively. These amounts are included in results reported by the respective subsidiary banks and the Other segment.from other equity investments.
The Company also selectively makes investments in financial services and financial technology ventures, either through acquisition or through internal funding initiatives.ventures. The Company owns a significant position in IdenTrust, Inc. (“IdenTrust”), a company in which two unrelated venture capital firms also own significant positions, and which provides, among other services, online identity authentication services and infrastructure. The Company subscribed to $5.0 million of an equity funding round of approximately $20 million that closed in 2005. IdenTrust continues to post operating losses and the Company recorded pretax charges of $1.7 million in 2008 and $2.2 million $1.8 millionin both 2007 and $4.1 million in 2006, 2005, and 2004, respectively, to reduce itswhich reduced our recorded investment in the company.Company. The Other segment includes IdenTrust relatedIdenTrust-related losses of $1.6 million in 2008 and $2.1 million $1.2 millionin both 2007 and $1.0 million and Zions Bank included pretax losses of $0.1 million, $0.6 million, and $3.1 million for 2006, 2005 and 2004, respectively.
2006.
The Company continues to selectively invest in new, innovative products and ventures. Most notably the Company has funded the continued development of NetDeposit (formerly NetDeposit, Inc., a family of innovative check imaging and clearing products and services. See page 19 of the “Executive Summary” for a description ofP5). NetDeposit andlosses, including P5 related services. For 2006 net after tax losses, of NetDeposit included in the Other segment were $7.5$18.1 million for 2008 compared to losses of $7.4$8.3 million in 2007 and $8.1 million in 2006. Excluding the goodwill impairment loss of $12.7 million, the net loss for 2005 and $5.7 million for 2004.2008 was $5.4 million.
BALANCE SHEET ANALYSIS
As previously discussed, the Company completed its acquisition of Amegy Bancorporation, Inc. in December 2005. The Company’s consolidated balance sheets at December 31, 2006 and December 31, 2005 include Amegy; however, average balances in 2005 will only reflect Amegy for one month.
Interest-Earning Assets
Interest-earning assets are those with interest rates or yields associated with them. One of our goals is to maintain a high level of interest-earning assets, while keeping nonearning assets at a minimum.
Interest-earning assets consist of money market investments, securities, and loans.loans and leases. Schedule 6,5, which we referred to in our discussion of net interest income, includes the average balances of the Company’s interest-earning assets, the amount of revenue generated by them, and their respective yields. As shown in the schedule, average interest-earning assets in 20062008 increased 28.2 %10.8% to $38.7$47.7 billion from $30.2$43.0 billion in 2005 reflecting both the impact of the Amegy acquisition and of organic2007 mainly driven by loan growth. Average interest-earning assets comprised 87.4%88.7% of total average assets in 20062008 compared with 89.7%88.1% in 2005;2007. Average interest-earning assets were 92.3% of average tangible assets in both 2008 and 2007.
Average money market investments, consisting of interest-bearing deposits and commercial paper, federal funds sold, and security resell agreements increased 126.5% in 2008 to $1,889 million from $834 million in 2007. The increase in average money market investments is mainly due to asset-backed commercial paper that the declineCompany purchased from Lockhart during 2008. The average commercial paper purchased from Lockhart was $865 million for 2008 compared to $251 million for 2007. Also, average interest-earning balances due from the Federal Reserve were $315 million for 2008 due in 2006 reflectedpart to the impact of the goodwillCompany receiving TARP funds in the fourth quarter. Average investment securities decreased 10.8% for 2008 compared to 2007. Average net loans and other intangible assets recorded in accountingleases for the Amegy acquisition. Average interest-earning assets in 2006 were 91.7% of average tangible assets2008 increased 11.3% compared with 92.0% in 2005.
to 2007.
Investment Securities Portfolio
We invest in securities both to generate revenues for the Company and to manage liquidity. ScheduleSchedules 26 and 27 presents a profile of the Company’s investment portfolios at December 31, 2006, 2005,2008. Schedule 28 presents a profile of the Company’s investment portfolios at December 31, 2007 and 2004.2006. The amortized cost amounts represent the Company’s original cost for the investments, adjusted for accumulated amortization or accretion of any yield adjustments related to the security.security and impairment losses. The estimated marketfair values are the amounts that we believe most accurately reflect assumptions that other participants in the market place would use in pricing the securities could be sold for as of the dates indicated.
Schedule 26 presents the Company’s asset-backed securities, classified by the highest of the ratings from any of Moody’s Investors Service, Fitch Ratings or Standard & Poors. Schedule 27 presents the asset-backed securities classified by the lowest of the ratings from any of these ratings agencies. During 2008, the Company observed greater divergence of ratings on these securities due to more and greater securities downgrades by one or two of the agencies compared to the other(s). The majority of these securities had “negative outlook” or “negative watch” designations by one of more rating agency at December 31, 2008.
SCHEDULE 27Schedule 26
INVESTMENT SECURITIES PORTFOLIO
ASSET-BACKED SECURITIES CLASSIFIED AT HIGHEST CREDIT RATING1
As of December 31, 2008
| December 31, | |||||||||||||
| 2006 | 2005 | 2004 | |||||||||||
| (In millions) | Amortized cost | Estimated market value | Amortized cost | Estimated market value | Amortized cost | Estimated market value | |||||||
HELD TO MATURITY: | |||||||||||||
Municipal securities | $ | 652 | 648 | 650 | 642 | 642 | 642 | ||||||
Other debt securities | 1 | 1 | – | – | – | – | |||||||
| 653 | 649 | 650 | 642 | 642 | 642 | ||||||||
AVAILABLE FOR SALE: | |||||||||||||
U.S. Treasury securities | 43 | 42 | 42 | 43 | 36 | 36 | |||||||
U.S. government agencies and corporations: | |||||||||||||
Small Business Administration | 907 | 901 | 786 | 782 | 712 | 711 | |||||||
Other agency securities | 782 | 774 | 688 | 683 | 275 | 277 | |||||||
Municipal securities | 226 | 227 | 266 | 267 | 95 | 96 | |||||||
Mortgage/asset-backed and other debt securities | 2,930 | 2,908 | 3,311 | 3,308 | 2,743 | 2,760 | |||||||
| 4,888 | 4,852 | 5,093 | 5,083 | 3,861 | 3,880 | ||||||||
Other securities: | |||||||||||||
Mutual funds | 193 | 193 | 217 | 216 | 301 | 301 | |||||||
Stock | 3 | 6 | 7 | 7 | 6 | 8 | |||||||
| 196 | 199 | 224 | 223 | 307 | 309 | ||||||||
| 5,084 | 5,051 | 5,317 | 5,306 | 4,168 | 4,189 | ||||||||
Total | $ | 5,737 | 5,700 | 5,967 | 5,948 | 4,810 | 4,831 | ||||||
| (In millions) | Par value | Amortized cost | Net unrealized gains (losses) recognized in OCI2 | Carrying value | Net unrealized gains (losses) not recognized in OCI2 | Estimated fair value | |||||||||
HELD-TO-MATURITY: | |||||||||||||||
Municipal securities | $ | 700 | 697 | – | 697 | (2 | ) | 695 | |||||||
Asset-backed securities: | |||||||||||||||
Trust preferred securities – banks and insurance | |||||||||||||||
AA rated | 10 | 10 | (1 | ) | 9 | (3 | ) | 6 | |||||||
A rated | 1,191 | 1,049 | (157 | ) | 892 | (292 | ) | 600 | |||||||
BBB rated | 173 | 129 | (26 | ) | 103 | (32 | ) | 71 | |||||||
| 1,374 | 1,188 | (184 | ) | 1,004 | (327 | ) | 677 | ||||||||
Trust preferred securities – real estate investment trusts | |||||||||||||||
AAA rated | 20 | 18 | (5 | ) | 13 | (2 | ) | 11 | |||||||
A rated | 25 | 18 | (4 | ) | 14 | (4 | ) | 10 | |||||||
| 45 | 36 | (9 | ) | 27 | (6 | ) | 21 | ||||||||
Other | |||||||||||||||
AAA rated | 23 | 22 | – | 22 | (7 | ) | 15 | ||||||||
AA rated | 25 | 22 | (1 | ) | 21 | (5 | ) | 16 | |||||||
BBB rated | 44 | 27 | (12 | ) | 15 | – | 15 | ||||||||
Noninvestment grade | 13 | 5 | – | 5 | – | 5 | |||||||||
| 105 | 76 | (13 | ) | 63 | (12 | ) | 51 | ||||||||
| 2,224 | 1,997 | (206 | ) | 1,791 | (347 | ) | 1,444 | ||||||||
AVAILABLE-FOR-SALE: | |||||||||||||||
U.S. Treasury securities | 29 | 28 | 1 | 29 | 29 | ||||||||||
U.S. Government agencies and corporations: | |||||||||||||||
Agency securities | 323 | 323 | 2 | 325 | 325 | ||||||||||
Agency guaranteed mortgage-backed securities | 408 | 406 | 4 | 410 | 410 | ||||||||||
Small Business Administration loan-backed securities | 645 | 693 | (26 | ) | 667 | 667 | |||||||||
Municipal securities | 177 | 178 | 2 | 180 | 180 | ||||||||||
Asset-backed securities: | |||||||||||||||
Trust preferred securities – banks and insurance | |||||||||||||||
AAA rated | 761 | 730 | (120 | ) | 610 | 610 | |||||||||
A rated | 53 | 48 | (21 | ) | 27 | 27 | |||||||||
BBB rated | 7 | 3 | – | 3 | 3 | ||||||||||
Not rated | 26 | 26 | (5 | ) | 21 | 21 | |||||||||
| 847 | 807 | (146 | ) | 661 | 661 | ||||||||||
Trust preferred securities – real estate investment trusts | |||||||||||||||
A rated | 15 | 6 | – | 6 | 6 | ||||||||||
BBB rated | 35 | 12 | (2 | ) | 10 | 10 | |||||||||
Noninvestment grade | 71 | 9 | (1 | ) | 8 | 8 | |||||||||
| 121 | 27 | (3 | ) | 24 | 24 | ||||||||||
Other | |||||||||||||||
AAA rated | 47 | 47 | (13 | ) | 34 | 34 | |||||||||
A rated | 50 | 48 | (15 | ) | 33 | 33 | |||||||||
BBB rated | 3 | 3 | (2 | ) | 1 | 1 | |||||||||
Noninvestment grade | 30 | 4 | – | 4 | 4 | ||||||||||
| 130 | 102 | (30 | ) | 72 | 72 | ||||||||||
| 2,680 | 2,564 | (196 | ) | 2,368 | 2,368 | ||||||||||
Other securities: | |||||||||||||||
Mutual funds and stock | 308 | 308 | – | 308 | 308 | ||||||||||
| 2,988 | 2,872 | (196 | ) | 2,676 | 2,676 | ||||||||||
Total | $ | 5,212 | 4,869 | (402 | ) | 4,467 | (347 | ) | 4,120 | ||||||
1 | Ratings categories include the entire range. For example, “A rated” includes A+, A and A-. Split rated securities with more than one rating are categorized at the highest rating level. |
2 | Other comprehensive income. All amounts reported are pretax. |
Schedule 27
INVESTMENT SECURITIES PORTFOLIO
ASSET-BACKED SECURITIES CLASSIFIED AT LOWEST CREDIT RATING1
As of December 31, 2008
| (In millions) | Par value | Amortized cost | Net unrealized gains (losses) recognized in OCI2 | Carrying value | Net unrealized gains (losses) not recognized in OCI2 | Estimated fair value | |||||||||
HELD-TO-MATURITY: | |||||||||||||||
Municipal securities | $ | 700 | 697 | – | 697 | (2 | ) | 695 | |||||||
Asset-backed securities: | |||||||||||||||
Trust preferred securities – banks and insurance | |||||||||||||||
A rated | 388 | 388 | (89 | ) | 299 | (90 | ) | 209 | |||||||
BBB rated | 268 | 201 | (32 | ) | 169 | (45 | ) | 124 | |||||||
Noninvestment grade | 718 | 599 | (63 | ) | 536 | (192 | ) | 344 | |||||||
| 1,374 | 1,188 | (184 | ) | 1,004 | (327 | ) | 677 | ||||||||
Trust preferred securities – real estate investment trusts | |||||||||||||||
AA rated | 20 | 18 | (5 | ) | 13 | (2 | ) | 11 | |||||||
A rated | 25 | 18 | (4 | ) | 14 | (4 | ) | 10 | |||||||
| 45 | 36 | (9 | ) | 27 | (6 | ) | 21 | ||||||||
Other | |||||||||||||||
AAA rated | 5 | 5 | – | 5 | – | 5 | |||||||||
AA rated | 18 | 16 | – | 16 | (6 | ) | 10 | ||||||||
A rated | 21 | 19 | – | 19 | (6 | ) | 13 | ||||||||
BBB rated | 4 | 4 | (1 | ) | 3 | – | 3 | ||||||||
Noninvestment grade | 57 | 32 | (12 | ) | 20 | – | 20 | ||||||||
| 105 | 76 | (13 | ) | 63 | (12 | ) | 51 | ||||||||
| 2,224 | 1,997 | (206 | ) | 1,791 | (347 | ) | 1,444 | ||||||||
AVAILABLE-FOR-SALE: | |||||||||||||||
U.S. Treasury securities | 29 | 28 | 1 | 29 | 29 | ||||||||||
U.S. Government agencies and corporations: | |||||||||||||||
Agency securities | 323 | 323 | 2 | 325 | 325 | ||||||||||
Agency guaranteed mortgage-backed securities | 408 | 406 | 4 | 410 | 410 | ||||||||||
Small Business Administration loan-backed securities | 645 | 693 | (26 | ) | 667 | 667 | |||||||||
Municipal securities | 177 | 178 | 2 | 180 | 180 | ||||||||||
Asset-backed securities: | |||||||||||||||
Trust preferred securities – banks and insurance | |||||||||||||||
AAA rated | 206 | 200 | (39 | ) | 161 | 161 | |||||||||
AA rated | 143 | 138 | (22 | ) | 116 | 116 | |||||||||
A rated | 176 | 169 | (32 | ) | 137 | 137 | |||||||||
BBB rated | 187 | 176 | (18 | ) | 158 | 158 | |||||||||
Not rated | 26 | 26 | (5 | ) | 21 | 21 | |||||||||
Noninvestment grade | 109 | 98 | (30 | ) | 68 | 68 | |||||||||
| 847 | 807 | (146 | ) | 661 | 661 | ||||||||||
Trust preferred securities – real estate investment trusts | |||||||||||||||
Noninvestment grade | 121 | 27 | (3 | ) | 24 | 24 | |||||||||
| 121 | 27 | (3 | ) | 24 | 24 | ||||||||||
Other | |||||||||||||||
AAA rated | 46 | 46 | (13 | ) | 33 | 33 | |||||||||
BBB rated | 54 | 52 | (17 | ) | 35 | 35 | |||||||||
Noninvestment grade | 30 | 4 | – | 4 | 4 | ||||||||||
| 130 | 102 | (30 | ) | 72 | 72 | ||||||||||
| 2,680 | 2,564 | (196 | ) | 2,368 | 2,368 | ||||||||||
Other securities: | |||||||||||||||
Mutual funds and stock | 308 | 308 | – | 308 | 308 | ||||||||||
| 2,988 | 2,872 | (196 | ) | 2,676 | 2,676 | ||||||||||
Total | $ | 5,212 | 4,869 | (402 | ) | 4,467 | (347 | ) | 4,120 | ||||||
1 | Ratings categories include the entire range. For example, “A rated” includes A+, A and A-. Split rated securities with more than one rating are categorized at the lowest rating level. |
2 | Other comprehensive income. All amounts reported are pretax. |
Schedule 28
INVESTMENT SECURITIES PORTFOLIO
| December 31, | |||||||||
| 2007 | 2006 | ||||||||
| (In millions) | Amortized cost | Estimated fair value | Amortized cost | Estimated fair value | |||||
HELD-TO-MATURITY: | |||||||||
Municipal securities | $ | 704 | 702 | 653 | 649 | ||||
AVAILABLE-FOR-SALE: | |||||||||
U.S. Treasury securities | 52 | 53 | 43 | 42 | |||||
U.S. Government agencies and corporations: | |||||||||
Agency securities | 629 | 626 | 782 | 774 | |||||
Agency guaranteed mortgage-backed securities | 765 | 763 | 901 | 894 | |||||
Small Business Administration loan-backed securities | 789 | 771 | 907 | 901 | |||||
Municipal securities | 220 | 222 | 226 | 227 | |||||
Asset-backed securities: | |||||||||
Trust preferred securities – banks and insurance | 2,123 | 2,019 | 1,624 | 1,610 | |||||
Trust preferred securities – real estate investment trusts | 156 | 94 | 204 | 201 | |||||
Small business loan-backed | 183 | 182 | 194 | 194 | |||||
Other | 226 | 231 | 7 | 9 | |||||
| 5,143 | 4,961 | 4,888 | 4,852 | ||||||
Other securities: | |||||||||
Mutual funds and stock | 174 | 174 | 196 | 199 | |||||
| 5,317 | 5,135 | 5,084 | 5,051 | ||||||
Total | $ | 6,021 | 5,837 | 5,737 | 5,700 | ||||
The amortized cost of investment securities at year-end 20062008 decreased $230$1,152 million from 2005.2007. The decreasechange was mainlylargely due to security sales, security paydowns, and OTTI write-downs, offset in part by Zions Bank purchasing securities from Lockhart. See further discussion of securities purchases from Lockhart in “Off-Balance Sheet Arrangement” on page 96. As discussed further in “Market Risk – Fixed Income” on page 113, changes in fair value on available-for-sale securities have been reflected in shareholders’ equity through accumulated other comprehensive income (“OCI”).
During the resultsecond quarter of 2008, the Company reassessed the classification of certain asset-backed and trust preferred CDOs. On April 28, 2008, the Company reclassified approximately $1.2 billion at fair value of these available-for-sale securities to held-to-maturity. The related unrealized pretax loss of approximately $273 million included in OCI remained in OCI and is being amortized as a yield adjustment through earnings over the remaining terms of the securities. On December 24, 2008, the Company reclassified an increaseadditional available-for-sale security with a fair value of approximately $5.1 million to held-to-maturity. No gain or loss was recognized at the time of reclassifications. The Company considers the held-to-maturity classification to be more appropriate because it has the ability and the intent to hold these securities to maturity.
Included in maturingasset-backed securities at December 31, 2008 are CDOs collateralized by trust preferred securities issued by banks, insurance companies, or REITs. The REIT CDOs have some exposure to the subprime market. In addition, the $135 million carrying value of held-to-maturity and available-for-sale “Asset-backed securities – Other” includes $63 million of certain structured asset-backed collateralized debt obligations (“ABS CDOs”) (also known as diversified structured finance CDOs) purchased from Lockhart, which have non-Zions’ originated subprime and home equity mortgage securitizations. The $63 million of ABS CDOs includes approximately $11 million of subprime mortgage securities and $7 million of home equity credit line securities. See further discussion of certain CDOs held by Lockhart in 2006“Off-Balance Sheet Arrangement” on page 96.
At December 31, 2008, 1% of the $2.7 billion of fair value of available-for-sale securities portfolio as shown previously was valued at Level 1, 71% was valued at Level 2, and pay downs28% was valued at Level 3 under the SFAS 157 valuation hierarchy. See “Fair Value Accounting” on page 34 and Note 21 of mortgage-backed securities.the Notes to Consolidated Financial Statements for further discussion of fair value accounting.
The amortized cost of available-for-sale investment securities valued at Level 3 was $929 million and the fair value of these securities was $750 million. The securities valued at Level 3 were comprised of CDOs. For these Level 3 securities, net pretax unrealized loss recognized in OCI in 2008 was $179 million. As of December 31, 2008, we believe that the par amounts of the Level 3 available-for-sale securities for which no OTTI has been recognized do not differ from the amounts we currently anticipate realizing on settlement or maturity. See “Valuation of Collateralized Debt Obligations” on page 37 for further details about the CDO securities pricing methodologies.
Schedule 29 presents a summary of all securities with OTTI losses in 2008 and 2007 including selected information for remaining securities at December 31, 2008.
Schedule 29
OTTI INVESTMENT SECURITIES PORTFOLIO
| OTTI losses | December 31, 2008 | ||||||||||||||||||
| Par value | Amortized cost | Net unrealized gains (losses) recognized in OCI | Carrying value | Net unrealized gains (losses) not recognized in OCI | Estimated fair value | ||||||||||||||
| (In millions) | 2008 | 2007 | |||||||||||||||||
HELD-TO-MATURITY: | |||||||||||||||||||
Asset-backed securities: | |||||||||||||||||||
Trust preferred securities – banks and insurance | $ | 187.7 | – | 341.6 | 153.7 | (1.4 | ) | 152.3 | (1.2 | ) | 151.1 | ||||||||
Other | 20.0 | – | 31.6 | 9.3 | – | 9.3 | – | 9.3 | |||||||||||
| 207.7 | – | 373.2 | 163.0 | (1.4 | ) | 161.6 | (1.2 | ) | 160.4 | ||||||||||
AVAILABLE-FOR-SALE: | |||||||||||||||||||
Asset-backed securities: | |||||||||||||||||||
Trust preferred securities – banks and insurance | 15.6 | – | 17.2 | 7.9 | – | 7.9 | 7.9 | ||||||||||||
Trust preferred securities – real estate investment trusts1 | 64.8 | 108.6 | 120.6 | 26.9 | (3.0 | ) | 23.9 | 23.9 | |||||||||||
Other | 15.9 | – | 30.0 | 4.4 | – | 4.4 | 4.4 | ||||||||||||
| 96.3 | 108.6 | 167.8 | 39.2 | (3.0 | ) | 36.2 | 36.2 | ||||||||||||
Total | $ | 304.0 | 108.6 | 541.0 | 202.2 | (4.4 | ) | 197.8 | (1.2 | ) | 196.6 | ||||||||
1 | Amounts at December 31, 2008 reflect the sale in December 2008 of certain REIT CDOs with a par value of $84 million and an amortized cost of $1 million. |
We review investment securities on an ongoing basis for the presence of OTTI, taking into consideration current market conditions, estimated credit impairment, if any, fair value in relationship to cost, extent and nature of change in fair value, issuer rating changes and trends, volatility of earnings, current analysts’ evaluations, our ability and intent to hold investments until a recovery of fair value, which may be maturity, and other factors. Future reviews for OTTI will consider the particular facts and circumstances during the reporting period in review. See “Other-than-Temporary-Impairment – Debt Investment Securities” on page 40 for further details about the OTTI accounting policy.
The Company also recognized valuation losses during 2008 of $13.1 million on securities purchased from Lockhart under the terms of the Liquidity agreement. During 2007 the Company recognized valuation losses of $49.6 million on securities purchased from Lockhart. The securities purchased from Lockhart in 2008 and 2007 consisted of REIT CDOs and bank and insurance trust preferred CDOs. See “Off-Balance Sheet Arrangement” on page 96 for further details about Lockhart.
Schedule 2830 also presents information regarding the investment securities portfolio. This schedule presents the maturities of the different types of investments that the Company owned as of December 31, 2006,2008, and the corresponding average interest rates that the investments will yield if they are held to maturity. It should be noted that most of the SBA loan-backed securities and mortgage/asset-backed securities are variable rate and their repricing periods are significantly less than their contractual maturities. Also see “Liquidity Risk” on page 91114 and Notes 1, 4 and 7 of the Notes to Consolidated Financial Statements for additional information about the Company’s investment securities and their management.
SCHEDULE 28Schedule 30
MATURITIES AND AVERAGE YIELDS ON SECURITIES
AT DECEMBER 31, 20062008
| Total securities | Within one year | After one but within five years | After five but within ten years | After ten years | |||||||||||||||||||||||||||||||||||||||||||||||||||
(Amounts in millions)
| Amount | Yield* | Amount | Yield* | Amount | Yield* | Amount | Yield* | Amount | Yield* | Total securities | Within one year | After one but within five years | After five but within ten years | After ten years | ||||||||||||||||||||||||||||||||||||||||
HELD TO MATURITY: | |||||||||||||||||||||||||||||||||||||||||||||||||||||||
| (Amounts in millions) | Amortized cost | Yield* | Amortized cost | Yield* | Amortized cost | Yield* | Amortized cost | Yield* | Amortized cost | Yield* | |||||||||||||||||||||||||||||||||||||||||||||
Municipal securities | $ | 652 | 6.8% | $ | 57 | 6.4% | $ | 203 | 6.7% | $ | 189 | 6.6% | $ | 203 | 7.3% | $ | 697 | 7.5 | % | $ | 68 | 6.5 | % | $ | 298 | 6.9 | % | $ | 190 | 8.3 | % | $ | 141 | 8.0 | % | ||||||||||||||||||||
Other debt securities | 1 | 5.1 | – | 1 | 5.1 | – | – | ||||||||||||||||||||||||||||||||||||||||||||||||
Asset-backed securities: | |||||||||||||||||||||||||||||||||||||||||||||||||||||||
Trust preferred securities – banks and insurance | 1,188 | 5.2 | 9 | 0.3 | 2 | 1.3 | 18 | 2.1 | 1,159 | 5.3 | |||||||||||||||||||||||||||||||||||||||||||||
Trust preferred securities – real estate investment trusts | 36 | 4.9 | – | – | – | 36 | 4.9 | ||||||||||||||||||||||||||||||||||||||||||||||||
Other | 76 | 6.2 | – | – | 9 | 19.0 | 67 | 4.4 | |||||||||||||||||||||||||||||||||||||||||||||||
| 653 | 6.8 | 57 | 6.4 | 204 | 6.7 | 189 | 6.6 | 203 | 7.3 | 1,997 | 6.1 | 77 | 5.8 | 300 | 6.9 | 217 | 8.2 | 1,403 | 5.6 | ||||||||||||||||||||||||||||||||||||
AVAILABLE FOR SALE: | |||||||||||||||||||||||||||||||||||||||||||||||||||||||
U.S. Treasury securities | 43 | 4.4 | 20 | 4.5 | 22 | 4.1 | 1 | 8.4 | – | 28 | 3.2 | 12 | 2.0 | 15 | 3.9 | 1 | 8.4 | – | |||||||||||||||||||||||||||||||||||||
U.S. government agencies and corporations: | |||||||||||||||||||||||||||||||||||||||||||||||||||||||
U.S. Government agencies and corporations: | |||||||||||||||||||||||||||||||||||||||||||||||||||||||
Agency securities | 323 | 5.0 | 181 | 5.0 | 129 | 5.1 | 12 | 5.0 | 1 | 4.7 | |||||||||||||||||||||||||||||||||||||||||||||
Agency guaranteed mortgage-backed securities | 406 | 4.7 | 112 | 4.8 | 210 | 4.7 | 67 | 4.6 | 17 | 4.2 | |||||||||||||||||||||||||||||||||||||||||||||
Small Business Administration loan-backed securities | 907 | 6.0 | 227 | 5.9 | 451 | 6.0 | 178 | 6.0 | 51 | 5.9 | 693 | 2.2 | 139 | 2.2 | 329 | 2.2 | 157 | 2.2 | 68 | 2.2 | |||||||||||||||||||||||||||||||||||
Other agency securities | 782 | 4.9 | 342 | 5.0 | 252 | 4.8 | 4 | 6.5 | 184 | 5.1 | |||||||||||||||||||||||||||||||||||||||||||||
Municipal securities | 226 | 5.8 | 13 | 5.0 | 10 | 6.8 | 45 | 6.0 | 158 | 5.7 | 178 | 6.1 | 10 | 4.6 | 35 | 5.2 | 78 | 6.4 | 55 | 6.5 | |||||||||||||||||||||||||||||||||||
Mortgage/asset-backed and other debt securities | 2,930 | 6.0 | 219 | 5.0 | 480 | 5.0 | 259 | 5.7 | 1,972 | 6.4 | |||||||||||||||||||||||||||||||||||||||||||||
Asset-backed securities | |||||||||||||||||||||||||||||||||||||||||||||||||||||||
Trust preferred securities – banks and insurance | 807 | 4.1 | 10 | 3.4 | 46 | 3.7 | 50 | 3.7 | 701 | 4.1 | |||||||||||||||||||||||||||||||||||||||||||||
Trust preferred securities – real estate investment trusts | 27 | 9.5 | 13 | – | 14 | 19.0 | – | ||||||||||||||||||||||||||||||||||||||||||||||||
Other | 102 | 3.3 | 1 | 4.7 | 1 | 4.7 | 89 | 3.4 | 11 | 2.5 | |||||||||||||||||||||||||||||||||||||||||||||
| 4,888 | 5.8 | 821 | 5.2 | 1,215 | 5.3 | 487 | 5.8 | 2,365 | 6.2 | 2,564 | 3.9 | 478 | 3.9 | 765 | 3.7 | 468 | 4.2 | 853 | 4.1 | ||||||||||||||||||||||||||||||||||||
Other securities: | |||||||||||||||||||||||||||||||||||||||||||||||||||||||
Mutual funds | 193 | 4.7 | 193 | 4.7 | – | – | – | ||||||||||||||||||||||||||||||||||||||||||||||||
Stock | 3 | 1.5 | – | – | – | 3 | 1.5 | ||||||||||||||||||||||||||||||||||||||||||||||||
| 196 | 4.7 | 193 | 4.7 | – | – | 3 | 1.5 | ||||||||||||||||||||||||||||||||||||||||||||||||
Mutual funds and stock | 308 | 1.6 | 308 | 1.6 | – | – | – | ||||||||||||||||||||||||||||||||||||||||||||||||
| 5,084 | 5.8 | 1,014 | 5.1 | 1,215 | 5.3 | 487 | 5.8 | 2,368 | 6.2 | 2,872 | 3.7 | 786 | 3.0 | 765 | 3.7 | 468 | 4.2 | 853 | 4.1 | ||||||||||||||||||||||||||||||||||||
Total | $ | 5,737 | 5.9% | $ | 1,071 | 5.2% | $ | 1,419 | 5.5% | $ | 676 | 6.1% | $ | 2,571 | 6.3% | $ | 4,869 | 4.7 | % | $ | 863 | 3.2 | % | $ | 1,065 | 4.6 | % | $ | 685 | 5.5 | % | $ | 2,256 | 5.0 | % | ||||||||||||||||||||
| * |
The investment securities portfolio at December 31, 20062008 includes $1.0 billion$707 million of nonrated, fixed-income securities.securities compared to $908 million at December 31, 2007 as shown in Schedule 31. Nonrated municipal securities held in the portfolio were underwritten as to credit by Zions Bank’s Public Finance Department. This department includes operationsMunicipal Credit Department in Utah, Idaho, Boston, and Dallas, and also the operations of Kelling, Northcross, and Nobriga in California, NSB Public Finance in Nevada, and the public finance department of NBA in Arizona.accordance with its established municipal credit standards.
Schedule 31
NONRATED SECURITIES
| December 31, | |||||
| (Book value in millions) | 2008 | 2007 | |||
Municipal securities | $ | 681 | 691 | ||
Asset-backed subordinated tranches, created from Zions’ loans | – | 183 | |||
Other nonrated debt securities | 26 | 34 | |||
| $ | 707 | 908 | |||
SCHEDULE 29
NONRATED SECURITIES
| December 31, | |||||
(Book value in millions)
| 2006 | 2005 | |||
Municipal securities | $ | 630 | 625 | ||
Asset-backed subordinated tranches, | 194 | 207 | |||
Asset-backed subordinated tranches, | 32 | 120 | |||
Other nonrated debt securities | 104 | 83 | |||
| $ | 960 | 1,035 | |||
In addition to the nonrated municipal securities, the portfolio includes nonrated, asset-backed subordinated tranches. The asset-backed subordinated tranches shown in 2007 created from the Company’s loans arewere mainly the subordinated retained interests of small business loan securitizations (thesecuritizations. During 2008, Zions Bank was required to purchase from Lockhart senior tranches of these securitizations are sold to Lockhart, a QSPE securities conduit described further in “Off-Balance-Sheet Arrangements”securitizations. Upon dissolution of related securitization trusts the Company recorded the previously securitized loans on its balance sheet as loans. See “Off-Balance Sheet Arrangement” on page 76). At December 31, 2006, these comprised $194 million of96 for further information on Lockhart and the $214 million set forth in Schedule 31. The tranches not created from the Company’s loans are tranches of bank and insurance company Trust Preferred
Collateral Debt Obligations. Investment securities also include other nonrated debt securities, the majority of which were created by Zions Bank.security purchases. Although the credit quality of these nonrated securities generally is high, it would be difficult to market them in a short period of time since they are not rated and there is no active trading market for them.
Loan Portfolio
As of December 31, 2006,2008, net loans and leases accounted for 73.8%76.0% of total assets compared to 73.8% at year-end 2007, and 77.2%78.5% of tangible assets as compared to 70.4% of total assets and 74.0% of tangible assets77.0% at December 31, 2005.2007. Schedule 3032 presents the Company’s loans outstanding by type of loan as of the five most recent year-ends. The schedule also includes a maturity profile for the loans that were outstanding as of December 31, 2006.2008. However, while this schedule reflects the contractual maturity and repricing characteristics of these loans, in certain cases the Company has hedged the repricing characteristics of its variable-rate loans as more fully described in “Interest Rate Risk” on page 87.111.
Schedule 32
SCHEDULE 30
LOAN PORTFOLIO BY TYPE AND MATURITY
| December 31, 2006 | December 31, | |||||||||||||||||||||||||||||||||||
| (In millions) | December 31, 2008 | |||||||||||||||||||||||||||||||||||
One year or less | One year five years | Over years | Total | December 31, | One year or less | One year through five years | Over five years | Total | December 31, | |||||||||||||||||||||||||||
| 2007 | 2006 | 2005 | 2004 | |||||||||||||||||||||||||||||||||
Loans held for sale | $ | 8 | 79 | 166 | 253 | 256 | 197 | 177 | 289 | $ | 29 | 25 | 146 | 200 | 208 | 253 | 256 | 197 | ||||||||||||||||||
Commercial lending: | ||||||||||||||||||||||||||||||||||||
Commercial and industrial | 4,479 | 2,871 | 1,072 | 8,422 | 7,192 | 4,643 | 4,111 | 4,124 | 6,037 | 3,962 | 1,449 | 11,448 | 10,407 | 8,422 | 7,192 | 4,643 | ||||||||||||||||||||
Leasing | 28 | 322 | 93 | 443 | 373 | 370 | 377 | 384 | 23 | 321 | 87 | 431 | 503 | 443 | 373 | 370 | ||||||||||||||||||||
Owner occupied | 491 | 927 | 4,842 | 6,260 | 4,825 | 3,790 | 3,319 | 3,018 | 628 | 1,044 | 7,071 | 8,743 | 7,545 | 6,260 | 4,825 | 3,790 | ||||||||||||||||||||
Total commercial lending | 4,998 | 4,120 | 6,007 | 15,125 | 12,390 | 8,803 | 7,807 | 7,526 | 6,688 | 5,327 | 8,607 | 20,622 | 18,455 | 15,125 | 12,390 | 8,803 | ||||||||||||||||||||
Commercial real estate: | ||||||||||||||||||||||||||||||||||||
Construction and land development | 4,872 | 2,205 | 406 | 7,483 | 6,065 | 3,536 | 2,867 | 2,947 | 5,115 | 2,150 | 251 | 7,516 | 7,869 | 7,483 | 6,065 | 3,536 | ||||||||||||||||||||
Term | 937 | 1,351 | 2,664 | 4,952 | 4,640 | 3,998 | 3,402 | 3,175 | 841 | 1,545 | 3,810 | 6,196 | 5,334 | 4,952 | 4,640 | 3,998 | ||||||||||||||||||||
Total commercial real estate | 5,809 | 3,556 | 3,070 | 12,435 | 10,705 | 7,534 | 6,269 | 6,122 | 5,956 | 3,695 | 4,061 | 13,712 | 13,203 | 12,435 | 10,705 | 7,534 | ||||||||||||||||||||
Consumer: | ||||||||||||||||||||||||||||||||||||
Home equity credit line and other consumer real estate | 246 | 402 | 1,202 | 1,850 | 1,831 | 1,104 | 838 | 651 | ||||||||||||||||||||||||||||
Home equity credit line | 24 | 42 | 1,939 | 2,005 | 1,608 | 1,850 | 1,831 | 1,104 | ||||||||||||||||||||||||||||
1-4 family residential | 152 | 519 | 3,521 | 4,192 | 4,130 | 4,234 | 3,874 | 3,209 | 84 | 406 | 3,387 | 3,877 | 3,975 | 4,192 | 4,130 | 4,234 | ||||||||||||||||||||
Construction and other consumer real estate | 373 | 246 | 155 | 774 | 945 | – | – | – | ||||||||||||||||||||||||||||
Bankcard and other revolving plans | 172 | 114 | 9 | 295 | 207 | 225 | 198 | 205 | 257 | 106 | 11 | 374 | 347 | 295 | 207 | 225 | ||||||||||||||||||||
Other | 102 | 281 | 74 | 457 | 537 | 532 | 749 | 1,000 | 84 | 246 | 55 | 385 | 460 | 457 | 537 | 532 | ||||||||||||||||||||
Total consumer | 672 | 1,316 | 4,806 | 6,794 | 6,705 | 6,095 | 5,659 | 5,065 | 822 | 1,046 | 5,547 | 7,415 | 7,335 | 6,794 | 6,705 | 6,095 | ||||||||||||||||||||
Foreign loans | 1 | 2 | – | 3 | 5 | 5 | 15 | 5 | 39 | 4 | – | 43 | 51 | 3 | 5 | 5 | ||||||||||||||||||||
Other receivables | 126 | 41 | 42 | 209 | 191 | 98 | 90 | 126 | – | – | – | – | – | 209 | 191 | 98 | ||||||||||||||||||||
Total loans | $ | 11,614 | 9,114 | 14,091 | 34,819 | 30,252 | 22,732 | 20,017 | 19,133 | $ | 13,534 | 10,097 | 18,361 | 41,992 | 39,252 | 34,819 | 30,252 | 22,732 | ||||||||||||||||||
Loans maturing in more than one year: | ||||||||||||||||||||||||||||||||||||
With fixed interest rates | $ | 3,624 | 3,515 | 7,139 | $ | 4,436 | 3,322 | 7,758 | ||||||||||||||||||||||||||||
With variable interest rates | 5,490 | 10,576 | 16,066 | 5,661 | 15,039 | 20,700 | ||||||||||||||||||||||||||||||
Total | $ | 9,114 | 14,091 | 23,205 | $ | 10,097 | 18,361 | 28,458 | ||||||||||||||||||||||||||||
Note: During 2006,2008 the Company reclassified certain balances between constructioncompleted a loan classification project and land development, home equity credit lineamounts for 2008 and other consumer real estate, and 1-4 family residential.2007 reflect reclassifications resulting from that project. Information to reclassify the loans for yearsperiods prior to 20052007 is not available.
Loan growth was strongNet loans and leases increased $2.8 billion during 2008 compared to $4.4 billion during 2007. The increase in mostloans includes $1.2 billion of loans resulting from the banking subsidiaries during 2006, particularlypurchase of certain securities from Lockhart, as discussed in “Off-Balance Sheet Arrangement” on page 96. These securities were backed by loans originated or underwritten by Zions Bank and are reflected on the Company’s balance sheet primarily as owner occupied commercial loans. Loan growth slowed considerably during 2008 at Zions Bank, Amegy, as previously discussedand Vectra. CB&T experienced modest loan growth during 2008 after contracting during 2007. NBA and NSB experienced a reduction in “Business Segment Results” beginning on page 52. outstanding loans due to very challenging economic times in their markets.
We expect that while net loan growth willmay continue in 20072009 in most of our subsidiary banks. However, the rate ofbanks, growth beganwill continue to slow during the second half of 2006be limited at NBA, NSB and even turned negative in CB&T and NSBuntil conditions in the fourth quarter; the averageresidential real estate sector improve. It appears that loan demand may be slowing in many of our markets due to weakening economic conditions and we believe that continued repayments and charge-offs of residential real estate acquisition and development loans in some markets may offset growth experiencedof other loan types and growth in 2006 may not be sustainable throughout 2007.other geographies.
Sold Loans Being Serviced
The Company performs loan servicing operations on both loans that it holds in its portfolios as well as loans that are owned by third party investor-owned trusts. Servicing loans includes:
collecting loan and, in certain instances, insurance and property tax payments from the borrowers;
monitoring adequate insurance coverage;
maintaining documentation files in accordance with legal, regulatory, and contractual guidelines; and
remitting payments to third party investor trusts and, where required, for insurance and property taxes.
The Company receives a fee for performing loan servicing for third parties. Failure by the Company to service the loans in accordance with the contractual requirements of the servicing agreements may lead to the termination of the servicing contract and the loss of future servicing fees.
Schedule 33
SCHEDULE 31
SOLD LOANS BEING SERVICED
| 2006 | 2005 | 2004 | |||||||||||
| (In millions) | Sales | Outstanding at year-end | Sales | Outstanding at year-end | Sales | Outstanding at year-end | |||||||
Home equity credit lines | $ | 153 | 261 | 408 | 456 | 296 | 447 | ||||||
Small business loans | – | 1,790 | 707 | 2,341 | 605 | 2,001 | |||||||
SBA 7(a) loans | 22 | 128 | 16 | 179 | 53 | 230 | |||||||
Farmer Mac | 43 | 407 | 69 | 407 | 42 | 388 | |||||||
Total | $ | 218 | 2,586 | 1,200 | 3,383 | 996 | 3,066 | ||||||
Residual interests on balance sheet at December 31, 2006 | Residual interests on balance sheet at December 31, 2005 | ||||||||||||
| (In millions) | Subordinated retained interests | Capitalized residual cash flows | Total | Subordinated retained interests | Capitalized residual cash flows | Total | |||||||
Home equity credit lines | $ | 8 | 5 | 13 | 13 | 7 | 20 | ||||||
Small business loans | 214 | 78 | 292 | 221 | 101 | 322 | |||||||
SBA 7(a) loans | – | 2 | 2 | – | 4 | 4 | |||||||
Farmer Mac | – | 5 | 5 | – | 6 | 6 | |||||||
Total | $ | 222 | 90 | 312 | 234 | 118 | 352 | ||||||
Home equity credit lines Small business loans SBA 7(a) loans Farmer Mac Leases Total Home equity credit lines Small business loans SBA 7(a) loans Farmer Mac Total 2008 2007 2006 (In millions) Sales Outstanding
at year-end Sales Outstanding
at year-end Sales Outstanding
at year-end $ – – – 71 153 261 – – – 1,331 – 1,790 31 98 – 90 22 128 74 403 64 393 43 407 86 77 – – – – $ 191 578 64 1,885 218 2,586 Residual interests
on balance sheet at December 31, 2008 Residual interests
on balance sheet at December 31, 2007(In millions) Subordinated
retained
interests Capitalized
residual
cash flows Total Subordinated
retained
interests Capitalized
residual
cash flows Total $ – – – 7 1 8 – – – 203 50 253 – 1 1 – 1 1 – 5 5 – 5 5 $ – 6 6 210 57 267
The Company has securitized and sold a portion of the loans that it originated and purchased. In many instances, we agreed to provide the servicing on these loans as a condition of the sale. Schedule 3133 summarizes the sold loans (other than conforming long-term first mortgage real estate loans) that the Company was servicing as of the dates indicated and the related loan sales activity. As reflected in the schedule, sales for 2006 decreased2008 increased approximately $1.0 billion$127 million compared to 2005.2007, which were down $154 million from 2006. The Company did not complete a small business loans securitization during 20062008 or 2007 and also discontinued selling new home equity credit lines originations during the fourth quarter.quarter of 2006. During 2008, the Company purchased small business securitization related securities from Lockhart and upon dissolution of related securitization trusts recorded the related loans on its balance sheet. See “Off-Balance Sheet Arrangement” on page 96 for further discussion. Also during 2008 the Company completed a “cleanup” call on its home equity credit line securitization. Small business, consumer and other sold loans being serviced totaled $2.6$0.6 billion at the end of 20062008 compared to $3.4$1.9 billion at the end of 2005. See Notes 1 and 6 of the Notes to Consolidated Financial Statements for additional information on asset securitizations.2007. In addition, at December 31, 2006,2008, conforming long-term first mortgage real estate loans being serviced for others was $1,251$1,173 million compared with $1,274$1,232 million at the same date in 2005.year-end 2007.
Although it performsperformed the servicing, the Company exertsexerted no control nor does it havehad any equity interest in any of the trusts that ownowned the securitized small business and home equity credit line loans. However, as of December 31, 2006, the Company had recorded assets in the amount of $312 million in connection with sold loans being serviced of $2.6 billion. As is a common practice with securitized transactions, the Company had subordinated retained interests in the securitized assets, amounting to $222 million at December 31, 2006, representing junior positions to the other investors in the trust securities. The capitalized residual cash flows, which is sometimes referred to as “excess servicing,” of $90 million primarily represent the present value of the excess cash flows that have been projected over the lives of the sold loans. These excess cash flows are subject to prepayment risk, which is the risk that a loan will be paid prior to its contractual maturity. When this occurs, any remaining excess cash flows that are associated with the loan must be reduced. See NoteNotes 1 and 6 of the Notes to Consolidated Financial Statements for more information on asset securitizations.securitizations and “Off-Balance Sheet Arrangement” on page 96.
Other Earning Assets
As of December 31, 2006,2008, the Company had $1,022$1,044 million of other noninterest-bearing investments compared with $939$1,034 million in 2005.2007. The increase in other noninterest-bearing investments resulted mainly from regulatory required increases in Federal Reserve stock at Amegybank-owned life insurance and increases in non-SBIC investment funds.
Schedule 34
OTHER NONINTEREST-BEARING INVESTMENTS
| December 31, | |||||
| (In millions) | 2008 | 2007 | |||
Bank-owned life insurance | $ | 623 | 601 | ||
Federal Home Loan Bank and Federal Reserve stock | 220 | 227 | |||
SBIC investments1 | 66 | 73 | |||
Non-SBIC investment funds | 106 | 65 | |||
Other public companies | 12 | 38 | |||
Other nonpublic companies | 3 | 16 | |||
Trust preferred securities | 14 | 14 | |||
| $ | 1,044 | 1,034 | |||
1 | Amounts include minority investors’ interests in Zions’ managed SBIC investments of approximately $26 million and $29 million as of the respective dates. |
Bank-owned life insurance investments increased $22 million during 2008 mainly representing the SBIC andincrease in cash surrender value of the policies, which is not taxable since it is anticipated that the bank-owned life insurance investments.will be held until the eventual death of the insured employees.
SCHEDULE 32
OTHER NONINTEREST-BEARING INVESTMENTS
| December 31, | |||||
(In millions)
| 2006 | 2005 | |||
Bank-owned life insurance | $ | 627 | 605 | ||
Federal Home Loan Bank and Federal Reserve stock | 189 | 153 | |||
SBIC investments(1) | 104 | 80 | |||
Non-SBIC investment funds | 37 | 27 | |||
Other public companies | 37 | 39 | |||
Other nonpublic companies | 14 | 15 | |||
Trust preferred securities | 14 | 20 | |||
| $ | 1,022 | 939 | |||
(1) Amounts include minority investors’ interests in Zions’ managed SBIC investments decreased $7 million from December 31, 2007 due to losses and write downs on investments in our venture funds.
Non-SBIC investment funds increased $41 million during 2008 primarily as a result of increased investment in funds within new and existing investment commitments and appreciation on investments.
Other public company investments declined $26 million during 2008 primarily due to impairment write downs of approximately $41$11.0 million on Farmer Mac and $27$2.0 million ason Insure.com and equity in losses of the respective dates.
The investments in publicly traded companies are accounted for using the equity methodFarmer Mac of accounting and are set forth in Schedule 33.
SCHEDULE 33
INVESTMENTS IN OTHER PUBLIC COMPANIES
| December 31, 2006 | |||||||||
(In millions)
| Symbol | Carrying value | Market value | Unrealized gain (loss) | |||||
COMPANY | |||||||||
Federal Agricultural Mortgage Corporation (Farmer Mac) | AGM/A | $ | 7 | 6 | (1) | ||||
Federal Agricultural Mortgage Corporation (Farmer Mac) | AGM | 20 | 23 | 3 | |||||
Insure.com, Inc. | NSUR | 10 | 9 | (1) | |||||
Total publicly traded equity investments | $ | 37 | 38 | 1 | |||||
$11.8 million.
Deposits and Borrowed Funds
Deposits, both interest-bearing and noninterest-bearing, are a primary source of funding for the Company. Intense competition for deposits during much of the year resulted in core deposit growth lagging the Company’s loan growth and also impeded our ability to reprice our deposits as the Federal Reserve lowered rates during the second half of the year. However, there were indications of improved deposit pricing and some improvement in deposit growth late in the year.
Schedule 65 summarizes the average deposit balances for the past five years along with their respective interest costs and average interest rates. Average noninterest-bearing deposits increased 28.2%decreased 2.7% in 2006 over 2005,2008 from 2007, while interest-bearing deposits increased 33.2%7.6% during the same time period. The increased average balances reflect the impact of the acquisition of Amegy.
Total deposits at December 31, 20062008 increased $2.3$4.4 billion to $35.0$41.3 billion, or 7.2%11.9% over the balances reported at December 31, 2005.2007. Core deposits increased $552 million$1.4 billion to $30.7$33.8 billion, or 1.8%4.3%, compared to $30.1$32.5 billion at December 31, 2005.2007. Noninterest-bearing demand deposits at December 31, 2008 increased $0.1 billion to $9.7 billion compared to $9.6 billion at December 31, 2007. Demand, savings and money market deposits comprised 74.9% of total deposits at December 31, 2008, compared with 72.0% as of December 31, 2007. The increase inwas mainly driven by increased brokered deposits and Internet money market deposits during 2008.
During 2008, the Company increased brokered deposit programs and Internet money market accounts to serve as an additional source of liquidity for the Company and reduce its reliance on FHLB advances and other short-term borrowings. At December 31, 2008, total deposits included approximately $270$3.3 billion of brokered deposits compared to $77 million of timeat December 31, 2007 and Internet money market deposits placed by The Stockmen’s Bank with two affiliate bankswere $2.5 billion compared to $2.2 billion at December 31, 2007. Money market brokered deposits comprised $2.6 billion of the Companyincrease in October 2006.brokered deposits. The Company’s acquisitionaverage balance of Stockmen’sbrokered deposits was announced on September 11, 2006$653 million for 2008 and was completed on January 17,$77 million for 2007.
See “Liquidity Risk” on page 91114 for information on funding and borrowed funds. Also, see Notes 11, 12 and 13 of the Notes to Consolidated Financial Statements for additional information on borrowed funds.
Off-Balance-Sheet ArrangementsOff-Balance Sheet Arrangement
Zions Bank provides a Liquidity Facility for a fee to aThe Company administers one QSPE securities conduit, Lockhart, which purchases U.S. Governmentwas established in 2000. Lockhart was structured to purchase securities that are collateralized by small business loans originated or purchased by Zions Bank; such loans were originated during and AAA-rated securities, which are fundedprior to 2005. Lockhart obtains funding through the issuance of asset-backed commercial paper and holds securities, which include U.S. Government agency securities collateralized by small business loans and AAA/AA-rated securities. In November 2008, Lockhart elected to participate in the Federal Reserve’s CPFF, and as of December 31, 2008 had sold $80 million of commercial paper to the Federal Reserve under this program.
Liquidity Agreement
Zions Bank is the sole provider of a liquidity facility to Lockhart. Pursuant to the Liquidity Agreement, Zions Bank is required to purchase nondefaulted securities from Lockhart to provide funds to repay maturing commercial paper upon Lockhart’s inability to access the commercial paper market for sufficient funding, or upon a commercial paper market disruption, as specified in the governing documents of Lockhart. In addition, pursuant to the governing documents, including the Liquidity Agreement, if any security in Lockhart is downgraded to below AA- or the downgrade of one or more securities results in more than ten securities having ratings of AA+ to AA-, Zions Bank must either 1) place its commercial paper. Atletter of credit on the security, 2) obtain a credit enhancement on the security from a third party, or 3) purchase the security from Lockhart at book value.
The maximum amount of liquidity that Zions Bank can be required to provide pursuant to the Liquidity Agreement is limited to the total amount of securities held by Lockhart. This maximum amount was $738 million at December 31, 2008, $2.1 billion at December 31, 2007, $4.1 billion at December 31, 2006, approximately 38% ofand $5.3 billion at December 31, 2005.
In addition to providing the AAA-rated securities held by Lockhart were created by the Company’s securitization of small business loans, as previously discussed.Liquidity Agreement, Zions Bank also receives a fee in exchange for providing hedge support and administrative and investment advisory services. Under the terms of the Liquidity Facility, if certain conditions arise,services to Lockhart.
A hedge agreement between Lockhart and Zions Bank provides for the bank to pay Lockhart should Lockhart’s monthly cost of funds exceed its monthly asset yield. Due to the extreme dislocation in short term
LIBOR, Lockhart’s cost of funds exceeded its asset yield for the first time in September of 2008. The spread between Lockhart’s monthly asset yield and cost of funds has been volatile as a result of decreasing asset yields and to a lesser extent commercial paper rates resulting from the ongoing contraction, disruption, and volatility in the credit markets. While this spread has again been positive since November, it is requiredpossible that this hedge agreement may be triggered in the future.
In addition to rating agency downgrades of securities held by Lockhart that would require Zions Bank to purchase securities from Lockhart, downgrades of Lockhart’s commercial paper below P-1 by Moody’s or below F1 by Fitch would prevent issuance of commercial paper by Lockhart and result in security purchases under the Liquidity Agreement.
During 2008, certain assets held by Lockhart were downgraded by rating agencies and Lockhart was unable to provide fundssell varying amounts of commercial paper, due to continued deterioration in the asset-backed commercial paper markets. These events caused purchases by Zions Bank of securities from Lockhart, as follows.
On November 5, 2008, Ambac Assurance Corporation was downgraded by Moody’s to Baa1, resulting in the downgrade of a $78 million security held by Lockhart. Zions Bank purchased the security at book value on November 6, 2008 and enable itrecorded the related pretax write-down of $7.9 million in adjusting the security to repayfair value.
On June 19, 2008, MBIA, Inc. was downgraded by Moody’s to below AA-, and as a result the MBIA, Inc. insured assets held by Lockhart were downgraded to below AA-. Therefore, on June 23, 2008, Zions Bank purchased $787 million of securities from Lockhart as required by the Liquidity Agreement. The purchases comprised the entire remaining small business loan securitizations created by Zions Bank and held by Lockhart. No gain or loss was recognized on these purchases. Upon dissolution of the securitization trusts (including $87 million of related securities owned by the Parent), the Company recorded $897 million of loans on its balance sheet including $23 million of premium. The retained interests related to the securities purchased were included in the purchase transaction and recorded with the premium amount.
On March 5, 2008, Lockhart was unable to sell sufficient commercial paper to fund commercial paper maturities and Zions Bank purchased $85 million of MBIA-insured securities and a $75 million bank trust preferred CDO from Lockhart. The MBIA-insured securities consisted of securitizations of small business loans from Zions Bank and their purchase resulted in no gain or loss. Upon dissolution of the securitization trusts, the loans were recorded on Zions Bank’s balance sheet. A pretax write-down of $4.4 million was recorded by Zions Bank in adjusting the bank trust preferred CDO security to fair value.
On February 5, 2008, a $5 million security held by Lockhart was downgraded by Moody’s from Aa1 to Baa1. Zions Bank purchased this security at book value and recorded the related pretax write-down of $0.8 million in adjusting the security to fair value. In addition, Lockhart was unable to sell sufficient commercial paper to fund commercial paper maturities and Zions Bank purchased $115 million of MBIA-insured securities from Lockhart. These securities consisted of securitizations of small business loans from Zions Bank and their purchase resulted in no gain or loss. Upon dissolution of the securitization trusts, the loans were recorded on Zions Bank’s balance sheet.
If Lockhart is unable to issue additional commercial paper to finance maturing commercial paper.paper, or if additional assets of Lockhart has been an important sourceare downgraded below the ratings described above, Zions Bank will be obligated to purchase additional assets from Lockhart. Because these purchases are transacted at book value, Zions Bank may incur losses if the assets’ book value exceeds their fair value. At December 31, 2008, the $738 million book value of funding forLockhart’s assets exceeded their fair value by approximately $119 million. The Company does not expect Lockhart’s securities portfolio to ever again exceed $738 million.
Subsequent Event
On January 14, 2009, a $25 million REIT trust preferred security held by Lockhart was downgraded by Fitch from AA to BB. Zions Bank purchased this security at book value under the Company’s loansLiquidity Agreement. The related pretax write-down of $8.9 million was recorded by Zions Bank in marking the security to fair value.
Assets Held by Lockhart
The following schedule summarizes Lockhart’s assets by category, related amortized cost, estimated fair value and ratings.
Schedule 35
LOCKHART FUNDING, LLC ASSETS
| December 31, 2008 | |||||||
| (In millions) | Amortized cost | Estimated fair value | Rating range | ||||
U.S. Government agencies and corporations: | |||||||
Small Business Administration loan-backed securities1 | $ | 191 | 187 | Guaranteed by SBA | |||
Asset-backed securities2: | |||||||
Trust preferred securities – banks and insurance | 504 | 405 | AAA to AA | ||||
Trust preferred securities – real estate investment trusts | 36 | 22 | AAA to AA | ||||
Other | 7 | 5 | AA | ||||
Total | $ | 738 | 619 | ||||
1 | The Company originated 42% of these Small Business Administration loan-backed securities. |
2 | A majority of these securities had a negative watchlisting designation by one or more rating agencies. |
At December 31, 2008, the weighted average interest rate reset of Lockhart’s assets was 3.4 months and the weighted average life of Lockhart’s assets was estimated at 17.8 years. The weighted average life of Lockhart’s asset-backed commercial paper was 13 days.
Possible Consolidation of Lockhart
As a QSPE currently defined by the provisions of SFAS 140, Lockhart remains off-balance sheet and is not consolidated in the Company’s financial statements. Should the Parent and its subsidiaries together own more than 90% of the outstanding commercial paper (beneficial interest) of Lockhart, Lockhart would cease to be a QSPE and would be required to be consolidated. In November of 2008, Lockhart sold approximately 10% of its outstanding commercial paper into the CPFF. The CPFF will terminate on October 31, 2009 unless it is further extended.
At December 31, 2008, Lockhart’s assets totaled $738 million at book value and the Company owned $412 million of Lockhart commercial paper.
If Zions Bank had been required to purchase all of Lockhart’s assets with a book value of $738 million at December 31, 2008, including the effect of the fair value loss on those assets, its consolidated total risk-based capital ratio as of December 31, 2008 would have been reduced by approximately 11 basis points and its consolidated tangible equity ratio as of December 31, 2008 would have been reduced by approximately 17 basis points. The Company has adequate liquidity and borrowing capacity to fund the net additional $0.3 billion necessary to purchase the Lockhart assets if it were required. Given that the Company has $55 billion of assets, the potential consolidation of Lockhart would not be significant to the Company.
See “Liquidity Management Actions” on page 93116 and Note 6 of the Notes to Consolidated Financial Statements for additional information on Lockhart.
RISK ELEMENTS
Since risk is inherent in substantially all of the Company’s operations, management of risk is integral to those operations and is also a key determinant of the Company’s overall performance. We apply various strategies to reduce the risks to which the Company’s operations are exposed, including credit, interest rate and market, liquidity, and operational risks.
Credit Risk Management
Credit risk is the possibility of loss from the failure of a borrower or contractual counterparty to fully perform under the terms of a credit-related contract. Credit risk arises primarily from the Company’s lending activities, as well as from other on- and off-balance-sheetoff-balance sheet credit instruments.
Credit risk is managed centrally through a uniform credit policy, credit administration, and credit exam functions at the Parent. Effective management of credit risk is essential in maintaining a safe, sound and profitable financial institution. We have structured the organization to separate the lending function from the credit administration function, which has added strength to the control over, and independent evaluation of, credit activities. Formal loan policies and procedures provide the Company with a framework for consistent underwriting and a basis for sound credit decisions. In addition, the Company has a well-defined set of standards for evaluating its loan portfolio, and management utilizes a comprehensive loan grading system to determine the risk potential in the portfolio. Further, an independent internal credit examination department periodically conducts examinations of the Company’s lending departments. These examinations are designed to review credit quality, adequacy of documentation, appropriate loan grading administration and compliance with lending policies, and reports thereon are submitted to management and to the Credit Review Committee of the Board of Directors.
Both the credit policy and the credit examination functions are managed centrally. Each bank is able to modify corporate credit policy to be more conservative; however, corporate approval must be obtained if a bank wishes to create a more liberal exception to the policy. Historically, only a limited number of such exceptionsmodifications have been approved. This entire process has been designed to place an emphasis on strong underwriting standards and early detection of potential problem credits so that action plans can be developed and implemented on a timely basis to mitigate any potential losses.
With regard to credit risk associated with counterparties in off-balance-sheetoff-balance sheet credit instruments, Zions Bank hasand Amegy have International Swap Dealer Association (“ISDA”) agreements in place under which derivative transactions are entered into with major derivative dealers. Each ISDA agreement details the collateral arrangementarrangements between Zions Bank and its counterparty.Amegy and their counterparties. In every case, the amount of the collateral required to secure the exposed party in the derivative transaction is determined by the mark-to-market exposurefair value on the derivative and the credit rating of the party with the obligation. The credit rating used in these situations is provided by either Moody’s or Standard & Poor’s. This means that a counterparty with ana “AAA” rating would be obligated to provide less collateral to secure a major credit exposure to Zions Bank than one with an “A” rating. All derivative gains and losses between Zions Bank or Amegy and a single counterparty are netted to determine the net credit exposure and therefore the collateral required. We have no exposure to credit default swaps.
The Company also has off-balance sheet credit risk associated with a Liquidity Agreement provided by Zions Bank to the QSPE securities conduit, Lockhart. See “Off-Balance Sheet Arrangement” page 96 for further details on Lockhart.
The Company attempts to avoid the risk of an undue concentration of credits in a particular property type or with an individual customer or counterparty. The majority of the Company’s business activity is with customers located within the geographical footprint of its banking subsidiaries. See Note 5 of the Notes to Consolidated Financial Statements for further information on concentrations of credit risk.
Another aspect of theThe Company’s credit risk management strategy is to pursue theincludes diversification of theits loan portfolio. The Company maintains a diversified loan portfolio with some emphasis in real estate. As displayed in Schedule 34,36, at year-end 20062008 no single loan type exceeded 24.2%27.3% of the Company’s total loan portfolio.
Schedule 36
SCHEDULE 34
LOAN PORTFOLIO DIVERSIFICATION
| December 31, 2006 | December 31, 2005 | |||||||||
(Amounts in millions)
| Amount | % of total loans | Amount | % of total loans | ||||||
Commercial lending: | ||||||||||
Commercial and industrial | $ | 8,422 | 24.2% | $ | 7,192 | 23.8% | ||||
Leasing | 443 | 1.3 | 373 | 1.2 | ||||||
Owner occupied | 6,260 | 18.0 | 4,825 | 15.9 | ||||||
Commercial real estate: | ||||||||||
Construction and land development | 7,483 | 21.5 | 6,065 | 20.0 | ||||||
Term | 4,952 | 14.2 | 4,640 | 15.3 | ||||||
Consumer: | ||||||||||
Home equity credit line and other consumer real estate | 1,850 | 5.3 | 1,831 | 6.1 | ||||||
1-4 family residential | 4,192 | 12.1 | 4,130 | 13.7 | ||||||
Bankcard and other revolving plans | 295 | 0.8 | 207 | 0.7 | ||||||
Other | 457 | 1.3 | 537 | 1.8 | ||||||
Other receivables | 465 | 1.3 | 452 | 1.5 | ||||||
Total loans | $ | 34,819 | 100.0% | $ | 30,252 | 100.0% | ||||
Commercial lending: Commercial and industrial Leasing Owner occupied Commercial real estate: Construction and land development Term Consumer: Home equity credit line 1-4 family residential Construction and other consumer real estate Bankcard and other revolving plans Other Other Total loans December 31, 2008 December 31, 2007 (Amounts in millions) Amount % of
total loans Amount % of
total loans $ 11,448 27.3 % $ 10,407 26.5 % 431 1.0 503 1.3 8,743 20.8 7,545 19.2 7,516 17.9 7,869 20.0 6,196 14.8 5,334 13.6 2,005 4.8 1,608 4.1 3,877 9.2 3,975 10.1 774 1.8 945 2.4 374 0.9 347 0.9 385 0.9 460 1.2 243 0.6 259 0.7 $ 41,992 100.0 % $ 39,252 100.0 %
In addition, as reflected in Schedule 35,37, as of December 31, 2006,2008, the commercial real estate loan portfolio totaling $12.4 billion is also well diversified by property type, purpose and collateral location.
SCHEDULE 35
Schedule 37
COMMERCIAL REAL ESTATE PORTFOLIO BY PROPERTY TYPE AND COLLATERAL LOCATION
(REPRESENTS PERCENTAGES BASED UPON OUTSTANDING COMMERCIAL REAL ESTATE LOANS)
AT DECEMBER 31, 20062008
| Collateral Location | Product as a % of | Product as a % of | ||||||||||||||||||||||||||||||||||||||||||||||
| (Dollar amounts in millions) | Collateral Location | Product as a% of total CRE | Product as a% of loan type | |||||||||||||||||||||||||||||||||||||||||||||
Loan Type | Arizona | Northern California | Southern California | Nevada | Colorado | Texas (Amegy) (1) | Utah / Idaho | Washington | Other | Product as a % of | Product as a % of | Balance1 | Arizona | Northern California | Southern California | Nevada | Colorado | Texas | Utah / Idaho | Wash- ington | Other | |||||||||||||||||||||||||||
Commercial term: | ||||||||||||||||||||||||||||||||||||||||||||||||
Industrial | 0.66% | 0.43 | 1.73 | 0.03 | 0.07 | 0.19 | 0.11 | 0.17 | 0.10 | 3.49 | 8.49 | 0.63 | % | 0.65 | 1.57 | 0.25 | 0.21 | 0.30 | 0.28 | 0.15 | 0.18 | 4.22 | 9.05 | |||||||||||||||||||||||||
Office | 1.04 | 0.58 | 2.24 | 1.67 | 1.56 | 1.80 | 1.55 | 0.14 | 1.26 | 11.84 | 28.81 | 1.24 | 0.66 | 1.81 | 1.33 | 0.78 | 1.22 | 1.44 | 0.30 | 1.45 | 10.23 | 21.94 | ||||||||||||||||||||||||||
Retail | 0.80 | 0.60 | 1.41 | 1.08 | 0.28 | 1.08 | 0.25 | 0.11 | 0.11 | 5.72 | 13.90 | 0.94 | 0.89 | 1.99 | 1.77 | 0.59 | 1.23 | 0.39 | 0.17 | 1.01 | 8.98 | 19.27 | ||||||||||||||||||||||||||
Hotel/motel | 1.04 | 0.09 | 0.75 | 0.36 | 0.49 | 0.02 | 1.07 | 0.12 | 2.03 | 5.97 | 14.52 | 1.72 | 0.81 | 0.99 | 0.64 | 0.70 | 1.00 | 1.43 | 0.15 | 3.75 | 11.19 | 24.00 | ||||||||||||||||||||||||||
Acquisition and development | – | 0.05 | 0.18 | 0.27 | 0.05 | 0.01 | 0.21 | 0.09 | – | 0.86 | 2.11 | – | 0.03 | – | – | – | – | – | 0.05 | – | 0.08 | 0.18 | ||||||||||||||||||||||||||
Medical | 0.41 | 0.19 | 0.34 | 0.40 | 0.01 | 0.03 | 0.15 | 0.01 | 0.06 | 1.60 | 3.90 | 0.49 | 0.22 | 0.36 | 0.57 | 0.04 | 0.14 | 0.10 | 0.01 | 0.02 | 1.95 | 4.18 | ||||||||||||||||||||||||||
Recreation/restaurant | 0.35 | 0.04 | 0.31 | 0.10 | 0.07 | 0.01 | 0.08 | 0.01 | 0.26 | 1.23 | 3.04 | 0.46 | 0.04 | 0.19 | 0.16 | 0.09 | 0.12 | 0.15 | 0.01 | 0.25 | 1.47 | 3.15 | ||||||||||||||||||||||||||
Multifamily | 0.17 | 0.42 | 1.31 | 0.34 | 0.31 | 0.59 | 0.57 | 0.07 | 0.38 | 4.16 | 10.15 | 0.38 | 0.24 | 1.79 | 0.28 | 0.28 | 1.12 | 0.52 | 0.11 | 0.53 | 5.25 | 11.27 | ||||||||||||||||||||||||||
Other | 0.89 | 0.12 | 1.65 | 0.64 | 0.30 | 0.01 | 0.60 | 0.05 | 1.93 | 6.19 | 15.08 | 0.55 | 0.19 | 0.75 | 0.53 | 0.09 | 0.09 | 0.58 | 0.06 | 0.41 | 3.25 | 6.96 | ||||||||||||||||||||||||||
Total commercial term | 5.36 | 2.52 | 9.92 | 4.89 | 3.14 | 3.74 | 4.59 | 0.77 | 6.13 | 41.06 | 100.00 | $ | 6,182.2 | 6.41 | 3.73 | 9.45 | 5.53 | 2.78 | 5.22 | 4.89 | 1.01 | 7.60 | 46.62 | 100.00 | ||||||||||||||||||||||||
Residential construction: | ||||||||||||||||||||||||||||||||||||||||||||||||
Single family housing | 4.75 | 1.15 | 3.90 | 0.62 | 0.78 | 2.00 | 2.05 | 0.02 | 0.29 | 15.56 | 46.19 | 1.08 | 0.45 | 1.04 | 0.36 | 0.77 | 1.71 | 1.06 | 0.24 | 0.36 | 7.07 | 35.87 | ||||||||||||||||||||||||||
Acquisition and development | 5.86 | 1.16 | 3.10 | 1.76 | 0.81 | 2.20 | 2.39 | 0.17 | 0.67 | 18.12 | 53.81 | 3.14 | 0.49 | 1.24 | 1.01 | 0.61 | 2.95 | 2.63 | 0.14 | 0.42 | 12.63 | 64.13 | ||||||||||||||||||||||||||
Total residential construction | 10.61 | 2.31 | 7.00 | 2.38 | 1.59 | 4.20 | 4.44 | 0.19 | 0.96 | 33.68 | 100.00 | 2,612.8 | 4.22 | 0.94 | 2.28 | 1.37 | 1.38 | 4.66 | 3.69 | 0.38 | 0.78 | 19.70 | 100.00 | |||||||||||||||||||||||||
Commercial construction: | ||||||||||||||||||||||||||||||||||||||||||||||||
Industrial | 0.38 | 0.03 | 0.31 | 1.54 | 0.30 | 0.73 | 0.13 | 0.08 | – | 3.50 | 13.87 | 0.37 | – | 0.37 | 0.03 | 0.02 | 0.79 | 0.06 | 0.01 | 0.02 | 1.67 | 4.95 | ||||||||||||||||||||||||||
Office | 0.51 | 0.09 | 0.26 | 0.77 | 0.08 | 0.32 | 0.20 | 0.21 | 0.07 | 2.51 | 9.87 | 0.65 | 0.02 | 0.68 | 0.84 | 0.12 | 0.58 | 0.53 | 0.09 | 0.47 | 3.98 | 11.81 | ||||||||||||||||||||||||||
Retail | 1.28 | 0.03 | 0.56 | 1.13 | 0.39 | 2.71 | 0.43 | 0.02 | 0.13 | 6.68 | 26.42 | 1.12 | 0.04 | 0.42 | 1.20 | 0.16 | 4.06 | 0.52 | 0.02 | 0.75 | 8.29 | 24.63 | ||||||||||||||||||||||||||
Hotel/motel | 0.19 | – | 0.08 | 0.03 | 0.02 | – | 0.09 | – | 0.09 | 0.50 | 1.96 | 0.13 | 0.19 | 0.11 | 0.14 | 0.02 | 0.27 | 0.11 | – | 0.09 | 1.06 | 3.16 | ||||||||||||||||||||||||||
Acquisition and development | 1.33 | 0.01 | 0.36 | 1.01 | 0.07 | 2.84 | 0.26 | 0.14 | – | 6.02 | 23.85 | 1.50 | 0.10 | 0.58 | 2.43 | 0.44 | 4.07 | 1.17 | 0.07 | 0.69 | 11.05 | 32.82 | ||||||||||||||||||||||||||
Medical | 0.10 | – | 0.03 | 0.02 | 0.03 | 0.16 | 0.09 | – | 0.02 | 0.45 | 1.80 | 0.17 | – | 0.10 | 0.19 | 0.07 | 0.04 | 0.09 | – | 0.49 | 1.15 | 3.37 | ||||||||||||||||||||||||||
Recreation/restaurant | 0.05 | – | 0.01 | 0.02 | – | – | 0.02 | – | – | 0.10 | 0.39 | 0.10 | – | 0.01 | – | – | – | – | – | – | 0.11 | 0.33 | ||||||||||||||||||||||||||
Other | 0.08 | – | 0.26 | 0.14 | 0.01 | 0.09 | 0.10 | 0.07 | 0.27 | 1.02 | 4.10 | 0.17 | – | 0.22 | 0.13 | 0.02 | 0.02 | 0.08 | 0.02 | 0.04 | 0.70 | 2.08 | ||||||||||||||||||||||||||
Apartments | 0.40 | 0.30 | 0.74 | 0.56 | 0.38 | 1.48 | 0.12 | 0.32 | 0.18 | 4.48 | 17.74 | 0.57 | 0.46 | 0.47 | 0.20 | 0.09 | 1.98 | 0.20 | 0.38 | 1.32 | 5.67 | 16.85 | ||||||||||||||||||||||||||
Total commercial construction | 4.32 | 0.46 | 2.61 | 5.22 | 1.28 | 8.33 | 1.44 | 0.84 | 0.76 | 25.26 | 100.00 | 4,465.7 | 4.78 | 0.81 | 2.96 | 5.16 | 0.94 | 11.81 | 2.76 | 0.59 | 3.87 | 33.68 | 100.00 | |||||||||||||||||||||||||
Total construction | 14.93 | 2.77 | 9.61 | 7.60 | 2.87 | 12.53 | 5.88 | 1.03 | 1.72 | 58.94 | 100.00 | 7,078.5 | 9.00 | 1.75 | 5.24 | 6.53 | 2.32 | 16.47 | 6.45 | 0.97 | 4.65 | 53.38 | ||||||||||||||||||||||||||
Total commercial real estate | 20.29% | 5.29 | 19.53 | 12.49 | 6.01 | 16.27 | 10.47 | 1.80 | 7.85 | 100.00 | $ | 13,260.7 | 15.41 | % | 5.48 | 14.69 | 12.06 | 5.10 | 21.69 | 11.34 | 1.98 | 12.25 | 100.00 | |||||||||||||||||||||||||
1 | Excludes approximately $507 million of unsecured loans outstanding, but related to the |
Note: Excludes approximately $537 million of unsecured loans outstanding, but related to the real estate industry.
Loan-to-value (“LTV”) ratios are another key determinant of credit risk in commercial real estate lending. The Company estimates that the weighted average LTV ratio on the total commercial real estate portfolio at June 30, 2006,December 31, 2008, detailed in year-end amounts in Schedule 35,37, was approximately 58.6%.57%; however, continued declines in property values in many of our distressed markets may understate the actual current LTV levels. This estimate is based on the most current appraisals, generally obtained as of the date of origination, downgrade or renewal of the loans.
We believeLending to finance residential land acquisition, development and construction is a core business for the Company. In some geographic markets, significant declines in the availability of mortgage financing to buyers of newly constructed homes, declining home values and general uncertainty in the residential real estate market are having an adverse impact on the operations of many of the Company’s potential risk from concentrationdeveloper and builder customers.
As discussed throughout this document, the Company’s level of credit quality continued to weaken during 2008. The deterioration in owner occupiedcredit quality is mainly related to the weakness in residential development and construction activity in the Southwest that started in the latter half of 2007. Although not to the degree as experienced in the Southwestern states, some signs of deterioration also surfaced in Utah/Idaho during the first quarter of 2008 and in the Texas market in the fourth quarter of 2008. Residential construction and land development loans in Arizona and Nevada remains the most troubled segment of the portfolio and account for the most meaningful declines in commercial real estate credit quality during the last half of 2008. The Company experienced increased criticized and classified loans is reducedin its commercial loan portfolio during the year in Utah and Texas, and increased loan delinquencies in segments of its residential mortgage portfolio in Utah and Idaho. We expect continued credit quality deterioration over the next few quarters.
The Company does not pursue subprime residential mortgage lending, including option ARM and negative amortization loans. It does have approximately $576 million of high FICO (a credit score developed by the emphasisFair Isaac Corporation) stated income loans, including “one-time close” loans to finance the construction of a home, which convert into a permanent jumbo mortgage. This portfolio began to show significant credit quality deterioration in the second half of 2008.
Commercial Real Estate Loans
Selected information regarding our commercial real estate (“CRE”) loan portfolio is presented in the following table:
Schedule 38
COMMERCIAL REAL ESTATE PORTFOLIO BY LOAN TYPE AND GEOGRAPHY
AT DECEMBER 31, 2008
| (Amounts in millions) | Arizona | Northern California | Southern California | Nevada | Colorado | Texas | Utah/ Idaho | Wash- ington | Other1 | Total | % of total CRE | |||||||||||||||||||||||||
Commercial term: | ||||||||||||||||||||||||||||||||||||
Balance outstanding | 12/31/08 | $ | 841.2 | 317.6 | 1,430.6 | 735.5 | 445.0 | 686.0 | 646.1 | 165.0 | 943.4 | 6,210.4 | 45.1 | % | ||||||||||||||||||||||
% of loan type | 13.5 | % | 5.1 | % | 23.0 | % | 11.8 | % | 7.2 | % | 11.1 | % | 10.4 | % | 2.7 | % | 15.2 | % | 100.0 | % | ||||||||||||||||
Delinquency rates2: | ||||||||||||||||||||||||||||||||||||
30-89 days | 12/31/08 | 0.5 | % | 0.9 | % | 0.4 | % | 1.8 | % | – | 0.7 | % | 1.8 | % | – | 4.4 | % | 1.4 | % | |||||||||||||||||
| 12/31/07 | 0.9 | % | 0.2 | % | 0.2 | % | – | – | 0.3 | % | 0.3 | % | – | 1.1 | % | 0.4 | % | |||||||||||||||||||
³ 90 days | 12/31/08 | 0.2 | % | 0.9 | % | 0.1 | % | 1.2 | % | – | 0.2 | % | 1.0 | % | – | 3.0 | % | 0.8 | % | |||||||||||||||||
| 12/31/07 | – | – | – | – | 0.1 | % | 0.5 | % | – | – | – | 0.1 | % | |||||||||||||||||||||||
Accruing past due | ||||||||||||||||||||||||||||||||||||
90 days | 12/31/08 | $ | 1.9 | – | – | 2.4 | – | – | – | – | 7.5 | 11.8 | ||||||||||||||||||||||||
| 12/31/07 | 0.1 | – | 0.2 | – | – | 0.6 | – | – | 0.1 | 1.0 | ||||||||||||||||||||||||||
Nonaccrual loans | 12/31/08 | 0.5 | 2.8 | 2.0 | 6.7 | 0.4 | 4.5 | 6.4 | – | 20.3 | 43.6 | |||||||||||||||||||||||||
| 12/31/07 | – | – | 0.1 | – | 0.4 | 3.6 | – | – | – | 4.1 | ||||||||||||||||||||||||||
Commercial construction: | ||||||||||||||||||||||||||||||||||||
Balance outstanding | 12/31/08 | 653.0 | 81.7 | 467.7 | 708.0 | 273.0 | 1,684.2 | 425.0 | 99.1 | 410.7 | 4,802.4 | 34.9 | % | |||||||||||||||||||||||
% of loan type | 13.6 | % | 1.7 | % | 9.7 | % | 14.7 | % | 5.7 | % | 35.1 | % | 8.8 | % | 2.1 | % | 8.6 | % | 100.0 | % | ||||||||||||||||
Delinquency rates2: | ||||||||||||||||||||||||||||||||||||
30-89 days | 12/31/08 | 2.8 | % | – | 2.4 | % | 10.5 | % | 0.5 | % | 2.1 | % | 6.6 | % | 1.8 | % | 6.1 | % | 4.1 | % | ||||||||||||||||
| 12/31/07 | – | – | 0.1 | % | – | 0.6 | % | – | – | 58.6 | % | 2.2 | % | 0.7 | % | |||||||||||||||||||||
³ 90 days | 12/31/08 | 0.7 | % | – | – | 8.5 | % | 0.5 | % | 0.2 | % | 2.9 | % | – | 6.1 | % | 2.2 | % | ||||||||||||||||||
| 12/31/07 | 0.2 | % | – | – | – | 0.5 | % | – | – | – | – | 0.1 | % | |||||||||||||||||||||||
Accruing past due | ||||||||||||||||||||||||||||||||||||
90 days | 12/31/08 | $ | 1.8 | – | – | 25.4 | – | – | 8.1 | – | 18.6 | 53.9 | ||||||||||||||||||||||||
| 12/31/07 | 6.3 | – | 15.9 | 13.2 | – | 0.1 | – | – | 32.2 | 67.7 | ||||||||||||||||||||||||||
Nonaccrual loans | 12/31/08 | 27.4 | – | 11.1 | 66.2 | 1.4 | 14.0 | 4.3 | – | 6.3 | 130.7 | |||||||||||||||||||||||||
| 12/31/07 | – | – | – | 5.7 | 1.3 | – | – | – | – | 7.0 | ||||||||||||||||||||||||||
Residential construction: | ||||||||||||||||||||||||||||||||||||
Balance outstanding | 12/31/08 | 591.3 | 113.7 | 327.4 | 199.2 | 185.4 | 666.8 | 479.7 | 50.5 | 141.0 | 2,755.0 | 20.0 | % | |||||||||||||||||||||||
% of loan type | 21.5 | % | 4.2 | % | 11.9 | % | 7.2 | % | 6.7 | % | 24.2 | % | 17.4 | % | 1.8 | % | 5.1 | % | 100.0 | % | ||||||||||||||||
Delinquency rates2: | ||||||||||||||||||||||||||||||||||||
30-89 days | 12/31/08 | 16.7 | % | 7.3 | % | 9.3 | % | 38.8 | % | 6.9 | % | 3.3 | % | 20.4 | % | 0.5 | % | 8.6 | % | 13.1 | % | |||||||||||||||
| 12/31/07 | 0.9 | % | 1.0 | % | – | 5.5 | % | 0.4 | % | 0.4 | % | 2.7 | % | – | – | 1.4 | % | |||||||||||||||||||
³ 90 days | 12/31/08 | 12.3 | % | 2.3 | % | 7.7 | % | 20.9 | % | 5.6 | % | 2.4 | % | 18.8 | % | 0.5 | % | 4.5 | % | 9.6 | % | |||||||||||||||
| 12/31/07 | 3.5 | % | – | 0.4 | % | 0.8 | % | 1.3 | % | 0.1 | % | 0.4 | % | – | – | 1.6 | % | |||||||||||||||||||
Accruing past due | ||||||||||||||||||||||||||||||||||||
90 days | 12/31/08 | $ | 7.2 | – | – | 1.0 | – | 0.7 | 9.6 | 0.3 | – | 18.8 | ||||||||||||||||||||||||
| 12/31/07 | 12.3 | 0.2 | – | – | 2.3 | 1.3 | 1.9 | – | – | 18.0 | ||||||||||||||||||||||||||
Nonaccrual loans | 12/31/08 | 99.3 | 5.8 | 45.6 | 50.5 | 15.0 | 18.6 | 88.7 | – | 19.3 | 342.8 | |||||||||||||||||||||||||
| 12/31/07 | 46.5 | 11.9 | 16.2 | 36.2 | – | 0.2 | 1.4 | – | 7.5 | 119.9 | ||||||||||||||||||||||||||
Total construction and land development | 12/31/08 | 1,244.3 | 195.4 | 795.1 | 907.2 | 458.4 | 2,351.0 | 904.7 | 149.6 | 551.7 | 7,557.4 | |||||||||||||||||||||||||
Total CRE balance outstanding | 12/31/08 | 2,085.5 | 513.0 | 2,225.7 | 1,642.7 | 903.4 | 3,037.0 | 1,550.8 | 314.6 | 1,495.1 | 13,767.8 | 100.0 | % | |||||||||||||||||||||||
Less loans held for sale in commercial real estate | (29.4 | ) | – | – | – | – | (26.7 | ) | – | – | – | (56.1 | ) | |||||||||||||||||||||||
Total commercial real | $ | 2,056.1 | 513.0 | 2,225.7 | 1,642.7 | 903.4 | 3,010.3 | 1,550.8 | 314.6 | 1,495.1 | 13,711.7 | |||||||||||||||||||||||||
1 | No other geography exceeded $189 million for all three loan types. |
2 | Delinquency rates include nonaccrual loans. |
Approximately 30% of the commercial term loans consist of mini-perm loans on which construction is complete and the project is either in the process of stabilization or has stabilized, and the owner is waiting to seek permanent financing given the current volatile conditions in the financial markets. Mini-perm loans generally have maturities of 3 to 7 years. The remaining 70% are term loans with initial maturities generally of 15 to 20 years. Stabilization criteria differ by product and are dependent on cash flow created by lease-up for office, industrial and retail products and occupancy for retail and apartment products.
Approximately 31% of the commercial construction and land development portfolio is designated as acquisition and development. Most of these acquisition and development properties are tied to specific retail, apartment, office or other projects. Underwriting on commercial properties is primarily based on the economic viability of the project with heavy consideration given to the creditworthiness of the sponsor. The owners’ equity is always expected to be injected prior to bank advances. Re-margining requirements are often included in the loan agreement along with guarantees of the sponsor. Recognizing that debt is paid via cash flow, the projected economics of the project are primary in the underwriting because it determines the ultimate value of the property and the ability to service debt. Therefore, in most projects (with the exception of multi-family projects) we placelook for substantial pre-leasing in our underwriting and we generally require a minimum projected stabilized debt service ratio of 1.20.
Although residential construction and development deals with a different product type, many of the requirements previously mentioned, such as creditworthiness of the developer, up-front injection of the developer’s equity, re-margining requirements, and the viability of the project are also important in underwriting a residential development loan. Heavy consideration is given to market acceptance of the product, location, strength of the developer, and the ability of the developer to stay within budget. Progress inspections performed by qualified independent inspectors are routinely performed before disbursements are made. Loan agreements generally include limitations on lending programs sponsored by the SBA. On these typesnumber of loans, the SBA bearsmodel homes and homes built on a major portionspec basis, with preference given to pre-sold homes.
Real estate appraisals are ordered independently of the credit risk. Inofficer and the borrower, generally by the banks’ appraisal review function, which is staffed by qualified appraisers. Appraisals are ordered from outside appraisers at the inception, renewal, or for CRE loans, upon the occurrence of any event causing a “criticized” or “classified” grade to be assigned to the credit. The frequency for obtaining updated appraisals for these adversely graded credits is increased when declining market conditions exist. Advance rates will vary based on the viability of the project and the credit-worthiness of the sponsor, but corporate guidelines generally limit advances to 50-65% for raw land, 65-75% for land development, 65-75% for finished commercial lots, 75-80% for finished residential lots, 80% for pre-sold homes, 75-80% for models and spec homes, and 75-80% for commercial properties. Exceptions may be granted on a case-by-case basis.
Loan agreements require regular financial information on the project and the sponsor in addition to lease schedules, rent rolls, and on construction projects, independent progress inspection reports. The receipt of these schedules is closely monitored and calculations are made to determine adherence to the Company attemptscovenants set forth in the loan agreement. Additionally, the frequency of loan-by-loan reviews has been increased to avoida quarterly basis for all commercial and residential land acquisition, development, and construction loans at California Bank & Trust, National Bank of Arizona, and Nevada State Bank.
Interest reserves are generally established as an expense item in the riskbudget for a real estate construction or development loan. It has proven preferable for the borrower to put their total amount of an undue concentrationavailable equity into the project at the inception of credits in a particular industry, tradethe construction, rather than holding enough of their available funds to pay the interest during the construction period. This enables the bank to maximize the amount of equity obtained and control the amount of money set aside to pay interest on the construction loan. The Company’s practice is to monitor the construction, sales and/or leasing progress to determine whether or not the project remains viable. At any time during the life of the credit that the project is determined not to be viable, the bank has the ability to discontinue the use of the interest reserve and take appropriate action to protect its collateral position via negotiation and/or
group,legal action as deemed appropriate. At year-end 2008, Zions affiliates have 1,898 loans with an outstanding balance of $3.6 billion where available interest reserves amount to $190 million. In instances where projects have been determined unviable, the interest reserves have been frozen.
We have not been involved to any meaningful extent with insurance arrangements, credit derivatives, or property type. any other default agreements as a mitigation strategy for commercial real estate loans. However, we do make use of personal or other guarantees as risk mitigation strategies.
The Company also has no significant exposure to highly-leveraged transactionsstress tests its CRE loan portfolio on a quarterly basis. This testing is back tested and the majorityresults of the Company’s business activity is with customers within the geographical footprint of its banking subsidiaries. Finally, the Company has no significant exposure to any individual customer or counterparty. See “Credit Risk Management” on page 77 for a discussion of counterparty risk associatedtesting are reviewed quarterly with the Company’s derivative transactions. See Note 5rating agencies and banking regulators. The stress testing methodology includes a loan-by-loan Monte Carlo simulation, which is an approach that measures potential loss of principal and related revenues. The Monte Carlo simulation stresses the Notes to Consolidated Financial Statementsprobability of default and loss given default for further informationCRE loans based on concentrationsa variety of credit risk.
factors including regional economic factors, loan grade, loan-to-value, collateral type, and geography.
Nonperforming Assets
Nonperforming assets include nonaccrual loans, loans restructured loans, andat other than market terms, other real estate owned. At December 31, 2006,owned and other nonperforming assets also included $6.2 million of equipment related to the participation in an equipment lease by NBA as previously discussed.assets. Loans are generally placed on nonaccrual status when the loan is 90 days or more past due as to principal or interest, unless the loan is both well secured and in the process of collection. Consumer loans are not normally placed on a nonaccrual status, inasmuch as theystatus. Generally, closed-end non-real estate secured consumer loans are generally charged off when they become 120 days past due. Open-end consumer loans are charged off when they become 180 days past due unless they are adequately secured by real estate at which point they are placed on nonaccrual status. Loans also occasionally may be restructured to provide a reduction or deferral of interest or principal payments. This generally occurs when the financial condition of a borrower deteriorates to the point where the borrower needs to be given temporary or permanent relief from the original contractual terms of the loan. Other real estate ownedOREO is acquired primarily through or in lieu of foreclosure on loans secured by real estate.
TheAs reflected in Schedule 39, the Company’s nonperforming assets as a percentage of net loans and leases and other real estate owned continued to improveOREO increased significantly during 2006.2008. The percentage was 0.24%2.71% at December 31, 20062008 compared with 0.30%0.73% on December 31, 2005.2007 and 0.24% on December 31, 2006. Total nonperforming assets were $82$1,140 million at year-end 2006,2008, compared to $89$284 million at December 31, 20052007 and $84$82 million at December 31, 2004. Internal loan classification measures also have continued2006.
Total nonaccrual loans at December 31, 2008 increased $687 million from the balances at December 31, 2007, which included increases of $296 million for commercial construction and land development loans, $227 million for commercial and industrial and owner occupied loans, and $84 million for consumer real estate loans. The increase in nonaccrual construction and land development loans was primarily in Arizona, California, Nevada, and Utah reflecting the weakness in residential development and construction activity in those states. We expect this weakness to reflect strong credit quality during 2006.continue in 2009.
SCHEDULE 36Schedule 39
NONPERFORMING ASSETS
NONPERFORMING ASSETS
| December 31, | December 31, | ||||||||||||||||||||||||||
(Amounts in millions)
| 2006 | 2005 | 2004 | 2003 | 2002 | 2008 | 2007 | 2006 | 2005 | 2004 | |||||||||||||||||
Nonaccrual loans: | |||||||||||||||||||||||||||
Loans held for sale | $ | 30 | – | – | – | – | |||||||||||||||||||||
Commercial lending: | |||||||||||||||||||||||||||
Commercial and industrial | $ | 25 | 21 | 24 | 36 | 29 | 148 | 58 | 25 | 21 | 24 | ||||||||||||||||
Leasing | – | – | 1 | 2 | 11 | 8 | – | – | – | 1 | |||||||||||||||||
Owner occupied | 13 | 16 | 22 | 15 | 14 | 158 | 21 | 13 | 16 | 22 | |||||||||||||||||
Commercial real estate: | |||||||||||||||||||||||||||
Construction | 14 | 17 | 1 | 7 | 7 | ||||||||||||||||||||||
Construction and land development | 457 | 161 | 14 | 17 | 1 | ||||||||||||||||||||||
Term | 8 | 3 | 4 | 3 | 4 | 44 | 4 | 8 | 3 | 4 | |||||||||||||||||
Consumer: | |||||||||||||||||||||||||||
Real estate | 5 | 9 | 13 | 11 | 11 | 97 | 13 | 5 | 9 | 13 | |||||||||||||||||
Other | 2 | 2 | 4 | 3 | 4 | 4 | 2 | 2 | 2 | 4 | |||||||||||||||||
Other | – | 1 | 3 | 1 | 2 | – | – | – | 1 | 3 | |||||||||||||||||
Total nonaccrual loans | 946 | 259 | 67 | 69 | 72 | ||||||||||||||||||||||
Restructured loans: | |||||||||||||||||||||||||||
Commercial real estate: | |||||||||||||||||||||||||||
Construction | – | – | – | 1 | 1 | ||||||||||||||||||||||
Term | – | – | – | – | 1 | ||||||||||||||||||||||
Commercial lending: | |||||||||||||||||||||||||||
Owner occupied | 2 | 10 | – | – | – | ||||||||||||||||||||||
Total restructured loans | 2 | 10 | – | – | – | ||||||||||||||||||||||
Other real estate owned: | |||||||||||||||||||||||||||
Commercial: | |||||||||||||||||||||||||||
Improved | 5 | 8 | 9 | 12 | 23 | ||||||||||||||||||||||
Unimproved | 2 | 3 | – | 4 | 3 | ||||||||||||||||||||||
Commercial properties | 36 | 8 | 5 | 3 | 9 | ||||||||||||||||||||||
Developed land | 7 | – | – | 5 | – | ||||||||||||||||||||||
Land | 2 | 2 | 2 | 3 | – | ||||||||||||||||||||||
Residential: | |||||||||||||||||||||||||||
1-4 family residential | 2 | 9 | 3 | 3 | 6 | 40 | 4 | 2 | 9 | 3 | |||||||||||||||||
Developed land | 71 | 1 | – | – | – | ||||||||||||||||||||||
Land | 36 | – | – | – | – | ||||||||||||||||||||||
Total other real estate owned | 192 | 15 | 9 | 20 | 12 | ||||||||||||||||||||||
Other assets | 6 | – | – | – | – | – | – | 6 | – | – | |||||||||||||||||
Total | $ | 82 | 89 | 84 | 98 | 116 | |||||||||||||||||||||
Total nonperforming assets | $ | 1,140 | 284 | 82 | 89 | 84 | |||||||||||||||||||||
% of net loans* and leases and other real estate owned | 0.24% | 0.30% | 0.37% | 0.49% | 0.61% | 2.71 | % | 0.73 | % | 0.24 | % | 0.30 | % | 0.37 | % | ||||||||||||
Accruing loans past due 90 days or more: | |||||||||||||||||||||||||||
Commercial lending | $ | 17 | 7 | 6 | 10 | 13 | $ | 50 | 38 | 17 | 7 | 6 | |||||||||||||||
Commercial real estate | 22 | 4 | 2 | 3 | 10 | 48 | 28 | 22 | 4 | 2 | |||||||||||||||||
Consumer | 5 | 6 | 8 | 11 | 12 | 32 | 11 | 5 | 6 | 8 | |||||||||||||||||
Other receivables | – | – | – | – | 2 | ||||||||||||||||||||||
Total | $ | 44 | 17 | 16 | 24 | 37 | $ | 130 | 77 | 44 | 17 | 16 | |||||||||||||||
% of net loans* and leases | 0.13% | 0.06% | 0.07% | 0.12% | 0.20% | 0.31 | % | 0.20 | % | 0.13 | % | 0.06 | % | 0.07 | % | ||||||||||||
| * | Includes loans held for sale. |
Included in nonaccrual loans are loans that we have determined to be impaired. Loans, other than those included in large groups of smaller-balance homogeneous loans, are considered impaired when, based on current
information and events, it is probable that the Company will be unable to collect all amounts due in accordance with the contractual terms of the loan agreement, including scheduled interest payments. The amount of the impairment is measured based on either the present value of expected cash flows, the observable marketfair value of the loan, or the fair value of the collateral securing the loan.
The Company’s total recorded investment in impaired loans was $47$770 million at December 31, 20062008 and $31$226 million at December 31, 2005.2007. Estimated losses on impaired loans are included in the allowance for loan losses. At December 31, 2006,2008, the allowance included $6$52 million for impaired loans with a recorded investment of $18$306 million. At December 31, 2005,2007, the allowance
for loan losses included $3$21 million for impaired loans with a recorded investment of $14$103 million. See Note 5 of the Notes to Consolidated Financial Statements for additional information on impaired loans.
AllowancesAllowance and Reserve for Credit Losses
Allowance for Loan LossesLosses:: In analyzing the adequacy of the allowance for loan losses, we utilize a comprehensive loan grading system to determine the risk potential in the portfolio and also consider the results of independent internal credit reviews. To determine the adequacy of the allowance, the Company’s loan and lease portfolio is broken into segments based on loan type.
For commercial loans, we use historical loss experience factors by loan segment, adjusted for changes in trends and conditions, to help determine an indicated allowance for each portfolio segment. These factors are based on aevaluated and updated using migration analysis techniquetechniques and other considerations based on the makeup of the specific segment. These other considerations include:
volumes and trends of delinquencies;
levels of nonaccruals, repossessions, and bankruptcies;
trends in criticized and classified loans;
expected losses on real estate secured loans;
new credit products and policies;
economic conditions;
concentrations of credit risk; and
experience and abilities of the Company’s lending personnel.
In addition to the segment evaluations, nonaccrual loans graded substandard or doubtful with an outstanding balance of $500 thousand or more are individually evaluated in accordance with SFAS No. 114,Accounting by Creditors for Impairment of a Loan,to determine the level of impairment and establish a specific reserve. A specific allowance is established for loans adversely graded below $500 thousand when it is determined that the risk associated with the loan differs significantly from the risk factor amounts established for its loan segment.
The allowance for consumer loans is determined using historically developed experience rates at which loans migrate from one delinquency level to the next higher level. Using average roll rates for the most recent twelve-month period and comparing projected losses to actual loss experience, the model estimates expected losses in dollars for the forecasted period. By refreshing the model with updated data, it is able to project losses for a new twelve-month period each month, segmenting the portfolio into nine product groupings with similar risk profiles. This methodology is an accepted industry practice, and the Company believes it has a sufficient volume of information to produce reliable projections.
As a final step to the evaluation process, we perform an additional review of the adequacy of the allowance based on the loan portfolio in its entirety. This enables us to mitigate the imprecision inherent in most estimates of expected credit losses. This review of the allowance includes our judgmental consideration of any adjustments necessary for subjective factors such as economic uncertainties and excessive concentration risks.
The methodology used by Amegy to estimate its allowance for loan losses has not yet been conformed to the process used by the other affiliate banks. However, the process used by Amegy is not significantly different than the process used by our other affiliate banks.
The Company has initiated a comprehensive review of its allowance for loan losses methodology with a view toward updating and conforming this methodology across all of its banking subsidiaries. The Company expects to beginbegan implementing this updated methodology in 2007 and to complete the implementationexpects that these changes will be phased in 2008.
during 2009.
Schedule 3740 summarizes the Company’s loan loss experience by major portfolio segment.
SCHEDULE 37Schedule 40
SUMMARY OF LOAN LOSS EXPERIENCE
(Amounts in millions)
| 2006 | 2005 | 2004 | 2003 | 2002 | 2008 | 2007 | 2006 | 2005 | 2004 | ||||||||||||||||||||||
Loans* and leases outstanding on December 31, (net of unearned income) | $ | 34,668 | 30,127 | 22,627 | 19,920 | 19,040 | $ | 41,859 | 39,088 | 34,668 | 30,127 | 22,627 | ||||||||||||||||||||
Average loans* and leases outstanding (net of unearned income) | $ | 32,395 | 24,009 | 21,046 | 19,325 | 18,114 | $ | 40,977 | 36,808 | 32,395 | 24,009 | 21,046 | ||||||||||||||||||||
Allowance for loan losses: | ||||||||||||||||||||||||||||||||
Balance at beginning of year | $ | 338 | 271 | 269 | 280 | 260 | $ | 459 | 365 | 338 | 271 | 269 | ||||||||||||||||||||
Allowance of companies acquired | – | 49 | – | – | 1 | – | 8 | – | 49 | – | ||||||||||||||||||||||
Allowance associated with repurchased revolving securitized loans | – | – | – | – | 10 | |||||||||||||||||||||||||||
Allowance of loans sold with branches | – | – | (2 | ) | – | – | ||||||||||||||||||||||||||
Allowance associated with purchased securitized loans | 2 | – | – | – | – | |||||||||||||||||||||||||||
Allowance of loans and leases sold | (1 | ) | (2 | ) | – | – | (2 | ) | ||||||||||||||||||||||||
Provision charged against earnings | 73 | 43 | 44 | 70 | 72 | 648 | 152 | 73 | 43 | 44 | ||||||||||||||||||||||
Loans and leases charged-off: | ||||||||||||||||||||||||||||||||
Commercial lending | (46 | ) | (20 | ) | (35 | ) | (56 | ) | (54 | ) | (100 | ) | (37 | ) | (46 | ) | (20 | ) | (35 | ) | ||||||||||||
Commercial real estate | (5 | ) | (3 | ) | (1 | ) | (3 | ) | (10 | ) | (269 | ) | (24 | ) | (5 | ) | (3 | ) | (1 | ) | ||||||||||||
Consumer | (14 | ) | (19 | ) | (23 | ) | (27 | ) | (20 | ) | (45 | ) | (16 | ) | (14 | ) | (19 | ) | (23 | ) | ||||||||||||
Other receivables | (1 | ) | (1 | ) | (1 | ) | – | – | – | (2 | ) | (1 | ) | (1 | ) | (1 | ) | |||||||||||||||
Total | (66 | ) | (43 | ) | (60 | ) | (86 | ) | (84 | ) | (414 | ) | (79 | ) | (66 | ) | (43 | ) | (60 | ) | ||||||||||||
Recoveries: | ||||||||||||||||||||||||||||||||
Commercial lending | 11 | 12 | 15 | 12 | 14 | 9 | 8 | 11 | 12 | 15 | ||||||||||||||||||||||
Commercial real estate | 2 | 1 | – | – | 3 | 7 | 1 | 2 | 1 | – | ||||||||||||||||||||||
Consumer | 7 | 5 | 5 | 5 | 4 | 5 | 5 | 7 | 5 | 5 | ||||||||||||||||||||||
Other receivables | – | 1 | – | – | – | |||||||||||||||||||||||||||
Total | 20 | 18 | 20 | 17 | 21 | 21 | 15 | 20 | 18 | 20 | ||||||||||||||||||||||
Net loan and lease charge-offs | (46 | ) | (25 | ) | (40 | ) | (69 | ) | (63 | ) | (393 | ) | (64 | ) | (46 | ) | (25 | ) | (40 | ) | ||||||||||||
| 365 | 338 | 271 | 281 | 280 | 715 | 459 | 365 | 338 | 271 | |||||||||||||||||||||||
Reclassification of allowance for unfunded lending commitments | – | – | – | (12 | ) | – | ||||||||||||||||||||||||||
Reclassification to reserve for unfunded lending commitments | (28 | ) | – | – | – | – | ||||||||||||||||||||||||||
Balance at end of year | $ | 365 | 338 | 271 | 269 | 280 | $ | 687 | 459 | 365 | 338 | 271 | ||||||||||||||||||||
Ratio of net charge-offs to average loans and leases | 0.14% | 0.10% | 0.19% | 0.36% | 0.35% | 0.96 | % | 0.17 | % | 0.14 | % | 0.10 | % | 0.19 | % | |||||||||||||||||
Ratio of allowance for loan losses to net loans and leases outstanding on December 31, | 1.05% | 1.12% | 1.20% | 1.35% | 1.47% | 1.64 | % | 1.18 | % | 1.05 | % | 1.12 | % | 1.20 | % | |||||||||||||||||
Ratio of allowance for loan losses to nonperforming loans on December 31, | 548.53% | 489.74% | 374.42% | 338.31% | 332.37% | 72.42 | % | 170.99 | % | 548.53 | % | 489.74 | % | 374.42 | % | |||||||||||||||||
Ratio of allowance for loan losses to nonaccrual loans and accruing loans past due 90 days or more on December 31, | 331.56% | 394.08% | 307.61% | 262.21% | 234.14% | 63.84 | % | 136.75 | % | 331.56 | % | 394.08 | % | 307.61 | % | |||||||||||||||||
| * | Includes loans held for sale. |
Schedule 3841 provides a breakdown of the allowance for loan losses and the allocation among the portfolio segments. No significant changes took place in the past fourfive years in the allocation of the allowance for loan losses by portfolio segment.
Schedule 41
SCHEDULE 38
ALLOCATION OF THE ALLOWANCE FOR LOAN LOSSES
AT DECEMBER 31,
| 2006 | 2005 | 2004 | 2003 | 2002 | |||||||||||||||||||||
| (Amounts in millions) | % of total loans | Allocation of allowance | % of total | Allocation of allowance | % of total loans | Allocation of allowance | % of total loans | Allocation of allowance | % of total loans | Allocation of allowance | |||||||||||||||
Type of Loan | |||||||||||||||||||||||||
Commercial lending | 43.5% | 179 | 41.2% | 166 | 39.0% | 134 | 39.2% | 130 | 39.4% | 133 | |||||||||||||||
Commercial real estate | 35.8 | 143 | 35.5 | 128 | 33.2 | 95 | 31.4 | 90 | 32.0 | 91 | |||||||||||||||
Consumer | 20.1 | 40 | 22.7 | 41 | 27.4 | 41 | 29.0 | 47 | 27.9 | 44 | |||||||||||||||
Other receivables | 0.6 | 3 | 0.6 | 3 | 0.4 | 1 | 0.4 | 2 | 0.7 | 2 | |||||||||||||||
Total loans | 100.0% | 100.0% | 100.0% | 100.0% | 100.0% | ||||||||||||||||||||
Off-balance-sheet unused commitments and standby letters of credit (1) | – | – | – | – | 10 | ||||||||||||||||||||
Total allowance for loan losses | $ | 365 | $ | 338 | $ | 271 | $ | 269 | $ | 280 | |||||||||||||||
| 2008 | 2007 | 2006 | 2005 | 2004 | ||||||||||||||||||||||||||
| (Amounts in millions) | % of total loans | Allocation of allowance | % of total loans | Allocation of allowance | % of total loans | Allocation of allowance | % of total loans | Allocation of allowance | % of total loans | Allocation of allowance | ||||||||||||||||||||
Type of Loan | ||||||||||||||||||||||||||||||
Commercial lending | 49.5 | % | $ | 319 | 47.4 | % | $ | 190 | 44.1 | % | $ | 182 | 41.8 | % | $ | 169 | 39.4 | % | $ | 135 | ||||||||||
Commercial real estate | 32.8 | 291 | 33.8 | 215 | 35.8 | 143 | 35.5 | 128 | 33.2 | 95 | ||||||||||||||||||||
Consumer | 17.7 | 77 | 18.8 | 54 | 20.1 | 40 | 22.7 | 41 | 27.4 | 41 | ||||||||||||||||||||
Total | 100.0 | % | $ | 687 | 100.0 | % | $ | 459 | 100.0 | % | $ | 365 | 100.0 | % | $ | 338 | 100.0 | % | $ | 271 | ||||||||||
As reflected in Schedule 38, theThe total allowance for loan losses at December 31, 20062008 increased by $27$228 million from the level at year-end 2005.2007. For 2006,2008, the amount of the allowance allocated for criticized and classified commercial loans increased $3.1 million compared to $0.2 million for 2005. The level of the allowance for noncriticized and classified commercial loans increased $24 million for 2006 compared to an increase of $23 million for 2005. The increase in level of the allowance indicated for noncriticized and classified loans for both 2006 and 2005 was mainly a result of $4.5 billion of new commercial and commercial real estate loan growth during 2006 and $7.5 billion of growth during 2005, including $5.2 billion of acquired Amegy loans. At December 31, 2006, the ratio of the allowance for loan losses to net loansfor commercial lending reflects $2.2 billion of loan growth mainly at Zions Bank and leases outstanding decreased to 1.05% compared to 1.12% at December 31, 2005. This decreaseAmegy. The increase also reflects improved trendsdeterioration of credit quality in both historical loss experience and nonaccrual loans as previously discussed.
The increased allowance for loan losses at December 31, 2005 compared to December 31, 2004 included a $49 million Amegy allowance acquired. In additionthis portfolio due to the changes above, excluding Amegy,worsening recessionary economic conditions during 2008. The $76 million increase in the allowance for consumercommercial real estate loans at year-end 2005 decreased $5 million compared to 2004 mainly due to a decreaselargely reflects the impact of deteriorating credit quality conditions primarily in outstanding consumer loans primarily as a result of a decision to exit indirect auto lending.
the residential construction and land acquisition and development portfolios in the Southwest and in Utah.
AllowanceReserve for Unfunded Lending CommitmentsCommitments:: The Company also estimates an allowancea reserve for potential losses associated with off-balance-sheetoff-balance sheet commitments and standby letters of credit. Prior to December 31, 2003, this allowance was included in the overall allowance for loan losses. ItThe reserve is now included with other liabilities in the Company’s consolidated balance sheet, with any related increases or decreases in the allowancereserve included in noninterest expense in the statement of income.
We determine the allowancereserve for unfunded lending commitments using a process that is similar to the one we use for commercial loans. Based on historical experience, we have developed experience-based loss factors that we apply to the Company’s unfunded lending commitments to estimate the potential for loss in that portfolio. These factors are generated from tracking commitments that become funded and develop into problem loans.
Schedule 39 sets forthThe Company has historically maintained a reserve for unfunded commitments, recorded in other liabilities. During the fourth quarter of 2008 refinements to this process were implemented to include unfunded commitments, including unfunded portions of partially funded credits. This action resulted in the reclassification of $27.9 million from the allowance for loan losses to the reserve for unfunded lending commitments.
Schedule 42 sets forth the reserve for unfunded lending commitments.
SCHEDULE 39Schedule 42
ALLOWANCERESERVE FOR UNFUNDED LENDING COMMITMENTS
| December 31, | December 31, | |||||||||
(In thousands)
| 2006 | 2005 | 2008 | 2007 | ||||||
Balance at beginning of year | $ | 18,120 | 12,682 | $ | 21,530 | 19,368 | ||||
Allowance of company acquired | – | 2,013 | ||||||||
Reserve of company acquired | – | 326 | ||||||||
Reclassification from allowance for loan losses | 27,937 | – | ||||||||
Provision charged against earnings | 1,248 | 3,425 | 1,467 | 1,836 | ||||||
Balance at end of year | $ | 19,368 | 18,120 | $ | 50,934 | 21,530 | ||||
Schedule 4043 sets forth the combined allowancesallowance and reserve for credit losses.
Schedule 43
SCHEDULE 40
COMBINED ALLOWANCESTOTAL ALLOWANCE AND RESERVE FOR CREDIT LOSSES
| December 31, | |||||||
(In thousands)
| 2006 | 2005 | 2004 | ||||
Allowance for loan losses | $ | 365,150 | 338,399 | 271,117 | |||
Allowance for unfunded lending commitments | 19,368 | 18,120 | 12,682 | ||||
Total allowances for credit losses | $ | 384,518 | 356,519 | 283,799 | |||
| December 31, | |||||||
| (In thousands) | 2008 | 2007 | 2006 | ||||
Allowance for loan losses | $ | 686,999 | 459,376 | 365,150 | |||
Reserve for unfunded lending commitments | 50,934 | 21,530 | 19,368 | ||||
Total allowance and reserve for credit losses | $ | 737,933 | 480,906 | 384,518 | |||
Interest Rate and Market Risk Management
Interest rate and market risk are managed centrally. Interest rate risk is the potential for lossreduced income resulting from adverse changes in the level of interest rates on the Company’s net interest income. Market risk is the potential for loss arising from adverse changes in the pricesfair value of fixed income securities, equity securities, other earning assets, and derivative financial instruments as a result of changes in interest rates or other factors. As a financial institution that engages in transactions involving an array of financial products, the Company is exposed to both interest rate risk and market risk.
The Company’s Board of Directors is responsible for approving the overall policies relating to the management of the financial risk of the Company. The Boards of Directors of the Company’s subsidiary banks are also required to review and approve these policies. In addition, the Board must understand the key strategies set by management for managing risk, establish and periodically revise policy limits, and review reported limit exceptions. The Board has established the management Asset/Liability Committee (“ALCO”) to which it has delegated the functional management of interest rate and market risk for the Company. ALCO’s primary responsibilities include:
Recommendingrecommending policies to the Board and administering Board-approved policies that govern and limit the Company’s exposure to all interest rate and market risk, including policies that are designed to limit the Company’s exposure to changes in interest rates;
Approvingapproving the procedures that support the Board-approved policies;
Maintainingmaintaining management’s policies dealing with interest rate and market risk;
Approvingapproving all material interest rate risk management strategies, including all hedging strategies and actions taken pursuant to managing interest rate risk and monitoring risk positions against approved limits;
Approvingapproving limits and all financial derivative positions taken at both the Parent and subsidiaries for the purpose of hedging the Company’s interest rate and market risks;
Providingproviding the basis for integrated balance sheet, net interest income, and liquidity management;
Calculatingcalculating the duration and dollar duration of each class of assets, liabilities, and net equity, given defined interest rate scenarios;
Managingmanaging the Company’s exposure to changes in net interest income and duration of equity due to interest rate fluctuations; and
Quantifyingquantifying the effects of hedging instruments on the duration of equity and net interest income under defined interest rate scenarios.
Interest Rate Risk
Interest rate risk is one of the most significant risks to which the Company is regularly exposed. In general, our goal in managing interest rate risk is to have the net interest margin increase slightly in a rising interest rate environment. We refer to this goal as being slightly “asset-sensitive.” This approach is based on our belief that in a rising interest rate environment, the market cost of equity, or implied rate at which future earnings are discounted, would also tend to rise.
We attempt to minimize the impact of changing interest rates on net interest income primarily through the use of interest rate swaps, and by avoiding large exposures to fixed rate interest-earning assets that have significant negative convexity. The prime lending rate and the LIBOR curves are the primary indices used for pricing the Company’s loans. The interest rates paid on deposit accounts are set by individual banks so as to be competitive in each local market.
We monitor this risk through the use of two complementary measurement methods: duration of equity and income simulation. In the duration of equity method, we measure the expected changes in the marketfair values of equity in response to changes in interest rates. In the income simulation method, we analyze the expected changes in income in response to changes in interest rates.
Duration of equity is derived by first calculating the dollar duration of all assets, liabilities and derivative instruments. Dollar duration is determined by calculating the marketfair value of each instrument assuming interest rates sustain immediate and parallel movements up 1% and down 1%. The average of these two changes in marketfair value is the dollar duration. Subtracting the dollar duration of liabilities from the dollar duration of assets and adding the net dollar duration of derivative instruments results in the dollar duration of equity. Duration of equity is computed by dividing the dollar duration of equity by the marketfair value of equity.
Income simulation is an estimate of the net interest income that would be recognized under different rate environments. Net interest income is measured under several parallel and nonparallel interest rate environments and deposit repricing assumptions, taking into account an estimate of the possible exercise of options within the portfolio.
Both of these measurement methods require that we assess a number of variables and make various assumptions in managing the Company’s exposure to changes in interest rates. The assessments address loan and security prepayments, early deposit withdrawals, and other embedded options and noncontrollable events. As a result of uncertainty about the maturity and repricing characteristics of both deposits and loans, the Company estimates ranges of duration and income simulation under a variety of assumptions and scenarios. The Company’s interest rate risk position changes as the interest rate environment changes and is managed actively to try to maintain a consistent slightly asset-sensitive position. However, positions at the end of any period may not be reflective of the Company’s position in any subsequent period.
We should note that estimated duration of equity isand the income simulation results are highly sensitive to the assumptions used for deposits that do not have specific maturities, such as checking, savings, and money market accounts and also to prepayment assumptions used for loans with prepayment options. Given the uncertainty of these durations,estimates, we view both the duration of equity and the income simulation results as falling within a range of possibilities.
For income simulation, Company policy requires that interest sensitive income from a static balance sheet is expectedbe limited to a decline byof no more than 10% during one year if rates were to immediately rise or fall in parallel by 200 basis points.
As of the dates indicated, Schedule 4144 shows the Company’s estimated range of duration of equity duration of equity simulation, and percentage change in interest sensitive income, based on a static balance sheet, in the first year after the rate
change if interest rates were to sustain an immediate parallel change of 200 basis points; the “low” and “high” results differ based on the assumed speed of repricing of administered-rate deposits (money market, interest-on-checking, and savings):
Schedule 44
SCHEDULE 41
DURATION OF EQUITY AND INTEREST SENSITIVE INCOME
| December 31, 2006 | December 31, 2005 | December 31, 2008 | December 31, 2007 | |||||||||||||||||
| Low | High | Low | High | Low | High | Low | High | |||||||||||||
Duration of equity: | ||||||||||||||||||||
Range (in years) | – | 1.6 | -0.2 | 2.3 | ||||||||||||||||
Duration of equity simulation – change in years: | ||||||||||||||||||||
Base case | -2.5 | 0.9 | 0.0 | 2.5 | ||||||||||||||||
Increase interest rates by 200 bp | 0.8 | 2.4 | 1.2 | 3.8 | -2.4 | 0.7 | 0.9 | 3.4 | ||||||||||||
Income simulation – change in interest sensitive income: | ||||||||||||||||||||
Increase interest rates by 200 bp | -0.9% | 1.5% | -1.1% | 2.4% | -1.1 | % | 1.5 | % | -1.3 | % | 1.1 | % | ||||||||
Decrease interest rates by 200 bp | -3.6% | -1.3% | -4.5% | -0.7% | -2.4 | % | -1.8 | % | -2.3 | % | -0.2 | % | ||||||||
We attemptThe Company believes that the dynamic balance sheet changes during 2008, including changes in the mix of deposits and other funding sources, have tended to minimizehave a somewhat larger effect on the net interest spread and net interest margin than has the Company’s interest rate risk position. In addition, competitive pressures on deposit rates impeded our ability to reprice deposits, which had a negative impact on the net interest margin during 2008. Market disruptions and funding pressures experienced by many financial institutions kept market deposit prices from falling as much as expected when the Federal Reserve Board began reducing short-term interest rates. Finally, continued changes in loan pricing spreads and other interest rates willrate behaviors have on netmade it more difficult to implement the Company’s normal interest income primarily throughrate risk management activities using interest rate swaps. Approximately $1.0 billion of receive-fixed interest rate swaps were terminated during 2008 and were not replaced in this period of historically low interest rates. At the same time, the Company’s subsidiary banks made increasing use of interest rate swaps, and by avoiding large exposures to fixedfloors on new loans. As a result, the Company ended 2008 with an interest rate interest-earning assetsrisk position that have significant negative convexity. The prime lending rate andwas more asset-sensitive than at the London Interbank Offer Rate (“LIBOR”) curves are the primary indices used for pricing the Company’s loans. The interest rates paid on deposit accounts are set by individual banks soend of 2007, as to be competitiveshown in each local market.
Schedule 44.
Our focus on business banking also plays a significant role in determining the nature of the Company’s asset-liability management posture. At the end of 2006,2008, approximately 75%78% of the Company’s commercial loan and commercial real estate portfolios were floating rate and primarily tied to either Primeprime or LIBOR. In addition, certain of our consumer loans also have floating interest rates. This means that these loans reprice quickly in response to changes in interest rates – more quickly on average than does their funding base. This posture results in a naturally “asset-sensitive” position.
It is our belief that the Company’s core banking business leads naturally to anatural position that is more asset-sensitive“asset-sensitive” than the Company believes is desirable.
The Company attempts to mitigate this tendency toward asset sensitivity primarilythrough the use of interest rate floors on loans to protect against declining rates, and more importantly through the use of interest rate swaps. We have also contracted to convert most of the Company’s long-term fixed-rate debt into floating-rate debt through the use of interest rate swaps (see fair“fair value hedgeshedges” in Schedule 42)45). More importantly, we engage in an ongoing program of swapping prime-based and LIBOR-based loans and other variable-rate assets for “receive fixed”“receive-fixed” contracts. At year-end 2006,2008, the Company had a notional amount of approximately $3.3$2.4 billion of such cash flow hedge contracts. The Company expectsThis notional amount is approximately $1.0 billion less than at year-end 2007; this reduction primarily reflects the termination of a number of swaps in 2008, and the Company’s decision not to continue to add new “receive fixed” swap contracts as its prime-based loan portfolio grows.replace those swaps in a historically low interest rate environment. These swaps also expose the Company to counterparty risk, which is a type of credit risk. The Company’s approach to managing this risk is discussed in “Credit Risk Management” on page 77.99. The Company retains basis risk due to changes between the prime rate and LIBOR on nonhedge derivative basis swaps. See “Accounting for Derivatives” on page 44 for further details about our derivative instruments.
Schedule 4245 presents a profile of the current interest rate swapderivatives portfolio. For additional information regarding derivative instruments, including fair values at December 31, 2006,2008, refer to Notes 1 and 7 of the Notes to Consolidated Financial Statements.
Schedule 45
SCHEDULE 42
INTEREST RATE SWAPSDERIVATIVES – YEAR-END BALANCES AND AVERAGE RATES
(Amounts in millions)
| 2007 | 2008 | 2009 | 2010 | 2011 | Thereafter | |||||||
Cash flow hedges(1): | |||||||||||||
Notional amount | $ | 3,275 | 3,145 | 2,285 | 1,475 | 225 | |||||||
Weighted average rate received | 7.31% | 7.33 | 7.66 | 7.85 | 7.78 | ||||||||
Weighted average rate paid | 7.62 | 7.50 | 7.73 | 7.61 | 7.99 | ||||||||
Fair value hedges(1): | |||||||||||||
Notional amount | $ | 1,400 | 1,400 | 1,400 | 1,400 | 1,400 | 1,400 | ||||||
Weighted average rate received | 5.71% | 5.71 | 5.71 | 5.71 | 5.71 | 5.71 | |||||||
Weighted average rate paid | 4.97 | 4.89 | 5.03 | 4.97 | 5.18 | 5.01 | |||||||
Nonhedges: | |||||||||||||
Receive fixed rate/pay variable rate: | |||||||||||||
Notional amount | $ | 189 | |||||||||||
Weighted average rate received | 4.55% | ||||||||||||
Weighted average rate paid | 5.28 | ||||||||||||
Receive variable rate/pay fixed rate: | |||||||||||||
Notional amount | $ | 189 | |||||||||||
Weighted average rate received | 5.28% | ||||||||||||
Weighted average rate paid | 4.55 | ||||||||||||
Basis Swaps: | |||||||||||||
Notional amount | $ | 3,030 | 2,900 | 2,190 | 1,380 | 225 | |||||||
Weighted average rate received | 7.83% | 7.72 | 7.85 | 7.79 | 7.99 | ||||||||
Weighted average rate paid | 7.81 | 7.69 | 7.81 | 7.78 | 7.95 | ||||||||
Net notional | $ | 7,705 | 7,445 | 5,875 | 4,255 | 1,850 | 1,400 | ||||||
| (Amounts in millions) | 2009 | 2010 | 2011 | 2012 | 2013 | Thereafter | ||||||||
Cash flow hedges1: | ||||||||||||||
Notional amount | $ | 2,405 | 2,080 | 1,140 | 330 | |||||||||
Weighted average expected receive rate | 7.05 | % | 6.99 | 6.83 | 6.21 | |||||||||
Weighted average expected pay rate | 3.20 | 4.01 | 4.27 | 3.61 | ||||||||||
Cash flow floors: | ||||||||||||||
Notional amount | $ | 255 | 255 | |||||||||||
Weighted average strike price | 3.53 | 3.53 | ||||||||||||
Fair value hedges1: | ||||||||||||||
Notional amount | $ | 1,400 | 1,400 | 1,400 | 1,400 | 1,400 | 1,400 | |||||||
Weighted average expected receive rate | 5.71 | % | 5.71 | 5.71 | 5.71 | 5.71 | 5.71 | |||||||
Weighted average expected pay rate | 1.83 | 2.70 | 2.91 | 3.22 | 3.22 | 3.02 | ||||||||
Nonhedges: | ||||||||||||||
Receive fixed rate/pay variable rate: | ||||||||||||||
Notional amount | $ | 130 | 71 | |||||||||||
Weighted average expected receive rate | 4.89 | % | 4.82 | |||||||||||
Weighted average expected pay rate | 1.71 | 2.42 | ||||||||||||
Receive variable rate/pay fixed rate: | ||||||||||||||
Notional amount | $ | 130 | 71 | |||||||||||
Weighted average expected receive rate | 1.71 | % | 2.42 | |||||||||||
Weighted average expected pay rate | 4.89 | 4.82 | ||||||||||||
Basis swaps: | ||||||||||||||
Notional amount | $ | 1,795 | 1,470 | 725 | 130 | |||||||||
Weighted average expected receive rate | 3.81 | % | 4.86 | 5.33 | 5.51 | |||||||||
Weighted average expected pay rate | 4.22 | 4.86 | 5.34 | 5.57 | ||||||||||
Net notional | $ | 5,855 | 5,205 | 3,265 | 1,860 | 1,400 | 1,400 | |||||||
1 | Receive fixed rate/pay variable rate |
Note: Balances are based upon the portfolio at December 31,2006.31, 2008. Excludes interest rate swap products that we provide as a service to our customers.
Market Risk – Fixed Income
The Company engages in the underwriting and trading and market making of U.S. Treasury, U.S. Government Agency, municipal and corporate securities. This trading and market makingactivity exposes the Company to a risk of loss arising from adverse changes in the prices of these fixed income securities held by the Company.
During the last quarter of 2005, the Company closed its London trading office and substantially reduced the size of its trading assets in response to continued narrow margins in its odd-lot electronic bond trading business. At December 31, 2006,2008, trading account assets had been reduced to $63.4$42.1 million and securities sold, not yet purchased were $50.4$35.7 million.
At year-end 2006,2008, the Company made a market in 823480 fixed income securities through Zions Bank and its wholly-owned subsidiary, Zions Direct, Inc. During 2006, 74%2008, 62% of all trades were executed electronically. The Company is an odd-lot securities dealer, which means that most U.S. Treasury and Government Agency trades are for less than $5 million and most corporate security trades are for less than $250,000.
Subsequent to year-end, the Company transferred the fixed income U.S. Treasury and Government Agency portion of this business to Diawa Securities.
The Company monitorsis exposed to market risk through changes in fixed income tradingfair value and OTTI of HTM and AFS securities. The Company also is exposed to market making through Value-at-Risk (“VAR”). VAR isrisk for interest rate swaps used to hedge interest rate risk. Changes in fair value in available-for-sale securities and interest rate swaps are included in OCI each quarter. During 2008, the worst-case loss expected within a specified confidence level, based on statistical models using historical data. Value-at-Risk information is not disclosed dueafter-tax change in OCI attributable to the limited riskAFS securities was $(11.2) million. The after-tax change in fixed income trading and market making after the reductionsOCI attributable to HTM securities transferred from AFS in the scalesecond quarter and fourth quarter of 2008 was $(123.9) million. The change attributable to interest rate swaps was $131.4 million, for a net decrease to shareholders’ equity of $3.7 million. If any of the Company’s tradingAFS securities or HTM securities transferred from AFS becomes other than temporarily impaired, any loss in OCI is reversed and the impairment is charged to operations.
See “Investment Securities Portfolio” on page 85 for additional information on OTTI.
Market Risk – Equity Investments
Through its equity investment activities, the Company owns equity securities that are publicly traded and subject to fluctuations in their market prices or values. In addition, the Company owns equity securities in companies that are not publicly traded, that are accounted for under cost, fair value, equity, or full consolidation methods of accounting, depending upon the Company’s ownership position and degree of involvement in influencing the investees’ affairs. In any case, the value of the Company’s investment is subject to fluctuation. Since the fair value of these market prices or valuessecurities may fall below the Company’s investment costs, the Company is exposed to the possibility of loss. These equity investments are approved, monitored and evaluated by the Company’s Equity Investment Committee.
The Company generally conducts minority investingalso invests in pre-publicprepublic venture capital companies in which it does not have strategic involvement, through four funds collectively referred to as Wasatch Venture Funds (“Wasatch”). Wasatch screens investment opportunities and makes investment decisions based on its assessment of business prospects and potential returns. After an investment is made, Wasatch actively monitors the performance of the companies in which it has invested, and often has representation on the board of directors of the company.various venture funds. Net of expenses, income tax effects and minority interest, losses were $3.0 million in 2008 and gains were $4.1$3.9 million in 2007 and $4.0 million in 2006 and losses were $2.2 million in 2005 and $4.5 million in 2004.from these venture funds. The Company’s remaining equity exposure to investments held by Wasatch,these venture funds, net of related minority interest and SBA debt, at December 31, 20062008 was approximately $49.1$54.4 million, compared to approximately $40.9$64.0 million at December 31, 2005.
2007.
In addition to the program described above, Amegy has in place an alternative investments program. These investments are primarily directed towards equity buyout and mezzanine funds with a key strategy of deriving ancillary commercial banking business from the portfolio companies. Early stage venture capital funds generally are not part of the strategy since the underlying companies are typically not credit worthy. The carrying value of the investments at December 31, 20062008 was $19.6$54.6 million as compared to $23.7$37.4 million at December 31, 2005.2007. The Company has a total remaining nonfinancial funding commitment of $102.9$100.2 million to SBIC, non-SBIC hedge fund,funds, and private equity investments as of December 31, 2006. This2008; $77.1 million of this total funding commitment is primarily at Amegy, totaling $93.5 million.
Amegy.
The Company also, from time to time, either starts and funds businesses of a strategic nature, or makes significant investments in companies of strategic interest. These investments may result in either minority or majority ownership positions, and usually give the Parent or its subsidiaries board representation. These strategic investments are in companies that are financial services or financial technologies providers. Examples of these investments include ICAP plc. and Lending Tree, which were both sold at substantial gains in 2003. Other examples include Contango NetDeposit, and P5 all ofNetDeposit, which are majority or wholly-owned by the Company, and Insure.com IdenTrust, and Roth Capital,IdenTrust, in which the Company owns a significant, but minority position.positions.
Liquidity Risk
Overview
Liquidity risk is the possibility that the Company’s cash flows may not be adequate to fund its ongoing operations and meet its commitments in a timely and cost-effective manner. Since liquidity risk is closely linked to both credit risk and market risk, many of the previously discussed risk control mechanisms also apply to the monitoring and management of liquidity risk. We manage the Company’s liquidity to provide adequate funds to meet its anticipated financial and contractual obligations, including withdrawals by depositors, debt service requirements and lease obligations, as well as to fund customers’ needs for credit.
Overseeing liquidity management is the responsibility of ALCO, which implements a Board-adopted corporate Liquidity and Funding Policy that is adhered to by the Parent and the subsidiary banks. This policy includes guidelines by which liquidity and funding are managed. These guidelines address maintaining liquidity needs, diversifying funding positions, monitoring liquidity at consolidated as well as subsidiary levels, and anticipating future funding needs. The policy also includes liquidity ratio guidelines that are used to monitor the liquidity positions of the Parent and bank subsidiaries.
Managing liquidity and funding is performed centrally by Zions Bank’s Capital Markets/Investment Division under the direction of the Company’s Chief Investment Officer, with oversight by ALCO. The Chief Investment Officer is responsible for making any
recommended changes to existing funding plans, as well as to the policy guidelines. These recommendations must be submitted for approval to ALCO and potentially to the Company’s Board of Directors. The subsidiary banks only have authority to price deposits, borrow from their FHLB and the Federal Reserve, and sell/purchase Federal Funds to/from Zions Bank.Bank and/or correspondent banks. The banks may also make liquidity and funding recommendations to the Chief Investment Officer, but are not involved in any other funding decision processes.
Contractual Obligations
Schedule 4346 summarizes the Company’s contractual obligations at December 31, 2006.2008.
Schedule 46
CONTRACTUAL OBLIGATIONS
SCHEDULE 43
CONTRACTUAL OBLIGATIONS
(In millions)
| One year or less | Over one year through three years | Over three years through five years | Over five years | Indeterminable maturity (1) | Total | One year or less | Over one year through three years | Over three years through five years | Over five years | Indeterminable maturity1 | Total | ||||||||||||||
Deposits | $ | 6,820 | 546 | 138 | 1 | 27,477 | 34,982 | $ | 7,395 | 642 | 195 | 3 | 33,081 | 41,316 | ||||||||||||
Commitments to extend credit | 6,494 | 5,455 | 1,991 | 2,775 | 16,715 | 5,831 | 4,197 | 1,442 | 2,670 | 14,140 | ||||||||||||||||
Standby letters of credit: | ||||||||||||||||||||||||||
Financial | 835 | 272 | 118 | 69 | 1,294 | |||||||||||||||||||||
Performance | 207 | 102 | 21 | 330 | 197 | 53 | 1 | 251 | ||||||||||||||||||
Financial | 789 | 236 | 119 | 13 | 1,157 | |||||||||||||||||||||
Commercial letters of credit | 130 | 3 | 133 | 56 | 1 | 9 | 66 | |||||||||||||||||||
Commitments to make venture and other noninterest-bearing investments (2) | 103 | 103 | ||||||||||||||||||||||||
Commitments to Lockhart (3) | 4,104 | 4,104 | ||||||||||||||||||||||||
Commitments to make venture and other noninterest-bearing investments2 | 103 | 103 | ||||||||||||||||||||||||
Commitments to Lockhart3 | 738 | 738 | ||||||||||||||||||||||||
Federal funds purchased and security repurchase agreements | 2,928 | 2,928 | 1,866 | 1,866 | ||||||||||||||||||||||
Other short-term borrowings | 789 | 789 | 2,091 | 2,091 | ||||||||||||||||||||||
Long-term borrowings (4) | 3 | 402 | 107 | 1,960 | 2,472 | |||||||||||||||||||||
Long-term borrowings4 | 298 | 133 | 3 | 1,952 | 2,386 | |||||||||||||||||||||
Operating leases, net of subleases | 41 | 76 | 59 | 160 | 336 | 41 | 82 | 63 | 157 | 343 | ||||||||||||||||
Visa litigation | 1 | 1 | 2 | |||||||||||||||||||||||
Unrecognized tax benefits, FIN 48 | 9 | 9 | ||||||||||||||||||||||||
| $ | 22,408 | 6,820 | 2,435 | 4,909 | 27,477 | 64,049 | $ | 19,452 | 5,380 | 1,831 | 4,851 | 33,091 | 64,605 | |||||||||||||
1 | Indeterminable maturity on deposits includes noninterest-bearing demand, savings and money market deposits, and nontime foreign deposits. |
2 | Commitments to make venture investments do not have defined maturity dates. They have therefore been considered due on demand, maturing in one year or less. |
3 | See “Off-Balance Sheet Arrangement” and Note 6 of the Notes to Consolidated Financial Statements for details of the commitments to Lockhart. |
4 | The maturities on long-term borrowings do not include the associated hedges. |
As of December 31, 2006, there were no minimum required pension plan contributions and no discretionary or noncash contributions are currently planned. As a result, no amounts have been included in the schedule above for future pension plan contributions. During 2006, the Company made a $10 million contribution to the plan based on actuarial recommendation.
In addition to the commitments specifically noted in the previous schedule, the Company enters into a number of contractual commitments in the ordinary course of business. These include software licensing and maintenance, telecommunications services, facilities maintenance and equipment servicing, supplies purchasing, and other goods and services used in the operation of our business. Generally, these contracts are renewable or cancelable at least annually, although in some cases to secure favorable pricing concessions, the Company has committed to contracts that may extend to several years.
The Company also enters into derivative contracts under which we areit is required either to receive cash or pay cash, depending on changes in interest rates. These contracts are carried at fair value on the balance sheet with the fair value representing the net present value of the expected future cash receipts and payments based on market rates of interest as of the balance sheet date. The fair value of the contracts changes daily as interest rates change. For further information on derivative contracts, see Note 7 of the Notes to Consolidated Financial Statements.
Pension Obligations
As of December 31, 2006, the market value of the Company’s pension plan assets was $141.3 million and the benefit obligation as of that date was $155.1 million, as measured with an annual discount rate of 5.65%. This means that the pension plan is underfunded in the amount of $13.8 million. This underfunding is recorded as a liability on the Company’s balance sheet. Since no new employees can be added to the plan and future benefit accruals were eliminated for most participants effective January 1, 2003, this unfunded condition should decrease over time as the market value of plan assets is expected to appreciate faster than the benefit obligation, although fluctuations in plan asset values could cause the unfunded amount to either increase or decrease over shorter time periods. As a result, the Company does not anticipate a need to make any cash contributions to the plan in the near future. However, certain changes to federal laws and regulations governing defined benefit plans could change the Company’s need to make future cash contributions.
Liquidity Management Actions
The Parent’s cash requirements consist primarily of debt service, investmentinvestments in and advances to subsidiaries, operating expenses, income taxes, and dividends to preferred and common shareholders, and share repurchases.including the CPP preferred equity issued to the Treasury. The Parent’s cash needs are routinely met through dividends from its subsidiaries, interest and investment income, subsidiaries’ proportionate share of current income taxes, management and other fees, bank lines, equity contributed through the exercise of stock options, commercial paper, and long-term debt and equity issuances. The subsidiaries’Parent also maintains internal back-up liquidity lines with several of its subsidiary banks that are secured by pledged collateral. The subsidiary banks’ primary source of funding is their core deposits. Operational cash flows, while constituting a funding source for the Company, are not large enough to provide funding in the amounts that fulfill the needs of the Parent and the bank subsidiaries. For 20062008, operations contributed $1.0 billion$1,174 million toward these needs. As a result, the Company utilizes other sources at its disposal to manage its liquidity needs.
During 2006,2008, the Parent received $431.6$106 million in cash dividends from various subsidiaries. At December 31, 2006,2008, the banking subsidiaries could pay $403.8$374 million of dividends to the Parent under regulatory guidelines without the need for regulatory approval. The amounts of dividends the banking subsidiaries can pay to the Parent are restricted by earnings, retained earnings, and risk-based capital requirements. The dividend capacity is dependent on the continued profitability of the subsidiary banks and no significant changes in the current regulatory environment. While we have no current expectation that these two conditions will change, should a change take place to either in the future, thisThis source of funding to the Parent may become more limited or even unavailable.unavailable if the operating performance of subsidiary banks deteriorates under continued weak economic conditions or changes in regulation or law. See Note 19 of the Notes to Consolidated Financial Statements for details of dividend capacities and limitations.
For the year 2006,2008, issuances of senior medium-term debt exceeded repayments of long-term debt exceeded issuances of medium-term and long-term debt, resulting in net cash outflowsinflows of $142.8$109 million from debt financing activities. Specific long-term debt-related activities for 2006 are as follows:
On March 31, 2006,In April 2008 the Company filed an “automaticredeemed $18 million of senior notes at maturity.
Throughout 2008, fixed-rate notes were sold via the Company’s online auction process and direct sales; we issued a total of $264 million of these unsecured notes that have been issued under a shelf registration statement”filed with the Securities and Exchange Commission as a “well-known seasoned issuer.” This new typeSEC.
During the third quarter of shelf registration does not require us to specify a maximum amount of securities that may be issued. The shelf registration replaced a previous shelf registration and covers securities of2008, the Company Zions Capital Trust C, and Zions Capital Trust D.redeemed $137 million of senior notes at maturity.
On April 27, 2006 under the new shelf registration,January 15, 2009, we issued $250approximately $255 million of senior floating rate senior notes due April 15, 2008. The notes require quarterly interest paymentsJune 21, 2012 at a coupon rate of three-month LIBOR plus 0.12%. They are not redeemable prior to maturity and are not listed on any national securities exchange. Proceeds from the notes were used to retire the $150 million of 2.70% senior notes due May 1, 2006 and the remaining $104.2 million of 6.95% subordinated notes due May 15, 2011 and redeemable May 15, 2006.
On September 28, 200637 basis points. The debt is guaranteed under the new shelf registration, we issued $145 million of floating rate senior notes due September 15,FDIC’s TLGP that became effective on November 21, 2008. The notes require quarterly interest payments at three-month LIBOR plus 0.12%. They are not redeemable prior to maturity and are not listed on any national securities exchange. Proceeds from the notes were used to retire all of the remaining $98.4 million of 6.50% subordinated notes due October 15, 2011 and redeemed October 15, 2006, and applied to the redemption of the $176.3 million of 8.536% trust preferred securities (Zions Institutional Capital Trust A) on December 15, 2006. The Company incurred a premium of $7.3 million on the redemption of the trust preferred securities, which was charged to the statement of income in the fourth quarter of 2006.
See Note 13 of the Notes to Consolidated Financial Statements for a complete summary of the Company’s long-term borrowings.
On December 7, 2006 the Company issued $240 million of Series A Floating-Rate Non-Cumulative Perpetual Preferred Stock. See “Capital Management” beginning on page 97 for further details of this issuance.
On a consolidated basis, fundings fromrepayments of short-term borrowings exceeded repaymentsfundings (excluding short-term FHLB borrowings) and resulted in a $683.3$2,367 million sourceuse of cash in 2006.2008. The Parent has a program to issue short-term commercial paperpaper; however, current market conditions have severely constrained activity in this program, and at December 31, 2006,2008, outstanding commercial paper was $220.5$15 million. In addition, the
The Parent has a $40 million secured revolving credit facilityfacilities totaling $395 million with five subsidiary banks. These revolving credit facilities are limited to the total of pledged securities owned by the Parent and municipal securities owned by a nonbank subsidiary bank.and hypothecated to the Parent. No amount was outstanding on this facilitythese facilities at December 31, 2006.
2008.
Access to funding markets for the Parent and subsidiary banks is directly tied to the credit ratings they receive from various rating agencies. The ratings not only influence the costs associated with the borrowings but can also influence the sources of the borrowings. The Parent and its three largest banking subsidiaries had the following ratings as of December 31, 2006:
SCHEDULE 44Schedule 47
CREDIT RATINGS
Parent Company:
Rating agency | Outlook | Long-term issuer/ senior debt rating | Subordinated debt rating | Short-term/ commercial paper rating | ||||
S&P | BBB+ | BBB | A-2 | |||||
Moody’s | A3 | Baa1 | ||||||
Fitch | A- | BBB+ | F1 | |||||
Dominion | Stable |
Three Largest Banking Subsidiaries:
Rating agency | Outlook | Long-term issuer/ senior debt rating | Subordinated debt rating | Short-term/ commercial paper rating | Certificate of deposit rating | |||||
S&P | NR | NR | na | NR | NR | |||||
Moody’s | Negative | A2 | na | P-1 | A2 | |||||
Fitch | Stable | A- | na | F1 | A | |||||
Dominion | Stable | NR | na | R-1(low) | A |
Any downgrade in theseNR – not rated
On February 28, 2008, Moody’s downgraded its ratings could negatively impactfor the Parent’s abilityParent on long-term issuer/senior debt to borrow, including higher costsA3, on subordinated debt to Baa1, and on short-term/commercial paper to P-2; it also changed its outlook from Negative to Stable. Also, Moody’s downgraded its ratings for the three largest banking subsidiaries on long-term issuer/senior debt and certificate of fundsdeposit to A2, affirmed the short-term/commercial paper rating of P-1, and accesschanged its outlook from Negative to fewer funding sources.Stable.
On August 11, 2008 Moody’s changed its rating outlook to Watch Negative for the Parent and the three largest subsidiary banks. On December 3, 2008, Moody’s reaffirmed its current ratings and changed its long-term issuer ratings outlook to Outlook Negative for the Parent. On September 3, 2008, S&P reaffirmed its current ratings and changed its long term issuer ratings outlook to Outlook Negative for the Parent and the largest subsidiary bank.
The subsidiaries’ primary source of funding is their core deposits, consisting of demand, savings and money market deposits, time deposits under $100,000, and foreign deposits. At December 31, 2006,2008, these core deposits, in aggregate, constituted 87.7%81.9% of consolidated deposits, compared with 92.3%87.9% of consolidated deposits at
December 31, 2005.2007. At December 31, 2008, total brokered deposits were $3.3 billion, up from $77 million at December 31, 2007. For 2006,2008, deposit increases resulted in net cash inflows of $2.3 billion$3,662 million which primarily resulted from a $1.8 billion$3,192 million increase in noncorebrokered deposits.
On October 3, 2008, the FDIC increased deposit “Jumbo CDs” or time deposits greater than $100,000.
insurance to $250,000 through December 31, 2009. In addition, the FDIC implemented a program to provide full deposit insurance coverage for noninterest-bearing transaction deposit accounts through December 31, 2009, unless insured banks elect to opt out of the program. The Company did not opt out of this program.
The FHLB system is also a significant source of liquidity for each of the Company’s subsidiary banks. Zions Bank and TCBW are members of the FHLB of Seattle. CB&T, NSB, and NBA are members of the FHLB of San Francisco. Vectra is a member of the FHLB of Topeka and Amegy is a member of the FHLB of Dallas. The FHLB allows member banks to borrow against their eligible loans to satisfy liquidity requirements. For 2006,2008, the activity in short-term FHLB borrowings resulted in a net cash inflowoutflow of $499.1$2,725 million. Amounts of unused lines of credit available for additional FHLB advances totaled $6.1$8.8 billion at December 31, 2006, subject to availability of collateral and certain requirements.2008. Borrowings from the FHLB may increase in the future, depending on availability of funding from other sources such as deposits. However, theThe subsidiary banks must maintain their FHLB memberships to continue accessing this source of funding. The Company is aware of recent news reports and FHLB member bank press releases regarding the financial strength of the FHLB system. The Company is actively monitoring its ability to borrow from the FHLB banks and took actions in the fourth quarter of 2008 to reduce its borrowings from the FHLB banks.
In December 2007, the Federal Reserve Board announced a new program, the Term Auction Facility (“TAF”), to make 28 day loans to banks in the United States and to foreign banks through foreign central banks. These loans are made using an auction process. Zions Bank is currently participating in the TAF and may continue to do so as long as money can be borrowed at an attractive rate. The amount that can be borrowed is based upon the amount of collateral that has been pledged to the Federal Reserve Bank. At December 31, 2008, $1.8 billion in borrowings were outstanding under this program as compared to $450 million at December 31, 2007. However, by February 13, 2009, the TAF borrowings outstanding had been reduced to $500 million. At December 31, 2008, the amount available for additional Federal Reserve borrowings was approximately $4.3 billion, which had increased to $5.7 billion by February 13, 2009. An additional $1.3 billion could be borrowed at December 31, 2008 upon the pledging of additional available collateral.
As explained earlier,At December 31, 2008, the CompanyCompany’s subsidiary banks had a total of $13.1 billion of immediately available, unused borrowing capacity at the Fed and various FHLBs, which had increased to $14.3 billion as of February 13, 2009.
Zions Bank has in prior years used asset securitizations to sell loans which also provides anand provide a flexible alternative source of funding for the subsidiaries and enhances flexibility in meeting funding needs. During 2006, loan sales (other than proceeds from loans held for sale included in cash flows from operating activities) provided $218 million in cash inflows.
At December 31, 2006, the Company managed approximately $2.6 billion of securitized assets that were originated or purchased by its subsidiary banks. Of these, approximately $1.6 billion were credit-enhanced by a third party insurance provider and held in Lockhart, which isfunding. As a QSPE securities conduit sponsored by Zions Bank, Lockhart has purchased and has been an important source of funding for the Company’s loans.held credit-enhanced securitized assets resulting from certain small business loan securitizations. Zions Bank provides a Liquidity Facilityliquidity facility to Lockhart for a fee tofee. Lockhart which purchases floating-rate U.S. Government and AAA-rated securities with funds from the issuance of commercial paper. Zions Bank also provides interest rate hedging support and administrative and investment advisory services for a fee. Pursuant
Due to the Liquidity Facility, Zions Bank isdisruptions in the asset-backed commercial paper markets that began in August 2007 and continued into 2008, Lockhart was unable to issue commercial paper sufficient to fund its assets and the Company and its subsidiary banks purchased Lockhart commercial paper and held it on their balance sheets. The Company was also required to purchase securities fromassets under the Liquidity Agreement due to security ratings downgrades and the inability of Lockhart to provide fundsissue commercial paper. See “Off-Balance Sheet Arrangement” beginning on page 96 for it to repay maturinginformation about Lockhart and the Liquidity Agreement. This includes details of the purchase of commercial paper upon Lockhart’s inabilityand securities and the possible effect on the Company’s liquidity and capital ratios if Lockhart was required to accessbe consolidated or the commercial paper market, or upon a commercial paper market disruption, as specifiedCompany was required to purchase its remaining securities. In November, 2008, Lockhart also diversified its funding sources by electing to participate in the governing documents of Lockhart. In addition, pursuant to the governing documents, including the Liquidity Facility, if any security in Lockhart is downgraded below AA-, Zions Bank must either 1) place its letter of credit on the security, 2) obtain a credit enhancement on the security from a third party, or 3) purchase the security from Lockhart at book value. At any given time, the maximum commitment of Zions Bank is the book value of Lockhart’s securities portfolio, which is not allowed to exceed the size of the Liquidity Facility.
At December 31, 2006, the book value of Lockhart’s securities portfolio was $4.1 billion, which approximated market value,Federal Reserve’s CPFF program, and the size of the Liquidity Facility commitment was $6.12 billion. No amounts were outstanding under this Liquidity Facility at December 31, 2006 or December 31, 2005. Lockhart is limited in size by program agreements and by the size of the Liquidity Facility.
In June 20052008 had $80 million outstanding under the Liquidity Facility contract, Zions Bank repurchased for the first time a bond from Lockhart at its book value of $12.4 million because of a rating downgrade. Zions Bank recognized an impairment loss of $1.6 million, which was included in fixed income securities gains (losses) for 2005. In June 2006, this security was sold and Zions Bank recovered $0.8 million of the loss.program. The CPFF program currently is scheduled to terminate on October 31, 2009.
The FASB has recently issued two accounting pronouncements that amend SFAS No. 140,Accounting for Transfers and Servicing of Financial Assets and Extinguishments of Liabilities.These amendments did not impact the operating activities of Lockhart; however other proposals to further amend SFAS No. 140 may require changes to the operating activities of QSPEs and other aspects relating to the transfer of financial assets. As a result of these proposals, Lockhart’s operations may need to be modified to preserve its off-balance sheet status. Further discussion of Lockhart can be found in the section entitled “Off-Balance-Sheet Arrangements” on page 76 and in Note 6 of the Notes to Consolidated Financial Statements.
While not considered a primary source of funding, the Company’s investment activities can also provide or use cash, depending on the asset-liability management posture that is being observed. For 2006,2008, investment securities activities resulted in net cash inflows of $229 million.
$0.8 billion.
Maturing balances in the various loan portfolios also provide additional flexibility in managing cash flows. In most cases, however, loan growth has resulted in net cash outflows from a funding standpoint. For 2006,2008, loan growth resulted in a net cash outflow of $4.9$2.5 billion as compared to $3.6$3.9 billion in 2005.2007. We expect that loans will continue to be a use of funding rather than a source in 2007.2009.
Operational Risk Management
Operational risk is the potential for unexpected losses attributable to human error, systems failures, fraud, or inadequate internal controls and procedures. In its ongoing efforts to identify and manage operational risk, the Company has created an Operatinga Corporate Risk Management Group,Department whose responsibility is to help Company management identify and assess key risks and monitor the key internal controls and processes that the Company has in place to mitigate operational risk. We have documented controls and the Control Self Assessment related to financial reporting under Section 404 of the Sarbanes-Oxley Act of 2002 and the Federal Deposit Insurance Corporation Improvement Act of 1991.
To manage and minimize its operating risk, the Company has in place transactional documentation requirements, systems and procedures to monitor transactions and positions, regulatory compliance reviews, and periodic reviews by the Company’s internal audit and credit examination departments. In addition, reconciliation procedures have been established to ensure that data processing systems consistently and accurately capture critical data. Further, we maintain contingency plans and systems for operations support in the event of natural or other disasters. We expect to continue effortsEfforts are continually underway to improve the Company’s oversight of operational risk, in 2007.
including enhancement of risk-control self assessments and of antifraud measures.
CAPITAL MANAGEMENT
The Board of Directors is responsible for approving the policies associated with capital management. The Board has established the Capital Management Committee (“CMC”) whose primary responsibility is to recommend and administer the approved capital policies that govern the capital management of the Company.Company and its subsidiary banks. Other major CMC responsibilities include:
Setting overall capital targets within the Board approved policy, monitoring performance and recommending changes to capital including dividends, common stock repurchases, subordinated debt, or to major strategies to maintain the Company and its bank subsidiaries at well capitalized levels; and
Reviewing agency ratings of the Parent and its bank subsidiaries and establishing target ratings.
The CMC, in managing the capital of the Company, may set capital standards that are higher than those approved by the Board, but may not set lower limits.
The Company has a fundamental financial objective to consistently produce superior risk-adjusted returns on its shareholders’ capital. We believe that a strong capital position is vital to continued profitability and to promoting depositor and investor confidence. Specifically, it is the policy of the Parent and each of the subsidiary banks to:
Maintain sufficient capital at not less than the “well capitalized” threshold as defined by federal banking regulators to support current needs and to ensure that capital is available to support anticipated growth;
Take into account the desirability of receiving an “investment grade” rating from major debt rating agencies on senior and subordinated unsecured debt when setting capital levels;
Develop capabilities to measure and manage capital on a risk-adjusted basis and to maintain economic capital consistent with an “investment grade” risk level; and
Return excess capital to shareholders through dividends and repurchases of common stock.
See Note 19 of the Notes to Consolidated Financial Statements for additional information on risk-based capital.
During 2008, the Company took several actions to raise additional capital in order to maintain a strong capital position as follows:
ItOn November 14, 2008, the Company received a capital investment of $1.4 billion from the U.S. Department of the Treasury under the Treasury’s Capital Purchase Program announced on October 14, 2008. The capital investment is our belief that capital not considered necessary to support current and anticipated business should be returnedin the form of nonvoting senior preferred shares pari passu with the Company’s existing preferred shares. The Company also issued to the Company’s shareholders through dividends and repurchases of its shares.
In December 2006, the Company resumed its stock repurchase plan, which had been suspended since July 2005 becauseTreasury warrants exercisable for 10 years to purchase 5,789,909 of the Amegy acquisition. The Board authorized a $400 million repurchase program. The Company repurchased and retired 308,359 shares of itsCompany’s common stock in 2006 at a total cost of $25.0 million and an average per share price of $81.05 under this share repurchase authorization. In 2005, common stock repurchases under repurchase plans totaled 1,159,522 shares at a total exercise cost of $80.7$210 million. The preferred shares qualify for regulatory Tier 1 capital and may be redeemed at any time that regulatory approval can be obtained. They have a dividend rate of 5% for the first five years, increasing to 9% thereafter. Among other things, the Company is subject to restrictions and conditions including those related to common dividends, share repurchases, executive compensation, and corporate governance. The Company expects to deploy this new capital mainly to support prudent new lending in its markets throughout the western United States; it may also pursue the acquisition of failed banks being offered by the FDIC.
During September 8-11, 2008, the Company issued $250 million of new common stock consisting of 7,194,079 shares at an average price of $34.75 per share. Net of issuance costs and fees, this added $244.9 million to common equity.
• | On July 2, 2008, the Company completed a $47 million offering of 9.50% Series C Fixed-Rate Non-Cumulative Perpetual Preferred Stock. The Company issued 46,949 shares in the form of 1,877,971 depositary shares with each depositary share representing a 1/40th ownership interest in a share of the preferred stock. Terms and conditions, except for the dividend amount, are generally similar to the existing $240 million Series A floating rate preferred stock issued in December 2006. The offering was sold via Zions’ online auction process and direct sales primarily by the Company’s broker/dealer subsidiary. |
These actions increased total shareholders’ equity at December 31, 2008 to $6.5 billion, an increase of 22.8% over the $5.3 billion at December 31, 2007. Tangible equity, including preferred stock, was $4.7 billion at the end of 2008 and $3.1 billion at the end of 2007. Tangible common equity was $3.1 billion, an increase of 8.6% from $2.9 billion at year-end 2007.
As of December 31, 2008, the Company had $56.3 million of remaining authorization from its Board of Directors for the repurchase of common stock. The Company has not repurchased any shares since August 2007 and in 2004 repurchases were 1,734,055compliance with the conditions of the Capital Purchase Program, the Company will not repurchase any common shares at a costduring the period the senior preferred shares are outstanding without permission from the U.S. Department of $104.9 million. The Company also repurchased $1.5 million of shares related to the Company’s restricted stock employee compensation program in both 2006 and 2005.Treasury.
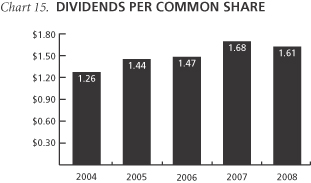
During its January 20072009 meeting, the Board of Directors declared a dividend of $0.39$0.04 per common share payable on February 21, 200725, 2009 to shareholders of record on February 7, 2007.11, 2009. This is a reduction from the prior quarter dividend of $0.32 per common share. The Company paid dividends in 20062008 of $1.47$1.61 per common share compared with $1.44 and $1.26$1.68 per share in 20052007 and 2004, respectively.
In 2006,$1.47 per share in 2006. Under the terms of the Capital Purchase Program, the Company paid $157.0 million inmay not increase the dividend on its common stock dividends and used $26.5 million to repurchase common stockabove $0.32 per share per quarter during the period the senior preferred shares are outstanding without permission from the U.S. Department of the Company. In total, we returned to shareholders $183.5 million out of total net income of $583.1 million or 31.5%. Treasury.
The Company paid $130.3$173.9 million in dividends on common stock dividends in 2005,2008, and used $82.2$2.9 million to repurchase shares of the Company’s common stock. In total, we returned to shareholders $212.5 million out of total net income of $480.1 million, or 44.3%.
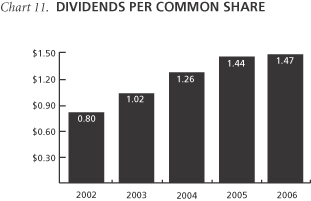
Total shareholders’ equity at December 31, 2006 increased to $5.0 billion, an increase of 17.7% over the $4.2 billion at December 31, 2005, resulting mainly from retained earnings and the issuance of preferred stock. Tangible equity was $2.9 billion at the end of 2006 and $2.2 billion at the end of 2005.
On December 7, 2006 the Company issued $240 million of Depositary Shares. The 9,600,000 Depositary Shares each represent a 1/40th ownership interest in a share of Series A Floating-Rate Non-Cumulative Perpetual Preferred Stock. The issuance was priced at an annual rate equal to the greater of three-month LIBOR plus 0.52%, or 4%. The Series A Preferred Stock is not redeemable prior to December 15, 2011. On and after that date, the Series A Preferred Stock will be redeemable, in whole at any time or in part from time to time, at a redemption price equal to $1,000 per share (equivalent to $25 per depositary share), plus any declared and unpaid dividends, without accumulation of any undeclared dividends.
The Company declared arecorded preferred stock dividenddividends of $3.8$24.4 million in December 2006during 2008 compared to $14.3 million during 2007.
The Company has not stated target capital ratio levels for the quarterly dividendperiod when more normal financial conditions resume, but has stated 1) that its long-term target range is likely to be paidhigher than the previously articulated tangible equity target range of 6.25% to shareholders on March 15, 2007. Under6.50%, and 2) that during current distressed financial market and economic conditions, the terms of the Zions Series A Preferred Stock, this dividend had to be declared and funds set aside to pay the dividend before Zions could begin repurchasing common shares under the $400 million repurchase authorization announced on December 11, 2006.
Company believes that maintaining capital ratios above that range is appropriate. The Company’s capital ratios were as follows at December 31, 20062008 and 2005:2007:
Schedule 48
CAPITAL RATIOS
SCHEDULE 45
| December 31, | Percentage required to be well capitalized | ||||||||
| 2008 | 2007 | ||||||||
Tangible common equity ratio | 5.89 | % | 5.70 | % | na | ||||
Tangible equity ratio | 8.86 | 6.17 | na | ||||||
Average equity to average assets | 10.30 | 10.74 | na | ||||||
Risk-based capital ratios: | |||||||||
Tier 1 leverage | 9.99 | 7.37 | na | 1 | |||||
Tier 1 risk-based capital | 10.22 | 7.57 | 6.00 | % | |||||
Total risk-based capital | 14.32 | 11.68 | 10.00 | ||||||
CAPITAL RATIOS
| December 31, | Percentage required to be well capitalized | |||||
| 2006 | 2005 | |||||
Tangible equity ratio | 6.51% | 5.28% | na | |||
Tangible common equity ratio | 5.98 | 5.28 | na | |||
Average equity to average assets | 10.19 | 9.01 | na | |||
Risk-based capital ratios: | ||||||
Tier 1 leverage | 7.86 | 8.16 | 5.00% | |||
Tier 1 risk-based capital | 7.98 | 7.52 | 6.00 | |||
Total risk-based capital | 12.29 | 12.23 | 10.00 | |||
1 | There is no Tier 1 leverage ratio component in the definition of a well capitalized bank holding company. |
The increased tangible equity ratiocapital ratios at December 31, 2006 reflects2008 compared to December 31, 2007, reflect the impact of the perpetualissuance of common and preferred stock issuance previously discussed. The increasesduring the year offset by loan growth, increased after tax unrealized losses of $135.2 million on investment securities included in the capital ratios reflect the increased earnings for 2006OCI, and the suspensionnet loss applicable to common shareholders for 2008. The Parent and its subsidiary banks are required to maintain adequate levels of capital as measured by several regulatory capital ratios. As of December 31, 2008, the Company’s share repurchase programs for mostCompany and each of 2006.
its subsidiary banks exceeded the “well capitalized” guidelines under regulatory standards.
The U.S. federal bank regulatory agencies’ risk-capital guidelines are based upon the 1988 capital accord (“Basel I”) of the Basel Committee on Banking Supervision (the “BCBS”). The BCBS is a committee of central banks and bank supervisors/regulators from the major industrialized countries that develops broad policy guidelines that each country’s supervisors can use to determine the supervisory policies they apply. In January 2001, the BCBS released a proposal to replace Basel I with a new capital framework (“Basel II”) that would set capital requirements for operational risk and materially change the existing capital requirements for credit risk and market risk exposures. Operational risk is defined by the proposal as the risk of direct or indirect loss resulting from inadequate or failed internal processes, people and systems, or from external events. Basel I does not include separate capital requirements for operational risk.
In September 2006, the U.S. banking regulators issued an interagency Advance Notice of Proposed Rulemaking (“NPR”) with regard to the U.S. implementation of the Basel II framework. Final rules are expected to be published by mid-year 2007. The regulators have previously stated that approximatelyPublished in December 2007, the ten largest U.S. bank holding companies will be requiredfinal rule requires banks with over $250 billion in consolidated total assets or on-balance sheet foreign exposure of $10 billion (core banks) to adopt the new standard, and that others mayAdvanced Approach of Basel II while allowing other banks to elect to “opt in.” We doare not currently expect to be an early “opt in” bank holding company, as the Company does not have in place the data collection and analytical capabilities necessary to adopt Basel II.the Advanced Approach. However, we believe that the competitive advantages afforded to companies that do adopt the frameworkAdvanced Approach may make it necessary for the Company to elect to “opt in” at some point, and we have begun investing in the required capabilities and required data. Whether or not this scenario emerges, our risk management will be well served by our continuing investment in more sophisticated analytical capabilities and in an enhanced data environment.
Also, in December 2006,In July 2008, the U.S. banking regulators issued another NPR for modificationsa proposed rule that would provide “noncore” banks with the option to adopt the Standardized Approach proposed in Basel IA framework for those banks not adoptingII, replacing the previously proposed Basel II. The regulatory agencies1A framework. While the Advanced Approach uses sophisticated mathematical models to measure and assign capital to specific risks, the Standardized Approach categorizes risks by type and then assigns capital requirements. We are currently evaluating the numerous comments received on this proposal, which is commonly referredbenefit of adopting the Standardized Approach.
However, in the near-term we believe that capital issued under the CPP and the potential for capital to as Basel IA. As proposed, Basel IA would appearbe issued after a regulatory “stress test” administered pursuant to narrow somewhat the regulatory capital disparities betweenARRA may override any consideration of any Basel II and the existing Basel I framework for some lines of business. However, given the Company’s mix of business, it does not expect to derive a significant capital benefit if Basel IA is adopted substantially as proposed.approach.
ITEM 7A.QUANTITATIVE AND QUALITATIVE DISCLOSURES ABOUT MARKET RISK
| ITEM 7A. | QUANTITATIVE AND QUALITATIVE DISCLOSURES ABOUT MARKET RISK |
Information required by this Item is included in “Interest Rate and Market Risk Management” in MD&A beginning on page 86110 and is hereby incorporated by reference.
ITEM 8. FINANCIAL STATEMENTS AND SUPPLEMENTARY DATA
| ITEM 8. | FINANCIAL STATEMENTS AND SUPPLEMENTARY DATA |
REPORT ON MANAGEMENT’S ASSESSMENT OF INTERNAL CONTROL OVER FINANCIAL REPORTING
The management of Zions Bancorporation and subsidiaries (“the Company”) is responsible for establishing and maintaining adequate internal control over financial reporting for the Company as defined by Exchange Act Rules 13a-15 and 15d-15.
The Company’s management has used the criteria established inInternal Control – Integrated Framework issued by the Committee of Sponsoring Organizations of the Treadway Commission (“COSO”) to evaluate the effectiveness of the Company’s internal control over financial reporting.
The Company’s management has assessed the effectiveness of the Company’s internal control over financial reporting as of December 31, 20062008 and has concluded that such internal control over financial reporting is effective. There are no material weaknesses in the Company’s internal control over financial reporting that have been identified by the Company’s management.
Ernst & Young LLP, an independent registered public accounting firm, has audited the consolidated financial statements of the Company for the year ended December 31, 2006,2008, and has also issued an attestation report, which is included herein, on internal control over financial reporting under Auditing Standard No. 25 of the Public Company Accounting Oversight Board (“PCAOB”).
REPORTS OF INDEPENDENT REGISTERED PUBLIC ACCOUNTING FIRM
REPORT ON INTERNAL CONTROL OVER FINANCIAL REPORTING
Audit Committee of the Board of Directors and Shareholders of Zions Bancorporation
We have audited management’s assessment, included in the accompanying Report on Management’s Assessment of Internal Control over Financial Reporting, that Zions Bancorporation and subsidiaries maintained effectivesubsidiaries’ internal control over financial reporting as of December 31, 2006,2008, based on criteria established in Internal Control – Integrated Framework issued by the Committee of Sponsoring Organizations of the Treadway Commission (the COSO criteria). Zions Bancorporation and subsidiaries’ management is responsible for maintaining effective internal control over financial reporting and for its assessment of the effectiveness of internal control over financial reporting.reporting included in the accompanying Report on Management’s Assessment of Internal Control over Financial Reporting. Our responsibility is to express an opinion on management’s assessment and an opinion on the effectiveness of the company’s internal control over financial reporting based on our audit.
We conducted our audit in accordance with the standards of the Public Company Accounting Oversight Board (United States). Those standards require that we plan and perform the audit to obtain reasonable assurance about whether effective internal control over financial reporting was maintained in all material respects. Our audit included obtaining an understanding of internal control over financial reporting, evaluating management’s assessment,assessing the risk that a material weakness exists, testing and evaluating the design and operating effectiveness of internal control based on the assessed risk, and performing such other procedures as we considered necessary in the circumstances. We believe that our audit provides a reasonable basis for our opinion.
A company’s internal control over financial reporting is a process designed to provide reasonable assurance regarding the reliability of financial reporting and the preparation of financial statements for external purposes in accordance with generally accepted accounting principles. Because management’s assessment and our audit were conducted to also meet the reporting requirements of Section 112 of the Federal Deposit Insurance Corporation Improvement Act (FDICIA), management’s assessment and our audit of Zions Bancorporation and subsidiaries’ internal control over financial reporting included controls over the preparation of financial statements in accordance with the instructions for the preparation of Consolidated Financial Statements for Bank Holding Companies (Form FR Y-9C). A company’s internal control over financial reporting includes those policies and procedures that (1) pertain to the maintenance of records that, in reasonable detail, accurately and fairly reflect the transactions and dispositions of the assets of the company; (2) provide reasonable assurance that transactions are recorded as necessary to permit preparation of financial statements in accordance with generally accepted accounting principles, and that receipts and expenditures of the company are being made only in accordance with authorizations of management and directors of the company; and (3) provide reasonable assurance regarding prevention or timely detection of unauthorized acquisition, use, or disposition of the company’s assets that could have a material effect on the financial statements.
Because of its inherent limitations, internal control over financial reporting may not prevent or detect misstatements. Also, projections of any evaluation of effectiveness to future periods are subject to the risk that controls may become inadequate because of changes in conditions, or that the degree of compliance with the policies or procedures may deteriorate.
In our opinion, management’s assessment that Zions Bancorporation and subsidiaries maintained effective internal control over financial reporting as of December 31, 2006, is fairly stated, in all material respects, based on the COSO criteria. Also, in our opinion, Zions Bancorporation and subsidiaries maintained, in all material respects, effective internal control over financial reporting as of December 31, 2006,2008, based on the COSO criteria.
criteria.
We also have audited, in accordance with the standards of the Public Company Accounting Oversight Board (United States), the consolidated balance sheets of Zions Bancorporation and subsidiaries as of December 31, 20062008 and 2005,2007 and the related consolidated statements of income, changes in shareholders’ equity and comprehensive income, and cash flows for each of the three years in the period ended December 31, 20062008 and our report dated February 28, 200727, 2009 expressed an unqualified opinion thereon.
/s/ ERNST & YOUNG LLP |
Salt Lake City, Utah
February 28, 200727, 2009
REPORT ON CONSOLIDATED FINANCIAL STATEMENTS
Audit Committee of the Board of Directors and Shareholders of Zions Bancorporation
We have audited the accompanying consolidated balance sheets of Zions Bancorporation and subsidiaries as of December 31, 20062008 and 2005,2007, and the related consolidated statements of income, changes in shareholders’ equity and comprehensive income, and cash flows for each of the three years in the period ended December 31, 2006.2008. These financial statements are the responsibility of the Company’s management. Our responsibility is to express an opinion on these financial statements based on our audits.
We conducted our audits in accordance with the standards of the Public Company Accounting Oversight Board (United States). Those standards require that we plan and perform the audit to obtain reasonable assurance about whether the financial statements are free of material misstatement. An audit includes examining, on a test basis, evidence supporting the amounts and disclosures in the financial statements. An audit also includes assessing the accounting principles used and significant estimates made by management, as well as evaluating the overall financial statement presentation. We believe that our audits provide a reasonable basis for our opinion.
In our opinion, the financial statements referred to above present fairly, in all material respects, the consolidated financial position of Zions Bancorporation and subsidiaries at December 31, 20062008 and 2005,2007, and the consolidated results of their operations and their cash flows for each of the three years in the period ended December 31, 2006,2008, in conformity with U.S. generally accepted accounting principles.
As discussed in Notes 1 14, and 1715 to the financial statements, during 2006 Zions Bancorporation and subsidiaries adopted FASB Interpretation No. 48,Accounting for Uncertainty in Income Taxes, an interpretation of FASB Statement of Financial Accounting Standards No. 123(R),Share-Based Payment.109,during 2007.
We also have audited, in accordance with the standards of the Public Company Accounting Oversight Board (United States), the effectiveness of Zions Bancorporation and subsidiaries’ internal control over financial reporting as of December 31, 2006,2008, based on the criteria established in Internal Control – IntegratedControl-Integrated Framework issued by the Committee of Sponsoring Organizations of the Treadway Commission and our report dated February 28, 200727, 2009 expressed an unqualified opinion thereon.
/s/ ERNST & YOUNG LLP |
Salt Lake City, Utah
February 28, 200727, 2009
ZIONS BANCORPORATION AND SUBSIDIARIES
DECEMBER 31, 2008 AND 2007
| (In thousands, except share amounts) | 2008 | 2007 | |||||
ASSETS | |||||||
Cash and due from banks | $ | 1,475,976 | 1,855,155 | ||||
Money market investments: | |||||||
Interest-bearing deposits and commercial paper | 2,332,759 | 726,446 | |||||
Federal funds sold | 83,451 | 102,225 | |||||
Security resell agreements | 286,707 | 671,537 | |||||
Investment securities: | |||||||
Held-to-maturity, at adjusted cost (approximate fair value $1,443,555 and $702,148) | 1,790,989 | 704,441 | |||||
Available-for-sale, at fair value | 2,676,255 | 5,134,610 | |||||
Trading account, at fair value (includes $538 and $741 transferred as collateral | 42,064 | 21,849 | |||||
| 4,509,308 | 5,860,900 | ||||||
Loans: | |||||||
Loans held for sale | 200,318 | 207,943 | |||||
Loans and leases | 41,791,237 | 39,044,163 | |||||
| 41,991,555 | 39,252,106 | ||||||
Less: | |||||||
Unearned income and fees, net of related costs | 132,499 | 164,327 | |||||
Allowance for loan losses | 686,999 | 459,376 | |||||
Loans and leases, net of allowance | 41,172,057 | 38,628,403 | |||||
Other noninterest-bearing investments | 1,044,092 | 1,034,412 | |||||
Premises and equipment, net | 687,096 | 655,712 | |||||
Goodwill | 1,651,377 | 2,009,513 | |||||
Core deposit and other intangibles | 125,935 | 149,493 | |||||
Other real estate owned | 191,792 | 15,201 | |||||
Other assets | 1,532,241 | 1,238,417 | |||||
| $ | 55,092,791 | 52,947,414 | |||||
LIABILITIES AND SHAREHOLDERS’ EQUITY | |||||||
Deposits: | |||||||
Noninterest-bearing demand | $ | 9,683,385 | 9,618,300 | ||||
Interest-bearing: | |||||||
Savings and NOW | 4,452,919 | 4,507,837 | |||||
Money market | 16,826,846 | 12,467,239 | |||||
Time under $100,000 | 2,974,566 | 2,562,363 | |||||
Time $100,000 and over | 4,756,218 | 4,391,588 | |||||
Foreign | 2,622,562 | 3,375,426 | |||||
| 41,316,496 | 36,922,753 | ||||||
Securities sold, not yet purchased | 35,657 | 224,269 | |||||
Federal funds purchased | 965,835 | 2,463,460 | |||||
Security repurchase agreements | 899,751 | 1,298,112 | |||||
Other liabilities | 669,111 | 644,375 | |||||
Commercial paper | 15,451 | 297,850 | |||||
Federal Home Loan Bank advances and other borrowings: | |||||||
One year or less | 2,039,853 | 3,181,990 | |||||
Over one year | 128,253 | 127,612 | |||||
Long-term debt | 2,493,368 | 2,463,254 | |||||
Total liabilities | 48,563,775 | 47,623,675 | |||||
Minority interest | 27,320 | 30,939 | |||||
Shareholders’ equity: | |||||||
Preferred stock | 1,581,834 | 240,000 | |||||
Common stock, without par value; authorized 350,000,000 shares; issued and | 2,599,916 | 2,212,237 | |||||
Retained earnings | 2,433,363 | 2,910,692 | |||||
Accumulated other comprehensive income (loss) | (98,958 | ) | (58,835 | ) | |||
Deferred compensation | (14,459 | ) | (11,294 | ) | |||
Total shareholders’ equity | 6,501,696 | 5,292,800 | |||||
| $ | 55,092,791 | 52,947,414 | |||||
CONSOLIDATED BALANCE SHEETS
DECEMBER 31, 2006 AND 2005
(In thousands, except share amounts)
| 2006 | 2005 | |||
ASSETS | |||||
Cash and due from banks | $ | 1,938,810 | 1,706,590 | ||
Money market investments: | |||||
Interest-bearing deposits | 43,203 | 22,179 | |||
Federal funds sold | 55,658 | 414,281 | |||
Security resell agreements | 270,415 | 230,282 | |||
Investment securities: | |||||
Held to maturity, at cost (approximate market value $648,828 and $642,258) | 653,124 | 649,791 | |||
Available for sale, at market | 5,050,907 | 5,305,859 | |||
Trading account, at market (includes $34,494 and $43,444 transferred as | 63,436 | 101,562 | |||
| 5,767,467 | 6,057,212 | ||||
Loans: | |||||
Loans held for sale | 252,818 | 256,236 | |||
Loans and leases | 34,566,118 | 29,996,022 | |||
| 34,818,936 | 30,252,258 | ||||
Less: | |||||
Unearned income and fees, net of related costs | 151,380 | 125,322 | |||
Allowance for loan losses | 365,150 | 338,399 | |||
Loans and leases, net of allowance | 34,302,406 | 29,788,537 | |||
Other noninterest-bearing investments | 1,022,383 | 938,515 | |||
Premises and equipment, net | 609,472 | 564,745 | |||
Goodwill | 1,900,517 | 1,887,588 | |||
Core deposit and other intangibles | 162,134 | 199,166 | |||
Other real estate owned | 9,250 | 19,966 | |||
Other assets | 888,511 | 950,578 | |||
| $ | 46,970,226 | 42,779,639 | |||
LIABILITIES AND SHAREHOLDERS’ EQUITY | |||||
Deposits: | |||||
Noninterest-bearing demand | $ | 10,010,310 | 9,953,833 | ||
Interest-bearing: | |||||
Savings and money market | 15,858,887 | 16,055,754 | |||
Time under $100,000 | 2,257,967 | 1,938,789 | |||
Time $100,000 and over | 4,302,056 | 2,514,596 | |||
Foreign | 2,552,526 | 2,179,436 | |||
| 34,981,746 | 32,642,408 | ||||
Securities sold, not yet purchased | 50,416 | 64,654 | |||
Federal funds purchased | 1,993,483 | 1,255,662 | |||
Security repurchase agreements | 934,057 | 1,027,658 | |||
Other liabilities | 747,499 | 592,599 | |||
Commercial paper | 220,507 | 167,188 | |||
Federal Home Loan Bank advances and other borrowings: | |||||
One year or less | 517,925 | 18,801 | |||
Over one year | 137,058 | 234,488 | |||
Long-term debt | 2,357,721 | 2,511,366 | |||
Total liabilities | 41,940,412 | 38,514,824 | |||
Minority interest | 42,791 | 27,551 | |||
Shareholders’ equity: | |||||
Capital stock: | |||||
Preferred stock, without par value, authorized 3,000,000 shares: | |||||
Series A (liquidation preference $1,000 per share); issued and outstanding 240,000 shares | 240,000 | – | |||
Common stock, without par value; authorized 350,000,000 shares; issued and outstanding 106,720,884 and 105,147,562 shares | 2,230,303 | 2,156,732 | |||
Retained earnings | 2,602,189 | 2,179,885 | |||
Accumulated other comprehensive loss | (75,849) | (83,043) | |||
Deferred compensation | (9,620) | (16,310) | |||
Total shareholders’ equity | 4,987,023 | 4,237,264 | |||
| $ | 46,970,226 | 42,779,639 | |||
See accompanying notes to consolidated financial statements.
CONSOLIDATED STATEMENTS OF INCOME
ZIONS BANCORPORATION AND SUBSIDIARIES
CONSOLIDATED STATEMENTS OF INCOME
YEARS ENDED DECEMBER 31, 2006, 20052008, 2007 AND 20042006
(In thousands, except per share amounts)
| 2006 | 2005 | 2004 | 2008 | 2007 | 2006 | ||||||||||
Interest income: | ||||||||||||||||
Interest and fees on loans | $ | 2,438,324 | 1,595,916 | 1,229,721 | $ | 2,646,112 | 2,823,382 | 2,438,324 | ||||||||
Interest on loans held for sale | 16,442 | 9,814 | 5,038 | 10,074 | 14,867 | 16,442 | ||||||||||
Lease financing | 18,290 | 16,079 | 16,839 | 22,099 | 21,683 | 18,290 | ||||||||||
Interest on money market investments | 24,714 | 31,682 | 16,355 | 47,780 | 43,699 | 24,714 | ||||||||||
Interest on securities: | ||||||||||||||||
Held to maturity – taxable | 8,861 | 7,331 | 5,467 | |||||||||||||
Held to maturity – nontaxable | 22,909 | 24,005 | 18,742 | |||||||||||||
Available for sale – taxable | 272,252 | 201,628 | 160,621 | |||||||||||||
Available for sale – nontaxable | 8,630 | 3,931 | 9,062 | |||||||||||||
Held-to-maturity – taxable | 62,282 | 8,997 | 8,861 | |||||||||||||
Held-to-maturity – nontaxable | 25,368 | 25,150 | 22,909 | |||||||||||||
Available-for-sale – taxable | 151,139 | 255,039 | 272,252 | |||||||||||||
Available-for-sale – nontaxable | 7,170 | 9,200 | 8,630 | |||||||||||||
Trading account | 7,699 | 19,870 | 29,615 | 1,875 | 3,309 | 7,699 | ||||||||||
Total interest income | 2,818,121 | 1,910,256 | 1,491,460 | 2,973,899 | 3,205,326 | 2,818,121 | ||||||||||
Interest expense: | ||||||||||||||||
Interest on savings and money market deposits | 405,269 | 220,604 | 121,189 | 370,568 | 479,366 | 405,269 | ||||||||||
Interest on time and foreign deposits | 315,569 | 119,720 | 61,177 | 342,325 | 472,353 | 315,569 | ||||||||||
Interest on short-term borrowings | 164,335 | 92,149 | 62,311 | 178,875 | 218,696 | 164,335 | ||||||||||
Interest on long-term debt | 168,224 | 116,433 | 85,965 | |||||||||||||
Interest on long-term borrowings | 110,485 | 152,959 | 168,224 | |||||||||||||
Total interest expense | 1,053,397 | 548,906 | 330,642 | 1,002,253 | 1,323,374 | 1,053,397 | ||||||||||
Net interest income | 1,764,724 | 1,361,350 | 1,160,818 | 1,971,646 | 1,881,952 | 1,764,724 | ||||||||||
Provision for loan losses | 72,572 | 43,023 | 44,067 | 648,269 | 152,210 | 72,572 | ||||||||||
Net interest income after provision for loan losses | 1,692,152 | 1,318,327 | 1,116,751 | 1,323,377 | 1,729,742 | 1,692,152 | ||||||||||
Noninterest income: | ||||||||||||||||
Service charges and fees on deposit accounts | 166,644 | 128,796 | 131,683 | 206,988 | 183,550 | 160,774 | ||||||||||
Loan sales and servicing income | 54,193 | 77,822 | 79,081 | |||||||||||||
Other service charges, commissions and fees | 166,824 | 111,268 | 93,617 | 167,669 | 170,564 | 150,204 | ||||||||||
Trust and wealth management income | 27,511 | 21,850 | 27,966 | 37,752 | 36,532 | 29,970 | ||||||||||
Capital markets and foreign exchange | 49,898 | 43,588 | 39,444 | |||||||||||||
Dividends and other investment income | 46,362 | 50,914 | 39,918 | |||||||||||||
Loan sales and servicing income | 24,379 | 38,503 | 54,193 | |||||||||||||
Income from securities conduit | 32,206 | 34,966 | 35,185 | 5,502 | 18,176 | 32,206 | ||||||||||
Dividends and other investment income | 39,918 | 30,040 | 31,812 | |||||||||||||
Market making, trading and nonhedge derivative income | 18,501 | 15,714 | 17,565 | |||||||||||||
Equity securities gains (losses), net | 17,841 | (1,312) | (9,765) | |||||||||||||
Fair value and nonhedge derivative income (loss) | (47,976 | ) | (14,256 | ) | 620 | |||||||||||
Equity securities gains, net | 793 | 17,719 | 17,841 | |||||||||||||
Fixed income securities gains, net | 6,416 | 845 | 2,510 | 849 | 3,019 | 6,416 | ||||||||||
Impairment losses on investment securities and valuation losses | (317,112 | ) | (158,208 | ) | – | |||||||||||
Other | 21,155 | 16,964 | 21,821 | 15,588 | 22,243 | 19,623 | ||||||||||
Total noninterest income | 551,209 | 436,953 | 431,475 | 190,692 | 412,344 | 551,209 | ||||||||||
Noninterest expense: | ||||||||||||||||
Salaries and employee benefits | 751,679 | 573,902 | 531,303 | 810,501 | 799,884 | 751,679 | ||||||||||
Occupancy, net | 99,607 | 77,393 | 73,716 | 114,175 | 107,438 | 99,607 | ||||||||||
Furniture and equipment | 88,725 | 68,190 | 65,781 | 100,136 | 96,452 | 88,725 | ||||||||||
Other real estate expense | 50,378 | 4,391 | 107 | |||||||||||||
Legal and professional services | 40,134 | 34,804 | 32,390 | 45,517 | 43,829 | 40,134 | ||||||||||
Postage and supplies | 33,076 | 26,839 | 25,679 | 37,455 | 36,512 | 33,076 | ||||||||||
Advertising | 26,465 | 21,364 | 19,747 | 30,731 | 26,920 | 26,465 | ||||||||||
Debt extinguishment cost | 7,261 | – | – | |||||||||||||
FDIC premiums | 19,858 | 6,514 | 5,429 | |||||||||||||
Impairment losses on long-lived assets | 1,304 | 3,133 | 712 | 3,134 | – | 1,304 | ||||||||||
Restructuring charges | 17 | 2,443 | 1,068 | |||||||||||||
Merger related expense | 20,461 | 3,310 | – | 1,608 | 5,266 | 20,461 | ||||||||||
Amortization of core deposit and other intangibles | 43,000 | 16,905 | 14,129 | 33,162 | 44,895 | 43,000 | ||||||||||
Provision for unfunded lending commitments | 1,248 | 3,425 | 467 | |||||||||||||
Other | 217,460 | 181,083 | 158,241 | 228,308 | 232,487 | 220,450 | ||||||||||
Total noninterest expense | 1,330,437 | 1,012,791 | 923,233 | 1,474,963 | 1,404,588 | 1,330,437 | ||||||||||
Impairment loss on goodwill | – | 602 | 602 | 353,804 | – | – | ||||||||||
Income before income taxes and minority interest | 912,924 | 741,887 | 624,391 | |||||||||||||
Income taxes | 317,950 | 263,418 | 220,126 | |||||||||||||
Income (loss) before income taxes and minority interest | (314,698 | ) | 737,498 | 912,924 | ||||||||||||
Income taxes (benefit) | (43,365 | ) | 235,737 | 317,950 | ||||||||||||
Minority interest | 11,849 | (1,652) | (1,722) | (5,064 | ) | 8,016 | 11,849 | |||||||||
Net income | 583,125 | 480,121 | 405,987 | |||||||||||||
Preferred stock dividend | 3,835 | – | – | |||||||||||||
Net income (loss) | (266,269 | ) | 493,745 | 583,125 | ||||||||||||
Preferred stock dividends | 24,424 | 14,323 | 3,835 | |||||||||||||
Net earnings applicable to common shareholders | $ | 579,290 | 480,121 | 405,987 | ||||||||||||
Net earnings (loss) applicable to common shareholders | $ | (290,693 | ) | 479,422 | 579,290 | |||||||||||
Weighted average common shares outstanding during the year: | ||||||||||||||||
Basic shares | 106,057 | 91,187 | 89,663 | 108,908 | 107,365 | 106,057 | ||||||||||
Diluted shares | 108,028 | 92,994 | 90,882 | 109,145 | 108,523 | 108,028 | ||||||||||
Net earnings per common share: | ||||||||||||||||
Net earnings (loss) per common share: | ||||||||||||||||
Basic | $ | 5.46 | 5.27 | 4.53 | $ | (2.67 | ) | 4.47 | 5.46 | |||||||
Diluted | 5.36 | 5.16 | 4.47 | (2.66 | ) | 4.42 | 5.36 | |||||||||
See accompanying notes to consolidated financial statements.
ZIONS BANCORPORATION AND SUBSIDIARIES
CONSOLIDATED STATEMENTS OF CHANGES IN SHAREHOLDERS’ EQUITY AND
COMPREHENSIVE INCOME
ZIONS BANCORPORATION AND SUBSIDIARIES
YEARS ENDED DECEMBER 31, 2006, 20052008, 2007 AND 20042006
Preferred stock | Common stock | Retained earnings | Accumulated income (loss) | Deferred compensation | Total equity | Preferred stock | Common stock | Retained earnings | Accumulated other comprehensive income (loss) | Deferred compensation | Total shareholders’ equity | |||||||||||||||||||||||||||
(In thousands, except share and per share amounts)
| Shares | Amount | ||||||||||||||||||||||||||||||||||||
Balance, December 31, 2003 | $ | – | 89,840,638 | $ | 985,904 | 1,538,677 | 19,041 | (3,599) | 2,540,023 | |||||||||||||||||||||||||||||
| (In thousands, except share and per share amounts) | Preferred stock | Shares | Amount | Retained earnings | Accumulated other comprehensive income (loss) | Deferred compensation | Total shareholders’ equity | |||||||||||||||||||||||||||||||
| $ | 105,147,562 | $ | 2,156,732 | 2,179,885 | (83,043 | (16,310 | ||||||||||||||||||||||||||||||||
Comprehensive income: | ||||||||||||||||||||||||||||||||||||||
Net income | 405,987 | 405,987 | 583,125 | 583,125 | ||||||||||||||||||||||||||||||||||
Other comprehensive loss, net of tax: | ||||||||||||||||||||||||||||||||||||||
Net realized and unrealized holding losses on investments and retained interests | (3,622) | |||||||||||||||||||||||||||||||||||||
Foreign currency translation | 803 | |||||||||||||||||||||||||||||||||||||
Reclassification for net realized gains on investments recorded in operations | (1,422) | |||||||||||||||||||||||||||||||||||||
Net unrealized losses on derivative instruments | (20,209) | |||||||||||||||||||||||||||||||||||||
Minimum pension liability | (2,523) | |||||||||||||||||||||||||||||||||||||
Other comprehensive loss | (26,973) | (26,973) | ||||||||||||||||||||||||||||||||||||
Total comprehensive income | 379,014 | |||||||||||||||||||||||||||||||||||||
Stock redeemed and retired | (1,734,055) | (104,881) | (104,881) | |||||||||||||||||||||||||||||||||||
Net stock options exercised | 1,723,364 | 91,042 | 91,042 | |||||||||||||||||||||||||||||||||||
Cash dividends on common stock, $1.26 per share | (114,600) | (114,600) | ||||||||||||||||||||||||||||||||||||
Change in deferred compensation | (619) | (619) | ||||||||||||||||||||||||||||||||||||
Balance, December 31, 2004 | – | 89,829,947 | 972,065 | 1,830,064 | (7,932) | (4,218) | 2,789,979 | |||||||||||||||||||||||||||||||
Comprehensive income: | ||||||||||||||||||||||||||||||||||||||
Net income | 480,121 | 480,121 | ||||||||||||||||||||||||||||||||||||
Other comprehensive loss, net of tax: | ||||||||||||||||||||||||||||||||||||||
Net realized and unrealized holding losses on investments and retained interests | (28,380) | |||||||||||||||||||||||||||||||||||||
Foreign currency translation | (1,507) | |||||||||||||||||||||||||||||||||||||
Reclassification for net realized gains on investments recorded in operations | (659) | |||||||||||||||||||||||||||||||||||||
Net unrealized losses on derivative instruments | (40,771) | |||||||||||||||||||||||||||||||||||||
Minimum pension liability | (3,794) | |||||||||||||||||||||||||||||||||||||
Other comprehensive loss | (75,111) | (75,111) | ||||||||||||||||||||||||||||||||||||
Total comprehensive income | 405,010 | |||||||||||||||||||||||||||||||||||||
Stock redeemed and retired | (1,178,880) | (82,211) | (82,211) | |||||||||||||||||||||||||||||||||||
Net stock options exercised and restricted stock issued | 2,001,876 | 113,290 | 113,290 | |||||||||||||||||||||||||||||||||||
Common and restricted stock issued and stock options assumed in acquisition | 14,494,619 | 1,153,588 | (3,906) | 1,149,682 | ||||||||||||||||||||||||||||||||||
Cash dividends on common stock, $1.44 per share | (130,300) | (130,300) | ||||||||||||||||||||||||||||||||||||
Change in deferred compensation | �� | (8,186) | (8,186) | |||||||||||||||||||||||||||||||||||
Balance, December 31, 2005 | – | 105,147,562 | 2,156,732 | 2,179,885 | (83,043) | (16,310) | 4,237,264 | |||||||||||||||||||||||||||||||
Comprehensive income: | ||||||||||||||||||||||||||||||||||||||
Net income | 583,125 | 583,125 | ||||||||||||||||||||||||||||||||||||
Other comprehensive income, net of tax: | ||||||||||||||||||||||||||||||||||||||
Other comprehensive income (loss), net of tax: | ||||||||||||||||||||||||||||||||||||||
Net realized and unrealized holding losses on investments and retained interests | (7,684) | (7,684 | ) | |||||||||||||||||||||||||||||||||||
Foreign currency translation | 715 | 715 | ||||||||||||||||||||||||||||||||||||
Reclassification for net realized gains on investments recorded in operations | (630) | (630 | ) | |||||||||||||||||||||||||||||||||||
Net unrealized gains on derivative instruments | 8,548 | 8,548 | ||||||||||||||||||||||||||||||||||||
Pension and postretirement | 6,245 | 6,245 | ||||||||||||||||||||||||||||||||||||
Other comprehensive income | 7,194 | 7,194 | 7,194 | 7,194 | ||||||||||||||||||||||||||||||||||
Total comprehensive income | 590,319 | 590,319 | ||||||||||||||||||||||||||||||||||||
Issuance of preferred stock | 240,000 | (4,167) | 235,833 | 240,000 | (4,167 | ) | 235,833 | |||||||||||||||||||||||||||||||
Stock redeemed and retired | (326,639) | (26,483) | (26,483) | (308,359 | ) | (24,994 | ) | (24,994 | ) | |||||||||||||||||||||||||||||
Net stock options exercised and restricted stock issued | 1,899,961 | 91,647 | 91,647 | |||||||||||||||||||||||||||||||||||
Net stock issued under employee plans and related tax benefits | 1,881,681 | 113,843 | 113,843 | |||||||||||||||||||||||||||||||||||
Reclassification of deferred compensation, adoption of SFAS 123R | (11,111) | 11,111 | – | (11,111 | ) | 11,111 | – | |||||||||||||||||||||||||||||||
Share-based compensation | 23,685 | 23,685 | ||||||||||||||||||||||||||||||||||||
Dividends declared on preferred stock | (3,835) | (3,835) | (3,835 | ) | (3,835 | ) | ||||||||||||||||||||||||||||||||
Cash dividends on common stock, $1.47 per share | (156,986) | (156,986) | (156,986 | ) | (156,986 | ) | ||||||||||||||||||||||||||||||||
Change in deferred compensation | (4,421) | (4,421) | (4,421 | ) | (4,421 | ) | ||||||||||||||||||||||||||||||||
Balance, December 31, 2006 | $ | 240,000 | 106,720,884 | $ | 2,230,303 | 2,602,189 | (75,849) | (9,620) | 4,987,023 | |||||||||||||||||||||||||||||
BALANCE, DECEMBER 31, 2006 | 240,000 | 106,720,884 | 2,230,303 | 2,602,189 | (75,849 | ) | (9,620 | ) | 4,987,023 | |||||||||||||||||||||||||||||
Cumulative effect of change in accounting principle, | 10,408 | 10,408 | ||||||||||||||||||||||||||||||||||||
Comprehensive income: | ||||||||||||||||||||||||||||||||||||||
Net income | 493,745 | 493,745 | ||||||||||||||||||||||||||||||||||||
Other comprehensive income (loss), net of tax: | ||||||||||||||||||||||||||||||||||||||
Net realized and unrealized holding losses on investments | (151,200 | ) | ||||||||||||||||||||||||||||||||||||
Foreign currency translation | (6 | ) | ||||||||||||||||||||||||||||||||||||
Reclassification for net realized losses on investments | 60,811 | |||||||||||||||||||||||||||||||||||||
Net unrealized gains on derivative instruments | 106,929 | |||||||||||||||||||||||||||||||||||||
Pension and postretirement | 480 | |||||||||||||||||||||||||||||||||||||
Other comprehensive income | 17,014 | 17,014 | ||||||||||||||||||||||||||||||||||||
Total comprehensive income | 510,759 | |||||||||||||||||||||||||||||||||||||
Common stock issued in acquisition | 2,600,117 | 206,075 | 206,075 | |||||||||||||||||||||||||||||||||||
Stock redeemed and retired | (3,933,128 | ) | (318,756 | ) | (318,756 | ) | ||||||||||||||||||||||||||||||||
Net stock issued under employee plans and related tax benefits | 1,728,632 | 94,615 | 94,615 | |||||||||||||||||||||||||||||||||||
Dividends declared on preferred stock | (14,323 | ) | (14,323 | ) | ||||||||||||||||||||||||||||||||||
Cash dividends on common stock, $1.68 per share | (181,327 | ) | (181,327 | ) | ||||||||||||||||||||||||||||||||||
Change in deferred compensation | (1,674 | ) | (1,674 | ) | ||||||||||||||||||||||||||||||||||
BALANCE, DECEMBER 31, 2007 | 240,000 | 107,116,505 | 2,212,237 | 2,910,692 | (58,835 | ) | (11,294 | ) | 5,292,800 | |||||||||||||||||||||||||||||
Cumulative effect of change in accounting principle, | (11,471 | ) | 11,471 | – | ||||||||||||||||||||||||||||||||||
Comprehensive loss: | ||||||||||||||||||||||||||||||||||||||
Net loss | (266,269 | ) | (266,269 | ) | ||||||||||||||||||||||||||||||||||
Other comprehensive income (loss), net of tax: | ||||||||||||||||||||||||||||||||||||||
Net realized and unrealized holding losses on investments | (333,095 | ) | ||||||||||||||||||||||||||||||||||||
Foreign currency translation | (5 | ) | ||||||||||||||||||||||||||||||||||||
Reclassification for net realized losses on investments | 181,524 | |||||||||||||||||||||||||||||||||||||
Net unrealized gains on derivative instruments | 131,443 | |||||||||||||||||||||||||||||||||||||
Pension and postretirement | (31,461 | ) | ||||||||||||||||||||||||||||||||||||
Other comprehensive loss | (51,594 | ) | (51,594 | ) | ||||||||||||||||||||||||||||||||||
Total comprehensive loss | (317,863 | ) | ||||||||||||||||||||||||||||||||||||
Issuance of preferred stock | 1,339,185 | (580 | ) | 1,338,605 | ||||||||||||||||||||||||||||||||||
Issuance of common stock and warrants | 7,194,079 | 352,653 | 352,653 | |||||||||||||||||||||||||||||||||||
Stock issued under dividend reinvestment plan | 39,857 | 1,261 | 1,261 | |||||||||||||||||||||||||||||||||||
Net stock issued under employee plans and related tax benefits | 994,372 | 34,345 | 34,345 | |||||||||||||||||||||||||||||||||||
Dividends on preferred stock | 2,649 | (24,424 | ) | (21,775 | ) | |||||||||||||||||||||||||||||||||
Dividends on common stock, $1.61 per share | (175,165 | ) | (175,165 | ) | ||||||||||||||||||||||||||||||||||
Change in deferred compensation | (3,165 | ) | (3,165 | ) | ||||||||||||||||||||||||||||||||||
BALANCE, DECEMBER 31, 2008 | $ | 1,581,834 | 115,344,813 | $ | 2,599,916 | 2,433,363 | (98,958 | ) | (14,459 | ) | 6,501,696 | |||||||||||||||||||||||||||
See accompanying notes to consolidated financial statements.
ZIONS BANCORPORATION AND SUBSIDIARIES
CONSOLIDATED STATEMENTS OF CASH FLOWS
ZIONS BANCORPORATION AND SUBSIDIARIES
YEARS ENDED DECEMBER 31, 2006, 20052008, 2007 AND 20042006
(In thousands)
| 2006 | 2005 | 2004 | 2008 | 2007 | 2006 | |||||||||||
CASH FLOWS FROM OPERATING ACTIVITIES: | |||||||||||||||||
Net income | $ | 583,125 | 480,121 | 405,987 | |||||||||||||
Adjustments to reconcile net income to net cash provided by operating activities: | |||||||||||||||||
Impairment losses on goodwill and long lived assets | 1,304 | 3,735 | 1,314 | ||||||||||||||
Net income (loss) | $ | (266,269 | ) | 493,745 | 583,125 | ||||||||||||
Adjustments to reconcile net income (loss) to net cash provided by operating activities: | |||||||||||||||||
Impairment and valuation losses on securities, goodwill, and long lived assets | 674,050 | 158,208 | 1,304 | ||||||||||||||
Debt extinguishment cost | 7,261 | – | – | – | 89 | 7,261 | |||||||||||
Provision for loan losses | 72,572 | 43,023 | 44,067 | 648,269 | 152,210 | 72,572 | |||||||||||
Depreciation of premises and equipment | 75,603 | 61,163 | 59,479 | 73,166 | 76,436 | 75,603 | |||||||||||
Amortization | 58,168 | 39,504 | 35,298 | 67,035 | 48,537 | 49,445 | |||||||||||
Deferred income tax expense (benefit) | 9,368 | (32,362) | (21,914) | (231,241 | ) | (158,702 | ) | 9,368 | |||||||||
Share-based compensation | 24,358 | – | – | 31,850 | 28,274 | 24,358 | |||||||||||
Excess tax benefits from share-based compensation | (15,707) | – | – | (1,059 | ) | (11,815 | ) | (14,689 | ) | ||||||||
Gain (loss) allocated to minority interest | 11,849 | (1,652) | (1,722) | (5,064 | ) | 8,016 | 11,849 | ||||||||||
Equity securities losses (gains), net | (17,841) | 1,312 | 9,765 | ||||||||||||||
Equity securities gains, net | (793 | ) | (17,719 | ) | (17,841 | ) | |||||||||||
Fixed income securities gains, net | (6,416) | (845) | (2,510) | (849 | ) | (3,019 | ) | (6,416 | ) | ||||||||
Net decrease in trading securities | 38,126 | 188,508 | 245,471 | ||||||||||||||
Net decrease (increase) in trading securities | (12,114 | ) | 41,587 | 38,126 | |||||||||||||
Principal payments on and proceeds from sales of loans held for sale | 1,150,692 | 987,324 | 735,392 | 1,125,840 | 1,166,724 | 1,150,692 | |||||||||||
Additions to loans held for sale | (1,119,723) | (911,287) | (707,320) | (1,135,131 | ) | (1,230,790 | ) | (1,119,723 | ) | ||||||||
Net gains on sales of loans, leases and other assets | (26,548) | (50,191) | (53,317) | ||||||||||||||
Increase in cash surrender value of bank-owned life insurance | (26,638) | (18,921) | (18,478) | ||||||||||||||
Net losses (gains) on sales of loans, leases and other assets | 29,238 | (17,243 | ) | (26,548 | ) | ||||||||||||
Income from increase in cash surrender value of bank-owned life insurance | (25,236 | ) | (26,560 | ) | (26,638 | ) | |||||||||||
Change in accrued income taxes | 27,305 | 15,611 | (4,292) | (128,793 | ) | 20,176 | 27,305 | ||||||||||
Change in accrued interest receivable | (42,498) | (22,922) | (12,890) | 34,288 | (7,521 | ) | (42,498 | ) | |||||||||
Change in other assets | 89,164 | (98,903) | 147,075 | 307,783 | 44,177 | 89,164 | |||||||||||
Change in other liabilities | 114,288 | 65,505 | (198,285) | 8,915 | (7,697 | ) | 114,288 | ||||||||||
Change in accrued interest payable | 31,020 | 10,085 | 1,469 | (10,765 | ) | (3,576 | ) | 31,020 | |||||||||
Other, net | 8,155 | (4,614) | (2,217) | (9,171 | ) | (20,637 | ) | 8,155 | |||||||||
Net cash provided by operating activities | 1,046,987 | 754,194 | 662,372 | 1,173,949 | 732,900 | 1,039,282 | |||||||||||
CASH FLOWS FROM INVESTING ACTIVITIES: | |||||||||||||||||
Net decrease in money market investments | 297,466 | 89,273 | 212,169 | ||||||||||||||
Proceeds from maturities of investment securities held to maturity | 128,358 | 129,916 | 133,859 | ||||||||||||||
Purchases of investment securities held to maturity | (131,356) | (137,844) | (138,859) | ||||||||||||||
Proceeds from sales of investment securities available for sale | 671,706 | 601,836 | 1,399,445 | ||||||||||||||
Proceeds from maturities of investment securities available for sale | 2,338,383 | 882,576 | 614,818 | ||||||||||||||
Purchases of investment securities available for sale | (2,777,647) | (1,327,688) | (2,408,902) | ||||||||||||||
Net decrease (increase) in money market investments | (1,202,709 | ) | (829,632 | ) | 297,466 | ||||||||||||
Proceeds from maturities of investment securities held-to-maturity | 98,924 | 112,670 | 128,358 | ||||||||||||||
Purchases of investment securities held-to-maturity | (128,570 | ) | (140,460 | ) | (131,356 | ) | |||||||||||
Proceeds from sales of investment securities available-for-sale | 575,811 | 795,915 | 671,706 | ||||||||||||||
Proceeds from maturities of investment securities available-for-sale | 3,308,703 | 3,355,414 | 2,338,383 | ||||||||||||||
Purchases of investment securities available-for-sale | (3,009,274 | ) | (4,537,371 | ) | (2,777,647 | ) | |||||||||||
Proceeds from sales of loans and leases | 218,104 | 1,200,692 | 996,249 | 294,480 | 68,579 | 218,104 | |||||||||||
Securitized loans purchased | (1,186,188 | ) | – | – | |||||||||||||
Net increase in loans and leases | (4,863,838) | (3,619,401) | (3,888,410) | (2,482,320 | ) | (3,907,965 | ) | (4,855,115 | ) | ||||||||
Net increase in other noninterest-bearing investments | (28,864) | (15,294) | (35,093) | ||||||||||||||
Proceeds from sales of premises and equipment | 3,632 | 5,331 | 11,301 | ||||||||||||||
Net decrease (increase) in other noninterest-bearing investments | (674 | ) | 62,234 | (28,864 | ) | ||||||||||||
Proceeds from sales of premises and equipment and other assets | 12,148 | 12,137 | 3,632 | ||||||||||||||
Purchases of premises and equipment | (122,432) | (67,995) | (72,289) | (114,164 | ) | (103,223 | ) | (122,432 | ) | ||||||||
Proceeds from sales of other real estate owned | 39,607 | 16,768 | 16,231 | 72,629 | 9,977 | 39,607 | |||||||||||
Net cash paid to acquire minority interest in nonbank subsidiary | (11,454) | – | – | ||||||||||||||
Net cash received from (paid for) acquisitions | (1,691) | (173,642) | 1,076 | 688,940 | 27,263 | (13,145 | ) | ||||||||||
Net cash paid for net liabilities on branches sold | – | (16,076) | (17,746) | ||||||||||||||
Net cash received for net assets/liabilities on branches sold | – | 11,174 | – | ||||||||||||||
Net cash received from sale of subsidiary | – | 6,995 | – | ||||||||||||||
Net cash used in investing activities | (4,240,026) | (2,431,548) | (3,176,151) | (3,072,264 | ) | (5,056,293 | ) | (4,231,303 | ) | ||||||||
ZIONS BANCORPORATION AND SUBSIDIARIES
CONSOLIDATED STATEMENTS OF CASH FLOWS(CONTINUED)
ZIONS BANCORPORATION AND SUBSIDIARIES
YEARS ENDED DECEMBER 31, 2006, 20052008, 2007 AND 20042006
(In thousands)
| 2006 | 2005 | 2004 | 2008 | 2007 | 2006 | |||||||||||
CASH FLOWS FROM FINANCING ACTIVITIES: | |||||||||||||||||
Net increase in deposits | $ | 2,339,338 | 2,995,165 | 2,560,653 | $ | 3,661,680 | 931,098 | 2,339,338 | |||||||||
Net change in short-term funds borrowed | 1,182,425 | (933,191) | (232,677) | (3,509,300 | ) | 3,743,292 | 1,182,425 | ||||||||||
Proceeds from FHLB advances and other borrowings over one year | 4,962 | 3,285 | – | 3,500 | – | 4,962 | |||||||||||
Payments on FHLB advances and other borrowings over one year | (102,392) | (2,233) | (3,288) | (2,859 | ) | (9,446 | ) | (102,392 | ) | ||||||||
Proceeds from issuance of long-term debt | 395,000 | 595,134 | 300,000 | 28,495 | 296,289 | 395,000 | |||||||||||
Debt issuance costs | (597) | (3,468) | (2,025) | ||||||||||||||
Debt issuance and extinguishment costs | (675 | ) | (151 | ) | (7,858 | ) | |||||||||||
Payments on long-term debt | (529,963) | (35) | (240,006) | (157,111 | ) | (274,957 | ) | (529,963 | ) | ||||||||
Debt extinguishment cost | (7,261) | – | – | ||||||||||||||
Proceeds from issuance of preferred stock | 235,833 | – | – | 1,338,605 | – | 235,833 | |||||||||||
Proceeds from issuance of common stock | 79,511 | 90,800 | 82,250 | ||||||||||||||
Proceeds from issuance of common stock and warrants | 354,302 | 59,473 | 79,511 | ||||||||||||||
Payments to redeem common stock | (26,483) | (82,211) | (104,881) | (2,881 | ) | (322,025 | ) | (26,483 | ) | ||||||||
Excess tax benefits from share-based compensation | 15,707 | – | – | 1,059 | 11,815 | 14,689 | |||||||||||
Dividends paid on preferred stock | (3,835) | – | – | (21,775 | ) | (14,323 | ) | (3,835 | ) | ||||||||
Dividends paid on common stock | (156,986) | (130,300) | (114,600) | (173,904 | ) | (181,327 | ) | (156,986 | ) | ||||||||
Net cash provided by financing activities | 3,425,259 | 2,532,946 | 2,245,426 | 1,519,136 | 4,239,738 | 3,424,241 | |||||||||||
Net increase (decrease) in cash and due from banks | 232,220 | 855,592 | (268,353) | (379,179 | ) | (83,655 | ) | 232,220 | |||||||||
Cash and due from banks at beginning of year | 1,706,590 | 850,998 | 1,119,351 | 1,855,155 | 1,938,810 | 1,706,590 | |||||||||||
Cash and due from banks at end of year | $ | 1,938,810 | 1,706,590 | 850,998 | $ | 1,475,976 | 1,855,155 | 1,938,810 | |||||||||
SUPPLEMENTAL DISCLOSURES OF CASH FLOW INFORMATION: | |||||||||||||||||
Cash paid for: | |||||||||||||||||
Interest | $ | 1,022,260 | 529,010 | 321,677 | $ | 1,011,719 | 1,318,356 | 1,022,260 | |||||||||
Income taxes | 273,154 | 257,850 | 240,773 | 303,180 | 355,685 | 273,154 | |||||||||||
Noncash items: | |||||||||||||||||
Loans transferred to securities resulting from securitizations | – | 42,431 | 36,282 | ||||||||||||||
Loans transferred to other real estate owned and other assets | 29,342 | 17,127 | 9,903 | ||||||||||||||
Investment securities available for sale transferred to investment securities held to maturity | – | – | 636,494 | ||||||||||||||
Acquisition of Amegy Bancorporation, Inc. | |||||||||||||||||
Investment securities available-for-sale transferred to investment securities held-to-maturity | 1,231,979 | – | – | ||||||||||||||
Loans transferred to other real estate owned | 297,228 | 22,701 | 29,342 | ||||||||||||||
Acquisitions: | |||||||||||||||||
Common stock issued | – | 1,089,440 | – | – | 206,075 | – | |||||||||||
Assets acquired | – | 8,886,049 | – | 66,192 | 1,348,233 | – | |||||||||||
Liabilities assumed | – | 7,126,844 | – | 737,116 | 1,142,158 | – | |||||||||||
See accompanying notes to consolidated financial statements.
ZIONS BANCORPORATION AND SUBSIDIARIES
NOTES TO CONSOLIDATED FINANCIAL STATEMENTS
ZIONS BANCORPORATION AND SUBSIDIARIES
1. SUMMARY OF SIGNIFICANT ACCOUNTING POLICIES
BusinessBUSINESS
Zions Bancorporation (“the Parent”) is a financial holding company headquartered in Salt Lake City, Utah, which provides a full range of banking and related services through its banking subsidiaries in ten Western and Southwestern states as follows: Zions First National Bank (“Zions Bank”), in Utah and Idaho; California Bank & Trust (“CB&T”); Amegy Corporation (“Amegy”) and its subsidiary, Amegy Bank, in Texas; National Bank of Arizona (“NBA”); Nevada State Bank (“NSB”); Vectra Bank Colorado (“Vectra”), in Colorado and New Mexico; The Commerce Bank of Washington (“TCBW”); and The Commerce Bank of Oregon (“TCBO”). Amegy and its parent, Amegy Bancorporation, Inc., were acquired effectivein December 3, 2005 as discussed in Note 3.2005. TCBO was opened in October 2005 and is not expected to have a material effect on consolidated operations for several years. The Parent also owns and operates certain nonbank subsidiaries that engage in the development and sale of financial technologies and related services, includingservices. Two of these subsidiaries, NetDeposit, Inc. (“NetDeposit”) and P5, Inc. (“P5”), were merged in 2008 to form NetDeposit, LLC (“NetDeposit”).
Another subsidiary whose ownership was transferred from Zions Bank to the Parent in 2008, Welman Holdings, Inc. (“Welman”), provides wealth management services.
Basis of Financial Statement PresentationBASIS OF FINANCIAL STATEMENT PRESENTATION
The consolidated financial statements include the accounts of the Parent and its majority-owned subsidiaries (“the Company,” “we,” “our,” “us”). Unconsolidated investments in which there is a greater than 20% ownership are accounted for by the equity method of accounting; those in which there is less than 20% ownership are accounted for under cost, fair value, or equity methods of accounting. All significant intercompany accounts and transactions have been eliminated in consolidation. Certain amounts in prior years have been reclassified to conform to the current year presentation.
Financial Accounting Standards Board (“FASB”) Interpretation No. 46R (“FIN 46R”),Consolidation of Variable Interest Entities, an Interpretation of Accounting Research Bulletin No. 51, as revised from FIN 46, requires consolidation of a variable interest entity (“VIE”) when a company is the primary beneficiary of the VIE. Upon adoption of FIN 46R beginning in 2004, we deconsolidated the trusts involved in our trust preferred borrowing arrangements. We have not consolidated or deconsolidated any other entity as a result of adopting FIN 46R. The analyses required of our variable interests have concluded in each case that we are not the primary beneficiary as defined by FIN 46R. Ongoing reviews of our variable interests have not identified any events that would change our previous conclusions. As described in Note 6, Zions Bank holds variable interests in securitization structures. All of these structures are qualifying special-purpose entities, which are exempt from the consolidation requirements of FIN 46R.
The consolidated financial statements have been prepared in conformity with accounting principles generally accepted in the United States and prevailing practices within the financial services industry. This includes the guidance in Financial Accounting Standards Board (“FASB”) Interpretation (“FIN”) No. 46(R),Consolidation of Variable Interest Entities, an Interpretation of Accounting Research Bulletin No. 51, as revised from FIN 46. FIN 46(R) requires consolidation of a variable interest entity (“VIE”) when a company is the primary beneficiary of the VIE. See Note 6 for discussion regarding current and proposed accounting rules amending FIN 46(R).
In preparing the consolidated financial statements, we are required to make estimates and assumptions that affect the amounts reported in the financial statements and accompanying notes. Actual results could differ from those estimates.
Statement of Cash FlowsSTATEMENT OF CASH FLOWS
For purposes of presentation in the consolidated statements of cash flows, “cash and cash equivalents” are defined as those amounts included in cash and due from banks in the consolidated balance sheets.
Security Resell AgreementsSECURITY RESELL AGREEMENTS
Security resell agreements represent overnight and term agreements, the majority maturing within 30 days. These agreements are generally treated as collateralized financing transactions and are carried at amounts at which the securities were acquired plus accrued interest. Either the Company or, in some instances, third parties on our behalf take possession of the underlying securities. The marketfair value of such securities is monitored throughout the contract term to ensure that asset values remain sufficient to protect against counterparty default. We are permitted by contract to sell or repledge certain securities that we accept as collateral for security resell
agreements. If sold, our obligation to return the collateral is recorded as a liability and included in the balance sheet as securities sold, not yet purchased. As of December 31, 2006,2008, we held approximately $270$287 million of securities for which we were permitted by contract to sell or repledge. The majority of these securities have been either pledged or otherwise transferred to others in connection with our financing activities, or to satisfy our commitments under short sales. Security resell agreements averaged approximately $300$514 million during 2006,2008, and the maximum amount outstanding at any month-end during 20062008 was $368$768 million.
Investment SecuritiesINVESTMENT SECURITIES
We classify our investment securities according to their purpose and holding period. Gains or losses on the sale of securities are recognized using the specific identification method and recorded in noninterest income.
Held to maturityHeld-to-maturity debt securities are stated at adjusted cost, net of unamortized premiums and unaccreted discounts. Upon purchase,Adjusted cost is used due to the transfer during 2008 of certain available-for-sale securities to held-to-maturity. The Company has the intent and ability to hold such securities to maturity. Debt securities held for investment and marketable equity securities not accounted for under the equity method of accounting are classified as available for saleavailable-for-sale and are recorded at fair value. Unrealized gains and losses of available-for-sale securities, after applicable taxes, are recorded as a component of other comprehensive income.income (“OCI”). Any declines in the value of debt securities and marketable equity securities that are considered other than temporaryother-than-temporary are recorded in noninterest income. The review for other-than-temporary declinesimpairment takes into account the severity and duration of the impairment, recent events specific to the issuer or industry, fair value in relationship to cost, extent and nature of change in fair value, creditworthiness of the issuer including external credit ratings and recent downgrades, trends and volatility of earnings, current analysts’ evaluations, and other key measures. In addition, we assess the Company’s intent and ability to hold the security for a period of time sufficient for a recovery in value, which may be maturity, taking into account our balance sheet management strategy and consideration of current and future market conditions.
Securities acquired for short-term appreciation or other trading purposes are classified as trading securities and are recorded at fair value. Realized and unrealized gains and losses are recorded in trading income.
The marketfair values of available for sale and tradinginvestment securities are generally based on quoted market prices or dealer quotes. If a quoted market price is not available, market value is estimated using quoted market prices for comparable securities or a discounted cash flow model based on established market rates.
according to Statement of Financial Accounting Standards (“SFAS”) No. 157,Fair Value Measurements, as discussed in Note 21.
LoansLOANS
Loans are reported at the principal amount outstanding, net of unearned income. Unearned income, which includes deferred fees net of deferred direct incremental loan origination costs, is amortized to interest income over the life of the loan using the interest method. Interest income is recognized on an accrual basis.
Loans held for sale are carried at the lower of aggregate cost or marketfair value. Gains and losses are recorded in noninterest income based on the difference between sales proceeds and carrying value.
Nonaccrual LoansNONACCRUAL LOANS
Loans are generally placed on a nonaccrual status when principal or interest is past due 90 days or more unless the loan is both well secured and in the process of collection or when, in the opinion of management, full collection of principal or interest is unlikely. Consumer loans are not normally placed on nonaccrual status. Generally, closed-end non-real estate secured consumer loans are not placed on nonaccrual status inasmuch as they are normally charged off when they become 120 days past due. Open-end consumer loans are charged off when they become 180 days past due unless they are adequately secured by real estate at which point they are placed on nonaccrual status. A nonaccrual loan may be returned to accrual status when all delinquent interest and principal become current in accordance with the terms of the loan agreement or when the loan becomes both well secured and in the process of collection.
Impaired LoansIMPAIRED LOANS
Loans are considered impaired when, based on current information and events, it is probable that we will be unable to collect all amounts due according to the contractual terms of the loan agreement, including scheduled interest payments.
When a loan has been identified as being impaired, the amount of impairment will be measured based on the present value of expected future cash flows discounted at the loan’s effective interest rate or, when appropriate, the loan’s observable marketfair value or the fair value of the collateral (less any selling costs) if the loan is collateral-dependent.
If the measurement of the impaired loan is less than the recorded investment in the loan (including accrued interest, net of deferred loan fees or costs and unamortized premium or discount), an impairment is recognized by creating or adjusting an existing allocation of the allowance for loan losses.
losses, or by charging down the loan to its value determined under the provisions of SFAS No. 114,Accounting by Creditors for Impairment of a Loan.
Restructured LoansRESTRUCTURED LOANS
In cases where a borrower experiences financial difficulty and we make certain concessionary modifications to contractual terms, the loan is classified as a restructured (accruing) loan. Loans restructured at a rate equal to or greater than that of a new loan with comparable risk at the time the contract is modified may be excluded from the impairment assessment and may cease to be considered impaired loans in the calendar years subsequent to the restructuring if they are not impaired based on the modified terms.
Generally, a nonaccrual loan that is restructured remains on nonaccrual for a period of six months to demonstrate that the borrower can meet the restructured terms. However, performance prior to the restructuring, or significant events that coincide with the restructuring, are included in assessing whether the borrower can meet the new terms and may result in the loan being returned to accrual at the time of restructuring or after a shorter performance period. If the borrower’s ability to meet the revised payment schedule is uncertain, the loan remains classified as a nonaccrual loan.
Other Real Estate OwnedOTHER REAL ESTATE OWNED
Other real estate owned consists principally of commercial and residential real estate obtained in partial or total satisfaction of loan obligations. Amounts are recorded at the lower of cost or marketfair value (less any selling costs) based on property appraisals at the time of transfer.
transfer and periodically thereafter.
Allowance for Loan LossesALLOWANCE FOR LOAN LOSSES
In analyzing the adequacy of the allowance for loan losses, we utilize a comprehensive loan grading system to determine the risk potential in the portfolio and also consider the results of independent internal credit reviews. To determine the adequacy of the allowance, our loan and lease portfolio is broken into segments based on loan type.
For commercial loans, we use historical loss experience factors by segment, adjusted for changes in trends and conditions, to help determine an indicated allowance for each portfolio segment. These factors are evaluated and updated using migration analysis techniques and other considerations based on the makeup of the specific segment. Other considerations include volumes and trends of delinquencies, levels of nonaccrual loans, repossessions and bankruptcies, criticized and classified loan trends, expected losses on real estate secured loans, new credit products and policies, current economic conditions, concentrations of credit risk, and experience and abilities of the Company’s lending personnel.
In addition to the segment evaluations, nonaccrual loans graded substandard or doubtful with an outstanding balance of $500 thousand or more are individually evaluated as impaired loans based on the facts and circumstances of the loan to determine if a specific allowance amount may be necessary. Specific allowances may also be established for loans whose outstanding balances are below the above threshold when it is determined that the risk associated with the loan differs significantly from the risk factor amounts established for its loan segment.
For consumer loans, we develop historical rates at which loans migrate from one delinquency level to the next higher level. Comparing these average roll rates to actual losses, the model establishes projected losses for rolling twelve-month periods with updated data broken down by product groupings with similar risk profiles.
After a preliminary allowance for credit losses has been established for the loan portfolio segments, we perform an additional review of the adequacy of the allowance based on the loan portfolio in its entirety. This enables us to mitigate the imprecision inherent in most estimates of expectedincurred credit losses and also supplements the allowance. This supplemental portion of the allowance includes our judgmental consideration of any additional amounts necessary for subjective factors such as economic uncertainties and excess concentration risks.
Nonmarketable SecuritiesNONMARKETABLE SECURITIES
Nonmarketable securities are included in other noninterest-bearing investments on the balance sheet. These securities include certain venture capital securities and securities acquired for various debt and regulatory requirements. Nonmarketable venture capital securities are reported at estimated fair values, in the absence of readily ascertainable marketfair values. Changes in fair value and gains and losses from sales are recognized in noninterest income. The values assigned to the securities where no market quotations exist are based upon available information and may not necessarily represent amounts that will ultimately be realized. Such estimated amounts depend on future circumstances and will not be realized until the individual securities are liquidated. The valuation procedures applied include consideration of economic and market conditions, current and projected financial performance of the investee company, and the investee company’s management team. We believe that the cost of an investment is initially the best indication of estimated fair value unless there have been significant subsequent positive or negative developments that justify an adjustment in the fair value estimate. Other nonmarketable securities acquired for various debt and regulatory requirements are accounted for at cost.
Asset SecuritizationsASSET SECURITIZATIONS
When we sellsold receivables in securitizations of home equity loans and small business loans, we may retaingenerally retained a cash reserve account, an interest-only strip, and in some cases a subordinated tranche, all of which arewere retained interests in the securitized receivables. Gain or loss on sale of the receivables dependsdepended in part on the previous carrying amount of the financial assets involved in the transfer, allocated between the assets sold and the retained interests based on their relative fair values at the date of transfer. Quoted market prices arewere generally not available for retained interests. To obtain fair values, we estimateestimated the present value of future expected cash flows using our best judgment of key assumptions, including credit losses, prepayment speeds and methods, forward yield curves, and discount rates commensurate with the risks involved.
Premises and EquipmentPREMISES AND EQUIPMENT
Premises and equipment are stated at cost, net of accumulated depreciation and amortization. Depreciation, computed primarily on the straight-line method, is charged to operations over the estimated useful lives of the properties, generally from 25 to 40 years for buildings and from 3 to 10 years for furniture and equipment. Leasehold improvements are amortized over the terms of the respective leases or the estimated useful lives of the improvements, whichever are shorter.
Business CombinationsBUSINESS COMBINATIONS
Business combinations are accounted for under the purchase method of accounting wherein accordance with SFAS No. 141,Business Combinations. Under this guidance, assets and liabilities of the business acquired are recorded at their estimated fair values as of the date of acquisition. Any excess of the cost of acquisition over the fair value of net assets and other identifiable intangible assets acquired is recorded as goodwill. Results of operations of the acquired business are included in the statement of income from the date of acquisition. See furtherNote 2 for a discussion of SFAS 141 (revised 2007) and SFAS 160, which significantly change the financial accounting and reporting of business combination transactions and noncontrolling (or minority) interest in Note 3.
consolidated financial statements.
Goodwill and Identifiable Intangible AssetsGOODWILL AND IDENTIFIABLE INTANGIBLE ASSETS
Statement of Financial Accounting Standards (“SFAS”)SFAS No. 142,Goodwill and Other Intangible Assets, requires that goodwill and intangible assets deemed to have indefinite lives are no longernot amortized. SuchAs required by SFAS 142, we subject these assets are now subject to annual specified impairment tests.tests as of the beginning of the fourth quarter and more frequently if changing conditions warrant. Core deposit assets and other intangibles with finite useful lives are generally amortized on an accelerated basis using an estimated useful life of up to 12 years.
Derivative InstrumentsDERIVATIVE INSTRUMENTS
We use derivative instruments including interest rate swaps and floors and basis swaps as part of our overall asset and liability duration and interest rate risk management strategy. These instruments enable us to manage desired asset and liability duration and to reduce interest rate exposure by matching estimated repricing periods of interest-sensitive assets and liabilities. We also execute derivative instruments with commercial banking customers to facilitate their risk management strategies. These derivatives are immediately hedged by offsetting derivatives such that we have nominimize our net interest rate risk exposure as a result of the transaction.such transactions. As required by SFAS No. 133,Accounting for Derivative Instruments and Hedging Activities, we record all derivatives at fair value in the balance sheet as either other assets or other liabilities. See further discussion in Note 7.
Commitments and Letters of CreditCOMMITMENTS AND LETTERS OF CREDIT
In the ordinary course of business, we enter into commitments to extend credit, commercial letters of credit, and standby letters of credit. Such financial instruments are recorded in the financial statements when they become payable. The credit risk associated with these commitments when indistinguishable from the underlying funded loan, is consideredevaluated in our determination ofa manner similar to the allowance for loan losses. OtherThe reserve for unfunded lending commitments is included in other liabilities in the balance sheet include the portion of the allowance that was distinguishable and related to undrawn commitments to extend credit.
sheet.
Share-Based CompensationSHARE-BASED COMPENSATION
Share-based compensation generally includes grants of stock options and restricted stock to employees and nonemployee directors. We account for share-based payments, including stock options, in accordance with SFAS No. 123R,123(R),Share-Based Payment, which we adopted effective January 1, 2006 using the “modified prospective” transition method. All share-based payments are recognizedand recognize them in the statement of income based on their fair values. See further discussion in Note 17.
Income TaxesINCOME TAXES
Deferred tax assets and liabilities are determined based on temporary differences between financial statement asset and liability amounts and their respective tax bases and are measured using enacted tax laws and rates. The effect on deferred tax assets and liabilities of a change in tax rates is recognized in income in the period that includes the enactment date. Deferred tax assets are recognized subject to management’s judgment that realization is more-likely-than-not.
Unrecognized tax benefits for uncertain tax positions relate primarily to state tax contingencies and are accounted for and disclosed in accordance with FIN No. 48,Accounting for Uncertainty in Income Taxes, an interpretation of FASB Statement No. 109. We adopted FIN 48 effective January 1, 2007. See further discussion in Note 15.
Net Earnings per Common ShareNET EARNINGS PER COMMON SHARE
Net earnings per common share is based on net earnings applicable to common shareholders which is net of the preferred stock dividend.dividends. Basic net earnings per common share is based on the weighted average outstanding common shares during each year. Diluted net earnings per common share is based on the weighted average outstanding common shares during each year, including common stock equivalents. Diluted net earnings per common share excludes common stock equivalents whose effect is antidilutive.
2. OTHER RECENT ACCOUNTING PRONOUNCEMENTS
In FebruaryDecember 2007, the FASB issued SFAS No 141 (revised 2007),Business Combinations, and SFAS No. 159,160,Fair Value Option forAccounting and Reporting of Noncontrolling Interests in Consolidated Financial Assets and Financial Liabilities, includingStatements, an amendment of FASB StatementARB No. 115.51. These new standards will significantly change the financial accounting and reporting of business combination transactions and noncontrolling (or minority) interests in consolidated financial statements. Among the most significant changes, SFAS 159 permits entities to choose to measure many financial instruments141(R) eliminates the step acquisition model under SFAS 141. Upon initially obtaining control, the acquirer will recognize 100% of all acquired assets (including goodwill) and certain other items at fair value at specified election dates. The fair value option mayall assumed liabilities regardless of the percentage owned. Certain transaction and restructuring costs must be applied instrument by instrument with certain exceptions and is applied generally on an irrevocable basisexpensed as incurred. Changes to the entire instrument.acquirer’s existing income tax valuation allowances and uncertainty accruals from a business combination must be recognized as an adjustment to current income tax expense and not to goodwill over the subsequent annual period. SFAS 159160 changes the presentation of noncontrolling (or minority) interests in that all operating amounts attributable to a noncontrolling interest are included in the statement of income and remaining balances are included as a separate component of equity. Also required is the allocation of losses to a noncontrolling interest even when such losses result in a negative carrying balance. Retrospective application is required for comparative presentation. Both Statements are effective for financial statements issued for fiscal yearsthe interim and annual reporting periods beginning after NovemberDecember 15, 2007. Early adoption2008. Management is permitted under certain circumstances. Management iscurrently evaluating the impact this Statementthese Statements may have on the Company’s financial statements.statements as they relate to future acquisitions, including the pending February 2009 acquisition related to Alliance Bank as discussed in Note 3. Minority interest of $27.3 million at December 31, 2008 will be reclassified to shareholders’ equity as of January 1, 2009 and reported as noncontrolling interests.
In September 2006, the Emerging Issues Task Force (“EITF”) ofJune 2008, the FASB ratifiedissued FASB Staff Position (“FSP”) No. EITF Issue No. 06-4,03-6-1,Accounting for Deferred Compensation and Postretirement Benefit Aspects of Endorsement Split-Dollar Life Insurance Arrangements, and EITF Issue No. 06-5,Accounting for Purchases of Life Insurance – Determining the Amount That Could Be RealizedWhether Instruments Granted in Accordance with FASB Technical Bulletin No. 85-4, Accounting for Purchases of Life InsuranceShare-Based Payment Transactions Are Participating Securities. EITF 06-4 providesThis FSP clarifies that an employer should recognize a liability for future benefits based on the substantive agreementunvested share-based payment awards with the employee. The Issuerights to receive nonforfeitable dividends are participating securities and should be applied to fiscal yearsincluded in the computation of earnings per share. It is effective for interim and annual periods beginning after December 15, 2007, with earlier application permitted. EITF 06-5 provides that in determining the amount recognized as an asset, a policyholder should consider the cash surrender value as well as any additional amounts included in the contractual terms of the policy that will2008 and requires prior period earnings per share information to be paid upon surrender. The amount that could be realized should be calculated at the individual policy level and consider any probable contractual limitations, including the exclusion of any additional amounts paid for the surrender of an entire group of policies. The Issue is effective for fiscal years beginning after December 15, 2006. Certain banking subsidiaries of the Company have life insurance arrangements; however, we have determined that the adoption of these issues willadjusted retrospectively. Management does not expect this FPS to have a materialsignificant impact on the Company’s financial statements.earnings per share information.
In September 2006, the FASB issued SFAS No. 157,Fair Value Measurements. SFAS 157 provides enhanced guidance for using fair value to measure assets and liabilities and expands disclosures about fair value measurements. The Statement applies under other accounting pronouncements that require or permit fair value measurements; however, it does not expand the use of fair value measurements in any new circumstances. SFAS 157 is effective for financial statements issued for fiscal years beginning after November 15, 2007, and interim periods within those fiscal years. Early adoption is permitted. Management is evaluating the impact this Statement may have on the Company’s financial statements.
Additional recent accounting pronouncements are discussed where applicable throughout the Notes to Consolidated Financial Statements.
3. MERGER AND ACQUISITION ACTIVITY
Effective December 3, 2005,September 5, 2008, we acquired 100%from the Federal Deposit Insurance Corporation (“FDIC”) the insured deposits and certain assets of the outstanding stock of Amegy Bancorporation, Inc.failed Silver State Bank, headquartered in Houston,Henderson, Nevada. The acquisition was made through our NSB and NBA subsidiaries and included approximately $737 million of deposits and $66 million of assets. The assets consisted primarily of deposit-secured loans, furniture, fixtures and equipment, and certain branch assets.
In September 2007, Amegy completed its acquisition for cash of Intercontinental Bank Shares Corporation (“Intercon”), including three branches located in San Antonio, Texas. The tax-free merger was accomplished accordingApproximately $8.5 million in goodwill, $58 million in loans, and $105 million in deposits, including $98 million in core deposits, were added to the Agreement and Plan of Merger (“the Merger Agreement”) dated July 5, 2005, and included the formation of a new holding company, Amegy Corporation, which became a wholly-owned subsidiary of the Company. The merger expanded the Company’s banking presence into Texas. Amegy’s results for the month of December 2005 were included with the Company’s results of operations for 2005.
As provided by the Merger Agreement and based on valuation amounts determined as of the merger date, approximately 70.89 million shares of Amegy common stock were exchanged for $600 million in cash and 14.35 million shares of the Company’s common stock at a calculated exchange ratio of 0.3136. The exchange of shares represented approximately 16% of the Company’s outstanding common stock as of the merger date.
The merger was accounted for under the purchase method of accounting in accordance with SFAS No. 141,Business Combinations. Accordingly, the purchase price was allocated to the assets acquired and the liabilities assumed based on their estimated fair values at the merger date as summarized below(in thousands, except share and per share amounts):
Purchase price | ||||||
Number of shares of the Company’s common stock issued for Amegy common stock | 14,351,115 | |||||
Average share price of the Company’s common stock three days prior to close on | $ | 75.9133 | ||||
Total stock consideration | $ | 1,089,440 | ||||
Fair value of Amegy stock options and restricted stock converted to the Company’s stock options and restricted stock | 60,242 | |||||
Total common and restricted stock issued and stock options assumed | 1,149,682 | |||||
Cash consideration, including fractional shares | 600,032 | |||||
Total stock and cash consideration | 1,749,714 | |||||
Acquisition costs: | ||||||
Direct costs of acquisition | 9,491 | |||||
Total purchase price and acquisition costs | 1,759,205 | |||||
Allocation of purchase price | ||||||
Amegy shareholders’ equity | $ | 604,787 | ||||
Amegy goodwill | (150,426) | |||||
Amegy core deposit intangible assets, net of tax | (12,852) | |||||
Adjustments to reflect assets acquired and liabilities assumed at fair value: | ||||||
Securities | (697) | |||||
Loans | (43,723) | |||||
Identified intangibles | 157,855 | |||||
Other assets | (42,599) | |||||
Deposits | (16) | |||||
Other liabilities | (364) | |||||
Fair value of net assets acquired | 511,965 | |||||
Goodwill resulting from the merger | $ | 1,247,240 | ||||
The appropriate amounts and adjustments shown were recorded by Amegy and included in its reporting segment. Adjustments to asset and liability amounts during the year subsequent to the merger date reduced goodwill by approximately $0.8 million. These adjustments primarily related to the tax deductibility of certain merger related expenses. Valuations of certain assets and liabilities of Amegy were performed with the assistance of independent valuation consultants. None of the resulting goodwill is expected to be deductible for tax purposes.
The following unaudited pro forma condensed combined financial information presents the Company’s results of operations for 2005 assuming the merger had taken place as of January 1, 2005(in thousands, except share and per share amounts):
Net interest income Provision for loan losses Noninterest income Merger related expense Other noninterest expense Income before income taxes and minority interest Net income Net earnings per common share: Basic Diluted Weighted average common shares outstanding during the year: Basic Diluted $ 1,574,660 51,154 530,397 3,310 1,294,983 755,608 493,764 $ 4.73 4.63 104,349 106,714
These pro forma amounts do not reflect cost savings or revenue enhancements anticipated from the acquisition, and are not necessarily indicative of what actually would have occurred if the acquisition had been completed as of the beginning of the year presented, nor are they necessarily indicative of future consolidated results.
For 2006 and 2005, merger related expense of $20.5 million and $3.3 million, respectively, related primarily to costs associated with this merger and consisted of systems integration and related charges of approximately $11.1 million and $1.4 million, employee-related costs of $9.1 million and $1.2 million, and other costs of $0.3 million and $0.7 million, respectively.
As of the merger date, approximately $15.2 million of liabilities for Amegy’s exit and termination costs as a result of the merger were recorded as purchase accounting adjustments resulting in an increase to goodwill. These costs consist of employee-related costs of $12.2 million and other exit costs of $3.0 million. As of December 31, 2006, Amegy’s unpaid accrual for these costs was approximately $2.3 million.
Additional costs from the merger for employment and retention agreements to be charged to operations by Amegy subsequent to December 31, 2006 as the employees render service are $2.8 million in 2007 and $1.0 million in 2008.
balance sheet.
In October 2006, we acquired the remaining minority interests of P5, a provider of web-based claims reconciliation services. We had previously owned a majority interest in this investment. Net cash consideration of approximately $23.5 million was allocated $17.5 million to goodwill and $6.0 million to other intangible assets.
On January 17, 2007, we completed the acquisition of The Stockmen’s Bancorp, Inc. (“Stockmen’s”), headquartered in Kingman, Arizona. As of the date of acquisition, Stockmen’s had approximately $1.2 billion of total assets, $1.1 billion of total deposits, and a total of 43 branches – branches—32 in Arizona and 11 in central California. Consideration of approximately $206$206.1 million consisted of 2.6 million shares of the Company’s common stock plus a small amount of cash paid for fractional shares. Stockmen’s parent company merged into the Parent and Stockmen’s banking subsidiary merged into NBA. Effective November 2, 2007, NBA completed the Company’s NBA subsidiary.sale of the 11 California branches, which included approximately $169 million of loans and $190 million of deposits, resulting in no gain or loss. As of December 31, 2007, after giving effect to the sale of the branches, the acquisition resulted in approximately $106.1 million of goodwill and $30.6 million of core deposit and other intangibles.
In October 2006, we acquired the remaining minority interests of P5, a previous nonbank subsidiary (see Note 1). We had previously owned a majority interest in this investment. Net cash consideration of approximately $23.5 million was allocated $17.5 million to goodwill and $6.0 million to other intangible assets.
For the Stockmen’s and P5 acquisitions, Note 9 discusses the impairment losses in 2008 that reduced the recorded balances of goodwill at December 31, 2008.
Merger related expense of $1.6 million for 2008 included approximately $1.0 million for certain employee-related agreements from the Amegy acquisition in 2005. For 2007, merger related expense of $5.3 million related to the Amegy, Intercon and Stockmen’s acquisitions. For 2006, substantially all of the $20.5 million related to the Amegy acquisition.
On February 6, 2009, our CB&T subsidiary agreed to acquire from the FDIC the banking operations of the failed Alliance Bank, headquartered in Culver City, California. The acquisition includes approximately $1.1 billion of assets, including the entire loan portfolio, $1.0 billion of deposits, and five branches. The FDIC will assume certain amounts of credit losses under a loss sharing arrangement.
4. INVESTMENT SECURITIES
Investment securities are summarized as follows(in thousands):
| December 31, 2006 | December 31, 2008 | |||||||||||||||||||||||
| Amortized cost | Gross unrealized gains | Gross unrealized losses | Estimated market value | Recognized in OCI1 | Not recognized in OCI1 | |||||||||||||||||||
Held to maturity | ||||||||||||||||||||||||
| Amortized cost | Gross unrealized gains | Gross unrealized losses | Carrying value | Gross unrealized gains | Gross unrealized losses | Estimated fair value | ||||||||||||||||||
Held-to-maturity | ||||||||||||||||||||||||
Municipal securities | $ | 652,624 | 3,521 | 7,817 | 648,328 | $ | 696,653 | – | – | 696,653 | 7,661 | 9,231 | 695,083 | |||||||||||
Asset-backed securities: | ||||||||||||||||||||||||
Trust preferred securities – banks and insurance | 1,187,804 | 53 | 184,195 | 1,003,662 | 4,380 | 332,006 | 676,036 | |||||||||||||||||
Trust preferred securities – real estate investment trusts | 36,013 | – | 8,671 | 27,342 | – | 6,271 | 21,071 | |||||||||||||||||
Other | 76,323 | 48 | 13,139 | 63,232 | 644 | 12,611 | 51,265 | |||||||||||||||||
Other debt securities | 500 | – | – | 500 | 100 | – | – | 100 | – | – | 100 | |||||||||||||
| $ | 653,124 | 3,521 | 7,817 | 648,828 | $ | 1,996,893 | 101 | 206,005 | 1,790,989 | 12,685 | 360,119 | 1,443,555 | ||||||||||||
Available for sale | ||||||||||||||||||||||||
Available-for-sale | ||||||||||||||||||||||||
U.S. Treasury securities | $ | 42,546 | 268 | 375 | 42,439 | $ | 27,973 | 1,148 | – | 29,121 | 29,121 | |||||||||||||
U.S. Government agencies and corporations: | ||||||||||||||||||||||||
Agency securities | 323,371 | 2,813 | 975 | 325,209 | 325,209 | |||||||||||||||||||
Agency guaranteed mortgage-backed securities | 406,462 | 5,308 | 1,655 | 410,115 | 410,115 | |||||||||||||||||||
Small Business Administration loan-backed securities | 907,372 | 2,387 | 8,355 | 901,404 | 692,634 | 35 | 25,992 | 666,677 | 666,677 | |||||||||||||||
Other agency securities | 782,480 | 235 | 9,241 | 773,474 | ||||||||||||||||||||
Municipal securities | 225,839 | 1,651 | 134 | 227,356 | 177,938 | 2,312 | 252 | 179,998 | 179,998 | |||||||||||||||
Mortgage/asset-backed and other debt securities | 2,930,006 | 21,009 | 43,299 | 2,907,716 | ||||||||||||||||||||
Asset-backed securities: | ||||||||||||||||||||||||
Trust preferred securities – banks and insurance | 806,537 | 3,457 | 149,367 | 660,627 | 660,627 | |||||||||||||||||||
Trust preferred securities – real estate investment trusts | 26,880 | – | 2,983 | 23,897 | 23,897 | |||||||||||||||||||
Other | 102,671 | – | 30,194 | 72,477 | 72,477 | |||||||||||||||||||
| 4,888,243 | 25,550 | 61,404 | 4,852,389 | 2,564,466 | 15,073 | 211,418 | 2,368,121 | 2,368,121 | ||||||||||||||||
Other securities: | ||||||||||||||||||||||||
Mutual funds | 192,635 | – | – | 192,635 | ||||||||||||||||||||
Stock | 3,426 | 2,457 | – | 5,883 | ||||||||||||||||||||
Mutual funds and stock | 308,134 | – | – | 308,134 | 308,134 | |||||||||||||||||||
| $ | 5,084,304 | 28,007 | 61,404 | 5,050,907 | $ | 2,872,600 | 15,073 | 211,418 | 2,676,255 | 2,676,255 | ||||||||||||||
| December 31, 2005 | ||||||||||||||||||||||||
| Amortized cost | Gross unrealized gains | Gross unrealized losses | Estimated market value | |||||||||||||||||||||
Held to maturity | ||||||||||||||||||||||||
Municipal securities | $ | 649,791 | 4,148 | 11,681 | 642,258 | |||||||||||||||||||
Available for sale | ||||||||||||||||||||||||
U.S. Treasury securities | $ | 42,572 | 304 | 320 | 42,556 | |||||||||||||||||||
U.S. Government agencies and corporations: | ||||||||||||||||||||||||
Small Business Administration loan-backed securities | 785,882 | 2,669 | 6,727 | 781,824 | ||||||||||||||||||||
Other agency securities | 687,632 | 1,121 | 5,413 | 683,340 | ||||||||||||||||||||
Municipal securities | 266,501 | 1,041 | 177 | 267,365 | ||||||||||||||||||||
Mortgage/asset-backed and other debt securities | 3,310,839 | 37,478 | 40,400 | 3,307,917 | ||||||||||||||||||||
| 5,093,426 | 42,613 | 53,037 | 5,083,002 | |||||||||||||||||||||
Other securities: | ||||||||||||||||||||||||
Mutual funds | 217,084 | – | 1,481 | 215,603 | ||||||||||||||||||||
Stock | 6,422 | 2,123 | 1,291 | 7,254 | ||||||||||||||||||||
| $ | 5,316,932 | 44,736 | 55,809 | 5,305,859 | ||||||||||||||||||||
1 | Other comprehensive income |
Held-to-maturity Municipal securities Available-for-sale U.S. Treasury securities U.S. Government agencies and corporations: Agency securities Agency guaranteed mortgage-backed securities Small Business Administration loan-backed securities Municipal securities Asset-backed securities: Trust preferred securities – banks and insurance Trust preferred securities – real estate investment trusts Small business loan-backed Other Other securities: Mutual funds and stock December 31, 2007 Amortized
cost Gross
unrealized
gains Gross
unrealized
losses Estimated
fair
value $ 704,441 5,811 8,104 702,148 $ 52,281 731 12 53,000 629,240 1,684 5,002 625,922 764,771 4,523 6,284 763,010 788,509 505 18,134 770,880 220,159 1,881 71 221,969 2,123,090 6,369 110,332 2,019,127 155,935 – 61,907 94,028 182,924 318 1,168 182,074 226,460 4,374 176 230,658 5,143,369 20,385 203,086 4,960,668 173,922 20 – 173,942 $ 5,317,291 20,405 203,086 5,134,610
As part of our ongoing review of the investment securities portfolio, we reassessed the classification of certain asset-backed and trust preferred collateralized debt obligation (“CDO”) securities. In the second and fourth quarters of 2008, we reclassified an aggregate of approximately $1.2 billion at fair value of available-for-sale (“AFS”) securities to held-to-maturity (“HTM”). The related unrealized pretax loss of approximately $273 million included in OCI remained in OCI and is being amortized as a yield adjustment through earnings over the remaining terms of the securities. No gain or loss was recognized at the time of reclassification. We consider the HTM classification to be more appropriate because we have the ability and the intent to hold these securities to maturity.
The amortized cost and estimated marketfair value of investment debt securities as of December 31, 20062008 by contractual maturity are shown as follows. Expected maturities will differ from contractual maturities because borrowers may have the right to call or prepay obligations with or without call or prepayment penalties(in thousands):
Due in one year or less Due after one year through five years Due after five years through ten years Due after ten years Held to maturity Available for sale Amortized
cost Estimated
market
value Amortized
cost Estimated
market
value $ 57,165 57,035 820,975 807,344 203,616 201,433 1,215,072 1,194,259 189,019 188,493 487,689 493,475 203,324 201,867 2,364,507 2,357,311 $ 653,124 648,828 4,888,243 4,852,389
| Held-to-maturity | Available-for-sale | ||||||||
| Amortized cost | Estimated fair value | Amortized cost | Estimated fair value | ||||||
Due in one year or less | $ | 76,870 | 73,883 | 477,028 | 470,173 | ||||
Due after one year through five years | 299,428 | 298,562 | 765,614 | 755,668 | |||||
Due after five years through ten years | 217,171 | 209,861 | 467,750 | 431,460 | |||||
Due after ten years | 1,403,424 | 861,249 | 854,074 | 710,820 | |||||
| $ | 1,996,893 | 1,443,555 | 2,564,466 | 2,368,121 | |||||
The following is a summary of the amount of gross unrealized losses and the estimated marketfair value by length of time that the securities have been in an unrealized loss position(in thousands):
| December 31, 2006 | |||||||||||||
| Less than 12 months | 12 months or more | Total | |||||||||||
| Gross unrealized losses | Estimated market value | Gross unrealized losses | Estimated market value | Gross unrealized losses | Estimated market value | ||||||||
Held to maturity | |||||||||||||
Municipal securities | $ | 762 | 81,497 | 7,055 | 291,781 | 7,817 | 373,278 | ||||||
Available for sale | |||||||||||||
U.S. Treasury securities | $ | 32 | 21,648 | 343 | 19,712 | 375 | 41,360 | ||||||
U.S. Government agencies and corporations: | |||||||||||||
Small Business Administration loan-backed securities | 3,031 | 337,503 | 5,324 | 324,998 | 8,355 | 662,501 | |||||||
Other agency securities | 1,088 | 284,179 | 8,153 | 255,988 | 9,241 | 540,167 | |||||||
Municipal securities | 39 | 15,564 | 95 | 2,597 | 134 | 18,161 | |||||||
Mortgage/asset-backed and other debt securities | 6,132 | 517,502 | 37,167 | 1,252,554 | 43,299 | 1,770,056 | |||||||
| $ | 10,322 | 1,176,396 | 51,082 | 1,855,849 | 61,404 | 3,032,245 | |||||||
| December 31, 2005 | |||||||||||||
| Less than 12 months | 12 months or more | Total | |||||||||||
| Gross unrealized losses | Estimated market value | Gross unrealized losses | Estimated market value | Gross unrealized losses | Estimated market value | ||||||||
Held to maturity | |||||||||||||
Municipal securities | $ | 6,414 | 228,902 | 5,267 | 130,207 | 11,681 | 359,109 | ||||||
Available for sale | |||||||||||||
U.S. Treasury securities | $ | 292 | 19,753 | 28 | 2,040 | 320 | 21,793 | ||||||
U.S. Government agencies and corporations: | |||||||||||||
Small Business Administration loan-backed securities | 3,671 | 318,535 | 3,056 | 173,286 | 6,727 | 491,821 | |||||||
Other agency securities | 1,998 | 267,359 | 3,415 | 86,546 | 5,413 | 353,905 | |||||||
Municipal securities | 136 | 48,782 | 41 | 2,286 | 177 | 51,068 | |||||||
Mortgage/asset-backed and other debt securities | 25,657 | 1,295,398 | 14,743 | 423,502 | 40,400 | 1,718,900 | |||||||
| 31,754 | 1,949,827 | 21,283 | 687,660 | 53,037 | 2,637,487 | ||||||||
Other securities: | |||||||||||||
Mutual funds | 1,481 | 90,329 | – | – | 1,481 | 90,329 | |||||||
Stock | – | – | 1,291 | 2,805 | 1,291 | 2,805 | |||||||
| $ | 33,235 | 2,040,156 | 22,574 | 690,465 | 55,809 | 2,730,621 | |||||||
| December 31, 2008 | |||||||||||||
| Less than 12 months | 12 months or more | Total | |||||||||||
| Gross unrealized losses | Estimated fair value | Gross unrealized losses | Estimated fair value | Gross unrealized losses | Estimated fair value | ||||||||
Held-to-maturity | |||||||||||||
Municipal securities | $ | 5,121 | 141,135 | 4,110 | 36,207 | 9,231 | 177,342 | ||||||
Asset-backed securities: | |||||||||||||
Trust preferred securities – banks and insurance | 13,991 | 19,239 | 502,210 | 511,103 | 516,201 | 530,342 | |||||||
Trust preferred securities – real estate investment trusts | – | – | 14,942 | 21,072 | 14,942 | 21,072 | |||||||
Other | 7,214 | 26,621 | 18,536 | 20,541 | 25,750 | 47,162 | |||||||
| $ | 26,326 | 186,995 | 539,798 | 588,923 | 566,124 | 775,918 | |||||||
Available-for-sale | |||||||||||||
U.S. Government agencies and corporations: | |||||||||||||
Agency securities | $ | 191 | 41,950 | 784 | 60,725 | 975 | 102,675 | ||||||
Agency guaranteed mortgage-backed securities | 1,336 | 103,721 | 319 | 32,960 | 1,655 | 136,681 | |||||||
Small Business Administration loan-backed securities | 2,523 | 170,443 | 23,469 | 483,628 | 25,992 | 654,071 | |||||||
Municipal securities | 224 | 16,303 | 28 | 2,286 | 252 | 18,589 | |||||||
Asset-backed securities: | |||||||||||||
Trust preferred securities – banks and insurance | 27,378 | 114,721 | 121,989 | 454,094 | 149,367 | 568,815 | |||||||
Trust preferred securities – real estate investment trusts | 2,983 | 10,783 | – | – | 2,983 | 10,783 | |||||||
Other | 24,050 | 40,337 | 6,144 | 20,750 | 30,194 | 61,087 | |||||||
| $ | 58,685 | 498,258 | 152,733 | 1,054,443 | 211,418 | 1,552,701 | |||||||
| December 31, 2007 | |||||||||||||
| Less than 12 months | 12 months or more | Total | |||||||||||
| Gross unrealized losses | Estimated fair value | Gross unrealized losses | Estimated fair value | Gross unrealized losses | Estimated fair value | ||||||||
Held-to-maturity | |||||||||||||
Municipal securities | $ | 6,308 | 49,252 | 1,796 | 167,971 | 8,104 | 217,223 | ||||||
Available-for-sale | |||||||||||||
U.S. Treasury securities | $ | 12 | 18,904 | – | – | 12 | 18,904 | ||||||
U.S. Government agencies and corporations: | |||||||||||||
Agency securities | 19 | 15,219 | 4,983 | 153,465 | 5,002 | 168,684 | |||||||
Agency guaranteed mortgage-backed securities | 571 | 82,323 | 5,713 | 345,593 | 6,284 | 427,916 | |||||||
Small Business Administration loan-backed securities | 1,571 | 132,774 | 16,563 | 544,872 | 18,134 | 677,646 | |||||||
Municipal securities | 10 | 1,745 | 61 | 3,729 | 71 | 5,474 | |||||||
Asset-backed securities: | |||||||||||||
Trust preferred securities – banks and insurance | 80,340 | 1,530,433 | 29,992 | 403,463 | 110,332 | 1,933,896 | |||||||
Trust preferred securities – real estate investment trusts | 61,907 | 60,869 | – | – | 61,907 | 60,869 | |||||||
Small business loan-backed | 289 | 61,472 | 879 | 41,405 | 1,168 | 102,877 | |||||||
Other | 176 | 188,247 | – | – | 176 | 188,247 | |||||||
| $ | 144,895 | 2,091,986 | 58,191 | 1,492,527 | 203,086 | 3,584,513 | |||||||
We review investment debt securities on an ongoing basis for the presence of other-than-temporary-impairment (“OTTI”) with formal reviews performed quarterly. OTTI losses on individual investment securities are recognized as a realized loss through earnings when it is probable that we will not collect all of the contractual cash flows or we determine we will be unable to hold the securities until a recovery of fair value, which may be maturity. OTTI losses include incurred credit losses and liquidity losses.
The precedingOur OTTI evaluation process follows the guidance of SFAS No. 115,Accounting for Certain Investments in Debt and Equity Securities, Emerging Issues Task Force (“EITF”) Issue No. 99-20,Recognition of Interest Income and Impairment on Purchased and Retained Beneficial Interests in Securitized Financial Assets, and FSP No. EITF 99-20-1, Amendments to the Impairment and Interest Income Measurement Guidance of EITF Issue No. 99-20. This guidance requires the Company to take into consideration current market conditions, fair value in relationship to cost, extent and nature of change in fair value, issuer rating changes and trends, volatility of earnings, current analysts’ evaluations, all available information relevant to the collectibility of debt securities, our ability and intent to hold investments until a recovery of fair value, which may be maturity, and other factors when evaluating for the existence of OTTI in our securities portfolio. FSP EITF 99-20-1 was issued on January 12, 2009 and is effective for reporting periods ending after December 15, 2008. This FSP amends EITF 99-20 by eliminating the requirement that a holder’s best estimate of cash flows be based upon those that “a market participant” would use. Instead, the FSP requires that OTTI be recognized as a realized loss through earnings when it is “probable” there has been an adverse change in the holder’s estimated cash flows from the cash flows previously projected. This requirement is consistent with the impairment model in SFAS 115.
In addition, our disclosure and related discussion of unrealized losses and the following discussion areis presented pursuant to FASB Staff Position (“FSP”)FSP FAS 115-1,The Meaning of Other-Than-Temporary Impairment and Its Application to Certain Investments, issued in November 2005, and EITF Issue No. 03-1,The Meaning of Other-Than-Temporary Impairment and Its Application to Certain Investments. FSP FAS 115-1 replaces thecertain impairment evaluation guidance (paragraphs 10-18) of EITF 03-1; however, the disclosure requirements of EITF 03-1 remain in effect. TheThis FSP addresses the determination of when an investment is considered impaired, whether the impairment is considered to be other-than-temporary, and the measurement of an impairment loss. The FSP also supersedes EITF Topic No. D-44,Recognition of Other-Than-Temporary Impairment upon the Planned Sale of a Security Whose Cost Exceeds Fair Value, and clarifies that an impairment loss should be recognized no later than when the impairment is deemed other-than-temporary, even if a decision to sell an impaired security has not been made.
U.S. Treasury Securities: Unrealized losses relate to U.S. Treasury notes and were caused by interest rate increases. The contractual terms of these investments range from less than one year to ten years. Because we have the ability and intent to hold those investments until a recovery of fair value, which may be maturity, we do not consider these investments to be other-than-temporarily impaired at December 31, 2006.Municipal securities
Small Business Administration (“SBA”) Loan-Backed Securities: These securities were generally purchased at premiums with maturities from five to 25 years and have principal cash flows guaranteed by the SBA. Because the decline in market value is not attributable to credit quality, and because we have the ability and intent to hold these investments until a recovery of fair value, which may be maturity, we do not consider these investments to be other-than-temporarily impaired at December 31, 2006.
Other Agency Securities: Unrealized losses were caused by interest rate increases. The other agency securities consist of discount notes and medium term notes issued by the Federal Agricultural Mortgage Corporation (“FAMC”), Federal Home Loan Bank (“FHLB”), Federal Farm Credit Bank, Federal Home Loan Mortgage Corporation (“FHLMC”) and Federal National Mortgage Association (“FNMA”). These securities are fixed rate and were purchased at premiums or discounts. They have maturity dates from one to 30 years and have contractual cash flows guaranteed by agencies of the U.S. Government. Because the decline in market value is attributable to changes in interest rates and not credit quality, and because we have the ability and intent to hold these investments until a recovery of fair value, which may be maturity, we do not consider these investments to be other-than-temporarily impaired at December 31, 2006.
Municipal Securities: We classify these securities issued by state and political subdivisions as held to maturity (“HTM”) and available for sale (“AFS”). The HTM securities are purchased directly from the municipalities and are generally not rated by a credit rating agency. The AFS securities are rated as investment grade by various credit rating agencies. Both the HTM and AFS securities are at fixed and variable rates with maturities from one to 25 years. MarketFair values of these securities are highly driven by interest rates. We perform annual or more frequent credit quality reviews as appropriate on these issues. Because the decline in marketfair value is attributable to changes in interest rates and not credit quality, and because we have the ability and intent to hold those investments until a recovery of fair value, which may be maturity, we do not consider these investments to be other-than-temporarily impaired at December 31, 2006.2008.
Asset-backed securities
Mortgage/Asset-BackedTrust preferred securities—banks and Other Debt Securitiesinsurance: The mortgage-backedThese CDO securities are comprised largely ofboth fixed and variable rate residential mortgage-backedpools of trust preferred securities related to banks and insurance companies. They are rated by one or more Nationally Recognized Statistical Rating Organizations (“NRSROs”) which are rating agencies registered with the Securities and Exchange Commission (“SEC”). They were purchased generally at par. Unrealized losses were caused mainly by the following factors: (1) collateral deterioration due to bank failures and credit concerns across the banking sector; (2) widening of credit spreads for asset-backed securities; and (3) general illiquidity in the market for CDOs. Our ongoing review of these securities in accordance with the
previous discussion and our policy in Note 1 determined that OTTI should be recorded on certain of these securities. See subsequent summary.
Trust preferred securities—real estate investment trusts (“REIT”): These CDO securities are both fixed and variable rate pools of trust preferred securities related to real estate investment trusts, and rated by one or more NRSROs. They were purchased generally at par. Unrealized losses were caused mainly by severe deterioration in mortgage REITs and homebuilder credit in addition to the same factors previously discussed for banks and insurance CDOs. Our ongoing review of these securities in accordance with the previous discussion and our policy in Note 1 determined that OTTI should be recorded on certain of these securities. See subsequent summary.
Other asset-backed securities: The majority of these CDO securities were purchased from Lockhart Funding, LLC (“Lockhart”) as discussed in Note 6 and were adjusted to fair value. Approximately $63 million consist of certain structured asset-backed CDOs (“ABS CDOs”) (also known as diversified structured finance CDOs) which have some exposure to subprime and home equity mortgage securitizations. Approximately $11 million of the collateral backing the ABS CDOs is subprime mortgage securitizations and $7 million is home equity credit line securitizations. Our ongoing review of these securities in accordance with the previous discussion and our policy in Note 1 determined that OTTI should be recorded on certain of these securities. See subsequent summary.
U.S. Government agencies and corporations
Agency securities: Unrealized losses were caused by changes in interest rates. The agency securities consist of discount notes and medium term notes issued by the Government NationalFederal Agricultural Mortgage AssociationCorporation (“GNMA”FAMC”), FAMC, FHLMC, or FNMA. The mortgage-backedFederal Home Loan Bank (“FHLB”), Federal Farm Credit Bank and Federal Home Loan Mortgage Corporation (“FHLMC”). These securities are also comprised of variablefixed rate unrated commercial mortgage-backed securities from small business loan securitizations by Zions Bank. Unrealized losses on the residential mortgage-backed securitiesand were caused by interest rate increases. These securities are purchased at premiums or discounts. The asset-backed securities are investment grade
rated pools of trust preferred securitiesThey have maturity dates from one to 30 years and other corporate debt. The asset-backed securities include both fixed and variable rate securities. Unrealized losses on the fixed rate securities were cause largelyhave contractual cash flows guaranteed by interest rate increases. The asset-backed securities and commercial mortgage-backed securities from the small business loan securitizations are reviewed quarterly to assess credit quality and determine if any impairment is other than temporary. The following factors are considered: 1) credit migration and credit structure/subordination; 2) cash flow performance and expectation; 3) market prices and/or recovery assumptions; 4) severity and duration of impairment; 5) sector trends; and 6) price volatility. Becauseagencies of the above analysisU.S. Government. In the latter half of 2008, the U.S. Government provided substantial liquidity to FHLMC to bolster its creditworthiness. Because the decline in fair value is generally attributable to interest rates and not credit quality, and because we have the ability and intent to hold these investments until a recovery of fair value, which may be maturity, we do not consider these investments to be other-than-temporarily impaired at December 31, 2006.2008.
Agency guaranteed mortgage-backed securities: Unrealized losses were caused by changes in interest rates. The agency mortgage-backed securities are comprised largely of fixed and variable rate residential mortgage-backed securities issued by the Government National Mortgage Association (“GNMA”), Federal National Mortgage Association (“FNMA”), FAMC or FHLMC. They have maturity dates from one to 30 years and have contractual cash flows guaranteed by agencies of the U.S. Government. In the latter half of 2008, the U.S. Government provided substantial liquidity to both FNMA and FHLMC to bolster their creditworthiness. Because the decline in fair value is generally attributable to changes in interest rates and not credit quality, and because we have the ability and intent to hold these investments until a recovery of fair value, which may be maturity, we do not consider these investments to be other-than-temporarily impaired at December 31, 2008.
Small Business Administration (“SBA”) loan-backed securities: These securities were generally purchased at premiums with maturities from five to 25 years and have principal cash flows guaranteed by the SBA. Because the decline in fair value is not attributable to credit quality, and because we have the ability and intent to hold these investments until a recovery of fair value, which may be maturity, we do not consider these investments to be other-than-temporarily impaired at December 31, 2008.
The following summarizes the amounts of recognized OTTI according to the previously discussed categories(in millions):
| 2008 | 2007 | |||||||||||||||||
| HTM | AFS | Total | HTM | AFS | Total | |||||||||||||
Asset-backed securities: | ||||||||||||||||||
Trust preferred securities – banks and insurance | $ | (187.7 | ) | (15.6 | ) | (203.3 | ) | – | – | – | ||||||||
Trust preferred securities – real estate investment trusts | – | (64.8 | ) | (64.8 | ) | – | (108.6 | ) | (108.6 | ) | ||||||||
Other (including ABS CDOs) | (20.0 | ) | (15.9 | ) | (35.9 | ) | – | – | – | |||||||||
| $ | (207.7 | ) | (96.3 | ) | (304.0 | ) | – | (108.6 | ) | (108.6 | ) | |||||||
We review all investment securities for impairment on an ongoing basis according to our policy described in Note 1. In 2006, as a result of our review on an equity investment, we recorded an impairment loss of approximately $2.5 million, which was included in equity securities gains (losses) in the statement of income. At December 31, 20062008 and 2005,2007, respectively, 1,552632 and 1,505807 HTM and 623739 and 660774 AFS investment securities were in an unrealized loss position.
The following summarizes realized gains and losses, including OTTI, that are recognized in the statement of income as equity securities gains (losses) and fixed income securities gains(in millions):
| 2006 | 2005 | 2004 | 2008 | 2007 | 2006 | ||||||||||||||||||||||||
| Gross gains | Gross losses | Gross gains | Gross losses | Gross gains | Gross losses | Gross gains | Gross losses | Gross gains | Gross losses | Gross gains | Gross losses | ||||||||||||||||||
Investment securities: | |||||||||||||||||||||||||||||
Available for sale | $ | 18.5 | (17.4) | 3.9 | (2.8) | 4.2 | (0.8) | ||||||||||||||||||||||
Held-to-maturity | $ | – | 208.5 | – | – | – | – | ||||||||||||||||||||||
Available-for-sale | 4.6 | 110.2 | 6.5 | 159.5 | 18.5 | 17.4 | |||||||||||||||||||||||
Other noninterest-bearing investments: | |||||||||||||||||||||||||||||
Securities held by consolidated SBICs | 26.3 | (6.6) | 6.1 | (8.5) | 15.4 | (22.5) | |||||||||||||||||||||||
Securities held byconsolidated SBICs | 10.5 | 18.9 | 20.1 | 4.7 | 26.3 | 6.6 | |||||||||||||||||||||||
Other | 3.5 | – | 0.9 | (0.1) | 1.0 | (4.6) | 20.1 | 13.1 | 0.4 | 0.3 | 3.5 | – | |||||||||||||||||
| $ | 48.3 | (24.0) | 10.9 | (11.4) | 20.6 | (27.9) | 35.2 | 350.7 | 27.0 | 164.5 | 48.3 | 24.0 | |||||||||||||||||
Net gains (losses) | $ | (315.5 | ) | (137.5 | ) | 24.3 | |||||||||||||||||||||||
Statement of income information: | |||||||||||||||||||||||||||||
Impairment losses on investment securities | $ | (304.0 | ) | (108.6 | ) | ||||||||||||||||||||||||
Valuation losses on securities purchased from | (13.1 | ) | (49.6 | ) | |||||||||||||||||||||||||
| (317.1 | ) | (158.2 | ) | ||||||||||||||||||||||||||
Equity securities gains, net | 0.8 | 17.7 | 17.9 | ||||||||||||||||||||||||||
Fixed income securities gains, net | 0.8 | 3.0 | 6.4 | ||||||||||||||||||||||||||
Net gains (losses) | $ | (315.5 | ) | (137.5 | ) | 24.3 | |||||||||||||||||||||||
Adjusted for expenses, minority interest, and income taxes, consolidated net income includes income (losses)The valuation losses from consolidated Small Business Investment Companies (“SBICs”)purchases of approximately $4.1 millioncertain Lockhart securities are discussed in 2006, $(2.2) million in 2005, and $(4.5) million in 2004. The carrying value of securities held by these SBICs was $97.3 million and $74.5 million at December 31, 2006 and 2005, respectively.
Note 6.
As of December 31, 20062008 and 2005,2007, securities with an amortized cost of $2.9$1.8 billion and $2.7 billion, respectively, were pledged to secure public and trust deposits, advances, and for other purposes as required by law. As described in Note 11, securities are also pledged as collateral for security repurchase agreements.
5. LOANS AND ALLOWANCE FOR LOAN LOSSES
Loans are summarized as follows at December 31(in thousands):
| 2006 | 2005 | ||||
Loans held for sale | $ | 252,818 | 256,236 | ||
Commercial lending: | |||||
Commercial and industrial | 8,422,094 | 7,192,112 | |||
Leasing | 442,440 | 372,647 | |||
Owner occupied | 6,260,224 | 4,825,375 | |||
Total commercial lending | 15,124,758 | 12,390,134 | |||
Commercial real estate: | |||||
Construction and land development | 7,482,896 | 6,065,250 | |||
Term | 4,951,654 | 4,639,869 | |||
Total commercial real estate | 12,434,550 | 10,705,119 | |||
Consumer: | |||||
Home equity credit line and other consumer real estate | 1,850,371 | 1,830,344 | |||
1-4 family residential | 4,191,953 | 4,130,167 | |||
Bankcard and other revolving plans | 295,314 | 206,724 | |||
Other | 456,942 | 536,927 | |||
Total consumer | 6,794,580 | 6,704,162 | |||
Foreign loans | 2,814 | 5,211 | |||
Other receivables | 209,416 | 191,396 | |||
Total loans | $ | 34,818,936 | 30,252,258 | ||
| 2008 | 2007 | ||||
Loans held for sale | $ | 200,318 | 207,943 | ||
Commercial lending: | |||||
Commercial and industrial | 11,447,370 | 10,406,882 | |||
Leasing | 431,139 | 502,601 | |||
Owner occupied | 8,742,809 | 7,544,918 | |||
Total commercial lending | 20,621,318 | 18,454,401 | |||
Commercial real estate: | |||||
Construction and land development | 7,515,584 | 7,868,928 | |||
Term | 6,196,165 | 5,334,385 | |||
Total commercial real estate | 13,711,749 | 13,203,313 | |||
Consumer: | |||||
Home equity credit line | 2,004,631 | 1,608,009 | |||
1-4 family residential | 3,876,964 | 3,974,925 | |||
Construction and other consumer real estate | 774,158 | 945,293 | |||
Bankcard and other revolving plans | 373,972 | 347,248 | |||
Other | 385,032 | 459,768 | |||
Total consumer | 7,414,757 | 7,335,243 | |||
Foreign loans | 43,413 | 51,206 | |||
Total loans | $ | 41,991,555 | 39,252,106 | ||
Owner occupied and commercial term loans included unamortized premium of approximately $97.1$155.1 million and $43.1$127.6 million at December 31, 20062008 and 2005,2007, respectively.
As of December 31, 20062008 and 2005,2007, loans with a carrying value of $3.7$9.4 billion and $3.1$6.4 billion, respectively, were included as blanket pledges of security for FHLB advances. Actual FHLB advances against these pledges were $631$128 million and $228$2,853 million at December 31, 20062008 and 2005,2007, respectively.
We sold loans totaling $950 million in 2008, $1,125 million in 2007, and $1,014 million in 2006 $885 million in 2005, and $687 million in 2004 that were previously classified as held for sale. Income from loans sold, excluding servicing, of bothwas $9.7 million in 2008, $24.2 million in 2007, and $35.5 million in 2006. These income amounts include loans held for sale and loan securitizations, was $28.5 million in 2006, $53.9 million in 2005, and $55.3 million in 2004.
exclude impairment losses on retained interests from loan securitizations.
Changes in the allowance for loan losses are summarized as follows ((in thousands)thousands):
| 2006 | 2005 | 2004 | 2008 | 2007 | 2006 | ||||||||||||
Balance at beginning of year | $ | 338,399 | 271,117 | 268,506 | $ | 459,376 | 365,150 | 338,399 | |||||||||
Allowance of loans sold with branches | – | – | (2,067) | ||||||||||||||
Allowance for loan losses of companies acquired | – | 49,217 | – | ||||||||||||||
Allowance of companies acquired | – | 7,639 | – | ||||||||||||||
Allowance associated with purchased securitized loans | 1,756 | – | – | ||||||||||||||
Allowance of loans and leases sold | (804 | ) | (2,034 | ) | – | ||||||||||||
Additions: | |||||||||||||||||
Provision for loan losses | 72,572 | 43,023 | 44,067 | 648,269 | 152,210 | 72,572 | |||||||||||
Recoveries | 19,971 | 17,811 | 20,265 | 21,026 | 15,095 | 19,971 | |||||||||||
Deductions: | |||||||||||||||||
Loan charge-offs | (65,792) | (42,769) | (59,654) | (414,687 | ) | (78,684 | ) | (65,792 | ) | ||||||||
Reclassification to reserve for unfunded lending commitments | (27,937 | ) | – | – | |||||||||||||
Balance at end of year | $ | 365,150 | 338,399 | 271,117 | $ | 686,999 | 459,376 | 365,150 | |||||||||
The reclassification reflects a refinement in the reserving process to include in the reserve for unfunded lending commitments the reserves for all unfunded lending commitments, including unfunded portions of partially funded credits previously reserved for as part of the allowance for loan losses. The reserve is included in other liabilities in the balance sheet and was increased by the reclassification during the fourth quarter of 2008.
Nonaccrual loans were $66$946 million and $69$259 million at December 31, 20062008 and 2005,2007, respectively. Loans past due 90 days or more as to interest or principal and still accruing interest were $44$130 million and $17$77 million at December 31, 20062008 and 2005,2007, respectively.
Our recorded investment in impaired loans was $47$770 million and $31$226 million at December 31, 20062008 and 2005,2007, respectively. Impaired loans of $18$306 million and $14$103 million at December 31, 20062008 and 20052007 required an allowance of $6$52 million and $3$21 million, respectively, which is included in the allowance for loan losses.
Contractual interest due on impaired loans was $38.9 million in 2008, $9.9 million in 2007, and $3.3 million in 2006, $2.6 million in 2005, and $3.6 million in 2004.2006. Interest collected on these loans and included in interest income was $0.6$4.7 million in 2006, $0.32008, $1.9 million in 2005,2007, and $0.6 million in 2004.2006. The average recorded investment in impaired loans was $499 million in 2008, $135 million in 2007, and $39 million in 2006, $33 million in 2005, and $49 million in 2004.
In December 2003, the American Institute of Certified Public Accountants issued Statement of Position 03-3 (“SOP 03-3”),Accounting for Certain Loans or Debt Securities Acquired in a Transfer. SOP 03-3 requires acquired impaired loans for which it is probable that the investor will be unable to collect all contractually required payments receivable to be recorded at the present value of amounts expected to be received and prohibits carrying over or creating valuation allowances in the initial accounting for these loans. Loans carried at fair value, mortgage loans held for sale, and loans to borrowers in good standing under revolving credit agreements are excluded from the scope of SOP 03-3. The guidance is effective for loans acquired in fiscal years beginning after December 15, 2004.
We acquired approximately $14.1 million of impaired loans in the Amegy acquisition which closed on December 3, 2005. These loans were recorded at their fair value of $13.5 million with no associated allowance for loan losses in accordance with the provisions of SOP 03-3. Additional disclosures under SOP 03-3 are not provided because the amounts are not significant.
2006.
Concentrations of credit risk from financial instruments (whether on- or off-balance sheet) occur when groups of customers or counterparties havinghave similar economic characteristics and are unable to meet contractual obligations when similarly affected by changes in economic or other conditions. Credit risk includes the loss that would be recognized subsequent to the reporting date if counterparties failed to perform as contracted. We have no significant exposure to any individual borrower. See Note 7 for a discussion of counterparty risk associated with the Company’s derivative transactions.
Most of our business activity is with customers located in the states of Utah, California, Texas, Arizona, Nevada, Colorado, Idaho, and Washington. The commercial loan portfolio is well diversified, consisting of 13nine major industry classification groupings based on Standard Industrial Classification codes. As of December 31, 2006,2008, the larger concentrations of risk were in the commercial, loan and leasing portfolios are represented by the real estate, and construction and services groupings. We have no significant exposure to highly-leveraged transactions.portfolios. See discussion in Note 18 regarding commitments to extend additional credit.
6. ASSET SECURITIZATIONS AND OFF-BALANCE SHEET ARRANGEMENT
SFAS No. 140,Accounting for Transfers and Servicing of Financial Assets and Extinguishments of Liabilities, and related accounting pronouncements, provides accounting and reporting guidance for sales, securitizations, and servicing of receivables and other financial assets, secured borrowing and collateral transactions, and the extinguishment of liabilities.
On September 15, 2008, the FASB issued a proposed amendment,Accounting for Transfers of Financial Assets, an amendment of FASB Statement No. 140, that among other things, would remove the concept of a qualifying special-purpose entity (“QSPE”) and remove the exception from applying FIN 46(R) to QSPEs. The proposed amendment would be effective for calendar-year companies beginning in 2010. Management is monitoring these developments as they relate to the operations and existence of Lockhart.
WeOn December 11, 2008, the FASB issued FSP FAS 140-4 and FIN 46(R)-8,Disclosures about Transfers of Financial Assets and Interest in Variable Interest Entities. This FSP is currently effective for December 31, 2008 reporting by public companies. It amends SFAS 140 and FIN 46(R) to expedite the effective date of the disclosure requirements in the proposed amendment to SFAS 140 discussed previously. The FSP requires additional disclosures regarding, among other things, a transferor’s continuing involvement in financial assets transferred to a special-purpose entity or a VIE and the impact of such involvement on its financial statements. The following disclosures include these additional requirements; however, as of December 31, 2008, our activity regarding the transfer of financial assets under SFAS 140 was not considered significant.
Zions Bank previously sold small business loans to securitization trusts held by Lockhart, an off-balance sheet QSPE securities conduit. Zions Bank had also sold home equity loans for cash to a revolving securitization structure for which westructure. No small business loans were sold during 2008, 2007 or 2006 and the sale of home equity loans was discontinued in December 2006. Zions Bank also had retained servicing responsibilities and receive servicing fees. On an annualized basis, these fees approximate 0.5% of the outstanding loan balances. We recognized pretax gainssubordinated interests from these loan securitizations of $4.7 million in 2006, $6.3 million in 2005, and $8.7 million in 2004. In December 2006, we discontinued selling these loans to the securitization structure.
We retain subordinated tranche interests or cash reserve accounts that serve as credit enhancements on the securitizations. These retained interests provide usCompany included them with rights to future cash flows arising after the investorsother assets in the securitizations have received the return for which they contracted, and after administrative and other expenses have been paid. The investors and the securitization vehicles have no recourse to other assets of the Company for failure of debtors to pay when due. Our retained interests are subject to credit, prepayment, and interest rate risks on the transferred loans and receivables.balance sheet.
The gain or loss on the sale of loans and receivables iswas the difference between the proceeds from the sale and the basis of the assets sold. The basis iswas determined by allocating the previous carrying amount between the assets sold and the retained interests, based on their relative fair values at the date of transfer. Fair values arewere based upon market prices at the time of sale for the assets and the estimated present value of future cash flows for the retained interests.
We have also sold small business loans to securitization structures prior to 2006. Except for the revolving features, the general characteristics of the Income recognized from previous securitizations, and rights of the Company described previously also pertain to these transactions. Annualizedexcluding servicing fees, approximate 1% of the outstandingwas $2.3 million in 2007 and $4.7 million in 2006.
For these loan balances. Forsecuritizations, Zions Bank retained servicing responsibilities and received servicing fees. A servicing asset was not established for most small business loan sales we do not establish a servicing asset because the lack of an active market doesdid not make it practicable to estimate the fair value of servicing. For sales previous to 2006, we recognized pretax gains
As subsequently discussed in greater detail, during 2008, Zions Bank completed the purchase of $2.6 million in 2005 and $0.8 million in 2004.
Key economic assumptions used for measuring theall retained interests atfor prior years’ small business loan securitizations and recorded the datepreviously sold loans on its balance sheet. Zions Bank also exercised its “cleanup call” rights and redeemed the remaining stated balances plus accrued interest of sale for securitizations are as follows:all home equity loans previously securitized. No gain or loss was recognized on any of these purchases or redemptions.
| Home equity loans | Small business loans | |||||
2006: | ||||||
Prepayment method | na(1) | na(2) | ||||
Annualized prepayment speed | na(1) | na(2) | ||||
Weighted average life (in months) | 11 | na(2) | ||||
Expected annual net loss rate | 0.10% | na(2) | ||||
Residual cash flows discounted at | 15.0% | na(2) | ||||
2005: | ||||||
Prepayment method | na(1) | CPR(3) | ||||
Annualized prepayment speed | na(1) | 4 - 15 Ramp in 25 months(4) | ||||
Weighted average life (in months) | 12 | 69 | ||||
Expected annual net loss rate | 0.10% | 0.40% | ||||
Residual cash flows discounted at | 15.0% | 15.0% | ||||
2004: | ||||||
Prepayment method | na(1) | CPR(3) | ||||
Annualized prepayment speed | na(1) | 10, 15 Ramp-up(5) | ||||
Weighted average life (in months) | 11 | 64 | ||||
Expected annual net loss rate | 0.10% | 0.50% | ||||
Residual cash flows discounted at | 15.0% | 15.0% | ||||
Certain cash flows between the CompanyZions Bank and the securitization structures are summarized as follows(in millions):
| 2006 | 2005 | 2004 | 2008 | 2007 | 2006 | ||||||||||
Proceeds from new securitizations | $ | – | 707 | 605 | |||||||||||
Proceeds from loans sold into revolving securitizations | 174 | 412 | 294 | $ | – | – | 174 | ||||||||
Purchases of loans previously securitized | (1,180 | ) | – | – | |||||||||||
Servicing fees received | 23 | 23 | 20 | 6 | 17 | 23 | |||||||||
Other cash flows received on retained interests(1) | 94 | 86 | 95 | ||||||||||||
Other cash flows received on retained interests1 | 317 | 84 | 94 | ||||||||||||
Total | $ | 291 | 1,228 | 1,014 | $ | (857 | ) | 101 | 291 | ||||||
1 | Represents total cash flows received from retained interests other than servicing fees. Other cash flows include cash from interest-only strips and cash above the minimum required level in cash collateral accounts. |
We recognizerecognized interest income on retained interests in small business loan securitizations in accordance with the provisions of EITF Issue No. 99-20,Recognition of Interest Income and Impairment on Purchased and Retained Beneficial Interests in Securitized Financial Assets.99-20. Interest income thus recognized excludingon the retained interests up to the time of their purchase was $0.6 million in 2008, $10.6 million in 2007, and $12.7 million in 2006. These amounts did not include interest income on revolving securitizations which arewere accounted for similar to trading securities, was $12.7 million in 2006, $17.7 million in 2005, and $22.5 million in 2004.securities.
In 2006, we adjusted our valuation assumptions for retained interests from certain previous securitizations. EITF 99-20 requires periodic updates of the assumptions used to compute estimated cash flows for retained interests and to comparea comparison of the net present value of these cash flows to the carrying value. We comply with EITF 99-20 by quarterly evaluating and updating our assumptions including the default assumptions as compared to historical credit losses and the credit loss expectation of the portfolio, and our prepayment speed assumptions as compared to historical prepayment speeds and the prepayment rate expectation. During this reevaluation, we also decreased the discount rate from 15% to a range of 12% - 14% on retained interest securities based on the analysis required by EITF 99-20. An impairment charge is required if the estimated market yieldfair value of the retained interests is lower than the current accretable yield and the security has a market value less than its carrying value. Based on adjustments to assumptions for prepayment speeds, discount rates, and expected credit losses, weZions Bank recorded impairment losses totaling $12.6 million in 2007 and $7.1 million in 2006 on the value of the retained interests from certain small business loan securitizations. The primary factor that influenced the impairment was higher prepayment speeds than previously estimated.
Servicing fee income on all securitizations was $6.1 million in 2008, $17.2 million in 2007, and $23.3 million in 2006, $22.7 million in 2005, and $20.4 million in 2004.2006. All amounts of pretax gains,interest income, impairment losses, interest income, and servicing fee income are included in loan sales and servicing income in the statement of income.
Key economic assumptions for all securitizations outstanding at December 31, 2006 and the sensitivity of the current fair value of capitalized residual cash flows to immediate 10% and 20% adverse changes in those assumptions are as follows at December 31, 2006(in millions of dollars and annualized percentage rates):
Small business loans Carrying amount/fair value of capitalized residual cash flows Weighted average life (in months) Prepayment speed assumption Decrease in fair value due to adverse change Expected credit losses Decrease in fair value due to adverse change Residual cash flows discount rate Decrease in fair value due to adverse change Home equity
loans $ 4.5 78.6 11 32 - 62 na(1) 12.5% - 28.0%(2) 10% $ 0.1 3.0 20% $ 0.1 5.7 0.10% 0.20% - 0.50% 10% $ 0.1 1.3 20% $ 0.1 2.5 12.0% 13.0% - 13.8% 10% $ 0.1 2.4 20% $ 0.1 4.7
These sensitivities are hypothetical and should be used with caution. As the figures indicate, changes in fair value based on variations in assumptions cannot be extrapolated, as the relationship of the change in assumption to the change of fair value may not be linear. Also, the effect of a variation in one assumption is in reality, likely to further cause changes in other assumptions, which might magnify or counteract the sensitivities.
At December 31, 2006 and 2005, the weighted average expected static pool credit losses for small business loans were 0.95% and 1.66%. Static pool losses are calculated by summing the actual and projected future credit losses and dividing them by the original balance of each pool of assets.
The following table presents quantitative information about delinquencies and net credit losses for those categories of loans for which securitizations existed at December 31. The Company only securitizes loans originated or purchased by Zions Bank. Therefore, only loans and related delinquencies and net credit losses of commonly managed Zions Bank loans are included(in millions):
Principal balance of loans past due 30+ days(1) Home equity loans Small business loans Total loans managed or securitized – Zions Bank Less loans securitized – Zions Bank(3) Loans held in portfolio – Zions Bank Principal balance
December 31,
December 31, Net credit losses(2) 2006 2005 2006 2005 2006 2005 2004 $ 726.0 663.1 0.4 0.9 0.2 (0.1) 0.2 3,677.0 3,282.8 37.8 27.7 3.2 2.3 (0.4) 4,403.0 3,945.9 38.2 28.6 3.4 2.2 (0.2) 2,051.0 2,796.4 $ 2,352.0 1,149.5
Zions Bank provides a liquidity facility (“Liquidity Facility”) for a fee to Lockhart, Funding, LLC (“Lockhart”), a qualifying special-purpose entity (“QSPE”) securities conduit. Lockhart purchaseswhich was structured to purchase floating rate U.S. Government and AAA-rated securities with funds from the issuance of asset-backed commercial paper. Zions Bank also provides interest rate hedging support and administrative and investment advisory services for a fee.
Pursuant to the Liquidity Facility contract,Agreement, Zions Bank is required to purchase nondefaulted securities from Lockhart to provide funds for Lockhart to repay maturing commercial paper upon Lockhart’s inability to access a sufficient amount of funding in the commercial paper market, or upon a commercial paper market disruption as specified in governing documents for Lockhart. Pursuant to the governing documents, including the liquidity agreement,Liquidity Agreement, if any security in Lockhart is downgraded below AA-, or the downgrade of one or more securities results in more than ten securities having ratings of AA+ to AA-, Zions Bank must either 1) place its letter of credit on the security, 2) obtain credit enhancement from a third party, or 3) purchase the security from Lockhart at book value. At any given time, the maximum commitment of Zions Bank may incur losses if it is required to purchase securities from Lockhart when the fair value of the securities at the time of purchase is less than book value.
During 2008 and the fourth quarter of 2007, Zions Bank purchased an aggregate of $1,145 million and $895 million, respectively, of securities at book value of Lockhart’sfrom Lockhart. Of these purchases, $870 million and $55 million, respectively, were required by the Liquidity Agreement when the securities, portfolio,and MBIA Inc. which is not allowed to exceed the sizeinsured certain of the Liquidity Facility commitment. securities, were downgraded below AA-. The remaining $275 million and $840 million, respectively, were due to the inability of Lockhart to issue a sufficient amount of commercial paper.
As a result of these purchases, Zions Bank recorded valuation losses of approximately $13.1 million in 2008 and $49.6 million in 2007, which were included in the statement of income with the $317.1 million in 2008 and $158.2 million in 2007 of “Impairment losses on investment securities and valuation losses on securities purchased from Lockhart Funding.”
The securities purchased in 2008 included $987 million which comprised the entire remaining small business loan securitizations created by Zions Bank and held by Lockhart. Upon dissolution of the securitization trusts (including a total of $170 million of related securities owned by the Parent), Zions Bank recorded $1,180 million of loans on its balance sheet including $23 million of premium. See further discussion of this premium in Note 21.
At December 31, 2006,2008, the book value of Lockhart’s securities portfolio was $4.1 billion,approximately $738 million which approximated marketexceeded the fair value by approximately $119 million. The securities portfolio consisted of $191 million of SBA loan-backed securities, $504 million of bank and insurance trust preferred CDOs, $36 million of REIT trust preferred CDOs, and $7 million of other securities.
The commitment of Zions Bank to Lockhart cannot exceed the book value of Lockhart’s securities portfolio. Lockhart is limited in size by program agreements, agreements with rating agencies, and the size of the Liquidity Facility commitment was $6.12 billion. No amounts were outstanding underliquidity facility.
As permitted by the Liquidity Facilitygoverning documents, the Company has also purchased asset-backed commercial paper from Lockhart and held approximately $412 million on its balance sheet at December 31, 2006.
In June 2005 under the Liquidity Facility contract, Zions Bank repurchased for the first time a bond security from2008. The average amount of Lockhart at its book value of $12.4 million because of a rating downgrade. In 2005, Zions Bank recognized an impairment loss of $1.6 million, and in 2006, recognized a gain of $0.8 million when the security was sold. The amounts arecommercial paper included in fixed income securities gainsmoney market investments for 2008 was approximately $865 million. These purchases were made to provide liquidity to Lockhart due to ongoing contraction and disruptions in the statementasset-backed commercial paper markets. In November 2008, Lockhart elected to participate in the Federal Reserve’s Commercial Paper Funding Facility (“CPFF”) Program. The CPFF is currently expected to expire on October 31, 2009. If at any given time the Company were to own more than 90% of income for their respective years.
In February 2006, the FASB issued SFAS No. 155,Accounting for Certain Hybrid Financial Instruments, an amendment of FASB Statements No. 133 and 140. This Statement amends SFAS 133Lockhart’s outstanding commercial paper (beneficial interest), Lockhart would cease to require evaluation of all interests in securitized financial assets under SFAS 133, eliminating a previous exemption under SFAS 133 for such financial instruments. Entities must now distinguish interests that are freestanding derivatives, hybrid financial instruments containing embedded derivatives requiring bifurcation, or hybrid financial instruments containing embedded derivatives that do not require bifurcation. In addition, the Statement permits fair value remeasurement for any hybrid instrument (on an instrument-by-instrument basis) that contains an embedded derivative that would otherwise require bifurcation. The Statement also amends SFAS 140 by eliminating the prohibition onbe a QSPE from holding a derivativeand the Company would be required to consolidate Lockhart in its financial instrument that pertains to a beneficial interest other than another derivative financial instrument.
In March 2006, the FASB issued SFAS No. 156,Accounting for Servicing of Financial Assets, an amendment of FASB Statement No. 140. This Statement permits entities to choose to either subsequently measure recorded servicing rights at fair value and report changes in fair value in earnings, or amortize servicing rights in proportionstatements. However, such consolidation would not be considered significant to the estimated net servicing income or loss and assess the rights for impairment or the need for an increased obligation. In addition, the Statement, among other things, clarifies when a servicer should separately recognize servicing assets and liabilities, and requires initial fair value measurement, if practicable, of such recognized assets and liabilities.
In general, both SFAS 155 and SFAS 156 are effective asfinancial position of the beginning of an entity’s fiscal year after September 15, 2006, or January 1, 2007 for calendar year-end companies. Management has concluded that the adoption of these Statements will not have a material effect on the Company’s financial statements.Company.
The FASB continues to deliberate other projects that propose to amend SFAS 140 in addition to SFAS 155 and SFAS 156. These include criteria for legal isolation of transferred assets and restrictions on permitted activities of QSPEs. The proposed amendments, among other things, may require changes to the operating activities of QSPEs and other aspects relating to the transfer of financial assets. Subject to the requirements of any final standards when they are issued, Lockhart’s operations may need to be modified to preserve its off-balance sheet status.
7. DERIVATIVE INSTRUMENTS AND HEDGING ACTIVITIES
SFAS 133, as currently amended, establishes accounting and reporting standards for derivative instruments, including certain derivative instruments embedded in other contracts, and for hedging activities. See Note 6
In March 2008, the FASB issued SFAS No. 161,Disclosures about Derivative Instruments and Hedging Activities, an amendment of FASB Statement No. 133. SFAS 161, among other things, requires greater transparency in disclosing information about derivatives including the objectives for their use, the volume of derivative activity, tabular disclosure of financial statement amounts, and any credit-risk-related features. The Statement is effective for annual and interim financial statements beginning after November 15, 2008. Management does not expect the requirements of this Statement to have a discussionsignificant impact on the Company’s financial statements and related disclosures.
In June 2008, the FASB issued a proposed amendment,Accounting for Hedging Activities, an amendment of SFAS 155.
FASB Statement No. 133, that would change current practices for hedge accounting. The “highly effective” hedging requirement would be replaced by a “reasonably effective” requirement. However, the shortcut method to assess effectiveness for interest rate swaps would be eliminated. The proposal is expected to take effect for annual and interim periods after June 15, 2009. Management is evaluating the impact this proposal may have on its hedging activities.
As required by SFAS 133, we record all derivatives on the balance sheet at fair value. See Note 21 for a discussion of the application of SFAS 157 in determining the fair value of derivatives. The accounting for changes in the fair value of derivatives depends on the intended use of the derivative and the resulting designation. Derivatives used to hedge the exposure to changes in the fair value of an asset, liability, or firm commitment attributable to a particular risk, such as interest rate risk, are considered fair value hedges. Derivatives used to hedge the exposure to variability in expected future cash flows, or other types of forecasted transactions, are considered cash flow hedges.
For derivatives designated as fair value hedges, changes in the fair value of the derivative are recognized in earnings together with changes in the fair value of the related hedged item. The net amount, if any, representing hedge ineffectiveness, is reflected in earnings. For derivatives designated as cash flow hedges, the effective portion of changes in the fair value of the derivative are recorded in other comprehensive income and recognized in earnings when the hedged transaction affects earnings. The ineffective portion of changes in the fair value of cash flow hedges is recognized directly in earnings. We assess the effectiveness of each hedging relationship by comparing the changes in fair value or cash flows on the derivative hedging instrument with the changes in fair value or cash flows on the designated hedged item or transaction. For derivatives not designated as hedges, changes in fair value are recognized in earnings.
Our objective in using derivatives is to add stability to interest income or expense, to modify the duration of specific assets or liabilities as we consider necessary,advisable, and to manage exposure to interest rate movements or other identified risks. To accomplish this objective, we use interest rate swaps and floors as part of our cash flow hedging strategy. TheThese derivatives are used to hedge the variable cash flows associated with designated commercial loans and investment securities.loans. We use fair value hedges to manage interest rate exposure to certain long-term debt. As of December 31, 2006,2008, no derivatives were designated for hedges of investments in foreign operations.
Exposure to credit risk arises from the possibility of nonperformance by counterparties. These counterparties primarily consist of financial institutions that are well established and well capitalized. We control this credit risk through credit approvals, limits, pledges of collateral, and monitoring procedures. No losses on derivative instruments have occurred as a result of counterparty nonperformance. Nevertheless, the related credit risk is considered and measured when and where appropriate. We have no significant exposure to credit default swaps.
Interest rate swap agreements designated as cash flow hedges involve the receipt of fixed-rate amounts in exchange for variable-rate payments over the life of the agreements without exchange of the underlying principal amount. Fair value hedges are used to swap certain long-term debt from fixed-rate to floating rate. Derivatives not designated as hedges, including basis swap agreements, are not speculative and are used to manage our exposure to interest rate movements and other identified risks, but do not meet the strict hedge accounting requirements of SFAS 133.
Selected information with respect to notional amounts, recorded gross fair values, and related income (expense) of derivative instruments is summarized as follows(in thousands):
| December 31, 2006 | Year ended December 31, 2006 | December 31, 2005 | Year ended December 31, 2005 | December 31, 2008 | Year ended December 31, 2008 | December 31, 2007 | Year ended December 31, 2007 | ||||||||||||||||||||||||||||||||||||||||||||||
Notional | Fair value | Interest | Other | Offset to | Notional | Fair value | Interest | Other | Offset to | Notional amount | Fair value | Interest income (expense) | Other income (expense) | Offset to interest expense | Notional amount | Fair value | Interest income (expense) | Other income (expense) | Offset to interest expense | ||||||||||||||||||||||||||||||||||
| Asset | Liability | Asset | Liability | Asset | Liability | Asset | Liability | ||||||||||||||||||||||||||||||||||||||||||||||
Cash flow hedges | |||||||||||||||||||||||||||||||||||||||||||||||||||||
Interest rate swaps | $ | 3,275,000 | 7,942 | 44,385 | (39,984) | 3,036,000 | 246 | 69,375 | 7,094 | $ | 2,405,000 | 237,912 | – | 67,134 | 3,400,000 | 133,954 | – | (39,114 | ) | ||||||||||||||||||||||||||||||||||
Basis swaps | – | – | – | – | – | – | – | 7 | |||||||||||||||||||||||||||||||||||||||||||||
Interest rate floors | 255,000 | 8,106 | – | 392 | – | – | – | – | |||||||||||||||||||||||||||||||||||||||||||||
| 3,275,000 | 7,942 | 44,385 | (39,984) | 3,036,000 | 246 | 69,375 | 7,101 | 2,660,000 | 246,018 | – | 67,526 | 3,400,000 | 133,954 | – | (39,114 | ) | |||||||||||||||||||||||||||||||||||||
Nonhedges | |||||||||||||||||||||||||||||||||||||||||||||||||||||
Interest rate swaps | 385,948 | 2,258 | 2,258 | (369) | 355,629 | 3,038 | 2,828 | (2,610) | 266,726 | 6,375 | 6,093 | (18,984 | ) | 323,934 | 508 | 508 | (123 | ) | |||||||||||||||||||||||||||||||||||
Interest rate swaps for customers | 1,108,225 | 9,198 | 9,198 | 2,442 | 725,361 | 4,794 | 4,794 | 2,402 | 2,739,173 | 104,100 | 107,270 | 2,436 | 1,924,115 | 28,752 | 28,752 | 4,049 | |||||||||||||||||||||||||||||||||||||
Energy commodity swaps for customers | 320,725 | 7,302 | 7,302 | 504 | – | – | – | – | 645,417 | 50,063 | 50,065 | 390 | 1,047,928 | 66,393 | 66,393 | 710 | |||||||||||||||||||||||||||||||||||||
Basis swaps | 3,030,000 | 2,652 | 48 | 1,008 | 2,575,000 | 3,340 | 115 | 2,333 | 1,795,000 | – | 14,693 | (18,332 | ) | 2,815,000 | 409 | 8,349 | (14,629 | ) | |||||||||||||||||||||||||||||||||||
| 4,844,898 | 21,410 | 18,806 | 3,585 | 3,655,990 | 11,172 | 7,737 | 2,125 | 5,446,316 | 160,538 | 178,121 | (34,490 | ) | 6,110,977 | 96,062 | 104,002 | (9,993 | ) | ||||||||||||||||||||||||||||||||||||
Fair value hedges | |||||||||||||||||||||||||||||||||||||||||||||||||||||
Long-term debt and other borrowings | 1,400,000 | 22,397 | – | 1,018 | 1,450,000 | 41,638 | 868 | 8,906 | |||||||||||||||||||||||||||||||||||||||||||||
Long-term debt | 1,400,000 | 235,704 | – | 35,074 | 1,400,000 | 77,436 | – | 1,989 | |||||||||||||||||||||||||||||||||||||||||||||
Total | $ | 9,519,898 | 51,749 | 63,191 | (39,984) | 3,585 | 1,018 | 8,141,990 | 53,056 | 77,980 | 7,101 | 2,125 | 8,906 | $ | 9,506,316 | 642,260 | 178,121 | 67,526 | (34,490 | ) | 35,074 | 10,910,977 | 307,452 | 104,002 | (39,114 | ) | (9,993 | ) | 1,989 | ||||||||||||||||||||||||
At December 31, 2008 in accordance with SFAS 157, the fair values of derivative assets and liabilities were reduced by net credit valuation adjustments of $12.5 million and $5.0 million, respectively. These adjustments are required to reflect both our own nonperformance risk and the respective counterparty’s nonperformance risk.
Effective January 1, 2008, we adopted the provisions of FSP FIN 39-1,Offsetting of Amounts Related to Certain Contracts. FSP FIN 39-1 permits entities to offset fair value amounts recognized for the right to reclaim cash collateral (a receivable) or the obligation to return cash collateral (a payable) against recognized fair value amounts of derivatives executed with the same counterparty under a master netting arrangement. At December 31, 2008, cash collateral was used to reduce recorded amounts of derivative assets by approximately $247 million and derivative liabilities by approximately $2 million.
Interest rate swaps and energy commodity swaps for customers result from a service we provide. Upon issuance, all of these customer swaps are immediately “hedged” by offsetting derivative contracts, such that the Company has nominimizes its net interest rate risk exposure resulting from the transaction.such transactions. Fee income from customer swaps is included in other service charges, commissions and fees. As with other derivative instruments, we have credit risk for any nonperformance by counterparties.
Other income (expense) from nonhedge derivativesinterest rate and basis swaps is included in market making, tradingfair value and nonhedge derivative income (loss) in the statement of income. Interest income on fair value hedges is used to offset interest expense on long-term debt. The change in net unrealized gains or losses for derivatives designated as cash flow hedges is separately disclosed in the statement of changes in shareholders’ equity and comprehensive income.
The amount charged to market making, trading and nonhedge derivative income in the statement of incomeAmounts for hedge ineffectiveness was approximately $0.9 million in 2005. This resulted when the hedge accounting for two cash flow derivative contracts was discontinued because it was probable that the original forecasted transactions would not occur as originally expected. During 2006 and 2004, no hedge ineffectiveness was required to be reported in earnings on the Company’s cash flow hedging relationships.
relationships are included in fair value and nonhedge derivative income (loss). For 2008 and 2006, these amounts were immaterial. For 2007, the amount was a gain of approximately $0.3 million. During 2008, we also included a loss of $1.7 million that was reclassified from other comprehensive income when it became probable that the hedged forecasted transactions would not occur.
The remaining balances of any derivative instruments terminated prior to maturity, including amounts in accumulated other comprehensive income for swap hedges, are accreted or amortized generally on a straight-line basis to interest income or expense over the period to their previously stated maturity dates.
Amounts reported in accumulated other comprehensive income related to derivatives are reclassified to interest income as interest payments are received on variable rate loans and investment securities.as amounts for terminated hedges are amortized to earnings. The change in net unrealized gains or losses on cash flow hedges discussed above reflects a reclassification of net unrealized gains or losses from accumulated other comprehensive income to interest income, as disclosed in Note 14. For 2007,2009, we estimate that an additional $38$124 million of lossesgains and accretion/amortization will be reclassified.
8. PREMISES AND EQUIPMENT
Premises and equipment are summarized as follows at December 31(in thousands):
| 2006 | 2005 | ||||
Land | $ | 151,997 | 137,231 | ||
Buildings | 346,389 | 326,200 | |||
Furniture and equipment | 485,712 | 434,131 | |||
Leasehold improvements | 108,861 | 103,280 | |||
Total | 1,092,959 | 1,000,842 | |||
Less accumulated depreciation and amortization | 483,487 | 436,097 | |||
Net book value | $ | 609,472 | 564,745 | ||
| 2008 | 2007 | ||||
Land | $ | 181,849 | 169,941 | ||
Buildings | 412,026 | 380,337 | |||
Furniture and equipment | 574,162 | 528,411 | |||
Leasehold improvements | 117,432 | 117,822 | |||
Total | 1,285,469 | 1,196,511 | |||
Less accumulated depreciation and amortization | 598,373 | 540,799 | |||
Net book value | $ | 687,096 | 655,712 | ||
9. GOODWILL AND OTHER INTANGIBLE ASSETS
Core deposit and other intangible assets and related accumulated amortization are as follows at December 31(in thousands):
| Gross carrying amount | Accumulated amortization | Net carrying amount | |||||||||||
| 2006 | 2005 | 2006 | 2005 | 2006 | 2005 | ||||||||
Core deposit intangibles | $ | 262,674 | 263,547 | (134,292) | (102,309) | 128,382 | 161,238 | ||||||
Customer relationships and | 46,246 | 40,188 | (12,494) | (2,260) | 33,752 | 37,928 | |||||||
| $ | 308,920 | 303,735 | (146,786) | (104,569) | 162,134 | 199,166 | |||||||
In 2005 as a result of the acquisition of Amegy, we recorded approximately $124.1 million of core deposit intangibles and $33.8 million of customer relationships and other intangibles. At the acquisition date, the weighted average amortization period for the Amegy intangibles was approximately 5.0 years and 3.4 years, respectively.
| Gross carrying amount | Accumulated amortization | Net carrying amount | |||||||||||||
| 2008 | 2007 | 2008 | 2007 | 2008 | 2007 | ||||||||||
Core deposit intangibles | $ | 226,700 | 287,973 | (119,650 | ) | (167,102 | ) | 107,050 | 120,871 | ||||||
Customer relationships and other intangibles | 52,350 | 52,350 | (33,465 | ) | (23,728 | ) | 18,885 | 28,622 | |||||||
| $ | 279,050 | 340,323 | (153,115 | ) | (190,830 | ) | 125,935 | 149,493 | |||||||
The amount of amortization expense of core deposit and other intangible assets is separately reflected in the statement of income. At December 31, 2006,2008, we had $0.8 million of other intangible assets with indefinite lives.
Estimated amortization expense for core deposit and other intangible assets is as follows for the five years succeeding December 31, 2006, which does not include amounts from the Stockmen’s acquisition discussed in Note 32008(in thousands):
2007 | $ | 38,299 | ||||
2008 | 27,515 | |||||
2009 | 20,892 | $ | 26,362 | |||
2010 | 17,866 | 22,716 | ||||
2011 | 12,757 | 17,249 | ||||
2012 | 14,570 | |||||
2013 | 12,402 | |||||
Changes in the carrying amount of goodwill by operating segment are as follows(in thousands):
| Zions Bank | CB&T | Amegy | NBA | NSB | Vectra | TCBW | Other | Consolidated Company | Zions Bank | CB&T | Amegy | NBA | NSB | Vectra | TCBW | Other | Consolidated Company | |||||||||||||||||||||||||||||
Balance as of January 1, 2005 | $ | 21,901 | 385,831 | – | 62,397 | 21,051 | 151,465 | – | – | 642,645 | ||||||||||||||||||||||||||||||||||||
Balance as of December 31, 2006 | $ | 21,899 | 382,119 | 1,242,942 | 62,397 | 21,051 | 151,465 | – | 18,644 | 1,900,517 | ||||||||||||||||||||||||||||||||||||
Goodwill acquired during the year | 1,248,070 | 1,187 | 1,249,257 | 1,624 | 8,477 | 106,128 | 116,229 | |||||||||||||||||||||||||||||||||||||||
Goodwill of subsidiary sold | (1,785 | ) | (1,785 | ) | ||||||||||||||||||||||||||||||||||||||||||
Tax benefit realized from share-based awards converted in acquisition | (2,069 | ) | (2,069 | ) | ||||||||||||||||||||||||||||||||||||||||||
Goodwill reclassified | (3,095 | ) | (284 | ) | (3,379 | ) | ||||||||||||||||||||||||||||||||||||||||
Balance as of December 31, 2007 | 21,738 | 379,024 | 1,249,066 | 168,525 | 21,051 | 151,465 | – | 18,644 | 2,009,513 | |||||||||||||||||||||||||||||||||||||
Goodwill of subsidiary transferred | (2,224 | ) | 2,224 | – | ||||||||||||||||||||||||||||||||||||||||||
Purchase accounting adjustments | 45 | 45 | ||||||||||||||||||||||||||||||||||||||||||||
Impairment losses | (602) | (602) | (168,570 | ) | (21,051 | ) | (151,465 | ) | (12,718 | ) | (353,804 | ) | ||||||||||||||||||||||||||||||||||
Goodwill reclassified to other liabilities | (3,712) | (3,712) | ||||||||||||||||||||||||||||||||||||||||||||
Tax benefit realized from share-based awards converted in acquisition | (120 | ) | (120 | ) | ||||||||||||||||||||||||||||||||||||||||||
Goodwill reclassified | 4 | (4,261 | ) | (4,257 | ) | |||||||||||||||||||||||||||||||||||||||||
Balance as of December 31, 2005 | 21,299 | 382,119 | 1,248,070 | 62,397 | 21,051 | 151,465 | – | 1,187 | 1,887,588 | |||||||||||||||||||||||||||||||||||||
Goodwill acquired during the year | 600 | 17,457 | 18,057 | |||||||||||||||||||||||||||||||||||||||||||
Tax benefit realized from share-based awards converted in acquisition | (4,298) | (4,298) | ||||||||||||||||||||||||||||||||||||||||||||
Purchase accounting adjustments | (830) | (830) | ||||||||||||||||||||||||||||||||||||||||||||
Balance as of December 31, 2008 | $ | 19,514 | 379,024 | 1,248,950 | – | – | – | – | 3,889 | 1,651,377 | ||||||||||||||||||||||||||||||||||||
Balance as of December 31, 2006 | $ | 21,899 | 382,119 | 1,242,942 | 62,397 | 21,051 | 151,465 | – | 18,644 | 1,900,517 | ||||||||||||||||||||||||||||||||||||
The acquisitions in 2007 of Intercon (by Amegy) and Stockmen’s (by NBA) resulted in goodwill of $8.5 million and $106.1 million, respectively, and are discussed further in Note 3. The tax benefits realized from share-based awards are discussed in Note 17.
See Note 3 for a discussionIn 2008, the $4.3 million reclassification of goodwill from the other segment related to the release of the Amegy acquisition,valuation allowance established for the determination ofacquired P5 net operating loss carryforwards, as further discussed in Note 15. In 2007, the amount$3.1 million reclassification of goodwill and subsequent purchase accounting adjustments affecting goodwill. See Note 17 for a discussion of the exercise of stock options converted in the Amegy acquisition.
See Note 3 for a discussion of the P5 acquisition and the $17.5 million of goodwill shown in the “Other” segment.
During the fourth quarter of 2006, we completed the annual goodwill impairment review required by SFAS 142 and did not recognize any impairment losses for 2006.
The 2005 impairment loss on goodwill of $0.6 million removed all of the goodwill relatedat CB&T was to Zions Bank International Ltd. (“ZBI”), an odd-lot bond trading operation, due to the Company’s decision to restructureother liabilities and ultimately close the London office in 2005. The restructuring charges of $2.4 million in 2005 and $1.1 million in 2004 relate to the ZBI restructuring.
The reduction in CB&T goodwill of $3.7 million in 2005 resulted from the recognition under FIN 48 of a portion ofthe remaining acquired state net operating loss carryforward benefits. This accounting followsbenefits following the guidancecompletion of a state tax examination.
The transfer of $2.2 million of goodwill resulted when the Parent acquired Welman from Zions Bank.
The impairment losses totaling $353.8 million reflect our company-wide annual impairment testing as of October 1, 2008 that was updated to December 31, 2008 due to continued market deterioration in the fourth quarter. The losses reflect impairment of all of the goodwill at the three subsidiary bank reporting segments and substantially all of the goodwill at P5 which is included in the other segment. The amount of the losses was determined based on the calculation process specified in SFAS 142, which compares carrying value to the estimated fair values of assets and liabilities. These fair values were estimated with the assistance of independent valuation consultants utilizing the provisions of SFAS No. 109,Accounting for Income Taxes. There was no impact on net income.
157. The estimation process took into account both market value and transaction value approaches including management estimates of projected discounted cash flow. Where applicable, we used recent valuations and transactions from banks similar in size, operations and geography to our subsidiary banks.
10. DEPOSITS
At December 31, 2006,2008, the scheduled maturities of all time deposits were as follows(in thousands):
2007 | $ | 6,820,397 | |
2008 | 421,952 | ||
2009 | 123,781 | ||
2010 | 73,328 | ||
2011 | 64,931 | ||
Thereafter | 878 | ||
| $ | 7,505,267 | ||
2009 | $ | 7,395,140 | |
2010 | 458,080 | ||
2011 | 183,930 | ||
2012 | 96,626 | ||
2013 | 98,616 | ||
Thereafter | 2,564 | ||
| $ | 8,234,956 | ||
At December 31, 2006,2008, the contractual maturities of domestic time deposits with a denomination of $100,000 and over were as follows: $1,863$1,817 million in 3 months or less, $1,125$978 million over 3 months through 6 months, $1,046$1,590 million over 6 months through 12 months, and $268$371 million over 12 months.
Domestic time deposits $100,000 and over were $4.3$4.8 billion and $2.5$4.4 billion at December 31, 20062008 and 2005,2007, respectively. Foreign time deposits $100,000 and over were $945$504 million and $980$1,113 million at December 31, 20062008 and 2005,2007, respectively.
Deposit overdrafts reclassified as loan balances were $48$39 million and $43$35 million at December 31, 20062008 and 2005,2007, respectively.
11. SHORT-TERM BORROWINGS
Selected information for certain short-term borrowings is as follows(in thousands):
| 2006 | 2005 | 2004 | 2008 | 2007 | 2006 | ||||||||||||
Federal funds purchased: | |||||||||||||||||
Average amount outstanding | $ | 1,747,256 | 1,456,531 | 1,393,344 | $ | 1,768,782 | 2,166,652 | 1,747,256 | |||||||||
Weighted average rate | 5.06% | 3.02% | 1.33% | 2.20 | % | 5.06 | % | 5.06 | % | ||||||||
Highest month-end balance | $ | 2,586,072 | 1,683,509 | 1,841,092 | $ | 2,379,055 | 2,865,076 | 2,586,072 | |||||||||
Year-end balance | $ | 1,993,483 | 1,255,662 | 1,841,092 | 965,835 | 2,463,460 | 1,993,483 | ||||||||||
Weighted average rate on outstandings at year-end | 5.16% | 3.97% | 2.19% | 0.33 | % | 3.84 | % | 5.16 | % | ||||||||
Security repurchase agreements: | |||||||||||||||||
Average amount outstanding | $ | 1,090,452 | 850,510 | 1,288,982 | $ | 964,801 | 1,044,465 | 1,090,452 | |||||||||
Weighted average rate | 3.33% | 2.30% | 1.06% | 1.50 | % | 3.73 | % | 3.33 | % | ||||||||
Highest month-end balance | $ | 1,225,107 | 1,027,658 | 1,363,420 | $ | 1,218,507 | 1,298,112 | 1,225,107 | |||||||||
Year-end balance | $ | 934,057 | 1,027,658 | 683,984 | 899,751 | 1,298,112 | 934,057 | ||||||||||
Weighted average rate on outstandings at year-end | 3.60% | 2.62% | 1.44% | 0.41 | % | 3.07 | % | 3.60 | % | ||||||||
Short-termThese short-term borrowings generally mature in less than 30 days. Our participation in security repurchase agreements is on an overnight or term basis. Certain overnight agreements are performed with sweep accounts in conjunction with a master repurchase agreement. In this case, securities under our control are pledged for and interest is paid on the collected balance of the customers’ accounts. For term repurchase agreements, securities are transferred to the applicable counterparty. The counterparty, in certain instances, is contractually entitled to sell or repledge securities accepted as collateral. As of December 31, 2006,2008, overnight security repurchase agreements were $833$605 million and term security repurchase agreements were $101$295 million.
12. FEDERAL HOME LOAN BANK ADVANCES AND OTHER BORROWINGS
FHLB short-term advances and other borrowings over one year or less are summarized as follows at December 31(in thousands):
| 2006 | 2005 | ||||
FHLB advances, 3.66% – 7.30% | $ | 130,058 | 227,488 | ||
SBA notes payable, 5.49% – 8.64% | 7,000 | 7,000 | |||
| $ | 137,058 | 234,488 | |||
FHLB short-term advances Other borrowings, one-year senior medium-term notes, 4.5% - 5.65% Federal Reserve auction borrowings, 0.42% - 1.39% Other 2008 2007 $ – 2,725,000 235,489 – 1,800,000 450,000 4,364 6,990 $ 2,039,853 3,181,990
The SBAsenior medium term notes payable are owed by a consolidated venture capital subsidiary. The weighted average interest rate on FHLB advances outstandingmature at various dates through August 2009 (see also Note 13). At December 31, 2006 and 2005 was 5.7% and 4.9%, respectively.
2008, the average remaining maturities of Federal Reserve borrowings were 33 days.
The FHLB advances arewere borrowed by banking subsidiariessubsidiary banks under their lines of credit whichthat are secured under blanket pledge arrangements. The subsidiariessubsidiary banks maintain unencumbered collateral with a carrying amount amounts
adjusted for the types of collateral pledged, equal to at least 100% of the outstanding advances. At December 31, 2006, amounts2008, the amount available for FHLB advances was approximately $8.8 billion. An additional $666 million could be borrowed upon the pledging of unused linesadditional available collateral.
The Federal Reserve borrowings were made by subsidiary banks through the Term Auction Facility. Amounts that the subsidiary banks can borrow are based upon the amount of creditcollateral pledged to a Federal Reserve Bank. At December 31, 2008, the amount available for additional Federal Reserve borrowings was approximately $4.3 billion. An additional $1.3 billion could be borrowed upon the pledging of additional available collateral.
The Company also had short-term commercial paper outstanding at December 31, 2008 of $15.5 million at rates ranging from 0.46% to 3.55% and $297.9 million at December 31, 2007.
12. FEDERAL HOME LOAN BANK LONG-TERM ADVANCES AND OTHER BORROWINGS
FHLB long-term advances over one year are as follows at December 31(in thousands):
| 2008 | 2007 | ||||
FHLB long-term advances, 3.66% - 7.30% | $ | 128,253 | 127,612 | ||
The weighted average interest rate on FHLB advances totaled $6.1 billion, subject to availability of collateraloutstanding was 5.6% and certain requirements.
5.7% at December 31, 2008 and 2007, respectively.
Interest expense on FHLB advances and other borrowings over one year was $7.4 million in 2008, $7.5 million in 2007, and $8.6 million in 2006, $11.5 million in 2005, and $11.7 million in 2004.
2006.
Maturities of FHLB advances and other borrowings with original maturities over one year are as follows at December 31, 20062008(in thousands):
2007 | $ | 2,217 | |
2008 | 3,171 | ||
2009 | 3,227 | ||
2010 | 103,619 | ||
2011 | 2,592 | ||
Thereafter | 22,232 | ||
| $ | 137,058 | ||
2009 | $ | 1,795 | |
2010 | 101,619 | ||
2011 | 2,592 | ||
2012 | 1,521 | ||
2013 | 1,941 | ||
Thereafter | 18,785 | ||
| $ | 128,253 | ||
13. LONG-TERM DEBT
Long-term debt at December 31 is summarized as follows(in thousands):
| 2006 | 2005 | ||||
Junior subordinated debentures related to trust preferred securities | $ | 467,850 | 645,459 | ||
Subordinated notes | 1,492,082 | 1,713,296 | |||
Senior notes | 394,984 | 149,112 | |||
Capital lease obligations and other | 2,805 | 3,499 | |||
| $ | 2,357,721 | 2,511,366 | |||
| 2008 | 2007 | ||||
Junior subordinated debentures related to trust preferred securities | $ | 461,888 | 462,033 | ||
Subordinated notes | 1,706,603 | 1,547,727 | |||
Senior medium-term notes | 324,125 | 450,655 | |||
Capital lease obligations and other | 752 | 2,839 | |||
| $ | 2,493,368 | 2,463,254 | |||
The preceding amounts represent the par value of the debt adjusted for any unamortized premium or discount or other basis adjustments related to hedgingincluding the debt with derivative instruments.value of associated hedges.
Junior subordinated debentures related to trust preferred securities primarily include GB Capital Trust (“GBCT”), CSBI Capital Trust I (“CSBICT”), Zions Capital Trust B (“ZCTB”), andAmegy Statutory Trusts I, II and III (“Amegy Trust I, II or III”), and Stockmen’s Statutory I,Trusts II and III (“Stockmen’s Trust II or III”) as follows at December 31, 20062008(in thousands):
Interest rate Early redemption/ maturity GBCT CSBICT ZCTB Statutory I Statutory II Statutory III ZCTB Amegy Trust I Amegy Trust II Amegy Trust III Stockmen’s Trust II Stockmen’s Trust III Intercontinental Statutory Trust I Balance Interest
distributions $ 2,382 10.25% Jan 2007/ Jan 2027 Semiannually 22,437 11.75% Jun 2007/ Jun 2027 Quarterly 293,545 8.00% Sep 2007/ Sep 2032 Quarterly 51,547 3mL+2.85%(1)
(8.21%) Dec 2008/ Dec 2033 Quarterly 36,083 3mL+1.90%(1)
(7.27%) Oct 2009/ Oct 2034 Quarterly 61,856 3mL+1.78%(1)
(7.14%) Dec 2009/ Dec 2034 Quarterly $ 467,850 Balance Interest
rate Early
redemption Maturity $ 293,815 8.00% Currently Sep 2032 redeemable 51,547 3mL+2.85%1 Currently Dec 2033 (4.72%) redeemable 36,083 3mL+1.90%1 Oct 2009 Oct 2034 (6.72%) 61,856 3mL+1.78%1 Dec 2009 Dec 2034 (3.78%) 7,732 3mL+3.15%1 Currently Mar 2033 (4.62%) redeemable 7,754 3mL+2.89%1 Mar 2009 Mar 2034 (4.76%) 3,101 3mL+2.85%1 Mar 2009 Mar 2034 (4.72%) $ 461,888
1 | Designation of “3mL” is three-month LIBOR (London Interbank Offer Rate); effective interest rate at the beginning of the accrual period commencing on or before December 31, |
The junior subordinated debentures are issued by the Company and relate to a corresponding series of trust preferred security obligations issued by the trusts. The trust obligations are in the form of capital securities subject to mandatory redemption upon repayment of the junior subordinated debentures by the Company. The sole assets of the trusts are the junior subordinated debentures.
Interest distributions are made quarterly at the same rates earned by the trusts on the junior subordinated debentures; however, we may defer the payment of interest on the junior subordinated debentures. Early redemption of the debentures begins at the date indicated and requires the approval of banking regulators. The debentures for GBCT, CSBICT, and ZCTB are direct and unsecured obligations of the Company and are subordinate to other indebtedness and general creditors. The debentures for StatutoryAmegy Trust I, II and III are direct and unsecured obligations of Amegy Corporation and are subordinate to other indebtedness and general creditors. The debentures for Stockmen’s Trust II and III are unsecured obligations assumed by the Company in connection with the acquisition of Stockmen’s by NBA. The Company has unconditionally guaranteed the obligations of GBCT, CSBICT, and ZCTB with respect to their respective series ofits trust preferred securities to the extent set forth in the applicable guarantee agreements.agreement. Amegy Corporation has unconditionally guaranteed the obligations of StatutoryAmegy Trust I, II and III with respect to their respective series of trust preferred securities to the extent set forth in the applicable guarantee agreements.
Subordinated notes consist of the following at December 31, 2008(in thousands):
The GBCT debentures were redeemed in January 2007.
Interest rate | Balance | Par amount | Maturity | ||||
5.65% | $ | 346,308 | 300,000 | May 2014 | |||
6.00% | 590,606 | 500,000 | Sep 2015 | ||||
5.50% | 694,689 | 600,000 | Nov 2015 | ||||
3mL+1.25%1 | 75,000 | 75,000 | Sep 2014 | ||||
(2.75%) | |||||||
| $ | 1,706,603 | ||||||
1 | Designation of “3mL” is three-month LIBOR; effective interest rate at the beginning of the accrual period commencing on or before December 31, 2008 is shown in parenthesis. |
These notes are unsecured and are not redeemable prior to maturity. Interest is payable semiannually. We hedged the ZCTB debenturesfixed-rate notes with a LIBOR-based floating interest rate swapswaps whose recorded fair value was $(0.3)values aggregated $235.7 million and $0.7$77.4 million at December 31, 20062008 and 2005,2007, respectively. We account for all swaps associated with long-term debt as fair value hedges in accordance with SFAS 133, as discussed in Note 7.
As discussed in Note 14, proceeds from the issuance of preferred stock in December 2006 The floating rate notes were used to redeem all of the $176.3 million trust preferred securities issued by Zions Institutional Capital Trust A. The Company incurred a debt extinguishment cost of $7.3 million for the call premium on the early redemption of this debt, which has been separately reflected in the statement of income.Amegy.
SubordinatedSenior medium-term notes consist of the following at December 31, 20062008(in thousands):
Interest rate | Balance | Par amount | Maturity | ||||
5.65% | $ | 306,466 | 300,000 | May 2014 | |||
6.00% | 514,745 | 500,000 | Sep 2015 | ||||
5.50% | 595,871 | 600,000 | Nov 2015 | ||||
3mL+1.25%(1) (6.625%) | 75,000 | 75,000 | Sep 2014 | ||||
| $ | 1,492,082 | ||||||
Interest rate | Balance | Interest payments | Early redemption | Maturity | |||||
3mL+1.5%1 | $ | 295,630 | Quarterly | Currently | Dec 2009 | ||||
(3.69%) | redeemable | ||||||||
5.25% - 5.45% | 28,495 | Semiannually | na | May - June 2010 | |||||
| $ | 324,125 | ||||||||
1 | Designation of “3mL” is three-month LIBOR; effective interest rate at the beginning of the accrual period commencing on or before December 31, |
TheThese unsecured notes are not redeemable prior to maturity and interest is payable semiannually. We hedged the 5.65%, 6.00%, and 5.50% notes with LIBOR-based floating interest rate swaps whose recorded fair values were, respectively, $6.8 million, $15.5 million, and $0.2 million at December 31, 2006 and $6.3 million, $24.5 million, and $10.8 million at December 31, 2005. Wehave been issued the 5.50% notes in November 2005 in connection with our acquisition of Amegy, as discussed in Note 3. The three-month LIBOR notes are issued by Amegy Corporation.
In March 2006, we filed an “automaticunder a shelf registration statement”filed with the Securities and Exchange Commission (“SEC”) as a “well-known seasoned issuer.”SEC. The shelf registration replaced a previous shelf registration and covers security issuances of the Company, Zions Capital Trust C and Zions Capital Trust D. Under the new shelf registration, we issued the following floating rate senior notes(in thousands):
Interest rate | Balance | Par amount | Maturity | ||||
3mL+0.12%(1) (5.494%) | $ | 249,984 | 250,000 | Apr 2008 | |||
3mL+0.12%(1) (5.48%) | 145,000 | 145,000 | Sep 2008 | ||||
| $ | 394,984 | ||||||
The notes are not redeemable prior to maturity and interest is payable quarterly. Proceeds from the issuance of thesefixed-rate two-year notes were used to retire previous indebtedness of seniorsold via the Company’s online auction process and subordinated notes.
direct sales.
Interest expense on long-term debt was $103.1 million in 2008, $145.4 million in 2007, and $159.6 million in 2006, $104.9 million in 2005, and $74.3 million in 2004.2006. Interest expense was reduced by $35.1 million in 2008, $2.0 million in 2007, and $1.0 million in 2006 $8.9 million in 2005, and $29.2 million in 2004 as a result of the associated hedges.
Maturities on long-term debt are as follows for the years succeeding December 31, 20062008(in thousands):
| Consolidated | Parent only | ||||
2007 | $ | 557 | |||
2008 | 395,577 | 394,983 | |||
2009 | 650 | ||||
2010 | 655 | ||||
2011 | 104 | ||||
Thereafter | 1,938,049 | 1,719,394 | |||
| $ | 2,335,592 | 2,114,377 | |||
2009 2010 2011 2012 2013 Thereafter Consolidated Parent only $ 295,920 295,630 28,712 28,495 – – – – – – 1,933,001 1,707,932 $ 2,257,633 2,032,057
These maturities do not include basis adjustments and the associated hedges. The Parent only maturities at December 31, 20062008 include $324.7$309.3 million of junior subordinated debtdebentures payable to GBCT, CSBICT,ZCTB and ZCTBStockmen’s Trust II and III after 2011.2013.
On January 15, 2009, we issued $254.9 million of senior floating rate notes due June 21, 2012 at a coupon rate of three-month LIBOR plus 37 basis points. The debt is guaranteed under the FDIC’s Temporary Liquidity Guarantee Program that became effective on November 21, 2008.
14. SHAREHOLDERS’ EQUITY
On December 7, 2006, we issued 240,000We have 3,000,000 authorized shares of ourpreferred stock without par value and with a liquidation preference of $1,000 per share. In general, preferred shareholders may receive asset distributions before common shareholders; however, preferred shareholders have only limited voting rights generally with respect to certain provisions of the preferred stock, the issuance of senior preferred stock, and the election of directors. Preferred stock dividends reduce earnings available to common shareholders and are paid quarterly in arrears. Redemption of the preferred stock is at the Company’s option. The redemption amount is computed at the per share liquidation preference plus any declared but unpaid dividends. The Series A and C shares are registered with the SEC.
Preferred stock at December 31 is summarized as follows(dollar amounts in thousands):
| Rate | Earliest redemption date | Shares outstanding | Carrying value | ||||||||
| 2008 | 2007 | ||||||||||
Series A | Floating | December 15, 2011 | 240,000 | $ | 240,000 | 240,000 | |||||
Series C | 9.50% | September 15, 2013 | 46,949 | 46,949 | – | ||||||
Series D, TARP Capital Purchase Program | 5.00% | November 15, 2011 | 1,400,000 | 1,294,885 | – | ||||||
| $ | 1,581,834 | 240,000 | |||||||||
The Series A Floating-Rate Non-Cumulative Perpetual Preferred Stock with an aggregate liquidation preference of $240 million, or $1,000 per share. The preferred stock was offeredissued in December 2006 in the form of 9,600,000 depositary shares with each depositary share representing a 1/40th ownership interest in a share of the preferred stock. In general, preferred shareholdersDividends are entitled to receive asset distributions before common shareholders; however, preferred shareholders have no preemptive or conversion rights, and only limited voting rights pertaining generally to amendments to the terms of the preferred stock or the issuance of senior preferred stock as well as the right to elect two directors in the event of certain defaults. The preferred stock is not redeemable prior to December 15, 2011, but will be redeemable subsequent to that date at the Company’s option at the liquidation preference value plus any declared but unpaid dividends. The preferred stock dividend reduces earnings available to common shareholders and is computed at an annual rate equal to the greater of three-month LIBOR plus 0.52%, or 4.0%. Dividend payments are made quarterly in arrears on the 15th day of March, June, September, and December, commencingDecember.
The Series C 9.50% Non-Cumulative Perpetual Preferred Stock offering was completed on March 15, 2007.
UnderJuly 2, 2008. The offering was issued in the termsform of 1,877,971 depositary shares representing a 1/40th ownership interest in a share of the preferred stock agreements,stock. The offering was sold primarily by Zions Direct, Inc., the Company’s broker/dealer subsidiary, via an online auction process and by direct sales. Generally, the other terms and conditions, including the dividend payment dates, are the same as the Series A preferred stock.
The Series D Fixed-Rate Cumulative Perpetual Preferred Stock was issued on November 14, 2008 to the U.S. Department of the Treasury for $1.4 billion. The Emergency Economic Stabilization Act of 2008 authorized the U.S. Treasury to appropriate funds to eligible financial institutions participating in the Troubled Asset Relief Program (“TARP”) Capital Purchase Program. The capital investment includes the issuance of preferred shares of the Company was requiredand a warrant to declarepurchase common shares pursuant to a Letter Agreement and a Securities Purchase agreement (collectively “the Agreement”). The preferred shares are rankedpari passu with the full quarterlySeries A and C preferred shares. The dividend rate of $3.85% increases to 9% after the first five years. Dividend payments are made on the 15th day of February, May, August, and November. The warrant allows the U.S. Treasury to purchase up to 5,789,909 shares of the Company’s common stock exercisable over a 10-year period at a price per share of $36.27. The preferred shares and the warrant qualify for Tier 1 regulatory capital. The Agreement subjects the Company to certain restrictions and conditions including those related to common dividends, share repurchases, executive compensation, and corporate governance.
We recorded the total $1.4 billion of the preferred shares and the warrant at their relative fair values of $1,292.2 million and set aside$107.8 million, respectively. The difference from the funds before it could resumepar amount of the preferred shares is accreted to preferred stock over five years using the interest method with a corresponding adjustment to preferred dividends.
During September 8-11, 2008, the Company issued $250 million of new common stock consisting of 7,194,079 shares at an average price of $34.75 per share. Net of issuance costs and fees, this issuance added $244.9 million to common stock.
In 2007 and 2006 under our stock repurchase ofplan, we repurchased 3,933,128 common shares underat a $400cost of $318.8 million repurchase authorization approved by the Board of Directors on December 11, 2006. The stock repurchase program had been suspended since July 2005 upon the announcement of our acquisition of Amegy. Under this new authorization, we repurchasedand 308,359 common shares in December 2006 at a cost of $25.0 million. We repurchased 1,159,522 common shares in 2005 at a cost of $80.7 million, and 1,734,055 common shares in 2004 at a cost of $104.9 million.respectively. Repurchased shares arewere included in stock redeemed and retired in the statements of changes in shareholders’ equity and comprehensive income. In both 2006 and 2005, weWe also repurchased $2.9 million in 2008, $3.2 million in 2007, and $1.5 million in 2006 of common shares related to the Company’s restricted stock employee incentive program.
Changes in accumulated other comprehensive income (loss) are summarized as follows(in thousands):
| Net unrealized gains (losses) on investments, retained interests and other | Net unrealized on derivative | Pension and post- retirement | Total | |||||||
Balance at December 31, 2003 | $ | 24,015 | 10,716 | (15,690) | 19,041 | |||||
Other comprehensive loss, net of tax: | ||||||||||
Net realized and unrealized holding losses, net of income tax benefit of $2,244 | (3,622) | (3,622) | ||||||||
Foreign currency translation | 803 | 803 | ||||||||
Reclassification for net realized gains recorded in operations, net of income tax expense of $881 | (1,422) | (1,422) | ||||||||
Net unrealized losses on derivative instruments, net of reclassification to operations of $44,290 and income tax benefit of $12,574 | (20,209) | (20,209) | ||||||||
Minimum pension liability, net of income tax benefit of $1,579 | (2,523) | (2,523) | ||||||||
Other comprehensive loss | (4,241) | (20,209) | (2,523) | (26,973) | ||||||
Balance at December 31, 2004 | 19,774 | (9,493) | (18,213) | (7,932) | ||||||
Other comprehensive loss, net of tax: | ||||||||||
Net realized and unrealized holding losses, net of income tax benefit of $17,580 | (28,380) | (28,380) | ||||||||
Foreign currency translation | (1,507) | (1,507) | ||||||||
Reclassification for net realized gains recorded in operations, net of income tax expense of $408 | (659) | (659) | ||||||||
Net unrealized losses on derivative instruments, net of reclassification to operations of $7,101 and income tax benefit of $25,474 | (40,771) | (40,771) | ||||||||
Minimum pension liability, net of income tax benefit of $2,426 | (3,794) | (3,794) | ||||||||
Other comprehensive loss | (30,546) | (40,771) | (3,794) | (75,111) | ||||||
Balance at December 31, 2005 | (10,772) | (50,264) | (22,007) | (83,043) | ||||||
Other comprehensive income, net of tax: | ||||||||||
Net realized and unrealized holding losses, net of income tax benefit of $4,759 | (7,684) | (7,684) | ||||||||
Foreign currency translation | 715 | 715 | ||||||||
Reclassification for net realized gains recorded in operations, net of income tax expense of $391 | (630) | (630) | ||||||||
Net unrealized gains on derivative instruments, net of reclassification to operations of $(39,984) and income tax expense of $4,572 | 8,548 | 8,548 | ||||||||
Pension and postretirement, net of income tax expense of $4,055 | 6,245 | (1) | 6,245 | |||||||
Other comprehensive income (loss) | (7,599) | 8,548 | 6,245 | 7,194 | ||||||
Balance at December 31, 2006 | $ | (18,371) | (41,716) | (15,762) | (75,849) | |||||
| Net unrealized gains (losses) on investments, retained interests and other | Net unrealized gains (losses) on derivative instruments | Pension and post- retirement | Total | ||||||||||
BALANCE, DECEMBER 31, 2005 | $ | (10,772 | ) | (50,264 | ) | (22,007 | ) | (83,043 | ) | ||||
Other comprehensive income (loss), net of tax: | |||||||||||||
Net realized and unrealized holding losses, net of income tax benefit of $4,759 | (7,684 | ) | (7,684 | ) | |||||||||
Foreign currency translation | 715 | 715 | |||||||||||
Reclassification for net realized gains recorded in operations, net of income tax expense of $391 | (630 | ) | (630 | ) | |||||||||
Net unrealized gains on derivative instruments, net of reclassification to operations of $(39,984) and income tax expense of $4,572 | 8,548 | 8,548 | |||||||||||
Pension and postretirement, net of income tax expense | 6,245 | 6,245 | |||||||||||
Other comprehensive income (loss) | (7,599 | ) | 8,548 | 6,245 | 7,194 | ||||||||
BALANCE, DECEMBER 31, 2006 | (18,371 | ) | (41,716 | ) | (15,762 | ) | (75,849 | ) | |||||
Other comprehensive income (loss), net of tax: | |||||||||||||
Net realized and unrealized holding losses, net of income tax benefit of $93,658 | (151,200 | )1 | (151,200 | ) | |||||||||
Foreign currency translation | (6 | ) | (6 | ) | |||||||||
Reclassification for net realized losses recorded in operations, net of income tax benefit of $42,541 | 60,811 | 1 | 60,811 | ||||||||||
Net unrealized gains on derivative instruments, net of reclassification to operations of $(39,114) and income tax expense of $67,375 | 106,929 | 106,929 | |||||||||||
Pension and postretirement, net of income tax expense | 480 | 480 | |||||||||||
Other comprehensive income (loss) | (90,395 | ) | 106,929 | 480 | 17,014 | ||||||||
BALANCE, DECEMBER 31, 2007 | (108,766 | ) | 65,213 | (15,282 | ) | (58,835 | ) | ||||||
Cumulative effect of change in accounting principle, adoption of SFAS 159 | 11,471 | 11,471 | |||||||||||
Other comprehensive income (loss), net of tax: | |||||||||||||
Net realized and unrealized holding losses, net of income tax benefit of $215,384 | (333,095 | )1 | (333,095 | ) | |||||||||
Foreign currency translation | (5 | ) | (5 | ) | |||||||||
Reclassification for net realized losses recorded in operations, net of income tax benefit of $119,597 | 181,524 | 1 | 181,524 | ||||||||||
Net unrealized gains on derivative instruments, net of reclassification to operations of $65,862 and income tax expense of $82,653 | 131,443 | 131,443 | |||||||||||
Pension and postretirement, net of income tax benefit | (31,461 | ) | (31,461 | ) | |||||||||
Other comprehensive income (loss) | (151,576 | ) | 131,443 | (31,461 | ) | (51,594 | ) | ||||||
BALANCE, DECEMBER 31, 2008 | $ | (248,871 | ) | 196,656 | (46,743 | ) | (98,958 | ) | |||||
1 | Includes the net after-tax effect of |
As discussed in Note 21, we adopted the SFAS 159 fair value option as of January 1, 2008 for certain securities. The cumulative effect of this adoption decreased retained earnings and increased accumulated other comprehensive income by $11.5 million.
Deferred compensation at year-end consists of the cost of the Company’s common stock held in rabbi trusts established for certain employees and directors. We consolidate the fair value of invested assets of the trusts along with the total obligations and include them in other assets and other liabilities, respectively, in the financial statements.balance sheet. At December 31, 20062008 and 2005,2007, total invested assets were approximately $54.8$53.7 million and $38.2$74.3 million and total obligations were approximately $64.4$68.1 million and $43.3$85.6 million, respectively.
At December 31, 2005,Upon the adoption of SFAS 123(R) in 2006, we reclassified deferred compensation also includedof $11.1 million to common stock. This consisted of $3.9 million for the value of Amegy’s nonvested restricted stock and stock options and $7.2 million for the unearned portion of restricted stock previously issued by the Company during 2005. As discussed in Note 17, we reclassified the total of these amounts, or $11.1 million, from deferred compensation to common stock upon the adoption of SFAS 123R.
Company.
15. INCOME TAXES
Income taxes (benefit) are summarized as follows(in thousands):
| 2006 | 2005 | 2004 | |||||
Federal: | |||||||
Current | $ | 259,759 | 250,280 | 203,852 | |||
Deferred | 9,368 | (32,362) | (21,914) | ||||
State | 48,823 | 45,500 | 38,188 | ||||
| $ | 317,950 | 263,418 | 220,126 | ||||
| 2008 | 2007 | 2006 | |||||||
Federal: | |||||||||
Current | $ | 170,268 | 351,215 | 261,423 | |||||
Deferred | (198,145 | ) | (132,541 | ) | 7,705 | ||||
| (27,877 | ) | 218,674 | 269,128 | ||||||
State: | |||||||||
Current | 17,608 | 43,224 | 47,158 | ||||||
Deferred | (33,096 | ) | (26,161 | ) | 1,664 | ||||
| (15,488 | ) | 17,063 | 48,822 | ||||||
| $ | (43,365 | ) | 235,737 | 317,950 | |||||
Income tax expense (benefit) computed at the statutory federal income tax rate of 35% reconciles to actual income tax expense (benefit) as follows(in thousands):
| 2006 | 2005 | 2004 | |||||
Income tax expense at statutory federal rate | $ | 319,523 | 259,660 | 218,537 | |||
State income taxes, net | 31,734 | 29,575 | 24,821 | ||||
Nondeductible expenses | 5,299 | 2,138 | 1,714 | ||||
Nontaxable income | (25,905) | (19,905) | (19,595) | ||||
Tax credits and other taxes | (5,999) | (5,722) | (4,902) | ||||
Other | (6,702) | (2,328) | (449) | ||||
| $ | 317,950 | 263,418 | 220,126 | ||||
| 2008 | 2007 | 2006 | ||||||||
Income tax expense at statutory federal rate | $ | (110,144 | ) | 258,124 | 319,523 | |||||
State income taxes, net | (4,883 | ) | 19,696 | 31,734 | ||||||
Uncertain state tax positions under FIN 48, including interest and penalties | (5,184 | ) | (8,605 | ) | – | |||||
Nondeductible goodwill impairment | 115,774 | – | – | |||||||
Other nondeductible expenses | 3,461 | 4,141 | 5,299 | |||||||
Nontaxable income | (27,763 | ) | (25,268 | ) | (25,905 | ) | ||||
Tax credits and other taxes | (7,766 | ) | (7,267 | ) | (5,999 | ) | ||||
Other | (6,860 | ) | (5,084 | ) | (6,702 | ) | ||||
| $ | (43,365 | ) | 235,737 | 317,950 | ||||||
The tax effects of temporary differences that give rise to significant portions of the deferred tax assets and deferred tax liabilities at December 31 are presented below(in thousands):
| 2006 | 2005 | ||||
Gross deferred tax assets: | |||||
Book loan loss deduction in excess of tax | $ | 142,117 | 131,938 | ||
Pension and postretirement | 13,343 | 17,386 | |||
Deferred compensation | 42,050 | 39,101 | |||
Deferred loan fees | 3,040 | 3,326 | |||
Accrued severance costs | 3,023 | 2,050 | |||
Loan sales | 23,467 | 33,138 | |||
Security investments and derivative market adjustments | 7,270 | 7,460 | |||
Equity investments | 2,286 | 14,125 | |||
Other | 10,336 | 20,074 | |||
| 246,932 | 268,598 | ||||
Valuation allowance | (4,510) | – | |||
Total deferred tax assets | 242,422 | 268,598 | |||
Gross deferred tax liabilities: | |||||
Core deposits and purchase accounting | (39,749) | (46,729) | |||
Premises and equipment, due to differences in depreciation | (6,395) | (11,926) | |||
FHLB stock dividends | (13,781) | (14,107) | |||
Leasing operations | (79,490) | (79,251) | |||
Prepaid expenses | (5,583) | (4,965) | |||
Prepaid pension reserves | (4,387) | (915) | |||
Other | (9,549) | (10,933) | |||
Total deferred tax liabilities | (158,934) | (168,826) | |||
Net deferred tax assets | $ | 83,488 | 99,772 | ||
| 2008 | 2007 | ||||||
Gross deferred tax assets: | |||||||
Book loan loss deduction in excess of tax | $ | 275,427 | 178,874 | ||||
Pension and postretirement | 31,367 | 12,536 | |||||
Deferred compensation | 58,255 | 55,563 | |||||
Deferred loan fees | 3,661 | 2,897 | |||||
Other real estate owned | 11,695 | 510 | |||||
Accrued severance costs | 2,654 | 2,799 | |||||
Loan sales | 6,047 | 15,819 | |||||
Security investments and derivative fair value adjustments | 212,365 | 95,546 | |||||
Equity investments | 21,343 | 6,868 | |||||
Other | 21,964 | 11,757 | |||||
| 644,778 | 383,169 | ||||||
Valuation allowance | – | (4,261 | ) | ||||
Total deferred tax assets | 644,778 | 378,908 | |||||
Gross deferred tax liabilities: | |||||||
Core deposits and purchase accounting | (46,199 | ) | (52,963 | ) | |||
Premises and equipment, due to differences in depreciation | (3,530 | ) | (1,713 | ) | |||
FHLB stock dividends | (15,168 | ) | (14,179 | ) | |||
Leasing operations | (87,939 | ) | (81,794 | ) | |||
Prepaid expenses | (7,076 | ) | (5,680 | ) | |||
Prepaid pension reserves | (5,540 | ) | (4,930 | ) | |||
Other | (29 | ) | (6,394 | ) | |||
Total deferred tax liabilities | (165,481 | ) | (167,653 | ) | |||
Net deferred tax assets | $ | 479,297 | 211,255 | ||||
The amount of net deferred tax assets is included with other assets inon the balance sheet. We analyze the deferred tax assets to determine whether a valuation allowance is required based on the more-likely-than-not criteria that such assets will be realized principally through future taxable income. This criteria takes into account the history of growth in earnings and the prospects for continued growth and profitability. The Company’s$4.3 million valuation allowance at December 31, 2007 was for net operating loss carryforwards included in our 2006 acquisition of the remaining minority interests of P5, as discussed in Note 3, included approximately $11.8 million3. The merger of P5 into NetDeposit during 2008 will allow the Company to utilize the benefits of the acquired P5 net operating loss carryforwards. The tax effect of these carryforwards, has been included in deferred tax assets. We have establishedthus eliminating the requirement for a valuation allowance at December 31, 2008. As discussed in Note 9, the release of approximately $4.5this valuation allowance during 2008 was reclassified from goodwill. The Company used $6.3 million for theseduring 2008 of the $11.1 million in carryforwards based on an analysis of P5’s operating history using the above criteria.that existed at December 31, 2007, resulting in $4.8 million in carryforwards remaining at December 31, 2008, which expire through 2025. We have also determined that a valuation allowance is not required for any other deferred tax assets.
In 2004, we signedWe have an agreement that confirmed and implemented our award ofawarded us a $100 million allocation of tax credit authority under the Community Development Financial Institutions Fund set upestablished by the U.S. Government. Under theThe program we mayallows us to invest up to $100 million in a wholly-owned subsidiary, which will makemakes qualifying loans and investments. In return, we will receive federal income tax credits that will beare recognized over seven years, including the year in which the funds were invested in the subsidiary. We recognize these tax credits for financial reporting purposes in the same year the tax benefit is recognized in our tax return. As of December 31, 2006 and 2005,2007, we had invested $90the entire $100 million and $80 million, respectively, which resulted inallocation. The resulting tax credits thatwhich reduced income tax expense bywere approximately $5.8 million in 2008, $5.6 million in 2007, and $4.5 million in 2006 and $4.0 million in 2005.2006.
In July 2006, the FASB issued FASB InterpretationEffective January 1, 2007, we adopted FIN No. 48, (“FIN 48”),Accounting for Uncertainty in Income Taxes, an interpretation of FASB Statement No. 109 Accounting for Income Taxes. FIN 48, createsas amended, prescribes a single model to address accountingmore-likely-than-not threshold for uncertainty inthe financial statement recognition of uncertain tax positions. Itpositions and clarifies the accounting for income taxes by prescribing that tax positions shall initially be recognized indefinition of settlement with the financial statements when it is more-likely-than-not the position will be sustained upon examination by taxing authorities. Such tax positions shall initially and subsequently be measured as the largest amount of benefit that is more than 50% likely of being
realized upon ultimate settlement. FIN 48authority. It also provides guidance on derecognition, measurement, classification, interest and penalties, accounting in interim periods, disclosure, and transition. In addition,
We have a FIN 48 removes income taxes from the scope of SFAS No. 5,Accountingliability for Contingencies. FIN 48 is effective for fiscal years beginning after December 15, 2006, or January 1, 2007 for calendar year-end companies. We haveunrecognized tax reserves at December 31, 2006 of approximately $39 million forbenefits relating to uncertain tax positions primarily for various state tax contingencies in several jurisdictions. Under the guidanceAs a result of adopting FIN 48, management estimates that these reserves may decreasewe reduced this liability by approximately $9$10.4 million to $13 million, which is subject to revision when management completes an analysis of the impact of FIN 48. As required by FIN 48 upon adoption onat January 1, 2007 this difference will be recorded in retained earnings asand recognized a cumulative effect adjustment.adjustment as an increase to retained earnings. A reconciliation of the beginning and ending amount of gross unrecognized tax benefits subsequent to the cumulative effect adjustment is as follows(in thousands):
| 2008 | 2007 | ||||||
Balance at beginning of year | $ | 29,717 | 46,341 | ||||
Tax positions related to current year: | |||||||
Additions | 676 | 1,708 | |||||
Reductions | – | – | |||||
Tax positions related to prior years: | |||||||
Additions | – | – | |||||
Reductions | (7,641 | ) | (8,277 | ) | |||
Settlements with taxing authorities | (5,675 | ) | – | ||||
Lapses in statutes of limitations | – | (10,055 | ) | ||||
Balance at end of year | $ | 17,077 | 29,717 | ||||
At December 31, 2008 and 2007, the FIN 48 liability included approximately $10.8 million and $19.1 million, respectively, (net of the federal tax benefit on state issues) related to unrecognized tax benefits that, if recognized, would affect the effective tax rate. Gross unrecognized tax benefits that may decrease during the 12 months subsequent to December 31, 2008 could range up to approximately $400 thousand as a result of the resolution of various tax positions.
During 2008, we reduced the FIN 48 liability, net of any federal and/or state tax benefits, by a net amount of approximately $9.6 million. Of this reduction, $5.2 million, including interest, reduced income tax expense and was primarily the result of a settlement with taxing authorities during the second quarter of 2008. The remaining $4.4 million resulted from the net effect of settlement payments. During 2007 in addition to increases to the FIN 48 liability, certain state tax issues were resolved through the closing of various state statutes of limitations and tax examinations. This allowed us to reduce the FIN 48 liability and recognize the tax benefit in operations. For 2007, the net reduction to income tax expense, including related interest and penalties, was approximately $8.6 million.
Interest and penalties related to unrecognized tax benefits are included in income tax expense in the statement of income. The net amount of interest and penalties recognized in the statement of income was a benefit of approximately $0.7 million in 2008 and $1.7 million in 2007. At December 31, 2008 and 2007, accrued interest and penalties recognized in the balance sheet, net of any federal and/or state tax benefits, were approximately $2.7 million and $4.1 million, respectively.
The Company and its subsidiaries file income tax returns in U.S. federal and various state jurisdictions. The Company is no longer subject to income tax examinations for years prior to 2005 for federal returns, and generally prior to 2004 for state returns.
16. NET EARNINGS PER COMMON SHARE
Basic and diluted net earnings per common share based on the weighted average outstanding shares are summarized as follows(in thousands, except perper share amounts):
| 2006 | 2005 | 2004 | |||||
Basic: | |||||||
Net earnings applicable to common shareholders | $ | 579,290 | 480,121 | 405,987 | |||
Weighted average common shares outstanding | 106,057 | 91,187 | 89,663 | ||||
Net earnings per common share | $ | 5.46 | 5.27 | 4.53 | |||
Diluted: | |||||||
Net earnings applicable to common shareholders | $ | 579,290 | 480,121 | 405,987 | |||
Weighted average common shares outstanding | 106,057 | 91,187 | 89,663 | ||||
Effect of dilutive common stock options and other stock awards | 1,971 | 1,807 | 1,219 | ||||
Weighted average diluted common shares outstanding | 108,028 | 92,994 | 90,882 | ||||
Net earnings per common share | $ | 5.36 | 5.16 | 4.47 | |||
| 2008 | 2007 | 2006 | ||||||
Basic: | ||||||||
Net earnings (loss) applicable to common shareholders | $ | (290,693 | ) | 479,422 | 579,290 | |||
Weighted average common shares outstanding | 108,908 | 107,365 | 106,057 | |||||
Net earnings (loss) per common share | $ | (2.67 | ) | 4.47 | 5.46 | |||
Diluted: | ||||||||
Net earnings (loss) applicable to common shareholders | $ | (290,693 | ) | 479,422 | 579,290 | |||
Weighted average common shares outstanding | 108,908 | 107,365 | 106,057 | |||||
Effect of dilutive common stock options and other stock awards | 178 | 1,158 | 1,971 | |||||
Effect of common stock warrant | 59 | – | – | |||||
Weighted average diluted common shares outstanding | 109,145 | 108,523 | 108,028 | |||||
Net earnings (loss) per common share | $ | (2.66 | ) | 4.42 | 5.36 | |||
17. SHARE-BASED COMPENSATION
We have a stock option and incentive plan which allows us to grant stock options and restricted stock to employees and nonemployee directors. The totalTotal shares authorized under the plan are 8,900,000 of which 6,630,337no shares are availableremained authorized under the plan for future grantgrants of stock options as of December 31, 2006.
Prior to January 1, 2006, we accounted for share-based compensation2008. Our agreement with the U.S. Treasury under the recognition and measurement provisions of Accounting Principles Board Opinion No. 25 (“APB 25”),Accounting for Stock Issued to Employees, andTARP Capital Purchase Program includes conditions related Interpretations, as permitted by SFAS No. 123,Accounting for Stock-Based Compensation. Accordingly, we did not record any compensation expense for stock options, as the exercise price of the option was equal to the quoted market priceissuance of the stock on the date of grant.
common stock. See further discussion in Note 14.
Effective January 1, 2006, we adopted SFAS No. 123R,123(R),Share-Based Payment, which requires all share-based payments to employees, including grants of employee stock options, to be recognized in the statement of income based on their fair values. This accounting utilizes a “modified grant-date” approach in which the fair value of an equity award is estimated on the grant date without regard to service or performance vesting conditions. We adopted SFAS 123R123(R) using the “modified prospective” transition method. Under this transition method, compensation expense is recognized beginning January 1, 2006 based on the requirements of SFAS 123R123(R) for all share-based payments granted after December 31, 2005, and based on the requirements of SFAS 123 for all awards granted to employees prior to January 1, 2006 that remain unvested as of that date. Results of operations for prior years have not been restated.
The adoption of SFAS 123R,123(R), compared to the previous accounting for share-based compensation under APB 25, reduced the Company’s2006 income before income taxes and minority interest andby $17.5 million, net income along with the relatedby $12.5 million, and both basic and diluted per common share amounts for 2006 as follows(in thousands, except per share amounts):
| |||
| |||
| |||
| |||
| |||
| |||
The impact on net income and net earnings per common share if we had appliedby $0.12.
Compensation expense and the provisions of SFAS 123 to stock optionsrelated tax benefit for 2005 and 2004 wasall share-based awards were as follows(in thousands, except per share amounts)thousands):
| 2005 | 2004 | ||||||
Net income, as reported | $ | 480,121 | 405,987 | ||||
Deduct: Total share-based compensation expense | |||||||
stock options, net of related tax effects | (9,793 | ) | (12,503 | ) | |||
Pro forma net income | $ | 470,328 | 393,484 | ||||
Net earnings per common share: | |||||||
Basic – as reported | $ | 5.27 | 4.53 | ||||
Basic – pro forma | 5.16 | 4.39 | |||||
Diluted – as reported | 5.16 | 4.47 | |||||
Diluted – pro forma | 5.08 | 4.33 | |||||
| 2008 | 2007 | 2006 | |||||
Compensation expense | $ | 31,850 | 28,274 | 24,358 | |||
Reduction of income tax expense | 11,080 | 9,386 | 7,232 | ||||
SFAS 123R also requiresCompensation expense is included in salaries and employee benefits in the benefitsstatement of tax deductionsincome with the corresponding increase included in excess of recognized compensation expense resulting from the exercise of share-based awards to be reported as a financing cash flow. For 2006, this requirement reduced net operating cash flows and increased net financing cash flows by approximately $15.7 million.
common stock in shareholders’ equity.
As required by SFAS 123R,123(R) and discussed further in Note 14, upon adoption in 2006, we reclassified $11.1 million of unearned compensation related to restricted stock from deferred compensation to common stock.
We classify all share-based awards as equity instruments and recognizeinstruments. Substantially all awards have graded vesting which is recognized on a straight-line basis over the vesting of the awards ratably over their respective terms.period. As of December 31, 2006,2008, compensation expense not yet recognized for nonvested share-based awards was approximately $44.2$61.6 million, which is expected to be recognized over a weighted average period of 1.31.4 years.
The tax benefit (shortfall) realized from the exercise of stock options and the vesting of restricted stock was as follows(in thousands):
| 2008 | 2007 | 2006 | ||||||
Reduction of goodwill for tax benefit of vested stock options converted in the Amegy acquisition and exercised during the year | $ | 120 | 2,069 | 4,298 | ||||
Tax benefit (shortfall) included in common stock in net stock issued under employee plans and related tax benefits | (2,288 | ) | 10,806 | 12,135 | ||||
Tax benefit from disqualifying dispositions of incentive stock options | – | 317 | 307 | |||||
Total tax benefit (shortfall) | $ | (2,168 | ) | 13,192 | 16,740 | |||
Stock Options
OptionsStock options granted to employees generally vest at the rate of one third each year and expire seven years after the date of grant. OptionsStock options granted to nonemployee directors vest in increments from six months to three and a half years and expire ten years after the date of grant.
In 2005, we discontinuedWe have used the results of the April 24-25, 2008 and May 4-7, 2007 auctions of our broad-basedEmployee Stock Option Appreciation Rights Securities (“ESOARS”) to value our employee stock option plan under which options were made availablegranted on April 24, 2008 and May 4, 2007. In October 2007, we received notification from the SEC that our ESOARS was sufficiently designed as a market-based method to substantially all employees; however, existing options continue to vest at the rate of one third each year and expire four years after the date of grant.
For 2006, the additional compensation expense of $17.5 million forvalue employee stock options under SFAS 123R is included in salaries and employee benefits123(R). The SEC staff did not object to our view that the market clearing price of ESOARS in the statementsMay 2007 auction was a reasonable estimate of income with the corresponding increase, excludingfair value of the effectsunderlying employee stock options.
Information from the results of these auctions was as follows:
| Grant date | |||||||
| April 24, 2008 | May 4, 2007 | ||||||
ESOARS per share auction fair value used for employee stock option grants | $ | 5.73 | 12.06 | ||||
Percentage that auction fair value is below comparable Black-Scholes model valuation | 24 | % | 14 | % | |||
Number of stock options granted | 1,542,238 | 963,680 | |||||
Percentage of stock options granted to total stock options granted during the applicable year | 61 | % | 91 | % | |||
We used the ESOARS values for the remainder of 2008 and 2007 to determine compensation expense for these stock option expense on subsidiary stock, included in common stock in shareholders’ equity. Theoptions and we recorded the related tax benefit recognizedestimated future ESOARS settlement obligations as a reduction of income tax expense was $5.0 million.liability in the balance sheet.
During 2006, the amount of cash received from the exercise ofFor all other stock options was $79.5 milliongranted in 2008, 2007 and 2006, we used the tax benefit realized as a reduction of income taxes payable was $17.3 million. Of this amount, $4.2 million reduced goodwill forBlack-Scholes option pricing model to estimate the tax benefit of vested share-based awards converted in the Amegy acquisition that were exercised during 2006, $11.8 million was included in common stock as part of net stock options exercised, and the remainder reduced deferred tax assets and current income tax expense.
For 2005 and 2004, the tax benefit realized as a reduction of income taxes payable and included in common stock was $13.5 million and $8.8 million, respectively.
Compensation expense was determined from the estimates of fair values of stock options granted using the Black-Scholes option-pricing model.in determining compensation expense. The following summarizes the weighted average of fair value and the significant assumptions used in applying the Black-Scholes model for options granted:
| 2006 | 2005 | 2004 | 2008 | 2007 | 2006 | ||||||||||||
Weighted average of fair value for options granted | $ | 15.02 | 15.33 | 11.85 | $ | 4.85 | 15.15 | 15.02 | |||||||||
Weighted average assumptions used: | |||||||||||||||||
Expected dividend yield | 2.0% | 2.0% | 2.0% | 4.7 | % | 2.0 | % | 2.0 | % | ||||||||
Expected volatility | 18.0% | 25.0% | 26.8% | 26.8 | % | 17.0 | % | 18.0 | % | ||||||||
Risk-free interest rate | 4.95% | 3.95% | 3.11% | 2.99 | % | 4.42 | % | 4.95 | % | ||||||||
Expected life (in years) | 4.1 | 4.1 | 3.8 | 4.7 | 5.4 | 4.1 | |||||||||||
The methodology used to estimate the fair values of stock options is consistent with the estimates used for the pro forma presentation in years prior to the adoption of SFAS 123R. The assumptions for expected dividend yield, expected volatility and expected life reflect management’s judgment and include consideration of historical experience. Expected volatility is based in part on historical volatility. The risk-free interest rate is based on the U.S. Treasury yield curve in effect at the time of grant for periods corresponding with the expected life of the option.
The following summarizes our stock option activity for the three years ended December 31, 2006:2008:
| Number of shares | Weighted average exercise price | ||||
Balance at December 31, 2003 | 7,570,645 | $ | 49.51 | ||
Granted | 2,279,621 | 57.28 | |||
Exercised | (1,812,594) | 48.32 | |||
Expired | (170,662) | 52.54 | |||
Forfeited | (233,235) | 51.59 | |||
Balance at December 31, 2004 | 7,633,775 | 51.98 | |||
Granted | 912,905 | 71.37 | |||
Assumed in acquisition | 1,559,693 | 47.44 | |||
Exercised | (1,872,753) | 50.00 | |||
Expired | (519,521) | 66.53 | |||
Forfeited | (216,533) | 55.46 | |||
Balance at December 31, 2005 | 7,497,566 | 52.79 | |||
Granted | 979,274 | 81.14 | |||
Exercised | (1,631,012) | 49.43 | |||
Expired | (52,398) | 50.00 | |||
Forfeited | (106,641) | 62.89 | |||
Balance at December 31, 2006 | 6,686,789 | 57.62 | |||
Outstanding options exercisable as of: | |||||
December 31, 2006 | 4,409,971 | $ | 50.73 | ||
December 31, 2005 | 4,663,707 | 49.04 | |||
December 31, 2004 | 3,711,405 | 51.02 | |||
| Number of shares | Weighted average exercise price | |||||
Balance at December 31, 2005 | 7,497,566 | $ | 52.79 | |||
Granted | 979,274 | 81.14 | ||||
Exercised | (1,631,012 | ) | 49.43 | |||
Expired | (52,398 | ) | 50.00 | |||
Forfeited | (106,641 | ) | 62.89 | |||
Balance at December 31, 2006 | 6,686,789 | 57.62 | ||||
Granted | 1,054,772 | 82.82 | ||||
Exercised | (1,681,742 | ) | 80.88 | |||
Expired | (136,805 | ) | 58.37 | |||
Forfeited | (112,031 | ) | 75.00 | |||
Balance at December 31, 2007 | 5,810,983 | 64.82 | ||||
Granted | 2,537,438 | 40.43 | ||||
Exercised | (52,072 | ) | 30.58 | |||
Expired | (536,643 | ) | 56.72 | |||
Forfeited | (85,108 | ) | 66.18 | |||
Balance at December 31, 2008 | 7,674,598 | 57.53 | ||||
Outstanding stock options exercisable as of: | ||||||
December 31, 2008 | 4,221,713 | $ | 62.15 | |||
December 31, 2007 | 3,866,627 | 57.15 | ||||
December 31, 2006 | 4,409,971 | 50.73 | ||||
We issue new authorized shares for the exercise of stock options. During 2006, theThe total intrinsic value of stock options exercised was approximately $0.9 million in 2008, $59.0 million in 2007, and $50.8 million.million in 2006. Cash received from the exercise of stock options was $1.6 million in 2008, $59.5 million in 2007, and $79.5 million in 2006.
Additional selected information on stock options at December 31, 20062008 follows:
| Outstanding options | Exercisable options | |||||||||||||||||
Exercise price range | Number of shares | Weighted average exercise price | Weighted average remaining contractual life (years) | Number of shares | Weighted average exercise price | |||||||||||||
$ 0.32 to $ 19.99 | 76,164 | $ | 11.63 | 0.9(1) | 76,164 | $ | 11.63 | |||||||||||
$ 20.00 to $ 39.99 | 190,986 | 27.44 | 2.2 | 190,986 | 27.44 | |||||||||||||
$ 40.00 to $ 44.99 | 1,290,243 | 42.23 | 2.6 | 1,290,243 | 42.23 | |||||||||||||
$ 45.00 to $ 49.99 | 356,590 | 48.30 | 4.6 | 356,590 | 48.30 | |||||||||||||
$ 50.00 to $ 54.99 | 1,011,382 | 53.72 | 2.4 | 1,006,735 | 53.71 | |||||||||||||
$ 55.00 to $ 59.99 | 1,550,516 | 56.92 | 4.5 | 917,585 | 57.03 | |||||||||||||
$ 60.00 to $ 64.99 | 172,390 | 61.51 | 2.7 | 102,522 | 61.72 | |||||||||||||
$ 65.00 to $ 69.99 | 198,253 | 67.30 | 6.4 | 146,699 | 67.42 | |||||||||||||
$ 70.00 to $ 74.99 | 759,814 | 70.86 | 5.5 | 255,919 | 70.91 | |||||||||||||
$ 75.00 to $ 79.99 | 116,126 | 75.92 | 6.0 | 57,528 | 75.84 | |||||||||||||
$ 80.00 to $ 82.92 | 964,325 | 81.14 | 6.4 | 9,000 | 80.65 | |||||||||||||
| 6,686,789 | 57.62 | 4.2(1) | 4,409,971 | 50.73 | ||||||||||||||
| Outstanding stock options | Exercisable stock options | ||||||||||||
Exercise price range | Number of shares | Weighted average exercise price | Weighted average remaining contractual life (years) | Number of shares | Weighted average exercise price | ||||||||
$0.32 to $19.99 | 33,271 | $ | 5.91 | 0.1 | 1 | 33,271 | $ | 5.91 | |||||
$20.00 to $39.99 | 992,763 | 28.16 | 6.1 | 91,763 | 29.49 | ||||||||
$40.00 to $49.99 | 2,253,636 | 46.45 | 5.2 | 664,839 | 44.57 | ||||||||
$50.00 to $54.99 | 502,598 | 53.37 | 1.0 | 502,225 | 53.37 | ||||||||
$55.00 to $59.99 | 1,051,452 | 56.88 | 3.0 | 1,032,985 | 56.86 | ||||||||
$60.00 to $64.99 | 40,656 | 63.06 | 3.3 | 37,183 | 63.00 | ||||||||
$65.00 to $69.99 | 157,690 | 67.34 | 4.6 | 157,455 | 67.34 | ||||||||
$70.00 to $74.99 | 684,197 | 70.91 | 3.7 | 666,224 | 70.88 | ||||||||
$75.00 to $79.99 | 115,938 | 75.92 | 4.0 | 115,081 | 75.89 | ||||||||
$80.00 to $81.99 | 885,721 | 81.14 | 4.5 | 592,397 | 81.13 | ||||||||
$82.00 to $83.38 | 956,676 | 83.25 | 5.4 | 328,290 | 83.25 | ||||||||
| 7,674,598 | 57.53 | 4.5 | 1 | 4,221,713 | 62.15 | ||||||||
1 | The weighted average remaining contractual life excludes |
For both outstanding and exercisable stock options at December 31, 2006,2008 and 2007, the aggregate intrinsic value was $166.0 million. For exercisable options at December 31, 2006, the aggregate intrinsic value was $139.9$0.6 million and the$5.7 million, respectively. The weighted average remaining contractual life was 3.43.2 years and 3.3 years at December 31, 2008 and 2007, respectively, excluding the stock options previously noted without a fixed expiration date.
The previous tables do not include stock options for employees to purchase common stock of our subsidiaries, TCBO and NetDeposit.subsidiary. At December 31, 2006 for TCBO,2008, there were options to purchase 87,000115,000 TCBO shares at an exercise price of $20.00.prices from $17.85 to $20.58. At December 31, 2006,2008, there were 1,038,000 issued and outstanding shares of TCBO common stock. For
During the fourth quarter of 2008, our NetDeposit there weresubsidiary terminated its stock option plan, canceled all associated options, and recognized all unearned stock option expense. As part of the termination, NetDeposit made a payment to purchase 11,739,920 shares at exercise prices from $0.42 to $1.00. At December 31, 2006, there were 100,536,568 issued andoption holders of $0.10 per outstanding shares of NetDeposit common stock. TCBO and NetDeposit options are included in the previous pro forma disclosure.
option, which totaled approximately $0.9 million.
Restricted Stock
Restricted stock grantedissued vests generally over four years. During the vesting period, the holder has full voting rights and receives dividend equivalents. For 2006, compensation expense recognized for issuances of restricted stock and included in salaries and employee benefits in the statement of income was $6.8 million. The related amount for 2005 was $1.7 million and was not significant for 2004. The corresponding increase to shareholders’ equity was included in common stock. Compensation expense wasis determined based on the number of restricted shares grantedissued and the market price of our common stock at the grantissue date.
The following summarizes our restricted stock activity for the three years ended December 31, 2006:2008:
| Number of shares | Weighted average grant price | ||||
Nonvested restricted shares at December 31, 2004 | 10,000 | $ | 61.07 | ||
Granted | 168,134 | 70.81 | |||
Assumed in acquisition | 143,504 | 57.45 | |||
Vested | (114,162) | 56.41 | |||
Forfeited | (3,493) | 70.90 | |||
Nonvested restricted shares at December 31, 2005 | 203,983 | 68.99 | |||
Granted | 293,650 | 80.14 | |||
Vested | (53,471) | 71.29 | |||
Forfeited | (24,029) | 76.09 | |||
Nonvested restricted shares at December 31, 2006 | 420,133 | 77.54 | |||
| Number of shares | Weighted average issue price | |||||
Nonvested restricted shares at December 31, 2005 | 203,983 | $ | 68.99 | |||
Issued | 293,650 | 80.14 | ||||
Vested | (53,471 | ) | 71.29 | |||
Forfeited | (24,029 | ) | 76.09 | |||
Nonvested restricted shares at December 31, 2006 | 420,133 | 77.54 | ||||
Issued | 357,961 | 71.91 | ||||
Vested | (115,852 | ) | 76.95 | |||
Forfeited | (27,180 | ) | 76.42 | |||
Nonvested restricted shares at December 31, 2007 | 635,062 | 74.54 | ||||
Issued | 849,156 | 37.64 | ||||
Vested | (191,605 | ) | 74.92 | |||
Forfeited | (43,332 | ) | 68.43 | |||
Nonvested restricted shares at December 31, 2008 | 1,249,281 | 49.61 | ||||
The total fair value of restricted stock vesting during 2006the year was $8.5 million in 2008, $9.4 million in 2007, and $4.3 million. Related amounts for 2005 and 2004 were not significant. During 2006, the amount of tax benefit realized as a reduction of income taxes payable from the vesting of restricted stock was $1.9 million.
million in 2006.
18. COMMITMENTS, GUARANTEES, CONTINGENT LIABILITIES, AND RELATED PARTIES
We use certain derivative instruments and other financial instruments in the normal course of business to meet the financing needs of our customers, to reduce our own exposure to fluctuations in interest rates, and to make a market in U.S. government,Government, agency, corporate, and municipal securities. These financial instruments involve, to varying degrees, elements of credit, liquidity, and interest rate risk in excess of the amount recognized in the balance sheet. Derivative instruments are discussed in Note 7.
Notes 7 and 21.
FASB InterpretationFIN No. 45, (“FIN 45”),Guarantor’s Accounting and Disclosure Requirements for Guarantees, Including Indirect Guarantees of Indebtedness of Others, establishes guidance for guarantees and related obligations. Financial and performance standby letters of credit are guarantees that come under the provisions of FIN 45.
Contractual amounts of the off-balance sheet financial instruments used to meet the financing needs of our customers are as follows at December 31(in thousands):
| 2006 | 2005 | ||||
Commitments to extend credit | $ | 16,714,742 | 13,682,763 | ||
Standby letters of credit: | |||||
Financial | 1,157,205 | 1,015,019 | |||
Performance | 330,056 | 240,763 | |||
Commercial letters of credit | 132,615 | 136,472 | |||
| 2008 | 2007 | ||||
Commitments to extend credit | $ | 14,140,429 | 16,648,056 | ||
Standby letters of credit: | |||||
Financial | 1,293,729 | 1,317,304 | |||
Performance | 250,836 | 351,150 | |||
Commercial letters of credit | 65,889 | 49,346 | |||
Commitments to extend credit are agreements to lend to a customer as long as there is no violation of any condition established in the contract. Commitments generally have fixed expiration dates or other termination clauses and may require the payment of a fee. The amount of collateral obtained, if deemed necessary by us upon extension of credit, is based on our credit evaluation of the counterparty. Types of collateral vary, but may include accounts receivable, inventory, property, plant and equipment, and income-producing properties.
While establishing commitments to extend credit creates credit risk, a significant portion of such commitments is expected to expire without being drawn upon. As of December 31, 2006, $6.52008, $5.8 billion of
commitments expire in 2007.2009. We use the same credit policies and procedures in making commitments to extend credit and conditional obligations as we do for on-balance sheet instruments. These policies and procedures include credit approvals, limits, and monitoring.
We issue standby and commercial letters of credit as conditional commitments generally to guarantee the performance of a customer to a third party. The guarantees are primarily issued to support public and private borrowing arrangements, including commercial paper, bond financing, and similar transactions. Standby letters of credit include remaining commitments of $996$1,032 million expiring in 20072009 and $491$513 million expiring thereafter through 2026.2049. The credit risk involved in issuing letters of credit is essentially the same as that involved in extending loan facilities to customers. We generally hold marketable securities and cash equivalents as collateral supporting those commitments for which collateral is deemed necessary. At December 31, 2006,2008, the carrying value recorded by the Company as a liability for these guarantees was $5.1$5.8 million.
Certain mortgage loans sold have limited recourse provisions for periods ranging from 3three months to one year. The amount of losses resulting from the exercise of these provisions has not been significant.
At December 31, 2006,2008, we had commitments to make venture and other noninterest-bearing investments of $103.0 million. These obligations have no stated maturity.
As a market maker in U.S. Government, agency, corporate, and municipal securities, we enter into agreements to purchase and sell such securities. As of December 31, 2006 and 2005, we had outstanding commitments to purchase securities of $10 million and $30 million and outstanding commitments to sell securities of $5 million and $22 million, respectively. These agreements at December 31, 2006 have remaining terms of one month or less.
The contractual or notional amount of financial instruments indicates a level of activity associated with a particular class of financial instrument and is not a reflection of the actual level of risk. As of December 31, 20062008 and 2005,2007, the regulatory risk-weighted values assigned to all off-balance sheet financial instruments and derivative instruments described herein were $6.7$5.3 billion and $6.1$7.0 billion, respectively.
At December 31, 2006,2008, we were required to maintain cash balances of $44.9$35.0 million with the Federal Reserve Banks to meet minimum balance requirements in accordance with Federal Reserve Board regulations.
As of December 31, 2006,2008, the Parent has guaranteed approximately $306.0$300.3 million of debt issued by our subsidiaries, as discussed in Note 13. See Note 6 for the discussion of Zions Bank’s commitment of $6.12 billion at December 31, 2006 to Lockhart, which is a QSPE conduit.
In October 2007, Visa Inc. (“Visa”) completed a reorganization in contemplation of its initial public offering (“IPO”) and as part of that reorganization, certain of the Company’s subsidiary banks received shares of common stock of Visa. During the first quarter of 2008, the banks recorded an aggregate pretax cash gain of approximately $12.4 million from the partial redemption of their equity interests in Visa upon completion of the IPO. The gain is included in equity securities gains, net in the statement of income. The Company’s subsidiary banks are also obligated as member banks under indemnification agreements to share in losses from certain litigation (“Covered Litigation”) of Visa. Guidance from the SEC staff requires Visa member banks to record a liability for the fair value of any contingent obligation under the Covered Litigation which is not funded into a litigation escrow account by Visa. At December 31, 2007, the Company had recorded a total accrual of approximately $8.1 million as an estimate of the fair value of the contingent obligation. In March 2008, Visa funded the litigation escrow upon completion of the IPO and in December 2008 additional funding of the escrow account was made in relation to a settlement of certain Covered Litigation. As a result, the Company reversed approximately $5.6 million of the litigation accrual during 2008 resulting in an accrual of $2.5 million at December 31, 2008. The litigation escrow account funding reduced the Company’s ownership interests in VISA. The original accrual and the reversal are included in other noninterest expense in the statement of income. Also, in accordance with generally accepted accounting principles and the SEC guidance, the Company’s subsidiary banks have not recognized any value for their remaining investments in Visa.
We are a defendant in various legal proceedings arising in the normal course of business. We do not believe that the outcome of any such proceedings will have a material effect on our results of operations, financial position, or liquidity.
We have commitments for leasing premises and equipment under the terms of noncancelable capital and operating leases expiring from 20072009 to 2031.2046. Premises leased under capital leases at December 31, 20062008 were $2.7$1.7 million and accumulated amortization was $2.6$1.3 million. Amortization applicable to premises leased under capital leases is included in depreciation expense.
Future aggregate minimum rental payments under existing noncancelable operating leases at December 31, 20062008 are as follows(in thousands):
2007 | $ | 41,609 | |
2008 | 40,321 | ||
2009 | 36,081 | ||
2010 | 31,079 | ||
2011 | 27,673 | ||
Thereafter | 159,645 | ||
| $ | 336,408 | ||
2009 | $ | 40,963 | |
2010 | 43,058 | ||
2011 | 38,660 | ||
2012 | 33,804 | ||
2013 | 29,435 | ||
Thereafter | 156,863 | ||
| $ | 342,783 | ||
Future aggregate minimum rental payments have been reduced by noncancelable subleases as follows: $1.9 million in 2007, $1.7 million in 2008, $1.1$2.1 million in 2009, $0.6$2.7 million in 2010, $0.4$2.2 million in 2011, $2.2 million in 2012, $2.1 million in 2013, and $0.6$8.7 million thereafter. Aggregate rental expense on operating leases amounted to $57.3 million in 2008, $54.0 million in 2007, and $51.5 million in 2006, $41.6 million in 2005, and $40.6 million in 2004.
2006.
We have a lease agreement on our corporate headquarters which provided for a rent holiday through December 31, 2006 while the building was being reconstructed. The reconstruction began in March 2005 and the lease term of this operating lease began in October 2005. We recorded and deferred rent expense during the rent holiday at applicable lease rates based on our occupancy of the building. We also recorded leasehold improvements funded by the landlord incentive and amortize them over their estimated useful lives or the term of the lease, whichever is shorter. The amount of deferred rent, including the leasehold improvements, is amortized using the straight-line method over the term of the lease, in accordance with applicable accounting and other SEC guidance.
We have no material related party transactions requiring disclosure. In the ordinary course of business, the Company and its banking subsidiaries extend credit to related parties, including executive officers, directors, principal shareholders, and their associates and related interests. These related party loans are made in compliance with applicable banking regulations under substantially the same terms as comparable third-party lending arrangements.
19. REGULATORY MATTERS
We are subject to various regulatory capital requirements administered by federal banking agencies. Failure to meet minimum capital
requirements can initiate certain mandatory – mandatory—and possibly additional discretionary – discretionary—actions by regulators that, if undertaken, could have a direct material effect on our financial statements. Under capital adequacy guidelines and the regulatory framework for prompt corrective action, we must meet specific capital guidelines that involve quantitative measures of our assets, liabilities, and certain off-balance sheet items as calculated under regulatory accounting practices. Our capital amounts and classification are also subject to qualitative judgments by regulators about components, risk weightings, and other factors.
Quantitative measures established by regulation to ensure capital adequacy require us to maintain minimum amounts and ratios (set forth in the following table) of Total and Tier I1 capital (as defined in the regulations) to risk-weighted assets (as defined), and of Tier I1 capital (as defined) to average assets (as defined). We believe, as of December 31, 2006,2008, that we meetexceed all capital adequacy requirements to which we are subject.
As discussed further in Note 14, the preferred shares and warrant to purchase common stock issued to the U.S. Treasury under the TARP Capital Purchase Program qualify for Tier 1 capital.
As of December 31, 2006,2008, our capital ratios exceeded the minimum capital levels, and we are considered well capitalized under the regulatory framework for prompt corrective action. Our subsidiary banks also met the well capitalized minimum. To be categorized as well capitalized, we must maintain minimum Total risk-based, Tier I1 risk-based, and Tier I1 leverage ratios as set forth in the table. There are no conditions or events that we believe have changed our regulatory category.
Dividends declared by our banking subsidiariessubsidiary banks in any calendar year may not, without the approval of the appropriate federal regulator, exceed their net earnings for that year combined with their net earnings less dividends paid for the preceding two years. We are also required to maintain the banking subsidiariessubsidiary banks at the well capitalized level. At December 31, 2006,2008, our banking subsidiariessubsidiary banks had approximately $403.8$373.8 million available for the payment of dividends under the foregoing restrictions.
The actual capital amounts and ratios for the Company and its significant banking subsidiariesthree largest subsidiary banks are as follows(in thousands):
| Actual | Minimum for capital adequacy purposes | To be well capitalized | Actual | Minimum for capital adequacy purposes | To be well capitalized | ||||||||||||||||||||||||||||
| Amount | Ratio | Amount | Ratio | Amount | Ratio | Amount | Ratio | Amount | Ratio | Amount | Ratio | ||||||||||||||||||||||
As of December 31, 2006: | |||||||||||||||||||||||||||||||||
As of December 31, 2008: | |||||||||||||||||||||||||||||||||
Total capital (to risk-weighted assets) | |||||||||||||||||||||||||||||||||
The Company | $ | 5,293,253 | 12.29% | $ | 3,445,531 | 8.00% | $ | 4,306,914 | 10.00% | $ | 7,385,958 | 14.32 | % | $ | 4,125,223 | 8.00 | % | $ | 5,156,529 | 10.00 | % | ||||||||||||
Zions First National Bank | 1,469,553 | 11.30 | 1,040,178 | 8.00 | 1,300,223 | 10.00 | 1,920,176 | 11.33 | 1,356,314 | 8.00 | 1,695,393 | 10.00 | |||||||||||||||||||||
California Bank & Trust | 1,200,874 | 11.50 | 835,632 | 8.00 | 1,044,541 | 10.00 | 1,158,262 | 11.05 | 838,538 | 8.00 | 1,048,172 | 10.00 | |||||||||||||||||||||
Amegy Bank N.A. | 916,454 | 10.35 | 708,239 | 8.00 | 885,299 | 10.00 | 1,290,617 | 11.13 | 927,404 | 8.00 | 1,159,255 | 10.00 | |||||||||||||||||||||
Tier I capital (to risk-weighted assets) | |||||||||||||||||||||||||||||||||
Tier 1 capital (to risk-weighted assets) | |||||||||||||||||||||||||||||||||
The Company | 3,437,413 | 7.98 | 1,722,766 | 4.00 | 2,584,148 | 6.00 | 5,269,330 | 10.22 | 2,062,612 | 4.00 | 3,093,917 | 6.00 | |||||||||||||||||||||
Zions First National Bank | 944,487 | 7.26 | 520,089 | 4.00 | 780,134 | 6.00 | 1,410,797 | 8.32 | 678,157 | 4.00 | 1,017,236 | 6.00 | |||||||||||||||||||||
California Bank & Trust | 751,100 | 7.19 | 417,816 | 4.00 | 626,724 | 6.00 | 872,714 | 8.33 | 419,269 | 4.00 | 628,903 | 6.00 | |||||||||||||||||||||
Amegy Bank N.A. | 636,517 | 7.19 | 354,120 | 4.00 | 531,180 | 6.00 | 939,442 | 8.10 | 463,702 | 4.00 | 695,553 | 6.00 | |||||||||||||||||||||
Tier I capital (to average assets) | |||||||||||||||||||||||||||||||||
Tier 1 capital (to average assets) | |||||||||||||||||||||||||||||||||
The Company | 3,437,413 | 7.86 | 1,312,658 | 3.00 | 2,187,763 | 5.00 | 5,269,330 | 9.99 | 1,583,071 | 3.00 | na | na | 1 | ||||||||||||||||||||
Zions First National Bank | 944,487 | 6.50 | 435,736 | 3.00 | 726,227 | 5.00 | 1,410,797 | 6.91 | 612,479 | 3.00 | 1,020,799 | 5.00 | |||||||||||||||||||||
California Bank & Trust | 751,100 | 7.36 | 306,240 | 3.00 | 510,401 | 5.00 | 872,714 | 8.77 | 298,587 | 3.00 | 497,645 | 5.00 | |||||||||||||||||||||
Amegy Bank N.A. | 636,517 | 7.64 | 249,864 | 3.00 | 416,441 | 5.00 | 939,442 | 8.67 | 325,140 | 3.00 | 541,899 | 5.00 | |||||||||||||||||||||
As of December 31, 2005: | |||||||||||||||||||||||||||||||||
As of December 31, 2007: | |||||||||||||||||||||||||||||||||
Total capital (to risk-weighted assets) | |||||||||||||||||||||||||||||||||
The Company | $ | 4,602,772 | 12.23% | $ | 3,010,880 | 8.00% | $ | 3,763,600 | 10.00% | $ | 5,547,973 | 11.68 | % | $ | 3,801,256 | 8.00 | % | $ | 4,751,570 | 10.00 | % | ||||||||||||
Zions First National Bank | 1,234,862 | 11.06 | 893,483 | 8.00 | 1,116,854 | 10.00 | 1,622,137 | 10.75 | 1,206,859 | 8.00 | 1,508,574 | 10.00 | |||||||||||||||||||||
California Bank & Trust | 1,086,594 | 10.90 | 797,474 | 8.00 | 996,843 | 10.00 | 1,088,798 | 11.58 | 752,253 | 8.00 | 940,316 | 10.00 | |||||||||||||||||||||
Amegy Bank N.A. | 609,400 | 8.65 | 563,895 | 8.00 | 704,869 | 10.00 | 1,178,538 | 10.94 | 861,581 | 8.00 | 1,076,977 | 10.00 | |||||||||||||||||||||
Tier I capital (to risk-weighted assets) | |||||||||||||||||||||||||||||||||
Tier 1 capital (to risk-weighted assets) | |||||||||||||||||||||||||||||||||
The Company | 2,830,419 | 7.52 | 1,505,440 | 4.00 | 2,258,160 | 6.00 | 3,596,234 | 7.57 | 1,900,628 | 4.00 | 2,850,942 | 6.00 | |||||||||||||||||||||
Zions First National Bank | 807,615 | 7.23 | 446,742 | 4.00 | 670,113 | 6.00 | 1,032,562 | 6.84 | 603,430 | 4.00 | 905,144 | 6.00 | |||||||||||||||||||||
California Bank & Trust | 692,103 | 6.94 | 398,737 | 4.00 | 598,106 | 6.00 | 689,380 | 7.33 | 376,126 | 4.00 | 564,190 | 6.00 | |||||||||||||||||||||
Amegy Bank N.A. | 559,364 | 7.94 | 281,948 | 4.00 | 422,922 | 6.00 | 742,630 | 6.90 | 430,791 | 4.00 | 646,186 | 6.00 | |||||||||||||||||||||
Tier I capital (to average assets) | |||||||||||||||||||||||||||||||||
Tier 1 capital (to average assets) | |||||||||||||||||||||||||||||||||
The Company | 2,830,419 | 8.16 | 1,040,785 | 3.00 | 1,734,642 | 5.00 | 3,596,234 | 7.37 | 1,463,464 | 3.00 | na | na | 1 | ||||||||||||||||||||
Zions First National Bank | 807,615 | 6.35 | 381,662 | 3.00 | 636,104 | 5.00 | 1,032,562 | 6.22 | 498,409 | 3.00 | 830,681 | 5.00 | |||||||||||||||||||||
California Bank & Trust | 692,103 | 6.81 | 304,711 | 3.00 | 507,852 | 5.00 | 689,380 | 6.97 | 296,545 | 3.00 | 494,242 | 5.00 | |||||||||||||||||||||
Amegy Bank N.A. | 559,364 | 8.10 | 207,246 | 3.00 | 345,410 | 5.00 | 742,630 | 7.58 | 294,038 | 3.00 | 490,064 | 5.00 | |||||||||||||||||||||
1 | There is no Tier 1 leverage ratio component in the definition of a well capitalized bank holding company. |
20. RETIREMENT PLANS
In September 2006, the FASB issued SFAS No. 158,Employers’ Accounting for Defined Benefit Pension and Other Postretirement Plans, an amendment of FASB Statements No. 87, 88, 106, and 132(R). SFAS 158, requires an entity to recognize the overfunded or underfunded status of a defined benefit postretirement plan as an asset or liability in the balance sheet and to recognize changes in that funded status through other comprehensive income in the years in which changes occur. While
On December 30, 2008, the Statement does not change the determination of net periodic benefit cost included in net income, it does expandFASB issued FSP 132(R)-1,Employers’ Disclosures about Postretirement Benefit Plan Assets. The FSP, among other things, requires additional disclosure about pension plan assets including certain disclosure requirements about certain effects on net periodic benefit cost that may arise in subsequent fiscal years. The recognition requirements are effective for fiscal years ending after December 15, 2006 for public entities. The Statement also requires an entity to measure the funded status of a plan as of the date of its year-end balance sheet,accordance with limited exceptions. The measurement requirementSFAS No. 157,Fair Value Measurements. It is effective for fiscal years ending after December 15, 2008.
We have adopted2009. Accordingly, we will adopt the recognition and measurement requirements atFSP for our financial statements ending December 31, 2006 for all of the Company’s pension and postretirement plans. The incremental pretax effect on certain financial statement items was as follows(in thousands):2009.
Before application After application Intangible assets Liability for pension/postretirement benefits Accumulated other comprehensive loss
of SFAS 158 Adjustments
of SFAS 158 Qualified
pension Supplemental
retirement Postretirement
medical Net $ 938 (938) (938) – (33,716) (385) 1,341 956 (32,760) 25,893 385 938 (1,341) (18) 25,875
The liability for pension/postretirement benefits is included in other liabilities in the balance sheet.
We have a qualified noncontributory defined benefit pension plan which was amended January 1, 2003 after whichthat has been frozen to new employees were not allowed to participate. Allparticipation. No service-related benefit accrualsbenefits accrue for existing participants ceased as of that dateexcept for those with certain grandfathering exceptions.provisions. Benefits vestvested under the plan upon completion of five years of vesting service. Plan assets consist principally of corporate equity securities, mutual fund investments, and cash investments. Plan benefits are defined as a lump-sum cash value or an annuity at retirement age.
The following presents the change in benefit obligation, change in fair value of plan assets, and funded status of the pension plan and amounts recognized in the balance sheet as of the measurement date of December 31(in thousandsthousands)):
| 2006 | 2005 | 2008 | 2007 | |||||||||
Change in benefit obligation: | ||||||||||||
Benefit obligation at beginning of year | $ | 157,404 | 148,962 | $ | 152,813 | 155,084 | ||||||
Service cost | 499 | 557 | 288 | 384 | ||||||||
Interest cost | 8,624 | 8,630 | 8,849 | 8,564 | ||||||||
Actuarial (gain) loss | (3,242) | 7,589 | 1,137 | (2,328 | ) | |||||||
Benefits paid | (8,201) | (8,334) | (10,283 | ) | (8,891 | ) | ||||||
Benefit obligation at end of year | 155,084 | 157,404 | 152,804 | 152,813 | ||||||||
Change in fair value of plan assets: | ||||||||||||
Fair value of plan assets at beginning of year | 124,288 | 122,444 | 141,235 | 141,294 | ||||||||
Actual return on plan assets | 15,207 | 10,178 | (41,778 | ) | 8,832 | |||||||
Employer contribution | 10,000 | – | 1,000 | – | ||||||||
Benefits paid | (8,201) | (8,334) | (10,283 | ) | (8,891 | ) | ||||||
Fair value of plan assets at end of year | 141,294 | 124,288 | 90,174 | 141,235 | ||||||||
Funded status | $ | (13,790) | (33,116) | $ | (62,630 | ) | (11,578 | ) | ||||
Amounts recognized in balance sheet: | ||||||||||||
Liability for pension benefits | $ | (13,790) | (32,590) | $ | (62,630 | ) | (11,578 | ) | ||||
Accumulated other comprehensive loss | 25,221 | 34,894 | 77,679 | 24,591 | ||||||||
Accumulated other comprehensive loss consists of: | ||||||||||||
Net loss | $ | 25,221 | 34,894 | 77,679 | 24,591 | |||||||
The liability for pension/postretirement benefits is included in other liabilities in the balance sheet.
The amount of net loss in accumulated other comprehensive loss at December 31, 20062008 expected to be recognized as an expense component of net periodic benefit cost in 20072009 is approximately $1.0$6.6 million. The accumulated benefit obligation for the pension plan was $154.7$152.6 million and $156.9$152.5 million as of December 31, 20062008 and 2005,2007, respectively. Future contributionsContributions to the plan will beare based on actuarial recommendation utilizingand pension regulations.
The following presents the components of net periodic benefit cost (credit) for the plan(in thousands):
| 2006 | 2005 | 2004 | |||||
Service cost | $ | 499 | 557 | 598 | |||
Interest cost | 8,624 | 8,630 | 8,430 | ||||
Expected return on plan assets | (10,250) | (10,211) | (9,650) | ||||
Amortization of net actuarial loss | 1,999 | 1,850 | 1,179 | ||||
Net periodic benefit cost | $ | 872 | 826 | 557 | |||
| 2008 | 2007 | 2006 | ||||||||
Service cost | $ | 288 | 384 | 499 | ||||||
Interest cost | 8,849 | 8,564 | 8,624 | |||||||
Expected return on plan assets | (11,235 | ) | (11,618 | ) | (10,250 | ) | ||||
Amortization of net actuarial loss | 1,063 | 1,089 | 1,999 | |||||||
Net periodic benefit cost (credit) | $ | (1,035 | ) | (1,581 | ) | 872 | ||||
Weighted average assumptions for the plan are as follows:
| 2006 | 2005 | 2004 | ||||
Used to determine benefit obligation at year-end: | ||||||
Discount rate | 5.65% | 5.60% | 5.75% | |||
Rate of compensation increase | 4.25 | 4.25 | 4.25 | |||
Used to determine net periodic benefit cost for the years ended December 31: | ||||||
Discount rate | 5.60 | 5.75 | 6.25 | |||
Expected long-term return on plan assets | 8.50 | 8.60 | 8.60 | |||
Rate of compensation increase | 4.25 | 4.25 | 4.00 |
| 2008 | 2007 | 2006 | |||||||
Used to determine benefit obligation at year-end: | |||||||||
Discount rate | 6.00 | % | 6.00 | % | 5.65 | % | |||
Rate of compensation increase | 4.25 | 4.25 | 4.25 | ||||||
Used to determine net periodic benefit cost for the years ended December 31: | |||||||||
Discount rate | 6.00 | 5.65 | 5.60 | ||||||
Expected long-term return on plan assets | 8.30 | 8.30 | 8.50 | ||||||
Rate of compensation increase | 4.25 | 4.25 | 4.25 |
The discount rate reflects the yields available on long-term, high-quality fixed-incomefixed income debt instruments with cash flows similar to the obligations of the plan, reset annually on the measurement date. The expected long-term rate of return on plan assets is based on a review of the target asset allocation of the plan. This rate is intended to approximate the long-term rate of return that we anticipate receiving on the plan’s investments, considering the mix of the assets that the plan holds as investments, the expected return ofon these underlying investments, the diversification of these investments, and the rebalancing strategystrategies employed. An expected long-term rate of return is assumed for each asset class and an underlying inflation rate assumption is determined. The projected rate of compensation increases is management’s estimate of future pay increases that the remaining eligible employees will receive until their retirement.
Weighted average asset allocations at December 31 for the plan are as follows:
| 2006 | 2005 | |||
Equity securities | 5% | 5% | ||
Mutual funds: | ||||
Equity funds | 14 | 14 | ||
Debt funds | 18 | 17 | ||
Other: | ||||
Insurance company separate accounts – | 60 | 59 | ||
Guaranteed deposit account | 3 | 5 | ||
| 100% | 100% | |||
| 2008 | 2007 | |||||
Equity securities | 5 | % | 3 | % | ||
Mutual funds: | ||||||
Equity funds | 9 | 12 | ||||
Debt funds | 23 | 19 | ||||
Insurance company separate accounts: | ||||||
Equity investments | 42 | 60 | ||||
Short-term fund | 11 | – | ||||
Guaranteed deposit account | 9 | 6 | ||||
Other | 1 | – | ||||
| 100 | % | 100 | % | |||
The plan’s investment strategy is predicated on its investment objectives and the risk and return expectations of asset classes appropriate for the plan. Investment objectives have been established by considering the plan’s liquidity needs and time horizon and the fiduciary standards under ERISA. The asset allocation strategy is developed to meet the plan’s long-term needs in a manner designed to control volatility and to reflect risk tolerance. Current targetTarget investment allocation percentages as of December 31, 2008 are 75% invested62.5% in equitiesequity and 25% invested37.5% in fixed income assets.
Equity securities consist of 91,606169,973 shares of Company common stock with a fair value of $7.6$4.2 million at December 31, 20062008 and 89,95793,808 shares with a fair value of $6.8$4.4 million at December 31, 2005.2007. Dividends received by the plan were approximately $143$222 thousand in 20062008 and $130$161 thousand in 2005.2007.
Benefit payments to pension plan participants, which reflect expected future service as appropriate, are estimated as follows for the years succeeding December 31, 20062008(in thousands):
2007 | $ | 8,513 | |
2008 | 8,361 | ||
2009 | 9,168 | ||
2010 | 9,976 | ||
2011 | 9,021 | ||
Years 2012 - 2016 | 51,733 |
Amegy also has a defined benefit pension plan which has been frozen and will be terminated. The recorded liability for pension benefits of approximately $1.4 million at December 31, 2006 is considered actuarially sufficient for termination purposes.
2009 | $ | 9,398 | |
2010 | 10,122 | ||
2011 | 8,945 | ||
2012 | 10,249 | ||
2013 | 10,070 | ||
Years 2014 - 2018 | 51,868 |
We also have unfunded nonqualified supplemental retirement plans for certain current and former employees. The following presents the change in benefit obligation, change in fair value of plan assets, and funded status of these plans and amounts recognized in the balance sheet as of the measurement date of December 31(in thousandsthousands)):
| 2006 | 2005 | ||||
Change in benefit obligation: | |||||
Benefit obligation at beginning of year | $ | 13,415 | 13,155 | ||
Interest cost | 719 | 730 | |||
Actuarial (gain) loss | (236) | 269 | |||
Benefits paid | (846) | (739) | |||
Benefit obligation at end of year | 13,052 | 13,415 | |||
Change in fair value of plan assets: | |||||
Fair value of plan assets at beginning of year | – | – | |||
Employer contributions | 846 | 739 | |||
Benefits paid | (846) | (739) | |||
Fair value of plan assets at end of year | – | – | |||
Funded status | $ | (13,052) | (13,415) | ||
Amounts recognized in balance sheet: | |||||
Liability for pension benefits | $ | (13,052) | (13,415) | ||
Accumulated other comprehensive loss | 1,995 | 1,283 | |||
Accumulated other comprehensive loss consists of: | |||||
Net loss | $ | 1,057 | na | ||
Prior service cost | 922 | na | |||
Transition liability | 16 | na | |||
| $ | 1,995 | 1,283 | |||
| 2008 | 2007 | ||||||
Change in benefit obligation: | |||||||
Benefit obligation at beginning of year | $ | 11,795 | 13,052 | ||||
Interest cost | 680 | 693 | |||||
Actuarial gain | (113 | ) | (205 | ) | |||
Benefits paid | (904 | ) | (904 | ) | |||
Settlements | – | (841 | ) | ||||
Benefit obligation at end of year | 11,458 | 11,795 | |||||
Change in fair value of plan assets: | |||||||
Fair value of plan assets at beginning of year | – | – | |||||
Employer contributions | 904 | 1,745 | |||||
Benefits paid and settlements | (904 | ) | (1,745 | ) | |||
Fair value of plan assets at end of year | – | – | |||||
Funded status | $ | (11,458 | ) | (11,795 | ) | ||
Amounts recognized in balance sheet: | |||||||
Liability for pension benefits | $ | (11,458 | ) | (11,795 | ) | ||
Accumulated other comprehensive loss | 1,290 | 1,500 | |||||
Accumulated other comprehensive loss consists of: | |||||||
Net loss | $ | 617 | 702 | ||||
Prior service cost | 673 | 798 | |||||
| $ | 1,290 | 1,500 | |||||
The amounts in accumulated other comprehensive loss at December 31, 20062008 expected to be recognized as an expense component of net periodic benefit cost in 20072009 are estimated as follows(in thousands):
| |||
| |||
| |||
Net gain | $ | (29 | ) | |
Prior service cost | 124 | |||
| $ | 95 | |||
The following presents the components of net periodic benefit cost for these plans(in thousands):
| 2006 | 2005 | 2004 | |||||
Interest cost | $ | 719 | 730 | 766 | |||
Amortization of net actuarial gain | (10) | (16) | (32) | ||||
Amortization of prior service cost | 124 | 124 | 124 | ||||
Amortization of transition liability | 16 | 16 | 16 | ||||
Net periodic benefit cost | $ | 849 | 854 | 874 | |||
| 2008 | 2007 | 2006 | |||||||
Interest cost | $ | 680 | 693 | 719 | |||||
Amortization of net actuarial (gain) loss | (27 | ) | 149 | (10 | ) | ||||
Amortization of prior service cost | 124 | 124 | 124 | ||||||
Amortization of transition liability | – | 16 | 16 | ||||||
Net periodic benefit cost | $ | 777 | 982 | 849 | |||||
Weighted average assumptions applicable for these plans are the same as the pension plan. Each year, Company contributions to these plans are made in amounts sufficient to meet benefit payments to plan participants. These benefit payments are estimated as follows for the years succeeding December 31, 20062008(in thousands):
2007 | $ | 1,642 | |
2008 | 1,288 | ||
2009 | 1,142 | ||
2010 | 1,171 | ||
2011 | 1,233 | ||
Years 2012 - 2016 | 5,094 |
2009 | $ | 1,889 | |
2010 | 1,087 | ||
2011 | 1,153 | ||
2012 | 1,082 | ||
2013 | 948 | ||
Years 2014 - 2018 | 4,075 |
We are also obligated under several other supplemental retirement plans for certain current and former employees. At December 31, 20062008 and 2005,2007, our liability was $5.4 million and $5.5$5.1 million, respectively, for these plans.
We also sponsor an unfunded defined benefit health care plan that provides postretirement medical benefits to certain full-time employees who met minimum age and service requirements. The plan is contributory with retiree contributions adjusted annually, and contains other cost-sharing features such as deductibles and coinsurance. Plan coverage is provided by self-funding or health maintenance organizations (HMOs) options. Reductions in our obligations to provide benefits resulting from cost sharing changes have been applied to reduceOur contribution towards the plan’s unrecognized transition obligation. In 2000, we increased our contribution toward retiree medical coverage andpremium has been permanently froze our contributions.frozen. Retirees pay the difference between the full premium rates and our capped contribution.
Effective June 1, 2008, we amended the plan and curtailed coverage for certain participants, primarily those with post-65 coverage. The effect of this curtailment on the change in the plan’s benefit obligation and determination of net periodic benefit cost (credit) for 2008 was determined in accordance with applicable accounting standards.
The following table presents the change in benefit obligations, change in fair value of plan assets, and funded status of the plan and amounts recognized in the balance sheet as of the measurement date of December 31(in thousands):
Change in benefit obligation: Benefit obligation at beginning of year Service cost Interest cost Actuarial (gain) loss Benefits paid Benefit obligation at end of year Change in fair value of plan assets: Fair value of plan assets at beginning of year Employer contributions Benefits paid Fair value of plan assets at end of year Funded status Amounts recognized in balance sheet: Liability for postretirement benefits Accumulated other comprehensive loss Accumulated other comprehensive loss consists of: Net gain 2006 2005 $ 6,454 6,539 101 118 326 357 (337) 91 (625) (651) 5,919 6,454 – – 625 651 (625) (651) – – $ (5,919) (6,454) $ (5,919) (7,791) (1,341) – $ (1,341) –
| 2008 | 2007 | ||||||
Change in benefit obligation: | |||||||
Benefit obligation at beginning of year | $ | 5,728 | 5,919 | ||||
Service cost | 56 | 105 | |||||
Interest cost | 181 | 318 | |||||
Plan amendment/settlement | (4,239 | ) | – | ||||
Actuarial gain | (96 | ) | (18 | ) | |||
Benefits paid | (530 | ) | (596 | ) | |||
Benefit obligation at end of year | 1,100 | 5,728 | |||||
Change in fair value of plan assets: | |||||||
Fair value of plan assets at beginning of year | – | – | |||||
Employer contributions | 530 | 596 | |||||
Benefits paid | (530 | ) | (596 | ) | |||
Fair value of plan assets at end of year | – | – | |||||
Funded status | $ | (1,100 | ) | (5,728 | ) | ||
Amounts recognized in balance sheet: | |||||||
Liability for postretirement benefits | $ | (1,100 | ) | (5,728 | ) | ||
Accumulated other comprehensive loss | (2,105 | ) | (1,090 | ) | |||
Accumulated other comprehensive loss consists of: | |||||||
Net gain | $ | (980 | ) | (1,090 | ) | ||
Prior service cost | (1,125 | ) | – | ||||
| $ | (2,105 | ) | (1,090 | ) | |||
The amount of net gain in accumulated other comprehensive loss at December 31, 20062008 expected to be recognized as a component of net periodic benefit cost in 20072009 is approximately $268$440 thousand.
The following presents the components of net periodic benefit cost (credit) for the plan(in thousands):
| 2006 | 2005 | 2004 | |||||
Service cost | $ | 101 | 118 | 103 | |||
Interest cost | 326 | 357 | 385 | ||||
Amortization of prior service cost | – | – | 85 | ||||
Amortization of net actuarial gain | (333) | (357) | (512) | ||||
Net periodic benefit cost | $ | 94 | 118 | 61 | |||
| 2008 | 2007 | 2006 | ||||||||
Service cost | $ | 56 | 105 | 101 | ||||||
Interest cost | 181 | 318 | 326 | |||||||
Amortization of prior service cost (credit) | (142 | ) | – | – | ||||||
Amortization of net actuarial gain | (206 | ) | (268 | ) | (333 | ) | ||||
Plan amendment/settlement gain | (2,973 | ) | – | – | ||||||
Net periodic benefit cost (credit) | $ | (3,084 | ) | 155 | 94 | |||||
Weighted average assumptions for the plan are as follows:
| 2006 | 2005 | 2004 | 2008 | 2007 | 2006 | ||||||||||
Used to determine benefit obligation at year-end: | |||||||||||||||
Discount rate | 5.65% | 5.60% | 5.75% | 6.00 | % | 6.00 | % | 5.65 | % | ||||||
Used to determine net periodic benefit cost for the years ended December 31: | |||||||||||||||
Discount rate | 5.60 | 5.75 | 6.25 | 6.00 | 5.65 | 5.60 | |||||||||
Because our contribution rate is capped, there is no effect on the plan from assumed increases or decreases in health care cost trends. Each year, Company contributions to the plan are made in amounts sufficient to meet benefit payments to plan participants. These benefit payments are estimated as follows for the years succeeding December 31, 20062008(in thousands):
2007 | $ | 593 | |
2008 | 571 | ||
2009 | 552 | ||
2010 | 536 | ||
2011 | 519 | ||
Years 2012 - 2016 | 2,351 |
2009 2010 2011 2012 2013 Years 2014 - 2018 $ 97 110 120 127 126 601
We have a 401(k) and employee stock ownership plan (“Payshelter”) under which employees select from several investment alternatives excluding the Company’s common stock. Effective in July 2006, employeesalternatives. Employees can contribute up to 80% of their earnings subject to the Payshelter plan which will be matchedannual maximum allowed contribution. The Company matches 100% by the Company forof the first 3% of employee contributions and 50% forof the next 2% of employee contributions. Our matchingMatching contributions are invested in the Company’s common stock and amounted to $20.6 million in 2008, $19.8 million in 2007, and $17.3 million in 2006, $12.4 million in 2005, and $11.3 million in 2004.
2006.
The Payshelter plan also has a noncontributory profit sharing feature which is discretionary and may range from 0% to 6% of eligible compensation based upon the Company’s return on average common equity for the year. For 2006 and 2005, the contribution percentage was 4% for each year, and the related2008, no profit sharing expense was $17.9accrued. For 2007, the profit sharing expense was $17.0 million and $13.2 million, respectively. Ourcomputed at a contribution rate of 3.25%. The profit sharing contribution is also invested in the Company’s common stock.
21. FAIR VALUE
Effective January 1, 2008, we adopted SFAS No. 157,Fair Value Measurements, and SFAS No. 159,The rangeFair Value Option for Financial Assets and resulting contribution percentageFinancial Liabilities. Both Standards address the application of fair value accounting and reporting.
Fair Value Measurements
SFAS 157 defines fair value, establishes a consistent framework for measuring fair value, and enhances disclosures about fair value measurements. In February 2008, the FASB amended SFAS 157 with the issuance of FSP FAS 157-1, which excludes with certain exceptions SFAS No. 13,Accounting for Leases, from the scope of SFAS 157, and FSP FAS 157-2, which delayed the adoption of SFAS 157 for one year for the measurement of nonfinancial assets and nonfinancial liabilities. In addition, the FASB issued FSP FAS 157-c,Measuring Liabilities under FASB Statement No. 157, which is a proposal that would provide further clarification for applying SFAS 157 principles to the measurement of certain liabilities, including derivatives. There was no material effect from the adoption of SFAS 157 on the Company’s consolidated financial statements.
SFAS 157 defines fair value as the exchange price that would be received for an asset or paid to transfer a liability (an exit price) in the principal or most advantageous market for the asset or liability in an orderly transaction between market participants on the measurement date. To measure fair value, SFAS 157 has established a hierarchy which requires an entity to maximize the use of observable inputs and minimize the use of unobservable inputs. This hierarchy uses three levels of inputs to measure the fair value of assets and liabilities as follows:
Level 1 – Quoted prices in active markets for identical assets or liabilities; includes certain U.S. Treasury and other U.S. Government and agency securities actively traded in over-the-counter markets; certain securities sold, not yet purchased; and certain derivatives.
Level 2 – Observable inputs other than Level 1 including quoted prices for similar assets or liabilities, quoted prices in less active markets, or other observable inputs that can be corroborated by observable market data; also includes derivative contracts whose value is determined using a pricing model with
observable market inputs or can be derived principally from or corroborated by observable market data. This category generally includes certain U.S. Government and agency securities; certain CDO securities; corporate debt securities; certain private equity investments; certain securities sold, not yet purchased; and certain derivatives.
Level 3 – Unobservable inputs supported by little or no market activity for financial instruments whose value is determined using pricing models, discounted cash flow methodologies, or similar techniques, as well as instruments for which the determination of fair value requires significant management judgment or estimation; also includes observable inputs for nonbinding single dealer quotes not corroborated by observable market data. This category generally includes certain CDO securities and certain private equity investments.
We use fair value to measure certain assets and liabilities on a recurring basis when fair value is the primary measure for accounting. This is done primarily for AFS and trading investment securities; private equity investments; securities sold, not yet purchased; and derivatives. Fair value is used on a nonrecurring basis to measure certain assets when applying lower of cost or market accounting or when adjusting carrying values, such as for loans held for sale, impaired loans, and other real estate owned. Fair value is also used when evaluating impairment on certain assets, including HTM and AFS securities, goodwill, and core deposit and other intangibles, long-lived assets, and for annual disclosures required by SFAS No. 107,Disclosures about Fair Value of Financial Instruments.
AFS and trading investment securities are fair valued under Level 1 using quoted market prices when available for identical securities. When quoted prices are not available, fair values are determined under Level 2 using quoted prices for similar securities or independent pricing services that incorporate observable market data when possible. AFS securities include certain CDOs that consist of trust preferred securities related to banks and insurance companies and to REITs. Where possible, the fair value of these CDOs is priced under Level 2 using a whole market price quote method that incorporates matrix pricing and uses the prices of securities of similar type and rating to value comparable securities held by us. If sufficient information is not available for matrix pricing, fair value is determined under Level 3 using nonbinding single dealer quotes or the model pricing discussed subsequently.
Because of market disruptions during the latter half of 2008, both the SEC on September 30, 2008 (Release No. 2008-234) and the FASB on October 10, 2008 (FSP FAS 157-3,Determining the Fair Value of a Financial Asset When the Market for That Asset Is Not Active) issued additional guidance on fair value accounting when markets become distressed and inactive. In general, this guidance clarifies under such market conditions when and how an entity might appropriately determine fair value using unobservable inputs under Level 3 rather than using observable inputs under Level 2, particularly when significant adjustments become necessary under Level 2 and extensive judgment must be employed to evaluate inputs and results in estimating fair value.
As a result of the above, we determined during the latter half of 2008 that substantially all CDOs previously fair valued under a Level 2 matrix approach would be more appropriately fair valued under a Level 3 cash flow modeling approach. Additional investment securities previously fair valued with Level 3 single dealer quotes were increasedalso moved to a Level 3 cash flow modeling approach.
We value our CDO portfolio using several methodologies that primarily include internal and third party models and to a lesser extent dealer quotes and pricing services. A licensed third party model is used internally to fair value bank and insurance trust preferred CDOs. This model uses estimated values of expected losses on underlying collateral and applies market-based discount rates on resultant cash flows to estimate fair value. Third party models are used to fair value certain REIT and ABS CDOs. These models utilize relevant data assumptions, which we evaluate for reasonableness. These assumptions include but are not limited to probability of default, collateral recovery rates, discount rates, over-collateralization levels, and rating transition probability matrices from rating agencies. The model prices obtained from third party services were evaluated for reasonableness
including quarter to quarter changes in 2005assumptions and comparison to other available data which included third party and internal model results and valuations. Our decision to use Level 3 model pricing for certain CDOs was made due to continued trading contraction of these securities and the lack of observable market inputs to value such securities.
Private equity investments valued under Level 2 on a recurring basis are investments in partnerships that invest in financial institutions. Fair values are determined from net asset values provided by the partnerships. Private equity investments valued under Level 3 on a recurring basis are recorded initially at acquisition cost, which is considered the best indication of fair value unless there have been significant subsequent positive or negative developments that justify an adjustment in the fair value estimate. Subsequent adjustments to recorded fair values are based as necessary on current and projected financial performance, recent financing activities, economic and market conditions, market comparables, market liquidity, sales restrictions, and other factors.
Derivatives are fair valued according to their classification as either exchange-traded or over-the-counter (“OTC”). Exchange-traded derivatives consist of forward currency exchange contracts that have been fair valued under Level 1 because we discontinuedthey are traded in active markets. OTC derivatives consist of interest rate swaps and options as well as energy commodity derivatives for customers. These derivatives are fair valued primarily under Level 2 using third party services. Observable market inputs include yield curves, option volatilities, counterparty credit risk, and other related data. Credit valuation adjustments are required to reflect both our own nonperformance risk and the broad-based employee stock option plan,respective counterparty’s nonperformance risk. These adjustments are determined generally by applying a credit spread for the counterparty or the Company as appropriate to the total expected exposure of the derivative. Amounts disclosed in the following table are also net of the cash collateral offsets pursuant to the guidance of FSP FIN 39-1, as discussed in Note 17. Amegy’s 401(k) plan was merged into7.
Securities sold, not yet purchased are fair valued under Level 1 when quoted prices are available for the Payshelter plan in July 2006.
securities involved. Those under Level 2 are fair valued similar to trading account investment securities.
21. FAIR VALUE OF FINANCIAL INSTRUMENTSAssets and liabilities measured at fair value on a recurring basis, including those elected under SFAS 159, are summarized as follows at December 31, 2008(in thousands):
| Level 1 | Level 2 | Level 3 | Total | |||||||
ASSETS | ||||||||||
Investment securities: | ||||||||||
Available-for-sale | $ | 27,756 | 1,898,082 | 750,417 | 2,676,255 | |||||
Trading account | 41,108 | 956 | 1 | 42,064 | ||||||
Other noninterest-bearing investments: | ||||||||||
Private equity | 29,037 | 143,511 | 172,548 | |||||||
Other assets: | ||||||||||
Derivatives | 9,922 | 395,272 | 405,194 | |||||||
| $ | 37,678 | 2,363,499 | 894,884 | 3,296,061 | ||||||
LIABILITIES | ||||||||||
Securities sold, not yet purchased | $ | 35,657 | 35,657 | |||||||
Other liabilities: | ||||||||||
Derivatives | 8,812 | 175,670 | 184,482 | |||||||
Other | 527 | 527 | ||||||||
| $ | 8,812 | 211,327 | 527 | 220,666 | ||||||
1 | Elected under SFAS 159 for fair value option, as discussed subsequently. |
The carrying valuefollowing reconciles the beginning and estimatedending balances of assets and liabilities for 2008 that are measured at fair value of principal financial instrumentson a recurring basis using Level 3 inputs(in thousands):
| Level 3 Instruments | ||||||||||||||||
| Year Ended December 31, 2008 | ||||||||||||||||
| Investment securities | Retained interests from securitizations1 | Private equity investments | Other liabilities | |||||||||||||
| Available- for-sale | Trading account1 | |||||||||||||||
Balance at January 1, 2008 | $ | 337,338 | 8,100 | 42,426 | 116,657 | (44 | ) | |||||||||
Total net gains (losses) included in: | ||||||||||||||||
Statement of income2: | ||||||||||||||||
Dividends and other investment income | 6,880 | |||||||||||||||
Fair value and nonhedge derivative loss | (7,144 | ) | (2,098 | ) | ||||||||||||
Equity securities gains (losses), net | (7,580 | ) | ||||||||||||||
Impairment losses on AFS securities and valuation losses on securities purchased from Lockhart Funding | (112,131 | ) | ||||||||||||||
Other noninterest expense | 517 | |||||||||||||||
Other comprehensive loss | (165,694 | ) | ||||||||||||||
Proceeds from ESOARS auction | (1,000 | ) | ||||||||||||||
Fair value of AFS securities transferred to HTM | (206,020 | ) | ||||||||||||||
Purchases, sales, issuances, and settlements, net | 68,158 | (13,593 | ) | 27,554 | ||||||||||||
Net transfers in (out) | 828,766 | – | (26,735 | ) | – | |||||||||||
Balance at December 31, 2008 | $ | 750,417 | 956 | – | 143,511 | (527 | ) | |||||||||
1 | Elected under SFAS 159 for fair value option, as discussed subsequently. |
2 | All amounts are unrealized except for realized gains of $5.9 million in dividends and other investment income and $11.2 million in equity securities gains (losses), net. |
Assets measured at fair value on a nonrecurring basis are summarized as follows(in thousands):
| December 31, 2006 | December 31, 2005 | ||||||||
Carrying value | Estimated fair value | Carrying value | Estimated fair value | ||||||
Financial assets: | |||||||||
Cash and due from banks | $ | 1,938,810 | 1,938,810 | 1,706,590 | 1,706,590 | ||||
Money market investments | 369,276 | 369,276 | 666,742 | 666,742 | |||||
Investment securities | 5,767,467 | 5,763,171 | 6,057,212 | 6,049,679 | |||||
Loans and leases, net of allowance | 34,302,406 | 34,311,063 | 29,788,537 | 29,798,159 | |||||
Derivatives (included in other assets) | 51,749 | 51,749 | 53,056 | 53,056 | |||||
Total financial assets | $ | 42,429,708 | 42,434,069 | 38,272,137 | 38,274,226 | ||||
Financial liabilities: | |||||||||
Demand, savings, and money market deposits | $ | 25,869,197 | 25,869,197 | 26,009,587 | 26,009,587 | ||||
Time deposits | 6,560,023 | 6,574,080 | 4,453,385 | 4,452,249 | |||||
Foreign deposits | 2,552,526 | 2,551,651 | 2,179,436 | 2,183,726 | |||||
Securities sold, not yet purchased | 50,416 | 50,416 | 64,654 | 64,654 | |||||
Federal funds purchased and security repurchase agreements | 2,927,540 | 2,927,540 | 2,283,320 | 2,283,320 | |||||
Derivatives (included in other liabilities) | 63,191 | 63,191 | 77,980 | 77,980 | |||||
Commercial paper, FHLB advances and other borrowings | 875,490 | 880,630 | 420,477 | 429,900 | |||||
Long-term debt | 2,357,721 | 2,384,806 | 2,511,366 | 2,541,620 | |||||
Total financial liabilities | $ | 41,256,104 | 41,301,511 | 38,000,205 | 38,043,036 | ||||
| Gains (losses) from fair value changes | ||||||||||||
| Fair value at December 31, 2008 | Year Ended December 31, 2008 | |||||||||||
| Level 1 | Level 2 | Level 3 | Total | |||||||||
Loans held for sale | $ | 21,518 | 21,518 | 34 | ||||||||
Impaired loans | 254,743 | 254,743 | (53,259 | ) | ||||||||
| $ | – | 276,261 | – | 276,261 | (53,225 | ) | ||||||
Loans held for sale relate to loans purchased under the SBA 7(a) program. They are fair valued under Level 2 based on quotes of comparable instruments.
Impaired loans that are collateral-dependent are fair valued under Level 2 based on the fair value of the collateral, which is determined when appropriate from appraisals and other observable market data.
Financial AssetsFair Value Option
SFAS 159 allows for the option to report certain financial assets and liabilities at fair value initially and at subsequent measurement dates with changes in fair value included in earnings. The option may be applied instrument by instrument, but is on an irrevocable basis. As of January 1, 2008, we elected the fair value option for one AFS trust preferred REIT CDO security and three retained interests on selected small business loan
securitizations. The cumulative effect of adopting SFAS 159 decreased retained earnings at January 1, 2008 as follows(in thousands):
| Carrying value ending balance at December 31, 2007 | Adjustment gain (loss) | Fair value beginning balance at January 1, 2008 | |||||||
Investment securities, available-for-sale, asset-backed trust preferred REIT CDO1 | $ | 27,000 | (18,900 | ) | 8,100 | ||||
Other assets, retained interests on certain small business loan securitizations | 42,103 | 323 | 42,426 | ||||||
Cumulative effect adjustment, pretax | (18,577 | ) | |||||||
Deferred income tax impact | 7,106 | ||||||||
Cumulative effect adjustment, after-tax, decrease to retained earnings | $ | (11,471 | ) | ||||||
1 | Subsequently classified as trading account. |
The REIT trust preferred CDO was selected as part of a directional hedging program to hedge the credit exposure we have to homebuilders in our REIT CDO portfolio. This allows us to avoid the complex hedge accounting provisions associated with the implemented hedging program. Management selected this security because it had the most exposure to the homebuilder market compared to the other REIT CDOs in our portfolio, both in dollar amount and as a percentage, and was therefore considered the most suitable for hedging.
The retained interests were selected to more appropriately reflect their fair value and to account for increases and decreases in their fair value through earnings. Net decreases in fair value of approximately $2.1 million during 2008 were recognized in fair value and nonhedge derivative loss in the statement of income. However as discussed in Note 6, during 2008, Zions Bank purchased securities from Lockhart that comprised the entire remaining small business loan securitizations created by Zions Bank and held by Lockhart. These retained interests related to the securities purchased and, as part of the purchase transaction, were included with the $23 million premium amount recorded with the loan balances at Zions Bank.
As required by SFAS 107, the following is a summary of the carrying values and estimated fair values of certain financial instruments(in thousands):
| December 31, 2008 | December 31, 2007 | ||||||||
| Carrying value | Estimated fair value | Carrying value | Estimated fair value | ||||||
Financial assets: | |||||||||
HTM investment securities | $ | 1,790,989 | 1,443,555 | 704,441 | 702,148 | ||||
Loans and leases, net of allowance | 41,172,057 | 40,646,816 | 38,628,403 | 38,975,714 | |||||
Financial liabilities: | |||||||||
Time deposits | $ | 7,730,784 | 7,923,883 | 6,953,951 | 7,017,862 | ||||
Foreign deposits | 2,622,562 | 2,625,869 | 3,375,426 | 3,374,886 | |||||
FHLB advances and other borrowings | 2,168,106 | 2,179,562 | 3,607,452 | 3,613,520 | |||||
Long-term debt | 2,257,633 | 1,838,555 | 2,463,254 | 2,493,832 | |||||
This summary excludes financial assets and liabilities for which carrying value approximates the carrying value offair value. For financial assets, these include cash and due from banks and money market investments. For investment securities, the fair value is based on quotedfinancial liabilities, these include demand, savings, and money market prices where available. If quoted market prices are not available, fair values are based on quoted market prices of comparable instruments or a discounted cash flow model based on established market rates. The fair value of fixed-rate loans is estimated by discounting future cash flows using the LIBOR yield curve adjusted by a factor which reflects the creditdeposits, federal funds purchased, and interest rate risk inherent in the loan. Variable-rate loans reprice with changes in market rates. As such, their carrying amounts are deemed to approximate fair value.
Financial Liabilities
security repurchase agreements. The estimated fair value of demand, savings, and money market deposits is the amount payable on demand at the reporting date. SFAS No. 107Disclosures about Fair Value of Financial Instruments, requires the use of the carrying value because the accounts have no stated maturity and the customer has the ability to withdraw funds immediately. Also excluded from the summary are financial instruments recorded at value fair on a recurring basis, as previously described.
The estimated fair value of securities soldloans is estimated by discounting future cash flows on ‘pass’ grade loans using the LIBOR yield curve adjusted by a factor which reflects the credit and interest rate risk inherent in the loan. These future cash flows are then reduced by the estimated ‘life-of-the-loan’ aggregate credit losses in the loan portfolio. These adjustments for lifetime future credit losses are highly judgmental because the Company does not yet purchased, federal fundshave a validated model to estimate lifetime losses on large portions of its loan portfolio. Loans accounted for under SFAS 114 are not included in this credit adjustment as they are already considered to be held at fair value. Loans, other than those held for sale, are not normally purchased and security repurchase agreements also approximatessold by the carrying value. Company, and there are no active trading markets for most of this portfolio.
The fair value of time and foreign deposits, is estimated by discounting future cash flows using the LIBOR yield curve. Commercial paper is issued for short terms of duration. The fair value of fixed rate FHLB advances, and other borrowings is estimated by discounting future cash flows using the LIBOR yield curve. Variable rate FHLB advances reprice with changes in market rates; as such, their carrying amounts approximate their fair value. Other borrowings are not significant. The estimated fair value of long-term debt is based on discounting cash flows using the LIBOR yield curve plus credit spreads.
Derivative Instruments
The fair value of the derivatives reflects the estimated amounts that we would receive or pay to terminate these contracts at the reporting date based upon pricing or valuation models applied to current market information. Interest rate swaps are valued using the market standard methodology of netting the discounted future fixed cash receipts (or payments) and the discounted expected variable cash payments (or receipts). The variable cash payments (or receipts) are based on an expectation of future interest rates derived from observed market interest rate curves.
Off-Balance-Sheet Financial Instruments
The fair value of commitments to extend credit and letters of credit, based on fees currently charged for similar commitments, is not significant.
Limitations
These fair value disclosures represent our best estimates based on relevant market information and information about the financial instruments. Fair value estimates are based on judgments regarding future expected loss experience, current economic conditions, risk characteristics of the various instruments, and other factors. These estimates are subjective in nature and involve uncertainties and matters of significant judgment and therefore cannot be determined with precision. Changes in the above methodologies and assumptions could significantly affect the estimates.
Further, certain financial instruments and all nonfinancial instruments are excluded from the applicable disclosure requirements. Therefore, the fair value amounts shown in the table do not, by themselves, represent the underlying value of the Company as a whole.
On January 30, 2009, the FASB issued a proposed amendment to SFAS 107, FSP FAS 107-b and APB 28-a,Interim Disclosure about Fair Value of Financial Instruments. The FSP would extend the annual fair value disclosure requirements of SFAS 107 to interim financial statements. If finalized, the proposed FSP would be effective for interim and annual reporting periods ending after March 15, 2009.
22. OPERATING SEGMENT INFORMATION
We manage our operations and prepare management reports and other information with a primary focus on geographical area. As of December 31, 2006,2008, we operate eight community/regional banks in distinct geographical areas. Performance assessment and resource allocation are based upon this geographical structure. The operating segment identified as “Other” includes the Parent, Zions Management Services Company (“ZMSC”), certain nonbank financial service and financial technology subsidiaries, other smaller nonbank operating units, TCBO (see Note 1), and eliminations of transactions between segments. Results for Amegy in 2005 only include
ZMSC provides internal technology and operational services to affiliated operating businesses of the monthCompany. ZMSC charges most of December.
its costs to the affiliates on an approximate break-even basis.
The accounting policies of the individual operating segments are the same as those of the Company as described in Note 1. Transactions between operating segments are primarily conducted at fair value, resulting in profits that are eliminated for reporting consolidated results of operations. Operating segments pay for centrally provided services based upon estimated or actual usage of those services.
The Company previously had a program where interest rate swaps were recorded and managed by Zions Bank for the benefit of other banking subsidiaries and hedge income was appropriately allocated. Starting in 2003, new interest rate swaps were recorded directly by the banking subsidiaries. In 2006 and 2005 for hedges remaining from the previous program, the amount of hedge income allocated to/from Zions Bank was not material. In the following tables presenting operating segment information, hedge income allocated to/from participating banking subsidiaries and hedge income recognized directly by these banking subsidiaries are presented as separate line items.
The following is a summary of selected operating segment information for the years ended December 31, 2008, 2007 and 2006 2005 and 2004(in(in millions):
| Zions Bank | CB&T | Amegy | NBA | NSB | Vectra | TCBW | Other | Consolidated Company | |||||||||||
2006: | |||||||||||||||||||
Net interest income excluding hedge income | $ | 473.9 | 487.9 | 306.0 | 218.4 | 201.4 | 100.5 | 35.5 | (18.9) | 1,804.7 | |||||||||
Hedge expense recorded directly at subsidiary | (2.2) | (18.5) | (1.3) | (3.3) | (3.9) | (6.0) | (1.8) | (3.0) | (40.0) | ||||||||||
Allocated hedge income (expense) | 0.6 | – | – | (0.2) | – | (0.3) | (0.1) | – | – | ||||||||||
Net interest income | 472.3 | 469.4 | 304.7 | 214.9 | 197.5 | 94.2 | 33.6 | (21.9) | 1,764.7 | ||||||||||
Provision for loan losses | 19.9 | 15.0 | 7.8 | 16.3 | 8.7 | 4.2 | 0.5 | 0.2 | 72.6 | ||||||||||
Net interest income after provision for loan losses | 452.4 | 454.4 | 296.9 | 198.6 | 188.8 | 90.0 | 33.1 | (22.1) | 1,692.1 | ||||||||||
Noninterest income | 263.7 | 80.7 | 114.9 | 25.4 | 31.2 | 26.8 | 2.0 | 6.5 | 551.2 | ||||||||||
Noninterest expense | 426.1 | 244.6 | 283.5 | 103.0 | 110.8 | 85.0 | 13.9 | 63.5 | 1,330.4 | ||||||||||
Income (loss) before income taxes and minority interest | 290.0 | 290.5 | 128.3 | 121.0 | 109.2 | 31.8 | 21.2 | (79.1) | 912.9 | ||||||||||
Income tax expense (benefit) | 98.1 | 117.9 | 39.5 | 47.8 | 38.1 | 11.7 | 7.0 | (42.1) | 318.0 | ||||||||||
Minority interest | 0.1 | – | 1.8 | – | – | – | – | 9.9 | 11.8 | ||||||||||
Net income (loss) | 191.8 | 172.6 | 87.0 | 73.2 | 71.1 | 20.1 | 14.2 | (46.9) | 583.1 | ||||||||||
Preferred stock dividend | – | – | – | – | – | – | – | 3.8 | 3.8 | ||||||||||
Net earnings applicable to common shareholders | $ | 191.8 | 172.6 | 87.0 | 73.2 | 71.1 | 20.1 | 14.2 | (50.7) | 579.3 | |||||||||
Assets | $ | 14,823 | 10,416 | 10,366 | 4,599 | 3,916 | 2,385 | 808 | (343) | 46,970 | |||||||||
Net loans and leases(1) | 10,702 | 8,092 | 6,352 | 4,066 | 3,214 | 1,725 | 428 | 89 | 34,668 | ||||||||||
Deposits | 10,450 | 8,410 | 7,329 | 3,695 | 3,401 | 1,712 | 513 | (528) | 34,982 | ||||||||||
Shareholder’s equity: | |||||||||||||||||||
Preferred equity | – | – | – | – | – | – | – | 240 | 240 | ||||||||||
Common equity | 972 | 1,123 | 1,805 | 346 | 273 | 314 | 56 | (142) | 4,747 | ||||||||||
Total shareholder’s equity | 972 | 1,123 | 1,805 | 346 | 273 | 314 | 56 | 98 | 4,987 | ||||||||||
| Zions Bank | CB&T | Amegy | NBA | NSB | Vectra | TCBW | Other | Consolidated Company | |||||||||||||||||||
2008: | |||||||||||||||||||||||||||
Net interest income | $ | 662.5 | 414.3 | 370.1 | 219.5 | 159.0 | 103.6 | 33.8 | 8.8 | 1,971.6 | |||||||||||||||||
Provision for loan losses | 163.1 | 82.9 | 71.9 | 211.8 | 100.3 | 15.9 | 1.1 | 1.3 | 648.3 | ||||||||||||||||||
Net interest income after provision for loan losses | 499.4 | 331.4 | 298.2 | 7.7 | 58.7 | 87.7 | 32.7 | 7.5 | 1,323.3 | ||||||||||||||||||
Impairment losses on investment securities and valuation losses on securities purchased from Lockhart Funding | (92.5 | ) | (118.0 | ) | – | – | (2.0 | ) | (6.4 | ) | (1.3 | ) | (96.9 | ) | (317.1 | ) | |||||||||||
Other noninterest income | 207.3 | 82.6 | 192.9 | 46.8 | 42.8 | 29.9 | 4.4 | (98.9 | ) | 507.8 | |||||||||||||||||
Noninterest expense | 463.4 | 239.0 | 305.2 | 161.2 | 137.9 | 85.9 | 14.8 | 67.6 | 1,475.0 | ||||||||||||||||||
Impairment loss on goodwill | – | – | – | 168.6 | 21.0 | 151.5 | – | 12.7 | 353.8 | ||||||||||||||||||
Income (loss) before income taxes (benefit) and minority interest | 150.8 | 57.0 | 185.9 | (275.3 | ) | (59.4 | ) | (126.2 | ) | 21.0 | (268.6 | ) | (314.8 | ) | |||||||||||||
Income tax expense (benefit) | 44.0 | 18.4 | 60.5 | (56.7 | ) | (13.6 | ) | 8.8 | 7.0 | (111.8 | ) | (43.4 | ) | ||||||||||||||
Minority interest | 0.1 | – | 0.3 | – | – | – | – | (5.5 | ) | (5.1 | ) | ||||||||||||||||
Net income (loss) | 106.7 | 38.6 | 125.1 | (218.6 | ) | (45.8 | ) | (135.0 | ) | 14.0 | (151.3 | ) | (266.3 | ) | |||||||||||||
Preferred stock dividend | – | – | – | – | – | – | – | 24.4 | 24.4 | ||||||||||||||||||
Net earnings (loss) applicable to common shareholders | $ | 106.7 | 38.6 | 125.1 | (218.6 | ) | (45.8 | ) | (135.0 | ) | 14.0 | (175.7 | ) | (290.7 | ) | ||||||||||||
Assets | $ | 20,778 | 10,137 | 12,406 | 4,864 | 4,063 | 2,722 | 880 | (757 | ) | 55,093 | ||||||||||||||||
Net loans and leases1 | 14,734 | 7,867 | 9,129 | 4,146 | 3,200 | 2,065 | 588 | 130 | 41,859 | ||||||||||||||||||
Deposits | 16,118 | 7,964 | 8,625 | 3,923 | 3,514 | 2,127 | 603 | (1,558 | ) | 41,316 | |||||||||||||||||
Shareholder’s equity: | |||||||||||||||||||||||||||
Preferred equity | 250 | 158 | 80 | 430 | 260 | 10 | – | 394 | 1,582 | ||||||||||||||||||
Common equity | 1,044 | 1,097 | 2,049 | 355 | 259 | 191 | 75 | (150 | ) | 4,920 | |||||||||||||||||
Total shareholder’s equity | 1,294 | 1,255 | 2,129 | 785 | 519 | 201 | 75 | 244 | 6,502 | ||||||||||||||||||
2007: | |||||||||||||||||||||||||||
Net interest income | $ | 551.4 | 434.8 | 331.3 | 250.8 | 182.5 | 96.9 | 35.1 | (0.8 | ) | 1,882.0 | ||||||||||||||||
Provision for loan losses | 39.1 | 33.5 | 21.2 | 30.5 | 23.3 | 4.0 | 0.3 | 0.3 | 152.2 | ||||||||||||||||||
Net interest income after provision for loan losses | 512.3 | 401.3 | 310.1 | 220.3 | 159.2 | 92.9 | 34.8 | (1.1 | ) | 1,729.8 | |||||||||||||||||
Impairment losses on investment securities and valuation losses on securities purchased from Lockhart Funding | (59.7 | ) | (79.2 | ) | – | – | – | – | – | (19.3 | ) | (158.2 | ) | ||||||||||||||
Other noninterest income | 236.8 | 87.3 | 126.7 | 33.4 | 32.9 | 28.1 | 2.5 | 22.8 | 570.5 | ||||||||||||||||||
Noninterest expense | 463.2 | 230.8 | 295.6 | 142.4 | 111.8 | 86.3 | 14.4 | 60.1 | 1,404.6 | ||||||||||||||||||
Income (loss) before income taxes (benefit) and minority interest | 226.2 | 178.6 | 141.2 | 111.3 | 80.3 | 34.7 | 22.9 | (57.7 | ) | 737.5 | |||||||||||||||||
Income tax expense (benefit) | 72.2 | 71.2 | 46.7 | 43.5 | 27.9 | 12.5 | 7.5 | (45.7 | ) | 235.8 | |||||||||||||||||
Minority interest | 0.2 | – | 0.1 | – | – | – | – | 7.7 | 8.0 | ||||||||||||||||||
Net income (loss) | 153.8 | 107.4 | 94.4 | 67.8 | 52.4 | 22.2 | 15.4 | (19.7 | ) | 493.7 | |||||||||||||||||
Preferred stock dividend | – | – | – | – | – | – | – | 14.3 | 14.3 | ||||||||||||||||||
Net earnings (loss) applicable to common shareholders | $ | 153.8 | 107.4 | 94.4 | 67.8 | 52.4 | 22.2 | 15.4 | (34.0 | ) | 479.4 | ||||||||||||||||
Assets | $ | 18,446 | 10,156 | 11,675 | 5,279 | 3,903 | 2,667 | 947 | (126 | ) | 52,947 | ||||||||||||||||
Net loans and leases1 | 12,997 | 7,792 | 7,902 | 4,585 | 3,231 | 1,987 | 509 | 85 | 39,088 | ||||||||||||||||||
Deposits | 11,644 | 8,082 | 8,058 | 3,871 | 3,304 | 1,752 | 608 | (396 | ) | 36,923 | |||||||||||||||||
Shareholder’s equity: | |||||||||||||||||||||||||||
Preferred equity | – | – | – | – | – | – | – | 240 | 240 | ||||||||||||||||||
Common equity | 1,048 | 1,067 | 1,932 | 581 | 261 | 329 | 67 | (232 | ) | 5,053 | |||||||||||||||||
Total shareholder’s equity | 1,048 | 1,067 | 1,932 | 581 | 261 | 329 | 67 | 8 | 5,293 | ||||||||||||||||||
| Zions Bank | CB&T | Amegy | NBA | NSB | Vectra | TCBW | Other | Consolidated Company | Zions Bank | CB&T | Amegy | NBA | NSB | Vectra | TCBW | Other | Consolidated Company | ||||||||||||||||||||||
2005: | |||||||||||||||||||||||||||||||||||||||
Net interest income excluding hedge income | $ | 405.8 | 451.0 | 25.5 | 186.2 | 170.4 | 88.1 | 29.7 | (2.4) | 1,354.3 | |||||||||||||||||||||||||||||
Hedge income (expense) recorded directly at subsidiary | 2.3 | 0.4 | – | 1.3 | 0.9 | 0.9 | (0.1) | 1.4 | 7.1 | ||||||||||||||||||||||||||||||
Allocated hedge income (expense) | (0.2) | – | – | 0.1 | – | 0.1 | – | – | – | ||||||||||||||||||||||||||||||
2006: | |||||||||||||||||||||||||||||||||||||||
Net interest income | 407.9 | 451.4 | 25.5 | 187.6 | 171.3 | 89.1 | 29.6 | (1.0) | 1,361.4 | $ | 472.3 | 469.4 | 304.7 | 214.9 | 197.5 | 94.2 | 33.6 | (21.9 | ) | 1,764.7 | |||||||||||||||||||
Provision for loan losses | 26.0 | 9.9 | – | 5.2 | (0.4) | 1.6 | 1.0 | (0.3) | 43.0 | 19.9 | 15.0 | 7.8 | 16.3 | 8.7 | 4.2 | 0.5 | 0.2 | 72.6 | |||||||||||||||||||||
Net interest income after provision for loan losses | 381.9 | 441.5 | 25.5 | 182.4 | 171.7 | 87.5 | 28.6 | (0.7) | 1,318.4 | 452.4 | 454.4 | 296.9 | 198.6 | 188.8 | 90.0 | 33.1 | (22.1 | ) | 1,692.1 | ||||||||||||||||||||
Noninterest income | 269.2 | 75.0 | 9.0 | 21.5 | 31.0 | 26.6 | 1.6 | 3.0 | 436.9 | 263.7 | 80.7 | 114.9 | 25.4 | 31.2 | 26.8 | 2.0 | 6.5 | 551.2 | |||||||||||||||||||||
Noninterest expense | 391.1 | 243.9 | 23.7 | 97.8 | 106.2 | 86.8 | 12.6 | 50.7 | 1,012.8 | 426.1 | 244.6 | 283.5 | 103.0 | 110.8 | 85.0 | 13.9 | 63.5 | 1,330.4 | |||||||||||||||||||||
Impairment loss on goodwill | 0.6 | – | – | – | – | – | – | – | 0.6 | ||||||||||||||||||||||||||||||
Income (loss) before income taxes and minority interest | 259.4 | 272.6 | 10.8 | 106.1 | 96.5 | 27.3 | 17.6 | (48.4) | 741.9 | ||||||||||||||||||||||||||||||
Income (loss) before income taxes (benefit) and minority interest | 290.0 | 290.5 | 128.3 | 121.0 | 109.2 | 31.8 | 21.2 | (79.1 | ) | 912.9 | |||||||||||||||||||||||||||||
Income tax expense (benefit) | 85.4 | 109.7 | 3.3 | 42.1 | 33.4 | 9.7 | 5.5 | (25.7) | 263.4 | 98.1 | 117.9 | 39.5 | 47.8 | 38.1 | 11.7 | 7.0 | (42.1 | ) | 318.0 | ||||||||||||||||||||
Minority interest | (0.1) | – | – | – | – | – | – | (1.5) | (1.6) | 0.1 | – | 1.8 | – | – | – | – | 9.9 | 11.8 | |||||||||||||||||||||
Net income (loss) | $ | 174.1 | 162.9 | 7.5 | 64.0 | 63.1 | 17.6 | 12.1 | (21.2) | 480.1 | 191.8 | 172.6 | 87.0 | 73.2 | 71.1 | 20.1 | 14.2 | (46.9 | ) | 583.1 | |||||||||||||||||||
Preferred stock dividend | – | – | – | – | – | – | – | 3.8 | 3.8 | ||||||||||||||||||||||||||||||
Net earnings (loss) applicable to common shareholders | $ | 191.8 | 172.6 | 87.0 | 73.2 | 71.1 | 20.1 | 14.2 | (50.7 | ) | 579.3 | ||||||||||||||||||||||||||||
Assets | $ | 12,651 | 10,896 | 9,350 | 4,209 | 3,681 | 2,324 | 789 | (1,120) | 42,780 | $ | 14,823 | 10,416 | 10,366 | 4,599 | 3,916 | 2,385 | 808 | (343 | ) | 46,970 | ||||||||||||||||||
Net loans and leases(1) | 8,510 | 7,671 | 5,389 | 3,698 | 2,846 | 1,539 | 402 | 72 | 30,127 | ||||||||||||||||||||||||||||||
Net loans and leases1 | 10,702 | 8,092 | 6,352 | 4,066 | 3,214 | 1,725 | 428 | 89 | 34,668 | ||||||||||||||||||||||||||||||
Deposits | 9,213 | 8,896 | 6,905 | 3,599 | 3,171 | 1,636 | 442 | (1,220) | 32,642 | 10,450 | 8,410 | 7,329 | 3,695 | 3,401 | 1,712 | 513 | (528 | ) | 34,982 | ||||||||||||||||||||
Shareholder’s equity | 836 | 1,072 | 1,768 | 299 | 244 | 299 | 50 | (331) | 4,237 | ||||||||||||||||||||||||||||||
2004: | |||||||||||||||||||||||||||||||||||||||
Net interest income excluding hedge income | $ | 340.5 | 396.4 | – | 139.0 | 140.2 | 79.0 | 23.2 | (1.8) | 1,116.5 | |||||||||||||||||||||||||||||
Hedge income recorded directly at subsidiary | 18.7 | 13.8 | – | 0.6 | 1.7 | 5.8 | 1.6 | 2.1 | 44.3 | ||||||||||||||||||||||||||||||
Allocated hedge income (expense) | (15.4) | – | – | 4.0 | 1.5 | 7.3 | 2.6 | – | – | ||||||||||||||||||||||||||||||
Net interest income | 343.8 | 410.2 | – | 143.6 | 143.4 | 92.1 | 27.4 | 0.3 | 1,160.8 | ||||||||||||||||||||||||||||||
Provision for loan losses | 24.7 | 10.7 | – | 4.0 | 3.4 | (0.7) | 2.0 | – | 44.1 | ||||||||||||||||||||||||||||||
Net interest income after provision for loan losses | 319.1 | 399.5 | – | 139.6 | 140.0 | 92.8 | 25.4 | 0.3 | 1,116.7 | ||||||||||||||||||||||||||||||
Noninterest income | 265.9 | 77.5 | – | 21.6 | 31.6 | 29.6 | 2.2 | 3.1 | 431.5 | ||||||||||||||||||||||||||||||
Noninterest expense | 350.4 | 234.1 | – | 86.1 | 96.4 | 92.6 | 11.4 | 52.2 | 923.2 | ||||||||||||||||||||||||||||||
Impairment loss on goodwill | 0.6 | – | – | – | – | – | – | – | 0.6 | ||||||||||||||||||||||||||||||
Income (loss) before income taxes and minority interest | 234.0 | 242.9 | – | 75.1 | 75.2 | 29.8 | 16.2 | (48.8) | 624.4 | ||||||||||||||||||||||||||||||
Income tax expense (benefit) | 77.6 | 97.1 | – | 29.7 | 25.8 | 10.6 | 4.9 | (25.6) | 220.1 | ||||||||||||||||||||||||||||||
Minority interest | (0.3) | – | – | – | – | – | – | (1.4) | (1.7) | ||||||||||||||||||||||||||||||
Net income (loss) | $ | 156.7 | 145.8 | – | 45.4 | 49.4 | 19.2 | 11.3 | (21.8) | 406.0 | |||||||||||||||||||||||||||||
Assets | $ | 11,880 | 10,186 | – | 3,592 | 3,339 | 2,319 | 726 | (572) | 31,470 | |||||||||||||||||||||||||||||
Net loans and leases(1) | 7,876 | 7,132 | – | 3,129 | 2,549 | 1,465 | 379 | 97 | 22,627 | ||||||||||||||||||||||||||||||
Deposits | 8,192 | 8,329 | – | 3,046 | 2,951 | 1,577 | 417 | (1,220) | 23,292 | ||||||||||||||||||||||||||||||
Shareholder’s equity | 756 | 1,031 | – | 264 | 220 | 322 | 50 | 147 | 2,790 | ||||||||||||||||||||||||||||||
Shareholder’s equity: | |||||||||||||||||||||||||||||||||||||||
Preferred equity | – | – | – | – | – | – | – | 240 | 240 | ||||||||||||||||||||||||||||||
Common equity | 972 | 1,123 | 1,805 | 346 | 273 | 314 | 56 | (142 | ) | 4,747 | |||||||||||||||||||||||||||||
Total shareholder’s equity | 972 | 1,123 | 1,805 | 346 | 273 | 314 | 56 | 98 | 4,987 | ||||||||||||||||||||||||||||||
1 | Net of unearned income and fees, net of related costs. |
23. QUARTERLY FINANCIAL INFORMATION (UNAUDITED)
Financial information by quarter for 20062008 and 20052007 is as follows(in thousands, except per share amounts):
| Quarters | Quarters | ||||||||||||||||||||||||||
| First | Second | Third | Fourth | Year | First | Second | Third | Fourth | Year | ||||||||||||||||||
2006: | |||||||||||||||||||||||||||
2008: | |||||||||||||||||||||||||||
Gross interest income | $ | 638,655 | 686,616 | 731,553 | 761,297 | 2,818,121 | $ | 790,115 | 722,932 | 735,652 | 725,200 | 2,973,899 | |||||||||||||||
Net interest income | 422,847 | 436,327 | 446,511 | 459,039 | 1,764,724 | 486,458 | 484,743 | 492,003 | 508,442 | 1,971,646 | |||||||||||||||||
Provision for loan losses | 14,512 | 17,022 | 14,363 | 26,675 | 72,572 | 92,282 | 114,192 | 156,606 | 285,189 | 648,269 | |||||||||||||||||
Noninterest income: | |||||||||||||||||||||||||||
Impairment losses on investment securities and valuation losses on securities purchased from Lockhart Funding | (45,989 | ) | (38,761 | ) | (28,022 | ) | (204,340 | ) | (317,112 | ) | |||||||||||||||||
Securities gains (losses), net | 11,843 | (8,043 | ) | 13,106 | (15,264 | ) | 1,642 | ||||||||||||||||||||
Other noninterest income | 145,146 | 119,176 | 104,526 | 137,314 | 506,162 | ||||||||||||||||||||||
Noninterest expense | 350,103 | 354,417 | 372,276 | 398,167 | 1,474,963 | ||||||||||||||||||||||
Impairment loss on goodwill | – | – | – | 353,804 | 353,804 | ||||||||||||||||||||||
Income (loss) before income taxes (benefit) and minority interest | 155,073 | 88,506 | 52,731 | (611,008 | ) | (314,698 | ) | ||||||||||||||||||||
Net income (loss) | 106,749 | 72,198 | 37,760 | (482,976 | ) | (266,269 | ) | ||||||||||||||||||||
Preferred stock dividends | 2,453 | 2,454 | 4,409 | 15,108 | 24,424 | ||||||||||||||||||||||
Net earnings (loss) applicable to common shareholders | 104,296 | 69,744 | 33,351 | (498,084 | ) | (290,693 | ) | ||||||||||||||||||||
Net earnings (loss) per common share: | |||||||||||||||||||||||||||
Basic | $ | 0.98 | 0.65 | 0.31 | (4.37 | ) | (2.67 | ) | |||||||||||||||||||
Diluted | 0.98 | 0.65 | 0.31 | (4.36 | ) | (2.66 | ) | ||||||||||||||||||||
2007: | |||||||||||||||||||||||||||
Gross interest income | $ | 770,451 | 789,614 | 817,742 | 827,519 | 3,205,326 | |||||||||||||||||||||
Net interest income | 457,083 | 469,347 | 476,637 | 478,885 | 1,881,952 | ||||||||||||||||||||||
Provision for loan losses | 9,111 | 17,763 | 55,354 | 69,982 | 152,210 | ||||||||||||||||||||||
Noninterest income: | |||||||||||||||||||||||||||
Impairment losses on available-for-sale securities and valuation losses on securities purchased from Lockhart Funding | – | – | – | (158,208 | ) | (158,208 | ) | ||||||||||||||||||||
Securities gains, net | 801 | 3,392 | 14,743 | 5,321 | 24,257 | 8,899 | 113 | 11,130 | 596 | 20,738 | |||||||||||||||||
Other noninterest income | 127,687 | 134,119 | 130,586 | 134,560 | 526,952 | 136,515 | 141,228 | 134,693 | 137,378 | 549,814 | |||||||||||||||||
Noninterest expense | 324,455 | 333,028 | 330,028 | 342,926 | 1,330,437 | 351,979 | 347,612 | 352,031 | 352,966 | 1,404,588 | |||||||||||||||||
Income before income taxes and minority interest | 212,368 | 223,788 | 247,449 | 229,319 | 912,924 | 241,407 | 245,313 | 215,075 | 35,703 | 737,498 | |||||||||||||||||
Net income | 137,633 | 145,310 | 153,674 | 146,508 | 583,125 | 153,258 | 159,214 | 135,732 | 45,541 | 493,745 | |||||||||||||||||
Preferred stock dividend | – | – | – | 3,835 | 3,835 | 3,603 | 3,607 | 3,770 | 3,343 | 14,323 | |||||||||||||||||
Net earnings applicable to common shareholders | 137,633 | 145,310 | 153,674 | 142,673 | 579,290 | 149,655 | 155,607 | 131,962 | 42,198 | 479,422 | |||||||||||||||||
Net earnings per common share: | |||||||||||||||||||||||||||
Basic | $ | 1.30 | 1.37 | 1.45 | 1.34 | 5.46 | $ | 1.38 | 1.44 | 1.24 | 0.40 | 4.47 | |||||||||||||||
Diluted | 1.28 | 1.35 | 1.42 | 1.32 | 5.36 | 1.36 | 1.43 | 1.22 | 0.39 | 4.42 | |||||||||||||||||
2005: | |||||||||||||||||||||||||||
Gross interest income | $ | 422,841 | 455,736 | 483,277 | 548,402 | 1,910,256 | |||||||||||||||||||||
Net interest income | 314,951 | 330,928 | 340,652 | 374,819 | 1,361,350 | ||||||||||||||||||||||
Provision for loan losses | 9,383 | 11,417 | 12,107 | 10,116 | 43,023 | ||||||||||||||||||||||
Noninterest income: | |||||||||||||||||||||||||||
Securities gains (losses), net | (54) | (3,965) | 1,365 | 2,187 | (467) | ||||||||||||||||||||||
Other noninterest income | 102,953 | 109,897 | 109,130 | 115,440 | 437,420 | ||||||||||||||||||||||
Noninterest expense | 239,238 | 242,046 | 247,718 | 283,789 | 1,012,791 | ||||||||||||||||||||||
Impairment loss on goodwill | – | – | – | 602 | 602 | ||||||||||||||||||||||
Income before income taxes and minority interest | 169,229 | 183,397 | 191,322 | 197,939 | 741,887 | ||||||||||||||||||||||
Net income | 110,234 | 118,810 | 122,970 | 128,107 | 480,121 | ||||||||||||||||||||||
Net income per common share: | |||||||||||||||||||||||||||
Basic | $ | 1.23 | 1.32 | 1.37 | 1.35 | 5.27 | |||||||||||||||||||||
Diluted | 1.20 | 1.30 | 1.34 | 1.32 | 5.16 | ||||||||||||||||||||||
24. PARENT COMPANY FINANCIAL INFORMATION
CONDENSED BALANCE SHEETS
DECEMBER 31, 20062008 AND 20052007
(In thousands)
| 2006 | 2005 | 2008 | 2007 | ||||||||
ASSETS | ||||||||||||
Cash and due from banks | $ | 1,907 | 2,057 | $ | 2,135 | 2,003 | ||||||
Interest-bearing deposits | 183,497 | 101,000 | 980,528 | 85,399 | ||||||||
Investment securities – available for sale, at market | 422,041 | 581,128 | ||||||||||
Investment securities: | ||||||||||||
Held-to-maturity, at adjusted cost (approximate fair value $191,952) | 197,841 | – | ||||||||||
Available-for-sale, at fair value | 59,153 | 388,045 | ||||||||||
Trading account, at fair value | 956 | – | ||||||||||
Loans, net of unearned fees of $379 and $33 and allowance for | 22,901 | 475 | ||||||||||
Other noninterest-bearing investments | 62,830 | 68,861 | 76,219 | 72,427 | ||||||||
Investments in subsidiaries: | ||||||||||||
Commercial banks and bank holding company | 4,899,646 | 4,586,756 | 6,266,229 | 5,293,994 | ||||||||
Other operating companies | 58,266 | 25,069 | 69,291 | 81,087 | ||||||||
Nonoperating – Zions Municipal Funding, Inc.(1) | 429,126 | 412,868 | ||||||||||
Nonoperating – Zions Municipal Funding, Inc.1 | 464,570 | 446,785 | ||||||||||
Receivables from subsidiaries: | ||||||||||||
Commercial banks | 1,294,452 | 617,702 | 760,500 | 1,407,500 | ||||||||
Other | 13,420 | 6,095 | 14,800 | 1,865 | ||||||||
Other assets | 83,432 | 106,731 | 411,584 | 179,552 | ||||||||
| $ | 7,448,617 | 6,508,267 | $ | 9,326,707 | 7,959,132 | |||||||
LIABILITIES AND SHAREHOLDERS’ EQUITY | ||||||||||||
Other liabilities | $ | 104,312 | 95,854 | $ | 252,519 | 95,698 | ||||||
Commercial paper | 220,507 | 167,188 | ||||||||||
Commercial paper: | ||||||||||||
Due to affiliates | 55,996 | – | ||||||||||
Due to others | 15,451 | 337,840 | ||||||||||
Other short-term borrowings | 235,550 | – | ||||||||||
Subordinated debt to affiliated trusts | 324,709 | 324,709 | 309,300 | 309,412 | ||||||||
Long-term debt | 1,812,066 | 1,683,252 | 1,956,195 | 1,923,382 | ||||||||
Total liabilities | 2,461,594 | 2,271,003 | 2,825,011 | 2,666,332 | ||||||||
Shareholders’ equity: | ||||||||||||
Preferred stock | 240,000 | – | 1,581,834 | 240,000 | ||||||||
Common stock | 2,230,303 | 2,156,732 | 2,599,916 | 2,212,237 | ||||||||
Retained earnings | 2,602,189 | 2,179,885 | 2,433,363 | 2,910,692 | ||||||||
Accumulated other comprehensive loss | (75,849) | (83,043) | (98,958 | ) | (58,835 | ) | ||||||
Deferred compensation | (9,620) | (16,310) | (14,459 | ) | (11,294 | ) | ||||||
Total shareholders’ equity | 4,987,023 | 4,237,264 | 6,501,696 | 5,292,800 | ||||||||
| $ | 7,448,617 | 6,508,267 | $ | 9,326,707 | 7,959,132 | |||||||
1 | Zions Municipal Funding, Inc. is a wholly-owned nonoperating subsidiary whose sole purpose is to hold a portfolio of municipal bonds, loans and leases. |
CONDENSED STATEMENTS OF INCOME
YEARS ENDED DECEMBER 31, 2006, 20052008, 2007 AND 20042006
(In thousands)
| 2006 | 2005 | 2004 | 2008 | 2007 | 2006 | |||||||||||
Interest income: | |||||||||||||||||
Commercial bank subsidiaries | $ | 62,146 | 30,485 | 13,320 | $ | 68,642 | 90,504 | 62,146 | |||||||||
Other subsidiaries and affiliates | 1,245 | 1,168 | 1,265 | 781 | 852 | 1,245 | |||||||||||
Other loans and securities | 32,881 | 37,025 | 30,943 | 20,585 | 27,870 | 32,881 | |||||||||||
Total interest income | 96,272 | 68,678 | 45,528 | 90,008 | 119,226 | 96,272 | |||||||||||
Interest expense: | |||||||||||||||||
Affiliated trusts | 25,964 | 25,966 | 25,971 | 24,391 | 25,925 | 25,964 | |||||||||||
Other borrowed funds | 112,726 | 61,277 | 33,304 | 79,208 | 116,520 | 112,726 | |||||||||||
Total interest expense | 138,690 | 87,243 | 59,275 | 103,599 | 142,445 | 138,690 | |||||||||||
Net interest loss | (42,418) | (18,565) | (13,747) | (13,591 | ) | (23,219 | ) | (42,418 | ) | ||||||||
Provision for loan losses | (8) | (37) | (29) | 605 | 50 | (8 | ) | ||||||||||
Net interest loss after provision for loan losses | (42,410) | (18,528) | (13,718) | (14,196 | ) | (23,269 | ) | (42,410 | ) | ||||||||
Other income: | |||||||||||||||||
Dividends from consolidated subsidiaries: | |||||||||||||||||
Commercial banks | 431,000 | 261,250 | 296,250 | ||||||||||||||
Commercial banks and bank holding company | 110,500 | 460,200 | 431,000 | ||||||||||||||
Other operating companies | 600 | 300 | – | 500 | 560 | 600 | |||||||||||
Equity and fixed income securities gains, net | 8,180 | 1,534 | 1,116 | ||||||||||||||
Other income | 2,730 | 3,522 | 5,601 | ||||||||||||||
Equity and fixed income securities gains (losses), net | (11,220 | ) | 2,882 | 8,180 | |||||||||||||
Impairment losses on investment securities | (96,890 | ) | (19,281 | ) | – | ||||||||||||
Other income (loss) | (7,611 | ) | 8,498 | 2,730 | |||||||||||||
| 442,510 | 266,606 | 302,967 | (4,721 | ) | 452,859 | 442,510 | |||||||||||
Expenses: | |||||||||||||||||
Salaries and employee benefits | 14,841 | 14,078 | 17,431 | 11,673 | 14,781 | 14,841 | |||||||||||
Other operating expenses | 23,388 | 18,001 | 15,520 | 16,962 | 20,328 | 23,388 | |||||||||||
| 38,229 | 32,079 | 32,951 | 28,635 | 35,109 | 38,229 | ||||||||||||
Income before income tax benefit and undistributed income of consolidated subsidiaries | 361,871 | 215,999 | 256,298 | ||||||||||||||
Income (loss) before income tax benefit and undistributed income (losses) of consolidated subsidiaries | (47,552 | ) | 394,481 | 361,871 | |||||||||||||
Income tax benefit | 29,541 | 21,207 | 20,095 | 71,837 | 40,422 | 29,541 | |||||||||||
Income before equity in undistributed income of consolidated subsidiaries | 391,412 | 237,206 | 276,393 | ||||||||||||||
Equity in undistributed income of consolidated subsidiaries: | |||||||||||||||||
Income before equity in undistributed income (losses) of consolidated subsidiaries | 24,285 | 434,903 | 391,412 | ||||||||||||||
Equity in undistributed income (losses) of consolidated subsidiaries: | |||||||||||||||||
Commercial banks and bank holding company | 190,756 | 239,821 | 130,987 | (272,963 | ) | 52,962 | 190,756 | ||||||||||
Other operating companies | (15,302) | (12,081) | (13,860) | (35,377 | ) | (11,778 | ) | (15,302 | ) | ||||||||
Nonoperating – Zions Municipal Funding, Inc. | 16,259 | 15,175 | 12,467 | 17,786 | 17,658 | 16,259 | |||||||||||
Net income | 583,125 | 480,121 | 405,987 | ||||||||||||||
Preferred stock dividend | 3,835 | – | – | ||||||||||||||
Net income (loss) | (266,269 | ) | 493,745 | 583,125 | |||||||||||||
Preferred stock dividends | 24,424 | 14,323 | 3,835 | ||||||||||||||
Net earnings applicable to common shareholders | $ | 579,290 | 480,121 | 405,987 | |||||||||||||
Net earnings (loss) applicable to common shareholders | $ | (290,693 | ) | 479,422 | 579,290 | ||||||||||||
CONDENSED STATEMENTS OF CASH FLOWS
YEARS ENDED DECEMBER 31, 2006, 20052008, 2007 AND 20042006
(In thousands)
| 2006 | 2005 | 2004 | 2008 | 2007 | 2006 | |||||||||||
CASH FLOWS FROM OPERATING ACTIVITIES: | |||||||||||||||||
Net income | $ | 583,125 | 480,121 | 405,987 | |||||||||||||
Adjustments to reconcile net income to net cash provided by operating activities: | |||||||||||||||||
Undistributed net income of consolidated subsidiaries | (191,713) | (242,915) | (129,594) | ||||||||||||||
Equity and fixed income securities gains, net | (8,180) | (1,534) | (1,116) | ||||||||||||||
Net income (loss) | $ | (266,269 | ) | 493,745 | 583,125 | ||||||||||||
Adjustments to reconcile net income (loss) to net cash provided by operating activities: | |||||||||||||||||
Undistributed net (income) losses of consolidated subsidiaries | 290,554 | (58,842 | ) | (191,713 | ) | ||||||||||||
Equity and fixed income securities (gains) losses, net | 11,220 | (2,882 | ) | (8,180 | ) | ||||||||||||
Impairment losses on investment securities | 96,890 | 19,281 | – | ||||||||||||||
Other | 34,160 | 40,048 | 12,351 | 93,859 | (15,582 | ) | 34,160 | ||||||||||
Net cash provided by operating activities | 417,392 | 275,720 | 287,628 | 226,254 | 435,720 | 417,392 | |||||||||||
CASH FLOWS FROM INVESTING ACTIVITIES: | |||||||||||||||||
Net (increase) decrease in interest-bearing deposits | (82,497) | 3,774 | (69,091) | (895,129 | ) | 98,098 | (82,497 | ) | |||||||||
Collection of advances to subsidiaries | 18,706 | 28,320 | 28,782 | 816,184 | 97,333 | 18,706 | |||||||||||
Advances to subsidiaries | (702,581) | (131,600) | (163,442) | (184,731 | ) | (201,862 | ) | (702,581 | ) | ||||||||
Proceeds from sales and maturities of equity and fixed income securities | 166,085 | 42,958 | 394,118 | 264,528 | 82,439 | 166,085 | |||||||||||
Purchases of investment securities | – | (42,221) | (334,466) | ||||||||||||||
Purchase of investment securities | (241,846 | ) | (140,786 | ) | – | ||||||||||||
Increase of investment in subsidiaries | (137,206) | (32,280) | (87,500) | (1,292,821 | ) | (47,500 | ) | (137,206 | ) | ||||||||
Cash paid for acquisition | – | (609,523) | – | ||||||||||||||
Other | (7,983) | (8,255) | (18,101) | (29,281 | ) | (3,147 | ) | (7,983 | ) | ||||||||
Net cash used in investing activities | (745,476) | (748,827) | (249,700) | (1,563,096 | ) | (115,425 | ) | (745,476 | ) | ||||||||
CASH FLOWS FROM FINANCING ACTIVITIES: | �� | ||||||||||||||||
Net change in commercial paper and other borrowings under one year | 53,319 | 1,741 | 39,303 | (30,843 | ) | 117,333 | 53,319 | ||||||||||
Proceeds from issuance of long-term debt | 395,000 | 595,134 | 300,000 | 28,495 | 295,627 | 395,000 | |||||||||||
Payments on long-term debt | (248,425) | – | (240,000) | (155,025 | ) | (274,957 | ) | (248,425 | ) | ||||||||
Proceeds from issuance of preferred stock | 235,833 | – | – | 1,338,605 | – | 235,833 | |||||||||||
Proceeds from issuance of common stock | 79,511 | 90,800 | 82,250 | ||||||||||||||
Proceeds from issuance of common stock and warrants | 354,302 | 59,473 | 79,511 | ||||||||||||||
Payments to redeem common stock | (26,483) | (82,211) | (104,881) | (2,881 | ) | (322,025 | ) | (26,483 | ) | ||||||||
Dividends paid on preferred stock | (3,835) | – | – | (21,775 | ) | (14,323 | ) | (3,835 | ) | ||||||||
Dividends paid on common stock | (156,986) | (130,300) | (114,600) | (173,904 | ) | (181,327 | ) | (156,986 | ) | ||||||||
Net cash provided by (used in) financing activities | 327,934 | 475,164 | (37,928) | 1,336,974 | (320,199 | ) | 327,934 | ||||||||||
Net increase (decrease) in cash and due from banks | (150) | 2,057 | – | 132 | 96 | (150 | ) | ||||||||||
Cash and due from banks at beginning of year | 2,057 | – | – | 2,003 | 1,907 | 2,057 | |||||||||||
Cash and due from banks at end of year | $ | 1,907 | 2,057 | – | $ | 2,135 | 2,003 | 1,907 | |||||||||
The Parent has a $40 million line of credit available from CB&T, which was unused asAs of December 31, 2006.2008, the Parent has lines of credit totaling $395 million with five of its subsidiary banks. No amounts were outstanding at December 31, 2008. Interest on these lines is at a variable rate based on specified indices. Any amount loaned requiresActual amounts that may be borrowed at any given time are based on determined collateral of cash or securities.
requirements.
The Parent paid interest of $99.5 million in 2008, $141.9 million in 2007, and $135.0 million in 2006, $80.5 million in 2005, and $56.5 million in 2004.2006.
| ITEM 9. | CHANGES IN AND DISAGREEMENTS WITH ACCOUNTANTS ON ACCOUNTING AND FINANCIAL DISCLOSURE |
None.
ITEM 9A. CONTROLS AND PROCEDURES
| ITEM 9A. | CONTROLS AND PROCEDURES |
An evaluation was carried out by the Company’s management, with the participation of the Chief Executive Officer and the Chief Financial Officer, of the effectiveness of the Company’s disclosure controls and procedures (as defined in Rule 13a-15(e) and 15d-15(e) under the Securities Exchange Act of 1934). Based on that evaluation, the Chief Executive Officer and Chief Financial Officer concluded that, as of December 31, 2006,2008, these disclosure controls and procedures were effective. There have been no changes in the Company’s internal control over financial reporting during the fourth quarter of 20062008 that have materially affected or are reasonably likely to affect the Company’s internal control over financial reporting. See “Report on Management’s Assessment of Internal Control over Financial Reporting” included in Item 8 on page 123 for management’s report on the adequacy of internal control over financial reporting. Also see “Report on Internal Control over Financial Reporting” issued by Ernst & Young LLP included in Item 8.
8 on page 124.
None.
| ITEM 10. | DIRECTORS, EXECUTIVE OFFICERS AND CORPORATE GOVERNANCE |
Incorporated by reference from the Company’s Proxy Statement to be dated approximately March 16, 2007.subsequently filed.
| ITEM 11. | EXECUTIVE COMPENSATION |
Incorporated by reference from the Company’s Proxy Statement to be dated approximately March 16, 2007.subsequently filed.
| ITEM 12. | SECURITY OWNERSHIP OF CERTAIN BENEFICIAL OWNERS AND MANAGEMENT AND RELATEDSTOCKHOLDER MATTERS |
EQUITY COMPENSATION PLAN INFORMATION
The following table provides information as of December 31, 20062008 with respect to the shares of the Company’s common stock that may be issued under existing equity compensation plans:
Plan Category (1) (a) Number of securities to be issued upon exercise of outstanding options, (b) Weighted average (c) Number of securities for future issuance under equity Equity Compensation Plans Approved by Security Holders: Zions Bancorporation 2005 Stock Option and Incentive Plan Zions Bancorporation 1996 Non-Employee Directors Stock Option Plan Zions Bancorporation Key Employee Incentive Stock Option Plan Equity Compensation Plans Not Approved by Security Holders: 1998 Non-Qualified Stock Option and Incentive Plan Total Plan Category1 Equity Compensation Plans Approved by Security Holders: Zions Bancorporation 2005 Stock Option and Incentive Plan Zions Bancorporation 1996 Non-Employee Directors Stock Option Plan Zions Bancorporation Key Employee Incentive Stock Option Plan Total
warrants and rights
exercise price of
outstanding options,
warrants and rights
remaining available
compensation plans
(excluding securities
reflected in column (a)) 1,822,194 $ 76.60 6,630,337 174,289 53.78 – 2,838,696 52.16 – 330,443 57.74 – 5,165,622 6,630,337 (a)
Number of securities
to be issued upon
exercise of
outstanding options,
warrants and rights (b)
Weighted average
exercise price of
outstanding options,
warrants and rights (c)
Number of securities
remaining available
for future
issuance under equity
compensation plans
(excluding securities
reflected in column (a)) 5,142,499 $ 60.16 – 136,000 55.06 – 1,657,327 52.77 – 6,935,826 –
1 | The table does not include information for equity compensation plans assumed by the Company in mergers. A total of |
Other information required by Item 12 is incorporated by reference from the Company’s Proxy Statement to be dated approximately March 16, 2007.subsequently filed.
| ITEM 13. | CERTAIN RELATIONSHIPS AND RELATED TRANSACTIONS, AND DIRECTOR INDEPENDENCE |
Incorporated by reference from the Company’s Proxy Statement to be subsequently filed.
ITEM 13. CERTAIN RELATIONSHIPS14. PRINCIPAL ACCOUNTING FEES AND RELATED TRANSACTIONS, AND DIRECTOR INDEPENDENCESERVICES
Incorporated by reference from the Company’s Proxy Statement to be dated approximately March 16, 2007.
ITEM 14. PRINCIPAL ACCOUNTING FEES AND SERVICES
Incorporated by reference from the Company’s Proxy Statement to be dated approximately March 16, 2007.subsequently filed.
| ITEM 15. | EXHIBITS, FINANCIAL STATEMENT SCHEDULES |
(a) | (1) | Financial | ||
| Consolidated balance | ||||
| Consolidated statements of | ||||
| Consolidated statements of changes in shareholders’ equity and comprehensive | ||||
| Consolidated statements of cash | ||||
| Notes to consolidated financial | ||||
| (2) | Financial statement | |||
| (3) | List of Exhibits: | |||
Exhibit | Description | |||
| 3.1 | Restated Articles of Incorporation of Zions Bancorporation dated November 8, 1993, incorporated by reference to Exhibit 3.1 of Form S-4 filed on November 22, 1993. | * | ||
| 3.2 | Articles of Amendment to the Restated Articles of Incorporation of Zions Bancorporation dated April 30, 1997, incorporated by reference to Exhibit 3.2 of Form | * | ||
| 3.3 | Articles of Amendment to the Restated Articles of Incorporation of Zions Bancorporation dated April 24, 1998, incorporated by reference to Exhibit 3.3 of Form 10-K for the year ended December 31, 2003. | * | ||
| 3.4 | Articles of Amendment to Restated Articles of Incorporation of Zions Bancorporation dated April 25, 2001, incorporated by reference to Exhibit 3.6 of Form S-4 filed July 13, 2001. | * | ||
| 3.5 | Articles of Amendment to the Restated Articles of Incorporation of Zions Bancorporation, dated December 5, 2006, incorporated by reference to Exhibit 3.1 of Form 8-K filed December 7, 2006. | * | ||
| 3.6 | Articles of Merger of The Stockmen’s Bancorp, Inc. with and into Zions Bancorporation, effective January 17, 2007, | * | ||||
| 3.7 | Articles of Amendment to the Restated | * | ||||
| 3.8 | Articles of Amendment to the Restated Articles of Incorporation of Zions Bancorporation, dated November 12, 2008, incorporated by reference to Exhibit 3.1 of Form 8-K filed November 17, 2008. | * | ||||
| 3.9 | Amended and Restated Bylaws of Zions Bancorporation dated May 4, 2007, incorporated by reference to Exhibit 3.2 of Form 8-K filed on May 9, 2007. | * | ||||
| 4.1 | Senior Debt Indenture dated September 10, 2002 between Zions Bancorporation and J.P. Morgan Trust Company, N.A., as trustee, with respect to senior debt securities of Zions Bancorporation, incorporated by reference to Exhibit 4.1 of Form S-3ARS filed March 31, 2006. | * | ||||
Exhibit | Description | |||
| 4.2 | Subordinated Debt Indenture dated September 10, 2002 between Zions Bancorporation and J.P. Morgan Trust Company, N.A., as trustee, with respect to subordinated debt securities of Zions Bancorporation, incorporated by reference to Exhibit 4.2 of Form S-3ARS filed March 31, 2006. | * | ||
| 4.3 | Junior Subordinated Indenture dated August 21, 2002 between Zions Bancorporation and J.P. Morgan Trust Company, N.A., as trustee, with respect to junior subordinated debentures of Zions Bancorporation, incorporated by reference to Exhibit 4.3 of Form S-3ARS filed March 31, 2006. | * | ||
| 10.1 | Zions Bancorporation | |||
| * | ||||
| First amendment to the Zions Bancorporation 2006-2008 Value Sharing Plan (filed herewith). | ||||
| 10.3 | Form of Zions Bancorporation 2006-2008 Value Sharing Plan, Subsidiary Banks, incorporated by reference to Exhibit 10.2 of Form 10-Q for the quarter ended June 30, 2006. | * | ||
| Amegy Bank of Texas 2007-2008 Value Sharing Plan, incorporated by reference to Exhibit 10.7 of Form 10-Q for the quarter ended June 30, 2007. | * | |||
| 10.5 | 2005 Management Incentive Compensation Plan, incorporated by reference to Appendix II of the Proxy Statement contained in the Company’s Schedule 14A filed on April 4, 2005. | * | ||
| 10.6 | Zions Bancorporation Second Restated and Revised Deferred Compensation Plan (filed herewith). | |||
| 10.7 | Zions Bancorporation Third Restated Deferred Compensation Plan | |||
| 10.8 | ||||||
| 10.9 | Zions Bancorporation First Restated Excess Benefit Plan | |||||
| 10.10 | Trust Agreement establishing the Zions Bancorporation Deferred Compensation Plan Trust by and between Zions Bancorporation and Cigna Bank & Trust Company, FSB effective October 1, 2002, | * | ||||
| 10.11 | Amendment to the Trust Agreement establishing the Zions Bancorporation Deferred Compensation Plan Trust by and between Zions Bancorporation and Cigna Bank & Trust Company, FSB substituting Prudential Bank & Trust, FSB as the trustee, dated January 6, 2005, incorporated by reference to Exhibit 10.13 of Form 10-K for the year ended December 31, 2004. | * | ||||
| 10.12 | Amendment to Trust Agreement Establishing the Zions Bancorporation Deferred Compensation Plans Trust, effective September 1, 2006, | * | ||||
| 10.13 | Zions Bancorporation Deferred Compensation Plans Master Trust between Zions Bancorporation and Fidelity Management Trust Company, effective September 1, 2006, | * | ||||
| 10.14 | Revised | * | ||||
| 10.15 | Zions Bancorporation Restated Pension Plan effective January 1, 2001, including amendments adopted through January 31, 2002, incorporated by reference to Exhibit | * | ||||
Exhibit | Description | |||
| 10.16 | Amendment dated December 31, 2002 to Zions Bancorporation Restated Pension Plan | |||
| 10.17 | Second Amendment to the Restated and Amended Zions Bancorporation Pension Plan dated September 4, 2003, incorporated by reference to Exhibit 10.1 of Form 10-Q for the quarter ended March 31, 2005. | * | ||
| 10.18 | Third Amendment to the Zions Bancorporation Pension Plan dated September 4, 2003, incorporated by reference to Exhibit 10.2 of Form 10-Q for the quarter ended March 31, 2005. | * | ||
| 10.19 | Fourth Amendment to the Restated and Amended Zions Bancorporation Pension Plan dated March 28, 2005, incorporated by reference to Exhibit 10.4 of Form 10-Q for the quarter ended March 31, 2005. | * | ||
| 10.20 | Zions Bancorporation Executive Management Pension Plan | |||||
| 10.21 | Zions Bancorporation Payshelter 401(k) and Employee Stock Ownership Plan, Established and Restated Effective January 1, 2003 | |||||
| 10.22 | First Amendment to the Zions Bancorporation Payshelter 401(k) and Employee Stock Ownership Plan, dated November 20, 2003, incorporated by reference to Exhibit 10.19 of Form 10-K for the year ended December 31, 2004. | * | ||||
| 10.23 | Second Amendment to the Zions Bancorporation Payshelter 401(k) and Employee Stock Ownership Plan, dated December 31, 2003, incorporated by reference to Exhibit 10.20 of Form 10-K for the year ended December 31, 2004. | * | ||||
| 10.24 | Third Amendment to the Zions Bancorporation Payshelter 401(k) and Employee Stock Ownership Plan, dated June 1, 2004, incorporated by reference to Exhibit 10.21 of Form 10-K for the year ended December 31, 2004. | * | ||||
| 10.25 | Fourth Amendment to the Zions Bancorporation Payshelter 401(k) and Employee Stock Ownership Plan, dated March 18, 2005, incorporated by reference to Exhibit 10.31 of Form 10-Q for the quarter ended March 31, 2005. | * | ||||
| 10.26 | Fifth Amendment to the Zions Bancorporation Payshelter 401(k) and Employee Stock Ownership Plan, dated February 28, 2006, incorporated by reference to Exhibit 10.1 of Form 10-Q for the quarter ended March 31, 2006. | * | ||||
| 10.27 | Sixth Amendment to the Zions Bancorporation Payshelter 401(k) and Employee Stock Ownership Plan, dated July 31, 2006, incorporated by reference to Exhibit 10.4 of Form 10-Q for the quarter ended June 30, 2006. | * | ||||
| 10.28 | Seventh Amendment to the Zions Bancorporation Payshelter 401(k) and Employee Stock Ownership Plan, dated December 28, 2006, | * | ||||
| 10.29 | Eighth Amendment to the Zions Bancorporation Payshelter 401(k) and Employee Stock Ownership Plan, dated May 14, 2007, incorporated by reference to Exhibit 10.3 of Form 10-Q for the quarter ended June 30, 2007. | * | ||||
| 10.30 | Ninth Amendment to the Zions Bancorporation Payshelter 401(k) and Employee Stock Ownership Plan, dated July 19, 2007, incorporated by reference to Exhibit 10.4 of Form 10-Q for the quarter ended June 30, 2007. | * | ||||
| 10.31 | Zions Bancorporation Payshelter 401(k) and Employee Stock Ownership Plan Trust Agreement between Zions Bancorporation and Fidelity Management Trust Company, dated July 3, 2006, incorporated by reference to Exhibit 10.1 of Form 10-Q for the quarter ended March 31, 2007. | * | ||||
Exhibit | Description | |||
| 10.32 | Amended and Restated Zions Bancorporation Key Employee Incentive Stock Option Plan, incorporated by reference to Exhibit 10.1 of Form 10-Q for the quarter ended June 30, 2004. | * | ||
| Amended and Restated Zions Bancorporation 1996 Non-Employee Directors Stock Option Plan, incorporated by reference to Exhibit | ||||
| * | ||||
| Zions Bancorporation 2005 Stock Option and Incentive Plan, incorporated by reference to Exhibit 4.7 of Form S-8 filed on May 6, 2005. | * | |||
| Amendment No. 1 to Zions Bancorporation 2005 Stock Option and Incentive Plan, incorporated by reference to Exhibit 10.1 of Form 10-Q for the quarter ended June30, 2007. | * | |||
| 10.36 | Standard Stock Option Award Agreement, Zions Bancorporation 2005 Stock Option and Incentive Plan, incorporated by reference to Exhibit 10.5 of Form 10-Q for the quarter ended March 31, 2005. | * | ||
| Standard Directors Stock Option Award Agreement, Zions Bancorporation 2005 Stock Option and Incentive Plan, incorporated by reference to Exhibit 10.6 of Form 10-Q for the quarter ended March 31, 2005. | * | |||
| Restated Standard Restricted Stock Award Agreement, Zions Bancorporation 2005 Stock Option and Incentive Plan, incorporated by reference to Exhibit | * | |||
| Amegy Bancorporation (formerly Southwest Bancorporation of Texas, Inc.)1996 Stock Option Plan, as amended and restated as of June 4, 2002, incorporated by reference to Exhibit | * | |||
| Amegy Bancorporation 2004 Omnibus Incentive Plan, incorporated by reference to Appendix B to Amegy Bancorporation’s Definitive Proxy Statement filed on March 25, 2004. | * | |||
| Form of Change in Control Agreement between the Company and Certain Executive Officers, including Harris H. Simmons, Doyle L. Arnold, Bruce K. Alexander, and | * | |||
| Form of Change in Control Agreement between the Company and Certain Executive Officers, including Paul B. Murphy and Scott J. McLean, incorporated by reference to Exhibit 10.48 of Form 10-K for the year ended December 31, 2007. | * | |||
| 10.43 | Addendum to Change in Control Agreement (filed herewith). | |||
| 10.44 | Stock Purchase and Shareholder Agreement dated June 1, 2004 among Welman Holdings, Inc., the Company, Zions First National Bank and PSC Wealth Management, LLC, incorporated by reference to Exhibit 99.2 of Form 8-K filed April 1, 2005. | * | ||
| 10.45 | Employment Agreement dated as of June 1, 2004 between the Company and George M. Feiger, incorporated by reference to Exhibit 99.1 of Form 8-K filed April 1, 2005. | * | ||
| 10.46 | Employment Agreement between the Company and Paul B. Murphy, | * | ||
| Employment Agreement between the Company and Scott J. McLean, incorporated by reference to Exhibit 10.41 of Form 10-K for the year ended December 31, 2006. | * | |||
| 10.48 | Employment Agreement between the Company and Dallas Haun, incorporated by reference to Exhibit 10.53 of Form 10-K for the year ended December 31, 2007. | * | ||
| 10.49 | Warrant to purchase up to 5,789,909 shares of Common Stock, issued on November 14, 2008, incorporated by reference to Exhibit 4.2 of Form 8-K filed November 17, 2008. | * | ||
Exhibit | Description | |||
| 10.50 | Performance stock agreement between Zions Bancorporation and Paul B. Murphy, dated August 15, 2008 (filed herewith). | |||
| 10.51 | Performance stock agreement between Zions Bancorporation and Scott McLean, dated August 15, 2008 (filed herewith). | |||
| 10.52 | Form of Change in Control Agreement between the Company and Dallas E. Haun, dated May 23, 2008 (filed herewith). | |||
| 12 | Ratio of Earnings to Fixed Charges (filed herewith). | |||
| 21 | List of Subsidiaries of Zions Bancorporation (filed herewith). | |||
| 23 | Consent of Independent Registered Public Accounting Firm (filed herewith). | |||
| 31.1 | Certification by Chief Executive Officer required by Rules 13a-15(f) and 15d-15(f) under the Securities Exchange Act of 1934 (filed herewith). | |||
| 31.2 | Certification by Chief Financial Officer required by Rules 13a-15(f) and 15d-15(f) under the Securities Exchange Act of 1934 (filed herewith). | |||
| 32 | Certification by Chief Executive Officer and Chief Financial Officer required by Sections 13(a) or 15(d), as applicable, of the Securities Exchange Act of 1934 (15 U.S.C. 78m) and 18 U.S.C. Section 1350 (furnished herewith). | |||
| * | Incorporated by reference |
Certain instruments defining the rights of holders of long-term debt securities of the Registrant and its subsidiaries are omitted pursuant to Item 601(b)(4)(iii) of Regulation S-K. The Registrant hereby undertakes to furnish to the SEC, upon request, copies of any such instruments.
Pursuant to the requirements of Section 13 or 15(d) of the Securities Exchange Act of 1934, the Registrant has duly caused this report to be signed on its behalf by the undersigned, thereunto duly authorized.
| February 27, 2009 | ZIONS BANCORPORATION | |||||||
| By |
| |||||||
HARRIS H. SIMMONS,Chairman, President and Chief Executive Officer | ||||||||
Pursuant to the requirements of the Securities Exchange Act of 1934, this report has been signed below by the following persons on behalf of the Registrant and in the capacities and on the date indicated.
February 27, 2009
March 1, 2007
/s/ HARRIS H. SIMMONS | /s/ DOYLE L. ARNOLD | |||
HARRIS H. SIMMONS,Director, Chairman, President and Chief Executive
| DOYLE L. ARNOLD,Vice Chairman and Chief Financial Officer (Principal Financial
| |||
/s/ NOLAN BELLON | /s/ JERRY C. ATKIN | |||
NOLAN BELLON,Controller (Principal
| JERRY C. ATKIN,Director | |||
/s/ R. D. CASH | / | |||
R. D. CASH,Director | PATRICIA FROBES,Director | |||
/s/ J. DAVID HEANEY | /s/ ROGER B. PORTER | |||
J. DAVID HEANEY,Director | ROGER B. PORTER,Director | |||
/s/ STEPHEN D. QUINN | /s/ L. E. SIMMONS | |||
STEPHEN D. QUINN,Director | L. E. SIMMONS,Director | |||
/s/ STEVEN C. WHEELWRIGHT | /s/ SHELLEY THOMAS WILLIAMS | |||
STEVEN C. WHEELWRIGHT,Director | SHELLEY THOMAS WILLIAMS,Director | |||
170193