UNITED STATES
SECURITIES AND EXCHANGE COMMISSION
WASHINGTON, D.C. 20549
FORM 10-K
| x | Annual report pursuant to Section 13 or 15(d) of the Securities Exchange Act of 1934 for the fiscal year ended March 31, 20072008 or |
| ¨ | Transition report pursuant to Section 13 or 15(d) of the Securities Exchange Act of 1934 for the transition period from to |
Commission file number: 001-32253
ENERSYS
(Exact name of registrant as specified in its charter)
| | |
| Delaware | | 23-3058564 |
(State of Incorporation or other jurisdiction of
incorporation or organization) | | (I.R.S. Employer
Identification No.) |
2366 Bernville Road
Reading, Pennsylvania 19605
(Address of principal executive offices) (Zip Code)
Registrant’s telephone number, including area code: 610-208-1991
Securities registered pursuant to Section 12(b) of the Act:
| | |
| Title of each class | | Name of each exchange on which registered |
Common Stock, $0.01 par value per valueshare | | New York Stock Exchange |
Securities registered pursuant to Section 12(g) of the Act: None
Indicate by check mark if the registrant is a well-known seasoned issuer, as defined in Rule 405 of the Securities Act. x¨ YES x¨ NO
Indicate by check mark if the registrant is not required to file reports pursuant to Section 13 or Section 15(d) of the Act. ¨ YES x NO
Indicate by check mark whether the registrant (1) has filed all reports required to be filed by Section 13 or 15(d) of the Securities Exchange Act of 1934 during the preceding 12 months (or for such shorter period that the registrant was required to file such reports), and (2) has been subject to such filing requirements for the past 90 days. x YES ¨ NO
Indicate by check mark if disclosure of delinquent filers pursuant to Item 405 of Regulation S-K is not contained herein, and will not be contained, to the best of registrant’s knowledge, in definitive proxy or information statements incorporated by reference in Part III of this Form 10-K or any amendment to this Form 10-K. ¨
Indicate by check mark whether the registrant is a large accelerated filer, an accelerated filer, a non-accelerated filer, or a non-accelerated filer.smaller reporting company. See definitionthe definitions of “large accelerated filer,” “accelerated filerfiler” and large accelerated filer”“smaller reporting company” in Rule 12b-2 of the Securities Exchange Act of 1934.Act. (Check one):
| | |
Large accelerated filer ¨ Accelerated filer x Non-accelerated filer ¨ | | Accelerated filer x |
| Non-accelerated filer ¨ | | Smaller reporting company ¨ |
(Do not check if a smaller reporting company)
Indicate by check mark whether the registrant is a shell company (as defined in Rule 12b-2 of the Act). ¨ YES x NO
Aggregate market value of the voting and non-voting common stock held by nonaffiliates at October 1, 2006: $212,691,058September 30, 2007: $464,815,772 (based upon its closing transaction price on the New York Stock Exchange on September 29, 2006)28, 2007).
Common stock outstanding at June 8, 2007:2008: Common Stock 47,122,99649,596,543 shares
DOCUMENTS INCORPORATED BY REFERENCE
Portions of the registrant’s definitive Proxy Statement for its Annual Meeting of Stockholders to be held on July 19, 200717, 2008, are incorporated by reference in Part III of this Annual Report.
CAUTIONARY NOTE REGARDING FORWARD-LOOKING STATEMENTS
The Private Securities Litigation Reform Act of 1995 (the “Reform Act”) provides a safe harbor for forward-looking statements made by or on behalf of EnerSys. EnerSys and its representatives may, from time to time, make written or verbal forward-looking statements, including statements contained in the Company’s filings with the Securities and Exchange Commission and its reports to stockholders. Generally, the inclusion of the words “anticipates,” “believe,” “expect,” “future,” “intend,” “estimate,” “anticipate,” “will,” “plans,” or the negative of such terms and similar expressions identify statements that constitute “forward-looking statements” within the meaning of Section 27A of the Securities Act of 1933 and Section 21E of the Securities Exchange Act of 1934 and that are intended to come within the safe harbor protection provided by those sections. All statements addressing operating performance, events, or developments that EnerSys expects or anticipates will occur in the future, including statements relating to sales growth, earnings or earnings per share growth, and market share, as well as statements expressing optimism or pessimism about future operating results, are forward-looking statements within the meaning of the Reform Act. The forward-looking statements are and will be based on management’s then-current viewsbeliefs and assumptions regarding future events and operating performance and on information currently available to management, and are applicable only as of the dates of such statements.
Forward-looking statements involve risks, uncertainties and assumptions. Although we do not make forward-looking statements unless we believe we have a reasonable basis for doing so, we cannot guarantee their accuracy. Actual results may differ materially from those expressed in these forward-looking statements due to a number of uncertainties and risks, including the risks described in this Annual Report on Form 10-K and other unforeseen risks. You should not put undue reliance on any forward-looking statements. These statements speak only as of the date of this Annual Report on Form 10-K, and we undertake no obligation to update or revise these statements to reflect events or circumstances occurring after the date of this Annual Report on Form 10-K.
Our actual results may differ materially from those contemplated by the forward-looking statements for a number of reasons, including the following factors:
general cyclical patterns of the industries in which our customers operate;
the extent to which we cannot control our fixed and variable costs;
the raw material in our products may experience significant fluctuations in market price and availability;
certain raw materials constitute hazardous materials that may give rise to costly environmental and safety claims;
legislation regarding the restriction of the use of certain hazardous substances in electrical and electronic equipment;our products;
risks involved in foreign operations such as disruption of markets, changes in import and export laws, currency restrictions and currency exchange rate fluctuations;
our ability to raise our selling prices to our customers when our product costs increase;
the extent to which we are able to efficiently utilize our global manufacturing facilities and optimize their capacity;
general economic conditions in the markets in which we operate;
competitiveness of the battery markets throughout the world;
our timely development of competitive new products and product enhancements in a changing environment and the acceptance of such products and product enhancements by customers;
our ability to adequately protect our proprietary intellectual property, technology and brand names;
unanticipated litigation and regulatory proceedings to which we might be subject;
changes in our market share in the business segments and regions where we operate;
our ability to implement our cost reduction initiatives successfully and improve our profitability;
unanticipated quality problems associated with our products;
our ability to implement business strategies, including our acquisition strategy, and restructuring plans;
our acquisition strategy may not be successful in locating advantageous targets;
our ability to successfully integrate any assets, liabilities, customers, systems and management personnel we acquire into our operations and our ability to realize related revenue synergies and cost savings within expected time frames;
our debt and debt service requirements which may restrict our operational and financial flexibility, as well as imposing unfavorable interest and financing costs;
our ability to maintain our existing credit facilities or obtain satisfactory new credit facilities.
adverse changes in our short- and long-term debt levels under our credit facilities;
our exposure to fluctuations in interest rates on our variable-rate debt;
our ability to attract and retain qualified personnel;
our ability to maintain good relations with labor unions;
credit risk associated with our customers, including risk of insolvency and bankruptcy;
our ability to successfully recover in the event of a disaster affecting our infrastructure; and
terrorist acts or acts of war, whether in the United States or abroad, could cause damage or disruption to our operations, our suppliers, channels to market or customers, or could cause costs to increase, or create political or economic instability, any of which could have a material adverse effect on our business.instability.
This list of factors that may affect future performance is illustrative, but by no means exhaustive. Accordingly, all forward-looking statements should be evaluated with the understanding of their inherent uncertainty.
EnerSys
Annual Report on Form 10-K
For the Fiscal Year Ended March 31, 20072008
Index
PART I
ITEM 1.BUSINESS
Overview
EnerSys (the “Company,” “we,” or “us”) is the world’s largest manufacturer, marketer and distributor of industrial batteries. We also manufacture, market and distribute related products such as chargers, power equipment and battery accessories, and we provide related after-market and customer-support services for industrial batteries. Industrial batteries generally are characterized as reserve power batteries or motive power batteries.
Reserve power productsalso are known as network, standby or stationary power batteries and are used primarily for backup power applications to ensure continuous power supply in case of main (primary) power failure or outage. Reserve power batteries are used primarily to supply standby direct current (“DC”) operating power for:
telecommunications systems, such as wireless, wireline and internet access systems, central and local switching systems, satellite stations and radio transmission stations;
uninterruptible power systems (“UPS”) applications for computer and computer-controlled systems, including process control systems;
specialty power applications, including security systems, and for premium starting, lighting and ignition applications;
switchgear and electrical control systems used in electric utilities and energy pipelines; and
commercial and military aircraft, submarines and tactical military vehicles.
Motive power products are used to provide power primarily for electric material handling and material handling equipment, primarily electric industrial forklift trucks. They compete primarily with propane- and diesel-powered internal combustion engines used principally in the following applications:
electric industrial forklift trucks in distribution and manufacturing facilities;
mining equipment, including scoops, coal haulers, shield haulers, underground forklifts, shuttle cars and locomotives,locomotives; and
railroad equipment, including diesel locomotive starting, rail car lighting and rail signaling equipment.equipment;
History
EnerSys and its predecessor companies have been manufacturers of industrial batteries for over 100 years. Morgan Stanley Capital Partners teamed with the management of Yuasa, Inc. in late 2000 to acquire from Yuasa Corporation (Japan) its reserve power and motive power battery businesses in North and South America. We were incorporated in October 2000 for the purpose of completing the Yuasa, Inc. acquisition from Yuasa Corporation (Japan).acquisition. On January 1, 2001, we changed our name from Yuasa, Inc. to EnerSys to reflect our focus on the energy systems nature of our businesses. In early 2002, we acquired the reserve power and motive power business of the Energy Storage Group, or ESG, of Invensys plc.
Today, our reserve power batteries are marketed and sold principally under the PowerSafe, DataSafe, Hawker, Genesis, Odyssey, VartaandCyclon brands. Our motive power batteries are marketed and sold principally under the Hawker, EnerSys-EnerSys Ironclad, General Battery, Fiamm Motive Power, Uranio, OldhamandExpressbrands. We also manufacture and sell related direct current—DC—power products including chargers, electronic power equipment and a wide variety of battery accessories. Our battery products span a broad range of sizes, configurations and electrical capacities, enabling us to meet a wide variety of customer applications.
In August 2004, EnerSys completed an initial public offering (the “IPO”). The Company’s Registration Statement (SEC File No. 333-115553) for its IPO was declared effective by the Securities and Exchange Commission on July 26, 2004. The Company’s common stock commenced trading on the New York Stock Exchange on July 30, 2004, under the trading symbol “ENS.”
We have expanded our product offerings and services globally through internal growth and acquisitions. During fiscal 2007 we made the following acquisitions:
In May 2006,March 2002, we acquired the Company purchasedreserve power and motive power business of the assetsEnergy Storage Group of Alliant Techsystems’ (NYSE:ATK) lithium primaryInvensys plc. (“ESG”). In June 2005, we acquired the motive power battery business located at its Power Sources Centerof FIAMM, S.p.A. (FIAMM), which complements our then existing European motive power business. We also made smaller acquisitions of a producer of specialty nickel-based batteries based in Horsham, PA, now known as EnerSys Advanced Systems Inc. (“EAS”). EAS producesGermany; a producer of lithium power sources, primarily for aerospace and& defense applications. As part of the transaction, ATK has signed a 5-year supply agreement for all of its requirements for products produced at EAS.
In August 2006, the Company acquired the assets, including manufacturing facilities, of Chaozhou Xuntong Power Source Company Limited (“CFT”),applications located in Chaoan, China, which manufactures valve-regulated, lead-acid batteries. This acquisition provides the Company with additional capacity needed to meet the growing customer demand for reserve power batteries.
In January 2007, the Company acquired theUSA; a lead-acid battery business in Switzerland; a manufacturing facility in China, and a 97% interest in a producer of Leclanché SA basedindustrial batteries, located in Yverdon-les-Bains, Switzerland.Bulgaria.
2008 restructuring plan
On May 23, 2007, we committed to the principal features of a plan to restructure certain of our European production and commercial operations. In part, the restructuring facilitated the integration of Energia AD into our worldwide operations. The Company assumedrestructuring was designed to improve operational efficiencies and eliminate redundant costs primarily attributable to the customers and existing contractsEnergia transaction. Restructuring actions commenced upon the completion of the Leclanché lead-acid battery business along with certain salesrequisite consultations, and service employees in orderwe expect it to maintain relationships with current customers. The acquisition providesbe substantially completed by the Company greater access to the Swiss market.end of fiscal 2009. In fiscal 2008, as a result of this restructuring, we incurred cash expenses of approximately $9 million, primarily for employee severance-related payments, and non-cash expenses of approximately $4 million, primarily for fixed asset write-offs.
Recent Developments
OnSale of Manufacturing Facility
In May 18, 2007,2008, we announced that, as part of our ongoing European restructuring program, we sold our Manchester, England manufacturing facility at a net of tax gain of approximately $8 million. This sale is consistent with our strategy to migrate our production to lower cost facilities.
Concurrent Public Offerings of Senior Convertible Notes and Common Stock and a Private Offering of a New Senior Secured Credit Facility
In May 2008, following the end of fiscal 2008, the Company completed the previously announced acquisitionsale of $172.5 million aggregate principal amount of senior unsecured convertible notes, and used the net proceeds of $168.2 million to repay a 97% interestportion of its existing senior secured Term Loan B. The senior unsecured convertible notes are potentially convertible at the option of the holders, at any time on or after March 1, 2015, but prior to the maturity date, into 24.6305 EnerSys common shares per $1,000 in Energia AD, a produceroriginal principal amount of industrial batteries, locatedthe notes, equivalent to $40.60 per share or approximately 4.25 million common shares. It is our current intent to settle the principal amount of any conversions in Targovishte, Bulgaria. The total purchase price for this transaction was approximately euro 13 million (approximately $17 million) including all transactions costs and adjustments. The acquisition was financed using cash, and any additional conversion consideration in cash, shares of EnerSys common stock or a combination of cash and shares. The notes will mature on June 1, 2038, unless earlier converted, redeemed or repurchased.
Concurrently with the convertible note offering, certain of our stockholders offered to sell, subject to market and other conditions, 3.4 million shares of EnerSys’ common stock pursuant to an effective shelf registration statement filed with the Securities and Exchange Commission on May 19, 2008. The offered shares were sold by several of our stockholders, including affiliates of Metalmark Capital LLC and certain other institutional stockholders. The selling stockholders granted the underwriters an option to purchase up to 0.34 million additional shares, of which 0.29 million shares were exercised and sold. A total of 3.69 million shares were sold as of May 28, 2008. We did not receive any proceeds from the common stock offering.
Also, immediately following the closing of the senior unsecured convertible note issue, we commenced refinancing the outstanding combined balance of the senior secured Term Loan B and our existing EnerSys credit facilities. The acquisition provides the CompanyRevolver of approximately $200 million, with an additional low cost manufacturing platform with substantial expansion potentiala new $350 million senior secured facility comprising Term A loans and increases the Company’s market presencea new Revolver. These planned refinancing transactions, which we expect to complete in the rapidly growing Eastern EuropeanJune 2008, will strengthen our capital structure by adding senior unsecured convertible debt and Russian markets.a new senior secured debt facility that matures in 6 years.
Amendments of Credit Agreements
On May 23, 2007,16, 2008, EnerSys completed the Fifth Amendment to the $480 million Senior Secured Credit Agreement which allowed for the issuance of up to $205 million of unsecured indebtedness. The proceeds from the unsecured indebtedness must be used to pay down the senior secured Term Loan B. On May 28, 2008, EnerSys used the net proceeds of $168.2 million from the senior unsecured convertible notes to pay down a portion of the senior secured Term Loan B.
On May 15, 2008, the Company announcedamended its commitmentEuro 25 million Credit Agreement to allow for the issuance of up to $205 million of unsecured indebtedness. The proceeds from the unsecured indebtedness must be used to pay down the senior secured Term Loan B. Additionally, the amendment authorized the Company to enter into a new $350 million US Credit Agreement on terms substantially similar to the principal featuresexisting Credit Agreement.
Termination of Interest Rate Swap Agreements
In connection with the issuance of $172.5 million of senior unsecured convertible notes, and the repayment of a plan to restructure certain of its European production and commercial operations. In part, the restructuring will facilitate the integration of Energia AD into the Company’s worldwide operations. The restructuring is designed to improve operational efficiencies and eliminate redundant costs primarily attributable to the Energia transaction. Restructuring actions will commence upon the completionportion of the requisite consultations, and the Company expects to substantially complete these actions by the endsenior secured Term Loan B in May 2008, we terminated $30 million of the fiscal 2008. Asinterest rate swap agreements which had been placed in October, 2005 at a resultloss of the restructuring, the Company expects to incur cash expenses of approximately $12 million, primarily for employee severance-related payments, and non-cash expenses of approximately $5 million, primarily for fixed asset write-offs.$1.4 million.
Fiscal Year Reporting
In this Report,Form 10-K, when we refer to our fiscal years, we say “fiscal” and the year number, as in “fiscal 2007”2008”, which refers to our fiscal year ended March 31, 2007.2008. The Company reports interim financial information for 13-week periods, except for the first quarter, which always begins on April 1, and the fourth quarter, which always ends on March 31. The four fiscal quarters in fiscal 2008 ended on July 1, 2007, September 30, 2007, December 30, 2007, and March 31, 2008, respectively. The four fiscal quarters in fiscal 2007 ended on July 2, 2006, October 1, 2006, December 31, 2006, and March 31, 2007, respectively. The four fiscal quarters in fiscal 2006 ended on July 3, 2005, October 2, 2005, January 1, 2006, and March 31, 2006, respectively. Financial information about segments and geographic areas is incorporated by reference from Note 24 of the notesNotes to the Consolidated Financial Statements in this Form 10-K.
Our Customers
We serve over 10,000 customers in over 100 countries, on a direct basis or through our distributors. We are not overly dependent on any particular end market or geographic region. No single customer accounts for more than 6%7% of our revenues.
Reserve Power
Our reserve power customers consist of regional customers as well as global customers. These customers are in diverse markets ranging from telecom to UPS, electric utilities, security systems, emergency lighting and premium starting, lighting and ignition applications. In addition, we sell our aerospace and& defense products to numerous countries, including the governments of the U.S., Germany and the U.K. and to major defense and aviation original equipment manufacturers (“OEMs”).
Motive Power
Our motive power customers include a large, diversified customer base. These customers include materialsmaterial handling equipment dealers, OEMs and end users of such equipment. End users include manufacturers, distributors, warehouse operators, retailers, airports, mine operators and railroads.
Distribution and Services
Reserve Power
We distribute, sell and service reserve power products globally through a combination of company-owned offices, independent manufacturers’ representatives and distributors managed by our regional sales managers. With our global manufacturing locations and regional warehouses, we believe we are well positioned to meet our customers’ delivery and servicing requirements. We have targeted our approach to meet local market conditions, which we believe provides the best possible service for our regional customers and our global accounts.
Motive Power
We distribute, sell and service our motive power products throughout the world, principally through company-owned sales and service facilities, as well as through independent manufacturers’ representatives. We believe we are one of the only battery manufacturers in the motive power battery industry that operates a primarily company-owned service network. This company-owned network allows us to offer high-quality service, including preventative maintenance programs and customer support. Our warehouses and service locations enable us to respond quickly to customers in the markets we serve. TheWe believe that the extensive industry experience of our sales organization results in strong long-term customer relationships.
Manufacturing and Raw Materials
We manufacture and assemble reserve power and motive power batteries and related products at manufacturing facilities located in the Americas, Europe and Asia. We believe that our global approach to manufacturing has significantly helped us increase our market share during the past several years. With a view toward projected demand, we strive to optimize and balance capacity at our battery manufacturing facilities located throughout the world, while simultaneously minimizing our product cost. By taking a global view of our manufacturing requirements and capacity, we are better able to anticipate potential capacity bottlenecks and equipment and capital funding needs.
The primary raw materials used to manufacture our products include lead, plastics, steel and copper. We purchase lead from a number of leading suppliers throughout the world. Because lead is traded on the world’s commodity markets and its price fluctuates daily, we enter into hedging arrangements from time to time for a portion of our projected requirements to reduce the volatility of these fluctuations.
Competition
The industrial battery market is highly competitive and has experienced substantial consolidation both among competitors who manufacture and sell industrial batteries and among customers who purchase industrial batteries. Our competitors range from development stage companies to major domestic and international corporations. We also compete with other energy storage technologies. We compete primarily on the basis of reputation, product quality, reliability of service, delivery and price. We believe that our products and services are competitively priced.
Reserve Power
We believe we have one of the largest market sharesshare for reserve power products on a worldwide basis. We compete principally with Exide Technologies, GS Yuasa, C&D Technologies, FIAMM, Coslight, and East Penn Manufacturing.
Motive Power
We believe we have the largest market share for motive power products on a worldwide basis. Our principal competitor, on a global basis, is Exide Technologies. On a regional basis, East Penn Manufacturing and C&D TechnologiesCrown Battery Manufacturing Co. compete with us in North America, Hoppecke competes with us in Europe, and JSB, Shinkobe, GS Yuasa and Hitachi compete with us in Asia.
Warranties
Warranties for our products vary by geography and product and are competitive with other suppliers of these types of products. Generally, our reserve power products’ warranties range from one- to twenty-years and our motive power products’ warranties range from one- to seven-years. The length of our warranties is sometimes extended to reflect varied regional characteristics and competitive influences. In some cases, we may extend the warranty period to include a pro rata period, which is typically based around the design life of the product and the application served. Our warranties generally cover defects in workmanship and materials and are limited to specific usage parameters.
Intellectual Property
We have numerous patents and patent licenses in the United States and other jurisdictions but do not consider any one patent to be material to our business. From time to time however we apply for patents on new inventions and designs, butdesigns. However, we believe that the growth of our business will depend primarily upon the quality of our products and our relationships with our customers, rather than the extent of our patent protection.
Although other manufacturers may possess certain thin-plate pure-lead technology (“TPPL”), we believe we are the only manufacturer of products using TPPL technology in the markets we serve.reserve power markets. Some aspects of this technology may be patented in the future. In any event, we believe that a significant capital investment would be required by any party desiring to produce products using TPPL technology for these markets.
We own or possess exclusive and non-exclusive licenses and other rights to use a number of trademarks in various jurisdictions. We have obtained registrations for many of these trademarks in the United States and other jurisdictions. Our various trademark registrations currently have a duration of approximately one to 10 years, varying by mark and jurisdiction of registration and may be renewable. We endeavor to keep all of our material registrations current. We believe that many such rights and licenses are important to our business by helping to develop strong brand-name recognition in the marketplace. Some of the significant (registered and unregistered) trademarks that we use include:Armasafe+, Chloride, Cobra, Cyclon, DataSafe, Deserthog, Energy Plus, Envirolink, ESB, Espace, EnerSys Ironclad, Express, FIAMM Motive Power, GBC, Genesis, Genesis NP,
Genesis Pure Lead, Hawker, HUP, Hybernator, LifeGuard, LifePlus, Life Speed, Loadhog, Oasis, Odyssey, Uranio, Oldham, Perfect, PowerGuard, PowerLease, Powerline, PowerPlus, PowerSafe, Smarthog, Superhog, Supersafe, Titan PowerTech, Uranio, Varta, Waterlessand Workhog. Workhog.
Seasonality
Our business generally does not experience significant monthly or quarterly fluctuations in net sales as a result of weather or other trends that can be directly linked to seasonality patterns. However, our second fiscal quarter normally experiences moderate reductions in net sales as compared to our first fiscal quarter for that year, due to summer manufacturing shutdowns of our customers and holidays primarily in the United StatesNorth America and Western Europe. InThat was the case in fiscal 2006, our second2007 but, in fiscal 2008, each quarter was slightly higher than the first quarter.preceding quarter, primarily due to price recovery initiatives and the strengthening of other currencies against the U.S. dollar. Our fourth fiscal quarter normally experiences the highest sales of any fiscal quarter within a given year, as was the case in fiscal years 2005, 2006, 2007 and 2007.2008. Many reserve power telecommunications customers tend to perform extensive service and engage in higher battery replacement and maintenance activities in the first calendar quarter of a year, which is our fourth fiscal quarter. In addition, many of our largest industrial customers are on a calendar fiscal year basis and many tend to purchase their durable goods more heavily in that quarter than any other within the calendar year.
Product and Process Development
Our product and process development efforts are focused on the creation and optimization of new battery products using existing technologies, which, in certain cases, differentiate our stored energy solutions from that of our competition’s.competition. We allocate our resources to the following key areas:
the design and development of new products;
optimizing and expanding our existing product offering;
production efficiency and utilization;
capacity expansion, without additional facilities; and
quality attribute maximization.
Employees
At March 31, 2007,2008, we had approximately 7,8008,600 employees. Of these employees, approximately 3,200,3,600, almost all of whom work in our European facilities, were covered by collective bargaining agreements. The average term of these agreements is one to two years, with the longest term being three and one-half years. These agreements expire over the period from calendar years 20072008 to 2009.
We consider our employee relations to be good. WeHistorically, we have not experienced any significant labor unrest or disruption of production.
Environmental Matters
In the manufacture of our products throughout the world, we process, store, dispose of and otherwise use large amounts of hazardous materials, especially lead and acid. As a result, we are subject to extensive and changing environmental, health and safety laws and regulations governing, among other things: the generation, handling, storage, use, transportation and disposal of hazardous materials; remediation of polluted ground or water; emissions or discharges of hazardous materials into the ground, air or water; and the health and safety of our employees. In addition, we may in the future, be required to comply with the directive issued from the European Economic Union called Registration, Evaluation, Authorization and Restriction of Chemicals or “REACH,” that entered into force on 1 June 2007. Under the directive, companies which manufacture or import more than one ton of a chemical substance per year will be required to register it in a central database administered by the new EU Chemicals Agency. REACH will require a registration, over a period of 11 years, of some 30,000 chemical substances. Compliance with these laws and regulations results in ongoing costs. Failure to comply with these laws and regulations, or to obtain or comply with required environmental permits, could result in fines,
criminal charges or other sanctions by regulators. From time to time, we have had instances of alleged or actual noncompliance that have resulted in the imposition of fines, penalties and required corrective actions. Our ongoing compliance with environmental, health and safety laws, regulations and permits could require us to incur significant expenses, limit our ability to modify or expand our facilities or continue production and require us to install additional pollution control equipment and make other capital improvements. In addition, private parties, including current or former employees, could bring personal injury or other claims against us due to the presence of, or their exposure to, hazardous substances used, stored, transported or disposed of by us or contained in our products.
Certain environmental laws assess liability on owners or operators of real property for the cost of investigation, removal or remediation of hazardous substances at their current or former properties or at properties at which they have disposed of hazardous substances. These laws may also assess costs to repair damage to natural resources. We may be responsible for remediating damage to our properties that was caused by former owners. Soil and groundwater contamination has occurred at some of our current and former properties
and may occur or be discovered at other properties in the future. We currently are investigating and monitoring soil and groundwater contamination at certain of our properties, and we may be required to conduct these operations at other properties in the future. In addition, we have been and in the future may be liable to contribute to the cleanup of locations owned or operated by other persons to which we or our predecessor companies have sent wastes for disposal, pursuant to federal and other environmental laws. Under these laws, the owner or operator of contaminated properties and companies that generated, disposed of or arranged for the disposal of wastes sent to a contaminated disposal facility can be held jointly and severally liable for the investigation and cleanup of such properties, regardless of fault.
Manchester, England
We currently have identified three potentially significant environmental issues resulting from historical operations at our Manchester, England battery facility: lead slag piles that may pose a health risk are located in the vicinity of a public footpath on the property; the potential restoration of the Manchester, Bolton and Bury Canal by British Waterways may lead to sampling and/or remediation obligations with respect to the canal and surrounding areas located on our property; and there may be multiple and as yet unidentified areas of soil and groundwater contamination at the facility. We believe we have a right to be indemnified by the previous owner for these potential environmental liabilities in excess of amounts accrued and submitted a notice of claim to the previous owner in May 2003 regarding these issues. No government or third-party lawsuits, regulatory actions or orders have been filed with respect to this site to date, and all our actions at this site to date are voluntary. We originally established a reserve for this facility at £3.5 million, and as of March 31, 2007 it amounted to approximately $6.62008, the remaining reserve approximated £3.3 million. This reserve was set up under purchase accounting. Based on the information available at this time, we believe this reserve is sufficient to satisfy these environmental liabilities. See“Recent Developments” above, regarding the sale of the Manchester, England facility, which was completed subsequent to our year end.
Sumter, South Carolina
We currently are responsible for certain environmental obligations at the former Yuasa battery facility in Sumter, South Carolina. This battery facility was closed in 2001 and is separate from our current metal fabrication facility in Sumter. Remediation issues related to lead contamination in the soil were addressed pursuant to a 1998 Consent Order with the State of South Carolina, and we believe this matter to be closed. We are subject to ongoing storm water inspection requirements under a 2000 Consent Order based on suspected lead contamination. We also are in periodic discussions with the State of South Carolina regarding alleged trichloroethylene (TCE) and other volatile organic compound (VOC) contamination in the groundwater that predates our ownership of this facility. There may be other unidentified contaminants in the soil or groundwater that also predate our ownership of this facility. We believe we are insured against losses arising out of the alleged VOC contamination pursuant to our environmental insurance policy for U.S. facilities and filed a notice of claim with our insurance carrier in October 2002 regarding this contamination. We also believe we will be indemnified by the former owner of the facility for environmental liabilities at this facility in excess of amounts accrued and
submitted a notice of claim to them in 2002 regarding these issues. We have established a reserve for this facility, and asin fiscal 2008, we received $1.1 million from a previous owner in settlement of their indemnification of potential environmental liabilities related to the Sumter facility. As of March 31, 2007, it amounted2008, the reserves related to this facility and the removal of its remaining equipment totaled approximately $2.2$4.0 million. Based on current information, we believe this reserve is adequate to satisfy our environmental liabilities at this facility.
Environmental and safety certifications
SevenEight of our facilities in the United States, Europe and Asia are certified to ISO 14001 standards. ISO 14001 is a globally recognized, voluntary program that focuses on the implementation, maintenance and continual improvement of an environmental management system and the improvement of environmental performance. One of ourTwo facilities in the United States is certified by the United States Occupational Safety and Health Administration for the Voluntary Protection Program STAR and one facility in Europe isare certified to ISO 18000 standards.
Quality Systems
We utilize a global strategy for quality management systems, policies and procedures, the basis of which is the ISO 9001:2000 standard, which is a worldwide recognized quality standard. We believe in the principles of
this standard and reinforce this by requiring mandatory compliance for all manufacturing, sales and service locations that are registered to the ISO 9001 standard. This strategy enables us to provide effective products and services to meet our customers’ needs.
Available Information
We file annual, quarterly and current reports, proxy statements and other information with the Securities and Exchange Commission (the “SEC”). These filings are available to the public on the Internet at the SEC’s website at http://www.sec.gov. You may also read and copy any document we file with the SEC at the SEC’s public reference room, located at 100 F Street, N.E., Room 1580, Washington, D.C. 20549. Please call the SEC at 1-800-SEC-0330 for further information on the public reference room.
Our Internet address is http://www.enersys.com. We make available free of charge on http://www.enersys.com our annual, quarterly and current reports, and amendments to those reports, as soon as reasonably practicablepractical after we electronically file such material with, or furnish it to, the SEC.
ITEM 1A.RISK FACTORSPART II
| | | | |
The following risksItem 5.
| | Market for Registrant’s Common Equity, Related Stockholder Matters and uncertainties, as well as others describedIssuer Purchases of Equity Securities | | B-19 |
| | |
Item 6. | | Selected Financial Data | | B-22 |
| | |
Item 7. | | Management’s Discussion and Analysis of Financial Condition and Results of Operations | | B-23 |
| | |
Item 7A. | | Quantitative and Qualitative Disclosures About Market Risk | | B-53 |
| | |
Item 8. | | Financial Statements and Supplementary Data | | B-56 |
| | |
Item 9. | | Changes in this Annual Reportand Disagreements with Accountants on Form 10-K, could materially adversely affect our business, results of operationsAccounting and financial conditions. Security holders are cautioned that theseFinancial Disclosure | | B-104 |
| | |
Item 9A. | | Controls and other factors may affect future performanceProcedures | | B-104 |
| | |
Item 9B. | | Other Information | | B-104 |
| |
PART III | | |
| | |
Item 10. | | Directors and cause actual results to differ from those which may, from time to time, be anticipated. See “Cautionary Note Regarding Forward-Looking Statements.” We operate in an extremely competitive industry and are subject to continual pricing pressure.
We compete with a number of major international manufacturers and distributors, as well as a large number of smaller, regional competitors. Due to excess capacity in some sectors of our industry, consolidation among industrial battery purchasers and the financial difficulties being experienced by several of our competitors, we have been subjected to continual and significant pricing pressures. These pricing pressures have prevented us from fully passing through to customers increased costs. We anticipate heightened competitive pricing pressure as Chinese and other foreign producers, able to employ labor at significantly lower costs than producers in the U.S. and Western Europe, expand their export capacity and increase their marketing presence in our major U.S. and European markets. Several of our competitors have strong technical, marketing, sales, manufacturing, distribution and other resources, as well as significant name recognition, established positions in the market and long-standing relationships with original equipment manufacturers and other customers. In addition, certain of
our competitors own lead smelting facilities which, during periods of lead cost increases or price volatility, may provide a competitive pricing advantage and reduce their exposure to volatile raw material costs. Our ability to maintain and improve our operating margins has depended, and continues to depend, on our ability to control and reduce our costs. We cannot assure you that we will be able to continue to reduce our operating expenses, to raise or maintain our prices or increase our unit volume, in order to maintain or improve our operating results.
Cyclical industry conditions of our customers have adversely affected and may continue to adversely affect our results of operations.
Our operating results are affected by the general cyclical patternExecutive Officers of the industries in which our major customer groups operateRegistrant
| | B-105 |
| | |
Item 11. | | Executive Compensation | | B-105 |
| | |
Item 12. | | Security Ownership of Certain Beneficial Owners and the overall economic conditions in which weManagement and our customers operate. For example, the significant capital expenditures made by the telecommunications industry during the period from fiscal 1999 through fiscal 2001, as numerous companies expanded their systemsRelated Stockholder Matters | | B-105 |
| | |
Item 13. | | Certain Relationships and installed standby backup battery power systems, drove demand for our reserve power products. As the telecommunications industry dramatically reduced the building of new systems in response to massive overcapacity, the demand for our reserve power products for this important application declined significantly. Both our reserve powerRelated Transactions | | B-105 |
| | |
Item 14. | | Principal Accountant Fees and motive power segments are heavily dependent on the end-user markets they serve, such as telecommunications, UPSServices | | B-105 |
| |
PART IV | | |
| | |
Item 15. | | Exhibits and electric industrial forklift trucks. A weak capital expenditure environment in these markets has had, and can be expected to have, a material adverse effect on our results of operations.Financial Statement Schedules | | B-106 |
| | |
| | Our raw materials costs are volatile and expose us to significant movements in our product costs.Signatures
We employ significant amounts of lead, plastics, steel, copper and other materials in our manufacturing processes. We estimate that raw material costs account for approximately half of our cost of goods sold. Lead is our most significant raw material. The costs of these raw materials, particularly lead, are volatile and beyond our control.
Volatile raw material costs can significantly affect our operating results and make period-to-period comparisons extremely difficult. We cannot assure you that we will be able to hedge the costs of our raw material requirements at a reasonable level or pass on to our customers the increased costs of our raw materials.
Our operations expose us to the risk of material environmental, health and safety liabilities, costs, and litigation.
| | B-109 |
PART I
ITEM 1.BUSINESS
Overview
EnerSys (the “Company,” “we,” or “us”) is the world’s largest manufacturer, marketer and distributor of industrial batteries. We also manufacture, market and distribute related products such as chargers, power equipment and battery accessories, and we provide related after-market and customer-support services for industrial batteries. Industrial batteries generally are characterized as reserve power batteries or motive power batteries.
Reserve power productsalso are known as network, standby or stationary power batteries and are used primarily for backup power applications to ensure continuous power supply in case of main (primary) power failure or outage. Reserve power batteries are used primarily to supply standby direct current (“DC”) operating power for:
In the manufacture of our products throughout the world, we process, store, dispose of and otherwise use large amounts of hazardous materials, especially lead and acid. As a result, we are subject to extensive and changing environmental, health and safety laws and regulations governing, among other things: the generation, handling, storage, use, transportation and disposal of hazardous materials; remediation of polluted ground or water; emissions or discharges of hazardous materials into the ground, air or water; and the health and safety of our employees. Compliance with these laws and regulations results in ongoing costs. Failure to comply with these laws or regulations, or to obtain or comply with required environmental permits, could result in fines, criminal charges or other sanctions by regulators. From time to time we have had instances of alleged or actual noncompliance that have resulted in the imposition of fines, penalties and required corrective actions. Our ongoing compliance with environmental, health and safety laws, regulations and permits could require us to incur significant expenses, limit our ability to modify or expand our facilities or continue production and require us to install additional pollution control equipment and make other capital improvements. In addition, private parties, including current or former employees, could bring personal injury or other claims against us due to the presence of, or exposure to, hazardous substances used, stored or disposed of by us or contained in our products.
Certain environmental laws assess liability on owners or operators of real property for the cost of investigation, removal or remediation of hazardous substances at their current or former properties or at properties at which they have disposed of hazardous substances. These laws may also assess costs to repair
damage to natural resources. We may be responsible for remediating damage to our properties that was caused by former owners. Soil and groundwater contamination has occurred at some of our current and former properties and may occur or be discovered at other properties in the future. We are currently investigating and monitoring soil and groundwater contamination at certain of our properties, and we may be required to conduct these operations at other properties in the future. In addition, we have been and in the future may be liable to contribute to the cleanup of locations owned or operated by other persons to which we or our predecessor companies have sent wastes for disposal, pursuant to federal and other environmental laws. Under these laws, the owner or operator of contaminated properties and companies that generated, disposed of or arranged for the disposal of wastes sent to a contaminated disposal facility can be held jointly and severally liable for the investigation and cleanup of such properties, regardless of fault.
We cannot assure you that we have been or at all times will be in compliance with environmental laws and regulations or that we will not be required to expend significant funds to comply with, or discharge liabilities arising under, environmental laws, regulations and permits, or that we will not be exposed to material environmental, health or safety litigation.
Legislation regarding the restriction of the use of certain hazardous substances in electrical and electronic equipment.
The European Union has directed that new electrical and electronic equipment not contain certain hazardous substances, including lead and cadmium. Because battery accessories and chargers are subject to this directive (commonly known as RoHS), our compliance with the directive directly impacts our manufacturing of these products and could cause certain of our existing inventory to be obsolete. In addition, certain other jurisdictions outside the European Union have implemented, or plan to implement, similar restrictions with various compliance dates. We cannot assure you that we will meet all restrictions by the required dates. Inventory obsolescence and our failure to comply could each have an adverse effect on our financial results.
We are exposed to exchange rate risks, and our net income and financial condition may suffer due to currency translations.
We invoice foreign sales and service transactions in local currencies and translate net sales using actual exchange rates during the period. We translate our non-U.S. assets and liabilities into U.S. dollars using current rates as of the balance sheet date. Because a significant portion of our revenues and expenses are denominated in foreign currencies, changes in exchange rates between the U.S. dollar and foreign currencies, primarily the euro and British pound, may adversely affect our revenue, cost of revenue and operating margins. For example, foreign currency depreciation against the U.S. dollar will reduce the value of our foreign revenues and operating earnings as well as reduce our net investment in foreign subsidiaries.
Most of the risk of fluctuating foreign currencies is in our European operations, which comprised over half of our net sales during the last two fiscal years. The euro is the dominant currency in our European operations.
The translation impact from currency fluctuations on net sales and operating earnings in the Americas and Asia is minimal, as a substantial majority of these net sales and operating earnings are in dollars or are closely correlated to the dollar.
Foreign currency depreciation will make it more expensive for our non-U.S. subsidiaries to purchase certain of our raw material commodities that are priced globally in U.S. dollars, while the related revenue will decrease when translated to U.S. dollars. Significant movements in foreign exchange rates can have a material impact on our results of operations and financial condition. We periodically engage in hedging of our foreign currency exposure, but cannot assure you that we can successfully hedge all of our foreign currency exposure or do so at a reasonable cost.
Our international operations may be adversely affected by actions taken by foreign governments or other forces or events over which we may have no control.
We currently have significant manufacturing and distribution facilities outside of the U.S., including in the United Kingdom, France, Germany, China, Mexico, Poland, Czech Republic, Spain, Italy and Bulgaria. We may face political instability and economic uncertainty, cultural and religious differences and difficult labor relations in our foreign operations. We also may face barriers in the form of long-standing relationships between potential customers and their existing suppliers, national policies favoring domestic manufacturers and protective regulations including exchange controls, restrictions on foreign investment or the repatriation of profits or invested capital, changes in export or import restrictions and changes in the tax system or rate of taxation in countries where we do business. We cannot assure you that we will be able to successfully develop and expand our international operations and sales or that we will be able to overcome the significant obstacles and risks of our international operations.
Our failure to introduce new products and product enhancements and broad market acceptance of new technologies introduced by our competitors could adversely affect our business.
Many new energy storage technologies have been introduced over the past several years. In addition, recent advances in fuel cell and flywheel technology have been introduced for use in selected applications that compete with the end uses for industrial batteries. For certain important and growing markets, such as aerospace and defense, lithium-based battery technologies have large and growing market share. Our ability to achieve significant and sustained penetration of key developing markets, including aerospace and defense, will depend upon our success in developing or acquiring these and other technologies, either independently, through joint ventures or through acquisitions. If we fail to develop or acquire, and manufacture and sell, products that satisfy our customers’ demands, or we fail to respond effectively to new product announcements by our competitors by quickly introducing competitive products, then market acceptance of our products could be reduced and our business could be adversely affected. We cannot assure you that our lead-acid products will remain competitive with products based on new technologies.
We may not be able to adequately protect our proprietary intellectual property and technology.
We rely on a combination of copyright, trademark, patent and trade secret laws, non-disclosure agreements and other confidentiality procedures and contractual provisions to establish, protect and maintain our proprietary intellectual property and technology and other confidential information. Certain of these technologies, especially in thin-plate pure-lead—TPPL—technology, are important to our business and are not protected by patents. Despite our efforts to protect our proprietary intellectual property and technology and other confidential information, unauthorized parties may attempt to copy or otherwise obtain and use our intellectual property and proprietary technologies.
Relocation of our customers’ operations could adversely affect our business.
The trend by a number of our North American and Western European customers to move manufacturing operations and expand their businesses into Asia and other low labor-cost markets may have an adverse impact on our business. As our customers in traditional manufacturing-based industries seek to move their manufacturing operations to lower-cost territories, there is a risk that these customers will source their energy storage products from competitors located in those territories and will cease or reduce the purchase of products from our manufacturing plants. We cannot assure you that we will be able to compete effectively with manufacturing operations of energy storage products in those territories, whether by establishing or expanding our manufacturing operations in those lower-cost territories or acquiring existing manufacturers.
We may fail to implement our cost reduction initiatives successfully and improve our profitability.
We must continue to implement cost reduction initiatives to achieve additional cost savings in future periods. We cannot assure you that we will be able to achieve all of the cost savings that we expect to realize
from current or future initiatives. In particular, we may be unable to implement one or more of our initiatives successfully or we may experience unexpected cost increases that offset the savings that we achieve. Given the continued competitive pricing pressures experienced in our industry, our failure to realize cost savings would adversely affect our results of operations.
Quality problems with our products could harm our reputation and erode our competitive position.
The success of our business will depend upon the quality of our products and our relationships with customers. In the event that our products fail to meet our customers’ standards, our reputation could be harmed, which would adversely affect our marketing and sales efforts. We cannot assure you that our customers will not experience quality problems with our products.
We offer our products under a variety of brand names, the protection of which is important to our reputation for quality in the consumer marketplace.
We rely upon a combination of trademark, licensing and contractual covenants to establish and protect the brand names of our products. We have registered many of our trademarks in the U.S. Patent and Trademark Office and in other countries. In many market segments, our reputation is closely related to our brand names. Monitoring unauthorized use of our brand names is difficult, and we cannot be certain that the steps we have taken will prevent their unauthorized use, particularly in foreign countries where the laws may not protect our proprietary rights as fully as in the U.S. We cannot assure you that our brand names will not be misappropriated or utilized without our consent or that such actions will not have a material adverse effect on our reputation and on our results of operations.
We may fail to implement our plans to make acquisitions or successfully integrate them into our operations.
As part of our business strategy, we have grown, and plan to continue growing, by acquiring other product lines, technologies or facilities that complement or expand our existing business. We may be unable to implement this part of our business strategy and may not be able to make acquisitions to continue our growth. There is significant competition for acquisition targets in the industrial battery industry. We may not be able to identify suitable acquisition candidates or negotiate attractive terms. In addition, we may have difficulty obtaining the financing necessary to complete transactions we pursue. In that regard, our credit facilities restrict the amount of additional indebtedness that we may incur to finance acquisitions and place other restrictions on our ability to make acquisitions. Our failure to execute our acquisition strategy could have a material adverse effect on our business. The amounts we may pay for acquisitions are subject to limits on individual transactions and aggregate limits over the term of the credit facilities—until 2011 under the senior secured credit facility. Our individual transaction limits are $25.0 million cash and $75.0 million total (cash and company stock), and our aggregate limits are $100.0 million cash and $200.0 million total. Our ability to incur additional indebtedness also is restricted such that any significant acquisitions that could not be financed through cash generated from operations would need to be financed through issuance of additional company common stock. Exceeding any of these limitations would require the consent of our lenders. We cannot assure you that our acquisition strategy will be successful.
Any acquisitions that we complete may dilute your ownership interest in EnerSys, may have adverse effects on our financial condition and results of operations and may cause unanticipated liabilities.
Future acquisitions may involve the issuance of our equity securities as payment, in part or in full, for the businesses or assets acquired. Any future issuances of equity securities would dilute your ownership interests. In addition, future acquisitions might not increase, and may even decrease, our earnings or earnings per share and the benefits derived by us from an acquisition might not outweigh or might not exceed the dilutive effect of the acquisition. We also may incur additional debt or suffer adverse tax and accounting consequences in connection with any future acquisitions.
The failure of critical computer systems could seriously affect our sales and operations.
We operate a number of critical computer systems throughout our business that can fail for a variety of reasons. If such a failure were to occur, then we may not be able to sufficiently recover from the failure in time to avoid the loss of data or adversely impact certain of our operations that are dependent on such system. This could result in lost sales and the inefficient operation of our facilities for the duration of such a failure.
Our significant indebtedness could adversely affect our financial condition.
As of March 31, 2007, we had $402.3 million of total consolidated debt. This level of debt could:
increase our vulnerability to adverse general economic and industry conditions, including interest rate fluctuations, because a significant portion of our borrowings bear, and will continue to bear, interest at floating rates;
require us to dedicate a substantial portion of our cash flow from operations to debt service payments, which would reduce the availability of our cash to fund working capital, capital expenditures or other general corporate purposes, including acquisitions;
limit our flexibility in planning for, or reacting to, changes in our business and industry;
restrict our ability to introduce new products or new technologies or exploit business opportunities;
place us at a disadvantage compared with competitors that have proportionately less debt;
limit our ability to borrow additional funds in the future, if we need them, due to financial and restrictive covenants in our debt agreements; and
have a material adverse effect on us if we fail to comply with the financial and restrictive covenants in our debt agreements.
This list of factors that may affect future performance is illustrative, but by no means exhaustive. Accordingly, all forward-looking statements should be evaluated with the understanding of their inherent uncertainty.
ITEM 1B.telecommunications systems, such as wireless, wireline and internet access systems, central and local switching systems, satellite stations and radio transmission stations; uninterruptible power systems (“UPS”) applications for computer and computer-controlled systems, including process control systems; specialty power applications, including security systems, and for premium starting, lighting and ignition applications; switchgear and electrical control systems used in electric utilities and energy pipelines; and commercial and military aircraft, submarines and tactical military vehicles. Motive power products are used to provide power primarily for electric industrial forklift trucks. They compete primarily with propane- and diesel-powered internal combustion engines used principally in the following applications: | UNRESOLVED STAFF COMMENTS |
Not applicable
ITEM 2. PROPERTIES
Set forth below is certain information, as of June 1, 2007, with respect to our principal properties. The primary function of the listed facilities is manufacturing of industrial batteries, unless otherwise noted.
| | | | | | |
Locationindustrial forklift trucks in distribution and manufacturing facilities; mining equipment, including scoops, coal haulers, shield haulers, underground forklifts, shuttle cars and locomotives; and railroad equipment, including diesel locomotive starting, rail car lighting and rail signaling equipment; History
| | Function/Products Produced
| | Size
(sq. feet utilized)
| | Owned/Leased |
North America:
| | | | | | |
Reading, PA
| | Corporate Offices
| | 109,000 | | Owned |
Warrensburg, MO
| | Reserve Power Batteries
| | 376,000 | | Owned |
Hays, KS
| | Reserve Power Batteries
| | 351,000 | | Owned |
Richmond, KY
| | Motive and Reserve Power Batteries
| | 277,000 | | Owned |
Monterrey, Mexico
| | Motive and Reserve Power Batteries
| | 181,000 | | Owned |
Tijuana, Mexico
| | Reserve Power Batteries
| | 156,000 | | Owned |
Ooltewah, TN
| | Motive Power Batteries
| | 100,750 | | Owned |
Richmond, KY
| | Distribution Center
| | 95,500 | | Owned |
Cleveland, OH
| | Motive Power Chargers
| | 66,000 | | Owned |
Sumter, SC
| | Distribution Center
| | 60,000 | | Owned |
Saddlebrook, NJ
| | Distribution Center
| | 58,500 | | Leased |
Sumter, SC
| | Metal fabrication
| | 52,000 | | Owned |
Chino, CA
| | Distribution Center
| | 46,400 | | Leased |
Santa Fe Springs, CA
| | Distribution Center
| | 35,000 | | Leased |
Brampton, Canada
| | Distribution Center
| | 30,400 | | Leased |
Burr Ridge, IL
| | Distribution Center
| | 25,000 | | Leased |
Norcross, GA
| | Distribution Center
| | 23,600 | | Leased |
Kansas City, MO
| | Distribution Center
| | 19,700 | | Leased |
Dallas, TX
| | Distribution Center
| | 19,500 | | Leased |
Horsham, PA
| | Lithium Products
| | 15,000 | | Leased |
Warrington, PA
| | Distribution Center
| | 15,000 | | Leased |
Warwick, RI
| | Lithium Products
| | 4,000 | | Leased |
| | | |
Europe:
| | | | | | |
Arras, France
| | Motive and Reserve Power Batteries
| | 486,000 | | Owned |
Targovishte, Bulgaria
| | Motive and Reserve Power Batteries
| | 483,000 | | Owned |
Manchester, England
| | Reserve Power Batteries
| | 284,000 | | Owned |
Newport, Wales
| | Reserve Power Batteries
| | 233,000 | | Owned |
Bielsko-Biala, Poland
| | Motive Power Batteries
| | 220,000 | | Leased |
Montecchio, Italy
| | Motive Power Batteries
| | 207,000 | | Leased |
Hagen, Germany
| | Motive and Reserve Power Batteries
| | 185,000 | | Owned |
Herstal, Belgium
| | Distribution Center
| | 58,700 | | Leased |
Zwickau, Germany
| | Specialty Batteries
| | 57,000 | | Leased |
Zamudio, Spain
| | Assembly and Distribution
| | 55,000 | | Owned |
Brussels, Belgium
| | Distribution Center
| | 45,000 | | Leased |
Brebieres, France
| | Motive Power Chargers
| | 41,000 | | Leased |
Yverdon-les Bains, Switzerland
| | Distribution Center
| | 40,000 | | Leased |
Hostomice, Czech Republic
| | Metal Fabrication
| | 29,000 | | Owned/Leased |
| | | |
Asia
| | | | | | |
Shenzhen, China
| | Reserve Power Batteries
| | 176,000 | | Leased |
Jiangsu, China
| | Motive and Reserve Power Batteries
| | 160,000 | | Owned |
Chaoan, China
| | Reserve Power Batteries
| | 59,000 | | Owned |
Sydney, Australia
| | Assembly and Distribution
| | 13,000 | | Leased |
EnerSys and its predecessor companies have been manufacturers of industrial batteries for over 100 years. Morgan Stanley Capital Partners teamed with the management of Yuasa, Inc. in late 2000 to acquire from Yuasa Corporation (Japan) its reserve power and motive power battery businesses in North and South America. We were incorporated in October 2000 for the purpose of completing the Yuasa, Inc. acquisition. On January 1, 2001, we changed our name from Yuasa, Inc. to EnerSys to reflect our focus on the energy systems nature of our businesses.
Today, our reserve power batteries are marketed and sold principally under the PowerSafe, DataSafe, Hawker, Genesis, Odyssey, VartaandCyclon brands. Our motive power batteries are marketed and sold principally under the Hawker, EnerSys Ironclad, General Battery, Fiamm Motive Power, Uranio, OldhamandExpressbrands. We also manufacture and sell related direct current—DC—power products including chargers, electronic power equipment and a wide variety of battery accessories. Our battery products span a broad range of sizes, configurations and electrical capacities, enabling us to meet a wide variety of customer applications.
In August 2004, EnerSys completed an initial public offering (the “IPO”). The Company’s Registration Statement (SEC File No. 333-115553) for its IPO was declared effective by the Securities and Exchange Commission on July 26, 2004. The Company’s common stock commenced trading on the New York Stock Exchange on July 30, 2004, under the trading symbol “ENS.”
We have expanded our product offerings and services globally through internal growth and acquisitions.
In March 2002, we acquired the reserve power and motive power business of the Energy Storage Group of Invensys plc. (“ESG”). In June 2005, we acquired the motive power battery business of FIAMM, S.p.A. (FIAMM), which complements our then existing European motive power business. We also made smaller acquisitions of a producer of specialty nickel-based batteries based in Germany; a producer of lithium power sources, primarily for aerospace & defense applications located in the USA; a lead-acid battery business in Switzerland; a manufacturing facility in China, and a 97% interest in a producer of industrial batteries, located in Bulgaria.
2008 restructuring plan
On May 23, 2007, we committed to the principal features of a plan to restructure certain of our European production and commercial operations. In part, the restructuring facilitated the integration of Energia AD into our worldwide operations. The restructuring was designed to improve operational efficiencies and eliminate redundant costs primarily attributable to the Energia transaction. Restructuring actions commenced upon the completion of the requisite consultations, and we expect it to be substantially completed by the end of fiscal 2009. In fiscal 2008, as a result of this restructuring, we incurred cash expenses of approximately $9 million, primarily for employee severance-related payments, and non-cash expenses of approximately $4 million, primarily for fixed asset write-offs.
Recent Developments
Sale of Manufacturing Facility
In May 2008, we announced that, as part of our ongoing European restructuring program, we sold our Manchester, England manufacturing facility at a net of tax gain of approximately $8 million. This sale is consistent with our strategy to migrate our production to lower cost facilities.
Concurrent Public Offerings of Senior Convertible Notes and Common Stock and a Private Offering of a New Senior Secured Credit Facility
In May 2008, following the end of fiscal 2008, the Company completed the sale of $172.5 million aggregate principal amount of senior unsecured convertible notes, and used the net proceeds of $168.2 million to repay a portion of its existing senior secured Term Loan B. The senior unsecured convertible notes are potentially convertible at the option of the holders, at any time on or after March 1, 2015, but prior to the maturity date, into 24.6305 EnerSys common shares per $1,000 in original principal amount of the notes, equivalent to $40.60 per share or approximately 4.25 million common shares. It is our current intent to settle the principal amount of any conversions in cash, and any additional conversion consideration in cash, shares of EnerSys common stock or a combination of cash and shares. The notes will mature on June 1, 2038, unless earlier converted, redeemed or repurchased.
Concurrently with the convertible note offering, certain of our stockholders offered to sell, subject to market and other conditions, 3.4 million shares of EnerSys’ common stock pursuant to an effective shelf registration statement filed with the Securities and Exchange Commission on May 19, 2008. The offered shares were sold by several of our stockholders, including affiliates of Metalmark Capital LLC and certain other institutional stockholders. The selling stockholders granted the underwriters an option to purchase up to 0.34 million additional shares, of which 0.29 million shares were exercised and sold. A total of 3.69 million shares were sold as of May 28, 2008. We did not receive any proceeds from the common stock offering.
Also, immediately following the closing of the senior unsecured convertible note issue, we commenced refinancing the outstanding combined balance of the senior secured Term Loan B and our existing Revolver of approximately $200 million, with a new $350 million senior secured facility comprising Term A loans and a new Revolver. These planned refinancing transactions, which we expect to complete in June 2008, will strengthen our capital structure by adding senior unsecured convertible debt and a new senior secured debt facility that matures in 6 years.
Amendments of Credit Agreements
On May 16, 2008, EnerSys completed the Fifth Amendment to the $480 million Senior Secured Credit Agreement which allowed for the issuance of up to $205 million of unsecured indebtedness. The proceeds from the unsecured indebtedness must be used to pay down the senior secured Term Loan B. On May 28, 2008, EnerSys used the net proceeds of $168.2 million from the senior unsecured convertible notes to pay down a portion of the senior secured Term Loan B.
On May 15, 2008, the Company amended its Euro 25 million Credit Agreement to allow for the issuance of up to $205 million of unsecured indebtedness. The proceeds from the unsecured indebtedness must be used to pay down the senior secured Term Loan B. Additionally, the amendment authorized the Company to enter into a new $350 million US Credit Agreement on terms substantially similar to the existing Credit Agreement.
Termination of Interest Rate Swap Agreements
In connection with the issuance of $172.5 million of senior unsecured convertible notes, and the repayment of a portion of the senior secured Term Loan B in May 2008, we terminated $30 million of interest rate swap agreements which had been placed in October, 2005 at a loss of $1.4 million.
Fiscal Year Reporting
In this Form 10-K, when we refer to our fiscal years, we say “fiscal” and the year number, as in “fiscal 2008”, which refers to our fiscal year ended March 31, 2008. The Company reports interim financial information for 13-week periods, except for the first quarter, which always begins on April 1, and the fourth quarter, which always ends on March 31. The four fiscal quarters in fiscal 2008 ended on July 1, 2007, September 30, 2007, December 30, 2007, and March 31, 2008, respectively. The four fiscal quarters in fiscal 2007 ended on July 2, 2006, October 1, 2006, December 31, 2006, and March 31, 2007, respectively. The four fiscal quarters in fiscal 2006 ended on July 3, 2005, October 2, 2005, January 1, 2006, and March 31, 2006, respectively. Financial information about segments and geographic areas is incorporated by reference from Note 24 of Notes to Consolidated Financial Statements in this Form 10-K.
Our Customers
We serve over 10,000 customers in over 100 countries, on a direct basis or through our distributors. We are not overly dependent on any particular end market or geographic region. No single customer accounts for more than 7% of our revenues.
Reserve Power
Our reserve power customers consist of regional customers as well as global customers. These customers are in diverse markets ranging from telecom to UPS, electric utilities, security systems, emergency lighting and premium starting, lighting and ignition applications. In addition, we sell our aerospace & defense products to numerous countries, including the governments of the U.S., Germany and the U.K. and to major defense and aviation original equipment manufacturers (“OEMs”).
Motive Power
Our motive power customers include a large, diversified customer base. These customers include material handling equipment dealers, OEMs and end users of such equipment. End users include manufacturers, distributors, warehouse operators, retailers, airports, mine operators and railroads.
Distribution and Services
Reserve Power
We distribute, sell and service reserve power products globally through a combination of company-owned offices, independent manufacturers’ representatives and distributors managed by our regional sales managers. With our global manufacturing locations and regional warehouses, we believe we are well positioned to meet our customers’ delivery and servicing requirements. We have targeted our approach to meet local market conditions, which we believe provides the best possible service for our regional customers and our global accounts.
Motive Power
We distribute, sell and service our motive power products throughout the world, principally through company-owned sales and service facilities, as well as through independent manufacturers’ representatives. We believe we are one of the only battery manufacturers in the motive power battery industry that operates a primarily company-owned service network. This company-owned network allows us to offer high-quality service, including preventative maintenance programs and customer support. Our warehouses and service locations enable us to respond quickly to customers in the markets we serve. We believe that the extensive industry experience of our sales organization results in strong long-term customer relationships.
Manufacturing and Raw Materials
We manufacture and assemble reserve power and motive power batteries and related products at manufacturing facilities located in the Americas, Europe and Asia. We believe that our global approach to manufacturing has significantly helped us increase our market share during the past several years. With a view toward projected demand, we strive to optimize and balance capacity at our battery manufacturing facilities located throughout the world, while simultaneously minimizing our product cost. By taking a global view of our manufacturing requirements and capacity, we are better able to anticipate potential capacity bottlenecks and equipment and capital funding needs.
The primary raw materials used to manufacture our products include lead, plastics, steel and copper. We purchase lead from a number of leading suppliers throughout the world. Because lead is traded on the world’s commodity markets and its price fluctuates daily, we enter into hedging arrangements from time to time for a portion of our projected requirements to reduce the volatility of these fluctuations.
Competition
The industrial battery market is highly competitive both among competitors who manufacture and sell industrial batteries and among customers who purchase industrial batteries. Our competitors range from development stage companies to major domestic and international corporations. We also compete with other energy storage technologies. We compete primarily on the basis of reputation, product quality, reliability of service, delivery and price. We believe that our products and services are competitively priced.
Reserve Power
We believe we have the largest market share for reserve power products on a worldwide basis. We compete principally with Exide Technologies, GS Yuasa, C&D Technologies, FIAMM, Coslight, and East Penn Manufacturing.
Motive Power
We believe we have the largest market share for motive power products on a worldwide basis. Our principal competitor, on a global basis, is Exide Technologies. On a regional basis, East Penn Manufacturing and Crown Battery Manufacturing Co. compete with us in North America, Hoppecke competes with us in Europe, and JSB, Shinkobe, GS Yuasa and Hitachi compete with us in Asia.
Warranties
Warranties for our products vary by geography and product and are competitive with other suppliers of these types of products. Generally, our reserve power products’ warranties range from one- to twenty-years and our motive power products’ warranties range from one- to seven-years. The length of our warranties is sometimes extended to reflect varied regional characteristics and competitive influences. In some cases, we may extend the warranty period to include a pro rata period, which is typically based around the design life of the product and the application served. Our warranties generally cover defects in workmanship and materials and are limited to specific usage parameters.
Intellectual Property
We have numerous patents and patent licenses in the United States and other jurisdictions but do not consider any one patent to be material to our business. From time to time we apply for patents on new inventions and designs. However, we believe that the growth of our business will depend primarily upon the quality of our products and our relationships with our customers, rather than the extent of our patent protection.
Although other manufacturers may possess certain thin-plate pure-lead technology (“TPPL”), we believe we are the only manufacturer of products using TPPL technology in the reserve power markets. Some aspects of this technology may be patented in the future. In any event, we believe that a significant capital investment would be required by any party desiring to produce products using TPPL technology for these markets.
We own or possess exclusive and non-exclusive licenses and other rights to use a number of trademarks in various jurisdictions. We have obtained registrations for many of these trademarks in the United States and other jurisdictions. Our various trademark registrations currently have a duration of approximately one to 10 years, varying by mark and jurisdiction of registration and may be renewable. We endeavor to keep all of our material registrations current. We believe that many such rights and licenses are important to our business by helping to develop strong brand-name recognition in the marketplace. Some of the significant (registered and unregistered) trademarks that we use include:Armasafe+, Chloride, Cobra, Cyclon, DataSafe, Deserthog, Energy Plus, Envirolink, ESB, Espace, EnerSys Ironclad, Express, FIAMM Motive Power, GBC, Genesis, Genesis NP, Genesis Pure Lead, Hawker, HUP, Hybernator, LifeGuard, LifePlus, Life Speed, Loadhog, Oasis, Odyssey, Oldham, Perfect, PowerGuard, PowerLease, Powerline, PowerPlus, PowerSafe, Smarthog, Superhog, Supersafe, Titan PowerTech, Uranio, Varta, Waterlessand Workhog.
Seasonality
Our business generally does not experience significant monthly or quarterly fluctuations in net sales as a result of weather or other trends that can be directly linked to seasonality patterns. However, our second fiscal quarter normally experiences moderate reductions in net sales as compared to our first fiscal quarter for that year, due to summer manufacturing shutdowns of our customers and holidays primarily in North America and Western Europe. That was the case in fiscal 2007 but, in fiscal 2008, each quarter was higher than the preceding quarter, primarily due to price recovery initiatives and the strengthening of other currencies against the U.S. dollar. Our fourth fiscal quarter normally experiences the highest sales of any fiscal quarter within a given year, as was the case in fiscal 2006, 2007 and 2008. Many reserve power telecommunications customers tend to perform extensive service and engage in higher battery replacement and maintenance activities in the first calendar quarter of a year, which is our fourth fiscal quarter. In addition, many of our largest industrial customers are on a calendar fiscal year basis and many tend to purchase their durable goods more heavily in that quarter than any other within the calendar year.
Product and Process Development
Our product and process development efforts are focused on the creation and optimization of new battery products using existing technologies, which, in certain cases, differentiate our stored energy solutions from that of our competition. We allocate our resources to the following key areas:
the design and development of new products;
optimizing and expanding our existing product offering;
production efficiency and utilization;
capacity expansion, without additional facilities; and
quality attribute maximization.
Employees
At March 31, 2008, we had approximately 8,600 employees. Of these employees, approximately 3,600, almost all of whom work in our European facilities, were covered by collective bargaining agreements. The average term of these agreements is two years, with the longest term being three and one-half years. These agreements expire over the period from calendar years 2008 to 2009.
We consider our employee relations to be good. Historically, we have not experienced any significant labor unrest or disruption of production.
Environmental Matters
In the manufacture of our products throughout the world, we process, store, dispose of and otherwise use large amounts of hazardous materials, especially lead and acid. As a result, we are subject to extensive and changing environmental, health and safety laws and regulations governing, among other things: the generation, handling, storage, use, transportation and disposal of hazardous materials; emissions or discharges of hazardous materials into the ground, air or water; and the health and safety of our employees. In addition, we may in the future, be required to comply with the directive issued from the European Economic Union called Registration, Evaluation, Authorization and Restriction of Chemicals or “REACH,” that entered into force on 1 June 2007. Under the directive, companies which manufacture or import more than one ton of a chemical substance per year will be required to register it in a central database administered by the new EU Chemicals Agency. REACH will require a registration, over a period of 11 years, of some 30,000 chemical substances. Compliance with these laws and regulations results in ongoing costs. Failure to comply with these laws and regulations, or to obtain or comply with required environmental permits, could result in fines, criminal charges or other sanctions by regulators. From time to time, we have had instances of alleged or actual noncompliance that have resulted in the imposition of fines, penalties and required corrective actions. Our ongoing compliance with environmental, health and safety laws, regulations and permits could require us to incur significant expenses, limit our ability to modify or expand our facilities or continue production and require us to install additional pollution control equipment and make other capital improvements. In addition, private parties, including current or former employees, could bring personal injury or other claims against us due to the presence of, or their exposure to, hazardous substances used, stored, transported or disposed of by us or contained in our products.
Certain environmental laws assess liability on owners or operators of real property for the cost of investigation, removal or remediation of hazardous substances at their current or former properties or at properties at which they have disposed of hazardous substances. These laws may also assess costs to repair damage to natural resources. We may be responsible for remediating damage to our properties that was caused by former owners. Soil and groundwater contamination has occurred at some of our current and former properties
and may occur or be discovered at other properties in the future. We currently are investigating and monitoring soil and groundwater contamination at certain of our properties, and we may be required to conduct these operations at other properties in the future. In addition, we have been and in the future may be liable to contribute to the cleanup of locations owned or operated by other persons to which we or our predecessor companies have sent wastes for disposal, pursuant to federal and other environmental laws. Under these laws, the owner or operator of contaminated properties and companies that generated, disposed of or arranged for the disposal of wastes sent to a contaminated disposal facility can be held jointly and severally liable for the investigation and cleanup of such properties, regardless of fault.
Manchester, England
We currently have identified three potentially significant environmental issues resulting from historical operations at our Manchester, England battery facility: lead slag piles that may pose a health risk are located in the vicinity of a public footpath on the property; the potential restoration of the Manchester, Bolton and Bury Canal by British Waterways may lead to sampling and/or remediation obligations with respect to the canal and surrounding areas located on our property; and there may be multiple and as yet unidentified areas of soil and groundwater contamination at the facility. We believe we have a right to be indemnified by the previous owner for these potential environmental liabilities in excess of amounts accrued and submitted a notice of claim to the previous owner in May 2003 regarding these issues. No government or third-party lawsuits, regulatory actions or orders have been filed with respect to this site to date, and all our actions at this site to date are voluntary. We originally established a reserve for this facility at £3.5 million, and as of March 31, 2008, the remaining reserve approximated £3.3 million. This reserve was set up under purchase accounting. Based on the information available at this time, we believe this reserve is sufficient to satisfy these environmental liabilities. See“Recent Developments” above, regarding the sale of the Manchester, England facility, which was completed subsequent to our year end.
Sumter, South Carolina
We currently are responsible for certain environmental obligations at the former Yuasa battery facility in Sumter, South Carolina. This battery facility was closed in 2001 and is separate from our current metal fabrication facility in Sumter. Remediation issues related to lead contamination in the soil were addressed pursuant to a 1998 Consent Order with the State of South Carolina, and we believe this matter to be closed. We are subject to ongoing storm water inspection requirements under a 2000 Consent Order based on suspected lead contamination. We also are in periodic discussions with the State of South Carolina regarding alleged trichloroethylene (TCE) and other volatile organic compound (VOC) contamination in the groundwater that predates our ownership of this facility. There may be other unidentified contaminants in the soil or groundwater that also predate our ownership of this facility. We have established a reserve for this facility, and in fiscal 2008, we received $1.1 million from a previous owner in settlement of their indemnification of potential environmental liabilities related to the Sumter facility. As of March 31, 2008, the reserves related to this facility and the removal of its remaining equipment totaled approximately $4.0 million. Based on current information, we believe this reserve is adequate to satisfy our environmental liabilities at this facility.
Environmental and safety certifications
Eight of our facilities in the United States, Europe and Asia are certified to ISO 14001 standards. ISO 14001 is a globally recognized, voluntary program that focuses on the implementation, maintenance and continual improvement of an environmental management system and the improvement of environmental performance. Two facilities in Europe are certified to ISO 18000 standards.
Quality Systems
We utilize a global strategy for quality management systems, policies and procedures, the basis of which is the ISO 9001:2000 standard, which is a worldwide recognized quality standard. We believe in the principles of
this standard and reinforce this by requiring mandatory compliance for all manufacturing, sales and service locations that are registered to the ISO 9001 standard. This strategy enables us to provide effective products and services to meet our customers’ needs.
Available Information
We file annual, quarterly and current reports, proxy statements and other information with the Securities and Exchange Commission (the “SEC”). These filings are available to the public on the Internet at the SEC’s website at http://www.sec.gov. You may also read and copy any document we file with the SEC at the SEC’s public reference room, located at 100 F Street, N.E., Room 1580, Washington, D.C. 20549. Please call the SEC at 1-800-SEC-0330 for further information on the public reference room.
Our Internet address is http://www.enersys.com. We make available free of charge on http://www.enersys.com our annual, quarterly and current reports, and amendments to those reports, as soon as reasonably practical after we electronically file such material with, or furnish it to, the SEC.
ITEM 1A. ITEM 3. LEGAL PROCEEDINGS
In fiscal 2007, we settled two litigation matters. As a result of these settlements, we recorded litigation settlement income, net of related legal fees and expenses, of $3.8 million.
From time to time, we are involved in litigation incidental to the conduct of our business. We do not expect that any of this litigation, individually or in the aggregate, will have a material adverse effect on our financial condition, results of operations or cash flow.
ITEM 4. SUBMISSION OF MATTERS TO A VOTE OF SECURITY HOLDERS
No matters were submitted to the vote of stockholders through the solicitation of proxies or otherwise during the fiscal quarter ended March 31, 2007.
PART II
ITEM 5. | | MARKET FOR REGISTRANT’S COMMON EQUITY, RELATED STOCKHOLDER MATTERS AND ISSUER REPURCHASES OF EQUITY SECURITIES |
| | |
Item 5. | | Market Informationfor Registrant’s Common Equity, Related Stockholder Matters and Issuer Purchases of Equity Securities | | B-19 |
| | |
The Company’s common stock has been listed on the New York Stock Exchange under the symbol “ENS” since it began trading on July 30, 2004. Prior to that time, there had been no public market for our common stock. The following table sets forth, on a per share basis for the periods presented, the range of high, low and closing prices of the Company’s common stock.Item 6.
| | | | | | | | | | Quarter Ended | | High Price | | Low Price | | Closing Price | July 2, 2006 | | $ | 21.46 | | $ | 12.06 | | $ | 20.90 | October 1, 2006 | | $ | 20.77 | | $ | 16.04 | | $ | 16.04 | December 31, 2006 | | $ | 18.57 | | $ | 15.20 | | $ | 16.00 | March 31, 2007 | | $ | 17.50 | | $ | 15.97 | | $ | 17.18 | | | | | July 3, 2005 | | $ | 14.00 | | $ | 9.00 | | $ | 13.66 | October 2, 2005 | | $ | 15.36 | | $ | 12.46 | | $ | 15.17 | January 1, 2006 | | $ | 15.54 | | $ | 12.98 | | $ | 13.04 | March 31, 2006 | | $ | 15.70 | | $ | 12.11 | | $ | 13.80 |
| | Holders of RecordSelected Financial Data
| | B-22 |
| | |
As of June 1, 2007, there were approximately 241 record holders of common stock of the Company. Because many of such shares are held by brokers and other institutions on behalf of stockholders, the Company is unable to estimate the total number of stockholders represented by these record holders.Item 7.
| | Dividends
We never have paid or declared any cash dividends on our common stock and we have certain restrictions from doing so by our senior secured credit agreement. We currently intend to retain any earnings for future growth and, therefore, do not expect to pay any cash dividends in the foreseeable future.
Recent Sales of Unregistered Securities
During the fiscal year ended March 31, 2007, we did not issue any unregistered securities.
STOCK PERFORMANCE GRAPH
The following graph compares the changes in cumulative total returns on EnerSys’ common stock with the changes in cumulative total returns of the New York Stock Exchange Composite Index, a broad equity market index, and the total return on a selected peer group index. The peer group selected is based on the standard industrial classification codes (“SIC Codes”) established by the U.S. government. The index chosen was “Miscellaneous Electrical Equipment and Suppliers” and comprises all publically traded companies having the same three-digit SIC Code (369) as EnerSys. The constituent companies are: Active Power Inc, Advanced Battery Technologies Inc., Axion Power International, Inc., C & D Technologies Inc., China BAK Battery Inc., Cooper Industries Limited, Cymer Inc., Electro Energy Inc., Ener1 Inc., Energizer Holdings Inc., Energy Conversion Devices Inc., Excel Technology Inc., Exide Technologies, Greatbatch Inc., Hoko Scientific Inc., Hybrid Technology Inc., Hydrogen Corp., Komag Inc., Lifestyle Innovations Inc., Lithium Technology Corp., Manhattan Scientifics Inc., Millenium Cell Inc., Motorcar Parts of America, Oak Ridge Micro Energy Inc., Power Technology Inc., Rofin Sinar Technologies, Satcon Technology Corp., Save the World Aircraft, Inc., Spectrum Brands Inc., Standard Motor Products, Inc., TNR Technical Inc., Trans Max Technologies Inc., Turbine Truck Engines Inc., Ultralife Batteries Inc., Valence Technology Inc., Wonder Auto Technology Inc. and Zareba Systems Inc. The peer group data points are weighted by market capitalization of the constituent companies.
The graph was prepared assuming that $100 was invested in EnerSys’ common stock, the New York Stock Exchange Composite Index and the peer group on July 30, 2004.
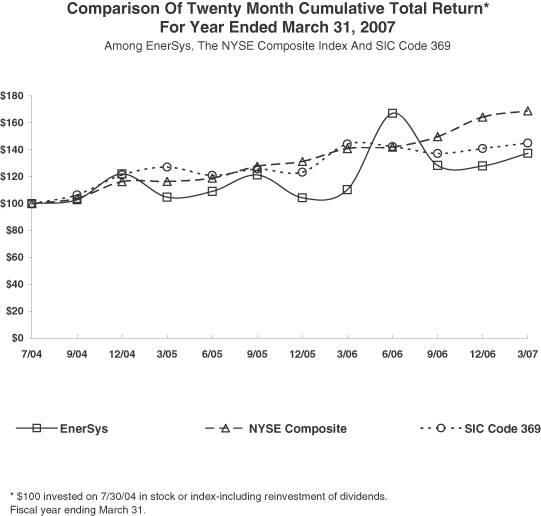
ITEM 6. SELECTED FINANCIAL DATA
The following tables set forth certain selected consolidated financial and operating data. The selected consolidated financial data presented below for the years ended March 31, 2005, 2006 and 2007, and as of March 31, 2006 and 2007 are derived from our audited consolidated financial statements included elsewhere in this Form 10-K. The selected consolidated financial data presented below for the years ended March 31, 2003 and 2004, and as of March 31, 2003, 2004 and 2005 are derived from our audited consolidated financial statements not included in this Form 10-K. This information should be read in conjunction with the consolidated financial statements and the related notes thereto, and Management’s Discussion and Analysis of Financial Condition and Results of Operations
| | B-23 |
| | |
Item 7A. | | Quantitative and Qualitative Disclosures About Market Risk | | B-53 |
| | |
Item 8. | | Financial Statements and Supplementary Data | | B-56 |
| | |
Item 9. | | Changes in and Disagreements with Accountants on Accounting and Financial Condition, each included elsewhere, herein.Disclosure | | B-104 |
| | |
Item 9A. | | Controls and Procedures | | B-104 |
| | |
Item 9B. | | Other Information | | B-104 |
| |
PART III | | |
| | |
Item 10. | | Directors and Executive Officers of the Registrant | | B-105 |
| | |
Item 11. | | Executive Compensation | | B-105 |
| | |
Item 12. | | Security Ownership of Certain Beneficial Owners and Management and Related Stockholder Matters | | B-105 |
| | |
Item 13. | | Certain Relationships and Related Transactions | | B-105 |
| | |
Item 14. | | Principal Accountant Fees and Services | | B-105 |
| |
PART IV | | |
| | |
Item 15. | | Exhibits and Financial Statement Schedules | | B-106 |
| | |
| | Signatures | | B-109 |
PART I
ITEM 1.BUSINESS
Overview
EnerSys (the “Company,” “we,” or “us”) is the world’s largest manufacturer, marketer and distributor of industrial batteries. We also manufacture, market and distribute related products such as chargers, power equipment and battery accessories, and we provide related after-market and customer-support services for industrial batteries. Industrial batteries generally are characterized as reserve power batteries or motive power batteries.
Reserve power productsalso are known as network, standby or stationary power batteries and are used primarily for backup power applications to ensure continuous power supply in case of main (primary) power failure or outage. Reserve power batteries are used primarily to supply standby direct current (“DC”) operating power for:
telecommunications systems, such as wireless, wireline and internet access systems, central and local switching systems, satellite stations and radio transmission stations;
uninterruptible power systems (“UPS”) applications for computer and computer-controlled systems, including process control systems;
specialty power applications, including security systems, and for premium starting, lighting and ignition applications;
switchgear and electrical control systems used in electric utilities and energy pipelines; and
commercial and military aircraft, submarines and tactical military vehicles.
Motive power products are used to provide power primarily for electric industrial forklift trucks. They compete primarily with propane- and diesel-powered internal combustion engines used principally in the following applications:
industrial forklift trucks in distribution and manufacturing facilities;
mining equipment, including scoops, coal haulers, shield haulers, underground forklifts, shuttle cars and locomotives; and
railroad equipment, including diesel locomotive starting, rail car lighting and rail signaling equipment;
History
EnerSys and its predecessor companies have been manufacturers of industrial batteries for over 100 years. Morgan Stanley Capital Partners teamed with the management of Yuasa, Inc. in late 2000 to acquire from Yuasa Corporation (Japan) its reserve power and motive power battery businesses in North and South America. We were incorporated in October 2000 for the purpose of completing the Yuasa, Inc. acquisition. On January 1, 2001, we changed our name from Yuasa, Inc. to EnerSys to reflect our focus on the energy systems nature of our businesses.
Today, our reserve power batteries are marketed and sold principally under the PowerSafe, DataSafe, Hawker, Genesis, Odyssey, VartaandCyclon brands. Our motive power batteries are marketed and sold principally under the Hawker, EnerSys Ironclad, General Battery, Fiamm Motive Power, Uranio, OldhamandExpressbrands. We also manufacture and sell related direct current—DC—power products including chargers, electronic power equipment and a wide variety of battery accessories. Our battery products span a broad range of sizes, configurations and electrical capacities, enabling us to meet a wide variety of customer applications.
In August 2004, EnerSys completed an initial public offering (the “IPO”). The Company’s Registration Statement (SEC File No. 333-115553) for its IPO was declared effective by the Securities and Exchange Commission on July 26, 2004. The Company’s common stock commenced trading on the New York Stock Exchange on July 30, 2004, under the trading symbol “ENS.”
We have expanded our product offerings and services globally through internal growth and acquisitions.
In March 2002, we acquired the reserve power and motive power business of the Energy Storage Group of Invensys plc. (“ESG”). In June 2005, we acquired the motive power battery business of FIAMM, S.p.A. (FIAMM), which complements our then existing European motive power business. We also made smaller acquisitions of a producer of specialty nickel-based batteries based in Germany; a producer of lithium power sources, primarily for aerospace & defense applications located in the USA; a lead-acid battery business in Switzerland; a manufacturing facility in China, and a 97% interest in a producer of industrial batteries, located in Bulgaria.
2008 restructuring plan
On May 23, 2007, we committed to the principal features of a plan to restructure certain of our European production and commercial operations. In part, the restructuring facilitated the integration of Energia AD into our worldwide operations. The restructuring was designed to improve operational efficiencies and eliminate redundant costs primarily attributable to the Energia transaction. Restructuring actions commenced upon the completion of the requisite consultations, and we expect it to be substantially completed by the end of fiscal 2009. In fiscal 2008, as a result of this restructuring, we incurred cash expenses of approximately $9 million, primarily for employee severance-related payments, and non-cash expenses of approximately $4 million, primarily for fixed asset write-offs.
Recent Developments
Sale of Manufacturing Facility
In May 2008, we announced that, as part of our ongoing European restructuring program, we sold our Manchester, England manufacturing facility at a net of tax gain of approximately $8 million. This sale is consistent with our strategy to migrate our production to lower cost facilities.
Concurrent Public Offerings of Senior Convertible Notes and Common Stock and a Private Offering of a New Senior Secured Credit Facility
In May 2008, following the end of fiscal 2008, the Company completed the sale of $172.5 million aggregate principal amount of senior unsecured convertible notes, and used the net proceeds of $168.2 million to repay a portion of its existing senior secured Term Loan B. The senior unsecured convertible notes are potentially convertible at the option of the holders, at any time on or after March 1, 2015, but prior to the maturity date, into 24.6305 EnerSys common shares per $1,000 in original principal amount of the notes, equivalent to $40.60 per share or approximately 4.25 million common shares. It is our current intent to settle the principal amount of any conversions in cash, and any additional conversion consideration in cash, shares of EnerSys common stock or a combination of cash and shares. The notes will mature on June 1, 2038, unless earlier converted, redeemed or repurchased.
Concurrently with the convertible note offering, certain of our stockholders offered to sell, subject to market and other conditions, 3.4 million shares of EnerSys’ common stock pursuant to an effective shelf registration statement filed with the Securities and Exchange Commission on May 19, 2008. The offered shares were sold by several of our stockholders, including affiliates of Metalmark Capital LLC and certain other institutional stockholders. The selling stockholders granted the underwriters an option to purchase up to 0.34 million additional shares, of which 0.29 million shares were exercised and sold. A total of 3.69 million shares were sold as of May 28, 2008. We did not receive any proceeds from the common stock offering.
Also, immediately following the closing of the senior unsecured convertible note issue, we commenced refinancing the outstanding combined balance of the senior secured Term Loan B and our existing Revolver of approximately $200 million, with a new $350 million senior secured facility comprising Term A loans and a new Revolver. These planned refinancing transactions, which we expect to complete in June 2008, will strengthen our capital structure by adding senior unsecured convertible debt and a new senior secured debt facility that matures in 6 years.
Amendments of Credit Agreements
On May 16, 2008, EnerSys completed the Fifth Amendment to the $480 million Senior Secured Credit Agreement which allowed for the issuance of up to $205 million of unsecured indebtedness. The proceeds from the unsecured indebtedness must be used to pay down the senior secured Term Loan B. On May 28, 2008, EnerSys used the net proceeds of $168.2 million from the senior unsecured convertible notes to pay down a portion of the senior secured Term Loan B.
On May 15, 2008, the Company amended its Euro 25 million Credit Agreement to allow for the issuance of up to $205 million of unsecured indebtedness. The proceeds from the unsecured indebtedness must be used to pay down the senior secured Term Loan B. Additionally, the amendment authorized the Company to enter into a new $350 million US Credit Agreement on terms substantially similar to the existing Credit Agreement.
Termination of Interest Rate Swap Agreements
In connection with the issuance of $172.5 million of senior unsecured convertible notes, and the repayment of a portion of the senior secured Term Loan B in May 2008, we terminated $30 million of interest rate swap agreements which had been placed in October, 2005 at a loss of $1.4 million.
Fiscal Year Reporting
In this Form 10-K, when we refer to our fiscal years, we say “fiscal” and the year number, as in “fiscal 2008”, which refers to our fiscal year ended March 31, 2008. The Company reports interim financial information for 13-week periods, except for the first quarter, which always begins on April 1, and the fourth quarter, which always ends on March 31. The four fiscal quarters in fiscal 2008 ended on July 1, 2007, September 30, 2007, December 30, 2007, and March 31, 2008, respectively. The four fiscal quarters in fiscal 2007 ended on July 2, 2006, October 1, 2006, December 31, 2006, and March 31, 2007, respectively. The four fiscal quarters in fiscal 2006 ended on July 3, 2005, October 2, 2005, January 1, 2006, and March 31, 2006, respectively. Financial information about segments and geographic areas is incorporated by reference from Note 24 of Notes to Consolidated Financial Statements in this Form 10-K.
Our Customers
We serve over 10,000 customers in over 100 countries, on a direct basis or through our distributors. We are not overly dependent on any particular end market or geographic region. No single customer accounts for more than 7% of our revenues.
Reserve Power
Our reserve power customers consist of regional customers as well as global customers. These customers are in diverse markets ranging from telecom to UPS, electric utilities, security systems, emergency lighting and premium starting, lighting and ignition applications. In addition, we sell our aerospace & defense products to numerous countries, including the governments of the U.S., Germany and the U.K. and to major defense and aviation original equipment manufacturers (“OEMs”).
Motive Power
Our motive power customers include a large, diversified customer base. These customers include material handling equipment dealers, OEMs and end users of such equipment. End users include manufacturers, distributors, warehouse operators, retailers, airports, mine operators and railroads.
Distribution and Services
Reserve Power
We distribute, sell and service reserve power products globally through a combination of company-owned offices, independent manufacturers’ representatives and distributors managed by our regional sales managers. With our global manufacturing locations and regional warehouses, we believe we are well positioned to meet our customers’ delivery and servicing requirements. We have targeted our approach to meet local market conditions, which we believe provides the best possible service for our regional customers and our global accounts.
Motive Power
We distribute, sell and service our motive power products throughout the world, principally through company-owned sales and service facilities, as well as through independent manufacturers’ representatives. We believe we are one of the only battery manufacturers in the motive power battery industry that operates a primarily company-owned service network. This company-owned network allows us to offer high-quality service, including preventative maintenance programs and customer support. Our warehouses and service locations enable us to respond quickly to customers in the markets we serve. We believe that the extensive industry experience of our sales organization results in strong long-term customer relationships.
Manufacturing and Raw Materials
We manufacture and assemble reserve power and motive power batteries and related products at manufacturing facilities located in the Americas, Europe and Asia. We believe that our global approach to manufacturing has significantly helped us increase our market share during the past several years. With a view toward projected demand, we strive to optimize and balance capacity at our battery manufacturing facilities located throughout the world, while simultaneously minimizing our product cost. By taking a global view of our manufacturing requirements and capacity, we are better able to anticipate potential capacity bottlenecks and equipment and capital funding needs.
The primary raw materials used to manufacture our products include lead, plastics, steel and copper. We purchase lead from a number of leading suppliers throughout the world. Because lead is traded on the world’s commodity markets and its price fluctuates daily, we enter into hedging arrangements from time to time for a portion of our projected requirements to reduce the volatility of these fluctuations.
Competition
The industrial battery market is highly competitive both among competitors who manufacture and sell industrial batteries and among customers who purchase industrial batteries. Our competitors range from development stage companies to major domestic and international corporations. We also compete with other energy storage technologies. We compete primarily on the basis of reputation, product quality, reliability of service, delivery and price. We believe that our products and services are competitively priced.
Reserve Power
We believe we have the largest market share for reserve power products on a worldwide basis. We compete principally with Exide Technologies, GS Yuasa, C&D Technologies, FIAMM, Coslight, and East Penn Manufacturing.
Motive Power
We believe we have the largest market share for motive power products on a worldwide basis. Our principal competitor, on a global basis, is Exide Technologies. On a regional basis, East Penn Manufacturing and Crown Battery Manufacturing Co. compete with us in North America, Hoppecke competes with us in Europe, and JSB, Shinkobe, GS Yuasa and Hitachi compete with us in Asia.
Warranties
Warranties for our products vary by geography and product and are competitive with other suppliers of these types of products. Generally, our reserve power products’ warranties range from one- to twenty-years and our motive power products’ warranties range from one- to seven-years. The length of our warranties is sometimes extended to reflect varied regional characteristics and competitive influences. In some cases, we may extend the warranty period to include a pro rata period, which is typically based around the design life of the product and the application served. Our warranties generally cover defects in workmanship and materials and are limited to specific usage parameters.
Intellectual Property
We have numerous patents and patent licenses in the United States and other jurisdictions but do not consider any one patent to be material to our business. From time to time we apply for patents on new inventions and designs. However, we believe that the growth of our business will depend primarily upon the quality of our products and our relationships with our customers, rather than the extent of our patent protection.
Although other manufacturers may possess certain thin-plate pure-lead technology (“TPPL”), we believe we are the only manufacturer of products using TPPL technology in the reserve power markets. Some aspects of this technology may be patented in the future. In any event, we believe that a significant capital investment would be required by any party desiring to produce products using TPPL technology for these markets.
We own or possess exclusive and non-exclusive licenses and other rights to use a number of trademarks in various jurisdictions. We have obtained registrations for many of these trademarks in the United States and other jurisdictions. Our various trademark registrations currently have a duration of approximately one to 10 years, varying by mark and jurisdiction of registration and may be renewable. We endeavor to keep all of our material registrations current. We believe that many such rights and licenses are important to our business by helping to develop strong brand-name recognition in the marketplace. Some of the significant (registered and unregistered) trademarks that we use include:Armasafe+, Chloride, Cobra, Cyclon, DataSafe, Deserthog, Energy Plus, Envirolink, ESB, Espace, EnerSys Ironclad, Express, FIAMM Motive Power, GBC, Genesis, Genesis NP, Genesis Pure Lead, Hawker, HUP, Hybernator, LifeGuard, LifePlus, Life Speed, Loadhog, Oasis, Odyssey, Oldham, Perfect, PowerGuard, PowerLease, Powerline, PowerPlus, PowerSafe, Smarthog, Superhog, Supersafe, Titan PowerTech, Uranio, Varta, Waterlessand Workhog.
Seasonality
Our business generally does not experience significant monthly or quarterly fluctuations in net sales as a result of weather or other trends that can be directly linked to seasonality patterns. However, our second fiscal quarter normally experiences moderate reductions in net sales as compared to our first fiscal quarter for that year, due to summer manufacturing shutdowns of our customers and holidays primarily in North America and Western Europe. That was the case in fiscal 2007 but, in fiscal 2008, each quarter was higher than the preceding quarter, primarily due to price recovery initiatives and the strengthening of other currencies against the U.S. dollar. Our fourth fiscal quarter normally experiences the highest sales of any fiscal quarter within a given year, as was the case in fiscal 2006, 2007 and 2008. Many reserve power telecommunications customers tend to perform extensive service and engage in higher battery replacement and maintenance activities in the first calendar quarter of a year, which is our fourth fiscal quarter. In addition, many of our largest industrial customers are on a calendar fiscal year basis and many tend to purchase their durable goods more heavily in that quarter than any other within the calendar year.
Product and Process Development
Our product and process development efforts are focused on the creation and optimization of new battery products using existing technologies, which, in certain cases, differentiate our stored energy solutions from that of our competition. We allocate our resources to the following key areas:
the design and development of new products;
optimizing and expanding our existing product offering;
production efficiency and utilization;
capacity expansion, without additional facilities; and
quality attribute maximization.
Employees
At March 31, 2008, we had approximately 8,600 employees. Of these employees, approximately 3,600, almost all of whom work in our European facilities, were covered by collective bargaining agreements. The average term of these agreements is two years, with the longest term being three and one-half years. These agreements expire over the period from calendar years 2008 to 2009.
We consider our employee relations to be good. Historically, we have not experienced any significant labor unrest or disruption of production.
Environmental Matters
In the manufacture of our products throughout the world, we process, store, dispose of and otherwise use large amounts of hazardous materials, especially lead and acid. As a result, we are subject to extensive and changing environmental, health and safety laws and regulations governing, among other things: the generation, handling, storage, use, transportation and disposal of hazardous materials; emissions or discharges of hazardous materials into the ground, air or water; and the health and safety of our employees. In addition, we may in the future, be required to comply with the directive issued from the European Economic Union called Registration, Evaluation, Authorization and Restriction of Chemicals or “REACH,” that entered into force on 1 June 2007. Under the directive, companies which manufacture or import more than one ton of a chemical substance per year will be required to register it in a central database administered by the new EU Chemicals Agency. REACH will require a registration, over a period of 11 years, of some 30,000 chemical substances. Compliance with these laws and regulations results in ongoing costs. Failure to comply with these laws and regulations, or to obtain or comply with required environmental permits, could result in fines, criminal charges or other sanctions by regulators. From time to time, we have had instances of alleged or actual noncompliance that have resulted in the imposition of fines, penalties and required corrective actions. Our ongoing compliance with environmental, health and safety laws, regulations and permits could require us to incur significant expenses, limit our ability to modify or expand our facilities or continue production and require us to install additional pollution control equipment and make other capital improvements. In addition, private parties, including current or former employees, could bring personal injury or other claims against us due to the presence of, or their exposure to, hazardous substances used, stored, transported or disposed of by us or contained in our products.
Certain environmental laws assess liability on owners or operators of real property for the cost of investigation, removal or remediation of hazardous substances at their current or former properties or at properties at which they have disposed of hazardous substances. These laws may also assess costs to repair damage to natural resources. We may be responsible for remediating damage to our properties that was caused by former owners. Soil and groundwater contamination has occurred at some of our current and former properties
and may occur or be discovered at other properties in the future. We currently are investigating and monitoring soil and groundwater contamination at certain of our properties, and we may be required to conduct these operations at other properties in the future. In addition, we have been and in the future may be liable to contribute to the cleanup of locations owned or operated by other persons to which we or our predecessor companies have sent wastes for disposal, pursuant to federal and other environmental laws. Under these laws, the owner or operator of contaminated properties and companies that generated, disposed of or arranged for the disposal of wastes sent to a contaminated disposal facility can be held jointly and severally liable for the investigation and cleanup of such properties, regardless of fault.
Manchester, England
We currently have identified three potentially significant environmental issues resulting from historical operations at our Manchester, England battery facility: lead slag piles that may pose a health risk are located in the vicinity of a public footpath on the property; the potential restoration of the Manchester, Bolton and Bury Canal by British Waterways may lead to sampling and/or remediation obligations with respect to the canal and surrounding areas located on our property; and there may be multiple and as yet unidentified areas of soil and groundwater contamination at the facility. We believe we have a right to be indemnified by the previous owner for these potential environmental liabilities in excess of amounts accrued and submitted a notice of claim to the previous owner in May 2003 regarding these issues. No government or third-party lawsuits, regulatory actions or orders have been filed with respect to this site to date, and all our actions at this site to date are voluntary. We originally established a reserve for this facility at £3.5 million, and as of March 31, 2008, the remaining reserve approximated £3.3 million. This reserve was set up under purchase accounting. Based on the information available at this time, we believe this reserve is sufficient to satisfy these environmental liabilities. See“Recent Developments” above, regarding the sale of the Manchester, England facility, which was completed subsequent to our year end.
Sumter, South Carolina
We currently are responsible for certain environmental obligations at the former Yuasa battery facility in Sumter, South Carolina. This battery facility was closed in 2001 and is separate from our current metal fabrication facility in Sumter. Remediation issues related to lead contamination in the soil were addressed pursuant to a 1998 Consent Order with the State of South Carolina, and we believe this matter to be closed. We are subject to ongoing storm water inspection requirements under a 2000 Consent Order based on suspected lead contamination. We also are in periodic discussions with the State of South Carolina regarding alleged trichloroethylene (TCE) and other volatile organic compound (VOC) contamination in the groundwater that predates our ownership of this facility. There may be other unidentified contaminants in the soil or groundwater that also predate our ownership of this facility. We have established a reserve for this facility, and in fiscal 2008, we received $1.1 million from a previous owner in settlement of their indemnification of potential environmental liabilities related to the Sumter facility. As of March 31, 2008, the reserves related to this facility and the removal of its remaining equipment totaled approximately $4.0 million. Based on current information, we believe this reserve is adequate to satisfy our environmental liabilities at this facility.
Environmental and safety certifications
Eight of our facilities in the United States, Europe and Asia are certified to ISO 14001 standards. ISO 14001 is a globally recognized, voluntary program that focuses on the implementation, maintenance and continual improvement of an environmental management system and the improvement of environmental performance. Two facilities in Europe are certified to ISO 18000 standards.
Quality Systems
We utilize a global strategy for quality management systems, policies and procedures, the basis of which is the ISO 9001:2000 standard, which is a worldwide recognized quality standard. We believe in the principles of
this standard and reinforce this by requiring mandatory compliance for all manufacturing, sales and service locations that are registered to the ISO 9001 standard. This strategy enables us to provide effective products and services to meet our customers’ needs.
Available Information
We file annual, quarterly and current reports, proxy statements and other information with the Securities and Exchange Commission (the “SEC”). These filings are available to the public on the Internet at the SEC’s website at http://www.sec.gov. You may also read and copy any document we file with the SEC at the SEC’s public reference room, located at 100 F Street, N.E., Room 1580, Washington, D.C. 20549. Please call the SEC at 1-800-SEC-0330 for further information on the public reference room.
Our Internet address is http://www.enersys.com. We make available free of charge on http://www.enersys.com our annual, quarterly and current reports, and amendments to those reports, as soon as reasonably practical after we electronically file such material with, or furnish it to, the SEC.
ITEM 1A. RISK FACTORS
The following risks and uncertainties, as well as others described in this Annual Report on Form 10-K, could materially and adversely affect our business, results of operations and financial conditions and could cause actual results to differ materially from our expectations and projections. Stockholders are cautioned that these and other factors, including those beyond our control, may affect future performance and cause actual results to differ from those which may, from time to time, be anticipated. There may be additional risks that are not presently material or known. See “Cautionary Note Regarding Forward-Looking Statements.” All forward-looking statements made by us or on our behalf are qualified by the risks described below.
We operate in an extremely competitive industry and are subject to continual pricing pressure.
We compete with a number of major international manufacturers and distributors, as well as a large number of smaller, regional competitors. Due to excess capacity in some sectors of our industry, consolidation among industrial battery purchasers and the financial difficulties being experienced by several of our competitors, we have been subjected to continual and significant pricing pressures. These pricing pressures have prevented us from fully passing increased material costs through to customers. We anticipate heightened competitive pricing pressure as Chinese and other foreign producers, able to employ labor at significantly lower costs than producers in the U.S. and Western Europe, expand their export capacity and increase their marketing presence in our major U.S. and European markets. Several of our competitors have strong technical, marketing, sales, manufacturing, distribution and other resources, as well as significant name recognition, established positions in the market and long-standing relationships with original equipment manufacturers and other customers. In addition, certain of our competitors own lead smelting facilities which, during periods of lead cost increases or price volatility, may provide a competitive pricing advantage and reduce their exposure to volatile raw material costs. Our ability to maintain and improve our operating margins has depended, and continues to depend, on our ability to control and reduce our costs. We cannot assure you that we will be able to continue to reduce our operating expenses, to raise or maintain our prices or increase our unit volume, in order to maintain or improve our operating results.
Cyclical industry conditions of our customers have adversely affected and may continue to adversely affect our results of operations.
Our operating results are affected by the general cyclical pattern of the industries in which our major customer groups operate and the overall economic conditions in which we and our customers operate. Both our reserve power and motive power segments are heavily dependent on the end-user markets they serve, such as telecommunications, UPS and electric industrial forklift trucks. A weak capital expenditure environment in these markets has had, and can be expected to have, a material adverse effect on our results of operations.
Our raw materials costs are volatile and expose us to significant movements in our product costs.
We use significant amounts of lead, plastics, steel, copper and other materials in our manufacturing processes. We estimate that raw material costs account for over half of our cost of goods sold. Lead is our most significant raw material. The costs of these raw materials, particularly lead, are volatile and beyond our control.
Volatile raw material costs can significantly affect our operating results and make period-to-period comparisons extremely difficult. We cannot assure you that we will be able to hedge the costs of our raw material requirements at a reasonable level or pass on to our customers the increased costs of our raw materials.
Our operations expose us to the risk of material environmental, health and safety liabilities, costs, and litigation.
In the manufacture of our products throughout the world, we process, store, dispose of and otherwise use large amounts of hazardous materials, especially lead and acid. As a result, we are subject to extensive and changing environmental, health and safety laws and regulations governing, among other things: the generation, handling, storage, use, transportation and disposal of hazardous materials; remediation of polluted ground or water; emissions or discharges of hazardous materials into the ground, air or water; and the health and safety of our employees. Compliance with these laws and regulations results in ongoing costs. Failure to comply with these laws or regulations, or to obtain or comply with required environmental permits, could result in fines, criminal charges or other sanctions by regulators. From time to time we have had instances of alleged or actual noncompliance that have resulted in the imposition of fines, penalties and required corrective actions. Our ongoing compliance with environmental, health and safety laws, regulations and permits could require us to incur significant expenses, limit our ability to modify or expand our facilities or continue production and require us to install additional pollution control equipment and make other capital improvements. In addition, private parties, including current or former employees, could bring personal injury or other claims against us due to the presence of, or exposure to, hazardous substances used, stored or disposed of by us or contained in our products.
Certain environmental laws assess liability on owners or operators of real property for the cost of investigation, removal or remediation of hazardous substances at their current or former properties or at properties at which they have disposed of hazardous substances. These laws may also assess costs to repair damage to natural resources. We may be responsible for remediating damage to our properties that was caused by former owners. Soil and groundwater contamination has occurred at some of our current and former properties and may occur or be discovered at other properties in the future. We are currently investigating and monitoring soil and groundwater contamination at certain of our properties, and we may be required to conduct these operations at other properties in the future. In addition, we have been and in the future may be liable to contribute to the cleanup of locations owned or operated by other persons to which we or our predecessor companies have sent wastes for disposal, pursuant to federal and other environmental laws. Under these laws, the owner or operator of contaminated properties and companies that generated, disposed of or arranged for the disposal of wastes sent to a contaminated disposal facility can be held jointly and severally liable for the investigation and cleanup of such properties, regardless of fault.
We cannot assure you that we have been or at all times will be in compliance with environmental laws and regulations or that we will not be required to expend significant funds to comply with, or discharge liabilities arising under, environmental laws, regulations and permits, or that we will not be exposed to material environmental, health or safety litigation.
Legislation regarding the restriction of the use of certain hazardous substances in electrical and electronic equipment.
The European Union has directed that new electrical and electronic equipment not contain certain hazardous substances, including lead and cadmium. Because battery accessories and chargers are subject to this directive, our compliance with the directive directly impacts our manufacturing of these products and could cause certain
of our existing inventory to be obsolete. In addition, certain other jurisdictions outside the European Union have implemented, or plan to implement, similar restrictions with various compliance dates. We cannot assure you that we will meet all restrictions by each of the required dates. Inventory obsolescence and our failure to comply could each have an adverse effect on our financial results.
We are exposed to exchange rate risks, and our net income and financial condition may suffer due to currency translations.
We invoice foreign sales and service transactions in local currencies and translate net sales using actual exchange rates during the period. We translate our non-U.S. assets and liabilities into U.S. dollars using current rates as of the balance sheet date. Because a significant portion of our revenues and expenses are denominated in foreign currencies, changes in exchange rates between the U.S. dollar and foreign currencies, primarily the euro and British pound, may adversely affect our revenue, cost of revenue and operating margins. For example, foreign currency depreciation against the U.S. dollar will reduce the value of our foreign revenues and operating earnings as well as reduce our net investment in foreign subsidiaries. Over 60% of net sales were generated outside of North America.
Most of the risk of fluctuating foreign currencies is in our Europe operations, which comprised over half of our net sales during the last two fiscal years. The euro is the dominant currency in our European operations.
The translation impact from currency fluctuations on net sales and operating earnings in the Americas and Asia regions is minimal, as a substantial majority of these net sales and operating earnings are in dollars or are closely correlated to the dollar.
Foreign currency depreciation will make it more expensive for our non-U.S. subsidiaries to purchase certain of our raw material commodities that are priced globally in U.S. dollars, while the related revenue will decrease when translated to U.S. dollars. Significant movements in foreign exchange rates can have a material impact on our results of operations and financial condition. We periodically engage in hedging of our foreign currency exposure, but cannot assure you that we can successfully hedge all of our foreign currency exposure or do so at a reasonable cost.
Our international operations may be adversely affected by actions taken by foreign governments or other forces or events over which we may have no control.
We currently have significant manufacturing and distribution facilities outside of the U.S., including in the United Kingdom, France, Germany, China, Mexico, Poland, Czech Republic, Spain, Italy and Bulgaria. We may face political instability and economic uncertainty, cultural and religious differences and difficult labor relations in our foreign operations. We also may face barriers in the form of long-standing relationships between potential customers and their existing suppliers, national policies favoring domestic manufacturers and protective regulations including exchange controls, restrictions on foreign investment or the repatriation of profits or invested capital, changes in export or import restrictions and changes in the tax system or rate of taxation in countries where we do business. We cannot assure you that we will be able to successfully develop and expand our international operations and sales or that we will be able to overcome the significant obstacles and risks of our international operations.
Our failure to introduce new products and product enhancements and broad market acceptance of new technologies introduced by our competitors could adversely affect our business.
Many new energy storage technologies have been introduced over the past several years. In addition, recent advances in fuel cell and flywheel technology have been introduced for use in selected applications that compete with the end uses for industrial batteries. For certain important and growing markets, such as aerospace & defense, lithium-based battery technologies have large and growing market share. Our ability to achieve significant and
sustained penetration of key developing markets, including aerospace & defense, will depend upon our success in developing or acquiring these and other technologies, either independently, through joint ventures or through acquisitions. If we fail to develop or acquire, and manufacture and sell, products that satisfy our customers’ demands, or we fail to respond effectively to new product announcements by our competitors by quickly introducing competitive products, then market acceptance of our products could be reduced and our business could be adversely affected. We cannot assure you that our lead-acid products will remain competitive with products based on new technologies.
We may not be able to adequately protect our proprietary intellectual property and technology.
We rely on a combination of copyright, trademark, patent and trade secret laws, non-disclosure agreements and other confidentiality procedures and contractual provisions to establish, protect and maintain our proprietary intellectual property and technology and other confidential information. Certain of these technologies, especially in thin-plate pure-lead—TPPL—technology, are important to our business and are not protected by patents. Despite our efforts to protect our proprietary intellectual property and technology and other confidential information, unauthorized parties may attempt to copy or otherwise obtain and use our intellectual property and proprietary technologies.
Relocation of our customers’ operations could adversely affect our business.
The trend by a number of our North American and Western European customers to move manufacturing operations and expand their businesses into Asia and other low labor-cost markets may have an adverse impact on our business. As our customers in traditional manufacturing-based industries seek to move their manufacturing operations to lower-cost territories, there is a risk that these customers will source their energy storage products from competitors located in those territories and will cease or reduce the purchase of products from our manufacturing plants. We cannot assure you that we will be able to compete effectively with manufacturing operations of energy storage products in those territories, whether by establishing or expanding our manufacturing operations in those lower-cost territories or acquiring existing manufacturers.
We may fail to implement our cost reduction initiatives successfully and improve our profitability.
We must continue to implement cost reduction initiatives to achieve additional cost savings in future periods. We cannot assure you that we will be able to achieve all of the cost savings that we expect to realize from current or future initiatives. In particular, we may be unable to implement one or more of our initiatives successfully or we may experience unexpected cost increases that offset the savings that we achieve. Given the continued competitive pricing pressures experienced in our industry, our failure to realize cost savings would adversely affect our results of operations.
Quality problems with our products could harm our reputation and erode our competitive position.
The success of our business will depend upon the quality of our products and our relationships with customers. In the event that our products fail to meet our customers’ standards, our reputation could be harmed, which would adversely affect our marketing and sales efforts. We cannot assure you that our customers will not experience quality problems with our products.
We offer our products under a variety of brand names, the protection of which is important to our reputation for quality in the consumer marketplace.
We rely upon a combination of trademark, licensing and contractual covenants to establish and protect the brand names of our products. We have registered many of our trademarks in the U.S. Patent and Trademark Office and in other countries. In many market segments, our reputation is closely related to our brand names. Monitoring unauthorized use of our brand names is difficult, and we cannot be certain that the steps we have
taken will prevent their unauthorized use, particularly in foreign countries where the laws may not protect our proprietary rights as fully as in the U.S. We cannot assure you that our brand names will not be misappropriated or utilized without our consent or that such actions will not have a material adverse effect on our reputation and on our results of operations.
We may fail to implement our plans to make acquisitions or successfully integrate them into our operations.
As part of our business strategy, we have grown, and plan to continue growing, by acquiring other product lines, technologies or facilities that complement or expand our existing business. There is significant competition for acquisition targets in the industrial battery industry. We may not be able to identify suitable acquisition candidates or negotiate attractive terms. In addition, we may have difficulty obtaining the financing necessary to complete transactions we pursue. In that regard, our credit facilities restrict the amount of additional indebtedness that we may incur to finance acquisitions and place other restrictions on our ability to make acquisitions. Exceeding any of these restrictions would require the consent of our lenders. We may be unable to successfully integrate any assets, liabilities, customers, systems and management personnel we acquire into our operations and we may not be able to realize related revenue synergies and cost savings within expected time frames. Our failure to execute our acquisition strategy could have a material adverse effect on our business. We cannot assure you that our acquisition strategy will be successful or that we will be able to successfully integrate acquisitions we do make.
Any acquisitions that we complete may dilute your ownership interest in EnerSys, may have adverse effects on our financial condition and results of operations and may cause unanticipated liabilities.
Future acquisitions may involve the issuance of our equity securities as payment, in part or in full, for the businesses or assets acquired. Any future issuances of equity securities would dilute your ownership interests. In addition, future acquisitions might not increase, and may even decrease our earnings or earnings per share and the benefits derived by us from an acquisition might not outweigh or might not exceed the dilutive effect of the acquisition. We also may incur additional debt or suffer adverse tax and accounting consequences in connection with any future acquisitions.
The failure of critical computer systems could seriously affect our sales and operations.
We operate a number of critical computer systems throughout our business that can fail for a variety of reasons. If such a failure were to occur, then we may not be able to sufficiently recover from the failure in time to avoid the loss of data or any adverse impact on certain of our operations that are dependent on such systems. This could result in lost sales and the inefficient operation of our facilities for the duration of such a failure.
Our ability to maintain an adequate credit facility.
Our ability to continue our ongoing business operations and fund future growth depends on our ability to maintain an adequate credit facility and to comply with the financial and other covenants in such credit facility or to secure alternative sources of financing. However, such credit facility or alternate financing may not be available or if available may not be on terms favorable to us.
Our significant indebtedness could adversely affect our financial condition.
As of March 31, 2008, we had $426.8 million of total consolidated debt. This level of debt could:
increase our vulnerability to adverse general economic and industry conditions, including interest rate fluctuations, because a significant portion of our borrowings bear, and will continue to bear, interest at floating rates;
require us to dedicate a substantial portion of our cash flow from operations to debt service payments, which would reduce the availability of our cash to fund working capital, capital expenditures or other general corporate purposes, including acquisitions;
limit our flexibility in planning for, or reacting to, changes in our business and industry;
restrict our ability to introduce new products or new technologies or exploit business opportunities;
place us at a disadvantage compared with competitors that have proportionately less debt;
limit our ability to borrow additional funds in the future, if we need them, due to financial and restrictive covenants in our debt agreements; and
have a material adverse effect on us if we fail to comply with the financial and restrictive covenants in our debt agreements.
This list of factors that may affect future performance is illustrative, but by no means exhaustive. Accordingly, all forward-looking statements should be evaluated with the understanding of their inherent uncertainty.
ITEM 1B. UNRESOLVED STAFF COMMENTS
Not applicable.
ITEM 2.PROPERTIES
Set forth below is certain information, as of June 1, 2008, with respect to our principal properties. The primary function of the listed facilities is manufacturing of industrial batteries, unless otherwise noted.
| | | | | | | | | | | | | | | | | | | | |
| | | Fiscal Year Ended March 31, | |
| | | 2003 | | | 2004 | | | 2005 | | | 2006 | | | 2007 | |
| | | (In thousands, except share and per share data) | |
Consolidated Statement of Operations: | | | | | | | | | | | | | | | | | | | | |
Net sales | | $ | 859,643 | | | $ | 969,079 | | | $ | 1,083,862 | | | $ | 1,283,265 | | | $ | 1,504,474 | |
Cost of goods sold | | | 653,998 | | | | 722,825 | | | | 828,447 | | | | 1,006,467 | | | | 1,193,266 | |
| | | | | | | | | | | | | | | | | | | | |
Gross profit | | | 205,645 | | | | 246,254 | | | | 255,415 | | | | 276,798 | | | | 311,208 | |
| | | | | |
Operating expenses | | | 150,691 | | | | 171,294 | | | | 179,015 | | | | 199,900 | | | | 221,102 | |
Litigation settlement income | | | — | | | | — | | | | — | | | | — | | | | (3,753 | ) |
Charges relating to restructuring, bonuses and uncompleted acquisitions | | | — | | | | 21,147 | | | | — | | | | 8,553 | | | | — | |
| | | | | | | | | | | | | | | | | | | | |
Operating earnings | | | 54,954 | | | | 53,813 | | | | 76,400 | | | | 68,345 | | | | 93,859 | |
Interest expense | | | 20,511 | | | | 20,343 | | | | 23,275 | | | | 24,900 | | | | 27,733 | |
Charges relating to a settlement agreement, write-off of deferred financing costs and a prepayment penalty | | | — | | | | 30,974 | | | | 6,022 | | | | — | | | | — | |
Other (income), expense net | | | (764 | ) | | | (5,297 | ) | | | (2,639 | ) | | | (1,358 | ) | | | 3,024 | |
| | | | | | | | | | | | | | | | | | | | |
Earnings before income taxes | | | 35,207 | | | | 7,793 | | | | 49,742 | | | | 44,803 | | | | 63,102 | |
Income tax expense | | | 12,355 | | | | 2,957 | | | | 17,359 | | | | 14,077 | | | | 17,892 | |
| | | | | | | | | | | | | | | | | | | | |
Net earnings | | $ | 22,852 | | | $ | 4,836 | | | $ | 32,383 | | | $ | 30,726 | | | $ | 45,210 | |
Series A convertible preferred stock dividends | | | 24,057 | | | | 24,689 | | | | 8,155 | | | | — | | | | — | |
| | | | | | | | | | | | | | | | | | | | |
Net (loss) earnings available to common stockholders | | $ | (1,205 | ) | | $ | (19,853 | ) | | $ | 24,228 | | | $ | 30,726 | | | $ | 45,210 | |
| | | | | | | | | | | | | | | | | | | | |
Net (loss) earnings per share | | | | | | | | | | | | | | | | | | | | |
Basic | | $ | (0.11 | ) | | $ | (1.80 | ) | | $ | 0.67 | | | $ | 0.66 | | | $ | 0.97 | |
Diluted | | | (0.11 | ) | | | (1.80 | ) | | | 0.65 | | | | 0.66 | | | | 0.95 | |
Weighted average shares outstanding | | | | | | | | | | | | | | | | | | | | |
Basic | | | 11,014,421 | | | | 11,014,421 | | | | 36,416,358 | | | | 46,226,582 | | | | 46,539,638 | |
Diluted | | | 11,014,421 | | | | 11,014,421 | | | | 37,046,697 | | | | 46,788,363 | | | | 47,546,240 | |
| | | | | | |
Location | | Function/Products Produced | | Size
(sq. feet utilized) | | Owned/Leased |
Americas: | | | | | | |
Reading, PA | | Worldwide Headquarters | | 109,000 | | Owned |
Warrensburg, MO | | Industrial Batteries | | 376,000 | | Owned |
Hays, KS | | Industrial Batteries | | 351,000 | | Owned |
Sumter, SC | | Distribution Center | | 300,000 | | Owned |
Richmond, KY | | Industrial Batteries | | 277,000 | | Owned/Leased |
Monterrey, Mexico | | Industrial Batteries | | 181,000 | | Owned |
Tijuana, Mexico | | Industrial Batteries | | 156,000 | | Owned |
Ooltewah, TN | | Industrial Batteries | | 100,750 | | Owned |
Richmond, KY | | Distribution Center | | 95,500 | | Owned |
Cleveland, OH | | Motive Power Chargers | | 66,000 | | Owned |
Saddle Brook, NJ | | Distribution Center | | 58,500 | | Leased |
Sumter, SC | | Metal Fabrication | | 52,000 | | Owned |
Horsham, PA | | Industrial Batteries | | 51,400 | | Leased |
Chino, CA | | Distribution Center | | 47,400 | | Leased |
Dallas, TX | | Distribution Center | | 40,000 | | Leased |
Santa Fe Springs, CA | | Distribution Center | | 35,000 | | Leased |
Brampton, Canada | | Distribution Center | | 30,400 | | Leased |
Burr Ridge, IL | | Distribution Center | | 25,500 | | Leased |
Norcross, GA | | Distribution Center | | 23,600 | | Leased |
Kansas City, MO | | Distribution Center | | 19,700 | | Leased |
Union City, CA | | Distribution Center | | 17,400 | | Leased |
Warrington, PA | | Distribution Center | | 15,000 | | Leased |
Warwick, RI | | Design Center | | 4,000 | | Leased |
| | | |
Europe: | | | | | | |
Zurich, Switzerland | | European Headquarters | | 2,500 | | Leased |
Arras, France | | Industrial Batteries | | 486,000 | | Owned |
Targovishte, Bulgaria | | Industrial Batteries | | 483,000 | | Owned |
Newport, Wales | | Industrial Batteries | | 233,000 | | Owned |
Bielsko-Biala, Poland | | Industrial Batteries | | 220,000 | | Leased |
Montecchio, Italy | | Industrial Batteries | | 207,000 | | Leased |
Hagen, Germany | | Industrial Batteries | | 185,000 | | Owned |
Herstal, Belgium | | Distribution Center | | 58,700 | | Leased |
Zwickau, Germany | | Industrial Batteries | | 57,000 | | Leased |
Zamudio, Spain | | Industrial Battery Assembly and Distribution | | 55,000 | | Owned |
Brussels, Belgium | | Distribution Center | | 45,000 | | Leased |
Manchester, England | | Distribution Center and Administrative Offices | | 42,600 | | Leased |
Brebieres, France | | Industrial Battery Chargers | | 41,000 | | Leased |
Yverdon-les-Bains, Switzerland | | Distribution Center | | 40,000 | | Leased |
Hostimice, Czech Republic | | Metal Fabrication | | 29,000 | | Owned/Leased |
| | | |
Asia: | | | | | | |
Shenzhen, China | | Industrial Batteries/Asia Headquarters | | 176,000 | | Owned/Leased |
Jiangsu, China | | Industrial Batteries | | 160,000 | | Owned |
Shantou, China | | Industrial Batteries | | 59,000 | | Owned |
Sydney, Australia | | Industrial Battery Assembly and Distribution | | 13,000 | | Leased |
| | | | | | | | | | | | | | | | | | | | |
| | | Fiscal Year Ended March 31, | |
| | | 2003 | | | 2004 | | | 2005 | | | 2006 | | | 2007 | |
| | | (In thousands) | |
Consolidated cash flow data: | | | | | | | | | | | | | | | | | | | | |
Net cash provided by operating activities | | $ | 55,438 | | | $ | 39,192 | | | $ | 29,353 | | | $ | 42,872 | | | $ | 72,424 | |
Net cash used in investing activities | | | (12,923 | ) | | | (26,981 | ) | | | (28,991 | ) | | | (76,876 | ) | | | (49,052 | ) |
Net cash (used in) provided by financing activities | | | (8,209 | ) | | | (39,989 | ) | | | 3,213 | | | | 27,905 | | | | (1,323 | ) |
Other operating data: | | | | | | | | | | | | | | | | | | | | |
Capital expenditures | | $ | 23,623 | | | $ | 28,580 | | | $ | 31,828 | | | $ | 39,665 | | | $ | 42,355 | |
| |
| | | As of March 31, | |
| | | 2003 | | | 2004 | | | 2005 | | | 2006 | | | 2007 | |
| | | (In thousands) | |
Balance Sheet Data: | | | | | | | | | | | | | | | | | | | | |
Cash and cash equivalents | | $ | 44,296 | | | $ | 17,207 | | | $ | 21,341 | | | $ | 15,217 | | | $ | 37,785 | |
Working capital | | | 135,356 | | | | 135,320 | | | | 182,177 | | | | 211,434 | | | | 276,252 | |
Total assets | | | 1,075,808 | | | | 1,153,943 | | | | 1,194,761 | | | | 1,263,948 | | | | 1,409,013 | |
Total debt, including capital leases | | | 252,162 | | | | 511,303 | | | | 375,457 | | | | 402,490 | | | | 402,311 | |
Total stockholders’ equity | | $ | 465,747 | | | $ | 239,302 | | | $ | 437,650 | | | $ | 445,188 | | | $ | 542,099 | |
In fiscal 2007, we settled two litigation matters. As a result of these settlements, we recorded litigation settlement income, net of related legal fees and expenses, of $3.8 million.
ITEM 7. | MANAGEMENT’S DISCUSSION AND ANALYSIS OF FINANCIAL CONDITION AND RESULTS OF OPERATIONS |
The following discussion and analysis of our results of operations and financial condition for the fiscal years ended March 31, 2005, 2006, and 2007, should be read in conjunction with Selected Consolidated Financial Data and our audited consolidated financial statements and the notes to those statements. Our discussion contains forward-looking statements based upon current expectations that involve risks and uncertainties, such as our plans, objectives, opinions, expectations, anticipations and intentions and beliefs. Actual results and the timing of events could differ materially from those anticipated in those forward-looking statements as a result of a number of factors. See “Cautionary Note Regarding Forward-Looking Statements” and “Business” sections elsewhere in this Report on Form 10-K. In the following discussion and analysis of results of operations and financial condition, certain financial measures may be considered “non-GAAP financial measures” under Securities and Exchange Commission rules. These rules require supplemental explanation and reconciliation, which is provided in this Annual Report on Form 10-K. EnerSys’ management uses the non-GAAP measures, EBITDA and Adjusted EBITDA, in their computation of compliance with loan covenants. These measures, as used by EnerSys, adjust net earnings determined in accordance with GAAP for interest, taxes, depreciation and amortization, and certain charges or credits as permitted by our credit agreements, that were recorded during the periods presented. EnerSys’ management uses the non-GAAP measures, Primary Working Capital and primary working capital percentage (see definition in “Liquidity and Capital Resources” below) along with capital expenditures, in their evaluation of business segment cash flow and financial position performance. These disclosures should not be viewed as a substitute for net earnings determined in accordance with GAAP, nor are they necessarily comparable to non-GAAP performance measures that may be presented by other companies.
Overview
We are the world’s largest manufacturer, marketer and distributor of industrial batteries. We also manufacture, market and distribute related products such as chargers, power equipment and battery accessories, and we provide related after-market and customer-support services for industrial batteries. We market and sell our products globally in more than 100 countries to over 10,000 customers through a network of distributors, independent representatives and an internal sales force.
We have two business segments: reserve power and motive power. Revenue and expense classifications by segment are as follows:
From time to time, we are involved in litigation incidental to the conduct of our business. We do not expect that any of this litigation, individually or in the aggregate, will have a material adverse effect on our financial condition, results of operations or cash flow.
Reserve powerITEM 4.products are used for backup power for the continuous operation of critical applications in telecommunications systems, uninterruptible power systems, or UPS, applications for computer and computer-controlled systems, and other specialty power applications, including security systems, for premium starting, lighting and ignition applications, switchgear and electrical control systems used in electric utilities and energy pipelines, and commercial and military aircraft, submarines and tactical military vehicles. | Motive powerSUBMISSION OF MATTERS TO A VOTE OF SECURITY HOLDERSproducts are used to provide power for manufacturing, warehousing and other material handling equipment, primarily electric industrial forklift trucks, mining equipment, and for diesel locomotive starting, rail car lighting and rail signaling equipment.We evaluate business segment performance based primarily upon operating earnings, exclusive of highlighted items. All corporate and centrally incurred regional costs are allocated to the business segments based principally on net sales. We evaluate business segment cash flow and financial position performance based primarily upon capital expenditures and primary working capital levels. Primary working capital for this purpose is trade accounts receivable, plus inventories, minus trade accounts payable and the resulting net amount is divided by the trailing three month net sales (annualized) for the respective business segment or reporting location, to derive a primary working capital percentage. Although we monitor the three elements of primary working capital (receivables, inventory and payables), our primary focus is on the total amount and percentage due to the significant impact it has on cash flow and, as a result, our level of debt.
We operate and manage our business in three primary geographic regions of the world—the Americas, Europe and Asia. Our business is highly decentralized with manufacturing locations throughout the world. Nearly 60% of our net sales for fiscal 2005, 2006 and 2007 were generated outside of North America. More than half of our manufacturing capacity is located outside of the U.S. Our management structure and financial reporting systems, and associated internal controls and procedures, are all consistent with our two business segments and three geographic regions in which we operate. We report on a March 31 fiscal year.
Our financial results are largely driven by the following factors:
|
No matters were submitted to the vote of stockholders through the solicitation of proxies or otherwise during the fiscal quarter ended March 31, 2008.
PART II
| ITEM 5. | MARKET FOR REGISTRANT’S COMMON EQUITY, RELATED STOCKHOLDER MATTERSAND ISSUER PURCHASES OF EQUITY SECURITIES |
Market Information
The Company’s common stock has been listed on the New York Stock Exchange under the symbol “ENS” since it began trading on July 30, 2004. Prior to that time, there had been no public market for our common stock. The following table sets forth, on a per share basis for the periods presented, the range of high, low and closing prices of the Company’s common stock.
| | | | | | | | | |
Quarter Ended | | High Price | | Low Price | | Closing Price |
July 1, 2007 | | $ | 19.15 | | $ | 16.29 | | $ | 18.30 |
September 30, 2007 | | $ | 19.46 | | $ | 17.50 | | $ | 17.77 |
December 30, 2007 | | $ | 24.81 | | $ | 17.55 | | $ | 24.45 |
March 31, 2008 | | $ | 27.72 | | $ | 22.13 | | $ | 23.92 |
| | | |
July 2, 2006 | | $ | 21.46 | | $ | 12.06 | | $ | 20.90 |
October 1, 2006 | | $ | 20.77 | | $ | 16.04 | | $ | 16.04 |
December 31, 2006 | | $ | 18.57 | | $ | 15.20 | | $ | 16.00 |
March 31, 2007 | | $ | 17.50 | | $ | 15.97 | | $ | 17.18 |
Holders of Record
As of June 1, 2008, there were approximately 281 record holders of common stock of the Company. Because many of such shares are held by brokers and other institutions on behalf of stockholders, the Company is unable to estimate the total number of stockholders represented by these record holders.
Dividends
We never have paid or declared any cash dividends on our common stock, and we have certain restrictions from doing so by our senior secured credit agreement. We currently intend to retain any earnings for future growth and, therefore, do not expect to pay any cash dividends in the foreseeable future.
Recent Sales of Unregistered Securities
During the three fiscal years ended March 31, 2008, we did not issue any unregistered securities.
Purchases of Equity Securities by the Issuer and Affiliated Purchasers
The following table summarizes the number of common shares we purchased during the fourth fiscal quarter of 2008 from participants in our equity incentive plans. As provided by such plans, vested options outstanding may be exercised through surrender to the Company of option shares or vested options outstanding under the Plan to satisfy the applicable aggregate exercise price (and any withholding tax) required to be paid upon such exercise.
Purchases of Equity Securities
| | | | | | | | | |
Period | | (a)
Total number
of shares (or
units)
purchased | | (b)
Average price
paid per share
(or unit) | | (c)
Total number of
shares (or units)
purchased as part of
publicly announced
plans or programs | | (d)
Maximum number
(or approximate
dollar value) of shares
(or units) that may be
purchased under the
plans or programs |
December 31, 2007-January 27, 2008 | | 28,585 | | $ | 25.43 | | — | | — |
January 28, 2008-February 24, 2008 | | — | | | — | | — | | — |
February 25, 2008-March 31, 2008 | | — | | | — | | — | | — |
| | | | | | | | | |
Total | | 28,585 | | $ | 25.43 | | — | | — |
| | | | | | | | | |
STOCK PERFORMANCE GRAPH
The following graph compares the changes in cumulative total returns on EnerSys’ common stock with the changes in cumulative total returns of the New York Stock Exchange Composite Index, a broad equity market index, and the total return on a selected peer group index. The peer group selected is based on the standard industrial classification codes (“SIC Codes”) established by the U.S. government. The index chosen was “Miscellaneous Electrical Equipment and Suppliers” and comprises all publically traded companies having the same three-digit SIC Code (369) as EnerSys. The constituent companies are: Active Power Inc, Advanced Battery Technologies Inc., Axion Power International, Inc., C & D Technologies Inc., China BAK Battery Inc., Cooper Industries Limited, Cymer Inc., Electro Energy Inc., Ener1 Inc., Energizer Holdings Inc., Energy Conversion Devices Inc., Excel Technology Inc., Exide Technologies, Greatbatch Inc., Hoko Scientific Inc., Hybrid Technology Inc., Hydrogen Corp., Komag Inc., Lifestyle Innovations Inc., Lithium Technology Corp., Manhattan Scientifics Inc., Millenium Cell Inc., Motorcar Parts of America, Oak Ridge Micro Energy Inc., Power Technology Inc., Rofin Sinar Technologies, Satcon Technology Corp., Save the World Aircraft, Inc., Spectrum Brands Inc., Standard Motor Products, Inc., TNR Technical Inc., Trans Max Technologies Inc., Turbine Truck Engines Inc., Ultralife Batteries Inc., Valence Technology Inc., Wonder Auto Technology Inc. and Zareba Systems Inc. The peer group data points are weighted by market capitalization of the constituent companies.
The graph was prepared assuming that $100 was invested in EnerSys’ common stock, the New York Stock Exchange Composite Index and the peer group on July 30, 2004.
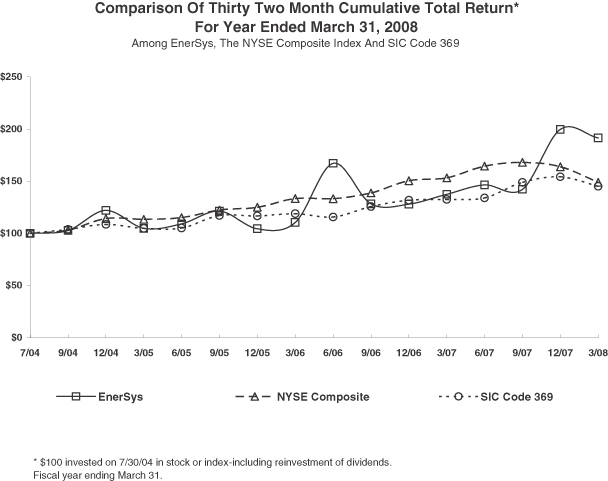
general cyclical patterns of the industries in which our customers operate;
| ITEM 6. | SELECTED FINANCIAL DATA |
The following tables set forth certain selected consolidated financial and operating data. The selected consolidated financial data presented below for the years ended March 31, 2008, 2007 and 2006, and as of March 31, 2008 and 2007, are derived from our audited consolidated financial statements included elsewhere in this Form 10-K. The selected consolidated financial data presented below for the years ended March 31, 2005 and 2004, and as of March 31, 2006, 2005 and 2004, are derived from our audited consolidated financial statements not included in this Form 10-K. This information should be read in conjunction with the consolidated financial statements and the related notes thereto, and Management’s Discussion and Analysis of Results of Operations and Financial Condition, each included elsewhere, herein.
| | | | | | | | | | | | | | | | | | | |
| | | Fiscal Year Ended March 31, | |
| | | 2008 | | 2007 | | | 2006 | | | 2005 | | | 2004 | |
| | | (In thousands, except share and per share data) | |
Consolidated Statement of Operations: | | | | | | | | | | | | | | | | | | | |
Net sales | | $ | 2,026,640 | | $ | 1,504,474 | | | $ | 1,283,265 | | | $ | 1,083,862 | | | $ | 969,079 | |
Cost of goods sold | | | 1,644,753 | | | 1,193,266 | | | | 1,006,467 | | | | 828,447 | | | | 722,825 | |
| | | | | | | | | | | | | | | | | | | |
Gross profit | | | 381,887 | | | 311,208 | | | | 276,798 | | | | 255,415 | | | | 246,254 | |
| | | | | |
Operating expenses | | | 249,350 | | | 221,102 | | | | 199,900 | | | | 179,015 | | | | 171,294 | |
Litigation settlement income | | | — | | | (3,753 | ) | | | — | | | | — | | | | — | |
Charges relating to restructuring, bonuses and abandoned acquisitions | | | 13,191 | | | — | | | | 8,553 | | | | — | | | | 21,147 | |
| | | | | | | | | | | | | | | | | | | |
Operating earnings | | | 119,346 | | | 93,859 | | | | 68,345 | | | | 76,400 | | | | 53,813 | |
Interest expense | | | 28,917 | | | 27,733 | | | | 24,900 | | | | 23,275 | | | | 20,343 | |
Charges relating to a settlement agreement, write-off of deferred financing costs and a prepayment penalty | | | — | | | — | | | | — | | | | 6,022 | | | | 30,974 | |
Other (income), expense net | | | 4,234 | | | 3,024 | | | | (1,358 | ) | | | (2,639 | ) | | | (5,297 | ) |
| | | | | | | | | | | | | | | | | | | |
Earnings before income taxes | | | 86,195 | | | 63,102 | | | | 44,803 | | | | 49,742 | | | | 7,793 | |
Income tax expense | | | 26,499 | | | 17,892 | | | | 14,077 | | | | 17,359 | | | | 2,957 | |
| | | | | | | | | | | | | | | | | | | |
Net earnings | | $ | 59,696 | | $ | 45,210 | | | $ | 30,726 | | | $ | 32,383 | | | $ | 4,836 | |
Series A convertible preferred stock dividends | | | — | | | — | | | | — | | | | 8,155 | | | | 24,689 | |
| | | | | | | | | | | | | | | | | | | |
Net earnings (loss) available to common stockholders | | $ | 59,696 | | $ | 45,210 | | | $ | 30,726 | | | $ | 24,228 | | | $ | (19,853 | ) |
| | | | | | | | | | | | | | | | | | | |
Net earnings (loss) per share | | | | | | | | | | | | | | | | | | | |
Basic | | $ | 1.25 | | $ | 0.97 | | | $ | 0.66 | | | $ | 0.67 | | | $ | (1.80 | ) |
Diluted | | | 1.22 | | | 0.95 | | | | 0.66 | | | | 0.65 | | | | (1.80 | ) |
Weighted average shares outstanding | | | | | | | | | | | | | | | | | | | |
Basic | | | 47,645,225 | | | 46,539,638 | | | | 46,226,582 | | | | 36,416,358 | | | | 11,014,421 | |
Diluted | | | 48,644,450 | | | 47,546,240 | | | | 46,788,363 | | | | 37,046,697 | | | | 11,014,421 | |
| | | | | | | | | | | | | | | | | | | | |
| | | Fiscal Year Ended March 31, | |
| | | 2008 | | | 2007 | | | 2006 | | | 2005 | | | 2004 | |
| | | (In thousands) | |
Consolidated cash flow data: | | | | | | | | | | | | | | | | | | | | |
Net cash provided by operating activities | | $ | 4,018 | | | $ | 72,424 | | | $ | 42,872 | | | $ | 29,353 | | | $ | 39,192 | |
Net cash used in investing activities | | | (62,150 | ) | | | (49,052 | ) | | | (76,876 | ) | | | (28,991 | ) | | | (26,981 | ) |
Net cash provided by (used in) financing activities | | | 39,558 | | | | (1,323 | ) | | | 27,905 | | | | 3,213 | | | | (39,989 | ) |
Other operating data: | | | | | | | | | | | | | | | | | | | | |
Capital expenditures | | $ | 45,037 | | | $ | 42,355 | | | $ | 39,665 | | | $ | 31,828 | | | $ | 28,580 | |
| |
| | | As of March 31, | |
| | | 2008 | | | 2007 | | | 2006 | | | 2005 | | | 2004 | |
| | | (In thousands) | |
Balance Sheet Data: | | | | | | | | | | | | | | | | | | | | |
Cash and cash equivalents | | $ | 20,620 | | | $ | 37,785 | | | $ | 15,217 | | | $ | 21,341 | | | $ | 17,207 | |
Working capital | | | 389,480 | | | | 276,252 | | | | 211,434 | | | | 182,177 | | | | 135,320 | |
Total assets | | | 1,710,790 | | | | 1,409,013 | | | | 1,263,948 | | | | 1,194,761 | | | | 1,153,943 | |
Total debt, including capital leases | | | 426,754 | | | | 402,311 | | | | 402,490 | | | | 375,457 | | | | 511,303 | |
Total stockholders’ equity | | $ | 691,543 | | | $ | 542,099 | | | $ | 445,188 | | | $ | 437,650 | | | $ | 239,302 | |
| ITEM 7. | MANAGEMENT’S DISCUSSION AND ANALYSIS OF FINANCIAL CONDITION AND RESULTS OF OPERATIONS |
The following discussion and analysis of our results of operations and financial condition for the fiscal years ended March 31, 2008, 2007, and 2006, should be read in conjunction with our audited consolidated financial statements and the notes to those statements included in Item 8, Financial Statements and Supplementary Data, of this Annual Report on Form 10-K. Our discussion contains forward-looking statements based upon current expectations that involve risks and uncertainties, such as our plans, objectives, opinions, expectations, anticipations and intentions and beliefs. Actual results and the timing of events could differ materially from those anticipated in those forward-looking statements as a result of a number of factors. See “Cautionary Note Regarding Forward-Looking Statements,” “Business” and “Risk Factors,” sections elsewhere in this Annual Report on Form 10-K. In the following discussion and analysis of results of operations and financial condition, certain financial measures may be considered “non-GAAP financial measures” under Securities and Exchange Commission rules. These rules require supplemental explanation and reconciliation, which is provided in this Annual Report on Form 10-K.
EnerSys’ management uses the non-GAAP measures, EBITDA and Adjusted EBITDA, in their computation of compliance with loan covenants. These measures, as used by EnerSys, adjust net earnings determined in accordance with GAAP for interest, taxes, depreciation and amortization, and certain charges or credits as permitted by our credit agreements, that were recorded during the periods presented.
EnerSys’ management uses the non-GAAP measures, Primary Working Capital and Primary Working Capital Percentage (see definition in “Liquidity and Capital Resources” below) along with capital expenditures, in their evaluation of business segment cash flow and financial position performance.
These non-GAAP disclosures have limitations as analytical tools, should not be viewed as a substitute for cash flow or operating earnings determined in accordance with GAAP, and should not be considered in isolation or as a substitute for analysis of the Company’s results as reported under GAAP, nor are they necessarily comparable to non-GAAP performance measures that may be presented by other companies. This supplemental presentation should not be construed as an inference that the Company’s future results will be unaffected by similar adjustments to operating earnings determined in accordance with GAAP.
Overview
We are the world’s largest manufacturer, marketer and distributor of industrial batteries. We also manufacture, market and distribute related products such as chargers, power equipment and battery accessories, and we provide related after-market and customer-support services for industrial batteries. We market and sell our products globally in more than 100 countries to over 10,000 customers through a network of distributors, independent representatives and an internal sales force.
We have two business segments: reserve power and motive power. Revenue and expense classifications by segment are as follows:
Reserve powerproducts are used for backup power for the continuous operation of critical applications in telecommunications systems, in uninterruptible power systems, or UPS, applications for computer and computer-controlled systems, in other specialty power applications, including security systems, for premium starting, lighting and ignition applications, in switchgear and electrical control systems used in electric utilities and energy pipelines, and in commercial and military aircraft, submarines and tactical military vehicles.
Motive powerproducts are used to provide power for manufacturing, warehousing and other material handling equipment, primarily electric industrial forklift trucks, mining equipment, and for diesel locomotive starting, rail car lighting and rail signaling equipment.
We evaluate business segment performance based primarily upon operating earnings, exclusive of highlighted items. All corporate and centrally incurred regional costs are allocated to the business segments based principally on net sales. We evaluate business segment cash flow and financial position performance based primarily upon capital expenditures and primary working capital levels. Primary working capital for this purpose is trade accounts receivable, plus inventories, minus trade accounts payable and the resulting net amount is divided by the trailing three month net sales (annualized) for the respective business segment or reporting location, to derive a primary working capital percentage. Although we monitor the three elements of primary working capital (receivables, inventory and payables), our primary focus is on the total amount and percentage due to the significant impact it has on cash flow and, as a result, our level of debt.
We operate and manage our business in three primary geographic regions of the world—the Americas, Europe and Asia. Our business is highly decentralized with manufacturing locations throughout the world. Approximately 60% of our net sales for fiscal 2008, 2007 and 2006, were generated outside of North America. More than half of our manufacturing capacity is located outside of the U.S. Our management structure and financial reporting systems, and associated internal controls and procedures, are all consistent with our two business segments and three geographic regions in which we operate. We report on a March 31 fiscal year.
Our financial results are largely driven by the following factors:
general cyclical patterns of the industries in which our customers operate;
changes in our market share in the business segments and regions where we operate;
changes in our selling prices and, in periods when our product costs increase, our ability to raise our selling prices to pass such cost increases through to our customers;
the extent to which we are able to efficiently utilize our global manufacturing facilities and optimize their capacity;
the extent to which we can control our fixed and variable costs, including those for our raw materials, manufacturing and distribution, operating activities;
changes in our levels of debt and changes in the variable interest rates under our credit facilities; and
the size and number of acquisitions and our ability to achieve their intended benefits.
Over the last four fiscal years, the costs of our raw materials (of which lead is our primary material) have risen significantly. Our estimated incremental lead cost, due to increased price, was approximately $360 million since fiscal 2004 and, in fiscal 2008 over fiscal 2007, was approximately $222 million.
We have been subjected to continual and significant pricing pressures over the past several years. We anticipate continuing competitive pricing pressure as Chinese and other foreign producers, able to employ labor at significantly lower costs than producers in the U.S. and Western Europe, expand their export capacity and increase their marketing presence in our major U.S. and European markets.
Our selling price increases approximated 2% of net sales for fiscal 2006 and increased net sales by approximately 5% in fiscal 2007 and 14% in fiscal 2008. We announced additional price increases from time to time during the course of fiscal 2008, however, these pricing actions will not be fully realized in our operating results until fiscal 2009.
Our ability to maintain and improve our operating margins has depended, and continues to depend, on our ability to control our costs and obtain appropriate pricing. Our business strategy in this environment of high commodity costs is to improve profitability by cost savings and pricing actions, as well as to tightly control operating cash flow and capital spending.
See “Market and Economic Conditions” below for a further discussion of commodity costs and our ability to offset some of the impact of these rising costs through selling price increases.
changes in our selling prices and, in periods when our product costs increase, our ability to raise our selling prices to pass such cost increases through to our customers;
the extent to which we are able to efficiently utilize our global manufacturing facilities and optimize their capacity;
the extent to which we can control our fixed and variable costs, including those for our raw materials, manufacturing and distribution, operating activities;
changes in our levels of debt and changes in the variable interest rates under our credit facilities; and
the size and number of acquisitions and our ability to achieve their intended benefits.
Over the last three fiscal years, the costs of our raw materials (of which lead is our primary material) have risen significantly. We estimate that our average cost of lead per pound (excluding premiums), as it affects our operating results, has risen from approximately $0.23 in fiscal 2004 to $0.56 in fiscal 2007. Our estimated incremental lead cost, due to increased price, in fiscal 2007 over fiscal 2006 was approximately $71 million. We expect lead prices to rise further in fiscal 2008.
We have been subjected to continual and significant pricing pressures over the past several years. We anticipate continuing competitive pricing pressure as Chinese and other foreign producers, able to employ labor at significantly lower costs than producers in the U.S. and Western Europe, expand their export capacity and increase their marketing presence in our major U.S. and European markets.
Our selling price increases approximated 2% of net sales for both fiscal 2005 and fiscal 2006 and increased net sales by approximately 5% in fiscal 2007. We announced additional price increases from time to time during the course of fiscal 2007, however, these pricing actions will not be fully realized in our operating results until fiscal 2008.
Our ability to maintain and improve our operating margins has depended, and continues to depend, on our ability to control our costs and obtain appropriate pricing. Our business strategy in this environment of high commodity costs is to improve profitability by cost savings and pricing actions, as well as to tightly control operating cash flow and capital spending.
See “Market and Economic Conditions” below for a further discussion of commodity costs and our ability to offset some of the impact of these rising costs through selling price increases.
Our Corporate History
There have been several key stages in the development of our business, which explain to a significant degree our results of operations over the past three years.
We were formed in late 2000 by Morgan Stanley Capital Partners (currently Metalmark Capital), and the management of Yuasa, Inc. to acquire the industrial battery business of Yuasa Corporation (Japan) in North and South America. Our results of operations for the past fivesix fiscal years have been significantly affected by our acquisition of ESGthe reserve power and motive power business of the Energy Storage Group, of Invensys plc. (“ESG”) on March 22, 2002, which more than doubled our size; and to a lesser extent, by the Company’s acquisitionsour acquisition of the motive power battery business of FIAMM, S.p.A. (“FIAMM”) on June 1, 2005, and several smaller acquisitions.
Our successful integration of ESG provided global scale in both the reserve and motive power markets. The ESG acquisition also provided us with a further opportunity to reduce costs and improve operating efficiency that, among other initiatives, led to closing underutilized manufacturing plants, distribution facilities, sales offices and eliminating other redundant costs, including staff. FIAMM complements our existing European motive power business and also provided us with opportunities to reduce costs and improve operating efficiency.
The Company’sOur other recent acquisitions include Gerate- und Akkumulatorwerk Zwickau GmbH (“GAZ”), a Germany-based producer of specialty nickel-based batteries utilized primarily in the energy, rail, telecommunications and uninterruptible power supply (UPS) industries worldwide, on October 11, 2005, Alliant Techsystems’2005; what is now known as EnerSys Advanced Systems Inc. (“EAS”), a USA-based producer of lithium primary battery business (“EAS”)power sources, primarily for aerospace & defense applications on May 18, 2006,2006; the manufacturing facilities of Chaozhou Xuntong Power Source Company Limited (“CFT”), located in Chaoan, China on August 22, 2006,2006; the lead-acid battery business of Leclanché SA (“Leclanché”) based in Yverdon-les-Bains, Switzerland on January 1, 2007,2007; and on May 18, 2007, the Companywe acquired approximately a 97% interest in Energia AD (“Energia”), a producer of industrial batteries, located in Targovishte, Bulgaria.
Our results of operations include ESG for all fiscal years presented. Our results of operations for fiscal 20062008, 2007 and 20072006 include FIAMM, GAZ, EAS, CFT, Leclanché and LeclanchéEnergia from their respective acquisition dates.
In August 2004, EnerSys completed an initial public offering (the “IPO”) and the Company’sour common stock commenced trading on the New York Stock Exchange on July 30, 2004, under the trading symbol “ENS.”
Our historical consolidated financial statements for fiscal 2003 and 2004 show our result of operations as a private company. In fiscal 2005,2008, 2007, 2006 and 2007,2005, the cost of complying with our public company reporting obligations (primarily costs associated with Sarbanes-Oxley Section 404 compliance) was approximately $3$6 million,
$10 $8 million, $10 million and $8$3 million, respectively. The significant increase in fiscal 2006 costs was due primarily to our initial year of compliance with the requirements of Sarbanes-Oxley Section 404.404 of Sarbanes-Oxley.
Critical Accounting Policies and Estimates
The Company’sOur significant accounting policies are described in the notesNotes to the Consolidated Financial Statements in this Form 10-K.
In preparing our financial statements, management is required to make estimates and assumptions that, among other things, affect the reported amounts of assets, liabilities, sales and expense. These estimates and assumptions are most significant where they involve levels of subjectivity and judgment necessary to account for highly uncertain matters or matters susceptible to change, and where they can have a material impact on our financial condition and operating performance. We discuss below the more significant estimates and related assumptions used in the preparation of our consolidated financial statements. If actual results were to differ materially from the estimates made, the reported results could be materially affected.
Revenue Recognition
We recognize revenue when the earnings process is complete. This occurs when we ship in accordance with terms of the underlying agreement, title transfers, collectibility is reasonably assured and pricing is fixed and determinable. Shipment terms to our battery product customers are primarily shipping point or destination and do not differ significantly between our regions of the world. Accordingly revenue is recognized when title is transferred to the customer. Amounts invoiced to customers for shipping and handling are classified as revenue. Taxes on revenue producing transactions are not included in net sales.
We recognize revenue from the service of reserve power and motive power products when the respective services are performed.
Management believes that the accounting estimates related to revenue recognition are critical accounting estimates because they requires reasonable assurance of collection of revenue proceeds and completion of all performance obligations. Also revenues are recorded net of provisions for sales discounts and returns, which are established at the time of sale. These estimates are based on our past experience.
Asset Impairment Determinations
As a result of the adoption of Statement of Financial Accounting Standards No. 142,Goodwill and Other Intangible Assets, goodwill is no longer amortized. The Company testsWe test for the impairment of itsour goodwill and trade names at least annually and whenever events or circumstances occur indicating that a possible impairment has been incurred. The Company utilizesWe utilize financial projections of itsour reporting segments, certain cash flow measures, as well as itsour market capitalization in itsthe determination of the fair value of these assets.
With respect to our other long-lived assets other than goodwill and indefinite lived intangible assets, we are required to test for impairment whenever events or circumstances indicate that the carrying value of an asset may not be recoverable. We apply Statement of Financial Accounting Standards No. 144,Accounting for the Impairment or Disposal of Long-Lived Assets, in order to determine whether or not an asset was impaired. This standard requires an impairment analysis when indicators of impairment are present. If such indicators are present, the standard indicates that if the sum of the future expected cash flows from the asset, undiscounted and
without interest charges, is less than the carrying value, an asset impairment must be recognized in the financial statements. The amount of the impairment is the difference between the fair value of the asset and the carrying value of the asset.
In making future cash flow analyses of goodwill and other long-lived assets, the Company makeswe make assumptions relating to the following:
The intended use of assets and the expected future cash flows resulting directly from such use;
Industry specific economic conditions;
Competitor activities and regulatory initiatives; and
Client and customer preferences and patterns.
We believe that an accounting estimate relating to asset impairment is a critical accounting estimate because the assumptions underlying future cash flow estimates are subject to change from time to time and the recognition of an impairment could have a significant impact on our financial statements.
Litigation and Claims
From time to time the Company has been or may be a party to various legal actions and investigations including, among others, employment matters, compliance with government regulations, federal and state employment laws, including wage and hour laws, contractual disputes and other matters, including matters
arising in the ordinary course of business. These claims may be brought by, among others, the government, clients, customers and employees. Management considers the measurement of litigation reserves as a critical accounting estimate because of the significant uncertainty in some cases relating to the outcome of potential claims or litigation and the difficulty of predicting the likelihood and range of potential liability involved, coupled with the material impact on our results of operations that could result from litigation or other claims. In determining legal reserves, management considers, among other issues:
Interpretation of contractual rights and obligations;
The status of government regulatory initiatives, interpretations and investigations;
The status of settlement negotiations;
Prior experience with similar types of claims;
Whether there is available insurance; and
Advice of outside counsel.
Environmental Loss Contingencies
Accruals for environmental loss contingencies (i.e., environmental reserves) are recorded when it is probable that a liability has been incurred and the amount can reasonably be estimated. Management views the measurement of environmental reserves as a critical accounting estimate because of the considerable uncertainty surrounding estimation, including the need to forecast well into the future. We are involved in legal proceedings under state, federal and local environmental laws in connection with our operations and companies that we have acquired. The estimation of environmental reserves is based on the evaluation of currently available information, prior experience in the remediation of contaminated sites and assumptions with respect to government regulations and enforcement activity, changes in remediation technology and practices, and financial obligations and credit worthiness of other responsible parties and insurers.
Warranty
We record a warranty reserve for possible claims against our product warranties, which generally run for a period of one-one to twenty-years for our reserve power batteries and for a period of one-yearone to seven-years for our motive power batteries. The assessment of the adequacy of the reserve includes a review of open claims and historical experience.
Management believes that the accounting estimate related to the warranty reserve is a critical accounting estimate because the underlying assumptions used for the reserve can change from time to time and warranty claims could potentially have a material impact on our results of operations.
Allowance for Doubtful Accounts
We encounter risks associated with sales and the collection of the associated accounts receivable. We record a provision for accounts receivable that are considered to be uncollectible. In order to calculate the appropriate provision, management analyzes the creditworthiness of specific customers and the aging of customer balances. Management also considers general and specific industry economic conditions, industry concentration and contractual rights and obligations.
Management believes that the accounting estimate related to the allowance for doubtful accounts is a critical accounting estimate because the underlying assumptions used for the allowance can change from time to time and uncollectible accounts could potentially have a material impact on our results of operations.
Inventory Obsolescence
We record an inventory obsolescence reserve for obsolete, excess and slow-moving inventory. In calculating our inventory obsolescence reserve, management analyzes historical data regarding customer demand within specific product categories and makes assumptions regarding economic conditions within customer specific industries, as well as style and product changes. Management believes that its accounting estimate related to inventory obsolescence is a critical accounting estimate because customer demand in certain of our businesses can be variable and changes in our reserve for inventory obsolescence could have a material affect on our results of operations.
Critical accounting estimates and assumptions related to our inventory obsolescence reserve are evaluated periodically as conditions warrant, and changes to such estimates are recorded as new information or changed conditions require revision.
PensionRetirement Plans
We use certain assumptions in the calculation of the actuarial valuation of our defined benefit plans. These assumptions include the weighted average discount rate, rates of increase in compensation levels and expected long-term rates of return of assets. If actual results are less favorable than those projected by us, additional expense may be required.
In September 2006, the FASB issued Statement of Financial Accounting Standards No. 158,Employers’ Accounting for Defined Benefit Pension and Other Postretirement Plans —anPlans—an amendment of FASB No. 87, 88, 106, and 132(R)(“SFAS 158”). SFAS 158 requires an entity to recognize in its statement of financial position an asset for a defined benefit postretirement plan’s overfunded status or a liability for a plan’s underfunded status, measure a defined benefit postretirement plan’s assets and obligation that determine its funded status as of the end of the employer’s fiscal year, and recognize changes in the funded status of a defined benefit postretirement plan in comprehensive income in the year in which the change occurs. The requirement to recognize the funded status of a defined benefit postretirement plan became effective March 31, 2007, and we adopted the recognition requirements as of March 31, 2007.
In connection with the fiscal 2007 adoption of SFAS 158,the Company recorded an additional pension liability of $2.8 million for the remaining underfunded status of our benefit plans at March 31, 2007, with an offsetting amount recorded in accumulated other comprehensive income, net of taxes.
Critical accounting estimates and assumptions related to the actuarial valuation of our defined benefit plans are evaluated periodically as conditions warrant and changes to such estimates are recorded as new information or changed conditions require revision.
Equity-based compensation
We recognize compensation cost relating to equity-based payment transactions in using a fair-value measurement method, in accordance with the revision of FASB Statement No. 123, Share-Based Payment (“SFAS 123(R)”), which we adopted on April 1, 2006. SFAS 123R requires all equity-based payments to employees, including grants of stock options, to be recognized as compensation expense based on fair value over the requisite service period of the awards. We determine the fair value of restricted stock and restricted stock units based on the number of shares granted and the quoted price of our common stock, and the fair value of stock options is determined using the Black-Scholes option-pricing model which uses both historical and current market data to estimate the fair value. This method incorporates various assumptions such as the risk-free interest rate, expected volatility, expected dividend yield and expected life of the options. When estimating the requisite
service period of the awards, we consider expected forfeitures and many related factors including types of awards, employee class, and historical experience. Actual results, and future changes in estimates of the requisite service period may differ substantially from our current estimates.
Income Taxes
Our effective tax rate is based on pretax income, statutory tax rates and tax planning opportunities available in the various jurisdictions in which we operate. We account for income taxes in accordance with SFAS 109 No. 109,Accounting for Income Taxes(“SFAS 109”), which requires that deferred tax assets and liabilities be recognized using enacted tax rates for the effect of temporary differences between book and tax bases on recorded assets and liabilities. SFAS 109 also requires that deferred tax assets be reduced by a valuation allowance, if it is more likely than not that some portion or all of the deferred tax assets will not be recognized.
The recognition and measurement of a tax position is based on management’s best judgment given the facts, circumstances and information available at the reporting date. In accordance withFASB Interpretation No. 48, Accounting for Uncertainty in Income Taxes—an interpretation of FASB Statement No. 109(“FIN 48”), which we adopted on April 1, 2007, we evaluate tax positions to determine whether the benefits of tax positions are more likely than not of being sustained upon audit based on the technical merits of the tax position. For tax positions that are more likely than not of being sustained upon audit, we recognize the largest amount of the benefit that is greater than 50% likely of being realized upon ultimate settlement in the financial statements. For tax positions that are not more likely than not of being sustained upon audit, we do not recognize any portion of the benefit in the financial statements. If the more likely than not threshold is not met in the period for which a tax position is taken, we may subsequently recognize the benefit of that tax position if the tax matter is effectively settled, the statute of limitations expires, or if the more likely than not threshold is met in a subsequent period. (See Note 12 of Notes to Consolidated Financial Statements.)
We evaluate, on a quarterly basis, the reliability of our deferred tax assets by assessing our valuation allowance and by adjusting the amount of such allowance, if necessary. The factors used to assess the likelihood of realization are our forecast of future taxable income and available tax planning strategies that could be implemented to realize the net deferred tax assets.
The Company accounts for income tax contingencies in accordance with the SFAS No. 5,Accounting for Contingencies (“SFAS 5”). The Company is subject to periodic audits of its income tax returns by federal, state and local agencies. In evaluating the exposures associated with our various tax filing positions, including state and local taxes, the Company records reserves for what is identified as probable exposures. A number of years may elapse before a particular matter for which a reserve has been established is audited and fully resolved. The estimate of the Company’s tax contingencies reserve contains uncertainty because management must use judgment to estimate the exposures associated with various tax filing positions. To make these judgments, management makes determinations about the likelihood that the specific taxing authority may challenge the tax deductions that have been taken on the Company’s tax return. Based on information about other tax settlements, the Company estimates amounts that may be settled with taxing authorities in order to conclude audits. To the extent the Company prevailswe prevail in matters for which reserves have been established, or isare required to pay amounts in excess of itsour reserves, itsour effective tax rate in a given financial statement period could be materially affected. An unfavorable tax settlement would require use of the Company’s cash and result in an increase in the effective tax rate in the year of resolution. A favorable tax settlement would be recognized as a reduction in the Company’sour effective tax rate in the year of resolution.
Derivative Financial Instruments
The Company hasWe have entered into interest rate swap agreements and option agreements to manage risk on a portion of itsour long-term floating-rate debt. The Company hasWe have entered into lead forward purchase contracts to manage risk of the cost of lead. The Company hasWe have entered into foreign exchange forward contracts and purchased option contracts to manage risk on foreign currency exposures. The agreements are with major financial institutions, and the Company believeswe believe the risk of nonperformance by the counterparties is negligible. The counterparties to certain of these agreements are lenders under the Credit Agreement and liabilities related to these agreements are covered under the security provisions of the Credit Agreement. The Company doesWe do not hold or issue derivative financial instruments for trading or speculative purposes.FASB Statement No. 133, Accounting for Derivative Instruments and Hedging Activities (“SFAS 133,133”), as amended, establishes accounting and reporting standards for derivative instruments and hedging activities. The Company recognizesWe recognize all derivatives as either assets or liabilities in the accompanying balance sheet and measuresmeasure those instruments at fair value. Changes in the fair value of those instruments are reported in accumulated other comprehensive income if they qualify for hedge accounting or in earnings if they do not qualify for hedge accounting. Derivatives qualify for hedge accounting if they are designated as hedge instruments and if the hedge
is highly effective in achieving offsetting changes in the fair value or cash flow of the asset or liability hedged. Effectiveness is measured on a regular basis using statistical analysis and by comparing the overall changes in the expected cash flows on the lead and foreign currency forward contracts with the changes in the expected all-in cash outflow required for the lead and foreign currency purchases. This analysis is performed quarterly on the initial purchases each month that cover the quantities hedged. Accordingly, gains and losses from changes in derivative fair value are deferred until the underlying transaction occurs. Interest expense on the debt is adjusted to include the payments made or received under such interest rate swap agreements. Inventory and cost of goods sold is adjusted to include the payments made or received under such lead and foreign currency forward contracts. Any deferred gains or losses associated with derivative instruments, which on infrequent occasions may be terminated prior to maturity are recognized in earnings in the period in which the underlying hedged transaction is recognized.terminated. In the event a designated hedged item is sold, extinguished or matures prior to the termination of the related derivative instrument, such instrument would be closed and the resulting gain or loss would be recognized in earnings.
Market and Economic Conditions
Our operating results are directly affected by the general cyclical pattern of the industries in which our major customer groups operate. Both our reserve power and motive power segments are heavily dependent on the end markets they serve, and our results of operations will vary depending on the capital expenditure environment in these markets. In addition, general economic conditions in the U.S. and international markets in which we and our customers operate also affect demand for our products. Sales of our motive power products, for example, depend significantly on demand for new electric industrial forklift trucks, which in turn depends on end-user
demand for additional motive capacity in their distribution and manufacturing facilities. The overall economic conditions in the markets we serve can be expected to have a material effect on our results of operations.
In fiscal 2005,2008, 2007 and 2006, economic growth and the market conditions for industrial batteries were up significantly in the Americas, very strong in Asia, and showed modest growth in Europe. In fiscal 2006 market and economic conditions remained strong in all regions, In the past four years, however, we experienced significant cost pressure on our raw material costs, primarily lead. In fiscal 2007, market and economic conditions generally remained strong, howeverlead (which is our primary raw material) as lead prices hit substantially higher levels. See “Quarterly“Quarterly Information.”
Over the last three fiscal years, the costs of our raw materials (of which lead is our primary material) have risen significantly. We estimate that our average purethe year over year incremental increase in lead based costcosts (excluding premiums) per pound,, as it affects our operating results, has risen from $0.23 in fiscal 2004 to $0.36 in fiscal 2005, $0.41 in fiscal 2006 and $0.56 in fiscal 2007. Since the cost of purchased lead is not reflected in our cost of goods sold for two to three months after purchase, we compare our actual cost to London Metal Exchange (“LME”) prices that are in effect two to three months prior to the income statement period being shown. On this basis, average LME prices per period were $0.23, $0.40, $0.44 and $0.59 in fiscal 2004, 2005, 2006 and 2007, respectively, as they would have been reflected in our operating results. Our estimated incremental lead cost (due to increased price) was approximately $44by $222 million in fiscal 2005 over2008, $71 million in fiscal 2004; approximately2007, $23 million in fiscal 2006, over fiscal 2005; and approximately $71$44 million in fiscal 2007 over fiscal 2006.2005.
The highest price for lead during each of the last four fiscal years were as follows: in fiscal 2008 lead reached a historical high of over $1.81 per pound on the London Metal Exchange on October 15, 2007; in fiscal 2007 it was $0.91 per pound on February 26, 2007; in fiscal 2006 it was $0.66 per pound on February 2, 2006; and in fiscal 2005 it was $0.479$0.48 per pound on December 31, 2004. TheDuring April and May 2008, the price of lead has fallen significantly and the highest price for lead during fiscal 2006 was $0.657 per pound on February 2, 2006. The highest price for lead during fiscal 2007 was $0.907 per pound on February 26, 2007. In May 2007, lead reached an historical high of over $1.06 per pound on the London Metal Exchange.Exchange was $1.34 per pound on, April 7, 2008 and the lowest price for lead on the London Metal Exchange was $0.87 per pound on May 29, 2008.
We have implemented a series of selling price increases to offset some of the impact of these rising commodity costs. We believe we recovered approximately 55%70% of the cumulative increase in commodity costs since the beginning of fiscal 2005. These incremental selling price increases approximate 14% of net sales for fiscal 2008; 5% of net sales for fiscal 2007; and 2% of net sales for both fiscal 2005 and 2006 and 5% of net sales for fiscal 2007.2005.
Cost savings programs are and have been a continuous element of our business strategy and are directed primarily at further reductions in plant manufacturing (labor and overhead), raw materials costs and our operating expenses (primarily selling, general and administrative). Numerous individual cost savings opportunities are identified and evaluated by management with a formal selection and approval process that results in an ongoing list of cost savings projects to be implemented. In certain cases, projects are either modified or abandoned during
their respective implementation phases. In order to realize cost savings benefits for a majority of these initiatives, costs are incurred either in the form of capital expenditures, funding the cash obligations of previously recorded restructuring expenses or current period expenses.
Components of Revenue and Expense
Net sales include the invoiced amount for all products sold and services provided; freight costs, when paid for by our customers; less all related allowances, rebates, discounts and sales, value-added or similar taxes.
Cost of goods sold includes the cost of material, labor and overhead; the cost of our service businesses; freight; warranty and other costs such as distribution centers; obsolete or slow moving inventory provisions; and certain types of insurance.
For fiscal 2005,2008, 2007 and 2006, and 2007, we estimate that materials costs comprised approximately one-halfover half of cost of goods sold. The largest single raw material cost is lead, which comprised approximately 21%33%, 25% and 25%21% of cost of goods sold in fiscal 2008, 2007 and 2006, and 2007, respectively.
We employuse significant amounts of lead, plastics, steel, copper and other materials in manufacturing our products. The costs of these raw materials, particularly lead, are volatile and beyond our control. IncrementalYear over year incremental lead costs were approximately $44$222 million in fiscal 2005,2008, $71 million in fiscal 2007, $23 million in fiscal 2006, and $71$44 million in fiscal 20072005, as a result of pricecost increases experienced during those years. Lead is our single largest raw material item and the price of lead has continued to increase rapidly.remained volatile. Lead, plastics, steel and copper in the aggregate represent our principal raw materials costs. Volatile raw materials costs can significantly affect our operating results and make period-to-period comparisons difficult. The costs of commodity raw materials such as lead, steel and copper have increased significantly in recent periods. We attempt to control our raw materials costs through strategic purchasing decisions. Where possible, we pass along some or all of our increased raw materials costs to our customers.
The following table shows certain average commodity prices for fiscal 2005,2008, 2007 and 2006, and 2007, which have not been adjusted for the timing of the impact on our financial results:
| | | | | | | | | |
| | | 2005 | | 2006 | | 2007 |
Lead $/lb.(1) | | $ | 0.417 | | $ | 0.473 | | $ | 0.647 |
Steel $/lb.(2) | | | 0.267 | | | 0.255 | | | 0.363 |
Copper $/lb.(1) | | | 1.361 | | | 1.901 | | | 3.202 |
| | | | | | | | | |
| | | 2008 | | 2007 | | 2006 |
Lead $/lb.(1) | | $ | 1.296 | | $ | 0.647 | | $ | 0.473 |
Steel $/lb.(2) | | | 0.366 | | | 0.363 | | | 0.255 |
Copper $/lb.(1) | | | 3.430 | | | 3.202 | | | 1.901 |
| (1) | Source: London Metal Exchange (“LME”) |
| (2) | Source: Nucor Corporation |
Labor and overhead are primarily attributable to our manufacturing facilities. Overhead includes plant operating costs such as utilities, repairs and maintenance, taxes, supplies and depreciation.
Operating expenses include all non-manufacturing selling, general and administrative, engineering and other expenses. These include salaries and wages, sales commissions, fringe benefits, professional fees, supplies, maintenance, general business taxes, rent, communications, travel and entertainment, depreciation, advertising and bad debt expenses.
Operating expenses in fiscal 2008 and 2007 were incurred in the following functional areas of our business (as a percent of the total) and are substantially similar in both of our business segments.
| | | | 2006 | | 2007 | | | 2008 | | 2007 | |
Selling | | 64 | % | | 63 | % | | 62 | % | | 63 | % |
General and administrative | | 30 | | | 30 | | | 32 | | | 30 | |
Engineering | | 6 | | | 7 | | | 6 | | | 7 | |
| | | | | | | | | | | | |
Total | | 100 | % | | 100 | % | | 100 | % | | 100 | % |
| | | | | | | | | | | | |
Restructuring and other charges and litigation settlement income
In comparing fiscal 2008 financial results to fiscal 2007, and fiscal 2007 financial results to fiscal 2006, and fiscal 2006 financial results to fiscal 2005, management believes it is appropriate to highlight the $13.2 million of operating restructuring charges and the $0.6 million of expenses for a shelf registrations and secondary offerings incurred in fiscal 2008; the $3.8 million of litigation settlement income, the $1.1 million of expenses for a shelf registration and secondary offering and an abandoned acquisition attempt, and a $2.0 million non-recurring tax benefit that were incurred in fiscal 2007; and the $8.6 million of operating restructuring and other charges incurred in fiscal 2006 and the $6.0 million of non-operating IPO-related charges that occurred in fiscal 2005.2006.
Other income (expense), net includesconsists primarily of non-operating foreign currency transaction gains (losses) and expenses associated with shelf registrations and secondary offerings.
Results of Operations—Fiscal 2008 Compared to Fiscal 2007
The following table presents summary consolidated statement of income data for fiscal year ended March 31, 2008, compared to fiscal year ended March 31, 2007:
| | | | | | | | | | | | | | | | | | | | |
| | | Fiscal 2008 | | | Fiscal 2007 | | | Increase (Decrease) | |
| | | In
Millions | | As %
Net Sales | | | In
Millions | | | As %
Net Sales | | | In
Millions | | | % | |
Net sales | | $ | 2,026.6 | | 100.0 | % | | $ | 1,504.5 | | | 100.0 | % | | $ | 522.1 | | | 34.7 | % |
Cost of goods sold | | | 1,644.7 | | 81.2 | | | | 1,193.3 | | | 79.3 | | | | 451.4 | | | 37.8 | |
| | | | | | | | | | | | | | | | | | | | |
Gross profit | | | 381.9 | | 18.8 | | | | 311.2 | | | 20.7 | | | | 70.7 | | | 22.7 | |
Operating expenses | | | 249.4 | | 12.3 | | | | 221.1 | | | 14.7 | | | | 28.3 | | | 12.8 | |
Restructuring charges | | | 13.2 | | 0.7 | | | | — | | | — | | | | 13.2 | | | NA | |
Litigation settlement income | | | — | | — | | | | (3.8 | ) | | (0.2 | ) | | | (3.8 | ) | | NA | |
| | | | | | | | | | | | | | | | | | | | |
Operating earnings | | | 119.3 | | 5.9 | | | | 93.9 | | | 6.2 | | | | 25.4 | | | 27.2 | |
Interest expense | | | 28.9 | | 1.4 | | | | 27.7 | | | 1.8 | | | | 1.2 | | | 4.3 | |
Other (income) expense, net | | | 4.2 | | 0.2 | | | | 3.1 | | | 0.2 | | | | 1.1 | | | 35.5 | |
| | | | | | | | | | | | | | | | | | | | |
Earnings before income taxes | | | 86.2 | | 4.3 | | | | 63.1 | | | 4.2 | | | | 23.1 | | | 36.6 | |
Income tax expense | | | 26.5 | | 1.3 | | | | 17.9 | | | 1.2 | | | | 8.6 | | | 48.0 | |
| | | | | | | | | | | | | | | | | | | | |
Net earnings | | $ | 59.7 | | 2.9 | % | | $ | 45.2 | | | 3.0 | % | | $ | 14.5 | | | 32.1 | % |
| | | | | | | | | | | | | | | | | | | | |
Overview
Fiscal 2008 results include a net sales increase over fiscal 2007 of 34.7%, license income and excise taxes. Dueto $2.03 billion, with an increase to gross profit of 22.7% to $381.9 million. Our gross profit margin decreased 190 basis points to 18.8% due primarily to the unfavorable effect of higher commodity costs of approximately $240 million, partially offset by increased sales volume, price increases to our global manufacturingcustomers and distribution footprint, which meansour cost savings initiatives. We estimate that mostthe impact of higher lead costs alone, our primary raw material, unfavorably affected our cost of goods sold by approximately $222 million in fiscal 2008. We estimate that our price increases realized in fiscal 2008 increased our net sales by approximately 14%.
Operating expenses in fiscal 2008 grew over fiscal 2007 by 12.8%, due mainly to currency fluctuations. Operating expenses as a percentage of sales were 12.3% in fiscal 2008, down from 14.7% in fiscal 2007 due to the favorable impact from higher net sales relative to the fixed elements of our operating expenses, cost savings actions and a decrease in public company costs (primarily costs associated with Sarbanes-Oxley Section 404 compliance) of approximately $2 million.
We incurred $13.2 million in restructuring expenses in fiscal 2008 compared to none in fiscal 2007. In fiscal 2007 we received litigation settlement income of $3.8 million. Interest expense in fiscal 2008 increased over fiscal 2007 by approximately $1.2 million or 4.3%, due primarily to increased debt to fund working capital growth. Other (income) expense, net was higher in fiscal 2008 by approximately $1.1 million over fiscal 2007 due primarily to higher foreign currency transaction losses, primarily on short-term intercompany loans, partly offset by lower expenses in fiscal 2008 for shelf registrations and secondary offerings ($0.6 million compared to $0.8 million in fiscal 2007), and an abandoned acquisition attempt in fiscal 2007. The above fiscal 2008 over fiscal 2007 improvements in performance were partially offset by a non-recurring tax benefit of approximately $2.0 million that we recorded in fiscal 2007. These factors resulted in the net earnings increase of $14.5 million or 32.1% to $59.7 million.
In comparing fiscal 2008 financial results to fiscal 2007, management believes it is appropriate to highlight the $13.2 million of restructuring charges and the $0.6 million of expenses for shelf registrations and secondary offerings incurred in fiscal 2008; and the $1.1 million of expenses for a shelf registration and secondary offering and an abandoned acquisition attempt, the favorable $3.8 million of litigation settlement income, and the $2.0 million in non-recurring tax benefit incurred in fiscal 2007.
Net sales by geographic region were as follows:
| | | | | | | | | | | | | | | | | | |
| | | Fiscal 2008 | | | Fiscal 2007 | | | Increase | |
| | | In
Millions | | % Total
Sales | | | In
Millions | | % Total
Sales | | | In
Millions | | % | |
Europe(1) | | $ | 1,115.3 | | 55.0 | % | | $ | 784.6 | | 52.2 | % | | $ | 330.7 | | 42.2 | % |
Americas | | | 777.9 | | 38.4 | | | | 630.8 | | 41.9 | | | | 147.1 | | 23.3 | |
Asia | | | 133.4 | | 6.6 | | | | 89.1 | | 5.9 | | | | 44.3 | | 49.7 | |
| | | | | | | | | | | | | | | | | | |
Total | | $ | 2,026.6 | | 100.0 | % | | $ | 1,504.5 | | 100.0 | % | | $ | 522.1 | | 34.7 | % |
| | | | | | | | | | | | | | | | | | |
| (1) | Includes Europe, Middle East and Africa |
All geographic regions experienced solid sales growth in fiscal 2008. We believe our global business continued to gain market share.
The Europe region’s revenue increased by approximately $330.7 million or 42.2% in fiscal 2008, as compared to fiscal 2007. The euro increased on average by approximately 10.9 % in fiscal 2008, having an impact of approximately $111 million on our Europe business’ fiscal 2008 net sales growth. Further, the Europe region’s revenue benefited from the Energia and other smaller acquisitions, which increased their net sales by approximately $25 million in fiscal 2008.
The Americas region’s revenue increased by approximately $147.1 million or 23.3% in fiscal 2008 as compared to fiscal 2007, primarily due to higher prices and volume growth.
The Asia region’s revenue increased by approximately $44.3 million in fiscal 2008, primarily attributed to higher prices and continued general business expansion in that region.
After excluding the impact of the Energia and other smaller acquisitions and adjusting for the impact of the stronger currencies (primarily the euro) and price increases in fiscal 2008, consolidated net sales increased approximately 11% compared to the prior year.
Operating earnings by geographic region were as follows:
| | | | | | | | | | | | | | | | | | | | |
| | | Fiscal 2008 | | | Fiscal 2007 | | | Increase (Decrease) | |
| | | In
Millions | | | As %
Net Sales | | | In
Millions | | As %
Net Sales | | | In
Millions | | | % | |
Europe(1) | | $ | 61.3 | | | 5.5 | % | | $ | 36.0 | | 4.6 | % | | $ | 25.3 | | | 70.3 | % |
Americas | | | 68.5 | | | 8.8 | | | | 52.7 | | 8.4 | | | | 15.8 | | | 30.0 | |
Asia | | | 2.7 | | | 2.0 | | | | 1.4 | | 1.6 | | | | 1.3 | | | 92.9 | |
| | | | | | | | | | | | | | | | | | | | |
Subtotal | | | 132.5 | | | 6.5 | | | | 90.1 | | 6.0 | | | | 42.4 | | | 47.1 | |
Restructuring charges-Europe | | | (13.2 | ) | | (0.7 | ) | | | — | | — | | | | (13.2 | ) | | NA | |
Litigation settlement income-Americas | | | — | | | — | | | | 3.8 | | 0.3 | | | | (3.8 | ) | | NA | |
| | | | | | | | | | | | | | | | | | | | |
Total | | $ | 119.3 | | | 5.9 | % | | $ | 93.9 | | 6.2 | % | | $ | 25.4 | | | 27.2 | % |
| | | | | | | | | | | | | | | | | | | | |
| (1) | Includes Europe, Middle East and Africa |
The Europe region’s operating earnings increased $25.3 million or 70.3% in fiscal 2008 compared to fiscal 2007 as increased sales volume, prices and cost savings programs more than offset higher commodity costs.
The Americas region’s operating earnings increased 30.0% as net sales grew by approximately 23.3%. The Americas region’s operating earnings were favorably affected by sales price increases, improved plant utilization and cost savings programs, which more than offset higher commodity costs.
The Asia region’s operating earnings reflect the improved operating performance in this region. The region realized significant price increases in fiscal 2008; partially offset by the negative impact of higher commodity costs and revenues are incurredcontinued challenging competitive conditions in this region.
The above operating earnings performance improvement in fiscal 2008 was reduced by the European restructuring program that is expected to continue into next fiscal year, and paidthe fiscal 2007 favorable litigation settlement income.
A discussion of specific fiscal 2008 versus fiscal 2007 operating results follows, including an analysis and discussion of the results of our two business segments.
Net Sales
| | | | | | | | | | | | | | | | | | |
| | | Fiscal 2008 | | | Fiscal 2007 | | | Increase | |
| | | In
Millions | | % Total
Sales | | | In
Millions | | % Total
Sales | | | In
Millions | | % | |
Reserve power | | $ | 883.8 | | 43.6 | % | | $ | 642.6 | | 42.7 | % | | $ | 241.2 | | 37.5 | % |
Motive power | | | 1,142.8 | | 56.4 | | | | 861.9 | | 57.3 | | | | 280.9 | | 32.6 | |
| | | | | | | | | | | | | | | | | | |
Total | | $ | 2,026.6 | | 100.0 | % | | $ | 1,504.5 | | 100.0 | % | | $ | 522.1 | | 34.7 | % |
| | | | | | | | | | | | | | | | | | |
Net sales increased $522.1 million or 34.7% in localfiscal 2008 over fiscal 2007. This growth resulted primarily from four main factors: currency fluctuations, acquisitions, pricing and organic growth.
Stronger currencies, primarily the euro compared to the U.S. dollar, resulted in an increase of $125 million or 8% in fiscal 2008 net sales. The euro exchange rate to the U.S. dollar averaged $1.43/ € in fiscal 2008 compared to $1.29/ € in fiscal 2007. Excluding the effect of foreign currency fluctuations, net sales in the Europe region increased 28%, the Americas region increased 23%, and the Asia region increased 38% in fiscal 2008 compared to fiscal 2007.
Acquisitions of Energia in May 2007, Leclanché in January 2007, contributed almost $28 million or 2% of worldwide incremental net sales in fiscal 2008 as compared to fiscal 2007.
We have implemented a series of selling price increases to offset some of the increased costs associated with lead and other key materials used in the manufacturing of our products. As described previously, competitive conditions remain challenging in our industry, with only a partial recovery of higher commodity costs experienced in fiscal 2008 and 2007 from sales price increases. We realized selling price increases of approximately 14% in fiscal 2008 and 5% in fiscal 2007, which represents approximately 85% of the commodity cost increases experienced in fiscal 2008 and roughly 66% of the commodity cost increases in fiscal 2007. We remain highly focused on maximizing our pricing actions; however, there is a time lag in realizing the full impact from announced price increases in our operating results, caused primarily by the impact of our order backlog. Price increases resulted in an increase in net sales of approximately $204 million or 14% in fiscal 2008 over fiscal 2007 in both segments. Strong efforts were made to pass through sales price increases in all regions. In general, more selling price realization occurred in our motive power business in comparison to our reserve power business during fiscal 2007, but was comparable in fiscal 2008.
Organic growth (increased net sales excluding the impact of currency, pricing and acquisitions) contributed approximately $165 million or 11% to net sales in fiscal 2008 over fiscal 2007. We believe our organic growth resulted from a combination of our increased market share and overall market growth.
Fiscal 2008 net sales growth, excluding the effect of foreign currency translation, in reserve power and motive power was approximately 30% and 24%, respectively, compared to fiscal 2007.
Excluding the effect of foreign currency translation, the reserve power segment achieved solid growth in fiscal 2008 sales as compared to fiscal 2007 sales, due primarily to improving sales trends for both telecom and UPS battery markets and the strong sales of aerospace & defense batteries, coupled with the impact of approximately $12 million of increased sales from recent acquisitions.
The strong growth experienced in our motive power segment in the prior year continued into fiscal 2008 and benefited from approximately $16 million of increased sales from acquisitions.
See Note 2 of Notes to Consolidated Financial Statements in this Form 10-K for descriptions of the Energia, Leclanché, CFT, EAS and GAZ acquisitions.
Gross Profit
| | | | | | | | | | | | | | | | | | |
| | | Fiscal 2008 | | | Fiscal 2007 | | | Increase | |
| | | In
Millions | | As %
Net Sales | | | In
Millions | | As %
Net Sales | | | In
Millions | | % | |
Gross profit | | $ | 381.9 | | 18.8 | % | | $ | 311.2 | | 20.7 | % | | $ | 70.7 | | 22.7 | % |
Gross profit increased $70.7 million or 22.7% in fiscal 2008 compared to fiscal 2007. Gross profit, excluding the effect of foreign currency translation, increased $55.1 million or 17.7% in fiscal 2008 compared to fiscal 2007. Gross profit margin declined 190 basis points in fiscal 2008 compared to fiscal 2007. The primary cause of the decline in gross profit margin is attributed to higher commodity and energy costs. Pricing recovery to offset higher commodity costs increased net sales by approximately 14% in fiscal 2008 and continues to be challenging. Lead represents our principal raw material and approximated 33% of total cost of goods sold for fiscal 2008 as compared to approximately 25% of total cost of goods sold for fiscal 2007. Lead costs continue to increase dramatically and increased approximately $222 million compared to the prior year. We continue to focus on cost savings initiatives to help mitigate the rising cost of commodities. Additionally, we believe thatcontinue to focus on a wide variety of sales initiatives which benefit our margins by improving product mix to higher margin products. Lastly, as previously discussed, we have implemented multiple sales price increases throughout the year to offset commodity cost increases.
Operating Expenses
| | | | | | | | | | | | | | | | | | |
| | | Fiscal 2008 | | | Fiscal 2007 | | | Increase | |
| | | In
Millions | | As %
Net Sales | | | In
Millions | | As %
Net Sales | | | In
Millions | | % | |
Operating expenses | | $ | 249.4 | | 12.3 | % | | $ | 221.1 | | 14.7 | % | | $ | 28.3 | | 12.8 | % |
Operating expenses increased $28.3 million or 12.8% in fiscal 2008 over fiscal 2007 as net sales increased 34.7%. Excluding the effect of foreign currency translation, operating expenses increased 7.9% in fiscal 2008 over fiscal 2007, while net sales increased 26.4% in fiscal 2008 over fiscal 2007. These increases also reflect the additional operating expenses and sales of the acquired Energia, Leclanché, EAS and GAZ businesses. Operating expenses represented 12.3% of net sales in fiscal 2008 as compared to 14.7% in fiscal 2007. Selling expenses were 61.8% of operating expenses in fiscal 2008, compared to 62.8% in fiscal 2007. We continued to further reduce our costs in this area through cost savings initiatives.
Restructuring Charges—Operating
| | | | | | | | | | | | | | | | | |
| | | Fiscal 2008 | | | Fiscal 2007 | | | Increase |
| | | In
Millions | | As %
Net Sales | | | In
Millions | | As %
Net Sales | | | In
Millions | | % |
Restructuring charges | | $ | 13.2 | | 0.7 | % | | $ | — | | — | % | | $ | 13.2 | | NA |
Included in our fiscal 2008 operating results are $13.2 million of highlighted restructuring charges that resulted from the Energia acquisition, which included $9.3 million that were incurred for staff reductions and professional fees, plus $3.9 million of non-cash impairment charges for redundant machinery and equipment. There were no restructuring charges in fiscal 2007.
Litigation Settlement (Income)—Operating
| | | | | | | | | | | | | | | | | | | |
| | | Fiscal 2008 | | | Fiscal 2007 | | | (Decrease) |
| | | In
Millions | | As %
Net Sales | | | In
Millions | | | As %
Net Sales | | | In
Millions | | | % |
Litigation settlement income | | $ | — | | — | % | | $ | (3.8 | ) | | (0.2 | )% | | $ | (3.8 | ) | | NA |
Included in our fiscal 2007 operating results is litigation settlement income of $3.8 million, net of fees and expenses, from the settlement of two separate legal matters associated with our Americas business. The amounts of the settlements have been recorded as increases in operating earnings in fiscal 2007, as the costs related to these matters were previously recorded as an element of operating earnings.
Operating Earnings
| | | | | | | | | | | | | | | | | | | | |
| | | Fiscal 2008 | | | Fiscal 2007 | | | Increase (Decrease) | |
| | | In
Millions | | | As %
Net Sales(1) | | | In
Millions | | As %
Net Sales(1) | | | In
Millions | | | % | |
Reserve power | | $ | 43.8 | | | 5.0 | % | | $ | 31.3 | | 4.9 | % | | $ | 12.5 | | | 39.9 | % |
Motive power | | | 88.7 | | | 7.8 | | | | 58.8 | | 6.8 | | | | 29.9 | | | 50.9 | |
| | | | | | | | | | | | | | | | | | | | |
Subtotal | | | 132.5 | | | 6.5 | | | | 90.1 | | 6.0 | | | | 42.4 | | | 47.1 | |
Restructuring charges-Reserve | | | (8.5 | ) | | (1.0 | ) | | | — | | — | | | | (8.5 | ) | | NA | |
Restructuring charges-Motive | | | (4.7 | ) | | (0.4 | ) | | | — | | — | | | | (4.7 | ) | | NA | |
Litigation settlement income-Reserve | | | — | | | — | | | | 3.0 | | 0.5 | | | | (3.0 | ) | | NA | |
Litigation settlement income-Motive | | | — | | | — | | | | 0.8 | | 0.1 | | | | (0.8 | ) | | NA | |
| | | | | | | | | | | | | | | | | | | | |
Total operating earnings | | $ | 119.3 | | | 5.9 | % | | $ | 93.9 | | 6.2 | % | | $ | 25.4 | | | 27.2 | % |
| | | | | | | | | | | | | | | | | | | | |
| (1) | The percentages shown for the segments are computed as a percentage of the applicable segment’s net sales. |
Fiscal 2008 operating earnings of $119.3 million were $25.4 million higher than in fiscal 2007 and our operating margins decreased 30 basis points to 5.9%. Fiscal 2008 operating earnings included the $13.2 million negative impact of restructuring charges; and fiscal 2007 operating earnings included the favorable impact of $3.8 million of litigation settlement income. As discussed above, our operating earnings were favorably affected by sales volume, price increases and our continuing cost savings programs, partially offset by higher commodity costs.
Interest Expense
| | | | | | | | | | | | | | | | | | |
| | | Fiscal 2008 | | | Fiscal 2007 | | | Increase | |
| | | In
Millions | | As %
Net Sales | | | In
Millions | | As %
Net Sales | | | In
Millions | | % | |
Interest expense | | $ | 28.9 | | 1.4 | % | | $ | 27.7 | | 1.8 | % | | $ | 1.2 | | 4.3 | % |
Fiscal 2008 interest expense of $28.9 million (net of interest income of $1.2 million) increased 4.3% over fiscal 2007. Our average debt outstanding in fiscal 2008 was approximately $430 million, as compared to our average debt of $417 million in fiscal 2007. Our average interest rate on borrowings incurred in fiscal 2008 was 6.5%, a significant natural hedge against the impactdecrease of 10 basis points from 6.6% in fiscal 2007. Included in fiscal 2008 interest expense are non-cash charges of $1.5 million for deferred financing fees, an increase of $0.1 million from fiscal 2007. The increase in interest expense is due primarily to higher average debt and lower interest income; partially offset by lower interest rates on our businessvariable rate debt in fiscal 2008 attributable to actions taken by central banks to decrease interest rates.
Other (Income) Expense, Net
| | | | | | | | | | | | | | | | | | |
| | | Fiscal 2008 | | | Fiscal 2007 | | | Increase | |
| | | In
Millions | | As %
Net Sales | | | In
Millions | | As %
Net Sales | | | In
Millions | | % | |
Other (income) expense, net | | $ | 4.2 | | 0.2 | % | | $ | 3.1 | | 0.2 | % | | $ | 1.1 | | 35.5 | % |
Fiscal 2008 other expense, net, which was $4.2 million, consists primarily of exchange rate fluctuations.$2.7 million in foreign currency transaction losses and $0.6 million in fees related to secondary stock offerings. This compares to fiscal 2007 other expense of $3.1 million, which consisted primarily of $1.6 million in foreign currency transaction losses and $1.1 million in fees related to a secondary stock offering and an abandoned acquisition attempt. Both years’ foreign currency transaction losses were primarily associated with short-term intercompany loan balances.
Earnings Before Income Taxes
| | | | | | | | | | | | | | | | | | |
| | | Fiscal 2008 | | | Fiscal 2007 | | | Increase | |
| | | In
Millions | | As %
Net Sales | | | In
Millions | | As %
Net Sales | | | In
Millions | | % | |
Earnings before income taxes | | $ | 86.2 | | 4.3 | % | | $ | 63.1 | | 4.2 | % | | $ | 23.1 | | 36.6 | % |
As a result of the factors discussed above, fiscal 2008 earnings before income taxes were $86.2 million, an increase of $23.1 million or 36.6% compared to fiscal 2007. Included in fiscal 2008 earnings before income taxes were $13.2 million of restructuring charges and $0.6 million of secondary offering expenses. Included in fiscal 2007 earnings before income taxes were $3.8 million of litigation settlement income, $1.1 million of secondary offering expenses and a loss on an abandoned acquisition attempt.
Income Tax Expense
| | | | | | | | | | | | | | | | | | | | |
| | | Fiscal 2008 | | | Fiscal 2007 | | | Increase | |
| | | In
Millions | | | As %
Net Sales | | | In
Millions | | | As %
Net Sales | | | In
Millions | | % | |
Income tax expense | | $ | 26.5 | | | 1.3 | % | | $ | 17.9 | | | 1.2 | % | | $ | 8.6 | | 48.0 | % |
| | | | | | | | | | | | | | | | | | | | |
Effective tax rate | | | 30.7 | % | | | | | | 28.4 | % | | | | | | | | | |
| | | | | | | | | | | | | | | | | | | | |
The effective income tax rate was 30.7% in fiscal 2008, compared to the fiscal 2007 effective tax rate, before the non-recurring credit, of 31.6%. The effective income tax rate was 28.4% in fiscal 2007, as the fiscal 2007 tax expense includes a non-recurring tax benefit of approximately $2.0 million recorded in the third fiscal quarter of 2007, attributable to the favorable resolution of a prior year tax matter related to our European business, which reduced our book effective tax rate by 3.2 percentage points. Additionally, in fiscal 2007, changes in the mix of earnings among our various legal entities in multiple foreign jurisdictions resulted in an approximate one percentage point decrease on our effective tax rate.
Net Earnings
| | | | | | | | | | | | | | | | | | |
| | | Fiscal 2008 | | | Fiscal 2007 | | | Increase | |
| | | In
Millions | | As %
Net Sales | | | In
Millions | | As %
Net Sales | | | In
Millions | | % | |
Net earnings | | $ | 59.7 | | 2.9 | % | | $ | 45.2 | | 3.0 | % | | $ | 14.5 | | 32.1 | % |
As a result of the factors discussed above, fiscal 2008 net earnings were $59.7 million compared to fiscal 2007 earnings of $45.2 million. The $14.5 million increase is due primarily to a $70.7 million increase gross profit, partially offset by $13.2 million of restructuring charges, a $28.3 million increase in operating expenses, a $1.2 million increase in interest expense, a $1.1 million increase in other expense and a $8.6 million increase in income taxes in fiscal 2008. In addition, fiscal 2007 benefited from $3.8 million (pre-tax) of litigation settlement income and the approximately $2.0 million non-recurring tax benefit.
Net earnings per common share in fiscal 2008 were $1.25 per basic share and $1.22 per diluted share compared to $0.97 per basic share and $0.95 per diluted share in fiscal 2007.
Results of Operations—Fiscal 2007 Compared to Fiscal 2006
The following table presents summary consolidated statement of income data for fiscal year ended March 31, 2007, compared to fiscal year ended March 31, 2006:
| | | | Fiscal 2006 | | Fiscal 2007 | | Increase (Decrease) | | | Fiscal 2007 | | Fiscal 2006 | | Increase (Decrease) | |
| | | In
Millions | | As %
Net Sales | | In
Millions | | As %
Net Sales | | In
Millions | | % | | | In
Millions | | As %
Net Sales | | In
Millions | | As %
Net Sales | | In
Millions | | % | |
Net sales | | $ | 1,283.3 | | | 100.0 | % | | $ | 1,504.5 | | | 100.0 | % | | $ | 221.2 | | | 17.2 | % | | $ | 1,504.5 | | | 100.0 | % | | $ | 1,283.3 | | | 100.0 | % | | $ | 221.2 | | | 17.2 | % |
Cost of goods sold | | | 1,006.5 | | | 78.4 | | | | 1,193.3 | | | 79.3 | | | | 186.8 | | | 18.6 | | | | 1,193.3 | | | 79.3 | | | | 1,006.5 | | | 78.4 | | | | 186.8 | | | 18.6 | |
| | | | | | | | | | | | | | | | | | | | | | | | | | | | | | | | | | |
Gross profit | | | 276.8 | | | 21.6 | | | | 311.2 | | | 20.7 | | | | 34.4 | | | 12.4 | | | | 311.2 | | | 20.7 | | | | 276.8 | | | 21.6 | | | | 34.4 | | | 12.4 | |
Operating expenses | | | 199.9 | | | 15.6 | | | | 221.1 | | | 14.7 | | | | 21.2 | | | 10.6 | | | | 221.1 | | | 14.7 | | | | 199.9 | | | 15.6 | | | | 21.2 | | | 10.6 | |
Restructuring and other charges | | | 8.6 | | | 0.7 | | | | — | | | — | | | | (8.6 | ) | | NA | | | | — | | | — | | | | 8.6 | | | 0.7 | | | | (8.6 | ) | | NA | |
Litigation settlement income | | | — | | | — | | | | (3.8 | ) | | (0.2 | ) | | | (3.8 | ) | | NA | | | | (3.8 | ) | | (0.2 | ) | | | — | | | — | | | | (3.8 | ) | | NA | |
| | | | | | | | | | | | | | | | | | | | | | | | | | | | | | | | | | |
Operating earnings | | | 68.3 | | | 5.3 | | | | 93.9 | | | 6.2 | | | | 25.6 | | | 37.3 | | | | 93.9 | | | 6.2 | | | | 68.3 | | | 5.3 | | | | 25.6 | | | 37.3 | |
Interest expense | | | 24.9 | | | 1.9 | | | | 27.7 | | | 1.8 | | | | 2.8 | | | 11.4 | | | | 27.7 | | | 1.8 | | | | 24.9 | | | 1.9 | | | | 2.8 | | | 11.4 | |
Other (income) expense, net | | | (1.4 | ) | | (0.1 | ) | | | 3.1 | | | 0.2 | | | | 4.5 | | | 321.4 | | | | 3.1 | | | 0.2 | | | | (1.4 | ) | | (0.1 | ) | | | 4.5 | | | 321.4 | |
| | | | | | | | | | | | | | | | | | | | | | | | | | | | | | | | | | |
Earnings before income taxes | | | 44.8 | | | 3.5 | | | | 63.1 | | | 4.2 | | | | 18.3 | | | 40.8 | | | | 63.1 | | | 4.2 | | | | 44.8 | | | 3.5 | | | | 18.3 | | | 40.8 | |
Income tax expense | | | 14.1 | | | 1.1 | | | | 17.9 | | | 1.2 | | | | 3.8 | | | 27.3 | | | | 17.9 | | | 1.2 | | | | 14.1 | | | 1.1 | | | | 3.8 | | | 27.3 | |
| | | | | | | | | | | | | | | | | | | | | | | | | | | | | | | | | | |
Net earnings | | $ | 30.7 | | | 2.4 | % | | $ | 45.2 | | | 3.0 | % | | $ | 14.5 | | | 47.2 | % | | $ | 45.2 | | | 3.0 | % | | $ | 30.7 | | | 2.4 | % | | $ | 14.5 | | | 47.2 | % |
| | | | | | | | | | | | | | | | | | | | | | | | | | | | | | | | | | |
Overview
Fiscal 2007 results include a net sales increase over fiscal 2006 of 17.2%, to $1.5 billion, with a gross profit increase of 12.4% to $311.2 million. Our gross profit margin decreased 90 basis points to 20.7% due primarily to the unfavorable effect of higher commodity costs, partially offset by increased sales volume, price increases to our customers and our cost savings initiatives. We estimate that the impact of higher lead costs alone, our primary raw material, unfavorably affected our cost of goods sold by approximately $71 million in fiscal 2007. We estimate that our price increases realized in fiscal 2007 increased our net sales by approximately 5%.
Operating expenses in fiscal 2007 grew at a slower rate over fiscal 2006 of 10.6%, due partly to a decrease in public company costs (primarily costs associated with Sarbanes-Oxley Section 404 compliance) of approximately $2 million, cost savings actions and the favorable impact from higher net sales relative to the fixed elements of our operating expenses.
We did not incur any restructuring expenses in fiscal 2007 as compared to $8.6 million in fiscal 2006, and in fiscal 2007 we received litigation settlement income of $3.8 million. Interest expense in fiscal 2007 increased over fiscal 2006 by approximately $2.8 million or 11.4%, due primarily to higher interest rates from our variable rate debt, as global interest rates have increased due to actions taken by central banks to raise borrowing costs. Other (income) expense, net in fiscal 2007 grew by approximately $4.5 million over fiscal 2006 due primarily to $1.1 million of expenses for a shelf registration and secondary offering and an abandoned acquisition attempt, and higher foreign currency transaction losses primarily on short-term intercompany loans. Additionally, we recorded a non-recurring tax benefit of approximately $2.0 million in fiscal 2007. These factors resulted in the net earnings increase of $14.5 million or 47.2% to $45.2 million.
In comparing fiscal 2007 financial results to fiscal 2006, management believes it is appropriate to highlight the $3.8 million of litigation settlement income, the $1.1 million of expenses for a shelf registration and secondary offering and an abandoned acquisition attempt and the $2.0 million in non-recurring tax benefit incurred in fiscal 2007, and the $8.6 million of operating restructuring and other charges incurred in fiscal 2006.
Net sales by geographic region were as follows:
| | | | Fiscal 2006 | | Fiscal 2007 | | Increase | | | Fiscal 2007 | | Fiscal 2006 | | Increase | |
| | | In
Millions | | % Total
Sales | | In
Millions | | % Total
Sales | | In
Millions | | % | | | In
Millions | | % Total
Sales | | In
Millions | | % Total
Sales | | In
Millions | | % | |
Europe | | $ | 675.4 | | 52.6 | % | | $ | 784.6 | | 52.2 | % | | $ | 109.2 | | 16.2 | % | | $ | 784.6 | | 52.2 | % | | $ | 675.4 | | 52.6 | % | | $ | 109.2 | | 16.2 | % |
Americas | | | 535.9 | | 41.8 | | | | 630.8 | | 41.9 | | | | 94.9 | | 17.7 | | | | 630.8 | | 41.9 | | | | 535.9 | | 41.8 | | | | 94.9 | | 17.7 | |
Asia | | | 72.0 | | 5.6 | | | | 89.1 | | 5.9 | | | | 17.1 | | 23.8 | | | | 89.1 | | 5.9 | | | | 72.0 | | 5.6 | | | | 17.1 | | 23.8 | |
| | | | | | | | | | | | | | | | | | | | | | | | | | | | |
Total | | $ | 1,283.3 | | 100.0 | % | | $ | 1,504.5 | | 100.0 | % | | $ | 221.2 | | 17.2 | % | | $ | 1,504.5 | | 100.0 | % | | $ | 1,283.3 | | 100.0 | % | | $ | 221.2 | | 17.2 | % |
| | | | | | | | | | | | | | | | | | | | | | | | | | | | |
All geographic regions experienced solid sales growth in fiscal 2007. The euro increased on average by approximately 6.6 %6.6% in fiscal 2007, having an impact of approximately $51.1$51 million on our Europe business’ fiscal 2007 net sales growth. We believe our global business continued to gain market share with particularly strong growth in the motive power segment. Asia’sThe Asia region’s revenue growth is primarily attributed to continued general business expansion in that region. Further, the Europe region revenue benefited from the FIAMM and other smaller acquisitions, which increased their net sales by approximately $12.9$13 million in fiscal 2007. The Asia region revenues increased by approximately $17.1$17 million in fiscal 2007. After excluding the impact of the FIAMM and other smallersmalleŕ acquisitions and adjusting for the impact of the stronger currencies (primarily the euro) and price increases in fiscal 2007, consolidated net sales increased approximately 6.6%7% compared to the prior year.
Operating earnings by geographic region were as follows:
| | | | Fiscal 2006 | | Fiscal 2007 | | Increase (Decrease) | | | Fiscal 2007 | | Fiscal 2006 | | Increase (Decrease) | |
| | | In
Millions | | As %
Net Sales | | In
Millions | | As %
Net Sales | | In
Millions | | % | | | In
Millions | | As %
Net Sales(1) | | In
Millions | | As %
Net Sales(1) | | In
Millions | | % | |
Europe | | $ | 35.7 | | | 5.3 | % | | $ | 36.0 | | 4.6 | % | | $ | 0.3 | | | 0.8 | % | | $ | 36.0 | | 4.6 | % | | $ | 35.7 | | | 5.3 | % | | $ | 0.3 | | | 0.8 | % |
Americas | | | 39.3 | | | 7.3 | | | | 52.7 | | 8.4 | | | | 13.4 | | | 34.1 | | | | 52.7 | | 8.4 | | | | 39.3 | | | 7.3 | | | | 13.4 | | | 34.1 | |
Asia | | | 1.9 | | | 2.6 | | | | 1.4 | | 1.6 | | | | (0.5 | ) | | (26.3 | ) | | | 1.4 | | 1.6 | | | | 1.9 | | | 2.6 | | | | (0.5 | ) | | (26.3 | ) |
| | | | | | | | | | | | | | | | | | | | | | | | | | | | | | | | |
Subtotal | | | 76.9 | | | 6.0 | | | | 90.1 | | 6.0 | | | | 13.2 | | | 17.2 | | | | 90.1 | | 6.0 | | | | 76.9 | | | 6.0 | | | | 13.2 | | | 17.2 | |
Restructuring and other charges | | | (8.6 | ) | | (0.7 | ) | | | — | | — | | | | 8.6 | | | NA | | |
Litigation settlement income | | | — | | | — | | | | 3.8 | | 0.3 | | | | 3.8 | | | NA | | |
Restructuring and other charges-Europe | | | | — | | — | | | | (8.6 | ) | | (0.7 | ) | | | 8.6 | | | NA | |
Litigation settlement income-Americas | | | | 3.8 | | 0.3 | | | | — | | | — | | | | 3.8 | | | NA | |
| | | | | | | | | | | | | | | | | | | | | | | | | | | | | | | | |
Total | | $ | 68.3 | | | 5.3 | % | | $ | 93.9 | | 6.2 | % | | $ | 25.6 | | | 37.3 | % | | $ | 93.9 | | 6.2 | % | | $ | 68.3 | | | 5.3 | % | | $ | 25.6 | | | 37.3 | % |
| | | | | | | | | | | | | | | | | | | | | | | | | | | | | | | | |
Europe’s
| (1) | The percentages shown for the region’s are computed as a percentage of the applicable region’s net sales. |
The Europe region’s operating earnings were flat in fiscal 2007 compared to fiscal 2006 as increased sales were offset by higher commodity costs.
Americas’The Americas region’s operating earnings increased 34.1% as net sales grew by approximately 17.7%. The Americas’Americas region’s operating earnings were favorably affected by sales price increases, improved plant utilization and cost savings programs which offset higher commodity costs.
Asia’sThe Asia region’s operating earnings were negatively affected by higher commodity costs in fiscal 2007 with a modest increase in sales prices realized as competitive conditions remain challenging in this region.
A discussion of specific fiscal 2007 versus fiscal 2006 operating results follows, including an analysis and discussion of the results of our two business segments.
Net Sales
| | | | | | | | | | | | | | | | | | |
| | | Fiscal 2006 | | | Fiscal 2007 | | | Increase | |
| | | In
Millions | | % Total
Sales | | | In
Millions | | % Total
Sales | | | In
Millions | | % | |
Reserve power | | $ | 571.1 | | 44.5 | % | | $ | 642.6 | | 42.7 | % | | $ | 71.5 | | 12.5 | % |
Motive power | | | 712.2 | | 55.5 | | | | 861.9 | | 57.3 | % | | | 149.7 | | 21.0 | |
| | | | | | | | | | | | | | | | | | |
Total | | $ | 1,283.3 | | 100.0 | % | | $ | 1,504.5 | | 100.0 | % | | $ | 221.2 | | 17.2 | % |
| | | | | | | | | | | | | | | | | | |
| | | | | | | | | | | | | | | | | | |
| | | Fiscal 2007 | | | Fiscal 2006 | | | Increase | |
| | | In
Millions | | % Total
Sales | | | In
Millions | | % Total
Sales | | | In
Millions | | % | |
Reserve power | | $ | 642.6 | | 42.7 | % | | $ | 571.1 | | 44.5 | % | | $ | 71.5 | | 12.5 | % |
Motive power | | | 861.9 | | 57.3 | | | | 712.2 | | 55.5 | % | | | 149.7 | | 21.0 | |
| | | | | | | | | | | | | | | | | | |
Total | | $ | 1,504.5 | | 100.0 | % | | $ | 1,283.3 | | 100.0 | % | | $ | 221.2 | | 17.2 | % |
| | | | | | | | | | | | | | | | | | |
NetConsolidated net sales increased $221.2 million or 17.2% in fiscal 2007 over fiscal 2006. This growth resulted primarily from four main factors: currency fluctuations, acquisitions, pricing and organic growth. All regions benefited from strong economic conditions and, we believe, an increase in market shares.share.
Stronger currencies, primarily the euro compared to the U.S. dollar, resulted in an increase of $55.0approximately $55 million or 4.3%4% in fiscal 2007 net sales. The euro exchange rate to the U.S. dollar averaged $1.29($$1.29 ($/ €) in fiscal 2007 compared to $1.21 ($/ €) in fiscal 2006. Excluding the effect of foreign currency fluctuations, net sales in the Americas region increased 17.5%18%, the Asia region increased 20.0%20% and the Europe region increased 8.6%9% in fiscal 2007 compared to fiscal 2006.
Acquisitions of Leclanché in January 2007, EAS in May 2006, GAZ in October 2005 and FIAMM in June 2005, GAZ in October 2005, EAS in May 2006 and Leclanché in January 2007, contributed $19.5approximately $20 million of worldwide incremental net sales in fiscal 2007 as compared to fiscal 2006.
We have implemented a series of selling price increases to offset some of the increased costs associated with lead and other key materials used in the manufacturing of our products. As described previously, competitive conditions remainremained challenging in our industry, with only a partial recovery of higher commodity costs experienced in fiscal 20062007 and 20072006 from sales price increases. We estimate realized selling price increases of approximately 5% in fiscal 2007, and 2% in fiscal 2006, and 5%which represents approximately 66% of the commodity cost increases in fiscal 2007, which represents roughlyand approximately 50% of the commodity cost increases experienced in fiscal 2006 and roughly 66% of the commodity cost increases in fiscal 2007.2006. We remainremained highly focused on maximizing our pricing actions; however, there is a time lag in realizing the full impact from our most recently announced price increases (November 2006,(April 2007, January 2007 and April 2007)November 2006) in our operating results, caused primarily by the impact of our order backlog. Price increases resulted in an increase in net sales by approximately $61$60 million or approximately 5% in fiscal 2007 over fiscal 2006. Strong efforts were made to pass through sales price increases in all regions. In general, more selling price realization has occurred in our motive power business in comparison to our reserve power business during fiscal 20062007 and 2007.2006. Organic growth (increased net sales excluding the impact of currency, pricing and sales resulting from acquisitions), which had the largest impact on sales growth, contributed approximately $85 million or 6.6% to net sales in fiscal 2007 over fiscal 2006. We believe our organic growth resulted from a combination of our increased market share and overall market growth.
Fiscal 2007 net sales growth, excluding the effect of foreign currency translation, in reserve power and motive power was approximately 8.5% and 16.5%, respectively, compared to fiscal 2006.
Excluding the effect of foreign currency translation, the reserve power segment achieved solid growth in fiscal 2007 sales as compared to fiscal 2006 sales, due primarily to improving sales trends for both telecom and UPS battery markets and the strong sales of aerospace and& defense batteries, coupled with the impact of $10.5over $10 million of increased sales from recent acquisitions.
The strong growth experienced in our motive power segment in the prior year continued into fiscal 2007 and benefited from $9.0approximately $9 million of increased sales from the FIAMM acquisition.
See Note 2 of the notesNotes to the Consolidated Financial Statements in this Form 10-K for descriptions of the FIAMM, GAZ, LeclancheLeclanché and EAS acquisitions.
Gross Profit
| | | | | | | | | | | | | | | | | | |
| | | Fiscal 2006 | | | Fiscal 2007 | | | Increase | |
| | | In
Millions | | As %
Net Sales | | | In
Millions | | As %
Net Sales | | | In
Millions | | % | |
Gross profit | | $ | 276.8 | | 21.6 | % | | $ | 311.2 | | 20.7 | % | | $ | 34.4 | | 12.4 | % |
| | | | | | | | | | | | | | | | | | |
| | | Fiscal 2007 | | | Fiscal 2006 | | | Increase | |
| | | In
Millions | | As %
Net Sales | | | In
Millions | | As %
Net Sales | | | In
Millions | | % | |
Gross profit | | $ | 311.2 | | 20.7 | % | | $ | 276.8 | | 21.6 | % | | $ | 34.4 | | 12.4 | % |
Gross profit increased $34.4 million or 12.4% in fiscal 2007 compared to fiscal 2006. Gross profit, excluding the effect of foreign currency translation, increased $25.9 million or 9.4% in fiscal 2007 compared to fiscal 2006. Gross profit margin declined 90 basis points in fiscal 2007 compared to fiscal 2006. The primary cause of the decline in gross profit margin is attributed to higher commodity and energy costs. Pricing recovery to offset higher commodity costs increased net sales by approximately 5% in fiscal 2007 and continues to be challenging. Lead represents our principal raw material and approximated 25% of total cost of goods sold for fiscal 2007. Lead costs continuecontinued to increase dramaticallysignificantly and on an LME basis as it affects our income statement, approximated $0.56/lb in fiscal 2007increased approximately $71 million compared to approximately $0.41/lb in the prior year. We continuecontinued to focus on cost savings initiatives to help mitigate the rising cost of commodities. Additionally, we continuecontinued to focus on a wide variety of sales initiatives which benefit our margins by improving product mix to higher margin products. Lastly, as previously discussed, we have implemented multiple sales price increases throughout the year to offset commodity cost increases.
Operating Expenses
| | | | | | | | | | | | | | | | | | |
| | | Fiscal 2006 | | | Fiscal 2007 | | | Increase | |
| | | In
Millions | | As %
Net Sales | | | In
Millions | | As %
Net Sales | | | In
Millions | | % | |
Operating expenses | | $ | 199.9 | | 15.6 | % | | $ | 221.1 | | 14.7 | % | | $ | 21.2 | | 10.6 | % |
| | | | | | | | | | | | | | | | | | |
| | | Fiscal 2007 | | | Fiscal 2006 | | | Increase | |
| | | In
Millions | | As %
Net Sales | | | In
Millions | | As %
Net Sales | | | In
Millions | | % | |
Operating expenses | | $ | 221.1 | | 14.7 | % | | $ | 199.9 | | 15.6 | % | | $ | 21.2 | | 10.6 | % |
Operating expenses represented 14.7 % of net sales in fiscal 2007 as compared to 15.6 % in fiscal 2006. Operating expenses increased $21.2 million or 10.6% in fiscal 2007 over fiscal 2006 as net sales increased 17.2%. Excluding the effect of foreign currency translation, operating expenses increased 6.1% in fiscal 2007 over fiscal 2006, while net sales increased 13.0% in fiscal 2007 over fiscal 2006. These increases also reflect the additional operating expenses and sales of the acquired FIAMM, GAZ, EAS and LeclancheLeclanché businesses. Selling expenses were 62.8% of operating expenses in fiscal 2007, compared to 64.2% in fiscal 2006. We continued to further reduce our costs in this area through cost savings initiatives and the reduction in expenses associated with being a public company. Such public company costs were reduced to approximately $8 million in fiscal 2007 from approximately $10 million in fiscal 2006 to $8 million in fiscal 2007.2006.
Restructuring and Other Charges—Operating
| | | | | | | | | | | | | | | | | | |
| | | Fiscal 2006 | | | Fiscal 2007 | | | Increase (Decrease) |
| | | In
Millions | | As %
Net Sales | | | In
Millions | | As %
Net Sales | | | In
Millions | | | % |
Restructuring and other charges | | $ | 8.6 | | 0.7 | % | | $ | — | | — | % | | $ | (8.6 | ) | | NA |
| | | | | | | | | | | | | | | | | | |
| | | Fiscal 2007 | | | Fiscal 2006 | | | Increase (Decrease) |
| | | In
Millions | | As %
Net Sales | | | In
Millions | | As %
Net Sales | | | In
Millions | | | % |
Restructuring and other charges | | $ | — | | — | % | | $ | 8.6 | | 0.7 | % | | $ | (8.6 | ) | | NA |
No restructuring charges were recorded in fiscal 2007. Included in our prior fiscal year’s operating results are $8.6 million of highlighted restructuring and other charges that were incurred to cover estimated costs, primarily in the Europe region, of staff reductions, exiting and moving product lines, and closing several ancillary locations, and a non-cash write-off of machinery and equipment based on impairment testing. These were primarily driven by the FIAMM and GAZ acquisitions. No restructuring charges were recorded in fiscal 2007.
Litigation Settlement Income—(Income)—Operating
| | | | | | | | | | | | | | | | | | | |
| | | Fiscal 2006 | | | Fiscal 2007 | | | Increase (Decrease) |
| | | In
Millions | | As %
Net Sales | | | In
Millions | | | As %
Net Sales | | | In
Millions | | | % |
Litigation settlement income | | $ | — | | — | % | | $ | (3.8 | ) | | (0.3 | )% | | $ | (3.8 | ) | | NA |
| | | | | | | | | | | | | | | | | | | |
| | | Fiscal 2007 | | | Fiscal 2006 | | | Increase (Decrease) |
| | | In
Millions | | | As %
Net Sales | | | In
Millions | | As %
Net Sales | | | In
Millions | | | % |
Litigation settlement income | | $ | (3.8 | ) | | (0.2 | )% | | $ | — | | — | % | | $ | (3.8 | ) | | NA |
Included in our fiscal 2007 operating results is litigation settlement income of $3.8 million, net of fees and expenses, from the settlement of two separate legal matters associated with our Americas business. The amounts
of the settlements have been recorded as increases in operating earnings in fiscal 2007, as the costs related to these matters were previously recorded as an element of operating earnings.
Operating Earnings
| | | | Fiscal 2006 | | Fiscal 2007 | | Increase (Decrease) | | | Fiscal 2007 | | Fiscal 2006 | | Increase (Decrease) | |
| | | In
Millions | | As %
Net Sales | | In
Millions | | As %
Net Sales | | In
Millions | | % | | | In
Millions | | As %
Net Sales(1) | | In
Millions | | As %
Net Sales(1) | | In
Millions | | % | |
Reserve power | | $ | 34.5 | | | 6.0 | % | | $ | 31.3 | | 4.9 | % | | $ | (3.2 | ) | | (9.7 | )% | | $ | 31.3 | | 4.9 | % | | $ | 34.5 | | | 6.0 | % | | $ | (3.2 | ) | | (9.7 | )% |
Motive power | | | 42.4 | | | 6.0 | | | | 58.8 | | 6.8 | | | | 16.4 | | | 39.3 | | | | 58.8 | | 6.8 | | | | 42.4 | | | 6.0 | | | | 16.4 | | | 39.3 | |
| | | | | | | | | | | | | | | | | | | | | | | | | | | | | | | | |
Subtotal | | | 76.9 | | | 6.0 | | | | 90.1 | | 6.0 | | | | 13.2 | | | 17.2 | | | | 90.1 | | 6.0 | | | | 76.9 | | | 6.0 | | | | 13.2 | | | 17.2 | |
Restructuring and other charges | | | (8.6 | ) | | (0.7 | ) | | | — | | — | | | | 8.6 | | | NA | | |
Litigation settlement income | | | — | | | — | | | | 3.8 | | 0.2 | | | | 3.8 | | | NA | | |
Restructuring and other charges-Reserve | | | | — | | — | | | | (4.5 | ) | | (0.7 | ) | | | 4.5 | | | NA | |
Restructuring and other charges-Motive | | | | — | | — | | | | (4.1 | ) | | (0.5 | ) | | | 4.1 | | | NA | |
Litigation settlement income-Reserve | | | | 3.0 | | 0.5 | | | | — | | | — | | | | 3.0 | | | NA | |
Litigation settlement income-Motive | | | | 0.8 | | 0.1 | | | | — | | | — | | | | 0.8 | | | NA | |
| | | | | | | | | | | | | | | | | | | | | | | | | | | | | | | | |
Total | | $ | 68.3 | | | 5.3 | % | | $ | 93.9 | | 6.2 | % | | $ | 25.6 | | | 37.3 | % | |
Total operating earnings | | | $ | 93.9 | | 6.2 | % | | $ | 68.3 | | | 5.3 | % | | $ | 25.6 | | | 37.3 | % |
| | | | | | | | | | | | | | | | | | | | | | | | | | | | | | | | |
| (1) | The percentages shown for the segments are computed as a percentage of the applicable segment’s net sales. |
Fiscal 2007 operating earnings of $93.9 million were $25.6 million higher than in fiscal 2006 with our operating margins increasing 90 basis points to 6.2%. ExcludingFiscal 2007 operating earnings included the effect of the highlighted charges in fiscal 2006 and the$3.8 million of highlighted litigation income inand fiscal 2007,2006 operating earnings increased $13.2 million or 17.2%. Our reserve power segment, excludingincluded the effect of the$8.6 million of highlighted charges, decreased 9.7%,restructuring and our margin declined 120 basis points. Our motive power segment, excluding the effect of the highlighted charges, increased 39.3% and our margin increased 90 basis points.other charges. As discussed above, our operating earnings were favorably affected by sales volume, price increases (particularly in the motive power segment) and our continuing cost savings programs, partially offset by higher commodity costs.
Interest Expense
| | | | | | | | | | | | | | | | | | |
| | | Fiscal 2006 | | | Fiscal 2007 | | | Increase | |
| | | In
Millions | | As %
Net Sales | | | In
Millions | | As %
Net Sales | | | In
Millions | | % | |
Interest expense | | $ | 24.9 | | 1.9 | % | | $ | 27.7 | | 1.8 | % | | $ | 2.8 | | 11.4 | % |
| | | | | | | | | | | | | | | | | | |
| | | Fiscal 2007 | | | Fiscal 2006 | | | Increase | |
| | | In
Millions | | As %
Net Sales | | | In
Millions | | As %
Net Sales | | | In
Millions | | % | |
Interest expense | | $ | 27.7 | | 1.8 | % | | $ | 24.9 | | 1.9 | % | | $ | 2.8 | | 11.4 | % |
Fiscal 2007 interest expense of $27.7 million (net of interest income of $1.1 million) increased 11.4% over fiscal 2006. Our average debt outstanding in fiscal 2007 was approximately $417 million, the same as our average debt in fiscal 2006. Our average interest rate on borrowings incurred in fiscal 2007 was 6.6%, an increase of 90 basis points from 5.7% in fiscal 2006. Included in fiscal 2007 interest expense are non-cash charges of $1.4 million for deferred financing fees, unchanged from fiscal 2006. The increase in interest expense is due primarily to higher interest rates on our variable rate debt in fiscal 2007 attributable to actions taken by central banks to increase interest rates.
Other (Income) Expense, Net
| | | | | | | | | | | | | | | | | | | |
| | | Fiscal 2006 | | | Fiscal 2007 | | | Increase | |
| | | In
Millions | | | As %
Net Sales | | | In
Millions | | As %
Net Sales | | | In
Millions | | % | |
Other (income) expense, net | | $ | (1.4 | ) | | (0.1 | )% | | $ | 3.1 | | 0.2 | % | | $ | 4.5 | | 321.4 | % |
| | | | | | | | | | | | | | | | | | | |
| | | Fiscal 2007 | | | Fiscal 2006 | | | Increase | |
| | | In
Millions | | As %
Net Sales | | | In
Millions | | | As %
Net Sales | | | In
Millions | | % | |
Other (income) expense, net | | $ | 3.1 | | 0.2 | % | | $ | (1.4 | ) | | (0.1 | )% | | $ | 4.5 | | 321.4 | % |
Fiscal 2007 other expense, net, which was $3.1 million, consists primarily of $1.6 million in foreign currency transaction losses and $1.1 million in fees related to a secondary stock offering and an abandoned acquisition attempt. This compares to fiscal 2006 other income of $1.4 million, which consisted primarily of $1.3 million in foreign currency transaction gains. Both years’ foreign currency transaction gains and losses were primarily associated with short-term intercompany loan balances.
Earnings Before Income Taxes
| | | | | | | | | | | | | | | | | | |
| | | Fiscal 2006 | | | Fiscal 2007 | | | Increase | |
| | | In
Millions | | As %
Net Sales | | | In
Millions | | As %
Net Sales | | | In
Millions | | % | |
Earnings before income taxes | | $ | 44.8 | | 3.5 | % | | $ | 63.1 | | 4.2 | % | | $ | 18.3 | | 40.8 | % |
| | | | | | | | | | | | | | | | | | |
| | | Fiscal 2007 | | | Fiscal 2006 | | | Increase | |
| | | In
Millions | | As %
Net Sales | | | In
Millions | | As %
Net Sales | | | In
Millions | | % | |
Earnings before income taxes | | $ | 63.1 | | 4.2 | % | | $ | 44.8 | | 3.5 | % | | $ | 18.3 | | 40.8 | % |
As a result of the factors discussed earlier,above, fiscal 2007 earnings before income taxes were $63.1 million, an increase of $18.3 million or 40.8% compared to fiscal 2006. Excluding theIncluded in fiscal 2007 earnings before income taxes were $3.8 million of litigation settlement income, and $1.1 million in secondary offering expenses and a loss on an abandoned acquisition attempt. Included in fiscal 2007, and the2006 earnings before income taxes were $8.6 million in restructuring and other charges in fiscal 2006, fiscal 2007 earnings before income taxes increased $7.0 million to $60.4 million or 13.1%.charges.
Income Tax Expense
| | | | Fiscal 2006 | | Fiscal 2007 | | Increase | | | Fiscal 2007 | | Fiscal 2006 | | Increase | |
| | | In
Millions | | As %
Net Sales | | In
Millions | | As %
Net Sales | | In
Millions | | % | | | In
Millions | | As %
Net Sales | | In
Millions | | As %
Net Sales | | In
Millions | | % | |
Income tax expense | | $ | 14.1 | | | 1.1 | % | | $ | 17.9 | | | 1.2 | % | | $ | 3.8 | | 27.3 | % | | $ | 17.9 | | | 1.2 | % | | $ | 14.1 | | | 1.1 | % | | $ | 3.8 | | 27.3 | % |
| | | | | | | | | | | | | | | | | | | | | | | | | | | | |
Effective tax rate | | | 31.4 | % | | | | | 28.4 | % | | | | | | | | | 28.4 | % | | | | | 31.4 | % | | | | | | |
| | | | | | | | | | | | | | | | | | | | | | | | | | | | |
The effective income tax rate was 28.4 % in fiscal 2007, compared to 31.4% in fiscal 2006. The fiscal 2007 tax expense includes a non-recurring tax benefit of approximately $2.0 million recorded in the third fiscal quarter of 2007, attributable to the favorable resolution of a prior year tax matter related to our European business, which reduced our book effective tax rate by 3.2 percentage points. Additionally, in fiscal 2007, changes in the mix of earnings among our various legal entities in multiple foreign jurisdictions had an approximate one percentage point decrease on our effective tax rate. A non-recurring $0.5 million tax benefit was recorded in the third fiscal quarter of 2006.
Net Earnings
| | | | | | | | | | | | | | | | | | |
| | | Fiscal 2006 | | | Fiscal 2007 | | | Increase | |
| | | In
Millions | | As %
Net Sales | | | In
Millions | | As %
Net Sales | | | In
Millions | | % | |
Net earnings | | $ | 30.7 | | 2.4 | % | | $ | 45.2 | | 3.0 | % | | $ | 14.5 | | 47.2 | % |
| | | | | | | | | | | | | | | | | | |
| | | Fiscal 2007 | | | Fiscal 2006 | | | Increase | |
| | | In
Millions | | As %
Net Sales | | | In
Millions | | As %
Net Sales | | | In
Millions | | % | |
Net earnings | | $ | 45.2 | | 3.0 | % | | $ | 30.7 | | 2.4 | % | | $ | 14.5 | | 47.2 | % |
As a result of the factors discussed earlier,above, fiscal 2007 net earnings were $45.2 million compared to fiscal 2006 earnings of $30.7 million. The $14.5 million increase is due primarily to a $34.4 million increase in fiscal 2007 gross profit, $3.8 million (pre-tax) of litigation settlement income in fiscal 2007 and the $8.6 million of restructuring charges fiscal 2006, partially offset by a $21.2 million increase in operating expenses, a $2.8 million increase in interest expense, a $4.5 million increase in other expense and a $3.8 million increase in income taxes. Also contributing to the improvement was the non-recurring tax benefit of approximately $2.0 million recorded in fiscal 2007.
Fiscal 2007 net earnings increased $14.5 million or 47.2% compared to fiscal 2006. Excluding the highlighted items for fiscal 2006 and 2007 discussed aboveNet earnings per common share in earnings before taxes, and the $2.0 million non-recurring fiscal 2007 tax benefit, fiscal 2007 net earnings increased $4.8 million to $41.4 million or 13.1%.
Results of Operations—Fiscal 2006 Compared to Fiscal 2005
The following table presents consolidated fiscal year ended March 31, 2006,were $0.97 per basic share and $0.95 per diluted share compared to fiscal year ended March 31, 2005, statement of income highlights:
| | | | | | | | | | | | | | | | | | | | | |
| | | Fiscal 2005 | | | Fiscal 2006 | | | Increase (Decrease) | |
| | | In
Millions | | | As %
Net Sales | | | In
Millions | | | As %
Net Sales | | | In
Millions | | | % | |
Net sales | | $ | 1,083.9 | | | 100.0 | % | | $ | 1,283.3 | | | 100.0 | % | | $ | 199.4 | | | 18.4 | % |
Cost of goods sold | | | 828.5 | | | 76.4 | | | | 1,006.5 | | | 78.4 | | | | 178.0 | | | 21.5 | |
| | | | | | | | | | | | | | | | | | | | | |
Gross profit | | | 255.4 | | | 23.6 | | | | 276.8 | | | 21.6 | | | | 21.4 | | | 8.4 | |
Operating expenses | | | 179.0 | | | 16.56 | | | | 199.9 | | | 15.6 | | | | 20.9 | | | 11.7 | |
Restructuring and other charges | | | — | | | — | | | | 8.6 | | | 0.7 | | | | 8.6 | | | NA | |
| | | | | | | | | | | | | | | | | | | | | |
Operating earnings | | | 76.4 | | | 7.0 | | | | 68.3 | | | 5.3 | | | | (8.1 | ) | | (10.6 | ) |
Interest expense | | | 23.3 | | | 2.1 | | | | 24.9 | | | 1.9 | | | | 1.6 | | | 7.0 | |
Charges relating to a write-off of deferred financing costs and a prepayment penalty | | | 6.0 | | | 0.6 | | | | — | | | — | | | | (6.0 | ) | | NA | |
Other income, net | | | (2.6 | ) | | (0.2 | ) | | | (1.4 | ) | | (0.1 | ) | | | (1.2 | ) | | (46.2 | ) |
| | | | | | | | | | | | | | | | | | | | | |
Earnings before income taxes | | | 49.7 | | | 4.6 | | | | 44.8 | | | 3.5 | | | | (4.9 | ) | | (9.9 | ) |
Income tax expense | | | 17.3 | | | 1.6 | | | | 14.1 | | | 1.1 | | | | (3.2 | ) | | (18.5 | ) |
| | | | | | | | | | | | | | | | | | | | | |
Net earnings | | $ | 32.4 | | | 3.0 | % | | $ | 30.7 | | | 2.4 | % | | $ | (1.7 | ) | | (5.2 | )% |
| | | | | | | | | | | | | | | | | | | | | |
Overview
Fiscal 2006 results include a net sales increase over fiscal 2005 of 18.4%, to $1.3 billion, with a gross profit increase of 21.4% to $276.8 million. Our gross profit margin decreased 200 basis points to 21.6% due primarily to the unfavorable effect of higher commodity$0.66 per basic and energy costs not being fully offset by selling price increases and our cost savings initiatives. Pricing recovery to offset higher commodity costs was approximately 2% of net sales and continues to be challenging. Incremental commodity costs in fiscal 2006 compared to the pricing of commodities in the comparable periods of fiscal 2005 were approximately $39 million.
Net sales by geographic region were as follows:
| | | | | | | | | | | | | | | | | | |
| | | Fiscal 2005 | | | Fiscal 2006 | | | Increase (Decrease) | |
| | | In
Millions | | % Total
Sales | | | In
Millions | | % Total
Sales | | | In
Millions | | % | |
Europe | | $ | 568.8 | | 52.5 | % | | $ | 675.4 | | 52.6 | % | | $ | 106.6 | | 18.7 | % |
Americas | | | 450.0 | | 41.5 | | | | 535.9 | | 41.8 | | | | 85.9 | | 19.1 | |
Asia | | | 65.1 | | 6.0 | | | | 72.0 | | 5.6 | | | | 6.9 | | 10.6 | |
| | | | | | | | | | | | | | | | | | |
Total | | $ | 1,083.9 | | 100.0 | % | | $ | 1,283.3 | | 100.0 | % | | $ | 199.4 | | 18.4 | % |
| | | | | | | | | | | | | | | | | | |
All geographic regions experienced solid sales growth in fiscal 2006. The euro, which had strengthened throughout fiscal 2005, weakened by an average of 4% in fiscal 2006, having an unfavorable impact on our Europe business net sales of approximately $33 million or 6%. We believe the Americas business continued to gain marketdiluted share with particularly strong growth in the motive power segment. Asia’s revenue growth is primarily attributed to continued general business expansion in that region. Further, Europe revenue benefited from the FIAMM and GAZ acquisitions, which increased their net sales by approximately $64 million or 11% in fiscal 2006. After excluding the impact of the FIAMM and GAZ acquisitions and adjusting for the impact of the weaker currencies (primarily the euro) in fiscal 2006, consolidated net sales increased approximately 15% compared to the prior year.
Operating expenses increased $20.9 million or 11.7% in fiscal 2006 over fiscal 2005. Excluding the effect of foreign currency translation, operating expenses increased 14.4%. The increase included approximately $7 million of increased expenses associated with being a public company, the additional operating expenses of the acquired FIAMM and GAZ businesses and the impact of increased sales volume.
Operating earnings by geographic region were as follows:
| | | | | | | | | | | | | | | | | | | | | |
| | | Fiscal 2005 | | | Fiscal 2006 | | | Increase (Decrease) | |
| | | In
Millions | | | As %
Net Sales | | | In
Millions | | | As %
Net Sales | | | In
Millions | | | % | |
Europe | | $ | 32.1 | | | 5.6 | % | | $ | 35.7 | | | 5.3 | % | | $ | 3.6 | | | 11.2 | % |
Americas | | | 38.7 | | | 8.6 | | | | 39.5 | | | 7.4 | | | | 0.8 | | | 2.1 | |
Asia | | | 5.8 | | | 8.9 | | | | 1.9 | | | 2.6 | | | | (3.9 | ) | | (67.2 | ) |
Other | | | (0.2 | ) | | N/A | | | | (0.2 | ) | | N/A | | | | — | | | — | |
| | | | | | | | | | | | | | | | | | | | | |
Subtotal | | | 76.4 | | | 7.0 | | | | 76.9 | | | 6.0 | | | | 0.5 | | | 0.7 | |
Restructuring and other charges | | | — | | | — | | | | 8.6 | | | 0.7 | | | | 8.6 | | | N/A | |
| | | | | | | | | | | | | | | | | | | | | |
Total | | $ | 76.4 | | | 7.0 | % | | $ | 68.3 | | | 5.3 | % | | $ | (8.1 | ) | | (10.6 | )% |
| | | | | | | | | | | | | | | | | | | | | |
Adjusting for the unfavorable impact of weaker currencies (primarily the euro), Europe’s operating earnings increased approximately 12% in fiscal 2006, which is less than the net sales growth of approximately 19%. This slower growth in operating earnings was primarily attributable to higher commodity and public company costs, partially offset by sales price increases and cost savings programs.
Americas’ operating earnings increased moderately as net sales grew by approximately 19%. The Americas’ operating earnings were also adversely affected by higher commodity and public company costs, which were partially offset by sales price increases and cost savings programs.
Asia’s operating earnings were negatively affected by higher commodity costs in fiscal 2006 with virtually no increase in sales prices realized as competitive conditions remain particularly challenging in this region.
Interest expense in fiscal 2006 increased over fiscal 2005 by approximately $1.6 million or 7.0%, due primarily to higher interest rates from our variable rate debt which offset the effect of lower average debt.
In comparing fiscal 2006 financial results to fiscal 2005, management believes it is appropriate to highlight the $8.6 million of operating restructuring charges incurred in fiscal 2006 and the $6.0 million in non-operating IPO-related charges associated with the write-off of deferred financing costs and a debt prepayment penalty incurred in fiscal 2005.
Other income, net in fiscal 2006 of $1.4 million was 1.2 million lower than the approximately $2.6 million in fiscal 2005 due primarily to lower foreign currency translation gains.
Our fiscal 2006 effective tax rate was 31.4% as compared to the fiscal 2005 rate of 34.9%. This rate reduction is primarily due to a change in the mix of earnings among our various legal entities in multiple foreign jurisdictions, which resulted in a higher proportion of our consolidated earnings being in tax jurisdictions with tax rates lower than our previous global averages, and a non-recurring $0.5 million tax benefit recorded in the third quarter of fiscal 2006 which reduced the fiscal 2006 book effective rate by 110 basis points.
These factors resulted in the net earnings decrease of $1.7 million or 5.2% to $30.7 million.
Operating Results
A discussion of specific fiscal 2006 versus fiscal 2005 operating results follows, including an analysis and discussion of the results of our two business segments.
Net Sales
| | | | | | | | | | | | | | | | | | |
| | | Fiscal 2005 | | | Fiscal 2006 | | | Increase | |
| | | In
Millions | | % Total
Sales | | | In
Millions | | % Total
Sales | | | In
Millions | | % | |
Reserve power | | $ | 510.5 | | 47.1 | % | | $ | 571.1 | | 44.5 | % | | $ | 60.6 | | 11.9 | % |
Motive power | | | 573.4 | | 52.9 | | | | 712.2 | | 55.5 | % | | | 138.8 | | 24.2 | |
| | | | | | | | | | | | | | | | | | |
Total | | $ | 1,083.9 | | 100.0 | % | | $ | 1,283.3 | | 100.0 | % | | $ | 199.4 | | 18.4 | % |
| | | | | | | | | | | | | | | | | | |
Net sales increased $199.4 million or 18.4% in fiscal 2006 over fiscal 2005. Weaker European currencies, primarily the euro compared to the U.S. dollar, resulted in a decrease of $28.4 million in fiscal 2006 net sales or 2.6%. The euro exchange rate to the U.S. dollar averaged $1.21 ($/ €) in fiscal 2006 compared to $1.27 ($/ €) in fiscal 2005. Excluding the effect of foreign currency translation, net sales increased 21.0% or $227.8 million in fiscal 2006 over fiscal 2005. Excluding the effect of foreign currency translation, both the Americas region’s net sales (up 18.5%) and Europe region’s net sales (up 24.5%) showed strong growth in fiscal 2006 compared to fiscal 2005. Our Asia sales in fiscal 2006 increased 10.0% (excluding the effect of foreign currency changes) in comparison to fiscal 2005 as a result of steady growth in many areas, partially offset by reduced sales volume to certain customers as a result of our pricing actions.
Strong efforts to pass through higher commodity costs via sales price increases were made in all regions. As described previously, competitive conditions remain challenging in our industry, with only a partial recovery of higher commodity costs experienced in fiscal 2006 from sales price increases. We estimate realized selling price increases of approximately 2% in fiscal 2006, which represents roughly one-half of the commodity cost increases experienced during this year. We remain highly focused on maximizing our pricing actions with the full impact from our two most recent announced price increases (November 2005 of 6% and January 2006, 5-10%), realized during the first half of fiscal 2007. The time lag in realizing price increases in our operating results is caused primarily by the impact of our order backlog. In general, more selling price realization has occurred in our motive power business in comparison to our reserve power business during fiscal 2006.
Fiscal 2006 net sales growth, excluding the effect of foreign currency translation, in reserve power and motive power was approximately 14.3% and 27.0%, respectively, compared to fiscal 2005.
The reserve power segment, excluding the effect of foreign currency translation when comparing fiscal 2006 sales to fiscal 2005 sales, achieved solid growth in fiscal 2006 primarily due to improving sales trends for both telecom and UPS battery markets and the strong sales of aerospace and defense batteries, coupled with the impact of approximately $4 million of increased sales from the October 2005 GAZ acquisition.
The strong growth experienced in our motive power segment in the prior year continued into fiscal 2006. Additionally, the segment included the favorable impact of approximately $60 million in sales from the June 1, 2005 FIAMM acquisition and the continued expansion of our Asia motive power business. See Note 2 of the notes to the Consolidated Financial Statements in this Form 10-K for descriptions of the FIAMM and GAZ acquisitions.
Gross Profit
| | | | | | | | | | | | | | | | | | |
| | | Fiscal 2005 | | | Fiscal 2006 | | | Increase | |
| | | In
Millions | | As %
Net Sales | | | In
Millions | | As %
Net Sales | | | In
Millions | | % | |
Gross profit | | $ | 255.4 | | 23.6 | % | | $ | 276.8 | | 21.6 | % | | $ | 21.4 | | 8.4 | % |
Gross profit increased $21.4 million or 8.4 % in fiscal 2006 compared to fiscal 2005 with the gross margin decreasing 200 basis points to 21.6%. Gross profit, excluding the effect of foreign currency translation, increased $26.6 million or 10.4% in fiscal 2006 compared to fiscal 2005. The primary cause of the decline in gross profit margin is attributed to higher commodity and energy costs not being fully offset by selling price increases. Pricing recovery to offset higher commodity costs was approximately 2% of net sales and continues to be challenging. Incremental commodity costs in fiscal 2006 compared to the pricing of commodities in the comparable periods of fiscal 2005 were approximately $39 million. Lead represents our principal raw material and approximates 21% of total cost of goods sold for fiscal 2006. Lead costs continue to increase dramatically and, on an LME basis as it affects our income statement, approximated $0.41/lb in fiscal 2006 compared to approximately $0.36/lb in the prior year. We continue to focus on cost savings initiatives to help mitigate the rising cost of commodities. Our sales initiatives will continue to focus on improving product mix to higher margin products and implementing sales price increases to offset commodity cost increases.
Operating Expenses
| | | | | | | | | | | | | | | | | | |
| | | Fiscal 2005 | | | Fiscal 2006 | | | Increase | |
| | | In
Millions | | As %
Net Sales | | | In
Millions | | As %
Net Sales | | | In
Millions | | % | |
Operating expenses | | $ | 179.0 | | 16.6 | % | | $ | 199.9 | | 15.6 | % | | $ | 20.9 | | 11.7 | % |
Operating expenses increased $20.9 million or 11.7% in fiscal 2006 over fiscal 2005. Excluding the effect of foreign currency translation, operating expenses increased 14.4%. Adjusting for expenses associated with being a public company of approximately $10 million in fiscal 2006 and $3 million in fiscal 2005, our operating expenses increased $19.0 million or 10.8% on a constant dollar basis, compared to the prior year, partially reflecting the additional operating expenses of the acquired FIAMM and GAZ businesses and increased sales volume. Selling expenses were 64.2% of operating expenses in fiscal 2006, compared to 65.4% in fiscal 2005 as we continued to further reduce our costs in this area.
Restructuring and Other Charges—Operating
| | | | | | | | | | | | | | | | | |
| | | Fiscal 2005 | | | Fiscal 2006 | | | Increase |
| | | In
Millions | | As %
Net Sales | | | In
Millions | | As %
Net Sales | | | In
Millions | | % |
Restructuring and other charges-operating | | $ | — | | — | % | | $ | 8.6 | | 0.7 | % | | $ | 8.6 | | NA |
Included in our fiscal 2006 operating results are $8.6 million of highlighted restructuring and other charges that were incurred to cover estimated costs, primarily in Europe, of staff reductions, exiting and moving product lines, and closing several ancillary locations, and a non-cash write-off of machinery and equipment based on impairment testing. These were primarily driven by the FIAMM and GAZ acquisitions.
Operating Earnings
| | | | | | | | | | | | | | | | | | | | |
| | | Fiscal 2005 | | | Fiscal 2006 | | | Increase (Decrease) | |
| | | In
Millions | | | As %
Net Sales | | | In
Millions | | As %
Net Sales | | | In
Millions | | | % | |
Reserve power | | $ | 36.8 | | | 7.2 | % | | $ | 34.5 | | 6.0 | % | | $ | (2.3 | ) | | (6.3 | )% |
Motive power | | | 39.8 | | | 6.9 | | | | 42.4 | | 6.0 | | | | 2.6 | | | 6.5 | |
Other | | | (0.2 | ) | | — | | | | — | | N/A | | | | 0.2 | | | NA | |
| | | | | | | | | | | | | | | | | | | | |
Subtotal | | | 76.4 | | | 7.0 | | | | 76.9 | | 6.0 | | | | 0.5 | | | 0.7 | |
Restructuring and other charges | | | — | | | — | | | | 8.6 | | 0.7 | | | | 8.6 | | | NA | |
| | | | | | | | | | | | | | | | | | | | |
Total | | $ | 76.4 | | | 7.0 | % | | $ | 68.3 | | 5.3 | % | | $ | (8.1 | ) | | (10.6 | )% |
| | | | | | | | | | | | | | | | | | | | |
Fiscal 2006 operating earnings of $68.3 million were $8.1 million lower than in fiscal 2005. Excluding the effect of foreign currency translation and the highlighted charges in fiscal 2006, operating earnings increased 0.9%. Operating earnings in our reserve power segment, excluding the effect of foreign currency translation, decreased 7.1%, and our margin declined 140 basis points. Our motive power segment, excluding the effect of foreign currency translation and the highlighted charges, increased 7.3% and our margin declined 94 basis points. As discussed above, our operating earnings were significantly affected by higher commodity costs and increased public company costs, partially offset by selling price increases and our continuing cost savings programs.
Interest Expense
| | | | | | | | | | | | | | | | | | |
| | | Fiscal 2005 | | | Fiscal 2006 | | | Increase | |
| | | In
Millions | | As %
Net Sales | | | In
Millions | | As %
Net Sales | | | In
Millions | | % | |
Interest expense | | $ | 23.3 | | 2.1 | % | | $ | 24.9 | | 1.9 | % | | $ | 1.6 | | 7.0 | % |
Fiscal 2006 interest expense of $24.9 million (net of interest income of $0.3 million) increased 7.0% over fiscal 2005. Our average debt outstanding in fiscal 2006 was $417 million compared to $426 million in fiscal 2005. Our average interest rate on borrowings incurred in fiscal 2006 was 5.7% compared to 4.9% in fiscal 2005. Included in fiscal 2006 interest expense are non-cash charges of $1.4 million for deferred financing fees, unchanged from fiscal 2005. The increase in interest expense is due primarily to higher interest rates in fiscal 2006, partially offset by lower average borrowings.
Other Charges Non—Operating
| | | | | | | | | | | | | | | | | | |
| | | Fiscal 2005 | | | Fiscal 2006 | | | (Decrease) |
| | | In
Millions | | As %
Net Sales | | | In
Millions | | As %
Net Sales | | | In
Millions | | | % |
Other charges non-operating | | $ | 6.0 | | 0.6 | % | | $ | — | | — | % | | $ | (6.0 | ) | | NA |
The highlighted non-operating charges of $6.0 million in fiscal 2005 included a $2.4 million prepayment penalty and a $3.6 million non-cash write-off of deferred financing costs that were associated with the IPO. There were no highlighted non-operating charges in fiscal 2006.
Other Income, Net
| | | | | | | | | | | | | | | | | | | | | |
| | | Fiscal 2005 | | | Fiscal 2006 | | | (Decrease) | |
| | | In
Millions | | | As %
Net Sales | | | In
Millions | | | As %
Net Sales | | | In
Millions | | | % | |
Other income, net | | $ | (2.6 | ) | | (0.2 | )% | | $ | (1.4 | ) | | (0.1 | )% | | $ | (1.2 | ) | | (46.2 | )% |
Fiscal 2006 other income, net of $1.4 million consists primarily of foreign currency transaction gains of $1.3 million. This compares to fiscal 2005 other income, net of $2.6 million, which consisted primarily of $1.9 million in foreign currency transaction gains. Both years’ transaction gains were primarily associated with short-term intercompany loan balances.
Earnings Before Income Taxes
| | | | | | | | | | | | | | | | | | | |
| | | Fiscal 2005 | | | Fiscal 2006 | | | (Decrease) | |
| | | In
Millions | | As %
Net Sales | | | In
Millions | | As %
Net Sales | | | In
Millions | | | % | |
Earnings before income taxes | | $ | 49.7 | | 4.6 | % | | $ | 44.8 | | 3.5 | % | | $ | (4.9 | ) | | (9.9 | )% |
Fiscal 2006 earnings before income taxes were $44.8 million, a decrease of $4.9 million compared to fiscal 2005. Excluding the $8.6 million of highlighted restructuring and other charges in fiscal 2006 and the $6.0 million in highlighted IPO-related charges in fiscal 2005, fiscal 2006 earnings before income taxes declined $2.3 million, primarily because of higher commodity and public company costs.
Income Tax Expense
| | | | | | | | | | | | | | | | | | | | | |
| | | Fiscal 2005 | | | Fiscal 2006 | | | (Decrease) | |
| | | In
Millions | | | As %
Net Sales | | | In
Millions | | | As %
Net Sales | | | In
Millions | | | % | |
Income tax expense | | $ | 17.3 | | | 1.6 | % | | $ | 14.1 | | | 1.1 | % | | $ | (3.2 | ) | | (18.5 | )% |
| | | | | | | | | | | | | | | | | | | | | |
Effective tax rate | | | 34.9 | % | | | | | | 31.4 | % | | | | | | | | | | |
| | | | | | | | | | | | | | | | | | | | | |
The fiscal 2006 effective income tax rate was 31.4% compared to 34.9% in fiscal 2005. This rate reduction is primarily due to a change in the mix of earnings among our various legal entities in multiple foreign jurisdictions, which resulted in a higher proportion of our consolidated earnings being in tax jurisdictions with tax rates lower than our previous global averages, and a non-recurring $0.5 million tax benefit recorded in the third quarter of fiscal 2006 which reduced the fiscal 2006 book effective rate by 110 basis points.
Net Earnings
| | | | | | | | | | | | | | | | | | | |
| | | Fiscal 2005 | | | Fiscal 2006 | | | (Decrease) | |
| | | In
Millions | | As %
Net Sales | | | In
Millions | | As %
Net Sales | | | In
Millions | | | % | |
Net earnings | | $ | 32.4 | | 3.0 | % | | $ | 30.7 | | 2.4 | % | | $ | (1.7 | ) | | (5.2 | )% |
Fiscal 2006 net earnings were $30.7 million compared to fiscal 2005 earnings of $32.4 million. The $1.7 million decrease is due primarily to a $21.4 million increase in gross profit, offset by a $20.9 million increase in operating expenses, $8.6 million of fiscal 2006 highlighted charges compared to $6.0 million in fiscal 2005, a $1.6 million increase in interest expense, and a $1.2 million decrease in other income. Also partially offsetting the decrease was a $3.2 million decrease in income tax expense which reflects the reduction of the pre-tax earnings and the effective income tax rate.
Liquidity and Capital Resources
Cash Flow and Financing Activities
Cash and cash equivalents at March 31, 2005,2008, 2007, and 2006, and 2007 were $21.3$20.6 million, $15.2$37.8 million, and $37.8$15.2 million, respectively.
Cash provided by operating activities for fiscal 2005,2008, 2007, and 2006, and 2007 was $29.4$4.0 million, $72.4 million and, $42.9 million, and $72.4respectively.
The $68.4 million respectively.
The $29.5 million improvementdecrease in operating cash flow in fiscal 20072008 was primarily from threefour areas: an(a) a $112.1 million increase in cash used for primary working capital and (b) $2.1 million higher spending on our restructuring activities in fiscal 2008 as compared to fiscal 2007; partially offset by (c) a favorable increase of $18.6$19.5 million in net earnings before non-cash depreciation; an $8.6depreciation and asset disposals; and (d) accrued and prepaid expenses provided $14.5 million decreasemore cash flow in cash used for primary working capital; and spending on our restructuring activities was lower than fiscal 2006 by $6.7 million.2008.
Cash used in investing activities for fiscal 2005,2008, 2007 and 2006 and 2007 was $29.0$62.2 million, $76.9$49.1 million and $49.1$76.9 million, respectively. Capital expenditures were $31.8$45.0 million, $39.7$42.4 million and $42.4$39.7 million in fiscal 2005,2008, 2007 and 2006, and 2007, respectively. The increase inmajority of capital expenditures in fiscal 2007 was primarilycontinue to be for additional capacity, new products and new products.cost savings programs. Additionally, the Company invested $17.4 million in fiscal 2008, primarily for the Energia acquisition, as compared to $7.0 million in fiscal 2007, for acquisitions as compared toand invested $38.1 million in fiscal 2006, primarily for the FIAMM and GAZ acquisitions.
As explained earlierabove in the discussion of our use of “non-GAAP financial measures,” we monitor the level and percentage of sales of our primary working capital accounts. Primary working capital for this purpose is trade accounts receivable, plus inventories, minus trade accounts payable and the resulting net amount is divided by the trailing three month net sales (annualized) to derive a primary working capital percentage. Primary working capital was $578.2 million (yielding a primary working capital percentage of 24.8%) at March 31, 2008 and $385.7 million (yielding a primary working capital percentage of 23.3%) at March 31, 2007, and $330.4 million (yielding a primary working capital percentage of 23.4%) at March 31, 2006.2007. The 0.11.5 percentage point decreaseincrease during fiscal 20072008 was due primarily to higher levels of inventory and receivables relative to sales, due in part, to improvementssignificantly higher lead costs in inventory this year, combined with an increase in trade receivables and accounts payable, largely offset by higher inventory levels, relative to sales. Approximately 0.5 percentage points of the increase was the result of higher foreign currencies at the end of fiscal 2008 than the average of those currencies during the three months prior to year end. Primary working capital and primary working capital percentages at March 31, 20072008 and 20062007 are computed as follows:
| At March 31, | | Trade
Receivables | | Inventory | | Accounts
Payable | | Total | | Quarter
Revenue
Annualized | | Primary
Working
Capital % | | | Trade
Receivables | | Inventory | | Accounts
Payable | | Total | | Quarter
Revenue
Annualized | | Primary
Working
Capital % | |
| | | | | (in millions) | | | | | | | | | | | | (in millions) | | | | | | | | |
2008 | | | $ | 503.0 | | $ | 335.7 | | $ | (260.5 | ) | | $ | 578.2 | | $ | 2,327.5 | | 24.8 | % |
2007 | | $ | 351.6 | | $ | 234.3 | | $ | (200.2 | ) | | $ | 385.7 | | $ | 1,654.4 | | 23.3 | % | | | 351.6 | | | 234.3 | | | (200.2 | ) | | | 385.7 | | | 1,654.4 | | 23.3 | % |
2006 | | | 308.6 | | | 179.5 | | | (157.7 | ) | | | 330.4 | | | 1,412.8 | | 23.4 | % | |
Cash provided by (used in) financing activities for fiscal 2005,2008, 2007 and 2006, and 2007 was $3.2$39.6 million, ($1.3) million and $27.9 million, respectively. The fiscal 2008 amount primarily reflects a net increase of $23.5 million in short-term debt associated primarily with the Energia acquisition and ($1.3)foreign line of credit borrowings, and $26.8 million respectively.related to the exercise of stock options; partially offset by $10.8 million in regularly-scheduled long term debt and capital lease payments. The fiscal 2007 amount primarily reflects $8.3 million in regularly-scheduled long term debt and capital lease payments, partially offset by a net increase of $3.6 million in short-term debt and $3.8 million related to the exercise of stock options. The fiscal 2006 amount relates primarily to the $29.9 million (euro (€25.0 million) financing of the FIAMM acquisition. The fiscal 2005 amount relates primarily to transactions related to the initial public offering of common stock. The net proceeds from the fiscal 2005 offering were approximately $139.2 million. The net proceeds and $1.7 million of other corporate funds were used to prepay the entire principal and accrued interest and prepayment penalty on our senior second lien term loan ($123.0 million) and to prepay
As a portion ($17.9 million) of our $380.0 million senior secured term loan B in fiscal 2005.
In August 2004, in order to take advantageresult of the Company’s lower leverageabove, cash and resulting lower market borrowing costs after completion of the initial public offering, we amended our senior secured credit agreementcash equivalents decreased $17.2 million from $37.8 million at March 31, 2007 to $20.6 million at March 31, 2008.
Senior Credit Agreement and reduced our borrowing rates on the senior secured term loan B by 0.50% to LIBOR+200 basis points. The existing term loans ($361.1 million plus accrued interest) were paid off and, simultaneously, new term loans of $365.0 million were borrowed.Other Financing Matters
In June 2006, we amended our senior secured credit agreement. The lenders approved the elimination of our senior secured debt leverage ratio (while maintaining our total debt leverage ratio).
In February 2007, in order to take advantage of the Company’s lower leverage and the favorable market conditions, we amended our senior secured credit agreement and reduced our borrowing rates on the senior secured term loan B by 0.25% to LIBOR+175 basis points. The existing $355.9 million term loans were converted into new term B loans. The initial $365.0 million senior secured term loanTerm Loan B has a 0.25% quarterly principal amortization and matures on March 17, 2011. The $100.0 million senior secured revolving credit facility matures on March 17, 2009. Borrowings under this credit agreement bear interest at a floating rate based,
at our option, upon a LIBOR rate plus an applicable percentage (currently 1.75%) or the greater of the federal funds rate plus 0.5% or the prime rate, plus an applicable percentage (currently 0.75%.). The average effective borrowing rates on our total debt for fiscal 2005,2008, 2007 and 2006 were 6.5%, 6.6% and 2007 were 4.9%, 5.7% and 6.6%, respectively. See Note 11 of the notesNotes to the Consolidated Financial Statements in this Form 10-K for information on our interest rate swap agreements. In March 2005, we amended our senior secured credit agreement to permit the Company’s acquisition of the motive power battery business of FIAMM S.p.A. and the secured financing for such acquisition. Additionally, the amendment revised the senior secured leverage ratio for the Company’s following six quarters. See Note 8 of the notes to the Consolidated Financial Statements in this Form 10-K for further discussion of this financing.
All obligations under the senior secured credit agreement are secured by, among other things, substantially all of our U.S. assets. Our credit agreements contain various covenants which, absent prepayment in full of the indebtedness and other obligations, or the receipt of waivers, would limit our ability to conduct certain specified business transactions, buy or sell assets out of the ordinary course of business, engage in sale and leaseback transactions, pay dividends and take certain other actions. There are no prepayment penalties on loans under the $455.9 million senior secured credit facility. We currently are in compliance with all covenants and conditions under our credit agreements.
In addition to the above described credit facility, our foreign subsidiaries maintain local credit facilities to provide credit for working capital and other purposes.
In addition to cash flows from operating activities, we had available credit lines of approximately $188.6 million at March 31, 2008 and $165.6 million at March 31, 2007 to cover short-term liquidity requirements. On a long-term basis, our senior secured revolving credit facility is committed through March 2009, as long as we continue to comply with the covenants and conditions of the facility agreement. Included in our available credit lines at March 31, 2007,2008, is $98.9$86.5 million of our senior secured revolving credit facility.
We believe that our cash flow from operations, available cash and available borrowing capacity under our senior secured credit agreement will be sufficient to meet our liquidity needs, including anticipatednormal levels of capital expenditures, for the foreseeable future; however, there can be no assurance that this will be the case. We have begun a capital expansion of our thin plate, pure lead manufacturing capacity for which we anticipate spending $50 million during fiscal years 2008, 2009 and 2010, and the capital needs of our ongoing acquisition programs may require additional funding.
We continue to review the capital markets for potential financing. On October 30, 2007, the Company filed a $500 million shelf registration statement, which included approximately $91 million for primary offerings, on Form S-3 with the SEC. This registration statement allowed the Company to offer and sell from time to time, in one or more offerings, shares of common stock and debt securities of the Company. The registration statement also permits certain institutional investors and certain members of senior management to sell shares of common stock held by such person. See Note 15 of Notes to Consolidated Financial Statements for a discussion of sales by institutional investors during fiscal 2007 and 2008
Recent Developments—Concurrent Public Offerings of Senior Convertible Notes and Common Stock and a Private Offering of a New Senior Secured Credit Facility
In May 2008, following the end of fiscal 2008, the Company completed the sale of $172.5 million aggregate principal amount of senior unsecured 3.375% convertible notes due 2038, and used the net proceeds of $168.2 million to repay a portion of its existing senior secured Term Loan B. The senior unsecured convertible notes are potentially convertible, at the option of the holders, into shares of EnerSys common stock as described in the May 19, 2008 Prospectus Supplement. The notes will mature on June 1, 2038, unless earlier converted, redeemed or repurchased.
Concurrently with the convertible note offering, certain of our stockholders sold 3.69 million shares of EnerSys’ common stock pursuant to an effective shelf registration statement filed with the Securities and Exchange Commission on May 19, 2008. We did not receive any proceeds from the common stock offering.
Also, immediately following the closing of the senior unsecured convertible note issue, we commenced refinancing the outstanding combined balance of the senior secured Term Loan B and our existing Revolver of approximately $200 million, with a new $350 million senior secured facility comprising Term A loans and a new Revolver. We expect these planned refinancing transactions will be completed in June 2008.
Amendment to Credit Agreements
On May 15, 2008, we amended the Euro 25,000 Credit Agreement and on May 16, 2008, we amended the $480,000 Senior Secured Credit Agreement. The amendments permitted us to issue up to $205,000 of unsecured indebtedness and to enter into a new $350 million US Credit Agreement on terms substantially similar to the existing Credit Agreement. See “Recent Developments”above for a discussion of these events.
Off-Balance Sheet Arrangements
The Company did not have any off-balance sheet arrangements during any of the periods covered by this report.
Contractual Obligations and Commercial Commitments
At March 31, 2007,2008, we had certain cash obligations, which are due as follows:
| | | | Total | | Less than
1 year | | 1 to 3
years | | 4 to 5
years | | After
5 years | | Total | | Less than
1 year | | 1 to 3
years | | 4 to 5
years | | After
5 years |
| | | (in millions) | | (in millions) |
Short-term debt | | $ | 11.7 | | $ | 11.7 | | $ | — | | $ | — | | $ | — | | $ | 41.1 | | $ | 41.1 | | $ | — | | $ | — | | $ | — |
Long-term debt | | | 388.0 | | | 9.4 | | | 23.3 | | | 355.3 | | | — | | | 383.6 | | | 11.9 | | | 369.3 | | | 2.4 | | | — |
Interest on debt | | | 101.3 | | | 26.6 | | | 51.4 | | | 23.3 | | | — | | | 51.5 | | | 18.2 | | | 33.3 | | | — | | | — |
Capital lease obligations | | | 2.8 | | | 1.6 | | | 1.0 | | | 0.2 | | | — | |
Capital lease obligations, including interest | | | | 2.2 | | | 1.0 | | | 1.2 | | | — | | | — |
Operating leases | | | 25.5 | | | 8.6 | | | 11.1 | | | 4.3 | | | 1.5 | | | 37.8 | | | 13.2 | | | 15.7 | | | 6.6 | | | 2.3 |
Pension and profit sharing | | | 25.6 | | | 1.9 | | | 3.9 | | | 4.6 | | | 15.2 | | | 33.7 | | | 5.3 | | | 4.3 | | | 5.1 | | | 19.0 |
Purchase Commitments | | | 5.0 | | | 5.0 | | | — | | | — | | | — | |
Interest rate swap agreements | | | | 11.6 | | | 3.5 | | | 6.5 | | | 1.6 | | | — |
Purchase commitments | | | | 2.9 | | | 2.9 | | | — | | | — | | | — |
Facility construction commitments | | | | 8.2 | | | 8.2 | | | — | | | — | | | — |
Restructuring | | | 13.0 | | | 2.5 | | | 1.0 | | | 2.0 | | | 7.5 | | | 15.8 | | | 8.3 | | | 0.2 | | | 0.2 | | | 7.1 |
| | | | | | | | | | | | | | | | | | | | |
Total | | $ | 572.9 | | $ | 66.9 | | $ | 92.1 | | $ | 389.7 | | $ | 24.2 | | $ | 588.4 | | $ | 113.6 | | $ | 430.5 | | $ | 15.9 | | $ | 28.4 |
| | | | | | | | | | | | | | | | | | | | |
Under our senior secured credit facility, we had outstanding standby letters of credit of $0.8 million, $1.2 million and $1.2 million atfor each of the years ending March 31, 2005, 20062008, 2007 and 2007, respectively. The amounts shown in the table above do not include interest charges on these cash obligations.2006.
Credit Facilities and Leverage
Our focus on working capital management and cash flow from operations is measured by our ability to reduce debt and reduce our leverage ratios. Shown below are the leverage ratios in connection with our senior secured credit agreement for fiscal 20062008 and 2007. The total leverage ratio for fiscal 20062008 is 3.42.5 times adjusted EBITDA (non-GAAP) as described below.
Our improved leverage in fiscal 2006 reflected the2008 reflects improved net earnings and positive cash flows, partially offset by approximately $17.4 million of borrowings from our available short term credit lines to fund the FIAMMEnergia acquisition in May 2007, and GAZadditional amounts to fund the increase in primary working capital caused by our higher sales volume and higher commodity prices. The total net debt, as defined under our senior secured credit agreement, for fiscal 2008 of approximately $422.7 million is 2.5 times adjusted EBITDA (non-GAAP).
Our debt at March 31, 2007 reflected fiscal 2007 acquisitions in June 2005 and October 2005, respectively.of approximately $7.0 million. The total net debt, as defined under our senior secured credit agreement, for fiscal 2007 of approximately $384.3 million is 2.8 times adjusted EBITDA (non-GAAP) as described below. Our improved leverage in fiscal 2007 reflects improved net earnings and positive cash flows. Borrowings to fund our 2007 acquisitions were approximately $7 million and were financed using our available short term credit lines. We believe our future operating cash flow, net of capital expenditures, will remain positive. .
The following table provides a reconciliation of net earnings to EBITDA (non-GAAP) and adjusted EBITDA (non-GAAP) as per our credit agreement:
| | | | | | | | |
| | | Fiscal 2006 | | | Fiscal 2007 | |
| | | (in millions,
except ratios) | |
Net earnings as reported | | $ | 30.7 | | | $ | 45.2 | |
Add back: | | | | | | | | |
Depreciation and amortization | | | 41.9 | | | | 45.9 | |
Interest expense | | | 24.9 | | | | 27.7 | |
Income tax expense | | | 14.1 | | | | 17.9 | |
| | | | | | | | |
EBITDA (non GAAP)(1) | | $ | 111.6 | | | $ | 136.7 | |
Adjustments per credit agreement definitions | | | 5.4 | (2) | | | 2.2 | (3) |
| | | | | | | | |
Adjusted EBITDA (non-GAAP) per credit agreements | | $ | 117.0 | | | $ | 138.9 | |
| | | | | | | | |
Total net debt(4) | | $ | 394.8 | | | $ | 384.3 | |
| | | | | | | | |
Leverage ratios: | | | | | | | | |
Total net debt/adjusted EBITDA ratio(5) | | | 3.4 | X | | | 2.8 | X |
Maximum ratio permitted | | | 4.4 | X | | | 3.9 | X |
Consolidated interest coverage ratio(5) | | | 4.9 | X | | | 5.2 | X |
Minimum ratio required | | | 3.2 | X | | | 3.3 | X |
| | | | | | | | |
| | | Fiscal 2008 | | | Fiscal 2007 | |
| | | (in millions, except ratios) | |
Net earnings as reported | | $ | 59.7 | | | $ | 45.2 | |
Add back: | | | | | | | | |
Depreciation and amortization | | | 47.7 | | | | 45.9 | |
Interest expense | | | 28.9 | | | | 27.7 | |
Income tax expense | | | 26.5 | | | | 17.9 | |
| | | | | | | | |
EBITDA (non GAAP)(1) | | $ | 162.8 | | | $ | 136.7 | |
Adjustments per credit agreement definitions-Stock compensation expense | | | 6.9 | (2) | | | 2.2 | (3) |
| | | | | | | | |
Adjusted EBITDA (non-GAAP) per credit agreements | | $ | 169.7 | | | $ | 138.9 | |
| | | | | | | | |
Total net debt(4) | | $ | 422.7 | | | $ | 384.3 | |
| | | | | | | | |
Leverage ratios: | | | | | | | | |
Total net debt/adjusted EBITDA ratio(5) | | | 2.5 | X | | | 2.8 | X |
Maximum ratio permitted | | | 3.3 | X | | | 3.9 | X |
Consolidated interest coverage ratio(5) | | | 6.0 | X | | | 5.2 | X |
Minimum ratio required | | | 3.4 | X | | | 3.3 | X |
| (1) | We have included EBITDA (non-GAAP) and adjusted EBITDA (non-GAAP) because our lenders use it as a key measure of our performance. EBITDA is defined as earnings before interest expense, income tax expense, depreciation and amortization. EBITDA is not a measure of financial performance under GAAP and should not be considered an alternative to net earnings or any other measure of performance under GAAP or to cash flows from operating, investing or financing activities as an indicator of cash flows or as a measure of liquidity. Our calculation of EBITDA may be different from the calculations used by other companies, and therefore comparability may be limited. Certain financial covenants in our senior secured credit facility are based on EBITDA, subject to adjustments, which is shown above. Because we have a significant amount of debt, and because continued availability of credit under our senior secured credit facility is critical to our ability to meet our business plans, we believe that an understanding of the key terms of our credit agreement is important to an investor’s understanding of our financial condition and liquidity risks. Failure to comply with our financial covenants, unless waived by our lenders, would mean we could not borrow any further amounts under our revolving credit facility and would give our lenders the right to demand immediate repayment of all outstanding term and revolving credit loans. We would be unable to continue our operations at current levels if we lost the liquidity provided under our credit agreements. Depreciation and amortization in this table excludes the amortization of deferred financing costs, which is included in interest expense. |
| (2) | The $5.4$6.9 million adjustments to EBITDA in fiscal 20062008 related primarily to $1.4the adjustment for restructuring charges which included $3.9 million for non-cash equipment write-offs and fixed asset impairment and a $4.0$3.0 million adjustment for restructuring.related primarily to stock compensation expense. |
| (3) | The $2.2 millionRepresents adjustments to EBITDA in fiscal 2007 related primarily to $2.2 million for stock compensation expense.expense of $2.2 million. |
| (4) | Debt includes capital lease obligations and letters of credit issued under the senior secured credit facility and is net of U.S. cash and cash equivalents. |
| (5) | These ratios are included to show compliance with the leverage ratios set forth in our credit facilities. We show both our current ratios and the maximum ratio permitted or minimum ratio required under our senior secured credit facility. |
Stockholders’ Equity
Stockholders’ equity increased $149.4 million during fiscal 2008, representing primarily net earnings of $59.7 million, an increase for currency translation adjustments of $75.3 million due primarily to the strengthening of the European currencies and a $29.9 million in increases related to stock-based compensation and the exercise of stock options; partially offset by a $15.8 million unrealized loss on derivative instruments.
Stockholders’ equity increased $96.9 million during fiscal 2007, representing net earnings of $45.2 million, an increase for currency translation adjustments of $41.5 million due primarily to the strengthening of the European currencies, a $5.0 million unrealized gain on derivative instruments, a $0.3 million change in minimum pension liability, and $6.9 million in increases related to stock-based compensation and the exercise of stock options. These increases were partially offset by a $2.0 million decrease due to the adoption of SFAS 158 for additional minimum pension liability. Stockholders’ equity increased $7.5 million during fiscal 2006, representing net earnings of $30.7 million, a reduction for currency translation adjustments of $24.6 million due primarily to the weakening of the European currencies, a $2.2 million decrease due primarily to minimum pension liability, a $1.7 million unrealized gain on derivative instruments and $1.9 million of proceeds from the exercise of stock options.
ACCOUNTING PRONOUNCEMENTS PENDING ADOPTION
In February, 2007,On March 19, 2008 the FASBFinancial Accounting Standards Board (“FASB”) issued Statement of Financial Accounting Standards (“SFAS”) No. 161,Disclosures about Derivative Instruments and Hedging Activities (“SFAS 161”) which is intended to improve financial reporting about derivative instruments and hedging activities by requiring enhanced disclosures to enable investors to better understand their effects on an entity’s financial position, financial performance, and cash flows. SFAS 161 is effective for financial statements issued for fiscal years and interim periods beginning after November 15, 2008, with early application encouraged. We believe SFAS 161 will have no impact on our financial position and results of operations.
On December 4, 2007, the FASB issued SFAS 141 (revised 2007),Business Combinations (“SFAS 141(R)”) which is intended to improve reporting by creating greater consistency in the accounting and financial reporting of business combinations, resulting in more complete, comparable, and relevant information for investors and other users of financial statements. To achieve this goal, the new standard requires the acquiring entity in a business combination to recognize all (and only) the assets acquired and liabilities assumed in the transaction; establishes the acquisition-date fair value as the measurement objective for all assets acquired and liabilities assumed; and requires the acquirer to disclose to investors and other users all of the information they need to evaluate and understand the nature and financial effect of the business combination. SFAS 141(R) is effective for fiscal years beginning after December 15, 2008. We are currently evaluating the impact SFAS 141(R) may have on our financial position and results of operations.
In February, 2007, the FASB issued SFAS 159,The Fair Value Option for Financial Assets and Financial Liabilities—Including an amendment of FASB Statement No. 115 (“SFAS 159”). SFAS 159 permits entities to choose to measure many financial assets and financial liabilities at fair value. Unrealized gains and losses on items for which the fair value option has been elected are reported in earnings. SFAS 159 is effective for the Companyus for the fiscal year ended March 31, 2009. The Company isWe are in the process of reviewing SFAS 159 and hashave not determined the effects on the consolidated financial statements.
In September 2006, the FASB issued SFAS No. 157,Fair Value Measurements(“SFAS 157”). SFAS 157 defines fair value, establishes a framework for measuring fair value in generally accepted accounting principles (“GAAP”), and expands disclosures about fair value measurements. The statement applies under other accounting pronouncements that require or permit fair value measurements. Accordingly, SFAS 157 does not require any new fair value measurements. However, for some entities, the application of SFAS 157 will change current practice. The Company isWe are required to adopt SFAS 157 in the first quarter of fiscal year 2009. The Company isWe are in the process of reviewing SFAS 157 and hashave not determined the effects it may have on theour consolidated financial statements.
In June 2006,May 2008, the FASB issued FASB Interpretation No. 48,Staff Position paper APB 14-1,Accounting for UncertaintyConvertible Debt Instruments That May Be Settled in Income Taxes—an InterpretationCash upon Conversion (Including Partial Cash Settlement) (“FSP APB 14-1”). This FASB Staff Position (“FSP”) will change the accounting treatment for convertible securities which the issuer
may settle fully or partially in cash. Under the final FSP, cash settled convertible securities will be separated into their debt and equity components. The value assigned to the debt component will be the estimated fair value, as of FASB Statement No. 109 (“FIN 48”). FIN 48 establishes thresholdthe issuance date, of a similar debt instrument without the conversion feature, and measurement attributesthe difference between the proceeds for the convertible debt and the amount reflected as a debt liability will be recorded as additional paid-in capital. As a result, the debt will be recorded at a discount reflecting its below market coupon interest rate. The debt will subsequently be accreted to its par value over its expected life, with the rate of interest that reflects the market rate at issuance being reflected on the income statement. This change in methodology will affect the calculations of net income and earnings per share for many issuers of cash settled convertible securities. This FSP is effective for our financial statement measurementstatements for fiscal year 2010 and recognition of tax positions taken or expected to be taken in a tax return. FIN 48 also provides guidance on derecognition, classification, interest and penalties, accounting in interim periods disclosure and transition. We are required to adopt FIN 48 as of April 1, 2007.within that fiscal year. We are currently finalizing the evaluation ofevaluating the impact that the adoption of FIN 48 willFSP APB 14-1 may have however, we do not believe the adoption of FIN 48 has a material impact on our financial statements,its financial position and results of operations or cash flows.operations.
Related Party Transactions
SFAS No. 57,Related Party Disclosures, (“SFAS 57”) requires us to identify and describe material transactions involving related persons or entities and to disclose information necessary to understand the effects of such transactions on our consolidated financial statements. In fiscal years 2008 and 2007, under the terms of its shareholders’
a security holder agreement, the Company paid approximately $0.6 million and $0.8 million, respectively, in fees related to a shelf registration statementstatements and a secondary offeringofferings of 6,000,00022 million shares of the Company’s common stock to Lehman Brothers Inc.underwriters by certain of the Company’s stockholders, including affiliates of Metalmark Capital LLC and certain other institutional stockholders.
Recent Development-Secondary Stock Offering
In May 2008, certain of our stockholders sold 3.69 million shares of EnerSys’ common stock pursuant to an effective shelf registration statement filed with the Securities and Exchange Commission on May 19, 2008. The shares were sold by various of our stockholders, including affiliates of Metalmark Capital LLC and certain other institutional stockholders. We did not receive any proceeds from the common stock offering. See “Recent Developments”above for a discussion of these events.
Quarterly Information
Fiscal 20062008 and 2007 quarterly operating results, and the associated quarterly trends within each of those two fiscal years, are affected by the same economic and business conditions as described in the fiscal 20072008 versus fiscal 20062007 analyses previously discussed.
| | | | | | | | | | | | | | | | | | | | | | | | | | | | | |
| | | Fiscal 2006 | | Fiscal 2007 |
| | | July 4,
2005
1st Qtr. | | | Oct 2,
2005 2nd
Qtr. | | | Jan 1,
2006
3rd Qtr. | | | March 31,
2006
4th Qtr. | | July 2,
2006
1st Qtr. | | | Oct 1,
2006
2nd Qtr. | | | Dec. 31,
2006
3rd Qtr. | | March 31,
2007
4th Qtr. |
| | | (in millions, except per share amounts) |
Net sales | | $ | 303.9 | | | $ | 304.4 | | | $ | 321.8 | | | $ | 353.2 | | $ | 359.0 | | | $ | 353.9 | | | $ | 377.9 | | $ | 413.6 |
Cost of goods sold | | | 237.4 | | | | 240.2 | | | | 252.2 | | | | 276.7 | | | 281.9 | | | | 276.2 | | | | 301.1 | | | 334.1 |
| | | | | | | | | | | | | | | | | | | | | | | | | | | | | |
Gross profit | | | 66.5 | | | | 64.2 | | | | 69.6 | | | | 76.5 | | | 77.1 | | | | 77.7 | | | | 76.8 | | | 79.5 |
Operating expenses, including amortization | | | 48.9 | | | | 48.3 | | | | 49.9 | | | | 52.8 | | | 54.3 | | | | 54.0 | | | | 55.7 | | | 57.1 |
Charges relating to restructuring | | | — | | | | 6.0 | | | | 2.6 | | | | — | | | — | | | | — | | | | — | | | — |
Litigation settlement income | | | — | | | | — | | | | — | | | | — | | | (2.8 | ) | | | (1.0 | ) | | | — | | | — |
| | | | | | | | | | | | | | | | | | | | | | | | | | | | | |
Operating earnings | | | 17.6 | | | | 9.9 | | | | 17.1 | | | | 23.7 | | | 25.6 | | | | 24.7 | | | | 21.1 | | | 22.4 |
Interest expense | | | 5.8 | | | | 6.3 | | | | 6.4 | | | | 6.4 | | | 7.0 | | | | 7.0 | | | | 7.1 | | | 6.6 |
Other (income) expense, net | | | (1.6 | ) | | | (0.1 | ) | | | (0.2 | ) | | | 0.5 | | | 0.8 | | | | 0.9 | | | | 0.9 | | | 0.5 |
| | | | | | | | | | | | | | | | | | | | | | | | | | | | | |
Earnings before income taxes | | | 13.4 | | | | 3.7 | | | | 10.9 | | | | 16.8 | | | 17.8 | | | | 16.8 | | | | 13.1 | | | 15.3 |
Income tax expense(1) | | | 4.6 | | | | 1.2 | | | | 3.1 | | | | 5.1 | | | 5.6 | | | | 5.3 | | | | 2.2 | | | 4.7 |
| | | | | | | | | | | | | | | | | | | | | | | | | | | | | |
Net earnings available to common stockholders | | $ | 8.8 | | | $ | 2.5 | | | $ | 7.8 | | | $ | 11.7 | | $ | 12.2 | | | $ | 11.5 | | | $ | 10.9 | | $ | 10.6 |
| | | | | | | | | | | | | | | | | | | | | | | | | | | | | |
Net earnings per common share | | | | | | | | | | | | | | | | | | | | | | | | | | | | | |
Basic | | $ | 0.19 | | | $ | 0.05 | | | $ | 0.17 | | | $ | 0.25 | | $ | 0.26 | | | $ | 0.25 | | | $ | 0.24 | | $ | 0.23 |
Diluted | | | 0.19 | | | | 0.05 | | | | 0.17 | | | | 0.25 | | | 0.26 | | | | 0.24 | | | | 0.23 | | | 0.22 |
Weighted average shares outstanding | | | | | | | | | | | | | | | | | | | | | | | | | | | | | |
Basic | | | 46,166,709 | | | | 46,214,469 | | | | 46,249,384 | | | | 46,278,229 | | | 46,338,013 | | | | 46,471,958 | | | | 46,597,387 | | | 46,751,194 |
Diluted | | | 46,366,789 | | | | 46,900,296 | | | | 46,949,052 | | | | 46,941,858 | | | 47,145,216 | | | | 47,769,804 | | | | 47,699,968 | | | 47,570,202 |
| | | | | | | | | | | | | | | | | | | | | | | | | | |
| | | Fiscal 2008 | | Fiscal 2007 |
| | | July 1,
2007
1st Qtr. | | Sept. 30,
2007 2nd
Qtr. | | Dec. 30,
2007
3rd Qtr. | | March 31,
2008
4th Qtr. | | July 2,
2006
1st Qtr. | | | Oct 1,
2006
2nd Qtr. | | | Dec. 31,
2006
3rd Qtr. | | March 31,
2007
4th Qtr. |
| | | (in millions, except per share amounts) | | |
Net sales | | $ | 429.9 | | $ | 461.4 | | $ | 553.4 | | $ | 581.9 | | $ | 359.0 | | | $ | 353.9 | | | $ | 377.9 | | $ | 413.6 |
Cost of goods sold | | | 343.3 | | | 369.4 | | | 455.9 | | | 476.1 | | | 281.9 | | | | 276.2 | | | | 301.1 | | | 334.1 |
| | | | | | | | | | | | | | | | | | | | | | | | | | |
Gross profit | | | 86.6 | | | 92.0 | | | 97.5 | | | 105.8 | | | 77.1 | | | | 77.7 | | | | 76.8 | | | 79.5 |
Operating expenses, including amortization | | | 57.5 | | | 60.1 | | | 65.0 | | | 66.8 | | | 54.3 | | | | 54.0 | | | | 55.7 | | | 57.1 |
Charges relating to restructuring | | | 9.9 | | | 0.4 | | | 1.1 | | | 1.8 | | | — | | | | — | | | | — | | | — |
Litigation settlement income | | | — | | | — | | | — | | | — | | | (2.8 | ) | | | (1.0 | ) | | | — | | | — |
| | | | | | | | | | | | | | | | | | | | | | | | | | |
Operating earnings | | | 19.2 | | | 31.5 | | | 31.4 | | | 37.2 | | | 25.6 | | | | 24.7 | | | | 21.1 | | | 22.4 |
Interest expense | | | 7.2 | | | 7.1 | | | 7.3 | | | 7.3 | | | 7.0 | | | | 7.0 | | | | 7.1 | | | 6.6 |
Other (income) expense, net | | | 1.3 | | | 0.7 | | | 1.9 | | | 0.3 | | | 0.8 | | | | 0.9 | | | | 0.9 | | | 0.5 |
| | | | | | | | | | | | | | | | | | | | | | | | | | |
Earnings before income taxes | | | 10.7 | | | 23.7 | | | 22.2 | | | 29.6 | | | 17.8 | | | | 16.8 | | | | 13.1 | | | 15.3 |
Income tax expense(1) | | | 3.3 | | | 6.9 | | | 6.2 | | | 10.1 | | | 5.6 | | | | 5.3 | | | | 2.2 | | | 4.7 |
| | | | | | | | | | | | | | | | | | | | | | | | | | |
Net earnings available to common stockholders | | $ | 7.4 | | $ | 16.8 | | $ | 16.0 | | $ | 19.5 | | $ | 12.2 | | | $ | 11.5 | | | $ | 10.9 | | $ | 10.6 |
| | | | | | | | | | | | | | | | | | | | | | | | | | |
Net earnings per common share | | | | | | | | | | | | | | | | | | | | | | | | | | |
Basic | | $ | 0.16 | | $ | 0.36 | | $ | 0.34 | | $ | 0.40 | | $ | 0.26 | | | $ | 0.25 | | | $ | 0.24 | | $ | 0.23 |
Diluted | | | 0.15 | | | 0.35 | | | 0.33 | | | 0.39 | | | 0.26 | | | | 0.24 | | | | 0.23 | | | 0.22 |
Weighted average shares outstanding | | | | | | | | | | | | | | | | | | | | | | | | | | |
Basic | | | 46,885,318 | | | 47,098,758 | | | 47,848,603 | | | 48,748,223 | | | 46,338,013 | | | | 46,471,958 | | | | 46,597,387 | | | 46,751,194 |
Diluted | | | 47,851,531 | | | 48,068,262 | | | 48,762,362 | | | 49,895,646 | | | 47,145,216 | | | | 47,769,804 | | | | 47,699,968 | | | 47,570,202 |
| (1) | Includes non-recurring tax benefits of $0.5 million recorded in the third fiscal quarter of 2006 and $2.0 million recorded in the third fiscal quarter of 2007. |
The effective income tax rate was 28.4 %30.7% in fiscal 2008, compared to the fiscal 2007 effective tax, rate before a non-recurring tax benefit, of 31.6 %. The effective income tax rate was 28.4% in fiscal 2007, compared to 31.4% in fiscal 2006. Theas the fiscal 2007 tax expense includes a non-recurring tax benefit of approximately $2.0 million recorded in the third fiscal quarter of 2007, attributable to the favorable resolution of a prior year tax matter related to our European business, which reduced our book effective tax rate by 3.2 percentage points. Additionally, in fiscal 2007, changes in the mix of earnings among our various legal entities in multiple foreign jurisdictions had an approximate one percentage point decrease on our effective tax rate. A non-recurring $0.5 million tax benefit was recorded in the third fiscal quarter of 2006.
Net Sales
Quarterly net sales by business segment were as follows:
| | | | Fiscal 2006 | | Fiscal 2007 | | | Fiscal 2008 | | Fiscal 2007 | |
| | | 1st Qtr. | | 2nd Qtr | | 3rd Qtr. | | 4th Qtr. | | 1st Qtr | | 2nd Qtr. | | 3rd Qtr. | | 4th Qtr. | | | 1st Qtr. | | 2nd Qtr. | | 3rd Qtr. | | 4th Qtr. | | 1st Qtr. | | 2nd Qtr. | | 3rd Qtr. | | 4th Qtr. | |
| | | (in millions) | | | (in millions) | |
Net sales: | | | | | | | | | | | | | | | | | | | | | | | | | | | | | | | | |
Reserve power | | $ | 136.3 | | | $ | 140.0 | | | $ | 140.8 | | | $ | 154.0 | | | $ | 158.4 | | | $ | 158.8 | | | $ | 157.0 | | | $ | 168.4 | | | $ | 184.7 | | | $ | 198.6 | | | $ | 247.9 | | | $ | 252.6 | | | $ | 158.4 | | | $ | 158.8 | | | $ | 157.0 | | | $ | 168.4 | |
Motive power | | | 167.6 | | | | 164.4 | | | | 181.0 | | | | 199.2 | | | | 200.6 | | | | 195.1 | | | | 220.9 | | | | 245.2 | | | | 245.2 | | | | 262.8 | | | | 305.5 | | | | 329.3 | | | | 200.6 | | | | 195.1 | | | | 220.9 | | | | 245.2 | |
| | | | | | | | | | | | | | | | | | | | | | | | | | | | | | | | | | | | | | | | | | | | | | | | |
Total | | $ | 303.9 | | | $ | 304.4 | | | $ | 321.8 | | | $ | 353.2 | | | $ | 359.0 | | | $ | 353.9 | | | $ | 377.9 | | | $ | 413.6 | | | $ | 429.9 | | | $ | 461.4 | | | $ | 553.4 | | | $ | 581.9 | | | $ | 359.0 | | | $ | 353.9 | | | $ | 377.9 | | | $ | 413.6 | |
| | | | | | | | | | | | | | | | | | | | | | | | | | | | | | | | | | | | | | | | | | | | | | | | |
Segment net sales as % total: | | | | | | | | | | | | | | | | | | | | | | | | | | | | | | | | |
Reserve power | | | 44.9 | % | | | 46.0 | % | | | 43.8 | % | | | 43.6 | % | | | 44.1 | % | | | 44.9 | % | | | 41.5 | % | | | 40.7 | % | | | 43.0 | % | | | 43.0 | % | | | 44.8 | % | | | 43.4 | % | | | 44.1 | % | | | 44.9 | % | | | 41.5 | % | | | 40.7 | % |
Motive power | | | 55.1 | | | | 54.0 | | | | 56.2 | | | | 56.4 | | | | 55.9 | | | | 55.1 | | | | 58.5 | | | | 59.3 | | | | 57.0 | | | | 57.0 | | | | 55.2 | | | | 56.6 | | | | 55.9 | | | | 55.1 | | | | 58.5 | | | | 59.3 | |
| | | | | | | | | | | | | | | | | | | | | | | | | | | | | | | | | | | | | | | | | | | | | | | | |
Total | | | 100.0 | % | | | 100.0 | % | | | 100.0 | % | | | 100.0 | % | | | 100.0 | % | | | 100.0 | % | | | 100.0 | % | | | 100.0 | % | | | 100.0 | % | | | 100.0 | % | | | 100.0 | % | | | 100.0 | % | | | 100.0 | % | | | 100.0 | % | | | 100.0 | % | | | 100.0 | % |
| | | | | | | | | | | | | | | | | | | | | | | | | | | | | | | | | | | | | | | | | | | | | | | | |
Fiscal 2008 net sales on a quarter-to-quarter sequential basis, excluding the effect of foreign currency translation, showed moderate increases over the first two quarters, and increased 18% in the third quarter and 4% in the final quarter of fiscal 2008, with strong growth in both reserve power and motive power segments. Historically, a smaller sequential change in the first three quarters is typical of our business as our fourth quarter is generally our strongest. However, the continued generally favorable global economic conditions, and price increases that were caused by the historical spike in lead costs, had a significant favorable impact on our sales in the second half of fiscal 2008.
Our motive power segment is heavily influenced by growth in the distribution and manufacturing sectors. Our reserve power segment is dependant on growth in telecom, UPS and aerospace & defense. On a year-on-year basis, both segments posted solid double-digit percentage gains in fiscal 2008.
Fiscal 2007 net sales on a quarter-to-quarter sequential basis, excluding the effect of foreign currency translation, were relatively unchanged over the first three quarters and increased 10% in the final quarter of fiscal 2007. The generally favorable global economic conditions that we experienced in fiscal 2006 continued to favorably impact our sales in fiscal 2007. Historically, a smaller sequential change in the first three quarters is typical of our business as our fourth quarter is generally our strongest. Our motive power segment is heavily influenced by growth in the distribution and manufacturing sectors. In fiscal 2007, the motive power segment posted solid double-digit year-on-year percentage gains. Our reserve power segment, which is dependant on growth in telecom, UPS and aerospace & defense, posted solid year-on-year percentage gains in fiscal 2007.
Fiscal 2006 net sales on a quarter-to-quarter sequential basis, excluding the effect of foreign currency translation, showed increases of approximately 5.1%, 1.2%, 12.0% and 8.1%. The generally favorable global economic conditions that we experienced in fiscal 2005 continued to favorably impact our sales in fiscal 2006. Our motive power segment included the results of FIAMM since its acquisition on June 1, 2005. In fiscal 2006, the motive power segment posted solid double-digit year-on-year percentage gains. Our reserve power segment, which is dependant on growth in telecom, UPS and aerospace & defense, and included the results of GAZ since its acquisition on October 11, 2005, posted solid year-on-year percentage gains in the first half of fiscal 2006 and double-digit year-on-year percentage gains in the second half of fiscal 2006.
The change in the mix of reserve power and motive power sales to total sales during the quarterly periods within fiscal 2007 and 20062008 primarily reflects the additioncontinued steady growth of FIAMM sales to the motive power segment throughout that year and the strong growth of the reserve power segment in the first quartersecond half of 2006, andfiscal 2008. The change in the mix within fiscal 2007 primarily reflects the strong growth of the motive power segment in fiscal 2007.throughout that year.
Operating Earnings
Fiscal 2008 operating earnings on a quarter-to-quarter sequential basis, excluding the effect of foreign currency translation, showed (decreases) increases of approximately (17)%, 67%, 4% and 15% on a quarter-to-quarter sequential basis. Our operating earnings were significantly affected by restructuring costs of $9.9 million, $0.4 million, $1.1 million and $1.8 million in the first, second, third and fourth quarters, respectively, and higher commodity costs, partially offset by selling price increases and our continuing cost savings programs.
Fiscal 2007 operating earnings on a quarter-to-quarter sequential basis, excluding the effect of foreign currency translation, showed (decreases) increases of approximately (8)%, 5%, (10)% and the favorable litigation settlements in the3% on a quarter-to-quarter sequential basis. The first and second fiscal quarters showed (decreases) increases of approximately (7.8)%, 4.9%, (10.4)% and 4.2% on a quarter-to-quarter sequential basis. Our2007 included the favorable impact of litigation settlement income. Additionally, our operating earnings were significantly affected by selling price increases and our continuing cost savings programs, partially offset by higher commodity costs.
Fiscal 2006 operating earnings on a quarter-to-quarter sequential basis, excluding the effect of foreign currency translation and the restructuring and other charges in the second and third fiscal quarters, showed (decreases) increases of approximately (0.1)%, (44.9)%, 72.2% and 38.9% on a quarter-to-quarter sequential basis. Our operating earnings were significantly affected by higher commodity and public company costs, partially offset by selling price increases and our continuing cost savings programs.
Other (Income) Expense, Net
Fiscal 2008 other (income) expense, net of $4.2 million is primarily attributed to $2.7 million in foreign currency net transaction losses associated with short-term intercompany loan balances and $0.6 million for fees related to a shelf registration and three secondary offerings.
Fiscal 2007 other (income) expense, net of $3.0 million is primarily attributed to $1.6 million in foreign currency net transaction losses associated with short-term intercompany loan balances and $0.8$1.1 million for fees related to a secondary offering.offering and an abandoned acquisition attempt.
Fiscal 2006 other income, net of $1.4 million is primarily attributed to increased foreign currency net transaction gains associated with short-term intercompany loan balances.
| ITEM 7A. | QUANTITATIVE AND QUALITATIVE DISCLOSURES ABOUT MARKET RISK |
ITEM 7A. QUANTITATIVE AND QUALITATIVE DISCLOSURES ABOUT MARKET RISK
Market Risks
EnerSys’ cash flows and earnings are subject to fluctuations resulting from changes in interest rates, foreign currency exchange rates and raw material costs. We manage our exposure to these market risks through internally established policies and procedures and, when deemed appropriate, through the use of derivative financial instruments. EnerSys’ policy does not allow speculation in derivative instruments for profit or execution of derivative instrument contracts for which there are no underlying exposures. We do not use financial instruments for trading purposes and are not a party to any leveraged derivatives. We monitor our underlying market risk exposures on an ongoing basis and believe that we can modify or adapt our hedging strategies as needed.
Interest Rate Risks
We are exposed to changes in variable U.S. interest rates on borrowings under our credit agreements. On a selective basis, from time to time, we enter into interest rate swap agreements to reduce the negative impact that increases in interest rates could have on our outstanding variable rate debt. SuchManagement considers the interest rate swaps to be highly effective against changes in the fair value of the underlying debt based on the criteria in SFAS 133. Cash flows related to the interest rate swap agreements are included in interest expense over the terms of the agreements.
Currently, such interest rate swap agreements effectively convert $203.0 million of the Company’s variable-rate debt to a fixed-rate basis, utilizing the three-month London Interbank Offered Rate, or LIBOR, as a floating rate reference. During August, November and December 2007 (see below), we entered into an additional $125.0 million of interest rate swap agreements that are effective as of February and May 2008 and will almost completely replace $128 million of interest rate swaps that mature in February and May 2008. The following commentary provides details for the $203.0 million interest rate swap agreements:
Fluctuations in LIBOR and fixed rates affect both the Company’s net financial investment position and the amount of cash to be paid or received by it under these agreements. The following commentary provides details for the $203.0 million interest rate swap contracts:
In February 2001, we entered into interest rate swap agreements to fix the interest rate on $60.0 million of our floating rate debt through February 22, 2006, at 5.59% per year. In April and May 2004, we amended these agreements to extend the maturity to February 22, 2008, and reduce the fixed rate to 5.16% per year beginning May 24, 2004.
In April 2004, we entered into interest rate swap agreements to fix interest rates on an additional $60.0 million of floating rate debt through May 5, 2008. The fixed rates per year began May 5, 2004, and are 2.85% during the first year, 3.15% the second year, 3.95% the third year and 4.75% in the fourth year, which averages 3.68% for the four-year period.
In August 2004, we entered into an interest rate swap agreement to fix interest rates on an additional $8.0 million of floating rate debt through May 5, 2008. The fixed rates per year began November 5, 2004, and are 2.85% during the first year, 3.15% the second year, 3.95% the third year and 4.20% in the fourth year, which averages 3.64% for the three and one-half year period.
In October 2005, we entered into interest rate swap agreements to fix interest rates on an additional $75.0 million of floating rate debt through December 22, 2010. The fixed rates per year plus an applicable credit spread began December 22, 2005, and are 4.25% during the first year, 4.525% the second year, 4.80% the third year, 5.075% the fourth year, and 5.47% in the fifth year, which averages 4.82% for the five-year period.
In August 2007, we entered into interest rate swap agreements, that became effective in February 2008, to fix interest rates on $40.0 million of floating rate debt through February 22, 2011, at 4.85% per year.
In November 2007, we entered into interest rate swap agreements that become effective in May 2008, to fix interest rates on $40.0 million of floating rate debt through May 7, 2013, at 4.435% per year.
In December 2007, the Company entered into $45.0 million of interest rate swap agreements that become effective in February and May 2008, to fix the interest rates on $20.0 million of floating rate debt through February 22, 2013, at 4.134% per year and to fix the interest rates on $25.0 million of floating rate debt through May 7, 2013, at 4.138% per year.
A 100 basis point increase in interest rates would increase interest expense by approximately $2.0$2.2 million.
Recent Development—Termination of Interest Rate Swap Agreements
In connection with the issuance of $172.5 million of senior unsecured convertible notes, and the repayment of a portion of the senior secured Term Loan B in May 2008, we terminated $30 million of interest rate swap agreements which had been placed in October, 2005 at a loss of $1.4 million. See “Recent Developments”above for a discussion of these events.
Commodity Cost Risks
We have a significant risk in our exposure to certain raw materials, which we estimate were approximatelyover half of total cost of goods sold for fiscal 20062008 and 2007. Our largest single raw material cost is lead, for which
the cost remains volatile. To mitigate against large increases in lead costs, we enter into contracts with financial institutions to fix the price of lead. We had the following contracts at the dates shown below:
| | | | | | | | | | | |
Date | | $’s Under Contract | | # Pounds Under Contract | | Average Contract
Price/Pound | | Approximate % of
Lead Requirements(1) | |
| | | (in millions) | | (in millions) | | | | | |
March 31, 2007 | | $ | 51.8 | | 73.5 | | $ | 0.70 | | 15 | % |
March 31, 2006 | | | 17.4 | | 32.8 | | | 0.53 | | 7 | % |
March 31, 2005 | | | 3.7 | | 9.9 | | | 0.37 | | 3 | % |
| | | | | | | | | | | |
Date | | $’s Under Contract | | # Pounds Under Contract | | Average Contract
Price/Pound | | Approximate % of
Lead Requirements(1) | |
| | | (in millions) | | (in millions) | | | | | |
March 31, 2008 | | $ | 72.3 | | 58.5 | | $ | 1.24 | | 12 | % |
March 31, 2007 | | | 51.8 | | 73.5 | | | 0.70 | | 15 | % |
March 31, 2006 | | | 17.4 | | 32.8 | | | 0.53 | | 7 | % |
| (1) | Based on the fiscal year lead requirements for the period then ended. |
We estimate that a 10% increase in our cost of lead (over our estimated cost in fiscal 2007)2008) would increase our annual total cost of goods sold by approximately $27.0$54 million or 1.8%3% of net sales.
Foreign Currency Exchange Rate Risks
The Company manufactures its products primarily in Bulgaria, China, France, Germany, Italy, Mexico, Poland, the United Kingdom Bulgaria and the United States. Over half of the Company’s sales and expenses are transacted in foreign currencies. The Company’s sales revenue, production costs, profit margins and competitive position are affected by the strength of the currencies in countries where it manufactures or purchases goods relative to the strength of the currencies in countries where the Company’s products are sold. Additionally, as the Company reports its financial statements in the U.S. dollar, our financial results are affected by the strength of the currencies in countries where it has operations relative to the strength of the U.S. dollar. The principal foreign currencies in which the Company conducts business are the euro, British pound, Polish zloty, Mexican peso, Canadian dollar and Chinese renminbi.
We quantify and monitor our global foreign currency exposures. On a selective basis we will enter into foreign currency forward contracts and option contracts to reduce the volatility from currency movements that affect the Company. Based primarily on statistical currency correlations on the Company’s exposures in fiscal 2007,2008, we are highly confident that the pretax effect on annual earnings of changes in the principal currencies in which we conduct our business would not be in excess of approximately $6$8 million in more than one year out of twenty years.
Our largest exposure is from the purchase and conversion of U.S. dollar based lead costs into local currencies in Europe, China and Mexico. Additionally, we have currency exposures from intercompany trade transactions. To hedge these exposures we have entered into forward and purchased option contracts with financial institutions to fix the value at which we will buy or sell certain currencies. Each contract is for a period not extending beyond one year. As of March 31, 2007,2008, March 31, 20062007 and March 31, 2005,2006, we had entered into a total of $99.6 million, $93.1 million, and $34.3 million and $0 forward contracts, with the March 31, 20072008 details as follows:
| | | | | | | | |
Transactions Hedged | | $US Equivalent
(in millions) | | Average Rate
Hedged | | Approximate % of Annual
Requirements(2) | |
Sell Euros for U.S. dollars | | $ | 74.0 | | $/€1.32 | | 50 | % |
Sell UK pounds for U.S. dollars | | | 9.1 | | $/£1.92 | | 53 | % |
Sell Euros for Polish zloty | | | 8.5 | | PLN/€3.89 | | 47 | % |
Sell Canadian dollars for U.S. dollars | | | 1.5 | | Can/$1.11 | | 13 | % |
| | | | | | | | |
Total | | $ | 93.1 | | | | | |
| | | | | | | | |
| | | | | | | | |
Transactions Hedged | | $US Equivalent
(in millions) | | Average Rate
Hedged | | Approximate % of
Annual
Requirements(2) | |
Sell Euros for U.S. dollars | | $ | 91.5 | | $/€1.47 | | 39 | % |
Sell UK pounds for U.S. dollar | | | 8.1 | | $/£1.97 | | 28 | % |
| | | | | | | | |
Total | | $ | 99.6 | | | | | |
| | | | | | | | |
| (2) | Based on the fiscal year currency requirements for the year ended March 31, 2007.2008. |
Foreign exchange translation adjustments are recorded on the Consolidated Statements of Comprehensive Income.
Based on changes in the timing and amount of interest rate and foreign currency exchange rate movements and our actual exposures and hedges, actual gains and losses in the future may differ from our historical results.
ITEM 8.FINANCIAL STATEMENTS AND SUPPLEMENTARY DATA
Contents
EnerSys
Consolidated financial statements for fiscal years ended March 31, 2005,2008, 2007 and 2006 and 2007
MANAGEMENT’S REPORT ON INTERNAL CONTROL OVER FINANCIAL REPORTING
The management of the Company is responsible for establishing and maintaining adequate internal control over financial reporting as defined in Rules 13a-15(f) and 15d-15(f) under the Securities Exchange Act of 1934. The Company’s internal control over financial reporting is a process designed to provide reasonable assurance regarding the reliability of financial reporting and the preparation of financial statements for external purposes in accordance with generally accepted accounting principles. The Company’s internal control over financial reporting includes those policies and procedures that: (i) pertain to the maintenance of records that, in reasonable detail, accurately and fairly reflect the transactions and dispositions of the assets of the Company; (ii) provide reasonable assurance that transactions are recorded as necessary to permit preparation of financial statements in accordance with generally accepted accounting principles, and that receipts and expenditures of the Company are being made only in accordance with authorizations of management and directors of the Company; and (iii) provide reasonable assurance regarding prevention or timely detection of unauthorized acquisition, use or disposition of the Company’s assets that could have a material effect on the financial statements.
Because of its inherent limitations, internal control over financial reporting may not prevent or detect misstatements. Also, projections of any evaluation of effectiveness to future periods are subject to the risk that controls may become inadequate because of changes in conditions, or that the degree of compliance with the policies or procedures may deteriorate.
Management of the Company assessed the effectiveness of the Company’s internal control over financial reporting as of March 31, 2007, based on the criteria established inInternal Control—Integrated Framework issued by the Committee of Sponsoring Organizations of the Treadway Commission. Based on this assessment, management concluded that the Company’s internal control over financial reporting was effective as of March 31, 2007.
The Company’s independent registered public accounting firm has issued an attestation report on management’s assessment of the Company’s internal control over financial reporting as of March 31, 2007. That report appears in our Annual Report on Form 10-K under the heading Report of Independent Registered Public Accounting Firm on Internal Control Over Financial Reporting.
| | | | |
/s/ JOHN D. CRAIG | | | | /s/ MICHAEL T. PHILION |
John D. Craig | | | | Michael T. Philion |
Chairman, President and | | | | Executive Vice President-Finance and |
Chief Executive Officer | | | | Chief Financial OfficerB-63 |
Report of Independent Registered Public Accounting Firm
On Internal Control overOver Financial Reporting
The Board of Directors and Stockholders
EnerSys
We have audited management’s assessment, included in the accompanying Management’s Report on Internal Control Over Financial Reporting, that EnerSys maintained effectiveEnerSys’ internal control over financial reporting as of March 31, 20072008, based on criteria established inInternal Control—Integrated Framework issued by the Committee of Sponsoring Organizations of the Treadway Commission (the COSO criteria). EnerSys’ management is responsible for maintaining effective internal control over financial reporting and for its assessment of the effectiveness of internal control over financial reporting.reporting included in the accompanyingManagement’s Report On Internal Control Over Financial Reporting. Our responsibility is to express an opinion on management’s assessment and an opinion on the effectiveness of the company’s internal control over financial reporting based on our audit.
We conducted our audit in accordance with the standards of the Public Company Accounting Oversight Board (United States). Those standards require that we plan and perform the audit to obtain reasonable assurance about whether effective internal control over financial reporting was maintained in all material respects. Our audit included obtaining an understanding of internal control over financial reporting, evaluating management’s assessment,assessing the risk that a material weakness exists, testing and evaluating the design and operating effectiveness of internal control based on the assessed risk, and performing such other procedures as we considered necessary in the circumstances. We believe that our audit provides a reasonable basis for our opinion.
A company’s internal control over financial reporting is a process designed to provide reasonable assurance regarding the reliability of financial reporting and the preparation of financial statements for external purposes in accordance with generally accepted accounting principles. A company’s internal control over financial reporting includes those policies and procedures that (1) pertain to the maintenance of records that, in reasonable detail, accurately and fairly reflect the transactions and dispositions of the assets of the company; (2) provide reasonable assurance that transactions are recorded as necessary to permit preparation of financial statements in accordance with generally accepted accounting principles, and that receipts and expenditures of the company are being made only in accordance with authorizations of management and directors of the company; and (3) provide reasonable assurance regarding prevention or timely detection of unauthorized acquisition, use, or disposition of the company’s assets that could have a material effect on the financial statements.
Because of its inherent limitations, internal control over financial reporting may not prevent or detect misstatements. Also, projections of any evaluation of effectiveness to future periods are subject to the risk that controls may become inadequate because of changes in conditions, or that the degree of compliance with the policies or procedures may deteriorate.
In our opinion, management’s assessment that EnerSys maintained effective internal control over financial reporting as of March 31, 2007 is fairly stated, in all material respects, based on the COSO criteria. Also, in our opinion, EnerSys maintained, in all material respects, effective internal control over financial reporting as of March 31, 20072008, based on the COSO criteria.
We also have audited, in accordance with the standards of the Public Company Accounting Oversight Board (United States), the consolidated balance sheets of EnerSys as of March 31, 2008 and 2007, and the related consolidated financial statements of EnerSysincome, changes in stockholders’ equity, and cash flows for each of the three years in the period ended March 31, 2008 and our report dated June 11, 20076, 2008 expressed an unqualified opinion thereon.
/s/ Ernst & Young LLP
Philadelphia, Pennsylvania
June 11, 20076, 2008
Report of Independent Registered Public Accounting Firm
On Consolidated Financial Statements and Schedule
The Board of Directors and Stockholders
EnerSys
We have audited the accompanying consolidated balance sheets of EnerSys as of March 31, 20072008 and 2006,2007, and the related consolidated statements of income, changes in stockholders’ equity, and cash flows for each of the three years in the period ended March 31, 2007.2008. Our audits also included the financial statement schedule listed in the index at Item 15(a). These financial statements and schedule are the responsibility of the Company’s management. Our responsibility is to express an opinion on these financial statements and schedule based on our audits.
We conducted our audits in accordance with the standards of the Public Company Accounting Oversight Board (United States). Those standards require that we plan and perform the audit to obtain reasonable assurance about whether the financial statements are free of material misstatement. An audit includes examining, on a test basis, evidence supporting the amounts and disclosures in the financial statements. An audit also includes assessing the accounting principles used and significant estimates made by management, as well as evaluating the overall financial statement presentation. We believe that our audits provide a reasonable basis for our opinion.
In our opinion, the financial statements referred to above present fairly, in all material respects, the consolidated financial position of EnerSys at March 31, 20072008 and 2006,2007, and the consolidated results of its operations and its cash flows for each of the three years in the period ended March 31, 2007,2008, in conformity with U.S. generally accepted accounting principles. Also, in our opinion, the related financial statement schedule, when considered in relation to the basic financial statements taken as a whole, presents fairly in all material respects the information set forth therein.
As discussed in Note 1 of Notes to the consolidated financial statements,Consolidated Financial Statements, the Company changed its method for accounting for employee stock compensation plans and defined benefit pension and other postretirement plans in 2007.
We also have audited, in accordance with the standards of the Public Company Accounting Oversight Board (United States), the effectiveness of EnerSys’ internal control over financial reporting as of March 31, 2007,2008, based on criteria established inInternal Control—Integrated Framework issued by the Committee of Sponsoring Organizations of the Treadway Commission and our report dated June 11, 20076, 2008 expressed an unqualified opinion thereon.
/s/ Ernst & Young LLP
Philadelphia, Pennsylvania
June 11, 20076, 2008
EnerSys
Consolidated Balance Sheets
(In Thousands, Except Share and Per Share Data)
| | | | March 31 | | March 31, |
| | | 2006 | | 2007 | | 2008 | | 2007 |
| Assets | | | | | | | | |
Current assets: | | | | | | | | |
Cash and cash equivalents | | $ | 15,217 | | | $ | 37,785 | | $ | 20,620 | | $ | 37,785 |
Accounts receivable, net | | | 308,625 | | | | 351,594 | | | 503,013 | | | 351,594 |
Inventories, net | | | 179,537 | | | | 234,326 | | | 335,729 | | | 234,326 |
Deferred taxes | | | 20,338 | | | | 11,433 | | | 16,848 | | | 11,433 |
Prepaid and other current assets | | | 23,978 | | | | 39,155 | | | 34,986 | | | 39,155 |
| | | | | | | | | |
Total current assets | | | 547,695 | | | | 674,293 | | | 911,196 | | | 674,293 |
| Property, plant, and equipment, net | | | 281,744 | | | | 300,995 | | | 339,997 | | | 300,995 |
Goodwill | | | 316,729 | | | | 332,874 | | | 358,429 | | | 332,874 |
Other intangible assets, net | | | 80,831 | | | | 80,540 | | | 80,139 | | | 80,540 |
Deferred taxes | | | 13,843 | | | | — | | | 3,347 | | | — |
Other assets | | | 23,106 | | | | 20,311 | | | 17,682 | | | 20,311 |
| | | | | | | | | |
Total assets | | $ | 1,263,948 | | | $ | 1,409,013 | | $ | 1,710,790 | | $ | 1,409,013 |
| | | | | | | | | |
| Liabilities and stockholders’ equity | | | | | | | | |
Current liabilities: | | | | | | | | |
Short-term debt | | $ | 6,571 | | | $ | 11,729 | | $ | 41,113 | | $ | 11,729 |
Current portion of long-term debt | | | 8,225 | | | | 9,353 | | | 11,926 | | | 9,353 |
Current portion of capital lease obligations | | | 1,367 | | | | 1,563 | | | 1,042 | | | 1,563 |
Accounts payable | | | 157,792 | | | | 200,157 | | | 260,530 | | | 200,157 |
Accrued expenses | | | 159,671 | | | | 175,239 | | | 202,475 | | | 175,239 |
Deferred taxes | | | 2,635 | | | | — | | | 4,630 | | | — |
| | | | | | | | | |
Total current liabilities | | | 336,261 | | | | 398,041 | | | 521,716 | | | 398,041 |
| Long-term debt | | | 384,142 | | | | 378,667 | | | 371,685 | | | 378,667 |
Capital lease obligations | | | 2,185 | | | | 999 | | | 988 | | | 999 |
Deferred taxes | | | 55,357 | | | | 43,690 | | | 44,161 | | | 43,690 |
Other liabilities | | | 40,815 | | | | 45,517 | | | 80,697 | | | 45,517 |
| | | | | | | | | |
Total liabilities | | | 818,760 | | | | 866,914 | | | 1,019,247 | | | 866,914 |
| Stockholders’ equity: | | | | | | | | |
Series A Convertible Preferred Stock, $0.01 par value, 1,000,000 shares authorized, no shares issued or outstanding at March 31, 2006 and at March 31, 2007 | | | — | | | | — | |
Common Stock, $0.01 par value, 135,000,000 shares authorized, 46,560,940 shares issued and outstanding at March 31, 2006; 47,042,444 shares issued and outstanding at March 31, 2007 | | | 466 | | | | 471 | |
Series A Convertible Preferred Stock, $0.01 par value, 1,000,000 shares authorized, no shares issued or outstanding at March 31, 2008 and at March 31, 2007 | | | | — | | | — |
Common Stock, $0.01 par value, 135,000,000 shares authorized, 49,060,906 shares issued and outstanding at March 31, 2008; 47,042,444 shares issued and outstanding at March 31, 2007 | | | | 491 | | | 471 |
Additional paid-in capital | | | 335,263 | | | | 339,114 | | | 368,963 | | | 339,114 |
Unearned stock grant compensation | | | (3,090 | ) | | | — | |
Retained earnings | | | 54,270 | | | | 99,480 | | | 159,176 | | | 99,480 |
Accumulated other comprehensive income | | | 58,279 | | | | 103,034 | | | 162,913 | | | 103,034 |
| | | | | | | | | |
Total stockholders’ equity | | | 445,188 | | | | 542,099 | | | 691,543 | | | 542,099 |
| | | | | | | | | |
Total liabilities and stockholders’ equity | | $ | 1,263,948 | | | $ | 1,409,013 | | $ | 1,710,790 | | $ | 1,409,013 |
| | | | | | | | | |
See accompanying notes.
EnerSys
Consolidated Statements of Income
(In Thousands Except Share and Per Share Data)
| | | | Fiscal year ended March 31, | | | Fiscal year ended March 31, | |
| | | 2005 | | 2006 | | 2007 | | | 2008 | | 2007 | | 2006 | |
Net sales | | $ | 1,083,862 | | | $ | 1,283,265 | | | $ | 1,504,474 | | | $ | 2,026,640 | | $ | 1,504,474 | | | $ | 1,283,265 | |
Cost of goods sold | | | 828,447 | | | | 1,006,467 | | | | 1,193,266 | | | | 1,644,753 | | | 1,193,266 | | | | 1,006,467 | |
| | | | | | | | | | | | | | | | | |
Gross profit | | | 255,415 | | | | 276,798 | | | | 311,208 | | | | 381,887 | | | 311,208 | | | | 276,798 | |
Operating expenses | | | 179,015 | | | | 199,900 | | | | 221,102 | | | | 249,350 | | | 221,102 | | | | 199,900 | |
Restructuring and other charges | | | — | | | | 8,553 | | | | — | | | | 13,191 | | | — | | | | 8,553 | |
Litigation settlement income | | | — | | | | — | | | | (3,753 | ) | | | — | | | (3,753 | ) | | | — | |
| | | | | | | | | | | | | | | | | |
Operating earnings | | | 76,400 | | | | 68,345 | | | | 93,859 | | | | 119,346 | | | 93,859 | | | | 68,345 | |
Interest expense | | | 23,275 | | | | 24,900 | | | | 27,733 | | | | 28,917 | | | 27,733 | | | | 24,900 | |
Charges relating to a settlement agreement, write-off of deferred financing costs and a prepayment penalty | | | 6,022 | | | | — | | | | — | | |
Other (income) expense, net | | | (2,639 | ) | | | (1,358 | ) | | | 3,024 | | | | 4,234 | | | 3,024 | | | | (1,358 | ) |
| | | | | | | | | | | | | | | | | |
Earnings before income taxes | | | 49,742 | | | | 44,803 | | | | 63,102 | | | | 86,195 | | | 63,102 | | | | 44,803 | |
Income tax expense | | | 17,359 | | | | 14,077 | | | | 17,892 | | | | 26,499 | | | 17,892 | | | | 14,077 | |
| | | | | | | | | | | | | | | | | |
Net earnings | | $ | 32,383 | | | $ | 30,726 | | | $ | 45,210 | | | $ | 59,696 | | $ | 45,210 | | | $ | 30,726 | |
Series A convertible preferred stock dividends | | | 8,155 | | | | — | | | | — | | |
| | | | | | | | | | |
Net earnings available to common shareholders | | $ | 24,228 | | | $ | 30,726 | | | $ | 45,210 | | |
| | | | | | | | | | | | | | | | | |
Net earnings per common share: | | | | | | | | | | | | |
Basic | | $ | 0.67 | | | $ | 0.66 | | | $ | 0.97 | | | $ | 1.25 | | $ | 0.97 | | | $ | 0.66 | |
| | | | | | | | | | | | | | | | | |
Diluted | | $ | 0.65 | | | $ | 0.66 | | | $ | 0.95 | | | $ | 1.22 | | $ | 0.95 | | | $ | 0.66 | |
| | | | | | | | | | | | | | | | | |
Weighted-average shares of common stock outstanding: | | | | | | | | | | | | |
Basic | | | 36,416,358 | | | | 46,226,582 | | | | 46,539,638 | | | | 47,645,225 | | | 46,539,638 | | | | 46,226,582 | |
| | | | | | | | | | | | | | | | | |
Diluted | | | 37,046,697 | | | | 46,788,363 | | | | 47,546,240 | | | | 48,644,450 | | | 47,546,240 | | | | 46,788,363 | |
| | | | | | | | | | | | | | | | | |
See accompanying notes.
EnerSys
Consolidated Statements of Changes in Stockholders’ Equity
(In Thousands)
| | | | Series A
Convertible
Preferred
Stock | | Common
Stock | | Paid-in
Capital | | Unearned
Stock
Compensation | | Retained
Earnings
(Deficit) | | Accumulated
Other
Comprehensive
Income | | Total
Stockholders’
Equity | | | Series A
Convertible
Preferred
Stock | | Common
Stock | | Paid-in
Capital | | Unearned
Stock
Compensation | | Retained
Earnings | | Accumulated
Other
Comprehensive
Income | | Total
Stockholders’
Equity | |
Balance at March 31, 2004 | | $ | 7 | | | $ | 110 | | $ | 188,766 | | | $ | — | | | $ | (8,839 | ) | | $ | 59,258 | | | $ | 239,302 | | |
| Stock-based compensation | | | — | | | | — | | | 210 | | | | — | | | | — | | | | — | | | | 210 | | |
Converted to common stock at IPO | | | (7 | ) | | | 225 | | | (218 | ) | | | — | | | | — | | | | — | | | | — | | |
Exercise of stock options | | | — | | | | 2 | | | 2,364 | | | | — | | | | — | | | | — | | | | 2,366 | | |
Net IPO proceeds | | | — | | | | 125 | | | 139,107 | | | | — | | | | — | | | | — | | | | 139,232 | | |
Net earnings | | | — | | | | — | | | — | | | | — | | | | 32,383 | | | | — | | | | 32,383 | | |
Other comprehensive income: | | | | | | | | | | | | | | | |
Minimum pension liability adjustment, net of tax of $142 | | | — | | | | — | | | — | | | | — | | | | — | | | | (259 | ) | | | (259 | ) | |
Unrealized income on derivative instruments, net of tax of $(1,810) | | | — | | | | — | | | — | | | | — | | | | — | | | | 2,746 | | | | 2,746 | | |
Foreign currency translation adjustment | | | — | | | | — | | | — | | | | — | | | | — | | | | 21,670 | | | | 21,670 | | |
| | | | | | | | | | | | | | | | |
Comprehensive income | | | | | | | | | | | | | | | 56,540 | | |
| | | | | | | | | | | | | | | | | | | | | |
Balance at March 31, 2005 | | | — | | | | 462 | | | 330,229 | | | | — | | | | 23,544 | | | | 83,415 | | | | 437,650 | | | $ | — | | $ | 462 | | $ | 330,229 | | | $ | — | | | $ | 23,544 | | $ | 83,415 | | | $ | 437,650 | |
| Stock-based compensation | | | — | | | | — | | | — | | | | 381 | | | | — | | | | — | | | | 381 | | | | — | | | — | | | — | | | | 381 | | | | — | | | — | | | | 381 | |
Issuance of restricted shares | | | — | | | | 3 | | | 3,468 | | | | (3,471 | ) | | | — | | | | — | | | | — | | | | — | | | 3 | | | 3,468 | | | | (3,471 | ) | | | — | | | — | | | | — | |
Exercise of stock options | | | — | | | | 1 | | | 1,566 | | | | — | | | | — | | | | — | | | | 1,567 | | | | — | | | 1 | | | 1,566 | | | | — | | | | — | | | — | | | | 1,567 | |
Net earnings | | | — | | | | — | | | — | | | | — | | | | 30,726 | | | | — | | | | 30,726 | | | | — | | | — | | | — | | | | — | | | | 30,726 | | | — | | | | 30,726 | |
Other comprehensive income: | | | | | | | | | | | | | | | | | | | | | | | | | | | | |
Minimum pension liability adjustment, net of tax of $58 | | | — | | | | — | | | — | | | | — | | | | — | | | | (2,251 | ) | | | (2,251 | ) | | | — | | | — | | | — | | | | — | | | | — | | | (2,251 | ) | | | (2,251 | ) |
Unrealized income on derivative instruments, net of tax of $(991) | | | — | | | | — | | | — | | | | — | | | | — | | | | 1,739 | | | | 1,739 | | | | — | | | — | | | — | | | | — | | | | — | | | 1,739 | | | | 1,739 | |
Foreign currency translation adjustment | | | — | | | | — | | | — | | | | — | | | | — | | | | (24,624 | ) | | | (24,624 | ) | | | — | | | — | | | — | | | | — | | | | — | | | (24,624 | ) | | | (24,624 | ) |
| | | | | | | | | | | | | | | | | | | | | | | | | | | | | | |
Comprehensive income | | | | | | | | | | | | | | | 5,590 | | | | | | | | | | | | | | | | 5,590 | |
| | | | | | | | | | | | | | | | | | | | | | | | | | | | | | | | | | | | | | |
Balance at March 31, 2006 | | | — | | | | 466 | | | 335,263 | | | | (3,090 | ) | | | 54,270 | | | | 58,279 | | | | 445,188 | | | | — | | | 466 | | | 335,263 | | | | (3,090 | ) | | | 54,270 | | | 58,279 | | | | 445,188 | |
| Reclassification of unearned stock compensation | | | — | | | | — | | | (3,090 | ) | | | 3,090 | | | | — | | | | — | | | | — | | | | — | | | — | | | (3,090 | ) | | | 3,090 | | | | — | | | — | | | | — | |
Stock-based compensation | | | — | | | | — | | | 3,118 | | | | — | | | | — | | | | — | | | | 3,118 | | | | — | | | — | | | 3,118 | | | | — | | | | — | | | — | | | | 3,118 | |
Exercise of stock options | | | — | | | | 5 | | | 1,797 | | | | — | | | | — | | | | — | | | | 1,802 | | | | — | | | 5 | | | 1,797 | | | | — | | | | — | | | — | | | | 1,802 | |
Tax benefit from stock options | | | — | | | | — | | | 2,026 | | | | — | | | | — | | | | — | | | | 2,026 | | | | — | | | — | | | 2,026 | | | | — | | | | — | | | — | | | | 2,026 | |
Adoption of SFAS 158, net of tax of $832 | | | | — | | | — | | | — | | | | — | | | | — | | | (1,983 | ) | | | (1,983 | ) |
Net earnings | | | — | | | | — | | | — | | | | — | | | | 45,210 | | | | — | | | | 45,210 | | | | — | | | — | | | — | | | | — | | | | 45,210 | | | — | | | | 45,210 | |
Accumulated other comprehensive income | | | — | | | | — | | | — | | | | — | | | | — | | | | 46,738 | | | | 46,738 | | |
Adoption of SFAS 158, net of tax of $832 | | | — | | | | — | | | — | | | | — | | | | — | | | | (1,983 | ) | | | (1,983 | ) | |
| | | | | | | | | | | | | | | | | | | | | |
Balance at March 31, 2007 | | $ | — | | | $ | 471 | | $ | 339,114 | | | $ | — | | | $ | 99,480 | | | $ | 103,034 | | | $ | 542,099 | | |
| | | | | | | | | | | | | | | | | | | | | |
2007 Comprehensive income | | | | | | | | | | | | | | | |
Net Income | | | | | | | | | | $ | 45,210 | | | $ | — | | | $ | 45,210 | | |
Other comprehensive income: | | | | | | | | | | | | | | | |
Minimum pension liability adjustment, net of tax of $(7) | | | | | | | | | | | — | | | | 259 | | | | 259 | | | | — | | | — | | | — | | | | — | | | | — | | | 259 | | | | 259 | |
Unrealized income on derivative instruments, net of tax of $(2,637) | | | | | | | | | | | — | | | | 4,966 | | | | 4,966 | | | | — | | | — | | | — | | | | — | | | | — | | | 4,966 | | | | 4,966 | |
Foreign currency translation adjustment | | | | | | | | | | | — | | | | 41,513 | | | | 41,513 | | | | — | | | — | | | — | | | | — | | | | — | | | 41,513 | | | | 41,513 | |
| | | | | | | | | | | | | | | | | | | | | | | | | | | | | | | | | | | |
Comprehensive income | | | | | | | | | | $ | 45,210 | | | $ | 46,738 | | | $ | 91,948 | | | | | | | | | | | | | | | | 91,948 | |
| | | | | | | | | | | | | | | | | | | | | | | | | | | | | | | | |
Balance at March 31, 2007 | | | | — | | | 471 | | | 339,114 | | | | — | | | | 99,480 | | | 103,034 | | | | 542,099 | |
| | | | | | | | | | | | | | | | | | | |
Stock-based compensation | | | | — | | | — | | | 3,028 | | | | — | | | | — | | | — | | | | 3,028 | |
Exercise of stock options | | | | — | | | 20 | | | 22,794 | | | | — | | | | — | | | — | | | | 22,814 | |
Tax benefit from stock options | | | | — | | | — | | | 4,027 | | | | — | | | | — | | | — | | | | 4,027 | |
Net earnings | | | | — | | | — | | | — | | | | — | | | | 59,696 | | | — | | | | 59,696 | |
Other comprehensive income: | | | | | | | | | | | | | | | |
Pension funded status adjustment, net of tax of $(411) | | | | — | | | — | | | — | | | | — | | | | — | | | 352 | | | | 352 | |
Unrealized loss on derivative instruments, net of tax benefit of $8,499 | | | | — | | | — | | | — | | | | — | | | | — | | | (15,783 | ) | | | (15,783 | ) |
Foreign currency translation adjustment | | | | — | | | — | | | — | | | | — | | | | — | | | 75,310 | | | | 75,310 | |
| | | | | | | | | | | | | | | | | | | |
Comprehensive income | | | | | | | | | | | | | | | | 119,575 | |
| | | | | | | | | | | | | | | | |
Balance at March 31, 2008 | | | $ | — | | $ | 491 | | $ | 368,963 | | | $ | — | | | $ | 159,176 | | $ | 162,913 | | | $ | 691,543 | |
| | | | | | | | | | | | | | | | | | | |
See accompanying notes.
EnerSys
Consolidated Statements of Cash Flows
(In Thousands)
| | | | Fiscal year ended March 31 | | | Fiscal year ended March 31, | |
| | | 2005 | | 2006 | | 2007 | | | 2008 | | 2007 | | 2006 | |
Cash flows from operating activities | | | | | | | | | | | | |
Net earnings | | $ | 32,383 | | | $ | 30,726 | | | $ | 45,210 | | | $ | 59,696 | | | $ | 45,210 | | | $ | 30,726 | |
Adjustments to reconcile net earnings to net cash provided by operating activities: | | | | | | | | | | | | |
Write-off of deferred financing costs | | | 3,622 | | | | — | | | | — | | |
Depreciation and amortization | | | 41,541 | | | | 43,270 | | | | 47,358 | | | | 49,215 | | | | 47,358 | | | | 43,270 | |
Provision for doubtful accounts | | | (441 | ) | | | 596 | | | | 315 | | | | 1,436 | | | | 315 | | | | 596 | |
Provision for deferred taxes | | | 9,907 | | | | 5,518 | | | | 7,970 | | | | 7,972 | | | | 7,970 | | | | 5,518 | |
Stock compensation expense | | | 210 | | | | 381 | | | | 3,118 | | | | 3,028 | | | | 3,118 | | | | 381 | |
Loss on disposal and impairment of fixed assets | | | 2,109 | | | | 2,604 | | | | 730 | | | | 3,908 | | | | 730 | | | | 2,604 | |
Changes in assets and liabilities, net of effects of acquisitions: | | | | | | | | | | | | |
Accounts receivable | | | (13,396 | ) | | | (56,017 | ) | | | (22,673 | ) | | | (107,113 | ) | | | (22,673 | ) | | | (56,017 | ) |
Inventory | | | (8,205 | ) | | | (25,757 | ) | | | (39,642 | ) | | | (70,278 | ) | | | (39,642 | ) | | | (25,757 | ) |
Prepaid expenses and other current assets | | | 3,649 | | | | 2,244 | | | | (4,799 | ) | | | 374 | | | | (4,799 | ) | | | 2,244 | |
Other assets | | | (428 | ) | | | 340 | | | | (322 | ) | | | 4,585 | | | | (322 | ) | | | 340 | |
Accounts payable | | | 1,713 | | | | 42,531 | | | | 31,659 | | | | 34,593 | | | | 31,659 | | | | 42,531 | |
Accrued expenses | | | (27,717 | ) | | | (1,928 | ) | | | 6,522 | | | | 15,805 | | | | 6,522 | | | | (1,928 | ) |
Other liabilities | | | (15,594 | ) | | | (1,636 | ) | | | (3,022 | ) | | | 797 | | | | (3,022 | ) | | | (1,636 | ) |
| | | | | | | | | | | | | | | | | | |
Net cash provided by operating activities | | | 29,353 | | | | 42,872 | | | | 72,424 | | | | 4,018 | | | | 72,424 | | | | 42,872 | |
| Cash flows from investing activities | | | | | | | | | | | | |
Capital expenditures | | | (31,828 | ) | | | (39,665 | ) | | | (42,355 | ) | | | (45,037 | ) | | | (42,355 | ) | | | (39,665 | ) |
Purchase of businesses, net of cash acquired | | | (1,168 | ) | | | (38,135 | ) | | | (6,979 | ) | | | (17,434 | ) | | | (6,979 | ) | | | (38,135 | ) |
Proceeds from disposal of property, plant, and equipment | | | 4,005 | | | | 924 | | | | 282 | | | | 321 | | | | 282 | | | | 924 | |
| | | | | | | | | | | | | | | | | | |
Net cash used in investing activities | | | (28,991 | ) | | | (76,876 | ) | | | (49,052 | ) | | | (62,150 | ) | | | (49,052 | ) | | | (76,876 | ) |
| Cash flows from financing activities | | | | | | | | | | | | |
Net increase in short-term debt | | | 2,351 | | | | 1,453 | | | | 3,607 | | | | 23,516 | | | | 3,607 | | | | 1,453 | |
Proceeds from the issuance of long-term debt | | | 365,000 | | | | 29,979 | | | | 127 | | | | — | | | | 127 | | | | 29,979 | |
Deferred financing costs | | | (1,249 | ) | | | (322 | ) | | | (572 | ) | | | (23 | ) | | | (572 | ) | | | (322 | ) |
Payments of long-term debt | | | (502,967 | ) | | | (4,110 | ) | | | (6,964 | ) | | | (9,780 | ) | | | (6,964 | ) | | | (4,110 | ) |
Payments of capital lease obligations, net | | | (1,175 | ) | | | (661 | ) | | | (1,349 | ) | | | (996 | ) | | | (1,349 | ) | | | (661 | ) |
Exercise of stock options | | | 1,676 | | | | 1,492 | | | | 1,802 | | | | 22,814 | | | | 1,802 | | | | 1,492 | |
Tax benefits from exercise of stock options | | | 345 | | | | 74 | | | | 2,026 | | | | 4,027 | | | | 2,026 | | | | 74 | |
Net proceeds from initial public offering | | | 139,232 | | | | — | | | | — | | |
| | | | | | | | | | | | | | | | | | |
Net cash provided by (used in) financing activities | | | 3,213 | | | | 27,905 | | | | (1,323 | ) | | | 39,558 | | | | (1,323 | ) | | | 27,905 | |
Effect of exchange rate changes on cash | | | 559 | | | | (25 | ) | | | 519 | | | | 1,409 | | | | 519 | | | | (25 | ) |
| | | | | | | | | | | | | | | | | | |
Net increase (decrease) in cash and cash equivalents | | | 4,134 | | | | (6,124 | ) | | | 22,568 | | |
Net (decrease) increase in cash and cash equivalents | | | | (17,165 | ) | | | 22,568 | | | | (6,124 | ) |
Cash and cash equivalents at beginning of year | | | 17,207 | | | | 21,341 | | | | 15,217 | | | | 37,785 | | | | 15,217 | | | | 21,341 | |
| | | | | | | | | | | | | | | | | | |
Cash and cash equivalents at end of year | | $ | 21,341 | | | $ | 15,217 | | | $ | 37,785 | | | $ | 20,620 | | | $ | 37,785 | | | $ | 15,217 | |
| | | | | | | | | | | | | | | | | | |
See accompanying notes.
EnerSys
Notes to Consolidated Financial Statements
March 31, 20072008
(In Thousands, Except Share and Per Share Data)
1. Summary of Significant Accounting Policies
Description of Business
EnerSys and its predecessor companies have been manufacturers of industrial batteries for over 100 years. Morgan Stanley Capital Partners (currently Metalmark Capital) teamed with the management of Yuasa, Inc. in late 2000 to acquire from Yuasa Corporation (Japan) its reserve power and motive power battery businesses in North and South America. We wereThe Company was incorporated in October 2000 for the purpose of completing the Yuasa, Inc. acquisition from Yuasa Corporation (Japan). The acquired businesses included the Exide, General and Yuasa brands. On January 1, 2001, wethe Company changed ourits name from Yuasa, Inc. to EnerSys to reflect our focus on the energy systems nature of ourits businesses. In earlyMarch 2002, wethe Company acquired the reserve power and motive power business of the Energy Storage Group (ESG), of Invensys plc (Invensys), whose principal brands were Hawker, PowerSafe andDataSafe. In June 2005, wethe Company acquired the motive power battery business of FIAMM, S.p.A. (FIAMM). FIAMM complements ourits existing European motive power business and its principal brand isFIAMM MOTIVE POWER.In October 2005, wethe Company acquired Gerate- und Akkumulatorwerk Zwickau GmbH (GAZ), based in Zwickau, Germany. GAZ is a producer of specialty nickel-based batteries utilized primarily in the energy, rail, telecommunications and uninterruptible power supply (UPS) industries worldwide, and its principal brand isGAZ.In May 2007, the Company acquired approximately a 97% interest in the reserve power and motive power business of Energia AD, located in Targovishte, Bulgaria. The acquisition provides the Company with an additional low cost manufacturing platform with substantial expansion potential and increases the Company’s market presence in the rapidly growing Eastern European and Russian markets. Energia’s principal brand isEnergia.
In August 2004, EnerSys completed an initial public offering (IPO) and issued 12,500,000 shares of our common stock at a value of $12.50 per share. The Company’s Registration Statement (SEC File No. 333-115553) for its IPO was declared effective by the Securities and Exchange Commission on July 26, 2004. The Company’s common stock commenced trading on the New York Stock Exchange on July 30, 2004, under the trading symbol “ENS.” At the completion of the offering, we had 45,945,559 shares of common stock outstanding, which included 11,014,421 shares that were outstanding prior to the IPO, 22,431,138 shares of common stock converted from preferred shares, and 12,500,000 new shares issued in the IPO. The net proceeds from the offering were approximately $139,232. The net proceeds and $1,696 of other corporate funds were used to prepay the entire principal and accrued interest and prepayment penalty on our senior second lien term loan ($123,015) and to prepay a portion ($17,913) of our $380,000 senior secured term loan B.
Principles of Consolidation
The consolidated financial statements include the accounts of the Company and its majority-owned and wholly-owned subsidiaries. All intercompany transactions and balances have been eliminated.
Foreign Currency Translation
Results of foreign operations are translated into United States dollars using average exchange rates during the period. The assets and liabilities are translated into United States dollars using current rates as of the balance sheet date. Gains or losses resulting from translating the foreign currency financial statements are accumulated as a separate component of accumulated other comprehensive income in stockholders’ equity.
Transaction gains and losses resulting from exchange rate changes on transactions denominated in currencies other than the functional currency of the applicable subsidiary are included in other income, net in the year in which the change occurs.
EnerSys
Notes to Consolidated Financial Statements—(Continued)
March 31, 2007
(In Thousands, Except Share and Per Share Data)
Revenue Recognition
The Company recognizes revenue when the earnings process is complete. This occurs when we ship in accordance with terms of the underlying agreement, title transfers, collectabilitycollectibility is reasonably assured and pricing is fixed and determinable. Shipment terms to our battery product customers are eitherprimarily shipping point or destination and accordingly revenue is recognized when title is transferred to the customer. Our customer shipment terms are primarily FOB shipping point and do not differ significantly between our regions of the world. Accordingly revenue is recognized when title is transferred to the customer. Amounts invoiced to customers for shipping and handling are classified as revenue. Taxes on revenue producing transactions are not included in net sales. The Company’s revenue recognition policy does not differ significantly between customers or regions of the world.
EnerSys
Notes to Consolidated Financial Statements—(Continued)
March 31, 2008
(In Thousands, Except Share and Per Share Data)
The Company recognizes revenue from the service of its reserve power and motive power products when the respective services are performed.
Accruals are made at the time of sale for sales returns and other allowances based on the Company’s experience.
Freight Expense
Amounts billed to customers for outbound freight costs are classified as sales in the consolidated income statement. Costs incurred by the Company for outbound freight costs to customers, inbound and transfer freight are classified in cost of sales.
Warranties
Substantially all of the Company’s products are warranted for a period of one to twenty years. The Company provides for estimated product warranty expenses when the related products are sold.
Cash and Cash Equivalents
Cash and cash equivalents include all highly liquid investments with an original maturity of three months or less when purchased.
Accounts Receivable
Accounts receivable are reported net of an allowance for doubtful accounts of $4,565$5,008 and $4,420 at March 31, 20062008 and 2007, respectively. The allowance is based on management’s estimate of uncollectible accounts, analysis of historical data and trends, as well as review of all relevant factors concerning the financial capability of its customers. Accounts receivable are considered to be past due based on how payments are received compared to the customer’s credit terms. Accounts are written off when management determines the account is worthless.
Inventories
Inventories are stated at the lower of cost or market. Cost is determined using the first-in, first-out (FIFO) method. The cost of inventory consists principally of material, labor, and associated overhead.
EnerSys
Notes to Consolidated Financial Statements—(Continued)
March 31, 2007
(In Thousands, Except Share and Per Share Data)
Property, Plant, and Equipment
Property, plant, and equipment are recorded at cost and include expenditures that substantially increase the useful lives of the assets. Depreciation is provided using the straight-line method over the estimated useful lives of the assets as follows: 10 to 33 years for buildings and improvements and 3 to 15 years for machinery and equipment.
Depreciation expense for the fiscal years ended March 31, 2005,2008, 2007 and 2006 totaled $47,151, $45,379 and 2007 totaled $40,102, $41,466, and $45,379, respectively. Maintenance and repairs are expensed as incurred. Interest on capital projects is capitalized during the construction period and amounted to $208,$829, $756 and $334 and $756 for the fiscal years ended March 31, 2005,2008, 2007 and 2006, respectively.
EnerSys
Notes to Consolidated Financial Statements—(Continued)
March 31, 2008
(In Thousands, Except Share and 2007, respectively.Per Share Data)
Intangible Assets
Statement of Financial Accounting Standards No. 142,Goodwill and Other Intangible Assets(“SFAS 142”) eliminated the amortization of goodwill and indefinite-lived intangible assets and requires a review at least annually for impairment. The Company has determined that trade names and goodwill are indefinite-lived assets, as defined by SFAS 142, and therefore not subject to amortization.
The Company tests for the impairment of its goodwill and trade names at least annually and whenever events or circumstances occur indicating that a possible impairment has been incurred. The Company utilizes financial projections of its reporting segments, certain cash flow measures, as well as its market capitalization in its determination of the fair value of these assets.
Environmental Expenditures
In accordance with SFAS No. 5Accounting for Contingencies(“ (“SFAS 5”) and Statement of Position 96-1,Environmental Remediation Liabilities, we record a loss and establish a reserve for the remediation when it is probable that an asset has been impaired or a liability exists and the amount of the liability can be reasonable estimated. Reasonable estimates involve judgments made by management after considering a broad range of information including: notifications, demands or settlements that have been received from a regulatory authority or private party, estimates performed by independent engineering companies and outside counsel, available facts existing and proposed technology, the identification of other potentially responsible parties, their ability to contribute and prior experience. These judgments are reviewed quarterly as more information is received and the amounts reserved are updated as necessary. However, the reserves may materially differ from ultimate actual liabilities if the loss contingency is difficult to estimate or if management’s judgments turn out to be inaccurate. If management believes no best estimate exists, the minimum probable loss is accrued.
Impairment of Long-Lived Assets
SFAS No. 144, Accounting for Impairment or Disposal of Long-Lived Assets(“SFAS 144”), requires that companies consider whether indicators of impairment of long-lived assets held for use are present. If such indicators are present, companies determine whether the sum of the estimated undiscounted future cash flows attributable to such assets is less than their carrying amount, and if so, companies recognize an impairment loss based on the excess of the carrying amount of the assets over their fair value. In fiscal 20052008 and 2006, the Company recorded impairment charges of $1,153$3,863 and $1,273, respectively, which arewere included in operating expenses.
EnerSys
Notes to Consolidated Financial Statements—(Continued)
March 31, 2007
(In Thousands, Except Sharerestructuring and Per Share Data)other charges.
Financial Instruments
The Company’s financial instruments include cash and cash equivalents, accounts receivable, accounts payable, and debt. The Company uses interest rate swap and option agreements to manage risk on a portion of its floating-rate debt. The Company uses lead hedge contracts to manage risk of the cost of lead. The Company uses foreign currency forward and purchased option contracts to manage the risk on the purchase and conversion of U.S. dollar based lead costs into local currencies in Europe and China, as well as currency exposures from intercompany trade transactions.
Because of short maturities, the carrying amount of cash and cash equivalents, accounts receivable, accounts payable, and short-term debt approximates fair value. The fair value of the Company’s long-term debt, described in Note 8, approximates its carrying value and the fair value of derivative instruments is described in Note 11.
EnerSys
Notes to Consolidated Financial Statements—(Continued)
March 31, 2008
(In Thousands, Except Share and Per Share Data)
Income Taxes
We account for income taxes in accordance with SFAS 109 No. 109,Accounting for Income Taxes(“SFAS 109”), which requires that deferred tax assets and liabilities be recognized using enacted tax rates for the effect of temporary differences between book and tax bases on recorded assets and liabilities. SFAS 109 also requires that deferred tax assets be reduced by a valuation allowance, if it is more likely than not that some portion or all of the deferred tax assets will not be recognized.
We evaluate on a quarterly basis the reliability of our deferred tax assets by assessing our valuation allowance and by adjusting the amount of such allowance, if necessary. The factors used to assess the likelihood of realization are our forecast of future taxable income and available tax planning strategies that could be implemented to realize the net deferred tax assets.
Deferred tax assets and liabilities are recognized for the future tax consequences attributable to temporary differences between the financial statement carrying amounts of existing assets and liabilities and their respective tax bases. These temporary differences are measured using enacted tax rates expected to apply to taxable income in the years in which the temporary differences are expected to be realized.
Valuation allowances are recorded to reduce deferred tax assets when it is more likely than not that a tax benefit will not be realized. The provision for income taxes represents income taxes paid or payable for the current year and the change in deferred taxes.
The Company accounts for income tax contingencies inIn accordance with the SFASFASB Interpretation No. 5,48, Accounting for Contingencies (“SFAS 5”). The Company is subject to periodic auditsUncertainty in Income Taxes—an interpretation of its income tax returns by federal, state and local agencies. In evaluating the exposures associated with our various tax filing positions, including state and local taxes,FASB Statement No. 109, which the Company records reserves for whatadopted on April 1, 2007, the Company evaluates tax positions to determine whether the benefits of tax positions are more likely than not of being sustained upon audit based on the technical merits of the tax position. For tax positions that are more likely than not of being sustained upon audit, the Company recognizes the largest amount of the benefit that is identified as probable exposures. A numbergreater than 50% likely of years may elapse before a particular matterbeing realized upon ultimate settlement in the financial statements. For tax positions that are not more likely than not of being sustained upon audit, the Company does not recognize any portion of the benefit in the financial statements. If the more likely than not threshold is not met in the period for which a reserve has been establishedtax position is audited and fully resolved. The estimatetaken, the Company may subsequently recognize the benefit of the Company’sthat tax contingencies reserve contains uncertainty because management must use judgment to estimate the exposures associated with various tax filing positions. To make these judgments, management makes determinations about the likelihood that the specific taxing authority may challengeposition if the tax deductions that have been taken onmatter is effectively settled, the Company’s tax return. Based on information about other tax settlements,statute of limitations expires, or if the Company estimates amounts that may be settled with taxing authorities in order to conclude audits. To the extent the Company prevails in matters for which reserves have been established, ormore likely than not threshold is required to pay amounts in excess of its reserves, its effective tax ratemet in a given financial statement period could be materially affected.subsequent period. (See Note 12.)
An unfavorable tax settlement would require use of the Company’s cash and result in an increase in the effective tax rate in the year of resolution. A favorable tax settlement would be recognized as a reduction in the Company’s effective tax rate in the year of resolution.
Deferred Financing Fees
In March 2004, the Company entered into two credit facilities with various portions that will expire in 2009, 2011 and 2012. Deferred financing fees associated with the newthese credit facilities of $11,000 were incurred and will be amortized over the life of the new credit facilities. Deferred financing fees of $6,569 related to the previously existing credit facility were written off.
In August 2004, the Company prepaid the entire $120,000 principal and accrued interest on the senior second lien term loan and prepaid a portion, $17,900, of the $380,000 senior secured term loan B. Deferred financing fees of $3,622, relating to the prepaid $137,900 of debt were written off in August 2004.
Deferred financing fees, net of accumulated amortization totaled $4,641 and $6,054 as of March 31, 2008 and 2007, respectively. Amortization expense included in interest expense was $1,586, $1,462 and $1,384 for the fiscal years ended March 31, 2008, 2007 and 2006, respectively.
EnerSys
Notes to Consolidated Financial Statements—(Continued)
March 31, 20072008
(In Thousands, Except Share and Per Share Data)
Deferred financing fees, net of accumulated amortization totaled $6,639 and $6,054 as of March 31, 2006 and 2007, respectively. Amortization expense included in interest expense was $1,388, $1,384 and $1,462 for the fiscal years ended March 31, 2005, 2006 and 2007, respectively.
Derivative Financial Instruments
The Company has entered into interest rate swap agreements and option agreements to manage risk on a portion of its long-term floating-rate debt. The Company has entered into lead forward purchase contracts to manage risk of the cost of lead. The Company has entered into foreign exchange forward contracts and purchased option contracts to manage risk on foreign currency exposures. The agreements are with major financial institutions, and the Company believes the risk of nonperformance by the counterparties is negligible. The counterparties to certain of these agreements are lenders under the Credit Agreement and liabilities related to these agreements are covered under the security provisions of the Credit Agreement. The Company does not hold or issue derivative financial instruments for trading or speculative purposes. SFAS 133, as amended, establishes accounting and reporting standards for derivative instruments and hedging activities. The Company recognizes all derivatives as either assets or liabilities in the accompanying balance sheet and measures those instruments at fair value. Changes in the fair value of those instruments are reported in accumulated other comprehensive income if they qualify for hedge accounting or in earnings if they do not qualify for hedge accounting. Derivatives qualify for hedge accounting if they are designated as hedge instruments and if the hedge is highly effective in achieving offsetting changes in the fair value or cash flow of the asset or liability hedged. Effectiveness is measured on a regular basis using statistical analysis and by comparing the overall changes in the expected cash flows on the lead and foreign currency forward contracts with the changes in the expected all-in cash outflow required for the lead and foreign currency purchases. This analysis is performed on the initial purchases each monthquarterly that cover the quantities hedged. Accordingly, gains and losses from changes in derivative fair value are deferred until the underlying transaction occurs. Interest expense on the debt is adjusted to include the payments made or received under such interest rate swap agreements. Inventory and cost of goods sold are adjusted to include the payments made or received under such lead and foreign currency forward contracts. Any deferred gains or losses associated with derivative instruments, which on infrequent occasions may be terminated prior to maturity, are recognized in earnings in the period in which the underlying hedged transaction is recognized. In the event a designated hedged item is sold, extinguished or matures prior to the termination of the related derivative instrument, such instrument would be closed and the resulting gain or loss would be recognized in earnings.
Pension Plans
The companyCompany uses certain assumptions in the calculation of the actuarial valuation of ourits defined benefit plans. These assumptions include the weighted average discount rate, rates of increase in compensation levels and expected long-term rates of return of assets. If actual results are less favorable than those projected by us,the Company, additional expense may be required.
In September 2006, the FASB issued Statement of Financial Accounting Standards No. 158,Employers’ Accounting for Defined Benefit Pension and Other Postretirement Plans—an amendment of FASB No. 87, 88, 106, and 132(R)(“SFAS 158”). SFAS 158 requires an entity to recognize in its statement of financial position an asset for a defined benefit postretirement plan’s overfunded status or a liability for a plan’s underfunded status, measure a defined benefit postretirement plan’s assets and obligation that determine its funded status as of the end of the employer’s fiscal year, and recognize changes in the funded status of a defined benefit postretirement plan in other comprehensive income in the year in which the change occurs. The requirement to recognize the funded status of a defined benefit postretirement plan became effective March 31, 2007, and the Company adopted the recognition requirements as of March 31, 2007.
EnerSys
Notes to Consolidated Financial Statements—(Continued)
March 31, 2007
(In Thousands, Except Share and Per Share Data)
In connection with the fiscal 2007 adoption of SFAS 158, the Company recorded an additional pension liability of $2,815 for the remaining underfunded status of ourits benefit plans at March 31, 2007, with an offsetting amount recorded in accumulated other comprehensive income, net of taxes.
EnerSys
Notes to Consolidated Financial Statements—(Continued)
March 31, 2008
(In Thousands, Except Share and Per Share Data)
Stock-Based Compensation Plans
The Company maintains three management equity incentive plans that reserve 11,289,232 shares of Common Stock for the grant of various classes of nonqualified stock options, restricted stock, restricted stock units and other forms of equity based compensation. The 2000 Management Equity Plan, the 2004 Equity Incentive Plan and the 2006 Equity Incentive Plan are described more fully in Note 16. Non-qualified stock options have been granted to employees under these plans at prices not less than the fair market value of the shares on the dates the options were granted. Generally, options vest over a four-year period and become exercisable in annual installments over the vesting period. Options generally expire in 10 years. As of March 31, 2008, the Company had 2,344,800 shares available for future grants.
During fiscal years 2005 andyear 2006, the Company followed the provisions of SFAS No. 148,Accounting for Stock-Based Compensation-Transition and Disclosure, an Amendment of FASB Statement No. 123 (“SFAS 148”) that allowed an entity to continue to measure compensation cost for those instruments using the intrinsic-value-based method of accounting prescribed by Accounting Principles Board Opinion (“APB”) No. 25,Accounting for Stock Issued to Employees (“APB 25”), provided it disclosed the effect of SFAS 123, as amended by SFAS 148, in footnotes to the financial statements. Accordingly, no stock option related compensation expense was recognized for its stock-based compensation plans during fiscal 2005 and 2006.
On April 1, 2006, the Company adopted, using the modified prospective application, Statement of Financial Accounting Standards No. 123(revised 2004),Share-Based Payment (“SFAS 123(R)”). SFAS 123(R) requires all share-based payments to employees, including grants of employee stock options and shares purchased under an employee stock purchase plan (if certain parameters are not met), to be recognized in the financial statements based on their fair values. Under the modified prospective method, prior interim period and prior fiscal year financial statements will not reflect any restated amounts for the adoption of SFAS 123(R). Upon its adoption of SFAS 123(R), the Company began recording compensation cost related to the continued vesting of all stock options that remained unvested as of April 1, 2006, as well as for all stock options granted, modified or cancelled after the Company’s adoption date. The compensation cost is being recorded based on the fair value at the grant date.
Accumulated Other Comprehensive Income
The components of accumulated other comprehensive income net of tax, are as follows:
| | | | | | | | | | | | | | | | | | | | |
| | | Beginning
Balance | | | Before-Tax
Amount | | | Tax Benefit
(Expense) | | | Net-of-Tax
Amount | | | Ending
Balance | |
March 31, 2005 | | | | | | | | | | | | | | | | | | | | |
Minimum pension liabilities | | $ | (1,456 | ) | | $ | (401 | ) | | $ | 142 | | | $ | (259 | ) | | $ | (1,715 | ) |
Unrealized (loss) income on derivative instruments | | | (2,578 | ) | | | 4,556 | | | | (1,810 | ) | | | 2,746 | | | | 168 | |
Foreign currency translation adjustment | | | 63,292 | | | | 21,670 | | | | — | | | | 21,670 | | | | 84,962 | |
| | | | | | | | | | | | | | | | | | | | |
Accumulated other comprehensive income, net of
tax | | $ | 59,258 | | | $ | 25,825 | | | $ | (1,668 | ) | | $ | 24,157 | | | $ | 83,415 | |
| | | | | | | | | | | | | | | | | | | | |
| | | | | | | | | | | | | | | | | | | | |
| | | Beginning
Balance | | | Before-Tax
Amount | | | Tax Benefit
(Expense) | | | Net-of-Tax
Amount | | | Ending
Balance | |
March 31, 2008 | | | | | | | | | | | | | | | | | | | | |
Pension funded status adjustment | | $ | (5,690 | ) | | $ | (59 | ) | | $ | 411 | | | $ | 352 | | | $ | (5,338 | ) |
Unrealized gain (loss) income on derivative instruments | | | 6,873 | | | | (24,282 | ) | | | 8,499 | | | | (15,783 | ) | | | (8,910 | ) |
Foreign currency translation adjustment | | | 101,851 | | | | 75,310 | | | | — | | | | 75,310 | | | | 177,161 | |
| | | | | | | | | | | | | | | | | | | | |
Accumulated other comprehensive income | | $ | 103,034 | | | | 50,969 | | | | 8,910 | | | | 59,879 | | | | 162,913 | |
| | | | | | | | | | | | | | | | | | | | |
| | | | | |
March 31, 2007 | | | | | | | | | | | | | | | | | | | | |
Minimum pension liabilities | | $ | (3,966 | ) | | $ | (2,549 | ) | | $ | 825 | | | $ | (1,724 | ) | | $ | (5,690 | ) |
Unrealized income on derivative instruments | | | 1,907 | | | | 7,603 | | | | (2,637 | ) | | | 4,966 | | | | 6,873 | |
Foreign currency translation adjustment | | | 60,338 | | | | 41,513 | | | | — | | | | 41,513 | | | | 101,851 | |
| | | | | | | | | | | | | | | | | | | | |
Accumulated other comprehensive income | | $ | 58,279 | | | $ | 46,567 | | | $ | (1,812 | ) | | $ | 44,755 | | | $ | 103,034 | |
| | | | | | | | | | | | | | | | | | | | |
EnerSys
Notes to Consolidated Financial Statements—(Continued)
March 31, 20072008
(In Thousands, Except Share and Per Share Data)
| | | | | | | | | | | | | | | | | | | | |
| | | Beginning
Balance | | | Before-Tax
Amount | | | Tax Benefit
(Expense) | | | Net-of-Tax
Amount | | | Ending
Balance | |
| | | | | |
March 31, 2006 | | | | | | | | | | | | | | | | | | | | |
Minimum pension liabilities | | $ | (1,715 | ) | | $ | (2,309 | ) | | $ | 58 | | | $ | (2,251 | ) | | $ | (3,966 | ) |
Unrealized (loss) income on derivative instruments | | | 168 | | | | 2,730 | | | | (991 | ) | | | 1,739 | | | | 1,907 | |
Foreign currency translation adjustment | | | 84,962 | | | | (24,624 | ) | | | — | | | | (24,624 | ) | | | 60,338 | |
| | | | | | | | | | | | | | | | | | | | |
Accumulated other comprehensive income, net of tax | | $ | 83,415 | | | $ | (24,203 | ) | | $ | (933 | ) | | $ | (25,136 | ) | | $ | 58,279 | |
| | | | | | | | | | | | | | | | | | | | |
| | | | | |
March 31, 2007 | | | | | | | | | | | | | | | | | | | | |
Minimum pension liabilities | | $ | (3,966 | ) | | $ | 266 | | | $ | (7 | ) | | $ | 259 | | | $ | (3,707 | ) |
SFAS 158 Adoption | | | — | | | | (2,815 | ) | | | 832 | | | | (1,983 | ) | | | (1,983 | ) |
Unrealized (loss) income on derivative instruments | | | 1,907 | | | | 7,603 | | | | (2,637 | ) | | | 4,966 | | | | 6,873 | |
Foreign currency translation adjustment | | | 60,338 | | | | 41,513 | | | | — | | | | 41,513 | | | | 101,851 | |
| | | | | | | | | | | | | | | | | | | | |
Accumulated other comprehensive income, net of tax | | $ | 58,279 | | | $ | 46,567 | | | $ | (1,812 | ) | | $ | 44,755 | | | $ | 103,034 | |
| | | | | | | | | | | | | | | | | | | | |
| | | | | | | | | | | | | | | | | | | | |
| | | Beginning
Balance | | | Before-Tax
Amount | | | Tax Benefit
(Expense) | | | Net-of-Tax
Amount | | | Ending
Balance | |
March 31, 2006 | | | | | | | | | | | | | | | | | | | | |
Minimum pension liabilities | | $ | (1,715 | ) | | $ | (2,309 | ) | | $ | 58 | | | $ | (2,251 | ) | | $ | (3,966 | ) |
Unrealized income on derivative instruments | | | 168 | | | | 2,730 | | | | (991 | ) | | | 1,739 | | | | 1,907 | |
Foreign currency translation adjustment | | | 84,962 | | | | (24,624 | ) | | | — | | | | (24,624 | ) | | | 60,338 | |
| | | | | | | | | | | | | | | | | | | | |
Accumulated other comprehensive income | | $ | 83,415 | | | $ | (24,203 | ) | | $ | (933 | ) | | $ | (25,136 | ) | | $ | 58,279 | |
| | | | | | | | | | | | | | | | | | | | |
Earnings Per Share
Basic earnings per common share (EPS) are computed by dividing net earnings available to common stockholders by the weighted average number of common shares outstanding for the period. Diluted EPS reflects the potential dilution that would occur if securities or other contracts to issue common stock were exercised or converted into common stock.
New and Proposed Accounting Pronouncements
On March 19, 2008 the Financial Accounting Standards Board (“FASB”) issued Statement of Financial Accounting Standards (“SFAS”) No. 161,Disclosures about Derivative Instruments and Hedging Activities (“SFAS 161)”) which is intended to improve financial reporting about derivative instruments and hedging activities by requiring enhanced disclosures to enable investors to better understand their effects on an entity’s financial position, financial performance, and cash flows. SFAS 161 is effective for financial statements issued for fiscal years and interim periods beginning after November 15, 2008, with early application encouraged. The Company believes SFAS 161 will have no impact on its financial position and results of operations.
On December 4, 2007, the FASB issued SFAS 141 (revised 2007),Business Combinations (“SFAS 141(R)”) which is intended to improve reporting by creating greater consistency in the accounting and financial reporting of business combinations, resulting in more complete, comparable, and relevant information for investors and other users of financial statements. To achieve this goal, the new standard requires the acquiring entity in a business combination to recognize all (and only) the assets acquired and liabilities assumed in the transaction; establishes the acquisition-date fair value as the measurement objective for all assets acquired and liabilities assumed; and requires the acquirer to disclose to investors and other users all of the information they need to evaluate and understand the nature and financial effect of the business combination. SFAS 141(R) is effective for fiscal years beginning after December 15, 2008. The Company is currently evaluating the impact of SFAS 141(R) on its financial position and results of operations.
In February, 2007, the FASB issued SFAS No. 159,The Fair Value Option for Financial Assets and Financial Liabilities—Including an amendment of FASB Statement No. 115 (“SFAS 159”). SFAS 159 permits entities to choose to measure many financial assets and financial liabilities at fair value. Unrealized gains and losses on items for which the fair value option has been elected are reported in earnings. SFAS 159 is effective for the Company for the fiscal year ended March 31, 2009. The Company is in the process of reviewing SFAS 159 and has not determined the effects on the consolidated financial statements.
In September 2006, the FASB issued SFAS No. 157,Fair Value Measurements(“SFAS 157”). SFAS 157 defines fair value, establishes a framework for measuring fair value in generally accepted accounting principles (“GAAP”), and expands disclosures about fair value measurements. The statement applies under other accounting
EnerSys
Notes to Consolidated Financial Statements—(Continued)
March 31, 2008
(In Thousands, Except Share and Per Share Data)
pronouncements that require or permit fair value measurements. Accordingly, SFAS 157 does not require any new fair value measurements. However, for some entities, the application of SFAS 157 will change current practice. The Company is required to adopt SFAS 157 in the first quarter of fiscal year 2009. The Company is in the process of reviewing SFAS 157 and has not determined the effects on the consolidated financial statements, however, it does not believe the adoption of SFAS 157 will have a material impact on its financial statements.
In June 2006,May 2008, the FASB issued FASB Interpretation No. 48,Staff Position paper APB 14-1,Accounting for UncertaintyConvertible Debt Instruments That May Be Settled in Income Taxes—an InterpretationCash upon Conversion (Including Partial Cash Settlement) (“FSP APB 14-1”). This FASB Staff Position (“FSP”) will change the accounting treatment for convertible securities which the issuer may settle fully or partially in cash. Under the final FSP, cash settled convertible securities will be separated into their debt and equity components. The value assigned to the debt component will be the estimated fair value, as of FASB Statement No. 109 (“FIN 48”). FIN 48 establishes thresholdthe issuance date, of a similar debt instrument without the conversion feature, and measurement
EnerSys
Notesthe difference between the proceeds for the convertible debt and the amount reflected as a debt liability will be recorded as additional paid-in capital. As a result, the debt will be recorded at a discount reflecting its below market coupon interest rate. The debt will subsequently be accreted to Consolidated Financial Statements—(Continued)
March 31, 2007
(In Thousands, Except Shareits par value over its expected life, with the rate of interest that reflects the market rate at issuance being reflected on the income statement. This change in methodology will affect the calculations of net income and Per Share Data)
attributesearnings per share for many issuers of cash settled convertible securities. This FSP is effective for financial statement measurement and recognitionstatements issued by the Company for the first quarter of tax positions taken or expected to be taken in a tax return. FIN 48 also provides guidance on derecognition, classification, interest and penalties, accounting in interim periods, disclosure and transition. The Company is required to adopt FIN 48 as of April 1, 2007.fiscal year 2010. The Company is currently finalizing its evaluation ofevaluating the impact that adoption of FIN 48 willFSP APB 14-1 may have on its financial position and results of operations and cash flows, but it does not believe the adoption of FIN 48 will have a material impact on the Company’s financial statements.operations.
Collective Bargaining
At March 31, 2007,2008, the Company had approximately 7,8008,600 employees. Of these employees, approximately 3,200,3,600, almost all of whom work in the Company’s European facilities, were covered by collective bargaining agreements. The average term of these agreements is one to two years with the longest term being three and one-half years, and these agreements expire over the period through 2009.2008-2009.
Use of Estimates
The preparation of financial statements in conformity with accounting principles generally accepted in the United States requires management to make estimates and assumptions that affect the amounts reported in the financial statements and accompanying notes. Actual results could differ from those estimates.
2. Acquisitions
On May 18, 2007, the Company acquired approximately a 97% interest in Energia AD, a producer of industrial batteries, located in Targovishte, Bulgaria. The total purchase price for this transaction was approximately euro 13,000 (approximately $17,000) including transaction costs and adjustments and was financed using EnerSys’ cash and existing credit facilities. The acquisition provides the Company with an additional low cost manufacturing platform with substantial expansion potential and increases the Company’s market presence in the rapidly growing Eastern European and Russian markets.
Effective January 1, 2007, the Company acquired the lead-acid battery business of Leclanché SA based in Yverdon-les-Bains, Switzerland. The total purchase price for this transaction was approximately $800 and was financed using existing EnerSys credit facilities. The Company assumed the customers and existing contracts of the Leclanché lead-acid battery business along with certain sales and service employees in order to maintain relationships with current customers. The acquisition provides the Company greater access to the Swiss market.
EnerSys
Notes to Consolidated Financial Statements—(Continued)
March 31, 2008
(In Thousands, Except Share and Per Share Data)
On August 22, 2006, the Company acquired the assets, including manufacturing facilities, of Chaozhou Xuntong Power Source Company Limited (“CFT”), located in Chaoan, China. This facility manufactures valve-regulated, lead-acid batteries. This acquisition provides the Company with additional capacity needed to meet the growing customer demand for reserve power batteries. The total purchase price for this transaction was approximately $5,300 and was financed using existing EnerSys credit facilities.
On May 18, 2006, the Company purchased the assets of Alliant Techsystems’ (NYSE:ATK) lithium primary battery business, located at its Power Sources Center (“PSC”) in Horsham, PA. The total purchase price for this transaction was approximately $2,200 and was financed using existing EnerSys credit facilities. PSC produces lithium power sources, primarily for aerospace and& defense applications. As part of the transaction, ATK has signed a 5-year supply agreement for allcertain of its requirements for products produced at PSC. PSC is now known as EnerSys Advanced Systems Inc. (“EAS”).
EnerSys
Notes to Consolidated Financial Statements—(Continued)
March 31, 2007
(In Thousands, Except Share and Per Share Data)
On October 11, 2005, the Company completed the acquisition of Gerate- und Akkumulatorwerk Zwickau GmbH (GAZ), based in Zwickau, Germany. The total cash purchase price net of cash received for this transaction was approximately $2,671 (excluding assumed debt of approximately $760) and was financed using existing EnerSys credit facilities. GAZ is a producer of specialty nickel-based batteries utilized primarily in the energy, rail, telecommunications and uninterruptible power supply (UPS) industries worldwide. The acquisition has been accounted for as a purchase and has resulted in the recognition of $1,891 of goodwill in the Company’s financial statements.
On June 1, 2005, the Company acquired the motive power battery business of FIAMM, S.p.A. (FIAMM). The total cash purchase price was $32,708 and was primarily financed using a new term credit facility with San Paolo IMI S.p.A., and Banca Intesa S.p.A as described in Note 8. This acquisition, which complements our existing European motive power business, has been accounted for as a purchase and resulted in the recognition of $6,435 of goodwill in the Company’s financial statements.
The Company made initial allocations of the purchase prices at the dates of the acquisitions based upon its understanding of the fair value of the acquired assets and liabilities. The Company obtained this information during due diligence and through other sources. In the months after the closings, as the Company obtains additional information about these assets and liabilities, the estimates of fair value will be refined and the allocations of purchase prices will be adjusted. Examples of factors and information that the Company uses to refine the allocations include tangible and intangible asset appraisals and cost data related to business integration. The only items considered for subsequent adjustment are items identified as of the acquisition dates.
The results of FIAMM,Energia, Leclanché, CFT, EAS, and GAZ EAS, CFT and Leclanché have been included in the Company’s results of operations from the dates of their respective acquisitions. Pro forma earnings per share computations have not been presented as these acquisitions are not considered material.
In connection with certain of its acquisitions, the Company formulated restructuring plans for the integration of the acquired businesses. See Note 20 for additional information regarding these plans.
3. Inventories
Net inventories consist of:
| | | | 2006 | | 2007 | | 2008 | | 2007 |
Raw materials | | $ | 44,453 | | $ | 53,789 | | $ | 81,645 | | $ | 53,789 |
Work-in-process | | | 50,472 | | | 62,881 | | | 98,320 | | | 62,881 |
Finished goods | | | 84,612 | | | 117,656 | | | 155,764 | | | 117,656 |
| | | | | | | | |
Total | | $ | 179,537 | | $ | 234,326 | | $ | 335,729 | | $ | 234,326 |
| | | | | | | | |
EnerSys
Notes to Consolidated Financial Statements—(Continued)
March 31, 2008
(In Thousands, Except Share and Per Share Data)
Inventory reserves for obsolescence and other estimated losses, mainly relating to finished goods, were $8,711$13,963 and $10,024 at March 31, 20062008 and 2007, respectively.
EnerSys
Notes to Consolidated Financial Statements—(Continued)
March 31, 2007
(In Thousands, Except Share and Per Share Data)
4. Property, Plant, and Equipment
Property, plant, and equipment consist of:
| | | | 2006 | | 2007 | | | 2008 | | 2007 | |
Land, buildings, and improvements | | $ | 114,814 | | | $ | 130,820 | | | $ | 162,763 | | | $ | 130,820 | |
Machinery and equipment | | | 307,854 | | | | 353,907 | | | | 418,957 | | | | 353,907 | |
Construction in progress | | | 13,589 | | | | 19,757 | | | | 28,994 | | | | 19,757 | |
| | | | | | | | | | | | |
| | | 436,257 | | | | 504,484 | | | | 610,714 | | | | 504,484 | |
Less accumulated depreciation | | | (154,513 | ) | | | (203,489 | ) | | | (270,717 | ) | | | (203,489 | ) |
| | | | | | | | | | | | |
Total | | $ | 281,744 | | | $ | 300,995 | | | $ | 339,997 | | | $ | 300,995 | |
| | | | | | | | | | | | |
5. Goodwill and Other Intangible Assets
Information regarding the Company’s goodwill and other intangible assets follows:
| | | | 2006 | | 2007 | | 2008 | | 2007 |
| | | Gross
Amount | | Accumulated
Amortization | | Net
Amount | | Gross
Amount | | Accumulated
Amortization | | Net
Amount | | Gross
Amount | | Accumulated
Amortization | | Net
Amount | | Gross
Amount | | Accumulated
Amortization | | Net
Amount |
Unamortizable intangible assets: | | | | | | | | | | | | | | | | | | | | | | | | |
Goodwill(1) | | $ | 318,141 | | $ | (1,412 | ) | | $ | 316,729 | | $ | 334,286 | | $ | (1,412 | ) | | $ | 332,874 | | $ | 359,841 | | $ | (1,412 | ) | | $ | 358,429 | | $ | 334,286 | | $ | (1,412 | ) | | $ | 332,874 |
Trademarks | | | 79,746 | | | (953 | ) | | | 78,793 | | | 79,746 | | | (953 | ) | | | 78,793 | | | 79,746 | | | (953 | ) | | | 78,793 | | | 79,746 | | | (953 | ) | | | 78,793 |
Amortizable intangible assets: | | | | | | | | | | | | | | | | | | | | | | | | |
Customer lists | | | 1,273 | | | (218 | ) | | | 1,055 | | | 1,361 | | | (491 | ) | | | 870 | | | 1,439 | | | (783 | ) | | | 656 | | | 1,361 | | | (491 | ) | | | 870 |
Non-compete | | | 628 | | | (107 | ) | | | 521 | | | 679 | | | (240 | ) | | | 439 | | | 725 | | | (377 | ) | | | 348 | | | 679 | | | (240 | ) | | | 439 |
Patents | | | 250 | | | (92 | ) | | | 158 | | | 250 | | | (109 | ) | | | 141 | | | 250 | | | (125 | ) | | | 125 | | | 250 | | | (109 | ) | | | 141 |
Trademarks | | | 365 | | | (61 | ) | | | 304 | | | 365 | | | (134 | ) | | | 231 | | | 464 | | | (307 | ) | | | 157 | | | 365 | | | (134 | ) | | | 231 |
Licenses | | | — | | | — | | | | — | | | 69 | | | (3 | ) | | | 66 | | | 77 | | | (17 | ) | | | 60 | | | 69 | | | (3 | ) | | | 66 |
| | | | | | | | | | | | | | | | | | | | | | | | | | | | |
Total | | $ | 400,403 | | $ | (2,843 | ) | | $ | 397,560 | | $ | 416,756 | | $ | (3,342 | ) | | $ | 413,414 | | $ | 442,542 | | $ | (3,974 | ) | | $ | 438,568 | | $ | 416,756 | | $ | (3,342 | ) | | $ | 413,414 |
| | | | | | | | | | | | | | | | | | | | | | | | | | | | |
The changes in the carrying amount of goodwill by business segment are as follows:
| | | | | | | | | | | | | | | | | | | | | | | | |
| | | 2006 | | | 2007 | |
| | | Reserve | | | Motive | | | Total | | | Reserve | | | Motive | | | Total | |
Balance at beginning of year(1) | | $ | 164,564 | | | $ | 152,051 | | | $ | 316,615 | | | $ | 159,685 | | | $ | 157,044 | | | $ | 316,729 | |
FIAMM acquisition | | | — | | | | 6,450 | | | | 6,450 | | | | — | | | | (15 | ) | | | (15 | ) |
GAZ acquisition | | | 1,891 | | | | — | | | | 1,891 | | | | — | | | | — | | | | — | |
Other acquisitions | | | — | | | | 1,289 | | | | 1,289 | | | | 1,073 | | | | 259 | | | | 1,332 | |
Income tax adjustment for ESG and Yuasa, Inc. acquisitions | | | (1,264 | ) | | | (1,350 | ) | | | (2,614 | ) | | | (1,362 | ) | | | (1,786 | ) | | | (3,148 | ) |
Foreign currency translation gain (loss) | | | (5,506 | ) | | | (1,396 | ) | | | (6,902 | ) | | | 8,713 | | | | 9,263 | | | | 17,976 | |
| | | | | | | | | | | | | | | | | | | | | | | | |
Balance at end of year(1) | | $ | 159,685 | | | $ | 157,044 | | | $ | 316,729 | | | $ | 168,109 | | | $ | 164,765 | | | $ | 332,874 | |
| | | | | | | | | | | | | | | | | | | | | | | | |
(1) | Gross goodwill in 2006 includes $7,962 attributable to a correction of an error in prior years within purchase accounting of ESG. A corresponding decrease in other assets, pension has been recorded. The adjustment was not deemed material, however, prior period amounts were corrected for comparability purposes. |
| | | | | | | | | | | | | | | | | | | | | | | |
| | | 2008 | | | 2007 | |
| | | Reserve | | Motive | | | Total | | | Reserve | | | Motive | | | Total | |
Balance at beginning of year | | $ | 168,109 | | $ | 164,765 | | | $ | 332,874 | | | $ | 159,685 | | | $ | 157,044 | | | $ | 316,729 | |
Energia acquisition | | | — | | | 3,000 | | | | 3,000 | | | | — | | | | — | | | | — | |
FIAMM acquisition | | | — | | | — | | | | — | | | | — | | | | (15 | ) | | | (15 | ) |
Other acquisitions | | | — | | | — | | | | — | | | | 1,073 | | | | 259 | | | | 1,332 | |
Income tax adjustment for ESG and Yuasa, Inc. acquisitions | | | — | | | (5,188 | ) | | | (5,188 | ) | | | (1,362 | ) | | | (1,786 | ) | | | (3,148 | ) |
Foreign currency translation gain | | | 11,919 | | | 15,824 | | | | 27,743 | | | | 8,713 | | | | 9,263 | | | | 17,976 | |
| | | | | | | | | | | | | | | | | | | | | | | |
Balance at end of year | | $ | 180,028 | | $ | 178,401 | | | $ | 358,429 | | | $ | 168,109 | | | $ | 164,765 | | | $ | 332,874 | |
| | | | | | | | | | | | | | | | | | | | | | | |
EnerSys
Notes to Consolidated Financial Statements—(Continued)
March 31, 20072008
(In Thousands, Except Share and Per Share Data)
The Company estimated tax-deductible goodwill to be approximately $24,000,$19,295, $21,500 and $23,000 and $21,500 as of March 31, 2005,2008, 2007 and 2006, and 2007, respectively.
6. Other Assets
Prepaid and other current assets consist of the following:
| | | | March 31, | | March 31, |
| | | 2006 | | 2007 | | 2008 | | 2007 |
Lead hedges | | $ | — | | $ | 12,040 | |
Non-trade receivables | | | 1,616 | | | 9,694 | |
Prepaid other taxes | | | 5,294 | | | 4,773 | | $ | 8,401 | | $ | 4,773 |
Prepaid income taxes | | | 7,049 | | | 3,306 | | | 4,826 | | | 3,306 |
Non-trade receivables | | | | 4,138 | | | 9,694 |
Lead hedges | | | | 1,685 | | | 12,040 |
Other | | | 10,019 | | | 9,342 | | | 15,936 | | | 9,342 |
| | | | | | | | |
Total | | $ | 23,978 | | $ | 39,155 | | $ | 34,986 | | $ | 39,155 |
| | | | | | | | |
Other assets consist of the following:
| | | | March 31, | | March 31, |
| | | 2006 | | 2007 | | 2008 | | 2007 |
Leases receivable | | $ | 4,939 | | $ | 8,804 | | $ | 9,115 | | $ | 8,804 |
Rental batteries | | | | 3,705 | | | 2,710 |
Deferred financing fees | | | 5,522 | | | 4,524 | | | 3,034 | | | 4,524 |
Rental batteries | | | 7,031 | | | 2,710 | |
Other | | | 5,614 | | | 4,273 | | | 1,828 | | | 4,273 |
| | | | | | | | |
Total | | $ | 23,106 | | $ | 20,311 | | $ | 17,682 | | $ | 20,311 |
| | | | | | | | |
7. Accrued Expenses
Accrued expenses consist of the following:
| | | | March 31, | | March 31, |
| | | 2006 | | 2007 | | 2008 | | 2007 |
Payroll and benefits | | $ | 36,815 | | $ | 46,919 | | $ | 60,425 | | $ | 46,919 |
Warranty | | | 26,652 | | | 27,533 | | | 34,037 | | | 27,533 |
Accrued selling expenses | | | 20,532 | | | 24,345 | | | 30,598 | | | 24,345 |
Income taxes, currently payable | | | 25,302 | | | 18,374 | | | 15,568 | | | 18,374 |
Restructuring | | | | 8,295 | | | 5,408 |
VAT and other non-income taxes | | | 8,133 | | | 9,367 | | | 8,224 | | | 9,367 |
Freight | | | 4,218 | | | 5,417 | | | 7,583 | | | 5,417 |
Restructuring | | | 9,289 | | | 5,408 | |
Pension and social security | | | 7,184 | | | 4,973 | | | 2,995 | | | 4,973 |
Interest | | | 2,540 | | | 2,480 | | | 2,469 | | | 2,480 |
Other | | | 19,006 | | | 30,423 | | | 32,281 | | | 30,423 |
| | | | | | | | |
Total | | $ | 159,671 | | $ | 175,239 | | $ | 202,475 | | $ | 175,239 |
| | | | | | | | |
EnerSys
Notes to Consolidated Financial Statements—(Continued)
March 31, 20072008
(In Thousands, Except Share and Per Share Data)
8. Debt
In connection with the acquisition of ESG, in March 22, 2002, the Company assumed a $5,000 note payable to the prior owner of an acquired manufacturing plant in Mexico. The note was due on February 2, 2004, plus accrued interest at a one-year LIBOR rate (3.28% at March 31, 2005). In fiscal 2004, the Company paid $1,786 on the note and the balance was suspended pending settlement of certain disputes. In fiscal 2005 and 2006, the Company made principal payments totaling $230, $320, respectively on this note. In October 2006, this debt was settled in a confidential arrangement.
In August 2004, the Company amended its credit agreement and reduced our borrowing rates on the senior secured term loan B by 0.50% to LIBOR + 2.00%. The then existing term loans ($361,137 plus accrued interest) were paid in full and simultaneously new term B loans of $365,000 were borrowed.
In March 2005,As of February 5, 2007, EnerSys completed the Company amendedFourth Amendment to the Credit Agreement in connection with its $480,000 senior secured Credit Agreement. The Lenders approved a reduction of 25 basis points in the credit agreementspread to permitLIBOR +175 basis points on $355,900 of term loans which will reduce the Company’s planned acquisitioninterest costs by approximately $800 per year during the term. The reduction was effective as of February 9, 2007. The then existing $355,900 term loans were converted into new term B loans.
The $355,900 senior secured term loan B is subject to a 0.25% quarterly principal amortization and matures on March 17, 2011. The $100,000 revolving credit line matures on March 17, 2009. Obligations under the credit facilities are secured by substantially all of our United States existing and hereafter acquired assets, including substantially all of the motive power battery businesscapital stock of FIAMM S.p.A.all of our United States subsidiaries that are guarantors under the new credit facility, and 65% of the secured financing for such acquisition. Additionally,capital stock of certain of our foreign subsidiaries that are owned by our United States companies. Borrowings under the amendment revisedcredit agreements bear interest at a floating rate based, at our option, upon (i) a LIBOR rate plus an applicable percentage (currently 1.75%) or (ii) the greater of the federal funds rate plus 0.5% or the prime rate, plus an applicable percentage (currently 0.75%). There is a provision that would require prepayment based upon certain excess cash flow amounts, as defined. There are no prepayment penalties on loans under the $455,900 senior secured leverage ratio for the Company’s next six quarters.credit facility.
On June 15, 2005, the Company entered in a euro €25,000Euro 25,000 Credit Facility Agreement among EnerSys Holdings (Luxembourg), S.a.r.l., San Paolo IMI S.p.A., as Facility Agent and lender, and Banca Intesa S.p.A., as lender (the “Euro Credit Agreement”). The proceeds from the Euro Credit Agreement were used to reduce the outstanding balance of the U.S. Credit Agreement that was utilized as bridge financing for the June 1, 2005 acquisition of the motive power battery business of FIAMM S.p.A. The Euro Credit Agreement matures on June 30, 2011, and is subject to quarterly principal amortization between €1,000 - €1,750 beginning March 31, 2007. Obligations under the Euro Credit Agreement are secured by a pledge of the shares of our Italian subsidiary and guaranty from EnerSys Capital Inc., a subsidiary of the Company. Borrowings under the Euro Credit Agreement bear interest at a floating rate based upon a EURIBOR rate plus 1.15%.
Effective November 27, 2006, the Company amended its Euro 25,000 Credit Agreement, and effective June 29, 2006, the Company amended its senior credit facility, which consisted of a $358,600 term loan B and a $100,000 revolving credit line. Under the amendments, the lenders approved the elimination of the covenants relating to the Company’s senior secured debt leverage ratio (while maintaining the covenants relating to its total debt leverage ratio) and several minor technical changes in the agreement. The Company pursued these amendments to provide greater operating flexibility and to increase its borrowing capacity for potential acquisition opportunities.
As of February 5, 2007, EnerSys completed the Fourth Amendment to the Credit Agreement in connection with its $480,000 senior secured Credit Agreement. The Lenders approved a reduction of 25 basis points in the credit spread to LIBOR +175 basis points on $355,900 of term loans which will reduce the Company’s future interest costs by approximately $800 per year during the term. The reduction was effective as of February 9, 2007. The existing $355,900 term loans were converted into new term B loans.
The $355,900 senior secured term loan B is subject to a 0.25% quarterly principal amortization and matures on March 17, 2011. The $100,000 revolving credit line matures on March 17, 2009. Obligations under the credit facilities are secured by substantially all of our United States existing and hereafter acquired assets, including substantially all of the capital stock of all of our United States subsidiaries that are guarantors under the new credit facility, and 65% of the capital stock of certain of our foreign subsidiaries that are owned by our United
EnerSys
Notes to Consolidated Financial Statements—(Continued)
March 31, 2007
(In Thousands, Except Share and Per Share Data)
States companies. Borrowings under the credit agreements bear interest at a floating rate based, at our option, upon (i) a LIBOR rate plus an applicable percentage (currently 1.75%) or (ii) the greater of the federal funds rate plus 0.5% or the prime rate, plus an applicable percentage (currently 0.75%). There is a provision that would require prepayment based upon certain excess cash flow amounts, as defined. There are no prepayment penalties on loans under the $455,900 senior secured credit facility.
Effective April 30, 2007, the Company amended its Euro 25,000 Credit Agreement. Under the amendment, the lenders approved the acquisition of Energia AD.
In connection with the acquisition of ESG, in March 22, 2002, the Company assumed a $5,000 note payable to the prior owner of an acquired manufacturing plant in Mexico. The note was due on February 2, 2004, plus accrued interest at a one-year LIBOR rate (3.28% at March 31, 2005). In fiscal 2004, the Company paid $1,786 on the note and the balance was suspended pending settlement of certain disputes. In fiscal 2006 and 2005, the Company made principal payments totaling $320 and $230, respectively on this note. In October 2006, this debt was settled in a confidential arrangement.
EnerSys
Notes to Consolidated Financial Statements—(Continued)
March 31, 2008
(In Thousands, Except Share and Per Share Data)
As of March 31, 20062008 and 2007, the Company had available under all its lines of credit approximately $130,700$188,600 and $165,600, respectively. Included in the March 31, 20062008 and 2007 amounts are $31,800$102,100 and $66,800, respectively, of uncommitted lines of credit.
The average effective borrowing rates for 20062008 and 2007 were 5.7%6.5% and 6.6% respectively.
The following summarizes the Company’s long-term debt:
| | | | | | | | | |
| | | March 31, |
| | | 2005 | | 2006 | | 2007 |
Term Loan B: Payable in quarterly installments of $890 through March 17, 2011, with the remaining balance due on March 17, 2011, bearing interest at 7.11% at March 31, 2007(1) | | $ | 362,263 | | $ | 358,613 | | $ | 354,985 |
Euro Term Loan: Payable in quarterly installments between €1,000 and €1,750 beginning March 31, 2007 through June 30, 2011, bearing interest at 5.06% at March 31, 2007 | | | — | | | 30,343 | | | 32,098 |
Note payable, bearing interest at 3.28%, 0.00% and 0.00% at March 31, 2005, 2006 and 2007, respectively | | | 2,984 | | | 2,664 | | | — |
Other | | | — | | | 747 | | | 937 |
| | | | | | | | | |
Total debt | | | 365,247 | | | 392,367 | | | 388,020 |
Less current portion | | | 6,634 | | | 8,225 | | | 9,353 |
| | | | | | | | | |
Total long-term debt | | $ | 358,613 | | $ | 384,142 | | $ | 378,667 |
| | | | | | | | | |
| | | | | | | | | |
| | | March 31, |
| | | 2008 | | 2007 | | 2006 |
Term Loan B: Payable in quarterly installments of $890 through March 17, 2011, with the remaining balance due on March 17, 2011, bearing interest at 4.74% at March 31, 2008(1) | | $ | 351,427 | | $ | 354,985 | | $ | 358,613 |
Euro Term Loan: Payable in quarterly installments between €1,000 and €1,750 beginning March 31, 2008 through June 30, 2011, bearing interest at 5.88% at March 31, 2008 | | | 31,151 | | | 32,098 | | | 30,343 |
Note payable | | | — | | | — | | | 2,664 |
Other | | | 1,033 | | | 937 | | | 747 |
| | | | | | | | | |
Total debt | | | 383,611 | | | 388,020 | | | 392,367 |
Less current portion | | | 11,926 | | | 9,353 | | | 8,225 |
| | | | | | | | | |
Total long-term debt | | $ | 371,685 | | $ | 378,667 | | $ | 384,142 |
| | | | | | | | | |
| (1) | LIBOR component on $203,000 swapped into fixed rates as discussed in Note 11. |
The Company paid $22,110,$28,534, $25,961 and $23,704, and $25,961, net of interest received, for interest during the fiscal years ended March 31, 2005,2008, 2007 and 2006, and 2007, respectively.
Aggregate maturities of long-term debt are as follows:
| | | |
2008 | | $ | 9,353 |
2009 | | | 11,407 |
2010 | | | 11,918 |
2011 | | | 353,337 |
2012 | | | 2,005 |
Thereafter | | | — |
| | | |
| | $ | 388,020 |
| | | |
EnerSys
Notes to Consolidated Financial Statements—(Continued)
March 31, 2007
(In Thousands, Except Share and Per Share Data)
| | | |
2009 | | $ | 11,926 |
2010 | | | 14,363 |
2011 | | | 354,956 |
2012 | | | 2,366 |
2013 | | | — |
Thereafter | | | — |
| | | |
| | $ | 383,611 |
| | | |
The Company’s financing agreements contain various covenants which, absent prepayment in full of the indebtedness and other obligations, or the receipt of waivers, would limit the Company’s ability to conduct certain specified business transactions including incurring debt, mergers, consolidations or similar transactions, buying or selling assets out of the ordinary course of business, engaging in sale and leaseback transactions, paying dividends and certain other actions. The Company is in compliance with all such covenants.
EnerSys
Notes to Consolidated Financial Statements—(Continued)
March 31, 2008
(In Thousands, Except Share and Per Share Data)
As of March 31, 20062008 and 2007, the Company had $1,150 of standby letters of credit outstanding that reduced the borrowings available under the Revolving Credit Line. As of March 31, 20062008 and 2007, the Company had $1,111$0 and $1,242, respectively, of bank guarantees ($1,242guarantees.
See Note 26, Subsequent Event for a discussion of Concurrent Public Offerings of Senior Convertible Notes, a Private Offering of a New Senior Secured Credit Facility and amendments to be paid in fiscal 2008).the Company’s credit agreements.
9. Leases
The Company’s future minimum lease payments under capital and operating leases that have noncancelable terms in excess of one year at March 31, 20072008 are as follows:
| | | | Capital
Leases | | Operating
Leases | | Capital
Leases | | Operating
Leases |
2008 | | $ | 1,563 | | $ | 8,653 | |
2009 | | | 651 | | | 6,421 | | $ | 1,042 | | $ | 13,170 |
2010 | | | 403 | | | 4,655 | | | 870 | | | 9,658 |
2011 | | | 158 | | | 2,603 | | | 255 | | | 6,108 |
2012 | | | 14 | | | 1,658 | | | — | | | 4,030 |
2013 | | | | — | | | 2,595 |
Thereafter | | | — | | | 1,469 | | | — | | | 2,317 |
| | | | | | | | |
Total minimum lease payments | | | 2,789 | | $ | 25,459 | | | 2,167 | | $ | 37,878 |
| | | | | | | | |
Amounts representing interest | | | 227 | | | | | 137 | | |
| | | | | | | | |
Net minimum lease payments, including current portion of $1,563 | | $ | 2,562 | | | |
Net minimum lease payments, including current portion of $1,042 | | | $ | 2,030 | | |
| | | | | | | | |
Rental expense was $19,833,$28,181, $25,593 and $22,555 and $ 25,593 for the fiscal years ended March 31, 2005,2008, 2007 and 2006, and 2007, respectively. Amortization of capitalized leased assets is included in depreciation expense. Certain operating lease agreements contain renewal or purchase options and/or escalation clauses.
10. Other Liabilities
Other long-term liabilities consists of the following:
| | | | March 31, | | March 31, |
| | | 2006 | | 2007 | | 2008 | | 2007 |
Pension and profit sharing obligation | | $ | 18,994 | | $ | 24,534 | | $ | 30,712 | | $ | 24,534 |
Long-term income taxes payable | | | | 14,160 | | | — |
Interest rate swap liabilities | | | | 11,593 | | | — |
Restructuring reserves | | | 8,483 | | | 7,640 | | | 7,545 | | | 7,640 |
Minority interest | | | | 3,437 | | | 2,799 |
Deferred income | | | 2,532 | | | 2,810 | | | 3,251 | | | 2,810 |
Minority interest | | | 2,509 | | | 2,799 | |
Other | | | 8,297 | | | 7,734 | | | 9,999 | | | 7,734 |
| | | | | | | | |
Total | | $ | 40,815 | | $ | 45,517 | | $ | 80,697 | | $ | 45,517 |
| | | | | | | | |
EnerSys
Notes to Consolidated Financial Statements—(Continued)
March 31, 20072008
(In Thousands, Except Share and Per Share Data)
11. Derivative Financial Instruments
Interest Rate Swap Agreements
The Company is exposed to changes in variable U.S. interest rates on borrowings under our credit agreements. On a selective basis, from time to time, the Company enters into interest rate swap agreements to reduce the negative impact that increases in interest rates could have on our outstanding variable rate debt. The Company enters into interest rate swap agreements to fix the interest rate on portions of its floating-rate obligations. Management considers the interest rate swaps to be highly effective against changes in the fair value of the underlying debt based on the criteria in SFAS 133. Cash flows related to the interest rate swap agreements are included in interest expense over the terms of the agreements.
Currently, such interest rate swap agreements effectively convert $203.0 million of the Company’s variable-rate debt to a fixed-rate basis, utilizing the three-month London Interbank Offered Rate, or LIBOR, as a floating rate reference. During August, November and December 2007 (see below), the Company entered into an additional $125 million of interest rate swap agreements that are effective in February and May 2008 and will almost entirely replace $128 million of interest rate swaps that mature in February and May 2008. The following commentary provides details for the interest rate swap agreements:
In February 2001, the Company entered into interest rate swap agreements to fix the interest rate on $60,000 of its floating-rate obligations at a rate of 5.59% per annum through February 22, 2006. In April and May 2004, the Company amended these agreements to extend the maturity to February 22, 2008, and reduce the fixed rate to 5.16% per annum beginning May 24, 2004.
In April 2004, the Company entered into interest rate swap agreements to fix the interest rate on an additional $60,000 of its floating-rate obligations, beginning May 5, 2004, at a rate of 2.85% per annum in Year 1, 3.15% per annum in Year 2, 3.95% per annum in Year 3 and 4.75% per annum in Year 4. These agreements expire on May 5, 2008.
In August 2004, the Company entered into an interest rate swap agreement to fix the interest rate on an additional $8,000 of its floating-rate obligations, beginning November 5, 2004, at a rate of 2.85% per annum for half of Year 1, 3.15% per annum in Year 2, 3.95% per annum in Year 3 and 4.20% per annum in Year 4. These agreements expire on May 5, 2008.
In October 2005, the Company entered into interest swap agreements to fix interest rates on an additional $75,000 of its floating rate obligations, beginning December 22, 2005, at a rate of 4.25% per annum in Year 1, 4.525% per annum in Year 2, 4.80% per annum in Year 3, 5.075% per annum in Year 4 and 5.47% per annum in Year 5. These agreements expire on December 22, 2010.
In August 2007, the Company entered into interest rate swap agreements, that became effective in February 2008, to fix interest rates on $40.0 million of floating rate debt through February 22, 2011, at 4.85% per year.
In November 2007, the Company entered into interest rate swap agreements that become effective in May 2008, to fix interest rates on $40.0 million of floating rate debt through May 7, 2013, at 4.435% per year.
In December 2007, the Company entered into $45.0 million of interest rate swap agreements that become effective in February and May 2008, to fix the interest rates on $20.0 million of floating rate debt through February 22, 2013, at 4.134% per year and to fix the interest rates on $25.0 million of floating rate debt through May 7, 2013, at 4.138% per year.
EnerSys
Notes to Consolidated Financial Statements—(Continued)
March 31, 2008
(In Thousands, Except Share and Per Share Data)
The Company recorded unrealized (losses) gains (losses) on interest rate swaps of $3,771,($11,612), ($2,349) and $2,913 and ($2,349) for the fiscal years ended March 31, 2005,2008, 2007 and 2006, and 2007, respectively, that is included in accumulated other comprehensive income. In the coming twelve months, the Company anticipates that approximately $4,900 of unrealized losses will be reclassified from accumulated other comprehensive income to earnings, as approximately a $3,540 increase in interest expense and approximately $1,360 of refinancing related expenses. The estimated fair value of the Company’s interest rate swap agreements was a (liability) asset of ($545)11,593), $2,368$19 and $19$2,368 at March 31, 2005,2008, 2007 and 2006, and 2007, respectively, as estimated based on quotes from market makers of these instruments. The Company recorded an expense (gain) of $2,618,($588), ($1,754) and $311 and ($1,754) in fiscal 2005,2008, 2007 and 2006, and 2007, respectively, which was recorded as an increase (decrease) in interest expense.
See Note 26, Subsequent Event, for the termination of $30 million of interest rate swap agreements.
Lead Hedge Contracts
During the fiscal years ending March 31, 2005,2008, 2007 and 2006, and 2007, the Company entered into lead hedge contracts to fix the price for lead purchases. Management considers the lead hedge contracts to be highly effective against changes in the fair value of the underlying lead purchases based on the criteria in SFAS 133. Each contract is for a period not extending beyond one year. Realized gains (losses) related to the lead hedge contracts are included in inventory. The Company recorded unrealized gains (losses) on lead hedge contracts of $785,($10,355), $11,572 and ($318) and $11,572 for the fiscal years ended March 31, 2005,2008, 2007 and 2006, and 2007, respectively, which is included in other comprehensive income. The fair value of open lead hedge contracts at March 31, 2005,2008, 2007 and 2006, was $1,685, $12,040 and 2007 was $785, $401, and $12,040.respectively. The gain on the settlement of lead hedge contracts during fiscal 2005,2008, 2007 and 2006, was $20,592, $7,393 and 2007 was $4,425, $5,254, and $7,396, a portion of which is recorded as a reduction of cost of goods sold and a portion of which was included in inventory at March 31, 2005, 20062008, 2007 and 2007.
EnerSys
Notes to Consolidated Financial Statements—(Continued)
March 31, 2007
(In Thousands, Except Share and Per Share Data)
2006.
Foreign Currency Forward Contracts
On a selective basis the Company will enter into foreign currency forward contracts and option contracts to reduce the volatility from currency movements that affect the Company. The Company’s largest exposure is from the purchase and conversion of U.S. dollar based lead costs into local currencies in Europe, China and Mexico. Additionally, the Company has currency exposures from intercompany trade transactions. To hedge these exposures the Company has enteredmay enter into foreign currency forward contracts and option contracts with financial institutions. Each contract is for a period not extending beyond one year. As of March 31, 20062008 and 2007, the Company had entered into a total of $34,300$99,550 and $93,050, respectively, foreign currency forward contracts. The Company recorded an unrealized gain (loss) on foreign currency forward contracts of $135($2,316) and ($1,620) for the fiscal years ended March 31, 20062008 and 2007, respectively, which is included in other comprehensive income. The fair value of open foreign currency forward contracts at March 31, 20062008 and 2007, was $135($3,801) and ($1,485). The net gain/(loss) on the settlement of foreign currency hedge contracts during fiscal 20062008 and 2007, was $619($5,635) and ($2,553), respectively, a portion of which was recorded as a decrease (increase) to cost of goods sold and a portion of which was included in inventory at March 31, 20062008 and 2007.
EnerSys
Notes to Consolidated Financial Statements—(Continued)
March 31, 2008
(In Thousands, Except Share and Per Share Data)
12. Income Taxes
Income tax expense is composed of the following:
| | | | Fiscal year ended March 31, | | | Fiscal year ended March 31, | |
| | | 2005 | | 2006 | | 2007 | | | 2008 | | 2007 | | 2006 | |
Current: | | | | | | | | | | | | |
Federal | | $ | — | | $ | 503 | | | $ | 46 | | | $ | 220 | | | $ | 46 | | | $ | 503 | |
State | | | — | | | 160 | | | | 532 | | | | 976 | | | | 532 | | | | 160 | |
Foreign | | | 7,452 | | | 7,896 | | | | 9,344 | | | | 17,331 | | | | 9,344 | | | | 7,896 | |
| | | | | | | | | | | | | | | | | |
Total current | | | 7,452 | | | 8,559 | | | | 9,922 | | | | 18,527 | | | | 9,922 | | | | 8,559 | |
Deferred: | | | | | | | | | | | | |
Federal | | | 6,270 | | | 8,036 | | | | 3,986 | | | | 3,898 | | | | 3,986 | | | | 8,036 | |
State | | | 979 | | | (108 | ) | | | (622 | ) | | | (583 | ) | | | (622 | ) | | | (108 | ) |
Foreign | | | 2,658 | | | (2,410 | ) | | | 4,606 | | | | 4,657 | | | | 4,606 | | | | (2,410 | ) |
| | | | | | | | | | | | | | | | | |
Total deferred | | | 9,907 | | | 5,518 | | | | 7,970 | | | | 7,972 | | | | 7,970 | | | | 5,518 | |
| | | | | | | | | | | | | | | | | |
Income tax expense | | $ | 17,359 | | $ | 14,077 | | | $ | 17,892 | | | $ | 26,499 | | | $ | 17,892 | | | $ | 14,077 | |
| | | | | | | | | | | | | | | | | |
Earnings before income taxes consists of the following:
| | | | Fiscal year ended March 31, | | Fiscal year ended March 31, |
| | | 2005 | | 2006 | | 2007 | | 2008 | | 2007 | | 2006 |
United States | | $ | 6,225 | | $ | 15,083 | | $ | 12,505 | | $ | 18,465 | | $ | 12,505 | | $ | 15,083 |
Foreign | | | 43,517 | | | 29,720 | | | 50,597 | | | 67,730 | | | 50,597 | | | 29,720 |
| | | | | | | | | | | | |
Earnings before income taxes | | $ | 49,742 | | $ | 44,803 | | $ | 63,102 | | $ | 86,195 | | $ | 63,102 | | $ | 44,803 |
| | | | | | | | | | | | |
Income taxes paid by the Company for the fiscal years ended March 31, 2005,2008, 2007 and 2006 were $7,255, $11,967 and 2007 were $9,133, $7,111, and $11,967, respectively.
EnerSys
Notes to Consolidated Financial Statements—(Continued)
March 31, 2007
(In Thousands, Except Share and Per Share Data)
The following table sets forth the tax effects of temporary differences that give rise to significant portions of the deferred tax assets and liabilities:
| | | | March 31, | | | March 31, | |
| | | 2006 | | 2007 | | | 2008 | | 2007 | |
Deferred tax assets: | | | | | | | | |
Accounts receivable | | $ | 850 | | | $ | 943 | | | $ | 1,129 | | | $ | 943 | |
Inventories | | | 4,828 | | | | 5,140 | | | | 5,391 | | | | 5,140 | |
Other intangible assets | | | 1,362 | | | | — | | |
Net operating loss carryforwards | | | 75,938 | | | | 95,625 | | | | 82,116 | | | | 95,625 | |
Accrued liabilities and restructuring expenses | | | 18,457 | | | | 15,033 | | | | 15,821 | | | | 15,033 | |
Other assets | | | 7,026 | | | | 8,709 | | | | 13,506 | | | | 8,709 | |
| | | | | | | | | | | | |
Gross deferred tax assets | | | 108,461 | | | | 125,450 | | | | 117,963 | | | | 125,450 | |
Less valuation allowance | | | (66,992 | ) | | | (86,770 | ) | | | (78,374 | ) | | | (86,770 | ) |
| | | | | | | | | | | | |
Total deferred tax assets | | | 41,469 | | | | 38,680 | | | | 39,589 | | | | 38,680 | |
| Deferred tax liabilities: | | | | | | | | |
Inventories | | | 658 | | | | — | | |
Property, plant and equipment | | | 28,205 | | | | 30,536 | | | | 30,560 | | | | 30,536 | |
Other intangible assets | | | 33,134 | | | | 33,596 | | | | 35,805 | | | | 33,596 | |
Other liabilities | | | 3,283 | | | | 6,805 | | | | 1,820 | | | | 6,805 | |
| | | | | | | | | | | | |
Total deferred tax liabilities | | | 65,280 | | | | 70,937 | | | | 68,185 | | | | 70,937 | |
| | | | | | | | | | | | |
Net deferred tax liabilities | | $ | (23,811 | ) | | $ | (32,257 | ) | | $ | (28,596 | ) | | $ | (32,257 | ) |
| | | | | | | | | | | | |
EnerSys
Notes to Consolidated Financial Statements—(Continued)
March 31, 2008
(In Thousands, Except Share and Per Share Data)
The Company has approximately $23,648$12,417 in United States federal net operating loss carryforwards, approximately $9,772$9,593 of which are limited by Section 382 of the Internal Revenue Code, that begin to expire in the year ending 2023. The Company has recorded a valuation allowance against approximately $9,233$6,178 of the losses limited by Section 382 and would reduce goodwill shouldas they will expire unused due to the tax benefit of these losses subsequently be recognized.Section 382 limitation. The Company also has $3,100$1,197 of foreign tax credit carryforwards which begin to expire in the year ending 2013,2018, and $549$861 of alternative minimum tax credits which have an unlimited life.
The net operating loss carryforwards at March 31, 20072008, related to the Company’s foreign subsidiaries are approximately $231,698.$251,122. Some of these net operating loss carryforwards have an unlimited life, while others expire at various times over the next twenty years. In addition, the Company also had approximately $83,277$80,528 of net operating loss carryforwards for state tax purposes that expire at various times over the next 20 years. The Company has recorded a valuation allowance for net deferred tax assets in certain foreign and state tax jurisdictions, primarily related to net operating loss carryforwards, due to the significant losses incurred in these tax jurisdictions. Approximately $56,751$47,673 of the March 31, 20072008, valuation allowance would be allocated to reduce goodwill should the Company subsequently recognize tax benefits for the related deferred tax assets. During the fiscal years ended March 31, 20062008 and 2007, the Company recorded tax benefits of $170$23 and $385, respectively, due to the utilization of net operating loss carryforwards in certain foreign subsidiaries.
EnerSys
Notes to Consolidated Financial Statements—(Continued)
March 31, 2007
(In Thousands, Except Share and Per Share Data)
A reconciliation of income taxes at the statutory rate to the income tax provision is as follows:
| | | | Fiscal year ended March 31, | | | Fiscal year ended March 31, | |
| | | 2005 | | 2006 | | 2007 | | | 2008 | | 2007 | | 2006 | |
United States statutory income tax expense (at 35%) | | $ | 17,410 | | | $ | 15,681 | | | $ | 22,086 | | | $ | 30,168 | | | $ | 22,086 | | | $ | 15,681 | |
Increase (decrease) resulting from: | | | | | | | | | | | | |
State income taxes, net of federal effect | | | 636 | | | | 33 | | | | 225 | | | | 623 | | | | 225 | | | | 33 | |
Nondeductible expenses | | | 1,837 | | | | 1,350 | | | | 94 | | | | 467 | | | | 94 | | | | 1,350 | |
Effect of foreign operations | | | (2,705 | ) | | | (3,819 | ) | | | (6,102 | ) | | | (7,682 | ) | | | (6,102 | ) | | | (3,819 | ) |
Valuation allowance | | | 181 | | | | 832 | | | | 1,589 | | | | 2,923 | | | | 1,589 | | | | 832 | |
| | | | | | | | | | | | | | | | | | |
Income tax expense | | $ | 17,359 | | | $ | 14,077 | | | $ | 17,892 | | | $ | 26,499 | | | $ | 17,892 | | | $ | 14,077 | |
| | | | | | | | | | | | | | | | | | |
The effective income tax rate was 30.7 % in fiscal 2008, compared to 28.4 % in fiscal 2007, compared to 31.4% in fiscal 2006.2007. The fiscal 2007 tax expense includes a non-recurring tax benefit of approximately $2,000 recorded in the third fiscal quarter of 2007, attributable to the favorable resolution of a prior year tax matter related to our European business, which reduced our book effective tax rate by 3.2 percentage points. Additionally, in fiscal 2007, changes in the mix of earnings among our various legal entities in multiple foreign jurisdictions hadresulted in an approximate one percentage point decrease on our effective tax rate. A non-recurring $500 tax benefit was recorded in the third fiscal quarter of 2006.
At March 31, 2007,2008, the Company has not recorded United States income or foreign withholding taxes on approximately $127,345$175,975 of undistributed earnings of foreign subsidiaries that could be subject to taxation if remitted to the United States because the Company currently plans to keep these amounts permanently invested overseas.
In June 2006,On April 1, 2007, the FASB issued Company adoptedFASB Interpretation No. 48,Accounting for Uncertainty in Income Taxes—an Interpretation of FASB Statement No. 109 (“FIN 48”). FIN No. 48 establishes which prescribes a recognition threshold and measurement attributesprocess for recording in the financial statement measurement and recognition ofstatements uncertain tax positions taken or expected to be taken in a tax return. Additionally, FIN 48 also provides guidance on the derecognition, classification, interest and penalties, accounting in interim periods and disclosure and transition. FIN 48 is effectiverequirements for fiscal years beginning after December 15, 2006. The Company is currently finalizing its evaluation of the impact that the adoption of FIN 48 will have, however, it does not believe the adoption of FIN 48 will have a material impact on our financial statements, financial position, results of operations or cash flows.uncertain tax positions.
EnerSys
Notes to Consolidated Financial Statements—(Continued)
March 31, 2008
(In Thousands, Except Share and Per Share Data)
As a result of the implementation of FIN 48, the Company did not change the overall total of previously recorded tax liabilities and benefits, and was not required to record any cumulative effect adjustment to retained earnings. A reconciliation of the beginning and ending amount of unrecognized tax benefits is as follows:
| | | | |
April 1, 2007 | | $ | 13,780 | |
Increases related to current year tax positions | | | 1,303 | |
Increases related to prior year tax positions due to foreign currency translation | | | 1,151 | |
Decreases related to prior year tax positions | | | (1,234 | ) |
Lapse of statute of limitations | | | (1,690 | ) |
| | | | |
March 31, 2008 | | $ | 13,310 | |
| | | | |
Included in the balance of unrecognized tax benefits at March 31, 2008 are potential benefits of approximately $11,700 that, if recognized, would be included in the Company’s Statement of Income and have a favorable impact on both the Company’s Statement of Income and effective tax rate.
The Company and its subsidiaries file income tax returns in the U.S. federal jurisdiction, and various states and foreign jurisdictions. With few exceptions, the Company is no longer subject to U.S. federal, state and local, or non-U.S. income tax examinations by tax authorities for years before 2002.
The Company anticipates that it is reasonably possible that an unrecognized tax benefit related to a foreign jurisdiction transfer pricing matter could be resolved as a result of the completion of a tax audit within the next 12 months. The Company also anticipates that it is reasonably possible that the statute of limitations related to unrecognized tax benefits from certain transfer pricing matters in various foreign jurisdictions will expire within the next 12 months. An estimate of the range of the adjustments cannot be made at this time.
The Company recognizes tax related interest and penalties in income tax expense in its Statement of Income. As of March 31, 2008 and April 1, 2007, the Company had an accrual of approximately $850 and $1,375, respectively, for interest and penalties.
EnerSys
Notes to Consolidated Financial Statements—(Continued)
March 31, 2008
(In Thousands, Except Share and Per Share Data)
13. Retirement Plans
Defined Benefit Plans
The Company provides retirement benefits to substantially all eligible salaried and hourly employees. The Company uses a measurement date of March 31 for its pension plans. The following table sets forth a reconciliation of the related benefit obligation, plan assets, and accrued benefit costs related to the pension benefits provided by the Company for these employees covered by defined benefit plans:
| | | | United States Plans | | International Plans | | | United States Plans | | International Plans | |
| | | March 31, | | March 31, | | | March 31, | | March 31, | |
| | | 2006 | | 2007 | | 2006 | | 2007 | | | 2008 | | 2007 | | 2008 | | 2007 | |
Change in projected benefit obligation | | | | | | | | | | | | | | | | |
Benefit obligation at the beginning of the year | | $ | 8,521 | | | $ | 8,852 | | | $ | 29,808 | | | $ | 35,430 | | | $ | 9,521 | | | $ | 8,852 | | | $ | 44,434 | | | $ | 35,430 | |
Service cost | | | 209 | | | | 220 | | | | 2,754 | | | | 3,117 | | | | 254 | | | | 220 | | | | 3,912 | | | | 3,117 | |
Interest cost | | | 505 | | | | 529 | | | | 1,609 | | | | 1,816 | | | | 564 | | | | 529 | | | | 2,328 | | | | 1,816 | |
Benefits paid | | | (476 | ) | | | (506 | ) | | | (1,546 | ) | | | (1,644 | ) | | | (519 | ) | | | (506 | ) | | | (2,036 | ) | | | (1,644 | ) |
Plan participants’ contributions | | | — | | | | — | | | | 746 | | | | 636 | | | | — | | | | — | | | | 709 | | | | 636 | |
Plan curtailments | | | | — | | | | — | | | | (543 | ) | | | — | |
Transfer in (effects of business combinations) | | | | — | | | | — | | | | 1,390 | | | | — | |
Change due to plan amendment | | | — | | | | 299 | | | | — | | | | — | | | | — | | | | 299 | | | | — | | | | — | |
Experience (gain) loss | | | 93 | | | | 127 | | | | 4,214 | | | | 872 | | | | 52 | | | | 127 | | | | (2,689 | ) | | | 872 | |
Foreign currency translation adjustment | | | — | | | | | | (2,155 | ) | | | 4,207 | | | | — | | | | — | | | | 4,298 | | | | 4,207 | |
| | | | | | | | | | | | | | | | | | | | | | | | |
Benefit obligation at the end of the period | | $ | 8,852 | | | $ | 9,521 | | | $ | 35,430 | | | $ | 44,434 | | | $ | 9,872 | | | $ | 9,521 | | | $ | 51,803 | | | $ | 44,434 | |
| | | | | | | | | | | | | | | | | | | | | | | | |
| | | | United States Plans | | International Plans | | | United States Plans | | International Plans | |
| | | March 31, | | March 31, | | | March 31, | | March 31, | |
| | | 2006 | | 2007 | | 2006 | | 2007 | | | 2008 | | 2007 | | 2008 | | 2007 | |
Change in plan assets | | | | | | | | | | | | | | | | |
Fair value of plan assets at the beginning of the period | | $ | 6,530 | | | $ | 7,535 | | | $ | 11,475 | | | $ | 15,417 | | | $ | 8,040 | | | $ | 7,535 | | | $ | 20,605 | | | $ | 15,417 | |
Actual return on plan assets | | | 593 | | | | 831 | | | | 2,554 | | | | 931 | | |
Actual return (loss) on plan assets | | | | 201 | | | | 831 | | | | (727 | ) | | | 931 | |
Employer contributions | | | 888 | | | | 180 | | | | 3,156 | | | | 3,158 | | | | 228 | | | | 180 | | | | 4,619 | | | | 3,158 | |
Plan participants’ contributions | | | — | | | | — | | | | 747 | | | | 637 | | | | — | | | | — | | | | 709 | | | | 637 | |
Benefits paid, inclusive of plan expenses | | | (476 | ) | | | (506 | ) | | | (1,546 | ) | | | (1,644 | ) | | | (519 | ) | | | (506 | ) | | | (2,036 | ) | | | (1,644 | ) |
Foreign currency translation adjustments | | | — | | | | — | | | | (969 | ) | | | 2,106 | | | | — | | | | — | | | | 279 | | | | 2,106 | |
| | | | | | | | | | | | | | | | | | | | | | | | |
Fair value of plan assets at the end of the period | | $ | 7,535 | | | $ | 8,040 | | | $ | 15,417 | | | $ | 20,605 | | | $ | 7,950 | | | $ | 8,040 | | | $ | 23,449 | | | $ | 20,605 | |
| | | | | | | | | | | | | | | | | | | | | | | | |
Funded status (deficit) | | $ | (1,317 | ) | | $ | (1,481 | ) | | $ | (20,013 | ) | | $ | (23,829 | ) | | $ | (1,922 | ) | | $ | (1,481 | ) | | $ | (28,354 | ) | | $ | (23,829 | ) |
Unrecognized net loss | | | 2,584 | | | | — | | | | 3,392 | | | | — | | | | — | | | | — | | | | — | | | | — | |
| | | | | | | | | | | | | | | | | | | | | | | | |
Prepaid (accrued) benefit cost | | $ | 1,267 | | | $ | (1,481 | ) | | $ | (16,621 | ) | | $ | (23,829 | ) | | $ | (1,922 | ) | | $ | (1,481 | ) | | $ | (28,354 | ) | | $ | (23,829 | ) |
| | | | | | | | | | | | | | | | | | | | | | | | |
Accrued pension benefit liability is included in accrued expenses and other liabilities.
EnerSys
Notes to Consolidated Financial Statements—(Continued)
March 31, 20072008
(In Thousands, Except Share and Per Share Data)
Net periodic pension cost for 2005,2008, 2007, and 2006, and 2007 includes the following components:
| | | | United States Plans | | International Plans | | | United States Plans | | International Plans | |
| | | March 31, | | March 31, | | | March 31, | | March 31, | |
| | | 2005 | | 2006 | | 2007 | | 2005 | | 2006 | | 2007 | | | 2008 | | 2007 | | 2006 | | 2008 | | 2007 | | 2006 | |
Service cost | | $ | 197 | | | $ | 209 | | | $ | 220 | | | $ | 3,733 | | | $ | 2,754 | | | $ | 3,117 | | | $ | 254 | | | $ | 220 | | | $ | 209 | | | $ | 3,912 | | | $ | 3,117 | | | $ | 2,754 | |
Interest cost | | | 492 | | | | 505 | | | | 529 | | | | 1,365 | | | | 1,609 | | | | 1,816 | | | | 564 | | | | 529 | | | | 505 | | | | 2,328 | | | | 1,816 | | | | 1,609 | |
Actual loss (return) on plan assets | | | (224 | ) | | | (603 | ) | | | (599 | ) | | | (1,339 | ) | | | (927 | ) | | | (1,447 | ) | | | (639 | ) | | | (599 | ) | | | (603 | ) | | | (1,781 | ) | | | (1,447 | ) | | | (927 | ) |
Amortization and deferral | | | (191 | ) | | | 157 | | | | 154 | | | | 11 | | | | — | | | | 130 | | | | 150 | | | | 154 | | | | 157 | | | | 66 | | | | 130 | | | | — | |
| | | | | | | | | | | | | | | | | | | | | | | | | | | | | | | | | | | | |
Net periodic benefit cost | | $ | 274 | | | $ | 268 | | | $ | 304 | | | $ | 3,770 | | | $ | 3,436 | | | $ | 3,616 | | | $ | 329 | | | $ | 304 | | | $ | 268 | | | $ | 4,525 | | | $ | 3,616 | | | $ | 3,436 | |
| | | | | | | | | | | | | | | | | | | | | | | | | | | | | | | | | | | | |
Significant assumptions used in accounting for the pension benefit plans are as follows:
| | | | United States Plans | | International Plans | | | United States Plans | | International Plans | |
| | | March 31, | | March 31, | | | March 31, | | March 31, | |
| | | 2005 | | 2006 | | 2007 | | 2005 | | 2006 | | 2007 | | | 2008 | | 2007 | | 2006 | | 2008 | | 2007 | | 2006 | |
Discount rate | | 6.0 | % | | 6.0 | % | | 6.0 | % | | 4.8-5.8 | % | | 4.0-5.0 | % | | 4.0-5.0 | % | | 6.0 | % | | 6.0 | % | | 6.0 | % | | 4.3-6.0 | % | | 4.0-5.0 | % | | 4.0-5.0 | % |
Expected return on plan assets | | 9.0 | | | 8.0 | | | 8.0 | | | 6.0-7.8 | | | 8.0 | | | 8.0 | | | 8.0 | | | 8.0 | | | 8.0 | | | 5.5-8.0 | | | 8.0 | | | 8.0 | |
Rate of compensation increase | | N/A | | | N/A | | | N/A | | | 2.0-4.0 | | | 2.0-4.0 | | | 2.0-3.0 | | | N/A | | | N/A | | | N/A | | | 2.0-3.0 | | | 2.0-3.0 | | | 2.0-4.0 | |
As required by SFAS 87, for pension plans for which the accumulated benefit obligation exceeds the fair value of plan assets, the Company has recognized in the consolidated balance sheet at March 31, 2006 the additional minimum liability of the unfunded accumulated benefit obligation of $ 4,947, as a long-term liability, with a partially offsetting intangible asset and equity adjustment. As required by SFAS 158, for pension plans for which the projected benefit obligation exceeds the fair value of plan assets, the Company has recognized in the consolidated balance sheet at March 31, 2008 and 2007, the additional minimum liability of the unfunded projected benefit obligation of $ 7,420,$7,555 and $7,420, respectively, as current and long-term liabilities, with an offsetting equity adjustment.adjustments. The accumulated benefit obligation for all defined benefit pension plans was $43,350$59,076 and $51,474 at March 31, 20062008 and 2007, respectively.
The accumulated benefit obligation related to all defined benefit pension plans and information related to unfunded and underfunded defined benefit pension plans at the end of each year follows:
| | | | | | | | | | | | |
| | | United States Plans | | International Plans |
| | | March 31, | | March 31, |
| | | 2006 | | 2007 | | 2006 | | 2007 |
All defined benefit plans: | | | | | | | | | | | | |
Accumulated benefit obligation | | $ | 8,852 | | $ | 9,521 | | $ | 34,498 | | $ | 41,953 |
Unfunded defined benefit plans: | | | | | | | | | | | | |
Projected benefit obligation | | | — | | | — | | | 20,076 | | | 22,066 |
Accumulated benefit obligations | | | — | | | — | | | 19,332 | | | 21,142 |
Defined benefit plans with an accumulated benefit obligation in excess of the fair value of plan assets: | | | | | | | | | | | | |
Projected benefit obligation | | | 8,852 | | | 9,521 | | | 20,076 | | | 44,434 |
Accumulated benefit obligation | | | 8,852 | | | 9,521 | | | 19,332 | | | 41,953 |
Fair value of plan assets | | | 7,535 | | | 8,040 | | | — | | | 20,605 |
EnerSys
Notes to Consolidated Financial Statements—(Continued)
March 31, 2007
(In Thousands, Except Share and Per Share Data)
| | | | | | | | | | | | |
| | | United States Plans | | International Plans |
| | | March 31, | | March 31, |
| | | 2008 | | 2007 | | 2008 | | 2007 |
All defined benefit plans: | | | | | | | | | | | | |
Accumulated benefit obligation | | $ | 9,872 | | $ | 9,521 | | $ | 49,204 | | $ | 41,953 |
Unfunded defined benefit plans: | | | | | | | | | | | | |
Projected benefit obligation | | | — | | | — | | | 25,859 | | | 22,066 |
Accumulated benefit obligations | | | — | | | — | | | 24,848 | | | 21,142 |
Defined benefit plans with an accumulated benefit obligation in excess of the fair value of plan assets: | | | | | | | | | | | | |
Projected benefit obligation | | | 9,872 | | | 9,521 | | | 50,614 | | | 44,434 |
Accumulated benefit obligation | | | 9,872 | | | 9,521 | | | 48,123 | | | 41,953 |
Fair value of plan assets | | | 7,950 | | | 8,040 | | | 22,362 | | | 20,605 |
The United States plans do not include compensation in the formula for determining the pension benefit as it is based solely on years of service.
EnerSys
Notes to Consolidated Financial Statements—(Continued)
March 31, 2008
(In Thousands, Except Share and Per Share Data)
The Company’s investment policy emphasizes a balanced approach to investing in securities of high quality and ready marketability. Investment flexibility is encouraged so as not to exclude opportunities available through a diversified investment strategy.
Equity investments are maintained within a target range of 50%-70% of the total portfolio at market. Investments in debt securities include issues of various maturities, and the average quality rating of bonds should be investment grade with a minimum quality rating of “B” at the time of purchase.
The Company periodically reviews the asset allocation of its portfolio. The proportion committed to equities, debt securities and cash equivalents is a function of the values available in each category and risk considerations. The plan’s overall return will be compared to and expected to meet or exceed established benchmark funds and returns over a three to five year period.
The objectives of the Company’s investment strategies are: (a) the achievement of a reasonable long-term rate of total return consistent with an emphasis on preservation of capital and purchasing power, (b) stability of annual returns through a portfolio risk level which is appropriate to conservative accounts, and (c) reflective of our willingness to forgo significantly above-average rewards in order to minimize above-average risks. These objectives may not be met each year but should be attained over a reasonable period of time.
The Company expects to make cash contributions of approximately $3,912$5,557 to its pension plans in fiscal year 2008.2009.
As a result of the ESG business combination, the Company has assumed defined benefit plans in Germany and France. These plans have no assets, while their benefit obligations were $18,782$22,208 and $20,683 as of March 31, 20062008 and 2007, respectively. Other salary and hourly employees are provided benefits in accordance with governmental regulatory requirements.
The allocation of investments for the pension plans is as follows:
| | | | | | | | | | | | |
| | | United States Plans | | | International Plans | |
| | | March 31, | | | March 31, | |
| | | 2006 | | | 2007 | | | 2006 | | | 2007 | |
Equity securities | | 62.5 | % | | 63.2 | % | | 62.7 | % | | 63.8 | % |
Debt securities | | 36.4 | | | 32.4 | | | 36.5 | | | 35.4 | |
Cash equivalents | | 0.6 | | | 4.4 | | | 0.6 | | | 0.2 | |
Other | | 0.5 | | | — | | | 0.2 | | | 0.6 | |
| | | | | | | | | | | | |
Total | | 100.0 | % | | 100.0 | % | | 100.0 | % | | 100.0 | % |
| | | | | | | | | | | | |
EnerSys
Notes to Consolidated Financial Statements—(Continued)
March 31, 2007
(In Thousands, Except Share and Per Share Data)
| | | | | | | | | | | | |
| | | United States Plans | | | International Plans | |
| | | March 31, | | | March 31, | |
| | | 2008 | | | 2007 | | | 2008 | | | 2007 | |
Equity securities | | 53.8 | % | | 63.2 | % | | 62.3 | % | | 63.8 | % |
Debt securities | | 41.5 | | | 32.4 | | | 36.5 | | | 35.4 | |
Cash equivalents | | 4.7 | | | 4.4 | | | 0.3 | | | 0.2 | |
Other | | — | | | — | | | 0.9 | | | 0.6 | |
| | | | | | | | | | | | |
Total | | 100.0 | % | | 100.0 | % | | 100.0 | % | | 100.0 | % |
| | | | | | | | | | | | |
Benefit payments, which reflect expected future service, as appropriate, are expected to be paid as follows:
| | | | Pension
Benefits | | Pension
Benefits |
2008 | | $ | 1,853 | |
2009 | | | 1,893 | | $ | 2,084 |
2010 | | | 2,002 | | | 2,094 |
2011 | | | 2,246 | | | 2,228 |
2012 | | | 2,344 | | | 2,449 |
Years 2013-2017 | | | 15,251 | |
2013 | | | | 2,581 |
Years 2014-2018 | | | | 19,027 |
EnerSys
Notes to Consolidated Financial Statements—(Continued)
March 31, 2008
(In Thousands, Except Share and Per Share Data)
In accordance with SFAS 158, the Company began recognizingrecognizes the funded status of its retirement plans in its statement of financial position at March 31, 2007.position. The underfunded status of our retirement plans recorded as a liability on the Company’s statement of financial position at March 31, 2008 and 2007 was approximately $25,310.$30,276 and $25,310, respectively.
The amounts included in accumulated other comprehensive income as of March 31, 20072008 that are expected to be recognized as components of net periodic pension cost during the fiscal year ended March 31, 20082009 are as follows:
| | | | |
Net gain or (loss) | | $ | (31 | ) |
Net prior service cost | | | (182 | ) |
| | | | |
Net amount expected to be recognized | | $ | (213 | ) |
| | | | |
The incremental effect of applying SFAS 158 on the individual line items in the balance sheet as of March 31, 2007 was as follows:
| | | | | | | | | | |
| | | Before
Application
of SFAS 158 | | Impact
Adjustments | | | After
Application
of SFAS 158 |
Other assets | | $ | 20,651 | | $ | (340 | ) | | $ | 20,311 |
Net deferred tax liabilities | | | 33,089 | | | (832 | ) | | | 32,257 |
Other long-term liabilities | | | 42,702 | | | 2,815 | | | | 45,517 |
Accumulated other comprehensive income | | | 105,017 | | | (1,983 | ) | | | 103,034 |
| | | | |
Net gain or (loss) | | $ | (143 | ) |
Net prior service cost | | | (33 | ) |
| | | | |
Net amount expected to be recognized | | $ | (176 | ) |
| | | | |
Defined Contribution Plan
Effective January 1, 2004, the Company amended its Defined Contribution Plan (the “401(k) Plan”). The amended 401(k) Plan covers substantially all U.S. salaried and hourly employees except those covered by a union plan. All eligible employees of the amended 401(k) Plan receive a matching contribution of 100% of the first 4% of wages contributed and 50% of the next 2% of wages contributed for a total match of up to 5% by the Company. Employer expenses for the 401(k) plan for the fiscal years ended March 31, 2005,2008, 2007 and 2006, were $2,298, $2,176 and 2007 were $1,972, $2,160, and $2,176, respectively.
EnerSys
Notes to Consolidated Financial Statements—(Continued)
March 31, 2007
(In Thousands, Except Share and Per Share Data)
14. Preferred Stock
The Company’s certificate of incorporation authorizes the issuance of up to 1,000,000 shares of preferred stock, par value $0.01 per share (Preferred Stock). At March 31, 20062008 and 2007, no shares of Preferred Stock were issued or outstanding. The Board of Directors of the Company has the authority to specify the terms of any Preferred Stock at the time of issuance.
15. Secondary OfferingOfferings of 6,000,000 Common Shares
On July 27, 2006, the Company filed a shelf registration statement on Form S-3 with the SEC, which allowed the Company to offer and sell from time to time, in one or more offerings, 12,500,000 shares of EnerSys’ common stock. The registration statement also permits certain institutional investors and certain members of senior management to sell shares of common stock held by such person.
Under the July 27, 2006 shelf registration statement, certain of the Company’s stockholders, including affiliates of Metalmark Capital LLC and certain other institutional stockholders, completed secondary offerings as follows:
on December 7, 2006, certain of the Company’s stockholders, including affiliates of Metalmark Capital LLC and certain other institutional stockholders, completed a secondary offering of 6,000,000 shares of the Company’s common stock to Lehman Brothers Inc. The offering closed on December 12, 2006.
on June 29, 2007, certain of the Company’s stockholders, including affiliates of Metalmark Capital LLC and certain other institutional stockholders, completed a secondary offering of 6,000,000 shares of the Company’s common stock to Jefferies & Company, Inc. The offering closed on July 5, 2007.
EnerSys
Notes to Consolidated Financial Statements—(Continued)
March 31, 2008
(In Thousands, Except Share and Per Share Data)
The Company did not issue any shares or receive any proceeds in the offering under the July 27, 2006 shelf registration statement, however, under the terms of its shareholders’ agreement, the companyCompany did payincur approximately $750$1,085 in fees related to the offering.
On October 30, 2007, the Company filed a $500,000 shelf registration statement on Form S-3 with the SEC. This registration statement allowed the Company to offer and sell from time to time, in one or more offerings, shares of common stock and debt securities of the Company. The registration statement also permitted certain institutional investors and certain members of senior management to sell approximately 22.2 million shares of common stock held by such person in one or more secondary offerings.
Under the October 30, 2007 shelf registration statement, certain of the Company’s stockholders, including affiliates of Metalmark Capital LLC and certain other institutional stockholders, completed secondary offerings as follows:
on November 29, 2007, 5,000,000 shares of the Company’s common stock were sold to Jefferies & Company, Inc. The offering closed on December 3, 2007; and
on February 26, 2008, 5,000,000 shares of the Company’s common stock were sold to Goldman, Sachs & Co. The offering closed on February 29, 2008.
The Company did not issue any shares or receive any proceeds in these offerings, however, under the terms of its shareholders’ agreement, the Company did incur approximately $610 in fees related to the fiscal 2008 offerings.
See Note 26, Subsequent Events, for a secondary offer made in May 2008.
16. Stock-Based Compensation
At March 31, 2007,2008, the Company maintains three management equity incentive plans, Thewhich were approved by the Company’s shareholders. These plans, which are the 2000 Management Equity Plan, the 2004 Equity Incentive Plan and the 2006 Equity Incentive Plan, that reserve 11,289,232 shares of Common Stock for the grant of various classes of nonqualified stock options, restricted stock, restricted stock units and other forms of equity based compensation. At March 31, 2008, 2,344,800 shares are available for future grants. The Company’s management equity incentive plans are intended to provide an incentive to employees and non-employee directors of the Company to remain in the service of the Company and to increase their interest in the success of the Company in order to promote the long-term interests of the Company. The plans seek to promote the highest level of performance by providing an economic interest in the long-term performance of the Company. The Company settles employee share-based compensation awards primarily with newly issued shares.
Stock Incentive Plans
Non-qualified stock options have been granted to employees under the equity incentive plans at prices not less than the fair market value of the shares on the dates the options were granted. Generally, options vest over a four-year period and become exercisable in annual installments over the vesting period. Options generally expire in 10 years.
EnerSys
Notes to Consolidated Financial Statements—(Continued)
March 31, 2008
(In Thousands, Except Share and Per Share Data)
During fiscal 2005 and 2006, the Company accounted for equity-based compensation under the provisions and related interpretations of Accounting Principles Board No. 25,Accounting for Stock Issued to Employees (“APB 25”). Accordingly, the Company was not required to record compensation expense when stock options were granted to employees as long as the exercise price was not less than the fair market value of the stock at the grant date. Also, the Company was not required to record compensation expense when it issued common stock under the Employee Stock Purchase Plan as long as the purchase price was not less than 85% of the fair market value of the Company’s common stock on the grant date. In December 1995, the FASB issued SFAS 123, which allowed the Company to continue to follow the guidelines of APB 25, but required pro-forma disclosures of net income and earnings per share as if the Company had adopted the provisions of SFAS 123. In December 2002, the FASB issued SFAS 148,Accounting for Stock-Based Compensation—Transition and Disclosure—an Amendment of FASB 123, which provided alternative methods of transition for an entity that voluntarily changes to the fair value based method of accounting for equity-based employee compensation. The Company continued to account for equity-based compensation under the provisions of APB 25 using the intrinsic value method.
If the compensation cost for the Company’s equity-based compensation plans had been determined based on the fair value at the grant dates for awards under those plans in accordance with the provisions of SFAS 123, then
EnerSys
Notes to Consolidated Financial Statements—(Continued)
March 31, 2007
(In Thousands, Except Share and Per Share Data)
the Company’s net earnings and net earnings per share for the fiscal years ended March 31, 2005 and 2006, would have been as follows (in thousands, except per share data):
| | | | Fiscal year ended
March 31,
2005 | | Fiscal year ended
March 31,
2006 | | | Fiscal year ended
March 31,
2006 | |
Net earnings, as reported | | $ | 24,228 | | | $ | 30,726 | | | $ | 30,726 | |
Add: Equity-based compensation included in net earnings, as reported | | | — | | | | 261 | | | | 261 | |
Other stock-based compensation expense | | | 210 | | | | — | | |
Subtract: Equity-based compensation under SFAS 123 | | | (2,543 | ) | | | (1,031 | ) | | | (1,031 | ) |
| | | | | | | | | |
Pro forma net earnings | | $ | 21,895 | | | $ | 29,956 | | | $ | 29,956 | |
| | | | | | | | | |
Net earnings per common share-as reported: | | | | | | |
Basic | | $ | 0.67 | | | $ | 0.66 | | | $ | 0.66 | |
| | | | | | | | | |
Diluted | | $ | 0.65 | | | $ | 0.66 | | | $ | 0.66 | |
| | | | | | | | | |
Net earnings per common share-as adjusted: | | | | | | |
Basic | | $ | 0.60 | | | $ | 0.65 | | | $ | 0.65 | |
| | | | | | | | | |
Diluted | | $ | 0.59 | | | $ | 0.64 | | | $ | 0.64 | |
| | | | | | | | | |
Equity-based compensation expense required by SFAS 123 has been determined as if the Company had accounted for its employee stock options under the fair value method of SFAS 123. The fair value of the options granted in fiscal 2006 was estimated at the date of grant using the Black-Scholes option-pricing model with the following assumptions:utilizing assumptions based on historical data, as follows: risk-free interest rate of 4.4%, dividend yield of zero, expected life of 7 years and expected volatility of 41.2%.
| | | | | | |
| | | 2005 | | | 2006 | |
Risk-free interest rate | | 5.0 | % | | 4.4 | % |
Dividend yield | | 0 | % | | 0 | % |
Expected life | | 7 years | | | 7 years | |
Expected volatility | | 28.9 | % | | 41.2 | % |
In December 2004, the FASB issued a revision of SFAS No. 123,Share-Based Payment (“SFAS 123(R)”), which supersedes SFAS 123 and APB 25. This statement focuses primarily on transactions in which an entity obtains employee services in exchange for share-based payments. The pro forma disclosure previously permitted under SFAS 123 will no longer be an alternative to financial statement recognition. Under SFAS 123(R), a public entity generally is required to measure the cost of employee services received in exchange for the award of an
EnerSys
Notes to Consolidated Financial Statements—(Continued)
March 31, 2008
(In Thousands, Except Share and Per Share Data)
equity instrument based on the grant-date fair value of the award, with such cost recognized over the applicable vesting period. In addition, SFAS 123(R) requires an entity to provide certain disclosures in order to assist in understanding the nature of share-based payment transactions and the effects of those transactions on the financial statements. The Company adopted the provisions of SFAS 123(R) on April 1, 2006, using the modified-prospective method.
The modified-prospective method requires that compensation expense be recorded for all unvested stock options at the beginning of the first quarter of adoption of SFAS 123(R), on April 1, 2006. Unvested options outstanding upon adoption, that were accounted for under the minimum value method in accordance with SFAS 123 and APB 25, will continue to be accounted for under the minimum value method. All other unvested options outstanding upon adoption will be accounted for under the modified–prospective method. The Company
EnerSys
Notes to Consolidated Financial Statements—(Continued)
March 31, 2007
(In Thousands, Except Share and Per Share Data)
uses the Black-Scholes option-pricing model to value all of its unvested stock options and the modified prospective method in applying the requirements of SFAS 123(R). In 2006, the pro forma compensation expense was calculated using the Black-Scholes model utilizing assumptions based on historical data, such that expense was determined using separate expected term assumptions for each vesting tranche. As a result, the pro forma compensation expense for any stock options granted prior to April 1, 2006 was calculated using the accelerated amortization method. Upon adoption of FAS 123R, effective April 1, 2006, the Company recognizes compensation expense using the straight-line method.
Upon adoption of SFAS 123(R), the Company began recording compensation cost related to the continued vesting of all stock options that remained unvested as of April 1, 2006, as well as for all stock options granted, modified or cancelled after the adoption date. The compensation cost to be recorded is based on the fair value at the grant date. The fair value of the options granted in fiscal 2007 was estimated at the date of grant using the Black-Scholes option-pricing model utilizing assumptions based on historical data and current market data. The assumptions include expected term of the options, risk-free rate, volatility, and dividend yield. The expected term represents the expected amount of time that options granted are expected to be outstanding, based on historical and forecasted exercise behavior. The risk-free rate is based on the rate at grant date of zero-coupon U.S. Treasury Notes with a term equal to the expected term of the option. Expected volatility is estimated using historical volatility based on historical weekly price changes. The weighted average fair value of options granted in 2008, and 2007 was $8.00 and $7.18 per option, respectively, and were determined using the following assumptions: risk-free interest rate of 5.1%, dividend yield of zero, expected life of 7 years and expected volatility of 38.3%.
| | | | | | |
| | | 2008 | | | 2007 | |
Risk-free interest rate | | 4.7 | % | | 5.1 | % |
Dividend yield | | 0 | % | | 0 | % |
Expected life | | 6 years | | | 7 years | |
Expected volatility | | 36.6 | % | | 38.3 | % |
For fiscal 2008 and 2007, the Company recognized $1,168 ($810 net of taxes) and $1,192 ($815 net of taxes), respectively, of stock-based compensation expense associated with the stock option grants.
Prior to the adoption of SFAS 123(R), cash flows resulting from the tax benefit related to equity-based compensation was presented in operating cash flows, along with other tax cash flows, in accordance with the provisions of EITF 00-15,Classification in the Statement of Cash Flows of the Income Tax Benefit Received by a Company upon Exercise of a Nonqualified Employee Stock Option, (“EITF 00-15”). SFAS 123(R) superseded EITF 00-15, amended SFAS 95,Statement of Cash Flows, and requires tax benefits relating to excess equity-based compensation deductions to be prospectively presented in the statement of cash flows as financing cash inflows.
EnerSys
Notes to Consolidated Financial Statements—(Continued)
March 31, 2008
(In Thousands, Except Share and Per Share Data)
The adoption of SFAS 123(R) had the effect of (a) reducing the Company’s income from operations, income before income taxes, net income by $1,192, $1,192 and $815, respectively; (b) reducing net cash provided by operating activities by $815, and (c) reducing basic and diluted earnings per share for the year ended March 31, 2007, by $0.2$0.02 and $0.2,$0.02, respectively, and (d) of increasing the Company’s net cash provided by financing activities by $815.
The following table summarizes the Company’s stock option activity in the years indicated:
| | | | | | | | | | | |
| | | Number of
Options | | | Weighted
Average
Remaining
Contract
Term (Years) | | Weighted
Average
Exercise
Price | | Aggregate
Intrinsic
Value |
Options outstanding as of March 31, 2004 | | 6,983,601 | | | 5.83 | | $ | 14.13 | | $ | N/A |
Conversion of preferred stock options to common stock options at IPO | | 357,507 | | | 4.25 | | | 3.74 | | | 3,132 |
Granted | | 194,109 | | | | | | 14.03 | | | — |
Exercised | | (213,435 | ) | | | | | 9.40 | | | 1,031 |
Canceled | | (47,168 | ) | | | | | 18.95 | | | 23 |
| | | | | | | | | | | |
Options outstanding as of March 31, 2005 | | 7,274,614 | | | 5.6 | | $ | 13.72 | | $ | 11,744 |
Granted | | 437,600 | | | | | | 15.41 | | | — |
Exercised | | (138,664 | ) | | | | | 13.52 | | | 381 |
Canceled | | (787,482 | ) | | | | | 15.31 | | | 799 |
| | | | | | | | | | | |
Options outstanding as of March 31, 2006 | | 6,786,068 | | | 4.9 | | $ | 13.71 | | $ | 13,537 |
Granted | | 44,729 | | | | | | 14.45 | | | — |
Exercised | | (1,298,548 | ) | | | | | 12.76 | | | 6,109 |
Canceled | | (25,750 | ) | | | | | 12.19 | | | 128 |
| | | | | | | | | | | |
Options outstanding as of March 31, 2007 | | 5,506,499 | | | 4.3 | | $ | 13.94 | | $ | 23,287 |
| | | | | | | | | | | |
Options exercisable as of March 31, 2007 | | 5,110,070 | | | 4.0 | | $ | 13.84 | | $ | 22,139 |
| | | | | | | | | | | |
Options expected to vest as of March 31, 2008 | | 139,457 | | | 8.3 | | $ | 15.16 | | $ | 408 |
| | | | | | | | | | | |
| | | | | | | | | | | |
| | | Number of
Options | | | Weighted
Average
Remaining
Contract
Term (Years) | | Weighted
Average
Exercise
Price | | Aggregate
Intrinsic
Value |
Options outstanding as of March 31, 2005 | | 7,274,614 | | | 5.6 | | $ | 13.72 | | $ | 11,744 |
Granted | | 437,600 | | | | | | 15.41 | | | — |
Exercised | | (138,664 | ) | | | | | 13.52 | | | 381 |
Canceled | | (787,482 | ) | | | | | 15.31 | | | 799 |
| | | | | | | | | | | |
Options outstanding as of March 31, 2006 | | 6,786,068 | | | 4.9 | | $ | 13.71 | | $ | 13,537 |
Granted | | 44,729 | | | | | | 14.45 | | | — |
Exercised | | (1,298,548 | ) | | | | | 12.76 | | | 6,109 |
Canceled | | (25,750 | ) | | | | | 12.19 | | | 128 |
| | | | | | | | | | | |
Options outstanding as of March 31, 2007 | | 5,506,499 | | | 4.3 | | $ | 13.94 | | $ | 23,287 |
Granted | | 286,724 | | | | | | 18.25 | | | — |
Exercised | | (2,236,505 | ) | | | | | 12.42 | | | 19,338 |
Canceled | | (21,783 | ) | | | | | 12.99 | | | 87 |
| | | | | | | | | | | |
Options outstanding as of March 31, 2008 | | 3,534,935 | | | 4.4 | | $ | 15.27 | | $ | 30,617 |
| | | | | | | | | | | |
Options exercisable as of March 31, 2008 | | 3,019,912 | | | 3.7 | | $ | 14.97 | | $ | 27,159 |
| | | | | | | | | | | |
Options expected to vest as of March 31, 2009 | | 192,682 | | | 8.1 | | $ | 16.49 | | $ | 1,442 |
| | | | | | | | | | | |
EnerSys
Notes to Consolidated Financial Statements—(Continued)
March 31,Fiscal 2008, 2007
(In Thousands, Except Share and Per Share Data)
During fiscal 2005, 10,609 of preferred stock options outstanding were converted into 357,507 common stock options. The additional preferred stock accretion in fiscal 2005 was 6,553 options. The approximate weighted average exercise price is $3.74 per share. These options are fully vested and expire on October 30, 2008.
Fiscal 2005, 2006, and 2007 options were granted with an exercise price that equals or was in excess of the estimated fair market value of a share of EnerSys common stock on the date of grant. The weighted average estimated fair market value of options that were granted in fiscal 2005,2008, 2007 and 2006, and 2007, computed using the Black-Scholes option-pricing model, were $4.10,$8.00, $7.18 and $5.99, respectively.
EnerSys
Notes to Consolidated Financial Statements—(Continued)
March 31, 2008
(In Thousands, Except Share and $7.18, respectively.Per Share Data)
The following table summarizes information regarding stock options outstanding and exercisable at March 31, 2007:2008:
| | | | Options Outstanding | | Options Exercisable | | Options Outstanding | | Options Exercisable |
Range of Exercise Prices | | Number of
Options | | Weighted
Average
Remaining
Contractual Life | | Weighted
Average
Exercise Price | | Number of
Options | | Weighted
Average
Exercise Price | | Number of
Options | | Weighted
Average
Remaining
Contractual Life | | Weighted
Average
Exercise Price | | Number of
Options | | Weighted
Average
Exercise Price |
$3.00-$10.00 | | 261,108 | | 1.6 | | $ | 3.74 | | 261,108 | | $ | 3.74 | | 9,890 | | 0.6 | | $ | 3.74 | | 9,890 | | $ | 3.74 |
$10.01-$15.00 | | 3,112,962 | | 5.1 | | | 11.18 | | 2,820,233 | | | 10.96 | | 2,050,214 | | 4.3 | | | 11.28 | | 1,886,841 | | | 11.10 |
$15.01-20.00 | | 1,261,490 | | 2.8 | | | 16.46 | | 1,188,990 | | | 16.30 | | 614,449 | | 5.8 | | | 17.61 | | 283,599 | | | 16.71 |
$20.01-25.00 | | 728,867 | | 4.9 | | | 22.04 | | 697,667 | | | 21.92 | | 718,310 | | 3.9 | | | 22.05 | | 697,510 | | | 21.96 |
Over $25.00 | | 142,072 | | 3.6 | | | 29.36 | | 142,072 | | | 29.36 | | 142,072 | | 2.6 | | | 29.36 | | 142,072 | | | 29.36 |
| | | | | | | | | | | | | | | | | | | | |
| | 5,506,499 | | 4.3 | | $ | 13.94 | | 5,110,070 | | $ | 13.84 | | 3,534,935 | | 4.4 | | $ | 15.27 | | 3,019,912 | | $ | 14.97 |
| | | | | | | | | | | | | | | | | | | | |
A summary of the status of the Company’s non-vested options as of March 31, 2007,2008, and changes during the year ended March 31, 2007,2008, is presented below.
| | | | Number of
Options | | Weighted
Average
Grant-Date
Fair Value | | Number of
Options | | Weighted
Average
Grant-Date
Fair Value |
Nonvested at March 31, 2006 | | $ | 533,842 | | | $ | 5.56 | |
Nonvested at March 31, 2007 | | | 415,113 | | | $ | 5.92 |
Granted | | | 44,729 | | | | 7.18 | | 286,724 | | | | 8.00 |
Vested | | | (164,892 | ) | | | 4.88 | | (175,206 | ) | | | 5.82 |
Forfeited | | | (17,250 | ) | | | 6.27 | | (11,608 | ) | | | 5.76 |
| | | | | | | | | | |
Nonvested at March 31, 2007 | | $ | 396,429 | | | | 6.00 | |
Nonvested at March 31, 2008 | | | 515,023 | | | | 7.11 |
| | | | | | | | | | |
Restricted Stock
No restricted stock awards were granted in fiscal 2008. In fiscal 2007, the Company approved grants of 9,000 shares of restricted stock at a weighted average fair market value on the date of grants of $16.11 per share. In fiscal 2006, the Company approved grants of 263,282 shares of restricted stock at a weighted average fair market value on that date of grants of $13.18 per share. This resulted in the recording of unearned stock grant compensation of $3,471 in the equity section of the Consolidated Condensed Balance Sheets. In connection with the adoption of SFAS 123(R) on April 1, 2006, the unamortized balance of unearned stock grant compensation on that date was reclassified to additional paid-in capital. In fiscal
At March 31, 2008 and 2007, the Company approved grants of 9,000had 133,144 and 205,217, respectively, shares of restricted stock outstanding at a weighted average fair market value on that date of grants of $16.11$13.33 and $13.31, respectively, per share. Generally, restricted stock is granted at the fair market value of the Company’s common stock on the date of grant and vest in annual installments of 25% over a four-year period from the date of grant.
EnerSys
Notes to Consolidated Financial Statements—(Continued)
March 31, 20072008
(In Thousands, Except Share and Per Share Data)
A summary of the changes in restricted stock outstanding under the Company’s equity compensation plans during fiscal 20072008 is presented below: There was no restricted stock granted or outstanding during fiscal 2005.
| | | | Number of
Restricted
Stock | | Weighted
Average
Grant Date
Fair Value | | Number of
Restricted
Stock | | Weighted
Average
Grant Date
Fair Value |
Non-vested units as of March 31, 2006 | | 263,282 | | | $ | 13.18 | |
Non-vested units as of March 31, 2007 | | | 205,217 | | | $ | 13.31 |
Granted | | 9,000 | | | | 16.11 | | — | | | | — |
Vested | | (67,065 | ) | | | 13.18 | | (71,323 | ) | | | 13.27 |
Canceled | | — | | | | — | | (750 | ) | | | 13.04 |
| | | | | | | | | | |
Non-vested units as of March 31, 2007 | | 205,217 | | | | 13.21 | |
Non-vested units as of March 31, 2008 | | | 133,144 | | | | 13.33 |
| | | | | | | | | | |
During fiscal 2008 and 2007, the Company recognized equity-based compensation expense of approximately $1,694 and the related tax benefits $593, respectively, related to the vesting of restricted stock.stock grants of approximately $907 with a related tax benefit of $279 during fiscal 2008 and $1,694, with a related tax benefits $593, during fiscal 2007.
Restricted Stock Units
The Company approved a grant of 22,969 restricted stock units on February 12, 2007, at the fair market value on that date of $16.37 and approved a grant of 19,831 restricted stock units on August 13, 2007, at the fair market value on that date of $18.96 to non-employee directors. These restricted stock units vest and becomebecame exercisable in installments over a five-month periodperiods which endsend on July 20, 2007, and July 19, 2008, respectively, just prior to the Company’s annual stockholders meeting.meetings. The Company approved a grant of 141,995 restricted stock units in fiscal 2008, at the fair market value on that date of $18.25 to management and other key employees. These restricted stock units are granted at the fair market value of the Company’s common stock on the date of grant and vest 25% per year over a four-year period from the date of grant.
The Company recognized equity-based compensation expense related to the vesting of restricted stock units of approximately $953, with a related tax benefit of $293 for fiscal 2008, and approximately $231, with a related tax benefit of $66 for fiscal 2007.
All Award Plans
As of March 31, 2007,2008, unrecognized compensation expense associated with the non-vested incentive awards outstanding was $2,775$5,010 and is expected to be recognized over a weighted average period of 2430 months.
In May 2007, subsequent to March 31, 2007 and therefore not included in the data above, the Company granted 284,999 stock options at an exercise price of $18.25 and 141,140 restricted stock units under its management equity incentive plans.
EnerSys
Notes to Consolidated Financial Statements—(Continued)
March 31, 20072008
(In Thousands, Except Share and Per Share Data)
17. Earnings Per Share
The following table sets forth the reconciliation from basic to diluted average common shares and the calculations of net earnings per common share (dollars in thousands, except per share data).
| | | | March 31, | | March 31, |
| | | 2005 | | 2006 | | 2007 | | 2008 | | 2007 | | 2006 |
Net earnings | | $ | 32,383 | | $ | 30,726 | | $ | 45,210 | | $ | 59,696 | | $ | 45,210 | | $ | 30,726 |
Series A convertible preferred stock dividends | | | 8,155 | | | — | | | — | |
| | | | | | | |
Net (loss) earnings available to common stockholders | | $ | 24,228 | | $ | 30,726 | | $ | 45,210 | |
| | | | | | | | | | | | |
Average common shares: | | | | | | | | | | | | |
Basic (weighted-average outstanding shares) | | | 36,416,358 | | | 46,226,582 | | | 46,539,638 | | | 47,645,225 | | | 46,539,638 | | | 46,226,582 |
Dilutive potential common shares from common stock options | | | 630,339 | | | 561,781 | | | 1,006,602 | | | 999,225 | | | 1,006,602 | | | 561,781 |
| | | | | | | | | | | | |
Diluted (weighted-average outstanding shares) | | | 37,046,697 | | | 46,788,363 | | | 47,546,240 | | | 48,644,450 | | | 47,546,240 | | | 46,788,363 |
| | | | | | | | | | | | |
Basic earnings per common share | | $ | 0.67 | | $ | 0.66 | | $ | 0.97 | | $ | 1.25 | | $ | 0.97 | | $ | 0.66 |
| | | | | | | | | | | | |
Diluted earnings per common share | | $ | 0.65 | | $ | 0.66 | | $ | 0.95 | | $ | 1.22 | | $ | 0.95 | | $ | 0.66 |
| | | | | | | | | | | | |
Antidilutive options, convertible preferred stock and non-vested restricted stock not included in the dilutive earnings per common share calculation | | | 8,649,375 | | | 6,487,567 | | | 1,098,629 | | | 183,672 | | | 1,098,629 | | | 6,487,567 |
| | | | | | | | | | | | |
See Note 26, Subsequent Events, for the grant of stock options and restricted stock units under the Company’s management equity incentive plans and the May 2008 sale of $172,500 aggregate principal amount of senior unsecured convertible notes.
18. Concentration of Credit Risk
Financial instruments that subject the Company to potential concentration of credit risk consist principally of trade accounts receivable and temporary cash investments. The Company places its temporary cash investments with various financial institutions and limits the amount of credit exposure to any one financial institution. Concentration of credit risk with respect to trade receivables is limited by a large, diversified customer base and its geographic dispersion. The Company performs ongoing credit evaluations of its customers’ financial condition and requires collateral, such as letters of credit, in certain circumstances.
19. Commitments Contingencies and ContingenciesLitigation
Litigation
The Company is involved in litigation incidental to the conduct of its business, the results of which, in the opinion of management, are not likely to be material to the Company’s financial condition, results of operations, or cash flows.
Litigation Settlement Income
In the nine fiscal months of 2007, the Company recorded litigation settlement income of approximately $3,753, net of fees and expenses, due to the settlements of two separate legal matters. The amounts of the settlements have been recorded as increases in operating income because the costs related to these matters were previously recorded as an element of operating earnings.
EnerSys
Notes to Consolidated Financial Statements—(Continued)
March 31, 2008
(In Thousands, Except Share and Per Share Data)
Environmental Issues
As a result of its operations, the Company is subject to various federal, state, local, and foreign environmental laws and regulations and is exposed to the costs and risks of registering, handling, processing, storing, transporting, and disposing of hazardous substances, especially lead and acid. The Company’s operations are also subject to federal, state, local and foreign occupational safety and health regulations, including laws and regulations relating to exposure to lead in the workplace.
EnerSys
Notes to Consolidated Financial Statements—(Continued)
March 31, 2007
(In Thousands, Except Share and Per Share Data)
The Company is involved in ongoing environmental issues at certain of its United States and foreign facilities. The Company currently has identified three potential environmental issues at our Manchester, United KingdomEngland battery facility and certain cleanup obligations at its Sumter, South Carolina facility and has established reserves of approximately $9,906 and $8,746 in other liabilities and accrued expenses at March 31, 2007.2008 and 2007, respectively. The Company believes it is indemnified in whole or in part for some of these environmental matters. Based on information available at this time, management believes that its reserves are sufficient to satisfy its environmental liabilities.
Manchester, England
We currently have identified three potentially significant environmental issues at our Manchester, England battery facility: lead slag piles that may pose a health risk are located in the vicinity of a public footpath on the property; the potential restoration of the Manchester, Bolton and Bury Canal by British Waterways may lead to sampling and/or remediation obligations with respect to the canal and surrounding areas located on our property; and there may be multiple and as yet unidentified areas of soil and groundwater contamination at the facility. We believe we have a right to be indemnified by the previous owner for these potential environmental liabilities in excess of amounts accrued and submitted a notice of claim to the previous owner in May 2003 regarding these issues. No government or third-party lawsuits, regulatory actions or orders have been filed with respect to this site to date, and all our actions at this site to date are voluntary. We originally established a reserve for this facility at £3,500, and as of March 31, 2008 and 2007, itthe remaining reserve amounted to approximately $6,575.$6,585 and $6,575, respectively. Based on the information available at this time, we believe these reserves are sufficient to satisfy these environmental liabilities. See Note 26, Subsequent Events, for comments regarding the sale of the Manchester facility, subsequent to March 31, 2008.
Sumter, South Carolina
We currently are responsible for certain cleanup obligations at the former Yuasa battery facility in Sumter, South Carolina. This battery facility was closed in 2001 and is separate from our current metal fabrication facility in Sumter. Remediation issues related to lead contamination in the soil were addressed pursuant to a 1998 Consent Order with the State of South Carolina, and we believe this matter to be closed. We are subject to ongoing storm water inspection requirements under a 2000 Consent Order based on suspected lead contamination. We also are in ongoing discussions with the State of South Carolina regarding alleged trichloroethylene (TCE) and other volatile organic compound (VOC) contamination in the groundwater that predates our ownership of this facility. There may be other unidentified contaminants in the soil or groundwater that also predate our ownership of this facility. We believe we are insured against losses arising out of the alleged VOC contamination pursuant to our environmental insurance policy for U.S. facilities and filed a notice of claim with our insurance carrier in October 2002 regarding this contamination. In July 2004, we received written confirmation from our insurance carrier that we are insured against losses over $500 with respect to the investigation of this VOC contamination. We also believe we will be indemnified by the former owner of the facility for environmental liabilities at this facility in excess of amounts accrued and submitted a notice of claim to them in 2002 regarding these issues. We have established a reserve for this facility, and asin fiscal 2008, we received $1,150 from a previous owner in settlement of their indemnification of potential environmental liabilities related to the Sumter facility. As of March 31, 2008 and 2007, it amountedthe reserves related to this facility and the removal of its remaining equipment totaled approximately $2,171.$4,007 and $2,860, respectively. Based on current information we believe these reserves are adequate to satisfy our environmental liabilities at this facility.
EnerSys
Notes to Consolidated Financial Statements—(Continued)
March 31, 2008
(In Thousands, Except Share and Per Share Data)
Lead Contracts
In order to mitigate against large increases in lead costs, the Company has entered into contracts with financial institutions to fix the price of lead. Each such contract is for a period not extending beyond one year. Under these contracts, at March 31, 2006,2008, the Company contracted to fix the price of approximately 32,800
EnerSys
Notes to Consolidated Financial Statements—(Continued)
March 31, 2007
(In Thousands, Except Share and Per Share Data)
58,495 pounds of lead for a total contract price of $17,420.$72,307. At March 31, 2007, the Company contracted to fix the price of approximately 73,500 pounds of lead for a total contract price of $51,790.
Foreign Currency Forward Contracts
We quantify and monitor our global foreign currency exposures. On a selective basis we will enter into foreign currency forward contracts and option contracts to reduce the volatility from currency movements that affect the Company. Based primarily on statistical analysis of the Company’s currency exposures in fiscal 2007, we are highly confident that the pretax effect on annual earnings of changes in the principal currencies in which we conduct our business would not be in excess of approximately $6 million in more than one year out of twenty years.
Our largest exposure is from the purchase and conversion of U.S. dollar based lead costs into local currencies in Europe, China and Mexico. Additionally, we have currency exposures from intercompany trade transactions. To hedge these exposures we have entered into foreign currency forward contracts with financial institutions. Each contract is for a period not extending beyond one year. As of March 31, 2005,2008, 2007 and 2006, and 2007, we had entered into a total of $0,$99,550, $93,050 and $34,300 and $93,050 foreign currency forward contracts.
Interest Rate Swap Agreements
We are exposed to changes in variable U.S. interest rates on borrowings under our credit agreements. On a selective basis, from time to time, we enter into interest rate swap agreements to reduce the negative impact that increases in interest rates could have on our outstanding variable debt interest expense. Such agreements effectively convert $203,000 of the Company’s variable-rate debt to a fixed-rate basis, utilizing the three-month London Interbank Offered Rate, or LIBOR, as a floating rate reference. During fiscal 2008, the Company entered into an additional $125,000 of interest rate swap agreements, of which $60,000 became effective in February 2008 and $65,000 will become effective in May 2008 and will almost entirely replace $128,000 of interest rate swaps which mature on those dates. Fluctuations in LIBOR and fixed rates affect both the Company’s net financial investment position and the amount of cash to be paid or received by it under these agreements.
See Note 26, Subsequent Events, for the subsequent termination of interest rate swap agreements in connection with the May 2008 issuance of $172,500 of convertible notes and the repayment of a portion of the senior secured Term Loan B.
20. Restructuring plans
The Company has two acquisition related restructuring plans and three non-acquisition related restructuring plans.
Acquisition related restructuring
The acquisition related restructuring plans were initiated in connection with the acquisition of approximately a 97% interest in Energia in May 2007, and the acquisition of the assets, stock and business of substantially all of the subsidiaries and affiliates comprising the Energy Storage Group of Invensys plc. (“ESG”) in 2002. The plans have been aggregated in the following table as the Energia activity is not considered material.
EnerSys
Notes to Consolidated Financial Statements—(Continued)
March 31, 2008
(In Thousands, Except Share and Per Share Data)
The plans were initiated in connection with the acquisitions of ESG in 2002 and the motive power battery business of FIAMM, S.p.A. (FIAMM) in 2006. They have been aggregated in the table below as the FIAMM activity is not considered significant. The ESG plan has two significant costs remaining; $6,575$6,585 related to environmental costs and $1,158$1,116 for prior service costs of the employee pension at the facility in Manchester, England.
The Company has described in Note 19, Commitments and Contingencies, the nature of the environmental costs at its Manchester, England and Sumter, S.C. locations. The environmental reserves related to Manchester are in the rollforward of the acquisition related restructuring reserves below while those for Sumter are included in the non-acquisition related restructuring plans rollforward, also below. WeThe Company relied upon Emerging Issues Task Force Issue No. 95-3,Recognition of Liabilities in Connection with a Purchase Business Combination,SFAS 141,Business Combinations and SFAS 5,Accounting for Contingencies, for the timing and measurement of these costs.
| | | | | | | | | | | | | | | | | | | | |
| | | Employee
Severance | | | Contractual
Obligations | | | Environmental | | | Plant Closures
& Other | | | Total | |
Balance at March 31, 2005 | | $ | 4,363 | | | $ | 3,694 | | | $ | 6,510 | | | $ | 1,404 | | | $ | 15,971 | |
Accrual | | | 5,571 | | | | 1,009 | | | | — | | | | 2,420 | | | | 9,000 | |
Adjustment to accrual | | | (2,910 | ) | | | (535 | ) | | | — | | | | 313 | | | | (3,132 | ) |
Costs incurred | | | (4,937 | ) | | | (1,705 | ) | | | (77 | ) | | | (2,868 | ) | | | (9,587 | ) |
Foreign currency impact and other | | | (258 | ) | | | (461 | ) | | | (450 | ) | | | (102 | ) | | | (1,271 | ) |
| | | | | | | | | | | | | | | | | | | | |
Balance at March 31, 2006 | | | 1,829 | | | | 2,002 | | | | 5,983 | | | | 1,167 | | | | 10,981 | |
Costs incurred | | | (731 | ) | | | (1,441 | ) | | | (124 | ) | | | (313 | ) | | | (2,609 | ) |
Foreign currency impact and other | | | 181 | | | | 292 | | | | 716 | | | | 104 | | | | 1,293 | |
| | | | | | | | | | | | | | | | | | | | |
Balance at March 31, 2007 | | | 1,279 | | | | 853 | | | | 6,575 | | | | 958 | | | | 9,665 | |
Adjustment to accrual | | | 1,010 | | | | — | | | | — | | | | — | | | | 1,010 | |
Costs incurred | | | (312 | ) | | | — | | | | (40 | ) | | | (521 | ) | | | (873 | ) |
Foreign currency impact and other | | | 197 | | | | 106 | | | | 50 | | | | 126 | | | | 479 | |
| | | | | | | | | | | | | | | | | | | | |
Balance at March 31, 2008 | | $ | 2,174 | | | $ | 959 | | | $ | 6,585 | | | $ | 563 | | | $ | 10,281 | |
| | | | | | | | | | | | | | | | | | | | |
Energia acquisition
Following the May 2007 acquisition of approximately a 97% interest in Energia, and in connection with further European restructuring initiatives (see below), the Company announced its commitment to restructure certain of Energia’s operations primarily to facilitate the integration of Energia into the Company’s worldwide operations. The balance of the Energia acquisition-related restructuring reserve at March 31, 2008 is $992, which the Company anticipates spending primarily during fiscal 2009.
FIAMM acquisition
In June 2005, the Company acquired the motive power battery business of FIAMM, S.p.A. (FIAMM). This acquisition, which complements our existing European motive power business, has been accounted for as a purchase and has resulted in the recognition of $6,450 of goodwill in the Company’s financial statements.
In the first quarter of fiscal year 2006, management began to assess and formulate a plan for the restructuring activities related to the FIAMM acquisition and established an estimated reserve of $9,000. In the
EnerSys
Notes to Consolidated Financial Statements—(Continued)
March 31, 20072008
(In Thousands, Except Share and Per Share Data)
A rollforwardthird quarter of fiscal year 2006, management completed the assessment of the acquisitionFIAMM restructuring plan and reduced the reserve by $3,132. At that time, management lowered its estimate of severance costs because of voluntary terminations and 54 employees who accepted employment at another Company manufacturing facility. The Company was also able to reduce a liability for the repayment of certain governmental training grants. The estimated total revised costs of $5,868 include $2,661 related restructuringto the termination of 132 manufacturing, selling and distribution employees, and the balance of $3,207 for plant and warehouse closure costs, including lease terminations.
During fiscal 2006, the Company incurred costs of $5,028, of which $2,352 was for the termination of employees and the balance primarily for other closure costs in our Italian and U.K. facilities. During fiscal 2007 and 2008, the Company incurred costs of $791 and as of March 31, 2007, the balance of the FIAMM reserve is as follows:was depleted.
| | | | | | | | | | | | | | | | | | | | |
| | | Employee
Severance | | | Contractual
Obligations | | | Environmental | | | Plant Closures
& Other | | | Total | |
Balance at March 31, 2004 | | $ | 16,866 | | | $ | 9,362 | | | $ | 6,594 | | | $ | 5,522 | | | $ | 38,344 | |
Costs incurred | | | (10,274 | ) | | | (3,737 | ) | | | (98 | ) | | | (3,633 | ) | | | (17,742 | ) |
Adjustment to accrual | | | (2,484 | ) | | | (2,751 | ) | | | — | | | | (514 | ) | | | (5,749 | ) |
Foreign currency impact and other | | | 255 | | | | 820 | | | | 14 | | | | 29 | | | | 1,118 | |
| | | | | | | | | | | | | | | | | | | | |
Balance at March 31, 2005 | | | 4,363 | | | | 3,694 | | | | 6,510 | | | | 1,404 | | | | 15,971 | |
Accrual | | | 5,571 | | | | 1,009 | | | | — | | | | 2,420 | | | | 9,000 | |
Adjustment to accrual | | | (2,910 | ) | | | (535 | ) | | | — | | | | 313 | | | | (3,132 | ) |
Costs incurred | | | (4,937 | ) | | | (1,705 | ) | | | (77 | ) | | | (2,868 | ) | | | (9,587 | ) |
Foreign currency impact and other | | | (258 | ) | | | (461 | ) | | | (450 | ) | | | (102 | ) | | | (1,271 | ) |
| | | | | | | | | | | | | | | | | | | | |
Balance at March 31, 2006 | | | 1,829 | | | | 2,002 | | | | 5,983 | | | | 1,167 | | | | 10,981 | |
Costs incurred | | | (731 | ) | | | (1,441 | ) | | | (124 | ) | | | (313 | ) | | | (2,609 | ) |
Foreign currency impact and other | | | 181 | | | | 292 | | | | 716 | | | | 104 | | | | 1,293 | |
| | | | | | | | | | | | | | | | | | | | |
Balance at March 31, 2007 | | $ | 1,279 | | | $ | 853 | | | $ | 6,575 | | | $ | 958 | | | $ | 9,665 | |
| | | | | | | | | | | | | | | | | | | | |
ESG acquisition
OnIn March 22, 2002, EnerSys acquired the assets, stock and business of substantially all of the subsidiaries and affiliates comprising the Energy Storage Group of Invensys (ESG). ESG was a manufacturer and supplier of industrial batteries with facilities located in Europe, North America, and Asia. This acquisition enhanced our product offering with complementary product lines and increased our ability to service global clients and gain global market share.
As of the acquisition date, the Company began to formulate an exit and restructuring plan for certain ESG facilities in North America and Europe, which was finalized during the fiscal year ended March 31, 2003. These facilities, located in England, Germany and the United States, were restructured due mainly to excess capacity brought about by the ESG acquisition and relatively high production costs at these locations compared to other EnerSys facilities. The facilities in England and Germany remain open, however, as either a distribution center or as a facility with a significantly reduced manufacturing cost structure. The facility in the United States has been closed. The exit and restructuring plan affected direct, indirect and certain administrative personnel. As of March 22, 2002, the Company recorded a liability of $18,173, of which $7,873 related to involuntary termination of employees and $10,300 related to the cancellation of certain contractual obligations that required the Company to purchase steam at the Germany location.
As a result of the finalization of these plans, the Company recorded an additional liability of $26,660 in fiscal 2003 for involuntary termination of employees, environmental costs, warranty costs, and plant closure costs and a reduction of $5,749 in fiscal 2005 primarily in severance and contractual obligations. These two amounts were recorded as adjustments to the goodwill initially recorded for the ESG acquisition. The resolution of the environmental costs at the Manchester, England facility is the only significant item that remains unresolved. The Company continues taking actions consistent with its original plan to resolve these issues.
During fiscal 20032008, 2007 and fiscal 2004,2006 the Company utilized $17,322 of these reserves primarily for the termination of employees. During fiscal 2005, 2006$727, $1,818 and 2007 the Company utilized $17,742, $4,559, and $1,818, respectively of these reserves. The balance of the ESG acquisition-related restructuring reserve at March 31, 20072008, is $9,645,$9,223 which we anticipate spending primarily during fiscal 20082009 with the exception of the environmental reserves related to Manchester which is more fully described in Note 26. Since the creation of this reserve the total utilized as of March 31, 2008 is $42,168.
EnerSys
Notes to Consolidated Financial Statements—(Continued)
March 31, 20072008
(In Thousands, Except Share and Per Share Data)
environmental reserves related to Manchester which is more fully described in Note 19. Since the creation of this reserve the total utilized as of March 31, 2007 is $41,441.
FIAMM acquisition
On June 1, 2005, the Company acquired the motive power battery business of FIAMM, S.p.A. (FIAMM). This acquisition, which complements our existing European motive power business, has been accounted for as a purchase and has resulted in the recognition of $6,450 of goodwill in the Company’s financial statements.
In the first quarter of fiscal year 2006, management began to assess and formulate a plan for the restructuring activities related to the FIAMM acquisition and established an estimated reserve of $9,000. In the third quarter of fiscal year 2006, management completed the assessment of the FIAMM restructuring plan and reduced the reserve by $3,132. At that time, management lowered its estimate of severance costs because of voluntary terminations and 54 employees who accepted employment at another Company manufacturing facility. The Company was also able to reduce a liability for the repayment of certain governmental training grants. The estimated total revised costs of $5,868 include $2,661 related to the termination of 132 manufacturing, selling and distribution employees, and the balance of $3,207 for plant and warehouse closure costs, including lease terminations.
During fiscal 2006, the Company incurred costs of $5,028, of which $2,352 was for the termination of employees and the balance primarily for other closure costs in our Italian and U.K. facilities. During fiscal 2007, the Company incurred costs of $791 and as of March 31, 2007, the balance of the FIAMM reserve was depleted.
Non-acquisition related restructuring plans
The remaining threenon-acquisition related restructuring plans were initiated in connection with the following cost-reduction initiatives.programs: in Europe in fiscal 2008, to facilitate the integration of Energia into the Company’s operations; in the European motive power segment in fiscal 2006; and in North and South America in fiscal 2002. The Company based its accounting and disclosures primarily on the requirements of SFAS No. 146,Accounting for Costs Associated with Exit or Disposal ActivitiesActivities. which resulted in directAs a result, charges to the determination of net earnings were made in the periods in which therestructuring plans were initiated, liabilities were incurred and provisions were determined.incurred. These three individual plans individually are not significantmaterial and accordingly have been aggregated.
A rollforward of these non-acquisition related restructuring reserves is as follows:
| | | | Employee
Severance | | Contractual
Obligations | | Environmental | | Plant Closures
& Other | | Total | | | Employee
Severance | | Contractual
Obligations | | Environmental | | Plant
Closures
& Other | | Total | |
| | | (in $ thousands) | | |
Balance at March 31, 2004 | | $ | — | | | $ | 7,826 | | | $ | 1,816 | | | $ | 2,421 | | | $ | 12,063 | | |
Provision | | | — | | | | — | | | | 715 | | | | 1,354 | | | | 2,069 | | |
Costs incurred | | | — | | | | (7,826 | ) | | | (110 | ) | | | (1,430 | ) | | | (9,366 | ) | |
| | | | | | | | | | | | | | | | | (in $ thousands) | |
Balance at March 31, 2005 | | | — | | | | — | | | | 2,421 | | | | 2,345 | | | | 4,766 | | | $ | — | | | $ | — | | | $ | 2,421 | | | $ | 2,345 | | | $ | 4,766 | |
Provision | | | 3,325 | | | | 1,371 | | | | — | | | | 663 | | | | 5,359 | | | | 3,325 | | | | 1,371 | | | | — | | | | 663 | | | | 5,359 | |
Costs incurred | | | (1,027 | ) | | | (537 | ) | | | 84 | | | | (1,877 | ) | | | (3,357 | ) | | | (1,027 | ) | | | (537 | ) | | | 84 | | | | (1,877 | ) | | | (3,357 | ) |
Foreign currency impact and other | | | 176 | | | | (152 | ) | | | — | | | | — | | | | 24 | | | | 176 | | | | (152 | ) | | | — | | | | — | | | | 24 | |
| | | | | | | | | | | | | | | | | | | | | | | | | | | | | | |
Balance at March 31, 2006 | | | 2,474 | | | | 682 | | | | 2,505 | | | | 1,131 | | | | 6,792 | | | | 2,474 | | | | 682 | | | | 2,505 | | | | 1,131 | | | | 6,792 | |
Provision | | | — | | | | — | | | | — | | | | — | | | | — | | | | — | | | | — | | | | — | | | | — | | | | — | |
Costs incurred | | | (1,979 | ) | | | (694 | ) | | | (132 | ) | | | (826 | ) | | | (3,631 | ) | | | (1,979 | ) | | | (694 | ) | | | (132 | ) | | | (826 | ) | | | (3,631 | ) |
Foreign currency impact and other | | | 111 | | | | 75 | | | | — | | | | 35 | | | | 221 | | | | 111 | | | | 75 | | | | — | | | | 35 | | | | 221 | |
| | | | | | | | | | | | | | | | | | | | | | | | | | | | | | |
Balance at March 31, 2007 | | $ | 606 | | | $ | 63 | | | $ | 2,373 | | | $ | 340 | | | $ | 3,382 | | | | 606 | | | | 63 | | | | 2,373 | | | | 340 | | | | 3,382 | |
Provision | | | | 8,246 | | | | — | | | | — | | | | 1,082 | | | | 9,328 | |
Costs incurred | | | | (6,101 | ) | | | (10 | ) | | | (3 | ) | | | (1,364 | ) | | | (7,478 | ) |
Foreign currency impact and other | | | | 249 | | | | 8 | | | | — | | | | 70 | | | | 327 | |
| | | | | | | | | | | | | | | | | | | | | | | | | | | | | | |
Balance at March 31, 2008 | | | $ | 3,000 | | | $ | 61 | | | $ | 2,370 | | | $ | 128 | | | $ | 5,559 | |
| | | | | | | | | | | | | | | | |
A description of these three plans is included below.
European Restructuring
On May 23, 2007, the Company announced its commitment to restructure certain of its European operations. The restructuring will primarily facilitate the integration of Energia’s reserve and motive power businesses into the Company’s worldwide operations. The restructuring is designed to improve operational efficiencies and eliminate redundant costs primarily as a result of the Energia transaction. Restructuring actions commenced upon the completion of the requisite labor consultations, and the Company expects to substantially complete these actions by the end of the fiscal 2009. The Company estimates that the total charges for the European restructuring will amount to approximately $18,000, which includes cash expenses of approximately $14,000, primarily for employee severance-related payments on an estimated 240 employees, and a non-cash charge of approximately $4,000, primarily for fixed asset impairments.
Based on actual commitments to date, the Company recorded a restructuring charge in fiscal 2008 of $13,191. The charge is composed of $9,328 as a restructuring accrual, primarily in Europe, for reductions of 120 staff and $3,863 for non-cash impairment of machinery and equipment. As of March 31, 2008, the reserve
EnerSys
Notes to Consolidated Financial Statements—(Continued)
March 31, 20072008
(In Thousands, Except Share and Per Share Data)
A descriptionbalance associated with these actions is $2,450. The Company expects to spend the majority of these three plans is included below.this reserve in fiscal 2009. In addition, the Company expects to be committed to approximately $5,000 of remaining restructuring charges in fiscal 2009.
GAZ facility in Zwickau
During the third quarter of fiscal year ended March 31, 2002,2006, a charge of $1,063 was incurred, to cover estimated restructuring programs to which the Company decidedcommitted, to close and downsizetransfer certain existing manufacturing locationsEuropean assembly operations to the newly acquired GAZ facility in NorthZwickau, Germany. During fiscal 2007, the Company incurred costs of $706 and South America, reduce product offerings, reduce sales and distribution facilities, and implement other consolidation initiatives. Costs incurred for this activity were $252 in fiscal 2007. These costs related to ongoing expenses from previously closed manufacturing locations. Asas of March 31, 2007, the balance of this reserve balance is $2,704, a small portion of which we expect to spendwas depleted.
Motive Power in the next year and the balance, primarily related to environmental costs, at an indeterminate time in the future.Europe
During the second quarter of fiscal 2006 a restructuring charge of $5,979, primarily for the motive power segment, was incurred to cover estimated costs in Europe of staff reductions of 112 employees, exiting of a product line, and closing several ancillary locations. The charge comprised $4,569 as a restructuring accrual and $1,410 for a non-cash write-off, primarily of machinery and equipment. During fiscal 2008 and 2007, the Company incurred costs of $112 and $2,673, respectively, and as of March 31, 2007,2008, the reserve balance is $669,$690, which mostly represents severance obligations we anticipatethe Company anticipates spending upon the individual employee’s determination. During the third quarter of fiscal year 2006, an additional charge of $238 was provided to cover additional costs, including $111 of non-cash charges, related to the restructuring plan initiated in the second quarter of fiscal year 2006.
North and South America
During the third quarter of fiscal year 2006, a charge of $1,063 was incurred,ended March 31, 2002, the Company decided to cover estimated restructuring programs to which the company committed, to transferclose and downsize certain existing European assembly operationsmanufacturing locations in North and South America, reduce product offerings, reduce sales and distribution facilities, and implement other consolidation initiatives. Costs incurred for this activity were $285 and $252 in fiscal 2008 and 2007, respectively. These costs related to the newly acquired GAZ facility in Zwickau, Germany. During fiscal 2007, the Company incurred costs of $706 and asongoing expenses from previously closed manufacturing locations. As of March 31, 2007,2008, the reserve balance is $2,419, a small portion of which the Company expects to spend in the next year and the balance, this reserve was depleted.primarily related to environmental costs, at an indeterminate time in the future.
21. Warranty
The Company provides for estimated product warranty expenses when the related products are sold and are primarily included within accrued expenses. Because warranty estimates are forecasts that are based on the best available information, primarily historical claims experience, claims costs may differ from amounts provided. An analysis of changes in the liability for product warranties is as follows:
| Balance at March 31, 2005 | | $ | 22,786 | | |
Current year provisions | | | 14,513 | | |
Costs incurred | | | (10,647 | ) | |
| | | | | |
Balance at March 31, 2006 | | $ | 26,652 | | | $ | 26,652 | |
Current year provisions | | | 12,222 | | | | 12,222 | |
Costs incurred | | | (11,341 | ) | | | (11,341 | ) |
| | | | | | |
Balance at March 31, 2007 | | $ | 27,533 | | | $ | 27,533 | |
Current year provisions | | | | 16,854 | |
Costs incurred | | | | (10,350 | ) |
| | | | | | |
Balance at March 31, 2008 | | | $ | 34,037 | |
| | | | |
EnerSys
Notes to Consolidated Financial Statements—(Continued)
March 31, 20072008
(In Thousands, Except Share and Per Share Data)
22. Other Charges and Litigation Settlement Income
The following is a summary of other charges and income:
| | | | | | | | | | |
| | | March 31, | |
| | | 2005 | | 2006 | | 2007 | |
Restructuring and other charges—operating | | $ | — | | $ | 8,553 | | $ | — | |
| | | | | | | | | | |
Write-off of deferred financing costs | | | 3,622 | | | — | | | — | |
Prepayment penalty | | | 2,400 | | | — | | | — | |
| | | | | | | | | | |
Other charges—non-operating | | | 6,022 | | | — | | | — | |
| | | | | | | | | | |
Litigation settlement income—operating | | | — | | | — | | | (3,753 | ) |
| | | | | | | | | | |
Total other charges and income | | $ | 6,022 | | $ | 8,553 | | $ | (3,753 | ) |
| | | | | | | | | | |
| | | | | | | | | | |
| | | March 31, |
| | | 2008 | | 2007 | | | 2006 |
Restructuring and other charges | | $ | 13,191 | | $ | — | | | $ | 8,553 |
Litigation settlement income | | | — | | | (3,753 | ) | | | — |
| | | | | | | | | | |
Total other charges and income | | $ | 13,191 | | $ | (3,753 | ) | | $ | 8,553 |
| | | | | | | | | | |
Other charges–non-operatingRestructuring charges for the fiscal year ended March 31, 20052008 of $13,191 is composed of $9,328 as a restructuring accrual, primarily in Europe, for staff reductions and $3,863 for non-cash impairment of machinery and equipment.
In fiscal 2007, the Company recorded litigation settlement income of approximately $3,753, net of fees and expenses, due to the settlements of two separate legal matters. The amounts of the settlements have been recorded as increases in operating income because the costs related to these matters were $6,022 for the write-offpreviously recorded as an element of a portion of unamortized deferred finance costs and a prepayment penalty on the repayment of its senior secured lien term loan in connection with the IPO.operating earnings.
Other charges–operatingRestructuring charges for the year ended March 31, 2006 were $8,553 which included $6,217 incurred to cover estimated costs in Europe of staff reductions, exiting of a product line, and closing several ancillary locations, $1,063 incurred to cover estimated restructuring programs in Europe related to the newly acquired GAZ facility in Zwickau, Germany, and $1,273 of non-cash write-off of machinery and equipment based on impairment testing.
In the first fiscal quarter of 2007, we settled a litigation matter. As a result of this settlement, we recorded litigation settlement income, net of related legal fees and expenses, of $2,766. Additionally, in the second fiscal quarter of 2007, we settled a legal dispute. As a result of this settlement, we recorded litigation settlement income, net of related legal fees and expenses, of $987.
23. Other (Income) Expense, Net
Other (income) expense, net consists of the following:
| | | | March 31, | | March 31, | |
| | | 2005 | | 2006 | | 2007 | | 2008 | | 2007 | | 2006 | |
Foreign exchange transaction (gains) losses | | $ | (1,899 | ) | | $ | (1,317 | ) | | $ | 1,592 | | $ | 2,686 | | | $ | 1,592 | | $ | (1,317 | ) |
Other (income) expense, net | | | (957 | ) | | | (211 | ) | | | 1,359 | | | 1,616 | | | | 1,359 | | | (211 | ) |
Minority interest | | | 217 | | | | 170 | | | | 73 | | | (68 | ) | | | 73 | | | 170 | |
| | | | | | | | | | | | | | | | |
Total | | $ | (2,639 | ) | | $ | (1,358 | ) | | $ | 3,024 | | $ | 4,234 | | | $ | 3,024 | | $ | (1,358 | ) |
| | | | | | | | | | | | | | | | |
24. Operations by Industry Segment and Geographic Area
The Company has the following two reportable business segments:
The reserve power segment manufactures batteries used to provide backup power for the continuous operation of critical systems during power disruptions. They include telecommunications and computer systems, such as process control and database systems.
EnerSys
Notes to Consolidated Financial Statements—(Continued)
March 31, 20072008
(In Thousands, Except Share and Per Share Data)
The motive power segment manufactures batteries used to power mobile manufacturing, warehousing and other material handling equipment, primarily industrial forklifts.
| | | | | | | | | | | | | |
| | | Reserve Power | | Motive Power | | Other(1) | | | Consolidated |
Fiscal year ended March 31, 2005 | | | | | | | | | | | | | |
Net sales | | $ | 510,506 | | $ | 573,356 | | $ | — | | | $ | 1,083,862 |
Operating earnings (loss) | | | 36,793 | | | 39,810 | | | (203 | ) | | | 76,400 |
| | | | |
Fiscal year ended March 31, 2006 | | | | | | | | | | | | | |
Net sales | | $ | 571,123 | | $ | 712,142 | | $ | — | | | $ | 1,283,265 |
Operating earnings | | | 34,558 | | | 42,414 | | | (8,627 | ) | | | 68,345 |
| | | | |
Fiscal year ended March 31, 2007 | | | | | | | | | | | | | |
Net sales | | $ | 642,626 | | $ | 861,848 | | $ | — | | | $ | 1,504,474 |
Operating earnings | | | 31,340 | | | 58,766 | | | 3,753 | | | | 93,859 |
(1) | Other represents restructuring expense and other charges and income (see Note 22). |
| | | | | | | | | |
| | | Reserve Power | | Motive Power | | Consolidated |
Fiscal year ended March 31, 2008 | | | | | | | | | |
Net sales | | $ | 883,778 | | $ | 1,142,862 | | $ | 2,026,640 |
| | | | | | | | | |
Operating earnings | | $ | 35,328 | | $ | 84,018 | | $ | 119,346 |
| | | | | | | | | |
| | | |
Fiscal year ended March 31, 2007 | | | | | | | | | |
Net sales | | $ | 642,626 | | $ | 861,848 | | $ | 1,504,474 |
| | | | | | | | | |
Operating earnings | | $ | 34,293 | | $ | 59,566 | | $ | 93,859 |
| | | | | | | | | |
| | | |
Fiscal year ended March 31, 2006 | | | | | | | | | |
Net sales | | $ | 571,123 | | $ | 712,142 | | $ | 1,283,265 |
| | | | | | | | | |
Operating earnings | | $ | 30,124 | | $ | 38,221 | | $ | 68,345 |
| | | | | | | | | |
Many of the Company’s facilities manufacture products for both of the Company’s segments. Therefore, it is not practicablepractical to disclose asset information on a segment basis.
Summarized financial information related to geographic areas in which the Company operated at March 31, 2005,2008, 2007 and 2006 and 2007 and for each of the years then ended is showshown below.
| | | | 2005 | | 2006 | | 2007 | | 2008 | | 2007 | | 2006 | |
Net sales | | | | | | | | | | | | |
Europe | | $ | 568,837 | | | $ | 675,422 | | | $ | 784,543 | | $ | 1,115,348 | | | $ | 784,543 | | $ | 675,422 | |
Americas | | | 449,997 | | | | 535,869 | | | | 630,813 | | | 777,917 | | | | 630,813 | | | 535,869 | |
Asia | | | 65,028 | | | | 71,974 | | | | 89,118 | | | 133,375 | | | | 89,118 | | | 71,974 | |
| | | | | | | | | | | | | | | | |
Total | | $ | 1,083,862 | | | $ | 1,283,265 | | | $ | 1,504,474 | |
Total net sales | | | $ | 2,026,640 | | | $ | 1,504,474 | | $ | 1,283,265 | |
| | | | | | | | | | | | | | | | |
Operating (loss) earnings | | | | | | | |
Operating earnings | | | | | | | |
Europe | | $ | 32,091 | | | $ | 35,722 | | | $ | 36,024 | | $ | 61,310 | | | $ | 36,024 | | $ | 35,722 | |
Americas | | | 38,749 | | | | 39,490 | | | | 52,710 | | | 68,492 | | | | 52,710 | | | 39,278 | |
Asia | | | 5,763 | | | | 1,898 | | | | 1,372 | | | 2,735 | | | | 1,372 | | | 1,898 | |
Eliminations, restructuring and other charges, litigation settlement income | | | (203 | ) | | | (8,765 | ) | | | 3,753 | |
Restructuring charges (Europe) | | | | (13,191 | ) | | | — | | | (8,553 | ) |
Litigation settlement income (Americas) | | | | — | | | | 3,753 | | | — | |
| | | | | | | | | | | | | | | | |
Total | | $ | 76,400 | | | $ | 68,345 | | | $ | 93,859 | |
Total operating earnings | | | $ | 119,346 | | | $ | 93,859 | | $ | 68,345 | |
| | | | | | | | | | | | | | | | |
Property, plant and equipment, net | | | | | | | | | | | | |
Europe | | $ | 156,872 | | | $ | 151,444 | | | $ | 158,788 | | $ | 190,792 | | | $ | 158,788 | | $ | 151,444 | |
Americas | | | 114,095 | | | | 117,419 | | | | 121,502 | | | 127,532 | | | | 121,502 | | | 117,419 | |
Asia | | | 8,901 | | | | 12,881 | | | | 20,705 | | | 21,673 | | | | 20,705 | | | 12,881 | |
| | | | | | | | | | | | | | | | |
Total | | $ | 279,868 | | | $ | 281,744 | | | $ | 300,995 | | $ | 339,997 | | | $ | 300,995 | | $ | 281,744 | |
| | | | | | | | | | | | | | | | |
EnerSys
Notes to Consolidated Financial Statements—(Continued)
March 31, 2008
(In Thousands, Except Share and Per Share Data)
25. Quarterly Financial Data (Unaudited)
The Company reports interim financial information for 13-week periods, except for the first quarter, which always begins on April 1, and the fourth quarter, which always ends on March 31. The four fiscal quarters in
EnerSys
Notes to Consolidated Financial Statements—(Continued)
2008 ended on July 1, 2007, September 30, 2007, December 30, 2007, and March 31, 2007
(In Thousands, Except Share and Per Share Data)
2008, respectively. The four fiscal quarters in fiscal 2007 ended on July 2, 2006, October 1, 2006, December 31, 2006, and March 31, 2007, respectively. The four
| | | | | | | | | | | | | | | |
| | | 1st Quarter | | 2nd Quarter | | 3rd Quarter | | 4th Quarter | | Fiscal Year |
Fiscal year ended March 31, 2008 | | | | | | | | | | | | | | | |
Net sales | | $ | 429,863 | | $ | 461,461 | | $ | 553,429 | | $ | 581,887 | | $ | 2,026,640 |
Gross profit | | | 86,576 | | | 92,014 | | | 97,482 | | | 105,815 | | | 381,887 |
Operating earnings | | | 19,197 | | | 31,546 | | | 31,397 | | | 37,206 | | | 119,346 |
Net earnings | | | 7.393 | | | 16,759 | | | 16,040 | | | 19,504 | | | 59,696 |
Net earnings per common share—basic | | $ | 0.16 | | $ | 0.36 | | $ | 0.34 | | $ | 0.40 | | $ | 1.25 |
Net earnings per common share—diluted | | $ | 0.15 | | $ | 0.35 | | $ | 0.33 | | $ | 0.39 | | $ | 1.22 |
| | | | | |
Fiscal year ended March 31, 2007 | | | | | | | | | | | | | | | |
Net sales | | $ | 359,034 | | $ | 353,924 | | $ | 377,881 | | $ | 413,635 | | $ | 1,504,474 |
Gross profit | | | 77,113 | | | 77,709 | | | 76,911 | | | 79,475 | | | 311,208 |
Operating earnings | | | 25,566 | | | 24,736 | | | 21,186 | | | 22,371 | | | 93,859 |
Net earnings | | | 12,159 | | | 11,453 | | | 10,979 | | | 10, 619 | | | 45,210 |
Net earnings per common share—basic | | $ | 0.26 | | $ | 0.25 | | $ | 0.24 | | $ | 0.23 | | $ | 0.97 |
Net earnings per common share—diluted | | $ | 0.26 | | $ | 0.24 | | $ | 0.23 | | $ | 0.22 | | $ | 0.95 |
In fiscal 2008, restructuring charges of $9,857, $430, $1,115, and $1,789 were recorded in the first, second, third and fourth fiscal quarters, in fiscal 2006 ended on July 3, 2005, October 2, 2005, January 1, 2006,respectively for a total of $13,191. These charges were incurred primarily to facilitate the integration of Energia’s reserve and March 31, 2006.
| | | | | | | | | | | | | | | |
| | | 1st Quarter | | 2nd Quarter | | 3rd Quarter | | 4th Quarter | | Fiscal Year |
Fiscal year ended March 31, 2006 | | | | | | | | | | | | | | | |
Net sales | | $ | 303,842 | | $ | 304,432 | | $ | 321,793 | | $ | 353,198 | | $ | 1,283,265 |
Gross profit | | | 66,542 | | | 64,199 | | | 69,584 | | | 76,473 | | | 276,798 |
Operating earnings | | | 17,647 | | | 9,876 | | | 17,119 | | | 23,703 | | | 68,345 |
Net earnings | | | 8,759 | | | 2,520 | | | 7,767 | | | 11,680 | | | 30,726 |
Net earnings per common share—basic | | $ | 0.19 | | $ | 0.05 | | $ | 0.17 | | $ | 0.25 | | $ | 0.66 |
Net earnings per common share—diluted | | $ | 0.19 | | $ | 0.05 | | $ | 0.17 | | $ | 0.25 | | $ | 0.66 |
| | | | | |
Fiscal year ended March 31, 2007 | | | | | | | | | | | | | | | |
Net sales | | $ | 359,034 | | $ | 353,924 | | $ | 377,881 | | $ | 413,635 | | $ | 1,504,474 |
Gross profit | | | 77,113 | | | 77,709 | | | 76,911 | | | 79,475 | | | 311,208 |
Operating earnings | | | 25,566 | | | 24,736 | | | 21,186 | | | 22,371 | | | 93,859 |
Net earnings | | | 12,159 | | | 11,453 | | | 10,979 | | | 10, 619 | | | 45,210 |
Net earnings per common share—basic | | $ | 0.26 | | $ | 0.25 | | $ | 0.24 | | $ | 0.23 | | $ | 0.97 |
Net earnings per common share—diluted | | $ | 0.26 | | $ | 0.24 | | $ | 0.23 | | $ | 0.22 | | $ | 0.95 |
Duringmotive power businesses into the second quarterCompany’s worldwide operations. The restructuring is designed to improve operational efficiencies and eliminate redundant costs primarily as a result of fiscal 2006, a restructuringthe Energia transaction. The total charge is composed of $5,979 was incurred to cover estimated costs in Europe of staff reductions, exiting of a product line, and closing several ancillary locations. The charge comprised $4,569$9,328 as a restructuring accrual, primarily in Europe, for staff reductions and $1,410$3,863 for a non-cash write-off, primarilyimpairment of machinery and equipment. (See Note 20.) During the first, third quarterand fourth fiscal quarters of fiscal 2006, a restructuring charge of $1,063 was incurred to cover estimated costs in Europe to transfer production of aircraft battery assembly from existing facilities in Hagen, Germany to2008 the newly acquired GAZ facility in Zwickau, Germany, and an additional $238 was also provided to cover additional costsCompany recorded professional fees related to the charge taken in the second fiscal quartera shelf registration statement and secondary offering expenses of fiscal 2006 described above. Also recorded were other charges of $1,273 representing a non-cash write-off of machinery$200, $235 and equipment based on impairment testing (see Note 22).$175, respectively. During the first and second fiscal quarters of 2007 the Company recorded favorable legal settlements, net of fees and expenses of $2,766 and $987, respectively. During the second and third fiscal quarters of 2007 the Company recorded professional fees related to a shelf registration statement and secondary offering, and an abandoned acquisition attempt of $1,085. During the third quarter of fiscal 2007 the Company recorded a non-recurring, favorable tax benefit of $2,000.
26. Subsequent Events
OnEquity Awards
In May 18, 2007,2008, the Company completed the previously announced acquisitiongranted 264,206 stock options at an exercise price of a 97% interest in Energia AD, a producer of industrial batteries, located in Targovishte, Bulgaria. The total purchase price for this transaction was approximately euro 13,000 (approximately $17,000) including all transactions costs$30.19 and adjustments. The acquisition was financed using cash and existing EnerSys credit facilities. The acquisition provides the Company with greater market penetration in the rapidly growing Eastern European and Russian markets while providing the Company with additional low cost manufacturing capacity. Effective April 30, 2007, the Company amended226,210 restricted stock units under its Euro 25,000 Credit Agreement. Under the amendment, the lenders approved the acquisition of Energia AD.
On May 23, 2007, the Company announced its commitment to the principal features of a plan to restructure certain of its European production and commercial operations. In part the restructuring will facilitate the integration of Energia AD into the Company’s worldwide operations. The restructuring is designed to improvemanagement equity incentive plans.
EnerSys
Notes to Consolidated Financial Statements—(Continued)
March 31, 20072008
(In Thousands, Except Share and Per Share Data)
operational efficienciesSale of Manufacturing Facility
In May 2008, the Company announced that, as part of its ongoing European restructuring program, it sold the Manchester, England manufacturing facility at a net of tax gain of approximately $8,000. This sale is consistent with the Company’s strategy to migrate its production to lower cost facilities.
Concurrent Public Offerings of Senior Convertible Notes and eliminate redundant costs primarily attributableCommon Stock and a Private Offering of a New Senior Secured Credit Facility
In May 2008, following the end of fiscal 2008, the Company issued $172,500 aggregate principal amount of senior unsecured 3.375% convertible notes, and used the net proceeds of $168,200 to repay a portion of its existing senior secured Term Loan B. The senior unsecured convertible notes are potentially convertible, at the Energia transaction. Restructuring actions will commence upon the completionoption of the requisite consultationsholders, into 4,248,761 EnerSys common shares. It is the Company’s current intent to settle the principal amount of any conversions in cash, and any additional conversion consideration in cash, shares of EnerSys common stock or a combination of cash and shares. The notes will mature on June 1, 2038, unless earlier converted, redeemed or repurchased.
In connection with the issuance of $172,500 of senior unsecured convertible note and the repayment of a portion of the senior secured Term Loan B in May 2008, the Company terminated $30,000 of interest rate swap agreements which had been placed in October, 2005, at a loss of $1,360.
Also, immediately following the closing of the senior unsecured convertible note issue, the Company commenced refinancing the outstanding combined balance of the senior secured Term Loan B and our existing Revolver of approximately $200,000, with a new $350,000 senior secured facility comprising Term A loans and a new Revolver. These planned refinancing transactions, which the Company expects to substantially complete these actions byin June 2008, will mature in 6 years.
Concurrently with the endconvertible note offering, certain of the fiscalCompany’s stockholders offered to sell, subject to market and other conditions, 3,400,000 shares of EnerSys’ common stock pursuant to an effective shelf registration statement filed with the Securities and Exchange Commission on May 19, 2008. As a resultThe offered shares were sold by those stockholders of the restructuring,Company, including affiliates of Metalmark Capital LLC and certain other institutional stockholders. The selling stockholders granted the underwriters an option to purchase up to 340,000 additional shares, of which 290,000 shares were exercised and sold. A total of 3,690,000 shares were sold as of May 28, 2008. The Company did not receive any proceeds from the common stock offering.
Amendments of Credit Agreements
On May 16, 2008, the Company expectscompleted the Fifth Amendment to incur cash expensesthe $480,000 Senior Secured Credit Agreement which allowed for the issuance of approximately $12,000, primarily for employee severance-related payments, and non-cash expensesup to $205,000 of approximately $5,000, primarily for fixed asset write-offs.
Inunsecured indebtedness. The proceeds from the unsecured indebtedness must be used to pay down the senior secured Term Loan B. On May 2007,28, 2008, the Company granted 284,999 stock options at an exercise priceused the net proceeds of $18.25 and 141,140 restricted stock units under$168,200 from the senior unsecured convertible notes to pay down a portion of the senior secured Term Loan B.
On May 15, 2008, the Company amended its management equity incentive plans.Euro 25,000 Credit Agreement to allow for the issuance of up to $205,000 of unsecured indebtedness. The proceeds from the unsecured indebtedness must be used to pay down the senior secured Term Loan B. Additionally, the amendment authorized the Company to enter into a new $350,000 US Credit Agreement on terms substantially similar to the existing Credit Agreement.
SCHEDULE II
EnerSys
Valuation and Qualifying Accounts
(In Thousands)
| | | | | | | | | | | | | | | | | | |
| | | Balance at
Beginning of
Period | | Additions
Charged to
Expense | | | Charge-Offs | | | Other(1) | | | Balance at End
of Period |
Allowance for doubtful accounts: | | | | | | | | | | | | | | | | | | |
Fiscal year ended March 31, 2005 | | $ | 6,722 | | $ | (441 | ) | | $ | (1,441 | ) | | $ | (131 | ) | | $ | 4,709 |
Fiscal year ended March 31, 2006 | | $ | 4,709 | | $ | 596 | | | $ | (748 | ) | | $ | 8 | | | $ | 4,565 |
Fiscal year ended March 31, 2007 | | $ | 4,565 | | $ | 315 | | | $ | (960 | ) | | $ | 500 | | | $ | 4,420 |
| | | | | |
Allowance for inventory valuation: | | | | | | | | | | | | | | | | | | |
Fiscal year ended March 31, 2005 | | $ | 10,895 | | $ | 4,065 | | | $ | (5,574 | ) | | $ | 512 | | | $ | 9,898 |
Fiscal year ended March 31, 2006 | | $ | 9,898 | | $ | 5,817 | | | $ | (6,541 | ) | | $ | (463 | ) | | $ | 8,711 |
Fiscal year ended March 31, 2007 | | $ | 8,711 | | $ | 7,257 | | | $ | (6,352 | ) | | $ | 408 | | | $ | 10,024 |
| | | | | | | | | | | | | | | | | |
| | | Balance at
Beginning of
Period | | Additions
Charged to
Expense | | Charge-Offs | | | Other(1) | | | Balance at End
of Period |
Allowance for doubtful accounts: | | | | | | | | | | | | | | | | | |
Fiscal year ended March 31, 2006 | | $ | 4,709 | | $ | 596 | | $ | (748 | ) | | $ | 8 | | | $ | 4,565 |
Fiscal year ended March 31, 2007 | | $ | 4,565 | | $ | 315 | | $ | (960 | ) | | $ | 500 | | | $ | 4,420 |
Fiscal year ended March 31, 2008 | | $ | 4,420 | | $ | 1,436 | | $ | (1,541 | ) | | $ | 693 | | | $ | 5,008 |
| | | | | |
Allowance for inventory valuation: | | | | | | | | | | | | | | | | | |
Fiscal year ended March 31, 2006 | | $ | 9,898 | | $ | 5,817 | | $ | (6,541 | ) | | $ | (463 | ) | | $ | 8,711 |
Fiscal year ended March 31, 2007 | | $ | 8,711 | | $ | 7,257 | | $ | (6,352 | ) | | $ | 408 | | | $ | 10,024 |
Fiscal year ended March 31, 2008 | | $ | 10,024 | | $ | 9,016 | | $ | (6,491 | ) | | $ | 1,414 | | | $ | 13,963 |
| (1) | Primarily the impact of currency changes as well as acquisitions of certain businesses. |
| ITEM 9. | CHANGES IN AND DISAGREEMENTS WITH ACCOUNTANTS ON ACCOUNTING AND FINANCIAL DISCLOSURE |
None.
ITEM 9A. CONTROLS AND PROCEDURES
| ITEM 9A. | CONTROLS AND PROCEDURES |
(a) Disclosure Controls and Procedures. The Company’s management, with the participation of the Company’s Chief Executive Officer and Chief Financial Officer, has evaluated the effectiveness of the Company’s disclosure controls and procedures (as such term is defined in Rules 13a-15(e) and 15d-15(e) under the Securities Exchange Act of 1934, as amended (the “Exchange Act”)) as of the end of the period covered by this Report. Based on such evaluation, the Company’s Chief Executive Officer and Chief Financial Officer have concluded that, as of the end of such period, the Company’s disclosure controls and procedures are effective.
(b) Internal Control Over Financial Reporting. There have not been any changes in the Company’s internal control over financial reporting (as such term is defined in Rules 13a-15(f) and 15d-15(f) under the Exchange Act) during the fourth fiscal quarter of the fiscal year to which this report relates that have materially affected, or are reasonably likely to materially affect, the Company’s internal control over financial reporting.
ITEM 9B. OTHER INFORMATIONThe report called for by Item 308(a) of Regulation S-K is included herein as “Management’s Report on Internal Control Over Financial Reporting.”
Not applicable.
PART III
We intend to file with the SEC a definitive proxy statementThe attestation report called for our 2007 Annual Meetingby Item 308(b) of Shareholders,Registration S-K is included herein as “Report of Independent Registered Public Accounting Firm on Internal Control Over Financial Reporting,” which will be filed with the Commission not later than 120 days after March 31, 2007, the close of the fiscal year covered byappears in Item 8 in this Annual Report on Form 10-K.
Management Report on Internal Control over Financial Reporting
Our management is responsible for establishing and maintaining adequate internal control over financial reporting. With the participation of the Chief Executive Officer and Chief Financial Officer, our management conducted an evaluation of the effectiveness of our internal control over financial reporting based on the framework and criteria established inInternal Control—Integrated Framework, issued by the Committee of Sponsoring Organizations of the Treadway Commission. The scope of management’s assessment of the effectiveness of internal control over financial reporting includes substantially all of our businesses. Based on this evaluation, our management has concluded that our internal control over financial reporting was effective as of March 31, 2008.
| | | | |
| | |
| /s/ JOHN D. CRAIG | | | | /s/ MICHAEL T. PHILION |
John D. Craig Chairman, President and CEO | | | | Michael T. Philion Executive Vice President, Finance and CFO |
| ITEM 9B. | OTHER INFORMATION |
Not applicable.
PART III
| ITEM 10. | DIRECTORS, EXECUTIVE OFFICERS AND CORPORATE GOVERNANCE |
The information required by Part III (Items 10, 11, 12, 13 and 14)this item is incorporated by reference to thatthe sections entitled “Board of Directors,” “Executive Officers,” “Section 16(a) Beneficial Ownership Reporting Compliance,” “Corporate Governance—Independence of Directors,” “Corporate Governance—Process for Selection of Director Nominee Candidates,” “Audit Committee Report,” and “Certain Relationships and Related Transactions—Employment of Related Parties” of the Company’s definitive proxy statement.statement for its 2008 Annual Meeting of Stockholders (the “Proxy Statement”).
We have adopted a Code of Business Conduct and Ethics that applies to all of our officers, directors and employees (including our Chief Executive Officer, Chief Financial Officer, and Chief Accounting Officer and Controller) and have posted the Code on our website atwww.enersys.com,, and a copy is available in print to any stockholder who requires a copy. If we waive any provision of the Code applicable to any director, our Chief Executive Officer, Chief Financial Officer, or Chief Accounting Officer and Controller, such waiver will be promptly disclosed to the Company’s stockholders through the Company’s website.
| ITEM 11. | EXECUTIVE COMPENSATION |
The information required by this item is incorporated by reference to the sections entitled “Corporate Governance—Compensation Committee” and “Executive Compensation” of the Proxy Statement.
| ITEM 12. | SECURITY OWNERSHIP OF CERTAIN BENEFICIAL OWNERS AND MANAGEMENT RELATED STOCKHOLDER MATTERS |
The information required by this item is incorporated by reference to the section entitled “Security Ownership of Certain Beneficial Owners and Management” of the Proxy Statement.
Equity Compensation Plan Information
| | | | | | | |
Plan Category | | Number of
securities to be
issued upon
exercise of
outstanding
options, warrants
and rights
(a) | | Weighted-average
exercise price of
outstanding options,
warrants and rights
(b) | | Number of
securities
remaining available
for future issuance
under equity
compensation plans
(excluding
securities reflected
in column (a))
(c) |
Equity compensation plans approved by security holders | | 3,827,608 | | $ | 15.27 | | 2,344,800 |
Equity compensation plans not approved by security holders | | — | | | — | | — |
| | | | | | | |
Total | | 3,827,608 | | $ | 15.27 | | 2,344,800 |
| | | | | | | |
| ITEM 13. | CERTAIN RELATIONSHIPS AND RELATED TRANSACTIONS, AND DIRECTOR INDEPENDENCE |
The information required by this item is incorporated by reference to the sections entitled “General Information—Metalmark and our Institutional Stockholders,” “Corporate Governance,” and “Certain Relationships and Related Transactions” of the Proxy Statement.
| ITEM 14. | PRINCIPAL ACCOUNTING FEES AND SERVICES |
The information required by this item is incorporated by reference to the section entitled “Audit Committee Report” of the Proxy Statement.
PART IV
ITEM 15. EXHIBITS AND FINANCIAL STATEMENT SCHEDULES
| ITEM 15. | EXHIBITS AND FINANCIAL STATEMENT SCHEDULES |
(a) The following documents are filed as part of this Report:
(1) Consolidated Financial Statements
See Index to Consolidated Financial Statements.
(2) Financial Statement Schedule
The following consolidated financial statement schedule should be read in conjunction with the consolidated financial statements (see Item 8. “Financial Statements and Supplementary Data:”): Schedule II—Valuation and Qualifying Accounts.
All other schedules are omitted because they are not applicable or the required information is contained in the consolidated financial statements or notes thereto.
(b) The following documents are filed herewith as exhibits:
| | |
Exhibit Number | | Description of Exhibit |
| 3.1 | | Fifth Restated Certificate of Incorporation (incorporated by reference to Exhibit 3.1 to Amendment No. 3 to EnerSys’ Registration Statement on Form S-1 (File No. 333-115553) filed on July 13, 2004). |
| |
| 3.2 | | Bylaws (incorporated by reference to Exhibits 3.2 to Amendment No. 3 to EnerSys’ Registration Statement on Form S-1 (File No. 333-115553) filed on July 13, 2004). |
| |
| 4.1 | | 2004 Securityholder Agreement (incorporated by reference to Exhibit 4.2 to Amendment No. 4 to EnerSys’ Registration Statement on Form S-1 (File No. 333-115553) filed on July 26, 2004). |
| |
| 4.2 | | Consent to Waiver dated as of November 1, 2007, between EnerSys, Morgan Stanley Dean Witter Capital Partners IV, L.P. and MSDW IV 892 Investors, L.P. (furnished herewith). |
| |
| 4.3 | | Consent to Waiver dated as of February 2, 2008, by and between Morgan Stanley Dean Witter Capital Partners IV, L.P., MSDW IV 892 Investors, L.P. and EnerSys (furnished herewith). |
| |
| 10.1 | | Credit Agreement, dated March 17, 2004, among EnerSys, EnerSys Capital Inc., various lending institutions party thereto, Bank of America, N.A., as Administrative Agent, Morgan Stanley Senior Funding, Inc., as Syndication Agent, and Lehman Commercial Paper Inc., as Documentation Agent (incorporated by reference to Exhibit 10.9 to EnerSys’ Registration Statement on Form S-1 (File No. 333-115553) filed on May 17, 2004). |
| |
| 10.2 | | First Amendment and Consent to Credit Agreement (File No. 001-32253) (incorporated by reference to Exhibit 10.28 to EnerSys’ Form 10-Q filed on September 9, 2004). |
| |
| 10.3 | | Second Amendment and Consent to Credit Agreement (incorporated by reference to Exhibit 10.3 to EnerSys’ Form 10-K filed on June 20, 2005). |
| |
| 10.4 | | Third Amendment to Credit Agreement and First Amendment to Pledge Agreement (incorporated by reference to Exhibit 10.2 to EnerSys’ Form 8-K dated July 6, 2006). |
| |
| 10.5 | | Fourth Amendment to the Credit Agreement (incorporated by reference to Exhibit 10.1 to EnerSys’ Form 8-K dated February 2, 2007). |
| |
| 10.6 | | Fifth Amendment to Credit Agreement (incorporated by reference to Exhibit 10.1 to EnerSys’ Form 8-K dated May 19, 2008). |
| | |
Exhibit Number | | Description of Exhibit |
| 10.7 | | Pledge Agreement, dated March 17, 2004, among EnerSys, various subsidiaries of EnerSys and Bank of America, N.A., as Collateral Agent (incorporated by reference to Exhibit 10.10 to EnerSys’ Registration Statement on Form S-1 (File No. 333-115553) filed on May 17, 2004). |
| |
10.5 10.8 | | Security Agreement, dated March 17, 2004, among EnerSys, various subsidiaries of EnerSys and Bank of America, N.A., as Collateral Agent (incorporated by reference to Exhibit 10.11 to EnerSys’ Registration Statement on Form S-1 (File No. 333-115553) filed on May 17, 2004). |
| |
10.6 10.9 | | Subsidiaries Guaranty, dated March 17, 2004, among various subsidiaries of EnerSys, in favor of Bank of America, N.A., as Administrative Agent (incorporated by reference to Exhibit 10.12 to EnerSys’ Registration Statement on Form S-1 (File No. 333-115553) filed on May 17, 2004). |
| |
10.7 10.10 | | Employment Agreement, dated November 9, 2000, between Yuasa, Inc. and John D. Craig and letter of amendment thereto (incorporated by reference to Exhibit 10.2 to EnerSys’ Registration Statement on Form S-1 (File No. 333-115553) filed on May 17, 2004). |
| | |
Exhibit Number | | Description of Exhibit
|
| |
10.8 10.11 | | Employment Agreement, dated November 9, 2000, between Yuasa, Inc. and Michael T. Philion and letter of amendment thereto (incorporated by reference to Exhibit 10.3 to EnerSys’ Registration Statement on Form S-1 (File No. 333-115553) filed on May 17, 2004). |
| |
10.9 10.12 | | Employment Agreement, dated November 9, 2000, between Yuasa, Inc. and John A. Shea and letter of amendment thereto (incorporated by reference to Exhibit 10.5 to EnerSys’ Registration Statement on Form S-1 (File No. 333-115553) filed on May 17, 2004). |
| |
10.1010.13 | | Employment Agreement, dated November 9, 2000, between Yuasa, Inc. and Richard W. Zuidema and letter of amendment thereto (incorporated by reference to Exhibit 10.6 to EnerSys’ Registration Statement on Form S-1 (File No. 333-115553) filed on May 17, 2004). |
| |
10.1110.14 | | DirectorshipEmployment Agreement, dated January 8, 2002,as of July 1, 2007 between EnerSys, Inc.EH Europe GmbH and RayRaymond R. Kubis (incorporated by reference to Exhibit 10.710.1 to EnerSys’ Registration Statement on Form S-1 (File No. 333-115553)10-Q filed on May 17, 2004). |
| |
10.12 | | Managing Directorship Agreement, dated JanuaryAugust 8, 2002, between Hawker Belgium S.A. and Ray Kubis (incorporated by reference to Exhibit 10.8 to EnerSys’ Registration Statement on Form S-1 (File No. 333-115553) filed on May 17, 2004 |
| |
10.13 | | Letter, dated April 1, 2007, amending the Employment Agreement between Yuasa, Inc. and John D. Craig (filed herewith). |
| |
10.14 | | Letter, dated April 1, 2007, amending the Employment Agreement between Yuasa, Inc. and Michael T. Philion (filed herewith).2007. |
| |
| 10.15 | | Letter, dated April 1, 2007, amending the Employment Agreement between Yuasa, Inc. and John A. Shea (filed herewith). |
| |
10.16 | | Letter, dated April 1, 2007, amending the Employment Agreement between Yuasa, Inc. and Richard W. Zuidema (filed herewith). |
| |
10.17 | | Letter, dated April 1, 2007, amending the Directorship Agreement between Hawker Belgium S.A. and Raymond R. Kubis (filed herewith). |
| |
10.18 | | Form of 2000 Management Equity Plan (incorporated by reference as Exhibit 10.1 to Amendment No. 3 to EnerSys’ Registration Statement on Form S-1 (File No. 333-115553) filed on July 13, 2004). |
| |
10.1910.16 | | Form of Indemnification Agreement between EnerSys and each of its Directors and Officers (incorporated by reference to Exhibit 10.18 to Amendment No. 3 to EnerSys’ Registration Statement on Form S-1 (File No. 333-115553) filed on July 13, 2004). |
| |
10.2010.17 | | Form of 2004 Equity Incentive Plan (incorporated by reference to Exhibit 10.24 to Amendment No. 3 to EnerSys’ Registration Statement on Form S-1 (File No. 333-115553) filed on July 13, 2004). |
| |
10.2110.18 | | Form of Employee Stock Purchase Plan (incorporated by reference to Exhibit 10.26 to Amendment No. 3 to EnerSys’ Registration Statement on Form S-1 (File No. 333-115553) filed on July 13, 2004). |
| |
10.2210.19 | | Stock Subscription Agreement, dated March 22, 2002, among EnerSys Holdings Inc., Morgan Stanley Dean Witter Capital Partners IV, L.P., Morgan Stanley Dean Witter Capital Investors IV, L.P., MSDW IV 892 Investors, L.P., Morgan Stanley Global Emerging Markets Private Investment Fund, L.P. and Morgan Stanley Global Emerging Markets Private Investors, L.P. (incorporated by reference to Exhibit 10.27 to Amendment No. 3 to EnerSys’ Registration Statement on Form S-1 (File No. 333-115553) filed on July 13, 2004). |
| |
10.2310.20 | | Euro Credit Agreement, dated June 15, 2005, among EnerSys S.p.A., Banca Intesa S.p.A., Sanpaolo IMI S.p.A., et al. (incorporated by reference to Exhibit 10.2 to EnerSys’ Form 8-K dated June 20, 2005). |
| | |
Exhibit Number | | Description of Exhibit |
| |
10.2410.21 | | Pledge over the Participation in EnerSys S.p.A., dated June 15, 2005, among EnerSys Holdings (Luxembourg) S.à r.l., Banca Intesa S.p.A., Sanpaolo IMI S.p.A., et al. (incorporated by reference to Exhibit 10.3 to EnerSys’ Form 8-K dated June 20, 2005) |
| | |
Exhibit Number | | Description of Exhibit
. |
| |
10.2510.22 | | Guaranty, dated June 15, 2005, of EnerSys Capital Inc. in favor of Sanpaolo IMI S.p.A. (incorporated by reference to Exhibit 10.4 to EnerSys’ Form 8-K dated June 20, 2005). |
| |
10.2610.23 | | Amendment to Euro 25,000,000 Credit Agreement (incorporated by reference to Exhibit 10.1 to EnerSys’ Form 8-K dated January 6, 2007). |
| |
| 10.24 | | Waiver and Amendment Agreement to Euro 25,000,000 Credit Agreement (incorporated by reference to Exhibit 10.2 to EnerSys’ Form 8-K dated May 19, 2008). |
| |
| 10.25 | | Form of Restricted Stock Agreement (incorporated by reference to Exhibit 10.1 to EnerSys’ Form 8-K dated December 9, 2005). |
| |
10.2710.26 | | EnerSys Management Incentive Plan for fiscal year 2007 (incorporated by reference to Exhibit 10.1 to EnerSys’ Form 8-K dated July 6, 2006). |
| |
| 10.27 | | EnerSys Amended and Restated 2006 Equity Incentive Plan (filed herewith). |
| |
| 10.28 | | Third Amendment to Credit Agreement and First Amendment to Pledge Agreement (incorporated by reference to Exhibit 10.2 to EnerSys’ Form 8-K dated July 6, 2006) |
| |
10.29 | | EnerSys 2006 Equity Incentive Plan (incorporated by reference to Exhibit 10.1 to EnerSys’ Form 8-K dated July 26, 2006) |
| |
10.30 | | Underwriting Agreement dated December 7, 2006, between EnerSys, Lehman Brothers Inc. and certain selling stockholders named therein (incorporated by reference to Exhibit 10.1 to EnerSys’ Form 8-K dated December 12, 2006) |
| |
10.31 | | Amendment to Euro 25,000,000 Credit Agreement (incorporated by reference to Exhibit 10.1 to EnerSys’ Form 8-K dated January 6, 2007) |
| |
10.32 | | Fourth Amendment to the Credit Agreement (incorporated by reference to Exhibit 10.1 to EnerSys’ Form 8-K dated February 2, 2007) |
| |
10.33 | | EnerSys Management Incentive Plan for fiscal year 2008 (incorporated by reference to Exhibit 10.1 to EnerSys’ Form 8-K dated April 2, 2007). |
| |
10.3410.29 | | Form of Stock Option Agreement (four year vesting) (incorporated by reference to Exhibit 10.1 to EnerSys’ Form 8-K dated May 23, 2007). |
| |
10.3510.30 | | Form of Stock Option Agreement (three year vesting) (incorporated by reference to Exhibit 10.2 to EnerSys’ Form 8-K dated May 6, 2008). |
| |
| 10.31 | | Form of Restricted Stock Unit Agreement (incorporated by reference to Exhibit 10.1 to EnerSys’ Form 8-K dated May 23, 2007). |
| |
| 11.1 | | Statement regarding Computation of Per Share EarningsEarnings.* |
| |
| 21.1 | | Subsidiaries of the Registrant (filed herewith). |
| |
| 23.1 | | Consent of Ernst & Young LLP (filed herewith) |
| . |
| 31.1 | | Certification of the Chief Executive Officer pursuant to Rule 13a-14(a)/15d-14(a) Under the Securities Exchange Act of 1934 (filed herewith). |
| |
| 31.2 | | Certification of the Chief Financial Officer pursuant to Rule 13a-14(a)/15d-14(a) Under the Securities Exchange Act of 1934 (filed herewith). |
| |
| 32.1 | | Certification of the Chief Executive Officer and Chief Financial Officer pursuant to 18 U.S.C. Section 1350, as adopted pursuant to Section 906 of the Sarbanes-Oxley Act of 2002 (furnished herewith). |
| * | Information required to be presented in Exhibit 11 is provided in Note 17 of Notes to the consolidated financial statementsConsolidated Financial Statements under Part II, Item 8 of this Form 10-K in accordance with the provisions of FASB Statement of Financial Accounting Standards (SFAS) No. 128, Earnings per Share. |
SIGNATURES
Pursuant to the requirements of Section 13 or 15(d) of the Securities Exchange Act of 1934, as amended, the registrant has duly caused this annual report to be signed on its behalf by the undersigned, thereunto duly authorized, in the City of Reading, Commonwealth of Pennsylvania, on June 13, 2007.11, 2008.
| | |
| ENERSYS |
| |
| By | | /s/ JOHN D. CRAIG |
| | John D. Craig |
| | Chairman, President and Chief Executive Officer |
POWER OF ATTORNEY
KNOW ALL PERSONS BY THESE PRESENTS, that each person whose name appears below hereby appoints John D. Craig and Michael T. Philion and each of them, as his true and lawful agent, with full power of substitution and resubstitution, for him and in his, place or stead, in any and all capacities, to execute any and all amendments to the within annual report, and to file the same, together with all exhibits thereto, with the Securities and Exchange Commission, granting unto each said attorney-in-fact and agent, full power and authority to do and perform each and every act and thing requisite and necessary to be done in and about the premises, as fully to all intents and purposes as he might or could do in person, hereby ratifying and confirming all that each said attorney-in-fact and agent may lawfully do or cause to be done by virtue hereof.
Pursuant to the requirements of the Securities Exchange Act of 1934, as amended, this annual report has been signed below by the following persons in the capacities and on the dates indicated
| | | | |
Name | | Title | | Date |
| | |
/s/ JOHN D. CRAIG John D. Craig | | Chairman, President, and Chief Executive Officer and Director (Principal Executive Officer) | | June 13, 200711, 2008 |
| | |
/s/ MICHAEL T. PHILION Michael T. Philion | | Executive Vice President-Finance and Chief Financial Officer (Principal Financial Officer) | | June 13, 200711, 2008 |
| | |
/s/ MICHAEL J. SCHMIDTLEIN Michael J. Schmidtlein | | Vice President & Corporate Controller (Principal Accounting Officer) | | June 13, 200711, 2008 |
| | |
/s/ HWAN-YOON CHUNG Hwan-yoon Chung | | Director | | June 13, 200711, 2008 |
| | |
/s/ KENNETH F. CLIFFORD Kenneth F. Clifford | | Director | | June 13, 200711, 2008 |
| | |
/s/ ERRICAYMOND T. FE. MRY ABUS, JR. Eric T. FryRaymond E. Mabus, Jr.
| | Director | | June 13, 200711, 2008 |
| | |
/s/ HOWARD I. HOFFEN Howard I. Hoffen | | Director | | June 13, 200711, 2008 |
| | |
/s/ MICHAEL C. HOFFMAN Michael C. Hoffman | | Director | | June 13, 200711, 2008 |
| | | | |
Name | | Title | | Date |
| | |
/s/ ARTHUR T. KATSAROS Arthur T. Katsaros | | Director | | June 13, 200711, 2008 |
| | |
/s/ JOHN F. LEHMAN John F. Lehman | | Director | | June 13, 200711, 2008 |
| | |
/s/ DENNIS S. MARLO Dennis S. Marlo | | Director | | June 13, 200711, 2008 |
Exhibit Index
| | |
Exhibit Number | | Description of Exhibit |
| 3.1 | | Fifth Restated Certificate of Incorporation (incorporated by reference to Exhibit 3.1 to Amendment No. 3 to EnerSys’ Registration Statement on Form S-1 (File No. 333-115553) filed on July 13, 2004). |
| |
| 3.2 | | Bylaws (incorporated by reference to Exhibits 3.2 to Amendment No. 3 to E 0.nerSys’EnerSys’ Registration Statement on Form S-1 (File No. 333-115553) filed on July 13, 2004). |
| |
| 4.1 | | 2004 Securityholder Agreement (incorporated by reference to Exhibit 4.2 to Amendment No. 4 to EnerSys’ Registration Statement on Form S-1 (File No. 333-115553) filed on July 26, 2004). |
| |
| 4.2 | | Consent to Waiver dated as of November 1, 2007, between EnerSys, Morgan Stanley Dean Witter Capital Partners IV, L.P. and MSDW IV 892 Investors, L.P. (furnished herewith). |
| |
| 4.3 | | Consent to Waiver dated as of February 2, 2008, by and between Morgan Stanley Dean Witter Capital Partners IV, L.P., MSDW IV 892 Investors, L.P. and EnerSys (furnished herewith). |
| |
| 10.1 | | Credit Agreement, dated March 17, 2004, among EnerSys, EnerSys Capital Inc., various lending institutions party thereto, Bank of America, N.A., as Administrative Agent, Morgan Stanley Senior Funding, Inc., as Syndication Agent, and Lehman Commercial Paper Inc., as Documentation Agent (incorporated by reference to Exhibit 10.9 to EnerSys’ Registration Statement on Form S-1 (File No. 333-115553) filed on May 17, 2004). |
| |
| 10.2 | | First Amendment and Consent to Credit Agreement (File No. 001-32253) (incorporated by reference to Exhibit 10.28 to EnerSys’ Form 10-Q filed on September 9, 2004). |
| |
| 10.3 | | Second Amendment and Consent to Credit Agreement (incorporated by reference to Exhibit 10.3 to EnerSys’ Form 10-K filed on June 20, 2005). |
| |
| 10.4 | | Third Amendment to Credit Agreement and First Amendment to Pledge Agreement (incorporated by reference to Exhibit 10.2 to EnerSys’ Form 8-K dated July 6, 2006). |
| |
| 10.5 | | Fourth Amendment to the Credit Agreement (incorporated by reference to Exhibit 10.1 to EnerSys’ Form 8-K dated February 2, 2007). |
| |
| 10.6 | | Fifth Amendment to Credit Agreement (incorporated by reference to Exhibit 10.1 to EnerSys’ Form 8-K dated May 19, 2008). |
| |
| 10.7 | | Pledge Agreement, dated March 17, 2004, among EnerSys, various subsidiaries of EnerSys and Bank of America, N.A., as Collateral Agent (incorporated by reference to Exhibit 10.10 to EnerSys’ Registration Statement on Form S-1 (File No. 333-115553) filed on May 17, 2004). |
| |
10.5 10.8 | | Security Agreement, dated March 17, 2004, among EnerSys, various subsidiaries of EnerSys and Bank of America, N.A., as Collateral Agent (incorporated by reference to Exhibit 10.11 to EnerSys’ Registration Statement on Form S-1 (File No. 333-115553) filed on May 17, 2004). |
| |
10.6 10.9 | | Subsidiaries Guaranty, dated March 17, 2004, among various subsidiaries of EnerSys, in favor of Bank of America, N.A., as Administrative Agent (incorporated by reference to Exhibit 10.12 to EnerSys’ Registration Statement on Form S-1 (File No. 333-115553) filed on May 17, 2004). |
| |
10.7 10.10 | | Employment Agreement, dated November 9, 2000, between Yuasa, Inc. and John D. Craig and letter of amendment thereto (incorporated by reference to Exhibit 10.2 to EnerSys’ Registration Statement on Form S-1 (File No. 333-115553) filed on May 17, 2004). |
| |
10.8 10.11 | | Employment Agreement, dated November 9, 2000, between Yuasa, Inc. and Michael T. Philion and letter of amendment thereto (incorporated by reference to Exhibit 10.3 to EnerSys’ Registration Statement on Form S-1 (File No. 333-115553) filed on May 17, 2004). |
| | |
10.9 Exhibit Number | | Description of Exhibit |
| 10.12 | | Employment Agreement, dated November 9, 2000, between Yuasa, Inc. and John A. Shea and letter of amendment thereto (incorporated by reference to Exhibit 10.5 to EnerSys’ Registration Statement on Form S-1 (File No. 333-115553) filed on May 17, 2004). |
| |
10.1010.13 | | Employment Agreement, dated November 9, 2000, between Yuasa, Inc. and Richard W. Zuidema and letter of amendment thereto (incorporated by reference to Exhibit 10.6 to EnerSys’ Registration Statement on Form S-1 (File No. 333-115553) filed on May 17, 2004). |
| |
10.1110.14 | | DirectorshipEmployment Agreement, dated January 8, 2002,as of July 1, 2007 between EnerSys, Inc.EH Europe GmbH and RayRaymond R. Kubis (incorporated by reference to Exhibit 10.710.1 to EnerSys’ Registration Statement on Form S-1 (File No. 333-115553)10-Q filed on May 17, 2004). |
| |
10.12 | | Managing Directorship Agreement, dated JanuaryAugust 8, 2002, between Hawker Belgium S.A. and Ray Kubis (incorporated by reference to Exhibit 10.8 to EnerSys’ Registration Statement on Form S-1 (File No. 333-115553) filed on May 17, 2004 |
| | |
Exhibit Number | | Description of Exhibit
|
10.13 | | Letter, dated April 1, 2007, amending the Employment Agreement between Yuasa, Inc. and John D. Craig (filed herewith). |
| |
10.14 | | Letter, dated April 1, 2007, amending the Employment Agreement between Yuasa, Inc. and Michael T. Philion (filed herewith).2007. |
| |
| 10.15 | | Letter, dated April 1, 2007, amending the Employment Agreement between Yuasa, Inc. and John A. Shea (filed herewith). |
| |
10.16 | | Letter, dated April 1, 2007, amending the Employment Agreement between Yuasa, Inc. and Richard W. Zuidema (filed herewith). |
| |
10.17 | | Letter, dated April 1, 2007, amending the Directorship Agreement between Hawker Belgium S.A. and Raymond R. Kubis (filed herewith). |
| |
10.18 | | Form of 2000 Management Equity Plan (incorporated by reference as Exhibit 10.1 to Amendment No. 3 to EnerSys’ Registration Statement on Form S-1 (File No. 333-115553) filed on July 13, 2004). |
| |
10.1910.16 | | Form of Indemnification Agreement between EnerSys and each of its Directors and Officers (incorporated by reference to Exhibit 10.18 to Amendment No. 3 to EnerSys’ Registration Statement on Form S-1 (File No. 333-115553) filed on July 13, 2004). |
| |
10.2010.17 | | Form of 2004 Equity Incentive Plan (incorporated by reference to Exhibit 10.24 to Amendment No. 3 to EnerSys’ Registration Statement on Form S-1 (File No. 333-115553) filed on July 13, 2004). |
| |
10.2110.18 | | Form of Employee Stock Purchase Plan (incorporated by reference to Exhibit 10.26 to Amendment No. 3 to EnerSys’ Registration Statement on Form S-1 (File No. 333-115553) filed on July 13, 2004). |
| |
10.2210.19 | | Stock Subscription Agreement, dated March 22, 2002, among EnerSys Holdings Inc., Morgan Stanley Dean Witter Capital Partners IV, L.P., Morgan Stanley Dean Witter Capital Investors IV, L.P., MSDW IV 892 Investors, L.P., Morgan Stanley Global Emerging Markets Private Investment Fund, L.P. and Morgan Stanley Global Emerging Markets Private Investors, L.P. (incorporated by reference to Exhibit 10.27 to Amendment No. 3 to EnerSys’ Registration Statement on Form S-1 (File No. 333-115553) filed on July 13, 2004). |
| |
10.2310.20 | | Euro Credit Agreement, dated June 15, 2005, among EnerSys S.p.A., Banca Intesa S.p.A., Sanpaolo IMI S.p.A., et al. (incorporated by reference to Exhibit 10.2 to EnerSys’ Form 8-K dated June 20, 2005). |
| |
10.2410.21 | | Pledge over the Participation in EnerSys S.p.A., dated June 15, 2005, among EnerSys Holdings (Luxembourg) S.à r.l., Banca Intesa S.p.A., Sanpaolo IMI S.p.A., et al. (incorporated by reference to Exhibit 10.3 to EnerSys’ Form 8-K dated June 20, 2005). |
| |
10.2510.22 | | Guaranty, dated June 15, 2005, of EnerSys Capital Inc. in favor of Sanpaolo IMI S.p.A. (incorporated by reference to Exhibit 10.4 to EnerSys’ Form 8-K dated June 20, 2005). |
| |
10.2610.23 | | Amendment to Euro 25,000,000 Credit Agreement (incorporated by reference to Exhibit 10.1 to EnerSys’ Form 8-K dated January 6, 2007). |
| |
| 10.24 | | Waiver and Amendment Agreement to Euro 25,000,000 Credit Agreement (incorporated by reference to Exhibit 10.2 to EnerSys’ Form 8-K dated May 19, 2008). |
| |
| 10.25 | | Form of Restricted Stock Agreement (incorporated by reference to Exhibit 10.1 to EnerSys’ Form 8-K dated December 9, 2005). |
| |
10.2710.26 | | EnerSys Management Incentive Plan for fiscal year 2007 (incorporated by reference to Exhibit 10.1 to EnerSys’ Form 8-K dated July 6, 2006). |
| |
10.28 | | Third Amendment to Credit Agreement and First Amendment to Pledge Agreement (incorporated by reference to Exhibit 10.2 to EnerSys’ Form 8-K dated July 6, 2006) |
| |
10.2910.27 | | EnerSys Amended and Restated 2006 Equity Incentive Plan (incorporated by reference to Exhibit 10.1 to EnerSys’ Form 8-K dated July 26, 2006)(filed herewith). |
| | |
Exhibit Number | | Description of Exhibit |
10.30 | | Underwriting Agreement dated December 7, 2006, between EnerSys, Lehman Brothers Inc. and certain selling stockholders named therein (incorporated by reference to Exhibit 10.1 to EnerSys’ Form 8-K dated December 12, 2006) |
| |
10.31 | | Amendment to Euro 25,000,000 Credit Agreement (incorporated by reference to Exhibit 10.1 to EnerSys’ Form 8-K dated January 6, 2007) |
| |
10.32 | | Fourth Amendment to the Credit Agreement (incorporated by reference to Exhibit 10.1 to EnerSys’ Form 8-K dated February 2, 2007) |
| |
10.3310.28 | | EnerSys Management Incentive Plan for fiscal year 2008 (incorporated by reference to Exhibit 10.1 to EnerSys’ Form 8-K dated April 2, 2007). |
| |
10.3410.29 | | Form of Stock Option Agreement (four year vesting) (incorporated by reference to Exhibit 10.1 to EnerSys’ Form 8-K dated May 23, 2007). |
| |
10.3510.30 | | Form of Stock Option Agreement (three year vesting) (incorporated by reference to Exhibit 10.2 to EnerSys’ Form 8-K dated May 6, 2008). |
| |
| 10.31 | | Form of Restricted Stock Unit Agreement (incorporated by reference to Exhibit 10.1 to EnerSys’ Form 8-K dated May 23, 2007). |
| |
| 11.1 | | Statement regarding Computation of Per Share EarningsEarnings.* |
| |
| 21.1 | | Subsidiaries of the Registrant (filed herewith). |
| |
| 23.1 | | Consent of Ernst & Young LLP (filed herewith). |
| |
| 31.1 | | Certification of the Chief Executive Officer pursuant to Rule 13a-14(a)/15d-14(a) Under the Securities Exchange Act of 1934 (filed herewith). |
| |
| 31.2 | | Certification of the Chief Financial Officer pursuant to Rule 13a-14(a)/15d-14(a) Under the Securities Exchange Act of 1934 (filed herewith). |
| |
| 32.1 | | Certification of the Chief Executive Officer and Chief Financial Officer pursuant to 18 U.S.C. Section 1350, as adopted pursuant to Section 906 of the Sarbanes-Oxley Act of 2002 (furnished herewith). |
| * | Information required to be presented in Exhibit 11 is provided in Note 17 of Notes to the consolidated financial statementsConsolidated Financial Statements under Part II, Item 8 of this Form 10-K in accordance with the provisions of FASB Statement of Financial Accounting Standards (SFAS) No. 128, Earnings per Share. |