
UNITED STATES
SECURITIES AND EXCHANGE COMMISSION
Washington, D.C. 20549
FORM 10-K
| x | ANNUAL REPORT PURSUANT TO SECTION 13 OR 15(d) OF THE SECURITIES EXCHANGE ACT OF 1934 |
For the fiscal year endedDecember 31, 20072009
OR
| ¨ | TRANSITION REPORT PURSUANT TO SECTION 13 OR 15(d) OF THE SECURITIES EXCHANGE ACT OF 1934 |
For the transition period fromto
COMMISSION FILE NUMBER 001-12307
ZIONS BANCORPORATION
(Exact name of Registrant as specified in its charter)
UTAH | 87-0227400 | |
(State or other jurisdiction of
| (Internal Revenue Service Employer Identification Number) | |
|
| |
| (Address of principal executive offices) | (Zip Code) | |
Registrant’s telephone number, including area code: (801) 524-4787
Securities registered pursuant to Section 12(b) of the Act:
Title of Each Class | Name of Each Exchange on Which Registered | |
Guarantee related to 8.00% Capital Securities of Zions Capital Trust B | New York Stock Exchange | |
Convertible 6% Subordinated Notes due September 15, 2015 | New York Stock Exchange | |
Depositary Shares each representing a 1/40th ownership interest in a share of Series A Floating-Rate Non-Cumulative Perpetual Preferred Stock | New York Stock Exchange | |
Depositary Shares each representing a 1/40th ownership interest in a share of Series C 9.5% Non-Cumulative Perpetual Preferred Stock | New York Stock Exchange | |
Common Stock, without par value | The NASDAQ Stock Market LLC |
Securities registered pursuant to Section 12(g) of the Act:None.
Indicate by check mark if the registrant is a well-known seasoned issuer, as defined in Rule 405 of the Securities Act.
Yes x No ¨
Indicate by check mark if the registrant is not required to file reports pursuant to Section 13 or Section 15(d) of the Act.
Yes ¨ No x
Indicate by check mark whether the registrant (1) has filed all reports required to be filed by Section 13 or 15(d) of the Securities Exchange Act of 1934 during the preceding 12 months (or for such shorter period that the registrant was required to file such reports), and (2) has been subject to such filing requirements for the past 90 days.
Yes x No ¨
Indicate by check mark whether the registrant has submitted electronically and posted on its corporate Web site, if any, every Interactive Data File required to be submitted and posted pursuant to Rule 405 of Regulation S-T (§232.405 of this chapter) during the preceding 12 months (or for such shorter period that the registrant was required to submit and post such files). Yes ¨ No ¨
Indicate by check mark if disclosure of delinquent filers pursuant to Item 405 of Regulation S-K (Section 229.405 of this chapter) is not contained herein, and will not be contained, to the best of registrant’s knowledge, in definitive proxy or information statements incorporated by reference in Part III of this Form 10-K or any amendment to this Form 10-K.¨
Indicate by check mark whether the registrant is a large accelerated filer, an accelerated filer, a non-accelerated filer, or a smaller reporting company. See the definitions of “large accelerated filer,” “accelerated filer,” and “smaller reporting company” in Rule 12b-2 of the Exchange Act.
Large accelerated filer x Accelerated filer ¨ Non-accelerated filer ¨ Smaller reporting company ¨
Indicate by check mark whether the registrant is a shell company (as defined in Rule 12b-2 of the Exchange Act).
Yes ¨ No x
Aggregate Market Value of Common Stock Held by Non-affiliates at June 30, 2007 | $ | 7,974,285,987 | |
Number of Common Shares Outstanding at February 15, 2008 | 107,139,628 shares | ||
Aggregate Market Value of Common Stock Held by Non-affiliates at June 30, 2009 | $ | 1,376,411,491 | |
Number of Common Shares Outstanding at February 16, 2010 | 150,401,679 shares |
Documents Incorporated by Reference:
Portions of the Company’s Proxy Statement (to be dated approximately March 10, 2008) for the Annual Meeting of Shareholders to be held April 24, 2008 – Incorporated into Part III
| Page | ||||
| PART I | ||||
| Item 1. | ||||
| Item 1A. | ||||
| Item 1B. | ||||
| Item 2. | ||||
| Item 3. | ||||
| Item 4. |
| |||
| PART II | ||||
| Item 5. | ||||
| Item 6. | ||||
| Item 7. | Management’s Discussion and Analysis of Financial Condition and Results of Operations. | |||
| Item 7A. | ||||
| Item 8. | ||||
| Item 9. | Changes in and Disagreements with Accountants on Accounting and Financial Disclosure. | |||
| Item 9A. | ||||
| Item 9B. | ||||
| PART III | ||||
| Item 10. | ||||
| Item 11. | ||||
| Item 12. | Security Ownership of Certain Beneficial Owners and Management and Related Stockholder Matters. | |||
| Item 13. | Certain Relationships and Related Transactions, and Director Independence. | |||
| Item 14. | ||||
| PART IV | ||||
| Item 15. | ||||
FORWARD-LOOKING INFORMATION
Statements in this Annual Report on Form 10-K that are based on other than historical data are forward-looking within the meaning of the Private Securities Litigation Reform Act of 1995. Forward-looking statements provide current expectations or forecasts of future events and include, among others:
statements with respect to the beliefs, plans, objectives, goals, guidelines, expectations, anticipations, and future financial condition, results of operations and performance of Zions Bancorporation (“the parent”) and its subsidiaries (collectively “the Company”Company,” “Zions,” “we,” “our,” “us”);
statements preceded by, followed by or that include the words “may,” “could,” “should,” “would,” “believe,” “anticipate,” “estimate,” “expect,” “intend,” “plan,” “projects,” or similar expressions.
These forward-looking statements are not guarantees of future performance, nor should they be relied upon as representing management’s views as of any subsequent date. Forward-looking statements involve significant risks and uncertainties and actual results may differ materially from those presented, either expressed or implied, in this Annual Report on Form 10-K, including, but not limited to, those presented in the Management’s Discussion and Analysis. Factors that might cause such differences include, but are not limited to:
the Company’s ability to successfully execute its business plans, manage its risks, and achieve its objectives;
changes in political and economic conditions, including without limitation the political and economic effects of the current economic crisis, delay of recovery from the current economic crisis, and other major wars, military actions, terrorist attacks against the United States and related events;attacks;
changes in financial market conditions, either internationally, nationally or locally in areas in which the Company conducts its operations, including without limitation reduced rates of business formation and growth, commercial and residential real estate development and real estate prices;
fluctuations in markets for equity, fixed-income, commercial paper and other securities, including availability, market liquidity levels, and pricing;
changes in interest rates, the quality and composition of the loan and securities portfolios, demand for loan products, deposit flows and competition;
acquisitions and integration of acquired businesses;
increases in the levels of losses, customer bankruptcies, bank failures, claims, and assessments;
changes in fiscal, monetary, regulatory, trade and tax policies and laws, and regulatory assessments and fees, including policies of the U.S. Department of Treasury, the Board of Governors of the Federal Reserve Board System (the “FRB” or the Federal Reserve Board), and the Federal Reserve Board;Deposit Insurance Corporation (“FDIC”);
the Company’s participation or lack of participation in governmental programs implemented under the Emergency Economic Stabilization Act (“EESA”) and the American Recovery and Reinvestment Act (“ARRA”), including without limitation the Troubled Asset Relief Program (“TARP”) and the Capital Purchase Program (“CPP”) and the impact of such programs and related regulations on the Company and on international, national, and local economic and financial markets and conditions;
the impact of the EESA and the ARRA and related rules and regulations, and changes in those rules and regulations, on the business operations and competitiveness of the Company and other participating American financial institutions, including the impact of the executive compensation limits of these acts, which may impact the ability of the Company and other American financial institutions to retain and recruit executives and other personnel necessary for their businesses and competitiveness;
continuing consolidation in the financial services industry;
new litigation or changes in existing litigation;
success in gaining regulatory approvals, when required;
changes in consumer spending and savings habits;
increased competitive challenges and expanding product and pricing pressures among financial institutions;
demand for financial services in the Company’s market areas;
inflation and deflation;
technological changes and the Company’s implementation of new technologies;
the Company’s ability to develop and maintain secure and reliable information technology systems;
legislation or regulatory changes which adversely affect the Company’s operations or business;
the Company’s ability to comply with applicable laws and regulations; and
changes in accounting policies or procedures as may be required by the Financial Accounting Standards Board or regulatory agencies.agencies; and
Theincreased costs of deposit insurance and changes with respect to FDIC insurance coverage levels.
Except to the extent required by law, the Company specifically disclaims any obligation to update any factors or to publicly announce the result of revisions to any of the forward-looking statements included herein to reflect future events or developments.
AVAILABILITY OF INFORMATION
We also make available free of charge on our website,www.zionsbancorporation.com, annual reports on Form 10-K, quarterly reports on Form 10-Q, and current reports on Form 8-K and amendments to those reports filed or furnished pursuant to Section 13(a) or 15(d) of the Securities Exchange Act of 1934, as well as proxy statements, as soon as reasonably practicable after we electronically file such material with, or furnish it to, the U.S. Securities and Exchange Commission.
GLOSSARY OF ACRONYMS
ABS – Asset-Backed Security
ACL – Allowance for Credit Losses
AFS – Available-for-Sale
ALCO – Asset/Liability Committee
ALLL – Allowance for Loan and Lease Losses
ALM – Asset-Liability Management
ARM – Adjustable Rate Mortgage
ARRA – American Recovery and Reinvestment Act
ASC – Accounting Standards Codification
ASU – Accounting Standards Update
ATM – Automated Teller Machine
BCBS – Basel Committee on Banking Supervision
BSA – Bank Secrecy Act
CB&T – California Bank & Trust
CDARS – Certificate of Deposit Account Registry System
CDO – Collateralized Debt Obligation
CMC – Capital Management Committee
COSO – Committee of Sponsoring Organizations of the Treadway Commission
CPP – Capital Purchase Program
CRA – Community Reinvestment Act
CRE – Commercial Real Estate
DTA – Deferred Tax Asset
DTL – Deferred Tax Liability
EESA – Emergency Economic Stabilization Act
ESOARS – Employee Stock Option Appreciation Rights Securities
FAMC – Federal Agricultural Mortgage Corporation
FASB – Financial Accounting Standards Board
FDIC – Federal Deposit Insurance Corporation
FHLB – Federal Home Loan Bank
FHLMC – Federal Home Loan Mortgage Corporation
FINRA – Financial Industry Regulatory Authority
FNMA – Federal National Mortgage Association
FRB – Federal Reserve Board
FTE – Full-Time Equivalent
GAAP – Generally Accepted Accounting Principles
GLB – Gramm-Leach-Bliley Act of 1999
GNMA – Government National Mortgage Association
HTM – Held-to-Maturity
ISDA – International Swap Dealer Association
LIBOR – London Inter-Bank Offering Rate
LTV – Loan-to-Value (on an “as completed” basis)
MD&A – Management’s Discussion and Analysis
MSA – Metropolitan Statistical Area
NBA – National Bank of Arizona
NPR – Notice of Proposed Rulemaking
NRSRO – Nationally Recognized Statistical Rating Organization
NSB – Nevada State Bank
OCC – Office of the Comptroller of the Currency
OCI – Other Comprehensive Income
OREO – Other Real Estate Owned
OTC – Over-the-Counter
OTTI – Other-Than-Temporary-Impairment
PCAOB – Public Company Accounting Oversight Board
PDs – Probabilities of Default
PIK – Payment in Kind
QSPE – Qualifying Special-Purpose Entity
REIT – Real Estate Investment Trust
SBA – Small Business Administration
SBIC – Small Business Investment Company
SEC – Securities and Exchange Commission
SFAS – Statement of Financial Accounting Standards
TAF – Term Auction Facility
TARP – Troubled Asset Relief Program
TCBO – The Commerce Bank of Oregon
TCBW – The Commerce Bank of Washington
TLGP – Temporary Liquidity Guarantee Program
VIE – Variable Interest Entity
ZCTB – Zions Capital Trust B
ZFNB – Zions First National Bank
ZMSC – Zions Management Services Company
| ITEM 1. | BUSINESS |
DESCRIPTION OF BUSINESS
Zions Bancorporation (“the Parent”) is a financial holding company organized under the laws of the State of Utah in 1955, and registered under the Bank Holding Company Act of 1956, as amended (the “BHC Act”). The Parent and its subsidiaries (collectively “the Company”) own and operate eight commercial banks with a total of 508491 domestic branches at year-end 2007.2009. The Company provides a full range of banking and related services through its banking and other subsidiaries, primarily in Utah, California, Texas, Arizona, Nevada, Colorado, Idaho, Washington, and Oregon. Full-time equivalent employees totaled 10,93310,529 at year-end 2007.2009. For further information about the Company’s industry segments, see “Business Segment Results” on page 64 in Management’s Discussion and Analysis (“MD&A”) and Note 22 of the Notes to Consolidated Financial Statements. For information about the Company’s foreign operations, see “Foreign Operations” on page 63 in MD&A. The “Executive Summary” on page 20 in MD&A provides further information about the Company.
PRODUCTS AND SERVICES
The Company focuses on providing community-mindedcommunity banking services by continuously strengthening its core business lines of 1) small, medium-sized business and corporate banking; 2) commercial and residential development, construction and term lending; 3) retail banking; 4) treasury cash management and related products and services; 5) residential mortgage; 6) trust and wealth management; and 7) investment activities. It operates eight different banks in ten Western and Southwestern states with each bank operating under a different name and each having its own board of directors, chief executive officer, and management team. The banks provide a wide variety of commercial and retail banking and mortgage lending products and services. They also provide a wide range of personal banking services to individuals, including home mortgages, bankcard, other installment loans, home equity lines of credit, checking accounts, savings accounts, time certificates of various types and maturities, trust services, safe deposit facilities, direct deposit, and 24-hour ATMAutomated Teller Machine (“ATM”) access. In addition, certain banking subsidiaries provide services to key market segments through their Women’s Financial, Private Client Services, and Executive Banking Groups. We also offer wealth management services through a subsidiary, Contango Capital Advisors, Inc., (“Contango”) that was launched in 2004, and online brokerage services through Zions Direct.
In addition to these core businesses, the Company has built specialized lines of business in capital markets, public finance, and certain financial technologies, and is also a leader in U.S. Small Business Administration (“SBA”) lending. Through its eight banking subsidiaries, the Company provides SBA 7(a) loans to small businesses throughout the United States and is also one of the largest providers of SBA 504 financing in the nation. The Company owns an equity interest in the Federal Agricultural Mortgage Corporation (“Farmer Mac”) and is one of the nation’s top originatororiginators of secondary market agricultural real estate mortgage loans through Farmer Mac. The Company is a leader in municipal finance advisory and underwriting services. The Company also controls four venture capital funds that provide early-stage capital primarily for start-up companies located in the Western United States. Finally, the Company’s NetDeposit Inc. (“NetDeposit”) and P5, Inc. (“P5”) subsidiaries are leaderssubsidiary is a leader in the provision of check imaging and clearing software and of web-based medical claims tracking and cash management services, respectively.
software.
COMPETITION
The Company operates in a highly competitive environment. The Company’s most direct competition for loans and deposits comes from other commercial banks, thrifts, and credit unions, including institutions that do not have a physical presence in our market footprint but solicit via the Internet and other means. In addition, the Company competes with finance companies, mutual funds, brokerage firms, securities dealers, investment banking companies, financial technology firms, and a variety of other types of companies. Many of these companies have fewer regulatory constraints and some have lower cost structures or tax burdens.
The primary factors in competing for business include pricing, convenience of office locations and other delivery methods, range of products offered, and the level of service delivered. The Company must compete effectively along all of these parameters to remain successful.
SUPERVISION AND REGULATION
The Parent is a bank holding company that has elected to become a financial holding company underas provided by the BHC Act. The Gramm-Leach-Bliley Act of 1999 (“the GLB Act”) provides a. The BHC Act, and other federal statutes as modified by the GLB Act, provide the regulatory framework for bank holding companies and financial holding companies which have as their umbrella regulator the Federal Reserve Board (“FRB”).Board. The functional regulation of the separately regulated subsidiaries of a holding company is conducted by each subsidiary’s primary functional regulator. To qualify for and maintain status as a financial holding company, the Parent must satisfy certain ongoing criteria. The Company currently engages in only limited activities for which financial holding company status is required.
In addition, the Company’sThe Parent’s subsidiary banks are subject to the provisions of the National Bank Act or other statutes governing national banks and the banking laws of their respectivevarious states, as well as the rules and regulations of the Office of the Comptroller of the Currency (“OCC”), the FRB, and the Federal Deposit Insurance Corporation (“FDIC”).FDIC. They are also under the supervision of, and are continually subject to periodic examination by, the OCC or their respective state banking departments, the FRB, and the FDIC. Many of our nonbank subsidiaries are also subject to regulation by the FRB and other applicable federal and state agencies. Our brokerage and investment advisory subsidiaries are regulated by the Securities and Exchange Commission (“SEC”), Financial Industry Regulatory Authority (“FINRA”) and/or state securities regulators. Our other nonbank subsidiaries may be subject to the laws and regulations of the federal government and/or the various states in which they conduct business.
The Company is subject to various requirements and restrictions contained in both the laws of the United States and the states in which its banks and other subsidiaries operate. These regulations include but are not limited to the following:
Laws and regulations regarding the availability, requirements and restrictions of a number of recently enacted governmental programs in which the Company participates, including without limitation the TARP and its associated CPP, as well as certain requirements and limitations imposed by the EESA and ARRA and programs and regulations thereunder, including without limitation limitations on dividends on common stock in the CPP, and on executive compensation contained in the EESA and ARRA. One of these programs, the CPP, contains provisions that allow the U.S. Government to unilaterally modify any term or provision of contracts executed under the program.
Requirements for approval of acquisitions and activities. The priorPrior approval is required, in accordance with the BHC Act of the FRB, for a financial holding company to acquire or hold more than 5% voting interest in any bank. The BHC Act allows, subject to certain limitations, interstate bank acquisitions and interstate branching by acquisition anywhere in the country. The BHC Act also requires approval for certain nonbanking acquisitions and restricts the Company’s nonbanking activities to those that are permitted for financial holding companies or that have been determined by the FRB to be financial in nature, incidental to financial activities, or complementary to a financial activity.
Capital requirements. The FRB has established capital guidelines for financial holding companies. The OCC, the FDIC, and the FRB have also issued regulations establishing capital requirements for banks. The federalU.S. regulatory bodies are expected to issue new capital guidelines for banking organizations. Numerous “white papers,” speeches, and similar documents have been published by both U.S. and international regulatory bodies, which consistently point toward unspecified, but increased, levels of bank regulatory agencies have adopted and are proposing risk-basedholding company capital rules described below.and liquidity. Accordingly, additional capital requirements could be required by new regulations in the future and could become required of the Company. In addition, there is a risk that the Company may be pressured by regulators to raise capital to enable it to repay the preferred stock issued to the U.S. Treasury under TARP at a time or in amounts that management would not consider optimal. Failure to meet capital requirements could subject the Parent and its subsidiary banks to a variety of restrictions and enforcement remedies. See Note 19 of the Notes to Consolidated Financial Statements for information regarding capital requirements.
The U.S. federal bank regulatory agencies’ risk-based capital guidelines are based upon the 1988 capital accord (“Basel I”) of the Basel Committee on Banking Supervision (the “BCBS”). The BCBS is
a committee of central banks and bank supervisors/regulators from the major industrialized countries that develops broad policy guidelines that each country’s supervisors can use to determine the supervisory policies they apply. The BCBS has been working for a number of years on revisions to Basel I and in June 2004 released the final version of its proposed new capital framework (“Basel II”) with an update in November 2005. Basel II provides two approaches for setting capital standards for credit risk – an internal ratings-based approach tailored to individual institutions’ circumstances (which for many asset classes is itself broken into a “foundation” approach and an “advanced” or “A-IRB” approach, the availability of which is subject to additional restrictions) and a standardized approach that bases risk weightings on external credit assessments to a much greater extent than permitted in existing risk-based capital guidelines. Basel II also sets capital requirements for operational risk and refines the existing capital requirements for market risk exposures. However, U.S. regulatory authorities consistently have taken the position that U.S. banks would not be permitted to utilize the “foundation” approach. Operational risk is defined to mean the risk of direct or indirect loss resulting from inadequate or failed internal processes, people and systems, or from external events. Basel I does not include separate capital requirements for operational risk.
I. In December 2007, U.S. banking regulators published the final rule for Basel II implementation, requiring banks with over $250 billion in consolidated total assets or on balanceon-balance sheet foreign exposure of $10 billion (core banks) to adopt the Advanced Approach of Basel II while allowing other banks to elect to “opt in.” We do not currently expect
Modifications to the Basel II regime (“Basel III”) continue to be an early “opt in”proposed. Additionally, regulators may subjectively require banking organizations to maintain capital, reserves, or liquidity at levels higher than those codified by regulation or those prior to the recent economic crisis. Adoption of new Basel III requirements and/or regulatory actions may have a significant impact on bank holding company, as the Company does not have in place the data collectioncapital and analytical capabilities necessary to adopt the Advanced Approach. However, we believe that the competitive advantages afforded to companies that do adopt the Advanced Approach may make it necessary for the Company to elect to “opt in” at some point, and we have begun investing in the required capabilities and required data.liquidity levels going forward.
Also, in July 2007, the U.S. banking regulators agreed to issue a proposed rule that would provide “non-core” banks with the option of adopting the Standardized Approach proposed in Basel II, replacing the previously proposed Basel 1A framework. While the Advanced Approach uses sophisticated mathematical models to measure and assign capital to specific risks, the Standardized Approach categorizes risks by type and then assigns capital requirements. Following the publication of the proposed rule, the Company will evaluate the benefit of adopting the Standardized Approach.
Requirements that the Parent serve as a source of strength for its banking subsidiaries. The FRB has a policy that a bank holding company is expected to act as a source of financial and managerial strength to each of its bank subsidiaries and, under appropriate circumstances, to commit resources to support each subsidiary bank. In addition, the OCC may order an assessment of the Parent if the capital of one of its national bank subsidiaries were to become impaired.fall below capital levels required by the regulators.
Limitations on dividends payable by subsidiaries. A substantial portion of the Parent’s cash, which is used to pay dividends on our common and preferred stock and to pay principal and interest on our debt obligations, is derived from dividends paid by the Parent’s subsidiary banks. These dividends are subject to various legal and regulatory restrictions as summarized inrestrictions. See Note 19 of the Notes to Consolidated Financial Statements.
Limitations on dividends payable to shareholders. The Parent’s ability to pay dividends on both its common and preferred stock may be subject to regulatory restrictions. See discussion under “Liquidity Management Actions” starting on page 123.
Cross-guarantee requirements. All of the Parent’s subsidiary banks are insured by the FDIC. Each commonly controlled FDIC-insured bank can be held liable for any losses incurred, or reasonably expected to be incurred, by the FDIC due to another commonly controlled FDIC-insured bank being placed into receivership, and for any assistance provided by the FDIC to another commonly controlled FDIC-insured bank that is subject to certain conditions indicating that receivership is likely to occur in the absence of regulatory assistance.
Safety and soundness requirements. Federal and state laws require that our banks be operated in a safe and sound manner. We are subject to additional safety and soundness standards prescribed in the Federal Deposit Insurance Corporate Improvement Act of 1991, including standards related to internal controls, information systems, internal audit, systems, loan documentation, credit underwriting, interest rate exposure, asset growth and compensation, as well as other operational and management standards deemed appropriate by the federal banking agencies.
Limitations on the amount of loans to a borrower and its affiliates.
Limitations on transactions with affiliates.
Restrictions on the nature and amount of any investments and ability to underwrite certain securities.
Requirements for opening of branches and the acquisition of other financial entities.
Fair lending and truth in lending requirements to provide equal access to credit and to protect consumers in credit transactions.
Provisions of the GLB Act and other federal and state laws dealing with privacy for nonpublic personal information of individual customers.
Community Reinvestment Act (“CRA”) requirements. The CRA requires banks to help serve the credit needs in their communities, including credit to low and moderate income individuals. Should the Company or its subsidiaries fail to adequately serve their communities, penalties may be imposed including denials of applications to add branches, relocate, add subsidiaries and affiliates, and merge with or purchase other financial institutions.
Anti-money laundering regulations. The Bank Secrecy Act (“BSA”) and other federal laws require financial institutions to assist U.S. governmentGovernment agencies to detect and prevent money laundering. Specifically, the BSA requires financial institutions to keep records of cash purchases of negotiable instruments, file reports of cash transactions exceeding $10,000 (daily aggregate amount), and to report suspicious activity that might signify money laundering, tax evasion, or other criminal activities. Title III of the Uniting and StrengthingStrengthening of America by Providing Appropriate Tools Required to Intercept and Obstruct Terrorism Act of 2001 (“USA Patriot Act”) substantially broadens the scope of U.S. anti-money laundering laws and regulations by imposing significant new compliance and due diligence obligations, defining new crimes and related penalties, and expanding the extra-territorial jurisdiction of the United States. The U.S. Treasury Department has issued a number of implementing regulations, which apply various requirements of the USA Patriot Act to financial institutions. The Company’s bank and broker-dealer subsidiaries and private investment companies advised or sponsored by the Company’s subsidiaries must comply with these regulations. These regulations also impose new obligations on financial institutions to maintain appropriate policies, procedures and controls to detect, prevent and report money laundering and terrorist financing.
The Parent is subject to the disclosure and regulatory requirements of the Securities Act of 1933, as amended, and the Securities Exchange Act of 1934, as amended, both as administered by the SEC. As a company quotedlisted on the NASDAQ Stock Market LLC (“Nasdaq”) Global Select Market, the Parent is subject to Nasdaq listing standards for quoted companies.
The Company is subject to the Sarbanes-Oxley Act of 2002, which addresses, among other issues, corporate governance, auditing and accounting, executive compensation, and enhanced and timely disclosure of corporate information. Nasdaq has also adopted corporate governance rules, which are intended to allow shareholders and investors to more easily and efficiently monitor the performance of companies and their directors.
The Board of Directors of the Parent has implemented a comprehensive system of strong corporate governance practices. This system includes Corporate Governance Guidelines, a Code of Business Conduct and Ethics for Employees, a Directors Code of Conduct, and charters for the Audit, Credit Review, Compensation, and Nominating and Corporate Governance Committees. More information on the Company’s corporate governance practices is available on the Company’s website atwww.zionsbancorporation.com. (The Company’s website is not part of this Annual Report on Form 10-K.)
The Company has adopted policies, procedures and controls to address compliance with the requirements of the banking, securities and other laws and regulations described above or otherwise applicable to the Company. The Company intends to make appropriate revisions to reflect any changes required.
Regulators, Congress, and state legislatures and international consultative bodies continue to enact rules, laws, and policies to regulate the financial services industry and public companies and to protect consumers and investors. The nature of these laws and regulations and the effect of such policies on future business and earnings of the Company cannot be predicted.
GOVERNMENT MONETARY POLICIES
The earnings and business of the Company are affected not only by general economic conditions, but also by fiscal and other policies adopted by various governmental authorities. The Company is particularly affected by the monetary policies of the FRB, which affect both short-term and long-term interest rates and the national supply of bank credit. The methods of monetary policytools available to the FRB which may be used to implement monetary policy include:
open-market operations in U.S. governmentGovernment and other securities;
adjustment of the discount rates or cost of bank borrowings from the FRB; and
imposing or changing reserve requirements against bank deposits.deposits;
term auction facilities collateralized by bank loansloans; and
other programs to purchase assets and inject liquidity directly in various segments of the economy.
These methods are used in varying combinations to influence the overall growth or contraction of bank loans, investments and deposits, and the interest rates charged on loans or paid for deposits.
In view of the changing conditions in the economy and the effect of the FRB’s monetary policies, it is difficult to predict future changes in loan demand, deposit levels and interest rates, or their effect on the business and earnings of the Company. FRB monetary policies have had a significant effect on the operating results of commercial banks in the past and are expected to continue to do so in the future.
| ITEM 1A. | RISK FACTORS |
The following list describes several risk factors which are significant to the Company including but not limited to:
The Company has been and could continue to be negatively affected by recent adverse economic conditions.
The United States and many other countries recently faced a severe economic crisis, including a major recession which has not yet been resolved. These adverse economic conditions have negatively affected, and are likely to continue for some time to adversely affect, the Company’s assets, including its loans and securities portfolios, capital levels, results of operations, and financial condition. In response to the economic crisis, the United States and other governments established a variety of programs and policies designed to mitigate the effects of the crisis. These programs and policies appear to have stabilized the severe financial crisis that occurred in the second half of 2008, but the extent to which these programs and policies will assist in an economic recovery or may lead to adverse consequences, whether anticipated or unanticipated, is still unclear. If these programs and policies are ineffective in bringing about an economic recovery or result in substantial adverse developments, the economic conditions may again become more severe, or adverse economic conditions may continue for a substantial period of time. Any increase in the severity or duration of adverse economic conditions or delay in the recovery from them would adversely affect the Company.
Our participation in the CPP and other government programs imposes restrictions and obligations on us that limit our ability to increase dividends, repurchase shares of our stock, and access the equity capital markets.
The Company has chosen to participate in a number of new programs sponsored by the U.S. Government during the current financial and economic crisis. These programs, including without limitation the TARP and its associated CPP, as well as the ARRA and EESA and regulations thereunder, contain important limitations on the Company’s conduct of its business, including limitations on dividends, repurchases of common stock, acquisitions, and executive compensation. These limitations may adversely impact the Company’s ability to attract nongovernmental capital and to recruit and retain executive management and other personnel and its ability to compete with other American and foreign financial institutions. One of these programs, the CPP, contains provisions that allow the U.S. Government to unilaterally modify any term or provision of contracts executed under the program.
Legislative and regulatory actions taken now or in the future may have a significant adverse effect on our operations.
In response to the recent economic crisis, various legislative proposals that would materially restructure the regulatory framework governing the financial services industry have been introduced or are being considered for introduction in Congress. These proposals include, but are not limited to:
the establishment of new regulatory bodies with authority over consumer protection and systemic risk;
the elimination or modification of responsibilities and independence of certain existing regulatory agencies;
the grant of authority to state agencies to enforce state and federal laws against national banks;
the imposition of substantial new fees or taxes on banking organizations or classes of banking organizations;
limitations on the size of banking organizations or the imposition of heightened costs or burdens associated with asset size; and
the introduction of new resolution authority and processes for entities in the financial services industry.
Also in response to the recent economic crisis, bank regulatory agencies and international regulatory consultative bodies have proposed or appear to be considering new regulations and requirements, some of which may be imposed without formal promulgation. These include, but are not limited to:
new capital and liquidity standards imposing higher levels and different mixes of capital and having new liquidity requirements than those contained in current regulations;
new capital planning actions, including stress testing or similar actions and timing expectations for capital-raising;
new and accelerated FDIC insurance premiums;
limitations on the amount and manner of compensation paid to executive officers and employees generally; and
restrictions on the types of products and services offered by banking organizations.
Some of these proposals could adversely affect the Company by, among other things: impacting after tax returns earned by financial services firms in general; limiting the Company’s ability to grow; increasing taxes or fees on some of the Company’s funding or activities; limiting the range of products and services that the Company could offer; exposing the Company to costly litigation and regulatory actions and increasing the cost of regulatory compliance; requiring the Company to raise capital at inopportune times; and making it difficult for the Company to compete with other banking and nonbanking companies to recruit and retain executives and other employees. Others of these proposals may actually favorably impact the Company by affecting some of its competitors more adversely than the Company. The ultimate impact of these proposals cannot be predicted, as it is unclear which, if any, may eventually be enacted into law or regulation.
Economic and other circumstances, including pressure to repay TARP preferred stock, may require us to raise capital at times or in amounts that are unfavorable to the Company.
The Company’s subsidiary banks must maintain certain risk-based and leverage capital ratios as required by their banking regulators and which can change depending upon general economic conditions and their particular condition, risk profile and growth plans. Compliance with capital requirements may limit the Company’s ability to expand and has required, and may require, capital investment from the Parent. In 2008, we issued shares of preferred stock for $1.4 billion and a warrant to purchase shares of the Company’s common stock to the U.S. Treasury under TARP. There may be increasing market, regulatory or political pressure on the Company to raise capital to enable it to repay the preferred stock issued to the U.S. Treasury under TARP at a time or in amounts that may be unfavorable to the Company’s shareholders. These uncertainties and risks created by the legislative and regulatory uncertainties discussed above may themselves increase the Company’s cost of capital and other financing costs.
Negative perceptions associated with our continued participation in the U.S. Treasury’s TARP may adversely affect our ability to retain customers, attract investors, and compete for new business opportunities.
Several financial institutions which also participated in the CPP have repurchased their TARP preferred stock. There can be no assurance as to the timing or manner in which the Company may repurchase its TARP preferred stock from the U.S. Treasury. Our customers, employees and counterparties in our current and future business relationships could draw negative implications regarding the strength of the Company as a financial institution based on our continued participation in the TARP following the exit of one or more of our competitors or other financial institutions. Any such negative perceptions could impair our ability to effectively compete with other financial institutions for business or to retain high performing employees. If this were to occur, our business, financial condition, and results of operations may be adversely affected, perhaps materially.
Credit quality has adversely affected us and may continue to adversely affect us.
Credit risk is one of our most significant risks. The Company’s level of credit quality weakenedcontinued to weaken during 2009 in most loan types and markets in which the latter half of 2007 although it remained relatively strong compared to historical company and industry standards. The deterioration inCompany operates. We expect continued credit quality was mainly relatedweakness over the next few quarters.
Failure to weakness in loans related to residential land acquisition, development and construction in Arizona, California, and Nevada andeffectively manage our interest rate risk could weaken further in 2008. We have not seen any evidence of significant deterioration in other components of our lending portfolio, but worsening economic conditions including further declines in property values could result in deterioration in other components of the portfolio. Economic conditions in the high growth Southwestern geographical areas in which our banks operate have been weakening and continued economic weakness could result in further deterioration of property values that could significantly increase the Company’s credit risk.adversely affect us.
Net interest income is the largest component of the Company’s revenue. The management of interest rate risk for the Company and all bank subsidiaries is centralized and overseen by an Asset Liability Management Committee appointed by the Company’s Board of Directors. The Company has been successful in its interest rate
risk management as evidenced by its achieving a relatively stable net interest rate margin over the last several years when interest rates have been volatile and the rate environment challenging. Factors beyond the Company’s control can significantly influence the interest rate environment and increase the Company’s risk. These factors include competitive pricing pressures for our loans and deposits, adverse shifts in the mix of deposits and other funding sources, and volatile market interest rates subject to general economic conditions and the policespolicies of governmental and regulatory agencies, in particular the FRB.
Our ability to maintain adequate sources of funding and liquidity has been and may continue to be adversely affected by market conditions.
Funding availability, as opposed to funding cost, becameremained a more important risk factor in the latter half of 2007, as what has been describedduring 2009, as a “globalglobal liquidity crisis” affectedcrisis continued to affect financial institutions generally, including the Company. However, the Company was able to take a number of actions during the year to augment its capital and liquidity (See “Capital Management” on page 126 in MD&A and Notes 11, 13 and 14 of the Notes to Consolidated Financial Statements for further information on funding availability). It is expected that liquidity stresses will continue to be a risk factor in 20082010 for the Company, the Parent and its affiliate banks,banks.
The quality and for Lockhart Funding, LLC (“Lockhart”).
Zions Bank sponsors an off-balance sheet qualifying special-purpose entity (“QSPE”), Lockhart, which funds its assets by issuingliquidity of our asset-backed commercial paper. Its assets include AAA-rated securities that are collateralized by small business loans, U.S. Government, agencyinvestment portfolio has adversely affected us and other AA-rated securities. Factors beyond the Company’s control can significantly influence whether Lockhart will remain as an off-balance sheet QSPE and whether the Company will be requiredmay continue to purchase securities and possibly incur losses on the securities from Lockhart under the provisions of a Liquidity Agreement the Company provides to Lockhart. These factors include Lockhart’s inability to issue asset-backed commercial paper, rating agency downgrades of securities, and instability in the credit markets.adversely affect us.
The Company’s on-balance sheet asset-backed securities investment portfolio includes collateralized debt obligations (“CDOs”) collateralized by trust preferred securities issued by banks, insurance companies, and real estate investment trusts (“REITs”) that may have some exposure to construction loan, commercial real estate, and the subprime market.markets and/or to other categories of distressed assets. In addition, asset-backed securities also include structured asset-backed collateralized debt obligations (“ABS CDOs”) (also known as diversified structured finance CDOs) purchased from Lockhart which have minimal exposure to subprime and home equity mortgage securitizations. Factors beyond the Company’s control can significantly influence the fair value of these securities and potential adverse changes to the fair valueimpairment status of these securities. These factors include but are not limited to defaults and deferrals by debt issuers, rating agency downgrades of securities, defaults of collateralized debt issuers, lack of market pricing of securities or the return of market pricing that varies from the Company’s current model valuations, rating agency downgrades of monoline insurers that insure certain asset-backed securities, and continued instability in the credit markets.markets, and changes in prepayment rates and future interest rates. See “Investment Securities Portfolio” on page 7791 for further details.
We have been unprofitable and may continue to be unprofitable, and such lack of profitability could have particular adverse effects on us, such as restricting our ability to pay dividends or requiring a valuation allowance against our deferred tax asset.
The Parent and certain of its subsidiary banks have been unprofitable in each of the most recent five quarters. The ability of banks and bank holding companies to pay dividends is restricted by regulatory requirements, including profitability and the need to maintain required levels of capital. Continuing lack of profitability exposes the Company to the risk that regulators could restrict the ability of our subsidiary banks to pay dividends to the Parent and/or of the Parent to declare and pay dividends on its common stock, preferred stock or trust preferred securities. It also increases the risk that the Company may have to establish a “valuation allowance” against its net deferred tax asset (“DTA”). The Parent and some of its subsidiary banks already have some disallowed DTA for regulatory capital purposes.
We and/or the holders of our securities could be adversely affected by unfavorable rating actions from rating agencies.
Our ability to access the capital markets is important to our overall funding profile. This access is affected by the ratings assigned by rating agencies to us, certain of our affiliates and particular classes of securities that we and our affiliates issue. The interest rates we pay on our securities are also influenced by, among other things, the credit ratings that we, our affiliates, and/or our securities receive from recognized rating agencies. The rating agencies have in the past downgraded our ratings. Further downgrades could increase our costs or otherwise have a negative effect on the market price of our securities, our ability to access capital markets, or our results of operations or financial condition.
We could be adversely affected by accounting, financial reporting, and regulatory and compliance risk.
The Company is exposed to accounting, financial reporting, and regulatory/compliance risk. The Company provides to its customers, and uses for its own capital, funding and risk management needs, a number of complex financial products and services. Estimates, judgments and interpretations of complex and changing accounting and regulatory policies are required in order to provide and account for these products and services. Identification, interpretation and implementation of complex and changing accounting standards as well as compliance with regulatory requirements, therefore pose an ongoing risk.
We could be adversely affected by litigation and legal claims.
The Company is subject to risks associated with legal claims and litigation. The Company’s exposure to claims and litigation has increased and may further increase as a result of stresses on customers, counterparties and others arising from the current economic crisis or otherwise.
We could be adversely affected by failure in our internal controls.
A failure in our internal controls could have a significant negative impact not only on our earnings, but also on the perception that customers, regulators and investors may have of the Company. We continue to devote a significant amount of effort, time and resources to improving our controls and ensuring compliance with complex accounting standards and regulations.
As noted previously, U.S. and international regulators have adopted new capital standards commonly knownWe could be adversely affected as Basel II. These standards would apply to a numberresult of our largest competitors and potentially give them a significant competitive advantage over banks that do not adopt these standards. Sophisticated systems and data are required to adopt Basel II standards; the Company does not yet have these systems and data. While the Company is developing some of the systems, data, and analytical capabilities required to adopt Basel II, adoption is difficult and the Company has not yet decided that it will or can adopt Basel II.acquisitions.
More recently, U.S. banking regulators issued the final rule which requires banks with over $250 billion in consolidated total assets or on-balance sheet foreign exposure of $10 billion (core banks) to adopt the Advanced Approach of Basel II while allowing other banks to elect to “opt in.” We do not currently expect to be an early “opt in” bank holding company. However, our initial analysis indicates that a significant risk of competitive inequity may exist between banks operating under Basel II and those not using Basel II by potentially allowing Basel II banks to operate with lower levels of capital for certain lines of business.
From time to time the Company makes acquisitions.acquisitions including the acquisition of assets and liabilities of failed banks from the FDIC acting as a receiver. The FDIC-supported transactions are subject to loan loss sharing agreements. Failure to comply with the terms of the agreements could result in the loss of indemnification from the FDIC. The success of any acquisition depends, in part, on our ability to realize the projected cost savings from the mergeracquisition and on the continued growth and profitability of the acquisition target. We have been successful with most prior mergers,acquisitions, but it is possible that the merger and integration process with an acquisition target could result in the loss of key employees, disruptions in controls, procedures and policies, or other factors that could affect our ability to realize the projected savings and successfully retain and grow the target’s customer base.
The Company’s Board of Directors has established an Enterprise-WideEnterprise Risk Management policy and has appointed an Enterprise Risk Management Committee in late 2005 to oversee and implement the policy. In addition to credit and interest rate risk, the Committee also monitors the following risk areas: market risk, liquidity risk, operational risk, compliance risk, information technology risk, strategic risk, compensation-related risk, and reputation risk.
| ITEM 1B. | UNRESOLVED STAFF COMMENTS |
None.There are no unresolved written comments that were received from the SEC’s staff 180 days or more before the end of the Company’s fiscal year relating to our periodic or current reports filed under the Securities Exchange Act of 1934.
| ITEM 2. | PROPERTIES |
At December 31, 2007,2009, the Company operated 508491 domestic branches, of which 263283 are owned and 245208 are leased premises.leased. The Company also leases its headquarterheadquarters offices in Salt Lake City, Utah. Other operations facilities are either owned or leased. The annual rentals under long-term leases for leased premises are determined under various formulas and factors, including operating costs, maintenance, and taxes. For additional information regarding leases and rental payments, see Note 18 of the Notes to Consolidated Financial Statements.
| ITEM 3. | LEGAL PROCEEDINGS |
The information contained in Note 18 of the Notes to Consolidated Financial Statements is incorporated by reference herein.
None.
| ITEM 5. | MARKET FOR |
MARKET INFORMATION
The Company’s common stock is traded on the Nasdaq Global Select Market under the symbol “ZION.” The last reported sale price of the common stock on Nasdaq on February 15, 200816, 2010 was $51.80$18.26 per share.
The following table sets forth, for the periods indicated, the high and low sale prices of the Company’s common stock, as quoted on Nasdaq:
| 2007 | 2006 | ||||||||||||||||||
| High | Low | High | Low | 2009 | 2008 | ||||||||||||||
| High | Low | High | Low | ||||||||||||||||
1st Quarter | $ | 88.56 | 81.18 | 85.25 | 75.13 | $ | 25.52 | 5.90 | 57.05 | 39.31 | |||||||||
2nd Quarter | 86.00 | 76.59 | 84.18 | 76.28 | 20.97 | 8.88 | 51.15 | 29.46 | |||||||||||
3rd Quarter | 81.43 | 67.51 | 84.09 | 75.25 | 20.36 | 10.25 | 107.21 | 1 | 17.53 | ||||||||||
4th Quarter | 73.00 | 45.70 | 83.15 | 77.37 | 19.03 | 12.50 | 47.94 | 21.07 | |||||||||||
| 1 | This trading price was an anomaly resulting from electronic orders at the opening of the market on September 19, 2008 in response to the SEC’s announcement (prior to the market opening that day) of its temporary emergency action suspending short selling in financial companies. The closing price on September 19, 2008 was $52.83. |
During 2009 the Company issued $472.7 million of new common stock consisting of 31,741,425 shares at an average price of $14.89 per share. Net of issuance costs and fees, the issuances added $464.1 million to common stock.
As of February 15, 2008,16, 2010, there were 6,4376,303 holders of record of the Company’s common stock.
EQUITY CAPITAL AND DIVIDENDS
We have 3,000,000 authorized shares of preferred stock without par value and with a liquidation preference of $1,000 per share. As of December 31, 2009, 67,952, 110,388, and 1,400,000 of preferred shares series A, C, and D, respectively, have been issued and are outstanding. In addition, holders of $1.1 billion of the Company’s subordinated debt have the right to convert that debt into either Series A or C preferred stock, and that therefore the Company has reserved for possible future issuance approximately 1.1 million shares of authorized preferred stock. In general, preferred shareholders may receive asset distributions before common shareholders; however, preferred shareholders have only limited voting rights generally with respect to certain provisions of the preferred stock, the issuance of senior preferred stock, and the election of directors. Preferred stock dividends reduce earnings available to common shareholders and are paid quarterly in arrears. The redemption amount is computed at the per share liquidation preference plus any declared but unpaid dividends. The series A and C shares are registered with the SEC.
The Series D Fixed-Rate Cumulative Perpetual Preferred Stock was issued on November 14, 2008 to the U.S. Department of the Treasury for $1.4 billion in a private placement exempt from registration. The EESA authorized the U.S. Treasury to provide funds to eligible financial institutions participating in the TARP Capital Purchase Program. The capital investment includes the issuance of preferred shares of the Company and a warrant to purchase common shares pursuant to a Letter Agreement and a Securities Purchase agreement (collectively “the Agreement”). The preferred shares are rankedpari passu with the Series A and C preferred shares. The dividend rate of 5% increases to 9% after the first five years. Dividend payments are made on the 15th day of February, May, August, and November. The warrant allows the U.S. Treasury to purchase up to 5,789,909 shares of the Company’s common stock exercisable over a 10-year period at a price per share of $36.27. The
preferred shares and the warrant qualify for Tier 1 regulatory capital. The Agreement subjects the Company to certain restrictions and conditions including those related to common dividends, share repurchases, executive compensation, and corporate governance.
We recorded the total $1.4 billion of the preferred shares and the warrant at their relative fair values of $1,292.2 million and $107.8 million, respectively. The difference from the par amount of the preferred shares is accreted to preferred stock over five years using the interest method with a corresponding adjustment to preferred dividends.
The frequency and amount of common stock dividends paid during the last two years are as follows:
| 1st Quarter | 2nd Quarter | 3rd Quarter | 4th Quarter | ||||||
2007 | $ | 0.39 | 0.43 | 0.43 | 0.43 | ||||
2006 | 0.36 | 0.36 | 0.36 | 0.39 | |||||
| 1st Quarter | 2nd Quarter | 3rd Quarter | 4th Quarter | ||||||
2009 | $ | 0.04 | 0.04 | 0.01 | 0.01 | ||||
2008 | 0.43 | 0.43 | 0.43 | 0.32 | |||||
OnIn January 24, 2008,2010, the Company’s Board of Directors approved a dividend of $0.43$0.01 per common share payable on February 20, 200824, 2010 to shareholders of record on February 6, 2008.10, 2010. The Company expects to continue its policy of paying regular cash dividends on a quarterly basis, although there is no assurance as to future dividends because they depend on future earnings, capital requirements, and financial condition.
In December 2006, we issued 240,000 shares of our Series A Floating-Rate Non-Cumulative Perpetual Preferred Stock with an aggregate liquidation preference of $240 million, or $1,000The Company cannot increase the common stock dividend above $0.32 per share. The preferred stock was offered inshare without the form of 9,600,000 depositary shares with each depositary share representing a 1/40th ownership interest in a shareconsent of the preferred stock. In general, preferred shareholders are entitled to receive asset distributions before common shareholders; however, preferred shareholders have no preemptive or conversion rights, and only limited voting rights pertaining generally to amendments toU.S. Treasury until the termsthird anniversary of the preferred stockdate of the investment, or November 14, 2011, unless prior to such third anniversary the issuance of senior preferred stock as well asseries D is redeemed in whole or the right to elect two directors inU.S. Treasury has transferred all of the event of certain defaults. Thesenior preferred stock is not redeemable priorseries D to December 15, 2011, but will be redeemable subsequent to that date at the Company’s option at the liquidation preference value plus any declared but unpaid dividends. The preferred stock dividend reduces earnings available to common shareholders and is computed at an annual rate equal to the greater of three-month LIBOR plus 0.52%, or 4.0%. Dividend payments are made quarterly in arrears on the 15th day of March, June, September, and December.third parties.
SECURITIES AUTHORIZED FOR ISSUANCE UNDER EQUITY COMPENSATION PLANS
The information contained in Item 12 of this Form 10-K is incorporated by reference herein.
SHARE REPURCHASES
The following table summarizes the Company’s share repurchases for the fourth quarter of 2007:2009:
Period | Total number of shares repurchased(1) | Average price paid per share | Total number of shares purchased as part of publicly announced plans or programs | Approximate dollar value of shares that may yet be purchased under the plan(2) | Total number of shares repurchased1 | Average price paid per share | Total number of shares purchased as part of publicly announced plans or programs | Approximate dollar value of shares that may yet be purchased under the plan | ||||||||||||
October | 490 | $ | 66.76 | – | $ | 56,250,315 | 341 | $ | 16.85 | – | $ | 56,250,315 | ||||||||
November | 229 | 50.71 | – | 56,250,315 | 404 | 13.11 | – | 56,250,315 | ||||||||||||
December | 143 | 48.22 | – | 56,250,315 | 8,944 | 13.12 | – | 56,250,315 | ||||||||||||
Fourth quarter | 862 | 59.42 | – | 9,689 | 13.25 | – | ||||||||||||||
All share repurchases |
The Company has not repurchased any shares under the Common Stock Repurchase Plan since August 16, 2007. It currently does not anticipate making additionalis prohibited from repurchasing any common shares through an authorized share repurchase program by terms of the CPP until the Company’s Series D preferred stock repurchases underhas been fully repaid or the plan during most or all of 2008.U.S. Treasury otherwise ceases to own any such preferred stock.
PERFORMANCE GRAPH
The following stock performance graph compares the five-year cumulative total return of Zions Bancorporation’s common stock with the Standard & Poor’s 500 Index and the KBW50KBW Bank Index which includesinclude Zions Bancorporation. The KBW50KBW Bank Index is a market-capitalization weightedmarket capitalization-weighted bank stock index developed and published by Keefe, Bruyette & Woods, Inc., a nationalnationally recognized brokerage and investment banking firm specializing in bank stocks. The index is composed of 50 of the nation’s largest banking companies.24 geographically diverse stocks representing national money center banks and leading regional financial institutions. The stock performance graph is based upon an initial investment of $100 on December 31, 20022004 and assumes reinvestment of dividends.

| 2004 | 2005 | 2006 | 2007 | 2008 | 2009 | |||||||
Zions Bancorporation | 100.0 | 113.3 | 125.9 | 73.1 | 40.2 | 21.3 | ||||||
KBW Bank Index | 100.0 | 103.2 | 120.7 | 94.5 | 49.8 | 48.9 | ||||||
S&P 500 | 100.0 | 104.9 | 121.4 | 128.1 | 80.8 | 102.1 |
| ITEM 6. | SELECTED FINANCIAL DATA |
FINANCIAL HIGHLIGHTSFinancial Highlights
(In millions, except per share amounts)
| 2007/2006 CHANGE | 2007 | 2006 | 2005 (3) | 2004 | 2003 | 2009/2008 Change | 2009 | 2008 | 2007 | 2006 | 20053 | ||||||||||||||||||||
FOR THE YEAR | ||||||||||||||||||||||||||||||||
For the Year | ||||||||||||||||||||||||||||||||
Net interest income | +7% | $ | 1,882.0 | 1,764.7 | 1,361.4 | 1,160.8 | 1,084.9 | -4 | % | $ | 1,897.5 | 1,971.6 | 1,882.0 | 1,764.7 | 1,361.4 | |||||||||||||||||
Noninterest income | -25% | 412.3 | 551.2 | 436.9 | 431.5 | 500.7 | +322 | % | 804.1 | 190.7 | 412.3 | 551.2 | 436.9 | |||||||||||||||||||
Total revenue | -1% | 2,294.3 | 2,315.9 | 1,798.3 | 1,592.3 | 1,585.6 | +25 | % | 2,701.6 | 2,162.3 | 2,294.3 | 2,315.9 | 1,798.3 | |||||||||||||||||||
Provision for loan losses | +110% | 152.2 | 72.6 | 43.0 | 44.1 | 69.9 | +211 | % | 2,016.9 | 648.3 | 152.2 | 72.6 | 43.0 | |||||||||||||||||||
Noninterest expense | +6% | 1,404.6 | 1,330.4 | 1,012.8 | 923.2 | 893.9 | +13 | % | 1,671.5 | 1,475.0 | 1,404.6 | 1,330.4 | 1,012.8 | |||||||||||||||||||
Impairment loss on goodwill | – | – | – | 0.6 | 0.6 | 75.6 | +80 | % | 636.2 | 353.8 | – | – | 0.6 | |||||||||||||||||||
Income from continuing operations before income taxes and minority interest | -19% | 737.5 | 912.9 | 741.9 | 624.4 | 546.2 | ||||||||||||||||||||||||||
Income taxes | -26% | 235.8 | 318.0 | 263.4 | 220.1 | 213.8 | ||||||||||||||||||||||||||
Minority interest | -32% | 8.0 | 11.8 | (1.6) | (1.7) | (7.2) | ||||||||||||||||||||||||||
Income from continuing operations | -15% | 493.7 | 583.1 | 480.1 | 406.0 | 339.6 | ||||||||||||||||||||||||||
Loss on discontinued operations | – | – | – | – | – | (1.8) | ||||||||||||||||||||||||||
Net income | -15% | 493.7 | 583.1 | 480.1 | 406.0 | 337.8 | ||||||||||||||||||||||||||
Net earnings applicable to common shareholders | -17% | 479.4 | 579.3 | 480.1 | 406.0 | 337.8 | ||||||||||||||||||||||||||
Income (loss) before income taxes | -416 | % | (1,623.0 | ) | (314.8 | ) | 737.5 | 912.9 | 741.9 | |||||||||||||||||||||||
Income taxes (benefit) | -825 | % | (401.3 | ) | (43.4 | ) | 235.8 | 318.0 | 263.4 | |||||||||||||||||||||||
Net income (loss) | -350 | % | (1,221.7 | ) | (271.4 | ) | 501.7 | 594.9 | 478.5 | |||||||||||||||||||||||
Net income (loss) applicable to noncontrolling interests | -10 | % | (5.6 | ) | (5.1 | ) | 8.0 | 11.8 | (1.6 | ) | ||||||||||||||||||||||
Net income (loss) applicable to controlling interest | -357 | % | (1,216.1 | ) | (266.3 | ) | 493.7 | 583.1 | 480.1 | |||||||||||||||||||||||
Net earnings (loss) applicable to common shareholders | -325 | % | (1,234.4 | ) | (290.7 | ) | 479.4 | 579.3 | 480.1 | |||||||||||||||||||||||
PER COMMON SHARE | ||||||||||||||||||||||||||||||||
Earnings from continuing operations – diluted | -18% | 4.42 | 5.36 | 5.16 | 4.47 | 3.74 | ||||||||||||||||||||||||||
Net earnings – diluted | -18% | 4.42 | 5.36 | 5.16 | 4.47 | 3.72 | ||||||||||||||||||||||||||
Net earnings – basic | -18% | 4.47 | 5.46 | 5.27 | 4.53 | 3.75 | ||||||||||||||||||||||||||
Per Common Share | ||||||||||||||||||||||||||||||||
Net earnings (loss) – diluted | -270 | % | (9.92 | ) | (2.68 | ) | 4.40 | 5.35 | 5.16 | |||||||||||||||||||||||
Net earnings (loss) – basic | -270 | % | (9.92 | ) | (2.68 | ) | 4.45 | 5.45 | 5.26 | |||||||||||||||||||||||
Dividends declared | +14% | 1.68 | 1.47 | 1.44 | 1.26 | 1.02 | -94 | % | 0.10 | 1.61 | 1.68 | 1.47 | 1.44 | |||||||||||||||||||
Book value (1) | +6% | 47.17 | 44.48 | 40.30 | 31.06 | 28.27 | ||||||||||||||||||||||||||
Book value1 | -35 | % | 27.85 | 42.65 | 47.17 | 44.48 | 40.30 | |||||||||||||||||||||||||
Market price – end | 46.69 | 82.44 | 75.56 | 68.03 | 61.34 | 12.83 | 24.51 | 46.69 | 82.44 | 75.56 | ||||||||||||||||||||||
Market price – high | 88.56 | 85.25 | 77.67 | 69.29 | 63.86 | |||||||||||||||||||||||||||
Market price – high2 | 25.52 | 57.05 | 88.56 | 85.25 | 77.67 | |||||||||||||||||||||||||||
Market price – low | 45.70 | 75.13 | 63.33 | 54.08 | 39.31 | 5.90 | 17.53 | 45.70 | 75.13 | 63.33 | ||||||||||||||||||||||
AT YEAR-END | ||||||||||||||||||||||||||||||||
At Year-End | ||||||||||||||||||||||||||||||||
Assets | +13% | 52,947 | 46,970 | 42,780 | 31,470 | 28,558 | -7 | % | 51,123 | 55,093 | 52,947 | 46,970 | 42,780 | |||||||||||||||||||
Net loans and leases | +13% | 39,088 | 34,668 | 30,127 | 22,627 | 19,920 | -4 | % | 40,189 | 41,659 | 38,880 | 34,415 | 29,871 | |||||||||||||||||||
Sold loans being serviced (2) | -27% | 1,885 | 2,586 | 3,383 | 3,066 | 2,782 | ||||||||||||||||||||||||||
Deposits | +6% | 36,923 | 34,982 | 32,642 | 23,292 | 20,897 | +1 | % | 41,841 | 41,316 | 36,923 | 34,982 | 32,642 | |||||||||||||||||||
Long-term borrowings | +4% | 2,591 | 2,495 | 2,746 | 1,919 | 1,843 | -22 | % | 2,033 | 2,622 | 2,591 | 2,495 | 2,746 | |||||||||||||||||||
Shareholders’ equity | +6% | 5,293 | 4,987 | 4,237 | 2,790 | 2,540 | ||||||||||||||||||||||||||
Shareholders’ equity: | ||||||||||||||||||||||||||||||||
Preferred equity | -5 | % | 1,503 | 1,582 | 240 | 240 | – | |||||||||||||||||||||||||
Common equity | -15 | % | 4,190 | 4,920 | 5,053 | 4,747 | 4,237 | |||||||||||||||||||||||||
Noncontrolling interests | -37 | % | 17 | 27 | 31 | 43 | 28 | |||||||||||||||||||||||||
PERFORMANCE RATIOS | ||||||||||||||||||||||||||||||||
Performance Ratios | ||||||||||||||||||||||||||||||||
Return on average assets | 1.01% | 1.32% | 1.43% | 1.31% | 1.20% | (2.25 | )% | (0.50 | )% | 1.01 | % | 1.32 | % | 1.43 | % | |||||||||||||||||
Return on average common equity | 9.57% | 12.89% | 15.86% | 15.27% | 13.69% | (28.35 | )% | (5.69 | )% | 9.57 | % | 12.89 | % | 15.86 | % | |||||||||||||||||
Efficiency ratio | 60.53% | 56.85% | 55.67% | 57.22% | 55.65% | 61.34 | % | 67.47 | % | 60.53 | % | 56.85 | % | 55.67 | % | |||||||||||||||||
Net interest margin | 4.43% | 4.63% | 4.58% | 4.27% | 4.41% | 3.94 | % | 4.18 | % | 4.43 | % | 4.63 | % | 4.58 | % | |||||||||||||||||
CAPITAL RATIOS(1) | ||||||||||||||||||||||||||||||||
Capital Ratios1 | ||||||||||||||||||||||||||||||||
Equity to assets | 10.00% | 10.62% | 9.90% | 8.87% | 8.89% | 11.17 | % | 11.85 | % | 10.06 | % | 10.71 | % | 9.97 | % | |||||||||||||||||
Tier 1 leverage | 7.37% | 7.86% | 8.16% | 8.31% | 8.06% | 10.38 | % | 9.99 | % | 7.37 | % | 7.86 | % | 8.16 | % | |||||||||||||||||
Tier 1 risk-based capital | 7.57% | 7.98% | 7.52% | 9.35% | 9.42% | 10.53 | % | 10.22 | % | 7.57 | % | 7.98 | % | 7.52 | % | |||||||||||||||||
Total risk-based capital | 11.68% | 12.29% | 12.23% | 14.05% | 13.52% | 13.28 | % | 14.32 | % | 11.68 | % | 12.29 | % | 12.23 | % | |||||||||||||||||
Tangible common equity | 6.12 | % | 5.89 | % | 5.70 | % | 5.98 | % | 5.28 | % | ||||||||||||||||||||||
Tangible equity | 6.17% | 6.51% | 5.28% | 6.80% | 6.53% | 9.16 | % | 8.91 | % | 6.23 | % | 6.61 | % | 5.35 | % | |||||||||||||||||
SELECTED INFORMATION | ||||||||||||||||||||||||||||||||
Selected Information | ||||||||||||||||||||||||||||||||
Average common and common-equivalent | 108,523 | 108,028 | 92,994 | 90,882 | 90,734 | 124,443 | 108,908 | 108,408 | 107,957 | 92,994 | ||||||||||||||||||||||
Common dividend payout ratio | 37.82% | 27.10% | 27.14% | 28.23% | 27.20% | na | na | 37.82 | % | 27.10 | % | 27.14 | % | |||||||||||||||||||
Full-time equivalent employees | 10,933 | 10,618 | 10,102 | 8,026 | 7,896 | 10,529 | 11,011 | 10,933 | 10,618 | 10,102 | ||||||||||||||||||||||
Commercial banking offices | 508 | 470 | 473 | 386 | 412 | 491 | 513 | 508 | 470 | 473 | ||||||||||||||||||||||
ATMs | 627 | 578 | 600 | 475 | 553 | 602 | 625 | 627 | 578 | 600 | ||||||||||||||||||||||
At year-end. |
The actual high price for 2008 was $107.21. However, this trading price was an anomaly resulting from electronic orders at the |
Amounts for 2005 include Amegy Corporation at December 31, 2005 and for the month of December 2005. Amegy was acquired on December 3, 2005. |
| ITEM 7. | MANAGEMENT’S DISCUSSION AND ANALYSIS OF FINANCIAL CONDITION AND RESULTS OF OPERATIONS |
MANAGEMENT’S DISCUSSION AND ANALYSIS
EXECUTIVE SUMMARY
Company Overview
Zions Bancorporation (“the Parent”) and subsidiaries (collectively “the Company,” “Zions,” “we,” “our,” “us”) together comprise a $53$51 billion financial holding company headquartered in Salt Lake City, Utah. TheAs of September 30, 2009, the Company iswas the twenty-third17th largest domestic bank holding company in terms of deposits, operatingdeposits. At December 31, 2009, the Company operated banking businesses through 508491 domestic branches and 627602 ATMs in ten Western and Southwestern states: Arizona, California, Colorado, Idaho, Nevada, New Mexico, Oregon, Texas, Utah, and Washington. Our banking businesses include: Zions First National Bank (“Zions Bank”), in Utah and Idaho; California Bank & Trust (“CB&T”); Amegy Corporation (“Amegy”) and its subsidiary, Amegy Bank, in Texas; National Bank of Arizona (“NBA”); Nevada State Bank (“NSB”); Vectra Bank Colorado (“Vectra”), in Colorado and New Mexico; The Commerce Bank of Washington (“TCBW”); and The Commerce Bank of Oregon (“TCBO”).
The Company also operates a number ofseveral specialty financial services and financial technology businesses that conduct business on a regional or national scale. The Company is a national leader in Small Business Administration (“SBA”) lending, public finance advisory services, and software sales and cash management services related to “Check 21 Act” electronic imaging and clearing of checks. In addition, Zions is included in the Standard and Poor’s 500 (“S&P 500500”) and NASDAQ Financial 100 indices.
In operating its banking businesses, the Company seeks to combine the front office or customer facing advantages that it believes can result from decentralized organization and branding, with those that can come from centralized risk management, capital management and operations. In its specialty financial services and technology businesses, the Company seeks to develop a competitive advantage in a particular product, customer, or technology niche.
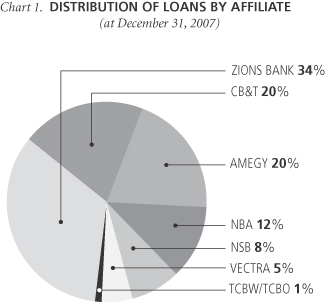
Banking BusinessesDistribution of Loans and Deposits
As shown in Charts 1 and 2 the Company’s loans and core deposits are widely diversified among the banking franchises the Company operates.


Note: Core deposits are defined as total deposits excluding
brokered deposits and time deposits $100,000 and over.


Business Strategies
We believe that the Company distinguishes itself by having a long-term strategy for growth in its banking businesses that is unique for a bank holding company of its size. This growth strategy is driven by four key factors: (1) focus on high growth markets; (2) keep decisions that affect customers local; (3) centralize technology and operations to achieve economies of scale; and (4) centralize and standardize policies and management controlling key risks.
These strategies are more fully set forth as follows:Focus on High Growth Markets
Each of the states in which the Company conducts its banking businesses has experienced relatively high levels of historical economic growth and each ranks among the top one-third of states as ranked by population and household income growth projected by the U.S. Census Bureau. Despite slowdowns in population,weaker employment and key indicators of economic growth in some of these markets in 2007,2009, which is expected tomay persist through much of 2008,2010, the Company believes that over the medium to longer term all of these markets will continue to be among the fastest growing in the country.
SCHEDULE
Schedule 1
DEMOGRAPHIC PROFILE
BY STATE
DEMOGRAPHIC PROFILE
BY STATE
(Dollar amounts in
| Number of branches 12/31/2007 | Deposits at 12/31/2007(1) | Percent of Zions’ deposit base | Estimated 2007 total population(2) | Estimated population % change 2000-2007(2) | Projected population % change 2007-2012(2) | Estimated median household income 2007(2) | Estimated household income % change 2000-2007(2) | Projected household income % change 2007-2012(2) | Number of branches 12/31/2009 | Deposits at 12/31/20091 | Percent of Zions’ deposit base | Estimated 2009 total population2 | Estimated population % change 2000-20092 | Projected population % change 2009-20142 | Estimated median household income 20092 | Estimated household income % change 2000-20092 | Projected household income % change 2009-20142 | |||||||||||||||||||||||||||
Utah | 114 | $ | 10,674,230 | 28.91% | 2,610,198 | 16.88% | 12.02% | $ | 58.4 | 27.70% | 18.39% | 103 | $ | 12,514,145 | 29.91 | % | 2,748,395 | 23.07 | % | 11.17 | % | $ | 60.3 | 31.88 | % | 4.29 | % | ||||||||||||||||||
California | 90 | 8,081,319 | 21.89 | 37,483,448 | 10.66 | 6.75 | 60.3 | 26.55 | 16.59 | 106 | 9,329,215 | 22.30 | 37,933,734 | 11.99 | 5.14 | 61.6 | 29.38 | 4.02 | |||||||||||||||||||||||||||
Texas | 87 | 8,057,997 | 21.82 | 23,986,432 | 15.03 | 9.89 | 51.1 | 27.96 | 18.02 | 82 | 8,880,228 | 21.22 | 24,896,267 | 19.40 | 9.25 | 52.4 | 31.19 | 4.03 | |||||||||||||||||||||||||||
Arizona | 76 | 3,851,422 | 10.43 | 6,363,799 | 24.04 | 16.96 | 53.3 | 31.34 | 21.43 | 76 | 3,784,170 | 9.04 | 6,664,707 | 29.90 | 12.84 | 55.3 | 36.21 | 5.46 | |||||||||||||||||||||||||||
Nevada | 74 | 3,279,288 | 8.88 | 2,645,277 | 32.38 | 19.90 | 56.3 | 26.21 | 17.07 | 58 | 3,523,708 | 8.42 | 2,746,331 | 37.44 | 14.61 | 58.1 | 30.29 | 4.63 | |||||||||||||||||||||||||||
Colorado | 40 | 1,697,382 | 4.60 | 4,883,413 | 13.53 | 8.53 | 61.0 | 29.01 | 19.49 | 37 | 1,964,909 | 4.70 | 5,026,916 | 16.87 | 7.75 | 62.6 | 32.44 | 5.14 | |||||||||||||||||||||||||||
Idaho | 24 | 633,515 | 1.72 | 1,513,708 | 16.98 | 11.98 | 48.5 | 28.57 | 19.71 | 26 | 1,125,416 | 2.69 | 1,562,163 | 20.73 | 9.61 | 50.4 | 33.54 | 5.22 | |||||||||||||||||||||||||||
Washington | 1 | 599,864 | 1.62 | 6,516,384 | 10.56 | 7.05 | 59.1 | 29.04 | 18.91 | 1 | 631,803 | 1.51 | 6,691,182 | 13.52 | 6.39 | 60.9 | 32.95 | 4.78 | |||||||||||||||||||||||||||
New Mexico | 1 | 24,248 | 0.07 | 1,993,495 | 9.59 | 6.90 | 43.4 | 26.95 | 17.76 | 1 | 40,088 | 0.10 | 2,058,296 | 13.15 | 6.30 | 44.7 | 30.76 | 4.84 | |||||||||||||||||||||||||||
Oregon | 1 | 23,488 | 0.06 | 3,752,734 | 9.69 | 6.72 | 51.7 | 26.35 | 17.86 | 1 | 46,907 | 0.11 | 3,841,859 | 12.29 | 5.81 | 53.5 | 30.62 | 4.01 | |||||||||||||||||||||||||||
Zions’ weighted average | 14.95 | 9.82 | 61.3 | 30.10 | 19.41 | 16.83 | 7.58 | 57.7 | 31.00 | 4.30 | |||||||||||||||||||||||||||||||||||
Aggregate national | 306,348,230 | 8.86 | 6.26 | 53.2 | 26.06 | 17.59 | 309,731,508 | 10.06 | 4.63 | 54.7 | 29.78 | 4.06 | |||||||||||||||||||||||||||||||||
Excludes intercompany deposits. |
Data Source: SNL Financial Database |
The Company seeks to grow both organically and through acquisitions in these banking markets. Within each of the states where the Company operates, we focus on the market segments that we believe present the best opportunities for us. We believe that these states over time have experienced higher rates of growth, business formation, and expansion than other states. We also believe that over the long term these states will continue to experience higher rates of commercial real estate development as businesses provide housing, shopping, business facilities and other amenities for their growing populations. As a result, aHowever, in the near term growth in many of our geographies and market segments has slowed markedly due to weakening economic conditions and loan demand. We have recently experienced net portfolio shrinkage in distressed real estate markets in the Southwest.
A common focus of all of Zions’ subsidiary banks is small and middle market business banking (including the personal banking needs of the executives and employees of those businesses) and commercial real estate development. In many cases, the Company’s relationship with its customers is primarily driven by the goal to satisfy their needs for credit to finance their expanding business opportunities. In addition to our commercial business, we also provide a broad base of consumer financial products in selected markets, including home mortgages, home equity credit lines, auto loans, and credit cards. This mix of business often leads to loan balances growing faster than internally generated deposits; this was particularly true in much of 20072008 as loan growth significantly outpaced low cost core deposit growth. In addition, it has important implications for the Company’s management of certain risks, including interest rate and liquidity risks, which are discussed further in later sections of this document.
Keep Decisions That Affect Customers Local
The Company operates eight different community/regional banks, each under a different name, and each with its own charter, chief executive officer and management team. This structure helps to ensure that decisions related to customers are made at a local level. In addition, each bank controls, among other things, most decisions related to its branding, market strategies, customer relationships, product pricing, and credit decisions (within the limits of established corporate policy). In this way we are able to differentiate our banks from much larger, “mass market” banking competitors that operate regional or national franchises under a common brand and often around “vertical” product silos. We believe that this approach allows us to attract and retain exceptional
management, and that it also results in providing service of the highest quality to our targeted customers. In addition, we believe that over time this strategy generates superior growth in our banking businesses.
Centralize Technology and Operations to Achieve Economies of Scale
We seek to differentiate the Company from smaller banks in two ways. First, we use the combined scale of all of the banking operations to create a broad product offering without the fragmentation of systems and operations that would typically drive up costs. Second, for certain products for which economies of scale are believed to be important, the Company “manufactures” the product centrally or outsources it from a third party. Examples include cash management, credit card administration, mortgage servicing, and deposit operations. In this way the Company seeks to create and maintain efficiencies while generating superior growth.
Centralize and Standardize Policies and Management Controlling Key Risks
We seek to standardize policies and practices related to the management of key risks in order to assure a consistent risk profile in an otherwise decentralized management model. Among these key risks and functions are credit, interest rate, liquidity, and market risks. Although credit decisions are made locally within each affiliate bank, these decisions are made within the framework of a corporate credit policy that is standard among all of our affiliate banks. Each bank may amend the policy in a more conservative direction; however, it may not amend the policy in a more liberal direction. In that case, it must request a specific waiver from the Company’s Chief Credit Officer; in practice only a limited number of waivers have been granted. Similarly, the Credit Examination function is a corporate activity, reporting to the Credit Review Committee of the Board of Directors, and administratively reporting to the Director of Enterprise Risk Management, who reports to the Company’s CEO. This assures a reasonable consistency of loan quality grading and loan loss reserving practices among all affiliate banks.
Interest rate risk management, liquidity and market risk, and portfolio investments also are managed centrally by a Board-designated Asset Liability Management Committee pursuant to corporate policies regarding interest rate risk, liquidity, investments and derivatives.
Internal Audit also is a centralized, corporate function reporting to the Audit Committee of the Board of Directors, and administratively reporting to the Director of Enterprise Risk Management, who reports to the Company’s CEO.
Finally, the Board established an Enterprise Risk Management Committee in late 2005, which is supported by the Director of Enterprise Risk Management. This Committee seeks to monitor and mitigate as appropriate these and other key operating and strategic risks throughout the Company.
While these long-term strategies have not changed, the severe economic recession that unfolded in 2009 following the financial crises of 2007-2008 meant that of necessity much of management’s focus in 2009 was on guiding the Company successfully through these severely adverse conditions, as described further below.
MANAGEMENT’S OVERVIEW OF 20072009 PERFORMANCE
The Company’s primary or “core” business consists of providing communityfinancial crisis and regional banking services to both individuals and businesses in ten Western and Southwestern states. We believeeconomic recession that this core banking business performed well in many markets during 2007, but came under considerable stressbecame severe in the secondfall of 2008, with the collapse of Lehman Brothers and the de facto government takeovers of Fannie Mae, Freddie Mac, and American International Group, Inc. continued and deepened in 2009. Capital and financing markets for banks were effectively limited in the last third of 2008, and access remained limited through the first quarter of 2009.
As this crisis unfolded and became more severe, the Federal Reserve Board (“FRB”) and later the U.S. Treasury took a series of increasingly strong and less conventional actions to try to mitigate the crisis. Starting in mid-2007, the FRB aggressively lowered short term interest rates; after a brief pause in mid-2008, this aggressive reduction resumed and left the target Fed Funds rate at an all-time low of 0-0.25% at year-end 2008 through 2009. In 2008 the FRB introduced a number of programs to directly provide greater liquidity to a financial
system under severe stress. In 2009 the FRB added additional programs to stabilize and provide liquidity to financial markets. It was particularly active in directly purchasing over $1 trillion of mortgage-backed securities. At the same time, however, other temporary supports put into place began to be withdrawn in the latter half of the year as residential housing markets deteriorated significantly, particularly in Arizona, California and Nevada. This deterioration adversely affected the Company’s residential land acquisition, development and construction related business; its loans to these business activities in these markets comprise approximately six percent of the Company’s total loan portfolio.
Despite credit quality deterioration and the virtual cessation of net organic loan growth in our banks in these three states, the Company experienced strong loan growth of 12.8%. Most of our growth in 2007 was organic. However, on January 17, 2007, we also acquired Stockmen’s Bancorp, Inc. (“Stockmen’s”), a bank holding company with $1.2 billion in assets headquartered in Kingman, Arizona. Stockmen’s parent company was merged into the Parent and Stockmen’s banking subsidiary was merged into our NBA affiliate bank. On November 2, 2007, the Company sold 11 Stockmen’s branches located in California which included $169 million of loans and $190 million of deposits. During the year, the Company explored other acquisition opportunities throughout its current geographical area markets, but only completed the Stockmen’s acquisition and the acquisition of Intercontinental Bank Shares Corporation, (“Intercon”) in Texas with $115 million in assets. Through2009. In the first half of 2009, the year,government required nineteen of the largest financial institutions to undergo a government-directed “stress test” to determine whether they had sufficient capital to withstand severe losses. After this test, several of these institutions repaid the Capital Purchase Program preferred stock investment made in 2008 by the U.S. Treasury, after raising significant amounts of capital. This had the effect of reopening to some extent the capital markets to financial institutions. The Company generally found thattook advantage of these slowly improving market conditions to raise various forms of capital and term financing at various times throughout the prices being sought by potential sellers were too highremainder of 2009.
The increased level of FDIC deposit insurance to allow$250,000, first established in October 2008, remains in effect. In addition, the CompanyFDIC’s program to create significant valueprovide full deposit insurance coverage for its shareholdersnoninterest-bearing transaction deposit accounts was extended through bank acquisitions. Later, as someJune 30, 2010, unless insured banks elect to opt out of its key markets weakened, the program. The Company did not pursue certain opportunities becauseopt out of this program.
The crisis and ensuing severe economic recession adversely impacted the Company’s performance and management focused a great deal of attention on managing the impact of the difficultycrisis. Key impacts included, among other things, restricted access to capital and funding markets, higher cost of capital and funding, investor and regulatory pressure to maintain strong capital levels, deteriorating credit quality which resulted in quantifying potential risksrising levels of loan losses and provision for loan losses, deteriorating values and other than temporary impairment charges related to the Company’s investment securities portfolio, and impairment of goodwill related to the acquisition of Amegy Bank in 2005.
Collectively, these factors had a rapidly changing banking environment. The Company believes that current economic stresses affecting a number of banking companies may result in more potential acquisition opportunities at more reasonable prices later in 2008 and beyond, but this cannot be assured.
significant adverse impact on the Company’s performance. The Company reported a net loss applicable to common shareholders for 2009 of $1,234.4 million or $9.92 per diluted common share as compared to a net loss of $290.7 million or $2.68 per diluted common share for 2008. This compares with net earnings for 2007applicable to common shareholders of $479.4 million or $4.42 per diluted common share. This compares with $579.3 million or $5.36$4.40 per diluted share for 2006 and $480.1 million or $5.16 per share for 2005.2007. Return on average common equity was 9.57%(28.35)% and return on average assets was (2.25)% in 2009, compared with (5.69)% and (0.50)% in 2008 and 9.57% and 1.01% in 2007, compared with 12.89% and 1.32% in 2006 and 15.86% and 1.43% in 2005.2007.
The key drivers of the Company’s performance during 20072009 were as follows:
Schedule 2
SCHEDULE 2
KEY DRIVERS OF PERFORMANCE
20072009 COMPARED TO 20062008
Driver | 2007 | 2006 | Change | ||||
| (in billions) | |||||||
Average net loans and leases | $ | 36.8 | 32.4 | 14% | |||
Average total noninterest-bearing deposits | 9.4 | 9.5 | -1% | ||||
Average total deposits | 35.8 | 32.8 | 9% | ||||
| (in millions) | |||||||
Net interest income | $ | 1,882.0 | 1,764.7 | 7% | |||
Provision for loan losses | 152.2 | 72.6 | 110% | ||||
Impairment and valuation losses on securities | 158.2 | – | |||||
Average Lockhart-related assets held on the balance sheet (1) | 253.3 | – | |||||
Net interest margin | 4.43% | 4.63% | -20bp | ||||
Ratio of nonperforming assets to net loans and leases and other real estate owned | 0.73% | 0.24% | 49bp | ||||
Efficiency ratio | 60.53% | 56.85% | 368bp | ||||
Driver | 2009 | 2008 | Change better/(worse) | |||||||
| (In billions) | ||||||||||
Average net loans and leases | $ | 41.5 | 40.8 | 2 | % | |||||
Average total noninterest-bearing deposits | 11.1 | 9.1 | 22 | % | ||||||
Average total deposits | 42.8 | 37.6 | 14 | % | ||||||
| (In millions) | ||||||||||
Net interest income | $ | 1,897.5 | 1,971.6 | (4 | )% | |||||
Provision for loan losses | (2,016.9 | ) | (648.3 | ) | (211 | )% | ||||
Net impairment and valuation losses on securities | (492.6 | ) | (317.1 | ) | (55 | )% | ||||
Impairment loss on goodwill | (636.2 | ) | (353.8 | ) | (80 | )% | ||||
Net interest margin | 3.94 | % | 4.18 | % | (24 | )bp | ||||
Ratio of nonperforming assets, excluding FDIC-supported assets, to net loans and leases and other real estate owned | 6.00 | % | 2.71 | % | (329 | )bp | ||||
Efficiency ratio | 61.34 | % | 67.47 | % | 613 | bp | ||||
| (In billions) | ||||||||||
Total Tier 1 regulatory capital raised* | $ | 1.06 | 0.29 | 266 | % | |||||
| (In millions of shares) | ||||||||||
Total net common shares issued | 35.1 | 8.2 | 328 | % | ||||||
As illustrated bybp – basis points
* Excludes the previous schedule, theimpact of TARP preferred stock
The Company’s earnings growthperformance in 20072009 compared to 20062008 reflected the following:
Strong organicWeak internal loan growth;growth in the latter half of 2008 became actual loan portfolio run-off in 2009 as loan demand continued to weaken during the national recession. The Company’s growing loan charge-offs were a further drag on net loan balances.
Additional unplanned balance sheetStrong deposit growth, resulting fromparticularly of noninterest-bearing deposits, which resulted in significant excess reserves kept with the purchase of Lockhart Funding, LLC (“Lockhart”) commercial paper and securities in response to deteriorating liquidity conditions in the global asset-backed commercial paper market;Federal Reserve Bank.
Lagging organic deposit growth, particularly the lack of noninterest-bearing deposit growth, resulting in a greater dependence on market rate funds;
NetStrengthening net interest margin deteriorationduring the first half of the year, due to higher spreads on new loans and lower funding costs, followed by a reduced net interest margin in the latter half of the year, mainly due to funding strong loan growth with more expensive funding,year. This resulted largely from the addition of lower net interest spread Lockhart commercial paper to the balance sheet, and pricing pressure on deposits in a difficult liquidity environment experienced by mostamortization of the domestic financial system;increased debt discounts resulting from the Company’s modification of over $1 billion of subordinated debt in June 2009.
An increased provisionIncreased nonperforming loans and other assets, loan losses and provisions for loan losses stemming mainly from continued credit-quality deteriorationdeterioration. While most loan losses occurred in our Southwestern residential land acquisition, development and construction lending portfolios;portfolios, credit quality weakened more broadly in other loan types and geographic markets as the recession became severe and national in scope.
Significant net impairment chargesand valuation losses on the Company’s available-for-saleinvestment securities, deemed “other-than-temporarily impaired”primarily its portfolio of bank trust preferred CDOs, as the number of failed banks and valuation losses associated withbanks deferring payment on trust preferred securities purchasedgrew throughout the year.
Goodwill impairment charges resulting from Lockhart pursuantthe Company’s determination during the first quarter that approximately 51% of the goodwill at Amegy was impaired. This accounted for over 99% of the total $636 million during the year.
Significant additions to the Liquidity Agreement between LockhartCompany’s capital base and Zions Bank.
We continue to focus on four primary objectives to drive our business success: 1) organic loan and deposit growth, 2) maintaining credit quality at high levels, 3) managing interest rate risk, and 4) controlling expenses. However in 2007, results were significantly
and adversely impacted by the effects of the housing market, subprime mortgage and globalfinancial liquidity crisis on the Company. This affected both the cost and availability of funding to the Company and its sponsored off-balance sheet entity, Lockhart, as well as the values ofthrough a number of securities held bydifferent actions including nonoperating gains from capital actions and acquisition related gains. While these actions significantly strengthened the Company, for investment.they resulted in meaningful dilution of existing shareholder’s interests and a drag on future earnings from increased interest expense.
Organic Loan and Deposit Growth
Since 2003,From 2005 through 2008, the Company has experienced steady and strong loan growth and moderate deposit growth, augmented in 2005 and 2006 by the Amegy acquisition, and in 2007 by the Stockmen’s acquisition. Through most of this period,acquisition, and in 2008 by the Silver State acquisition (deposits only). From 2004 through 2006, we consider this performance to be primarily a direct result of steadily improvingstrong economic conditions throughout most of our geographical footprint, and of effectively executing our operating strategies. The continued strong organic loan growth in the latter half of 2007 may also have begun to reflect the increasing lack of nonbank sources of credit as global credit market conditions deteriorated sharply. Chart 34 depicts this growth.

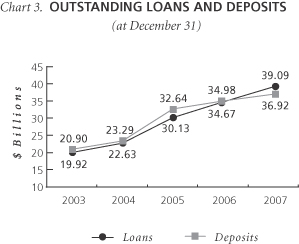
As expected,After strong growth in the first half of 2008, loan growth slowed sharply in the latter half, and continued to slow throughout 2009. Loan demand weakened throughout 2009 in all geographic markets that the Company experienced little or noserves, and in most core loan types, as a result of sharply curtailed real estate activities and the national recession. The net organic loan growth in 2007 in its three Southwestern banks (CB&T, NBA, and NSB), which were most heavily impacted by deteriorating conditionsshrinkage in the residential real estate markets. In these banks, declining rates of residential housingcommercial construction and land development and construction lending offset growth in commercial real estate($1.96 billion, or 26.1%) and commercial and industrial lending.($1.53 billion, or 13.3%) loan categories was particularly noteworthy. In addition to weak loan demand, significant loan charge-offs contributed to these declines, particularly in the construction and land development category. The Company expects thatexperienced significant organic net growth only in the slower rate of residential development and construction lending will continue to result in continued slower or no net loan growth in CB&T, NBA, and NSB through most if not all of 2008.
However, loan growth remained strong throughout the year in our banks that serve geographies in which economic conditions remained more robust, including Zions Bank, Amegy, Vectra and TCBW. The result was net loan growth of $4.4 billion including the effect of the Stockmen’s acquisition, or 12.8%, from year-end 2007 compared to year-end 2006, and a mix shift away from commercial real estate term loan category, which grew by $1.1 billion, or 17.1%. This growth reflected both new originations as well as the completion of credit-worthy construction projects that “rolled” into term loans. The Company also acquired loans in three transactions with the FDIC related to failed banks (Alliance and towards commercial lending sectorsVineyard banks in newCalifornia and Great Basin Bank in Nevada); these loans totaled $1.4 billion at year-end 2009, compared to zero at the end of 2008. However, these sources of growth were not sufficient to offset declines in other categories, and the Company’s loan originations.portfolio shrank $1.5 billion, or 3.5%; excluding FDIC-supported loans, the shrinkage was $2.9 billion, or 7.0% for the full year 2009.
Reflecting trends throughout the banking industry,While total deposits were relatively unchanged, core deposits grew only $1.9 billion from year-end 2006, a rate of 6.0% – significantly lagging thedeposit growth rate of loans. In addition, noninterest-bearing demand deposits decreased by $0.4 billion from year-end 2006. Thus,in 2009 was strong, which enabled the Company increased its reliance onto pay down more costlyexpensive sources of funding, duringincluding wholesale borrowings from Federal Home Loan Banks and time deposits, and to reduce interest expense significantly. Growth was particularly strong in noninterest-bearing transaction accounts ($2.64 billion, or 27.3%) and savings and NOW accounts ($1.39 billion or 31.2%). The Company believes that both the year.unlimited deposit insurance coverage of noninterest-bearing
transaction accounts and the very low short-term interest rate levels resulting from Federal Reserve policy, as well as the Company’s own sales efforts contributed to this growth. The FDIC-assisted acquisitions discussed above contributed relatively less to deposit growth than to loan totals, as a large portion of their total funding was from high-cost certificates of deposits, brokered deposits, and other expensive deposits; a large portion of these deposits left the Company, by design, when rates on such accounts were reset to lower levels.
Maintaining Credit Quality at High Levels
The ratio of nonperforming lending-related assets, excluding FDIC-supported assets, to net loans and other real estate owned deteriorated(“OREO”) increased to 0.73%6.00% at year-end, compared to 0.24%2.71% at the end of 2006.2008. See Chart 5. Net loan charge-offs for 20072009 were $64$1,172.6 million, or 2.90% of average loans, excluding FDIC-supported loans, compared to $46$393.7 million or 0.96% of average loans for 2006.2008. Chart 7 highlights net charge-offs by loan category. The provision for loan losses during 2007 increased significantly during 2009 to $152.2$2,016.9 million compared to $72.6$648.3 million for 2006. All2008. While the Company’s ratio of thesenet charge-offs to average loans and leases, excluding FDIC-supported loans, is now higher than the peer median (see Chart 6), its ratio of nonperforming assets to net loans and OREO, excluding FDIC-supported assets, is now below the peer median (see Chart 5).
These trends largely reflect the impact of varying degrees of deteriorating credit quality conditions in residential land acquisitionmost of the Company’s loan types and development and construction lendinggeographic regions as a result of the national recession. The rate of deterioration was most severe in the Southwest,first half of the year, and also very strong loan growth. However, theseshowed signs of stabilization in the fourth quarter of 2009. Net charge-offs came predominantly from the commercial real estate portfolio (see Chart 7), mainly construction and land development. As a result of the economic recession’s continued adverse impact on credit quality, measures remain stronger than our peer group averages. Thethe Company also has not seen clear evidence of material spillover of this deterioration into other components ofcontinued to strengthen its portfolio, including residential mortgages,allowance for credit card, other consumer lending, and commercial and industrial lending. However, in view of the unsettled market conditions and possible recession of the economy, we are closely monitoring our credit measures.losses, which stood at 4.25% at year-end 2009 (see Chart 8).

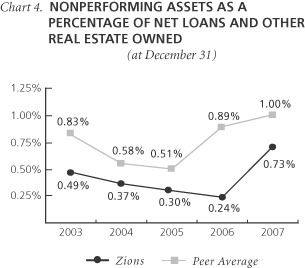
Note: Peer group is defined as bank holding companies
with assets > $10 billion.billion excluding banks providing
primarily trust services.
Peer data source: SNL Financial Database
Peer information for 2007 is from 3rd quarter 2007 and does not reflect 4th quarter 2007 performance.
Managing * Excluding FDIC-supported assets

Note: Peer group is defined as bank holding companies
with assets > $10 billion excluding banks providing
primarily trust services.
Peer data source: SNL Financial Database
* Excluding FDIC-supported loans


Note: Peer group is defined as bank holding companies
with assets > $10 billion excluding banks providing
primarily trust services.
Peer data source: SNL Financial Database
* Excluding FDIC-supported loans
Interest Rate Risk
Our focus in managing interest rate risk istraditionally has been to not to take positions based upon management’s forecasts of interest rates, but rather to maintain a position of slight “asset-sensitivity.” However, in 2009, in response to short term interest rates that were at or near zero, and term interest rates at historic lows, the Company has positioned its balance sheet to be more asset sensitive than its historical position. It has chosen not to take certain actions commonly used in the industry to increase duration and reduce asset sensitivity, such as using excess liquidity to buy longer term securities. This means that our assets primarily loans,(primarily loans) tend to reprice slightly more quickly than our liabilities primarily deposits.(primarily deposits). The Company makeshistorically has made extensive use of interest rate swaps to hedge interest rate risk in order to seek to achieve this desired position. This practice has enabled us to achieve a relatively stable net interest margin during periods of volatile interest rates, which is depicted in Chart 5.9.
Market levels of interest rates remained at historically low and relatively unchanged levels throughout 2009. Therefore, changes in loan and deposit pricing and in the composition of earning assets and funding were more significant drivers of the net interest income and margin than the Company’s hedging strategies. The Company pushed spreads over cost of funds on newly originated loans higher throughout most of the year. In part this was accomplished through the use of pricing floors on a significant amount of newly originated or renewed variable rate loans. At year-end 2009, $10.6 billion (26.3% of total loans) had floors or other pricing characteristics that were “in the money” relative to their underlying pricing index plus spread. Offsetting this was the loss of interest income from nonperforming lending related assets, which totaled $2.8 billion at year-end 2009, compared to $1.1 billion at year-end 2008. The cost of funding was favorably impacted by the significant increase in noninterest-bearing deposits discussed above, as well as both rate declines in all interest-bearing deposit categories and a shift toward a lower cost mix of such deposits.
Due to changes in newly originated and renewed loan spreads, changes in the relationship between the prime rate and London Inter-Bank Offer Rate (“LIBOR”), changes in the pattern of prime rate behavior in several of our banks, and other factors, our hedging strategy continued to be more difficult to conduct in 2009. In particular, a number of our interest rate swaps were terminated that had ineffectiveness under the Financial Accounting Standards Board (“FASB”) Accounting Standards Codification (“ASC”) No. 815,Derivatives and Hedging, and the Company elected not to replace them at historically low interest rates. Instead, the Company relied more on obtaining interest rate floors on new and renewed loans, as discussed previously. On the whole, Company management believes its actions continued to result in one of the highest and most stable net interest margins in the industry. We believe that our risk position at December 31, 2009 was more “asset sensitive” than has typically been the case.
As noted previously (see “Loan and Deposit Growth”), the lower-cost core deposit categories grew significantly during 2009, while reliance on higher-cost sources of funding was reduced. In addition, rates paid on most interest-bearing funding sources declined significantly in 2009 compared to 2008 due to weak economic conditions and the Federal Reserve’s policy of maintaining low short term interest rates and injecting liquidity into the banking system. These factors contributed significantly to an overall lower cost of funding in 2009 compared to 2008, and therefore to the maintenance of a relatively high net interest margin.
Taxable-equivalent net interest income in 2007 increased 6.7% over 2006.2009 decreased 3.7% from 2008. The net interest margin declined to a still high 4.43%3.94% for 2007,2009, down from 4.63%4.18% for 2006.2008. The Company was able to achieve this performance despite rising levels of nonaccrual loans and other nonperforming assets and the challengesimpact of a flat-to-inverted yield curve through most of 2007, and significant pressures on both loan pricing and funding costs thatdebt modification discount amortization. These factors resulted in a fairly steady compression, until the fourth quarter, of the net interest spread (the difference between the average yield on all interest-earningmargin.

Note: Peer group is defined as bank holding companies
with assets and the average cost of all interest-bearing funding sources).> $10 billion excluding banks providing
primarily trust services.
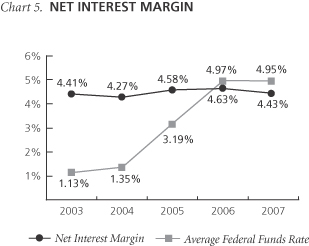
The Company’s net interest margin declined more than we expected in the second half of 2007 as a result of several unusual events and trends. First, from August through year-end, the Company purchased various amounts of commercial paper issued by Lockhart during the global liquidity crisis that emerged in August (See “Off-Balance Sheet Arrangements” on page 85 for a discussion of this off-balance sheet funding entity). On average, the Company held approximately $763 million of Lockhart commercial paper on its balance sheet during the fourth quarter of 2007. These assets had a very low spread over the cost of funding them, and detracted approximately six basis points from the margin during the quarter. The Company anticipates that this Lockhart-related spread compression will continue and likely will worsen during part or all of 2008.
Second, strong loan growth through the year was funded primarily with interest-bearing deposits and nondeposit funding. Noninterest-bearing deposits, as noted, actually declined during the year. This change in funding mix detracted approximately eight basis points from the margin in the fourth quarter and on average three basis points for the full year compared to 2006. We expect that pressure on the net interest margin may continue in 2008.
Finally, when the Federal Reserve Board (“FRB”) began lowering short-term interest rates in the second half of the year, deposit pricing adjusted downward much more slowly than expected based on historical patterns. The Company believes this is the result of strong liquidity pressures, and the resulting competition for deposits, that emerged globally in the second half of the year that were experienced by many depository institutions, and in particular some depository institutions in the West that were heavily exposed to residential mortgages, including sub-prime mortgages.
See the section “Interest Rate Risk” on page 99117 for more information regarding the Company’s asset-liability management (“ALM”) philosophy and practice and our interest rate risk management.
Controlling Expenses
During 2007,2009, the Company’s efficiency (expense-to-revenue) ratio increasedimproved to 60.5%61.3% from 56.9%67.5% for 2006.2008. The efficiency ratio is the relationship between noninterest expense and total taxable-equivalent revenue. The increase inDespite this improvement, the efficiency ratio continued to 60.5% for 2007 was primarily due tobe adversely impacted by the effect on revenue of the net impairment and valuation losses on securities as previously discussed. Therefore,Because of the significant securities impairment and valuation losses, the Company believes that its “raw” efficiency ratio is not a particularly useful measure of how well operating expenses were contained in 2007;2008 and 2009; nor does it believe that this measure is particularly useful for its peers, in 2007, many of which also experienced large losses and impairment charges and loan loss provisions as a result of market turmoil and deteriorating credit conditions. The Company’s efficiency ratio was 56.7% ifNoninterest expense increased 13.3% in 2009 compared to 2008. This increase resulted mainly from the impairmentincreased provision for unfunded lending commitments, OREO and valuation losses on securities are excluded – essentially unchanged from 2006credit-related expenses, and better reflecting our successFDIC premiums; excluding the effects of these items, noninterest expense decreased 2.1% in keeping operating expenses under control.2009 compared to 2008.

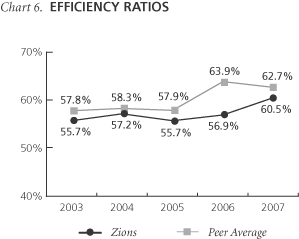
Note: Peer group is defined as bank holding companies
with assets > $10 billion.billion excluding banks providing
primarily trust services.
Peer data source: SNL Financial Database
Peer information for 2007 is from 3rd quarter 2007 and does not reflect 4th quarter 2007 performance.
Effects of Housing Market, Subprime Mortgage and Global Liquidity Crisis on the Company
It is now well recognized that during the period of roughly 2004-2006 a speculative bubble developed in residential housing in some of the Company’s key markets (including Arizona, Southern Nevada, and parts of California), and elsewhere in the country. The volume of mortgage debt outstanding grew at unprecedented rates, fueled by record low interest rates and increasingly lax lending standards as reflected by so-called subprime, Alt-A, and other alternative mortgages. Median housing prices and housing starts both
increased to record levels during this period. Home equity lending standards also deteriorated as lenders were lulled by low default rates and rising home prices.
The Company itself never originated subprime mortgages, had almost no direct exposure to these loans, and never offered residential “option ARM,” “negative amortization,” or “piggy-back” loans, and purchased very few broker-originated mortgages or brokered home equity loans. However, the Company has a significant business in financing residential land acquisition, development and construction activity. As the FRB began raising interest rates in 2005-2007, it became increasingly apparent that the prevailing levels of housing activity were unsustainable. Permits to build new homes hit a record peak of over 2,155,000 in 2005 and then began to decline. By December 2007, they had fallen to an annualized rate less than 900,000 nationally. This precipitous decline in housing activity has placed significant stress on a number of the Company’s homebuilder customers, and therefore on the Company’s loan portfolio in this sector. This portfolio peaked in mid 2006 as a percentage of the total loan portfolio and declined as a percentage of the total loan portfolio thereafter. Additionally, the portfolio began to shrink in dollar value terms in the latter half of 2007 in the Southwestern markets. Nonaccrual loans and provisions for loan losses began to increase significantly in late summer 2007, as it became clearer that this housing slump would likely be longer and deeper than originally believed. The Company now believes that these conditions are likely to persist throughout 2008 and into 2009, and that nonaccrual loans, the provision for loan losses, and net charge-offs will likely remain elevated throughout this period.
As home prices in many markets stopped appreciating and then began to decline in 2007, and as interest rates remained elevated, an increasing number of subprime mortgages began to default, and rating agencies began to downgrade ratings on mortgage-backed securities (“MBS”) and debt obligations developed from pools of MBSs (so-called Collateralized Debt Obligations, or “CDOs”). Values of such MBSs and CDOs began to decline and the holders of such instruments began to report large losses. At first these were isolated, but by the late summer these securities losses were both growing increasingly large and affecting a growing number of better known and well regarded financial institutions.
As the market lost confidence that it understood these problems and which institutions had exposure to them, liquidity began to be withdrawn from all participants. This affected Lockhart, an off-balance-sheet entity sponsored by Zions Bank, even though it had almost no exposure to subprime instruments. Investors became unwilling to buy so-called “asset-backed commercial paper” (“ABCP”) regardless of the quality of the assets backing the commercial paper (“CP”). Starting in August and continuing through year-end and into 2008, Lockhart had increasing difficulty issuing sufficient CP to fund its assets. The CP that it did issue was at much higher rates than had prevailed historically, and had a much shorter term – often only overnight. The Company and its affiliates purchased Lockhart CP and held it on their balance sheets. These actions enlarged the Company’s balance sheet, decreased its net interest margin, decreased its capital ratios, and decreased the fee income earned from Lockhart.
In late December, it became clear that Lockhart would not be able to sell sufficient CP over or shortly after year-end to fully fund its assets. This then triggered the Liquidity Agreement between Zions Bank and Lockhart, and on December 26 and 27, Zions Bank
purchased $840 million of securities out of Lockhart at Lockhart’s book value. Zions Bank recorded these assets on its balance sheet at fair value, and recognized a pretax loss of $33.1 million through its income statement. In addition, during the fourth quarter two CDO securities held by Lockhart were downgraded by one rating agency to below AA-, which also triggered the purchase of $55 million of these securities from Lockhart. These were also recorded on the Company’s balance sheet at fair value, and a pretax loss of $16.5 million was recognized.
Finally, several Real Estate Investment Trusts (“REIT”) CDOs held on the balance sheet of the Company declined sharply in value during the third and fourth quarters. These declines in value reflected in part the growing illiquidity of the markets for any type of debt securities with real estate exposure. However, in December as these declines in value continued and deepened, the Company conducted an analysis of the risk exposures represented by these CDOs. As a result of this analysis, the Company deemed seven of these CDOs to be other-than-temporarily impaired on December 18th, and recorded a $94.1 million pretax impairment charge through its income statement to write the securities down to estimated fair value. On December 28th, an additional CDO was determined to be other-than-temporarily impaired and a pretax charge of $14.5 million was recorded.
Altogether these purchases of securities from Lockhart, and the write-downs of securities held on our balance sheet reduced pretax income during the fourth quarter by $158.2 million, or $0.89 per share after-tax. These write-downs were in significant part the result of the turmoil in residential real estate markets and growing illiquidity of financial markets in the second half of the year. There can be no assurance that the Company will not record additional losses in 2008 arising from the same causes or related causes. Elsewhere in this report, including “Off-Balance Sheet Arrangements” on page 85, we disclose our exposure to and valuation marks to fair value by major asset class in both Lockhart’s securities and the Company’s available-for-sale securities portfolio.
Capital and Return on Capital
As regulated financial institutions, the Parent and its subsidiary banks are required to maintain adequate levels of capital as measured by several regulatory capital ratios. One of our goals is to maintain capital levels that are at least “well capitalized” under regulatory standards. The Company and each of its banking subsidiaries metexceeded the “well capitalized” guidelines at December 31, 2007.2009. In addition, the Parent and certain of its banking subsidiaries have issued various debt securities that have been rated by the principal rating agencies. As a result, another goal is to maintain capital at levels consistent with an “investment grade” rating for these debt securities. The Company has maintained its “investment grade” debt ratings as have thosefrom Standard & Poors, Fitch and Dominion Bond Rating Service, but has a rating that is significantly below investment grade from Moody’s.
During 2009 the Company took a variety of actions that had the effect of augmenting its bank subsidiaries that have ratings. At year-end 2007,capital in the Company’s tangibleface of continuing operating losses and stress in its loan and securities portfolios. Collectively these actions totaled $1.06 billion and included:
Issuance of $464.1 million of common equity ratiounder two common equity distribution programs;
Common equity increased $124.9 million from preferred stock redemptions and conversions into common equity;
Preferred equity decreased $108.6 million due to 5.70% comparedthe impact of the preferred stock redemptions, conversions into common stock, and subordinated debt conversions into preferred stock;
Modification of $1.2 billion of subordinated debt to 5.98%add options allowing the holder to convert debt into either of two outstanding issues of preferred stock which resulted in a $478.5 million increase in common equity net of increased debt discount amortization expense;
Acquisitions of three failed banks with FDIC assistance at the end of 2006. “bargain purchase” prices, which added $99.2 million to common equity; and
In December 2006,July 2009, the Company issued $240 million of noncumulative perpetual preferred stock; this additional capital raisedreduced the Company’s tangible equity ratio to 6.51% at the end of 2006. The Company announced in the fourth quarter of 2006 that it would target a tangible equity ratio of 6.25 - 6.50%, replacing the previously announced tangible common equity ratio target. At December 31, 2007, the Company’s tangible equity ratio was 6.17%, which was slightly below this targeted range.
In December 2006, the Company resumed its stock repurchase plan, which had been suspended since July 2005 because of the Amegy acquisition. On December 11, 2006, the Board authorized a $400 million repurchase program. The Company repurchased and retired 3,933,128 shares ofdividend on its common stock during 2007 at a total cost of $318.8 million and an averageto $0.01 per share priceper quarter in order to preserve capital.
These actions are summarized in Schedule 3. In deciding what capital actions to take, Company management has attempted to raise amounts prudently needed while causing as little dilution as possible to the ownership interests of $81.04existing shareholders, under very difficult market conditions. The results of this share repurchase authorization. The remaining authorized amount for share repurchases as of December 31, 2007 was $56.3 million. Due to growing uncertaintiesapproach are shown in global capitalChart 11, and funding markets,indicate that during 2009 the Company decided that it was prudentadded 36.8% to take stepsits core capital base while adding only 30.0% to conserve capital, and suspended its common stock repurchase program on August 16, 2007.shares outstanding.
Schedule 3
TIER 1 REGULATORY CAPITAL ACTIONS
| Increase to | ||||||||
| Statement of income | Tier 1 equity | |||||||
| (In millions) | Pretax | After-tax | ||||||
Common equity issuances | $ | 464.1 | ||||||
Common equity from preferred stock conversions and redemptions | 84.6 | 84.6 | 124.9 | |||||
Preferred equity reduction from conversions and redemptions | (108.6 | ) | ||||||
Gain on subordinated debt modification, net of increased discount amortization of $62.4 million | 446.5 | 275.7 | 275.7 | |||||
Beneficial conversion feature recorded in common stock | 202.8 | |||||||
Acquisition related gains | 169.2 | 99.2 | 99.2 | |||||
| $ | 459.5 | 1,058.1 | ||||||
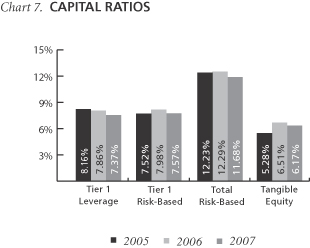


The Company continuesexpects that it (and the banking industry as a whole) may be required by market forces and/or regulation to believeoperate with higher capital ratios than in the recent past. In addition, the CPP capital preferred dividend is scheduled to increase from 5% to 9% in 2013, making it more expensive as a source of capital if not redeemed at or prior to that time. Thus, in addition to maintaining higher levels of capital, the Company’s capital structure may continue to be subject to greater variation over the next few years than has been true historically, due to the still highly uncertain economic and regulatory environments. Therefore, in 2010, continuing to preserve and augment capital in excessresponse to these uncertainties and in preparation for the eventual repayment of that requiredTARP CPP preferred stock are likely to support the risks oftake precedence over making capital investments to expand the business, in which it engages should be returned to the shareholders. However, although the Company has $56.3 million stock buyback authorization remaining, due to continued capital market disruptions and the potential for deteriorating economic conditions in 2008, it does not currently expect to resume this program until at least late 2008.
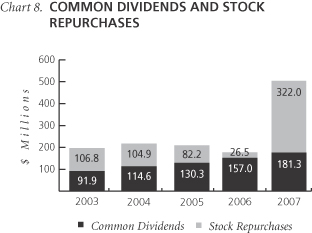
In addition, we believe that the Company should engage or invest in business activities that provide attractive returns on equity. Chart 9 illustrates that as a result of earnings improvement, the exit of underperforming businesses and returning unneeded capital to the shareholders the Company’s return on average common equity improved from 2003 to 2005. The decline in 2006 resulted from the additional common equity held due to additional intangible assets (primarily goodwill and core deposit intangibles) that resulted from the premium paid to acquire Amegy. The further decline in the return on average common equity in 2007 resulted primarily from the securities impairment charges and larger provision for loan losses discussed previously, as well as from the additional intangible assets that resulted from the premium paid to acquire Stockmen’s.
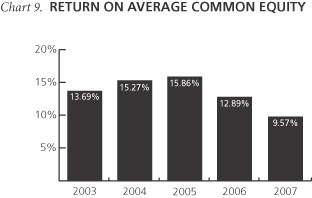
As depicted in Chart 10, tangible return on average tangible common equity further improved in 2006 as the Company continued to improve its core operating results. However, it deteriorated significantly in 2007 primarily as a resultform of the securities impairment and valuation losses and the increased provision for loan losses discussed previously.
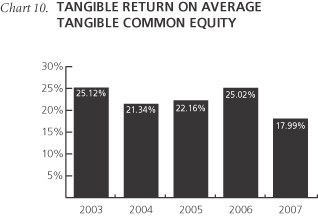
Note: Tangible return is net earnings applicable to common
shareholders plus after-tax amortization of core deposit and
other intangibles and impairment losses on goodwill.
Specialty Financial Services and Technology Businesses
In addition to its community and regional banking businesses, the Company operates a number of specialized businesses some of which are national in scope. These businesses include SBA 7(a) loan originations in which the Company ranks in the top 15 nationally. The Company also ranks #1 in the nation in owner occupied real estate loans originated in conjunction with the SBA 504 loan program, and provides public finance advisory and underwriting services, and software and cash management services related to the electronic imaging of checks pursuant to the Check 21 Act. Other such specialty businesses include our Contango Capital Advisors, Inc. (“Contango”) fee-only wealth management advisory business, and our Employee Stock Option Appreciation Rights Securities (“ESOARS”) market-based employee stock options expense determination service.
National Real Estate Lending
This business consists of making SBA 504 and similar low loan-to-value, primarily owner-occupied, first mortgage small business commercial loans. During both 2007 and 2006, the Company originated directly and purchased from correspondents approximately $1.5 billion and $1.2 billion of these loans, respectively. From 2000 through 2005, the Company securitized and credit enhanced these loans and sold them to a qualifying special-purpose entity (“QSPE”), Lockhart, which funded them through the issuance of commercial paper. However during 2007 and 2006, no additional loans were securitized and sold to Lockhart. The Company does not expect to securitize and sell to Lockhart any additional loans going forward, for reasons discussed elsewhere in this report. See “Off-Balance Sheet Arrangements” on page 85 for further discussion.
Treasury Management, NetDeposit and Related Services
Zions believes it has a significant opportunity to increase its treasury management penetration of commercial customers in its geographic territory, and continued to invest in these capabilities in 2007. An increased level of investment in treasury management, both in technology and service and in sales, is expected to continue in 2008.
In addition to enhancing its general treasury management capabilities, Zions has made significant investments specifically in creating enhanced capabilities in services related to claims processing and reconciliation for medical providers. Included among these investments was the acquisition of the remaining minority interests in P5, Inc. (“P5”) during 2006; Zions had for several years owned a majority interest in this start-up provider of web-based claims reconciliation services. At year-end 2007, P5 provided these services to over 1,200 medical practitioners, mostly pharmacy outlets, as compared to 800 at year-end 2006. The Company is in the process of integrating P5’s services and other payment processing services into its more traditional treasury management products and services for the medical provider industry. P5 also has applied for and has been granted several patents covering key aspects of Internet-based medical claims processing and lending against medical claims submitted through the Internet. It also is considering appropriate steps to enforce its intellectual property rights.
We also continue to invest in our NetDeposit, Inc. (“NetDeposit”) subsidiary that was created to develop and sell software and processes that facilitate electronic check clearing. With the implementation of the Check 21 Act late in 2004, this company and its products are well positioned to take advantage of the revolution in check processing now underway in America. During 2007,
NetDeposit reduced earnings by $0.05 per dilutedhigher dividends or share compared to $0.07 per share in 2006. Revenues for 2007 increased 32.5% from 2006. During 2007, NetDeposit largely completed the build-out of its full suite of intended products, and launched major upgrades of older products. Consequently, late in 2007 we were able to slow the rate of additional investment in this business and reduce expenses. We currently believe that NetDeposit is likely to reach break-even late in 2008.repurchases.
The Company generates revenues in several ways from this business. First, NetDeposit licenses software, sells consulting services, and resells scanners to other banks and processors. Newly announced customers since January 1, 2007 include US Merchant Services, Whitney Bank, Farm Bureau Bank, United Commercial Bank, and Home National Bank. These activities initially generate revenue from scanner sales, consulting, and licensing fees. Deployment-related fees related to work station site licenses and check processing follow, but have been slower to increase than expected as deployment throughout the industry has been slower than expected.
Second, NetDeposit has licensed its software to the Company’s banks, which use the capabilities of the software to provide state-of-the art cash management services to business customers and to correspondent banks. At year-end, over 6,000 Zions affiliate bank cash management customers were using NetDeposit, and we processed over $8.9 billion of imaged checks from our cash management customers in the month of December.
Third, Zions Bank uses NetDeposit software to provide check-clearing services to correspondent banks. Zions Bank has contracts and co-marketing agreements with a number of bank processors and resellers.
NetDeposit seeks to protect its intellectual property in business methods related to the electronic processing and clearing of checks. During 2007 two patents were issued to NetDeposit and several additional patent applications are pending. The Company believes that one or more competitors may be infringing on its patents and is now considering appropriate steps to enforce its intellectual property rights.
Wealth Management
We have extensive relationships with small and middle-market businesses and business owners that we believe present an unusual opportunity to offer wealth management services. As a result, the Company established a wealth management business, Contango, and launched the business in the latter half of 2004. The business offers financial and tax planning, trust and inheritance services, over-the-counter, exchange-traded and synthetic derivative and hedging strategies, quantitative asset allocation and risk management and a global array of investment strategies from equities and bonds through alternative and private equity investments. At year-end, Contango had over $1.3 billion of client assets under management and a strong pipeline of referrals from our affiliate banks, as compared to over $885 million under management at December 31, 2006. At December 31, 2007, the Company had total discretionary assets under management of $2.9 billion, including assets managed by Contango, Amegy, and Western National Trust Company, a wholly-owned subsidiary of Zions Bank. During 2007, Contango generated net losses of $0.08 per diluted share compared with $0.07 per diluted share during 2006.
Employee Stock Option Appreciation Rights
In December 2004, the Financial Accounting Standards Board (“FASB”) issued Statement of Financial Accounting Standards (“SFAS”) No. 123R,Share-Based Payment, which is a revision of SFAS No. 123,Accounting for Stock-Based Compensation. We have developed a market-based method for the valuation of employee stock options for SFAS 123R purposes. This method uses an online auction to price a tracking instrument that measures the fair value of the option grant. On January 25, 2007, we received notice from the Office of the Chief Accountant of the Securities and Exchange Commission (“SEC”) that they concur with our view that our tracking instrument, with modifications described in the notification, is sufficiently designed to be used for SFAS 123R.
From May 4-7, 2007, the Company successfully conducted an auction of its ESOARS. As allowed by SFAS 123R, the Company used the results of that auction to value its employee stock options issued on May 4. The value established was $12.06 per option, which the Company estimates is approximately 14% below its Black-Scholes model valuation on that date. The Company recorded the related estimated future settlement obligation of ESOARS as a liability in the balance sheet.
On October 22, 2007, the Company announced it had received notification from the SEC that its ESOARS are sufficiently designed as a market-based method for valuing employee stock options under SFAS 123R. The SEC staff did not object to the Company’s view that the market-clearing price of ESOARS in the Company’s auction was a reasonable estimate of the fair value of the underlying employee stock options.
The Company has not as yet conducted ESOARS auctions on behalf of any non-Zions companies, but anticipates that it is likely to do so in 2008.
Challenges to Operations
As we enter 2008,2010, we see severala number of significant challenges to improving performance.
confronting the industry and our Company.
Global capital and funding markets remain under significant stress, and most observers are increasing their forecast probabilitiesstress; however, domestic credit spreads from the related financing have narrowed significantly since the height of the downturn, providing an improved operating environment for a recession in the U. S. economy. We believe this will likely have several ramifications for the Company. First, thefinancial services companies. Nevertheless, continued ability of Lockhart to issue sufficient commercial paper to fund its assets will remain uncertain. Therefore, it is quite possible that the Company will continue to purchase Lockhart’s commercial paper, and/or purchase assets from Lockhart pursuant to the Liquidity Agreement. Downgrades of additional Lockhart securities also are possible, which would, if sufficiently severe, trigger their purchase by Zions Bank pursuant to the Liquidity Agreement. All of these actions are likely to keep the Company’s balance sheet larger than it otherwise would like, and to depress its net interest margin. The sameeconomic conditions may lead toto:
Continued elevated levels of substandard loans, with the possibility of further weaknessesmaterial deterioration if the macroeconomic recovery reverses course.
Further declines in value and potential other than temporary impairment (“OTTI”) charges on CDO securities we own that are largely collateralized by junior debt and trust preferred debt including REIT CDOs.issued by banks and insurance companies.
Regulatory policy and actions have become increasingly subject to change and difficult to predict, both in general and as they may be applied specifically to the Company. A number of proposals have been offered by the President, the Federal Reserve, members of Congress, and in international regulatory forums. Many of these proposals, if enacted, may have significant and adverse impacts on the Company, the ultimate effects of which are currently difficult to predict.
Continued weaknessCapital and funding markets have improved significantly during the latter half of 2009, but still remain somewhat stressed as we enter 2010. The degree to which this improvement is still dependent upon unprecedented actions by the Federal Reserve System to provide direct support to various markets is difficult to quantify; therefore, the potential for additional disruption may exist in the residential housing construction markets, particularly in Arizona, Nevadafuture if and California,when that support is likely to result in continuedwithdrawn. While the Company by many measures has higher levels of loan loss provisionscapital and nonperforming assetsfunding than it has been experienced byhad in a very long time, the Company, in recent years. If the economy does slip into a more broad-based recession, this credit quality weakness could spreadlike most financial institutions, at some point may need to other sectors of our loan portfolio, although we have seen no material indication of that yet.
We expect that commercial real estate loans,access capital and funding markets to support its operations. The conditions under which declined in CB&T and NSB in the fourth quarter, may continue to decline in our Southwestern markets throughout the first half of 2008. However, commercial loan growth has been strong, particularly at Zions Bank, Amegy and Vectra, which has kept aggregate Company loan growth robust. In addition, the Company has been ablecan access those markets may remain highly uncertain in 2010. Further, as discussed previously, the Company may be required to obtain somewhat better pricing (as measured by spread over matched maturity cost of funds)repay the preferred stock issued under TARP at a time or in amounts that may be unfavorable.
These challenges and others are more fully discussed under “Risk Factors” on a number of newly originated loans in recent months. We expect that this pricing improvement may continue for at least the first part of 2008.
However, due to the previously discussed general tight conditions for funding of all types, as well as large needs for funding that are specific to several major competitors in our market, deposit pricing has not adjusted as expected in response to recent rate reductions by the Federal Reserve. Also, deposit growth, particularly lower cost types of deposits, has remained relatively weak. These factors, combined with the impact of Lockhart-related actions on our assets and liabilities, means that our net interest margin came under more downward pressure than expected in the second half of 2007. We now expect that these pressures on the net interest margin may persist in the first half of 2008.
Compliance with regulatory requirements poses an ongoing challenge. In particular, regulatory scrutiny of compliance programs related to Anti-Money Laundering (“AML”) and the Bank Secrecy Act (“BSA”) continues to increase. A failure in our internal controls could have a significant negative impact not only on our earnings but also on the perception that customers, regulators and investors may have of the Company. We continue to devote a significant amount of effort, time and resources to improving our controls and ensuring compliance with these complex regulations.
We have a number of business initiatives that, while we believe they will ultimately produce profits for our shareholders, currently generate expenses in excess of revenues. Three significant initiatives are Contango, a wealth management business started in 2004, NetDeposit, our subsidiary that provides electronic check processing systems, and the increased investments in treasury management and medical claims capabilities as previously discussed. We will need to manage these businesses carefully to ensure that expenses and revenues develop in a planned way and that profits are not impaired to an extent that is not warranted by the opportunities these businesses provide.
Finally, competition from credit unions continues to pose a significant challenge. The aggressive expansion of some credit unions, far beyond the traditional concept of a common bond, presents a competitive threat to Zions and many other banking companies. While this is an issue in all of our markets, it is especially acute in Utah where two of the five largest financial institutions (measured by local deposits) are credit unions that are exempt from all state and federal income tax.page 12.
CRITICAL ACCOUNTING POLICIES AND SIGNIFICANT ESTIMATES
The Notes to Consolidated Financial Statements contain a summary of the Company’s significant accounting policies. We believe that an understanding of certain of these policies, along with the related estimates that we are required to make in recording the financial transactions of the Company, is important in order to have a complete picture of the Company’s financial condition. In addition, in arriving at these estimates, we are required to make complex and subjective judgments, many of which include a high degree of uncertainty. The following is a discussion of these critical accounting policies and significant estimates related to these policies. We have discussed each of these accounting policies and the related estimates with the Audit Committee of the Board of Directors.
We have included sensitivity schedules and other examples to demonstrate the impact of the changes in estimates made for various financial transactions. The sensitivities in these schedules and examples are hypothetical and should be viewed with caution. Changes in estimates are based on variations in assumptions and are not subject to simple extrapolation, as the relationship of the change in the assumption to the change in the amount of the estimate may not be linear. In addition, the effect of a variation in one assumption is in reality likely to cause changes in other assumptions, which could potentially magnify or counteract the sensitivities.
Fair Value Accounting
Securitization Transactions
The Company from time to time enters into securitization transactions that involve transfers of loans or other receivables to off-balance sheet QSPEs as defined in SFAS No. 140,Accounting for Transfers and Servicing of Financial Assets and Extinguishments of Liabilities. In most instances, we provide the servicing on these loans as a condition of the sale. In addition, as part of these transactions,Effective January 1, 2008, the Company may retainadopted ASC 820,Fair Value Measurements and Disclosures. ASC 820 defines fair value, establishes a cash reserve account, an interest-only strip, or in some casesconsistent framework for measuring fair value, and enhances disclosures about fair value measurements. Adoption of ASC 820 for the measurement of all nonfinancial assets and nonfinancial liabilities was delayed one year until January 1, 2009. The adoption of ASC 820 did not have a subordinated tranche, all of which are considered to be retained interests in the securitized assets.
Whenever we initiate a securitization, the first determination that we must make in connection with the transaction is whether the transfer of the assets constitutes a sale under U.S. generally accepted accounting principles (“GAAP”). If it does, the assets are removed from the Company’s consolidated balance sheet with a gain or loss recognized. Otherwise, the transfer is considered a financing transaction, resulting in no gain or loss being recognized and the recording of a liabilitymaterial effect on the Company’s consolidated balance sheet. financial statements, but significantly expanded the disclosure requirements for fair value measurements.
ASC 820 defines fair value as the exchange price that would be received for an asset or paid to transfer a liability (an exit price) in the principal or most advantageous market for the asset or liability in an orderly transaction between market participants on the measurement date. To measure fair value, ASC 820 has established a hierarchy which requires an entity to maximize the use of observable inputs and minimize the use of unobservable inputs. This hierarchy uses three levels of inputs to measure the fair value of assets and liabilities as follows:
Level 1 – Quoted prices in active markets for identical assets or liabilities; includes certain U.S. Treasury and other U.S. Government and agency securities actively traded in over-the-counter markets; certain securities sold, not yet purchased; and certain derivatives.
Level 2 – Observable inputs other than Level 1 including quoted prices for similar assets or liabilities, quoted prices in less active markets, or other observable inputs that can be corroborated by observable market data; also includes derivative contracts whose value is determined using a pricing model with observable market inputs or that can be derived principally from or corroborated by observable market data. This category generally includes certain U.S. Government and agency securities; certain CDO securities; corporate debt securities; certain private equity investments; certain securities sold, not yet purchased; and certain derivatives. See “Accounting for Derivatives” on page 47 for further details on fair value accounting for derivatives.
Level 3 – Unobservable inputs supported by little or no market activity for financial instruments whose value is determined using pricing models, discounted cash flow methodologies, or similar techniques, as well as instruments for which the determination of fair value requires significant management judgment or estimation. Additionally, observable inputs such as nonbinding single dealer quotes that are not corroborated by observable market data are included in this category. This category generally includes certain private equity investments and most CDO securities.
The financing treatmentCompany uses models when quotations are not available for certain securities or in markets where trading activity has slowed or ceased. When quotations are not available, and are not provided by third party pricing services, management judgment is necessary to determine fair value. In situations involving management judgment, fair value is determined using discounted cash flow analysis or other valuation models, which incorporate available market information, including appropriate benchmarking to similar instruments, analysis of default and recovery rates, estimation of prepayment characteristics and implied volatilities. Even when management exercises significant judgment in determining fair value, the objective is the same: to estimate the exit price of the asset or liability.
At December 31, 2009, approximately 7.8% of total assets, or $4.0 billion, consisted of financial instruments recorded at fair value on a recurring basis. Of this amount, $2.2 billion of these financial instruments used valuation methodologies involving market-based or market-derived information, collectively Level 1 and 2 measurements, to measure fair value. Approximately $1.8 billion of these financial assets are measured using model-based techniques or nonbinding single dealer quotes, both of which constitute Level 3 measurements. At December 31, 2009, approximately 0.3% of total liabilities, or $119 million, consisted of financial instruments recorded at fair value on a recurring basis. At December 31, 2009, approximately 0.8% of total assets, or $412 million of financial assets were valued on a nonrecurring basis.
Estimates of Fair Value
The Company measures or monitors many of its assets and liabilities on a fair value basis. Fair value is used on a recurring basis for certain assets and liabilities in which fair value is the primary basis of accounting. Examples of these include derivative instruments, available-for-sale and trading securities, and private equity investments. Additionally, fair value is used on a nonrecurring basis to evaluate assets or liabilities for impairment or for disclosure purposes in accordance with ASC 825. Examples of these nonrecurring uses of fair value include loans held for sale accounted for at the lower of cost or fair value, impaired loans, long-lived assets, goodwill, and core deposit and other intangible assets. Depending on the nature of the asset or liability, the Company uses various valuation techniques and assumptions when estimating the instrument’s fair value. These valuation techniques and assumptions are in accordance with ASC 820.
Fair value is the price that could have unfavorablebe received to sell an asset or paid to transfer a liability in an orderly transaction between market participants. If observable market prices are not available, then fair value is estimated using modeling techniques such as discounted cash flow analyses. These modeling techniques utilize assumptions that market participants would use in pricing the asset or the liability, including assumptions about the risk inherent in a particular valuation technique, the effect of a restriction on the sale or use of an asset, and the risk of nonperformance. To increase consistency and comparability in fair value measures, ASC 820 established a three-level hierarchy to prioritize the inputs used in valuation techniques between observable inputs that reflect quoted prices in active markets, inputs other than quoted prices with observable market data, and unobservable data such as the Company’s own data or single dealer nonbinding pricing quotes.
Fair values for some investment securities, trading assets, and most derivative financial implications includinginstruments are based on independent, third party market prices, or if identical market prices are not available they are based on the market prices of similar instruments if available. If market prices of similar instruments are not available, instruments are valued based on the best available data, some of which may not be readily observable in the market. The fair values of loans held for sale are typically based on quotes from market participants. The fair values of OREO and other repossessed assets are typically determined based on appraisals by third parties, less estimated selling costs.
Estimates of fair value are also required when performing an adverse effectimpairment analysis of long-lived assets, goodwill, and core deposit and other intangible assets. The Company reviews goodwill for impairment at the reporting unit level on Zions’ resultsan annual basis, or more often if events or circumstances indicate the carrying value may not be recoverable. The goodwill impairment test compares the fair value of operations and capital ratios. However, allthe reporting unit with its carrying value. If the carrying amount of the Company’s securitizations have been structured to meetinvestment in the existing criteria for sale treatment.
Another determination thatreporting unit exceeds its fair value, an additional analysis must be made is whether the special-purpose entity involved in the securitization is independent from the Company or whether it should be included in its consolidated financial statements. If the entity’s activities meet certain criteria for it to be considered a QSPE, no consolidation is required. Since all of the Company’s securitizations have been with entities that have met the requirements to be treated as QSPEs, they have met the existing accounting criteria for nonconsolidation.
Finally, we must make assumptionsperformed to determine the amount, if any, by which goodwill is impaired. In
determining the fair value of gainthe Company’s reporting units, management uses discounted cash flow models which require assumptions about growth rates of the reporting units and the cost of equity. To the extent that adequate data is available, other valuation techniques relying on market data may be incorporated into the estimate of a reporting unit’s fair value. The selection and weighting of the various fair value techniques may result in a higher or lower fair value. Judgment is applied in determining the amount that is most representative of fair value. For long-lived assets and intangible assets subject to amortization, an impairment loss resulting fromis recognized if the securitization transaction as well as the subsequent carrying amount forof the retained interests.asset is not likely to be recoverable and exceeds its fair value. In determining the gain fair value, management uses models which require assumptions about growth rates, the life of the asset, and/or loss, we use assumptionsthe fair value of the assets. The Company tests long-lived assets for impairment whenever events or changes in circumstances indicate that aretheir carrying amounts may not be recoverable.
Valuation of Asset-Backed Securities (“ABS”)
The Company values available-for-sale and held-to-maturity ABS using several methodologies based on the facts surroundingappropriate fair value hierarchy consistent with currently available market information. At December 31, 2009, the Company valued substantially all of the ABS portfolio using Level 3 pricing methods as follows:
Schedule 4
ABS FAIR VALUES
| Held-to-maturity | Available-for-sale | ||||||||||||
| (In millions) | Par | Amortized cost | Estimated fair value | Par | Amortized cost | Estimated fair value | |||||||
Trust preferred securities – bank and insurance: | |||||||||||||
Internal model | $ | 265 | 265 | 208 | 2,369 | 1,985 | 1,340 | ||||||
Third party models | – | – | – | 31 | 21 | 7 | |||||||
Dealer quotes | – | – | – | 15 | 15 | 13 | |||||||
Other – Level 2 | – | – | – | 3 | 2 | 1 | |||||||
| 265 | 265 | 208 | 2,418 | 2,023 | 1,361 | ||||||||
Trust preferred securities – real estate investment trusts: | |||||||||||||
Third party models | – | – | – | 95 | 56 | 24 | |||||||
| – | – | – | 95 | 56 | 24 | ||||||||
Other: | |||||||||||||
Internal model | – | – | – | 2 | – | – | |||||||
Third party models | 37 | 30 | 16 | 101 | 44 | 22 | |||||||
Dealer quotes | – | – | – | 16 | 16 | 13 | |||||||
CDS spreads | – | – | – | 54 | 53 | 27 | |||||||
Other – Level 2 | – | – | – | 16 | 14 | 15 | |||||||
| 37 | 30 | 16 | 189 | 127 | 77 | ||||||||
Municipal Securities: | |||||||||||||
Third party models | – | – | – | 54 | 48 | 48 | |||||||
CDS spreads | – | – | – | 16 | 15 | 16 | |||||||
| – | – | – | 70 | 63 | 64 | ||||||||
Auction Rate Securities: | |||||||||||||
Third party models | – | – | – | 173 | 160 | 160 | |||||||
| – | – | – | 173 | 160 | 160 | ||||||||
Total | $ | 302 | 295 | 224 | 2,945 | 2,429 | 1,686 | ||||||
Internal Model
In the third quarter of 2009, the Company changed the way it forecasts the default assumption for private banks and nonperforming public banks within its collateralized debt obligation (“CDO”) pools. Beginning in the third quarter of 2008, the Company used a combination of a licensed third party model for public companies in conjunction with third party ratings for private companies to forecast defaults of bank and insurance collateral. The third party model estimated probabilities of default (“PDs”) using a proprietary reduced form model derived using logistic regression on a historical default database. Because the licensed third party model required equity valuation related inputs (along with other macro and issuer specific inputs) to produce default probabilities, the model did not produce results for private firms and some very small public firms without readily available market data. The Company utilized the third party model to calculate the average of the default probabilities by rating level of the public collateral, and this rating level default probability was applied to each securitization. Using alternativesprivate issuer within the CDO pools. When combined with pool specific collateral lists these PDs created estimates of pool-level expected loss rates for each CDO.
This ratings bucketing approach for private issuers was replaced in the quarter ending September 30, 2009 by a statistical regression using financial ratios which the Company has identified as predictive of future bank failures for the private banks in the CDO pools. As this credit cycle has progressed, the Company has an increasingly significant data set of failed banks. The regression draws upon the quarterly Call Report ratios of failed banks for the four quarters prior to thesefailure to determine one year default probabilities. A five year default probability is calculated by assigning a mathematical relationship to the one year and five year default probabilities from the licensed third party model. The updated model has a significantly stronger correlation with actual bank failures than in the prior method. The Company found this ratio-based approach produced higher default probabilities than the previous approach for private banks that subsequently failed during the third and fourth quarters of 2009. Although both methods produced a comparable expected number of failures, the ratio based approach exhibited better specificity in regard to predicting which banks would fail.
The inputs and regression formula were updated in the quarter ending December 31, 2009 and will be updated quarterly to include the most recent available financial ratios and to utilize those financial ratios which have best predicted bank failures during this credit cycle.
The Company has seen nearly all of the failures within its predominantly bank CDO pools come from those banks that have previously deferred the payment of interest on their trust preferred securities. The terms of the securities within the CDO pools generally allow for deferral of current interest for five years without causing default. The Company found that for the public deferring banks, the ratio-based approach generally resulted in higher PDs than did the licensed third party model for banks that subsequently failed. In the interest of better projecting public bank failures, the Company utilized the higher of PDs from its ratio-based approach and those from the licensed third party model for public deferring banks effective for the quarters ending September 30, 2009 and December 31, 2009.
In the fourth quarter, the Company increased the ratio-based PDs by a calibration adjustment of 7.8%. The calibration adjustment was calculated as the average difference between the actual 100% default probability for all banks failing in the third or fourth quarter of 2009 (both CDO and non-CDO banks) and the PD generated for each deferring bank using the ratio based approach. Ratio based PDs for deferring banks were adjusted upward by the 7.8% from the level produced by the fourth quarter regression model. The resulting effective PDs ranged from 100% for the “worst” deferring banks to 8.2% for the “best” deferring bank. The weighted average assumed loss rate on deferring collateral was 44%. The change from the 35% assumed minimum loss rate used in the third quarter of 2009 was supported by the preponderance of all failures coming from higher default probability banks and the addition, in the fourth quarter of 2009, of the calibration adjustment. These assumption changes were not material with respect to their effect on either OTTI credit loss or fair value.
The Company’s experience with deferring collateral was that 47% of the CDO collateral that elected to defer at or after January 2007 had subsequently defaulted by December 31, 2009, and 53% remained within the allowable deferrable period as of that date.
The model for projecting expected cash flows for CDO tranches after identifying collateral level probabilities of default remains the same as disclosed in previous filings. Estimates of expected loss for the individual pieces of underlying collateral are aggregated to arrive at a pool-level expected loss rate for each CDO. These loss assumptions could affectare applied to the CDO’s structure to generate cash flow projections for each tranche of the CDO. The presence OTTI is identified and the amount of gain or loss recognizedthe credit component of OTTI is calculated by discounting the resulting loss-adjusted cash flows at each tranche’s coupon rate and comparing that value to the Company’s amortized cost of the tranche. The fair value of each tranche is determined by discounting its resultant loss-adjusted cash flows with appropriate market-based discount rates.
Beginning in the quarter ending March 31, 2009, the Company began utilizing a more granular approach to reflect the specific risks embedded in every deal and to reference trading levels of publicly traded single-issuer trust preferred securities as a data point. This change in inputs/assumptions was driven by market developments and was not due to a change in accounting rules during the first quarter of 2009.
The discount rate assumption used for valuation purposes for each CDO tranche was derived from trading yields on publicly traded trust preferred securities and projected probabilities of default on the transaction and,underlying issuers. Beginning in turn, the Company’s resultsquarter ending September 30, 2009, the data set included a publicly traded trust preferred security which was in deferral with regard to the payment of operations. In valuing the retained interests, since quoted market prices of these interests are generally not available, we must estimate their value basedcurrent interest. The discount margins on the present valuetraded securities, including the deferring security, were regressed to those of the futureCDOs by comparing expected levels of cash flows associated withflow impairments between the securitizations. These value estimations requireCDOs and the publicly traded trust preferred securities.
For the quarter ending September 30, 2009, the Company to make a number of assumptions including:
the method to use in computing the prepayments of the securitized loans;
the annualized prepayment speed of the securitized loans;
the weighted average life of the loans in the securitization;
the expected annual net credit loss rate; and
increased the discount rate range to LIBOR +3.75% for the residualhighest quality/most over-collateralized tranches and LIBOR +17.35% for the lowest credit quality tranche in order to reflect market level assumptions for structured finance securities. In addition, in order to acknowledge the greater uncertainty in the cash flows.
Quarterly,flows of those junior trust preferred CDO tranches which are “PIKing” (capitalizing interest), the Company reviews its valuation assumptions for retained beneficial interests underutilized a discount rate of at least LIBOR + 13% using the rules contained in Emerging Issues Task Force Issue No. 99-20,Recognition of Interest Income and Impairment on Purchased and Retained Beneficial Interests in Securitized Financial Assets, (“EITF 99-20”). These rules require the Company to periodically update its assumptions used to compute estimated cash flows for its retained beneficial interests and compare the net present value of these cash flows to the carrying value. The Company complies with EITF 99-20 by quarterly evaluating and updating its assumptions including the default assumption as compared to the historical credit losses and the credit loss expectation of the portfolio, and its prepayment speed assumption as compared to the historical prepayment speeds and prepayment rate expectation. Changes in certain 2007 assumptions from 2006 for securitizations were made in accordance with this process.
forward LIBOR curve.
At December 31, 20072009, the Company had seven small business securitizationsfurther increased the discount rate range to LIBOR +3.75% for the highest quality/most over collateralized tranches and one home equity loan securitization.LIBOR + 24.65% for the lowest credit quality tranche in order to reflect market level assumptions for structured finance securities. In addition, in order to acknowledge the greater uncertainty in the cash flows of those junior trust preferred CDO tranches which are PIKing (capitalizing interest), the Company utilized a discount rate of at least LIBOR + 13% using the forward LIBOR curve. These discount rates are in addition to the credit related discounts applied to the cash flows for each tranche. The retained beneficial interests for certainrange of the small business securitizations required impairment charges during 2007projected cumulative credit loss of the CDO pools varies extensively across pools and 2006 followingranges between 8.6% and 87.8%.
CDO tranches with greater uncertainty in their cash flows should be discounted at higher rates than those that market participants would use for tranches with more stable expected cash flows (e.g., as a result of more subordination and/or better credit quality in the applicationunderlying collateral). The high end of EITF 99-20. For the twelve months endeddiscount margin spectrum was applied to tranches in which minor changes in future default assumptions produced substantial deterioration in tranche cash flows. These discount rates are applied to credit-stressed cash flows, which constitute each tranche’s expected cash flows; discount rates are not applied to a hypothetical contractual cash flow.
As shown in Schedule 5, the fair value of bank and insurance CDOs (determined using an internal model) declined $128 million from $1,289 million at December 31, 2007,2008 to $1,161 million at December 31, 2009. In 2009, the Company incurredrecorded net credit impairment charges of $12.6$163 million before income taxes asrelated to these CDO securities that were held in the portfolio at December 31, 2009. The decline in fair value is due primarily to the use of generally higher discount rate assumptions at year-end 2009 versus 2008, and to deterioration of projected cash flows for particular securities during the year. Schedule 5 sets forth the fair values of securities held at December 31, 2009 compared to impairment chargestheir fair values at December 31, 2008 by original ratings level. The 2008 portion of $7.1 millionthe schedule presents securities in their 2009 ratings categories in order to isolate the 2009 changes to this securities portfolio.
The line titled “Other” in the schedule includes additions to the portfolio in 2009 from the Company purchasing securities from Lockhart Funding LLC (“Lockhart”), subtractions from the portfolio in 2009 due to securities sales and principal pay downs and transfers of securities from HTM to AFS during 2006.2009.
Schedule 5
EFFECT OF BANK AND INSURANCE CDO ASSUMPTION CHANGES AND COLLATERAL CHANGES ON FAIR VALUES
| Estimated fair value of Level 3 bank and insurance CDOs, internal model | ||||||||||||||
| December 31, 2009 | December 31, 2008 | |||||||||||||
| (In millions) | Held-to- maturity | Available- for-sale | Total | Held-to- maturity | Available- for-sale | Total | ||||||||
Securities presented using 2009 categories: | ||||||||||||||
AAA – original rating | $ | – | 539 | 539 | – | 588 | 588 | |||||||
A – original rating | 208 | 361 | 569 | 141 | 490 | 631 | ||||||||
BBB – original rating | – | 43 | 43 | – | 60 | 60 | ||||||||
NR – original rating | – | 10 | 10 | – | 10 | 10 | ||||||||
Total securities using 2009 categories | 208 | 953 | 1,161 | 141 | 1,148 | 1,289 | ||||||||
Other | – | 387 | 387 | 530 | (510 | ) | 20 | |||||||
Total | $ | 208 | 1,340 | 1,548 | 671 | 638 | 1,309 | |||||||
Schedule 3 summarizes
2008 credit assumptions: 0% recovery on deferrals and defaulted collateral. Performing collateral from TARP banks assumed to have a 40% recovery upon default and non-TARP banks assumed to have a 10% recovery upon default.
2008 discount rate assumptions: LIBOR +6.0% weighted average discount margin, with L+2.2% minimum and L+11.6% maximum.
2009 credit assumptions: 0% recovery on defaults. Probability of default on deferrals calculated by the key economicratio-based probability of default plus a 7.8% calibration adjustment.
2009 discount rate assumptions: LIBOR +6.97% weighted average discount margin, with L+3.75% minimum, PIKing tranches at a minimum of L+13%, and L+24.65% maximum.
The original A-rated securities in the HTM portfolio are primarily from insurance only CDOs which had lower discount rate assumptions that we used for measuring the values of the retained interests at the date of sale for securitizations during 2006 and 2005. No securitizations of small business loans were completed during 2007 or 2006. Also in December 2006, the Company ceased selling loans into its revolving home equity loan securitization.year end 2009 compared to year end 2008.
SCHEDULE 3
KEY ECONOMIC ASSUMPTIONS USED TO VALUE
RETAINED INTERESTS
| Home equity loans | Small business loans | |||
2006: | ||||
Prepayment method | na(1) | na(2) | ||
Annualized prepayment speed | na(1) | na(2) | ||
Weighted average life (in months) | 11 | na(2) | ||
Expected annual net loss rate | 0.10% | na(2) | ||
Residual cash flows discounted at | 15.0% | na(2) | ||
2005: | ||||
Prepayment method | na(1) | CPR(3) | ||
Annualized prepayment speed | na(1) | 4 - 15 Ramp in 25 months(4) | ||
Weighted average life (in months) | 12 | 69 | ||
Expected annual net loss rate | 0.10% | 0.40% | ||
Residual cash flows discounted at | 15.0% | 15.0% | ||
Schedule 4The following schedule sets forth the sensitivity of the current CDO fair value ofvalues, using an internal model, to changes in the capitalized residual cash flows at December 31, 2007 to immediate 10% and 20% adverse changes to those keymost significant assumptions that reflectutilized in the current portfolio assumptions.
SCHEDULE 4Schedule 6
SENSITIVITY OF RESIDUAL CASH FLOWSBANK AND INSURANCE CDO VALUATIONS TO ADVERSE CHANGES
OF IN CURRENT PORTFOLIOMODEL KEY VALUATION ASSUMPTIONS
| (In millions of dollars and annualized percentage rates) | Home equity loans | Small business loans | ||||||
Carrying amount/fair value of capitalized residual cash flows | $ | 0.8 | 49.8 | |||||
Weighted average life (in months) | 13.6 | 31 - 41 | ||||||
Prepayment speed assumption | na | (1) | 20.0% - 26.0% | |||||
Decrease in fair value due to adverse change | 10% | $ | 0.1 | 1.2 | ||||
| 20% | $ | 0.1 | 2.2 | |||||
Expected credit losses | 0.10 | % | 0.50% - 1.00% | |||||
Decrease in fair value due to adverse change | 10% | $ | < 0.1 | 1.6 | ||||
| 20% | $ | < 0.1 | 3.2 | |||||
Residual cash flows discount rate | 12.0 | % | 16.0% | |||||
Decrease in fair value due to adverse change | 10% | $ | < 0.1 | 1.1 | ||||
| 20% | $ | < 0.1 | 2.2 | |||||
| Bank and insurance CDOs at Level 3 | |||||||||||||||||
| (Amounts in millions) | Held-to-maturity | Available-for-sale | |||||||||||||||
Fair value balance at December 31, 2009 | $208 | $1,340 | |||||||||||||||
Expected collateral credit losses1 | |||||||||||||||||
| Incremental | Cumulative | Incremental | Cumulative | ||||||||||||||
Weighted average: | |||||||||||||||||
Loss percentage from currently defaulted or deferring collateral2 | 3.5 | % | 18.3 | % | |||||||||||||
Projected loss percentage from currently performing collateral: | |||||||||||||||||
1 year | 1.5 | % | 5.0 | % | 1.5 | % | 19.8 | % | |||||||||
Years 2-5 | 2.8 | % | 7.8 | % | 2.7 | % | 22.5 | % | |||||||||
Years 6-30 | 3.9 | % | 11.7 | % | 3.7 | % | 26.2 | % | |||||||||
Decrease in fair value due to increase in projected loss percentage from currently performing collateral3 | 25 | % | $ | (0.3 | ) | $ | (13.7 | ) | |||||||||
| 50 | % | (0.7 | ) | (28.4 | ) | ||||||||||||
| 100 | % | (3.4 | ) | (64.2 | ) | ||||||||||||
Discount rate4 | |||||||||||||||||
Weighted average spread over LIBOR | 448 | bp | 725 | bp | |||||||||||||
Decrease in fair value due to increase in discount rate | + 100 | bp | $ | (18.0 | ) | $ | (110.3 | ) | |||||||||
| + 200 | bp | (33.8 | ) | (207.3 | ) | ||||||||||||
The |
| 2 | Weighted average |
| 3 | Percentage increase is applied to incremental projected loss percentages from currently performing collateral. For example, the 50% and 100% stress scenarios for AFS securities would result in cumulative 30 year losses of 30.2% =26.2% + 50% (1.5%+2.7%+3.7%) and 34.1%= 26.2% + 100% (1.5%+2.7%+3.7%) respectively. |
| 4 | The discount rate is a spread over the LIBOR swap yield curve at the date of valuation. |
During the fourth quarter the Company experienced adverse changes in the loss percentage from currently defaulted or deferring collateral and adverse changes in future cumulative projected credit losses. The changes were driven by loss experience due to default in excess of projections, future loss projections from previously performing institutions electing to defer current interest payments and the deterioration of ratios of certain institutions. Given the transfers of securities from held-to-maturity (“HTM”) to available-for-sale (“AFS”) during the second quarter of 2009, the remaining HTM portfolio is generally of better credit quality than the portion held in the AFS portfolio. See “Investment Securities Portfolio” on page 91 for further information regarding the transfers of securities.
Zions Bank provides a liquidity facility for a fee to a QSPE securities conduit, Lockhart, which purchases U.S. Government and AAA-rated securities, which are funded through the issuance of its commercial paper.
Third Party Models
At December 31, 2007 approximately 53%2009, the Company utilized third party valuation services for fifteen securities with an aggregate amortized cost of $152 million in the ABS CDO and trust preferred asset classes. These securities continued to have insufficient observable market data available to directly determine prices. The Company reviewed all relevant data inputs and the appropriateness of key model methodologies and assumptions employed by third party models. These assumptions included, but were not limited to, probability of default, collateral recovery rates, discount rates, over-collateralization levels, and rating transition probability matrices from rating agencies. The model valuations obtained from third party services were evaluated for reasonableness including quarter to quarter changes in assumptions and comparison to other available data which included third party and internal model results and valuations. A range of value estimates is not provided because third party vendors utilized point estimates.
Auction rate and municipal securities with an amortized cost of $208 million were valued using third party matrix referencing ratings as the key variable with regards to valuation.
Dealer Quotes
The $31 million of asset-backed securities at amortized cost are valued using nonbinding and unadjusted dealer quotes. Multiple quotes are not available and the values provided are based on a combination of proprietary dealer quotes. Broker disclosure levels vary and the Company seeks to minimize dependence on this Level 3 source.
CDS Spreads
A total of $53 million at amortized cost of insured securities were valued using the relevant monoline insurers’ credit derivative levels.
In addition, a total of $15 million of municipal securities with puts back to the underwriter in 2010 were valued using the CDS Spread of the AAA-ratedunderwriter.
See Note 4 of the Notes to Consolidated Financial Statements and “Investment Securities Portfolio” on page 91 for further information.
Other-than-Temporary Impairment (“OTTI”) – Debt Investment Securities
We review investment debt securities held by Lockhart were createdon an ongoing basis with formal reviews for the presence of OTTI performed quarterly. Net OTTI losses on individual investment securities are recognized as a realized loss through earnings when it is more likely than not that the Company will not collect sufficient contractual cash flows as compared to its amortized cost or the Company is unable to hold the securities to recovery.
The Company’s OTTI evaluation process conforms to the rules as required by the Company’s securitizationdebt securities subsequent measurement topic in ASC 320. These rules require the Company to take into consideration current market conditions, fair value in relationship to cost, extent and nature of small business loans. Zions Bank also receiveschange in fair value, issuer rating changes and trends, volatility of earnings, current analysts’ evaluations, all available information relevant to the collectability of debt securities, our ability and intent to hold investments until a feerecovery of amortized cost (which may be maturity), and other factors when evaluating for the existence of OTTI in exchangeour securities portfolio.
On January 12, 2009, the FASB amended the debt securities subsequent measurement topic in ASC 320. This amendment is effective for providing hedge supportinterim and administrativeannual reporting periods ending after December 15, 2008, applied prospectively. The amendment eliminated the requirement that a holder’s best estimate of cash flows be based upon those that “a market participant” would use. Instead, the amendment requires that OTTI be recognized as a realized loss through earnings when it is “probable” there has been an adverse change in the holder’s estimated cash flows from the cash flows previously projected to determine amortized cost.
On April 9, 2009, the FASB amended the debt securities subsequent measurement topic in ASC 320. This amendment was effective for interim and investment advisory services.annual reporting periods ending after June 15, 2009, applied prospectively with a cumulative effect adjustment for prior OTTI illiquidity losses, with the option to early adopt for the first quarter of 2009. The Company elected to early adopt this amendment during the first quarter of 2009. The Company recorded a $137.5 million after tax cumulative effect adjustment upon adoption of the amendment. Retained earnings were increased and accumulated other comprehensive income decreased. The amendment significantly changes how an entity evaluates whether impairment is other than temporary and how to recognize OTTI for debt securities classified as available-for-sale or held-to-maturity.
LockhartThe three most significant changes that impacted the determination and calculation of OTTI are first, a requirement that an entity conclude it does not intend to sell an impaired security and it is an off-balance sheet QSPE as defined by SFAS 140. Should Zions Bancorporation and affiliates together own morenot “more likely than 90% of Lockhart’s outstanding commercial paper, Lockhart would cease to be a QSPE and wouldnot” that it will be required to sell the security before the recovery of its amortized cost basis. Second, a requirement to assess the collectability of cash flows based on “a more likely than not” basis, as compared to the “probable” basis under the prior accounting rule. Finally, a requirement to recognize the total OTTI charge for debt securities in separate amounts – one amount representing the decrease in cash flows expected to be consolidated. Zions Bancorporation affiliates owned 34%collected (“credit loss”), which is recognized in earnings, and 68%the second amount representing the amount related to all other factors (“illiquidity loss”), which is recognized in OCI. Also, for securities classified as held-to-maturity, the amendment requires that the amount of OTTI recognized in OCI be accreted (through OCI) over the remaining life of the outstanding commercial papersecurity.
The Company recognized pretax OTTI losses of Lockhart at December 31, 2007$569.9 million during 2009 and February 15,$304.0 million during 2008 respectively.
See “Off-Balance Sheet Arrangements” beginningon investment debt securities. All of the impairment for 2009 related to securities valued using Level 3 inputs. Management determined that $289.4 million of the impairment in 2009 was due to noncredit-related losses on securities not expected to be sold, resulting in a net impairment of $280.5 million. The significant inputs used in the methodology to calculate the credit loss impairment is described under “Valuation of Asset-Backed Securities,” on page 8537 with the exception that while the discount rate used for further discussionvaluation is a market level discount rate, the discount rate used to determine the presence and amount of Lockhart includingcredit impairment is the Liquidity Agreementsecurity specific coupon rate. The expected cash flows are credit stressed in that they incorporate the effect of both collateral nonperformance and projected additional nonperformance.
The decision to deem these securities OTTI was based on a specific analysis of the structure of each security purchases from Lockhart required byand an evaluation of the Liquidity Agreement, assets held by Lockhart,underlying collateral. Future reviews for OTTI will consider the particular facts and information regardingcircumstances during the impact to the Company if it were required to consolidate Lockhart or purchase its remaining assets.
reporting period in review.
Allowance for LoanCredit Losses
Allowance for loan losses
The allowance for loan losses represents our estimate of the losses that are inherent in the loan and lease portfolios. The determination of the appropriate level of the allowance is based on periodic evaluations of the portfolios along with other relevant factors. These evaluations are inherently subjective and require us to make numerous assumptions, estimates and judgments.
In analyzing the adequacy of the allowance for loan losses, we utilize a comprehensive loan grading system to determine the risk potential in the portfolio and also consider the results of independent internal credit reviews. To determine the adequacy of the allowance, the Company’s loan and lease portfolio is broken into segments based on loan type. For commercial loans, we use historical loss experience factors by loan segment, adjusted for changes in trends and conditions, to help determine an indicated allowance for each segment based on individual loan grades. These factors are evaluated and updated using migration analysis techniques and other considerations based on the makeup of the specific portfolio segment. The other considerations used in our analysis include volumes and trends of delinquencies, levels of nonaccrual loans, repossessions and bankruptcies, trends in criticized and classified loans, and expected losses on loans secured by real estate. In addition, new credit products and policies, economic conditions, concentrations of credit risk, and the experience and abilities of lending personnel are also taken into consideration.
In addition to the segment evaluations, nonaccrual loans graded substandard or doubtful with an outstanding balance of $500 thousand or more, as well as all loans designated as troubled debt restructurings, are individually evaluated in accordance with SFAS No. 114,ASC 310,Accounting by Creditors for Impairment of a Loan,Receivables,to determine the level of impairment and establish a specific reserve. A specific allowance may also be established for adversely graded loans below $500 thousand when it is determined that the risk associated with the loan differs significantly from the risk factor amounts established for its loan segment and risk grade.
The allowance for consumer loans is determined using historically developed loss experience “roll rates” at which loans migrate from one delinquency level to the next higher level. Using average roll rates for the most recent twelve-month period, currently six months, and comparing projected losses to actual loss experience, the model estimates the expected losses in dollars for the forecasted period.period of twelve months. By refreshing the model with updated data, it is able to project losses for a new twelve-month period each month, segmenting the portfolio into ninetwelve consumer loan product groupings and four bankcard product groupings with similar risk profiles.
The residential mortgage and home equity portfolios’ models implicitly take into consideration housing price depreciation (appreciation) and homeowners’ loss (gain) of equity in the collateral by incorporating current roll rates and loss severity rates. The models make no assumptions about future housing price changes. This methodology is an accepted industry practice, and the Company believes it has a sufficient volume of information to produce reliable projections.
As a final step to the evaluation process, we perform an additional review of the adequacy of the allowance based on the loan portfolio in its entirety. This enables us to mitigate, but not eliminate, the imprecision inherent in mostloan- and segment-level estimates of expected credit losses. This review of the allowance includes our judgmental consideration of any adjustments necessary for subjective factors such as economic uncertainties and concentration risks.
There are numerous components that enter into the evaluation of the allowance for loan losses. Some are quantitative while others require us to make qualitative judgments. Although we believe that our processes for determining an appropriate level for the allowance adequately address all of the various components that could potentially result in credit losses, the processes and their elements include features that may be susceptible to significant change. Any unfavorable differences between the actual outcome of credit-related events and our estimates and projections could require an additional provision for credit losses, which would negatively impact the Company’s results of operations in future periods. As an example, if a total of $250 million$1.5 billion of nonclassified“pass” grade loans were to
be immediately classified as special“special mention, substandard” “substandard” and doubtful“doubtful” in the same proportion as the existing portfolio of the criticized and classified loans to the whole portfolio, the quantitatively determined amount of the allowance for loan losses at December 31, 20072009 would increase by approximately $15.3$128 million. This sensitivity analysis is hypothetical and has been provided only to indicate the potential impact that changes in the level of the criticized and classified loans may have on the allowance estimation process. We believe that given the procedures we follow in determining the potential losses in the loan portfolio, the various components used in the current estimation processes are appropriate.
We are inregularly evaluate the processappropriateness of developing potential changesour loss estimation methods to enhancereduce differences between estimated and actual losses and update our methodology for determining the allowance for loan losses. We have recently enhanced our internal loan loss database to provide the ability to refine our segmentation by bank, loan segment, and loan grade. During 2009, this enhancement allowed management to calculate loan loss migration factors that are self-correcting in that they are more weighted toward recent loss experience. This enhancement provided management with loss factors applicable to adversely graded credits that reflect more recent loss experience for the portfolio, and which facilitated management’s decision to increase the allowance for credit losses during mid-2009 as credit quality was deteriorating at an accelerated pace. These loss factors currently are based on the most recent six months loss rates for consumer loans, and the higher of the most recent six or twelve month loss rates for commercial loans. A preliminary reserve is then calculated that is adequate to cover one year of losses at that loss rate for consumer loans and 1.5 years for commercial loans. The potentialfinal reserve is then adjusted to incorporate management’s judgment regarding several qualitative factors.
Allowance for loan losses for FDIC-supported loans
The determination of the allowance for loan losses for FDIC-supported loans follows the same process described above. However, this allowance is only established for credit deterioration subsequent to the date of acquisition and represents our estimate of the inherent losses in excess of the book value of FDIC-supported loans. The allowance for loan losses for loans acquired in FDIC-supported transactions is determined without giving consideration to the amounts recoverable through loss sharing agreements (since the loss sharing agreements are separately accounted for and thus presented “gross” on the balance sheet). The provision for loan losses is reported net of changes include incorporating a two-factor grading system to include probability of default andin the amounts recoverable under the loss given default. We currently anticipate that these changes will be phased in during 2008 and 2009.
sharing agreements.
Nonmarketable Equity SecuritiesReserve for unfunded lending commitments
The Company either directly, through its banking subsidiaries or through its Small Business Investment Companies (“SBIC”), owns investments in venture fundsalso estimates a reserve for potential losses associated with off-balance sheet commitments and other capital securitiesstandby letters of credit. We determine the reserve for unfunded lending commitments using a process that are not publicly traded and are not accountedis similar to the one we use for using the equity method. Since these nonmarketable securities have no readily ascertainable fair values, they are reported at amountscommercial loans. Based on historical experience, we have estimated to be their fair values. In estimating the fair value of each investment, we must apply judgment using certain assumptions. Initially, we believe that an investment’s cost is the best indication of its fair value, provided that there have been no significant positive or negative developments subsequent to its acquisition that indicate the necessity of an adjustment to a fair value estimate. If and when such an event takes place, we adjust the investment’s cost by an amountdeveloped experience-based loss factors that we believe reflectsapply to the nature ofCompany’s unfunded lending commitments to estimate the event. In addition, any minority interestspotential for loss arising from those commitments. The reserve is included with other liabilities in the Company’s SBICs reduce its share ofconsolidated balance sheet, with any gainsrelated increases or losses incurred on these investments.
As of December 31, 2007, the Company’s total investment in nonmarketable equity securities not accounted for using the equity method was $103.7 million, of which its equity exposure to investments held by the SBICs, net of related minority interest of $28.7 million, was $44.3 million. In addition, exposure to non-SBIC equity investments not accounted for by the equity method was $30.7 million.
The values we have assigned to these securities where no market quotations exist are based upon available information and may not necessarily represent amounts that ultimately will be realized on these securities. Key information used in valuing these securities include the projected financial performance of these companies, the evaluation of the investee company’s management team, and other industry, economic and market factors. If there had been an active market for these securities, the carrying value may have been significantly different from the amounts reported. In addition, since Zions Bank and Amegy are the principal business segments holding these investments, they would experience the largest impact of any changesdecreases in the fair valuesreserve included in noninterest expense in the statement of these securities.income.
Accounting for Goodwill
Goodwill arises from business acquisitions and represents the value attributable to the unidentifiable intangible elements in our acquired businesses. Goodwill is initially recorded at fair value and is subsequently evaluated at least annually for impairment in accordance with SFAS No. 142,ASC 350,Intangibles – Goodwill and Other Intangible Assets. The Company performs this annual test as of October 1 of each year. Evaluations are also performed on a more frequent basis if events or circumstances indicate impairment could have taken place. Such events could include, among others, a significant adverse change in the business climate, a significant adverse change in market values of similar businesses, an adverse action by a regulator, an unanticipated change in the competitive environment, and a decision to change the operations or dispose of a reporting unit.
The first step in this evaluation process is to determine if a potential impairment exists in any of the Company’s reporting units, and if required from the results of this step, a second step measures the amount of any impairment loss. The computations required by steps 1 and 2 call forrequire us to make a number of estimates and assumptions. In completing step 1, we determine the fair value of the reporting unit that is being evaluated. In determining the fair value, we generally calculate value using a combination of up to three separate methods: comparable publicly traded financial service companies in the Westernwestern and Southwestern states;southwestern states (“Market Value”); comparable acquisitions of financial services companies in the Westernwestern and Southwestern states;southwestern states (“Transaction Value”); and the discounted present value of management’s estimates of future cash or income flows. Critical assumptions that are used as part of these calculations include:
selection of comparable publicly traded companies, based on location, size, and business composition;
selection of market comparable acquisition transactions, based on location, size, business composition, and date of the transaction;
the discount rate applied to future earnings, based on an estimate of the cost of capital;
the potential future earnings of the reporting unit;
the relative weight given to the valuations derived by the three methods described.described; and
the control premium associated with reporting units.
We use a similar methodology in evaluating impairment in nonbank subsidiaries, but generally useassess companies and acquisition transactions nationallyat a national level in the analysis.
The Company applies a control premium in the Market Value approach to determine the reporting units’ equity values. Control premiums represent the ability of a controlling shareholder to benefit from synergies and other intangible assets that arise from control that might cause the fair value of a reporting unit as a whole to exceed its market capitalization. Based on a review of historical recent bank transactions within the Company’s geographic footprint, comparing market values 30 days prior to the announced transaction to the deal value, the Company determined that a control premium of 25% was appropriate.
Since estimates are an integral part of the impairment computations, changes in these estimates could have a significant impact on any calculated impairment amount. Factors that may significantly affect the estimates include, among others, competitive forces, customer behaviors and attrition, loan losses, changes in revenue growth trends, cost structures and technology, changes in discount rates, changes in equity market values and merger and acquisition valuations, and changes in industry conditions.
If step 1 indicates a potential impairment of a reporting unit, step 2 requires us to estimate the “implied fair value” of the goodwill of the reporting unit. This process estimates the fair value of the unit’s individual assets and liabilities in the same manner as if a purchase of the reporting unit were taking place. To do this, we must determine the fair value of the assets, liabilities and identifiable intangible assets of the reporting unit based upon the best available information. We estimate the fair market value of all of the tangible assets, identifiable intangible assets and liabilities of the associated reporting units in accordance with the principles of ASC 820. Loans, deposits with maturities, and debt are fair valued using standard software and assumptions used by Zions in its interest rate risk management processes and using other estimates such as credit assumptions to comply with ASC 820. Deposits with no maturities are valued at book value. Larger occupied properties are appraised, while for smaller properties and furniture, fixtures and equipment, it is assumed that depreciated book value approximates fair market value. If the implied fair value of goodwill calculated in step 2 is less than the carrying amount of goodwill for the reporting unit, an impairment is indicated and the carrying value of goodwill is written down to the calculatedits implied fair value.
During the first quarter of 2009, we performed a goodwill impairment evaluation for Amegy and CB&T, effective February 28, 2009, due to the Company’s performance deterioration and market decline of bank stocks in those markets from December 31, 2008. Step 1 was performed by using both Market Value and discounted cash flow approaches. In the Market Value approach, we identified a group of publicly traded banks using primarily size, location and business mix compared to Zions’ subsidiary banks. We then used valuation multiples, including a control premium, developed from this group to apply to our subsidiary banks. Due to the limited number of nondistressed or nonfailed bank merger and acquisition transactions during the past 12 months, the Transaction Value approach was not used in this analysis. In the discounted cash flow approach we discounted projected cash flows to their present value using an estimated long-term cost of equity specific to each reporting unit, to arrive at our estimate of fair value.
Since estimates are an integral partUpon completion of step 1 of the evaluation process, we concluded that potential impairment computations, changesprimarily existed at the Company’s Amegy reporting unit. Step 2 was completed with the assistance of an independent valuation consultant and the Company’s internal valuation resources and resulted in these estimates could have a significant impact on any calculated$634.0 million of impairment amount. Factors that may significantly affectlosses in the estimates include, among others, competitive forces, customer behaviors and attrition, changes in revenue growth trends, cost structures and technology, changes in discount rates, changes in stock and mergers and acquisitions market values, and changes in industry or market sector conditions.first quarter of 2009.
During the fourth quarter of 2007,2009, we performed our annual goodwill impairment evaluation for the entire organization, effective October 1, 2007.2009. Step 1 was performed by using both market value and transaction value approachesthe discounted cashflow approach for all reporting units and in certain cases where similar publicly traded comparables existed, the discounted cash flowcomparable Market Value approach was also used. In the marketdiscounted cash flow approach, we discounted projected cash flows to their present value to derive our estimate of fair value. In instances where the Market Value approach was used, we identified a group of publicly traded banks that are similar inusing primarily size, location and locationbusiness mix compared to Zions’ subsidiary banks andbanks. We then used valuation multiples, including a control premium, developed from thethis group to apply to our subsidiary banks. In the transaction value approach, we reviewed the purchase price paid in recent mergers and acquisitions of banks similar in size to Zions’ subsidiary banks. From these purchase prices we developed a set of valuation multiples, which we applied to our subsidiary banks. In instances where the discounted cash flowThe Transaction Value approach was not used we discounted projected cash flowsin this analysis, due to their present value to arrive at our estimatethe limited number of fair value.nondistressed or nonfailed bank merger transactions that occurred over the past 12 months.
Upon completion of step 1 of the evaluation process, we concluded that nonone of our bank affiliates were impaired; however, potential impairment existed for any ofat the Welman Holdings, Inc., reporting unit. Step 2 was completed with the Company’s reporting units. In reaching this conclusion,internal accounting and valuation resources, determining that all the goodwill associated with Welman Holdings, Inc. was impaired, resulting in $2.2 million of impairment loss. Additionally, we determined that the fair values of goodwill exceeded the recordedreporting units of Amegy, CB&T, and Zions Bank exceed their carrying values of goodwill. Since thisby 7%, 6%, and 23%, respectively.
This evaluation process required us to make estimates and assumptions with regard to the fair value of the Company’s reporting units, and actual values may differ significantly from these estimates. Such differences could result in future impairment of goodwill that would, in turn, negatively impact the Company’s results of operations and the business segments where the goodwill is recorded. However, had ourSignificant remaining amounts of goodwill at December 31, 2009 were as follows: Amegy – $616 million; CB&T – $379 million; and Zions Bank – $20 million.
At September 30, 2009, the Company’s fair value of its reporting units exceeded the market value of the Company’s common equity by approximately $2.0 billion. The Company reconciled those values as of September 30, 2009 by attempting to identify items priced into the market equity value but not in the fair value of the Company’s reporting units. These reconciling items were based on market expectation of future loan losses and future credit OTTI, and high levels of short interest in the Company’s common stock. We believe applying a 25% control premium and the above mentioned factors explains the $2.0 billion difference between book and market equity values.
We expect that the current disrupted market conditions may require us to evaluate goodwill more frequently, including quarterly, as circumstances warrant. Any differences between estimated fair values been 10% lower, there would still have been no indicationand carrying values could result in future impairment of impairment for any of our banking reporting units.
goodwill.
Accounting for Derivatives
Our interest rate risk management strategy involves hedging the repricing characteristics of certain assets and liabilities so as to mitigate adverse effects on the Company’s net interest margin and cash flows from changes in interest rates. While we do not participate in speculative derivatives trading, we consider it prudent to use certain derivative instruments to add stability to the Company’s interest income and expense, to modify the duration of specific assets and liabilities, and to manage the Company’s exposure to interest rate movements.
AllAdditionally, the Company executes derivative instruments, including interest rate swaps and options, futures contracts, forward currency exchange contracts, and energy commodity swaps, with commercial banking customers to facilitate their respective risk management strategies. Those derivatives are carried onimmediately hedged by offsetting derivative contracts, such that the balance sheet at fair value. Company minimizes its net risk exposure resulting from such transactions. The Company does not use credit default swaps in its investment or hedging operations.
As of December 31, 2007,2009, the recorded amounts of derivative assets, classified in other assets, and derivative liabilities, classified in other liabilities, were $307.5$142 million and $104.0$86 million, respectively. Since thereWhen quoted market prices are no market value quotes fornot available, the specificvaluation of derivative instruments thatis determined using widely accepted valuation techniques including discounted cash flow analysis on the Company holds, we must estimate theirexpected cash flows of each derivative. This analysis reflects the contractual terms of the derivatives, including the period to maturity, and uses observable market-based inputs, including interest rate curves, foreign exchange rates, commodity prices, and implied volatilities. The estimates of fair values. This estimate isvalue are made by an independent third party using a standardized methodology that nets the discounted expected future cash receipts and cash payments (based on observable market inputs). These future net cash flows, however, are susceptible to change due primarily to fluctuations in interest rates.rates (most significantly), foreign exchange rates, and commodity prices. As a result, the estimated values of these derivatives will typically change over time as cash is received and paid and also as market conditions change. As these changes take place, they may have a positive or negative impact on our estimated valuations. Based on the nature and
limited purposes of the derivatives that the Company employs, fluctuations in interest rates have only had a modest effect on its results of operations. As such, fluctuations are generally
expected to be countered by offsetting changes in income, expense and/or values of assets and liabilities. However, the Company retains basis risk due to changes between the prime rate and LIBOR on nonhedge derivative basis swaps.
In addition to making the valuation estimates, we also face the risk that certain derivative instruments that have been designated as hedges and currently meet the strict hedge accounting requirements of SFAS No. 133,Accounting for Derivative Instruments and Hedging Activities,ASC 815 may not qualify in the future as “highly effective,” as defined by the Statement, as well as the risk that hedged transactions in cash flow hedging relationships may no longer be considered probable to occur. During 2007, an immaterial amount of hedge ineffectiveness was required to be reported in earnings on the Company’s cash flow hedging relationships. Further, new interpretations and guidance related to SFAS 133 continue toASC 815 may be issued in the future, and we cannot predict the possible impact that they willsuch guidance may have on our use of derivative instruments in the future.
going forward.
Although the majority of the Company’s hedging relationships have been designated as cash flow hedges, for which hedge effectiveness is assessed and measured using a “long haul” approach, the Company also had five fair value hedging relationships, outstanding aswhich were terminated during the first quarter of December 31, 20072009, that were designated using the “shortcut” method, as described in SFAS 133, paragraph 68.method. The Company believes that the shortcut method continues to bewas appropriate for those hedges because we havehad precisely complied with the documentation requirements and each of the applicable shortcut criteria describedcriteria. During 2009, there was no hedge ineffectiveness required to be reported in paragraph 68.earnings on the Company’s outstanding cash flow hedging relationships. However, the Company reclassified $104.7 million from other comprehensive income to earnings during 2009, as the hedged forecasted transactions related to certain terminated cash flow hedging relationships became probable not to occur. This income is included in fair value and nonhedge derivative income (loss).
Futures contracts are primarily highly liquid exchange-traded federal funds futures contracts that are traded to manage interest rate risk on certain CDO securities. These identified mixed straddle trades are executed to convert three- and six-month fixed cash flows into cash flows that vary with daily fluctuations in interest rates. Because of daily settlement of valuation changes, there is no recording of fair values in the financial statements.
Derivative contracts can be exchange-traded or over-the-counter (“OTC”). The Company’s exchange-traded derivatives consist of forward currency exchange contracts, which are part of the Company’s services provided to commercial customers. Exchange-traded derivatives are classified as Level 1 in the fair value hierarchy, as the values of these derivatives are obtained from quoted prices in active markets for identical contracts.
The Company’s OTC derivatives consist of interest rate swaps and options, as well as energy commodity derivatives for customers. The Company has classified its OTC derivatives in Level 2 of the fair value hierarchy, as the significant inputs to the overall valuations are based on market-observable data or information derived from or corroborated by market-observable data, including market-based inputs to models, model calibration to market-clearing transactions, broker or dealer quotations, or alternative pricing sources with reasonable levels of price transparency. Where models are used, the selection of a particular model to value an OTC derivative depends upon the contractual terms of, and specific risks inherent in, the instrument as well as the availability of pricing information in the market. The Company generally uses similar models to value similar instruments. Valuation models require a variety of inputs, including contractual terms, market prices, yield curves, credit curves, measures of volatility, and correlations of such inputs. For OTC derivatives that trade in liquid markets, such as generic forwards, swaps and options, model inputs can generally be verified and model selection does not involve significant management judgment.
To comply with the provisions of ASC 820, the Company incorporates credit valuation adjustments to appropriately reflect both its own nonperformance risk and the respective counterparty’s nonperformance risk in the fair value measurements of its OTC derivatives. The credit valuation adjustments are calculated by determining the total expected exposure of the derivatives (which incorporates both the current and potential
future exposure) and then applying each counterparty’s credit spread to the applicable exposure. For derivatives with two-way exposure, such as interest rate swaps, the counterparty’s credit spread is applied to the Company’s exposure to the counterparty, and the Company’s own credit spread is applied to the counterparty’s exposure to the Company, and the net credit valuation adjustment is reflected in the Company’s derivative valuations. The total expected exposure of a derivative is derived using market-observable inputs, such as yield curves and volatilities. For the Company’s own credit spread and for counterparties having publicly available credit information, the credit spreads over LIBOR used in the calculations represent implied credit default swap spreads obtained from a third party credit data provider. For counterparties without publicly available credit information, which are primarily commercial banking customers, the credit spreads over LIBOR used in the calculations are estimated by the Company based on current market conditions, including consideration of current borrowing spreads for similar customers and transactions, review of existing collateralization or other credit enhancements, and changes in credit sector and entity-specific credit information. In addition,adjusting the fair value of its derivative contracts for the effect of nonperformance risk, the Company has considered the impact of netting and any applicable credit enhancements, such as collateral postings, current threshold amounts, mutual puts, and guarantees. Additionally, the Company actively monitors counterparty credit ratings for significant changes.
As of December 31, 2009, the net credit valuation adjustments reduced the settlement values of the Company’s derivative assets and liabilities by $2.0 million and $1.6 million, respectively. During 2009, the Company recognized a programgain of $3.0 million related to providecredit valuation adjustments on nonhedge derivative financial instruments, to certain customers, acting as an intermediarywhich is included in noninterest income. Various factors impact changes in the transaction. Upon issuance, allcredit valuation adjustments over time, including changes in the credit spreads of these customer derivatives are immediately “hedged” by offsettingthe parties to the contracts, as well as changes in market rates and volatilities, which affect the total expected exposure of the derivative contracts, such thatinstruments.
Although the Company has minimizeddetermined that the net risk exposure resulting frommajority of the inputs used to value its derivatives fall within Level 2 of the fair value hierarchy, the credit valuation adjustments associated with its derivatives utilize Level 3 inputs, such transactions.as estimates of current credit spreads to evaluate the likelihood of default by itself and its counterparties. However, as of December 31, 2009, the Company has assessed the significance of the impact of the credit valuation adjustments on the overall valuation of its derivative positions and has determined that the credit valuation adjustments are not significant to the overall valuation of its derivatives. As a result, the Company has classified its OTC derivative valuations in Level 2 of the fair value hierarchy.
When appropriate, valuations are also adjusted for various factors such as liquidity and bid/offer spreads, which factors were deemed immaterial by the Company as of December 31, 2009.
Share-Based Compensation
As discussed in Note 17 of the Notes to Consolidated Financial Statements, effective January 1, 2006, we adopted SFAS No. 123R,Share-Based Payment, which requires all share-based payments to employees, including grants of employee stock options, to be recognized in the statement of income based on their fair values.
The Company used the Black-Scholes option-pricing model to estimate the fair value of stock options granted in 2009. Also, the Black-Scholes option-pricing model was used to estimate the value of stock options for all stock option grants prior to 2007 and off cycleoff-cycle stock option grants during 2007.2007 and 2008. The assumptions used to apply this model include a weighted average risk-free interest rate, a weighted average expected life, an expected dividend yield, and an expected volatility. The 2009 stock options grant assumptions for significant grants were 2.24% for the weighted average risk-free interest rate, 4.5 years for the weighted average expected life, 1.0% for the expected dividend yield, and 33.0% for the expected volatility. Use of these assumptions is subjective and requires management judgment to determine the assumptions used in the model as described in Note 17.
During 2009, the Company granted 714,085 stock options and 698,311 shares of restricted stock.
From May 4-7, 2007,April 24-25, 2008, the Company successfully conducted an auction of its ESOARS.Employee Stock Option Appreciation Rights Securities (“ESOARS”). As allowed by SFAS No. 123R,ASC 718, the Company used the results of that auction to value its primary grant of employee stock options issued on May 4, 2007.April 24, 2008. The value established was $12.06$5.73 per option, which the Company estimates is approximately 14%24% below its Black-Scholes model valuation on that date. The Company recorded the related estimated future settlement obligation of ESOARS as a liability in the balance sheet. The 20072008 stock option expense for these grants was $2.7$2.2 million. If the ESOARS value was
10% lower, the expense would be $2.5$2.0 million and if the ESOARS value was 10% higher, the expense would be $3.0$2.4 million. Additionally, the primary grant of options in 2007 was valued with the results of an ESOARS auction in 2007. The number of stock options granted at the primary grant dates on May 4, 2007 and April 24, 2008 were 963,680 and 1,542,238, respectively, or 91.4% and 60.8% of the total stock options granted in 2007 and 2008, respectively.
On October 22, 2007, the Company announced it had received notification from the SEC that its ESOARS are sufficiently designed as a market-based method for valuing employee stock options under SFAS 123R.ASC 718. The SEC staff did not object to the Company’s view that the market-clearing price of ESOARS in the Company’s auction was a reasonable estimate of the fair value of the underlying employee stock options.
The accounting for stock option compensation under SFAS 123RASC 718 decreased 2009 income before income taxes by $15.8$9.6 million and net incomeearnings applicable to common shareholders by approximately $10.8$6.8 million, for 2007, or $0.10$0.05 per diluted share.share, as compared to $13.1 million, $9.2 million, and $0.08, respectively, in 2008. See Note 17 of the Notes to Consolidated Financial Statements for additional information on stock options and restricted stock.
Income Taxes
The Company is subject to the income tax laws of the United States, its states and other jurisdictions where it conducts business. These laws are complex and subject to different interpretations by the taxpayer and the various taxing authorities. In determining the provision for income taxes, management must make judgments and estimates about the application of these inherently complex laws and related regulations, and case law.regulations. In the process of preparing the Company’s tax returns, management attempts to make reasonable interpretations of the tax laws. These interpretations are subject to challenge by the tax authorities upon audit or to reinterpretationre-interpretation based on management’s ongoing assessment of facts and evolving case law.
The Company had net deferred tax assets (“DTAs”) of $498 million at December 31, 2009, compared to $479 million at December 31, 2008. The most significant portions of the deductible temporary differences relate to (1) the allowance for loan losses and (2) fair value adjustments or impairment write-downs related to securities. No valuation allowance has been recorded as of December 31, 2009 related to DTAs except for a full valuation reserve related to certain acquired net operating losses from an immaterial nonbank subsidiary. In assessing the need for a valuation allowance, both the positive and negative evidence about the realization of DTAs were evaluated. The ultimate realization of DTAs is based on the Company’s ability to carryback net operating losses to prior tax periods, tax planning strategies that are prudent and feasible, the reversal of deductible temporary differences that can be offset by taxable temporary differences and future taxable income.
The Company has available carryback potential to offset federal tax of approximately $107 million and $340 million in the 2008 and 2007 tax years, respectively. During 2009, the Company does anticipate a net operating loss for tax purposes that will largely offset the taxable income for the 2007 tax year. In the fourth quarter of 2009, the Company entered into certain Identified Mixed Straddle transactions for the management of interest rate risk on certain of its investment assets. These transactions not only increased the 2009 net operating loss, but also decreased the DTAs that existed at December 31, 2009 by approximately $150 million.
Tax planning strategies represent a source of positive evidence that must be considered when assessing the need for a valuation allowance. Tax planning strategies must be prudent and feasible (and within the control of the company), something that a company might not ordinarily implement, but would implement to prevent an operating loss or tax credit carryforward from expiring unused, and would result in the realization of DTAs. The Company has evaluated a number of tax planning strategies that, if implemented, could result in the realization of a majority of the net DTA balance that exists at December 31, 2009. These strategies mainly involve the sale of highly appreciated assets (e.g., certain fixed assets, publicly-traded securities and insurance policies). Management would not expect that the execution of any of the actions would involve a significant amount of expense.
The Company has taxable temporary differences, or deferred tax liabilities (“DTLs”) that will reverse and offset DTAs in the periods prior to the expiration of any benefits. Based on our analysis and experience, the general reversal pattern of DTLs against DTAs would be somewhat similar in character and timing. Because of this generally consistent reversal pattern, we believe it is appropriate to reduce our gross DTAs by our DTLs.
The Company has a strong history of positive earnings and has generated significant levels of net income in 42 out of the previous 45 years. While the recent economic downturn has been severe, the Company has consistently maintained strong levels of pretax, precredit-cost income. The Company is well positioned in the highest growth areas in the country and is fundamentally strong in its capital, liquidity, business practices, and has actually grown its customer base during the current economic downturn. The Company has a long history of profitability and is expected to be profitable again in the near future. The Company is relying on future taxable income to realize a small amount of its DTA and expects to generate this income through 2011.
After evaluating all of the factors previously summarized and considering the weight of the positive evidence compared to the negative evidence, management has concluded it is more likely than not that the Company will realize the existing DTAs and that an additional valuation allowance is not needed.
On a quarterly basis, management assesses the reasonableness of its effective tax rate based upon its current best estimate of net income and the applicable taxes expected for the full year. Deferred tax assets and liabilities are also reassessed on a quarterly basis, if business events or circumstances warrant.regular basis. Reserves for contingent tax liabilities are reviewed quarterly for adequacy based upon developments in tax law and the status of examinations or audits. During 2007, the Company reduced its liability for unrecognized tax benefits by approximately $12.4 million, net of any federal and/or state tax benefits. Of this reduction, $8.6 million decreased the Company’s tax provision for 2007 and $3.8 million reduced goodwill and tax-related balance sheet accounts. The Company has tax reserves at December 31, 20072009 of approximately $16.2$6.2 million, net of federal and/or state benefits, for uncertain tax positions primarily for various state tax contingencies in several jurisdictions.
PENDING ADOPTION OF ACCOUNTING PRONOUNCEMENTS
Effective January 1, 2007,On June 12, 2009, the Company adopted FASB Interpretationissued Accounting Standards Update (“ASU”) No. 48 (“FIN 48”),Accounting for Uncertainty2009-16 incorporated in Income Taxes, an interpretationASC 860,Transfers and Servicing, to address transfer and servicing accounting practices that have developed and concerns of FASB Statement No. 109, Accounting for Income Taxes. As a result of adopting this new accounting guidance, the Company reduced its existing liability for unrecognized tax benefits by approximately $10.4 million at January 1, 2007 and recognized a cumulative effect adjustment as an increase to retained earnings. See Note 15financial statement users that many of the Notesfinancial assets that have been derecognized should continue to Consolidated Financial Statements for additionalbe reported in the financial statements of transferors. Additionally, because of significant events in the credit markets, financial statement users have expressed concerns about the transparency of disclosures regarding the nature and extent of a transferor continuing involvement with transferred financial assets. The objective of ASU 2009-16 is to improve the comparability, relevance and transparency of the information that a reporting entity provides in its financial reports about a transfer of financial assets; the effects of a transfer on income taxes.its financial position, financial performance and cash flows; and a transferor’s continuing involvement in transferred financial assets. To meet those objectives, ASU 2009-16 clarifies several key principles of the derecognition criteria.
Valuation of Collateralized Debt Obligations Available-for-Sale Securities
During the third quarter of 2007, the Company enhanced its methodology to value certain CDOs, which are included in available-for-sale investment securitiesBased on the balance sheet. The Company usesnew conditions for reporting a whole market price quote method.
The whole market price quote methodtransfer of a portion of a financial asset, many transfers that have occurred in which the transferor transfers a senior interest and retains a subordinated interest in the contractual cash flows of a specified asset will not qualify for CDOs incorporates matrix pricing, which usessale accounting in the pricesfuture. Also, future transactions that involve participations, transfers of similarly ratedundivided interests, and type of securitiessyndications will require additional accounting analysis to value comparable securities held bydetermine if the Company and includes restricted single dealer quotes. The enhancement was made due to dealers’ reluctance to provide unrestricted price quotes and to provide a more representative view of comparable instruments. The mechanics of the whole market price quote method included matrix market pricing when comparable securities’ pricing was availabletransaction qualifies for securities on our balance sheet. Where comparable pricing was not available, the matrix incorporated single dealer quotes.
The pricing methodologytransfer accounting. ASU 2009-16 is consistent with the Level 2 input pricing under the fair value measurement framework of SFAS No. 157,Fair Value Measurements.effective for enterprises in fiscal years beginning after November 15, 2009. The Company will adopt SFAS 157 effectivethe ASU as of January 1, 2008. See Notes 12010 as required, and 4does not expect the adoption of this guidance to be significant to the Company’s financial statements.
On June 12, 2009, the FASB issued ASU 2009-17, which amends certain of the Noteskey provisions of ASC 810,Consolidation. ASU 2009-17 responds to Consolidated Financial Statementscertain concerns about the application of provisions of ASC 810, such as the complexity involved with determining the primary beneficiary, and concern over the lack of transparency
of enterprises’ involvement with off balance sheet structures. ASU 2009-17 eliminates the qualifying special-purpose entity scope exceptions and revises guidance for further discussion. Also see “Investment Securities Portfolio”determining whether equity lacks the characteristics of a controlling financial interest. The ASU also revises guidance on whether decision maker/service provider fees are variable interests, indicates that only substantive terms, transactions, and arrangements should be considered, and provides new criteria for determining the primary beneficiary of a variable interest entity. Finally, the ASU requires additional interim and annual disclosures and subjects more entities to consolidation assessments and reassessments. ASU 2009-17 is effective for enterprises in fiscal years beginning on page 77 for further information.
Pending Adoption of Accounting Pronouncements
Effective January 1, 2008, theafter November 15, 2009. The Company will adopt SFAS No. 157,Fair Value Measurementsand SFAS No. 159,The Fair Value Option for Financial Assets and Financial Liabilities. SFAS 157 defines fair value, establishes a consistent framework for measuring fair value, and enhances disclosures about fair value measurements. Adoptionthe ASU as of SFAS 157 has been delayed one year for the measurement of all nonfinancial assetsJanuary 1, 2010 as required, and nonfinancial liabilities. The Company does not expect that the adoption of SFAS 157 will have a material effect onthis guidance to be significant to the consolidatedCompany’s financial statements. SFAS 159 allows for the option to report certain financial assets and liabilities at fair value initially and at subsequent measurement with changes in fair value included in earnings. The option may be applied instrument by instrument, but is on an irrevocable basis. The Company has determined to apply the fair value option to one available-for-sale trust preferred REIT CDO security and three retained interests on selected small business loan securitizations. In conjunction with the adoption of SFAS 159 on the selected REIT CDO security, the Company plans to implement a directional hedging program in an effort to hedge the credit exposure the Company has to homebuilders in its REIT CDO portfolio. The cumulative effect of adopting SFAS 159 is estimated to reduce the beginning balance of retained earnings at January 1, 2008 by approximately $11.5 million, comprised of a decrease of $11.7 million for the REIT CDO and an increase of $0.2 million for the three retained interests.
RESULTS OF OPERATIONS
As previously disclosed, the Company completed its acquisition of Stockmen’s, a bank holding company with $1.2 billion in assets on January 17, 2007, and the subsequent sale of its 11 California branches on November 2, 2007, and the purchase of Intercon on September 6, 2007 with $115 million in assets. All comparisons of 2007 to 2006 and prior periods reflect the effects of these acquisitions.
As previously disclosed, the Company completed its acquisition of Amegy Bancorporation, Inc. in December 2005. All comparisons of 2007 and 2006 to 2005 and prior periods reflect the effects of the Amegy acquisition.
Net Interest Income, Margin and Interest Rate Spreads
Net interest income is the difference between interest earned on interest-bearing assets and interest incurred on interest-bearing liabilities. Taxable-equivalent net interest income is the largest component of Zions’ revenue. For the year 2007,2009, it was 82.2%70.5% of our taxable-equivalent revenues, compared to 76.4%91.3% in 20062008 and 76.0%82.2% in 2005.2007. The decreased percentage for 2009 as compared to 2008 was primarily due to the 2009 gain on subordinated debt modification of $508.9 million and acquisition related gains of $169.2 million which increased total taxable-equivalent revenues. The increased percentage for 2008 over 2007 was mainly due to the $158.2 million ofnet impairment and valuation losses on securities which reduced total taxable-equivalent noninterest revenues.revenues by $317.1 million in 2008 and $158.2 million in 2007. On a taxable-equivalent basis, net interest income for 20072009 was up $119.1down $74.5 million or 6.7%3.7% from 2006,2008, which was up $406.6$87.3 million or 29.4%4.6% from 2005.2007. The decrease in taxable-equivalent net interest income for 2009 was mainly due to the impact of increased nonaccrual loans, securities on nonaccrual status and higher average money market balances earning lower interest rates. The increase in taxable-equivalent net interest income for 20072008 was driven by strong organic loan growth thatmainly due to increased interest-earning assets driven by loan growth and partially offset by a 20declines of 25 basis point decreasepoints in the net interest margin compared to 2006. The net interest margin for 2006 was up 5 basis points from 2005.2008. The incremental tax rate used for calculating all taxable-equivalent adjustments was 35% for all years discussed and presented.
By its nature, net interest income is especially vulnerable to changes in the mix and amounts of interest-earning assets and interest-bearing liabilities. In addition, changes in the interest rates and yields associated with these assets and liabilities significantly impact net interest income. See “Interest Rate and Market Risk Management” on page 98116 for a complete discussion of how we manage the portfolios of interest-earning assets and interest-bearing liabilities and associated risk.
A gauge that we consistently use to measure the Company’s success in managing its net interest income is the level and stability of the net interest margin. The net interest margin was 3.94% in 2009 compared with 4.18% in 2008 and 4.43% in 2007 compared with 4.63% in 2006 and 4.58% in 2005.2007. For the fourth quarter of 2007,2009, the Company’s net interest margin was 4.27%. 3.81%, which was reduced by 28 basis points due to the impact of the subordinated debt discount amortization. In addition, the net interest margin continued to be under pressure due to the level of nonaccrual assets and interest reversals as loans moved into nonaccrual status.
The decreased net interest margin compression for 20072009 compared to 20062008 resulted from increased nonaccrual loans and securities; the Company’simpact of the discount amortization on the modified subordinated debt, including the effect of the conversion of subordinated debt into Series C preferred stock; and higher money market investment balances earning lower rates. This was offset in part by a lower cost mix of deposit funding, lower rates paid on interest-bearing deposits, and larger incremental spreads on new loan generation. Average loans and leases increased $0.7 billion due to the acquisition of FDIC-supported loans, and average money market investments increased $0.5 billion due to strong growth in certain deposit categories, which the Company chose not to invest in longer-duration securities. Average interest-bearing deposits increased $3.4 billion from 2008, with the increase being driven primarily by money market and savings deposits. Average borrowed funds decreased $5.3 billion compared to 2008, primarily due to decreased borrowing from the Federal Home Loan Bank (“FHLB”) and the Federal Reserve. Average noninterest-bearing deposits increased $1.9 billion compared to 2008 and were 25.8%
of total average deposits for 2009, compared to 24.3% for 2008. The net interest margin for 2009 was unfavorably impacted by 5 basis points for the discount amortization on the modified subordinated debt and an additional 7 basis points from the impact of accelerated debt discount amortization resulting from the conversion of subordinated debt into Series C preferred stock.
The spread on average interest-bearing funds for 2009 was 3.52%, which decreased from 3.68% for 2008. The spread on average interest-bearing funds for 2009 was adversely impacted by the same factors that reduced the net interest margin.
The decreased net interest margin for 2008 compared to 2007 resulted from increased nonperforming assets reducing average asset yields, loan growth being funded mainly by higher costyields dropping more than deposit products and nondeposit borrowings,rates, a decline in noninterest-bearing demand deposits, competitive pricing pressures, and purchases of low yielding Lockhart commercial paper. Higher yielding averageAverage loans and leases increased $4.4$4.2 billion from 2006 while lower yieldingand average money market investments increased $1.1 billion due to the impact of the capital investment from the U.S. Treasury and securities slightly decreased by $32.4 million.purchases of commercial paper from Lockhart. Average interest-bearing deposits increased $3.2$2.0 billion from 20062007, with most of the increase inbeing driven primarily by higher cost Internet money market, timebrokered and foreign deposits. Average borrowed funds increased $850$3.0 billion in 2008 compared to 2007, primarily due to increased borrowing from the FHLB and the Federal Reserve. Average noninterest-bearing deposits declined $257 million compared to 2006. Average noninterest-bearing deposits2007 and were 26.2%24.3% of total average deposits for 2007,2008, compared to 29.0%26.2% for 2006. Average time deposits greater than $100,000 increased to 13.3% of total average deposits compared to 10.0% for 2006.
2007.
The increased net interest margin for 2006 comparedwill continue to 2005 resulted mainly from an improved asset and liability mix and frombe adversely affected in future quarters due to the impact of increasing short-termnonperforming assets and amortization of debt discounts related to the debt modification transactions. Also, the net interest ratesmargin was previously favorably impacted by accreted swap gains on Zions’ balance sheet. Higher yielding average loans and leases increased $8.4 billion from 2005 while lower yielding average money market investments and securities increased $128terminated swaps that reduced interest expense on long-term subordinated debt. The debt modification transaction during 2009 reduced the unrecognized swaps gains. The debt modification transaction also resulted in a discount on the modified convertible subordinated debt, which as of December 31, 2009 was approximately $616 million. The net increaseThis discount will be amortized as interest expense over the remaining life of the debt using an interest method. If in interest-earnings assets was mainly funded by increases in lower cost average interest-bearing deposits, which increased $5.8 billion and average noninterest-bearing deposits which increased $2.1 billion, while average borrowed funds increased $1.1 billion from 2005.
future periods debt holders exercise their option to convert debt to preferred stock, the amortization of the discount will be accelerated at the time of conversion.
The Company expects to continue its efforts over the long run to maintain a slightly “asset-sensitive” position with regard to interest rate risk. However, because of the current low interest rate environment the Company is allowing the balance sheet to become more asset-sensitive than has historically been the case, by (1) reducing our estimatesuse of interest rate swaps against our floating rate loans; (2) terminating receive fixed / pay variable swaps on the Company’s subordinated debt; and (3) using certain straddle transactions on the CDO portfolio to manage interest rate risk. As of December 31, 2009, the Company had $0.9 billion notional amount of interest rate swaps designated as cash flow hedges, down from $2.4 billion one year ago. Such swaps are used to protect net interest income from declining in a falling rate environment by countering the effect of lost revenue on loans. With interest rates at historically low levels, there is a reduced need to protect against falling interest rates. Our estimate of the Company’s actual rate risk position areis highly dependent upon changes in both short-term and long-term interest rates, modeling assumptions, and the actions of competitors and customers in response to those changes.
During the third and fourth quarters of 2007, the FRB lowered the federal funds For further details on interest rate by 100 basis points. This decrease had a rapid impact on loans tied to LIBOR and the prime rate as these rates were lowered by 50, 25, and 25 basis points on September 18th, October 31st, and December 11th, respectively. Due to the intense competition for bank deposits, the rates paid to consumers for their deposits were lowered less than 100 basis points. Competitive pressures on deposit rates impeded our ability to reprice deposits, which had a negative impact on the net interest margin during the fourth quarter of 2007. We expect that these competitive pricing pressures may continue into 2008. Seerisk see “Interest Rate Risk” on page 99 for further information.
117.
Schedule 57 summarizes the average balances, the amount of interest earned or incurred and the applicable yields for interest-earning assets and the costs of interest-bearing liabilities that generate taxable-equivalent net interest income.
SCHEDULE 5Schedule 7
DISTRIBUTION OF ASSETS, LIABILITIES, AND SHAREHOLDERS’ EQUITY
AVERAGE BALANCE SHEETS, YIELDS AND RATES
(Amounts in millions)
| 2007 | 2006 | 2009 | 2008 | ||||||||||||||||||||||||||||||
| Average balance | Amount of interest(1) | Average rate | Average balance | Amount of interest(1) | Average rate | Average balance | Amount of interest1 | Average rate | Average balance | Amount of interest1 | Average rate | |||||||||||||||||||||||
ASSETS: | ||||||||||||||||||||||||||||||||||
ASSETS | ||||||||||||||||||||||||||||||||||
Money market investments | $ | 834 | 43.7 | 5.24% | $ | 479 | 24.7 | 5.16% | $ | 2,380 | 7.9 | 0.33 | % | $ | 1,889 | 47.8 | 2.53 | % | ||||||||||||||||
Securities: | ||||||||||||||||||||||||||||||||||
Held-to-maturity | 684 | 47.7 | 6.97 | 645 | 44.1 | 6.83 | 1,263 | 66.9 | 5.29 | 1,516 | 101.3 | 6.68 | ||||||||||||||||||||||
Available-for-sale | 4,661 | 269.2 | 5.78 | 4,992 | 285.5 | 5.72 | 3,313 | 104.1 | 3.14 | 3,266 | 162.1 | 4.97 | ||||||||||||||||||||||
Trading account | 61 | 3.3 | 5.40 | 157 | 7.7 | 4.91 | 75 | 2.7 | 3.65 | 43 | 1.9 | 4.41 | ||||||||||||||||||||||
Total securities | 5,406 | 320.2 | 5.92 | 5,794 | 337.3 | 5.82 | 4,651 | 173.7 | 3.73 | 4,825 | 265.3 | 5.50 | ||||||||||||||||||||||
Loans held for sale | 226 | 11.0 | 4.88 | 182 | 10.1 | 5.52 | ||||||||||||||||||||||||||||
Loans: | ||||||||||||||||||||||||||||||||||
Loans held for sale | 233 | 14.9 | 6.37 | 261 | 16.5 | 6.30 | ||||||||||||||||||||||||||||
Net loans and leases(2) | 36,575 | 2,852.7 | 7.80 | 32,134 | 2,463.9 | 7.67 | ||||||||||||||||||||||||||||
Net loans and leases excluding FDIC-supported loans2 | 40,455 | 2,281.6 | 5.64 | 40,795 | 2,674.4 | 6.56 | ||||||||||||||||||||||||||||
FDIC-supported loans | 1,058 | 64.4 | 6.09 | – | – | |||||||||||||||||||||||||||||
Total loans and leases | 36,808 | 2,867.6 | 7.79 | 32,395 | 2,480.4 | 7.66 | 41,513 | 2,346.0 | 5.65 | 40,795 | 2,674.4 | 6.56 | ||||||||||||||||||||||
Total interest-earning assets | 43,048 | 3,231.5 | 7.51 | 38,668 | 2,842.4 | 7.35 | 48,770 | 2,538.6 | 5.21 | 47,691 | 2,997.6 | 6.29 | ||||||||||||||||||||||
Cash and due from banks | 1,477 | 1,476 | 1,245 | 1,380 | ||||||||||||||||||||||||||||||
Allowance for loan losses | (391) | (349) | (1,104 | ) | (546 | ) | ||||||||||||||||||||||||||||
Goodwill | 2,005 | 1,887 | 1,174 | 1,937 | ||||||||||||||||||||||||||||||
Core deposit and other intangibles | 181 | 181 | 125 | 137 | ||||||||||||||||||||||||||||||
Other assets | 2,527 | 2,379 | 3,838 | 3,163 | ||||||||||||||||||||||||||||||
Total assets | $ | 48,847 | $ | 44,242 | $ | 54,048 | $ | 53,762 | ||||||||||||||||||||||||||
LIABILITIES: | ||||||||||||||||||||||||||||||||||
LIABILITIES | ||||||||||||||||||||||||||||||||||
Interest-bearing deposits: | ||||||||||||||||||||||||||||||||||
Savings and NOW | $ | 4,443 | 41.4 | 0.93 | $ | 4,180 | 30.9 | 0.74 | $ | 5,035 | 21.6 | 0.43 | $ | 4,446 | 35.6 | 0.80 | ||||||||||||||||||
Money market | 10,351 | 358.1 | 3.46 | 10,684 | 328.2 | 3.07 | 17,513 | 216.4 | 1.24 | 13,739 | 335.0 | 2.44 | ||||||||||||||||||||||
Internet money market | 1,611 | 79.8 | 4.95 | 986 | 46.2 | 4.68 | ||||||||||||||||||||||||||||
Time under $100,000 | 2,529 | 110.7 | 4.38 | 2,065 | 77.4 | 3.75 | 2,908 | 69.5 | 2.39 | 2,695 | 96.2 | 3.57 | ||||||||||||||||||||||
Time $100,000 and over | 4,779 | 231.2 | 4.84 | 3,272 | 142.6 | 4.36 | 4,327 | 98.5 | 2.28 | 4,382 | 161.9 | 3.69 | ||||||||||||||||||||||
Foreign | 2,710 | 130.5 | 4.81 | 2,065 | 95.5 | 4.62 | 2,011 | 18.7 | 0.93 | 3,166 | 84.2 | 2.66 | ||||||||||||||||||||||
Total interest-bearing deposits | 26,423 | 951.7 | 3.60 | 23,252 | 720.8 | 3.10 | 31,794 | 424.7 | 1.34 | 28,428 | 712.9 | 2.51 | ||||||||||||||||||||||
Borrowed funds: | ||||||||||||||||||||||||||||||||||
Securities sold, not yet purchased | 30 | 1.4 | 4.56 | 66 | 3.0 | 4.57 | 41 | 2.2 | 5.22 | 33 | 1.5 | 4.82 | ||||||||||||||||||||||
Federal funds purchased and security repurchase agreements | 3,211 | 148.5 | 4.62 | 2,838 | 124.7 | 4.39 | 1,923 | 5.7 | 0.30 | 2,733 | 53.3 | 1.95 | ||||||||||||||||||||||
Commercial paper | 256 | 13.8 | 5.41 | 220 | 11.4 | 5.20 | 2 | – | 1.38 | 110 | 4.2 | 3.84 | ||||||||||||||||||||||
FHLB advances and other borrowings: | ||||||||||||||||||||||||||||||||||
One year or less | 1,099 | 55.0 | 5.00 | 479 | 25.3 | 5.27 | 303 | 6.8 | 2.25 | 4,589 | 119.8 | 2.61 | ||||||||||||||||||||||
Over one year | 131 | 7.6 | 5.77 | 148 | 8.6 | 5.80 | 50 | 2.7 | 5.48 | 128 | 7.4 | 5.73 | ||||||||||||||||||||||
Long-term debt | 2,365 | 145.4 | 6.15 | 2,491 | 159.6 | 6.41 | 2,388 | 175.7 | 7.36 | 2,449 | 103.1 | 4.21 | ||||||||||||||||||||||
Total borrowed funds | 7,092 | 371.7 | 5.24 | �� | 6,242 | 332.6 | 5.33 | 4,707 | 193.1 | 4.10 | 10,042 | 289.3 | 2.88 | |||||||||||||||||||||
Total interest-bearing liabilities | 33,515 | 1,323.4 | 3.95 | 29,494 | 1,053.4 | 3.57 | 36,501 | 617.8 | 1.69 | 38,470 | 1,002.2 | 2.61 | ||||||||||||||||||||||
Noninterest-bearing deposits | 9,401 | 9,508 | 11,053 | 9,145 | ||||||||||||||||||||||||||||||
Other liabilities | 647 | 697 | 558 | 578 | ||||||||||||||||||||||||||||||
Total liabilities | 43,563 | 39,699 | 48,112 | 48,193 | ||||||||||||||||||||||||||||||
Minority interest | 36 | 34 | ||||||||||||||||||||||||||||||||
Shareholders’ equity: | ||||||||||||||||||||||||||||||||||
Preferred equity | 240 | 16 | 1,558 | 432 | ||||||||||||||||||||||||||||||
Common equity | 5,008 | 4,493 | 4,354 | 5,108 | ||||||||||||||||||||||||||||||
Controlling interest shareholders’ equity | 5,912 | 5,540 | ||||||||||||||||||||||||||||||||
Noncontrolling interests | 24 | 29 | ||||||||||||||||||||||||||||||||
Total shareholders’ equity | 5,248 | 4,509 | 5,936 | 5,569 | ||||||||||||||||||||||||||||||
Total liabilities and shareholders’ equity | $ | 48,847 | $ | 44,242 | $ | 54,048 | $ | 53,762 | ||||||||||||||||||||||||||
Spread on average interest-bearing funds | 3.56% | 3.78% | 3.52 | % | 3.68 | % | ||||||||||||||||||||||||||||
Taxable-equivalent net interest income and net yield on interest-earning assets | 1,908.1 | 4.43% | 1,789.0 | 4.63% | $ | 1,920.8 | 3.94 | % | $ | 1,995.4 | 4.18 | % | ||||||||||||||||||||||
Taxable-equivalent rates used where applicable. |
Net of unearned income and fees, net of related costs. Loans include nonaccrual and restructured loans. |
| 2005 | 2004 | 2003 | |||||||||||||||||
| Average balance | Amount of interest(1) | Average rate | Average balance | Amount of interest(1) | Average rate | Average balance | Amount of interest(1) | Average rate | |||||||||||
| $ | 988 | 31.7 | 3.21% | $ | 1,463 | 16.4 | 1.12% | $ | 1,343 | 13.0 | 0.97% | ||||||||
| 639 | 44.2 | 6.93 | 500 | 34.3 | 6.86 | – | – | ||||||||||||
| 4,021 | 207.7 | 5.16 | 3,968 | 174.5 | 4.40 | 3,736 | 171.5 | 4.59 | |||||||||||
| 497 | 19.9 | 4.00 | 732 | 29.6 | 4.04 | 711 | 24.7 | 3.47 | |||||||||||
| 5,157 | 271.8 | 5.27 | 5,200 | 238.4 | 4.59 | 4,447 | 196.2 | 4.41 | |||||||||||
| 205 | 9.8 | 4.80 | 159 | 5.1 | 3.16 | 220 | 8.3 | 3.77 | |||||||||||
| 23,804 | 1,618.0 | 6.80 | 20,887 | 1,252.8 | 6.00 | 19,105 | 1,194.2 | 6.25 | |||||||||||
| 24,009 | 1,627.8 | 6.78 | 21,046 | 1,257.9 | 5.98 | 19,325 | 1,202.5 | 6.22 | |||||||||||
| 30,154 | 1,931.3 | 6.40 | 27,709 | 1,512.7 | 5.46 | 25,115 | 1,411.7 | 5.62 | |||||||||||
| 1,123 | 1,026 | 953 | |||||||||||||||||
| (285) | (272) | (282) | |||||||||||||||||
| 746 | 648 | 711 | |||||||||||||||||
| 66 | 65 | 77 | |||||||||||||||||
| 1,799 | 1,760 | 1,630 | |||||||||||||||||
| $ | 33,603 | $ | 30,936 | $ | 28,204 | ||||||||||||||
| $ | 3,636 | 17.5 | 0.48 | $ | 3,671 | 14.1 | 0.38 | $ | 3,344 | 15.4 | 0.46 | ||||||||
| 9,086 | 182.5 | 2.01 | 8,540 | 96.4 | 1.13 | 8,063 | 88.1 | 1.09 | |||||||||||
| 756 | 20.6 | 2.72 | 606 | 10.7 | 1.76 | 467 | 8.1 | 1.74 | |||||||||||
| 1,523 | 41.7 | 2.74 | 1,436 | 27.5 | 1.92 | 1,644 | 36.9 | 2.25 | |||||||||||
| 1,713 | 54.7 | 3.19 | 1,244 | 29.2 | 2.35 | 1,290 | 33.3 | 2.58 | |||||||||||
| 737 | 23.3 | 3.16 | 338 | 4.4 | 1.30 | 186 | 1.7 | 0.89 | |||||||||||
| 17,451 | 340.3 | 1.95 | 15,835 | 182.3 | 1.15 | 14,994 | 183.5 | 1.22 | |||||||||||
| 475 | 17.7 | 3.72 | 625 | 24.2 | 3.86 | 538 | 20.4 | 3.80 | |||||||||||
| 2,307 | 63.6 | 2.76 | 2,682 | 32.2 | 1.20 | 2,605 | 25.5 | 0.98 | |||||||||||
| 149 | 5.0 | 3.36 | 201 | 3.0 | 1.51 | 215 | 3.0 | 1.41 | |||||||||||
| 204 | 5.9 | 2.90 | 252 | 2.9 | 1.14 | 145 | 1.9 | 1.32 | |||||||||||
| 228 | 11.5 | 5.05 | 230 | 11.7 | 5.08 | 237 | 12.3 | 5.19 | |||||||||||
| 1,786 | 104.9 | 5.88 | 1,659 | 74.3 | 4.48 | 1,277 | 57.3 | 4.48 | |||||||||||
| 5,149 | 208.6 | 4.05 | 5,649 | 148.3 | 2.62 | 5,017 | 120.4 | 2.40 | |||||||||||
| 22,600 | 548.9 | 2.43 | 21,484 | 330.6 | 1.54 | 20,011 | 303.9 | 1.52 | |||||||||||
| 7,417 | 6,269 | 5,259 | |||||||||||||||||
| 533 | 501 | 444 | |||||||||||||||||
| 30,550 | 28,254 | 25,714 | |||||||||||||||||
| 26 | 23 | 22 | |||||||||||||||||
| – | – | – | |||||||||||||||||
| 3,027 | 2,659 | 2,468 | |||||||||||||||||
| 3,027 | 2,659 | 2,468 | |||||||||||||||||
| $ | 33,603 | $ | 30,936 | $ | 28,204 | ||||||||||||||
| 3.97% | 3.92% | 4.10% | |||||||||||||||||
| 1,382.4 | 4.58% | 1,182.1 | 4.27% | 1,107.8 | 4.41% | ||||||||||||||
| 2007 | 2006 | 2005 | ||||||||||||||||||||||||||
| Average balance | Amount of interest1 | Average rate | Average balance | Amount of interest1 | Average rate | Average balance | Amount of interest1 | Average rate | ||||||||||||||||||||
| $ | 834 | 43.7 | 5.24 | % | $ | 479 | 24.7 | 5.16 | % | $ | 988 | 31.7 | 3.21 | % | ||||||||||||||
| 684 | 47.7 | 6.97 | 645 | 44.1 | 6.83 | 639 | 44.2 | 6.93 | ||||||||||||||||||||
| 4,661 | 269.2 | 5.78 | 4,992 | 285.5 | 5.72 | 4,021 | 207.7 | 5.16 | ||||||||||||||||||||
| 61 | 3.3 | 5.40 | 157 | 7.7 | 4.91 | 497 | 19.9 | 4.00 | ||||||||||||||||||||
| 5,406 | 320.2 | 5.92 | 5,794 | 337.3 | 5.82 | 5,157 | 271.8 | 5.27 | ||||||||||||||||||||
| 233 | 14.9 | 6.37 | 261 | 16.5 | 6.30 | 205 | 9.8 | 4.80 | ||||||||||||||||||||
| 36,575 | 2,852.7 | 7.80 | 32,134 | 2,463.9 | 7.67 | 23,804 | 1,618.0 | 6.80 | ||||||||||||||||||||
| – | – | – | – | – | – | |||||||||||||||||||||||
| 36,575 | 2,852.7 | 7.80 | 32,134 | 2,463.9 | 7.67 | 23,804 | 1,618.0 | 6.80 | ||||||||||||||||||||
| 43,048 | 3,231.5 | 7.51 | 38,668 | 2,842.4 | 7.35 | 30,154 | 1,931.3 | 6.40 | ||||||||||||||||||||
| 1,477 | 1,476 | 1,123 | ||||||||||||||||||||||||||
| (391 | ) | (349 | ) | (285 | ) | |||||||||||||||||||||||
| 2,005 | 1,887 | 746 | ||||||||||||||||||||||||||
| 181 | 181 | 66 | ||||||||||||||||||||||||||
| 2,527 | 2,379 | 1,799 | ||||||||||||||||||||||||||
| $ | 48,847 | $ | 44,242 | $ | 33,603 | |||||||||||||||||||||||
| $ | 4,443 | 41.4 | 0.93 | $ | 5,129 | 75.3 | 1.47 | $ | 4,347 | 36.7 | 0.84 | |||||||||||||||||
| 11,962 | 437.9 | 3.66 | 10,721 | 330.0 | 3.08 | 9,131 | 183.9 | 2.01 | ||||||||||||||||||||
| 2,529 | 110.7 | 4.38 | 2,065 | 77.4 | 3.75 | 1,523 | 41.7 | 2.74 | ||||||||||||||||||||
| 4,779 | 231.2 | 4.84 | 3,272 | 142.6 | 4.36 | 1,713 | 54.7 | 3.19 | ||||||||||||||||||||
| 2,710 | 130.5 | 4.81 | 2,065 | 95.5 | 4.62 | 737 | 23.3 | 3.16 | ||||||||||||||||||||
| 26,423 | 951.7 | 3.60 | 23,252 | 720.8 | 3.10 | 17,451 | 340.3 | 1.95 | ||||||||||||||||||||
| 30 | 1.4 | 4.56 | 66 | 3.0 | 4.57 | 475 | 17.7 | 3.72 | ||||||||||||||||||||
| 3,211 | 148.5 | 4.62 | 2,838 | 124.7 | 4.39 | 2,307 | 63.6 | 2.76 | ||||||||||||||||||||
| 256 | 13.8 | 5.41 | 220 | 11.4 | 5.20 | 149 | 5.0 | 3.36 | ||||||||||||||||||||
| 1,099 | 55.0 | 5.00 | 479 | 25.3 | 5.27 | 204 | 5.9 | 2.90 | ||||||||||||||||||||
| 131 | 7.6 | 5.77 | 148 | 8.6 | 5.80 | 228 | 11.5 | 5.05 | ||||||||||||||||||||
| 2,365 | 145.4 | 6.15 | 2,491 | 159.6 | 6.41 | 1,786 | 104.9 | 5.88 | ||||||||||||||||||||
| 7,092 | 371.7 | 5.24 | 6,242 | 332.6 | 5.33 | 5,149 | 208.6 | 4.05 | ||||||||||||||||||||
| 33,515 | 1,323.4 | 3.95 | 29,494 | 1,053.4 | 3.57 | 22,600 | 548.9 | 2.43 | ||||||||||||||||||||
| 9,401 | 9,508 | 7,417 | ||||||||||||||||||||||||||
| 647 | 697 | 533 | ||||||||||||||||||||||||||
| 43,563 | 39,699 | 30,550 | ||||||||||||||||||||||||||
| 240 | 16 | – | ||||||||||||||||||||||||||
| 5,008 | 4,493 | 3,027 | ||||||||||||||||||||||||||
| 5,248 | 4,509 | 3,027 | ||||||||||||||||||||||||||
| 36 | 34 | 26 | ||||||||||||||||||||||||||
| 5,284 | 4,543 | 3,053 | ||||||||||||||||||||||||||
| $48,847 | $ | 44,242 | $ | 33,603 | ||||||||||||||||||||||||
| 3.56 | % | 3.78 | % | 3.97 | % | |||||||||||||||||||||||
| $ | 1,908.1 | 4.43 | % | $ | 1,789.0 | 4.63 | % | $ | 1,382.4 | 4.58 | % | |||||||||||||||||
Schedule 68 analyzes the year-to-year changes in net interest income on a fully taxable-equivalent basis for the years indicated. For purposes of calculating the yields in these schedules, the average loan balances also include the principal amounts of nonaccrual and restructured loans. However, interest received on nonaccrual loans is included in income only to the extent that cash payments have been received and not applied to principal reductions. In addition, interest on restructured loans is generally accrued at reduced rates.
Schedule 8
SCHEDULE 6
ANALYSIS OF INTEREST CHANGES DUE TO VOLUME AND RATE
| 2007 over 2006 | 2006 over 2005 | 2009 over 2008 | 2008 over 2007 | |||||||||||||||||||||||||||||
| Changes due to | Total changes | Changes due to | Total changes | Changes due to | Total changes | Changes due to | Total changes | |||||||||||||||||||||||||
| (In millions) | Volume | Rate(1) | Volume | Rate(1) | ||||||||||||||||||||||||||||
INTEREST- EARNING ASSETS: | ||||||||||||||||||||||||||||||||
| (Amounts in millions) | Volume | Rate1 | Total changes | Volume | Rate1 | Total changes | ||||||||||||||||||||||||||
INTEREST-EARNING ASSETS | ||||||||||||||||||||||||||||||||
Money market investments | $ | 18.6 | 0.4 | 19.0 | (16.3) | 9.3 | (7.0) | $ | 1.6 | (41.5 | ) | (39.9 | ) | 26.7 | (22.6 | ) | 4.1 | |||||||||||||||
Securities: | ||||||||||||||||||||||||||||||||
Held-to-maturity | 2.7 | 0.9 | 3.6 | 0.5 | (0.6) | (0.1) | (13.3 | ) | (21.1 | ) | (34.4 | ) | 55.6 | (2.0 | ) | 53.6 | ||||||||||||||||
Available-for-sale | (18.9) | 2.6 | (16.3) | 53.7 | 24.1 | 77.8 | 1.6 | (59.6 | ) | (58.0 | ) | (69.5 | ) | (37.6 | ) | (107.1 | ) | |||||||||||||||
Trading account | (4.7) | 0.3 | (4.4) | (13.6) | 1.4 | (12.2) | 1.1 | (0.3 | ) | 0.8 | (0.8 | ) | (0.6 | ) | (1.4 | ) | ||||||||||||||||
Total securities | (20.9) | 3.8 | (17.1) | 40.6 | 24.9 | 65.5 | (10.6 | ) | (81.0 | ) | (91.6 | ) | (14.7 | ) | (40.2 | ) | (54.9 | ) | ||||||||||||||
Loans held for sale | 2.1 | (1.2 | ) | 0.9 | (2.8 | ) | (2.0 | ) | (4.8 | ) | ||||||||||||||||||||||
Loans: | ||||||||||||||||||||||||||||||||
Loans held for sale | (1.7) | 0.1 | (1.6) | 3.2 | 3.5 | 6.7 | ||||||||||||||||||||||||||
Net loans and leases(2) | 345.7 | 43.1 | 388.8 | 619.1 | 226.8 | 845.9 | ||||||||||||||||||||||||||
Net loans and leases excluding FDIC-supported loans2 | (19.2 | ) | (373.6 | ) | (392.8 | ) | 275.1 | (453.4 | ) | (178.3 | ) | |||||||||||||||||||||
FDIC-supported loans | 64.4 | – | 64.4 | – | – | – | ||||||||||||||||||||||||||
Total loans and leases | 344.0 | 43.2 | 387.2 | 622.3 | 230.3 | 852.6 | 45.2 | (373.6 | ) | (328.4 | ) | 275.1 | (453.4 | ) | (178.3 | ) | ||||||||||||||||
Total interest-earning assets | $ | 341.7 | 47.4 | 389.1 | 646.6 | 264.5 | 911.1 | $ | 38.3 | (497.3 | ) | (459.0 | ) | 284.3 | (518.2 | ) | (233.9 | ) | ||||||||||||||
INTEREST-BEARING LIABILITIES: | ||||||||||||||||||||||||||||||||
INTEREST-BEARING LIABILITIES | ||||||||||||||||||||||||||||||||
Interest-bearing deposits: | ||||||||||||||||||||||||||||||||
Savings and NOW | $ | 2.1 | 8.4 | 10.5 | 4.0 | 9.4 | 13.4 | $ | 2.4 | (16.4 | ) | (14.0 | ) | – | (5.8 | ) | (5.8 | ) | ||||||||||||||
Money market | (10.5) | 40.4 | 29.9 | 36.5 | 109.2 | 145.7 | 46.0 | (164.6 | ) | (118.6 | ) | 43.2 | (146.1 | ) | (102.9 | ) | ||||||||||||||||
Internet money market | 30.9 | 2.7 | 33.6 | 7.6 | 18.0 | 25.6 | ||||||||||||||||||||||||||
Time under $100,000 | 19.0 | 14.3 | 33.3 | 17.5 | 18.2 | 35.7 | 5.1 | (31.8 | ) | (26.7 | ) | 5.9 | (20.4 | ) | (14.5 | ) | ||||||||||||||||
Time $100,000 and over | 71.5 | 17.1 | 88.6 | 62.7 | 25.2 | 87.9 | (1.4 | ) | (62.0 | ) | (63.4 | ) | (14.4 | ) | (54.9 | ) | (69.3 | ) | ||||||||||||||
Foreign | 31.0 | 4.0 | 35.0 | 57.5 | 14.7 | 72.2 | (10.7 | ) | (54.8 | ) | (65.5 | ) | 12.1 | (58.4 | ) | (46.3 | ) | |||||||||||||||
Total interest-bearing deposits | 144.0 | 86.9 | 230.9 | 185.8 | 194.7 | 380.5 | 41.4 | (329.6 | ) | (288.2 | ) | 46.8 | (285.6 | ) | (238.8 | ) | ||||||||||||||||
Borrowed funds: | ||||||||||||||||||||||||||||||||
Securities sold, not yet purchased | (1.6) | – | (1.6) | (15.2) | 0.5 | (14.7) | 0.5 | 0.2 | 0.7 | 0.1 | – | 0.1 | ||||||||||||||||||||
Federal funds purchased and security repurchase agreements | 17.1 | 6.7 | 23.8 | 17.2 | 43.9 | 61.1 | (2.5 | ) | (45.1 | ) | (47.6 | ) | (9.3 | ) | (85.9 | ) | (95.2 | ) | ||||||||||||||
Commercial paper | 1.9 | 0.5 | 2.4 | 3.0 | 3.4 | 6.4 | (1.5 | ) | (2.7 | ) | (4.2 | ) | (5.6 | ) | (4.0 | ) | (9.6 | ) | ||||||||||||||
FHLB advances and other borrowings: | ||||||||||||||||||||||||||||||||
One year or less | 31.0 | (1.3) | 29.7 | 12.1 | 7.3 | 19.4 | (96.5 | ) | (16.5 | ) | (113.0 | ) | 91.1 | (26.3 | ) | 64.8 | ||||||||||||||||
Over one year | (1.0) | – | (1.0) | (4.0) | 1.1 | (2.9) | (4.3 | ) | (0.4 | ) | (4.7 | ) | (0.1 | ) | (0.1 | ) | (0.2 | ) | ||||||||||||||
Long-term debt | (7.8) | (6.4) | (14.2) | 44.5 | 10.2 | 54.7 | (2.5 | ) | 75.1 | 72.6 | 3.5 | (45.8 | ) | (42.3 | ) | |||||||||||||||||
Total borrowed funds | 39.6 | (0.5) | 39.1 | 57.6 | 66.4 | 124.0 | (106.8 | ) | 10.6 | (96.2 | ) | 79.7 | (162.1 | ) | (82.4 | ) | ||||||||||||||||
Total interest-bearing liabilities | $ | 183.6 | 86.4 | 270.0 | 243.4 | 261.1 | 504.5 | $ | (65.4 | ) | (319.0 | ) | (384.4 | ) | 126.5 | (447.7 | ) | (321.2 | ) | |||||||||||||
Change in taxable-equivalent net interest income | $ | 158.1 | (39.0) | 119.1 | 403.2 | 3.4 | 406.6 | $ | 103.7 | (178.3 | ) | (74.6 | ) | 157.8 | (70.5 | ) | 87.3 | |||||||||||||||
Taxable-equivalent income used where applicable. |
Net of unearned income and fees, net of related costs. Loans include nonaccrual and restructured loans. |
In the analysis of interest changes due to volume and rate, changes due to the volume/rate variance are allocated to volume with the following exceptions: when volume and rate both increase, the variance is allocated proportionately to both volume and rate; when the rate increases and volume decreases, the variance is allocated to the rate.
Provisions for Credit Losses
The provision for loan losses is the amount of expense that, based on our judgment, is required to maintain the allowance for loan losses at an adequate level based upon the inherent risks in the portfolio. The provision for unfunded lending commitments is used to maintain the reserve for unfunded lending commitments at an adequate level. In determining adequate levels of the allowance and reserve, we perform periodic evaluations of the Company’s various portfolios, the levels of actual charge-offs, and statistical trends and other economic factors. See “Credit Risk Management” on page 88103 for more information on how we determine the appropriate level for the allowance for loan and lease losses and the reserve for unfunded lending commitments.
For the year 2007,2009, the provision for loan losses was $152.2$2,016.9 million, compared to $72.6$648.3 million for 20062008 and $43.0$152.2 million for 2005.2007. The increased provision for 2007 resulted mainly from significant softening2009 was attributable to a higher level of criticized and classified loans, higher realized loss content in our credit quality, particularlythese loan categories, and continued deterioration in relation to residentialcollateral values primarily in construction and land development loans, all of which resulted in increases of some of our loss migration factors and construction activity inapplication of the Southwest, with Arizona, California,updated factors at all banking subsidiaries using the most recent loss experience. See “Nonperforming Assets” and Nevada being most severely impacted.“Allowance for Credit Losses” on pages 110 and 112 for further details. Net loan and lease charge-offs increased to $1,172.6 million in 2009 up from $393.7 million in 2008 and $63.6 million in 2007 up from $45.8 million in 2006 and $25.0 million in 2005.2007. The $17.8$778.9 million increase during 20072009 was primarily driven by higherincreased net charge-offs inof $294.8 million at NSB, $179.7 million at Zions Bank, $119.1 million at Amegy, and higher charge-offs in NBA,$82.6 million at CB&T, and NSB$67.0 million at NBA, primarily related to residential land developmentthe commercial real estate and construction loans. The provision for 2006 reflected increased provisioning driven by loan growth and a $10.9 million loss at NBA on an equipment lease related to an alleged accounting fraud at a water bottling company.
commercial lending portfolios. Including the provision for unfunded lending commitments, the total provision for credit losses was $2,082.4 million for 2009, $649.7 million for 2008, and $154.0 million for 2007, $73.82007. The provision for loan losses was $390.7 million for 2006,the fourth quarter of 2009 and $46.4 millionnet charge-offs for 2005. From period to period, the amounts of unfunded lending commitments may be subject to sizeable fluctuationquarter were $292.1 million.
The Company’s expectation is that credit costs will improve slowly in 2010 due to changes ina stabilization of economic conditions. We expect provisioning and net charge-offs to be modestly lower for at least the timing and volumenext several quarters than the recent elevated levels of loan originations and associated funding.
credit costs.
Noninterest Income
Noninterest income represents revenues the Company earns for products and services that have no interest rate or yield associated with them. Noninterest income for 20072009 comprised 17.8%29.5% of taxable-equivalent revenues, reflecting the $158.2 million of impairment and valuation losses on securities, which reduced noninterest income for 2007, compared to 23.6%8.7% for 20062008 and 24.0%17.8% for 2005.2007. Schedule 79 presents a comparison of the major components of noninterest income for the past three years.
SCHEDULE 7Schedule 9
NONINTEREST INCOME
NONINTEREST INCOME
| (Amounts in millions) | 2007 | Percent change | 2006 | Percent change | 2005 | ||||||||
Service charges and fees on deposit accounts | $ | 183.6 | 14.2 % | $ | 160.8 | 29.3 % | $ | 124.4 | |||||
Loan sales and servicing income | 38.5 | (29.0) | 54.2 | (30.3) | 77.8 | ||||||||
Other service charges, commissions and fees | 196.8 | 14.6 | 171.8 | 47.2 | 116.7 | ||||||||
Trust and wealth management income | 36.5 | 21.7 | 30.0 | 35.1 | 22.2 | ||||||||
Income from securities conduit | 18.2 | (43.5) | 32.2 | (8.0) | 35.0 | ||||||||
Dividends and other investment income | 50.9 | 27.6 | 39.9 | 33.0 | 30.0 | ||||||||
Trading and nonhedge derivative income | 3.1 | (83.2) | 18.5 | 17.8 | 15.7 | ||||||||
Equity securities gains (losses), net | 17.7 | (0.6) | 17.8 | 1,469.2 | (1.3) | ||||||||
Fixed income securities gains, net | 3.0 | (53.1) | 6.4 | 166.7 | 2.4 | ||||||||
Impairment losses on available-for-sale securities and valuation losses on securities purchased from Lockhart Funding | (158.2) | – | – | nm | (1.6) | ||||||||
Other | 22.2 | 13.3 | 19.6 | 25.6 | 15.6 | ||||||||
Total | $ | 412.3 | (25.2)% | $ | 551.2 | 26.2 % | $ | 436.9 | |||||
nm – not meaningful
| (Amounts in millions) | 2009 | Percent change | 2008 | Percent change | 2007 | |||||||||||||
Service charges and fees on deposit accounts | $ | 212.6 | 2.7 | % | $ | 207.0 | 12.7 | % | $ | 183.6 | ||||||||
Other service charges, commissions and fees | 156.5 | (6.7 | ) | 167.7 | (1.7 | ) | 170.6 | |||||||||||
Trust and wealth management income | 30.0 | (20.4 | ) | 37.7 | 3.3 | 36.5 | ||||||||||||
Capital markets and foreign exchange | 50.3 | 0.8 | 49.9 | 14.4 | 43.6 | |||||||||||||
Dividends and other investment income | 26.6 | (42.7 | ) | �� | 46.4 | (8.8 | ) | 50.9 | ||||||||||
Loan sales and servicing income | 22.3 | (8.6 | ) | 24.4 | (36.6 | ) | 38.5 | |||||||||||
Income from securities conduit | 1.1 | (80.0 | ) | 5.5 | (69.8 | ) | 18.2 | |||||||||||
Fair value and nonhedge derivative income (loss) | 113.8 | 337.1 | (48.0 | ) | (235.7 | ) | (14.3 | ) | ||||||||||
Equity securities gains (losses), net | (1.8 | ) | (325.0 | ) | 0.8 | (95.5 | ) | 17.7 | ||||||||||
Fixed income securities gains (losses), net | (3.8 | ) | (575.0 | ) | 0.8 | (73.3 | ) | 3.0 | ||||||||||
Impairment losses on investment securities: | ||||||||||||||||||
Impairment losses on investment securities | (569.9 | ) | (87.5 | ) | (304.0 | ) | (179.9 | ) | (108.6 | ) | ||||||||
Noncredit-related losses on securities not expected to be sold (recognized in other comprehensive income) | 289.4 | – | – | – | – | |||||||||||||
Net impairment losses on investment securities | (280.5 | ) | 7.7 | (304.0 | ) | (179.9 | ) | (108.6 | ) | |||||||||
Valuation losses on securities purchased | (212.1 | ) | (1,519.1 | ) | (13.1 | ) | 73.6 | (49.6 | ) | |||||||||
Gain on subordinated debt modification | 508.9 | – | – | – | – | |||||||||||||
Acquisition related gains | 169.2 | – | – | – | – | |||||||||||||
Other | 11.0 | (29.5 | ) | 15.6 | (29.7 | ) | 22.2 | |||||||||||
Total | $ | 804.1 | 321.7 | % | $ | 190.7 | (53.7 | )% | $ | 412.3 | ||||||||
Noninterest income for 2007 decreased $138.92009 increased $613.4 million or 25.2%321.7% compared to 2006.2008. The largest components of this increase were $169.2 million of acquisition related gains and the $508.9 million gain on subordinated debt modification, offset by $492.6 million of net impairment and valuation losses on securities. Fair value and nonhedge derivative income (loss) also increased $161.8 million. Noninterest income for 2008 decreased $221.6 million or 53.7% compared to 2007. The largest component of this decrease was the $158.2a $158.9 million ofincrease in impairment and valuation losses on securities. ExcludingOther significant components contributing to the impairment and valuation losses on securities, noninterest income increased $19.3 million or 3.5% compared to 2006. Noninterestdecrease in 2008 included loan sales and servicing income, for 2006 increased $114.3 million or 26.2% compared to 2005 reflecting the impact of the Amegy acquisition in December 2005. Excluding the impact of the Amegy acquisition, the largest components of this increase were inincome from securities conduit, fair value and nonhedge derivative loss, and net equity securities gains, which were $17.8 million in 2006 compared with net losses of $1.3 million in 2005, and net gains from fixed income securities, which increased $4.0 million.
gains.
Service charges and fees on deposit accounts increased $22.8$5.6 million in 2007.2009 and $23.4 million in 2008. The increased fees for 2009 primarily related to the acquisitions previously discussed and reduced business deposit account earnings credits due to lower interest rates. The increase in 2008 was mainly due to the impact of fee increases across the Company, continuing efforts to promote treasury management services to our customers, and the acquisition of Stockmen’s. The significant increase for 2006 was mainly a result of the acquisition of Amegy.
Loan sales and servicing income includes revenues from securitizations of loans as well as from revenues that we earn through servicing loans that have been sold to third parties. For 2007, loan sales and servicing income decreased 29.0% compared to 2006 and decreased 30.3% between 2006 and 2005. The decreases werereduced deposit account earnings credits due to no home equity loan securitization sale transactions in 2007, no small business loan securitization sale transactions in 2007 and 2006, lower servicing fees from lower loan balances, and retained interest impairment write-downs of $12.6 million in 2007 and $7.1 million in 2006. These write-downs resulted primarily from higher than expected loan prepayments, increased default assumptions, and changes in the interest rate environment as determined from our periodic evaluation of beneficial interests as required by EITF 99-20. As of December 31, 2007, the Company had $49.8 million of retained interests in small business securitizations recorded on the balance sheet that are exposed to additional future impairments due to the above mentioned factors. See Note 6 of the Notes to Consolidated Financial Statements for additional information on the Company’s securitization programs.rates.
Other service charges, commissions, and fees, which isare comprised of public finance fees, Automated Teller Machine (“ATM”) fees, insurance commissions, bankcard merchant fees, debit card interchange fees, cash management fees, lending commitment fees, syndication and servicing fees and other miscellaneous fees, increased $25.0decreased $11.2 million, or 14.6%6.7% from 2006,2008, which was up 47.2%down 1.7% from 2005.2007. The increasedecrease in 20072009 was primarily drivendue to lower lending related fees, official check fees, mutual fund commission fees and cash management related fees, offset by higher public financeincreased accounts receivable factoring fees. The decrease in 2008 was principally due to lower lending related fees and official check fees offset by increased accounts receivable factoring fees, debit card fees, and cash management related fees. The cash management fees include remote check imaging fees, third-party ACH transaction fees, and web-based medical claims transaction fees, remote check imaging fees, and third-party ACH transaction fees. The increase was offset by decreased insurance income of $5.0 million resulting from the sale of the Company’s Grant Hatch insurance agency and certain other insurance assets completed during the first quarter of 2007. The 2006 increase was primarily due to the Amegy acquisition.
Trust and wealth management income for 2007 increased 21.7%2009 decreased 20.4% compared to 2006,2008, which was up 35.1%3.3% compared to 2005.2007. The decrease for 2009 was primarily due to lower fees from our trust and wealth management
business resulting from lower balances of assets under management and lower 12b-1 mutual fund fees due to lower balances. The increase for 20072008 was from modest organic growth in the trust and wealth management business, partially offset by declines in fees due primarily to declines in market values of a number of asset classes.
Capital markets and foreign exchange includes trading income, public finance fees, foreign exchange income, and other capital market related fees and increased 0.8% from 2008, which was up 14.4% from 2007. The increase in 2008 was primarily driven by increased trading income, partially offset by lower public finance fees.
Dividends and other investment income consists of revenue from the Company’s bank-owned life insurance program and revenues from other investments. Revenues from other investments include dividends on FHLB stock, Federal Reserve Bank stock, and earnings from unconsolidated affiliates including growth relatedcertain alternative venture investments, and were $1.5 million in 2009, $15.6 million in 2008, and $23.0 million in 2007. The decreased income from other investments in 2009 is due to our Contango wealth managementa $14.7 million decrease in earnings from Amegy’s alternative investments program, a $14.4 million decrease in two investment funds, and associated trust business,a $5.7 million decrease in dividends from FHLB stock. These decreases were offset by a $13.6 million increase in equity in earnings of Farmer Mac and a $7.1 million increase in dividends and equity in earnings on other investments. The decreased income from other investments in 2008 is primarily due to a $14.1 million decrease in equity in earnings of Farmer Mac, offset by a $6.0 million increase in earnings from Amegy’s alternative investments program. The decrease in earnings from Farmer Mac was mainly due to their losses in securities holdings in Lehman Brothers and Fannie Mae. Revenue from bank-owned life insurance programs was $25.1 million in 2009, $30.7 million in 2008, and $27.9 million in 2007.
Loan sales and servicing income includes revenues from securitizations of loans, gains and losses from sales of loans, as well as growthrevenues that we earn through servicing loans that we sold to third parties. For 2009, loan sales and servicing income decreased 8.6% compared to 2008 and decreased 36.6% between 2008 and 2007. The decreased income in the Amegy trust and wealth management business. The increase for 2006 is2009 was primarily due to decreased servicing fees on small business loans resulting from the Amegy acquisitiondissolution of loan securitizations in Lockhart during 2008, offset by increased gains on sold mortgage loans. The decreased income for 2008 is mainly due to reduced servicing fees on securitized small business loans. Upon dissolution of securitization trusts as described in “Termination of Off-Balance Sheet Arrangement” on page 103, these loans were recorded on Zions Bank’s balance sheet and increased fees from organic growth in the trust and wealth management business.
no longer serviced for investors.
Income from securities conduit decreased $14.0$4.4 million or 43.5%80.0% for 20072009 compared to 2006.2008 and decreased 69.8% between 2008 and 2007. This income represents fees we receivereceived from Lockhart, a QSPE securities conduit. The decrease in income is due to the higher cost of asset-backed commercial paper used to fund Lockhart resulting from the recent disruptions in the credit markets and a decrease in the size of Lockhart’s securities portfolio. The book value of Lockhart’s securities portfolio declined to $2.1 billion at December 31, 2007 from $4.1 billion at December 31, 2006 due to repayments of principal and Zions’ purchase of securities outtermination of Lockhart. We expect that the book valueSee “Termination of the Lockhart portfolio will continue to decrease. Income from securities conduit will depend both on the amount of securities held in the portfolio and on the cost of the commercial paper used to fund those securities. The 8.0% decrease in income for 2006 compared to 2005 resulted from lower fees on the investment holdings in Lockhart’s securities portfolio. See “Off-BalanceOff-Balance Sheet Arrangements”Arrangement” on page 85,103, “Liquidity Management Actions” on page 106,123, and Note 6 of the Notes to Consolidated Financial Statements for further information regarding securitizations and Lockhart.
Dividends and other investment income consist of revenue from the Company’s bank-owned life insurance program, dividends on securities holdings, and revenues from other investments. Revenues from investments include dividends on Federal Home Loan Bank (“FHLB”) stock, Federal Reserve Bank stock, and equity in earnings from unconsolidated affiliates, and were $23.0 million in 2007, $13.3 million in 2006, and $11.1 million in 2005. The increased income in 2007 is primarily from investments accounted for using the equity method. Income from equity method investments was $9.7 million in 2007 compared to $2.3 million in 2006. The increase for 2006 is mainly due to the Amegy acquisition. Revenue from bank-owned life insurance programs was $27.9 million in 2007, $26.6 million in 2006, and $18.9 million in 2005.
TradingFair value and nonhedge derivative income (loss) consists of the following:
Schedule 10
SCHEDULE 8
TRADINGFAIR VALUE AND NONHEDGE DERIVATIVE INCOME (LOSS)
| (Amounts in millions) | 2007 | Percent change | 2006 | Percent change | 2005 | 2009 | Percent change | 2008 | Percent change | 2007 | |||||||||||||||||||||||
Trading income | $ | 17.3 | (3.4) | % | $ | 17.9 | 9.8 | % | $ | 16.3 | |||||||||||||||||||||||
Nonhedge derivative income (loss) | (14.2) | (2,466.7) | 0.6 | 200.0 | (0.6) | $ | 111.9 | 409.1 | % | $ | (36.2 | ) | (139.7 | )% | $ | (15.1 | ) | ||||||||||||||||
Fair value decreases on instruments elected | (0.9 | ) | 90.2 | (9.2 | ) | – | – | ||||||||||||||||||||||||||
Derivative fair value credit adjustments | 3.0 | 196.8 | (3.1 | ) | – | – | |||||||||||||||||||||||||||
Other | (0.2 | ) | (140.0 | ) | 0.5 | (37.5 | ) | 0.8 | |||||||||||||||||||||||||
Total | $ | 3.1 | $ | 18.5 | $ | 15.7 | $ | 113.8 | 337.1 | % | $ | (48.0 | ) | (235.7 | )% | $ | (14.3 | ) | |||||||||||||||
Trading and nonhedge derivative
During 2009, $104.7 million was accelerated from other comprehensive income decreased $15.4 million or 83.2% compared to 2006.earnings related to certain terminated cash flow hedging relationships. The decline is primarily due to decreases in the fair value oflosses on nonhedge derivatives resultingfor 2008 and 2007 resulted from decreasing spreads between LIBOR and the prime rate during the second half of 2007. In an effort to employ the year betweenmost liquid instrument available for Zions’ hedging program and execute transactions with the London Interbank Offer Rate (“LIBOR”) andmost economically favorable terms, it has been Zions’ practice to use LIBOR as the prime rate. Trading income for 2006 increased $1.6 million or 9.8% compared to 2005. Excluding Amegy, trading income decreased $5.2 million during 2006 mainly due tofloating index on swaps executed with external counterparties. As a decision made to close our London trading office in the fourth quarter of 2005 and reduce the amountsignificant portion of the Company’s tradingloan assets are prime rate floating loans, many of the Company’s swaps are structured with a prime floating rate. In conjunction with the execution of swaps in responsewhich the Company receives a fixed rate and pays prime, Zions also executes a swap in which it pays LIBOR plus a spread and receives prime. The Company therefore has chosen to margin pressures. Nonhedge derivative income was $0.6 million for 2006 compared to a loss of $0.6 millionretain the prime-LIBOR basis risk in 2005, which included losses of $0.9 million from two ineffective cash flow hedges.
this hedging activity.
Net equity securities gainslosses in 20072009 were $17.7$1.8 million, as compared to net gains of $17.8$0.8 million in 20062008 and $17.7 million in 2007. Net losses for 2009 included gains of $4.4 million on various investments, offset by a $3.5 million impairment loss on the Company’s investment in a public company, and net losses of $1.3$2.7 million in 2005.on venture capital equity investments. Net gains for 20072008 included a $2.5$12.4 million gain on the VISA stock redemption, a $7.7 million gain on the sale of an interest in a mutual fund management company, an $11.0 million impairment loss on the Company’s investment in a community bankFarmer Mac, and net gainslosses of $8.4 million on venture capital equity investments of $15.4 million. investments.
Net of related minority interest of $8.0impairment losses on investment securities and valuation losses on securities purchased were $492.6 million income taxes and other expenses, venture capital investments contributed $3.4 million to net income in 2007,2009, compared to $317.1 million in 2008 and $158.2 million in 2007. The 2009 losses included net incomeimpairment losses of $4.1$280.5 million for 2006certain CDOs, including bank and losses of $2.2 million for 2005.
Impairment losses of $108.6 million on eightinsurance CDOs, ABS CDOs, and REIT trust preferred CDO available-for-saleCDOs. The valuation losses in 2009 consist of $187.9 million from purchases of securities combined withfrom Lockhart, prior to fully consolidating Lockhart in June 2009, and $24.2 million for valuation adjustments to auction rate securities purchased from customers during the first quarter of 2009. The 2008 losses consisted of impairment losses of $304.0 million on ABS, REIT trust preferred, and bank and insurance trust preferred CDOs and valuation losses of $49.6$13.1 million on securities purchased from Lockhart aggregated to a $158.2 million impairment and valuation loss during 2007. The lossesLockhart. See “Other-than-Temporary-Impairment – Debt Investment Securities” on the eight REIT trust preferred CDO securities were a result of our ongoing review for other-than-temporary impairment. The valuation losses on securities purchased from Lockhart was due to marking to fair value $55 million of securities purchased after rating agency downgrades and $840 million of securities purchased due to the absence of sufficient commercial paper funding for Lockhart. Seepage 42, “Investment Securities Portfolio” on page 7791, and “Off-Balance“Termination of Off-Balance Sheet Arrangements”Arrangement” on page 85103 for further discussion.
In 2009, the Company recorded a gain on subordinated debt modification of $508.9 million. The Company exchanged approximately $0.2 billion of subordinated notes for new notes with the same terms. The remaining $1.2 billion of subordinated notes were modified to permit conversion on a par for par basis into either the Company’s Series A or Series C preferred stock.
Acquisition related gains were $169.2 million which resulted from the Company’s acquisition of failed banks from the FDIC with loss sharing agreements. The Company recognized $146.5 million in gains resulting from the acquisition of Vineyard Bank, a failed financial institution acquired from the FDIC on July 17, 2009. The gains resulted from the acquisition of assets that had fair values in excess of the fair value of liabilities assumed. The Company also recognized acquisitions related gains of $22.7 million from the acquisition of the failed Alliance Bank on February 6, 2009 by California Bank & Trust and Great Basin Bank on April 17, 2009 by Nevada State Bank. The acquisitions involved loss sharing arrangements with the FDIC.
Other noninterest income for 20072009 was $22.2$11.0 million, compared to $19.6 million for 2006 and $15.6 million for 2005. The increase in 2007 included a $2.92008 and $22.2 million gain of the sale of the Company’s insurance business duringfor 2007. The increasedecrease in 2006 was primarily due2009 and 2008 included reduced remote deposit scanner sales to the acquisition of Amegy, and NetDeposit revenue from scanner sales.third party financial institutions.
Noninterest Expense
Noninterest expense for 20072009 increased 5.6%13.3% over 2006,2008, which was 31.4%5.0% higher than in 2005.2007. The 20062009 increase was impacted by the acquisition of Amegy, $20.5 million of mergerincreased provision for unfunded lending commitments, other real estate expense, and credit related expenses and debt extinguishment costs of $7.3 million.due to the deterioration in the Company’s loan credit quality. Additionally, FDIC expense increased due to the higher premiums the FDIC has assessed on the Company’s banks. Excluding these expenses, noninterest expense decreased $29.5 million or 2.1% from 2008. Schedule 911 summarizes the major components of noninterest expense and provides a comparison of the components over the past three years.
Schedule 11
SCHEDULE 9NONINTEREST EXPENSE
NONINTEREST EXPENSE
| (Amounts in millions) | 2007 | Percent change | 2006 | Percent change | 2005 | ||||||||
Salaries and employee benefits | $ | 799.9 | 6.4 % | $ | 751.7 | 31.0 % | $ | 573.9 | |||||
Occupancy, net | 107.4 | 7.8 | 99.6 | 28.7 | 77.4 | ||||||||
Furniture and equipment | 96.5 | 8.8 | 88.7 | 30.1 | 68.2 | ||||||||
Legal and professional services | 43.8 | 9.2 | 40.1 | 15.2 | 34.8 | ||||||||
Postage and supplies | 36.5 | 10.3 | 33.1 | 23.0 | 26.9 | ||||||||
Advertising | 26.9 | 1.5 | 26.5 | 23.8 | 21.4 | ||||||||
Debt extinguishment cost | 0.1 | (98.6) | 7.3 | – | – | ||||||||
Impairment losses on long-lived assets | – | nm | 1.3 | (58.1) | 3.1 | ||||||||
Restructuring charges | – | – | – | nm | 2.4 | ||||||||
Merger related expense | 5.3 | (74.1) | 20.5 | 521.2 | 3.3 | ||||||||
Amortization of core deposit and other intangibles | 44.9 | 4.4 | 43.0 | 154.4 | 16.9 | ||||||||
Provision for unfunded lending commitments | 1.8 | 50.0 | 1.2 | (64.7) | 3.4 | ||||||||
Other | 241.5 | 11.1 | 217.4 | 20.0 | 181.1 | ||||||||
Total | $ | 1,404.6 | 5.6 % | $ | 1,330.4 | 31.4 % | $ | 1,012.8 | |||||
nm – not meaningful
| (Amounts in millions) | 2009 | Percent change | 2008 | Percent change | 2007 | ||||||||||
Salaries and employee benefits | $ | 818.8 | 1.0 | % | $ | 810.5 | 1.3 | % | $ | 799.9 | |||||
Occupancy, net | 112.2 | (1.8 | ) | 114.2 | 6.3 | 107.4 | |||||||||
Furniture and equipment | 99.9 | (0.2 | ) | 100.1 | 3.7 | 96.5 | |||||||||
Other real estate expense | 110.8 | 119.8 | 50.4 | 1,045.5 | 4.4 | ||||||||||
Legal and professional services | 37.2 | (18.2 | ) | 45.5 | 3.9 | 43.8 | |||||||||
Postage and supplies | 32.0 | (14.7 | ) | 37.5 | 2.7 | 36.5 | |||||||||
Advertising | 23.0 | (25.1 | ) | 30.7 | 14.1 | 26.9 | |||||||||
FDIC premiums | 100.5 | 405.0 | 19.9 | 206.2 | 6.5 | ||||||||||
Amortization of core deposit and other intangibles | 31.7 | (4.5 | ) | 33.2 | (26.1 | ) | 44.9 | ||||||||
Provision for unfunded lending commitments | 65.5 | 4,578.6 | 1.4 | (22.2 | ) | 1.8 | |||||||||
Other | 239.9 | 3.6 | 231.6 | (1.9 | ) | 236.0 | |||||||||
Total | $ | 1,671.5 | 13.3 | % | $ | 1,475.0 | 5.0 | % | $ | 1,404.6 | |||||
The Company’s efficiency ratio was 61.3% for 2009, compared to 67.5% for 2008 and 60.5% for 2007 compared to 56.9% for 2006 and 55.7% for 2005.2007. The increase in the efficiency ratio to 60.5% for 2007 was primarilyhas been significantly impacted due to the previously discussed impairment and valuation losses on securities. The efficiency ratio was 56.7% excludingsecurities, acquisition related gains, and the impairment and valuation losses.
gain on subordinated debt modification.
Salary costs for 2007 increased 6.4% over 2006,2009 decreased 2.0% from 2008, which were up 31.0%4.2% from 2005.2007. The decreases for 2009 resulted mainly from reduced variable pay and staff reductions. The increases for 20072008 resulted mainly from merit pay salary increases and increased staffing related to other business expansion.offset by reductions in variable pay. The salary costs for 20072009 also included share-based compensation expense of approximately $28.3$29.8 million, updown from $24.4$31.8 million for 2006. The increases for 2006 resulted primarily from the acquisition of Amegy, increased incentive plan costs, additional staffing related to the build-out of our wealth management business, NetDeposit, and to other business expansion and share-based compensation expense resulting from the adoption of SFAS 123R in 2006.2008. Employee health and insurance benefits for 20072009 increased 24.2%37.9% from 2006,2008, which increased 9.7%decreased 10.5% from 2005. The increase for 2006 resulted primarily from the acquisition of Amegy.2007. Employee health and insurance expense for 20062009 increased mainly due to higher health care costs from catastrophic claims. Employee health and insurance expense for 2008 included an adjustment which reduced expense by approximately $4.0$3.0 million to reflect accumulated cash balances availablethe elimination of a health insurance benefit. Retirement expense for 2009 increased primarily due to pay incurred but not reported medical claims.pension expenses. Retirement expense for 2008 decreased primarily because no accrual was required for the Company’s profit sharing plan. Salaries and employee benefits are shown in greater detail in Schedule 10.12.
SCHEDULE 10Schedule 12
SALARIES AND EMPLOYEE BENEFITS
| (Dollar amounts in millions) | 2007 | Percent change | 2006 | Percent change | 2005 | 2009 | Percent change | 2008 | Percent change | 2007 | ||||||||||||||||||
Salaries and bonuses | $ | 678.1 | 5.8% | $ | 641.1 | 31.7% | $ | 486.7 | $ | 692.3 | (2.0 | )% | $ | 706.5 | 4.2 | % | $ | 678.1 | ||||||||||
Employee benefits: | ||||||||||||||||||||||||||||
Employee health and insurance | 42.1 | 24.2 | 33.9 | 9.7 | 30.9 | 52.0 | 37.9 | 37.7 | (10.5 | ) | 42.1 | |||||||||||||||||
Retirement | 36.3 | (4.0) | 37.8 | 35.0 | 28.0 | 30.0 | 45.6 | 20.6 | (43.3 | ) | 36.3 | |||||||||||||||||
Payroll taxes and other | 43.4 | 11.6 | 38.9 | 37.5 | 28.3 | 44.5 | (2.6 | ) | 45.7 | 5.3 | 43.4 | |||||||||||||||||
Total benefits | 121.8 | 10.1 | 110.6 | 26.8 | 87.2 | 126.5 | 21.6 | 104.0 | (14.6 | ) | 121.8 | |||||||||||||||||
Total salaries and employee benefits | $ | 799.9 | 6.4% | $ | 751.7 | 31.0% | $ | 573.9 | $ | 818.8 | 1.0 | % | $ | 810.5 | 1.3 | % | $ | 799.9 | ||||||||||
Full-time equivalent employees (“FTEs”) at December 31 | 10,933 | 3.0% | 10,618 | 5.1% | 10,102 | |||||||||||||||||||||||
Full-time equivalent (“FTE”) employees at December 31 | 10,529 | (4.4 | )% | 11,011 | 0.7 | % | 10,933 | |||||||||||||||||||||
OccupancyOther real estate expense increased $7.8to $110.8 million, compared $50.4 million for 2008 and $4.4 million for 2007. The increase is primarily due to increased OREO balances and write-downs resulting from declining property values, mainly in Utah and Nevada.
Legal and professional services decreased $8.3 million or 7.8%18.2% compared to 20062008, which was up 28.7%3.9% from 2005.2007. The 2007 increase is impacteddecrease in 2009 was primarily driven by higher facilities renta reduction in the use of technology related consultants and professional services.
Postage and supplies expense higher facilities maintenance and utilities expense, and the impact of the acquisition of Stockmen’s. The increase for 2006 was mainly due to the Amegy acquisition.
Furniture and equipment expense for 2007 increased $7.8decreased $5.5 million or 8.8%14.7% compared to 2006,2008, which was up 30.1%2.7% from 2005.2007. The increasedecrease in 20072009 was mainlyprimarily driven by cost reduction measures implemented by the Company.
FDIC premiums for 2009 increased $80.6 million or 405.0% compared to 2008, which was up 206.2% from 2007 due to increased maintenance contract costs relatedpremium rates and a “one-time” special assessment charged by the FDIC. We expect this expense to technology and operational assets. remain elevated in 2010.
The increaseprovision for 2006 resulted primarily from the acquisition of Amegy.
Merger related expense decreased $15.2unfunded lending commitments was $65.5 million or 74.1%for 2009 compared to 2006. The decrease is mainly due to the completion of the Amegy system conversion during 2006. Merger related expenses$1.4 million for 2006 and 2005 are mainly incremental costs associated with the integration and system conversions of Amegy.2008. See Note 3 of the Notes to Consolidated Financial Statements“Provisions for additional informationCredit Losses” on merger related expenses.
page 57 for further discussion.
Other noninterest expense for 20072009 increased $24.1$8.3 million or 11.1%3.6% compared to 2006,2008, which was up 20.0%down 1.9% from 2005.2007. The increase included an $8.1in 2009 was primarily due to increased credit-related expenses of $20.9 million, offset by reductions in travel expense, other operational losses, and scanner equipment expense. During 2008 the Company reduced the Visa litigation accrual increased other real estate expensesby $5.6 million as a result of $4.3 million,Visa funding a litigation escrow account and a $4.0 million write-down on repossessed equipment, which was collateral for an equipment lease on which we recorded a loan loss related to an alleged accounting fraud at a water bottling company during the fourth quarter of 2006. The Visa litigation accrual represents an estimate of the Company’s proportionate share of a contingent obligation to indemnify Visa Inc. forsettling certain litigation matters. The increase for 2006 resulted primarily from the acquisition of Amegy.covered litigation.
Impairment Losses on Goodwill
During 2009, goodwill impairment analysis completed in the first and fourth quarters resulted in total impairment losses on goodwill of $636.2 million, almost entirely at Amegy. The annual goodwill impairment analysis completed in the fourth quarter of 2007, 20062008 resulted in total impairment losses on goodwill of $353.8 million at the NBA, Vectra, NSB, and 2005,P5 reporting units.
The primary causes of the Company completedimpairment losses on goodwill in 2009 and 2008 at the annual goodwill impairment analysis as required by SFAS 142Company’s banking reporting units were declines in market values of comparable companies, and concluded there was no impairmentreduced earnings at the reporting units, which resulted primarily from deterioration in credit quality of loan portfolios. See “Accounting for Goodwill” on page 45 for further discussion of the goodwill balances.impairment.
Foreign Operations
Zions Bank and Amegy bothSix of our subsidiary banks each operate a foreign branchesbranch in Grand Cayman, Grand Cayman Islands, B.W.I. The branches only accept deposits from qualified domestic customers. While deposits in these branches are not subject to Federal Reserve BoardFRB reserve requirements or Federal Deposit Insurance CorporationFDIC insurance requirements,premiums, there are no federal or state income tax benefits to the Company or any customers as a result of these operations.
Foreign deposits at December 31, 2009, 2008 and 2007 2006, and 2005 totaled $3.4$1.7 billion, $2.6 billion and $2.2$3.4 billion, respectively, and averaged $2.0 billion for 2009, $3.2 billion for 2008, and $2.7 billion for 2007, $2.1 billion for 2006, and $0.7 billion for 2005.2007. All of these foreign deposits were related to domestic customers of the banks. See Schedule 2935 on page 81100 for foreign loans outstanding.
In addition to the Grand Cayman branch, Zions Bank, through a wholly-owned subsidiary, had an office in the United Kingdom that provided sales support for its U.S. Dollar trading operations. The office was closed during the fourth quarter of 2005.
Income Taxes
The Company’s income tax expensebenefit for 20072009 was $235.7$401.3 million, compared to $318.0an income tax benefit of $43.4 million for 20062008 and $263.4income tax expense of $235.7 million for 2005.2007. The Company’s effective income tax rates, including the effects of minority interest,noncontrolling interests, were 24.8% in 2009, 14.0% in 2008, and 32.3% in 2007, 35.3%2007. The 2009 average effective tax rate was higher than in 2006, and 35.4%2008 primarily due to the smaller impact of nondeductible goodwill impairment charges in 2005.proportion to overall net taxable loss. See Note 15 of the Notes to Consolidated Financial Statements for more information on income taxes.
The average effective tax rate in 2008 was lower than in 2007 mainly because of the nondeductible goodwill impairment charges. Increased securities impairment charges, loan loss provision, and OREO charge-downs recorded in 2008 also affected taxable loss, thereby increasing the impact of nontaxable income relative to total loss. During the fourth quarter of 2007,2008, the Company reduced its liability for unrecognized tax benefits by approximately $12.2$9.6 million, net of any federal and/or state tax benefits. Of this reduction, $9.1$5.2 million decreased the Company’s tax provisionexpense for 20072008 and $3.1$4.4 million reduced goodwill. The primary cause of the decrease was the closing of various state statutes of limitations and tax examinations. As a result of the recognition of certain tax benefits, accrued interest payable on unrecognized tax benefits was also reduced by approximately $2.8 million, net of any federal and/or state benefits. Since the Company classifies interest and penalties related to tax matters as a component of tax expense, the reduction in interest on unrecognized tax benefits also resulted in a decrease to the Company’s tax provision for 2007. The average effective tax rate in 2007 also was lower than in prior years because the securities impairment charges recorded in 2007 affected taxable revenue, thereby increasing the proportion of nontaxable income relative to total income.
tax-related balance sheet accounts.
In 2004, the Company signed an agreement that confirmed and implemented its award of a $100 million allocation of tax credit authority under the Community Development Financial Institutions Fund set up by the U.S. Government. Under the program, Zions has invested $100 million as of December 31, 2007,2009 in a wholly-owned subsidiary which makes qualifying loans and investments. In return, Zions receives federal income tax credits that will be recognized over seven years, including the year in which the funds were invested in the subsidiary. Zions invested $20 million in its subsidiary in 2005, an additional $10 million in 2006, and another $10 million during 2007. Income tax expense was reduced by $5.9 million for 2009, $5.8 million for 2008, and $5.6 million for 2007 $4.5 million for 2006, and $4.0 million for 2005 as a result of these tax credits. We expect that we will be able to reduce the Company’s federal income tax payments by a total of $39 million over the life of this award, which is expected to be for the yearsrun from 2004 through 2013.
BUSINESS SEGMENT RESULTS
The Company manages its banking operations and prepares management reports with a primary focus on geographical area. Segments, other than the “Other” segment, that are presented in the following discussion are based on geographical banking operations. The Other segment includes the Parent, Zions Management Services Company (“ZMSC”), nonbank financial service and financial technology subsidiaries, other smaller nonbank operating units, TCBO, which was opened during the fourth quarter of 2005 and is not yet significant, and eliminations of intercompany transactions.
During 2009 Zions Bank, CB&T and NSB sold at fair value to the Parent investment securities with an amortized cost of $572 million and recorded $75.8 million, $288.1 million and $11.8 million, respectively, of fixed income securities losses. In the following schedules presenting operating segment information, these losses are included in “Loss on sale of investment securities to Parent” of the respective subsidiary. The elimination of these losses is included in “Elimination of loss on sale of investment securities to Parent” for the Other segment. For 2009, these transactions increased the net loss applicable to controlling interest at Zions Bank, CB&T and NSB by $46.8 million, $166.9 million and $7.7 million, respectively.
Operating segment information is presented in the following discussion and in Note 22 of the Notes to Consolidated Financial Statements. The accounting policies of the individual segments are the same as those of the Company. The Company allocates centrally provided services to the business segments based upon estimated or actual usage of those services.
Zions Bank
Zions Bank is headquartered in Salt Lake City, Utah and is primarily responsible for conducting the Company’s operations in Utah and Idaho. Zions Bank is the 2nd largest full-service commercial bank in Utah and the 11th4th largest in Idaho, as measured by domestic deposits booked in the state. Zions Bank alsooperates 122 full-service traditional branches and 7 banking centers in grocery stores. During the first quarter of 2009, Zions Bank exited 21 banking centers in grocery stores and opened 8 new traditional branches. The leases on these banking centers were assumed by another bank and all loans and deposits were transferred to nearby Zions Bank traditional branches. Zions Bank includes most of the Company’s Capital Markets operations, which include Zions Direct, Inc., fixed income trading, correspondent banking, public finance, and trust and investment advisory services, and liquidity and hedging services for Lockhart. Contango, a wealth management business, andLockhart until its termination in September 2009. Zions Bank also includes Western National Trust Company, which together constitute the Wealth Management Group, are also included in Zions Bank.
SCHEDULE 11
ZIONS BANK
(In millions)
| 2007 | 2006 | 2005 | ||||
CONDENSED INCOME STATEMENT | |||||||
Net interest income | $ | 551.4 | 472.3 | 407.9 | |||
Impairment losses on available-for-sale securities and valuation | (59.7) | – | (1.6) | ||||
Other noninterest income | 236.8 | 263.7 | 270.8 | ||||
Total revenue | 728.5 | 736.0 | 677.1 | ||||
Provision for loan losses | 39.1 | 19.9 | 26.0 | ||||
Noninterest expense | 463.2 | 426.1 | 391.1 | ||||
Impairment loss on goodwill | – | – | 0.6 | ||||
Income before income taxes and minority interest | 226.2 | 290.0 | 259.4 | ||||
Income tax expense | 72.2 | 98.1 | 85.4 | ||||
Minority interest | 0.2 | 0.1 | (0.1) | ||||
Net income | $ | 153.8 | 191.8 | 174.1 | |||
YEAR-END BALANCE SHEET DATA | |||||||
Total assets | $ | 18,446 | 14,823 | 12,651 | |||
Net loans and leases | 12,997 | 10,702 | 8,510 | ||||
Allowance for loan losses | 133 | 108 | 107 | ||||
Goodwill, core deposit and other intangibles | 24 | 27 | 27 | ||||
Noninterest-bearing demand deposits | 2,445 | 2,320 | 1,986 | ||||
Total deposits | 11,644 | 10,450 | 9,213 | ||||
Common equity | 1,048 | 972 | 836 | ||||
Net income for Zions Bank decreased 19.8% to $153.8 million for 2007 compared to $191.8 million for 2006 and $174.1 million for 2005. The decrease in earnings was primarily due to impairment losses on investment securities and increased provision for loan losses. Results include the Wealth Management group, which includes Contango and which had after-tax net losses of $8.8 million in 2007, $7.9 million in 2006 and $6.2 million in 2005.Company. On January 1, 2008, Welman Holdings, Inc. (“Welman”), the parent of Contango Capital Advisors, Inc. (“Contango”), became a direct subsidiary of the Parent.
Earnings at Results of operations for Zions Bank for 2007 include Welman. In 2007, Welman experienced after-tax losses of $8.8 million.
Utah’s unemployment rate was 6.7% at December 31, 2009, compared to the national rate of 10%, with most job losses over the last 18 months occurring in construction and manufacturing. Utah’s economy is also seeing weakness in areas such as trade, transportation and utilities and professional and business services. Housing prices in Utah were drivendown 10.5% in the third quarter of 2009 compared to the third quarter of 2008, which ranks the state 48th in the nation in home price decline. In 2009, Idaho’s unemployment rate was 9.1% in December compared to 6.1% in December of 2008. Like Utah, the majority of job losses in Idaho are attributable to overall economic decline in the construction and manufacturing sectors. Idaho housing starts dropped 26% from 2008 but are stabilizing and expected to reach 16,400 units by 2013. Attractive living costs and world-class recreational opportunities should assist Idaho’s economy in 2010.
Schedule 13
ZIONS BANK
| (In millions) | 2009 | 2008 | 2007 | |||||||
CONDENSED INCOME STATEMENT | ||||||||||
Net interest income | $ | 690.4 | 662.5 | 551.4 | ||||||
Net impairment losses on investment securities | (35.2 | ) | (79.4 | ) | (10.1 | ) | ||||
Valuation losses on securities purchased | (203.0 | ) | (13.1 | ) | (49.6 | ) | ||||
Loss on sale of investment securities to Parent | (75.8 | ) | – | – | ||||||
Other noninterest income | 199.3 | 207.3 | 236.8 | |||||||
Total revenue | 575.7 | 777.3 | 728.5 | |||||||
Provision for loan losses | 400.4 | 163.1 | 39.1 | |||||||
Noninterest expense | 522.5 | 463.4 | 463.2 | |||||||
Income (loss) before income taxes | (347.2 | ) | 150.8 | 226.2 | ||||||
Income tax expense (benefit) | (144.4 | ) | 44.0 | 72.2 | ||||||
Net income (loss) applicable to noncontrolling interests | 0.1 | 0.1 | 0.2 | |||||||
Net income (loss) applicable to controlling interest | $ | (202.9 | ) | 106.7 | 153.8 | |||||
YEAR-END BALANCE SHEET DATA | ||||||||||
Total assets | $ | 17,652 | 20,778 | 18,446 | ||||||
Total securities | 1,963 | 1,698 | 2,039 | |||||||
Net loans and leases | 13,990 | 14,684 | 12,910 | |||||||
Allowance for loan losses | 359 | 214 | 133 | |||||||
Goodwill, core deposit and other intangibles | 20 | 20 | 24 | |||||||
Noninterest-bearing demand deposits | 2,490 | 2,198 | 2,445 | |||||||
Total deposits | 13,823 | 16,118 | 11,644 | |||||||
Preferred equity | 460 | 250 | – | |||||||
Common equity | 1,282 | 1,044 | 1,048 | |||||||
Zions Bank had a 16.7%, or $79.1net loss of $202.9 million in 2009 compared to net income of $106.7 million for 2008 and net income of $153.8 million for 2007. The increase in net interest income. Thisthe provision for loan losses of $237.3 million, the increase resulted from strong loan growth of $2.3 billion, strong deposit growth, and stable net interest margin. Balance sheet growth reflected strong economic conditions in Zions Bank’s primary markets, the bank’s successful sales efforts, and our decision not to securitize and sell any small business loans during the year. The net interest margin was 3.90% for 2007, compared to 3.89% for 2006 and 3.68% for 2005.
Noninterest income, excluding impairment and valuation losses on securities decreased 10.2% to $236.8of $145.7 million compared to $263.7together with $75.8 million for 2006 and $269.2 million for 2005. The bank recognized other-than-temporary impairment losses on available-for-sale securities of $10.1 million and valuation losses on securities sold to the Parent were the main factors causing the decrease in earnings.
Nonperforming assets were $772.7 million at December 31, 2009 compared to $412.4 million one year ago, an increase of $360.3 million or 87.4%. This deterioration can mainly be attributed to real estate loans, including owner-occupied loans, which account for 87.4% of nonperforming loans. Nonperforming loans secured by owner-occupied properties increased $154.3 million in 2009. Nonperforming assets to net loans and other real estate owned at December 31, 2009 was 5.45% compared to 2.79% at December 31, 2008.
Net loan and lease charge-offs were $255.1 million for 2009 compared to $75.4 million for 2008 and $14.0 million for 2007. Total real estate secured net loan charge-offs were $158.9 million or 62.3% of total net charge-offs, including $85.9 million of net charge-offs related to construction and land development loans. Remaining net charge-offs are composed of $72.6 million in commercial loans and $23.6 million in consumer loans. The provision for loan losses was $400.4 million for 2009 compared to $163.1 million for 2008 and $39.1 million for 2007.
The ratio of the allowance for loan losses to net loans and leases was 2.57%, 1.45% and 1.03% at December 31, 2009, 2008 and 2007, respectively.
Net interest income at Zions Bank for 2009 increased $27.9 million or 4.2%. Average earning assets in 2009 compared to 2008 were up $1.3 billion or 7.2%. Average money market and securities balances increased $1.0
billion and average loans increased $0.3 billion in 2009. During 2009, $678 million in securities were purchased from Lockhart of $49.6 million during 2007. The valuation losses on securities purchased from Lockhart resulted fromas required by the purchase of securities pursuant to a Liquidity Agreement between the bankZions Bank and Lockhart. WhenThe net interest margin was 3.68% for 2009, compared to 3.77% for 2008 and 3.90% for 2007. The biggest driver of margin compression has been the increase in nonperforming assets and the large increase in low yielding money market and investment securities.
Other noninterest income for 2009 was $199.3 million, $207.3 million in 2008 and $236.8 million in 2007. Trading income was up $5.1 million in 2009 and up $8.6 million in 2008 from 2007. Income from securities conduit declined $4.4 million in 2009 and $12.7 million in 2008 compared to 2007. Nonhedge derivatives losses were $26.7 million in 2009, $28.6 million in 2008 and $15.0 million in 2007. Trust income was down $2.3 million in 2009 from 2008 and flat in 2008 compared with 2007. Wealth Management income was down $2.0 million in 2009 compared to 2008 and down $6.4 million in 2008 from 2007. The majority of this agreementdecrease is triggered, securitiesattributable to Contango Capital Advisors which became a subsidiary of the Parent in January 2008. Contango contributed $6.9 million in noninterest income in 2007 to Zions Bank, while its results are purchased at Lockhart’s carrying valueincluded in the “Other” segment for 2008 and recorded by the bank at fair value. See “Off-Balance Sheet Arrangements” on page 85 for further discussion of Lockhart. Income generated2009. Public Finance income was essentially flat in 2009 compared to 2008 but declined $4.5 million from providing services to Lockhart declined by $14.0 million this year to $18.2 million. This lower fee income resulted from Lockhart’s higher funding cost due to changes in LIBOR and spreads over LIBOR.2007. Loan sales and servicing income declined $14.9 million due to a reduction of $744was down $0.4 million in average sold loans, prepayments2009 from 2008 and margin compression. Also included in loan sales and servicing income was a pretax impairment charge on retained interests of $12.6$13.3 million in 20072008 compared to a $7.12007. In 2008, Zions Bank also received income from the redemption of VISA stock which contributed $7.8 million in 2006. Debit card interchange fees increased $8.5equity security gains.
Noninterest expense was $522.5 million in 2009, $463.4 million in 2008 and $463.2 million in 2007. Service charges and fees on deposit accounts increased $8.8 million as a result of increased analysis fees on commercial accounts and other service charge fees. Nonhedge derivative income declined by $15.8 million in 2007 compared to 2006. This decline is primarily due to decreases in the fair value of nonhedge derivatives resulting from decreasing spreads during the third and fourth quarters between LIBOR and the prime rate.
Noninterest expense for 20072009 increased $37.1$59.1 million or 8.7%12.8% from 2006.2008. Increases for 20072009 included an $11.5a $39.4 million or 6.0%241.9% increase in salariescredit related and benefits.other real estate owned expenses. FDIC premiums increased $27.6 million or 385.9% compared to 2008. This increase is due to increased rates and a “one-time” assessment charged by the FDIC. Advertising expense was down $5.0 million and legal and professional services were down $3.7 million in 2009. The efficiency ratio was 89.10% for 2009, as compared to 59.04% for 2008 and 62.82% for 2007. The change in the efficiency ratio was mainly due to the increase in securities losses and increases in FDIC insurance, credit and other real estate owned expenses.
Schedule 14
ZIONS BANK
| (Dollar amounts in millions) | 2009 | 2008 | 2007 | |||||||
PERFORMANCE RATIOS | ||||||||||
Return on average assets | (0.98 | )% | 0.55 | % | 0.98 | % | ||||
Return on average common equity | (17.83 | )% | 9.90 | % | 15.04 | % | ||||
Efficiency ratio | 89.10 | % | 59.04 | % | 62.82 | % | ||||
Net interest margin | 3.68 | % | 3.77 | % | 3.90 | % | ||||
RISK-BASED CAPITAL RATIOS | ||||||||||
Tier 1 leverage | 8.84 | % | 6.91 | % | 6.22 | % | ||||
Tier 1 risk-based capital | 10.29 | % | 8.32 | % | 6.84 | % | ||||
Total risk-based capital | 11.52 | % | 11.33 | % | 10.75 | % | ||||
CREDIT QUALITY | ||||||||||
Provision for loan losses | $ | 400.4 | 163.1 | 39.1 | ||||||
Net loan and lease charge-offs | 255.1 | 75.4 | 14.0 | |||||||
Ratio of net charge-offs to average loans and leases | 1.77 | % | 0.53 | % | 0.12 | % | ||||
Allowance for loan losses | $ | 359 | 214 | 133 | ||||||
Ratio of allowance for loan losses to net loans and leases | 2.57 | % | 1.45 | % | 1.03 | % | ||||
Nonperforming assets | $ | 772.7 | 412.4 | 45.0 | ||||||
Ratio of nonperforming assets to net loans and leases and other real estate owned | 5.45 | % | 2.79 | % | 0.35 | % | ||||
Accruing loans past due 90 days or more | $ | 53.0 | 83.5 | 36.5 | ||||||
Ratio of accruing loans past due 90 days or more to net loans and leases | 0.38 | % | 0.57 | % | 0.28 | % | ||||
OTHER INFORMATION | ||||||||||
Full-time equivalent employees | 2,345 | 2,525 | 2,668 | |||||||
Domestic offices: | ||||||||||
Traditional branches | 122 | 112 | 109 | |||||||
Banking centers in grocery stores | 7 | 29 | 29 | |||||||
Foreign office | 1 | 1 | 1 | |||||||
Total offices | 130 | 142 | 139 | |||||||
ATMs | 149 | 176 | 184 | |||||||
Net loans and leases contracted $694 million or 4.7% in 2009 compared to 2008. Commercial lending decreased by $436 million, consumer lending was down $354 million and commercial real estate increased $82 million. Of the $82 million increase in commercial real estate, construction and land development declined $195 million while commercial term real estate increased $277 million in 2009.
Total deposits decreased $2.3 billion in 2009 compared to 2008. The large decrease in 2009 deposits came from brokered deposits which were down $1.1 billion, and foreign deposits that were down $1.0 billion. Noninterest-bearing demand deposits increased $292 million in 2009 compared to 2008. The retail branch network had significant core deposit growth in 2009. The ratio of noninterest-bearing demand deposits to total deposits was 18.0% in 2009, 13.6% in 2008 and 21.0% in 2007.
Total securities increased $265 million or 15.6% in 2009 compared to 2008. The change mainly came from Zions Bank expensed $5.1purchasing $678 million of the Company’s total Visa litigation accrual of $8.1 million, which represents an estimate of the Company’s proportionate share of a contingent obligation to indemnify Visa Inc. for certain litigation matters. Bankcard expenses increased $9.0 million primarily because of volume increases in debit and credit card transactions.
Year-end deposits for 2007 increased 11.4%securities from 2006 or $1.2 billion compared to growth of $1.2 billion or 13.4% over 2005. Both the branch network and Internet Banking deposit products contributed to this growth.
SCHEDULE 12
ZIONS BANK
(Dollar amounts in millions)
| 2007 | 2006 | 2005 | ||||
PERFORMANCE RATIOS | |||||||
Return on average assets | 0.98% | 1.39% | 1.40% | ||||
Return on average common equity | 15.04% | 21.47% | 22.22% | ||||
Tangible return on average tangible common equity | 15.49% | 22.27% | 23.32% | ||||
Efficiency ratio | 62.82% | 57.15% | 56.95% | ||||
Net interest margin | 3.90% | 3.89% | 3.68% | ||||
CREDIT QUALITY | |||||||
Provision for loan losses | $ | 39.1 | 19.9 | 26.0 | |||
Net loan and lease charge-offs | 14.0 | 18.9 | 17.5 | ||||
Ratio of net charge-offs to average loans and leases | 0.12% | 0.20% | 0.21% | ||||
Allowance for loan losses | $ | 133 | 108 | 107 | |||
Ratio of allowance for loan losses to net loans and leases | 1.02% | 1.01% | 1.26% | ||||
Nonperforming assets | $ | 45.0 | 17.1 | 22.1 | |||
Ratio of nonperforming assets to net loans and leases and | 0.35% | 0.16% | 0.26% | ||||
Accruing loans past due 90 days or more | $ | 36.5 | 8.5 | 4.4 | |||
Ratio of accruing loans past due 90 days or more to net | 0.28% | 0.08% | 0.05% | ||||
OTHER INFORMATION | |||||||
Full-time equivalent employees | 2,668 | 2,687 | 2,517 | ||||
Domestic offices: | |||||||
Traditional branches | 109 | 107 | 104 | ||||
Banking centers in grocery stores | 29 | 29 | 30 | ||||
Foreign office | 1 | 1 | 1 | ||||
Total offices | 139 | 137 | 135 | ||||
ATMs | 184 | 165 | 178 | ||||
Nonperforming assets forLockhart. Zions Bank were $45.0sold at fair value investment securities with an amortized cost of $138 million to the Parent in 2009.
The bank continued to be well capitalized in 2009. Its total risk-based capital ratio was 11.52% at December 31, 2007, up from $17.1 million2009, 11.33% at December 31, 2006. Accruing loans past due 90 days or more increased to $36.5 million compared to $8.5 million2008 and 10.75% at year-end 2006. Net loan and lease charge-offsDecember 31, 2007. The increase in the total
risk-based capital ratio for 2007 were $14.0 million compared with $18.9 million for 2006. For 2007, Zions Bank’s loan loss provision was $39.1 million compared with $19.9 million for 2006 and $26.0 million for 2005. The increased provision for 20072009 was mainly driven by loan growthdue to the issuance of qualifying Tier 1 capital preferred stock of $210 million to the Parent, a $305 million net decrease of qualifying Tier 2 capital subordinated debt due to the Parent, a $120 million capital contribution from the Parent, $275 million of capital in the form of loans and securities contributed to Zions Bank from the increase in nonperforming assets.Parent, and net loss of $202.9 million.
During 2007,2009, Zions Bank ranked as Utah’s top SBA 7(a) lender for the 14th16th consecutive year and ranked first1st in Idaho’s Boise District for the sixtheighth consecutive year.
California Bank & Trust
CB&TCalifornia Bank & Trust is a full service commercial bank headquartered in San Diego, California, and is the fourteenthtwelfth largest financial institutionfull-service commercial bank in California as measured by domestic deposits booked in the state. CB&T operates 90106 full-service traditional branch officesbranches throughout the state. CB&T manages its branch network by a&T’s regional structure allowingallows decision-making to remain as close as possible to the customer.customer, facilitating reasoned and rapid response with an understanding of the local marketplace. These regions include San Diego, Los Angeles, Orange County, San Francisco, Sacramento, Central Valley, San Bernardino and the Central Valley. In addition to the regional structure, core businesses are managed functionally. These functions include retail banking, corporate and commercial banking, construction and commercial real estate financing, and SBA lending.Riverside. CB&T plans to continue its emphasis oncore business of relationship banking by providing commercial, real estate and consumer lending, depository services, international banking, cash management and community development services. During 2009, CB&T acquired certain assets and liabilities of Alliance Bank and Vineyard Bank from the FDIC as receiver of those two failed banks. Prior to the purchase accounting adjustments, the two FDIC-assisted transactions had approximately $2.7 billion of assets, including $2.3 billion of loans and $2.5 billion of deposits. The loans and other real estate acquired are covered by loss share agreements with the FDIC.
California represents approximately 13% of the nation’s gross domestic product. Like other parts of the country, California in 2009 experienced significant declines in real estate values and one of the worst recessions in recent times. Its unemployment rate was 12.4% in December 2009. The state government is facing a current budget deficit of approximately $20 billion. An economic turnaround is not likely to happen quickly. However, there are some modest signs of stabilization. For example, median home prices statewide have stopped falling after 27 months of year-over-year declines.
SCHEDULE 13
Schedule 15
CALIFORNIA BANK & TRUST
(In millions)
| 2007 | 2006 | 2005 | ||||
CONDENSED INCOME STATEMENT | |||||||
Net interest income | $ | 434.8 | 469.4 | 451.4 | |||
Impairment losses on available-for-sale securities | (79.2) | – | – | ||||
Other noninterest income | 87.3 | 80.7 | 75.0 | ||||
Total revenue | 442.9 | 550.1 | 526.4 | ||||
Provision for loan losses | 33.5 | 15.0 | 9.9 | ||||
Noninterest expense | 230.8 | 244.6 | 243.9 | ||||
Income before income taxes | 178.6 | 290.5 | 272.6 | ||||
Income tax expense | 71.2 | 117.9 | 109.7 | ||||
Net income | $ | 107.4 | 172.6 | 162.9 | |||
YEAR-END BALANCE SHEET DATA | |||||||
Total assets | $ | 10,156 | 10,416 | 10,896 | |||
Net loans and leases | 7,792 | 8,092 | 7,671 | ||||
Allowance for loan losses | 105 | 95 | 91 | ||||
Goodwill, core deposit and other intangibles | 390 | 400 | 408 | ||||
Noninterest-bearing demand deposits | 2,509 | 2,824 | 2,952 | ||||
Total deposits | 8,082 | 8,410 | 8,896 | ||||
Common equity | 1,067 | 1,123 | 1,072 | ||||
| (In millions) | 2009 | 2008 | 2007 | |||||||
CONDENSED INCOME STATEMENT | ||||||||||
Net interest income | $ | 465.3 | 414.3 | 434.8 | ||||||
Net impairment losses on investment securities | (31.8 | ) | (118.0 | ) | (79.2 | ) | ||||
Loss on sale of investment securities to Parent | (288.1 | ) | – | – | ||||||
Acquisition related gains | 152.7 | – | – | |||||||
Other noninterest income | 152.8 | 82.6 | 87.3 | |||||||
Total revenue | 450.9 | 378.9 | 442.9 | |||||||
Provision for loan losses | 251.5 | 82.9 | 33.5 | |||||||
Noninterest expense | 295.2 | 239.0 | 230.8 | |||||||
Income (loss) before income taxes | (95.8 | ) | 57.0 | 178.6 | ||||||
Income tax expense (benefit) | (45.6 | ) | 18.4 | 71.2 | ||||||
Net (loss) income | $ | (50.2 | ) | 38.6 | 107.4 | |||||
YEAR-END BALANCE SHEET DATA | ||||||||||
Total assets | $ | 11,097 | 10,137 | 10,156 | ||||||
Total securities | 292 | 654 | 951 | |||||||
Net loans and leases | 8,951 | 7,861 | 7,792 | |||||||
Allowance for loan losses | 223 | 116 | 105 | |||||||
Goodwill, core deposit and other intangibles | 396 | 386 | 390 | |||||||
Noninterest-bearing demand deposits | 3,119 | 2,338 | 2,509 | |||||||
Total deposits | 9,760 | 7,964 | 8,082 | |||||||
Preferred equity | 262 | 158 | – | |||||||
Common equity | 1,120 | 1,097 | 1,067 | |||||||
Net income for CB&T decreased 37.8%$88.8 million to a net loss of $50.2 million for 2009 compared to net income of $38.6 million for 2008 and $107.4 million in 2007 compared with $172.6 million for 2006, and $162.9 million for 2005.2007. The decrease in earningsnet income was primarily due to a decrease in net interest income, impairment losses on investment securities and increased provision for loan losses.
Net interest income for 2007 decreased 7.4% or $34.6 million to $434.8 million compared to $469.4 million for 2006 and $451.4 million for 2005. The decrease was the result of a 6.3% or $620 million decrease in average earning assets, primarily due to lower loan balances in the residential land acquisition and development and construction portfolios, and to a lesser extent a lower net interest margin. Net interest income for 2006 increased 4.0% or 18.0 million compared to 2005. This increase was attributable to a 6.2% or $572 million growth in average earning assets offset slightly by a lower net interest margin.
Noninterest income, excluding impairment losses on available-for-sale securities, increased $6.6 million to $87.3 million for 2007 compared to $80.7 million for 2006 and $75.0 million for 2005.
Noninterest expense for 2007 decreased $13.8 million or 5.6% to $230.8 million compared to $244.6 million for 2006 and $243.9 for 2005. Decreases for 2007 included a $7.7 million or 5.6% decrease in salaries and benefits related to a reversal of an accrual for a long-term incentive plan and lower accruals for profit sharing and bonus incentives, a $1.7 million or 21.3% decrease in furniture and equipment expense, a $0.8 million or 12.5% decrease in legal and professional services and a $2.0 million or 65.8% decrease in advertising.
SCHEDULE 14
CALIFORNIA BANK & TRUST
(Dollar amounts in millions)
| 2007 | 2006 | 2005 | ||||
PERFORMANCE RATIOS | |||||||
Return on average assets | 1.06% | 1.59% | 1.59% | ||||
Return on average common equity | 9.83% | 15.40% | 15.53% | ||||
Tangible return on average tangible common equity | 16.02% | 24.68% | 26.26% | ||||
Efficiency ratio | 52.07% | 44.42% | 46.29% | ||||
Net interest margin | 4.76% | 4.81% | 4.91% | ||||
CREDIT QUALITY | |||||||
Provision for loan losses | $ | 33.5 | 15.0 | 9.9 | |||
Net loan and lease charge-offs | 23.1 | 10.9 | 4.9 | ||||
Ratio of net charge-offs to average loans and leases | 0.29% | 0.14% | 0.07% | ||||
Allowance for loan losses | $ | 105 | 95 | 91 | |||
Ratio of allowance for loan losses to net loans and leases | 1.35% | 1.17% | 1.18% | ||||
Nonperforming assets | $ | 62.4 | 27.1 | 20.0 | |||
Ratio of nonperforming assets to net loans and leases and | 0.80% | 0.34% | 0.26% | ||||
Accruing loans past due 90 days or more | $ | 13.0 | 3.5 | 1.7 | |||
Ratio of accruing loans past due 90 days or more to net | 0.17% | 0.04% | 0.02% | ||||
OTHER INFORMATION | |||||||
Full-time equivalent employees | 1,572 | 1,659 | 1,673 | ||||
Domestic offices: | |||||||
Traditional branches | 90 | 91 | 91 | ||||
ATMs | 103 | 103 �� | 105 | ||||
Net loans and leases contracted $300 million or 3.7% in 2007 compared to 2006. Commercial and small business loans grew modestly in 2007 compared to 2006, while real estate construction, commercial real estate, residential real estate and consumer loans declined. This reduction in earning assets resulted from CB&T’s decision to reduce its loan exposure to residential land acquisition and development activities in response to deteriorating market and credit conditions. This deterioration also drove the increase in
the provision for loan losses, to $33.5 million in 2007 compared to $15.0 million in 2006, as well asoffset by the increased net loan charge-offs. CB&T continues to emphasize growinggains on the commercialFDIC-assisted acquisitions of Alliance Bank and small business loan portfolios and managing the run-off of real estate loans. CB&T does not expect total loans to grow significantly in 2008 compared to 2007 given the tenuous business climate and uncertain economy.
Total deposits declined $328 million or 3.9% in 2007 compared to 2006. The ratio of noninterest-bearing deposits to total deposits was 31.0% in 2007 and 33.6% in 2006. CB&T was challenged in its deposit growth in 2007 and will continue to be challenged in 2008.
Vineyard Bank.
Nonperforming assets, excluding FDIC-supported assets, were $62.4$261.6 million at December 31, 20072009 compared to $27.1$147.0 million one year ago, an increase of $35.3$114.6 million or 130.3%78.0%. Nearly allNonperforming assets are comprised of nonaccrual loans of $238.1 million and foreclosed real estate of $23.5 million for 2009 compared to $135.0 million of nonaccrual loans and $12.0 million of foreclosed real estate in 2008. The majority of the increase in nonaccrual loans is attributable to deterioration ofin commercial and industrial, owner occupied commercial real estate construction, land development(including SBA 504 loans), and landinvestor commercial real estate loans. Nonperforming assets (excluding FDIC-supported assets) to net loans and other real estate owned at December 31, 20072009 was 0.80%3.43% compared to 0.34%1.87% at December 31, 2006. 2008.
Net loan and lease charge-offs were $144.4 million for 2009 compared to $61.8 million for 2008 and $23.1 million for 2007 compared with $10.92007. Net loan and lease charge-offs in 2009 were comprised primarily of commercial and industrial, and commercial real estate loans. The provision for loan losses was $251.5 million for 2006 and $4.92009 compared to $82.9 million for 2005. CB&T’s loan loss provision was2008 and $33.5 million for 2007 compared to $15.0 million for 2006 and $9.9 million for 2005.2007. The ratio of the allowance for loan losses to net loans and leases excluding FDIC-supported loans was 1.35%2.94% and 1.17%1.48% at December 31, 20072009 and 2006,2008, respectively.
Net interest income for 2009 increased $51.0 million or 12.3%. This increase resulted primarily from the increase in earning assets from the acquisitions of Alliance Bank and Vineyard Bank and the improvement in the net interest margin. The net interest margin was 4.88% for 2009, compared to 4.51% for 2008 and 4.76% for
2007. The net interest margin improvement resulted primarily from increased spreads on loans, the lower cost of deposits and repayment of higher cost long-term debt.
CB&T recognized net impairment losses on CDOs of $31.8 million in 2009 compared to $118.0 million in 2008 and $79.2 million in 2007. In addition, CB&T recognized losses of $288.1 million on sales of CDOs to the Parent. The acquisition of assets and liabilities of Alliance Bank and Vineyard Bank in 2009 resulted in the recognition of acquisition related gains of $152.7 million.
Other noninterest income for 2009 increased $70.2 million to $152.8 million compared to $82.6 million for 2008 and $87.3 million for 2007. The largest changes in noninterest income were a $72.1 million increase in fair value and nonhedge derivative income related to the early termination of interest rate hedges and hedge ineffectiveness on outstanding cash flow hedging relationships and a $3.1 million increase in service charges on deposit accounts, offset by a $4.8 million decrease in other service charges, commissions, and fees, and a $1.3 million decrease in dividend income.
Noninterest expense for 2009 increased $56.2 million or 23.5% to $295.2 million from $239.0 million for 2008 and $230.8 million for 2007. Increases for 2009 include a $7.8 million or 151.2% increase in credit related and other real estate owned expenses. FDIC premiums were up $18.6 million due to increased rates and a “one-time” assessment charged by the FDIC as well as overall deposit growth. Salaries and employee benefits increased $17.5 million due to the impact of increased employees coming from FDIC-assisted acquisitions of Alliance Bank and Vineyard Bank. The efficiency ratio was 65.42% for 2009, compared to 63.03% for 2008 and 52.07% for 2007.
Schedule 16
CALIFORNIA BANK & TRUST
| (Dollar amounts in millions) | 2009 | 2008 | 2007 | |||||||
PERFORMANCE RATIOS | ||||||||||
Return on average assets | (0.46 | )% | 0.38 | % | 1.06 | % | ||||
Return on average common equity | (4.41 | )% | 3.59 | % | 9.83 | % | ||||
Efficiency ratio | 65.42 | % | 63.03 | % | 52.07 | % | ||||
Net interest margin | 4.88 | % | 4.51 | % | 4.76 | % | ||||
RISK-BASED CAPITAL RATIOS | ||||||||||
Tier 1 leverage | 8.81 | % | 8.77 | % | 6.97 | % | ||||
Tier 1 risk-based capital | 10.25 | % | 8.33 | % | 7.33 | % | ||||
Total risk-based capital | 11.51 | % | 11.05 | % | 11.58 | % | ||||
CREDIT QUALITY | ||||||||||
Provision for loan losses | $ | 251.5 | 82.9 | 33.5 | ||||||
Net loan and lease charge-offs | 144.4 | 61.8 | 23.1 | |||||||
Ratio of net charge-offs to average loans and leases | 1.85 | % | 0.78 | % | 0.29 | % | ||||
Allowance for loan losses | $ | 223 | 116 | 105 | ||||||
Ratio of allowance for loan losses to net loans and leases excluding FDIC-supported loans | 2.94 | % | 1.48 | % | 1.35 | % | ||||
Nonperforming assets, excluding FDIC-supported assets | $ | 261.6 | 147.0 | 62.3 | ||||||
Ratio of nonperforming assets, excluding FDIC-supported assets to net loans and leases and other real estate owned | 3.43 | % | 1.87 | % | 0.80 | % | ||||
Accruing loans past due 90 days or more, excluding FDIC-supported loans | $ | 11.9 | 7.4 | 13.0 | ||||||
Ratio of accruing loans past due 90 days or more, excluding FDIC-supported loans to net loans and leases | 0.16 | % | 0.09 | % | 0.17 | % | ||||
OTHER INFORMATION | ||||||||||
Full-time equivalent employees | 1,653 | 1,474 | 1,572 | |||||||
Domestic offices: | ||||||||||
Traditional branches | 106 | 90 | 90 | |||||||
Foreign office | 1 | 1 | – | |||||||
Total offices | 107 | 91 | 90 | |||||||
ATMs | 120 | 103 | 103 | |||||||
Net loans and leases increased $1,090 million or 13.9% in 2009 compared to 2008. However, excluding the acquisitions of Alliance Bank and Vineyard Bank, loans decreased $260 million or 3.3% in 2009 compared to 2008. The decrease was comprised of $140 million in commercial lending and $440 million of construction and land development loans, offset by increases of $283 million in commercial real estate term loans and $39 million in consumer loans. CB&T continues to diversify its credit risks by reducing construction and land development loans. CB&T expects modest net loan growth, as growth in organically generated loans is expected to be offset by reductions in balances resulting from workouts of the FDIC-supported loan portfolios. CB&T continues to focus on growing the commercial and small business loan portfolios, while managing credit risk.
Total deposits increased $1,796 million or 22.6% in 2009 compared to 2008. Contributions to this increase were the acquisitions of Alliance Bank and Vineyard Bank of $930 million, organic growth of $464 million and foreign deposit growth of $402 million. The ratio of noninterest-bearing demand deposits to total deposits was 32.0% in 2009 and 29.4% in 2008. CB&T believes the increase in the ratio was due to the desire of depositors to carry larger balances in fully FDIC-insured noninterest-bearing accounts. CB&T expects the ratio to decline in 2010 when the FDIC removes the unlimited insurance feature. CB&T does not generally rely on or solicit
brokered deposits. At December 31, 2009 brokered deposits were $40 million compared to $2 million at December 31, 2008. The year-end 2009 balances consisted entirely of brokered time deposits acquired from Alliance Bank.
Total securities declined $362 million or 55.4% to $292 million in 2009 compared to $654 million in 2008. The change was driven primarily by the sale of CDOs to the Parent.
The Tier 1 leverage, Tier 1 risk-based capital and total risk-based capital ratios all improved at December 31, 2009 compared to December 31, 2008 due to a combination of higher Tier 1 capital and lower risk-weighted assets. Tier 1 capital increased as a result of a $25 million capital infusion and the conversion of $154.5 million of Tier 2 capital to Tier 1 capital, offset by the net loss for the year.
Amegy Corporation
Amegy is headquartered in Houston, Texas and operates Amegy Bank, the tenth6th largest full-service commercial bank in Texas as measured by domestic deposits in the state. Amegy operatesoffers 69 full-service traditional branches and eighttwo banking centers in grocery stores in the Houston metropolitan area, and six traditional branches and one loan production office in the Dallas metropolitan area. During 2007, Amegy expanded its presence in the San Antonio market through the acquisition of Intercontinental Bank Shares Corporation (“Intercon Bank”) on September 6, 2007. Intercon had $115 million in total assetsarea and added three branches to Amegy’s presence bringing the total to fourfive traditional branches in that market.San Antonio. Amegy also operates a broker-dealer (“Amegy Investments”), a trust and private bank, and a mortgage company (“Amegy Mortgage Company”)., a broker-dealer (“Amegy Investments”), an insurance agency (“Amegy Insurance Agency”), and a trust and private banking group.
The Texas added moreeconomy – the world’s 12th largest – continued to fare better than others in the nation, but did feel the effects of the recession in 2009. Texas lost 275,900 jobs than any other state in 2007, with two of2009 compared to the nation’s 4.2 million job losses during the same period. Amegy’s three primary markets among– Houston, Dallas, and San Antonio – all experienced a small decline in employment of about 1%, but they and other markets within the top five fastest growing metropolitan areas instate have continued to keep Texas’s unemployment rate below the nation. Houston has a diversified economy driven by energy, healthcare, andnational average for 36 consecutive months. Recognized as an leading international business and in 2007 it added 99,400center, the Houston Metropolitan Statistical Area (“MSA”) reported total jobs for a total ofDecember 2009 at 2.6 million jobs. Dallas also has a diversified economymillion. The Dallas-Fort Worth-Arlington MSA, which is driven by the telecommunications, distributiontrade, transportation and transportation industries. The Dallas-Fort Worth metroplex added 113,700utilities industries, reported 2.9 million jobs in 2007 forwhile a totalstrong healthcare industry strongly influenced San Antonio’s job count of three million jobs. In addition, the San Antonio economy added approximately 28,100 jobs in 2007 based on strong growth in healthcare, tourism, and trade with a growing manufacturing sector. In 2008, Amegy plans to continue its expansion in its primary markets and plans to open two traditional branches in the Houston market, two in the Dallas/Ft. Worth metropolis, and one in San Antonio.nearly 850,000.
Schedule 17
AMEGY CORPORATION
| (In millions) | 2009 | 2008 | 2007 | |||||
CONDENSED INCOME STATEMENT | ||||||||
Net interest income | $ | 385.7 | 370.1 | 331.3 | ||||
Valuation losses on securities purchased | (7.5 | ) | – | – | ||||
Other noninterest income | 136.1 | 192.9 | 126.7 | |||||
Total revenue | 514.3 | 563.0 | 458.0 | |||||
Provision for loan losses | 406.1 | 71.9 | 21.2 | |||||
Noninterest expense | 345.6 | 305.2 | 295.6 | |||||
Impairment loss on goodwill | 633.3 | – | – | |||||
Income (loss) before income taxes | (870.7 | ) | 185.9 | 141.2 | ||||
Income tax expense (benefit) | (90.3 | ) | 60.5 | 46.7 | ||||
Net income (loss) applicable to noncontrolling interests | – | 0.3 | 0.1 | |||||
Net income (loss) applicable to controlling interest | $ | (780.4 | ) | 125.1 | 94.4 | |||
YEAR-END BALANCE SHEET DATA | ||||||||
Total assets | $ | 11,145 | 12,406 | 11,675 | ||||
Total securities | 850 | 693 | 895 | |||||
Net loans and leases | 8,262 | 9,027 | 7,811 | |||||
Allowance for loan losses | 379 | 116 | 68 | |||||
Goodwill, core deposit and other intangibles | 685 | 1,334 | 1,355 | |||||
Noninterest-bearing demand deposits | 3,743 | 2,709 | 2,243 | |||||
Total deposits | 8,880 | 8,625 | 8,058 | |||||
Preferred equity | 376 | 80 | – | |||||
Common equity | 1,435 | 2,049 | 1,932 | |||||
In 2007, Amegy continued its strong financial performance with record levelshad a net loss of activity in many key areas. Net$780.4 million for 2009 compared to net income of $125.1 million for 2008 and net income of $94.4 million for 2007. The net loss for the year was primarily due to a record $94.4 million.$633.3 million impairment loss on goodwill taken in the first quarter of 2009, along with a 464.8% increase in the provision for loan losses. The impairment loss on goodwill was primarily due to declines in market values of comparable companies and the lower short-term earnings performancepotential of Amegy itself. The increase in the provision for loan losses was due to deterioration in the credit quality of the loan portfolio as a result of the difficult economic environment.
Nonperforming assets were $549.5 million at December 31, 2009 compared to $56.7 million one year ago, an increase of $492.8 million or 869.1%. The increase in nonperforming assets primarily was driven by strong levelsdue to deterioration in the construction and land development segment of the loan growth, higherportfolio. Nonperforming assets to net interest income, fee income generation, improved balance sheet efficiency,loans and moderate increasesother real estate owned at December 31, 2009 was 6.52% compared to 0.62% at December 31, 2008.
Net loan and lease charge-offs were $143.2 million for 2009 compared with $24.1 million for 2008 and $9.0 million for 2007. Net loan and lease charge-offs in operating expenses, offset by a lower net interest margin2009 were primarily in the construction and a higherland development loan portfolio. The loan loss provision.
SCHEDULE 15
AMEGY CORPORATION
(In millions)
| 2007 | 2006 | 2005 (1) | ||||
CONDENSED INCOME STATEMENT | |||||||
Net interest income | $ | 331.3 | 304.7 | 25.5 | |||
Noninterest income | 126.7 | 114.9 | 9.0 | ||||
Total revenue | 458.0 | 419.6 | 34.5 | ||||
Provision for loan losses | 21.2 | 7.8 | – | ||||
Noninterest expense | 295.6 | 283.5 | 23.7 | ||||
Income before income taxes and minority interest | 141.2 | 128.3 | 10.8 | ||||
Income tax expense | 46.7 | 39.5 | 3.3 | ||||
Minority interest | 0.1 | 1.8 | – | ||||
Net income | $ | 94.4 | 87.0 | 7.5 | |||
YEAR-END BALANCE SHEET DATA | |||||||
Total assets | $ | 11,675 | 10,366 | 9,350 | |||
Net loans and leases | 7,902 | 6,352 | 5,389 | ||||
Allowance for loan losses | 68 | 55 | 49 | ||||
Goodwill, core deposit and other intangibles | 1,355 | 1,370 | 1,404 | ||||
Noninterest-bearing demand deposits | 2,243 | 2,245 | 2,145 | ||||
Total deposits | 8,058 | 7,329 | 6,905 | ||||
Common equity | 1,932 | 1,805 | 1,768 | ||||
Record levelsprovision was $406.1 million for 2009 compared to $71.9 million for 2008 and $21.2 million for 2007. The ratio of revenue resulted from Amegy’s strong sales culture, a healthy Texas economy,the allowance for loan losses to net loans and the dedicated efforts of a stableleases was 4.58% at December 31, 2009 compared to 1.28% and talented corps of relationship officers0.87% at December 31, 2008 and administrative personnel.
2007, respectively.
Net interest income was drivenincreased by record levels of period end loan growth of $1.6 billion,4.2% for 2009 due to a 4.7% or 24.4%.$450 million increase in average earning assets. The net interest margin declined from 4.36%was 3.90% for 2009, compared to 3.92% for 2008 and 4.13% for 2007.
Other noninterest income decreased 29.4% to $136.1 million compared to $192.9 million for 2008 and $126.7 million for 2007. The largest decreases in 2006noninterest income were a $25.5 million or 65.6% decline in
fair value and nonhedge derivative income recognized in 2008 related to 4.13% in 2007 as a resultthe early termination of increased competitive pressure for depositsinterest rate hedges and hedge ineffectiveness on outstanding cash flow hedging relationships, and a heavier reliance$13.0 million or 144.2% decrease in income on wholesale type funding to support growth in the loan portfolio. Loan growth was primarily focused in the commercial and industrial sectors with continued growth in the real estate lending groups.
Noninterest income was $126.7 million, an increase of 10.3%. Record levels of fee income were generated in the deposit and retail services area, commercial loan fees, and in the capital markets group.
other equity investments.
Noninterest expense increased by $12.1$40.4 million or 4.3%.13.2% from 2008. Increases for 2009 included a $37.2 million increase in the provision for losses on unfunded lending commitments, a $17.1 million or 370.7% increase in the cost of FDIC insurance and a $4.4 million, or 427.8% increase in expenses related to other real estate owned properties. These increases were partially offset by an expense reduction program which produced decreases in most operating expense categories. The primary component of the increase waslargest decreases were $9.4 million or 6.8% in salaries and benefits, of $16.2$4.1 million or 13.9%, reflecting Amegy’s continuing investment17.3% in expanding its market presenceoccupancy expenses and $2.5 million or 46.7% in Houston and Dallas, and the addition of Intercon Bank in the San Antonio market.advertising. The efficiency ratio improveddeteriorated to 63.8%66.60% in 2009 from 66.8%.
Schedule 18
Year end deposits grew by $729 million or 9.9%. Year end noninterest-bearing deposits were $2.2 billion, essentially unchanged from the prior year.AMEGY CORPORATION
SCHEDULE 16
AMEGY CORPORATION
(Dollar amounts in millions)
| 2007 | 2006 | 2005 (1) | 2009 | 2008 | 2007 | |||||||||||
PERFORMANCE RATIOS | |||||||||||||||||
Return on average assets | 0.91% | 0.93% | 0.97 % | (6.64 | )% | 1.04 | % | 0.91 | % | ||||||||
Return on average common equity | 5.10% | 4.87% | 4.97 % | (48.87 | )% | 6.28 | % | 5.10 | % | ||||||||
Tangible return on average tangible common equity | 22.46% | 26.25% | 29.72 % | ||||||||||||||
Efficiency ratio | 63.83% | 66.79% | 68.03 % | 66.60 | % | 53.80 | % | 63.83 | % | ||||||||
Net interest margin | 4.13% | 4.36% | 4.44 % | 3.90 | % | 3.92 | % | 4.13 | % | ||||||||
RISK-BASED CAPITAL RATIOS1 | |||||||||||||||||
Tier 1 leverage | 11.79 | % | 8.67 | % | 7.58 | % | |||||||||||
Tier 1 risk-based capital | 12.29 | % | 8.10 | % | 6.90 | % | |||||||||||
Total risk-based capital | 13.57 | % | 11.13 | % | 10.94 | % | |||||||||||
CREDIT QUALITY | |||||||||||||||||
Provision for loan losses | $ | 21.2 | 7.8 | – | $ | 406.1 | 71.9 | 21.2 | |||||||||
Net loan and lease charge-offs | 9.0 | 1.9 | (0.2) | 143.2 | 24.1 | 9.0 | |||||||||||
Ratio of net charge-offs to average loans and leases | 0.13% | 0.03% | (0.04)% | 1.65 | % | 0.28 | % | 0.13 | % | ||||||||
Allowance for loan losses | $ | 68 | 55 | 49 | $ | 379 | 116 | 68 | |||||||||
Ratio of allowance for loan losses to net loans and leases | 0.86% | 0.87% | 0.92 % | 4.58 | % | 1.28 | % | 0.87 | % | ||||||||
Nonperforming assets | $ | 45.6 | 15.7 | 17.3 | $ | 549.5 | 56.7 | 45.6 | |||||||||
Ratio of nonperforming assets to net loans and leases and | 0.58% | 0.25% | 0.32 % | 6.52 | % | 0.62 | % | 0.58 | % | ||||||||
Accruing loans past due 90 days or more | $ | 3.8 | 9.7 | 5.1 | $ | 14.4 | 5.5 | 3.8 | |||||||||
Ratio of accruing loans past due 90 days or more to net | 0.05% | 0.15% | 0.09 % | 0.17 | % | 0.06 | % | 0.05 | % | ||||||||
OTHER INFORMATION | |||||||||||||||||
Full-time equivalent employees | 1,694 | 1,599 | 1,983 | 1,612 | 1,756 | 1,694 | |||||||||||
Domestic offices: | |||||||||||||||||
Traditional branches | 79 | 70 | 67 | 80 | 80 | 79 | |||||||||||
Banking centers in grocery stores | 8 | 8 | 15 | 2 | 3 | 8 | |||||||||||
Foreign office | 1 | 1 | 1 | 1 | 1 | 1 | |||||||||||
Total offices | 88 | 79 | 83 | 83 | 84 | 88 | |||||||||||
ATMs | 142 | 129 | 130 | 132 | 140 | 142 | |||||||||||
Capital ratios are for |
Net loans and leases contracted $765 million or 8.5% to $8.3 billion in 2009 compared to $9.0 billion in 2008. Declines in loans balances included decreases of $502 million in commercial lending, $507 million in construction and land development loans and $127 million in consumer loans, offset by an increase of $394
million in commercial real estate term loans. The provision for loan losses increased to $21.2 million for 2007 reflecting the increasereduction in the loan portfolio outstandingbalances was due to the soft economy, commercial borrowers deleveraging, and deteriorationto soft real estate markets. Amegy continues to be active in asset quality principally among fournew loan originations by seeking borrowers meeting both its pricing and credit criteria.
Total deposits grew $255 million or 3.0% in 2009 compared to 2008, with noninterest-bearing demand deposits growing $1,034 million and total interest-bearing deposits shrinking $779 million. The ratio of noninterest-bearing demand deposits to total deposits was 42.2% in 2009 and 31.4% in 2008. Amegy continues to be a leader in providing treasury management services to commercial clients and in serving retail and small business enterprises through its branch network.
Total securities increased $157 million or 22.7% in 2009 compared to 2008 primarily due to the purchase of $134 million of adjustable auction rate securities from customers in the commercialfirst quarter of 2009. This transaction was undertaken to restore liquidity to customers who had purchased the securities through Amegy Investments. This transaction generated a $7.5 million valuation loss at inception. Through the end of the year, $14.6 million of these securities had been redeemed at par which resulted in the recapture of $876 thousand of the valuation loss. Amegy expects to recover the entire valuation loss over the life of these securities. Amegy did not recognize any impairment or valuation losses in its core securities portfolio in either 2009 or 2008.
The total risk-based capital ratio at December 31, 2009 was 13.57% compared to 11.13% and industrial loan portfolio. Nonperforming assets increased10.94% at December 31, 2008 and December 31, 2007, respectively. The increase in total risk-based capital was due to $45.6$177 million or 0.58%in direct capital injections from the Parent and the issuance of qualifying Tier 1 capital preferred stock of $296 million to the Parent, offset by the redemption of $231 million of subordinated debt (which qualified as Tier 2 capital) due to the Parent and the net loans and leases, and other real estate owned. Net charge-offs to average loans and leases was 0.13% and was within Amegy’s historical rangeloss of credit statistics.$148.0 million, excluding the after-tax goodwill impairment.
National Bank of Arizona
NBA, the Company’s financial institution responsible for operations inNational Bank of Arizona is headquartered in Tucson, Arizona, and is the fourth4th largest full-service commercial bank in Arizona as measured by domestic deposits booked in the state. FollowingNBA operates 76 full-service traditional branches.
The Arizona economy began its contraction in late 2007 prior to much of the acquisition by NBA in Januarysame trend being realized at the national level. In a twenty-four month period, beginning with the third quarter of 2007, of Stockmen’s, the branch network in Arizona expanded by 43% to the present level of 76 branches reaching every county within the state. Arizona’s economic performance and outlook has taken a downturn over the year, yet population growth continues to be one the strongest in the entire country. Population in the state exceeds 6.5 million residents and increased over 3% in 2007 comparedworkforce declined by more than 10%, or 275,000 nonfarm workers. The current pace of job loss has dissipated to 2006. The Phoenix and Tucson metropolitan areas also experienced an increase of over 3% over 2006 and together comprise over 80%roughly half of the state’s population with over 5.2 million individuals. Net migration intoaverage experienced during this 24 month period; however continued job losses are expected until the statethird quarter of 2010. Total unemployment was at 8.8% at the end of 2009 and is expected to continue overimprove to 7.7% by the next several years, butend of 2010. The state’s population grew at aan historically low rate of 1.1%, or approximately 70,000, in 2009, and is expected to again increase at this slow pace in 2010. Residential home-building activity, as measured by new permits, decreased by 45% to 13,689 in 2009 compared to 2008. Although the reduction was significant for the full year, by mid-year 2009 the trend began to reflect some level of improvement. This slightly more moderate pace.
The housing industry was deeply impacted during the year by the contraction in the real estate market, which has been a key economic driver for the state’s economy. Permits for new residential construction plummeted from one of the highest point experienced in 2005 of over 85,000 to approximately 66,062 in 2006 and approximately 50,000 in 2007. By November-December 2007, the annualized run rate of new permits issued had declined to approximately 16,000. This downwardpositive trend is expected to continue into the near future at a lower pace. The effects of the housing industry slowdown have begun to impact the commercial real estate segment of the market, but not nearly as severely. Vacancy rates have exhibited a slight increase over the year and the velocity of rental rate increases, on a per square foot basis, have tapered in the year within the metropolitan marketplaces.
Despite the impacts from the construction industry, trimming over 23,000 jobs in the state within one year, the state’s job market still reflected positive gains for the full year 2007. However, job growth did turn negative late in the year. The trend of employment declines is expected to continue into the next year2010, with a projected increase of 42% to just over 19,000 new residential permits. Commercial real estate values have declined significantly since their peak in unemployment as the fallout from the struggling home building industry beginslate 2007; any recovery in commercial values is expected to impact other market sectors.lag behind expected residential improvement in 2010.
SCHEDULE 17Schedule 19
NATIONAL BANK OF ARIZONA
(In millions)
| 2007 | 2006 | 2005 | 2009 | 2008 | 2007 | ||||||||||
CONDENSED INCOME STATEMENT | ||||||||||||||||
Net interest income | $ | 250.8 | 214.9 | 187.6 | $ | 179.1 | 219.5 | 250.8 | ||||||||
Noninterest income | 33.4 | 25.4 | 21.5 | 44.0 | 46.8 | 33.4 | ||||||||||
Total revenue | 284.2 | 240.3 | 209.1 | 223.1 | 266.3 | 284.2 | ||||||||||
Provision for loan losses | 30.5 | 16.3 | 5.2 | 291.7 | 211.8 | 30.5 | ||||||||||
Noninterest expense | 142.4 | 103.0 | 97.8 | 170.0 | 161.2 | 142.4 | ||||||||||
Impairment loss on goodwill | – | 168.6 | – | |||||||||||||
Income before income taxes | 111.3 | 121.0 | 106.1 | |||||||||||||
Income tax expense | 43.5 | 47.8 | 42.1 | |||||||||||||
Income (loss) before income taxes | (238.6 | ) | (275.3 | ) | 111.3 | |||||||||||
Income tax expense (benefit) | (94.4 | ) | (56.7 | ) | 43.5 | |||||||||||
Net income | $ | 67.8 | 73.2 | 64.0 | ||||||||||||
Net income (loss) | $ | (144.2 | ) | (218.6 | ) | 67.8 | ||||||||||
YEAR-END BALANCE SHEET DATA | ||||||||||||||||
Total assets | $ | 5,279 | 4,599 | 4,209 | $ | 4,524 | 4,864 | 5,279 | ||||||||
Total securities | 208 | 204 | 258 | |||||||||||||
Net loans and leases | 4,585 | 4,066 | 3,698 | 3,609 | 4,108 | 4,566 | ||||||||||
Allowance for loan losses | 65 | 43 | 38 | 201 | 124 | 65 | ||||||||||
Goodwill, core deposit and other intangibles | 195 | 66 | 68 | 18 | 22 | 195 | ||||||||||
Noninterest-bearing demand deposits | 1,100 | 1,160 | 1,191 | 1,039 | 916 | 1,100 | ||||||||||
Total deposits | 3,871 | 3,695 | 3,599 | 3,784 | 3,923 | 3,871 | ||||||||||
Preferred equity | 405 | 430 | – | |||||||||||||
Common equity | 581 | 346 | 299 | 228 | 355 | 581 | ||||||||||
NBA’sThe net loss for NBA decreased 34.0% to $144.2 million for 2009 compared to a loss of $218.6 million for 2008 and net income of $67.8 million for 2007. In 2008, NBA recognized an impairment loss on the entire balance of goodwill totaling $168.6 million. Excluding the after tax goodwill impairment loss in 2007 reflected a decrease2008, the net loss for 2009 compared to 2008 increased $80.0 million. The increased loss is mainly due to the decline in net interest income and the increased provision for loan losses.
The allowance for loan losses and the provision for loan losses increased during the year as loan credit quality worsened through 2009. Loan credit quality did appear to begin stabilizing in mid-year, and to improve somewhat thereafter. This credit quality improvement was not due to improvement in the Arizona economy, but rather was primarily due to the fact that many problem loans had been charged-down or otherwise resolved. Nonperforming assets were $320.2 million at the end of 7.4%2009 compared to $273.0 million at the end of 2008. The level of nonperforming assets, although higher when comparing the end of 2009 with 2008, has declined from the peak experienced in mid-2009. The majority of the nonperforming loans are construction and land development loans and mortgages. Nonperforming assets to net loans and other real estate owned at December 31, 2009 was 8.66%, which followed a 14.4% growthcompared to 6.49% at December 31, 2008.
Net loan and lease charge-offs were $214.2 million for 2009, an increase of $67.0 million from the $147.2 million level experienced in earnings in 2006. 2008. Net loan and lease charge-offs were primarily related to the bank’s real estate portfolio, including construction and land development loans and mortgages. The provision for loan losses was $291.7 million for 2009 compared to $211.8 million for 2008 and $30.5 million for 2007. The ratio of the allowance for loan losses to net loans and leases was 5.57% and 3.01% at December 31, 2009 and 2008, respectively.
Net interest income increased by 16.7%at NBA for 2009 decreased $40.4 million or 18.4% compared to $250.8 million, as2008. A reduction in average earning assets of $203 million from 2008 to 2009, coupled with an increase in the level of nonperforming loans and competitive pressure on deposit pricing contributed to the decrease in net interest
income increased with the acquisition of Stockmen’s at the beginning offor the year. The net interest margin declined from 5.20% in 2006was 3.95% for 2009, compared to 4.64% for 2008 and 5.08% infor 2007. Comparatively low margins during 2009 were largely due to the level and severity of nonperforming assets and lower yields achieved on higher levels of liquidity maintained throughout the year.
Noninterest income decreased 6.0% to $44.0 million, compared to $46.8 million for 2008 and $33.4 million for 2007. The margin compression primarily reflectsmajority of the decrease is attributable to a $2.4 million decline in noninterest-bearing deposits,fair value and nonhedge derivative income during 2009.
Noninterest expense for 2009 increased by $8.8 million or 5.5% from 2008. Increases for 2009 include a $6.1 million or 200.8% increase in FDIC premiums from 2008 and a $3.2 million or 73.3% increase in credit related costs. Credit related and OREO costs totaled $36.7 million for all of 2009 and are a result of continued reliance on noncore deposit funding,declines in the value of foreclosed properties. Several noninterest expense components, such as salaries and benefits, declined year over year as management worked to reduce controllable operating expenses. The efficiency ratio was 76.12% for 2009, compared to 60.45% for 2008 and 49.90% for 2007. The change in efficiency ratio was due to the heightened level of credit related expenditures and FDIC premiums, coupled with the consequences of deposit pricingoverall reduction in an increasingly competitive marketplace seeking to attract and retain deposits.net interest income.
Schedule 20
Noninterest income increased 31.5% in 2007 compared to 2006, following an 18.1% improvement in 2006. During 2007, NBA increased the number of depository accounts, largely a result of the Stockmen’s acquisition. The increase in the number of customer accounts, coupled with fee increases drove a 73.6% increase in deposit service charges. Loan sales and servicing income declined 19.4%, reflecting the diminished residential housing activity in Arizona.
Noninterest expense rose by $39.4 million in 2007 or 38.3% compared with an increase of $5.2 million or 5.3% in 2006. The 2007 change is almost solely due to the operating costs, amortization and merger costs related to the Stockmen’s acquisition early in 2007. Through the acquisition, NBA was able to expand its branch network and operating personnel, providing a positive impact on the enterprise’s revenue stream.
SCHEDULE 18
NATIONAL BANK OF ARIZONA
(Dollar amounts in millions)
| 2007 | 2006 | 2005 | 2009 | 2008 | 2007 | |||||||||||
PERFORMANCE RATIOS | |||||||||||||||||
Return on average assets | 1.25% | 1.66% | 1.65% | (3.01 | )% | (4.25 | )% | 1.25 | % | ||||||||
Return on average common equity | 11.36% | 22.49% | 22.62% | (50.93 | )% | (39.40 | )% | 11.36 | % | ||||||||
Tangible return on average tangible common equity | 18.55% | 28.76% | 30.48% | ||||||||||||||
Efficiency ratio | 49.90% | 42.81% | 46.67% | 76.12 | % | 60.45 | % | 49.90 | % | ||||||||
Net interest margin | 5.08% | 5.20% | 5.23% | 3.95 | % | 4.64 | % | 5.08 | % | ||||||||
RISK-BASED CAPITAL RATIOS | |||||||||||||||||
Tier 1 leverage | 11.59 | % | 15.19 | % | 7.29 | % | |||||||||||
Tier 1 risk-based capital | 14.46 | % | 17.49 | % | 7.51 | % | |||||||||||
Total risk-based capital | 15.76 | % | 18.76 | % | 10.95 | % | |||||||||||
CREDIT QUALITY | |||||||||||||||||
Provision for loan losses | $ | 30.5 | 16.3 | 5.2 | $ | 291.7 | 211.8 | 30.5 | |||||||||
Net loan and lease charge-offs | 13.6 | 11.3 | 0.4 | 214.2 | 147.2 | 13.6 | |||||||||||
Ratio of net charge-offs to average loans and leases | 0.29% | 0.29% | 0.01% | 5.54 | % | 3.35 | % | 0.29 | % | ||||||||
Allowance for loan losses | $ | 65 | 43 | 38 | $ | 201 | 124 | 65 | |||||||||
Ratio of allowance for loan losses to net loans and leases | 1.42% | 1.06% | 1.03% | 5.57 | % | 3.01 | % | 1.42 | % | ||||||||
Nonperforming assets | $ | 76.1 | 12.2 | 9.7 | $ | 320.2 | 273.0 | 68.2 | |||||||||
Ratio of nonperforming assets to net loans and leases and | 1.66% | 0.30% | 0.26% | 8.66 | % | 6.49 | % | 1.49 | % | ||||||||
Accruing loans past due 90 days or more | $ | 11.8 | 2.3 | 3.2 | $ | 14.2 | 17.0 | 11.8 | |||||||||
Ratio of accruing loans past due 90 days or more to net | 0.26% | 0.06% | 0.09% | 0.39 | % | 0.41 | % | 0.26 | % | ||||||||
OTHER INFORMATION | |||||||||||||||||
Full-time equivalent employees | 1,137 | 911 | 871 | 1,023 | 1,100 | 1,137 | |||||||||||
Domestic offices: | |||||||||||||||||
Traditional branches | 76 | 53 | 53 | 76 | 79 | 76 | |||||||||||
Foreign office | 1 | 1 | – | ||||||||||||||
Total offices | 77 | 80 | 76 | ||||||||||||||
ATMs | 69 | 55 | 53 | 78 | 73 | 69 | |||||||||||
Net loans grew by $519and leases contracted $499 million for the year, an increase of 12.8%, followingin 2009 or a 10.0% growth rate in 2006. The net loans acquired in the Stockmen’s acquisition were $561 million which exceeded NBA’s net loan growth for 2007. In light of the slowing and changing economy, growth has also slowed and reflects the selective ability to pursue customers and relationships which fit the long term profile of the bank. Net deposit growth, totaling $176 million, also was attributable to the purchase of Stockmen’s Bank. The continued competitive pressures and the expanding reach of new financial institutions into the market during the year placed pressure on attracting new and retaining existing deposits.
The return on average assets and average common equity for NBA declined for the year principally due to the higher provision for loan losses and credit costs and net interest margin compression. As margin compression lowered the net interest income, the impact of higher credit and merger related expenses outpaced revenue improvements and thus increased the efficiency ratio in 200712.1% decline when compared to prior years.
Nonperforming assets increasedTotal deposits decreased $139 million or 3.5% in 2009 compared to $76.12008, as the bank worked to reduce balances in higher cost deposit categories. The ratio of noninterest-bearing demand deposits to total deposits was 27.5% in 2009 and 23.3% in 2008. Brokered deposit levels declined by the end of 2009 to $33 million as compared to $128 million at December 31, 2006, compared2008.
The bank continued to $12.2 millionbe well capitalized in 2009; its total risk-based capital ratio was 15.76% at year-end 2006 reflectingDecember 31, 2009, 18.76% at 2008 and 10.95% at 2007. The decrease in the affectsratio from 2008 to 2009 was a direct result of the net loss sustained during the year and the disallowance of a softening economy, particularly on residential land acquisition, development and construction loan quality. Net charge-offs were $13.6 millionportion of the net deferred tax assets for 2007, up from $11.3 million for 2006. The provision for loan losses increased to $30.5 million compared to $16.3 million in the prior year. The change in allpurposes of these credit quality related amounts reflect the deterioration in the housing and general real estate market in Arizona.calculating regulatory capital levels.
Nevada State Bank
NSB,Nevada State Bank is headquartered in Las Vegas, Nevada, and is the fifth largest full-service commercial bank in the stateNevada as measured by domestic deposits booked in the state. TravelNSB operates 54 full-service traditional branches and 4 banking centers in grocery stores throughout the State of Nevada and provides banking services to Nevada’s small and mid-sized businesses as well as retail consumers, with a focus on relationship banking.
During 2009, NSB acquired the banking operations of the former Great Basin Bank of Elko, Nevada, in an FDIC-assisted transaction. The acquisition consisted of approximately $212 million of assets, including the entire loan portfolio, $209 million of deposits, and five branches in Northern Nevada. NSB received approximately $17.8 million in cash from the FDIC and entered into a loss sharing agreement in which the FDIC assumes 80% of the first $40 million of losses on loans and other real estate owned and 95% of any losses above that amount for a period of up to ten years.
The markets in which NSB operates are heavily dependent on travel/tourism and construction. During spring 2008, financial conditions in these sectors began to deteriorate dramatically. This deterioration continued throughout 2009 but has begun to moderate, and in certain metrics there has been stabilization and slight improvement. As of October 2009 and compared to October 2008, gaming revenues are down 11.6%, airline passenger count is down 0.3% and visitor volume is up 0.7%. From November 2008 to November 2009 in Clark County, NSB’s biggest market area, residential construction and mining are Nevada’s three largest industries. Visitor volumepermits increased 1.0% after falling 87.7% in the Silver State is off modestly and gaming revenue and taxable sales are off from prior year, levels. The Silver State continues to attract new investments and job growth increasedwhile commercial construction permits fell 71.4% after declining 55.0% in 2007the prior year. Washoe County saw residential permits fall 25.0% in 2009 after a decline of 57.4% in 2008; commercial construction permits declined 57.9% compared to 2006. However, reduced residential sales and construction activity52.9% in reaction2008. These declines have led to earlier over expansionan increase in the sector has impacted the economic expansion enjoyed during the last few years.Nevada unemployment rate to 12.8% at December 2009, compared to 8.7% one year earlier. The consensus outlook for 2010 is that Nevada’s economy will remain challenged as residential foreclosures continue, construction remains suppressed, and consumers remain conservative in their spending habits despite a slight increase in expected visitor volume.
Schedule 21
SCHEDULE 19
NEVADA STATE BANK
(In millions)
| 2007 | 2006 | 2005 | 2009 | 2008 | 2007 | ||||||||||
CONDENSED INCOME STATEMENT | ||||||||||||||||
Net interest income | $ | 182.5 | 197.5 | 171.3 | $ | 140.0 | 159.0 | 182.5 | ||||||||
Noninterest expense | 32.9 | 31.2 | 31.0 | |||||||||||||
Net impairment losses on investment securities | (3.3 | ) | (2.0 | ) | – | |||||||||||
Loss on sale of investment securities to Parent | (11.8 | ) | – | – | ||||||||||||
Acquisition related gains | 16.5 | – | – | |||||||||||||
Other noninterest income | 60.8 | 42.8 | 32.9 | |||||||||||||
Total revenue | 215.4 | 228.7 | 202.3 | 202.2 | 199.8 | 215.4 | ||||||||||
Provision for loan losses | 23.3 | 8.7 | (0.4) | 563.7 | 100.3 | 23.3 | ||||||||||
Noninterest expense | 111.8 | 110.8 | 106.2 | 180.6 | 137.9 | 111.8 | ||||||||||
Impairment loss on goodwill | – | 21.0 | – | |||||||||||||
Income before income taxes | 80.3 | 109.2 | 96.5 | |||||||||||||
Income tax expense | 27.9 | 38.1 | 33.4 | |||||||||||||
Income (loss) before income taxes | (542.1 | ) | (59.4 | ) | 80.3 | |||||||||||
Income tax expense (benefit) | (190.1 | ) | (13.6 | ) | 27.9 | |||||||||||
Net income | $ | 52.4 | 71.1 | 63.1 | ||||||||||||
Net income (loss) | $ | (352.0 | ) | (45.8 | ) | 52.4 | ||||||||||
YEAR-END BALANCE SHEET DATA | ||||||||||||||||
Total assets | $ | 3,903 | 3,916 | 3,681 | $ | 4,187 | 4,063 | 3,903 | ||||||||
Total securities | 329 | 194 | 412 | |||||||||||||
Net loans and leases | 3,231 | 3,214 | 2,846 | 2,752 | 3,200 | 3,230 | ||||||||||
Allowance for loan losses | 56 | 35 | 28 | 280 | 82 | 56 | ||||||||||
Goodwill, core deposit and other intangibles | 21 | 21 | 22 | 9 | 8 | 21 | ||||||||||
Noninterest-bearing demand deposits | 929 | 1,002 | 1,122 | 1,149 | 912 | 929 | ||||||||||
Total deposits | 3,304 | 3,401 | 3,171 | 3,526 | 3,514 | 3,304 | ||||||||||
Preferred equity | 360 | 260 | – | |||||||||||||
Common equity | 261 | 273 | 244 | 296 | 259 | 261 | ||||||||||
NSB’sThe net loss for NSB increased 668.6% to $352.0 million for 2009 compared to $45.8 million for 2008 and net income for 2007 decreased 26.3% toof $52.4 million comparedfor 2007. The increase in net loss was primarily due to $71.1 millionan increase in the provision for 2006 and $63.1 million for 2005.loan losses of $463.4 million. Net interest income declined $19.0 million as loan volumes declined and higher yielding loans were replaced with low yielding federal funds sold. Expenses and losses related to $182.5other real estate owned increased $20.0 million, or 7.6% from 2006, which was up 15.3% from 2005. The decrease in 2007 reflects modest growth in the loan portfolio, along with compression of the net interest margin that resulted from an adverse funding mix shift and deposit pricing pressure.
Noninterest income for 2007 increased 5.4% to $32.9offset by a $16.5 million compared to $31.2 million for 2006 and $31.0 million for 2005.
Noninterest expense increased by 0.9% compared to 2006, which was up 4.3% from 2005. Franchise expansion was the major driversgain related to the growth in noninterest expense in both 2007 and 2006, and salaries and increased affiliate service allocationsGreat Basin Bank acquisition.
Nonperforming assets, excluding FDIC-supported assets, were the largest components of those increases. NSB’s efficiency ratio was 51.8% for 2007, 48.4% for 2006, and 52.4% for 2005. The bank continues to focus on managing operating costs to improve its efficiency.
SCHEDULE 20
NEVADA STATE BANK
(Dollar amounts in millions)
| 2007 | 2006 | 2005 | ||||
PERFORMANCE RATIOS | |||||||
Return on average assets | 1.35% | 1.82% | 1.78% | ||||
Return on average common equity | 19.90% | 27.68% | 27.35% | ||||
Tangible return on average tangible common equity | 21.70% | 30.35% | 30.39% | ||||
Efficiency ratio | 51.82% | 48.37% | 52.37% | ||||
Net interest margin | 5.06% | 5.46% | 5.26% | ||||
CREDIT QUALITY | |||||||
Provision for loan losses | $ | 23.3 | 8.7 | (0.4) | |||
Net loan and lease charge-offs | 2.7 | 1.0 | 0.5 | ||||
Ratio of net charge-offs to average loans and leases | 0.09% | 0.03% | 0.02% | ||||
Allowance for loan losses | $ | 56 | 35 | 28 | |||
Ratio of allowance for loan losses to net loans and leases | 1.73% | 1.10% | 0.97% | ||||
Nonperforming assets | $ | 44.2 | 0.6 | 4.2 | |||
Ratio of nonperforming assets to net loans and leases and | 1.37% | 0.02% | 0.15% | ||||
Accruing loans past due 90 days or more | $ | 8.9 | 18.3 | 1.7 | |||
Ratio of accruing loans past due 90 days or more to net | 0.28% | 0.57% | 0.06% | ||||
OTHER INFORMATION | |||||||
Full-time equivalent employees | 854 | 875 | 811 | ||||
Domestic offices: | |||||||
Traditional branches | 39 | 37 | 34 | ||||
Banking centers in grocery stores | 35 | 35 | 35 | ||||
Total offices | 74 | 72 | 69 | ||||
ATMs | 81 | 79 | 78 | ||||
The decline in residential construction has adversely impacted the robust construction industry of the past few years; however, employment remains strong because of new casino, hotel and other projects along the “Strip.” Net loans grew by $17$319.5 million or 0.5% in 2007 compared to 2006, which was up 12.9% from 2005. Loan growth was primarily in the commercial lending area.
Total deposits declined by $97 million or 2.9% in 2007 compared to 2006. Deposit growth continues to be a challenge. The ratio of interest-bearing deposits to total deposits continues to increase – 71.9% at December 31, 2007 compared with 70.5% at December 31, 2006. NSB continues to enhance business development groups and core business relationship focus in order to try to increase noninterest-bearing deposits in 2008.
Nonperforming assets for NSB increased to $44.2 million at year-end 20072009 compared to $0.6$222.0 million at year-end 2006.one year ago, an increase of $97.5 million or 43.9%. The levelmajority of nonperformingthe increase is due to deterioration in commercial real estate term loans, while the remaining increase is generally attributable to deterioration of construction and land development loans. Nonperforming assets to net loans and other real estate owned at December 31, 20072009 was 1.37%11.78%, compared to 0.02%6.85% at December 31, 2006. 2008.
Net loan and lease charge-offs were $366.4 million for 2009, compared with $71.6 million for 2008 and $2.7 million for 20072007. Approximately 62% of net loan and lease charge-offs in 2009 related to construction and land development loans. The majority of the remaining net losses were investor-owned commercial real estate and commercial and industrial loans. The provision for loan losses was $563.7 million for 2009 compared to $1.0$100.3 million for 2006. For 2007, NSB’s2008 and $23.3 million for 2007. The ratio of the allowance for loan loss provisionlosses to net loans and leases (excluding FDIC-supported loans) was $23.310.53% and 2.58% at December 31, 2009 and 2008, respectively.
Net interest income at NSB declined 11.9%, or $19.0 million from 2008 to 2009. This decrease resulted from a shift in earning assets from generally higher-yielding loans into lower-yielding federal funds sold, combined with a lower interest rate environment. The yield on earning assets declined 28.7% from 6.47% in
2008 to 4.61% in 2009, which was the primary driver of the reduced net interest income in 2009. The shift in earning assets was driven by a lack of quality loan demand in the markets in which we do business, combined with the high level of charge-offs incurred during the year. Loans declined from 89.2% of average earning assets in 2008 to 76.9% in 2009, and federal funds sold increased from 0.7% of average earning assets in 2008 to 15.0% in 2009. Further, lower interest rate levels in 2009 resulted in much of the loan portfolio being repriced at rates below those earned in 2008. Finally, higher levels of nonperforming loans lowered the yield on earning assets in 2009. The cost of interest-bearing deposits also declined, offsetting some of the decline in interest income. The lower interest rate environment and the strong core deposit base led to a decline in the cost of interest-bearing deposits from 2.67% in 2008 to 1.71% in 2009. The result of these changes in the balance sheet mix and the lower interest rate environment produced a net interest margin of 3.50% for 2009, compared to 4.43% for 2008 and 5.06% for 2007.
Other noninterest income increased 42.1% to $60.8 million, compared to $8.7$42.8 million for 2006.2008 and $32.9 million for 2007. A $16.5 million gain on the acquisition of Great Basin Bank was recognized in 2009, while no such gains were recognized in 2008 or 2007. Gains related to terminated interest rate swaps and hedge ineffectiveness on outstanding cash flow hedging relationships totaled $27.1 million, $7.8 million and $0.6 million in 2009, 2008 and 2007, respectively. Other noninterest income components were generally flat from 2007 through 2009, with increases in deposit service charges offset by lower loan fees and dividends on restricted stock. The bank also recognized net impairment losses on investment securities of $3.3 million in 2009 compared to $2.0 million in 2008.
Noninterest expense for 2009 increased provision reflects the weakening Nevada economy$42.7 million or 31.0% from 2008. Increases for 2009 included a $20.0 million or 169.4% increase in expenses and anrealized losses related to other real estate owned, a $12.5 million or 816.6% increase in the bank’s classified loansprovision for unfunded lending commitments, and a $6.4 million or 231.6% increase in FDIC insurance premiums, attributable to a “one-time” assessment required by the FDIC in 2009 as well as higher assessment rates experienced throughout the banking industry. Recurring expenses such as salaries and benefits and occupancy experienced modest declines from 2008 to 2009 as savings from the prior year, which are primarilyclosing of 28 grocery store center branches in early 2009 were largely offset by increased costs related to the addition of the Great Basin Bank operations. The efficiency ratio was 89.14% for 2009, as compared to 68.96% for 2008 and 51.82% for 2007. The increase in the residentialefficiency ratio from 2008 to 2009 was driven by the higher other real estate owned expenses, unfunded commitment provisions, and FDIC assessments discussed above, while total revenue remained essentially flat. The bank incurred a goodwill impairment loss of $21.0 million during 2008, with no such losses incurred in 2009. No goodwill remains on the balance sheet of Nevada State Bank.
Schedule 22
NEVADA STATE BANK
| (Dollar amounts in millions) | 2009 | 2008 | 2007 | |||||||
PERFORMANCE RATIOS | ||||||||||
Return on average assets | (8.28 | )% | (1.18 | )% | 1.35 | % | ||||
Return on average common equity | (155.84 | )% | (15.61 | )% | 19.90 | % | ||||
Efficiency ratio | 89.14 | % | 68.96 | % | 51.82 | % | ||||
Net interest margin | 3.50 | % | 4.43 | % | 5.06 | % | ||||
RISK-BASED CAPITAL RATIOS | ||||||||||
Tier 1 leverage | 13.10 | % | 12.75 | % | 5.95 | % | ||||
Tier 1 risk-based capital | 18.71 | % | 14.31 | % | 6.59 | % | ||||
Total risk-based capital | 20.07 | % | 15.58 | % | 11.05 | % | ||||
CREDIT QUALITY | ||||||||||
Provision for loan losses | $ | 563.7 | 100.3 | 23.3 | ||||||
Net loan and lease charge-offs | 366.4 | 71.6 | 2.7 | |||||||
Ratio of net charge-offs to average loans and leases | 12.19 | % | 2.23 | % | 0.09 | % | ||||
Allowance for loan losses | $ | 280 | 82 | 56 | ||||||
Ratio of allowance for loan losses to net loans and leases excluding FDIC-supported loans | 10.53 | % | 2.58 | % | 1.73 | % | ||||
Nonperforming assets, excluding FDIC-supported assets | $ | 319.5 | 222.0 | 44.2 | ||||||
Ratio of nonperforming assets, excluding FDIC-supported assets to net loans and leases and other real estate owned | 11.78 | % | 6.85 | % | 1.37 | % | ||||
Accruing loans past due 90 days or more, excluding FDIC-supported loans | $ | 12.1 | 14.5 | 8.9 | ||||||
Ratio of accruing loans past due 90 days or more, excluding FDIC-supported loans to net loans and leases | 0.45 | % | 0.45 | % | 0.28 | % | ||||
OTHER INFORMATION | ||||||||||
Full-time equivalent employees | 817 | 863 | 854 | |||||||
Domestic offices: | ||||||||||
Traditional branches | 54 | 45 | 39 | |||||||
Banking centers in grocery stores | 4 | 32 | 35 | |||||||
Total offices | 58 | 77 | 74 | |||||||
ATMs | 80 | 85 | 81 | |||||||
Net loans and leases contracted $448 million or 14.0% in 2009 compared to 2008. Gross charge-offs were a major driver of the contraction, accounting for $381 million or 85.0% of the decline. A general lack of quality loan demand accounts for the remainder as Nevada experienced economic contraction throughout 2009. Construction and land acquisition, development and construction sector.other real estate secured loans experienced the largest decline, again driven by charge-offs but also due to management’s efforts to reduce concentrations in this area. Loan demand is expected to remain challenged in 2010 as difficult economic conditions persist, and NSB’s focus remains on growing the commercial and small business loan portfolios and managing the run-off of real estate loans.
Total deposits increased $12 million or 0.3% in 2009 compared to 2008. The deposit mix improved with the ratio of noninterest-bearing demand deposits to total deposits increasing to 32.6% in 2009 from 26.0% in 2008. Certificates of deposit declined from 32.6% of total deposits in 2008 to 18.5% in 2009 as NSB focused on growing core deposit relationships and reducing reliance on non-relationship, rate sensitive funds. Deposit growth is expected to be relatively flat in 2010 as an incrementally improving economy and potentially higher market interest rates may lead to the deployment of some depositor funds into higher yielding assets. NSB has no brokered certificates of deposit or internet money market accounts.
Total securities increased $135 million or 69.6% in 2009 compared to 2008 as Nevada State Bank purchased US Government and Government Sponsored Enterprise guaranteed obligations as part of its balance sheet management strategy.
The bank continued to be well capitalized in 2009. Its total risk-based capital ratio was 20.07% at year-end 2009, 15.58% at 2008, and 11.05% at 2007. The increase in the ratio was impacted by capital contributions of $500 million of preferred and common equity from the Parent, partially offset by the net loss of $352.0 million and a reduction in risk-weighted assets as loans declined and federal funds sold increased.
Vectra Bank Colorado
Vectra Bank Colorado, N.A. is headquartered in Denver, Colorado, and is the eleventh9th largest full-service commercial bank in Colorado as measured by domestic deposits booked in the state. Vectra operates 4036 full service traditional branches throughout central and westernone grocery store banking center in Colorado, and one full service branch office in Farmington, New Mexico.
The Colorado economy experienced a steady, positive economic climate from 2005 through 2007. Colorado’s annual employment growthdecline of 100,000 jobs during 2009. The losses have most heavily impacted the goods producing sectors including construction and manufacturing activities. While the state has been slightly above 2% duringseen declines in jobs, the past three years. Colorado is a diversified economy and achieved 2007 employment gainsDecember 2009 unemployment rate of 7.3% compares favorably to the national 10% jobless rate. The loss of jobs has resulted in a broad rangedecline in retail sales of industries including aerospace, bioscience and energy. Steady employment growth12% during 2009. As of year-end 2009, the Denver metro area, the state’s largest housing market, has seen a 13.0% decline in the medium home price since the market high in 2006, compared to a national decline of 22.0% over the past three yearssame time frame. This relative stability in home values has led to lower availability of labor; Colorado’s unemployment rate averaged 3.8% during the first 11 months of 2007, down from 4.3%resulted in 2006 and 5.6% during 2002-2005.
Vectra has continued to pursue a relationship banking strategy providing commercial and retail banking services, commercial, construction andstable real estate financing,market in most of the state and cash management services.should assist in supporting a return to economic growth in 2010.
Schedule 23
SCHEDULE 21
VECTRA BANK COLORADO
(In millions)
| 2007 | 2006 | 2005 | 2009 | 2008 | 2007 | ||||||||||
CONDENSED INCOME STATEMENT | ||||||||||||||||
Net interest income | $ | 96.9 | 94.2 | 89.1 | $ | 105.3 | 103.6 | 96.9 | ||||||||
Noninterest income | 28.1 | 26.8 | 26.6 | |||||||||||||
Net impairment losses on investment securities | (5.3 | ) | (6.4 | ) | – | |||||||||||
Other noninterest income | 31.4 | 29.9 | 28.1 | |||||||||||||
Total revenue | 125.0 | 121.0 | 115.7 | 131.4 | 127.1 | 125.0 | ||||||||||
Provision for loan losses | 4.0 | 4.2 | 1.6 | 78.5 | 15.9 | 4.0 | ||||||||||
Noninterest expense | 86.3 | 85.0 | 86.8 | 96.4 | 85.9 | 86.3 | ||||||||||
Impairment loss on goodwill | – | 151.5 | – | |||||||||||||
Income before income taxes | 34.7 | 31.8 | 27.3 | |||||||||||||
Income tax expense | 12.5 | 11.7 | 9.7 | |||||||||||||
Income (loss) before income taxes | (43.5 | ) | (126.2 | ) | 34.7 | |||||||||||
Income tax expense (benefit) | (17.9 | ) | 8.8 | 12.5 | ||||||||||||
Net income | $ | 22.2 | 20.1 | 17.6 | ||||||||||||
Net income (loss) | $ | (25.6 | ) | (135.0 | ) | 22.2 | ||||||||||
YEAR-END BALANCE SHEET DATA | ||||||||||||||||
Total assets | $ | 2,667 | 2,385 | 2,324 | $ | 2,440 | 2,722 | 2,667 | ||||||||
Total securities | 267 | 267 | 329 | |||||||||||||
Net loans and leases | 1,987 | 1,725 | 1,539 | 1,981 | 2,059 | 1,975 | ||||||||||
Allowance for loan losses | 26 | 24 | 21 | 74 | 27 | 26 | ||||||||||
Goodwill, core deposit and other intangibles | 152 | 154 | 156 | – | – | 152 | ||||||||||
Noninterest-bearing demand deposits | 485 | 510 | 541 | 618 | 460 | 485 | ||||||||||
Total deposits | 1,752 | 1,712 | 1,636 | 2,005 | 2,127 | 1,752 | ||||||||||
Preferred equity | 65 | 10 | – | |||||||||||||
Common equity | 329 | 314 | 299 | 199 | 191 | 329 | ||||||||||
NetThe net loss for Vectra decreased 81.0% to $25.6 million for 2009 compared to a net loss of $135.0 million for 2008 and net income increased 10.4% toof $22.2 million in 2007, up from $20.1for 2007. The 2008 loss was driven by a $151.5 million in 2006 and $17.6 million in 2005. Net interest income increased 2.9% to $96.9 million, up from $94.2 million in 2006 and $89.1 million in 2005. Theimpairment loss on goodwill, which eliminated the full amount of goodwill at Vectra. In 2009, the primary driver of the loss was the increase in net interest incomeprovision for loan losses of $62.6 million over 2008 levels.
During 2009, the bank experienced a decline in 2007 was primarily duecredit quality attributable to steady loan growth and improvementsthe recession’s impact on the Colorado economy. Vectra expects to see some stabilization in loan yield, which increased 20 basis pointscredit quality trends during 2010. Nonperforming lending-related assets were $105.9 million at December 31, 2009 compared to 7.48% from 7.28% in 2006. Vectra has consistently maintained its sales management processes and had a record$25.1 million one year ago, an increase of loan growth; loans grew $262$80.8 million or 15.2%, from ending balances321.9%. Nearly all of the increase in 2006. Increased interest income was limited by higher funding costs as competition from national and community banks for deposits within Colorado resulted in higher deposit rates. As a result of higher funding costs, the net interest margin for Vectra declined 20 basis points from 4.73% in 2006nonperforming assets relates to 4.53% in 2007. Noninterest income rose as the bank generated higher consumer and commercial deposit and lending related fees.
Noninterest expense was up $1.3 million or 1.5% to $86.3 million compared to $85.0 million in 2006 and $86.8 million in 2005. Vectra’s efficiency ratio of 68.8% improved compared to an efficiency ratio of 70.0% in 2006 and 74.7% in 2005. The bank continues to focus on revenue generation and expense management as a means of improving operational efficiency. Management of staffing levels enabled the bank to limit expense growth during 2007. The bank has consistently reduced staffing levels while increasing revenue, ending 2007 with 551 full-time equivalent employees, down from 621 in 2005.
SCHEDULE 22
VECTRA BANK COLORADO
(Dollar amounts in millions)
| 2007 | 2006 | 2005 | ||||
PERFORMANCE RATIOS | |||||||
Return on average assets | 0.90% | 0.87% | 0.76% | ||||
Return on average common equity | 6.97% | 6.63% | 5.68% | ||||
Tangible return on average tangible common equity | 14.25% | 14.39% | 12.50% | ||||
Efficiency ratio | 68.78% | 69.99% | 74.72% | ||||
Net interest margin | 4.53% | 4.73% | 4.57% | ||||
CREDIT QUALITY | |||||||
Provision for loan losses | $ | 4.0 | 4.2 | 1.6 | |||
Net loan and lease charge-offs | 1.3 | 1.7 | 0.9 | ||||
Ratio of net charge-offs to average loans and leases | 0.07% | 0.10% | 0.06% | ||||
Allowance for loan losses | $ | 26 | 24 | 21 | |||
Ratio of allowance for loan losses to net loans and leases | 1.32% | 1.37% | 1.37% | ||||
Nonperforming assets | $ | 10.4 | 9.3 | 10.9 | |||
Ratio of nonperforming assets to net loans and leases and | 0.52% | 0.54% | 0.71% | ||||
Accruing loans past due 90 days or more | $ | 3.4 | 1.4 | 1.1 | |||
Ratio of accruing loans past due 90 days or more to net | 0.17% | 0.08% | 0.07% | ||||
OTHER INFORMATION | |||||||
Full-time equivalent employees | 551 | 575 | 621 | ||||
Domestic offices: | |||||||
Traditional branches | 39 | 37 | 40 | ||||
Banking centers in grocery stores | 2 | 2 | 2 | ||||
Total offices | 41 | 39 | 42 | ||||
ATMs | 48 | 47 | 56 | ||||
Net loans increased by 15.2% to $1,987 million from $1,725 million in 2006 and $1,539 million in 2005. Deposits increased to $1,752 million from $1,712 million in 2006 and $1,636 million in 2005. The bank experienced growth in its core business groups including the commercial and commercial real estate lending units.
Credit quality continues to remain strong at Vectra.portfolios. Nonperforming assets have been relatively unchanged for the last several years—$10.4 million, or 0.52% ofto net loans and leases and other real estate owned at year-end 2007,December 31, 2009 was 5.29% compared to $9.3 million or 0.54% in 2006 and $10.9 million or 0.71% in 2005. 1.21% at December 31, 2008.
Net loan and lease charge-offs remained lowwere $31.8 million for 2007 at 0.07% of average loans2009 compared with $13.6 million for 2008 and leases, compared$1.3 million for 2007. Net loan and lease charge-offs in 2009 were primarily related to 0.10% in 2006the commercial and 0.06% in 2005. Accruing loans past due 90 days or more increased to 0.17% of net loans and leases, compared to 0.08% in 2006 and 0.07% in 2005.commercial real estate lending segments. The provision for loan losses was $78.5 million for 2009 compared to $15.9 million for 2008 and $4.0 million in 2007 compared to $4.2 million in 2006 and $1.6 million in 2008.for 2007. The ratio of the allowance for loan losses as a percentage ofto net loans and leases was 3.72% and 1.32% at December 31, 2009 and 2008, respectively.
Net interest income at Vectra for 2009 increased $1.7 million or 1.6%. This increase primarily resulted from a decrease in interest expense as the endbank reduced both its deposit rates and its average wholesale funding position by $304 million while growing its lower cost deposit base by $200 million over average 2008 levels. Some of 2007, down slightlythe benefit of the lower funding cost was offset by a reduction in earning assets of $51 million and a decline in the yield on average interest earning assets of 0.74%. The yield on earning assets primarily reflects the declining rate environment throughout 2008. The net interest margin was 4.52% for 2009 compared to 4.31% for 2008 and 4.53% for 2007. The margin increased as the bank restructured its funding base to reduce interest expense.
Other noninterest income increased 5.0% to $31.4 million compared to $29.9 million for 2008 and $28.1 million for 2007. The bank recognized net impairment losses on investment securities of $5.3 million in 2009, a decrease of $1.1 million from 1.37%2008.
Noninterest expense for 2009 increased $10.5 million or 12.2% from 2008. The bank incurred a $4.3 million debt extinguishment cost (which allowed the bank to significantly reduce its 2009 funding expense), an increase in both 2006FDIC insurance expense of $3.8 million, a $3.4 million increase in credit related and 2005.other real estate owned expenses as well as a $2.4 million increase in the provision for unfunded lending commitments. Salaries and benefits decreased $2.4 million or 5.4%. The efficiency ratio was 72.43% for 2009, as compared to 67.19% for 2008 and 68.78% for 2007. The change in efficiency ratio was primarily driven by the above mentioned increases in noninterest expense.
Schedule 24
VECTRA BANK COLORADO
| (Dollar amounts in millions) | 2009 | 2008 | 2007 | |||||||
PERFORMANCE RATIOS | ||||||||||
Return on average assets | (1.01 | )% | (4.98 | )% | 0.90 | % | ||||
Return on average common equity | (13.84 | )% | (45.35 | )% | 6.97 | % | ||||
Efficiency ratio | 72.43 | % | 67.19 | % | 68.78 | % | ||||
Net interest margin | 4.52 | % | 4.31 | % | 4.53 | % | ||||
RISK-BASED CAPITAL RATIOS | ||||||||||
Tier 1 leverage | 10.91 | % | 7.16 | % | 7.27 | % | ||||
Tier 1 risk-based capital | 10.93 | % | 7.82 | % | 7.15 | % | ||||
Total risk-based capital | 12.21 | % | 11.23 | % | 10.54 | % | ||||
CREDIT QUALITY | ||||||||||
Provision for loan losses | $ | 78.5 | 15.9 | 4.0 | ||||||
Net loan and lease charge-offs | 31.8 | 13.6 | 1.3 | |||||||
Ratio of net charge-offs to average loans and leases | 1.57 | % | 0.66 | % | 0.07 | % | ||||
Allowance for loan losses | $ | 74 | 27 | 26 | ||||||
Ratio of allowance for loan losses to net loans and leases | 3.72 | % | 1.32 | % | 1.33 | % | ||||
Nonperforming assets | $ | 105.9 | 25.1 | 8.2 | ||||||
Ratio of nonperforming assets to net loans and leases and other real estate owned | 5.29 | % | 1.21 | % | 0.41 | % | ||||
Accruing loans past due 90 days or more | $ | 1.4 | 1.7 | 3.4 | ||||||
Ratio of accruing loans past due 90 days or more to net loans and leases | 0.07 | % | 0.08 | % | 0.17 | % | ||||
OTHER INFORMATION | ||||||||||
Full-time equivalent employees | 538 | 568 | 551 | |||||||
Domestic offices: | ||||||||||
Traditional branches | 37 | 39 | 39 | |||||||
Banking centers in grocery stores | 1 | 2 | 2 | |||||||
Foreign office | 1 | 1 | – | |||||||
Total offices | 39 | 42 | 41 | |||||||
ATMs | 43 | 48 | 48 | |||||||
Net loans and leases contracted $78 million or 3.8% in 2009 compared to 2008. The declines were primarily in construction and land development and consumer real estate loans.
The provision for loan losses increased in 2009 as the bank experienced higher levels of loan losses and increased reserves to provide additional coverage for potential losses in light of the deterioration in the commercial and commercial real estate markets.
Vectra continues to emphasize growing the small business, consumer and commercial loan portfolios and managing the run-off of commercial real estate loans.
Total deposits decreased $122 million or 5.7% in 2009 compared to 2008, as the bank reduced higher cost funding as earning assets declined. The ratio of noninterest-bearing demand deposits to total deposits was 30.8% in 2009 and 21.6% in 2008. At December 31, 2009, the bank maintained $136 million in brokered money market balances. In 2010, the bank anticipates a decline in noninterest-bearing demand deposits as the FDIC removes the unlimited deposit insurance coverage of noninterest-bearing deposits in June.
The bank continued to be well capitalized in 2009; its total risk-based capital ratio was 12.21% at year-end 2009, 11.23% at 2008 and 10.54% at 2007. Total risk-based capital increased as a result of the bank receiving a $45 million capital contribution from the Parent in 2009.
The Commerce Bank of Washington
TCBW consistsThe Commerce Bank of Washington is headquartered in Seattle, Washington, and operates out of a single office located in downtownthe Seattle that serves the greater Seattle, Washington area.central business district. Its business strategy focuses on serving the financial needs of commercial businesses, including professional serviceservices firms, and individuals by providing a high level of customer service delivered by seasoned professionals.
TCBW has been successful in serving this market within the greater Seattle areaSeattle/Puget Sound region by using couriers, bank by mail, remote deposit image capture, and other technology in lieu of a branch network.
The Washington State economy continues to struggle with an unemployment rate at 9.5% and rising. The Washington Economic and Revenue Forecast Council expects unemployment to peak in the second quarter of 2010 at 9.8%, then slowly improve, noting the pronounced and sustained decline in new unemployment claims in the last four months of 2009. Housing is continuing to provide mixed messages with single family permits trending up while multifamily permits remain at low levels. Washington banks were more heavily exposed to real estate than the national average and further bank failures in the state are expected. The relative strength of TCBW had strong earningsis expected to result in continued growth in 2007 due primarily to the increase inboth loans and deposits from 2006 to 2007. Expense control was also a factor, resulting in an improved efficiency ratio for 2007.deposits.
Schedule 25
Credit quality improved with net recoveries of $115 thousand in 2007, an improvement over the net charge-offs of $212 thousand in 2006, reflecting the healthy western Washington economy.
SCHEDULE 23
THE COMMERCE BANK OF WASHINGTON
(In millions)
| 2007 | 2006 | 2005 | ||||
CONDENSED INCOME STATEMENT | |||||||
Net interest income | $ | 35.1 | 33.6 | 29.6 | |||
Noninterest income | 2.5 | 2.0 | 1.6 | ||||
Total revenue | 37.6 | 35.6 | 31.2 | ||||
Provision for loan losses | 0.3 | 0.5 | 1.0 | ||||
Noninterest expense | 14.4 | 13.9 | 12.6 | ||||
Income before income taxes | 22.9 | 21.2 | 17.6 | ||||
Income tax expense | 7.5 | 7.0 | 5.5 | ||||
Net income | $ | 15.4 | 14.2 | 12.1 | |||
YEAR-END BALANCE SHEET DATA | |||||||
Total assets | $ | 947 | 808 | 789 | |||
Net loans and leases | 509 | 428 | 402 | ||||
Allowance for loan losses | 5 | 5 | 4 | ||||
Goodwill, core deposit and other intangibles | – | – | 1 | ||||
Noninterest-bearing demand deposits | 145 | 120 | 130 | ||||
Total deposits | 608 | 513 | 442 | ||||
Common equity | 67 | 56 | 50 | ||||
| (In millions) | 2009 | 2008 | 2007 | ||||||
CONDENSED INCOME STATEMENT | |||||||||
Net interest income | $ | 32.1 | 33.8 | 35.1 | |||||
Net impairment losses on investment securities | (1.1 | ) | (1.3 | ) | – | ||||
Other noninterest income | 9.4 | 4.4 | 2.5 | ||||||
Total revenue | 40.4 | 36.9 | 37.6 | ||||||
Provision for loan losses | 22.5 | 1.1 | 0.3 | ||||||
Noninterest expense | 15.9 | 14.8 | 14.4 | ||||||
Income before income taxes | 2.0 | 21.0 | 22.9 | ||||||
Income tax expense | 0.4 | 7.0 | 7.5 | ||||||
Net income | $ | 1.6 | 14.0 | 15.4 | |||||
YEAR-END BALANCE SHEET DATA | |||||||||
Total assets | $ | 835 | 880 | 947 | |||||
Total securities | 171 | 199 | 326 | ||||||
Net loans and leases | 578 | 588 | 509 | ||||||
Allowance for loan losses | 13 | 6 | 5 | ||||||
Noninterest-bearing demand deposits | 196 | 185 | 145 | ||||||
Total deposits | 632 | 603 | 608 | ||||||
Preferred equity | 15 | – | – | ||||||
Common equity | 69 | 75 | 67 | ||||||
Net income for TCBW wasdecreased 88.6% to $1.6 million for 2009 compared to $14.0 million for 2008 and $15.4 million for 2007,2007. The decrease in net income was primarily due to a $21.4 million increase in provision for loan losses.
Nonperforming assets were $29.5 million at December 31, 2009 compared to no nonperforming assets at December 31, 2008. Nearly all of the increase is attributable to deterioration in commercial and industrial loans. Nonperforming assets to net loans and other real estate owned at December 31, 2009 was 5.09%.
Net loan and lease charge-offs were $15.3 million for 2009 compared with small net recoveries in 2008 and 2007. Net loan and lease charge-offs in 2009 were primarily commercial and industrial loans. The provision for loan losses was $22.5 million for 2009 compared to $1.1 million for 2008 and $0.3 million for 2007. The ratio of the allowance for loan losses to net loans and leases was 2.32% and 1.05% at December 31, 2009 and 2008, respectively.
Net interest income at TCBW for 2009 declined by $1.7 million or 5.0%. This decrease resulted from a 5.7% decline in average earning assets caused mainly by a managed decline in the securities portfolio. The securities portfolio decline was made possible by a 40.9% decline in other borrowings, primarily repurchase agreements. The net interest margin was 4.06% for 2009, compared to 4.05% for 2008 and 4.41% for 2007. The cost of total borrowings in 2009 was 0.31%, down from 1.70% in 2008. The yield on earning assets for 2009 was 4.47%, down from 5.56% in 2008.
Other noninterest income increased 113.6% to $9.4 million compared to $4.4 million for 2008 and $2.5 million for 2007. The primary increase in other noninterest income was $5.0 million of increased revenues related to terminated interest rate swap hedge transactions. This revenue, which would normally amortize over the original term of the swap, was accelerated due to a decline in the number of floating loans available for the hedge. Other factors included an increase over the $14.2 million earned in 2006 and $12.1 million in 2005. The 7.6% earnings increase for 2007 resulted from continued growth in loans and deposits, an increase in noninterest income of 25.8%, and an improvement in credit quality. Operational efficiencies also improved, resulting in an efficiency ratio of 37.7% in 2007, whichservice charge fees on deposit accounts.
Noninterest expense for 2009 increased $1.1 million or 7.4% from 2008. The largest factor in this increase was an improvement over the 38.4%$1.4 million in 2006. Net interest income for 2007 increased 4.5% over 2006 while the net interest margin declined to 4.41% in 2007FDIC premiums compared to 4.53%$0.4 million in 2008, an increase of 261.1%. Increases for 20062009 also include a $0.1 million or 1.5% increase in salaries and 4.16%benefits. The efficiency ratio was 39.07% for 2005.2009, as compared to 39.52% for 2008 and 37.68% for 2007.
SCHEDULE 24Schedule 26
THE COMMERCE BANK OF WASHINGTON
(Dollar amounts in millions)
| 2007 | 2006 | 2005 | 2009 | 2008 | 2007 | |||||||||||
PERFORMANCE RATIOS | |||||||||||||||||
Return on average assets | 1.82 % | 1.78% | 1.57% | 0.19 | % | 1.57 | % | 1.82 | % | ||||||||
Return on average common equity | 25.89 % | 27.11% | 24.26% | 2.13 | % | 20.11 | % | 25.89 | % | ||||||||
Tangible return on average tangible common equity | 25.89 % | 27.68% | 24.86% | ||||||||||||||
Efficiency ratio | 37.68 % | 38.38% | 39.25% | 39.07 | % | 39.52 | % | 37.68 | % | ||||||||
Net interest margin | 4.41 % | 4.53% | 4.16% | 4.06 | % | 4.05 | % | 4.41 | % | ||||||||
RISK-BASED CAPITAL RATIOS | |||||||||||||||||
Tier 1 leverage | 10.57 | % | 8.66 | % | 7.45 | % | |||||||||||
Tier 1 risk-based capital | 12.60 | % | 10.33 | % | 10.36 | % | |||||||||||
Total risk-based capital | 13.86 | % | 13.32 | % | 13.46 | % | |||||||||||
CREDIT QUALITY | |||||||||||||||||
Provision for loan losses | $ | 0.3 | 0.5 | 1.0 | $ | 22.5 | 1.1 | 0.3 | |||||||||
Net loan and lease charge-offs | (0.1) | 0.2 | 0.9 | ||||||||||||||
Net loan and lease charge-offs (recoveries) | 15.3 | (0.1 | ) | (0.1 | ) | ||||||||||||
Ratio of net charge-offs to average loans and leases | (0.02)% | 0.05% | 0.25% | 2.59 | % | (0.03 | )% | (0.02 | )% | ||||||||
Allowance for loan losses | $ | 5 | 5 | 4 | $ | 13 | 6 | 5 | |||||||||
Ratio of allowance for loan losses to net loans and leases | 1.01 % | 1.11% | 1.13% | 2.32 | % | 1.05 | % | 1.01 | % | ||||||||
Nonperforming assets | $ | 0.2 | – | 2.1 | $ | 29.5 | – | 0.2 | |||||||||
Ratio of nonperforming assets to net loans and leases and | 0.04 % | – | 0.53% | 5.09 | % | – | 0.04 | % | |||||||||
Accruing loans past due 90 days or more | $ | – | – | – | |||||||||||||
Ratio of accruing loans past due 90 days or more to net | – | – | – | ||||||||||||||
OTHER INFORMATION | |||||||||||||||||
Full-time equivalent employees | 60 | 56 | 61 | 58 | 69 | 60 | |||||||||||
Domestic offices: | |||||||||||||||||
Traditional branches | 1 | 1 | 1 | 1 | 1 | 1 | |||||||||||
Foreign office | 1 | 1 | – | ||||||||||||||
ATMs | – | – | – | ||||||||||||||
Total offices | 2 | 2 | 1 | ||||||||||||||
Net loans and leases contracted $10 million or 1.7% in 2009 compared to 2008. The decline was primarily due to $15.3 million in charge-offs and a decline in credit line utilization in the fourth quarter, offset by increases in commercial and industrial loans and loans to high net worth individuals. Yearly average net loans and leases increased by $34 million or 6.1% from 2008 to 2009. The allowance for loan and lease losses increased to $13 million in 2009 from $6 million in 2008, reflective of portfolio deterioration. TCBW continues to focus on loan growth in the commercial and high net worth individual markets and anticipates opportunities to grow market share in these areas as weaker local community banks struggle to maintain their client base.
Total deposits increased $29 million or 4.8% in 2009 compared to 2008. The ratio of noninterest-bearing demand deposits to total deposits was 31.0% in 2009 and 30.7% 2008. TCBW does not maintain brokered deposits and does not offer internet special rates.
The bank continued to growbe well capitalized in 2007 as2009. Its total assets increased to $947 million, up from $808 millionrisk-based capital ratio was 13.86% at December 31, 2006. Net loans increased to $509 million, from $428 million2009 year-end, 13.32% at year-end 20062008 and total deposits increased to $608 million from $513 million13.46% at the end of 2006. TCBW anticipates another year of steady balance sheet growth in 2008 with a stable net interest margin.
2007.
Other
“Other” includes the Parent and other various nonbanking subsidiaries, including nonbank financial services and financial technology subsidiaries and other smaller nonbank operating units, along with the elimination of transactions between segments.
The Other segment also includes ZMSC,Zions Management Services Company (“ZMSC”), which provides internal technology and operational services to affiliated operating businesses of the Company. ZMSC has 2,1422,214 of the 2,3972,483 FTE employees in the Other segment. ZMSC charges most of its costs to the affiliates on an approximate break-even basis.
The Other segment also includes TCBO,The Commerce Bank of Oregon (“TCBO”), which was opened during the fourth quarter of 2005 and has not had a significant impact on the Company’s balance sheet and income statement. TCBO consists of a single banking office operating in the Portland, Oregon area. Its business strategies focus on serving the financial needs of businesses, professional service firms, executives and professionals. At December 31, 2007,2009, TCBO had net loans of $26.3$53 million compared to $12.0$46 million at the end of 20062008 and deposits of $23.5$47 million compared to $8.7$35 million at the end of 2006. 2008.
Also, the Other segment includes P5, Inc.NetDeposit and NetDeposit. P5 is a company that providesWelman. NetDeposit generates revenues by selling hardware, software and services related to remote imaging, electronic capture and clearing of paper checks, and providing medical claims imaging, lockbox and web-based reconciliation and tracking services. The remaining minority interest of P5 was acquiredNetDeposit protects, with patents, its intellectual property in the fourth quarter of 2006, which is the main reason for the increased goodwill and other intangibles in the Other segment during 2006. NetDeposit sells hardware, software and servicesbusiness methods related to the remote imaging, electronic capture andprocessing, clearing of paper checks.checks, key aspects of Internet-based medical claims processing, and lending against medical claims submitted through the Internet.
Welman, including Contango Capital Advisors, Inc. (“Contango”), is a wealth management company that became a direct subsidiary of the Parent on January 1, 2008. We have extensive relationships with small and middle-market businesses and business owners that we believe present an unusual opportunity to offer wealth management services. Welman provides financial and tax planning, trust and inheritance services, over-the-counter, exchange-traded and synthetic derivative and hedging strategies, quantitative asset allocation and risk management and an array of investment strategies from equities and bonds through alternative and private equity investments. During 2009, Contango had an average balance of $1.0 billion of client assets under management and a strong pipeline of referrals from our affiliate banks, as compared to an average balance of $1.2 billion of assets under management during 2008. In years prior to 2008, Welman was a subsidiary of Zions Bank.
Schedule 27
OTHER
| (Dollar amounts in millions) | 2009 | 2008 | 2007 | |||||||
CONDENSED INCOME STATEMENT | ||||||||||
Net interest income | $ | (100.4 | ) | 8.8 | (0.8 | ) | ||||
Net impairment losses on investment securities | (203.8 | ) | (96.9 | ) | (19.3 | ) | ||||
Valuation losses on securities purchased | (1.6 | ) | – | – | ||||||
Elimination of loss on sale of investment securities to Parent | 375.7 | – | – | |||||||
Gain on subordinated debt modification | 508.9 | – | – | |||||||
Other noninterest income | (15.2 | ) | (98.9 | ) | 22.8 | |||||
Total revenue | 563.6 | (187.0 | ) | 2.7 | ||||||
Provision for loan losses | 2.5 | 1.3 | 0.3 | |||||||
Noninterest expense | 45.3 | 67.6 | 60.1 | |||||||
Impairment loss on goodwill | 2.9 | 12.7 | – | |||||||
Income (loss) before income taxes | 512.9 | (268.6 | ) | (57.7 | ) | |||||
Income tax expense (benefit) | 181.0 | (111.8 | ) | (45.7 | ) | |||||
Net income (loss) | 331.9 | (156.8 | ) | (12.0 | ) | |||||
Net income (loss) applicable to noncontrolling interests | (5.7 | ) | (5.5 | ) | 7.7 | |||||
Net income (loss) applicable to controlling interest | 337.6 | (151.3 | ) | (19.7 | ) | |||||
Preferred stock dividends | (100.3 | ) | (24.4 | ) | (14.3 | ) | ||||
Preferred stock redemption | 84.6 | – | – | |||||||
Net earnings (loss) applicable to common shareholders | $ | 321.9 | (175.7 | ) | (34.0 | ) | ||||
YEAR-END BALANCE SHEET DATA | ||||||||||
Total assets | $ | (757 | ) | (757 | ) | (126 | ) | |||
Total securities | 469 | 600 | 651 | |||||||
Net loans and leases | 66 | 132 | 87 | |||||||
Allowance for loan losses | 2 | 2 | 1 | |||||||
Goodwill and other intangibles | 1 | 7 | 22 | |||||||
Noninterest-bearing demand deposits | (30 | ) | (35 | ) | (238 | ) | ||||
Total deposits | (569 | ) | (1,558 | ) | (396 | ) | ||||
Preferred equity | (440 | ) | 394 | 240 | ||||||
Common equity | (439 | ) | (150 | ) | (232 | ) | ||||
Noncontrolling interests | 17 | 26 | 30 | |||||||
OTHER INFORMATION | ||||||||||
Full-time equivalent employees | 2,483 | 2,656 | 2,397 | |||||||
Domestic offices: | ||||||||||
Traditional branches | 1 | 1 | 1 | |||||||
SCHEDULE 25
OTHER
(Dollar amounts in millions)
| 2007 | 2006 | 2005 | ||||
CONDENSED INCOME STATEMENT | |||||||
Net interest income (expense) | $ | (0.8) | (21.9) | (1.0) | |||
Impairment losses on available-for-sale securities | (19.3) | – | – | ||||
Other noninterest income | 22.8 | 6.5 | 3.0 | ||||
Total revenue | 2.7 | (15.4) | 2.0 | ||||
Provision for loan losses | 0.3 | 0.2 | (0.3) | ||||
Noninterest expense | 60.1 | 63.5 | 50.7 | ||||
Income (loss) before income taxes and minority interest | (57.7) | (79.1) | (48.4) | ||||
Income tax expense (benefit) | (45.7) | (42.1) | (25.7) | ||||
Minority interest | 7.7 | 9.9 | (1.5) | ||||
Net income (loss) | (19.7) | (46.9) | (21.2) | ||||
Preferred stock dividend | 14.3 | 3.8 | – | ||||
Net earnings (loss) applicable to common shareholders | $ | (34.0) | (50.7) | (21.2) | |||
YEAR-END BALANCE SHEET DATA | |||||||
Total assets | $ | (126) | (343) | (1,120) | |||
Net loans and leases | 85 | 89 | 72 | ||||
Allowance for loan losses | 1 | – | – | ||||
Goodwill, core deposit and other intangibles | 22 | 25 | 1 | ||||
Noninterest-bearing demand deposits | (238) | (171) | (113) | ||||
Total deposits | (396) | (528) | (1,220) | ||||
Preferred equity | 240 | 240 | – | ||||
Common equity | (232) | (142) | (331) | ||||
OTHER INFORMATION | |||||||
Full-time equivalent employees | 2,397 | 2,256 | 1,565 | ||||
Domestic offices: | |||||||
Traditional branches | 1 | 1 | 1 | ||||
The net lossNet earnings applicable to common shareholders for the Other segment was $34.0$321.9 million in 20072009, compared to net losses of $50.7$175.7 million in 20062008 and $21.2$34.0 million in 2005. Net2007. The increase in net earnings applicable to common shareholders for 2009 is mainly due to the gain on subordinated debt modification and the impact of eliminating intercompany transactions, offset by increased net impairment losses on investment securities, increased preferred stock dividends mainly related to the U.S. Treasury’s $1.4 billion preferred stock investment and reduced net interest expenseincome. The increased net loss applicable to common shareholders for the other segment decreased $21.1 million from 20062008 is mainly
due to increased interest income at the parent level from interest-bearing advances primarily to its banking subsidiaries. Impairmentimpairment losses on available-for-saleinvestment securities, goodwill impairment losses on P5 goodwill, intercompany hedge ineffectiveness eliminations, and increased preferred stock dividends mainly related to the U.S. Treasury’s $1.4 billion preferred stock investment. Net impairment and valuation losses on
investment securities increased $19.3to a total of $205.4 million in 2009 from $96.9 million for 2008, mainly due to impairment losses on REITbank and insurance trust preferred CDO securities recorded in December 2007. Other noninterest income increased $16.3 million to $22.8 million during 2007, up from $6.5 million in 2006. The increase resulted from the inclusion of certain one-time intercompany profit eliminations during 2006 and increased earnings from nonbank subsidiaries during 2007. See further discussion in “Noninterest Income” on page 50.securities. See “Capital Management” on page 110126 for an explanation of the preferred stock dividend.dividends.
Net interest income was $(100.4) million in 2009, compared to $8.8 million in 2008 and $(0.8) million in 2007. The decrease in 2009 in net interest income is primarily due to the amortization of the discount on the modified convertible subordinated debt and interest expense on senior notes issued in 2009 at a higher interest rate. The modified convertible subordinated debt discount will be amortized to interest expense over the remaining life of the debt using the effective interest method. The rate of amortization will be accelerated if and as holders of the convertible subordinated debt elect to convert it into preferred stock. See further discussion in “Net Interest Income, Margin and Interest Rate Spreads” on page 52.
Through certainOther noninterest income was $(15.2) million in 2009 compared to $(98.9) million in 2008 and $22.8 million in 2007. The increase in other noninterest income is mainly due to an elimination in 2008 of $79.3 million for income recognized by the subsidiary banks on ineffective hedges that were not ineffective for the consolidated Company, has principally made nonmarketable investmentsand a $9.5 million decrease in a number of companies using four Small Business Investment Companies (“SBICs”). No new SBICs have been started since 2001. net equity securities losses.
The Company recognized gains on these venture capital SBIC investments, net of expenses,decline in 2008 in other noninterest income taxes and minority interest, of $3.4is mainly due to $59.6 million in 2007, compared to gains of $4.1 millionhedge ineffectiveness income eliminations in 2006 and losses of $2.2 million in 2005. These amounts are included in results reported by2008 for ineffective hedges at the respective subsidiary banks that were not ineffective for the consolidated Company. Other reasons for the decrease include $15.4 million for intercompany derivative credit valuation income eliminations, $30.2 million for declines in net equity securities gains, $4.2 million for declines in net fixed income securities gains, a $7.1 million fair value decrease for a security accounted for at fair value, and the Other segment, depending on the entity that made the investment.
$7.7 million for declines in income from other equity investments.
The Company also selectively makes investments in financial services and financial technology ventures. The Company owns a significant position in IdenTrust, Inc. (“IdenTrust”), a company in which two unrelated venture capital firms also own significant positions, and which provides, among other services, online identity authentication services and infrastructure. IdenTrust continues to post operating losses and the Company recorded pretax charges of $0.9 million in 2009 and $1.7 million in 2008 and $2.2 million in both 2007, and 2006 and $1.8 million in 2005, which reduced our recorded investment in the Company. The Other segment includes IdenTrust-related losses of $2.1 million in both 2007 and 2006 and $1.2 million in 2005 and Zions Bank included pretax losses of $0.1 million in both 2007 and 2006 and $0.6 million in 2005.
The Company continues to selectively invest in new, innovative products and ventures. Most notably the Company has funded the continued development of both NetDeposit (formerly NetDeposit, Inc. and P5. See page 30 of the “Executive Summary” for descriptions ofP5). NetDeposit and P5. For 2007, net after-tax losses of NetDeposit included in the Other segment were $5.8$12.0 million for 2009 compared to losses of $7.5$18.1 million in 20062008 and $7.4$8.3 million in 2005. Net after-tax losses2007. Excluding the goodwill impairment loss of $12.7 million, the net loss for P5 in 2007 included in the Other segment were $2.52008 was $5.4 million.
BALANCE SHEET ANALYSIS
As previously disclosed, the Company completed its acquisition of Stockmen’s effective January 17, 2007. Certain comparisons to 2006 include the impact of this acquisition.
Interest-Earning Assets
Interest-earning assets are those assets with interest rates or yields associated with them. One of our goals is to maintain a high level of interest-earning assets relative to total assets, while keeping nonearning assets at a minimum.
Interest-earning assets consist of money market investments, securities, and loans and leases. Schedule 5,7, which we referred to in our discussion of net interest income, includes the average balances of the Company’s interest-earning assets, the amount of revenue generated by them, and their respective yields. As shown in the schedule, average interest-earning assets in 20072009 increased 11.3%2.3% to $43.0$48.8 billion from $38.7$47.7 billion in 20062008 mainly driven by strong organic loan growth.increased average loans. Average interest-earning assets comprised 88.1%90.2% of total average assets in 20072009 compared with 87.4%88.7% in 2006.2008. Average interest-earning assets in 2007 were 92.3%92.5% of average tangible assets in 2009 as compared with 91.7%to 92.3% in 2006.
2008.
Average money market investments, consisting of interest-bearing deposits and commercial paper, federal funds sold, and security resell agreements increased 74.1%26.0% in 20072009 to $834$2,380 million from $479$1,889 million in 2006.2008. The increase in average money market investments is duereflects the increase in part to the asset-backedCompany’s liquidity during 2009. Average commercial paper that the affiliate banks purchased from Lockhart during the third and fourth quarters of 2007. See discussion in “Off-Balance Sheet Arrangements” on page 85was $118 million for further details.2009 compared to $865 million for 2008. Average investment securities decreased 6.7%3.6% for 20072009 compared to 2006.2008. Average net loans and leases for 20072009 increased 13.6%1.8% compared to 2006.
2008, primarily due to the impact of the acquired loans with FDIC support.
Investment Securities Portfolio
We invest in securities both to generate revenues for the Company and to manage liquidity. Schedule 26 presentsSchedules 28 and 29 present a profile of the Company’s investment portfolios at December 31, 2007, 2006,2009 with asset-backed securities classified by credit ratings. Schedule 30 presents a summarized profile of the Company’s investment portfolios at December 31, 2009 and 2005.2008. The amortized cost amounts represent the Company’s original cost for the investments, adjusted for accumulated amortization or accretion of any yield adjustments related to the security.security and credit impairment losses. The estimated fair values are the amounts that we believe most accurately reflect assumptions that other participants in the market place would use in pricing the securities as of the dates indicated.
Schedule 28 presents the Company’s asset-backed securities, classified by the highest of the ratings from any of Moody’s Investors Service, Fitch Ratings or Standard & Poors. Schedule 29 presents the asset-backed securities classified by the lowest of the ratings from any of these ratings agencies. During 2009, the Company continued to observe divergence of ratings on these securities between the various rating agencies.
SCHEDULE 26Schedule 28
INVESTMENT SECURITIES PORTFOLIO
ASSET-BACKED SECURITIES CLASSIFIED AT HIGHEST CREDIT RATING1
AT DECEMBER 31, 2009
| (In millions) | Par value | Amortized cost | Net unrealized gains (losses) recognized in OCI2 | Carrying value | Net unrealized gains (losses) not recognized in OCI2 | Estimated fair value | ||||||||||||||||||||||
HELD-TO-MATURITY | ||||||||||||||||||||||||||||
Municipal securities | $ | 609 | 606 | – | 606 | 3 | 609 | |||||||||||||||||||||
Asset-backed securities: | ||||||||||||||||||||||||||||
Trust preferred securities – banks and insurance | ||||||||||||||||||||||||||||
A rated | 10 | 10 | (1 | ) | 9 | (1 | ) | 8 | ||||||||||||||||||||
BBB rated | 16 | 17 | (2 | ) | 15 | (3 | ) | 12 | ||||||||||||||||||||
Noninvestment grade | 237 | 237 | (22 | ) | 215 | (27 | ) | 188 | ||||||||||||||||||||
Noninvestment grade – OTTI/PIK’d3 | 2 | 1 | (1 | ) | – | – | – | |||||||||||||||||||||
| December 31, | 265 | 265 | (26 | ) | 239 | (31 | ) | 208 | ||||||||||||||||||||
| 2007 | 2006 | 2005 | ||||||||||||||||||||||||||
(In millions)
| Amortized cost | Estimated fair value | Amortized cost | Estimated fair value | Amortized cost | Estimated fair value | ||||||||||||||||||||||
HELD-TO-MATURITY: | ||||||||||||||||||||||||||||
Municipal securities | $ | 704 | 702 | 653 | 649 | 650 | 642 | |||||||||||||||||||||
Other | ||||||||||||||||||||||||||||
AAA rated | 4 | 3 | – | 3 | – | 3 | ||||||||||||||||||||||
BBB rated | 21 | 20 | (1 | ) | 19 | (9 | ) | 10 | ||||||||||||||||||||
Noninvestment grade – OTTI/PIK’d3 | 12 | 7 | (4 | ) | 3 | – | 3 | |||||||||||||||||||||
| 37 | 30 | (5 | ) | 25 | (9 | ) | 16 | |||||||||||||||||||||
AVAILABLE-FOR-SALE: | ||||||||||||||||||||||||||||
| 911 | 901 | (31 | ) | 870 | (37 | ) | 833 | |||||||||||||||||||||
AVAILABLE-FOR-SALE | ||||||||||||||||||||||||||||
U.S. Treasury securities | 52 | 53 | 43 | 42 | 42 | 43 | 26 | 26 | – | 26 | 26 | |||||||||||||||||
U.S. government agencies and corporations: | ||||||||||||||||||||||||||||
U.S. Government agencies and corporations: | ||||||||||||||||||||||||||||
Agency securities | 629 | 626 | 782 | 774 | 688 | 683 | 242 | 243 | 6 | 249 | 249 | |||||||||||||||||
Agency guaranteed mortgage-backed securities | 765 | 763 | 901 | 894 | 1,156 | 1,150 | 373 | 374 | 11 | 385 | 385 | |||||||||||||||||
Small Business Administration | 789 | 771 | 907 | 901 | 786 | 782 | 744 | 782 | (14 | ) | 768 | 768 | ||||||||||||||||
Municipal securities | 244 | 237 | 5 | 242 | 242 | |||||||||||||||||||||||
Asset-backed securities: | ||||||||||||||||||||||||||||
Trust preferred securities - banks and insurance | 2,123 | 2,019 | 1,624 | 1,610 | 1,778 | 1,784 | ||||||||||||||||||||||
Trust preferred securities - real estate investment trusts | 156 | 94 | 204 | 201 | 153 | 151 | ||||||||||||||||||||||
Small business loan-backed | 183 | 182 | 194 | 194 | 206 | 203 | ||||||||||||||||||||||
Trust preferred securities – banks and insurance | ||||||||||||||||||||||||||||
AAA rated | 71 | 70 | (7 | ) | 63 | 63 | ||||||||||||||||||||||
AA rated | 634 | 477 | 21 | 498 | 498 | |||||||||||||||||||||||
A rated | 318 | 309 | (84 | ) | 225 | 225 | ||||||||||||||||||||||
A rated – OTTI/PIK’d3 | 50 | 44 | (12 | ) | 32 | 32 | ||||||||||||||||||||||
BBB rated | 163 | 139 | (29 | ) | 110 | 110 | ||||||||||||||||||||||
Not rated | 26 | 25 | (2 | ) | 23 | 23 | ||||||||||||||||||||||
Noninvestment grade | 223 | 217 | (56 | ) | 161 | 161 | ||||||||||||||||||||||
Noninvestment grade – OTTI/PIK’d3 | 933 | 742 | (493 | ) | 249 | 249 | ||||||||||||||||||||||
| 2,418 | 2,023 | (662 | ) | 1,361 | 1,361 | |||||||||||||||||||||||
Trust preferred securities – real estate investment trusts | ||||||||||||||||||||||||||||
Noninvestment grade | 25 | 16 | (2 | ) | 14 | 14 | ||||||||||||||||||||||
Noninvestment grade – OTTI/PIK’d3 | 70 | 40 | (30 | ) | 10 | 10 | ||||||||||||||||||||||
| 95 | 56 | (32 | ) | 24 | 24 | |||||||||||||||||||||||
Auction rate securities | ||||||||||||||||||||||||||||
AAA rated | 170 | 157 | – | 157 | 157 | |||||||||||||||||||||||
BBB rated | 3 | 3 | – | 3 | 3 | |||||||||||||||||||||||
| 173 | 160 | – | 160 | 160 | ||||||||||||||||||||||||
Other | 226 | 231 | 7 | 9 | 18 | 20 | ||||||||||||||||||||||
Municipal securities | 220 | 222 | 226 | 227 | 266 | 267 | ||||||||||||||||||||||
AAA rated | 50 | 48 | (8 | ) | 40 | 40 | ||||||||||||||||||||||
A rated | 3 | 3 | – | 3 | 3 | |||||||||||||||||||||||
Not rated | 33 | 32 | (20 | ) | 12 | 12 | ||||||||||||||||||||||
Noninvestment grade | 6 | 4 | (1 | ) | 3 | 3 | ||||||||||||||||||||||
Noninvestment grade – OTTI/PIK’d3 | 97 | 40 | (21 | ) | 19 | 19 | ||||||||||||||||||||||
| 189 | 127 | (50 | ) | 77 | 77 | |||||||||||||||||||||||
| 5,143 | 4,961 | 4,888 | 4,852 | 5,093 | 5,083 | 4,504 | 4,028 | (736 | ) | 3,292 | 3,292 | |||||||||||||||||
Other securities: | ||||||||||||||||||||||||||||
Mutual funds and stock | 174 | 174 | 196 | 199 | 224 | 223 | 364 | 364 | – | 364 | 364 | |||||||||||||||||
| 5,317 | 5,135 | 5,084 | 5,051 | 5,317 | 5,306 | 4,868 | 4,392 | (736 | ) | 3,656 | 3,656 | |||||||||||||||||
Total | $ | 6,021 | 5,837 | 5,737 | 5,700 | 5,967 | 5,948 | $ | 5,779 | 5,293 | (767 | ) | 4,526 | (37 | ) | 4,489 | ||||||||||||
| 1 | Ratings categories include the entire range. For example, “A rated” includes A+, A and A-. Split rated securities with more than one rating are categorized at the highest rating level. |
| 2 | Other comprehensive income. All amounts reported are pretax. |
| 3 | Consists of securities determined to have OTTI and/or securities whose most recent interest payment was capitalized as opposed to being paid in cash, as permitted under the terms of the security. This capitalization feature is known as Payment In Kind (“PIK”) and where exercised the security is called PIK’d. |
Schedule 29
INVESTMENT SECURITIES PORTFOLIO
ASSET-BACKED SECURITIES CLASSIFIED AT LOWEST CREDIT RATING1
AT DECEMBER 31, 2009
| (In millions) | Par value | Amortized cost | Net unrealized gains (losses) recognized in OCI2 | Carrying value | Net unrealized gains (losses) not recognized in OCI2 | Estimated fair value | |||||||||
HELD-TO-MATURITY | |||||||||||||||
Municipal securities | $ | 609 | 606 | – | 606 | 3 | 609 | ||||||||
Asset-backed securities: | |||||||||||||||
Trust preferred securities – banks and insurance | |||||||||||||||
Noninvestment grade | 263 | 264 | (25 | ) | 239 | (31 | ) | 208 | |||||||
Noninvestment grade – OTTI/PIK’d3 | 2 | 1 | (1 | ) | – | – | – | ||||||||
| 265 | 265 | (26 | ) | 239 | (31 | ) | 208 | ||||||||
Other | |||||||||||||||
A rated | 4 | 3 | – | 3 | – | 3 | |||||||||
Noninvestment grade | 21 | 20 | (1 | ) | 19 | (9 | ) | 10 | |||||||
Noninvestment grade – OTTI/PIK’d3 | 12 | 7 | (4 | ) | 3 | – | 3 | ||||||||
| 37 | 30 | (5 | ) | 25 | (9 | ) | 16 | ||||||||
| 911 | 901 | (31 | ) | 870 | (37 | ) | 833 | ||||||||
AVAILABLE-FOR-SALE | |||||||||||||||
U.S. Treasury securities | 26 | 26 | – | 26 | 26 | ||||||||||
U.S. Government agencies and corporations: | |||||||||||||||
Agency securities | 242 | 243 | 6 | 249 | 249 | ||||||||||
Agency guaranteed mortgage-backed securities | 373 | 374 | 11 | 385 | 385 | ||||||||||
Small Business Administration loan-backed securities | 744 | 782 | (14 | ) | 768 | 768 | |||||||||
Municipal securities | 244 | 237 | 5 | 242 | 242 | ||||||||||
Asset-backed securities: | |||||||||||||||
Trust preferred securities – banks and insurance | |||||||||||||||
AAA rated | 5 | 5 | - | 5 | 5 | ||||||||||
AA rated | 104 | 96 | (2 | ) | 94 | 94 | |||||||||
A rated | 148 | 121 | - | 121 | 121 | ||||||||||
BBB rated | 256 | 181 | 25 | 206 | 206 | ||||||||||
Not rated | 26 | 25 | (2 | ) | 23 | 23 | |||||||||
Noninvestment grade | 896 | 809 | (178 | ) | 631 | 631 | |||||||||
Noninvestment grade – OTTI/PIK’d3 | 983 | 786 | (505 | ) | 281 | 281 | |||||||||
| 2,418 | 2,023 | (662 | ) | 1,361 | 1,361 | ||||||||||
Trust preferred securities – real estate investment trusts | |||||||||||||||
Noninvestment grade | 25 | 16 | (2 | ) | 14 | 14 | |||||||||
Noninvestment grade – OTTI/PIK’d3 | 70 | 40 | (30 | ) | 10 | 10 | |||||||||
| 95 | 56 | (32 | ) | 24 | 24 | ||||||||||
Auction rate securities | |||||||||||||||
AAA rated | 163 | 151 | – | 151 | 151 | ||||||||||
BBB rated | 3 | 3 | – | 3 | 3 | ||||||||||
Noninvestment grade | 7 | 6 | – | 6 | 6 | ||||||||||
| 173 | 160 | – | 160 | 160 | |||||||||||
Other | |||||||||||||||
AAA rated | 11 | 9 | 1 | 10 | 10 | ||||||||||
AA rated | 37 | 37 | (9 | ) | 28 | 28 | |||||||||
A rated | 5 | 5 | – | 5 | 5 | ||||||||||
Not rated | 33 | 32 | (20 | ) | 12 | 12 | |||||||||
Noninvestment grade | 6 | 4 | (1 | ) | 3 | 3 | |||||||||
Noninvestment grade – OTTI/PIK’d3 | 97 | 40 | (21 | ) | 19 | 19 | |||||||||
| 189 | 127 | (50 | ) | 77 | 77 | ||||||||||
| 4,504 | 4,028 | (736 | ) | 3,292 | 3,292 | ||||||||||
Other securities: | |||||||||||||||
Mutual funds and stock | 364 | 364 | – | 364 | 364 | ||||||||||
| 4,868 | 4,392 | (736 | ) | 3,656 | 3,656 | ||||||||||
Total | $ | 5,779 | 5,293 | (767 | ) | 4,526 | (37 | ) | 4,489 | ||||||
| 1 | Ratings categories include the entire range. For example, “A rated” includes A+, A and A-. Split rated securities with more than one rating are categorized at the lowest rating level. |
| 2 | Other comprehensive income. All amounts reported are pretax. |
| 3 | Consists of securities determined to have OTTI and/or securities whose most recent interest payment was capitalized as opposed to being paid in cash, as permitted under the terms of the security. This capitalization feature is known as Payment In Kind (“PIK”) and where exercised the security is called PIK’d. |
Schedule 30
INVESTMENT SECURITIES PORTFOLIO
| December 31, | |||||||||||||||||||
| 2009 | 2008 | 2007 | |||||||||||||||||
| (In millions) | Amortized cost | Carrying value | Estimated fair value | Amortized cost | Carrying value | Estimated fair value | Amortized cost | Carrying value | Estimated fair value | ||||||||||
HELD-TO-MATURITY: | |||||||||||||||||||
Municipal securities | $ | 606 | 606 | 609 | 697 | 697 | 695 | 704 | 704 | 702 | |||||||||
Asset-backed securities: | |||||||||||||||||||
Trust preferred securities – banks and insurance | 265 | 239 | 208 | 1,188 | 1,004 | 677 | – | – | – | ||||||||||
Trust preferred securities – real estate investment trusts | – | – | – | 36 | 27 | 21 | – | – | – | ||||||||||
Other | 30 | 25 | 16 | 76 | 63 | 51 | – | – | – | ||||||||||
| 901 | 870 | 833 | 1,997 | 1,791 | 1,444 | 704 | 704 | 702 | |||||||||||
AVAILABLE-FOR-SALE: | |||||||||||||||||||
U.S. Treasury securities | 26 | 26 | 26 | 28 | 29 | 29 | 52 | 53 | 53 | ||||||||||
U.S. Government agencies and corporations: | |||||||||||||||||||
Agency securities | 243 | 249 | 249 | 323 | 325 | 325 | 629 | 626 | 626 | ||||||||||
Agency guaranteed mortgage-backed securities | 374 | 385 | 385 | 406 | 410 | 410 | 765 | 763 | 763 | ||||||||||
Small Business Administration loan-backed securities | 782 | 768 | 768 | 693 | 667 | 667 | 789 | 771 | 771 | ||||||||||
Municipal securities | 237 | 242 | 242 | 178 | 180 | 180 | 220 | 222 | 222 | ||||||||||
Asset-backed securities: | |||||||||||||||||||
Trust preferred securities – banks and insurance | 2,023 | 1,361 | 1,361 | 807 | 661 | 661 | 2,123 | 2,019 | 2,019 | ||||||||||
Trust preferred securities – real estate investment trusts | 56 | 24 | 24 | 27 | 24 | 24 | 156 | 94 | 94 | ||||||||||
Auction rate securities | 160 | 160 | 160 | – | – | – | – | – | – | ||||||||||
Small business loan-backed | – | – | – | – | – | – | 183 | 182 | 182 | ||||||||||
Other | 127 | 77 | 77 | 102 | 72 | 72 | 226 | 231 | 231 | ||||||||||
| 4,028 | 3,292 | 3,292 | 2,564 | 2,368 | 2,368 | 5,143 | 4,961 | 4,961 | |||||||||||
Other securities: | |||||||||||||||||||
Mutual funds and stock | 364 | 364 | 364 | 308 | 308 | 308 | 174 | 174 | 174 | ||||||||||
| 4,392 | 3,656 | 3,656 | 2,872 | 2,676 | 2,676 | 5,317 | 5,135 | 5,135 | |||||||||||
Total | $ | 5,293 | 4,526 | 4,489 | 4,869 | 4,467 | 4,120 | 6,021 | 5,839 | 5,837 | |||||||||
The amortized cost of investment securities at year-end 2007December 31, 2009 increased $284 million8.7% from 2006.the balance at December 31, 2008. The increasechange was largely due to Zions Bank purchasing $840 million at book value of U.S. Government agency-guaranteed and AAA-rated securities from Lockhart in December 2007. These actions were taken pursuant to($678 million), the Liquidity Agreement between Zions Bank and Lockhart, which requiresCompany purchasing auction rate securities purchasesfrom customers ($237 million), securities acquired in the absenceFDIC-assisted transactions of sufficient commercial paper funding. Sincethe failed Alliance, Great Basin, and Vineyard banks ($182 million), and the impact of the 2009 provisions of ACS 320 ($230 million) offset by OTTI credit impairment, valuation losses on security purchases, and security maturity paydowns. See further discussion of securities purchased from Lockhart in “Termination of Off-Balance Sheet Arrangement” on page 103. As discussed further in “Market Risk – Fixed Income” on page 120, changes in fair value on available-for-sale securities have been reflected in shareholders’ equity through accumulated other comprehensive income (“OCI”).
As shown previously, at December 31, 2009, 10.4% of the $3.7 billion of fair value of available-for-sale securities portfolio was valued at Level 1, 43.9% was valued at Level 2, and 45.7% was valued at Level 3 under the GAAP fair value accounting valuation hierarchy. See “Fair Value Accounting” on page 35 and Note 21 of the Notes to Consolidated Financial Statements for further discussion of fair value accounting.
The amortized cost of available-for-sale investment securities valued at Level 3 was $2,413 million and the fair value of the assets purchased was less than their book value, a pretax write-down of $33.1 million was recorded in conjunction with the purchase of these securities. Additionally, during November and December, the Company purchased two securities totaling $55 million from Lockhart that were downgraded below AA- by Fitch Ratings. The pretax charge for these securities purchased from Lockhart to mark them to estimated fair value was approximately $16.5$1,670 million.
At December 31, 2007, 65% of the $5.1 billion of available-for-sale The securities consisted of AAA-rated structured, municipal securities, government or agency guaranteed securities and 26% consisted of A-rated securities. In addition, approximately 3% of the available-for-sale portfolio was rated BBB and the 6% of the portfolio was unrated and below investment grade securities.
Included in asset-backed securitiesvalued at December 31, 2007 are CDOs collateralized by trust preferred securities issued by banks, insurance companies, or REITs, which may have some exposure to the subprime market. In addition, asset-backed securities – Other includes $112 million of certain structured asset-backed collateralized debt obligations (“ABS CDOs”) (also known as diversified structured finance CDOs) purchased from Lockhart which have minimal exposure to non-Zions originated subprime and home equity
mortgage securitizations. The $112 millionLevel 3 were comprised of ABS CDOs includes approximately $28 millionand auction rate securities. For these Level 3 securities, net pretax unrealized loss recognized in OCI at year end was $743 million. As of subprime mortgage securities and $16 million of home equity credit line securities. See further discussion of certain CDOs held by Lockhart in “Off-Balance Sheet Arrangements” on page 85.
At December 31, 2007,2009, we believe that the Company valued certain CDO par amounts of the Level 3 available-for-sale
securities using a matrix pricing methodology.for which no OTTI has been recognized do not differ from the amounts we currently anticipate realizing on settlement or maturity. See further discussion in “Critical Accounting Policies and Significant Estimates” on page 34.35 for further details about the CDO securities pricing methodologies.
During 2009, the Company reassessed the classification of certain asset-backed and trust preferred CDOs and reclassified approximately $596 million at fair value of held-to-maturity securities to available-for-sale. These securities were downgraded from an investment grade to a noninvestment grade rating by at least one rating agency. No gain or loss was recognized in the statement of income at the time of reclassification.
We review investment securities on an ongoing basis for the presence of other-than-temporary impairment (“OTTI”),OTTI, taking into consideration current market conditions, estimated credit impairment, if any, fair value in relationship to cost, the extent and nature of change in fair value, issuer rating changes and trends, volatility of earnings, current analysts’ evaluations, our ability and intent to hold investments until a recovery of fair value, which may be maturity, and other factors. Our review resultedThe Company incurred $280.5 million of credit-related OTTI charges recorded in aearnings and $289.4 million pretax charge of $108.6 million for OTTI related to illiquidity recorded in OCI during the fourth quarter of 2007 for eight REIT CDO securities.2009. The collateral in these securities deemed to have OTTI includes bank and insurance trust preferred debt, commercial mortgage-backed securities, and debt issued by commercial income REITs, commercial mortgage-backed securities, residential mortgage REITs, and home builders. The decision to deem these securities OTTI was based on the near term financial prospects for collateral in each CDO, a specific analysis of the structure of each security, and an evaluation of the underlying collateral using information and industry knowledge available to Zions.
homebuilders. Future reviews for OTTI will consider the particular facts and circumstances during the reporting period in review. See “Other-than-Temporary Impairment – Debt Investment Securities” on page 42 for further details about the OTTI accounting policy.
The Company recognized valuation losses during 2009 of $187.9 million on securities purchased from Lockhart under the terms of Lockhart’s Liquidity Agreement and $24.2 million on auction rate securities purchased from bank customers at par. During 2008 the Company recognized valuation losses of $13.1 million on securities purchased from Lockhart. These securities purchased from Lockhart in 2009 and 2008 consisted of REIT CDOs and bank and insurance trust preferred CDOs. See “Termination of Off-Balance Sheet Arrangement” on page 103 for further details about Lockhart.
Schedules 31 and 32 provide additional information on the below-investment-grade rated bank and insurance trust preferred CDOs portion of the AFS and HTM portfolio with aggregate data on those securities which have been determined to not have OTTI at December 31, 2009 and those which have been determined to be OTTI at or prior to December 31, 2009. The schedules utilize the lowest rating to identify those securities below investment grade. The schedules segment the securities by original ratings level to provide granularity on the seniority level of the securities and the distribution of unrealized losses, and on pool-level performance and projections. The best and worst pool-level statistic for each original ratings subgroup is presented, not the best and worst single security within the original ratings grouping. The number of issuers and number of currently performing issuers noted in Schedule 32 are from the same security. The remaining statistics may not be from the same security.
The Company’s loss and recovery experience as of December 31, 2009 is 100% loss on defaults. Our experience with deferring collateral has been that of all collateral that has elected to defer beginning in 2007, 47% has defaulted and 53% remains within the allowable deferrable period.
The following schedules reflect data and assumptions that are included in the calculations of fair value and OTTI.
Schedule 31
BELOW-INVESTMENT-GRADE RATED BANK AND INSURANCE TRUST PREFERRED CDOs BY ORIGINAL RATINGS LEVEL
AT DECEMBER 31, 2009
| (Amounts in millions) | Number of securities | % of portfolio | Total | Average holding1 | ||||||||||||||||||||
| Par value | Amortized cost | Estimated fair value | Unrealized gain (loss) | Par value | Amortized cost | Estimated fair value | Unrealized gain (loss) | |||||||||||||||||
Original ratings of securities, non-OTTI: | ||||||||||||||||||||||||
Original AAA | 22 | 32 | % | $ | 684 | 598 | 475 | (123 | ) | 30 | 26 | 21 | (5 | ) | ||||||||||
Original A | 30 | 26 | 555 | 555 | 366 | (189 | ) | 17 | 17 | 11 | (6 | ) | ||||||||||||
Original BBB | 8 | 3 | 59 | 59 | 35 | (24 | ) | 10 | 10 | 6 | (4 | ) | ||||||||||||
Total non-OTTI | 61 | 1,298 | 1,212 | 876 | (336 | ) | ||||||||||||||||||
Original ratings of securities, OTTI: | ||||||||||||||||||||||||
Original AAA | 1 | 2 | 50 | 44 | 32 | (12 | ) | 50 | 44 | 32 | (12 | ) | ||||||||||||
Original A | 37 | 33 | 718 | 576 | 205 | (371 | ) | 15 | 12 | 4 | (8 | ) | ||||||||||||
Original BBB | 9 | 4 | 78 | 28 | 7 | (21 | ) | 9 | 3 | 1 | (2 | ) | ||||||||||||
Total OTTI | 39 | 846 | 648 | 244 | (404 | ) | ||||||||||||||||||
Total noninvestment grade bank and insurance CDOs | 100 | % | $ | 2,144 | 1,860 | 1,120 | (740 | ) | ||||||||||||||||
| 1 | The Company may have more than one holding of the same security. |
Schedule 2732
POOL LEVEL PERFORMANCE AND PROJECTIONS FOR BELOW INVESTMENT GRADE RATED BANK AND INSURANCE TRUST PREFERRED CDOs
AT DECEMBER 31, 2009
| Current lowest rating | # of issuers in collateral pool | # of issuers currently performing1 | % of original collateral defaulted2 | % of original collateral deferring3 | Subordination as a % of performing collateral4 | Collateralization %5 | Present value of expected cash flows discounted at coupon rate as a % of par6 | Lifetime additional projected loss from performing collateral7 | ||||||||||||||||
Original ratings of securities, non-OTTI: | ||||||||||||||||||||||||
Original AAA | ||||||||||||||||||||||||
Best | BB | 49 | 43 | 4.43 | % | 1.52 | % | 76.15 | % | 710.81 | % | 100 | % | 5.80 | % | |||||||||
Weighted average | 33 | 24 | 13.58 | 14.98 | 33.97 | 253.82 | 99 | 8 | 8.57 | |||||||||||||||
Worst | CCC | 16 | 8 | 23.79 | 23.99 | 15.12 | 158.67 | 94 | 8 | 23.50 | ||||||||||||||
Original A | ||||||||||||||||||||||||
Best | BB | 29 | 29 | – | – | 24.20 | 305.17 | 110 | 4.98 | |||||||||||||||
Weighted average | 17 | 16 | 3.20 | 5.21 | 7.75 | 127.78 | 101 | 8.06 | ||||||||||||||||
Worst | C | 6 | 4 | 14.50 | 15.57 | (8.09 | )9 | 73.29 | 10 | 99 | 8 | 10.42 | ||||||||||||
Original BBB | ||||||||||||||||||||||||
Best | B | 36 | 36 | – | – | 14.99 | 354.73 | 100 | 4.98 | |||||||||||||||
Weighted average | 29 | 28 | 0.62 | 2.51 | 7.92 | 241.25 | 100 | 7.70 | ||||||||||||||||
Worst | C | 17 | 16 | 3.01 | 4.99 | 1.13 | 120.34 | 100 | 9.83 | |||||||||||||||
Original ratings of securities, OTTI: | ||||||||||||||||||||||||
Original AAA | ||||||||||||||||||||||||
Single security | B | 44 | 31 | 12.39 | 17.46 | 33.70 | 274.81 | 88 | 8.13 | |||||||||||||||
Original A | ||||||||||||||||||||||||
Best | BB | 62 | 54 | – | 1.69 | 36.92 | 158.53 | 103 | 1.63 | |||||||||||||||
Weighted average | 45 | 31 | 12.40 | 14.98 | 11.72 | 69.29 | 81 | 8.19 | ||||||||||||||||
Worst | C | 19 | 9 | 19.00 | 23.99 | (56.93 | ) | (7.09 | ) | 58 | 20.70 | |||||||||||||
Original BBB | ||||||||||||||||||||||||
Best | CC | 74 | 60 | 2.99 | 4.57 | (7.72 | ) | 76.11 | 95 | 6.78 | ||||||||||||||
Weighted average | 51 | 37 | 11.24 | 17.88 | (13.77 | ) | (116.69 | ) | 36 | 8.99 | ||||||||||||||
Worst | C | 38 | 23 | 15.65 | 23.88 | (18.85 | ) | (352.86 | ) | – | 11.17 | |||||||||||||
| 1 | Excludes both defaulted issuers and issuers that have elected to defer payment of current interest. |
| 2 | Collateral is identified as defaulted when a regulator closes an issuing bank. |
| 3 | Collateral is identified as deferring when the Company becomes aware that an issuer has announced or elected to defer interest payment on trust preferred debt. |
| 4 | Utilizes the Company’s loss assumption of 100% on defaulted collateral and the Company’s issuer specific loss assumption of from 8.2% to 100% dependent on credit for each deferring piece of collateral. “Subordination” in the schedule includes the effects of seniority level within the CDOs’ liability structure, the Company’s loss and recovery rate assumption for deferring but not defaulted collateral and a 0% recovery rate for defaulted collateral. The numerator is all collateral less the sum of (i) 100% of the defaulted collateral, (ii) the sum of the projected net loss amounts for each piece of deferring but not defaulted collateral and (iii) the amount of each CDO’s debt which is either senior to or pari passu with our security’s priority level. The denominator is all collateral less the sum of (i) 100% of the defaulted collateral and (ii) the sum of the projected net loss amounts for each piece of deferring but not defaulted collateral. |
| 5 | Utilizes the Company’s loss assumption of 100% on defaulted collateral and the Company’s issuer specific loss assumption of from 8.2% to 100% dependent on credit for each deferring piece of collateral. “Collateralization” in the schedule identifies the portion of a CDO tranche that is backed by nondefaulted collateral. The numerator is all collateral less the sum of (i) 100% of the defaulted collateral, (ii) the sum of the projected net loss amounts for each piece of deferring but not defaulted collateral and (iii) the amount of each CDO’s debt which is senior to our security’s priority level. The denominator is the par amount of the tranche. Par is defined as the original par less any principal paydowns. For further details on the loss assumption on deferrals see “Critical Accounting Policies and Significant Estimates” on page 35. |
| 6 | For OTTI securities, this statistic approximates the extent of OTTI credit losses taken. For the methodology used in determining OTTI credit loss see “Other-than-Temporary Impairment – Debt Investment Securities” on page 42. |
| 7 | This is the same statistic presented in Schedule 6 on page 41 and incorporated in the fair value and OTTI calculations. The statistic is the sum of incremental projected loss percentages from currently paying collateral for year one, years two through five and years six through thirty. For the methodology for projecting future credit losses see “Critical Accounting Policies and Significant Estimates” on page 35. |
| 8 | Although cash flows project a return of less than par, they project full recovery of amortized cost and therefore OTTI exists. |
| 9 | Negative subordination is projected to be remedied by excess spread prior to maturity. |
| 10 | Collateralization shortfall is projected to be remedied by excess spread prior to maturity. |
During the fourth quarter of 2009, the Company was informed of outstanding offers from a hedge fund to the preferred shareholders (“equity holders”) of four CDOs in which the Company held senior debt. The offers sought to induce the equity holders, in exchange for payments to be made outside of the CDO, to approve sales to the hedge fund of substantial amounts of performing collateral at deeply discounted prices. Such sales, if consummated, would be detrimental to the interests of the more senior tranches of the CDO.
Three of the four offers were not accepted by preferred shareholders and the offer with respect to one CDO was accepted by the preferred shareholders. The trustee has not commenced to sell the collateral and has filed an action in the United States District Court for the Southern District of New York seeking that the court order the interested parties in all the CDOs to interplead and settle all claims relating to the collateral. The Company and numerous other holders of more senior tranches of this CDO have retained counsel to defend their interests in the CDOs and the collateral and to seek to block any such sales, and believe they have substantial legal bases to do so.
The Company had holdings with a carrying value and amortized cost of $6.6 million and $33.5 million, respectively, at December 31, 2009 related to the CDO with the accepted offer. The Company’s investment could be materially adversely affected if judicial determinations result in the sale of the performing collateral at significant discounts to fair value. The Company has not adjusted the cash flows of these securities or incorporated the risk of an adverse outcome into its OTTI analysis as a result of the actions described above. The Company does not expect that the ultimate judicial determination will permit the proposed sales, which are in contravention to the seniority concepts within the CDOs. We did not find that sufficient information was available to market participants at either the balance sheet date or filing date to support the expectation of an adverse outcome. Schedule 33 also presents information regarding the investment securities portfolio. This schedule presents the maturities of the different types of investments that the Company owned as of December 31, 2007,2009, and the corresponding average interest rates that the investments will yield if they are held-to-maturity.held to maturity. It should be noted that most of the SBA loan-backed securities and asset-backed securities are variable rate and their repricing periods are significantly less than their contractual maturities. Also see “Liquidity Risk” on page 104121 and Notes 1, 4 and 7 of the Notes to Consolidated Financial Statements for additional information about the Company’s investment securities and their management.
SCHEDULE 27Schedule 33
MATURITIES AND AVERAGE YIELDS ON SECURITIES
AT DECEMBER 31, 20072009
| Total securities | Within one year | After one but within five years | After five but within ten years | After ten years | Total securities | Within one year | After one but within five years | After five but within ten years | After ten years | ||||||||||||||||||||||||||||||||||||||||||||||
(Amounts in millions)
| Amount | Yield* | Amount | Yield* | Amount | Yield* | Amount | Yield* | Amount | Yield* | Amortized cost | Yield* | Amortized cost | Yield* | Amortized cost | Yield* | Amortized cost | Yield* | Amortized cost | Yield* | |||||||||||||||||||||||||||||||||||
HELD-TO-MATURITY: | |||||||||||||||||||||||||||||||||||||||||||||||||||||||
HELD-TO-MATURITY | |||||||||||||||||||||||||||||||||||||||||||||||||||||||
Municipal securities | $ | 704 | 7.3% | $ | 54 | 7.0% | $ | 236 | 7.4% | $ | 189 | 7.2% | $ | 225 | 7.4% | $ | 606 | 7.1 | % | $ | 90 | 6.1 | % | $ | 236 | 6.6 | % | $ | 145 | 7.8 | % | $ | 135 | 8.0 | % | ||||||||||||||||||||
Asset-backed securities: | |||||||||||||||||||||||||||||||||||||||||||||||||||||||
Trust preferred securities – banks and insurance | 265 | 2.5 | – | 1 | 2.4 | 64 | 2.2 | 200 | 2.6 | ||||||||||||||||||||||||||||||||||||||||||||||
Other | 30 | 1.0 | – | 8 | 1.1 | 15 | 1.1 | 7 | 0.8 | ||||||||||||||||||||||||||||||||||||||||||||||
| 901 | 5.6 | 90 | 6.1 | 245 | 6.4 | 224 | 5.8 | 342 | 4.7 | ||||||||||||||||||||||||||||||||||||||||||||||
AVAILABLE-FOR-SALE: | |||||||||||||||||||||||||||||||||||||||||||||||||||||||
AVAILABLE-FOR-SALE | |||||||||||||||||||||||||||||||||||||||||||||||||||||||
U.S. Treasury securities | 52 | 3.9 | 31 | 3.6 | 20 | 4.2 | 1 | 8.4 | – | 26 | 2.7 | 25 | 2.4 | 1 | 7.7 | – | – | ||||||||||||||||||||||||||||||||||||||
U.S. government agencies and corporations: | |||||||||||||||||||||||||||||||||||||||||||||||||||||||
U.S. Government agencies and corporations: | |||||||||||||||||||||||||||||||||||||||||||||||||||||||
Agency securities | 629 | 4.7 | 408 | 4.6 | 181 | 5.0 | 35 | 5.1 | 5 | 5.2 | 243 | 5.2 | 78 | 5.2 | 126 | 5.2 | 34 | 5.3 | 5 | 5.3 | |||||||||||||||||||||||||||||||||||
Agency guaranteed mortgage-backed securities | 765 | 4.8 | 175 | 4.8 | 390 | 4.8 | 147 | 4.8 | 53 | 4.9 | 374 | 4.4 | 106 | 4.5 | 194 | 4.4 | 56 | 4.2 | 18 | 4.1 | |||||||||||||||||||||||||||||||||||
Small Business Administration loan-backed securities | 789 | 5.3 | 176 | 5.2 | 398 | 5.4 | 162 | 5.4 | 53 | 5.1 | 782 | 2.0 | 156 | 2.0 | 372 | 2.0 | 187 | 2.0 | 67 | 2.0 | |||||||||||||||||||||||||||||||||||
Asset-backed securities: | |||||||||||||||||||||||||||||||||||||||||||||||||||||||
Trust preferred securities - banks and insurance(1) | 2,123 | 6.1 | – | – | – | 2,123 | 6.1 | ||||||||||||||||||||||||||||||||||||||||||||||||
Trust preferred securities - real estate investment trusts(1) | 156 | 6.1 | – | – | – | 156 | 6.1 | ||||||||||||||||||||||||||||||||||||||||||||||||
Small business loan-backed | 183 | 7.3 | 24 | 7.4 | 122 | 7.2 | 37 | 7.7 | – | ||||||||||||||||||||||||||||||||||||||||||||||
Municipal securities | 237 | 5.0 | 11 | 6.9 | 40 | 6.6 | 69 | 5.8 | 117 | 3.7 | |||||||||||||||||||||||||||||||||||||||||||||
Asset-backed securities | |||||||||||||||||||||||||||||||||||||||||||||||||||||||
Trust preferred securities – banks and insurance | 2,023 | 2.0 | 21 | 2.0 | 113 | 2.3 | 231 | 2.4 | 1,658 | 2.0 | |||||||||||||||||||||||||||||||||||||||||||||
Trust preferred securities – real estate investment trusts | 56 | 2.0 | – | – | 12 | 0.8 | 44 | 2.3 | |||||||||||||||||||||||||||||||||||||||||||||||
Auction rate securities | 160 | 0.9 | – | – | – | 160 | 0.9 | ||||||||||||||||||||||||||||||||||||||||||||||||
Other | 226 | 5.9 | 2 | 7.3 | 29 | 5.6 | 53 | 6.0 | 142 | 5.9 | 127 | 1.6 | 26 | 1.7 | 53 | 1.8 | 6 | 1.4 | 42 | 1.2 | |||||||||||||||||||||||||||||||||||
Municipal securities | 220 | 5.8 | 22 | 5.5 | 7 | 6.4 | 60 | 6.0 | 131 | 5.7 | |||||||||||||||||||||||||||||||||||||||||||||
| 5,143 | 5.6 | 838 | 4.8 | 1,147 | 5.3 | 495 | 5.5 | 2,663 | 6.0 | 4,028 | 2.6 | 423 | 3.4 | 899 | 3.2 | 595 | 3.0 | 2,111 | 2.0 | ||||||||||||||||||||||||||||||||||||
Other securities: | |||||||||||||||||||||||||||||||||||||||||||||||||||||||
Mutual funds and stock | 174 | 3.0 | 173 | 3.0 | – | – | 1 | 2.1 | 364 | 0.1 | 364 | 0.1 | – | – | – | ||||||||||||||||||||||||||||||||||||||||
| 5,317 | 5.5 | 1,011 | 4.5 | 1,147 | 5.3 | 495 | 5.5 | 2,664 | 6.0 | 4,392 | 2.4 | 787 | 1.9 | 899 | 3.2 | 595 | 3.0 | 2,111 | 2.0 | ||||||||||||||||||||||||||||||||||||
Total | $ | 6,021 | 5.7% | $ | 1,065 | 4.7% | $ | 1,383 | 5.6% | $ | 684 | 6.0% | $ | 2,889 | 6.1% | $ | 5,293 | 2.9 | % | $ | 877 | 2.3 | % | $ | 1,144 | 3.9 | % | $ | 819 | 3.8 | % | $ | 2,453 | 2.4 | % | ||||||||||||||||||||
| Taxable-equivalent rates used where |
TheAs shown in Schedule 34, the investment securities portfolio at December 31, 20072009 includes $908$654 million of nonrated, fixed-income securities compared to $881$707 million at December 31, 2006 as shown in Schedule 28.2008. Nonrated municipal securities held in the portfolio were underwritten as to credit by Zions Bank’s Municipal Credit Department in accordance with its established municipal credit standards. Virtually all the securities were originated by the Company’s financial services business.
Schedule 34
NONRATED SECURITIES
Municipal securities Other nonrated debt securitiesSCHEDULE 28 December 31, (Book value in millions) 2009 2008 $ 594 681 60 26 $ 654 707
NONRATED SECURITIES
| December 31, | |||||
| (Book value in millions) | 2007 | 2006 | |||
Municipal securities | $ | 691 | 630 | ||
Asset-backed subordinated tranches, | 183 | 194 | |||
Asset-backed subordinated tranches, | 33 | 55 | |||
Other nonrated debt securities | 1 | 2 | |||
| $ | 908 | 881 | |||
In addition to the nonrated municipal securities, the portfolio includes nonrated, asset-backed subordinated tranches. The asset-backed subordinated tranches created from the Company’s loans are mainly the subordinated retained interests of small business loan securitizations (the senior tranches of these securitizations are sold to Lockhart, a QSPE securities conduit described further in “Off-Balance Sheet Arrangements” on page 85. At December 31, 2007, these comprised $183 million of the $203 million set forth in Schedule 30. The tranches not created from the Company’s loans are tranches of bank and insurance company trust preferred CDOs.
Although the credit quality of these nonrated securities generally is high, it would be difficult to market them in a short period of time since they are not rated and there is no active trading market for them.
Loan Portfolio
As of December 31, 2007,2009, net loans and leases accounted for 73.8%78.6% of total assets unchanged fromcompared to 75.6% at year-end 2006,2008, and 77.0%80.4% of tangible assets as compared to 77.2%78.1% at December 31, 2006.2008. Schedule 2935 presents the Company’s loans outstanding by type of loan as of the five most recent year-ends. The schedule also includes a maturity profile for the loans that were outstanding as of December 31, 2007.2009. However, while this schedule reflects the contractual maturity and repricing characteristics of these loans, in certain cases the Company has hedged the repricing characteristics of its variable-rate loans as more fully described in “Interest Rate Risk” on page 99.117.
Schedule 35
SCHEDULE 29
LOAN PORTFOLIO BY TYPE AND MATURITY
| December 31, 2007 | December 31, | December 31, 2009 | December 31, | |||||||||||||||||||||||||||||||||
| (In millions) | One year or less | One year through five years | Over five years | Total | One year or less | One year through five years | Over five years | Total | 2008 | 2007 | 2006 | 2005 | ||||||||||||||||||||||||
| 2006 | 2005 | 2004 | 2003 | |||||||||||||||||||||||||||||||||
Loans held for sale | $ | 1 | 40 | 167 | 208 | 253 | 256 | 197 | 177 | |||||||||||||||||||||||||||
Commercial lending: | ||||||||||||||||||||||||||||||||||||
Commercial and industrial | 5,075 | 3,421 | 1,315 | 9,811 | 8,422 | 7,192 | 4,643 | 4,111 | $ | 5,204 | 3,456 | 1,262 | 9,922 | 11,447 | 10,407 | 8,422 | 7,192 | |||||||||||||||||||
Leasing | 20 | 381 | 102 | 503 | 443 | 373 | 370 | 377 | 25 | 317 | 124 | 466 | 431 | 503 | 443 | 373 | ||||||||||||||||||||
Owner occupied | 602 | 780 | 6,222 | 7,604 | 6,260 | 4,825 | 3,790 | 3,319 | 459 | 1,319 | 6,974 | 8,752 | 8,743 | 7,545 | 6,260 | 4,825 | ||||||||||||||||||||
Total commercial lending | 5,697 | 4,582 | 7,639 | 17,918 | 15,125 | 12,390 | 8,803 | 7,807 | 5,688 | 5,092 | 8,360 | 19,140 | 20,621 | 18,455 | 15,125 | 12,390 | ||||||||||||||||||||
Commercial real estate: | ||||||||||||||||||||||||||||||||||||
Construction and land development | 5,849 | 2,017 | 449 | 8,315 | 7,483 | 6,065 | 3,536 | 2,867 | 3,243 | 2,095 | 214 | 5,552 | 7,516 | 7,869 | 7,483 | 6,065 | ||||||||||||||||||||
Term | 980 | 1,229 | 3,067 | 5,276 | 4,952 | 4,640 | 3,998 | 3,402 | 1,036 | 2,256 | 3,963 | 7,255 | 6,196 | 5,334 | 4,952 | 4,640 | ||||||||||||||||||||
Total commercial real estate | 6,829 | 3,246 | 3,516 | 13,591 | 12,435 | 10,705 | 7,534 | 6,269 | 4,279 | 4,351 | 4,177 | 12,807 | 13,712 | 13,203 | 12,435 | 10,705 | ||||||||||||||||||||
Consumer: | ||||||||||||||||||||||||||||||||||||
Home equity credit line and other consumer real estate | 301 | 355 | 1,547 | 2,203 | 1,850 | 1,831 | 1,104 | 838 | ||||||||||||||||||||||||||||
Home equity credit line | 15 | 109 | 2,011 | 2,135 | 2,005 | 1,608 | 1,850 | 1,831 | ||||||||||||||||||||||||||||
1-4 family residential | 169 | 624 | 3,413 | 4,206 | 4,192 | 4,130 | 4,234 | 3,874 | 112 | 324 | 3,206 | 3,642 | 3,877 | 3,975 | 4,192 | 4,130 | ||||||||||||||||||||
Construction and other consumer real estate | 206 | 105 | 148 | 459 | 774 | 945 | – | – | ||||||||||||||||||||||||||||
Bankcard and other revolving plans | 212 | 127 | 8 | 347 | 295 | 207 | 225 | 198 | 214 | 115 | 12 | 341 | 374 | 347 | 295 | 207 | ||||||||||||||||||||
Other | 94 | 265 | 93 | 452 | 457 | 537 | 532 | 749 | 68 | 197 | 28 | 293 | 385 | 460 | 457 | 537 | ||||||||||||||||||||
Total consumer | 776 | 1,371 | 5,061 | 7,208 | 6,794 | 6,705 | 6,095 | 5,659 | 615 | 850 | 5,405 | 6,870 | 7,415 | 7,335 | 6,794 | 6,705 | ||||||||||||||||||||
Foreign loans | 18 | 8 | – | 26 | 3 | 5 | 5 | 15 | 62 | 3 | – | 65 | 43 | 51 | 3 | 5 | ||||||||||||||||||||
FDIC-supported loans | 496 | 333 | 616 | 1,445 | ||||||||||||||||||||||||||||||||
Other receivables | 190 | 79 | 32 | 301 | 209 | 191 | 98 | 90 | – | – | – | – | – | – | 209 | 191 | ||||||||||||||||||||
Total loans | $ | 13,511 | 9,326 | 16,415 | 39,252 | 34,819 | 30,252 | 22,732 | 20,017 | $ | 11,140 | 10,629 | 18,558 | 40,327 | 41,791 | 39,044 | 34,566 | 29,996 | ||||||||||||||||||
Loans maturing in more than one year: | ||||||||||||||||||||||||||||||||||||
With fixed interest rates | $ | 3,869 | 3,865 | 7,734 | $ | 4,414 | 3,536 | 7,950 | ||||||||||||||||||||||||||||
With variable interest rates | 5,457 | 12,550 | 18,007 | 6,215 | 15,022 | 21,237 | ||||||||||||||||||||||||||||||
Total | $ | 9,326 | 16,415 | 25,741 | $ | 10,629 | 18,558 | 29,187 | ||||||||||||||||||||||||||||
During 2008 the Company completed a loan classification project. Information to reclassify loans for periods prior to 2007 is not available.
Loan growth was strongNet loans and leases decreased $1.5 billion during 20072009 compared to an increase of $2.8 billion during 2008. Loans at Zions Bank, Amegy, Vectra, TCBW and TCBO. However, loan growth at NBA and NSB slowed considerably during 2007 and CB&T experienced a reduction in outstanding loans. Loan growth included the impactDecember 31, 2009 include $1.4 billion of the loans, acquired from the Stockmen’s acquisition,FDIC with loss sharing agreements, related to the failed Alliance Bank, Great Basin Bank, and Vineyard Bank. Excluding these FDIC-supported loans, net loans and leases decreased approximately $2.9 billion or 7.0% during 2009 throughout our markets due to weak loan demand, as previouslywell as pay-offs and loan charge-offs resulting from challenging economic
conditions in our markets. Loan contraction during 2009 was primarily in commercial construction and land development at all banking subsidiaries and secondarily in commercial lending. We did have loan growth in the commercial real estate term category at all banking subsidiaries except NSB as maturing, credit-worthy commercial construction and land development loans converted into commercial real estate term loans. The increase in loans in 2008 includes $1.2 billion of loans resulting from the purchase of certain securities from Lockhart, as discussed in “Business Segment Results” beginning“Termination of Off-Balance Sheet Arrangement” on page 57.103. These securities were backed by loans originated or underwritten by Zions Bank and are reflected on the Company’s balance sheet primarily as owner-occupied commercial loans.
Although we continue to actively originate loans, we expect that core loan balances for the next few quarters will most likely contract. This is mainly due to the current economic environment which is causing a reduction in loan demand. Pay-downs, charge offs, and other reductions are likely to continue to offset originations. We expect that loan growth will continue in 2008 in most of our subsidiary banks, butconstruction and land development balances to continue to be stagnant at NBA, NSB and CB&T until conditions in the residential real estate sector improve. However, the average growth experienced in 2007 may not be sustainable throughout 2008.decline as they have during recent quarters.
Sold Loans Being Serviced
The Company performs loan servicing operations on both loans that it holds in its portfolios as well as loans that are owned by third party investor-owned trusts.parties. Servicing loans includes:
collecting loan and, in certain instances, insurance and property tax payments from the borrowers;
monitoring adequate insurance coverage;
maintaining documentation files in accordance with legal, regulatory, and contractual guidelines; and
remitting payments to third party investor trusts and, where required, for insurance and property taxes.
The Company receives a fee for performing loan servicing for third parties. Failure by the Company to service the loans in accordance with the contractual requirements of the servicing agreements may lead to the termination of the servicing contract and the loss of future servicing fees.
Schedule 36
SCHEDULE 30
SOLD LOANS BEING SERVICED
| 2007 | 2006 | 2005 | |||||||||||
| (In millions) | Sales | Outstanding at year-end | Sales | Outstanding at year-end | Sales | Outstanding at year-end | |||||||
Home equity credit lines | $ | – | 71 | 153 | 261 | 408 | 456 | ||||||
Small business loans | – | 1,331 | – | 1,790 | 707 | 2,341 | |||||||
SBA 7(a) loans | – | 90 | 22 | 128 | 16 | 179 | |||||||
Farmer Mac | 64 | 393 | 43 | 407 | 69 | 407 | |||||||
Total | $ | 64 | 1,885 | 218 | 2,586 | 1,200 | 3,383 | ||||||
| Residual interests on balance sheet at December 31, 2007 | Residual interests on balance sheet at December 31, 2006 | ||||||||||||
| (In millions) | Subordinated retained interests | Capitalized residual cash flows | Total | Subordinated retained interests | Capitalized residual cash flows | Total | |||||||
Home equity credit lines | $ | 7 | 1 | 8 | 8 | 5 | 13 | ||||||
Small business loans | 203 | 50 | 253 | 214 | 78 | 292 | |||||||
SBA 7(a) loans | – | 1 | 1 | – | 2 | 2 | |||||||
Farmer Mac | – | 5 | 5 | – | 5 | 5 | |||||||
Total | $ | 210 | 57 | 267 | 222 | 90 | 312 | ||||||
Home equity credit lines Small business loans SBA 7(a) loans Farmer Mac Leases Total 2009 2008 2007 (In millions) Sales Outstanding
at year-end Sales Outstanding
at year-end Sales Outstanding
at year-end $ – – – – – 71 – – – – – 1,331 25 202 31 98 – 90 80 417 74 403 64 393 – 49 86 77 – – $ 105 668 191 578 64 1,885
The Company has securitized and sold a portion of the loans that it originated and purchased. In many instances, we agreed to provide the servicing on these loans as a condition of the sale. Schedule 30 summarizes the sold loans (other than conforming long-term first mortgage real estate loans) that the Company was servicing as of the dates indicated and the related loan sales activity. As reflectedincrease in the schedule, sales for 2007 decreased approximately $154 million compared to 2006, which were down $982 million from 2005. The Company did not complete a small business loans securitization during 2007 or 2006 and also discontinued selling new home equity credit lines originations during the fourth quarter of 2006. Small business, consumer and otheroutstanding SBA 7(a) sold loans being serviced totaled $1.9 billion at the end of 2007 compared to $2.6 billion at the end of 2006. See Notes 1 and 6 of the Notes to Consolidated Financial Statements for additional information on asset securitizations. In addition, at December 31, 2007, conforming long-term first mortgage real estate loans being serviced for others was $1,232 million compared with $1,251 million at year-end 2006.
Although it performs the servicing, the Company exerts no control nor does it have any equity interest in any of the trusts that own the securitized loans. However, as of December 31, 2007, the Company had recorded assets in the amount of $267 million in connection with sold loans being serviced of $1.9 billion. As is a common practice with securitized transactions, the Company had subordinated retained interests in the securitized assets amounting to $210 million at December 31, 2007, representing junior positionsprimarily due to the other investors in the trust securities. The capitalized residual cash flows, which is sometimes referred to as “excessimpact of acquired SBA 7(a) loan servicing” of $57 million primarily represent the present value of the excess cash flows that have been projected over the lives of the sold loans. These excess cash flows are subject to prepayment risk, which is the risk that a loan will be paid prior to its contractual maturity. When this occurs, any remaining excess cash flows associated with the loan would be reduced. See Note 6 of the Notes to Consolidated Financial Statements for more information on asset securitizations portfolios at Alliance and “Off-Balance Sheet Arrangements” on page 85.Vineyard Banks.
Other Earning Assets
As of December 31, 2007,2009, the Company had $1,034$1,100 million of other noninterest-bearing investments compared with $1,022$1,044 million in 2006.2008. The increase in other noninterest-bearing investments resulted mainly from increases in Federal Home Loan Bank stock and increases in the non-SBIC investment funds.Reserve stock.
Schedule 37
SCHEDULE 31
OTHER NONINTEREST-BEARING INVESTMENTS
| December 31, | December 31, | |||||||||
| (In millions) | 2007 | 2006 | 2009 | 2008 | ||||||
Bank-owned life insurance | $ | 601 | 627 | $ | 620 | 623 | ||||
Federal Home Loan Bank and Federal Reserve stock | 227 | 189 | ||||||||
SBIC investments(1) | 73 | 104 | ||||||||
Non-SBIC investment funds | 65 | 37 | ||||||||
Federal Home Loan Bank stock | 136 | 136 | ||||||||
Federal Reserve stock | 122 | 84 | ||||||||
SBIC investments1 | 65 | 66 | ||||||||
Non-SBIC investment funds and other | 102 | 93 | ||||||||
Investments in ADC arrangements | 19 | 16 | ||||||||
Other public companies | 38 | 37 | 22 | 12 | ||||||
Other nonpublic companies | 16 | 14 | ||||||||
Trust preferred securities | 14 | 14 | 14 | 14 | ||||||
| $ | 1,034 | 1,022 | $ | 1,100 | 1,044 | |||||
Amounts include minority investors’ interests in Zions’ managed SBIC investments of approximately |
Bank-owned life insurance investments declined $26 million during 2007 mainly due to the Company surrendering three bank-owned life insurance contracts during the first quarter. The increase in cash surrender value of the remaining policies is not taxable since it is anticipated that the bank-owned life insurance will be held until the eventual death of the insured employees.
FHLB and Federal Reserve stock investments increased $38 million from December 31, 2006 primarily during the third quarter of 2007. The increase is mainly2009 due to increased investments the Company made at the FHLBs to increase the Company’s borrowing capacity.
SBIC investments decreased $31 million from December 31, 2006 due to the sale and profitable exit of investments in our venture funds.
regulatory required investments.
Non-SBIC investment funds increased $28$9 million during 20072009 primarily as a result of increased investment in funds within new and existing investment commitments and appreciation on existing investments.
TheOther public company investments increased $10 million during 2009 primarily due to increased equity in earnings from investments in publicly traded companies are accounted for using the equity method of accountingFarmer Mac and are set forth in Schedule 32.
SCHEDULE 32
INVESTMENTS IN OTHER PUBLIC COMPANIES
| December 31, 2007 | |||||||||
(In millions)
| Symbol | Carrying value | Fair value | Unrealized gain (loss) | |||||
COMPANY | |||||||||
Federal Agricultural Mortgage Corporation (Farmer Mac) | AGM/A | $ | 7 | 5 | (2) | ||||
Federal Agricultural Mortgage Corporation (Farmer Mac) | AGM | 20 | 22 | 2 | |||||
Insure.com, Inc. | NSUR | 11 | 10 | (1) | |||||
Total publicly traded equity investments | $ | 38 | 37 | (1) | |||||
Life Quotes, Inc.
Deposits and Borrowed Funds
Deposits, both interest-bearing and noninterest-bearing, are a primary source of funding for the Company. Intense competition forDuring 2009, total actual and average deposit balances increased over 2008 balances, and were impacted by the inclusion of deposits during the year resulted in deposit growth laggingrelated to failed bank FDIC-assisted acquisitions and a failed bank FDIC paying agent agreement. Total deposits exceeded the Company’s strong loan growthnet loans and also impeded our ability to reprice our deposits as the Federal Reserve lowered rates during the second half of the year. Management expects that deposit growth may continue to lag behind loan growth and that a portion of future loan growth may be funded from alternative higher cost funding sources.
leases balance at December 31, 2009.
Schedule 57 on page 54 summarizes the average deposit balances for the past five years along with their respective interest costs and average interest rates. Average noninterest-bearing deposits decreased 1.1%increased 20.9% in 2007 over 2006,2009 from 2008, while average interest-bearing deposits increased 13.6%11.8% during the same time period. Average noninterest-bearing deposit account balance growth was strong in 2009 and the Company believes this is partially attributable to low absolute interest rates and the FDIC guarantee on demand deposits.
Total deposits at December 31, 20072009 increased $1.9$0.5 billion to $36.9$41.8 billion, or 5.5%1.3% over the balances reported at December 31, 2006. Core deposits increased $1.9 million to $32.5 billion, or 6.0%, compared to $30.7 billion at December 31, 2006. The Company experienced strong growth in its Internet money market deposits during 2007 with balances increasing $1.0 billion to $2.2 billion, or 82.5% compared to $1.2 billion at December 31, 2006.2008. Noninterest-bearing demand deposits at December 31, 2007 decreased $0.42009 increased $2.6 billion to $9.6$12.3 billion compared to $10.0$9.7 billion at December 31, 2006. The mix of deposits reflects the decline in demand deposits during the year as demand,2008. Demand, savings and money market deposits comprised 72.0%82.6% of total deposits at December 31, 2007,2009, compared with 74.0%74.9% as of December 31, 2006.2008. The increase was mainly driven by increased noninterest-bearing demand deposits and savings deposits during 2009.
During 2008 and the first quarter of 2009, the Company increased brokered deposit programs and Internet money market accounts to serve as an additional source of liquidity for the Company and to reduce its reliance on FHLB advances and other short-term borrowings. As liquidity returned to the market during 2009, the Company reduced brokered deposit programs. At December 31, 2009, total deposits included $1.6 billion of
brokered deposits compared to $3.3 billion at December 31, 2008. Internet money market deposits were $2.7 billion compared to $2.5 billion at December 31, 2008. Money market deposits included $1.3 billion of brokered deposits or 7.7% of total money market deposits. The average balance of brokered deposits was $2.9 billion for 2009 and $653 million for 2008.
See “Liquidity Risk” on page 104121 for information on funding and borrowed funds. Also, see Notes 11, 12 and 13 of the Notes to Consolidated Financial Statements for additional information on borrowed funds.
Termination of Off-Balance Sheet ArrangementsArrangement
The Company administers one QSPEpreviously administered a qualifying special-purpose entity (“QSPE”) securities conduit, Lockhart Funding LLC, which was established in 2000. Lockhart was structured to purchase AAA-rated and other government agency securities and AAA-rated securities that arewere collateralized by small business loans originated or purchased by Zions Bank; such loans were originated between 2000during and prior to 2005. Lockhart obtainsobtained funding through the issuance of asset-backed commercial paper.
Lockhart ceased issuance of asset backed commercial paper and holds securities, which include securities that are collateralized by small business loans, U.S. Government, agency and AAA-rated securities.
Liquidity Agreement
on April 21, 2009 after Moody’s downgraded Zions Bank, isas Liquidity Bank, from P1 to NP and downgraded Lockhart as a consequence. Effective June 5, 2009, Zions Bank became a holder of over 90% of Lockhart’s commercial paper notes, causing Lockhart to no longer be a QSPE and thus requiring consolidation of Lockhart by Zions Bank at fair value.
On September 15, 2009, the sole providerremaining outstanding commercial paper notes of Lockhart totaling $3 million matured. Lockhart’s remaining security portfolio was exclusively SBA-backed securities. Following the notes’ maturity on September 15, 2009, Lockhart and its program documents were terminated as agreed to in an executed Termination Agreement dated May 29, 2009 between all involved parties.
Under the terms of a liquidity facility, prior to Lockhart. Lockhart purchases U.S. Government, agency and AAA-rated securities, which are funded through the issuance of Lockhart’s asset-backed commercial paper. Pursuant to the Liquidity Agreement,consolidation Zions Bank is required to purchase nondefaultedpurchased, during the nine months ended September 30, 2009, $678 million of securities from Lockhart to provide funds to repay maturing commercial paper upon Lockhart’s inability to access the commercial paper market for sufficient funding, or upon a commercial paper market disruption, as specified in the governing documents of Lockhart. In addition, pursuant to the governing documents, including the Liquidity Agreement, if any security in Lockhart is downgraded to below AA- or the downgrade of one or more securities results in more than ten securities having ratings of AA+ to AA-, Zions Bank must either 1) place its letter of credit on the security, 2) obtain a credit enhancement on the security from a third party, or 3) purchase the security from Lockhart at book value.
The maximum amountvalue and recognized losses of liquidity that Zions Bank can be required to provide pursuant to the Liquidity Agreement is limited to the total amount of securities held by Lockhart. This maximum amount was $2.1 billion at year-end 2007, $4.1 billion at December 31, 2006, and $5.3 billion at December 31, 2005. As of February 15, 2008, the total amount of securities held by Lockhart was $1.9 billion and the Company owned $1.3 billion of Lockhart commercial paper.
In addition to providing the Liquidity Agreement, Zions Bank receives a fee in exchange for providing hedge support and administrative and investment advisory services to Lockhart.
A hedge agreement between Lockhart and Zions Bank provides for the bank to pay Lockhart should Lockhart’s monthly cost of funds exceed its monthly asset yield. This agreement has never been triggered. The spread between Lockhart’s monthly asset yield and cost
of funds has narrowed as a result of increased commercial paper rates resulting from the ongoing contraction and disruption in the credit markets. Although not expected, it is possible that this hedge agreement could be triggered.
In addition to rating agency downgrades of securities held by Lockhart that would require the Company to purchase securities from Lockhart, the following rating agency actions may result in security purchases under the Liquidity Agreement:
downgrades of Lockhart’s commercial paper below P1 by Moody’s or below F1 by Fitch, which would prevent issuance of commercial paper by Lockhart,
downgrades of bond insurers MBIA or Ambac that trigger Lockhart securities downgrades, which may require Zions to purchase assets.
At December 31, 2007, Lockhart owned six securities aggregating $1.1 billion that are insured by MBIA and backed by small business loans securitized by Zions and one security of $111$187.9 million insured by Ambac. The MBIA-insured securities did not have underlying public ratings. The Ambac-insured security had an underlying public rating of AAA from Fitch and no underlying rating from Moody’s Investors Service.
In the fourth quarter of 2007, certain assets held by Lockhart were downgraded by rating agencies and Lockhart was unable to sell certain amounts of commercial paper at times. These events were caused by market deterioration in the asset-backed commercial paper markets due to the subprime mortgage and global liquidity crisis described previously.
On November 21, 2007, Fitch Ratings downgraded from “AAA” to “B+” a $30 million ABS CDO held by Lockhart. Under the terms of the Liquidity Agreement, Zions Bank purchased this security at book value; a pretax write-down of $9.7 million was recorded by Zions Bank in marking the securitysecurities to fair value. On December 21, 2007, Fitch Ratings downgraded from “AAA” to “A-” a $25 million REIT CDO held by Lockhart. Under the terms of the Liquidity Agreement, Zions Bank purchased this security at book value; a pretax write-down of $6.8 million was recorded by Zions Bank in marking this security to fair value.
On December 26 and 27, 2007, Zions Bank purchased U.S. Government agency-guaranteed and AAA-rated securities from Lockhart at a price of $840 million, equal to book value plus accrued and unpaid interest, which reduced the amount of outstanding commercial paper issued by Lockhart by a like amount. These actions were taken pursuant to the Liquidity Agreement between Zions Bank and Lockhart when Lockhart could not issue a sufficient amount of commercial paper. Since the fair value of the assets purchased was less than their book value, a pretax write-down of $33.1 million was recorded by Zions Bank in conjunction with the purchase of these securities.
If Lockhart is unable to issue additional commercial paper to finance maturing commercial paper, or if additional assets of Lockhart are downgraded below the ratings described above, Zions Bank will be obligated to purchase additional assets from Lockhart. Zions Bank may incur losses in connection with any such purchases because the price would be based on book value, but Zions Bank would
record the asset at fair value, which may be lower. At December 31, 2007, the book value of Lockhart’s $2.1 billion of assets exceeded their fair value by approximately $22 million, which increased to approximately $40 million as of January 31, 2008.
Subsequent Event
On February 6, 2008, a $5 million security held by Lockhart was downgraded by Moody’s from Aa1 to Baa1. Zions Bank purchased this security at book value under the Liquidity Agreement. The related pretax write-down of $0.8 million was recorded by Zions Bank in marking the security to fair value. In addition, Lockhart was unable to sell sufficient commercial paper to fund commercial paper maturities and Zions Bank purchased $121 million of MBIA-insured securities from Lockhart as required under the Liquidity Agreement. These securities consisted of securitizations of small business loans from Zions Bank and their purchase resulted in no gain or loss. Upon dissolution of the securitization trusts, the loans were recorded on Zions Bank’s balance sheet.
Assets Held by Lockhart
Schedule 33 summarizes Lockhart’s assets by category, related amortized cost, fair value and ratings.
SCHEDULE 33
LOCKHART FUNDING, LLC ASSETS
| December 31, 2007 | |||||||
(In millions)
| Amortized cost | Estimated fair value | Rating range | ||||
Assets: | |||||||
U.S. government agencies and corporations: | |||||||
Small Business Administration loan-backed securities(1) | $ | 249 | 247 | Guaranteed by SBA | |||
Asset-backed securities: | |||||||
Trust preferred securities - banks and insurance | 692 | 680 | AAA | ||||
Trust preferred securities - real estate investment trusts | 36 | 29 | AAA to AA | ||||
Small business loan-backed(2) | 1,134 | 1,134 | AAA | ||||
Other | 13 | 12 | AAA to AA | ||||
Total | $ | 2,124 | 2,102 | ||||
(1) 43% of these Small Business Administration loan-backed securities were originated by the Company. (2) These securities are collateralized by small business loans originated or purchased by Zions Bank. | |||||||
At December 31, 2007, the weighted average interest rate reset of Lockhart’s assets was 1.9 months and the weighted average life of Lockhart’s assets was estimated at 3.4 years. The weighted average life of Lockhart’s asset-backed commercial paper was six days.
Possible Consolidation of Lockhart
Lockhart is an off-balance sheet QSPE as defined by SFAS 140. Should Zions Bancorporation and its affiliates together own more than 90% of the outstanding commercial paper (beneficial interest) of Lockhart, Lockhart would cease to be a QSPE and would be required to be consolidated.
If Zions Bank had been required to purchase all of Lockhart’s assets with a book value of $2.1 billion at December 31, 2007, its consolidated total risk-based capital ratio as of December 31, 2007 would have been reduced by approximately 25 basis points (but would nonetheless have remained above the “well-capitalized” threshold) and its consolidated tangible equity ratio as of December 31, 2007 would have been reduced by approximately 16 basis points. As of February 15, 2008, total Lockhart assets were approximately $1.9 billion and the Company owned $1.3 billion of Lockhart commercial paper. The Company has adequate liquidity and borrowing capacity to fund the net additional $0.6 billion necessary to purchase the Lockhart assets if it were required. Given that the Company has $53 billion of assets, the potential consolidation of Lockhart would not be significant to the Company. We do not believe that consolidation of Lockhart or the purchase of the remaining Lockhart assets in and of itself would directly result in credit ratings downgrades or affect the Company’s common or preferred dividend payments.
See “Liquidity Management Actions” on page 106, “Critical Accounting Policies and Significant Estimates” on page 34,123 and Note 6 of the Notes to Consolidated Financial Statements for additional information on Lockhart.
RISK ELEMENTS
Since risk is inherent in substantially all of the Company’s operations, management of risk is integral to those operations and is also a key determinant of the Company’s overall performance. We apply various strategies to reduce the risks to which the Company’s operations are exposed, including credit, interest rate and market, liquidity, and operational risks.
Credit Risk Management
Credit risk is the possibility of loss from the failure of a borrower or contractual counterparty to fully perform under the terms of a credit-related contract. Credit risk arises primarily from the Company’s lending activities, as well as from off-balance sheet credit instruments.
CreditCentralized oversight of credit risk is managed centrallyprovided through a uniform credit policy, credit administration, and credit exam functions at the Parent. Effective management of credit risk is essential in maintaining a safe, sound and profitable financial institution. We have structured the organization to separate the lending function from the credit administration function, which has added strength to the control over, and independent evaluation of, credit activities. Formal loan policies and procedures provide the Company with a framework for consistent underwriting and a basis for sound credit decisions. In addition, the Company has a well-defined set of standards for evaluating its loan portfolio, and management utilizes a comprehensive loan grading system to determine the risk potential in the portfolio. Further, an independent internal credit examination department periodically
conducts examinations of the Company’s lending departments. These examinations are designed to review credit quality, adequacy of documentation, appropriate loan grading administration and compliance with lending policies, and reports thereon are submitted to management and to the Credit Review Committee of the Board of Directors. New, expanded, or modified products and services as well as new lines of business, are approved by a New Product Review Committee at the bank level or Parent level, depending on the inherent risk of the new activity.
Both the credit policy and the credit examination functions are managed centrally. Each bank is able to modify corporate credit policy to be more conservative; however, corporate approval must be obtained if a bank wishes to create a more liberal policy. Historically, only a limited number of such modifications have been approved. This entire process has been designed to place an emphasis on strong underwriting standards and early detection of potential problem credits so that action plans can be developed and implemented on a timely basis to mitigate any potential losses.
With regard to credit risk associated with counterparties in off-balance sheet credit instruments, Zions Bank hasand Amegy have International Swap Dealer Association (“ISDA”) agreements in place under which derivative transactions are entered into with major derivative dealers. Each ISDA agreement details the collateral arrangementarrangements between Zions Bank and its counterparty.Amegy and their counterparties. In every case, the amount of the collateral required to secure the exposed party in the derivative transaction is determined by the mark-to-market exposure onfair value of the derivative and the credit rating of the party with the obligation. The credit rating used in these situations is provided by either Moody’s or Standard & Poor’s. This means that a counterparty with ana “AAA” rating would be obligated to provide less collateral to secure a major credit exposure to Zions Bank than one with an “A” rating. All derivative gains and losses between Zions Bank or Amegy and a single counterparty are netted to determine the net credit exposure and therefore the collateral required. We have no significant exposure to credit default swaps.
The Company’s credit risk management strategy includes diversification of its loan portfolio. The Company also has off-balance sheet credit risk associatedmaintains a diversified loan portfolio with a Liquidity Agreement provided by Zions Bank to the QSPE securities conduit, Lockhart. See “Off-Balance Sheet Arrangements” page 85 for further details on Lockhart.
some emphasis in real estate. The Company attempts to avoid the risk of an undue concentration of credits in a particular industry, trade group, or property type or with an individual customer or counterparty. During 2009 the Company adopted new concentration limits on various types of commercial real estate lending, particularly construction and land development lending, which over time should reduce further the Company’s exposure to this type of lending. The majority of the Company’s business activity is with customers located within the geographical footprint of its banking subsidiaries. See Note 5 of the Notes to Consolidated Financial Statements for further information on concentrations of credit risk.
The Company’s credit risk management strategy includes diversification of its loan portfolio. The Company maintains a diversified loan portfolio with some emphasis in real estate.
As displayed in Schedule 34,38, at year-end 20072009 no single loan type exceeded 25%24.6% of the Company’s total loan portfolio.
Schedule 38
SCHEDULE 34
LOAN PORTFOLIO DIVERSIFICATION
| December 31, 2007 | December 31, 2006 | |||||||||
(Amounts in millions)
| Amount | % of total loans | Amount | % of total loans | ||||||
Commercial lending: | ||||||||||
Commercial and industrial | $ | 9,811 | 25.0% | $ | 8,422 | 24.2% | ||||
Leasing | 503 | 1.3 | 443 | 1.3 | ||||||
Owner occupied | 7,604 | 19.4 | 6,260 | 18.0 | ||||||
Commercial real estate: | ||||||||||
Construction and land development | 8,315 | 21.2 | 7,483 | 21.5 | ||||||
Term | 5,276 | 13.4 | 4,952 | 14.2 | ||||||
Consumer: | ||||||||||
Home equity credit line and other consumer real estate | 2,203 | 5.6 | 1,850 | 5.3 | ||||||
1-4 family residential | 4,206 | 10.7 | 4,192 | 12.1 | ||||||
Bankcard and other revolving plans | 347 | 0.9 | 295 | 0.8 | ||||||
Other | 452 | 1.1 | 457 | 1.3 | ||||||
Other receivables | 535 | 1.4 | 465 | 1.3 | ||||||
Total loans | $ | 39,252 | 100.0% | $ | 34,819 | 100.0% | ||||
| December 31, 2009 | December 31, 2008 | |||||||||||
(Amounts in millions)
| Amount | % of total loans | Amount | % of total loans | ||||||||
Commercial lending: | ||||||||||||
Commercial and industrial | $ | 9,922 | 24.6 | % | $ | 11,447 | 27.4 | % | ||||
Leasing | 466 | 1.2 | 431 | 1.0 | ||||||||
Owner occupied | 8,752 | 21.7 | 8,743 | 20.9 | ||||||||
Commercial real estate: | ||||||||||||
Construction and land development | 5,552 | 13.8 | 7,516 | 18.0 | ||||||||
Term | 7,255 | 18.0 | 6,196 | 14.8 | ||||||||
Consumer: | ||||||||||||
Home equity credit line | 2,135 | 5.3 | 2,005 | 4.8 | ||||||||
1-4 family residential | 3,642 | 9.0 | 3,877 | 9.3 | ||||||||
Construction and other consumer real estate | 459 | 1.1 | 774 | 1.9 | ||||||||
Bankcard and other revolving plans | 341 | 0.8 | 374 | 0.9 | ||||||||
Other | 293 | 0.7 | 385 | 0.9 | ||||||||
Foreign Loans | 65 | 0.2 | 43 | 0.1 | ||||||||
FDIC-supported loans | 1,445 | 3.6 | – | – | ||||||||
Total loans | $ | 40,327 | 100.0 | % | $ | 41,791 | 100.0 | % | ||||
In addition, as reflected in Schedule 35,39, as of December 31, 2007,2009, the commercial real estate loan portfolio totaling $13.6 billion is also well diversified by property type, purpose and collateral location.
SCHEDULE 35Schedule 39
COMMERCIAL REAL ESTATE PORTFOLIO BY PROPERTY TYPE AND COLLATERAL LOCATION
(REPRESENTS PERCENTAGES BASED UPON OUTSTANDING COMMERCIAL REAL ESTATE LOANS)
AT DECEMBER 31, 20072009
| Collateral Location | Product as a % of total CRE | Product as a % of loan type | ||||||||||||||||||||||||||||||||||||||||||||||
Loan Type | Arizona | Northern California | Southern California | Nevada | Colorado | Texas | Utah / Idaho | Washington | Other | |||||||||||||||||||||||||||||||||||||||
Commercial term: | ||||||||||||||||||||||||||||||||||||||||||||||||
(Amounts in millions)
Loan Type | Balance1 | Collateral location | Product as a % of total CRE | Product as a % of loan type | ||||||||||||||||||||||||||||||||||||||||||||
| Arizona | Northern California | Southern California | Nevada | Colorado | Texas | Utah / Idaho | Wash- ington | Other | ||||||||||||||||||||||||||||||||||||||||
Commercial term | ||||||||||||||||||||||||||||||||||||||||||||||||
Industrial | 0.63% | 0.37 | 1.49 | 0.13 | 0.18 | 0.26 | 0.12 | 0.08 | 0.12 | 3.38 | 8.28 | 0.88 | % | 0.40 | 1.44 | 0.26 | 0.14 | 0.71 | 0.31 | 0.12 | 0.38 | 4.64 | 8.05 | |||||||||||||||||||||||||
Office | 1.06 | 0.60 | 1.65 | 1.43 | 1.16 | 1.37 | 1.46 | 0.25 | 1.15 | 10.13 | 24.92 | 1.58 | 1.02 | 2.55 | 1.48 | 0.87 | 1.48 | 1.62 | 0.42 | 1.61 | 12.63 | 21.91 | ||||||||||||||||||||||||||
Retail | 0.71 | 0.51 | 1.43 | 1.62 | 0.27 | 1.06 | 0.20 | 0.10 | 0.15 | 6.05 | 14.90 | 1.17 | 1.10 | 2.90 | 1.91 | 0.70 | 2.58 | 0.49 | 0.26 | 1.62 | 12.73 | 22.07 | ||||||||||||||||||||||||||
Hotel/motel | 1.37 | 0.47 | 0.71 | 0.63 | 0.56 | 0.62 | 1.15 | 0.18 | 2.53 | 8.22 | 20.18 | 1.81 | 1.01 | 1.00 | 0.45 | 0.68 | 1.31 | 1.66 | 0.24 | 3.80 | 11.96 | 20.73 | ||||||||||||||||||||||||||
Acquisition and development | – | – | 0.03 | – | – | – | – | 0.05 | – | 0.08 | 0.21 | – | – | – | – | – | – | – | 0.01 | – | 0.01 | 0.01 | ||||||||||||||||||||||||||
Medical | 0.51 | 0.07 | 0.26 | 0.15 | 0.04 | 0.08 | 0.11 | 0.01 | 0.03 | 1.26 | 3.11 | 0.64 | 0.29 | 0.45 | 0.63 | 0.11 | 0.17 | 0.20 | 0.01 | 0.03 | 2.53 | 4.39 | ||||||||||||||||||||||||||
Recreation/restaurant | 0.20 | 0.01 | 0.13 | 0.13 | 0.08 | 0.08 | 0.12 | – | 0.18 | 0.93 | 2.31 | 0.50 | 0.07 | 0.46 | 0.30 | 0.18 | 0.20 | 0.24 | 0.02 | 0.38 | 2.35 | 4.06 | ||||||||||||||||||||||||||
Multifamily | 0.51 | 0.41 | 1.38 | 0.32 | 0.24 | 0.93 | 0.43 | 0.06 | 0.50 | 4.78 | 11.72 | 0.69 | 0.42 | 2.26 | 0.46 | 0.35 | 1.74 | 0.47 | 0.11 | 0.50 | 7.00 | 12.14 | ||||||||||||||||||||||||||
Other | 1.06 | 0.25 | 1.24 | 0.62 | 0.44 | 0.25 | 0.63 | 0.07 | 1.29 | 5.85 | 14.37 | 0.51 | 0.22 | 1.14 | 0.41 | 0.12 | 0.08 | 0.80 | 0.08 | 0.47 | 3.83 | 6.64 | ||||||||||||||||||||||||||
Total commercial term | 6.05 | 2.69 | 8.32 | 5.03 | 2.97 | 4.65 | 4.22 | 0.80 | 5.95 | 40.68 | 100.00 | $ | 7,180.1 | 7.78 | 4.53 | 12.20 | 5.90 | 3.15 | 8.27 | 5.79 | 1.27 | 8.79 | 57.68 | 100.00 | ||||||||||||||||||||||||
Residential construction: | ||||||||||||||||||||||||||||||||||||||||||||||||
Residential construction and land development | Residential construction and land development | |||||||||||||||||||||||||||||||||||||||||||||||
Single family housing | 3.63 | 0.93 | 2.64 | 0.76 | 0.91 | 2.46 | 2.06 | 0.07 | 0.19 | 13.65 | 46.32 | 0.45 | 0.03 | 0.48 | 0.08 | 0.82 | 1.35 | 0.67 | 0.23 | 0.33 | 4.44 | 31.71 | ||||||||||||||||||||||||||
Acquisition and development | 4.92 | 0.85 | 1.82 | 1.67 | 0.79 | 2.62 | 2.47 | 0.23 | 0.43 | 15.80 | 53.68 | 1.90 | 0.31 | 1.03 | 0.67 | 0.64 | 2.86 | 1.94 | 0.07 | 0.16 | 9.58 | 68.29 | ||||||||||||||||||||||||||
Total residential construction | 8.55 | 1.78 | 4.46 | 2.43 | 1.70 | 5.08 | 4.53 | 0.30 | 0.62 | 29.45 | 100.00 | |||||||||||||||||||||||||||||||||||||
Commercial construction: | ||||||||||||||||||||||||||||||||||||||||||||||||
Total residential construction and land development | 1,745.5 | 2.35 | 0.34 | 1.51 | 0.75 | 1.46 | 4.21 | 2.61 | 0.30 | 0.49 | 14.02 | 100.00 | ||||||||||||||||||||||||||||||||||||
Commercial construction and land development | Commercial construction and land development | |||||||||||||||||||||||||||||||||||||||||||||||
Industrial | 0.35 | – | 0.17 | 0.05 | 0.02 | 0.63 | 0.06 | – | 0.01 | 1.29 | 4.32 | 0.07 | 0.01 | 0.15 | – | – | 0.64 | 0.06 | 0.01 | 0.01 | 0.95 | 3.34 | ||||||||||||||||||||||||||
Office | 0.61 | 0.01 | 0.49 | 0.68 | 0.12 | 0.31 | 0.39 | 0.09 | 0.18 | 2.88 | 9.64 | 0.28 | 0.07 | 0.58 | 0.43 | 0.35 | 0.75 | 0.43 | 0.03 | 0.11 | 3.03 | 10.71 | ||||||||||||||||||||||||||
Retail | 1.03 | 0.01 | 0.32 | 1.30 | 0.25 | 2.96 | 0.52 | 0.05 | 0.57 | 7.01 | 23.48 | 1.04 | 0.02 | 0.10 | 0.90 | 0.27 | 2.54 | 0.63 | 0.03 | 0.23 | 5.76 | 20.34 | ||||||||||||||||||||||||||
Hotel/motel | 0.23 | – | 0.09 | – | 0.06 | 0.03 | 0.25 | – | 0.13 | 0.79 | 2.63 | 0.14 | 0.19 | 0.32 | 0.04 | 0.02 | 0.35 | 0.05 | – | 0.13 | 1.24 | 4.39 | ||||||||||||||||||||||||||
Acquisition and development | 1.58 | 0.27 | 0.32 | 2.37 | 0.23 | 3.57 | 0.89 | 0.09 | 0.47 | 9.79 | 32.84 | 1.08 | 0.09 | 0.54 | 1.34 | 0.48 | 2.84 | 1.29 | 0.05 | 0.39 | 8.10 | 28.62 | ||||||||||||||||||||||||||
Medical | 0.16 | – | 0.05 | 0.18 | 0.02 | 0.12 | 0.05 | – | 0.31 | 0.89 | 2.94 | 0.18 | – | 0.03 | 0.25 | – | 0.14 | 0.02 | 0.06 | 0.35 | 1.03 | 3.63 | ||||||||||||||||||||||||||
Recreation/restaurant | 0.03 | – | – | – | – | – | 0.01 | – | – | 0.04 | 0.13 | 0.06 | – | – | 0.02 | – | – | 0.01 | – | – | 0.09 | 0.34 | ||||||||||||||||||||||||||
Other | 0.40 | 0.01 | 0.28 | 0.23 | 0.02 | 0.11 | 0.10 | 0.09 | 1.43 | 2.67 | 8.94 | 0.07 | – | – | 0.41 | 0.03 | 0.43 | 0.18 | 0.02 | 0.10 | 1.24 | 4.39 | ||||||||||||||||||||||||||
Apartments | 0.54 | 0.35 | 0.67 | 0.24 | 0.38 | 1.16 | 0.10 | 0.34 | 0.73 | 4.51 | 15.08 | 0.47 | 0.47 | 0.74 | 0.24 | 0.24 | 2.54 | 0.40 | 0.41 | 1.35 | 6.86 | 24.24 | ||||||||||||||||||||||||||
Total commercial construction | 4.93 | 0.65 | 2.39 | 5.05 | 1.10 | 8.89 | 2.37 | 0.66 | 3.83 | 29.87 | 100.00 | |||||||||||||||||||||||||||||||||||||
Total construction | 13.48 | 2.43 | 6.85 | 7.48 | 2.80 | 13.97 | 6.90 | 0.96 | 4.45 | 59.32 | ||||||||||||||||||||||||||||||||||||||
Total commercial construction and land development | 3,522.3 | 3.39 | 0.85 | 2.46 | 3.63 | 1.39 | 10.23 | 3.07 | 0.61 | 2.67 | 28.30 | 100.00 | ||||||||||||||||||||||||||||||||||||
Total construction and land development | 5,267.8 | 5.74 | 1.19 | 3.97 | 4.38 | 2.85 | 14.44 | 5.68 | 0.91 | 3.16 | 42.32 | 100.00 | ||||||||||||||||||||||||||||||||||||
Total commercial real estate | 19.53% | 5.12 | 15.17 | 12.51 | 5.77 | 18.62 | 11.12 | 1.76 | 10.40 | 100.00 | $ | 12,447.9 | 13.52 | % | 5.72 | 16.17 | 10.28 | 6.00 | 22.71 | 11.47 | 2.18 | 11.95 | 100.00 | |||||||||||||||||||||||||
| 1 | Excludes approximately $359 million of unsecured loans outstanding, but related to the real estate industry. |
Note: Excludes approximately $566During 2009, the Company acquired assets from the FDIC as receiver for the failed Alliance Bank, Great Basin Bank, and Vineyard Bank that are included in nonperforming loans and other loans with characteristics indicative of a high credit risk profile. These include substantial concentrations in California and Nevada, loans with homebuilders and other construction finance loans. Because most of these assets are covered under loss sharing agreements with the FDIC for which the FDIC generally will assume 80% of the first $275 million of unsecuredcredit losses for the Alliance Bank assets, $40 million of credit losses for the Great Basin Bank assets, $465 million of credit losses for the Vineyard Bank assets and 95% of the credit losses in excess of those amounts, the Company’s financial exposure to losses from these assets is substantially limited. FDIC-supported loans outstanding, but relatedrepresent approximately 3.6% of the Company’s total loan portfolio.
The Company’s level of credit quality continued to weaken during 2009, although it weakened at a decreasing rate during the real estate industry.
fourth quarter of 2009. This deterioration in credit quality is now widespread and affects most of the Company’s geographic markets and product types. The Company believes that a number of indicators of credit quality began to stabilize toward the end of 2009, although further deterioration in the economy could result in further deterioration in credit quality.
Loan-to-value (“LTV”) ratios are another key determinant of credit risk in commercial real estate lending. The Company estimates that the weighted average LTV ratio on the total commercial real estate portfolio at June 30, 2007,December 31, 2009, detailed in year-end amounts in Schedule 35,39, was approximately 59.5%.58.6% compared to 57.4% at December 31, 2008.
However, continued declines in property values in many of our distressed markets may understate the actual current LTV levels. This estimate is based on the most current appraisals, generally obtained as of the date of origination, downgrade or renewal of the loans.
The Company does not pursue subprime or alternative (“Alt-A”) residential mortgage lending and has little or no direct exposure to that market. However, lendingLending to finance residential land acquisition, development and construction is a core business for the Company. In some geographic markets, significant declines in the availability of subprime residential first mortgagesmortgage financing to buyers of newly constructed homes, are havingdeclining home values and general uncertainty in the residential real estate market continue to have an adverse impact on the operations of somemany of the Company’s developer and builder customers.
The Company does not pursue subprime residential mortgage lending, including option ARM and negative amortization loans. It does have approximately $475 million of stated income loans with generally high FICO scores at origination, including “one-time close” loans to finance the construction of a home, which convert into permanent jumbo mortgages. This portfolio began to show significant credit quality deterioration in the second half of 2008. At December 31, 2009, approximately $74 million of the stated income loans had FICO scores of less than 620, reflecting the current economic environment. These totals exclude held-for-sale loans.
As discussedThe Company is engaged in home equity credit line lending. We actively monitor our credit risk in this portfolio and as of December 31, 2009, approximately 14.5% of the Company’s $2.1 billion portfolio was estimated to have loan-to-value ratios above 100%. Of the total home equity credit line portfolio, 0.42% was 90 or more days past due at December 31, 2009 as compared to 0.20% as of December 31, 2008. The credit losses for this portfolio were 75 basis points for the twelve months ended December 31, 2009. During 2009, the Company modified $1.4 million of home equity credit line loans. The Company requires appraisals for all real estate collateral-dependent loans at the time of origination and when adverse credit events occur.
Commercial Real Estate Loans
Selected information regarding our commercial real estate (“CRE”) loan portfolio is presented in the following sections,schedule:
Schedule 40
COMMERCIAL REAL ESTATE PORTFOLIO BY LOAN TYPE AND COLLATERAL LOCATION
AT DECEMBER 31, 2009
| (Amounts in millions) | Collateral location | % of | ||||||||||||||||||||||||||||||||||
Loan Type | As of date | Arizona | Northern California | Southern California | Nevada | Colorado | Texas | Utah / Idaho | Wash- ington | Other1 | Total | |||||||||||||||||||||||||
Commercial term | ||||||||||||||||||||||||||||||||||||
Balance outstanding | 12/31/09 | $ | 987.9 | 362.3 | 1,659.4 | 765.0 | 488.3 | 1,044.1 | 729.3 | 194.6 | 1,024.2 | 7,255.1 | 56.6 | % | ||||||||||||||||||||||
% of loan type | 13.6 | % | 5.0 | % | 22.9 | % | 10.5 | % | 6.7 | % | 14.4 | % | 10.1 | % | 2.7 | % | 14.1 | % | 100.0 | % | ||||||||||||||||
Delinquency rates2: | ||||||||||||||||||||||||||||||||||||
30-89 days | 12/31/09 | 1.8 | % | 2.4 | % | 2.4 | % | 7.6 | % | 1.4 | % | 4.3 | % | 2.4 | % | 0.3 | % | 9.2 | % | 4.0 | % | |||||||||||||||
| 12/31/08 | 0.5 | % | 0.9 | % | 0.4 | % | 1.8 | % | – | 0.7 | % | 1.8 | % | – | 4.4 | % | 1.4 | % | ||||||||||||||||||
³ 90 days | 12/31/09 | 1.4 | % | 1.6 | % | 1.6 | % | 3.9 | % | 0.8 | % | 3.3 | % | 1.1 | % | – | 5.6 | % | 2.5 | % | ||||||||||||||||
| 12/31/08 | 0.2 | % | 0.9 | % | 0.1 | % | 1.2 | % | – | 0.2 | % | 1.0 | % | – | 3.0 | % | 0.8 | % | ||||||||||||||||||
Accruing loans past due 90 days or more | 12/31/09 | $ | 1.2 | – | 0.6 | 0.5 | – | 1.2 | 0.6 | – | 2.6 | 6.7 | ||||||||||||||||||||||||
| 12/31/08 | 1.9 | – | – | 2.4 | – | – | – | – | 7.5 | 11.8 | ||||||||||||||||||||||||||
Nonaccrual loans | 12/31/09 | 14.5 | 6.5 | 30.3 | 60.9 | 6.5 | 36.3 | 10.0 | 1.4 | 62.1 | 228.5 | |||||||||||||||||||||||||
| 12/31/08 | 0.5 | 2.8 | 2.0 | 6.7 | 0.4 | 4.5 | 6.4 | – | 20.3 | 43.6 | ||||||||||||||||||||||||||
Residential construction and land development |
| |||||||||||||||||||||||||||||||||||
Balance outstanding | 12/31/09 | $ | 324.8 | 43.5 | 155.2 | 114.5 | 189.2 | 524.7 | 340.3 | 39.7 | 144.5 | 1,876.4 | 14.7 | % | ||||||||||||||||||||||
% of loan type | 17.3 | % | 2.3 | % | 8.3 | % | 6.1 | % | 10.1 | % | 28.0 | % | 18.1 | % | 2.1 | % | 7.7 | % | 100.0 | % | ||||||||||||||||
Delinquency rates2: | ||||||||||||||||||||||||||||||||||||
30-89 days | 12/31/09 | 20.9 | % | 8.3 | % | 6.2 | % | 18.0 | % | 12.7 | % | 14.2 | % | 20.1 | % | 0.2 | % | 15.8 | % | 15.5 | % | |||||||||||||||
| 12/31/08 | 16.7 | % | 7.3 | % | 9.3 | % | 38.8 | % | 6.9 | % | 3.3 | % | 20.4 | % | 0.5 | % | 8.6 | % | 13.1 | % | ||||||||||||||||
³ 90 days | 12/31/09 | 17.9 | % | 8.3 | % | 4.6 | % | 5.6 | % | 11.1 | % | 7.3 | % | 19.7 | % | – | 6.9 | % | 11.3 | % | ||||||||||||||||
| 12/31/08 | 12.3 | % | 2.3 | % | 7.7 | % | 20.9 | % | 5.6 | % | 2.4 | % | 18.8 | % | 0.5 | % | 4.5 | % | 9.6 | % | ||||||||||||||||
Accruing loans past due 90 days or more | 12/31/09 | $ | 6.2 | – | – | – | – | 0.1 | 1.9 | – | 0.1 | 8.3 | ||||||||||||||||||||||||
| 12/31/08 | 7.2 | – | – | 1.0 | – | 0.7 | 9.6 | 0.3 | – | 18.8 | ||||||||||||||||||||||||||
Nonaccrual loans | 12/31/09 | 66.2 | 4.8 | 33.7 | 44.5 | 23.0 | 103.4 | 100.1 | – | 19.8 | 395.5 | |||||||||||||||||||||||||
| 12/31/08 | 99.3 | 5.8 | 45.6 | 50.5 | 15.0 | 18.6 | 88.7 | – | 19.3 | 342.8 | ||||||||||||||||||||||||||
Commercial construction and land development |
| |||||||||||||||||||||||||||||||||||
Balance outstanding | 12/31/09 | $ | 444.2 | 84.1 | 333.6 | 467.8 | 212.9 | 1,328.3 | 425.9 | 86.3 | 292.5 | 3,675.6 | 28.7 | % | ||||||||||||||||||||||
% of loan type | 12.1 | % | 2.3 | % | 9.1 | % | 12.7 | % | 5.8 | % | 36.1 | % | 11.6 | % | 2.3 | % | 8.0 | % | 100.0 | % | ||||||||||||||||
Delinquency rates2: | ||||||||||||||||||||||||||||||||||||
30-89 days | 12/31/09 | 12.9 | % | – | 3.9 | % | 23.4 | % | 7.9 | % | 9.4 | % | 14.5 | % | 24.6 | % | 4.1 | % | 11.3 | % | ||||||||||||||||
| 12/31/08 | 2.8 | % | – | 2.4 | % | 10.5 | % | 0.5 | % | 2.1 | % | 6.6 | % | 1.8 | % | 6.1 | % | 4.1 | % | |||||||||||||||||
³ 90 days | 12/31/09 | 7.3 | % | – | 3.0 | % | 19.1 | % | 1.6 | % | 5.5 | % | 7.7 | % | – | 4.1 | % | 6.9 | % | |||||||||||||||||
| 12/31/08 | 0.7 | % | – | – | 8.5 | % | 0.5 | % | 0.2 | % | 2.9 | % | – | 6.1 | % | 2.2 | % | |||||||||||||||||||
Accruing loans past due 90 days or more | 12/31/09 | $ | 4.1 | – | – | 9.1 | 0.8 | 0.9 | 3.0 | – | 0.1 | 18.0 | ||||||||||||||||||||||||
| 12/31/08 | 1.8 | – | – | 25.4 | – | – | 8.1 | – | 18.6 | 53.9 | ||||||||||||||||||||||||||
Nonaccrual loans | 12/31/09 | 57.1 | – | 12.8 | 107.2 | 4.7 | 198.8 | 37.0 | – | 11.8 | 429.3 | |||||||||||||||||||||||||
| 12/31/08 | 27.4 | – | 11.1 | 66.2 | 1.4 | 14.0 | 4.3 | – | 6.3 | 130.7 | ||||||||||||||||||||||||||
Total construction and land development | 12/31/09 | 769.0 | 127.6 | 488.8 | 582.3 | 402.1 | 1,853.0 | 766.2 | 126.0 | 437.0 | 5,552.0 | |||||||||||||||||||||||||
Total commercial real estate | 12/31/09 | $ | 1,756.9 | 489.9 | 2,148.2 | 1,347.3 | 890.4 | 2,897.1 | 1,495.5 | 320.6 | 1,461.2 | 12,807.1 | 100.0 | % | ||||||||||||||||||||||
| 1 | No other geography exceeded $194 million for all three loan types. |
| 2 | Delinquency rates include nonaccrual loans. |
Approximately 32% of the Company’s levelcommercial term loans consist of credit quality weakened during 2007 although it remained relatively strong comparedmini-perm loans on which construction is complete and the project is either in the process of stabilization or has stabilized, and the owner is waiting to historical companyseek permanent financing. Mini-perm loans generally have maturities of 3 to 7 years. The remaining 68% are term loans with initial maturities generally of 15 to 20 years. Stabilization criteria differ by product and industry standards. The deterioration in credit quality was mainly relatedare dependent on cash flow created by lease-up for office, industrial and retail products and occupancy for retail and apartment products.
Approximately 28.6% of the commercial construction and land development portfolio is designated as acquisition and development. Most of these acquisition and development properties are tied to specific retail, apartment, office or other projects. Underwriting on commercial properties is primarily based on the economic viability of the project with heavy consideration given to the continuing weakness in residential land acquisition, development and construction activitycreditworthiness of the sponsor. The owners’ equity is generally expected to be injected prior to bank advances. Remargining requirements are often included in the Southwest.loan agreement along with guarantees of the sponsor. Recognizing that debt is repaid via cash flow, the projected economics of the project are primary in the underwriting because this determines the ultimate value of the property and the ability to service debt. Therefore, in most projects (with the exception of multi-family projects) we look for substantial pre-leasing in our underwriting and we generally require a minimum projected stabilized debt service ratio of 1.20.
Although residential construction and development deals with a different product type, many of the requirements previously mentioned, such as credit worthiness of the developer, up-front injection of the developer’s equity, re-margining requirements, and the viability of the project are also important in underwriting a residential development loan. Heavy consideration is given to market acceptance of the product, location, strength of the developer, and the ability of the developer to stay within budget. Progress inspections performed by qualified independent inspectors are routinely performed before disbursements are made. Loan agreements generally include limitations on the number of model homes and homes built on a spec basis, with preference given to pre-sold homes.
Real estate appraisals are ordered independently of the credit officer and the borrower, generally by the banks’ appraisal review function, which is staffed by certified appraisers. In some cases, reports from automated valuation services are used. Appraisals are ordered from outside appraisers at the inception, renewal, or for CRE loans, upon the occurrence of any event causing a “criticized” or “classified” grade to be assigned to the credit. The frequency for obtaining updated appraisals for these adversely graded credits is increased when declining market conditions exist. Advance rates, on an “as completed basis,” will vary based on the viability of the project and the creditworthiness of the sponsor, but corporate guidelines generally limit advances to 50-65% for raw land, 65-75% for land development, 65-75% for finished commercial lots, 75-80% for finished residential lots, 80% for pre-sold homes, 75-80% for models and spec homes, and 75-80% for commercial properties. Exceptions may be granted on a case-by-case basis.
Loan agreements require regular financial information on the project and the sponsor in addition to lease schedules, rent rolls, and on construction projects, independent progress inspection reports. The receipt of these schedules is closely monitored and calculations are made to determine adherence to the covenants set forth in the loan agreement. Additionally, the frequency of loan-by-loan reviews has been increased to a quarterly basis for all commercial and residential construction and land development loans at Zions Bank, California Bank & Trust, Amegy, National Bank of Arizona, Nevada State Bank, and Vectra Bank.
Interest reserves are established as an expense item in the budget on some real estate construction or development loans. We generally require the borrower to put the total amount of available equity into the project at the inception of the construction. This enables the bank to maximize the amount of equity obtained and control the amount of money set aside to pay interest on the construction loan. The Company’s practice is to monitor the construction, sales and/or leasing progress to determine whether or not the project remains viable. At any time during the life of the credit that the project is determined not to be viable, the bank discontinues the use of the interest reserve and takes appropriate action to protect its collateral position via negotiation and/or legal action as
deemed appropriate. At year-end 2009, Zions’ affiliates have 416 loans with an outstanding balance of $1.0 billion where available interest reserves amounted to $106 million. In instances where projects have been determined unviable, the interest reserves have been frozen.
We have not been involved to any meaningful extent with insurance arrangements, credit derivatives, or any other default agreements as a mitigation strategy for commercial real estate loans. However, we do make use of personal or other guarantees as risk mitigation strategies.
The Company periodically stress tests its CRE loan portfolio. This testing is back-tested and the results of the testing are reviewed regularly with the management, rating agencies, and various banking regulators. The stress testing methodology includes a loan-by-loan Monte Carlo simulation, which is an approach that measures potential loss of principal and related revenues. The Monte Carlo simulation stresses the probability of default and loss given default for CRE loans based on a variety of factors including regional economic factors, loan grade, loan-to-value, collateral type, and geography.
Nonperforming Assets
Nonperforming lending related assets include nonaccrual loans loans restructured at other than market terms,and other real estate owned and other nonperforming assets.owned. Loans are generally placed on nonaccrual status when the loan is 90 days or more past due as to principal or interest, unless the loan is both well secured and in the process of collection. Consumer loans are not normally placed on a nonaccrual status inasmuch as theywhen the loan is 90 days past due. Generally, closed-end non-real estate secured consumer loans are generallycharged off prior to 120 days past due. Open-end consumer loans adequately secured by real estate are placed on nonaccrual status at 90 days. Open-end credit card consumer loans are charged off when they become 120180 days past due. Loans occasionally may beNonaccrual loans also include nonperforming loans restructured to provide a reduction or deferral of interest or principal payments. This generally occurs when the financial condition of a borrower deteriorates to the point wherethat the borrower needs to be given temporary or permanent relief from the original contractual terms of the loan. During 2009, the Company modified $121 million of CRE loans. Other real estate owned is acquired primarily through or in lieu of foreclosure on loans secured by real estate.
As reflected in Schedule 36,41, the Company’s nonperforming assets as a percentage of net loans and leases and other real estate ownedOREO increased significantly during 2007.2009. The percentage was 0.73%6.80% at December 31, 20072009 (6.00% excluding FDIC-supported assets) compared with 0.24%2.71% on December 31, 20062008 and 0.30%0.70% on December 31, 2005.2007. Total nonperforming lending related assets were $284 million at year-end 2007, compared to $82$2,769 million at December 31, 2006 and $892009 ($2,359 million excluding FDIC-supported assets) compared to $1,138 million at December 31, 2005.
2008 and $274 million at December 31, 2007.
Total nonaccrual loans excluding FDIC-supported loans at December 31, 20072009 increased $192$1,077 million from the balances at December 31, 2006,2008, which included increases of $147$368 million for commercial construction and land development loans, and $33$316 million for commercial owner occupied loans, $184 million for commercial real estate term loans, $171 million for commercial and industrial loans, and $65 million for consumer real estate loans. The increase in nonaccrual construction and land development loans was primarily in Arizona,Texas, Utah, and California and Nevada, reflectingwhile all the continuing weakness in residential development and construction activity in those states. We expect this weakness to continue inother markets experienced increases as well. Total nonperforming assets excluding FDIC-supported assets increased $1,221 million from the balances at December 31, 2008.
SCHEDULE 36The following schedule sets forth the Company’s nonperforming lending related assets:
Schedule 41
NONPERFORMING LENDING RELATED ASSETS
NONPERFORMING ASSETS
| December 31, | December 31, | ||||||||||||||||||||||||||
(Amounts in millions)
| 2007 | 2006 | 2005 | 2004 | 2003 | 2009 | 2008 | 2007 | 2006 | 2005 | |||||||||||||||||
Nonaccrual loans: | |||||||||||||||||||||||||||
Loans held for sale | $ | – | 30 | – | – | – | |||||||||||||||||||||
Commercial lending: | |||||||||||||||||||||||||||
Commercial and industrial | $ | 58 | 25 | 21 | 24 | 36 | 319 | 148 | 58 | 25 | 21 | ||||||||||||||||
Leasing | – | – | – | 1 | 2 | 11 | 8 | – | – | – | |||||||||||||||||
Owner occupied | 21 | 13 | 16 | 22 | 15 | 474 | 158 | 21 | 13 | 16 | |||||||||||||||||
Commercial real estate: | |||||||||||||||||||||||||||
Construction and land development | 161 | 14 | 17 | 1 | 7 | 825 | 457 | 161 | 14 | 17 | |||||||||||||||||
Term | 4 | 8 | 3 | 4 | 3 | 228 | 44 | 4 | 8 | 3 | |||||||||||||||||
Consumer: | |||||||||||||||||||||||||||
Real estate | 13 | 5 | 9 | 13 | 11 | 162 | 97 | 13 | 5 | 9 | |||||||||||||||||
Other | 2 | 2 | 2 | 4 | 3 | 4 | 4 | 2 | 2 | 2 | |||||||||||||||||
Other | – | – | 1 | 3 | 1 | – | – | – | – | 1 | |||||||||||||||||
Total nonaccrual loans | 259 | 67 | 69 | 72 | 78 | ||||||||||||||||||||||
Restructured loans: | |||||||||||||||||||||||||||
Commercial lending: | |||||||||||||||||||||||||||
Owner occupied | 10 | – | – | – | – | ||||||||||||||||||||||
Commercial real estate: | |||||||||||||||||||||||||||
Construction and land development | – | – | – | – | 1 | ||||||||||||||||||||||
Total restructured loans | 10 | – | – | – | 1 | ||||||||||||||||||||||
Nonaccrual loans, excluding FDIC-supported loans | 2,023 | 946 | 259 | 67 | 69 | ||||||||||||||||||||||
Other real estate owned: | |||||||||||||||||||||||||||
Commercial: | |||||||||||||||||||||||||||
Improved | 10 | 5 | 8 | 9 | 12 | ||||||||||||||||||||||
Unimproved | 2 | 2 | 3 | – | 4 | ||||||||||||||||||||||
Commercial properties | 85 | 36 | 8 | 5 | 3 | ||||||||||||||||||||||
Developed land | 14 | 7 | – | – | 5 | ||||||||||||||||||||||
Land | 35 | 2 | 2 | 2 | 3 | ||||||||||||||||||||||
Residential: | |||||||||||||||||||||||||||
1-4 family | 3 | 2 | 9 | 3 | 3 | 50 | 40 | 4 | 2 | 9 | |||||||||||||||||
Developed land | 119 | 71 | 1 | – | – | ||||||||||||||||||||||
Land | 33 | 36 | – | – | – | ||||||||||||||||||||||
Total other real estate owned | 15 | 9 | 20 | 12 | 19 | ||||||||||||||||||||||
Other real estate owned, excluding FDIC-supported assets | 336 | 192 | 15 | 9 | 20 | ||||||||||||||||||||||
Other assets | – | 6 | – | – | – | – | – | – | 6 | – | |||||||||||||||||
Total nonperforming assets | $ | 284 | 82 | 89 | 84 | 98 | |||||||||||||||||||||
Total nonperforming lending related assets, excluding FDIC-supported assets | 2,359 | 1,138 | 274 | 82 | 89 | ||||||||||||||||||||||
% of net loans* and leases and other real estate owned | 0.73% | 0.24% | 0.30% | 0.37% | 0.49% | ||||||||||||||||||||||
FDIC-supported nonaccrual loans | 356 | – | – | – | – | ||||||||||||||||||||||
FDIC-supported other real estate owned | 54 | – | – | – | – | ||||||||||||||||||||||
FDIC-supported nonperforming lending related assets | 410 | – | – | – | – | ||||||||||||||||||||||
Total nonperforming lending related assets | $ | 2,769 | 1,138 | 274 | 82 | 89 | |||||||||||||||||||||
Ratio of nonperforming assets, excluding FDIC-supported assets, to net loans and leases* and other real estate owned | 6.00 | % | 2.71 | % | 0.70 | % | 0.24 | % | 0.29 | % | |||||||||||||||||
Ratio of nonperforming assets to net loans and leases* and other real estate owned | 6.80 | % | 2.71 | % | 0.70 | % | 0.24 | % | 0.29 | % | |||||||||||||||||
Accruing loans past due 90 days or more: | |||||||||||||||||||||||||||
Commercial lending | $ | 38 | 17 | 7 | 6 | 10 | $ | 53 | 50 | 38 | 17 | 7 | |||||||||||||||
Commercial real estate | 28 | 22 | 4 | 2 | 3 | 33 | 48 | 28 | 22 | 4 | |||||||||||||||||
Consumer | 11 | 5 | 6 | 8 | 11 | 21 | 32 | 11 | 5 | 6 | |||||||||||||||||
Total | $ | 77 | 44 | 17 | 16 | 24 | |||||||||||||||||||||
Total excluding FDIC-supported loans | 107 | 130 | 77 | 44 | 17 | ||||||||||||||||||||||
FDIC-supported loans | 56 | – | – | – | – | ||||||||||||||||||||||
% of net loans* and leases | 0.20% | 0.13% | 0.06% | 0.07% | 0.12% | ||||||||||||||||||||||
Total accruing loans past due 90 days or more | $ | 163 | 130 | 77 | 44 | 17 | |||||||||||||||||||||
Ratio of accruing loans past due 90 days or more, excluding FDIC-supported loans, to net loans and leases* | 0.27 | % | 0.31 | % | 0.20 | % | 0.13 | % | 0.06 | % | |||||||||||||||||
Ratio of accruing loans past due 90 days or more to net loans and leases* | 0.40 | % | 0.31 | % | 0.20 | % | 0.13 | % | 0.06 | % | |||||||||||||||||
| * | Includes loans held for sale. |
Included in nonaccrual loans are loans that we have determined to be impaired. Loans, other than those included in large groups of smaller-balance homogeneous loans, are considered impaired when, based on current information and events, it is probable that the
Company will be unable to collect all amounts due in accordance with the contractual terms of the loan agreement, including scheduled interest payments. The amount of the impairment is measured based on either the present value of expected cash flows, the observable fair value of the loan, or the fair value of the collateral securing the loan.
The Company’s total recorded investment in impaired loans was $226$1,925 million at December 31, 20072009 and $47$770 million at December 31, 2006.2008. Estimated losses on impaired loans are included in the allowance for loan losses. At December 31, 2007,2009, the allowance included $21$105 million for impaired loans with a recorded investment of $103$435 million. At December 31, 2006,2008, the allowance for loan losses included $6$52 million for impaired loans with a recorded investment of $18$306 million. See Note 5 of the Notes to Consolidated Financial Statements for additional information on impaired loans.
In addition to the lending related nonperforming assets, the Company also has $171 million in carrying value of investments in debt securities that are on nonaccrual status at December 31, 2009.
Allowance and Reserve for Credit Losses
Allowance for Loan Losses:– In analyzing the adequacy of the allowance for loan losses, we utilize a comprehensive loan grading system to determine the risk potential in the portfolio and also consider the results of independent internal credit reviews. To determine the adequacy of the allowance, the Company’s loan and lease portfolio is broken into segments based on loan type.
For commercial loans, we use historical loss experience factors by loan segment,type and quality grade, adjusted for changes in trends and conditions, to help determine an indicated allowance for each portfolio segment. Currently, the Company re-estimates all commercial loss reserve factors based on very recent loss experience on a quarterly basis. These factors are evaluated and updated using migration analysis techniquetechniques and other considerations based on the makeup of the specific segment. These other considerations include:
volumes and trends of delinquencies;
levels of nonaccruals, repossessions and bankruptcies;
trends in criticized and classified loans;
expected losses on real estate secured loans;
new credit products and policies;
economic conditions;
concentrations of credit risk; and
experience and abilities of the Company’s lending personnel.
In addition to the segment evaluations, nonaccrual loans graded substandard or doubtful with an outstanding balance of $500 thousand or more, as well as consumer loans designated as troubled debt restructurings, are individually evaluated in accordance with SFAS No. 114,ASC 310,Accounting by Creditors for Impairment of a Loan,Receivables,to determine the level of impairment and establish a specific reserve. A specific allowance is established for loans adversely graded loans below $500 thousand when it is determined that the risk associated with the loan differs significantly from the risk factor amounts established for its loan segment.
The allowance for consumer loans is determined using historically developed loss experience rates“roll rates” at which loans migrate from one delinquency level to the next higher level. Using averagecurrent roll rates for the most recent twelve-monthsix-month period and comparing projected losses to actual loss experience, the model estimatesmodels estimate expected losses in dollars for the forecasted period.period of twelve months. By refreshing the modelmodels with updated data, it is able to project losses are projected for a new twelve-month period each month, segmenting the portfolio into ninetwelve consumer loan
product groupings and four bankcard product groupings with similar risk profiles. The residential mortgage and home equity portfolios’ models implicitly take into consideration housing price depreciation (appreciation) and homeowners’ loss (gain) of equity in the collateral by incorporating current roll rates and loss severity rates. The models make no assumptions about future housing price changes. This methodology is an accepted industry practice, and the Company believes it has a sufficient volume of information to produce reliable projections.
As a final step to the evaluation process, we perform an additional review of the adequacy of the allowance based on the loan portfolio in its entirety. This enables us to mitigate, but not eliminate, the imprecision inherent in mostloan- and segment-level estimates of expected credit losses. This review of the allowance includes our judgmental consideration of any adjustments necessary for subjective factors such as economic uncertainties and excessive concentration risks.
The methodology used by Amegy to estimate its allowance for loan losses has not yet been conformed to the process used by the other affiliate banks. However, the process used by Amegy is not significantly different than the process used by our other affiliate banks.
The Company has initiated a comprehensive review of its allowance for loan losses methodology with a view toward updating and conforming this methodology across all of its banking subsidiaries. The Company began implementing this updated methodology in 2007 and expects to complete the implementation in 2009.
Schedule 3742 summarizes the Company’s loan loss experience by major portfolio segment.
Schedule 42
SCHEDULE 37
SUMMARY OF LOAN LOSS EXPERIENCE
(Amounts in millions)
| 2007 | 2006 | 2005 | 2004 | 2003 | 2009 | 2008 | 2007 | 2006 | 2005 | |||||||||||||||||
Loans* and leases outstanding on | $ | 39,088 | 34,668 | 30,127 | 22,627 | 19,920 | |||||||||||||||||||||
Loans and leases outstanding on December 31, excluding FDIC-supported loans (net of unearned income) | $ | 38,744 | 41,659 | 38,880 | 34,415 | 29,871 | |||||||||||||||||||||
Average loans* and leases outstanding (net | $ | 36,808 | 32,395 | 24,009 | 21,046 | 19,325 | |||||||||||||||||||||
Average loans and leases outstanding, excluding FDIC-supported loans (net of unearned income) | $ | 40,455 | 40,795 | 36,575 | 32,134 | 23,804 | |||||||||||||||||||||
Allowance for loan losses: | |||||||||||||||||||||||||||
Balance at beginning of year | $ | 365 | 338 | 271 | 269 | 280 | $ | 687 | 459 | 365 | 338 | 271 | |||||||||||||||
Allowance of companies acquired | 8 | – | 49 | – | – | – | – | 8 | – | 49 | |||||||||||||||||
Allowance of loans sold with branches | (2) | – | – | (2) | – | ||||||||||||||||||||||
Allowance associated with purchased securitized loans | – | 2 | – | – | – | ||||||||||||||||||||||
Allowance of loans and leases sold | – | (1 | ) | (2 | ) | – | – | ||||||||||||||||||||
Provision charged against earnings | 152 | 73 | 43 | 44 | 70 | 2,017 | 648 | 152 | 73 | 43 | |||||||||||||||||
Loans and leases charged-off: | |||||||||||||||||||||||||||
Charge-offs: | |||||||||||||||||||||||||||
Commercial lending | (37) | (46) | (20) | (35) | (56) | (373 | ) | (100 | ) | (39 | ) | (47 | ) | (21 | ) | ||||||||||||
Commercial real estate | (24) | (5) | (3) | (1) | (3) | (713 | ) | (269 | ) | (24 | ) | (5 | ) | (3 | ) | ||||||||||||
Consumer | (16) | (14) | (19) | (23) | (27) | (170 | ) | (45 | ) | (16 | ) | (14 | ) | (19 | ) | ||||||||||||
Other receivables | (2) | (1) | (1) | (1) | – | ||||||||||||||||||||||
Total | (79) | (66) | (43) | (60) | (86) | (1,256 | ) | (414 | ) | (79 | ) | (66 | ) | (43 | ) | ||||||||||||
Recoveries: | |||||||||||||||||||||||||||
Commercial lending | 8 | 11 | 12 | 15 | 12 | 51 | 9 | 9 | 12 | 12 | |||||||||||||||||
Commercial real estate | 1 | 2 | 1 | – | – | 21 | 7 | 1 | 1 | 1 | |||||||||||||||||
Consumer | 5 | 7 | 5 | 5 | 5 | 9 | 5 | 5 | 7 | 5 | |||||||||||||||||
Other receivables | 1 | – | – | – | – | ||||||||||||||||||||||
Total | 15 | 20 | 18 | 20 | 17 | 81 | 21 | 15 | 20 | 18 | |||||||||||||||||
Charge-offs recoverable from FDIC | 2 | – | – | – | – | ||||||||||||||||||||||
Net loan and lease charge-offs | (64) | (46) | (25) | (40) | (69) | (1,173 | ) | (393 | ) | (64 | ) | (46 | ) | (25 | ) | ||||||||||||
| 459 | 365 | 338 | 271 | 281 | |||||||||||||||||||||||
Reclassification of reserve for unfunded | – | – | – | – | (12) | ||||||||||||||||||||||
Reclassification to reserve for unfunded lending commitments | – | (28 | ) | – | – | – | |||||||||||||||||||||
Balance at end of year | $ | 459 | 365 | 338 | 271 | 269 | $ | 1,531 | 687 | 459 | 365 | 338 | |||||||||||||||
Ratio of net charge-offs to average loans and | 0.17% | 0.14% | 0.10% | 0.19% | 0.36% | ||||||||||||||||||||||
Ratio of allowance for loan losses to net | 1.18% | 1.05% | 1.12% | 1.20% | 1.35% | ||||||||||||||||||||||
Ratio of allowance for loan losses to | 170.99% | 548.53% | 489.74% | 374.42% | 338.31% | ||||||||||||||||||||||
Ratio of allowance for loan losses to | 136.75% | 331.56% | 394.08% | 307.61% | 262.21% | ||||||||||||||||||||||
Ratio of net charge-offs to average loans and leases, excluding FDIC-supported loans | 2.90 | % | 0.96 | % | 0.17 | % | 0.14 | % | 0.10 | % | |||||||||||||||||
Ratio of allowance for loan losses to net loans and leases, excluding FDIC-supported loans, on December 31, | 3.95 | % | 1.65 | % | 1.18 | % | 1.06 | % | 1.13 | % | |||||||||||||||||
Ratio of allowance for loan losses to nonperforming loans, excluding FDIC-supported loans, on December 31, | 75.68 | % | 72.58 | % | 177.70 | % | 549.88 | % | 492.45 | % | |||||||||||||||||
Ratio of allowance for loan losses to nonaccrual loans and accruing loans past due 90 days or more, excluding FDIC-supported loans, on December 31, | 71.88 | % | 63.84 | % | 136.75 | % | 331.56 | % | 394.08 | % | |||||||||||||||||
Schedule 3843 provides a breakdown of the allowance for loan losses and the allocation among the portfolio segments. No significant changes took place in the past five years in the allocation of the allowance for loan losses by portfolio segment.
SCHEDULE 38Schedule 43
ALLOCATION OF THE ALLOWANCE FOR LOAN LOSSES
AT DECEMBER 31,
| 2007 | 2006 | 2005 | 2004 | 2003 | |||||||||||||||||||||
(Amounts in millions)
| % of total loans | Allocation of allowance | % of total loans | Allocation of allowance | % of total loans | Allocation of allowance | % of total loans | Allocation of allowance | % of total loans | Allocation of allowance | |||||||||||||||
Type of Loan | |||||||||||||||||||||||||
Commercial lending | 45.7% | $ | 182 | 43.5% | $ | 179 | 41.2% | $ | 166 | 39.0% | $ | 134 | 39.2% | $ | 130 | ||||||||||
Commercial real estate | 34.7 | 222 | 35.8 | 143 | 35.5 | 128 | 33.2 | 95 | 31.4 | 90 | |||||||||||||||
Consumer | 18.8 | 48 | 20.1 | 40 | 22.7 | 41 | 27.4 | 41 | 29.0 | 47 | |||||||||||||||
Other receivables | 0.8 | 7 | 0.6 | 3 | 0.6 | 3 | 0.4 | 1 | 0.4 | 2 | |||||||||||||||
Total | 100.0% | $ | 459 | 100.0% | $ | 365 | 100.0% | $ | 338 | 100.0% | $ | 271 | 100.0% | $ | 269 | ||||||||||
| 2009 | 2008 | 2007 | 2006 | 2005 | ||||||||||||||||||||||||||
| (Amounts in millions) | % of total loans | Allocation of allowance | % of total loans | Allocation of allowance | % of total loans | Allocation of allowance | % of total loans | Allocation of allowance | % of total loans | Allocation of allowance | ||||||||||||||||||||
Type of Loan | ||||||||||||||||||||||||||||||
Commercial lending | 49.0 | % | $ | 613 | 49.5 | % | $ | 319 | 47.4 | % | $ | 190 | 44.1 | % | $ | 182 | 41.8 | % | $ | 169 | ||||||||||
Commercial real estate | 33.7 | 753 | 32.8 | 291 | 33.8 | 215 | 35.8 | 143 | 35.5 | 128 | ||||||||||||||||||||
Consumer | 17.3 | 165 | 17.7 | 77 | 18.8 | 54 | 20.1 | 40 | 22.7 | 41 | ||||||||||||||||||||
Total | 100.0 | % | $ | 1,531 | 100.0 | % | $ | 687 | 100.0 | % | $ | 459 | 100.0 | % | $ | 365 | 100.0 | % | $ | 338 | ||||||||||
The total allowance for loan losses at December 31, 20072009 increased $94$844 million from the level at year-end 2006.2008. For 2007,2009, the amount of the allowance included for criticized and classified commercial and commercial real estate loans increased $63$294 million compared to $3 million for 2006. Of this increase, $22 million was for construction and land development loans reflecting the weaker credit conditions in the Southwestern residential real estate markets as previously discussed, $19 million was for commercial lending, and $22 million was for other commercial real estate loans. The level of the allowance for noncriticized and classified commercial loans increased $19 million for 2007 compared to an increase of $24 million for 2006. The increase in the level of the allowance indicated for noncriticized and classified loans for both 2007 and 2006 was mainly a result of $3.9 billion of new commercial and commercial real estate loan growth during 2007 and $4.5 billion of growth during 2006. The allowance for consumer loans and other receivables increased $12 million compared to December 31, 2006. At December 31, 2007, the ratio of the allowance for loan losses for commercial lending reflects deterioration of borrower credit quality due to netdifficult economic conditions, reductions in collateral values, and increases in realized loss rates that increased our quantitative loss factors for commercial real estate and consumer portfolios as well. The $462 million increase in the allowance for commercial real estate loans and leases outstanding increased to 1.18% compared to 1.05% at December 31, 2006. This increaselargely reflects the previously discussed softening in ourimpact of deteriorating credit quality indicatorsconditions in the commercial construction, land acquisition and our concerns regardingdevelopment portfolios across the economy, particularly the outlook for residential land development and construction.
Company.
Reserve for Unfunded Lending Commitments: The Company also estimates a reserve for potential losses associated with off-balance sheet commitments and standby letters of credit. The reserve is included with other liabilities in the Company’s consolidated balance sheet, with any related increases or decreases in the reserve included in noninterest expense in the statement of income.
We determine the reserve for unfunded lending commitments using a process that is similar to the one we use for commercial loans. Based on historical experience, we have developed experience-based loss factors that we apply to the Company’s unfunded lending commitments to estimate the potential for loss inherent in that portfolio. These factors are generatedsuch commitments.
The Company has historically maintained a reserve for unfunded commitments, recorded in other liabilities. During the fourth quarter of 2008 refinements to this process were implemented to include unfunded portions of partially funded credits. This action resulted in the reclassification of $27.9 million from tracking commitments that become funded and develop into problem loans.the allowance for loan losses to the reserve for unfunded lending commitments.
Schedule 3944 sets forth the reserve for unfunded lending commitments.
Schedule 44
SCHEDULE 39
RESERVE FOR UNFUNDED LENDING COMMITMENTS
| December 31, | |||||
| (In thousands) | 2007 | 2006 | |||
Balance at beginning of year | $ | 19,368 | 18,120 | ||
Reserve of company acquired | 326 | – | |||
Provision charged against earnings | 1,836 | 1,248 | |||
Balance at end of year | $ | 21,530 | 19,368 | ||
| December 31, | |||||||
| (In millions) | 2009 | 2008 | 2007 | ||||
Balance at beginning of year | $ | 51 | 22 | 19 | |||
Reserve of company acquired | – | – | 1 | ||||
Reclassification from allowance for loan losses | – | 28 | – | ||||
Provision charged against earnings | 66 | 1 | 2 | ||||
Balance at end of year | $ | 117 | 51 | 22 | |||
Schedule 4045 sets forth the combined allowance and reserve for credit losses.
Schedule 45
SCHEDULE 40
TOTAL ALLOWANCE AND RESERVE FOR CREDIT LOSSES
| December 31, | |||||||
| (In thousands) | 2007 | 2006 | 2005 | ||||
Allowance for loan losses | $ | 459,376 | 365,150 | 338,399 | |||
Reserve for unfunded lending commitments | 21,530 | 19,368 | 18,120 | ||||
Total allowance and reserve for credit losses | $ | 480,906 | 384,518 | 356,519 | |||
| December 31, | |||||||
| (In millions) | 2009 | 2008 | 2007 | ||||
Allowance for loan losses | $ | 1,531 | 687 | 459 | |||
Reserve for unfunded lending commitments | 117 | 51 | 22 | ||||
Total allowance for credit losses | $ | 1,648 | 738 | 481 | |||
Interest Rate and Market Risk Management
Interest rate and market risk are managed centrally. Interest rate risk is the potential for reduced income resulting from adverse changes in the level of interest rates on the Company’s net interest income. Market risk is the potential for reduced incomeloss arising from adverse changes in the fair value of fixed income securities, equity securities, other earning assets, and derivative financial instruments as a result of changes in interest rates or other factors. As a financial institution that engages in transactions involving an array of financial products, the Company is exposed to both interest rate risk and market risk.
The Company’s Board of Directors is responsible for approving the overall policies relating to the management of the financial risk of the Company. The Boards of Directors of the Company’s subsidiary banks are also required to review and approve these policies. In addition, the Board must understandreviews the key strategies set by management for managing risk, establishestablishes and periodically reviserevises policy limits, and reviewreviews reported limit exceptions. The Board has established the Managementmanagement Asset/Liability Committee (“ALCO”) to which it has delegated the functional management of interest rate and market risk for the Company. ALCO’s primary responsibilities include:
recommending policies to the Board and administering Board-approved policies that govern and limit the Company’s exposure to all interest rate and market risk, including policies that are designed to limit the Company’s exposure to changes in interest rates;
approving the procedures that support the Board-approved policies;
maintaining management’s policies dealing with interest rate and market risk;
approving all material interest rate risk management strategies, including all hedging strategies and actions taken pursuant to managing interest rate risk and monitoring risk positions against approved limits;
approving limits and all financial derivative positions taken at both the Parent and subsidiaries for the purpose of hedging the Company’s interest rate and market risks;
providing the basis for integrated balance sheet, net interest income, and liquidity management;
calculating the duration and dollar duration of each class of assets, liabilities, and net equity, given defined interest rate scenarios;
managing the Company’s exposure to changes in net interest income and duration of equity due to interest rate fluctuations; and
quantifying the effects of hedging instruments on the duration of equity and net interest income under defined interest rate scenarios.
Interest Rate Risk
Interest rate risk is one of the most significant risks to which the Company is regularly exposed. In general, our goal in managing interest rate risk is to have the net interest margin increase slightly in a rising interest rate environment. We refer to this goal as being slightly “asset-sensitive.” This approach is based on our belief that in a rising interest rate environment, the market cost of equity, or implied rate at which future earnings are discounted, would also tend to rise. However, as noted below, the Company has intentionally positioned its balance sheet to be more asset sensitive as compared to 2008.
We attempt to minimize the impact of changing interest rates on net interest income through the use of interest rate floors on variable rate loans, interest rate swaps, and by avoiding large exposures to long-term fixed rate interest-earning assets that have significant negative convexity. The prime lending rate and the LIBOR curves are the primary indices used for pricing the Company’s loans. The interest rates paid on deposit accounts are set by individual banks so as to be competitive in each local market.
We monitor this risk through the use of two complementary measurement methods: duration of equity and income simulation. In the duration of equity method, we measure the expected changes in the fair values of equity in response to changes in interest rates. In the income simulation method, we analyze the expected changes in income in response to changes in interest rates.
Duration of equity is derived by first calculating the dollar duration of all assets, liabilities and derivative instruments. Dollar duration is determined by calculating the fair value of each instrument assuming interest rates sustain immediate and parallel movements up 1% and down 1%. The average of these two changes in fair value is the dollar duration. Subtracting the dollar duration of liabilities from the dollar duration of assets and adding the net dollar duration of derivative instruments results in the dollar duration of equity. Duration of equity is computed by dividing the dollar duration of equity by the fair value of equity.
The Company’s policy is to maintain duration of equity between -3% to +7%.
Income simulation is an estimate of the net interest income that would be recognized under different rate environments. Net interest income is measured under several parallel and nonparallel interest rate environments and deposit repricing assumptions, taking into account an estimate of the possible exercise of options within the portfolio.
Both of these measurement methods require that we assess a number of variables and make various assumptions in managing the Company’s exposure to changes in interest rates. The assessments address loan and security prepayments, early deposit withdrawals, and other embedded options and noncontrollable events. As a result of uncertainty about the maturity and repricing characteristics
of both deposits and loans, the Company estimates ranges of duration and income simulation under a variety of assumptions and scenarios. The Company’s interest rate risk position changes as the interest rate environment changes and is managed actively to try to maintain a consistent slightly asset-sensitive position. However, positions at the end of any period may not be reflective of the Company’s position in any subsequent period.
We should note that estimated duration of equity and the income simulation results are highly sensitive to the assumptions used for deposits that do not have specific maturities, such as checking, savings, and money market accounts and also to prepayment assumptions used for loans with prepayment options. Given the uncertainty of these estimates, we view both the duration of equity and the income simulation results as falling within a range of possibilities.
For income simulation, Company policy requires that interest sensitive income from a static balance sheet is expectedbe limited to a decline byof no more than 10% during one year if rates were to immediately rise or fall in parallel by 200 basis points.
As of the dates indicated, Schedule 4146 shows the Company’s estimated range of duration of equity and percentage change in interest sensitive income, based on a static balance sheet, in the first year after the rate change if interest rates were to sustain an immediate parallel change of 200 basis points; the “low”“fast” and “high”“slow” results differ based on the assumed speed of repricing of administered-rate deposits (money market, interest-on-checking, and savings):.
Schedule 46
SCHEDULE 41
DURATION OF EQUITY AND INTEREST SENSITIVE INCOME
| December 31, 2007 | December 31, 2006 | December 31, 2009 | December 31, 2008 | |||||||||||||||||
| Low | High | Low | High | Low | High | Low | High | |||||||||||||
Duration of equity: | ||||||||||||||||||||
Range (in years) | ||||||||||||||||||||
Base case | 0.0 | 2.5 | 0.0 | 1.6 | -2.9 | -0.8 | -2.5 | 0.9 | ||||||||||||
Increase interest rates by 200 bp | 0.9 | 3.4 | 0.8 | 2.4 | -2.7 | -0.8 | -2.4 | 0.7 | ||||||||||||
| Deposit repricing response | ||||||||||||||||||||
| Fast | Slow | Fast | Slow | |||||||||||||||||
Income simulation – change in interest sensitive income: | ||||||||||||||||||||
Increase interest rates by 200 bp | -1.3% | 1.1% | -0.9% | 1.5% | 2.2 | % | 5.0 | % | -1.1 | % | 1.5 | % | ||||||||
Decrease interest rates by 200 bp | -2.3% | -0.2% | -3.6% | -1.3% | ||||||||||||||||
Decrease interest rates by 200 bp1 | -4.1 | % | -4.3 | % | -1.8 | % | -2.4 | % | ||||||||||||
| 1 | In the event that a 200 basis point rate parallel decrease cannot be achieved, the applicable rate changes are limited to lesser amounts such that interest rates cannot be less than zero. |
As discussed previously underDuring 2009, the section, “Net Interest Income, Marginduration of equity became shorter as compared to December 31, 2008. The reduction of the duration of equity was due to increased long term debt, shorter duration of assets, and Interest Rate Spreads,” the Company believes that in recent quarters, the dynamic balance sheet changes with regardmanagement decisions to changes in the mix of deposits and other funding sources have tended to have a somewhat larger effect on the net interest spread and net interest margin than has the Company’s interest rate risk position. In addition, as also discussed in that section, competitive pressures on deposit rates may impede our ability to reprice deposits, which did have a negative impact on the net interest margin during the third and fourth quarter of 2007. During those quarters, deposits repriced even more slowly than our modeled “low” case, as market disruptions and funding pressures experienced by many financial institutions kept market deposit prices from falling as much as expected when the Federal Reserve Board began reducing short-term interest rates.
We attempt to minimize the impact of changing interest rates will have on net interest income primarily through the use ofeliminate fair value interest rate swaps and by avoiding large exposures toon fixed rate interest-earning assets that have significant negative convexity. The prime lendingdebt, and terminate without replacement a number of “receive fixed” interest rate and LIBOR curves are the primary indices used for pricing the Company’sswaps on pools of floating rate loans. The interest rates paid on deposit accounts are set by individual banks so as to be competitive in each local market.
Our focus on business banking also plays a significant role in determining the nature of the Company’s asset-liability management posture. At the end of 2007,2009, approximately 75%78% of the Company’s commercial loan and commercial real estate portfolios were floating rate and primarily tied to either Primeprime or LIBOR. In addition, certain of our consumer loans also have floating interest rates. This means that these loans reprice quickly in response to changes in interest rates – more quickly on average than does their funding base. This posture resultsresulted in a natural position that is more “asset-sensitive” than the Company believes is desirable.
The Company attempts to mitigate this tendency toward asset sensitivity primarilythrough the use of interest rate floors on loans to protect against declining rates, and through the use of interest rate swaps. We haveIn past years we also had contracted to convert most of the Company’s long-term fixed-rate debt into floating-rate debt through the use of interest rate swaps. However, in the first quarter of 2009, these swaps (see fair value hedgeswere terminated when management decided to position the Company to be more asset sensitive in Schedule 42). More importantly, we engagelight of historically low short-term interest rates
and unprecedented “quantitative easing” monetary policy actions by the Federal Reserve. We also traditionally have engaged in an ongoing program of swapping prime-based and LIBOR-based loans for “receive fixed”“receive-fixed” contracts. However, during 2009 we terminated and did not replace a number of such swaps as they became ineffective under ASC 815, with the same objective of positioning the Company’s balance sheet to be more asset sensitive. At year-end 2007,2009, the Company had a notional amount of approximately $3.4$0.9 billion of such cash flow hedge contracts. The Company expects to continue to add new “receive fixed” swap contracts as its prime-based loan portfolio grows.This notional amount is approximately $1.5 billion less than at year-end 2008. These swaps also expose the Company to counterparty risk, which is a type of credit risk. The Company’s approach to managing this risk is discussed in “Credit Risk Management” on page 88.103. The Company retains basis risk due to changes between the prime rate and LIBOR on nonhedge derivative basis swaps. See “Critical Accounting Policies and Significant Estimates – Accounting“Accounting for Derivatives” on page 4147 for further details about our derivative instruments. Finally, the Company’s subsidiary banks made increasing use of interest rate floors on new loans. As of December 31, 2009, approximately 26.3% of the Company’s floating rate loans were priced at floors that were above the “index plus spread” rate by an average of 1.55% on that date.
The Company believes that these dynamic balance sheet changes during 2009, including changes in the mix of deposits and other funding sources, have tended to have a somewhat larger effect on the net interest spread and net interest margin than has the Company’s interest rate risk position. As a result of these changes, the Company ended 2009 with an interest rate risk position that was more asset-sensitive than at the end of 2008, as shown in Schedule 46.
Schedule 4247 presents a profile of the current interest rate swapderivatives portfolio. For additional information regarding derivative instruments, including fair values at December 31, 2007,2009, refer to Notes 1 and 7 of the Notes to Consolidated Financial Statements.
SCHEDULE 42Schedule 47
INTEREST RATE SWAPSDERIVATIVES – YEAR-END BALANCES AND AVERAGE RATES
(Amounts in millions)
| 2008 | 2009 | 2010 | 2011 | 2012 | Thereafter | |||||||
Cash flow hedges(1): | |||||||||||||
Notional amount | $ | 3,400 | 3,400 | 2,970 | 1,840 | 615 | |||||||
Weighted average rate received | 7.38% | 7.38 | 7.38 | 7.18 | 7.02 | ||||||||
Weighted average rate paid | 5.74 | 6.07 | 6.43 | 6.59 | 6.69 | ||||||||
Fair value hedges(1): | |||||||||||||
Notional amount | $ | 1,400 | 1,400 | 1,400 | 1,400 | 1,400 | 1,400 | ||||||
Weighted average rate received | 5.71% | 5.71 | 5.71 | 5.71 | 5.71 | 5.71 | |||||||
Weighted average rate paid | 3.49 | 3.96 | 4.35 | 4.62 | 4.91 | 5.05 | |||||||
Nonhedges: | |||||||||||||
Receive fixed rate/pay variable rate: | |||||||||||||
Notional amount | $ | 87 | |||||||||||
Weighted average rate received | 4.53% | ||||||||||||
Weighted average rate paid | 3.88 | ||||||||||||
Receive variable rate/pay fixed rate: | |||||||||||||
Notional amount | $ | 87 | |||||||||||
Weighted average rate received | 3.88% | ||||||||||||
Weighted average rate paid | 4.53 | ||||||||||||
Basis swaps: | |||||||||||||
Notional amount | $ | 2,815 | 2,815 | 2,385 | 1,400 | 340 | |||||||
Weighted average rate received | 6.21% | 6.58 | 6.99 | 7.29 | 7.60 | ||||||||
Weighted average rate paid | 6.45 | 6.63 | 7.09 | 7.35 | 7.64 | ||||||||
Net notional | $ | 7,615 | 7,615 | 6,755 | 4,640 | 2,355 | 1,400 | ||||||
| (Amounts in millions) | 2010 | 2011 | 2012 | Thereafter | ||||||
Cash flow hedges1: | ||||||||||
Notional amount | $ | 665 | 380 | 130 | ||||||
Weighted average expected receive rate | 6.36 | % | 6.06 | 5.75 | ||||||
Weighted average expected pay rate | 2.08 | 2.81 | 3.63 | |||||||
Cash flow floors: | ||||||||||
Notional amount | $ | 170 | ||||||||
Weighted average strike price | 2.79 | |||||||||
Nonhedges: | ||||||||||
Receive fixed rate/pay variable rate: | ||||||||||
Notional amount | $ | 104 | 59 | 59 | ||||||
Weighted average expected receive rate | 4.04 | % | 4.24 | 4.24 | ||||||
Weighted average expected pay rate | 1.87 | 3.21 | 4.27 | |||||||
Receive variable rate/pay fixed rate: | ||||||||||
Notional amount | $ | 104 | 59 | 59 | ||||||
Weighted average expected receive rate | 1.87 | % | 3.21 | 4.27 | ||||||
Weighted average expected pay rate | 4.04 | 4.24 | 4.24 | |||||||
Basis swaps: | ||||||||||
Notional amount | $ | 305 | 140 | 30 | ||||||
Weighted average expected receive rate | 2.74 | % | 2.67 | 2.77 | ||||||
Weighted average expected pay rate | 4.37 | 5.74 | 6.76 | |||||||
Net notional | $ | 1,140 | 520 | 160 | ||||||
Receive fixed rate/pay variable rate |
Note: Balances are based upon the portfolio at December 31, 2007.2009. Excludes interest rate swap products that we provide as a service to our customers.
Market Risk – Fixed Income
The Company engages in the underwriting and trading of municipal and corporate securities. This trading activity exposes the Company to a risk of loss arising from adverse changes in the prices of these fixed income securities held by the Company.
At December 31, 2007,2009, trading account assets had been reduced to $21.8$23.5 million and securities sold, not yet purchased were $224.3$43.4 million. The higher level of securities sold, not yet purchased is related to an Amegy Bank sweep product.
At year-end 2007,2009, the Company made a market in 493639 fixed income securities through Zions Bank and its wholly-owned subsidiary, Zions Direct, Inc. During 2007, 69%2009, 78% of all trades were executed electronically. The Company is an odd-lot securities dealer, which means that most corporate security trades are for less than $250,000.
The Company is exposed to market risk through changes in fair value and OTTI of HTM and AFS securities. The Company also is exposed to market risk which incorporates credit risk, through changes in fair value of available-for-sale securities andfor interest rate swaps used to hedge interest rate risk. Changes in fair value in both of these categoriesavailable-for-sale securities and interest rate swaps are included in accumulated other comprehensive income (loss) (“OCI”)OCI each quarter. During 2007,2009, the after-tax change in OCI attributable to available-for-saleAFS and HTM securities was $(90.4) million and the$(217.8) million. The change attributable to interest rate swaps was $106.9$(128.6) million, for a net increase indecreasing shareholders’ equity of $16.5by
$(346.4) million. If any of the available-for-saleAFS securities or HTM securities transferred from AFS becomes other-than-temporarilyother than temporarily impaired, the lossany credit impairment in OCI is reversed and the impairment is charged to operations.
See “Investment Securities Portfolio” on page 91 for additional information on OTTI.
Market Risk – Equity Investments
Through its equity investment activities, the Company owns equity securities that are publicly traded and subject to fluctuations in their market prices or values. In addition, the Company owns equity securities in companies that are not publicly traded, that are accounted for under cost, fair value, equity, or full consolidation methods of accounting, depending upon the Company’s ownership position and degree of involvement in influencing the investees’ affairs. In anyeither case, the value of the Company’s investment is subject to fluctuation. Since the fair value of these market prices or valuessecurities may fall below the Company’s investment costs, the Company is exposed to the possibility of loss. These equity investments are approved, monitored and evaluated by the Company’s Equity Investment Committee.
The Company generally conducts minority investingalso invests in prepublic venture capital companies in which it does not have strategic involvement, through four funds collectively referred to as Epic Venture Funds (“Epic”) (formerly Wasatch Venture Funds). Epic screens investment opportunities and makes investment decisions based on its assessment of business prospects and potential returns. After an investment is made, Epic actively monitors the performance of each company in which it has invested, and often has representation on the board of directors of the company.various venture funds. Net of expenses, income tax effects and minority interest,noncontrolling interests, losses were $1.9 million in 2009 and $3.0 million in 2008 and gains were $3.4$3.9 million in 2007 and $4.1 million in 2006 and losses were $2.2 million in 2005.from these venture funds. The Company’s remaining equity exposure to investments held by Epic,these venture funds, net of related minority interest and SBA debt,noncontrolling interests at December 31, 20072009 was approximately $40.0$56.3 million, compared to approximately $49.1$54.4 million at December 31, 2006.
2008.
In addition to the program described above, Amegy has in place an alternative investments program. These investments are primarily directed towards equity buyout and mezzanine funds with a key strategy of deriving ancillary commercial banking business from the portfolio companies. Early stage venture capital funds generally are not part of the strategy since the underlying companies are typically not credit worthy. The carrying value of the investments at December 31, 20072009 was $37.4$62.8 million compared to $19.6$54.6 million at December 31, 2006.2008. The Company has a total remaining funding commitment of $101.7$78.2 million to SBIC, non-SBIC hedge funds, and private equity investments as of December 31, 2007. This2009; $52.8 million of this total funding commitment is primarily at Amegy, totaling $76.4 million.Amegy.
The Company also, from time to time, either starts and funds businesses of a strategic nature, or makes significant investments in companies of strategic interest. These investments may result in either minority or majority ownership positions, and usually give the Parent or its subsidiaries board representation. These strategic investments are in companies that are financial services or financial technologies providers. Examples include Contango NetDeposit, and P5 all ofNetDeposit, which are majority or wholly-owned by the Company, and Insure.com,Life Quotes, Inc. and IdenTrust, in which the Company owns a significant, but minority position.positions.
Liquidity Risk
Overview
Liquidity risk is the possibility that the Company’s cash flows may not be adequate to fund its ongoing operations and meet its commitments in a timely and cost-effective manner. Since liquidity risk is closely linked to both credit risk and market risk, many of the previously discussed risk control mechanisms also apply to the monitoring and management of liquidity risk. We manage the Company’s liquidity to provide adequate funds to meet its anticipated financial and contractual obligations, including withdrawals by depositors, debt service requirements and lease obligations, as well as to fund customers’ needs for credit.
Overseeing liquidity management is the responsibility of ALCO, which implements a Board-adopted corporate Liquidity and Funding Policy. This Policy that is adhered to by the Parent and the subsidiary banks. This policy includes guidelines by whichaddresses maintaining adequate liquidity, and funding are managed. These guidelines address maintaining liquidity needs, diversifying funding positions, monitoring liquidity at consolidated as well as subsidiary bank levels, and anticipating future funding needs. The policy also includes liquidity ratio guidelines that are used to monitor the liquidity positions of the Parent and bank subsidiaries.
Managing liquidity and funding is performed centrally by Zions Bank’s Capital Markets/Investment Division under the direction of the Company’s Chief Investment Officer, with oversight by ALCO. The Chief Investment Officer is responsible for making any recommendedrecommending changes to existing funding plans, as well as to the policy guidelines. These recommendations must be submitted for approval to ALCO and potentially to the Company’s Board of Directors. The subsidiary banks only have authority to price deposits, borrow from their FHLB and the Federal Reserve, and sell/purchase Federal Funds to/from Zions Bank.Bank and/or correspondent banks. The banks may also make liquidity and funding recommendations to the Chief Investment Officer, but are not involved in any other funding decision processes.
Contractual Obligations
Schedule 4348 summarizes the Company’s contractual obligations at December 31, 2007.2009.
Schedule 48
CONTRACTUAL OBLIGATIONS
SCHEDULE 43
CONTRACTUAL OBLIGATIONS
| (In millions) | One year or less | Over one year through three years | Over three years through five years | Over five years | Indeterminable maturity (1) | Total | One year or less | Over one year through three years | Over three years through five years | Over five years | Indeterminable maturity1 | Total | ||||||||||||||
Deposits | $ | 7,418 | 499 | 149 | 1 | 28,856 | 36,923 | $ | 5,101 | 586 | 202 | 2 | 35,950 | 41,841 | ||||||||||||
Commitments to extend credit | 5,839 | 5,883 | 2,057 | 2,869 | 16,648 | 4,803 | 3,810 | 803 | 2,194 | 11,610 | ||||||||||||||||
Standby letters of credit: | ||||||||||||||||||||||||||
Financial | 523 | 397 | 62 | 90 | 1,072 | |||||||||||||||||||||
Performance | 218 | 131 | 2 | 351 | 131 | 50 | 1 | 182 | ||||||||||||||||||
Financial | 824 | 260 | 142 | 91 | 1,317 | |||||||||||||||||||||
Commercial letters of credit | 45 | 4 | 49 | 21 | 9 | 30 | ||||||||||||||||||||
Commitments to make venture and other noninterest-bearing investments(2) | 102 | 102 | ||||||||||||||||||||||||
Commitments to Lockhart(3) | 2,124 | 2,124 | ||||||||||||||||||||||||
Commitments to make venture and other noninterest-bearing investments2 | 78 | 78 | ||||||||||||||||||||||||
Federal funds purchased and security repurchase agreements | 3,762 | 3,762 | 786 | 786 | ||||||||||||||||||||||
Other short-term borrowings | 3,704 | 3,704 | 165 | 165 | ||||||||||||||||||||||
Long-term borrowings(4) | 158 | 401 | 4 | 1,950 | 2,513 | |||||||||||||||||||||
Long-term borrowings3 | 73 | 262 | 633 | 1,041 | 2,009 | |||||||||||||||||||||
Operating leases, net of subleases | 45 | 81 | 61 | 165 | 352 | 48 | 88 | 67 | 152 | 355 | ||||||||||||||||
Visa litigation | 2 | 1 | 1 | 4 | 8 | 1 | 1 | |||||||||||||||||||
Unrecognized tax benefits, FIN 48 | 24 | 24 | ||||||||||||||||||||||||
Unrecognized tax benefits, ASC 740 | 8 | 8 | ||||||||||||||||||||||||
| $ | 24,241 | 7,260 | 2,416 | 5,076 | 28,884 | 67,877 | $ | 11,729 | 5,202 | 1,768 | 3,479 | 35,959 | 58,137 | |||||||||||||
Indeterminable maturity |
Commitments to make venture investments do not have defined maturity dates. They have therefore been considered due on demand, maturing in one year or less. |
|
|
The maturities on long-term borrowings do not include the associated hedges. |
As of December 31, 2007, there were no minimum required pension plan contributions and no discretionary or noncash contributions are currently planned. As a result, no amounts have been included in the schedule above for future pension plan contributions.
In addition to the commitments specifically noted in the previous schedule, the Company enters into a number of contractual commitments in the ordinary course of business. These include software licensing and maintenance, telecommunications services, facilities maintenance and equipment servicing, supplies purchasing, and other goods and services used in the operation of our business. Generally, these contracts are renewable or cancelable at least annually, although in some cases to secure favorable pricing concessions, the Company has committed to contracts that may extend to several years.
The Company also enters into derivative contracts under which it is required either to receive cash or pay cash, depending on changes in interest rates. These contracts are carried at fair value on the balance sheet with the fair value representing the net present value of the expected future cash receipts and payments based on
market rates of interest as of the balance sheet date. The fair value of the contracts changes daily as interest rates change. For further information on derivative contracts, see Note 7 of the Notes to Consolidated Financial Statements.
Pension Obligations
As of December 31, 2007, the market value of the Company’s pension plan assets was $141.2 million and the benefit obligation as of that date was $152.8 million, as measured with an annual discount rate of 6.0%. This means that the pension plan is underfunded in the amount of $11.6 million. This underfunding is recorded as a liability on the Company's balance sheet. Since no new employees can be added to the plan and future benefit accruals were eliminated for most participants effective January 1, 2003, this unfunded condition should decrease over time as the market value of plan assets is expected to appreciate faster than the benefit obligation, although fluctuations in plan asset values could cause the unfunded amount to either increase or decrease over shorter time periods. As a result, the Company does not anticipate a need to make any cash contributions to the plan in the near future. However, certain changes to federal laws and regulations governing defined benefit plans could change the Company’s need to make future cash contributions.
Liquidity Management Actions
The Parent’s cash requirements consist primarily of debt service, investments in and advances to subsidiaries, operating expenses, income taxes, and dividends to preferred and common shareholders, and share repurchases.including the CPP preferred equity issued to the Treasury. The Parent’s cash needs are routinelyusually met through dividends from its subsidiaries, interest and investment income, subsidiaries’ proportionate share of current income taxes, management and other fees, bank lines, equity contributed through the exercise of stock options, commercial paper, and long-term debt and equity issuances. The subsidiaries’subsidiary banks’ primary source of funding is their core deposits. Operational cash flows, while constituting a funding source for the Company, are not large enough to provide funding in the amounts that fulfill the needs of the Parent and the bank subsidiaries.its subsidiary banks. For 2007,2009, operations contributed $733$1,058 million toward these needs. As a result, the Company utilizes other sources at its disposal to manage its liquidity needs.
Most of the Company’s subsidiary banks have seen reduced profitability or posted losses in recent quarters, and therefore are currently unable to reliably pay dividends. Also, earnings on the Parent’s investment securities portfolio have been reduced. Cash earnings from subsidiaries and investments currently do not cover the Parent’s interest and dividend payments, and the Company does not expect cash receipts from its subsidiaries and investments to cover those payments in 2010. In addition, the Parent has had to increase its investment in several of its bank subsidiaries in order to maintain capital levels appropriate to current weak economic and credit quality conditions. The Company has reduced the dividend on its common stock in several stages to $0.01 per share per quarter, in order to conserve both capital and cash. Federal Reserve Board Supervisory Letter SR 09-4, dated February 24, 2009, reiterates and expands previous guidance regarding the payment of common dividends and dividends on more senior capital instruments in times of stress on earnings and capital ratios.
General financial market and economic conditions, both of which have been highly stressed since mid-2008 or earlier, as well as the Company’s debt ratings, have adversely impacted the Company’s access to external financing. One rating agency, Moody’s, has downgraded the Company’s senior debt rating to B2, while Standard & Poors, Fitch and DBRS all rate the Company’s senior debt at a low investment grade. All of the agencies have indicated that continued high loan losses and/or losses related to the Company’s investment portfolio of CDOs could erode capital levels and cause further downgrades in the Company’s debt ratings. Additional information regarding rating agency actions may be found subsequently.
During 2007,2009, the Parent received $461$5 million in cash dividends from various subsidiaries. At December 31, 2007, the banking subsidiaries could pay $304 million of dividends to the Parent under regulatory guidelines without the need for regulatory approval. The amounts of dividends the banking subsidiaries can pay to the Parent are restricted by earnings, retained earnings, and risk-based capital requirements. The dividend capacity is dependent on the continued profitability of the subsidiary banks and no significant changes in the current regulatory environment. While we have no current expectation that these two conditions will change, should a change take place to either in the future, thisThis source of funding to the Parent may become more limited or even unavailable.unavailable if the operating performance of subsidiary banks deteriorates under continued weak economic conditions or changes in regulation or law. See Note 19 of the Notes to Consolidated Financial Statements for details of dividend capacities and limitations.
During 2009, the primary sources of cash available to the Parent in the capital markets have been (1) unsecured 1-2 year senior notes issued by the Parent, (2) issuance of new shares of common stock, (3) the FDIC’s Temporary Liquidity Guarantee Program (“TLGP”) debt program under which the Company issued its maximum allowed $254.9 million on January 21, 2009, and (4) in September 2009 and December 2009 the Company issued at a discount a total of $459 million of 7.75% unsecured senior notes which added approximately $393 million to the Parent’s cash balance. The Parent’s cash balance was $542 million at December 31, 2009 compared to $983 million at December 31, 2008.
During 2009, the Parent’s operating expenses included cash payments for interest of approximately $123 million. Additionally, the Parent paid $96 million in dividends on preferred and common stock. Note 24 of the Notes to Consolidated Financial Statements contains the Parent’s statements of income and statements of cash flows for the years ended December 31, 2009, 2008, and 2007 as well as its balance sheets at December 31, 2009 and December 31, 2008.
Additional information regarding financing actions may be found subsequently. In the summer of 2009 some other financing markets began to reopen for regional and larger banking companies, but there can be no assurance that the Company will have access to these markets at any given time.
For the year 2007,2009, issuances of medium-term and long-term debt exceeded repayments of long-term debt, resulting in net cash inflows of $21$408 million, from debt financing activities. Specific long-term debt-related activities for 2007 arenet of $62 million discount, as follows:
On March 31, 2006, the Company filed an “automatic shelf registration statement” with the Securities and Exchange Commission asIn January 2009 we issued approximately $255 million of unsecured senior floating rate notes due June 21, 2012 at a “well-known seasoned issuer.” This new typecoupon rate of shelf registration does not require us to specify a maximum amount of securities that may be issued.three-month LIBOR plus 37 basis points. The shelf registration replaced a previous shelf registration and covers securities of the Company, Zions Capital Trust C, and Zions Capital Trust D.
On December 6, 2007,debt is guaranteed under the shelf registration of March 31, 2006,FDIC’s TLGP.
In September and December 2009 we issued $295.6approximately $459 million of floating rate7.75% unsecured senior notes due December 10, 2009.September 23, 2014. The notes require quarterly interest payments at three-month LIBOR plus 1.50%. These notes are not redeemable in whole on December 10, 2008 or on any interest payment date thereafter. The proceeds from the notes were usedprior to retire portions of othermaturity.
Throughout 2009, fixed-rate senior medium-term notes were sold via the Company’s online auction process and direct sales; we issued a total of $232.0$52 million due April 15, 2008 and $8.0 million due September 15, 2008 and for general corporate purposes.of these unsecured notes that have been issued under a shelf registration filed with the SEC.
On June 6, 2007, under provisionsDuring the fourth quarter of the borrowing agreements,2009, the Company redeemed $296 million of senior notes at maturity.
In addition to the entire $19.7senior medium-term notes classified as long-term debt we issued $118 million net par amountof senior medium term notes classified as short-term debt and repaid $236 million of senior medium-term notes classified as short term debt, for a cash outflow of $118 million.
At December 31, 2009, maturities of the 11.75% trust preferred securities.
During 2007, the Company assumed other trust preferred securities totaling $32.3 millionsenior medium-term notes classified as long- and short-term debt ranged from the acquisition of Stockmen’s and Intercontinental Banks.
During 2007, the Company redeemed a portion of the other trust preferred securities totaling $15.3 million assumed in acquisitions of Stockmen’s.
May 2010 to September 2011 with rates from 5.25% to 6.00%.
See Note 13 of the Notes to Consolidated Financial Statements for a complete summary of the Company’s long-term borrowings.
On a consolidated basis, fundings fromrepayments of short-term borrowings exceeded repaymentsfundings (excluding short-term FHLB borrowings)Federal Reserve borrowings and senior medium-term notes) and resulted in a $1,079$1,086 million sourceuse of cash in 2007.2009. The Parent has a program to issue short-term commercial paperpaper; however, current market conditions have severely constrained activity in this program, and at December 31, 2007,2009, outstanding commercial paper was $298$1 million. In addition, the Parent has secured revolving credit facilities totaling $153 million with two subsidiary banks. These revolving credit facilities are limited to the amount of pledged securities the Parent holds for these credit facilities. No amount was outstanding on these facilities at December 31, 2007.
The Parent plans to arrange new borrowing lines from its banking subsidiaries that are collateralized with municipal securities owned by a subsidiary and hypothecated to the Parent. This funding source can provide up to $297 million of new borrowing capacity based on asset values as of December 31, 2007.
Access to funding markets for the Parent and subsidiary banks is directly tied to the credit ratings they receive from various rating agencies. The ratings not only influence the costs associated with the borrowings but can also influence the sources of the borrowings. The Parent and its three largest banking subsidiaries had the following ratings as of December 31, 2007:
SCHEDULE 44Schedule 49
CREDIT RATINGS
Parent Company:
Rating agency | Outlook | Long-term issuer/ senior debt rating | Subordinated debt rating | Short-term/ commercial paper rating | ||||
S&P | ||||||||
Moody’s | Negative | |||||||
Fitch | ||||||||
Dominion | ||||||||
Three Largest Banking Subsidiaries:
| ||||||||||
| ||||||||||
| Negative | |||||||||
| ||||||||||
| ||||||||||
On February 28, 2008, Moody’s downgraded its ratings
During 2009, the Company received $464 million of cash from the issuance of common stock and used $46.5 million (including expenses) of cash to tender for the Parent on long-term issuer/senior debt to A3, on subordinated debt to Baal, and on short-term/commercial paper to P-2; it also changed its outlook from Negative to Stable. Also, Moody’s downgraded its ratings for the three largest banking subsidiaries on long-term issuer/senior debt and certificate$100.5 million par value of deposit to A2, affirmed the short-term/commercial paper rating of P-1, and changed its outlook from Negative to Stable.
Series A preferred stock.
The subsidiaries’ primary source of funding is their core deposits, consisting of demand, savings and money market deposits, time deposits under $100,000, and foreign deposits. At December 31, 2007,2009, these core deposits, excluding brokered deposits, in aggregate, constituted 88.1%89.3% of consolidated deposits, compared with 87.7%81.9% of consolidated deposits at December 31, 2006.2008. The Company has also obtained brokered deposits to serve as an additional source of liquidity. At December 31, 2009, total brokered deposits were $1.6 billion, down from $3.3 billion at December 31, 2008. For 2007,2009, deposit increasesdecreases resulted in net cash inflowsoutflows of $931$2,154 million which primarily resulted from a $978 million increasedecreases in Internettime deposits and brokered deposits, partially offset by increases in noninterest-bearing demand deposits and savings and money market deposits.
On October 3, 2008, the FDIC increased deposit insurance to $250,000 through December 31, 2009 and in May 2009 extended the increased insurance coverage through December 31, 2013. The FDIC has also implemented a program to provide full deposit insurance coverage for noninterest-bearing transaction deposit accounts through December 31, 2009, unless insured banks elect to opt out of the program. On August 26, 2009 the FDIC extended this program through June 30, 2010. The Company did not opt out of this program.
The FHLB system, is alsohas, from time to time, been a significant source of liquidity for the Company’s subsidiary banks. Zions Bank and TCBW are members of the FHLB of Seattle. CB&T, NSB, and NBA are members of the FHLB of San Francisco. Vectra is a member of the FHLB of Topeka and Amegy is a member of the FHLB of Dallas. The FHLB allows member banks to borrow against their eligible loans to satisfy liquidity requirements. For 2007, the activity in short-term FHLB borrowings resulted in a net cash inflow of $2,664 million. Amounts of unused lines of credit available for additional FHLB advances totaled $3.5 billion at December 31, 2007. An additional $1.3 billion could be borrowed upon the pledging of additional available collateral. Borrowings from the FHLB may increase in the future, depending on availability of funding from other sources such as deposits. However,The subsidiary banks are required to invest in FHLB stock to maintain their borrowing capacity. The Company is aware of recent news reports and FHLB member bank press releases regarding the financial strength of the FHLB system. The Company is actively monitoring its ability to borrow from the FHLB banks and took actions in the fourth quarter of 2008 to reduce its borrowings from the FHLB banks. At December 31, 2009 and 2008, the Company did not have any short-term borrowings outstanding from the FHLB. At December 31, 2009 and 2008, the subsidiary banks must maintain theirbanks’ total investment in FHLB memberships to continue accessing this source of funding.
stock was approximately $136 million.
In December 2007, the Federal Reserve Board announced a new program, the Term Auction Facility (“TAF”), to make 28 day28-day loans to banks in the United States and to foreign banks through foreign central banks. These loans are made using an auction process. The Company’s banking subsidiaries – Zions Bank, is currently participatingCB&T, and Amegy – have participated in this new program and willmay continue to do so as long as money can be borrowed at an attractive rate. The amountAmounts that can be borrowed
is are based upon the amount of collateral that has been pledged to the Federal Reserve Bank. The Company did not have any borrowings outstanding under this program at December 31, 2009 and had $1.8 billion outstanding at December 31, 2008.
At December 31, 2007, $450 million in borrowings were outstanding at Zions Bank under this program. At December 31, 2007,2009, the amount available for additional FHLB and Federal Reserve borrowings was approximately $2.3$12.4 billion. An additional $5.7$0.7 billion could be borrowed at December 31, 2009 upon the pledging of additional available collateral.
Zions Bank has in prior years used asset securitizations to sell loans and provide a flexible alternative source of funding. As a QSPE securities conduit sponsored by Zions Bank, Lockhart has purchased and held credit-enhanced securitized assets resulting from certain small business loan securitizations. During 2009, Zions Bank providespurchased $678 million of securities from Lockhart at book value under the terms of a liquidity facility Zions Bank provided to Lockhart for a fee. Lockhart purchases floating-rate U.S. government and AAA-rated securities, including securities resulting from Zions Bank’s small business loan securitizations, with funds fromLockhart. During the issuancesecond quarter of commercial paper.
Due to the disruptions in the asset-backed commercial paper markets that began in August 2007 and continued into 2008,2009, Lockhart was unable to issue commercial paper sufficient to fund its assets andconsolidated onto the Company and its banks purchased Lockhartbooks of Zions Bank as a result of Zions Bank holding over 90% of Lockhart’s asset backed commercial paper, and held it on their balance sheets. The Companyin September 2009 Lockhart was also required to purchase assets under the Liquidity Agreement due to security ratings downgrades and the inabilityterminated. See “Termination of Lockhart to issue commercial paper. See “Off-BalanceOff-Balance Sheet Arrangements” beginningArrangement” on page 85103 for information about Lockhart and the Liquidity Agreement. This includes details of the purchase of commercial paper and securities and the possible effect on the Company’s liquidity and capital ratios if Lockhart was required to be consolidated or the Company was required to purchase its remaining securities.
While not considered a primary source of funding, the Company’s investment activities can also provide or use cash, depending on the asset-liability management posture that is being observed. For 2007,2009, investment
securities activities resulted in an increase in investment securities holdings primarily due to Zions Bank purchasing securities from Lockhart under the terms of the Liquidity Agreement and a net decrease of cash outflowsin the amount of $414$501 million.
Maturing balances in the various loan portfolios also provide additional flexibility in managing cash flows. In most cases, however, loan growth has resulted in net cash outflows from a funding standpoint. For 2007, loan growthstandpoint; however, for 2009, organic activity resulted in a net cash outflowinflow of $3.9$1.4 billion compared to $4.9a cash outflow of $2.5 billion in 2006.2008. We expect that loans will continue to be a use of funding rather than a source in 2008.continued weak loan demand during 2010.
Operational Risk Management
Operational risk is the potential for unexpected losses attributable to human error, systems failures, fraud, or inadequate internal controls and procedures. In its ongoing efforts to identify and manage operational risk, the Company has created a Corporate Risk Management Department whose responsibility is to help Company management identify and assess key risks and monitor the key internal controls and processes that the Company has in place to mitigate operational risk. We have documented controls and the Control Self Assessment related to financial reporting under Section 404 of the Sarbanes-Oxley Act of 2002 and the Federal Deposit Insurance Corporation Improvement Act of 1991.
To manage and minimize its operating risk, the Company has in place transactional documentation requirements, systems and procedures to monitor transactions and positions, regulatory compliance reviews, and periodic reviews by the Company’s internal audit and credit examination departments. In addition, reconciliation procedures have been established to ensure that data processing systems consistently and accurately capture critical data. Further, we maintain contingency plans and systems for operations support in the event of natural or other disasters. Efforts are continually underway to improve the Company’s oversight atof operational risk, including enhancement of risk-control self assessments and of antifraud measures.
CAPITAL MANAGEMENT
The Board of Directors is responsible for approving the policies associated with capital management. The Board has established the Capital Management Committee (“CMC”) whose primary responsibility is to recommend and administer the approved capital policies that govern the capital management of the Company.Company and its subsidiary banks. Other major CMC responsibilities include:
Setting overall capital targets within the Board approvedBoard-approved policy, monitoring performance and recommending changes to capital including dividends, common stock repurchases, subordinated debt, or to major strategies to maintain the Company and its bank subsidiaries at well capitalized levels; and
Reviewing agency ratings of the Parent and its bank subsidiaries and establishing target ratings.
The CMC, in managing the capital of the Company, may set capital standards that are higher than those approved by the Board, but may not set lower limits.
The Company has a fundamental financial objective to consistently produce superior risk-adjusted returns on its shareholders’ capital. We believe that a strong capital position is vital to continued profitability and to promoting depositor and investor confidence. Specifically, it is the policy of the Parent and each of the subsidiary banks to:
Maintain sufficient capital at not less than the “well capitalized” threshold as defined by federal banking regulators to support current needs and to ensure that capital is available to support anticipated growth;
Take into account the desirability of receiving an “investment grade” rating from major debt rating agencies on senior and subordinated unsecured debt when setting capital levels;
Develop capabilities to measure and manage capital on a risk-adjusted basis and to maintain economic capital consistent with an “investment grade” risk level; and
Return excess capital to shareholders through dividends and repurchases of common stock.
See Note 19 of the Notes to Consolidated Financial Statements for additional information on risk-based capital.
In December 2006,During 2009, the Company resumedtook a number of actions to raise additional capital in order to maintain a strong capital position, as follows:
On August 27, 2009, Zions Bancorporation completed its $250 million offering of shares of common stock, repurchase plan, which had been suspended since July 2005 becausecommenced on June 1, 2009. The registered sales took place through the common equity distribution program announced June 1, 2009 with Goldman, Sachs & Co. (“Goldman Sachs”) acting as sales agent. During the second quarter, Zions issued common shares for gross proceeds of $126.5 million. During the third quarter, Zions completed the offering, issuing 7,655,267 common shares at an average price of $16.13 per share, for gross proceeds of $123.5 million. The cumulative offering totaled 16,832,925 common shares at an average price of $14.85. Net of issuance costs and fees, including $4.2 million in commissions paid to Goldman Sachs, these sales added $245.5 million to common equity.
On September 17, 2009, the Company entered into a new equity distribution agreement (the “Equity Distribution Agreement”) with Goldman Sachs, pursuant to which the Company may offer and sell through or to Goldman Sachs, from time to time, shares of the Amegy acquisition. On December 11, 2006, the Board authorized a $400 million repurchase program. The Company repurchased
and retired 3,933,128 shares of itsCompany’s common stock, in 2007an aggregate amount of up to $250 million. Sales of common stock are made by means of ordinary brokers’ transactions on the Nasdaq Global Select Market or otherwise at market prices or to Goldman Sachs for resale at a price to be agreed upon by the Company and Goldman Sachs. During the period from September 17 through September 30, 2009, the Company issued $67.2 million of new common stock consisting of 3,671,000 shares at an average share price of $18.31 per share under the Equity Distribution Agreement. During the fourth quarter, Zions issued 11,237,500 common shares at an average price of $13.84 per share, for gross proceeds of $155.5 million. The cumulative offering totaled 14,908,500 common shares at an average price of $14.94. Net of issuance costs and fees, including $3.8 million in commissions paid to Goldman Sachs, these sales added $218.6 million to common equity.
| • | During the second quarter of 2009, the Company purchased 4,020,435 depositary shares (each share representing a 1/40th ownership interest in a share of preferred stock) of Series A preferred stock at a price of $11.50 per depositary share, or an aggregate amount of $46.4 million including accrued dividends. At a $25 per depositary share liquidation preference, the purchase reduced the $240 million carrying value of the Series A preferred stock by approximately $100.5 million. Net of related costs, the redemption resulted in a $54.0 million increase to common shareholders’ equity. Finally, the Company recognized $202.8 million after-tax in 2009 directly in equity for the intrinsic value of the beneficial conversion feature related to the subordinated debt modification discussed below. |
Also, as disclosed previously, during the second and fourth quarters of 2009, the Company modified $1.2 billion of subordinated notes to permit conversion on a par for par basis into either the Company’s Series A or Series C preferred stock. Net of issuance costs and debt discount on the previous debt, the pretax gain recognized in earnings from this subordinated debt modification was $508.9 million.
During the third and fourth quarters of 2009, and as a result of the subordinated debt modifications previously announced, $27.8 million and $35.6 million, respectively, of subordinated debt was converted into shares of the Company’s Series C preferred stock. This conversion accelerated the discount amortization, resulting in a $15.8 million increase to interest expense in the third quarter of 2009 and $19.9 million in the fourth quarter of 2009.
During the fourth quarter of 2009, the Company exchanged Series A preferred stock with a liquidation value of $71.5 million for 2,816,834 shares of newly issued common stock. Tangible common equity was increased by approximately the same amount.
The Company also took several actions to raise additional capital during 2008 as follows:
On November 14, 2008, the Company received a capital investment of $1.4 billion from the U.S. Department of the Treasury under the Treasury’s Capital Purchase Program announced on October 14, 2008. The capital investment is in the form of nonvoting senior preferred shares pari passu with the Company’s existing preferred shares. The Company also issued to the Treasury warrants exercisable for 10 years to purchase 5,789,909 of the Company’s common shares at a total exercise cost of $318.8$210 million. The preferred shares qualify for regulatory Tier 1 capital and may be redeemed at any time that regulatory approval can be obtained. They have a dividend rate of 5% for the first five years, increasing to 9% thereafter. Among other things, the Company is subject to restrictions and conditions including those related to common dividends, share repurchases, executive compensation, and corporate governance.
During September 2008, the Company issued $250 million andof new common stock consisting of 7,194,079 shares at an average per share price of $81.04 under$34.75 per share. Net of issuance costs and fees, this share repurchase authorization. The remaining authorized amount for share repurchases asadded $244.9 million to common equity.
| • | On July 2, 2008, the Company completed a $47 million offering of 9.50% Series C Fixed-Rate Non-Cumulative Perpetual Preferred Stock. The Company issued 46,949 shares in the form of 1,877,971 depositary shares with each depositary share representing a 1/40th ownership interest in a share of the preferred stock. Terms and conditions, except for the dividend amount, are generally similar to the existing $240 million Series A floating rate preferred stock issued in December 2006. The offering was sold via Zions’ online auction process and direct sales primarily by the Company’s broker/dealer subsidiary. |
Total controlling interest shareholders’ equity on December 31, 2009 was $5,693 million compared to $6,502 million at December 31, 2008, a decrease of 12.4%. As of December 31, 2007 was2009, the Company had $56.3 million.million of remaining authorization from its Board of Directors for the repurchase of common stock. The Company has not repurchased any shares since August 16, 2007 and suspended itsin compliance with the conditions of the CPP, the Company will not repurchase any common stock repurchase program in order to conserve capital due toshares during the continuing capital market disruptions and uncertainties regarding economic conditions in 2008. The Company does not currently expect to resume repurchasesperiod the senior preferred shares are outstanding without permission from the U.S. Department of its common stock until late 2008 or beyond, depending on economic conditions and the Company’s financial performance.Treasury.
In 2006, common stock repurchases under repurchase plans totaled 308,359 shares at a total cost of $25.0 million. The Company also repurchased $3.2 million in 2007 and $1.5 million in 2006 of shares related to the Company’s restricted stock employee compensation program.
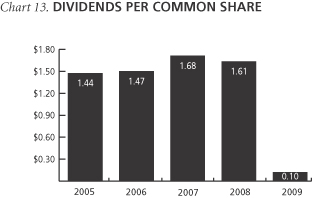
During its January 20082010 meeting, the Board of Directors declared a dividend of $0.43$0.01 per common share payable on February 20, 200824, 2010 to shareholders of record on February 6, 2008.10, 2010. This is unchanged from the rate paid during third and fourth quarters of 2009. The Company paid dividends in 20072009 of $1.68$0.10 per common share compared with $1.47$1.61 per share in 20062008 and $1.44$1.68 per share in 2005.
In 2007,2007. Under the terms of the CPP, the Company paid dividends of $181.3 million
may not increase the dividend on its common stock and used $322.0 million to repurchase common stockabove $0.32 per share per quarter during the period the senior preferred shares are outstanding without adversely impacting the Company’s interest in the program or without permission from the U.S. Department of the Company. In total, we returned to shareholders $503.3 million out of total net income of $493.7 million or 101.9%. Treasury.
The Company paid $157.0$11.9 million in dividends on common stock in 2006,2009, and used $26.5 million todid not repurchase any shares of the Company’s common stock. In total, we returned to shareholders $183.5 million out of total net income of $583.1 million, or 31.5%.

Total shareholders’ equity at December 31, 2007 increased to $5.3 billion, an increase of 6.1% over the $5.0 billion at December 31, 2006. Tangible equity including noncumulative preferred stock was $3.1 billion at the end of 2007 and $2.9 billion at the end of 2006.
On December 7, 2006, the Company issued $240 million of Depositary Shares. The 9,600,000 Depositary Shares each represent a 1/40th ownership interest in a share of Series A Floating-Rate Non-Cumulative Perpetual Preferred Stock. The issuance was priced at an annual rate equal to the greater of three-month LIBOR plus 0.52%, or 4%. The Series A Preferred Stock is not redeemable prior to December 15, 2011. On and after that date, the Series A Preferred Stock will be redeemable, in whole at any time or in part from time to time, at a redemption price equal to $1,000 per share (equivalent to $25 per depositary share), plus any declared and unpaid dividends, without accumulation of any undeclared dividends.
The Company declaredrecorded preferred stock dividends of $14.3$103.0 million during 20072009 compared to $3.8$24.4 million during 2006.2008. Preferred dividends for 2009 includes $88.6 million related to the TARP preferred stock issued to the U.S. Department of Treasury.
Schedule 50
CAPITAL RATIOS
| December 31, | Percentage required to be well capitalized | ||||||||
| 2009 | 2008 | ||||||||
Tangible common equity ratio | 6.12 | % | 5.89 | % | na | ||||
Tangible equity ratio | 9.16 | 8.91 | na | ||||||
Average equity to average assets | 10.98 | 10.36 | na | ||||||
Risk-based capital ratios: | |||||||||
Tier 1 common to risk-weighted assets | 6.73 | 6.28 | na | ||||||
Tier 1 leverage | 10.38 | 9.99 | na | 1 | |||||
Tier 1 risk-based capital | 10.53 | 10.22 | 6.00 | % | |||||
Total risk-based capital | 13.28 | 14.32 | 10.00 | ||||||
| 1 | There is no Tier 1 leverage ratio component in the definition of a well capitalized bank holding company. |
The decrease in total controlling interest shareholders’ equity from December 31, 2008 is primarily due to net losses recognized during 2009 including noncash expenses resulting from goodwill impairment, the negative impact of increased after-tax unrealized losses of $205 million on investment securities and derivatives included in OCI, and the preferred stock redemption. These decreases were offset by capital raising actions including the issuance of common stock and the effect of the subordinated debt modification.
Banking organizations are required under published regulations to maintain adequate levels of capital as measured by several regulatory capital ratios. As of December 31, 2009, the Company has stated thatand each of its long-term target for its tangible equity ratios is 6.25 - 6.50%. The Company’ssubsidiary banks exceeded the “well capitalized” guidelines under these regulatory standards.
At December 31, 2009, regulatory Tier 1 risk-based capital ratiosand total risk-based capital were as follows$5,407 million and $6,823 million compared to $5,269 million and $7,386 million at December 31, 2007 and 2006:
SCHEDULE 45
CAPITAL RATIOS
| December 31, | Percentage required to be well capitalized | |||||
| 2007 | 2006 | |||||
Tangible equity ratio | 6.17% | 6.51% | na | |||
Tangible common equity ratio | 5.70 | 5.98 | na | |||
Average equity to average assets | 10.74 | 10.19 | na | |||
Risk-based capital ratios: | ||||||
Tier 1 leverage | 7.37 | 7.86 | 5.00% | |||
Tier 1 risk-based capital | 7.57 | 7.98 | 6.00 | |||
Total risk-based capital | 11.68 | 12.29 | 10.00 | |||
The decreased capital ratios at December 31, 2007 compared to December 31, 2006 reflect the impact of the strong loan growth during the year, common stock repurchases, and the lower earnings for 2007.
2008.
The U.S. federal bank regulatory agencies’ risk-capitalrisk-based capital guidelines are based upon the 1988 capital accord (“Basel I”) of the Basel Committee on Banking Supervision (the “BCBS”). The BCBS is a committee of central banks and bank supervisors/regulators from the major industrialized countries that develops broad policy guidelines that each country’s supervisors can use to determine the supervisory policies they apply. The BCBS has been working for a number of years on revisions to Basel I. In January 2001, the BCBS released a proposal to replace Basel I with a new capital framework (“Basel II”) that would set capital requirements for operational risk and materially change the existing capital requirements for credit risk and market risk exposures. Operational risk is defined by the proposal as the risk of direct or indirect loss resulting from inadequate or failed internal processes, people and systems, or from external events. Basel I does not include separate capital requirements for operational risk.
In September 2006, theDecember 2007, U.S. banking regulators issued an interagency Advance Notice of Proposed Rulemaking (“NPR”) with regard to the U.S. implementation of the Basel II framework. Published in December 2007,published the final rule requiresfor Basel II implementation, requiring banks with over $250 billion in consolidated total assets or on-balance sheet foreign exposure of $10 billion (core banks) to adopt the Advanced Approach of Basel II while allowing other banks to elect to “opt in.” We do not currently expect
Modifications to the Basel II regime (“Basel III”) continue to be an early “opt in”proposed. Additionally, regulators may subjectively require banking organizations to maintain capital, reserves, or liquidity at levels higher than those codified by regulation or those prior to the recent economic crisis. Adoption of new Basel III requirements and/or regulatory actions may have a significant impact on bank holding company, ascapital and liquidity levels going forward.
GAAP TO NON-GAAP RECONCILIATION
Traditionally, the Company does notFederal Reserve and other banking regulators have assessed a bank’s capital adequacy based on Tier 1 capital, the calculation of which is codified in place the data collection and analytical capabilities necessary to adopt the Advanced Approach. However, we believe that the competitive advantages afforded to companies that do adopt the Advanced Approach may make it necessary for the Company to elect to “opt in” at some point, and wefederal banking regulations. Regulators have begun investingsupplementing their assessment of the capital adequacy of a bank based on a variation of Tier 1 capital, known as Tier 1 common equity. While not codified, analysts and banking regulators have assessed Zions’ capital adequacy using the Tier 1 common equity measure. Because Tier 1 common equity is not formally defined by GAAP or codified in the required capabilitiesfederal banking regulations, this measure is considered to be a non-GAAP financial measure and required data.
Also, in July 2007, the U.S.other entities may calculate them differently than Zions’ disclosed calculations. Since analysts and banking regulators agreedmay assess Zions’ capital adequacy using Tier 1 common equity, Zions believes that it is useful to issueprovide investors the ability to assess Zions’ capital adequacy on this same basis.
Tier 1 common equity is often expressed as a proposed rulepercentage of risk-weighted assets. Under the risk-based capital framework, a bank’s balance sheet assets and credit equivalent amounts of off-balance sheet items are assigned to one of four broad risk categories. The aggregated dollar amount in each category is then multiplied by the risk weighting assigned to that would provide noncore banks withcategory. The resulting weighted values from each of the optionfour categories are added together and this sum is the risk-weighted assets total that, as adjusted, comprises the denominator of adoptingcertain risk-based capital ratios. Tier 1 capital is then divided by this denominator (risk-weighted assets) to determine the Standardized Approach proposed in Basel II. This replaces the proposed Basel 1A framework, which has been withdrawn. While the Advanced Approach uses sophisticated mathematical modelsTier 1 capital ratio. Adjustments are made to measure and assignTier 1 capital to specific risks,arrive at Tier 1 common equity. Tier 1 common equity is also divided by the Standardized Approach categorizes risksrisk-weighted assets to determine the Tier 1 common equity ratio. The amounts disclosed as risk-weighted assets are calculated consistent with banking regulatory requirements.
Non-GAAP financial measures have inherent limitations, are not required to be uniformly applied and are not audited. Although this non-GAAP financial measure is frequently used by typestakeholders in the evaluation of a company, it has limitations as an analytical tool, and then assignsshould not be considered in isolation or as a substitute for analyses of results as reported under GAAP.
See Schedule 51 below which provides a reconciliation of controlling interest shareholders’ equity (GAAP) to Tier 1 capital requirements. Following the publication of the proposed rule, the Company will evaluate the benefit of adopting the Standardized Approach.
(regulatory) and to Tier 1 common equity (non-GAAP).
ITEM 7A.QUANTITATIVE AND QUALITATIVE DISCLOSURES ABOUT MARKET RISKSchedule 51
GAAP TO NON-GAAP RECONCILIATION
| December 31, | ||||||||||
| (Amounts in millions) | 2009 | 2008 | 2007 | |||||||
Controlling interest shareholders’ equity (GAAP) | $ | 5,693 | 6,501 | 5,293 | ||||||
Accumulated other comprehensive (income) loss | 437 | 99 | 59 | |||||||
Non-qualifying goodwill and intangibles | (1,129 | ) | (1,777 | ) | (2,159 | ) | ||||
Disallowed deferred tax assets | (43 | ) | – | – | ||||||
Other regulatory adjustments | 1 | (2 | ) | (45 | ) | |||||
Qualifying trust preferred securities | 448 | 448 | 448 | |||||||
Tier 1 capital (regulatory) | 5,407 | 5,269 | 3,596 | |||||||
Qualifying trust preferred securities | (448 | ) | (448 | ) | (448 | ) | ||||
Preferred stock | (1,503 | ) | (1,582 | ) | (240 | ) | ||||
Tier 1 common equity (non-GAAP) | $ | 3,456 | 3,239 | 2,908 | ||||||
Risk-weighted assets (regulatory) | $ | 51,360 | 51,565 | 47,516 | ||||||
Tier 1 common to risk-weighted assets (non-GAAP) | 6.73 | % | 6.28 | % | 6.12 | % | ||||
| ITEM 7A. | QUANTITATIVE AND QUALITATIVE DISCLOSURES ABOUT MARKET RISK |
Information required by this Item is included in “Interest Rate and Market Risk Management” in MD&A beginning on page 98116 and is hereby incorporated by reference.
ITEM 8. FINANCIAL STATEMENTS AND SUPPLEMENTARY DATA
| ITEM 8. | FINANCIAL STATEMENTS AND SUPPLEMENTARY DATA |
REPORT ON MANAGEMENT’S ASSESSMENT OF INTERNAL CONTROL OVER FINANCIAL REPORTING
The management of Zions Bancorporation and subsidiaries (“the Company”) is responsible for establishing and maintaining adequate internal control over financial reporting for the Company as defined by Exchange Act Rules 13a-15 and 15d-15.
The Company’s management has used the criteria established inInternal Control – Integrated Framework issued by the Committee of Sponsoring Organizations of the Treadway Commission (“COSO”) to evaluate the effectiveness of the Company’s internal control over financial reporting.
The Company’sAs discussed further in Item 9A., Controls and Procedures, the Company filed amended Form 10-Qs for the quarterly periods ended June 30, 2009 and September 30, 2009. In connection with these amended filings, management has assessedreassessed the effectiveness of the Company’s disclosure controls and procedures and identified a material weakness in internal control over financial reporting. Management concluded as of December 31, 2009 that the internal control over financial reporting as of December 31, 2007 and has concluded that such internal control over financial reporting iswas not effective. There are noHowever, management believes this material weaknesses inweakness was remediated when the Company’s internal control over financial reporting that have been identified by the Company’s management.
amended Form 10-Qs were filed on February 11, 2010.
Ernst & Young LLP, an independent registered public accounting firm, has audited the consolidated financial statements of the Company for the year ended December 31, 2007,2009, and has also issued an attestation report, which is included herein, on internal control over financial reporting under Auditing Standard No. 5 of the Public Company Accounting Oversight Board (“PCAOB”).
REPORTS OF INDEPENDENT REGISTERED PUBLIC ACCOUNTING FIRM
REPORT ON INTERNAL CONTROL OVER FINANCIAL REPORTING
Audit Committee of the Board of Directors and Shareholders of Zions Bancorporation
We have audited Zions Bancorporation and subsidiaries’ internal control over financial reporting as of December 31, 2007,2009, based on criteria established in Internal Control – Integrated Framework issued by the Committee of Sponsoring Organizations of the Treadway Commission (the COSO criteria). Zions Bancorporation and subsidiaries’ management is responsible for maintaining effective internal control over financial reporting, and for its assessment of the effectiveness of internal control over financial reporting included in the accompanying Report on Management’s Assessment of Internal Control over Financial Reporting. Our responsibility is to express an opinion on the company’s internal control over financial reporting based on our audit.
We conducted our audit in accordance with the standards of the Public Company Accounting Oversight Board (United States). Those standards require that we plan and perform the audit to obtain reasonable assurance about whether effective internal control over financial reporting was maintained in all material respects. Our audit included obtaining an understanding of internal control over financial reporting, assessing the risk that a material weakness exists, testing and evaluating the design and operating effectiveness of internal control based on the assessed risk, and performing such other procedures as we considered necessary in the circumstances. We believe that our audit provides a reasonable basis for our opinion.
A company’s internal control over financial reporting is a process designed to provide reasonable assurance regarding the reliability of financial reporting and the preparation of financial statements for external purposes in accordance with generally accepted accounting principles. Because management’s assessment and our audit were conducted to also meet the reporting requirements of Section 112 of the Federal Deposit Insurance Corporation Improvement Act (FDICIA), management’s assessment and our audit of Zions Bancorporation and subsidiaries’ internal control over financial reporting included controls over the preparation of financial statements in accordance with the instructions for the preparation of Consolidated Financial Statements for Bank Holding Companies (Form FR Y-9C). A company’s internal control over financial reporting includes those policies and procedures that (1) pertain to the maintenance of records that, in reasonable detail, accurately and fairly reflect the transactions and dispositions of the assets of the company; (2) provide reasonable assurance that transactions are recorded as necessary to permit preparation of financial statements in accordance with generally accepted accounting principles, and that receipts and expenditures of the company are being made only in accordance with authorizations of management and directors of the company; and (3) provide reasonable assurance regarding prevention or timely detection of unauthorized acquisition, use, or disposition of the company’s assets that could have a material effect on the financial statements.
Because of its inherent limitations, internal control over financial reporting may not prevent or detect misstatements. Also, projections of any evaluation of effectiveness to future periods are subject to the risk that controls may become inadequate because of changes in conditions, or that the degree of compliance with the policies or procedures may deteriorate.
In our opinion, Zions Bancorporation and subsidiaries maintained,A material weakness is a deficiency, or combination of deficiencies, in all material respects, effective internal control over financial reporting, assuch that there is a reasonable possibility that a material misstatement of December 31, 2007, basedthe company’s annual or interim financial statements will not be prevented or detected on a timely basis. The following material weakness has been identified and included in management’s assessment. Management has identified a material weakness in controls over the COSO criteria.
Company’s process utilized to interpret the applicable accounting literature for computing and allocating the amount attributable to the beneficial conversion feature related to the Company’s subordinated debt modification. We also have audited, in accordance with the standards of the Public Company Accounting Oversight Board (United States), the consolidated balance sheets of Zions Bancorporation and subsidiaries as of December 31, 20072009 and 2006,2008 and the related consolidated statements of income, changes in shareholders’ equity and comprehensive income, and cash flows for each of the three years in the period ended December 31, 20072009. This material weakness was considered in determining the nature, timing and extent of audit tests applied in our audit of the 2009 financial statements and this report does not affect our report dated February 28, 2008March 1, 2010, which expressed an unqualified opinion thereon.on those financial statements.
In our opinion, because of the effect of the material weakness described above on the achievement of the objectives of the control criteria, Zions Bancorporation and subsidiaries has not maintained effective internal control over financial reporting as of December 31, 2009, based on the COSO criteria.
/s/ ERNST & YOUNG LLP
Salt Lake City, Utah
February 28, 2008March 1, 2010
REPORT ON CONSOLIDATED FINANCIAL STATEMENTS
Audit Committee of the Board of Directors and Shareholders of Zions Bancorporation
We have audited the accompanying consolidated balance sheets of Zions Bancorporation and subsidiaries as of December 31, 20072009 and 2006,2008, and the related consolidated statements of income, changes in shareholders’ equity and comprehensive income, and cash flows for each of the three years in the period ended December 31, 2007.2009. These financial statements are the responsibility of the Company’s management. Our responsibility is to express an opinion on these financial statements based on our audits.
We conducted our audits in accordance with the standards of the Public Company Accounting Oversight Board (United States). Those standards require that we plan and perform the audit to obtain reasonable assurance about whether the financial statements are free of material misstatement. An audit includes examining, on a test basis, evidence supporting the amounts and disclosures in the financial statements. An audit also includes assessing the accounting principles used and significant estimates made by management, as well as evaluating the overall financial statement presentation. We believe that our audits provide a reasonable basis for our opinion.
In our opinion, the financial statements referred to above present fairly, in all material respects, the consolidated financial position of Zions Bancorporation and subsidiaries at December 31, 20072009 and 2006,2008, and the consolidated results of their operations and their cash flows for each of the three years in the period ended December 31, 2007,2009, in conformity with U.S. generally accepted accounting principles.
As discussed in Notes 1, 14, 15, and 17During 2009, the Company changed its method of accounting for impairment losses on investment securities (see Note 4 to the financial statements, Zions Bancorporationstatements), business combinations (see Notes 1 and subsidiaries adopted FASB Interpretation No. 48,Accounting for Uncertainty in Income Taxes, an interpretation of FASB Statement No. 109,during 20073 to the financial statements), and Statement of Financial Accounting Standards No. 123(R),Share-Based Payment, during 2006.
noncontrolling or minority interests (see Note 2 to the financial statements).
We also have audited, in accordance with the standards of the Public Company Accounting Oversight Board (United States), Zions Bancorporation and subsidiaries’ internal control over financial reporting as of December 31, 2007,2009, based on criteria established in Internal Control – Integrated Framework issued by the Committee of Sponsoring Organizations of the Treadway Commission and our report dated February 28, 2008March 1, 2010 expressed an unqualifiedadverse opinion thereon.
/s/ ERNST & YOUNG LLP
Salt Lake City, Utah
February 28, 2008March 1, 2010
ZIONS BANCORPORATION AND SUBSIDIARIES
DECEMBER 31, 2009 AND 2008
| (In thousands, except share amounts) | 2009 | 2008 | |||||
ASSETS | |||||||
Cash and due from banks | $ | 1,370,189 | 1,475,976 | ||||
Money market investments: | |||||||
Interest-bearing deposits and commercial paper | 652,964 | 2,332,759 | |||||
Federal funds sold | 20,985 | 83,451 | |||||
Security resell agreements | 57,556 | 286,707 | |||||
Investment securities: | |||||||
Held-to-maturity, at adjusted cost (approximate fair value $833,455 and $1,443,555) | 869,595 | 1,790,989 | |||||
Available-for-sale, at fair value | 3,655,619 | 2,676,255 | |||||
Trading account, at fair value (includes $0 and $538 transferred as collateral under repurchase agreements) | 23,543 | 42,064 | |||||
| 4,548,757 | 4,509,308 | ||||||
Loans held for sale | 208,567 | 200,318 | |||||
Loans: | |||||||
Loans and leases excluding FDIC-supported loans | 38,882,083 | 41,791,237 | |||||
FDIC-supported loans | 1,444,594 | – | |||||
| 40,326,677 | 41,791,237 | ||||||
Less: | |||||||
Unearned income and fees, net of related costs | 137,697 | 132,499 | |||||
Allowance for loan losses | 1,531,332 | 686,999 | |||||
Loans and leases, net of allowance | 38,657,648 | 40,971,739 | |||||
Other noninterest-bearing investments | 1,099,961 | 1,044,092 | |||||
Premises and equipment, net | 710,534 | 687,096 | |||||
Goodwill | 1,015,161 | 1,651,377 | |||||
Core deposit and other intangibles | 113,416 | 125,935 | |||||
Other real estate owned | 389,782 | 191,792 | |||||
Other assets | 2,277,487 | 1,532,241 | |||||
| $ | 51,123,007 | 55,092,791 | |||||
LIABILITIES AND SHAREHOLDERS’ EQUITY | |||||||
Deposits: | |||||||
Noninterest-bearing demand | $ | 12,324,247 | 9,683,385 | ||||
Interest-bearing: | |||||||
Savings and NOW | 5,843,573 | 4,452,919 | |||||
Money market | 16,378,874 | 16,826,846 | |||||
Time under $100,000 | 2,497,395 | 2,974,566 | |||||
Time $100,000 and over | 3,117,472 | 4,756,218 | |||||
Foreign | 1,679,028 | 2,622,562 | |||||
| 41,840,589 | 41,316,496 | ||||||
Securities sold, not yet purchased | 43,404 | 35,657 | |||||
Federal funds purchased | 208,669 | 965,835 | |||||
Security repurchase agreements | 577,346 | 899,751 | |||||
Other liabilities | 588,527 | 669,111 | |||||
Commercial paper | 1,084 | 15,451 | |||||
Federal Home Loan Bank advances and other borrowings: | |||||||
One year or less | 120,189 | 2,039,853 | |||||
Over one year | 15,722 | 128,253 | |||||
Long-term debt | 2,017,220 | 2,493,368 | |||||
Total liabilities | 45,412,750 | 48,563,775 | |||||
Shareholders’ equity: | |||||||
Preferred stock | 1,502,784 | 1,581,834 | |||||
Common stock, without par value; authorized 350,000,000 shares; | 3,318,417 | 2,599,916 | |||||
Retained earnings | 1,324,516 | 2,433,363 | |||||
Accumulated other comprehensive income (loss) | (436,899 | ) | (98,958 | ) | |||
Deferred compensation | (16,160 | ) | (14,459 | ) | |||
Controlling interest shareholders’ equity | 5,692,658 | 6,501,696 | |||||
Noncontrolling interests | 17,599 | 27,320 | |||||
Total shareholders’ equity | 5,710,257 | 6,529,016 | |||||
| $ | 51,123,007 | 55,092,791 | |||||
CONSOLIDATED BALANCE SHEETS
DECEMBER 31, 2007 AND 2006
| (In thousands, except share amounts) | 2007 | 2006 | |||
ASSETS | |||||
Cash and due from banks | $ | 1,855,155 | 1,938,810 | ||
Money market investments: | |||||
Interest-bearing deposits and commercial paper | 726,446 | 43,203 | |||
Federal funds sold | 102,225 | 55,658 | |||
Security resell agreements | 671,537 | 270,415 | |||
Investment securities: | |||||
Held-to-maturity, at cost (approximate fair value $702,148 and $648,828) | 704,441 | 653,124 | |||
Available-for-sale, at fair value | 5,134,610 | 5,050,907 | |||
Trading account, at fair value (includes $741 and $34,494 transferred as | 21,849 | 63,436 | |||
| 5,860,900 | 5,767,467 | ||||
Loans: | |||||
Loans held for sale | 207,943 | 252,818 | |||
Loans and leases | 39,044,163 | 34,566,118 | |||
| 39,252,106 | 34,818,936 | ||||
Less: | |||||
Unearned income and fees, net of related costs | 164,327 | 151,380 | |||
Allowance for loan losses | 459,376 | 365,150 | |||
Loans and leases, net of allowance | 38,628,403 | 34,302,406 | |||
Other noninterest-bearing investments | 1,034,412 | 1,022,383 | |||
Premises and equipment, net | 655,712 | 609,472 | |||
Goodwill | 2,009,513 | 1,900,517 | |||
Core deposit and other intangibles | 149,493 | 162,134 | |||
Other real estate owned | 15,201 | 9,250 | |||
Other assets | 1,238,417 | 888,511 | |||
| $ | 52,947,414 | 46,970,226 | |||
LIABILITIES AND SHAREHOLDERS’ EQUITY | |||||
Deposits: | |||||
Noninterest-bearing demand | $ | 9,618,300 | 10,010,310 | ||
Interest-bearing: | |||||
Savings and money market | 14,812,062 | 14,673,478 | |||
Internet money market | 2,163,014 | 1,185,409 | |||
Time under $100,000 | 2,562,363 | 2,257,967 | |||
Time $100,000 and over | 4,391,588 | 4,302,056 | |||
Foreign | 3,375,426 | 2,552,526 | |||
| 36,922,753 | 34,981,746 | ||||
Securities sold, not yet purchased | 224,269 | 175,993 | |||
Federal funds purchased | 2,463,460 | 1,993,483 | |||
Security repurchase agreements | 1,298,112 | 934,057 | |||
Other liabilities | 644,375 | 621,922 | |||
Commercial paper | 297,850 | 220,507 | |||
Federal Home Loan Bank advances and other borrowings: | |||||
One year or less | 3,181,990 | 517,925 | |||
Over one year | 127,612 | 137,058 | |||
Long-term debt | 2,463,254 | 2,357,721 | |||
Total liabilities | 47,623,675 | 41,940,412 | |||
Minority interest | 30,939 | 42,791 | |||
Shareholders’ equity: | |||||
Capital stock: | |||||
Preferred stock, without par value, authorized 3,000,000 shares: | |||||
Series A (liquidation preference $1,000 per share); | 240,000 | 240,000 | |||
Common stock, without par value; authorized 350,000,000 shares; | 2,212,237 | 2,230,303 | |||
Retained earnings | 2,910,692 | 2,602,189 | |||
Accumulated other comprehensive income (loss) | (58,835) | (75,849) | |||
Deferred compensation | (11,294) | (9,620) | |||
Total shareholders’ equity | 5,292,800 | 4,987,023 | |||
| $ | 52,947,414 | 46,970,226 | |||
See accompanying notes to consolidated financial statements.
CONSOLIDATED STATEMENTS OF INCOME
ZIONS BANCORPORATION AND SUBSIDIARIES
CONSOLIDATED STATEMENTS OF INCOME
YEARS ENDED DECEMBER 31, 2007, 20062009, 2008 AND 20052007
(In thousands, except per share amounts)
| 2007 | 2006 | 2005 | 2009 | 2008 | 2007 | |||||||||||
Interest income: | |||||||||||||||||
Interest and fees on loans | $ | 2,823,382 | 2,438,324 | 1,595,916 | $ | 2,319,301 | 2,646,112 | 2,823,382 | |||||||||
Interest on loans held for sale | 14,867 | 16,442 | 9,814 | 11,007 | 10,074 | 14,867 | |||||||||||
Lease financing | 21,683 | 18,290 | 16,079 | 19,742 | 22,099 | 21,683 | |||||||||||
Interest on money market investments | 43,699 | 24,714 | 31,682 | 7,914 | 47,780 | 43,699 | |||||||||||
Interest on securities: | |||||||||||||||||
Held-to-maturity – taxable | 8,997 | 8,861 | 7,331 | 31,064 | 62,282 | 8,997 | |||||||||||
Held-to-maturity – nontaxable | 25,150 | 22,909 | 24,005 | 23,263 | 25,368 | 25,150 | |||||||||||
Available-for-sale – taxable | 255,039 | 272,252 | 201,628 | 93,208 | 151,139 | 255,039 | |||||||||||
Available-for-sale – nontaxable | 9,200 | 8,630 | 3,931 | 7,099 | 7,170 | 9,200 | |||||||||||
Trading account | 3,309 | 7,699 | 19,870 | 2,728 | 1,875 | 3,309 | |||||||||||
Total interest income | 3,205,326 | 2,818,121 | 1,910,256 | 2,515,326 | 2,973,899 | 3,205,326 | |||||||||||
Interest expense: | |||||||||||||||||
Interest on savings and money market deposits | 479,366 | 405,269 | 220,604 | 237,977 | 370,568 | 479,366 | |||||||||||
Interest on time and foreign deposits | 472,353 | 315,569 | 119,720 | 186,707 | 342,325 | 472,353 | |||||||||||
Interest on short-term borrowings | 218,696 | 164,335 | 92,149 | 14,720 | 178,875 | 218,696 | |||||||||||
Interest on long-term borrowings | 152,959 | 168,224 | 116,433 | 178,390 | 110,485 | 152,959 | |||||||||||
Total interest expense | 1,323,374 | 1,053,397 | 548,906 | 617,794 | 1,002,253 | 1,323,374 | |||||||||||
Net interest income | 1,881,952 | 1,764,724 | 1,361,350 | 1,897,532 | 1,971,646 | 1,881,952 | |||||||||||
Provision for loan losses | 152,210 | 72,572 | 43,023 | 2,016,927 | 648,269 | 152,210 | |||||||||||
Net interest income after provision for loan losses | 1,729,742 | 1,692,152 | 1,318,327 | (119,395 | ) | 1,323,377 | 1,729,742 | ||||||||||
Noninterest income: | |||||||||||||||||
Service charges and fees on deposit accounts | 183,550 | 160,774 | 124,453 | 212,562 | 206,988 | 183,550 | |||||||||||
Loan sales and servicing income | 38,503 | 54,193 | 77,822 | ||||||||||||||
Other service charges, commissions and fees | 196,815 | 171,767 | 116,688 | 156,539 | 167,669 | 170,564 | |||||||||||
Trust and wealth management income | 36,532 | 29,970 | 22,175 | 29,949 | 37,752 | 36,532 | |||||||||||
Capital markets and foreign exchange | 50,313 | 49,898 | 43,588 | ||||||||||||||
Dividends and other investment income | 26,631 | 46,362 | 50,914 | ||||||||||||||
Loan sales and servicing income | 22,261 | 24,379 | 38,503 | ||||||||||||||
Income from securities conduit | 18,176 | 32,206 | 34,966 | 1,118 | 5,502 | 18,176 | |||||||||||
Dividends and other investment income | 50,914 | 39,918 | 30,040 | ||||||||||||||
Trading and nonhedge derivative income | 3,081 | 18,501 | 15,714 | ||||||||||||||
Fair value and nonhedge derivative income (loss) | 113,779 | (47,976 | ) | (14,256 | ) | ||||||||||||
Equity securities gains (losses), net | 17,719 | 17,841 | (1,312) | (1,825 | ) | 793 | 17,719 | ||||||||||
Fixed income securities gains, net | 3,019 | 6,416 | 2,462 | ||||||||||||||
Impairment losses on available-for-sale securities and valuation losses on securities purchased from Lockhart Funding | (158,208) | – | (1,617) | ||||||||||||||
Fixed income securities gains (losses), net | (3,846 | ) | 849 | 3,019 | |||||||||||||
Impairment losses on investment securities: | |||||||||||||||||
Impairment losses on investment securities | (569,866 | ) | (304,040 | ) | (108,624 | ) | |||||||||||
Noncredit-related losses on securities not expected to be sold | 289,403 | – | – | ||||||||||||||
Net impairment losses on investment securities | (280,463 | ) | (304,040 | ) | (108,624 | ) | |||||||||||
Valuation losses on securities purchased | (212,092 | ) | (13,072 | ) | (49,584 | ) | |||||||||||
Gain on subordinated debt modification | 508,945 | – | – | ||||||||||||||
Acquisition related gains | 169,186 | – | – | ||||||||||||||
Other | 22,243 | 19,623 | 15,562 | 11,044 | 15,588 | 22,243 | |||||||||||
Total noninterest income | 412,344 | 551,209 | 436,953 | 804,101 | 190,692 | 412,344 | |||||||||||
Noninterest expense: | |||||||||||||||||
Salaries and employee benefits | 799,884 | 751,679 | 573,902 | 818,837 | 810,501 | 799,884 | |||||||||||
Occupancy, net | 107,438 | 99,607 | 77,393 | 112,201 | 114,175 | 107,438 | |||||||||||
Furniture and equipment | 96,452 | 88,725 | 68,190 | 99,878 | 100,136 | 96,452 | |||||||||||
Other real estate expense | 110,800 | 50,378 | 4,391 | ||||||||||||||
Legal and professional services | 43,829 | 40,134 | 34,804 | 37,197 | 45,517 | 43,829 | |||||||||||
Postage and supplies | 36,512 | 33,076 | 26,839 | 32,005 | 37,455 | 36,512 | |||||||||||
Advertising | 26,920 | 26,465 | 21,364 | 22,982 | 30,731 | 26,920 | |||||||||||
Debt extinguishment cost | 89 | 7,261 | – | ||||||||||||||
Impairment losses on long-lived assets | – | 1,304 | 3,133 | ||||||||||||||
Restructuring charges | – | 17 | 2,443 | ||||||||||||||
Merger related expense | 5,266 | 20,461 | 3,310 | ||||||||||||||
FDIC premiums | 100,517 | 19,858 | 6,514 | ||||||||||||||
Amortization of core deposit and other intangibles | 44,895 | 43,000 | 16,905 | 31,674 | 33,162 | 44,895 | |||||||||||
Provision for unfunded lending commitments | 1,836 | 1,248 | 3,425 | 65,511 | 1,467 | 1,836 | |||||||||||
Other | 241,467 | 217,460 | 181,083 | 239,908 | 231,583 | 235,917 | |||||||||||
Total noninterest expense | 1,404,588 | 1,330,437 | 1,012,791 | 1,671,510 | 1,474,963 | 1,404,588 | |||||||||||
Impairment loss on goodwill | – | – | 602 | 636,216 | 353,804 | – | |||||||||||
Income before income taxes and minority interest | 737,498 | 912,924 | 741,887 | ||||||||||||||
Income taxes | 235,737 | 317,950 | 263,418 | ||||||||||||||
Minority interest | 8,016 | 11,849 | (1,652) | ||||||||||||||
Income (loss) before income taxes (benefit) | (1,623,020 | ) | (314,698 | ) | 737,498 | ||||||||||||
Income taxes (benefit) | (401,343 | ) | (43,365 | ) | 235,737 | ||||||||||||
Net income | 493,745 | 583,125 | 480,121 | ||||||||||||||
Preferred stock dividend | 14,323 | 3,835 | – | ||||||||||||||
Net income (loss) | (1,221,677 | ) | (271,333 | ) | 501,761 | ||||||||||||
Net income (loss) applicable to noncontrolling interests | (5,566 | ) | (5,064 | ) | 8,016 | ||||||||||||
Net earnings applicable to common shareholders | $ | 479,422 | 579,290 | 480,121 | |||||||||||||
Net income (loss) applicable to controlling interest | (1,216,111 | ) | (266,269 | ) | 493,745 | ||||||||||||
Preferred stock dividends | (102,969 | ) | (24,424 | ) | (14,323 | ) | |||||||||||
Preferred stock redemption and conversion | 84,633 | – | – | ||||||||||||||
Net earnings (loss) applicable to common shareholders | $ | (1,234,447 | ) | (290,693 | ) | 479,422 | |||||||||||
Weighted average common shares outstanding during the year: | |||||||||||||||||
Basic shares | 107,365 | 106,057 | 91,187 | 124,443 | 108,908 | 107,365 | |||||||||||
Diluted shares | 108,523 | 108,028 | 92,994 | 124,443 | 108,908 | 108,408 | |||||||||||
Net earnings per common share: | |||||||||||||||||
Net earnings (loss) per common share: | |||||||||||||||||
Basic | $ | 4.47 | 5.46 | 5.27 | $ | (9.92 | ) | (2.68 | ) | 4.45 | |||||||
Diluted | 4.42 | 5.36 | 5.16 | (9.92 | ) | (2.68 | ) | 4.40 | |||||||||
See accompanying notes to consolidated financial statements.
ZIONS BANCORPORATION AND SUBSIDIARIES
CONSOLIDATED STATEMENTS OF CHANGES IN SHAREHOLDERS’ EQUITY AND
COMPREHENSIVE INCOME
ZIONS BANCORPORATION AND SUBSIDIARIES
YEARS ENDED DECEMBER 31, 2007, 20062009, 2008 AND 20052007
(In thousands, except share and per share amounts)
| Preferred stock | Common stock | Retained earnings | Accumulated other comprehensive income (loss) | Deferred compensation | Total shareholders’ equity | Preferred stock | Common stock | Retained earnings | Accumulated other comprehensive income (loss) | Deferred compensation | Noncontrolling interests | Total shareholders’ equity | ||||||||||||||||||||||||||||
| Shares | Amount | Shares | Amount | ||||||||||||||||||||||||||||||||||||||
Balance, December 31, 2004 | $ | – | 89,829,947 | $ | 972,065 | 1,830,064 | (7,932) | (4,218) | 2,789,979 | ||||||||||||||||||||||||||||||||
BALANCE, DECEMBER 31, 2006 | $ | 240,000 | 106,720,884 | $ | 2,230,303 | 2,602,189 | (75,849 | ) | (9,620 | ) | 42,791 | 5,029,814 | |||||||||||||||||||||||||||||
Cumulative effect of change in accounting principle, adoption of new guidance under ASC 740 related to accounting for uncertainty in income taxes | 10,408 | 10,408 | |||||||||||||||||||||||||||||||||||||||
Comprehensive income: | |||||||||||||||||||||||||||||||||||||||||
Net income | 480,121 | 480,121 | 493,745 | 8,016 | 501,761 | ||||||||||||||||||||||||||||||||||||
Other comprehensive loss, net of tax: | |||||||||||||||||||||||||||||||||||||||||
Net realized and unrealized holding losses on investments and retained interests | (28,380) | ||||||||||||||||||||||||||||||||||||||||
Foreign currency translation | (1,507) | ||||||||||||||||||||||||||||||||||||||||
Reclassification for net realized gains on investments recorded in operations | (659) | ||||||||||||||||||||||||||||||||||||||||
Net unrealized losses on derivative instruments | (40,771) | ||||||||||||||||||||||||||||||||||||||||
Minimum pension liability | (3,794) | ||||||||||||||||||||||||||||||||||||||||
Other comprehensive loss | (75,111) | (75,111) | |||||||||||||||||||||||||||||||||||||||
Total comprehensive income | 405,010 | ||||||||||||||||||||||||||||||||||||||||
Stock redeemed and retired | (1,178,880) | (82,211) | (82,211) | ||||||||||||||||||||||||||||||||||||||
Net stock options exercised and restricted stock issued | 2,001,876 | 113,290 | 113,290 | ||||||||||||||||||||||||||||||||||||||
Common and restricted stock issued and stock options assumed in acquisition | 14,494,619 | 1,153,588 | (3,906) | 1,149,682 | |||||||||||||||||||||||||||||||||||||
Cash dividends on common stock, $1.44 per share | (130,300) | (130,300) | |||||||||||||||||||||||||||||||||||||||
Change in deferred compensation | (8,186) | (8,186) | |||||||||||||||||||||||||||||||||||||||
Balance, December 31, 2005 | – | 105,147,562 | 2,156,732 | 2,179,885 | (83,043) | (16,310) | 4,237,264 | ||||||||||||||||||||||||||||||||||
Comprehensive income: | |||||||||||||||||||||||||||||||||||||||||
Net income | 583,125 | 583,125 | |||||||||||||||||||||||||||||||||||||||
Other comprehensive income, net of tax: | |||||||||||||||||||||||||||||||||||||||||
Net realized and unrealized holding losses on investments and retained interests | (7,684) | ||||||||||||||||||||||||||||||||||||||||
Foreign currency translation | 715 | ||||||||||||||||||||||||||||||||||||||||
Reclassification for net realized gains on investments recorded in operations | (630) | ||||||||||||||||||||||||||||||||||||||||
Net unrealized gains on derivative instruments | 8,548 | ||||||||||||||||||||||||||||||||||||||||
Pension and postretirement | 6,245 | ||||||||||||||||||||||||||||||||||||||||
Other comprehensive income | 7,194 | 7,194 | |||||||||||||||||||||||||||||||||||||||
Total comprehensive income | 590,319 | ||||||||||||||||||||||||||||||||||||||||
Issuance of preferred stock | 240,000 | (4,167) | 235,833 | ||||||||||||||||||||||||||||||||||||||
Stock redeemed and retired | (326,639) | (26,483) | (26,483) | ||||||||||||||||||||||||||||||||||||||
Net stock options exercised and restricted stock issued | 1,899,961 | 91,647 | 91,647 | ||||||||||||||||||||||||||||||||||||||
Reclassification of deferred compensation, adoption of SFAS 123R | (11,111) | 11,111 | – | ||||||||||||||||||||||||||||||||||||||
Share-based compensation | 23,685 | 23,685 | |||||||||||||||||||||||||||||||||||||||
Dividends declared on preferred stock | (3,835) | (3,835) | |||||||||||||||||||||||||||||||||||||||
Cash dividends on common stock, $1.47 per share | (156,986) | (156,986) | |||||||||||||||||||||||||||||||||||||||
Change in deferred compensation | (4,421) | (4,421) | |||||||||||||||||||||||||||||||||||||||
Balance, December 31, 2006 | 240,000 | 106,720,884 | 2,230,303 | 2,602,189 | (75,849) | (9,620) | 4,987,023 | ||||||||||||||||||||||||||||||||||
Cumulative effect of change in accounting principle, adoption of FIN 48 | 10,408 | 10,408 | |||||||||||||||||||||||||||||||||||||||
Comprehensive income: | |||||||||||||||||||||||||||||||||||||||||
Net income | 493,745 | 493,745 | |||||||||||||||||||||||||||||||||||||||
Other comprehensive income, net of tax: | |||||||||||||||||||||||||||||||||||||||||
Other comprehensive income (loss), net of tax: | |||||||||||||||||||||||||||||||||||||||||
Net realized and unrealized holding losses on investments and retained interests | (181,815) | (151,200 | ) | ||||||||||||||||||||||||||||||||||||||
Foreign currency translation | (6) | (6 | ) | ||||||||||||||||||||||||||||||||||||||
Reclassification for net realized losses on investments recorded in operations | 91,426 | 60,811 | |||||||||||||||||||||||||||||||||||||||
Net unrealized gains on derivative instruments | 106,929 | 106,929 | |||||||||||||||||||||||||||||||||||||||
Pension and postretirement | 480 | 480 | |||||||||||||||||||||||||||||||||||||||
Other comprehensive income | 17,014 | 17,014 | 17,014 | 17,014 | |||||||||||||||||||||||||||||||||||||
Total comprehensive income | 510,759 | 518,775 | |||||||||||||||||||||||||||||||||||||||
Common stock issued in acquisition | 2,600,117 | 206,075 | 206,075 | ||||||||||||||||||||||||||||||||||||||
Stock redeemed and retired | (3,973,234) | (322,025) | (322,025) | (3,933,128 | ) | (318,756 | ) | (318,756 | ) | ||||||||||||||||||||||||||||||||
Net stock options exercised and restricted stock issued | 1,768,738 | 70,278 | 70,278 | ||||||||||||||||||||||||||||||||||||||
Common stock issued in acquisition | 2,600,117 | 206,075 | 206,075 | ||||||||||||||||||||||||||||||||||||||
Share-based compensation | 27,606 | 27,606 | |||||||||||||||||||||||||||||||||||||||
Net stock issued under employee plans and related tax benefits | 1,728,632 | 94,615 | 94,615 | ||||||||||||||||||||||||||||||||||||||
Dividends declared on preferred stock | (14,323) | (14,323) | (14,323 | ) | (14,323 | ) | |||||||||||||||||||||||||||||||||||
Cash dividends on common stock, $1.68 per share | (181,327) | (181,327) | (181,327 | ) | (181,327 | ) | |||||||||||||||||||||||||||||||||||
Change in deferred compensation | (1,674) | (1,674) | (1,674 | ) | (1,674 | ) | |||||||||||||||||||||||||||||||||||
Other changes in noncontrolling interests | (19,868 | ) | (19,868 | ) | |||||||||||||||||||||||||||||||||||||
Balance, December 31, 2007 | $ | 240,000 | 107,116,505 | $ | 2,212,237 | 2,910,692 | (58,835) | (11,294) | 5,292,800 | ||||||||||||||||||||||||||||||||
BALANCE, DECEMBER 31, 2007 | 240,000 | 107,116,505 | 2,212,237 | 2,910,692 | (58,835 | ) | (11,294 | ) | 30,939 | 5,323,739 | |||||||||||||||||||||||||||||||
Cumulative effect of change in accounting principle, adoption of fair value option under ASC 825 | (11,471 | ) | 11,471 | – | |||||||||||||||||||||||||||||||||||||
Comprehensive loss: | |||||||||||||||||||||||||||||||||||||||||
Net loss | (266,269 | ) | (5,064 | ) | (271,333 | ) | |||||||||||||||||||||||||||||||||||
Other comprehensive income (loss), net of tax: | |||||||||||||||||||||||||||||||||||||||||
Net realized and unrealized holding losses on investments and retained interests | (333,095 | ) | |||||||||||||||||||||||||||||||||||||||
Foreign currency translation | (5 | ) | |||||||||||||||||||||||||||||||||||||||
Reclassification for net realized losses on investments recorded in operations | 181,524 | ||||||||||||||||||||||||||||||||||||||||
Net unrealized gains on derivative instruments | 131,443 | ||||||||||||||||||||||||||||||||||||||||
Pension and postretirement | (31,461 | ) | |||||||||||||||||||||||||||||||||||||||
Other comprehensive loss | (51,594 | ) | (51,594 | ) | |||||||||||||||||||||||||||||||||||||
Total comprehensive loss | (322,927 | ) | |||||||||||||||||||||||||||||||||||||||
Issuance of preferred stock | 1,339,185 | (580 | ) | 1,338,605 | |||||||||||||||||||||||||||||||||||||
Issuance of common stock and warrant | 7,194,079 | 352,653 | 352,653 | ||||||||||||||||||||||||||||||||||||||
Stock issued under dividend reinvestment plan | 39,857 | 1,261 | 1,261 | ||||||||||||||||||||||||||||||||||||||
Net stock issued under employee plans and related tax benefits | 994,372 | 34,345 | 34,345 | ||||||||||||||||||||||||||||||||||||||
Dividends on preferred stock | 2,649 | (24,424 | ) | (21,775 | ) | ||||||||||||||||||||||||||||||||||||
Dividends on common stock, $1.61 per share | (175,165 | ) | (175,165 | ) | |||||||||||||||||||||||||||||||||||||
Change in deferred compensation | (3,165 | ) | (3,165 | ) | |||||||||||||||||||||||||||||||||||||
Other changes in noncontrolling interests | 1,445 | 1,445 | |||||||||||||||||||||||||||||||||||||||
BALANCE, DECEMBER 31, 2008 | 1,581,834 | 115,344,813 | 2,599,916 | 2,433,363 | (98,958 | ) | (14,459 | ) | 27,320 | 6,529,016 | |||||||||||||||||||||||||||||||
CONSOLIDATED STATEMENTS OF CHANGES IN SHAREHOLDERS’ EQUITY AND COMPREHENSIVE INCOME(CONTINUED)
ZIONS BANCORPORATION AND SUBSIDIARIES
YEARS ENDED DECEMBER 31, 2009, 2008 AND 2007
(In thousands, except shareand per | Preferred stock | Common stock | Retained earnings | Accumulated other comprehensive income (loss) | Deferred compensation | Noncontrolling interests | Total shareholders’ equity | ||||||||||||||||||
| Shares | Amount | ||||||||||||||||||||||||
Cumulative effect of change in accounting principle, adoption of new OTTI guidance under ASC 320 | 137,462 | (137,462 | ) | – | |||||||||||||||||||||
Comprehensive loss: | |||||||||||||||||||||||||
Net loss | (1,216,111 | ) | (5,566 | ) | (1,221,677 | ) | |||||||||||||||||||
Other comprehensive income (loss), net of tax: | |||||||||||||||||||||||||
Net realized and unrealized holding losses on investments and retained interests | (65,037 | ) | |||||||||||||||||||||||
Reclassification for net realized losses on investments recorded in operations | 162,206 | ||||||||||||||||||||||||
Noncredit-related impairment losses on securities not expected to be sold | (174,244 | ) | |||||||||||||||||||||||
Accretion of securities with noncredit-related impairment losses not expected to be sold | 996 | ||||||||||||||||||||||||
Net unrealized losses on derivative instruments | (128,597 | ) | |||||||||||||||||||||||
Pension and postretirement | 4,197 | ||||||||||||||||||||||||
Other comprehensive loss | (200,479 | ) | (200,479 | ) | |||||||||||||||||||||
Total comprehensive loss | (1,422,156 | ) | |||||||||||||||||||||||
Preferred stock redemption | (100,511 | ) | 1,763 | 52,266 | (46,482 | ) | |||||||||||||||||||
Preferred stock converted to common stock | (71,537 | ) | 2,816,834 | 38,486 | 32,367 | (684 | ) | ||||||||||||||||||
Subordinated debt converted to preferred stock | 74,438 | (10,999 | ) | 63,439 | |||||||||||||||||||||
Issuance of common stock | 31,741,425 | 464,110 | 464,110 | ||||||||||||||||||||||
Subordinated debt modification | 202,814 | 202,814 | |||||||||||||||||||||||
Net stock issued under employee plans and related tax benefits | 521,998 | 22,327 | 22,327 | ||||||||||||||||||||||
Dividends on preferred stock | 18,560 | (102,969 | ) | (84,409 | ) | ||||||||||||||||||||
Dividends on common stock, $0.10 per share | (11,862 | ) | (11,862 | ) | |||||||||||||||||||||
Change in deferred compensation | (1,701 | ) | (1,701 | ) | |||||||||||||||||||||
Other changes in noncontrolling interests | (4,155 | ) | (4,155 | ) | |||||||||||||||||||||
BALANCE, DECEMBER 31, 2009 | $ | 1,502,784 | 150,425,070 | $ | 3,318,417 | 1,324,516 | (436,899 | ) | (16,160 | ) | 17,599 | 5,710,257 | |||||||||||||
See accompanying notes to consolidated financial statements.
ZIONS BANCORPORATION AND SUBSIDIARIES
CONSOLIDATED STATEMENTS OF CASH FLOWS
ZIONS BANCORPORATION AND SUBSIDIARIES
YEARS ENDED DECEMBER 31, 2007, 20062009, 2008 AND 20052007
| (In thousands) | 2007 | 2006 | 2005 | 2009 | 2008 | 2007 | |||||||||||
CASH FLOWS FROM OPERATING ACTIVITIES: | |||||||||||||||||
Net income | $ | 493,745 | 583,125 | 480,121 | |||||||||||||
Adjustments to reconcile net income to net cash provided by operating activities: | |||||||||||||||||
Impairment and valuation losses on securities, goodwill and long lived assets | 158,208 | 1,304 | 5,352 | ||||||||||||||
Net income (loss) | $ | (1,221,677 | ) | (271,333 | ) | 501,761 | |||||||||||
Adjustments to reconcile net income (loss) to net cash provided by operating activities: | |||||||||||||||||
Impairment and valuation losses on investment securities, goodwill, and | 1,128,771 | 674,050 | 158,208 | ||||||||||||||
Gain on subordinated debt modification | (508,945 | ) | – | – | |||||||||||||
Acquisition related gains | (169,186 | ) | – | – | |||||||||||||
Debt extinguishment cost | 89 | 7,261 | – | 5,256 | – | 89 | |||||||||||
Provision for loan losses | 152,210 | 72,572 | 43,023 | ||||||||||||||
Provision for credit losses | 2,082,438 | 649,736 | 154,046 | ||||||||||||||
Depreciation of premises and equipment | 76,436 | 75,603 | 61,163 | 74,097 | 73,166 | 76,436 | |||||||||||
Amortization | 48,537 | 49,445 | 39,504 | 138,943 | 67,035 | 48,537 | |||||||||||
Deferred income tax expense (benefit) | (158,702) | 9,368 | (32,362) | ||||||||||||||
Deferred income tax benefit | (15,071 | ) | (231,241 | ) | (158,702 | ) | |||||||||||
Share-based compensation | 28,274 | 24,358 | – | 29,789 | 31,850 | 28,274 | |||||||||||
Excess tax benefits from share-based compensation | (11,815) | (14,689) | – | (36 | ) | (1,059 | ) | (11,815 | ) | ||||||||
Gain (loss) allocated to minority interest | 8,016 | 11,849 | (1,652) | ||||||||||||||
Equity securities losses (gains), net | (17,719) | (17,841) | 1,312 | 1,825 | (793 | ) | (17,719 | ) | |||||||||
Fixed income securities gains, net | (3,019) | (6,416) | (2,462) | ||||||||||||||
Net decrease in trading securities | 41,587 | 38,126 | 188,508 | ||||||||||||||
Fixed income securities losses (gains), net | 3,846 | (849 | ) | (3,019 | ) | ||||||||||||
Net decrease (increase) in trading securities | 18,521 | (12,114 | ) | 41,587 | |||||||||||||
Principal payments on and proceeds from sales of loans held for sale | 1,166,724 | 1,150,692 | 987,324 | 2,013,464 | 1,125,840 | 1,166,724 | |||||||||||
Additions to loans held for sale | (1,230,790) | (1,119,723) | (911,287) | ||||||||||||||
Originations of loans held for sale | (2,013,860 | ) | (1,135,131 | ) | (1,230,790 | ) | |||||||||||
Net write-down of and losses from sales of other real estate owned | 92,920 | 45,858 | 3,448 | ||||||||||||||
Net gains on sales of loans, leases and other assets | (17,243) | (26,548) | (50,191) | (15,364 | ) | (16,620 | ) | (20,691 | ) | ||||||||
Income from increase in cash surrender value of bank-owned life insurance | (26,560) | (26,638) | (18,921) | (24,284 | ) | (25,236 | ) | (26,560 | ) | ||||||||
Change in accrued income taxes | 20,176 | 27,305 | 15,611 | (270,478 | ) | (128,793 | ) | 20,176 | |||||||||
Change in accrued interest receivable | (7,521) | (42,498) | (22,922) | 56,807 | 34,288 | (7,521 | ) | ||||||||||
Change in other assets | 44,177 | 89,164 | (98,903) | (203,529 | ) | 307,783 | 44,177 | ||||||||||
Change in other liabilities | (7,697) | 114,288 | 65,505 | (126,168 | ) | 7,448 | (9,533 | ) | |||||||||
Change in accrued interest payable | (3,576) | 31,020 | 10,085 | (26,508 | ) | (10,765 | ) | (3,576 | ) | ||||||||
Other, net | (20,637) | 8,155 | (4,614) | 6,327 | (9,171 | ) | (20,637 | ) | |||||||||
Net cash provided by operating activities | 732,900 | 1,039,282 | 754,194 | 1,057,898 | 1,173,949 | 732,900 | |||||||||||
CASH FLOWS FROM INVESTING ACTIVITIES: | |||||||||||||||||
Net decrease (increase) in money market investments | (829,632) | 297,466 | 89,273 | 1,975,107 | (1,202,709 | ) | (829,632 | ) | |||||||||
Proceeds from maturities of investment securities held-to-maturity | 112,670 | 128,358 | 129,916 | ||||||||||||||
Proceeds from maturities and paydowns of investment securities held-to-maturity | 166,808 | 98,924 | 112,670 | ||||||||||||||
Purchases of investment securities held-to-maturity | (140,460) | (131,356) | (137,844) | (76,322 | ) | (128,570 | ) | (140,460 | ) | ||||||||
Proceeds from sales of investment securities available-for-sale | 795,915 | 671,706 | 601,836 | 751,199 | 575,811 | 795,915 | |||||||||||
Proceeds from maturities of investment securities available-for-sale | 3,355,414 | 2,338,383 | 882,576 | ||||||||||||||
Proceeds from maturities and paydowns of investment securities available-for-sale | 509,716 | 3,308,703 | 3,355,414 | ||||||||||||||
Purchases of investment securities available-for-sale | (4,537,371) | (2,777,647) | (1,327,688) | (1,852,711 | ) | (3,009,274 | ) | (4,537,371 | ) | ||||||||
Proceeds from sales of loans and leases | 68,579 | 218,104 | 1,200,692 | 104,304 | 294,480 | 68,579 | |||||||||||
Net increase in loans and leases | (3,907,965) | (4,855,115) | (3,619,401) | ||||||||||||||
Securitized loans purchased | – | (1,186,188 | ) | – | |||||||||||||
Loan and lease originations, net of collections | 1,412,754 | (2,482,320 | ) | (3,907,965 | ) | ||||||||||||
Net decrease (increase) in other noninterest-bearing investments | 62,234 | (28,864) | (15,294) | (18,274 | ) | (674 | ) | 62,234 | |||||||||
Proceeds from sales of premises and equipment and other assets | 12,137 | 3,632 | 5,331 | 6,212 | 12,148 | 12,137 | |||||||||||
Purchases of premises and equipment | (103,223) | (122,432) | (67,995) | (103,347 | ) | (114,164 | ) | (103,223 | ) | ||||||||
Proceeds from sales of other real estate owned | 9,977 | 39,607 | 16,768 | 315,229 | 72,629 | 9,977 | |||||||||||
Net cash received from (paid for) acquisitions | 27,263 | (13,145) | (173,642) | ||||||||||||||
Net cash received (paid) for net assets/liabilities on branches sold | 11,174 | – | (16,076) | ||||||||||||||
Net cash received from acquisitions | 452,192 | 688,940 | 27,263 | ||||||||||||||
Net cash received for net assets/liabilities on branches sold | – | – | 11,174 | ||||||||||||||
Net cash received from sale of subsidiary | 6,995 | – | – | – | – | 6,995 | |||||||||||
Net cash used in investing activities | (5,056,293) | (4,231,303) | (2,431,548) | ||||||||||||||
Net cash provided by (used in) investing activities | 3,642,867 | (3,072,264 | ) | (5,056,293 | ) | ||||||||||||
ZIONS BANCORPORATION AND SUBSIDIARIES
CONSOLIDATED STATEMENTS OF CASH FLOWS(CONTINUED)
ZIONS BANCORPORATION AND SUBSIDIARIES
YEARS ENDED DECEMBER 31, 2007, 20062009, 2008 AND 20052007
| (In thousands) | 2007 | 2006 | 2005 | 2009 | 2008 | 2007 | |||||||||||
CASH FLOWS FROM FINANCING ACTIVITIES: | |||||||||||||||||
Net increase in deposits | $ | 931,098 | 2,339,338 | 2,995,165 | |||||||||||||
Net increase (decrease) in deposits | $ | (2,154,495 | ) | 3,661,680 | 931,098 | ||||||||||||
Net change in short-term funds borrowed | 3,743,292 | 1,182,425 | (933,191) | (3,007,062 | ) | (3,509,300 | ) | 3,743,292 | |||||||||
Repayments of FHLB advances over 90 days and up to one year | (236,811 | ) | – | – | |||||||||||||
Proceeds from FHLB advances and other borrowings over one year | – | 4,962 | 3,285 | 90 | 3,500 | – | |||||||||||
Payments on FHLB advances and other borrowings over one year | (9,446) | (102,392) | (2,233) | ||||||||||||||
Repayments of FHLB advances and other borrowings over one year | (112,621 | ) | (2,859 | ) | (9,446 | ) | |||||||||||
Proceeds from issuance of long-term debt | 296,289 | 395,000 | 595,134 | 703,932 | 28,495 | 296,289 | |||||||||||
Debt issuance costs | (62) | (597) | (3,468) | ||||||||||||||
Payments on long-term debt | (274,957) | (529,963) | (35) | ||||||||||||||
Debt extinguishment cost | (89) | (7,261) | – | ||||||||||||||
Debt issuance and extinguishment costs | (23,010 | ) | (675 | ) | (151 | ) | |||||||||||
Repayments of long-term debt | (295,910 | ) | (157,111 | ) | (274,957 | ) | |||||||||||
Proceeds from issuance of preferred stock | – | 235,833 | – | – | 1,338,605 | – | |||||||||||
Proceeds from issuance of common stock | 59,473 | 79,511 | 90,800 | ||||||||||||||
Payments to redeem preferred stock | (47,166 | ) | – | – | |||||||||||||
Proceeds from issuance of common stock and warrant | 464,110 | 354,302 | 59,473 | ||||||||||||||
Payments to redeem common stock | (322,025) | (26,483) | (82,211) | (1,374 | ) | (2,881 | ) | (322,025 | ) | ||||||||
Excess tax benefits from share-based compensation | 11,815 | 14,689 | – | 36 | 1,059 | 11,815 | |||||||||||
Dividends paid on preferred stock | (14,323) | (3,835) | – | (84,408 | ) | (21,775 | ) | (14,323 | ) | ||||||||
Dividends paid on common stock | (181,327) | (156,986) | (130,300) | (11,863 | ) | (173,904 | ) | (181,327 | ) | ||||||||
Net cash provided by financing activities | 4,239,738 | 3,424,241 | 2,532,946 | ||||||||||||||
Net cash provided by (used in) financing activities | (4,806,552 | ) | 1,519,136 | 4,239,738 | |||||||||||||
Net increase (decrease) in cash and due from banks | (83,655) | 232,220 | 855,592 | ||||||||||||||
Net decrease in cash and due from banks | (105,787 | ) | (379,179 | ) | (83,655 | ) | |||||||||||
Cash and due from banks at beginning of year | 1,938,810 | 1,706,590 | 850,998 | 1,475,976 | 1,855,155 | 1,938,810 | |||||||||||
Cash and due from banks at end of year | $ | 1,855,155 | 1,938,810 | 1,706,590 | $ | 1,370,189 | 1,475,976 | 1,855,155 | |||||||||
SUPPLEMENTAL DISCLOSURES OF CASH FLOW INFORMATION: | |||||||||||||||||
Cash paid for: | |||||||||||||||||
Interest | $ | 1,318,356 | 1,022,260 | 529,010 | $ | 577,799 | 1,011,719 | 1,318,356 | |||||||||
Income taxes | 355,685 | 273,154 | 257,850 | ||||||||||||||
Net payment made (cash refund received) for income taxes | (131,187 | ) | 303,180 | 355,685 | |||||||||||||
Noncash items: | |||||||||||||||||
Loans transferred to securities resulting from securitizations | – | – | 42,431 | ||||||||||||||
Amortized cost of investment securities held-to-maturity transferred to | 1,058,159 | – | – | ||||||||||||||
Fair value of investment securities available-for-sale transferred to | – | 1,231,979 | – | ||||||||||||||
Loans transferred to other real estate owned | 22,701 | 29,342 | 17,127 | 553,415 | 297,228 | 22,701 | |||||||||||
Beneficial conversion feature of modified subordinated debt allocated to | 202,814 | – | – | ||||||||||||||
Subordinated debt converted to preferred stock | 63,439 | – | – | ||||||||||||||
Preferred stock converted to common stock | 38,486 | – | – | ||||||||||||||
Acquisitions: | |||||||||||||||||
Common stock issued | 206,075 | – | 1,089,440 | – | – | 206,075 | |||||||||||
Assets acquired | 1,348,233 | – | 8,886,049 | 2,981,335 | 66,192 | 1,348,233 | |||||||||||
Liabilities assumed | 1,142,158 | – | 7,126,844 | 2,929,448 | 737,116 | 1,142,158 | |||||||||||
See accompanying notes to consolidated financial statements.
ZIONS BANCORPORATION AND SUBSIDIARIES
NOTES TO CONSOLIDATED FINANCIAL STATEMENTS
ZIONS BANCORPORATION AND SUBSIDIARIES
1. SUMMARY OF SIGNIFICANT ACCOUNTING POLICIES
BusinessBUSINESS
Zions Bancorporation (“the Parent”) is a financial holding company headquartered in Salt Lake City, Utah, which provides a full range of banking and related services through its banking subsidiaries in ten Western and Southwestern states as follows: Zions First National Bank (“Zions Bank”), in Utah and Idaho; California Bank & Trust (“CB&T”); Amegy Corporation (“Amegy”) and its subsidiary, Amegy Bank, in Texas; National Bank of Arizona (“NBA”); Nevada State Bank (“NSB”); Vectra Bank Colorado (“Vectra”), in Colorado and New Mexico; The Commerce Bank of Washington (“TCBW”); and The Commerce Bank of Oregon (“TCBO”). Amegy and its parent, Amegy Bancorporation, Inc., were acquired effective December 3, 2005. TCBO was opened in October 2005 and is not expected to have a material effect on consolidated operations for several years. The Parent also owns and operates certain nonbank subsidiaries that engage in the development and sale of financial technologies and related services, includingservices. Two of these subsidiaries, NetDeposit, Inc. (“NetDeposit”) and P5, Inc. (“P5”), were merged in 2008 to form NetDeposit, LLC (“NetDeposit”).
Another subsidiary whose ownership was transferred from Zions Bank to the Parent in 2008, Welman Holdings, Inc. (“Welman”), provides wealth management services.
Basis of Financial Statement PresentationBASIS OF FINANCIAL STATEMENT PRESENTATION
The consolidated financial statements include the accounts of the Parent and its majority-owned subsidiaries (“the Company,” “we,” “our,” “us”). Unconsolidated investments in which there is a greater than 20% ownership are accounted for by the equity method of accounting; those in which there is less than 20% ownership are accounted for under cost, fair value, or equity methods of accounting. All significant intercompany accounts and transactions have been eliminated in consolidation. Certain amounts in prior years have been reclassified to conform to the current year presentation.
The consolidated financial statements have been prepared in conformity with accounting principles generally accepted in the United States and prevailing practices within the financial services industry. This includes the guidance in Financial Accounting Standards Board (“FASB”) Interpretation No. 46R (“FIN 46R”),under ASC 810,Consolidation of Variable Interest Entities, an Interpretation of Accounting Research Bulletin No. 51, as revised from FIN 46. FIN 46Rwhich requires consolidation of a variable interest entity (“VIE”) when a company is the primary beneficiary of the VIE. As described inSee Note 6, Zions Bank holds variable interests in securitization structures. All2 for a discussion of these structures are qualifying special-purpose entities, which are exempt from the consolidation requirements of FIN 46R.related accounting guidance on consolidated financial statements and proposed rules amending this guidance.
In preparing the consolidated financial statements, we are required to make estimates and assumptions that affect the amounts reported in the financial statements and accompanying notes. Actual results could differ from those estimates.
Statement of Cash FlowsSTATEMENT OF CASH FLOWS
For purposes of presentation in the consolidated statements of cash flows, “cash and cash equivalents” are defined as those amounts included in cash and due from banks in the consolidated balance sheets.
Security Resell AgreementsSECURITY RESELL AGREEMENTS
Security resell agreements represent overnight and term agreements with the majority maturing within 30 days. These agreements are generally treated as collateralized financing transactions and are carried at amounts at which the securities were acquired plus accrued interest. Either the Company or, in some instances, third parties on ourits behalf take possession of the underlying securities. The fair value of such securities is monitored throughout the contract term to ensure that asset values remain sufficient to protect against counterparty default. We are permitted by contract to sell or repledge certain securities that we accept as collateral for security resell agreements. If sold, our obligation to return the collateral is recorded as a liability and included in the balance sheet as securities
sold, not yet purchased. As of December 31, 2007,2009, we held approximately $672$58 million of securities for which we were permitted by contract to sell or repledge. The majority of these securities have been
either pledged or otherwise transferred to others in connection with our financing activities, or to satisfy our commitments under short sales. Security resell agreements averaged approximately $474$237 million during 2007,2009, and the maximum amount outstanding at any month-end during 20072009 was $683$372 million.
Investment SecuritiesINVESTMENT SECURITIES
We classify our investment securities according to their purpose and holding period. Gains or losses on the sale of securities are recognized using the specific identification method and recorded in noninterest income.
Held-to-maturity debt securities are stated at adjusted cost, net of unamortized premiums and unaccreted discounts. The Company has the intent and ability to hold such securities to maturity. Debt
Available-for-sale securities are stated at fair value and generally consist of debt securities held for investment and marketable equity securities not accounted for under the equity method of accounting are classified as available-for-sale and recorded at fair value.method. Unrealized gains and losses of available-for-sale securities, after applicable taxes, are recorded as a component of other comprehensive income.income (“OCI”). Any declines in the valuevalues of debt securities and marketable equitythese securities that are considered other-than-temporaryto be other-than-temporary-impairment (“OTTI”) and credit-related are recordedrecognized in noninterest income.earnings. Noncredit-related OTTI on securities not expected to be sold is recognized in OCI. The review for other-than-temporary impairmentOTTI is conducted on an ongoing basis and takes into account the severity and duration of the impairment, recent events specific to the issuer or industry, fair value in relationship to cost, extent and nature of change in fair value, creditworthiness of the issuer including external credit ratings and recent downgrades, trends and volatility of earnings, current analysts’ evaluations, and other key measures. In addition, we assessdetermine that we do not intend to sell the Company’s intentsecurities and abilityit is not more likely than not that we will be required to holdsell the security for a periodsecurities before recovery of time sufficient for a recovery in value, which may be maturity, takingtheir amortized cost basis. In doing this, we take into account our balance sheet management strategy and consideration of current and future market conditions.
SecuritiesTrading securities are stated at fair value and consist of securities acquired for short-term appreciation or other trading purposes are classified as trading securities and are recorded at fair value.purposes. Realized and unrealized gains and losses are recorded in trading income.income, which is included in capital markets and foreign exchange.
The fair values of available-for-sale and tradinginvestment securities are generally based on quoted market prices or dealer quotes. If a quoted market price is not available, fair value is estimated using quoted market prices for comparable securities or a discounted cash flow model based on established market rates.
according to ASC 820,Fair Value Measurements and Disclosures, as discussed in Note 21.
LoansLOANS
Loans are reported at the principal amount outstanding, net of unearned income. Unearned income, which includes deferred fees net of deferred direct loan origination costs, is amortized to interest income over the life of the loan using the interest method. Interest income is recognized on an accrual basis.
Loans held for sale are carried at the lower of aggregate cost or fair value. Gains and losses are recorded in noninterest income based on the difference between sales proceeds and carrying value.
Interest income on nonimpaired loans acquired in a business combination, including FDIC-supported transactions, is recognized based on the acquired loan’s contractual cash flows.
Nonaccrual LoansNONACCRUAL LOANS
Loans are generally placed on a nonaccrual status when principal or interestthe loan is past due 90 days or more past due as to principal or interest, unless the loan is both well secured and in the process of collection or when, in the opinion of management, full collection of principal or interest is unlikely. Generally, consumercollection. Consumer loans are not placed on nonaccrual status inasmuch as theywhen the loan is 90 days past due. Generally, closed-end non-real estate secured consumer loans are normallycharged off prior to 120 days past due. Open-end consumer loans adequately secured by real estate are placed on nonaccrual status at 90 days. Open-end credit card consumer loans are charged off when they become 120180 days past due. A nonaccrual loan may be returned to accrual status when all delinquent interest and principal become current in accordance with the terms of the loan agreement or when the loan becomes both well secured and in the process of collection.
Impaired LoansIMPAIRED LOANS
Loans, other than those included in large groups of smaller-balance homogeneous loans, are considered impaired when, based on current information and events, it is probable that we will be unable to collect all amounts due according toin accordance with the contractual terms of the loan agreement, including scheduled interest payments.
When a loan has been identified as being impaired, the The amount of impairment will beis measured based on the present value of expected future cash flows discounted at the loan’s effective interest rate or, when appropriate, the loan’s observable fair value or the fair value of the collateral (less any selling costs) if the loan is collateral-dependent.
If the measurement of the impaired loan is less than the recorded investment in the loan (including accrued interest, net of deferred loan fees or costs and unamortized premium or discount), an impairment is recognized by creating or adjusting an existing allocation of the allowance for loan losses.
The impaired loan may be subsequently charged down.
Restructured LoansRESTRUCTURED LOANS
In cases where a borrower experiences financial difficulty and we make certain concessionary modifications to contractual terms, the loan is classified as a restructured (accruing) loan. Loans restructured at a rate equal to or greater than that of a new loan with comparable risk at the time the contract is modified may be excluded from the impairment assessment and may cease to be considered impaired loans in the calendar years subsequent to the restructuring if they are not impaired based on the modified terms.
Generally, a nonaccrual loan that is restructured remains on nonaccrual status for a period of six months to demonstrate that the borrower can meet the restructured terms. However, performance prior to the restructuring, or significant events that coincide with the restructuring, are included in assessing whether the borrower can meet the new terms and may result in the loan being returned to accrual at the time of restructuring or after a shorter performance period. If the borrower’s ability to meet the revised payment schedule is uncertain, the loan remains classified as a nonaccrual loan.
Other Real Estate OwnedOTHER REAL ESTATE OWNED
Other real estate owned consists principally of commercial and residential real estate obtained in partial or total satisfaction of loan obligations. Amounts are recorded at the lower of cost or marketfair value (less any selling costs) based on property appraisals at the time of transfer and periodically thereafter.
Allowance for Loan LossesALLOWANCE FOR LOAN LOSSES
In analyzing the adequacy of the allowance for loan losses, we utilize a comprehensive loan grading system to determine the risk potential in the portfolio and also consider the results of independent internal credit reviews. To determine the adequacy of the allowance, our loan and lease portfolio is broken into segments based on loan type.
For commercial loans, we use historical loss experience factors by segment,loan type and quality grade, adjusted for changes in trends and conditions, to help determine an indicated allowance for each portfolio segment. Currently, the Company reestimates all commercial loss reserve factors based on recent loss experience on a quarterly basis. These factors are evaluated and updated using migration analysis techniques and other considerations based on the makeup of the specific segment. Other considerations include volumes and trends of delinquencies, levels of nonaccrual loans, repossessions and bankruptcies, trends in criticized and classified loan trends,loans, expected losses on real estate secured loans, new credit products and policies, current economic conditions, concentrations of credit risk, and experience and abilities of the Company’s lending personnel.
In addition to the segment evaluations, nonaccrual loans graded substandard or doubtful with an outstanding balance of $500 thousand or more, as well as consumer loans designated as troubled debt restructurings, are individually evaluated as impaired loans based on the facts and circumstances of the loanin accordance with ASC 310 to determine ifthe level of impairment and establish a specific allowance amount may be necessary. Specific allowances may also be established for loans whose outstanding balances are below the above threshold when it is determined that the risk associated with the loan differs significantly from the risk factor amounts established for its loan segment.reserve.
For consumer loans, we develop historical ratesdetermine the allowance using historically developed loss experience “roll rates” at which loans migrate from one delinquency level to the next higher level. Comparing these averageUsing current roll rates for the most recent six-month period and comparing projected losses to actual loss experience, the models estimate expected losses in dollars for the model establishes projected losses for rolling twelve-month periodsforecasted period of twelve months. By refreshing the models with updated data, broken down byit is able to project losses for a new twelve-month period each month, segmenting the portfolio into twelve consumer loan product groupings and four bankcard product groupings with similar risk profiles.
The residential mortgage and home equity portfolios’ models implicitly take into consideration housing price depreciation (appreciation) and homeowners’ loss (gain) of equity in the collateral by incorporating current roll rates and loss severity rates. The models make no assumptions about future housing price changes. This methodology is an accepted industry practice, and we believe we have a sufficient volume of information to produce reliable projections.
After a preliminary allowance for credit losses has been established for the loan portfolio segments, we perform an additional review of the adequacy of the allowance based on the loan portfolio in its entirety. This enables us to mitigate, but not eliminate, the imprecision inherent in mostloan- and segment-level estimates of expected credit losses and also supplements the allowance.losses. This supplemental portionreview of the allowance includes our judgmental consideration of any additional amountsadjustments necessary for subjective factors such as economic uncertainties and excessexcessive concentration risks.
For loans acquired in FDIC-supported transactions, the allowance for loan losses is determined without giving consideration to the amounts recoverable through the loss sharing agreements with the FDIC. The provision for loan losses is reported net of changes in the amounts recoverable under the loss sharing agreements.
Nonmarketable SecuritiesNONMARKETABLE SECURITIES
Nonmarketable securities are included in other noninterest-bearing investments on the balance sheet. These securities include certain venture capital securities and securities acquired for various debt and regulatory requirements. Nonmarketable venture capital securities are reported at estimated fair values, in the absence of readily ascertainable fair values. Changes in fair value and gains and losses from sales are recognized in noninterest income. The values assigned to the securities where no market quotations exist are based upon available information and may not necessarily represent amounts that will ultimately be realized. Such estimated amounts depend on future circumstances and will not be realized until the individual securities are liquidated. The valuation procedures applied include consideration of economic and market conditions, current and projected financial performance of the investee company, and the investee company’s management team. We believe that the cost of an investment is initially the best indication of estimated fair value unless there have been significantmaterial subsequent positive or negative developments that justify an adjustment in the fair value estimate. Other nonmarketable securities acquired for various debt and regulatory requirements are accounted for at cost.
Asset SecuritizationsPREMISES AND EQUIPMENT
When we sell receivables in securitizations of home equity loans and small business loans, we may retain a cash reserve account, an interest-only strip, and in some cases a subordinated tranche, all of which are retained interests in the securitized receivables. Gain or loss on sale of the receivables depends in part on the previous carrying amount of the financial assets involved in the transfer, allocated between the assets sold and the retained interests based on their relative fair values at the date of transfer. Quoted market prices are generally not available for retained interests. To obtain fair values, we estimate the present value of future expected cash flows using our best judgment of key assumptions, including credit losses, prepayment speeds and methods, forward yield curves, and discount rates commensurate with the risks involved.
Premises and Equipment
Premises and equipment are stated at cost, net of accumulated depreciation and amortization. Depreciation, computed primarily on the straight-line method, is charged to operations over the estimated useful lives of the properties, generally from 25 to 40 years for buildings and from 3 to 10 years for furniture and equipment. Leasehold improvements are amortized over the terms of the respective leases or the estimated useful lives of the improvements, whichever are shorter.
Business CombinationsBUSINESS COMBINATIONS
Business combinations are accounted for under the purchase method of accounting in accordance with Statement of Financial Accounting Standards (“SFAS”) No. 141,ASC 805,Business Combinations. Under this guidance, assets and liabilities of the business acquired are recorded at their estimated fair values as of the date of acquisition. Any excess of the cost of acquisition over the fair value of net assets and other identifiable intangible assets acquired is recorded as goodwill.goodwill, while any excess of fair value over the cost of the acquisition is recognized as a gain. Results of operations of the acquired business are included in the statement of income from the date of acquisition. See Note 3 for additional discussion of new accounting guidance adopted in 2009.
GOODWILL AND IDENTIFIABLE INTANGIBLE ASSETS
Goodwill and Identifiable Intangible Assets
SFAS No. 142,Goodwill and Other Intangible Assets, requires that goodwill and intangible assets deemed to have indefinite lives are not amortized. SuchAs required under ASC 350,Intangibles – Goodwill and Other, we subject these assets are subject to annual specified impairment tests.tests as of the beginning of the fourth quarter and more frequently if changing conditions warrant. Core deposit assets and other intangibles with finite useful lives are generally amortized on an accelerated basis using an estimated useful life of up to 12 years.
Derivative InstrumentsDERIVATIVE INSTRUMENTS
We use derivative instruments including interest rate swaps and floors and basis swaps as part of our overall asset and liability duration and interest rate risk management strategy. These instruments enable us to manage desired asset and liability duration and to reduce interest rate exposure by matching estimated repricing periods of interest-sensitive assets and liabilities. We also execute derivative instruments with commercial banking customers to facilitate their risk management strategies. These derivatives are immediately hedged by offsetting derivatives such that we minimize our net risk exposure as a result of such transactions. As required by SFAS No. 133,ASC 815,Accounting for Derivative InstrumentsDerivatives and Hedging Activities,, we record all derivatives at fair value in the balance sheet as either other assets or other liabilities. See further discussion in Note 7.
Commitments and Letters of CreditCOMMITMENTS AND LETTERS OF CREDIT
In the ordinary course of business, we enter into commitments to extend credit, commercial letters of credit, and standby letters of credit. Such financial instruments are recorded in the financial statements when they become payable. The credit risk associated with these commitments when indistinguishable from the underlying funded loan, is consideredevaluated in our determination ofa manner similar to the allowance for loan losses. Other liabilities in the balance sheet include theThe reserve for unfunded lending commitments that is distinguishable and related to undrawn commitments to extend credit.
included in other liabilities in the balance sheet.
Share-Based CompensationSHARE-BASED COMPENSATION
Share-based compensation generally includes grants of stock options and restricted stock to employees and nonemployee directors. We account for share-based payments, including stock options, in accordance with SFAS No. 123R,ASC 718,Share-Based PaymentCompensation – Stock Compensation, and recognize them in the statement of income based on their fair values. See further discussion in Note 17.
Income TaxesINCOME TAXES
Deferred tax assets and liabilities are determined based on temporary differences between financial statement asset and liability amounts and their respective tax bases and are measured using enacted tax laws and rates. The effect on deferred tax assets and liabilities of a change in tax rates is recognized in income in the period that includes the enactment date. Deferred tax assets are recognized subject to management’s judgment that realization is more-likely-than-not.
Unrecognized tax benefits for uncertain tax positions relate primarily to state tax contingencies and are accounted for and disclosed in accordance with FASB Interpretation No. 48 (“FIN 48”),Accounting for Uncertainty in Income Taxes, an interpretation of FASB Statement No. 109.We adopted FIN 48 effective January 1, 2007.contingencies. See further discussion in Note 15.
Net Earnings per Common ShareNET EARNINGS PER COMMON SHARE
Net earnings per common share is based on net earnings applicable to common shareholders which is net of the preferred stock dividend.dividends. Unvested share-based payment awards with rights to receive nonforfeitable dividends are considered participating securities and included in the computation of earnings per share. Basic net earnings per common share is based on the weighted average outstanding common shares during each year. Diluted net earnings per common share is based on the weighted average outstanding common shares during each year, including common stock equivalents. Diluted net earnings per common share excludes common stock equivalents whose effect is antidilutive.
2. OTHER RECENT ACCOUNTING PRONOUNCEMENTS
Effective January 1, 2008,In June 2009, the Company will adopt SFASFinancial Accounting Standards Board (“FASB”) issued Statement of Financial Accounting Standards (“SFAS”) No. 157,Fair Value Measurementsand SFAS No. 159,168,The Fair Value Option for Financial AssetsFASB Accounting Standards CodificationTM and Financial Liabilitiesthe Hierarchy of Generally Accepted Accounting Principles – a replacement of FASB Statement No. 162. SFAS 157 defines fair value, establishes a consistent framework for measuring fair value, and enhances disclosures about fair value measurements. AdoptionWith the issuance of SFAS 157 has been delayed one year168, the FASB Accounting Standards Codification (“the Codification” or “ASC”) becomes the single source of authoritative U.S. accounting and reporting standards applicable for all nongovernmental entities, with the measurementexception of guidance issued by the SEC. This change is effective for financial statements issued for interim or annual periods ending after September 15, 2009. Accordingly, all nonfinancial assetsspecific references herein to generally accepted accounting principles (“GAAP”) refer to the Codification and nonfinancial liabilities.not to the pre-Codification literature. The CompanyCodification does not expect thatmodify existing GAAP nor any guidance issued by the adoption of SFAS 157 will have a material effect onSEC. Nonauthoritative accounting literature is excluded from the consolidated financial statements. SFAS 159 allows forCodification. To improve usability, the optionCodification does include certain SEC guidance. GAAP accounting standards used to report certain financial assets and liabilities at fair value initially and at subsequent measurement with changes in fair value included in earnings. The option may be applied instrument by instrument, but is on an irrevocable basis. The Company has determinedpopulate the Codification are superseded. Updates to apply the fair value option to one available-for-sale trust preferred REIT CDO security and three retained interests on selected small business loan securitizations. In conjunction with the adoption of SFAS 159 on the selected REIT CDO security, the Company plans to implement a directional hedging program in an effort to hedge the credit exposure the Company has to homebuilders in its REIT CDO portfolio. The cumulative effect of adopting SFAS 159 is estimated to reduce the beginning balance of retained earnings at January 1, 2008 by approximately $11.5 million, comprised of a decrease of $11.7 million for the REIT CDO and an increase of $0.2 million for the three retained interests.Codification are made through Accounting Standards Updates (“ASU”).
On December 4, 2007,In June 2009, the FASB issued SFAS No 141 (revised 2007),No. 167,Business CombinationsAmendments to FASB Interpretation No. 46(R) (subsequently codified by ASU 2009-17 and included in ASC 810,Consolidation). This new accounting guidance, among other things, requires a continuous analysis on a qualitative rather than a quantitative basis to determine the primary beneficiary of a VIE. The guidance requires enhanced disclosures about an enterprise’s involvement with a VIE and amends previous guidance to determine whether an entity is a VIE. This guidance becomes effective January 1, 2010. We will be required to reconsider our consolidation conclusions for all entities with which we are involved. However, we do not expect the adoption of this guidance to have a significant impact on the Company’s financial statements.
ASC 855,Subsequent Events, includes new guidance that became effective for the second quarter of 2009. The definition of subsequent events was modified and SFAS No. 160,Accountingentities are required to disclose the date through which subsequent events have been evaluated and Reportingthe basis for that date. Adoption of Noncontrolling Intereststhis guidance was not significant to the Company’s financial statements.
ASC 810,Consolidation, includes new requirements for presenting consolidated financial statements, which we adopted January 1, 2009, as required. Under the new view of an economic entity in Consolidated Financial Statements, an amendmentconsolidated financial statements, the presentation of ARB No. 51. These new standards will significantly change the financial accounting and reporting of business combination transactions and noncontrolling (or minority) interests has been changed in consolidatedthat all operating amounts attributable to a noncontrolling interest are included in the statement of income and accumulated balances are included as a separate component of equity. Also required is the allocation of losses to a noncontrolling interest even when such losses result in a negative carrying balance. The effect of adoption was not significant to the Company’s financial statements. Both StatementsAs of January 1, 2009, minority interest of $27.3 million was reclassified to shareholders’ equity and reported as noncontrolling interests. As required, retrospective application was made to all prior periods for comparative presentation.
The FASB is currently considering a proposed statement that would require additional disclosures about the credit quality of financing receivables and the allowance for credit losses. The new guidance as currently proposed would require significant changes in the way entities disclose this information. Final requirements and timing of adoption are effective for the first annual reporting period after December 31, 2008. Generally, adoption is prospective and early adoption is not permitted.
In April 2007, the FASB issued FASB Staff Position (“FSP”) FIN 39-1,Offsetting of Amounts Related to Certain Contracts. FSP FIN 39-1 permits entities to offset fair value amounts recognized for the right to reclaim cash collateral (a receivable) or the obligation to return cash collateral (a payable) against fair value amounts recognized for derivative instruments executed with the same counterparty under a master netting arrangement. This new accounting guidance is effective for fiscal years beginning after November 15, 2007, with early application permitted.still being deliberated. Management is evaluating the impacteffect this FSP maycurrently proposed guidance will have on the Company’s financial statements.
Additional recent accounting pronouncements are discussed where applicable throughout the Notes to Consolidated Financial Statements.
3. MERGER AND ACQUISITION ACTIVITY
Effective January 1, 2009, we adopted new accounting provisions under ASC 805,Business Combinations. Among the most significant changes is the elimination of the step acquisition model used with previous accounting. Upon initially obtaining control, the acquirer now recognizes 100% of all acquired assets (including
Effective September 6, 2007, Amegy completed its acquisition for cash
goodwill) and all assumed liabilities regardless of Intercontinentalthe percentage owned. Certain transaction and restructuring costs must be expensed as incurred. Changes to the acquirer’s existing income tax valuation allowances and uncertainty accruals from a business combination must be recognized as an adjustment to current income tax expense and not to goodwill over the subsequent annual period. Assets acquired and liabilities assumed from contingencies must also be recognized at fair value, if the fair value can be determined during the measurement period.
On July, 17, 2009, CB&T acquired the banking operations of the failed Vineyard Bank Sharesfrom the Federal Deposit Insurance Corporation (“Intercon”FDIC”), as receiver. The acquisition consisted of approximately $1.6 billion of assets, including three$1.4 billion of loans, $1.5 billion of deposits, and 16 branches mostly located in San Antonio, Texas. Approximately $8.5the Inland Empire area of Southern California. CB&T assumed Vineyard’s deposit obligations other than brokered deposits, and purchased most of Vineyard’s assets, including all loans. CB&T received approximately $87.5 million in goodwill, $58cash from the FDIC and entered into a loss sharing agreement in which the FDIC will bear 80% of the first $465 million of losses on loans and other real estate owned and 95% of any losses above that amount for a period of up to ten years.
On April 17, 2009, NSB acquired the banking operations of the failed Great Basin Bank of Nevada headquartered in Elko, Nevada, from the FDIC as receiver. The acquisition consisted of approximately $212 million of assets, including the entire loan portfolio, $209 million of deposits, and five branches in Northern Nevada. NSB received approximately $17.8 million in cash from the FDIC and entered into a loss sharing agreement in which the FDIC will assume 80% of the first $40 million of losses on loans and $105other real estate owned and 95% of any losses above that amount for a period of up to ten years.
On February 6, 2009, CB&T acquired the banking operations of the failed Alliance Bank headquartered in Culver City, California from the FDIC as receiver. The acquisition consisted of approximately $1.1 billion of assets, including the entire loan portfolio, $1.0 billion of deposits, and five branches. CB&T received approximately $10 million in deposits, including $98cash from the FDIC and entered into a loss sharing agreement in which the FDIC will assume 80% of the first $275 million of credit losses and 95% of any losses above that amount for a period of up to ten years.
As a result of these loss sharing agreements, the acquired loans are presented separately in core deposits, were added to the Company’s balance sheet.
On January 17, 2007, we completed the acquisition of The Stockmen’s Bancorp, Inc. (“Stockmen’s”), headquartered in Kingman, Arizona. As ofsheet as “FDIC-supported loans.” At the date of acquisition, Stockmen’s hadthese loans were recorded at fair value without a corresponding allowance for loan losses. The acquired foreclosed assets of approximately $1.2 billion$54.1 million are included with other real estate owned in the balance sheet. Because the fair value of totalnet assets $1.1 billionacquired exceeded cost, and taking into consideration the amounts of totalcash received from the FDIC, we recognized acquisition related gains of $169.2 million.
The following summarizes the carrying value of FDIC-supported loans at December 31, 2009 for (1) acquired loans accounted for under ASC 310-30,Loans and Debt Securities Acquired with Deteriorated Credit Quality, which have evidence of credit deterioration and for which it is probable that not all contractual payments will be collected, and (2) acquired loans without evidence of credit deterioration(in thousands):
| Loans with deterioration | Loans without deterioration | Total | |||||
Commercial lending | $ | 84,116 | 481,954 | 566,070 | |||
Commercial real estate | 295,685 | 474,144 | 769,829 | ||||
Consumer | 8,699 | 99,996 | 108,695 | ||||
Total FDIC-supported loans | $ | 388,500 | 1,056,094 | 1,444,594 | |||
As of the respective dates of acquisition, the preliminary estimates of the contractually required payments receivable for loans with evidence of credit deterioration were $966.9 million, the cash flows expected to be collected from borrowers were $561.9 million including interest, and the estimated fair value of the acquired
loans was $560.0 million. These amounts were determined based upon the estimated remaining life of the underlying loans, which included the effects of estimated prepayments. Because of the estimation process required, certain refinements will likely be made to the above estimates in future reporting periods.
Changes in the carrying amount and accretable yield for loans with evidence of credit deterioration were as follows during 2009 from the respective dates of acquisition(in thousands):
| Net accretable discount | Carrying amount of loans | |||||
Fair value of acquired loans at date of acquisition | $ | 1,853 | 560,045 | |||
Payments received, net of advances | (169,678 | ) | ||||
Transfers to other real estate owned | (320 | ) | ||||
Charge-offs in excess of original loss estimate | (1,499 | ) | ||||
Amortization, net | 48 | (48 | ) | |||
Balance at December 31, 2009 | $ | 1,901 | 388,500 | |||
Interest income on nonimpaired loans acquired in a business combination, including FDIC-supported transactions, is recognized based on the acquired loan’s contractual cash flows, as described in ASC 310-20,Nonrefundable Fees and Other Costs.
The estimated loss reimbursement from FDIC, which represents the estimated amounts due from the FDIC under the loss sharing agreements, amounted to approximately $293.3 million at December 31, 2009 and is included with other assets in the balance sheet. This amount was fair valued using projected cash flows based on credit adjustments for each loan type and the loss sharing reimbursement of 80% or 95%, as appropriate. The timing of the cash flows was adjusted to reflect management’s expectations to receive the FDIC reimbursements within the estimated loss period. Discount rates were based on U.S. Treasury rates or the AAA composite yield on investment grade bonds of similar maturity. The amount is adjusted as actual loss experience is developed and estimated losses covered under the loss sharing arrangements are updated. Estimated loan losses, if any, in excess of the amounts recoverable through the loss sharing agreements are reflected as period expenses through the provision for loan losses.
Subsequent to the acquisition, the allowance for loan losses for loans acquired in FDIC-supported transactions is determined without giving consideration to the amounts recoverable through loss sharing agreements (since the loss sharing agreements are separately accounted for and thus presented “gross” on the balance sheet). The provision for loan losses is reported net of changes in the amounts recoverable under the loss sharing agreements.
In September 2008, our NSB and NBA subsidiaries acquired from the FDIC the insured deposits and a total of 43 branches – 32 in Arizona and 11 in central California. Consideration of approximately $206.1 million consisted of 2.6 million sharescertain assets of the Company’s common stock plus a small amount of cash paid for fractional shares. Stockmen’s parent company merged into the Parent and Stockmen’s banking subsidiary merged into NBA. Effective November 2, 2007, NBA completed the sale of the 11 California branches, whichfailed Silver State Bank, headquartered in Henderson, Nevada. The acquisition included approximately $169 million of loans and $190$737 million of deposits resulting in no gain or loss. As of December 31, 2007, after giving effect to the sale of the branches, the acquisition resulted in approximately $106.1and $66 million of goodwillassets. The assets consisted primarily of deposit-secured loans, furniture, fixtures and $30.6 million of core depositequipment, and other intangibles.certain branch assets.
For 2007, merger related expense of $5.3 million consisted of $3.8 million for the Amegy and Intercon acquisitions, of which $2.8 million related to Amegy employment and retention agreements as the employees continued to render service. Approximately $1.0 million remains to be charged to operations in 2008 for these employment agreements. The remaining $1.5 million in 2007 was for the Stockmen’s acquisition. For 2006 and 2005, substantially all of the $20.5 million and $3.3 million, respectively, related to the Amegy acquisition.
In October 2006, we acquired the remaining minority interests of P5, a provider of web-based claims reconciliation services. We had previously owned a majority interest in this investment. Net cash consideration of approximately $23.5 million was allocated $17.5 million to goodwill and $6.0 million to other intangible assets.
4. INVESTMENT SECURITIES
Investment securities are summarized as follows(in thousands):
| December 31, 2009 | ||||||||||||||||||||||||
| December 31, 2007 | Recognized in OCI1 | Not recognized in OCI1 | ||||||||||||||||||||||
| Amortized cost | Gross unrealized gains | Gross unrealized losses | Estimated fair value | Amortized cost | Gross unrealized gains | Gross unrealized losses | Carrying value | Gross unrealized gains | Gross unrealized losses | Estimated fair value | ||||||||||||||
Held-to-maturity | ||||||||||||||||||||||||
Municipal securities | $ | 704,441 | 5,811 | 8,104 | 702,148 | $ | 606,074 | – | – | 606,074 | 8,724 | 5,451 | 609,347 | |||||||||||
Asset-backed securities: | ||||||||||||||||||||||||
Trust preferred securities – banks and insurance | 264,712 | – | 25,920 | 238,792 | – | 31,115 | 207,677 | |||||||||||||||||
Other | 30,482 | – | 5,853 | 24,629 | 551 | 8,848 | 16,332 | |||||||||||||||||
Other debt securities | 100 | – | – | 100 | – | 1 | 99 | |||||||||||||||||
| $ | 901,368 | – | 31,773 | 869,595 | 9,275 | 45,415 | 833,455 | |||||||||||||||||
Available-for-sale | ||||||||||||||||||||||||
U.S. Treasury securities | $ | 52,281 | 731 | 12 | 53,000 | $ | 25,651 | 493 | – | 26,144 | 26,144 | |||||||||||||
U.S. government agencies and corporations: | ||||||||||||||||||||||||
U.S. Government agencies and corporations: | ||||||||||||||||||||||||
Agency securities | 629,240 | 1,684 | 5,002 | 625,922 | 242,609 | 6,904 | 114 | 249,399 | 249,399 | |||||||||||||||
Agency guaranteed mortgage-backed securities | 764,771 | 4,523 | 6,284 | 763,010 | 374,118 | 11,849 | 692 | 385,275 | 385,275 | |||||||||||||||
Small Business Administration loan-backed securities | 788,509 | 505 | 18,134 | 770,880 | 782,385 | 3,050 | 17,796 | 767,639 | 767,639 | |||||||||||||||
Municipal securities | 237,057 | 4,823 | 386 | 241,494 | 241,494 | |||||||||||||||||||
Asset-backed securities: | ||||||||||||||||||||||||
Trust preferred securities – banks and insurance | 2,123,090 | 6,369 | 110,332 | 2,019,127 | 2,022,998 | 54,449 | 716,347 | 1,361,100 | 1,361,100 | |||||||||||||||
Trust preferred securities – real estate investment trusts | 155,935 | – | 61,907 | 94,028 | 56,265 | – | 32,247 | 24,018 | 24,018 | |||||||||||||||
Small business loan-backed | 182,924 | 318 | 1,168 | 182,074 | ||||||||||||||||||||
Auction rate securities | 159,649 | 321 | 530 | 159,440 | 159,440 | |||||||||||||||||||
Other | 226,460 | 4,374 | 176 | 230,658 | 127,210 | 1,355 | 51,413 | 77,152 | 77,152 | |||||||||||||||
Municipal securities | 220,159 | 1,881 | 71 | 221,969 | ||||||||||||||||||||
| 5,143,369 | 20,385 | 203,086 | 4,960,668 | 4,027,942 | 83,244 | 819,525 | 3,291,661 | 3,291,661 | ||||||||||||||||
Other securities: | ||||||||||||||||||||||||
Mutual funds | 173,159 | – | – | 173,159 | ||||||||||||||||||||
Stock | 763 | 20 | – | 783 | ||||||||||||||||||||
Mutual funds and stock | 363,958 | – | – | 363,958 | 363,958 | |||||||||||||||||||
| $ | 5,317,291 | 20,405 | 203,086 | 5,134,610 | $ | 4,391,900 | 83,244 | 819,525 | 3,655,619 | 3,655,619 | ||||||||||||||
| December 31, 2008 | ||||||||||||||||||||||||
| December 31, 2006 | Recognized in OCI1 | Not recognized in OCI1 | ||||||||||||||||||||||
| Amortized cost | Gross unrealized gains | Gross unrealized losses | Estimated fair value | Amortized cost | Gross unrealized gains | Gross unrealized losses | Carrying value | Gross unrealized gains | Gross unrealized losses | Estimated fair value | ||||||||||||||
Held-to-maturity | ||||||||||||||||||||||||
Municipal securities | $ | 653,124 | 3,521 | 7,817 | 648,828 | $ | 696,653 | – | – | 696,653 | 7,661 | 9,231 | 695,083 | |||||||||||
Asset-backed securities: | ||||||||||||||||||||||||
Trust preferred securities – banks and insurance | 1,187,804 | 53 | 184,195 | 1,003,662 | 4,380 | 332,006 | 676,036 | |||||||||||||||||
Trust preferred securities – real estate investment trusts | 36,013 | – | 8,671 | 27,342 | 6,271 | 21,071 | ||||||||||||||||||
Other | 76,323 | 48 | 13,139 | 63,232 | 644 | 12,611 | 51,265 | |||||||||||||||||
Other debt securities | 100 | – | – | 100 | – | – | 100 | |||||||||||||||||
| $ | 1,996,893 | 101 | 206,005 | 1,790,989 | 12,685 | 360,119 | 1,443,555 | |||||||||||||||||
Available-for-sale | ||||||||||||||||||||||||
U.S. Treasury securities | $ | 42,546 | 268 | 375 | 42,439 | $ | 27,973 | 1,148 | – | 29,121 | 29,121 | |||||||||||||
U.S. government agencies and corporations: | ||||||||||||||||||||||||
U.S. Government agencies and corporations: | ||||||||||||||||||||||||
Agency securities | 782,480 | 235 | 9,241 | 773,474 | 323,371 | 2,813 | 975 | 325,209 | 325,209 | |||||||||||||||
Agency guaranteed mortgage-backed securities | 900,673 | 2,188 | 9,266 | 893,595 | 406,462 | 5,308 | 1,655 | 410,115 | 410,115 | |||||||||||||||
Small Business Administration loan-backed securities | 907,372 | 2,387 | 8,355 | 901,404 | 692,634 | 35 | 25,992 | 666,677 | 666,677 | |||||||||||||||
Municipal securities | 177,938 | 2,312 | 252 | 179,998 | 179,998 | |||||||||||||||||||
Asset-backed securities: | ||||||||||||||||||||||||
Trust preferred securities – banks and insurance | 1,623,364 | 16,325 | 29,463 | 1,610,226 | 806,537 | 3,457 | 149,367 | 660,627 | 660,627 | |||||||||||||||
Trust preferred securities – real estate investment trusts | 204,445 | – | 3,196 | 201,249 | 26,880 | – | 2,983 | 23,897 | 23,897 | |||||||||||||||
Small business loan-backed | 194,164 | 679 | 1,374 | 193,469 | ||||||||||||||||||||
Other | 7,360 | 1,817 | – | 9,177 | 102,671 | – | 30,194 | 72,477 | 72,477 | |||||||||||||||
Municipal securities | 225,839 | 1,651 | 134 | 227,356 | ||||||||||||||||||||
| 4,888,243 | 25,550 | 61,404 | 4,852,389 | 2,564,466 | 15,073 | 211,418 | 2,368,121 | 2,368,121 | ||||||||||||||||
Other securities: | ||||||||||||||||||||||||
Mutual funds | 192,635 | – | – | 192,635 | ||||||||||||||||||||
Stock | 3,426 | 2,457 | – | 5,883 | ||||||||||||||||||||
Mutual funds and stock | 308,134 | – | – | 308,134 | 308,134 | |||||||||||||||||||
| $ | 5,084,304 | 28,007 | 61,404 | 5,050,907 | $ | 2,872,600 | 15,073 | 211,418 | 2,676,255 | 2,676,255 | ||||||||||||||
| 1 | Other comprehensive income |
As part of our ongoing review of the investment securities portfolio, we reassessed the classification of certain asset-backed and trust preferred collateralized debt obligation (“CDO”) securities. During 2009, we reclassified a total of $596 million at fair value of held-to-maturity (“HTM”) securities to available-for-sale (“AFS”). Unrealized losses added to OCI at the time of these transfers were $126.5 million. The reclassifications were made subsequent to ratings downgrades, as permitted under ASC 320,Investments – Debt and Equity Securities. No gain or loss was recognized in the statement of income at the time of reclassification.
The amortized cost and estimated fair value of investment debt securities are shown below as of December 31, 20072009 by expected maturity distribution for asset-backed securities and by contractual maturity are shown as follows. Expecteddistribution for other debt securities. Actual maturities willmay differ from expected or contractual maturities because borrowers may have the right to call or prepay obligations with or without call or prepayment penalties(in thousands):
| Held-to-maturity | Available-for-sale | ||||||||
| Amortized cost | Estimated fair value | Amortized cost | Estimated fair value | ||||||
Due in one year or less | $ | 53,955 | 53,745 | 837,850 | 832,976 | ||||
Due after one year through five years | 235,613 | 236,510 | 1,147,594 | 1,139,921 | |||||
Due after five years through ten years | 189,585 | 191,691 | 494,282 | 490,323 | |||||
Due after ten years | 225,288 | 220,202 | 2,663,643 | 2,497,448 | |||||
| $ | 704,441 | 702,148 | 5,143,369 | 4,960,668 | |||||
| Held-to-maturity | Available-for-sale | ||||||||
| Amortized cost | Estimated fair value | Amortized cost | Estimated fair value | ||||||
Due in one year or less | $ | 90,482 | 90,292 | 422,624 | 421,717 | ||||
Due after one year through five years | 245,349 | 244,051 | 899,076 | 881,623 | |||||
Due after five years through ten years | 224,121 | 205,919 | 595,111 | 577,283 | |||||
Due after ten years | 341,416 | 293,193 | 2,111,131 | 1,411,038 | |||||
| $ | 901,368 | 833,455 | 4,027,942 | 3,291,661 | |||||
The following is a summary of the amount of gross unrealized losses for debt securities and the estimated fair value by length of time that the securities have been in an unrealized loss position(in thousands):
Held-to-maturity Municipal securities Available-for-sale U.S. Treasury securities U.S. government agencies and corporations: Agency securities Agency guaranteed mortgage-backed securities Small Business Administration loan-backed securities Asset-backed securities: Trust preferred securities – banks and insurance Trust preferred securities – real estate investment trusts Small business loan-backed Other Municipal securities Held-to-maturity Municipal securities Available-for-sale U.S. Treasury securities U.S. government agencies and corporations: Agency securities Agency guaranteed mortgage-backed securities Small Business Administration loan-backed securities Asset-backed securities: Trust preferred securities – banks and insurance Trust preferred securities – real estate investment trusts Small business loan-backed Municipal securities December 31, 2007 Less than 12 months 12 months or more Total Gross
unrealized
losses Estimated
fair
value Gross
unrealized
losses Estimated
fair
value Gross
unrealized
losses Estimated
fair
value $ 6,308 49,252 1,796 167,971 8,104 217,223 $ 12 18,904 – – 12 18,904 19 15,219 4,983 153,465 5,002 168,684 571 82,323 5,713 345,593 6,284 427,916 1,571 132,774 16,563 544,872 18,134 677,646 80,340 1,530,433 29,992 403,463 110,332 1,933,896 61,907 60,869 – – 61,907 60,869 289 61,472 879 41,405 1,168 102,877 176 188,247 – – 176 188,247 10 1,745 61 3,729 71 5,474 $ 144,895 2,091,986 58,191 1,492,527 203,086 3,584,513 December 31, 2006 Less than 12 months 12 months or more Total Gross
unrealized
losses Estimated
fair
value Gross
unrealized
losses Estimated
fair
value Gross
unrealized
losses Estimated
fair
value $ 762 81,497 7,055 291,781 7,817 373,278 $ 32 21,648 343 19,712 375 41,360 1,088 284,179 8,153 255,988 9,241 540,167 2,536 185,137 6,730 377,427 9,266 562,564 3,031 337,503 5,324 324,998 8,355 662,501 2,010 241,506 27,453 694,835 29,463 936,341 1,586 90,859 1,610 75,390 3,196 166,249 – – 1,374 104,902 1,374 104,902 39 15,564 95 2,597 134 18,161 $ 10,322 1,176,396 51,082 1,855,849 61,404 3,032,245
| December 31, 2009 | |||||||||||||
| Less than 12 months | 12 months or more | Total | |||||||||||
| Gross unrealized losses | Estimated fair value | Gross unrealized losses | Estimated fair value | Gross unrealized losses | Estimated fair value | ||||||||
Held-to-maturity | |||||||||||||
Municipal securities | $ | 1,051 | 40,006 | 4,400 | 28,152 | 5,451 | 68,158 | ||||||
Asset-backed securities: | |||||||||||||
Trust preferred securities – banks and insurance | – | – | 57,035 | 207,676 | 57,035 | 207,676 | |||||||
Other | – | – | 14,701 | 16,332 | 14,701 | 16,332 | |||||||
Other debt securities | – | – | 1 | 99 | 1 | 99 | |||||||
| $ | 1,051 | 40,006 | 76,137 | 252,259 | 77,188 | 292,265 | |||||||
Available-for-sale | |||||||||||||
U.S. Government agencies and corporations: | |||||||||||||
Agency securities | $ | 40 | 5,300 | 74 | 2,231 | 114 | 7,531 | ||||||
Agency guaranteed mortgage-backed securities | 690 | 44,259 | 2 | 163 | 692 | 44,422 | |||||||
Small Business Administration loan-backed securities | 2,345 | 60,624 | 15,451 | 506,866 | 17,796 | 567,490 | |||||||
Municipal securities | 383 | 15,342 | 3 | 676 | 386 | 16,018 | |||||||
Asset-backed securities: | |||||||||||||
Trust preferred securities – banks and insurance | 5,578 | 62,172 | 710,769 | 897,513 | 716,347 | 959,685 | |||||||
Trust preferred securities – real estate investment trusts | 20,808 | 2,253 | 11,439 | 21,766 | 32,247 | 24,019 | |||||||
Auction rate securities | 530 | 122,148 | – | – | 530 | 122,148 | |||||||
Other | 2,089 | 6,210 | 49,324 | 56,238 | 51,413 | 62,448 | |||||||
| $ | 32,463 | 318,308 | 787,062 | 1,485,453 | 819,525 | 1,803,761 | |||||||
Held-to-maturity Municipal securities Asset-backed securities: Trust preferred securities – banks and insurance Trust preferred securities – real estate investment trusts Other Available-for-sale U.S. Government agencies and corporations: Agency securities Agency guaranteed mortgage-backed securities Small Business Administration loan-backed securities Municipal securities Asset-backed securities: Trust preferred securities – banks and insurance Trust preferred securities – real estate investment trusts Other We conduct a formal review of The new guidance requires that credit-related OTTI is recognized in earnings while noncredit-related OTTI on securities not expected to be sold is recognized in OCI. Noncredit-related OTTI is based on other factors, including illiquidity. Presentation of OTTI is made in the statement of income on a gross basis with an The preceding disclosure December 31, 2008 Less than 12 months 12 months or more Total Gross
unrealized
losses Estimated
fair
value Gross
unrealized
losses Estimated
fair
value Gross
unrealized
losses Estimated
fair
value $ 5,121 141,135 4,110 36,207 9,231 177,342 13,991 19,239 502,210 511,103 516,201 530,342 – – 14,942 21,072 14,942 21,072 7,214 26,621 18,536 20,541 25,750 47,162 $ 26,326 186,995 539,798 588,923 566,124 775,918 $ 191 41,950 784 60,725 975 102,675 1,336 103,721 319 32,960 1,655 136,681 2,523 170,443 23,469 483,628 25,992 654,071 224 16,303 28 2,286 252 18,589 27,378 114,721 121,989 454,094 149,367 568,815 2,983 10,783 – – 2,983 10,783 24,050 40,337 6,144 20,750 30,194 61,087 $ 58,685 498,258 152,733 1,054,443 211,418 1,552,701 unrealized losses andinvestment securities on a quarterly basis for the following discussion are presented pursuant to FSP FAS 115-1,The Meaningpresence of Other-Than-Temporary Impairment and Its Application to Certain Investments, issued in November 2005, and EITF Issue No. 03-1,The Meaningother-than-temporary impairment (“OTTI”). Our review was made under ASC 320, which includes new guidance that we adopted effective January 1, 2009. We assess whether OTTI is present when the fair value of Other-Than-Temporary Impairment and Its Application to Certain Investments. FSP FAS 115-1 replacesa debt security is less than its amortized cost basis at the impairment evaluation guidance (paragraphs 10-18) of EITF 03-1; however, the disclosure requirements of EITF 03-1 remain in effect. The FSP addresses the determination of when an investmentbalance sheet date. Under these circumstances, OTTI is considered impaired, whether the impairment is considered other-than-temporary, and the measurement of an impairment loss. The FSP also supersedes EITF Topic No. D-44,Recognition of Other-Than-Temporary Impairment upon the Planned Sale of a Security Whose Cost Exceeds Fair Value, and clarifies that an impairment loss should be recognized no later than when the impairment is deemed other-than-temporary, evento have occurred (1) if a decisionwe intend to sell the security; (2) if it is “more likely than not” we will be required to sell the security before recovery of its amortized cost basis; or (3) if the present value of expected cash flows is not sufficient to recover the entire amortized cost basis. The “more likely than not” criteria is a lower threshold than the “probable” criteria used under previous guidance.impaired security has not been made.
U.S. TreasuryOur OTTI evaluation process also takes into consideration current market conditions, fair value in relationship to cost, extent and nature of change in fair value, issuer rating changes and trends, volatility of earnings, current analysts’ evaluations, all available information relevant to the collectibility of debt securities,
Unrealized losses relate to U.S. Treasury notes and were caused by changes in interest rates. The contractual terms of these investments range from less than one year to five years. Because we have the our ability and intent to hold those investments until a recovery of fair value,amortized cost, which may be maturity, and other
factors, when evaluating for the existence of OTTI in our securities portfolio. Additionally, under ASC 325-40,Beneficial Interests in Securitized Financial Assets, OTTI is recognized as a realized loss through earnings when there has been an adverse change in the holder’s expected cash flows such that it is “probable” that the full amount will not be received. This is a change from previous guidance that a holder’s best estimate of cash flows should be based upon those that “a market participant” would use.
For all AFS security types discussed below where we believe that no OTTI exists at December 31, 2009, we first applied the criteria required in the new guidance in that we do not consider these investmentsintend to sell the securities and it is not more likely than not that we will be other-than-temporarily impaired at December 31, 2007.
U.S. Government agencies and corporations
Agencyrequired to sell the securities: Unrealized losses were caused by changes in interest rates. The agency securities consist of discount notes and medium term notes issued by the Federal Agricultural Mortgage Corporation (“FAMC”), Federal Home Loan Bank (“FHLB”), Federal Farm Credit Bank and Federal Home Loan Mortgage Corporation (“FHLMC”). These securities are fixed rate and were purchased at premiums or discounts. They have maturity dates from one to 30 years and have contractual cash flows guaranteed by agencies of the U.S. Government. Because the decline in fair value is attributable to changes in interest rates and not credit quality, and because we have the ability and intent to hold these investments until a before recovery of fair value, which may be maturity, we do not consider these investments to be other-than-temporarily impaired at December 31, 2007.
Agency guaranteed mortgage-backed securities: Unrealized losses were caused by changes in interest rates. The agency mortgage-backed securities are comprised largely of fixed and variable rate residential mortgage-backed securities issued by the Government National Mortgage Association (“GNMA”), Federal National Mortgage Association (“FNMA”), FAMC or FHLMC. They have maturity dates from one to 30 years and have contractual cash flows guaranteed by agencies of the U.S. Government. Because the decline in fair value is attributable to changes in interest rates and not credit quality, and because we have the ability and intent to hold these investments until a recovery of fair value, which may be maturity, we do not consider these investments to be other-than-temporarily impaired at December 31, 2007.
Small Business Administration (“SBA”) loan-backed securities: These securities were generally purchased at premiums with maturities from five to 25 years and have principal cash flows guaranteed by the SBA. Because the decline in fair value is not attributable to credit quality, and because we have the ability and intent to hold these investments until a recovery of fair value, which may be maturity, we do not consider these investments to be other-than-temporarily impaired at December 31, 2007.
Asset-backed securities
Trust preferred securities – banks and insurance: These collateralized debt obligation (“CDO”) securities are investment grade rated pools of trust preferred securities related to banks and insurance companies. They are purchased at both fixed and variable rates generally at par. Unrealized losses were caused mainly by the following factors: (1) widening of credit spreads for asset-backed securities; (2) general illiquidity in the market for CDOs; (3) global disruptions in 2007 in the credit markets; and (4) increased supply of CDO secondary market securities from distressed sellers. These securities are reviewed quarterly according to our policy discussed in Note 1 to assess credit quality and to determine if any impairment is other-than-temporary. As a result of our review which noted no decline in fair value attributable to credit quality, and because we have the ability and intent to hold these investments until a recovery of fair value, which may be maturity, we do not consider these investments to be other-than-temporarily impaired at December 31, 2007.
Trust preferred securities – real estate investment trusts (“REITs”): These CDO securities are rated pools of trust preferred securities related to real estate investment trusts. They are purchased at both fixed and variable rates generally at par. Unrealized losses were caused mainly by severe deterioration in mortgage REITs and homebuilder loans in 2007 in addition to the same factors previously
discussed for banks and insurance CDOs. Theses securities are reviewed quarterly according to our policy to assess credit quality and to determine if any impairment is other-than-temporary. As a result of our review, we recognized a pretax charge of approximately $108.6 million in the fourth quarter of 2007 for eight of these securities that were deemed to be other-than-temporarily impaired. This amount is included in the statement of income with the $158.2 million of “Impairment losses on available-for-sale securities and valuation losses on securities purchased from Lockhart Funding.” Based on all available information, we do not consider the remaining securities to be other-than-temporarily impaired at December 31, 2007.
Small business loan-backed: These securities are also comprised of variable rate unrated commercial mortgage-backed securities from small business loan securitizations made by Zions Bank. The securities from the small business loan securitizations are reviewed quarterly according to our policy to assess credit quality and to determine if any impairment is other-than-temporary. Based on the above analysis and because we have the ability and intent to hold these investments until a recovery of fair value, which may be maturity, we do not consider these investments to be other-than-temporarily impaired at December 31, 2007.
Other asset-backed securities: The majority of these CDO securities were purchased from Lockhart in December 2007 as discussed in Note 6 and were adjusted to fair value. Approximately $112 million consist of certain structured asset-backed CDOs (“ABS CDOs”) (also known as diversified structured finance CDOs) which have minimal exposure to subprime and home equity mortgage securitizations. Approximately $28 million of the collateral backing the ABS CDOs is subprime mortgage securitizations and $16 million is home equity credit line securitizations. They will be reviewed quarterly according to our policy to assess credit quality and determine if any impairment is other-than-temporary. Based on the above analysis and because we have the ability and intent to hold these investments until a recovery of fair value, which may be maturity, we do not consider these investments to be other-than-temporarily impaired at December 31, 2007.
their amortized cost basis.
Municipal securities
We classify these securities issued by state and political subdivisions as held-to-maturity (“HTM”) and available-for-sale (“AFS”). The HTM securities are purchased directly from the municipalities and are generally not rated by a credit rating agency. The AFS securities are rated as investment grade by various credit rating agencies. Both the HTM and AFS securities are at fixed and variable rates with maturities from one to 25 years. Fair values of these securities are highly driven by interest rates. We perform annual or more frequent credit quality reviews as appropriate on these issues.securities at each reporting period. Because the decline in fair value is not attributable to changes in interest rates and not credit quality, and because we have the ability and intent to hold those investments until a recovery of fair value, which may be maturity, we do not considerbelieve that no OTTI exists for these investments to be other-than-temporarily impairedsecurities at December 31, 2007.2009.
Asset-backed securities
Trust preferred securities – banks and insurance: These CDO securities are variable rate pools of trust preferred securities related to banks and insurance companies. They are rated by one or more Nationally Recognized Statistical Rating Organizations (“NRSROs”) which are rating agencies registered with the SEC. They were purchased generally at par. Unrealized losses were caused mainly by the following factors: (1) collateral deterioration due to bank failures and credit concerns across the banking sector; (2) widening of credit spreads for asset-backed securities; and (3) general illiquidity in the market for CDOs. Our ongoing review of these securities in accordance with the previous discussion and our policy in Note 1 determined that OTTI should be recorded on certain of these securities.
Trust preferred securities – real estate investment trusts (“REIT”): These CDO securities are variable rate pools of trust preferred securities primarily related to real estate investment trusts, and are rated by one or more NRSROs. They were purchased generally at par. Unrealized losses were caused mainly by severe deterioration in mortgage REITs and homebuilder credit in addition to the same factors previously discussed for banks and insurance CDOs. Our ongoing review of these securities in accordance with the previous discussion and our policy in Note 1 determined that OTTI should be recorded on certain of these securities.
Auction rate securities: These debt instruments primarily relate to auction market preferred stock and certain corporate and municipal bonds for which the interest rate was determined through an auction process. Due to the failure of these auctions and attendant illiquidity of the securities, the Company voluntarily purchased these securities at par and recorded them at fair value. They had previously been sold to customers by certain Company subsidiaries. Adjustments to fair value when purchased from customers were included in valuation losses on securities purchased. Because subsequent declines in fair value were not attributable to credit quality, we believe that no OTTI exists for these securities at December 31, 2009.
Other asset-backed securities: The majority of these CDO securities were purchased from Lockhart Funding LLC (“Lockhart”) at their carrying values and were adjusted to fair value. Certain of these CDOs consist of structured asset-backed CDOs (“ABS CDOs”) (also known as diversified structured finance CDOs). Our ongoing review of these securities in accordance with the previous discussion and our policy in Note 1 determined that OTTI should be recorded on certain of these securities.
U.S. Government agencies and corporations
Agency securities: These securities consist of discount notes and medium term notes issued by the Federal Agricultural Mortgage Corporation (“FAMC”), Federal Home Loan Bank (“FHLB”), Federal Farm Credit Bank, Federal Home Loan Mortgage Corporation (“FHLMC”), and Federal National Mortgage
Association (“FNMA”). These securities are fixed rate and were purchased at premiums or discounts. They have maturity dates from one to 30 years and have contractual cash flows guaranteed by agencies of the U.S. Government. The U.S. Government has provided substantial liquidity to FNMA and FHLMC to bolster their creditworthiness. Because the decline in fair value is not attributable to credit quality, we believe that no OTTI exists for these securities at December 31, 2009.
Agency guaranteed mortgage-backed securities: These securities are comprised largely of fixed and variable rate residential and agricultural mortgage-backed securities issued by the Government National Mortgage Association (“GNMA”), FNMA, FAMC, or FHLMC. They have maturity dates from one to 30 years and have contractual cash flows guaranteed by agencies of the U.S. Government. The U.S. Government has provided substantial liquidity to both FNMA and FHLMC to bolster their creditworthiness. Because the decline in fair value is not attributable to credit quality, we believe that no OTTI exists for these securities at December 31, 2009.
Small Business Administration (“SBA”) loan-backed securities: These securities were generally purchased at premiums with maturities from five to 25 years and have principal cash flows guaranteed by the SBA. Because the decline in fair value is not attributable to credit quality, we believe that no OTTI exists for these securities at December 31, 2009.
The following is a tabular rollforward of the total amount of credit-related OTTI, including amounts recognized in earnings during 2009(in thousands):
| HTM | AFS | Total | ||||||||
Balance of credit-related OTTI at beginning of year | $ | (1,905 | ) | (100,194 | ) | (102,099 | ) | |||
Additions recognized in earnings during the year: | ||||||||||
Credit-related OTTI not previously recognized | (682 | ) | (117,069 | ) | (117,751 | ) | ||||
Credit-related OTTI previously recognized when there is no intent to sell and no requirement to sell before recovery of amortized cost basis | (2,619 | ) | (160,093 | ) | (162,712 | ) | ||||
Subtotal of amounts recognized in earnings | (3,301 | ) | (277,162 | ) | (280,463 | ) | ||||
Reductions for securities sold during the year | – | 108,105 | 108,105 | |||||||
Balance of credit-related OTTI at end of year | $ | (5,206 | ) | (269,251 | ) | (274,457 | ) | |||
In 2006,To determine the credit component of OTTI for all security types, we utilize projected cash flows as the best estimate of fair value. These cash flows are credit adjusted using, among other things, assumptions for default probability assigned to each portion of performing collateral. The credit adjusted cash flows are discounted at a security specific coupon rate to identify any OTTI, and then at a market rate for valuation purposes.
Noncredit-related OTTI of $289.4 million ($174.2 million after-tax) on securities not expected to be sold, and for which it is not more likely than not that we will be required to sell the securities before recovery of their amortized cost basis, was recognized in OCI during 2009. Of this amount, $288.8 million related to AFS securities and $0.6 million related to HTM securities. As of January 1, 2009, we reclassified $137.5 million after-tax as a resultcumulative effect adjustment for the noncredit-related portion of our review for other-than-temporary impairment on an equity investment, we recorded an impairment loss of approximately $2.5 million, which was includedOTTI losses previously recognized in equity securities gains (losses) in the statement of income.
earnings.
At December 31, 20072009 and 2006,2008, respectively, 807131 and 1,552632 HTM and 774717 and 623739 AFS investment securities were in an unrealized loss position.
The following summarizes gains and losses, including OTTI, that were recognized in the statement of income(in millions)thousands):
| 2007 | 2006 | 2005 | 2009 | 2008 | 2007 | ||||||||||||||||||||||||||
| Gross gains | Gross losses | Gross gains | Gross losses | Gross gains | Gross losses | Gross gains | Gross losses | Gross gains | Gross losses | Gross gains | Gross losses | ||||||||||||||||||||
Investment securities: | |||||||||||||||||||||||||||||||
Held-to-maturity | $ | – | 3,301 | – | 208,515 | – | – | ||||||||||||||||||||||||
Available-for-sale | $ | 6.5 | (159.5) | 18.5 | (17.4) | 3.9 | (2.8) | 9,976 | 499,970 | 4,565 | 110,244 | 6,564 | 159,498 | ||||||||||||||||||
Other noninterest-bearing investments: | |||||||||||||||||||||||||||||||
Other noninterest-bearing investments | |||||||||||||||||||||||||||||||
Securities held by consolidated SBICs | 20.1 | (4.7) | 26.3 | (6.6) | 6.1 | (8.5) | 3,613 | 6,320 | 10,554 | 18,907 | 20,126 | 4,736 | |||||||||||||||||||
Other | 0.4 | (0.3) | 3.5 | – | 0.9 | (0.1) | 1,306 | 3,530 | 20,079 | 13,002 | 413 | 339 | |||||||||||||||||||
| 27.0 | (164.5) | 48.3 | (24.0) | 10.9 | (11.4) | 14,895 | 513,121 | 35,198 | 350,668 | 27,103 | 164,573 | ||||||||||||||||||||
Net gains (losses) | $ | (137.5) | 24.3 | (0.5) | $ | (498,226 | ) | (315,470 | ) | (137,470 | ) | ||||||||||||||||||||
Statement of income: | |||||||||||||||||||||||||||||||
Equity securities gains (losses), net | $ | 17.7 | 17.9 | (1.3) | |||||||||||||||||||||||||||
Fixed income securities gains, net | 3.0 | 6.4 | 2.4 | ||||||||||||||||||||||||||||
Impairment losses on available-for-sale securities and valuation losses on securities purchased from Lockhart Funding | (158.2) | – | (1.6) | ||||||||||||||||||||||||||||
Statement of income information: | |||||||||||||||||||||||||||||||
Net impairment losses on investment securities | $ | (280,463 | ) | (304,040 | ) | (108,624 | ) | ||||||||||||||||||||||||
Valuation losses on securities purchased | (212,092 | ) | (13,072 | ) | (49,584 | ) | |||||||||||||||||||||||||
| $ | (137.5) | 24.3 | (0.5) | (492,555 | ) | (317,112 | ) | (158,208 | ) | ||||||||||||||||||||||
Equity securities gains (losses), net | (1,825 | ) | 793 | 17,719 | |||||||||||||||||||||||||||
Fixed income securities gains (losses), net | (3,846 | ) | 849 | 3,019 | |||||||||||||||||||||||||||
Net gains (losses) | $ | (498,226 | ) | (315,470 | ) | (137,470 | ) | ||||||||||||||||||||||||
Losses of $158.2 millionValuation losses on available-for-sale securities in 2007 include the $108.6 million impairment loss for REIT CDOspurchased primarily relate to purchases by Zions Bank from Lockhart and are discussed previously and the $49.6 million valuation loss from the purchase of certain Lockhart securities, as discussedfurther in Note 6. Included in the 2009 amount is $24.2 million that was incurred when we voluntarily purchased all of the $255.3 million of auction rate securities previously sold to customers by certain Company subsidiaries.
Adjusted for expenses, minority interest, and income taxes, consolidated net income includes income (losses) from consolidated Small Business Investment Companies (“SBICs”)Securities with a carrying value of approximately $3.4 million in 2007, $4.1 million in 2006, and $(2.2) million in 2005. The Company’s remaining equity exposure to these investments, net of minority interest and SBA debt, was approximately $40.0 million and $49.1 million$1.8 billion at both December 31, 20072009 and 2006, respectively.
As of December 31, 2007 and 2006, securities with an amortized cost of $2.7 billion and $2.9 billion, respectively,2008 were pledged to secure public and trust deposits, advances, and for other purposes as required by law. As described in Note 11, securitiesSecurities are also pledged as collateral for security repurchase agreements.
On October 15, 2009, we were informed of outstanding offers from a hedge fund to the preferred shareholders (“equity holders”) of four CDOs in which the Company held senior debt. The offers sought to induce the equity holders, in exchange for payments to be made outside of the CDO, to approve sales to the hedge fund of substantial amounts of performing collateral at deeply discounted prices. Such sales, if consummated, would be detrimental to the interests of the more senior tranches of the CDO.
We subsequently learned that the equity holders in one of the CDOs agreed to the proposed offer from the hedge fund and that the other three offers were rejected. Our exposure to securities issued by the sole CDO with the accepted offer was $6.6 million of carrying value at December 31, 2009. Our remaining exposure could be materially adversely affected if the sale of the performing collateral at significant discounts to fair value were to be permitted.
The trustee has not commenced to sell the collateral and has filed an action in the United States District Court for the Southern District of New York seeking that the court order the interested parties to interplead and settle all claims relating to the collateral. Legal counsel has advised us and other bondholders in the CDO that we have a substantial legal basis to block any such sales.
We do not expect that the ultimate judicial determination will permit the proposed sales, which would be in contravention to the seniority concepts within the CDO. We have not found that sufficient information was
available to market participants at either the balance sheet date or filing date of the accompanying financial statements to support the expectation of an adverse outcome. As a result, we have not adjusted the projected cash flows at December 31, 2009 of the exposed CDO.
5. LOANS AND ALLOWANCE FOR LOAN LOSSES
Loans are summarized as follows at December 31(in thousands):
| 2007 | 2006 | 2009 | 2008 | |||||||
Loans held for sale | $ | 207,943 | 252,818 | |||||||
Commercial lending: | ||||||||||
Commercial and industrial | 9,810,991 | 8,422,094 | $ | 9,921,730 | 11,447,370 | |||||
Leasing | 502,601 | 442,440 | 466,492 | 431,139 | ||||||
Owner occupied | 7,603,727 | 6,260,224 | 8,751,983 | 8,742,809 | ||||||
Total commercial lending | 17,917,319 | 15,124,758 | 19,140,205 | 20,621,318 | ||||||
Commercial real estate: | ||||||||||
Construction and land development | 8,315,527 | 7,482,896 | 5,551,963 | 7,515,584 | ||||||
Term | 5,275,576 | 4,951,654 | 7,255,124 | 6,196,165 | ||||||
Total commercial real estate | 13,591,103 | 12,434,550 | 12,807,087 | 13,711,749 | ||||||
Consumer: | ||||||||||
Home equity credit line and other consumer real estate | 2,203,345 | 1,850,371 | ||||||||
Home equity credit line | 2,135,172 | 2,004,631 | ||||||||
1-4 family residential | 4,205,693 | 4,191,953 | 3,642,403 | 3,876,964 | ||||||
Construction and other consumer real estate | 459,039 | 774,158 | ||||||||
Bankcard and other revolving plans | 347,248 | 295,314 | 340,428 | 373,972 | ||||||
Other | 451,457 | 456,942 | 292,455 | 385,032 | ||||||
Total consumer | 7,207,743 | 6,794,580 | 6,869,497 | 7,414,757 | ||||||
Foreign loans | 26,638 | 2,814 | 65,294 | 43,413 | ||||||
Other receivables | 301,360 | 209,416 | ||||||||
FDIC-supported loans | 1,444,594 | – | ||||||||
Total loans | $ | 39,252,106 | 34,818,936 | $ | 40,326,677 | 41,791,237 | ||||
FDIC-supported loans are loans acquired during 2009 that are supported by the FDIC under loss sharing agreements. See further discussion in Note 3.
Owner occupied and commercial termreal estate loans included unamortized premium of approximately $127.6$117.6 million and $97.1$155.1 million at December 31, 20072009 and 2006,2008, respectively.
As of December 31, 20072009 and 2006,2008, loans with a carrying value of $6.4$9.3 billion and $3.7$9.4 billion, respectively, were included as blanket pledges of security for FHLB advances. Actual FHLB advances against these pledges were $2,853$16 million and $631$128 million at December 31, 20072009 and 2006,2008, respectively.
We sold loans totaling $1,934 million in 2009, $950 million in 2008, and $1,125 million in 2007 $1,014 million in 2006, and $885 million in 2005 that were previously classified as held for sale. Income from loans sold, excluding servicing, was $26.9$11.2 million in 2007, $35.52009, $9.7 million in 2006,2008, and $53.9$24.2 million in 2005.2007. These income amounts include loans held for sale and loan securitizations, and exclude impairment losses on retained interests from loan securitizations.
Changes in the allowance for loan losses are summarized as follows(in thousands):
| 2007 | 2006 | 2005 | |||||||||||||||
| 2009 | 2008 | 2007 | |||||||||||||||
Balance at beginning of year | $ | 365,150 | 338,399 | 271,117 | $ | 686,999 | 459,376 | 365,150 | |||||||||
Allowance for loan losses of companies acquired | 7,639 | – | 49,217 | ||||||||||||||
Allowance of loans sold with branches | (2,034) | – | – | ||||||||||||||
Allowance of companies acquired | – | – | 7,639 | ||||||||||||||
Allowance associated with purchased securitized loans | – | 1,756 | – | ||||||||||||||
Allowance of loans and leases sold | – | (804 | ) | (2,034 | ) | ||||||||||||
Additions: | |||||||||||||||||
Provision for loan losses | 152,210 | 72,572 | 43,023 | 2,016,927 | 648,269 | 152,210 | |||||||||||
Charge-offs recoverable from FDIC | 2,303 | – | – | ||||||||||||||
Recoveries | 15,095 | 19,971 | 17,811 | 80,755 | 21,026 | 15,095 | |||||||||||
Deductions: | |||||||||||||||||
Loan charge-offs | (78,684) | (65,792) | (42,769) | ||||||||||||||
Charge-offs | (1,255,652 | ) | (414,687 | ) | (78,684 | ) | |||||||||||
Reclassification to reserve for unfunded lending commitments | – | (27,937 | ) | – | |||||||||||||
Balance at end of year | $ | 459,376 | 365,150 | 338,399 | $ | 1,531,332 | 686,999 | 459,376 | |||||||||
The reclassification in 2008 reflects a refinement in the reserving process to include in the reserve for unfunded lending commitments the reserves for all unfunded lending commitments, including unfunded portions of partially funded credits previously reserved for as part of the allowance for loan losses. The reserve is included in other liabilities in the balance sheet and was increased by this reclassification. The amount of this reserve was $116.4 million and $50.9 million at December 31, 2009 and 2008, respectively.
Nonaccrual loans were $259$2,023 million (excluding $356 million of FDIC-supported loans) and $67$946 million at December 31, 20072009 and 2006,2008, respectively. Loans past due 90 days or more as to interest or principal and still accruing interest were $77$107 million (excluding $56 million of FDIC-supported loans) and $44$130 million at December 31, 20072009 and 2006,2008, respectively.
Our recorded investment in impaired loans was $226$1,925 million and $47$770 million at December 31, 20072009 and 2006,2008, respectively. Impaired loans of $103$435 million and $18$306 million at December 31, 20072009 and 20062008 required an allowance of $21$105 million and $6$52 million, respectively, which is included in the allowance for loan losses. Contractual interest due on impaired loans was $9.9 million in 2007, $3.3 million in 2006, and $2.6 million in 2005. Interest collected on theseimpaired loans and included in interest income was $4.0 million in 2009, $4.7 million in 2008, and $1.9 million in 2007, $0.6 million in 2006, and $0.3 million in 2005.2007. The average recorded investment in impaired loans was $1,374 million in 2009, $499 million in 2008, and $135 million in 2007, $39 million in 2006, and $33 million in 2005.
2007.
Concentrations of credit risk from financial instruments (whether on- or off-balance sheet) occur when groups of customers or counterparties have similar economic characteristics and are similarly affected by changes in economic or other conditions. Credit risk includes the loss that would be recognized subsequent to the reporting date if counterparties failed to perform as contracted. We have no significant exposure to any individual borrower. See Note 7 for a discussion of counterparty risk associated with the Company’s derivative transactions.
Most of our business activity is with customers located in the states of Utah, California, Texas, Arizona, Nevada, Colorado, Idaho, and Washington. The commercial loan portfolio is well diversified, consisting of 13nine major industry classification groupings based on Standard Industrialcodes under the North American Industry Classification codes.System. As of December 31, 2007,2009, the larger concentrations of risk were in the commercial, real estate, and construction portfolios. See discussion in Note 18 regarding commitments to extend additional credit.
In the latter half of 2007, the residential housing market deteriorated significantly in Arizona, California and Nevada. This resulted in increased credit risk for loans in these states related to residential land acquisition, development, and construction related business. In 2007, approximately 71% of the increase in both nonaccrual and impaired loans related to these states.
6. ASSET SECURITIZATIONS AND OFF-BALANCE SHEET ARRANGEMENT
Effective June 5, 2009, Zions Bank fully consolidated Lockhart, which previously functioned as an off-balance sheet qualifying special-purpose entity (“QSPE”) securities conduit. As of September 30, 2009, Lockhart was legally terminated. Prior to this consolidation, Zions Bank purchased securities at book value from Lockhart amounting to $678 million in 2009, $1,145 million in 2008, and $895 million during the fourth quarter
of 2007. Valuation losses resulting from these purchases were $187.9 million in 2009, $13.1 million in 2008, and SFAS No. 140,Accounting for TransfersServicing$49.6 million in 2007. Valuation losses were also incurred in 2009 when we purchased auction rate securities, as discussed in Note 4. The purchases of Financial Assetssecurities from Lockhart were made due to investment downgrades as required under a liquidity agreement between Zions Bank and ExtinguishmentsLockhart, and due to the inability of Liabilities, and related accounting pronouncements, provides accounting and reporting guidance for sales, securitizations, and servicingLockhart to issue a sufficient amount of receivables and other financial assets, secured borrowing and collateral transactions, and the extinguishment of liabilities.
We retain subordinated tranche interests or cash reserve accounts that serve as credit enhancements on our securitized loans. These retained interests provide us with rights to future cash flows arising after the investors in the securitizations have received the return for which they contracted, and after administrative and other expenses have been paid. The investors and the securitization entities have no recourse to other assets of the Company for failure of debtors to pay when due. Our retained interests are subject to credit, prepayment, and interest rate risks on the transferred loans and receivables.
commercial paper.
The gain or loss onsecurities purchased in 2008 included $987 million which comprised the sale of loans and receivables is the difference between the proceeds from the sale and the basis of the assets sold. The basis is determined by allocating the previous carrying amount between the assets sold and the retained interests, based on their relative fair values at the date of transfer. Fair values are based upon market prices at the time of sale for the assets and the estimated present value of future cash flows for the retained interests.
We previously sold home equity loans for cash to a revolving securitization structure for which we retain servicing responsibilities and receive servicing fees. On an annualized basis, these fees approximate 0.5% of the outstanding loan balances. We recognized income excluding servicing fees from these securitizations of $2.3 million in 2007, $4.7 million in 2006, and $6.3 million in 2005. In December 2006, we discontinued selling these loans into the revolving securitization structure.
We have also sold small business loans in prior years to securitization structures. Annualized servicing fees approximate 1% of the outstanding loan balances for these securitizations. For most small business loan sales, we do not establish a servicing asset because the lack of an active market does not make it practicable to estimate the fair value of servicing. Noentire remaining small business loan securitizations were completed during 2007 or 2006. Wecreated by Zions Bank and held by Lockhart. Upon dissolution of the securitization trusts (including a total of $170 million of related securities owned by the Parent), Zions Bank recorded $1,180 million of loans on its balance sheet including $23 million of premium. See further discussion of this premium in Note 21.
Income recognized a pretax gain of $2.6from previous loan securitizations, excluding servicing fees, was $2.3 million for a securitization completed in 2005.
Key economic assumptions used for measuring the retained interests at the date of sale in 2006 and 2005 for securitizations were as follows:
| Home equity loans | Small business loans | |||||
2006(2): | ||||||
Prepayment method | na(1) | na(2) | ||||
Annualized prepayment speed | na(1) | na(2) | ||||
Weighted average life (in months) | 11 | na(2) | ||||
Expected annual net loss rate | 0.10% | na(2) | ||||
Residual cash flows discounted at | 15.0% | na(2) | ||||
2005: | ||||||
Prepayment method | na(1) | CPR(3) | ||||
Annualized prepayment speed | na(1) | 4 – 15 Ramp in 25 months(4) | ||||
Weighted average life (in months) | 12 | 69 | ||||
Expected annual net loss rate | 0.10% | 0.40% | ||||
Residual cash flows discounted at | 15.0% | 15.0% | ||||
2007.
Certain cash flows between the CompanyZions Bank and the securitization structures are summarizedwere as follows(in millions):
| 2007 | 2006 | 2005 | |||||
Proceeds from new securitizations | $ | – | – | 707 | |||
Proceeds from loans sold into revolving securitizations | – | 174 | 412 | ||||
Servicing fees received | 17 | 23 | 23 | ||||
Other cash flows received on retained interests(1) | 84 | 94 | 86 | ||||
Total | $ | 101 | 291 | 1,228 | |||
| 2008 | 2007 | |||||
Purchases of loans previously securitized | $ | (1,180 | ) | – | ||
Servicing fees received | 6 | 17 | ||||
Other cash flows received on retained interests1 | 317 | 84 | ||||
Total | $ | (857 | ) | 101 | ||
| 1 | Represents total cash flows received from retained interests other than servicing fees. Other cash |
We recognize interestInterest income on retained interests in small business loan securitizationsrecognized in accordance with the provisions of EITF Issue No. 99-20,ASC 325-40,Recognition of Interest Income and Impairment on Purchased and Retained Beneficial Interests in Securitized Financial Assets(“EITF 99-20”). Interest, on the retained interests up to the time of their purchase was $0.6 million in 2008 and $10.6 million in 2007. These amounts did not include interest income thus recognized, excludingon revolving securitizations which arewere accounted for similar to trading securities, was $10.6 million in 2007, $12.7 million in 2006, and $17.7 million in 2005.securities.
EITF 99-20 requires periodic updates of the assumptions used to compute estimated cash flows for retained interests and a comparison of the net present value of these cash flows to the carrying value. We comply with EITF 99-20 by quarterly evaluating and updating our assumptions including the default assumptions as compared to historical credit losses and the credit loss expectation of the portfolio, and our prepayment speed assumptions as compared to historical prepayment speeds and the prepayment rate expectation. We also evaluate the discount rate on retained interest securities based on the analysis required by EITF 99-20. An impairment charge is required if the estimated market yield is lower than the current accretable yield and the security has a fair value less than its carrying value. Based on adjustments to assumptions for prepayment speeds, discount rates, and expected credit losses, weas required by ASC 325-40, Zions Bank recorded impairment losses totaling $12.6 million in 2007 and $7.1 million in 2006 on the value of the retained interests from certain small business loan securitizations.
Servicing fee income on all securitizations was $6.1 million in 2008 and $17.2 million in 2007, $23.3 million in 2006, and $22.7 million in 2005.2007. All amounts of pretax gains,interest income, impairment losses, interest income, and servicing fee income are included in loan sales and servicing income in the statement of income.
Key economic assumptions for all securitizations outstanding at December 31, 2007 and the sensitivity of the current fair value of capitalized residual cash flows to immediate 10% and 20% adverse changes in those assumptions are as follows at December 31, 2007(in millions of dollars and annualized percentage rates):
| Home equity loans | Small business loans | ||||||||
Carrying amount/fair value of capitalized residual cash flows | $ | 0.8 | 49.8 | ||||||
Weighted average life (in months) | 13.6 | 31 - 41 | |||||||
Prepayment speed assumption | na(1) | 20.0% - 26.0% | |||||||
Decrease in fair value due to adverse change | 10% | $ | 0.1 | 1.2 | |||||
| 20% | $ | 0.1 | 2.2 | ||||||
Expected credit losses | 0.10% | 0.50% - 1.00% | |||||||
Decrease in fair value due to adverse change | 10% | $ | < 0.1 | 1.6 | |||||
| 20% | $ | < 0.1 | 3.2 | ||||||
Residual cash flows discount rate | 12.0% | 16.0% | |||||||
Decrease in fair value due to adverse change | 10% | $ | < 0.1 | 1.1 | |||||
| 20% | $ | < 0.1 | 2.2 | ||||||
These sensitivities are hypothetical and should be used with caution. As the figures indicate, changes in fair value based on variations in assumptions cannot be extrapolated, as the relationship of the change in assumption to the change of fair value may not be linear. Also, the effect of a variation in one assumption is in reality, likely to further cause changes in other assumptions, which might magnify or counteract the sensitivities.
At December 31, 2007 and 2006, the weighted average expected static pool credit losses for small business loans were 1.23% and 0.95%. Static pool losses are calculated by summing the actual and projected future credit losses and dividing them by the original balance of each pool of assets.
The following table presents quantitative information about delinquencies and net credit losses for those categories of loans for which securitizations existed at December 31. The Company only securitizes loans originated or purchased by Zions Bank. Therefore, only loans and related delinquencies and net credit losses of commonly managed Zions Bank loans are included(in millions):
| Principal balance December 31, | Principal balance of loans past due 30+ days(1) December 31, | Net credit losses(2) | |||||||||||||
| 2007 | 2006 | 2007 | 2006 | 2007 | 2006 | 2005 | |||||||||
Home equity loans | $ | 852.5 | 726.0 | 0.4 | 0.4 | (0.1) | 0.2 | (0.1) | |||||||
Small business loans | 4,093.5 | 3,677.0 | 78.6 | 37.8 | 6.7 | 3.2 | 2.3 | ||||||||
Total loans managed or securitized – Zions Bank | 4,946.0 | 4,403.0 | 79.0 | 38.2 | 6.6 | 3.4 | 2.2 | ||||||||
Less loans securitized – Zions Bank(3) | 1,401.8 | 2,051.0 | |||||||||||||
Loans held in portfolio – Zions Bank | $ | 3,544.2 | 2,352.0 | ||||||||||||
Zions Bank provides a liquidity facility for a fee to Lockhart Funding, LLC (“Lockhart”), an off-balance sheet qualifying special-purpose entity (“QSPE”) securities conduit. Lockhart purchases floating rate U.S. Government and AAA-rated securities with funds from the issuance of asset-backed commercial paper. Zions Bank also provides interest rate hedging support and administrative and investment advisory services for a fee.
Pursuant to the Liquidity Agreement, Zions Bank is required to purchase securities from Lockhart to provide funds for Lockhart to repay maturing commercial paper upon Lockhart’s inability to access a sufficient amount of funding in the commercial paper market, or upon a commercial paper market disruption as specified in governing documents for Lockhart. Pursuant to the governing documents, including the Liquidity Agreement, if any security in Lockhart is downgraded below AA-, or the downgrade of one or more securities results in more than ten securities having ratings of AA+ to AA-, Zions Bank must either 1) place its letter of credit on the security, 2) obtain credit enhancement from a third party, or 3) purchase the security from Lockhart at book value. Zions Bank may incur losses if it is required to purchase securities from Lockhart when the fair value of the securities at the time of purchase is less than book value.
The commitment of Zions Bank to Lockhart is the lesser of the size of the liquidity facility of $6.12 billion at December 31, 2007, or the book value of Lockhart’s securities portfolio, which was approximately $2.1 billion at December 31, 2007. Lockhart is limited in size by program agreements, agreements with rating agencies, and the size of the liquidity facility.
During the fourth quarter of 2007, Zions Bank purchased $895 million of securities and interest at book value from Lockhart pursuant to the Liquidity Agreement. Of these purchases, $840 million were required when Lockhart was unable to access a sufficient amount of funding in the commercial paper market and $55 million resulted from rating downgrades. Zions Bank recorded valuation losses of
approximately $49.6 million, which were included in the statement of income with the $158.2 million of “Impairment losses on available-for-sale securities and valuation losses on securities purchased from Lockhart Funding.” The $2.1 billion book value of the remaining Lockhart’s securities portfolio exceeded the fair value of the securities by approximately $22 million at December 31, 2007 and $40 million at January 31, 2008.
In 2005, Zions Bank purchased a $12.4 million bond security from Lockhart as a result of a rating downgrade for which Zions Bank recorded a valuation loss of $1.6 million. Zions Bank recognized a gain of $0.8 million in 2006 when the security was sold and included the amount in fixed income securities gains in the statement of income.
During the third and fourth quarters of 2007 in the midst of disruptions in the credit markets and as allowed by the governing documents, the Company purchased asset-backed commercial paper from Lockhart. The average amount of commercial paper included in money market investments for the fourth quarter of 2007 was approximately $763 million. The amount of purchased commercial paper outstanding at December 31, 2007 was approximately $710 million. If at any given time the Company were to own more than 90% of Lockhart’s outstanding commercial paper (beneficial interest), Lockhart would cease to be a QSPE and the Company would be required to consolidate Lockhart in its financial statements.
On February 6, 2008, Zions Bank purchased $126 million of securities from Lockhart. Of these purchases, a $5 million security resulted from a rating downgrade for which Zions Bank recorded a valuation loss of approximately $0.8 million. The remaining $121 million of securities were purchased when Lockhart was unable to access a sufficient amount of funding in the commercial paper market. These securities consisted of securitizations of small business loans from Zions Bank and their purchase resulted in no gain or loss. Upon dissolution of the securitization trusts, these loans were recorded on the Company’s balance sheet.
In 2006,June 2009, the FASB issued SFAS No. 155,166,Accounting for Certain Hybrid Financial Instruments, an amendment of FASB Statements No. 133 and 140, and SFAS No. 156,Accounting for ServicingTransfers of Financial Assets, an amendment of FASB Statement No. 140.140(subsequently codified by ASU 2009-16 and included in ASC 860,Transfers and Servicing). This new accounting guidance becomes effective January 1, 2010. Among other things, SFAS 155 amends SFAS 140 by eliminatingit modifies the prohibition onaccounting for transfers of financial assets and removes the concept of a QSPE. Since Lockhart, as the Company’s only QSPE from holding a derivative financial instrument that pertainswas funded with commercial paper, was dissolved in 2009, management does not expect this new accounting guidance, upon adoption, to a beneficial interest other than another derivative financial instrument. SFAS 156 permits either measuring recorded servicing rights at fair value and including changes in earnings or amortizing servicing rights with periodic assessment for impairment or increasing the related obligation. Adoption of these Statements did not have a material effectany impact on the Company’s financial statements.
7. DERIVATIVE INSTRUMENTS AND HEDGING ACTIVITIES
ASC 815,Derivatives and Hedging, includes new guidance that we adopted January 1, 2009 regarding the disclosure of information about derivatives. Greater transparency is required in disclosing the objectives for their use, the volume of derivative activity, tabular disclosure of financial statement amounts, and any credit-risk-related features. The new disclosure requirements were not significantly different from the Company’s previous annual disclosures.
SFAS 133, as currently amended, establishes accounting and reporting standards for derivative instruments, including certain derivative instruments embedded in other contracts, and for hedging activities.
As required by SFAS 133, weWe record all derivatives on the balance sheet at fair value. See Note 21 for a discussion of the determination of fair value for derivatives. The accounting for changes in the fair value of derivatives depends on the intended use of the derivative and the resulting designation. Derivatives used to hedge the exposure to changes in the fair value of an asset, liability, or firm commitment attributable to a particular risk, such as interest rate risk, are considered fair value hedges. Derivatives used to hedge the exposure to variability in expected future cash flows, or other types of forecasted transactions, are considered cash flow hedges.
For derivatives designated as fair value hedges, changes in the fair value of the derivative are recognized in earnings together with changes in the fair value of the related hedged item. The net amount, if any, representing hedge ineffectiveness, is reflected in earnings. At December 31, 2009, the Company had no fair value hedges, as discussed subsequently.
For derivatives designated as cash flow hedges, the effective portion of changes in the fair value of the derivative are recorded in other comprehensive incomeOCI and recognized in earnings when the hedged transaction affects earnings. The ineffective
portion of changes in the fair value of cash flow hedges is recognized directly in earnings.
We assess the effectiveness of each hedging relationship by comparing the changes in fair value or cash flows on the derivative hedging instrument with the changes in fair value or cash flows on the designated hedged item or transaction. For derivatives not designated as hedges, changes in fair value are recognized in earnings.
Our objective in using derivatives is to add stability to interest income or expense, to modify the duration of specific assets or liabilities as we consider necessary, andadvisable, to manage exposure to interest rate movements or other identified risks.risks, and to directly offset derivatives sold to our customers. To accomplish this objective, we use interest rate swaps and floors as part of our cash flow hedging strategy. These derivatives are used to hedge the variable cash flows associated with designated commercial loans and investment securities. We useloans.
In previous years, we used fair value hedges to manage interest rate exposure to certain long-term debt. During the first quarter of 2009, we terminated all fair value hedges. After significant declines in short-term interest rates, we believed it was highly unlikely that short-term rates would go significantly lower. By terminating the swaps, we locked in a substantial gain due to the increase in their fair value and we increased our flexibility to exchange or modify the now unhedged subordinated debt. As discussed further in Note 13, the subordinated debt was modified beginning in the second quarter of 2009 and certain amounts were exchanged and/or converted during the remainder of 2009. As of December 31, 2007,2009, no derivatives were designated for hedges of investments in foreign operations.
Exposure to credit risk arises from the possibility of nonperformance by counterparties. These counterparties primarily consist of financial institutions that are well established and well capitalized. We control this credit risk through credit approvals, limits, pledges of collateral, and monitoring procedures. No losses on derivative instruments have occurred as a result of counterparty nonperformance. Nevertheless, the related credit risk is considered and measured when and where appropriate. We have no significant exposure to credit default swaps.
Interest rate swap agreements designated as cash flow hedges involve the receipt of fixed-rate amounts in exchange for variable-rate payments over the life of the agreements without exchange of the underlying principal amount. Fair value hedges are used to swap certain long-term debt from fixed-rate to floating rate. Derivatives not designated as accounting hedges, including basis swap agreements, are not speculative and are used to economically manage our exposure to interest rate movements and other identified risks, but do not meet the strict hedge accounting requirements of SFAS 133.requirements.
Selected information with respect to notional amounts and recorded gross fair values at December 31, 2009 and 2008, and the related income (expense)gain (loss) of derivative instruments for 2009 and 2008 is summarized as follows(in thousands):
| December 31, 2007 | Year ended December 31, 2007 | December 31, 2006 | Year ended December 31, 2006 | ||||||||||||||||||||||
| Notional amount | Fair value | Interest income (expense) | Other income (expense) | Offset to interest expense | Notional amount | Fair value | Interest income (expense) | Other income (expense) | Offset to interest expense | ||||||||||||||||
| Asset | Liability | Asset | Liability | ||||||||||||||||||||||
Cash flow hedges | |||||||||||||||||||||||||
Interest rate swaps | $ | 3,400,000 | 133,954 | – | (39,114) | 3,275,000 | 7,942 | 44,385 | (39,984) | ||||||||||||||||
Nonhedges | |||||||||||||||||||||||||
Interest rate swaps | 323,934 | 508 | 508 | (123) | 385,948 | 2,258 | 2,258 | (369) | |||||||||||||||||
Interest rate swaps for customers | 1,924,115 | 28,752 | 28,752 | 4,049 | 1,108,225 | 9,198 | 9,198 | 2,442 | |||||||||||||||||
Energy commodity swaps for customers | 1,047,928 | 66,393 | 66,393 | 710 | 320,725 | 7,302 | 7,302 | 504 | |||||||||||||||||
Basis swaps | 2,815,000 | 409 | 8,349 | (14,629) | 3,030,000 | 2,652 | 48 | 1,008 | |||||||||||||||||
| 6,110,977 | 96,062 | 104,002 | (9,993) | 4,844,898 | 21,410 | 18,806 | 3,585 | ||||||||||||||||||
Fair value hedges | |||||||||||||||||||||||||
Long-term debt and other borrowings | 1,400,000 | 77,436 | – | 1,989 | 1,400,000 | 22,397 | – | 1,018 | |||||||||||||||||
Total | $ | 10,910,977 | 307,452 | 104,002 | (39,114) | (9,993) | 1,989 | 9,519,898 | 51,749 | 63,191 | (39,984) | 3,585 | 1,018 | ||||||||||||
| December 31, 2009 | Year Ended December 31, 2009 | December 31, 2008 | Year Ended December 31, 2008 | ||||||||||||||||||||||||||||
| Amount of derivative gain (loss) recognized/reclassified | Amount of derivative gain (loss) recognized/reclassified | ||||||||||||||||||||||||||||||
| OCI | Reclassified from AOCI to interest income | Noninterest income | Offset to interest expense | OCI | Reclassified from AOCI to interest income | Noninterest income | Offset to interest expense | ||||||||||||||||||||||||
| Notional amount | Fair value | Notional amount | Fair value | ||||||||||||||||||||||||||||
| Other assets | Other liabilities | Other assets | Other liabilities | ||||||||||||||||||||||||||||
Derivatives designated as hedging instruments | |||||||||||||||||||||||||||||||
Asset derivatives | |||||||||||||||||||||||||||||||
Cash flow hedges1: | |||||||||||||||||||||||||||||||
Interest rate | $ | 865,000 | 52,539 | – | 11,457 | 112,847 | 2,405,000 | 237,912 | – | 270,223 | 67,134 | ||||||||||||||||||||
Interest rate floors | 170,000 | 4,249 | – | 3,016 | 5,550 | 255,000 | 8,106 | – | 9,735 | 392 | |||||||||||||||||||||
Terminated swaps and floors | 104,706 | (1,664 | ) | ||||||||||||||||||||||||||||
| 1,035,000 | 56,788 | – | 14,473 | 118,397 | 104,706 | 3 | 2,660,000 | 246,018 | – | 279,958 | 67,526 | (1,664 | )3 | ||||||||||||||||||
Liability derivatives | |||||||||||||||||||||||||||||||
Fair value hedges: | |||||||||||||||||||||||||||||||
Long-term debt | 26,170 | 1,400,000 | 235,704 | – | 35,074 | ||||||||||||||||||||||||||
Total derivatives designated as hedging instruments | 1,035,000 | 56,788 | – | 14,473 | 118,397 | 104,706 | 26,170 | 4,060,000 | 481,722 | – | 279,958 | 67,526 | (1,664 | ) | 35,074 | ||||||||||||||||
Derivatives not designated as hedging instruments | |||||||||||||||||||||||||||||||
Interest rate | 210,354 | 3,966 | 4,011 | (983 | ) | 266,726 | 6,375 | 6,093 | (18,984 | ) | |||||||||||||||||||||
Interest rate swaps for customers2 | 3,234,378 | 69,008 | 69,382 | 7,585 | 2,739,173 | 104,100 | 107,270 | 2,436 | |||||||||||||||||||||||
Energy commodity swaps for customers2 | 125,895 | 12,483 | 12,194 | 600 | 645,417 | 50,063 | 50,065 | 390 | |||||||||||||||||||||||
Basis swaps | 505,000 | 131 | 53 | 8,014 | 1,795,000 | – | 14,693 | (18,332 | ) | ||||||||||||||||||||||
Futures contracts | 4,386,000 | – | – | 508 | 299,000 | – | – | 527 | |||||||||||||||||||||||
Total derivatives not designated as hedging instruments | 8,461,627 | 85,588 | 85,640 | 15,724 | 5,745,316 | 160,538 | 178,121 | (33,963 | ) | ||||||||||||||||||||||
Total derivatives | $ | 9,496,627 | 142,376 | 85,640 | 14,473 | 118,397 | 120,430 | 26,170 | 9,805,316 | 642,260 | 178,121 | 279,958 | 67,526 | (35,627 | ) | 35,074 | |||||||||||||||
| 1 | Amounts recognized in OCI and reclassified from accumulated OCI (“AOCI”) represent the effective portion of the derivative gain (loss). |
| 2 | Amounts include both the customer swaps and the offsetting derivative contracts. |
| 3 | Amounts for 2009 and 2008 of $104,706 and $(1,664), respectively, which reflect the acceleration of OCI amounts reclassified to income that related to previously terminated hedges, together with the reclassification amounts of $118,397 and $67,526, or a total of $223,103 and $65,862, are the amounts of reclassification included in the changes in OCI presented in Note 14. |
At December 31, 2009, the fair values of derivative assets and liabilities were reduced by net credit valuation adjustments of $2.0 million and $1.6 million, respectively. These adjustments are required to reflect both our own nonperformance risk and the respective counterparty’s nonperformance risk.
Fair value amounts recognized for the right to reclaim cash collateral (a receivable) or the obligation to return cash collateral (a payable) have been offset against recognized fair value amounts of derivatives executed with the same counterparty under a master netting arrangement. At December 31, 2009 and 2008, cash collateral was used to reduce recorded amounts of derivative assets by $8 million and $247 million and derivative liabilities by $14 million and $2 million, respectively.
Interest rate swaps and energy commodity swaps for customers result from a service we provide.are offered to assist customers in managing their exposure to fluctuating interest rates and energy prices. Upon issuance, all of these customer swaps are immediately “hedged” by offsetting derivative contracts, such that the Company minimizes its net risk exposure resulting from such
transactions. Fee income from customer swaps is included in other service charges, commissions and fees. As with other derivative instruments, we have credit risk for any nonperformance by counterparties.
Other income (expense) from nonhedgeFutures contracts are primarily highly liquid exchange-traded federal funds futures contracts that are traded to manage interest rate risk on certain CDO securities. These identified mixed straddle trades are executed to convert three- and basis swaps is includedsix-month fixed cash flows into cash flows that vary with daily fluctuations in trading and nonhedge derivative income in the statement of income. Interest income on fair value hedges is used to offset interest expense on long-term debt. The change in net unrealized gains or losses for derivatives designated asrates. These transactions are cash flow hedges is separately disclosed in the statement of changes in shareholders’ equity and comprehensive income.
Amounts for hedge ineffectiveness on the Company’s cash flow hedging relationships are included in trading and nonhedge derivative income. These amounted to a gain of approximately $0.3 million in 2007 and a loss of $0.9 million in 2005. There was no hedge ineffectiveness in 2006.
settled daily.
The remaining balances of any derivative instruments terminated prior to maturity, including amounts in accumulated other comprehensive incomeAOCI for swap hedges, are accreted or amortized generally on a straight-line basis to interest income or expense over the period to their previously stated maturity dates.
During 2009, the Company recognized a gain when certain debt was modified. See discussion in Note 13.
Amounts reported in accumulated other comprehensive income related to derivativesAOCI are reclassified to interest income as interest payments are receivedis earned on variable rate loans and investment securities. The change in net unrealized gainsas amounts for terminated hedges are accreted or losses on cash flow hedges discussed above reflects a reclassification of net unrealized gains or losses from accumulated other comprehensive incomeamortized to interest income, as disclosed in Note 14.earnings. For 2008,2010, we estimate that an additional $20$70 million of gains and accretion/amortization will be reclassified.
8. PREMISES AND EQUIPMENT
Premises and equipment are summarized as follows at December 31(in thousands):
| 2007 | 2006 | ||||
Land | $ | 169,941 | 151,997 | ||
Buildings | 380,337 | 346,389 | |||
Furniture and equipment | 528,411 | 485,712 | |||
Leasehold improvements | 117,822 | 108,861 | |||
Total | 1,196,511 | 1,092,959 | |||
Less accumulated depreciation and amortization | 540,799 | 483,487 | |||
Net book value | $ | 655,712 | 609,472 | ||
| 2009 | 2008 | ||||
Land | $ | 185,806 | 181,849 | ||
Buildings | 445,632 | 412,026 | |||
Furniture and equipment | 586,648 | 574,162 | |||
Leasehold improvements | 115,096 | 117,432 | |||
Total | 1,333,182 | 1,285,469 | |||
Less accumulated depreciation and amortization | 622,648 | 598,373 | |||
Net book value | $ | 710,534 | 687,096 | ||
9. GOODWILL AND OTHER INTANGIBLE ASSETS
Core deposit and other intangible assets and related accumulated amortization are as follows at December 31(in thousands):
| Gross carrying amount | Accumulated amortization | Net carrying amount | |||||||||||
| 2007 | 2006 | 2007 | 2006 | 2007 | 2006 | ||||||||
Core deposit intangibles | $ | 287,973 | 262,674 | (167,102) | (134,292) | 120,871 | 128,382 | ||||||
Customer relationships and other intangibles | 52,350 | 46,246 | (23,728) | (12,494) | 28,622 | 33,752 | |||||||
| $ | 340,323 | 308,920 | (190,830) | (146,786) | 149,493 | 162,134 | |||||||
| Gross carrying amount | Accumulated amortization | Net carrying amount | |||||||||||||
| 2009 | 2008 | 2009 | 2008 | 2009 | 2008 | ||||||||||
Core deposit intangibles | $ | 225,766 | 226,700 | (123,618 | ) | (119,650 | ) | 102,148 | 107,050 | ||||||
Customer relationships and other intangibles | 33,974 | 52,350 | (22,706 | ) | (33,465 | ) | 11,268 | 18,885 | |||||||
| $ | 259,740 | 279,050 | (146,324 | ) | (153,115 | ) | 113,416 | 125,935 | |||||||
The amount of amortization expense of core deposit and other intangible assets is separately reflected in the statement of income. At December 31, 2007, we had $0.8In 2009, this amortization expense included approximately $2.6 million for the impairment of certain amounts for customer relationships and other intangible assets with indefinite lives.intangibles.
Estimated amortization expense for core deposit and other intangible assets is as follows for the five years succeeding December 31, 20072009(in thousands):
2008 | $ | 32,522 | ||||
2009 | 24,441 | |||||
2010 | 20,796 | $ | 25,517 | |||
2011 | 15,329 | 20,014 | ||||
2012 | 12,650 | 16,962 | ||||
2013 | 14,553 | |||||
2014 | 11,105 | |||||
Changes in the carrying amount of goodwill by operating segment are as follows(in thousands):
| Zions Bank | CB&T | Amegy | NBA | NSB | Vectra | TCBW | Other | Consolidated Company | Zions Bank | CB&T | Amegy | NBA | NSB | Vectra | Other | Consolidated Company | ||||||||||||||||||||||||||||
Balance as of December 31, 2005 | $ | 21,299 | 382,119 | 1,248,070 | 62,397 | 21,051 | 151,465 | – | 1,187 | 1,887,588 | ||||||||||||||||||||||||||||||||||
Goodwill acquired during the year | 600 | 17,457 | 18,057 | |||||||||||||||||||||||||||||||||||||||||
Tax benefit realized from share-based awards converted in acquisition | (4,298) | (4,298) | ||||||||||||||||||||||||||||||||||||||||||
Balance as of December 31, 2007 | $ | 21,738 | 379,024 | 1,249,066 | 168,525 | 21,051 | 151,465 | 18,644 | 2,009,513 | |||||||||||||||||||||||||||||||||||
Goodwill of subsidiary transferred | (2,224 | ) | 2,224 | – | ||||||||||||||||||||||||||||||||||||||||
Purchase accounting adjustments | (830) | (830) | 45 | 45 | ||||||||||||||||||||||||||||||||||||||||
Balance as of December 31, 2006 | 21,899 | 382,119 | 1,242,942 | 62,397 | 21,051 | 151,465 | – | 18,644 | 1,900,517 | |||||||||||||||||||||||||||||||||||
Goodwill acquired during the year | 1,624 | 8,477 | 106,128 | 116,229 | ||||||||||||||||||||||||||||||||||||||||
Goodwill of subsidiary sold | (1,785) | (1,785) | ||||||||||||||||||||||||||||||||||||||||||
Impairment losses | (168,570 | ) | (21,051 | ) | (151,465 | ) | (12,718 | ) | (353,804 | ) | ||||||||||||||||||||||||||||||||||
Tax benefit realized from share-based awards converted in acquisition | (2,069) | (2,069) | (120 | ) | (120 | ) | ||||||||||||||||||||||||||||||||||||||
Goodwill reclassified | (3,095 | ) | (284) | (3,379) | 4 | (4,261 | ) | (4,257 | ) | |||||||||||||||||||||||||||||||||||
Balance as of December 31, 2007 | $ | 21,738 | 379,024 | 1,249,066 | 168,525 | 21,051 | 151,465 | – | 18,644 | 2,009,513 | ||||||||||||||||||||||||||||||||||
Balance as of December 31, 2008 | 19,514 | 379,024 | 1,248,950 | – | – | – | 3,889 | 1,651,377 | ||||||||||||||||||||||||||||||||||||
Impairment losses | (633,327 | ) | (2,889 | ) | (636,216 | ) | ||||||||||||||||||||||||||||||||||||||
Balance as of December 31, 2009 | $ | 19,514 | 379,024 | 615,623 | – | – | – | 1,000 | 1,015,161 | |||||||||||||||||||||||||||||||||||
The acquisitionIn 2008, the transfer of P5 in 2006 resulting in $17.5$2.2 million of goodwill is discussed further in Note 3.resulted when the Parent acquired Welman from Zions Bank. The acquisitions of Intercon (by Amegy) and Stockmen’s in 2007 resulting in goodwill of $8.5 million and $106.1 million, respectively, are discussed further in Note 3. The tax benefits realized from share-based awards are discussed in Note 17.
The $3.1$4.3 million reclassification of goodwill at CB&T was to other liabilities and resulted from the recognition under FIN 48other segment related to the release of the remainingvaluation allowance established for the acquired stateP5 net operating loss carryforward benefits following the completioncarryforwards, as further discussed in Note 15. In 2009, impairment losses of $2.9 million related primarily to Welman.
The impairment losses reflect our Company-wide annual impairment testing conducted as of October 1 of each year and updated on a state tax examination in 2007. There was no impact on net income.
During the fourth quarter of 2007, we completed the annualmore frequent basis when events or circumstances indicate that impairment could have taken place. The Amegy goodwill impairment review required by SFAS 142resulted from an evaluation performed for Amegy and did not recognize any impairment losses for 2007.
The 2005 impairment loss on goodwill of $0.6 million shown in the statement of income removed all of the goodwill related to Zions Bank International Ltd. (“ZBI”), an odd-lot bond trading operation,CB&T effective February 28, 2009 due to the Company’s decision to restructureperformance deterioration and ultimately closedeclines in bank market values from December 31, 2008.
The amount of the London officeimpairment losses was determined based on the calculation process specified in 2005. The restructuring charges of $2.4 million in 2005 relateASC 350,Intangibles – Goodwill and Other, which compares carrying value to the ZBI restructuring.
estimated fair values of assets and liabilities. These fair values were estimated with the assistance of independent valuation consultants utilizing the provisions of ASC 820. The estimation process took into account both market value and transaction value approaches including management estimates of projected discounted cash flow. Where applicable, we used recent market valuations and transactions from banks similar in size, operations and geography to our subsidiary banks. The analysis took into account the continued market deterioration and weaker economic outlook for the applicable states.
10. DEPOSITS
At December 31, 2007,2009, the scheduled maturities of all time deposits were as follows(in thousands):
2008 | $ | 7,417,771 | |
2009 | 361,493 | ||
2010 | 137,377 | ||
2011 | 66,611 | ||
2012 | 82,932 | ||
Thereafter | 879 | ||
| $ | 8,067,063 | ||
2010 | $ | 5,101,424 | |
2011 | 445,709 | ||
2012 | 139,970 | ||
2013 | 114,438 | ||
2014 | 87,385 | ||
Thereafter | 2,407 | ||
| $ | 5,891,333 | ||
At December 31, 2007,2009, the contractual maturities of domestic time deposits with a denomination of $100,000 and over were as follows: $1,852$1,163 million in 3 months or less, $1,246$662 million over 3 months through 6 months, $1,022$930 million over 6 months through 12 months, and $272$362 million over 12 months.
Domestic time deposits $100,000 and over were $4.4$3.1 billion and $4.3$4.8 billion at December 31, 20072009 and 2006,2008, respectively. Foreign time deposits $100,000 and over were $1,113$276 million and $945$504 million at December 31, 20072009 and 2006,2008, respectively.
Deposit overdrafts reclassified as loan balances were $35$19 million and $48$39 million at December 31, 20072009 and 2006,2008, respectively.
11. SHORT-TERM BORROWINGS
Selected information for certain short-term borrowings is as follows(in thousands):
| 2007 | 2006 | 2005 | |||||
Federal funds purchased: | |||||||
Average amount outstanding | $ | 2,166,652 | 1,747,256 | 1,456,531 | |||
Weighted average rate | 5.06% | 5.06% | 3.02% | ||||
Highest month-end balance | $ | 2,865,076 | 2,586,072 | 1,683,509 | |||
Year-end balance | 2,463,460 | 1,993,483 | 1,255,662 | ||||
Weighted average rate on outstandings at year-end | 3.84% | 5.16% | 3.97% | ||||
Security repurchase agreements: | |||||||
Average amount outstanding | $ | 1,044,465 | 1,090,452 | 850,510 | |||
Weighted average rate | 3.73% | 3.33% | 2.30% | ||||
Highest month-end balance | $ | 1,298,112 | 1,225,107 | 1,027,658 | |||
Year-end balance | 1,298,112 | 934,057 | 1,027,658 | ||||
Weighted average rate on outstandings at year-end | 3.07% | 3.60% | 2.62% | ||||
| 2009 | 2008 | 2007 | ||||||||
Federal funds purchased: | ||||||||||
Average amount outstanding | $ | 1,290,140 | 1,768,782 | 2,166,652 | ||||||
Weighted average rate | 0.30 | % | 2.20 | % | 5.06 | % | ||||
Highest month-end balance | $ | 1,659,303 | 2,379,055 | 2,865,076 | ||||||
Year-end balance | 208,669 | 965,835 | 2,463,460 | |||||||
Weighted average rate on outstandings at year-end | 0.21 | % | 0.33 | % | 3.84 | % | ||||
Security repurchase agreements: | ||||||||||
Average amount outstanding | $ | 632,756 | 964,801 | 1,044,465 | ||||||
Weighted average rate | 0.30 | % | 1.50 | % | 3.73 | % | ||||
Highest month-end balance | $ | 784,182 | 1,218,507 | 1,298,112 | ||||||
Year-end balance | 577,346 | 899,751 | 1,298,112 | |||||||
Weighted average rate on outstandings at year-end | 0.16 | % | 0.41 | % | 3.07 | % | ||||
These short-term borrowings generally mature in less than 30 days. Our participation in security repurchase agreements is on an overnight or term basis. Certain overnight agreements are performed with sweep accounts in conjunction with a master repurchase agreement. In this case, securities under our control are pledged for and interest is paid on the collected balance of the customers’ accounts. For term repurchase agreements, securities are transferred to the applicable counterparty. The counterparty, in certain instances, is contractually entitled to sell or repledge securities accepted as collateral. As of December 31, 2007,2009, overnight security repurchase agreements were $690$546 million and term security repurchase agreements were $608$31 million.
FHLB short-term advances and otherOther borrowings one year or less are summarized as follows at December 31(in thousands):
| 2007 | 2006 | ||||
FHLB short-term advances, 4.33% – 5.31% | $ | 2,725,000 | 501,000 | ||
Federal Reserve auction borrowings, 4.25% – 4.55% | 450,000 | – | |||
Other | 6,990 | 16,925 | |||
| $ | 3,181,990 | 517,925 | |||
| 2009 | 2008 | ||||
Senior medium-term notes, 5.35% - 5.50% | $ | 117,134 | 235,489 | ||
Federal Reserve auction borrowings | – | 1,800,000 | |||
Other | 3,055 | 4,364 | |||
| $ | 120,189 | 2,039,853 | |||
AtThe unsecured senior medium term notes mature at various dates through December 31, 2007, the average remaining maturities of FHLB short-term advances were 15 days and remaining maturities of Federal Reserve borrowings were three days.
2010 (see also Note 13).
The Company’s subsidiary banks may borrow from the FHLB advances are borrowed by banking subsidiaries under their lines of credit whichthat are secured under blanket pledge arrangements. The subsidiariessubsidiary banks maintain unencumbered collateral with a carrying amountamounts adjusted for the types of collateral pledged, equal to at least 100% of the outstanding advances. At December 31, 2007,2009, the amount available for additional FHLB advances was approximately $3.5$8.6 billion. An additional $1.3 billion$423 million could be borrowed upon the pledging of additional available collateral.
The Federal Reserve borrowings were made by Zions Bank under a new program announced in December 2007 by
Our subsidiary banks borrow from the Federal Reserve Board to make 28 day loans available through an auction process.the Term Auction Facility. Amounts that the Company’s banking subsidiaries can borrowbe borrowed are based upon the amount of collateral pledged to thea Federal Reserve Bank. At December 31, 2007,2009, the amount available for additional Federal Reserve borrowings was approximately $2.3$3.8 billion. An additional $5.7 billion$234 million could be borrowed upon the pledging of additional available collateral.
The Company also had short-term commercial paper outstanding at December 31, 2007 of $297.9 million at rates ranging from 4.46% to 5.43% and $220.5 million outstanding at December 31, 2006.
12. FEDERAL HOME LOAN BANK LONG-TERM ADVANCES AND OTHER BORROWINGS
FHLB long-term advances and other borrowings over one year are summarized as follows at December 31(in thousands):
| 2007 | 2006 | ||||
FHLB long-term advances, 3.66% – 7.30% | $ | 127,612 | 130,058 | ||
SBA notes payable, 5.49% – 8.64% | – | 7,000 | |||
| $ | 127,612 | 137,058 | |||
| 2009 | 2008 | ||||
FHLB long-term advances, 2.81% - 6.98% | $ | 15,722 | 128,253 | ||
The weighted average interest rate on FHLB advances outstanding was 5.7%5.0% and 5.6% at December 31, 20072009 and 2006.
2008, respectively.
Interest expense on FHLB advances and other borrowings over one year was $2.7 million in 2009, $7.4 million in 2008, and $7.5 million in 2007, $8.6 million in 2006, and $11.5 million in 2005.
2007.
Maturities of FHLB advances and other borrowings with original maturities over one year are as follows at December 31, 20072009(in thousands):
2008 | $ | 2,594 | |
2009 | 1,795 | ||
2010 | 101,619 | ||
2011 | 2,592 | ||
2012 | 1,521 | ||
Thereafter | 17,491 | ||
| $ | 127,612 | ||
2014 Thereafter $ 80 15,642 $ 15,722
13. LONG-TERM DEBT
Long-term debt at December 31 is summarized as follows(in thousands):
| 2007 | 2006 | ||||
Junior subordinated debentures related to trust preferred securities | $ | 462,033 | 467,850 | ||
Subordinated notes | 1,547,727 | 1,492,082 | |||
Senior medium-term notes | 450,655 | 394,984 | |||
Capital lease obligations and other | 2,839 | 2,805 | |||
| $ | 2,463,254 | 2,357,721 | |||
| 2009 | 2008 | ||||
Junior subordinated debentures related to trust preferred securities | $ | 461,858 | 461,888 | ||
Convertible subordinated notes | 530,186 | – | |||
Subordinated notes | 288,394 | 1,706,603 | |||
Senior medium-term notes | 736,309 | 324,125 | |||
Capital lease obligations and other | 473 | 752 | |||
| $ | 2,017,220 | 2,493,368 | |||
The preceding amounts represent the par value of the debt adjusted for any unamortized premium or discount or other basis adjustments including the value of associated hedges.
Junior subordinated debentures related to trust preferred securities primarily include Zions Capital Trust B (“ZCTB”), Amegy Statutory Trusts I, II and III (“Amegy Trust I, II or III”), and Stockmen’s Statutory Trusts II and III (“Stockmen’s Trust II or III”) as follows at December 31, 20072009(in thousands):
| Balance | Interest rate | Early redemption | Maturity | |||||||||||||
| Balance | Interest rate | Maturity | ||||||||||||||
ZCTB | $ | 293,815 | 8.00% | Currently redeemable | Sep 2032 | $ | 293,815 | 8.00% | Sep 2032 | |||||||
Amegy Trust I | 51,547 | 3mL+2.85%(1) (8.54%) | Dec 2008 | Dec 2033 | 51,547 | 3mL+2.85%1 | Dec 2033 | |||||||||
| (3.10%) | ||||||||||||||||
Amegy Trust II | 36,083 | 3mL+1.90%(1) (7.26%) | Oct 2009 | Oct 2034 | 36,083 | 3mL+1.90%1 | Oct 2034 | |||||||||
| (2.18%) | ||||||||||||||||
Amegy Trust III | 61,856 | 3mL+1.78%(1) (7.47%) | Dec 2009 | Dec 2034 | 61,856 | 3mL+1.78%1 | Dec 2034 | |||||||||
| (2.03%) | ||||||||||||||||
Stockmen’s Trust II | 7,759 | 3mL+3.15%(1) (8.01%) | Mar 2008 | Mar 2033 | 7,732 | 3mL+3.15%1 | Mar 2033 | |||||||||
| (3.40%) | ||||||||||||||||
Stockmen’s Trust III | 7,838 | 3mL+2.89%(1) (7.88%) | Mar 2009 | Mar 2034 | 7,732 | 3mL+2.89%1 | Mar 2034 | |||||||||
| (3.14%) | ||||||||||||||||
Intercontinental Statutory Trust I | 3,093 | 3mL+2.85%1 | Mar 2034 | |||||||||||||
| 3,135 | 3mL+2.85%(1) (8.54%) | Mar 2009 | Mar 2034 | (3.10%) | ||||||||||||
| $ | 462,033 | $ | 461,858 | |||||||||||||
| 1 | Designation of “3mL” is three-month LIBOR (London Interbank Offer Rate); effective interest rate at the beginning of the accrual period commencing on or before December 31, |
The junior subordinated debentures are issued by the Company and relate to a corresponding series of trust preferred security obligations issued by the trusts. The trust obligations are in the form of capital securities subject to mandatory redemption upon repayment of the junior subordinated debentures by the Company. The sole assets of the trusts are the junior subordinated debentures.
Interest distributions are made quarterly at the same rates earned by the trusts on the junior subordinated debentures; however, we may defer the payment of interest on the junior subordinated debentures. Early redemption is currently possible on all of the debentures begins at the date indicated and requires the approval of banking regulators. The debentures for ZCTB are direct and unsecured obligations of the Company and are subordinate to other indebtedness and general creditors. The debentures for Amegy Trust I, II and III are direct and unsecured obligations of Amegy and are subordinate to other indebtedness and general creditors. The debentures for Stockmen’s Trust II and III are unsecured obligations assumed by the Company in connection with the acquisition of Stockmen’s by NBA. The Company has unconditionally guaranteed the obligations of ZCTB with respect to its trust preferred securities to the extent set forth in the applicable guarantee agreement. Amegy has unconditionally guaranteed the obligations of Amegy Trust I, II and III with respect to their respective series of trust preferred securities to the extent set forth in the applicable guarantee agreements.
The Company incurred a debt extinguishment cost of $7.3 million when it redeemed certain junior subordinated debentures with the proceeds from the issuance of preferred stock in December 2006.
Subordinated notes consist of the following at December 31, 20072009(in thousands):
Interest rate | Balance | Par amount | Maturity | Convertible subordinated notes | Subordinated notes | Maturity | ||||||||||||
Interest rate | Balance | Par amount | Balance | Par amount | Maturity | |||||||||||||
| $ | 318,109 | 300,000 | May 2014 | $ | 122,079 | 261,674 | 38,814 | 34,680 | ||||||||||
6.00% | 533,083 | 500,000 | Sep 2015 | 187,344 | 408,419 | 90,799 | 80,445 | Sep 2015 | ||||||||||
5.50% | 621,535 | 600,000 | Nov 2015 | 220,763 | 476,333 | 83,781 | 75,010 | Nov 2015 | ||||||||||
3mL+1.25%(1) (6.50%) | 75,000 | 75,000 | Sep 2014 | |||||||||||||||
3mL+1.25%1 (1.56%) | 75,000 | 75,000 | Sep 2014 | |||||||||||||||
| $ | 1,547,727 | $ | 530,186 | 1,146,426 | 288,394 | 265,135 | ||||||||||||
| 1 | Designation of “3mL” is three-month LIBOR; effective interest rate at |
These notes are unsecured and are not redeemable prior to maturity. Interest is payable semiannually. We hedged
During June 2009, we exchanged approximately $0.2 billion par value of the fixed-ratesubordinated notes for new notes with LIBOR-based floatingthe same terms. The remaining $1.2 billion par value of the subordinated notes was modified to permit conversion on a par-for-par basis into either the Company’s Series A or Series C preferred stock. The carrying value of the subordinated notes included associated terminated fair value hedges. In December 2009, we modified an additional $40 million of subordinated debt in a manner similar to the previous subordinated debt modification. Holders of the convertible subordinated debt are allowed to convert on the interest rate swaps whosepayment dates of the debt. Net of issuance costs and debt discount on the previous debt, the total pretax gain recognized in the statement of income from these subordinated debt modifications was $508.9 million. The gain was calculated as the difference between the fair value of the modified convertible subordinated notes and the carrying value of the extinguished debt on the transaction dates.
In connection with these subordinated debt modifications, we also recorded fair values aggregated $77.4 million and $22.4the intrinsic value of the beneficial conversion feature directly in common stock, as discussed in Note 14.
The debt discount recorded in connection with the subordinated debt modifications amounted to $616.2 million at December 31, 20072009. This debt discount is being amortized to interest expense using the interest method over the remaining terms of the convertible subordinated notes. If and 2006, respectively. We account for all swapswhen holders of the convertible subordinated notes convert to preferred stock, the rate of amortization is accelerated by immediately expensing any unamortized discount associated with long-termthe converted debt.
During 2009, following the subordinated debt as fair value hedges in accordance with SFAS 133,modification, approximately $63.4 million of convertible subordinated notes were converted into preferred stock. Amortization of the convertible subordinated debt discount was accelerated by approximately $35.7 million. Total amortization of debt discount during 2009 was approximately $65.7 million, of which $62.7 million related to the convertible subordinated debt.
During the first quarter of 2009, as discussed in Note 7. We issued7, we terminated all fair value hedges that had been used for the 5.50% notes in November 2005 in connection with our acquisitionsubordinated notes. The remaining value of Amegy, which$23.7 million at December 31, 2009 is discussed in Note 3. being amortized as a reduction of interest expense over the periods to the previously stated maturity dates of the notes.
The $75 million floating rate subordinated notes were issued by Amegy.
Senior medium-term notes consist of the following at December 31, 2009(in thousands):
Interest rate | Balance | Par amount | Early redemption | Maturity | |||||
3mL+0.12%(1) (5.36%) | $ | 18,025 | 18,025 | na | Apr 2008 | ||||
3mL+0.12%(1) (5.11%) | 137,000 | 137,000 | na | Sep 2008 | |||||
3mL+1.5%(1) (6.64%) | 295,630 | 295,630 | Dec 2008 | Dec 2009 | |||||
| $ | 450,655 | ||||||||
Interest rate | Balance | Par amount | Interest payments | Maturity | |||||
3mL+0.37% (0.65%) | $ | 254,334 | 254,892 | Quarterly | Jun 2012 | ||||
7.75% | 401,294 | 458,806 | Semiannually | Sep 2014 | |||||
5.25% - 6.00% | 80,681 | na | Semiannually | May 2010 - Sep 2011 | |||||
| $736,309 | |||||||||
| 1 | Designation of “3mL” is three-month LIBOR; effective interest rate at |
These notes have beenare unsecured and are not redeemable prior to maturity. The variable rate notes are guaranteed under the FDIC’s Temporary Liquidity Guarantee Program that became effective on November 21, 2008. The remaining notes were issued under a shelf registration filed with the Securities and Exchange Commission (“SEC”). They are unsecured and require quarterly interest payments. Proceeds from the issuance of theseSEC. The $80.7 million notes were used generally to retire previous indebtednesssold via the Company’s online auction process and direct sales.
In 2009, we redeemed $295.6 million of senior and subordinatedmedium-term notes.
Interest expense on long-term debt was $175.7 million in 2009, $103.1 million in 2008, and $145.4 million in 2007, $159.6 million in 2006, and $104.9 million in 2005.2007. Interest expense was reduced by $26.2 million in 2009, $35.1 million in 2008, and $2.0 million in 2007 $1.0 million in 2006, and $8.9 million in 2005 as a result of the associated hedges.
Maturities on long-term debt are as follows for the years succeeding December 31, 20072009(in thousands):
| Consolidated | Parent only | ||||
2008 | $ | 155,833 | 155,025 | ||
2009 | 296,469 | 295,630 | |||
2010 | 843 | ||||
2011 | 104 | ||||
2012 | – | ||||
Thereafter | 1,932,394 | 1,704,570 | |||
| $ | 2,385,643 | 2,155,225 | |||
2010 2011 2012 2013 2014 Thereafter Consolidated Parent only $ 72,685 72,626 8,055 8,055 254,334 254,334 – – 633,034 558,034 1,025,400 872,407 $ 1,993,508 1,765,456
These maturities do not include basis adjustments and the associated hedges. The Parent only maturities at December 31, 20072009 include $309.3 million of junior subordinated debentures payable to ZCTB and Stockmen’s Trust II and III after 2012.
2014.
14. SHAREHOLDERS’ EQUITY
In December 2006, we issued 240,000We have 3,000,000 authorized shares of ourpreferred stock without par value and with a liquidation preference of $1,000 per share. In general, preferred shareholders may receive asset distributions before common shareholders; however, preferred shareholders have only limited voting rights generally with respect to certain provisions of the preferred stock, the issuance of senior preferred stock, and the election of directors. Preferred stock dividends reduce earnings available to common shareholders and are paid quarterly in arrears. Redemption of the preferred stock is at the Company’s option, after the expiration of any applicable redemption restrictions. The redemption amount is computed at the per share liquidation preference plus any declared but unpaid dividends. The Series A and C shares are registered with the SEC.
Preferred stock at December 31 is summarized as follows(dollar amounts in thousands):
| Rate | Earliest redemption date | Shares at December 31, 2009 | Carrying value | ||||||||||
| Authorized | Outstanding | 2009 | 2008 | ||||||||||
Series A | Floating | December 15, 2011 | 140,000 | 67,952 | $ | 67,952 | 240,000 | ||||||
Series C | 9.50% | September 15, 2013 | 1,400,000 | 110,388 | 121,386 | 46,949 | |||||||
Series D, TARP Capital Purchase Program | 5.00% | November 15, 2011 | 1,400,000 | 1,400,000 | 1,313,446 | 1,294,885 | |||||||
| $ | 1,502,784 | 1,581,834 | |||||||||||
The Series A Floating-Rate Non-Cumulative Perpetual Preferred Stock with an aggregate liquidation preference of $240 million, or $1,000 per share. The preferred stock was offeredissued in the form of 9,600,000 depositary shares with each depositary share representing a 1/40th ownership interest in a share of the preferred stock. In general, preferred shareholdersDividends are entitled to receive asset distributions before common shareholders; however, preferred shareholders have no preemptive or conversion rights, and only limited voting rights pertaining generally to amendments to the terms of the preferred stock or the issuance of senior preferred stock as well as the right to elect two directors in the event of certain defaults. The preferred stock is not redeemable prior to December 15, 2011, but will be redeemable subsequent to that date at the Company’s option at the liquidation preference value plus any declared but unpaid dividends. The preferred stock dividend reduces earnings available to common shareholders and is computed at an annual rate equal to the greater of three-month LIBOR plus 0.52%, or 4.0%. Dividend payments are made quarterly in arrears on the 15th day of March, June, September, and December.
The Series C 9.50% Non-Cumulative Perpetual Preferred Stock offering was issued in the form of depositary shares representing a 1/40th ownership interest in a share of the preferred stock. The offering was sold primarily by Zions Direct, Inc., the Company’s broker/dealer subsidiary, via an online auction process and by direct sales. Generally, the other terms and conditions, including the dividend payment dates, are the same as the Series A preferred stock.
The Series D Fixed-Rate Cumulative Perpetual Preferred Stock was issued in November 2008 to the U.S. Department of the Treasury for $1.4 billion. The Emergency Economic Stabilization Act of 2008 authorized the
U.S. Treasury to appropriate funds to eligible financial institutions participating in the Troubled Asset Relief Program (“TARP”) Capital Purchase Program. The capital investment includes the issuance of preferred shares of the Company and a warrant to purchase common shares pursuant to a Letter Agreement and a Securities Purchase agreement (collectively “the Agreement”). The preferred shares are rankedpari passu with the Series A and C preferred shares. The dividend rate of 5% increases to 9% after the first five years. Dividend payments are made on the 15th day of February, May, August, and November. The warrant allows the U.S. Treasury to purchase up to 5,789,909 shares of the Company’s common stock exercisable over a 10-year period at a price per share of $36.27. The preferred shares and the warrant qualify for Tier 1 regulatory capital. The Agreement subjects the Company to certain restrictions and conditions including those related to common dividends, share repurchases, executive compensation, and corporate governance.
We recorded the total $1.4 billion of the Series D preferred shares and the warrant at their relative fair values of $1,292.2 million and $107.8 million, respectively. The difference from the par amount of the preferred shares is accreted to preferred stock over five years using the interest method with a corresponding adjustment to preferred dividends. This accretion amounted to $18.6 million in 2009 and $2.6 million in 2008.
In connection with the subordinated debt modifications discussed in Note 13, we recorded $202.8 million after-tax directly in common stock for the intrinsic value of the beneficial conversion feature of the modified subordinated debt. The Company has “no par” common stock and all additional paid-in capital transactions are recorded in common stock. The intrinsic value of the beneficial conversion feature was calculated as the difference between the fair value of the preferred stock into which the debt is convertible (multiplied by the number of related shares) and the fair value of the modified convertible debt on the commitment dates. The commitment date is defined as the date when both parties are bound to the terms of the transaction, which was the expiration of the exchange offer and corresponded with the transaction date. At the time of each conversion of the convertible debt to preferred stock, a proportional amount of the intrinsic value of the beneficial conversion feature is transferred from common stock to preferred stock. See discussion following.
In June 2009, through a tender offer, we purchased 4,020,435 depositary shares of Series A preferred stock at a price of $11.50 per depositary share, or an aggregate amount of $46.4 million including accrued dividends. At a $25 per depositary share liquidation preference, the purchase reduced the $240 million carrying value of the Series A preferred stock by approximately $100.5 million. Net of related costs, the preferred stock redemption resulted in a $54.0 million increase to common shareholders’ equity. The purchase price of $11.50 per depositary share was determined based on a modified “Dutch auction” pricing mechanism.
As discussed in Note 13, approximately $63.4 million of convertible subordinated notes were converted into preferred stock during 2009 following the subordinated debt modification. Accordingly, as discussed previously, approximately $11.0 million of the intrinsic value of the beneficial conversion feature was transferred from common stock to preferred stock.
In December 2009, we completed the exchange of approximately $71.5 million of Series A preferred stock into approximately 2.8 million shares of common stock. The number of shares was determined based on an exchange ratio calculation specified in the exchange offer. Among other things, the calculation of the exchange ratio included a defined weighted average price of our common shares for each of the five consecutive days ending on the December 17, 2009 expiration date, or $13.2056 per share. Approximately $32.4 million, which is net of $0.7 million of issuance costs, was included in retained earnings as the difference between the $37.2 million fair value of the common shares on the date of exchange plus the $1.2 million original issuance costs of the preferred stock and the carrying value of the preferred stock exchanged.
Beginning June 1, 2009 through December 31, 2009, we issued $472.7 million of new common stock consisting of approximately 31.7 million shares at an average price of $14.89 per share. Net of commissions and fees, this issuance added $464.1 million to common stock. The shares were sold under two common equity distribution agreements of $250 million each. At December 31, 2009, approximately $27.3 million of common stock remained to be sold under the second agreement.
In September 2008, we issued $250 million of new common stock consisting of approximately 7.2 million shares at an average price of $34.75 per share. Net of commissions and fees, this issuance added $244.9 million to common stock.
In 2007 under our stock repurchase plan, we repurchased 3,933,128 common shares at a cost of $318.8 million. We have not repurchased any common shares since August 16, 2007. At December 31, 2007, approximately $56.3 million remained under the current $400 million stock repurchase authorization approved by the Board of Directors in December 2006. At that time, the stock repurchase program was resumed following a suspension since July 2005 upon the announcement of the Company’s acquisition of Amegy. Under this authorization, we repurchased 308,359 common shares in December 2006 at a cost of $25.0 million. We repurchased 1,159,522 common shares in 2005 at a cost of $80.7 million. Repurchased shares arewere included in stock redeemed and retired in the statements of changes in shareholders’ equity and comprehensive income. We also repurchased $1.4 million in 2009, $2.9 million in 2008, and $3.2 million in 2007 and $1.5 million in both 2006 and 2005 of common shares related to the Company’s restricted stock employee incentive program.
Changes in accumulated other comprehensive income (loss) are summarized as follows(in thousands):
| Net unrealized gains (losses) on investments, retained interests and other | Net unrealized gains (losses) on derivative instruments | Pension and post- retirement | Total | |||||||||
Balance, December 31, 2004 | $ | 19,774 | (9,493) | (18,213) | (7,932) | |||||||
Other comprehensive loss, net of tax: | ||||||||||||
Net realized and unrealized holding losses, net of income tax benefit of $17,580 | (28,380) | (28,380) | ||||||||||
Foreign currency translation | (1,507) | (1,507) | ||||||||||
Reclassification for net realized gains recorded in operations, net of income tax expense of $408 | (659) | (659) | ||||||||||
Net unrealized losses on derivative instruments, net of reclassification to operations of $7,101 and income tax benefit of $25,474 | (40,771) | (40,771) | ||||||||||
Minimum pension liability, net of income tax benefit of $2,426 | (3,794) | (3,794) | ||||||||||
Other comprehensive loss | (30,546) | (40,771) | (3,794) | (75,111) | ||||||||
Balance, December 31, 2005 | (10,772) | (50,264) | (22,007) | (83,043) | ||||||||
Other comprehensive income (loss), net of tax: | ||||||||||||
Net realized and unrealized holding losses, net of income tax benefit of $4,759 | (7,684) | (7,684) | ||||||||||
Foreign currency translation | 715 | 715 | ||||||||||
Reclassification for net realized gains recorded in operations, net of income tax expense of $391 | (630) | (630) | ||||||||||
Net unrealized gains on derivative instruments, net of reclassification to operations of $(39,984) and income tax expense of $4,572 | 8,548 | 8,548 | ||||||||||
Pension and postretirement, net of income tax expense of $4,055 | 6,245 | (1) | 6,245 | |||||||||
Other comprehensive income (loss) | (7,599) | 8,548 | 6,245 | 7,194 | ||||||||
Balance, December 31, 2006 | (18,371) | (41,716) | (15,762) | (75,849) | ||||||||
Other comprehensive income (loss), net of tax: | ||||||||||||
Net realized and unrealized holding losses, net of income tax benefit of $112,622 | (181,815) | (2) | (181,815) | |||||||||
Foreign currency translation | (6) | (6) | ||||||||||
Reclassification for net realized losses recorded in operations, net of income tax benefit of $61,510 | 91,426 | (2) | 91,426 | |||||||||
Net unrealized gains on derivative instruments, net of reclassification to operations of $(39,114) and income tax expense of $67,375 | 106,929 | 106,929 | ||||||||||
Pension and postretirement, net of income tax expense of $395 | 480 | 480 | ||||||||||
Other comprehensive income (loss) | (90,395) | 106,929 | 480 | 17,014 | ||||||||
Balance, December 31, 2007 | $ | (108,766) | 65,213 | (15,282) | (58,835) | |||||||
| Net unrealized gains (losses) on investments, retained interests and other | Net unrealized gains (losses) on derivative instruments | Pension and post- retirement | Total | ||||||||||
BALANCE, DECEMBER 31, 2006 | $ | (18,371 | ) | (41,716 | ) | (15,762 | ) | (75,849 | ) | ||||
Other comprehensive income (loss), net of tax: | |||||||||||||
Net realized and unrealized holding losses, net of income tax benefit of $93,658 | (151,200 | ) | (151,200 | ) | |||||||||
Foreign currency translation | (6 | ) | (6 | ) | |||||||||
Reclassification for net realized losses recorded in operations, net of income tax benefit of $42,541 | 60,811 | 60,811 | |||||||||||
Net unrealized gains, net of reclassification to operations of $(39,114) and income tax expense of $67,375 | 106,929 | 106,929 | |||||||||||
Pension and postretirement, net of income tax expense of $395 | 480 | 480 | |||||||||||
Other comprehensive income (loss) | (90,395 | ) | 106,929 | 480 | 17,014 | ||||||||
BALANCE, DECEMBER 31, 2007 | (108,766 | ) | 65,213 | (15,282 | ) | (58,835 | ) | ||||||
Cumulative effect of change in accounting principle, adoption of ASC 825 for fair value option | 11,471 | 11,471 | |||||||||||
Other comprehensive income (loss), net of tax: | |||||||||||||
Net realized and unrealized holding losses, net of income tax benefit of $215,384 | (333,095 | ) | (333,095 | ) | |||||||||
Foreign currency translation | (5 | ) | (5 | ) | |||||||||
Reclassification for net realized losses recorded in operations, net of income tax benefit of $119,597 | 181,524 | 181,524 | |||||||||||
Net unrealized gains, net of reclassification to operations of $65,862 and income tax expense of $82,653 | 131,443 | 131,443 | |||||||||||
Pension and postretirement, net of income tax benefit of $20,401 | (31,461 | ) | (31,461 | ) | |||||||||
Other comprehensive income (loss) | (151,576 | ) | 131,443 | (31,461 | ) | (51,594 | ) | ||||||
BALANCE, DECEMBER 31, 2008 | (248,871 | ) | 196,656 | (46,743 | ) | (98,958 | ) | ||||||
Cumulative effect of change in accounting principle, adoption of new OTTI guidance in ASC 320 | (137,462 | ) | (137,462 | ) | |||||||||
Other comprehensive income (loss), net of tax: | |||||||||||||
Net realized and unrealized holding losses net of income tax benefit of $40,454 | (65,037 | ) | (65,037 | ) | |||||||||
Reclassification for net realized losses recorded in operations, net of income tax benefit of $102,284 | 162,206 | 162,206 | |||||||||||
Noncredit-related impairment losses on securities not expected to be sold, net of income tax benefit of $115,159 | (174,244 | ) | (174,244 | ) | |||||||||
Accretion of securities with noncredit-related impairment losses not expected to be sold, net of income tax expense of $673 | 996 | 996 | |||||||||||
Net unrealized losses, net of reclassification to operations of $223,103 and income tax benefit of $80,033 | (128,597 | ) | (128,597 | ) | |||||||||
Pension and postretirement, net of income tax expense of $2,694 | 4,197 | 4,197 | |||||||||||
Other comprehensive income (loss) | (76,079 | ) | (128,597 | ) | 4,197 | (200,479 | ) | ||||||
BALANCE, DECEMBER 31, 2009 | $ | (462,412 | ) | 68,059 | (42,546 | ) | (436,899 | ) | |||||
As discussed in Note 4, we adopted new guidance under ASC 320,Investments – Debt and Equity Securities, as of January 1, 2009 related to the accounting for noncredit-related impairment losses on investment securities not expected to be sold. In addition to the ongoing effect on AOCI, the cumulative effect of adopting this new guidance increased retained earnings and decreased AOCI by $137.5 million.
As discussed in Note 21, we adopted the fair value option under ASC 825,Financial Instruments, as of January 1, 2008 for certain investment securities. The cumulative effect of this adoption decreased retained earnings and increased AOCI by $11.5 million.
Deferred compensation at year-end consists of the cost of the Company’s common stock held in rabbi trusts established for certain employees and directors. We consolidate the fair value of invested assets of the trusts along with the total obligations and include them in other assets and other liabilities, respectively, in the balance sheet. At December 31, 20072009 and 2006,2008, total invested assets were approximately $74.3$58.0 million and $54.8$53.7 million and total obligations were approximately $85.6$74.2 million and $64.4$68.1 million, respectively.
Upon the adoption of SFAS 123R in 2006, we reclassified deferred compensation of $11.1 million to common stock. This consisted of $3.9 million for the value of Amegy’s nonvested restricted stock and stock options and $7.2 million for the unearned portion of restricted stock issued by the Company during 2005.
15. INCOME TAXES
Income taxes (benefit) are summarized as follows(in thousands):
| 2007 | 2006 | 2005 | |||||
Federal: | |||||||
Current | $ | 351,215 | 261,423 | 244,152 | |||
Deferred | (132,541) | 7,705 | (26,234) | ||||
| 218,674 | 269,128 | 217,918 | |||||
State: | |||||||
Current | 43,224 | 47,158 | 51,628 | ||||
Deferred | (26,161) | 1,664 | (6,128) | ||||
| 17,063 | 48,822 | 45,500 | |||||
| $ | 235,737 | 317,950 | 263,418 | ||||
| 2009 | 2008 | 2007 | ||||||||
Federal: | ||||||||||
Current | $ | (375,610 | ) | 170,268 | 351,215 | |||||
Deferred | 24,171 | (198,145 | ) | (132,541 | ) | |||||
| (351,439 | ) | (27,877 | ) | 218,674 | ||||||
State: | ||||||||||
Current | (10,662 | ) | 17,608 | 43,224 | ||||||
Deferred | (39,242 | ) | (33,096 | ) | (26,161 | ) | ||||
| (49,904 | ) | (15,488 | ) | 17,063 | ||||||
| $ | (401,343 | ) | (43,365 | ) | 235,737 | |||||
Income tax expense (benefit) computed at the statutory federal income tax rate of 35% reconciles to actual income tax expense (benefit) as follows(in thousands):
| 2007 | 2006 | 2005 | 2009 | 2008 | 2007 | ||||||||||||
Income tax expense at statutory federal rate | $ | 258,124 | 319,523 | 259,660 | |||||||||||||
Income tax expense (benefit) at statutory federal rate | $ | (568,057 | ) | (110,144 | ) | 258,124 | |||||||||||
State income taxes, net | 19,696 | 31,734 | 29,575 | (32,437 | ) | (4,883 | ) | 19,696 | |||||||||
Uncertain state tax positions under FIN 48, including interest and penalties | (8,605) | – | – | ||||||||||||||
Nondeductible expenses | 4,141 | 5,299 | 2,138 | ||||||||||||||
Uncertain state tax positions, including interest and penalties | – | (5,184 | ) | (8,605 | ) | ||||||||||||
Nondeductible goodwill impairment | 220,852 | 115,774 | – | ||||||||||||||
Other nondeductible expenses | 4,380 | 3,461 | 4,141 | ||||||||||||||
Nontaxable income | (25,268) | (25,905) | (19,905) | (22,091 | ) | (27,763 | ) | (25,268 | ) | ||||||||
Tax credits and other taxes | (7,267) | (5,999) | (5,722) | (7,946 | ) | (7,766 | ) | (7,267 | ) | ||||||||
Valuation allowance for federal tax purposes on | 3,899 | – | – | ||||||||||||||
Other | (5,084) | (6,702) | (2,328) | 57 | (6,860 | ) | (5,084 | ) | |||||||||
| $ | 235,737 | 317,950 | 263,418 | $ | (401,343 | ) | (43,365 | ) | 235,737 | ||||||||
The tax effects of temporary differences that give rise to significant portions of the deferred tax assets and deferred tax liabilities at December 31 are presented below(in thousands):
| 2007 | 2006 | ||||
Gross deferred tax assets: | |||||
Book loan loss deduction in excess of tax | $ | 178,874 | 142,117 | ||
Pension and postretirement | 12,536 | 13,343 | |||
Deferred compensation | 55,563 | 42,050 | |||
Deferred loan fees | 2,897 | 3,040 | |||
Accrued severance costs | 2,799 | 3,023 | |||
Loan sales | 15,819 | 23,467 | |||
Security investments and derivative market adjustments | 95,546 | 7,270 | |||
Equity investments | 6,868 | 2,286 | |||
Other | 12,267 | 10,336 | |||
| 383,169 | 246,932 | ||||
Valuation allowance | (4,261) | (4,510) | |||
Total deferred tax assets | 378,908 | 242,422 | |||
Gross deferred tax liabilities: | |||||
Core deposits and purchase accounting | (52,963) | (42,609) | |||
Premises and equipment, due to differences in depreciation | (1,713) | (3,535) | |||
FHLB stock dividends | (14,179) | (13,781) | |||
Leasing operations | (81,794) | (79,490) | |||
Prepaid expenses | (5,680) | (5,583) | |||
Prepaid pension reserves | (4,930) | (4,387) | |||
Other | (6,394) | (9,549) | |||
Total deferred tax liabilities | (167,653) | (158,934) | |||
Net deferred tax assets | $ | 211,255 | 83,488 | ||
| 2009 | 2008 | ||||||
Gross deferred tax assets: | |||||||
Book loan loss deduction in excess of tax | $ | 612,818 | 275,427 | ||||
Pension and postretirement | 31,009 | 31,367 | |||||
Deferred compensation | 58,496 | 58,255 | |||||
Deferred loan fees | – | 3,661 | |||||
Other real estate owned | 17,108 | 11,695 | |||||
Accrued severance costs | 2,985 | 2,654 | |||||
Security investments and derivative fair value adjustments | 248,487 | 212,365 | |||||
Equity investments | 15,610 | 21,343 | |||||
Net operating losses and tax credits | 49,947 | 2,012 | |||||
Other | 20,787 | 25,999 | |||||
| 1,057,247 | 644,778 | ||||||
Valuation allowance | (4,261 | ) | – | ||||
Total deferred tax assets | 1,052,986 | 644,778 | |||||
Gross deferred tax liabilities: | |||||||
Core deposits and purchase accounting | (40,322 | ) | (46,199 | ) | |||
Premises and equipment, due to differences in depreciation | (5,913 | ) | (3,530 | ) | |||
FHLB stock dividends | (13,540 | ) | (15,168 | ) | |||
Leasing operations | (94,644 | ) | (87,939 | ) | |||
Prepaid expenses | (7,290 | ) | (7,076 | ) | |||
Prepaid pension reserves | (3,231 | ) | (5,540 | ) | |||
Subordinated debt modification | (296,366 | ) | – | ||||
Deferred loan fees | (17,770 | ) | – | ||||
FDIC-supported transactions | (62,187 | ) | – | ||||
Other | (13,474 | ) | (29 | ) | |||
Total deferred tax liabilities | (554,737 | ) | (165,481 | ) | |||
Net deferred tax assets | $ | 498,249 | 479,297 | ||||
The amount of net deferred tax assets is included with other assets onin the balance sheet. The $4.3 million valuation allowance at December 31, 2009 was for certain acquired net operating loss carryforwards included in our acquisition of the remaining interests in a less significant subsidiary. At December 31, 2009, excluding the $4.3 million, the tax effect of remaining net operating loss and tax credit carryforwards expiring through 2030 was approximately $45.7 million.
We analyzeevaluate the net deferred tax assets on a regular basis to determine whether aan additional valuation allowance is requiredrequired. In conducting this evaluation, we have considered all available evidence, both positive and negative, based on the more-likely-than-not criteria that such assets will be realized principally through future taxable income.realized. This criteria takes into accountevaluation includes, but is not limited to: (1) available carryback potential to offset federal tax of approximately $107 million and $340 million in the history of growth in earnings2008 and 2007 tax years, respectively; during 2009, the prospects for continued growth and profitability. The valuation allowance shown at both December 31, 2007 and 2006 is forCompany has a net operating loss carryforwards included infor tax purposes that will largely offset the Company’s 2006 acquisitiontaxable income for the 2007 tax year; (2) potential future reversals of existing deferred tax liabilities, which historically have a reversal pattern generally consistent with deferred tax assets; (3) potential tax planning strategies; and (4) future projected taxable income. Based on this evaluation, and considering the weight of the remaining minority interests of P5, as discussed in Note 3. The amount ofpositive evidence compared to the carryforwards was approximately $11.1 million at December 31, 2007 and the tax effect has been included in deferred tax assets. Establishment of this allowance was based on P5’s operating history using the criteria previously discussed. Wenegative evidence, we have also determinedconcluded that aan additional valuation allowance is not required for any other deferred tax assets.as of December 31, 2009.
In 2004, we signedWe have an agreement that confirmed and implemented our award ofawarded us a $100 million allocation of tax credit authority under the Community Development Financial Institutions Fund established by the U.S. Government. The program allows us to invest up to $100We have invested the
$100 million in a wholly-owned subsidiary which makes qualifying loans and investments. In return, we receive federal income tax credits that are recognized over seven years, including the year in which the funds were invested in the subsidiary. We recognize these tax credits for financial reporting purposes in the same year the tax benefit is recognized in our tax return. As of December 31, 2007 and 2006, we had invested $100 million and $90 million, respectively, which resulted inThe resulting tax credits thatwhich reduced income tax expense bywere approximately $5.9 million in 2009, $5.8 million in 2008, and $5.6 million in 2007, $4.5 million in 2006, and $4.0 million in 2005.2007.
Effective January 1, 2007, we adopted FASB Interpretation No. 48 (“FIN 48”),Accounting for Uncertainty in Income Taxes, an interpretation of FASB Statement No. 109. FIN 48, as amended, prescribes a more-likely-than-not threshold for the financial statement recognition of uncertain tax positions and clarifies the definition of settlement with the taxing authority. It also provides guidance on derecognition, measurement, classification, interest and penalties, accounting in interim periods, disclosure, and transition.
We have a FIN 48 liability for unrecognized tax benefits relating to uncertain tax positions primarily for various state tax contingencies in several jurisdictions. As a result of adopting FIN 48,the accounting guidance under ASC 740,Income Taxes, we reduced this liability by approximately $10.4 million at January 1, 2007 and recognized a cumulative effect adjustment as an increase to retained earnings. A reconciliation of the 2007 beginning and ending amount of gross unrecognized tax benefits subsequent to the cumulative effect adjustment is as follows(in thousands):
| |||
| |||
| |||
| |||
| |||
| |||
| |||
| |||
| |||
| |||
| 2009 | 2008 | ||||||
Balance at beginning of year | $ | 17,077 | 29,717 | ||||
Tax positions related to current year: | |||||||
Additions | – | 676 | |||||
Reductions | – | – | |||||
Tax positions related to prior years: | |||||||
Additions | – | – | |||||
Reductions | – | (7,641 | ) | ||||
Settlements with taxing authorities | – | (5,675 | ) | ||||
Lapses in statutes of limitations | (400 | ) | – | ||||
Balance at end of year | $ | 16,677 | 17,077 | ||||
TheAt both December 31, 2007 balance of2009 and 2008, the Company’s FIN 48 liability includesfor unrecognized tax benefits included approximately $19.1$10.8 million (net of the federal tax benefit on state issues) related to unrecognized tax benefits that, if recognized, would affect the effective tax rate. Gross unrecognized tax benefits that may decrease during the 12 months subsequent to December 31, 20072009 could range up to approximately $13.3$1.3 million as a result of the resolution of various state tax positions.
During 2007 in addition to increases to the FIN 482009, we reduced this liability, certainnet of any federal and/or state tax issues were resolved through the closingbenefits, and reduced income tax expense by a net amount of various state$366 thousand, including interest, due to lapses in statutes of limitationslimitations. During 2008, the reduction in this liability of approximately $9.6 million and tax examinations. This allowed us to reduce the FIN 48 liability and recognize the tax benefit in operations. For 2007, the net reductionoffset to income tax expense including related interestwas due to a $5.2 million settlement with taxing authorities and penalties, was approximately $8.6 million.
to $4.4 million from the net effect of settlement payments.
Interest and penalties related to unrecognized tax benefits are included in income tax expense in the statement of income. In 2007, theThe net amount of interest and penalties recognized in the statement of income was $34 thousand in 2009 and a benefit of approximately $1.7 million.$657 thousand in 2008. At December 31, 20072009 and 2006,2008, accrued interest and penalties recognized in the balance sheet, net of any federal and/or state tax benefits, were approximately $4.1$2.8 million and $5.8$2.7 million, respectively.
The Company and its subsidiaries file income tax returns in U.S. federal and various state jurisdictions. The Company is no longer subject to income tax examinations for years prior to 20042006 for federal returns, and generally prior to 20032005 for state returns.
16. NET EARNINGS PER COMMON SHARE
ASC 260,Earnings Per Share, includes new guidance issued in June 2008 that we adopted effective January 1, 2009. The new guidance clarifies that unvested share-based payment awards with rights to receive nonforfeitable dividends are considered participating securities and should be included in the computation of earnings per share. Adoption of this guidance required retrospective adjustment of earnings per share information, which was not significant to any prior period included in the accompanying financial statements.
Basic and diluted net earnings per common share based on the weighted average outstanding shares are summarized as follows(in thousands, except per share amounts):
| 2007 | 2006 | 2005 | |||||
Basic: | |||||||
Net earnings applicable to common shareholders | $ | 479,422 | 579,290 | 480,121 | |||
Weighted average common shares outstanding | 107,365 | 106,057 | 91,187 | ||||
Net earnings per common share | $ | 4.47 | 5.46 | 5.27 | |||
Diluted: | |||||||
Net earnings applicable to common shareholders | $ | 479,422 | 579,290 | 480,121 | |||
Weighted average common shares outstanding | 107,365 | 106,057 | 91,187 | ||||
Effect of dilutive common stock options and other stock awards | 1,158 | 1,971 | 1,807 | ||||
Weighted average diluted common shares outstanding | 108,523 | 108,028 | 92,994 | ||||
Net earnings per common share | $ | 4.42 | 5.36 | 5.16 | |||
| 2009 | 2008 | 2007 | |||||||
Basic: | |||||||||
Net income (loss) applicable to controlling interest | $ | (1,216,111 | ) | (266,269 | ) | 493,745 | |||
Less common and preferred dividends | 30,198 | 199,589 | 195,650 | ||||||
Undistributed earnings (loss) | (1,246,309 | ) | (465,858 | ) | 298,095 | ||||
Less undistributed earnings applicable to nonvested restricted shares | – | – | 1,390 | ||||||
Undistributed earnings (loss) applicable to common shares | (1,246,309 | ) | (465,858 | ) | 296,705 | ||||
Distributed earnings applicable to common shares | 11,773 | 173,963 | 180,662 | ||||||
Total earnings (loss) applicable to common shares | $ | (1,234,536 | ) | (291,895 | ) | 477,367 | |||
Weighted average common shares outstanding | 124,443 | 108,908 | 107,365 | ||||||
Net earnings (loss) per common share | $ | (9.92 | ) | (2.68 | ) | 4.45 | |||
Diluted: | |||||||||
Total earnings (loss) applicable to common shares | $ | (1,234,536 | ) | (291,895 | ) | 477,367 | |||
Additional undistributed earnings allocated to incremental option shares | – | – | 13 | ||||||
Diluted earnings (loss) applicable to common shares | $ | (1,234,536 | ) | (291,895 | ) | 477,380 | |||
Weighted average common shares outstanding | 124,443 | 108,908 | 107,365 | ||||||
Additional weighted average dilutive option shares | – | – | 1,043 | ||||||
Weighted average diluted common shares outstanding | 124,443 | 108,908 | 108,408 | ||||||
Net earnings (loss) per common share | $ | (9.92 | ) | (2.68 | ) | 4.40 | |||
17. SHARE-BASED COMPENSATION
We have a stock option and incentive plan which allows us to grant stock options and restricted stock to employees and nonemployee directors. The total shares authorized under the plan areincreased from 8,900,000 to 13,200,000 during 2009 of which 5,367,875 shares are available3,463,864 remained authorized under the plan for future grantgrants of stock options or restricted stock as of December 31, 2007.
Prior to January 1, 2006, we accounted for share-based compensation2009. Our agreement with the U.S. Treasury under the recognition and measurement provisions of Accounting Principles Board Opinion No. 25 (“APB 25”),Accounting for Stock Issued to Employees, andTARP Capital Purchase Program includes conditions related Interpretations, as permitted by SFAS No. 123,Accounting for Stock-Based Compensation. Accordingly, we did not record any compensation expense for stock options, as the exercise price of the option was equal to the quoted market priceissuance of the stock on the date of grant.common stock. See further discussion in Note 14.
Effective January 1, 2006, we adopted SFAS No. 123R,Share-Based Payment, which requires allAll share-based payments to employees, including grants of employee stock options, to beare recognized in the statement of income based on their fair values. This accounting utilizesUtilizing a “modified grant-date” approach, in which the fair value of an equity award is estimated on the grant date without regard to service or performance vesting conditions. We adopted SFAS 123R using
Compensation expense and the “modified prospective” transition method. Under this transition method, compensation expense is recognized beginning January 1, 2006 based on the requirements of SFAS 123Rrelated tax benefit for all share-based payments granted after December 31, 2005, and based on the requirements of SFAS 123 for all awards granted to employees prior to January 1, 2006 that remain unvested as of that date. Results of operations for prior years have not been restated.
The adoption of SFAS 123R, compared to the previous accounting for share-based compensation under APB 25, reduced 2006 income before income taxes and minority interest by $17.5 million, net income by $12.5 million, and both basic and diluted net earnings per common share by $0.12.
The impact on net income and net earnings per common share if we had applied the recognition provisions of SFAS 123 to stock options for 2005 waswere as follows(in thousands, except per share amounts)thousands):
Net income, as reported | $ | 480,121 | ||
Deduct: Total share-based compensation expense determined under fair value based method for stock options, net of related tax effects | (9,793 | ) | ||
Pro forma net income | $ | 470,328 | ||
Net earnings per common share: | ||||
Basic – as reported | $ | 5.27 | ||
Basic – pro forma | 5.16 | |||
Diluted – as reported | 5.16 | |||
Diluted – pro forma | 5.08 | |||
| 2009 | 2008 | 2007 | |||||
Compensation expense | $ | 29,789 | 31,850 | 28,274 | |||
Reduction of income tax expense | 10,433 | 11,080 | 9,386 | ||||
Compensation expense is included in salaries and employee benefits in the statement of income with the corresponding increase included in common stock in shareholders’ equity.
As required by SFAS 123R and discussed further in Note 14, upon adoption in 2006, we reclassified $11.1 million of unearned compensation related to restricted stock from deferred compensation to common stock.
We classify all share-based awards as equity instruments. Substantially all awards have graded vesting which is recognized on a straight-line basis over the vesting period. As of December 31, 2007,2009, compensation expense not yet recognized for nonvested share-based awards was approximately $52.3$42.8 million, which is expected to be recognized over a weighted average period of 1.31.2 years.
The tax benefit (shortfall) realized from the exercise of stock options and the vesting of restricted stock was as follows(in thousands):
| 2009 | 2008 | 2007 | |||||||
Reduction of goodwill for tax benefit of vested stock options converted in the Amegy acquisition and exercised during the year | $ | – | 120 | 2,069 | |||||
Tax benefit (shortfall) included in common stock in net stock issued under employee plans and related tax benefits | (6,077 | ) | (2,288 | ) | 10,806 | ||||
Tax benefit from disqualifying dispositions of incentive stock options | – | – | 317 | ||||||
Total tax benefit (shortfall) | $ | (6,077 | ) | (2,168 | ) | 13,192 | |||
Stock Options
Stock options granted to employees generally vest at the rate of one third each year and expire seven years after the date of grant. Stock options granted to nonemployee directors vest in increments from six months to three and a half years and expire ten years after the date of grant.
In 2005, we discontinuedWe used the results of the April 24-25, 2008 and May 4-7, 2007 auctions of our broad-based employee stock option plan under which options were made available to substantially all employees; however, existing options continue to vest at the rate of one third each year and expire four years after the date of grant.
Following are the expense, cash flow, and tax effects related to stock options on the Company’s financial statements from the adoption of SFAS 123R(in thousands):
| 2007 | 2006 | ||||
Compensation expense: | |||||
Additional amount recorded | $ | 15,828 | 17,542 | ||
Reduction of income tax expense | 4,987 | 4,968 | |||
Cash flows received from exercise of stock options | 59,473 | 79,511 | |||
Tax benefit realized from reduction of income taxes payable: | |||||
Reduction of goodwill for tax benefit of vested stock options converted in the Amegy acquisition and exercised during the year | $ | 2,069 | 4,189 | ||
Included in common stock as net stock options exercised | 10,365 | 11,769 | |||
Reduction of deferred tax assets and current income tax expense | 1,038 | 1,323 | |||
Total tax benefit | $ | 13,472 | 17,281 | ||
The additional compensation expense is included in salaries and employee benefits in the statement of income with the corresponding increase included in common stock in shareholders’ equity.
For 2005, the tax benefit realized as a reduction of income taxes payable and included in common stock was $13.5 million.
On October 22, 2007, the Company announced it had received notification from the SEC that its patent-pending Employee Stock Option Appreciation Rights Securities (“ESOARS”) to value our employee stock options granted on April 24, 2008 and May 4, 2007. In October 2007, we received notification from the SEC that our ESOARS was sufficiently designed as a market-based method for valuingto value employee stock options under SFAS 123R.ASC 718,Compensation – Stock Compensation. The SEC staff did not object to the Company’sour view that the market-clearingmarket clearing price of ESOARS in the Company’sMay 2007 auction conducted May 4-7, 2007 was a reasonable estimate of the fair value of the underlying employee stock options.
The Company usedInformation from the results of that auction to value its employee stock options granted on May 4, 2007. The value establishedthese auctions was $12.06 per option, which the Company estimated was approximately 14% below its Black-Scholes model valuation on that date. The number of stock options granted on that date were 963,680, or 91.4% of the total stock options granted in 2007. The Companyas follows:
| Grant date | |||||||
| April 24, 2008 | May 4, 2007 | ||||||
ESOARS per share auction fair value used for employee stock option grants | $ | 5.73 | 12.06 | ||||
Percentage that auction fair value is below comparable Black-Scholes | 24 | % | 14 | % | |||
Number of stock options granted | 1,542,238 | 963,680 | |||||
Percentage of stock options granted to total stock options granted during | 61 | % | 91 | % | |||
We used the ESOARS valuevalues for the remainder of 2008 and 2007 in determiningto determine compensation expense for this grant ofthese stock options and we recorded the related estimated future ESOARS settlement obligationobligations as a liability in the balance sheet.
For all stock options granted in 2009 and all other stock options granted in 2008 and 2007 and previously in 2006 and 2005, the Companywe used the Black-Scholes option pricing model to estimate the fair values of stock options in determining compensation expense. The following summarizes the weighted average of fair value and the significant assumptions used in applying the Black-Scholes model for options granted:
| 2007 | 2006 | 2005 | 2009 | 2008 | 2007 | ||||||||||||
Weighted average of fair value for options granted | $ | 15.15 | 15.02 | 15.33 | $ | 4.09 | 4.85 | 15.15 | |||||||||
Weighted average assumptions used: | |||||||||||||||||
Expected dividend yield | 2.0% | 2.0% | 2.0% | 1.0 | % | 4.7 | % | 2.0 | % | ||||||||
Expected volatility | 17.0% | 18.0% | 25.0% | 33.0 | % | 26.8 | % | 17.0 | % | ||||||||
Risk-free interest rate | 4.42% | 4.95% | 3.95% | 2.24 | % | 2.99 | % | 4.42 | % | ||||||||
Expected life (in years) | 5.4 | 4.1 | 4.1 | 4.5 | 4.7 | 5.4 | |||||||||||
The methodology used to estimate the fair values of stock options is consistent with the estimates used for the 2005 pro forma presentation previously shown. The assumptions for expected dividend yield, expected volatility and expected life reflect management’s judgment and include consideration of historical experience. Expected volatility is based in part on historical volatility. The risk-free interest rate is based on the U.S. Treasury yield curve in effect at the time of grant for periods corresponding with the expected life of the option.
The following summarizes our stock option activity for the three years ended December 31, 2007:2009:
| Number of shares | Weighted average exercise price | ||||
Balance at December 31, 2004 | 7,633,775 | $ | 51.98 | ||
Granted | 912,905 | 71.37 | |||
Assumed in acquisition | 1,559,693 | 47.44 | |||
Exercised | (1,872,753) | 50.00 | |||
Expired | (519,521) | 66.53 | |||
Forfeited | (216,533) | 55.46 | |||
Balance at December 31, 2005 | 7,497,566 | 52.79 | |||
Granted | 979,274 | 81.14 | |||
Exercised | (1,631,012) | 49.43 | |||
Expired | (52,398) | 50.00 | |||
Forfeited | (106,641) | 62.89 | |||
Balance at December 31, 2006 | 6,686,789 | 57.62 | |||
Granted | 1,054,772 | 82.82 | |||
Exercised | (1,681,742) | 80.88 | |||
Expired | (136,805) | 58.37 | |||
Forfeited | (112,031) | 75.00 | |||
Balance at December 31, 2007 | 5,810,983 | 64.82 | |||
Outstanding stock options exercisable as of: | |||||
December 31, 2007 | 3,866,627 | $ | 57.15 | ||
December 31, 2006 | 4,409,971 | 50.73 | |||
December 31, 2005 | 4,663,707 | 49.04 | |||
| Number of shares | Weighted average exercise price | |||||
Balance at December 31, 2006 | 6,686,789 | $ | 57.62 | |||
Granted | 1,054,772 | 82.82 | ||||
Exercised | (1,681,742 | ) | 80.88 | |||
Expired | (136,805 | ) | 58.37 | |||
Forfeited | (112,031 | ) | 75.00 | |||
Balance at December 31, 2007 | 5,810,983 | 64.82 | ||||
Granted | 2,537,438 | 40.43 | ||||
Exercised | (52,072 | ) | 30.58 | |||
Expired | (536,643 | ) | 56.72 | |||
Forfeited | (85,108 | ) | 66.18 | |||
Balance at December 31, 2008 | 7,674,598 | 57.53 | ||||
Granted | 714,085 | 14.64 | ||||
Exercised | (316 | ) | 5.82 | |||
Expired | (599,405 | ) | 56.35 | |||
Forfeited | (59,932 | ) | 62.99 | |||
Balance at December 31, 2009 | 7,729,030 | 53.61 | ||||
Outstanding stock options exercisable as of: | ||||||
December 31, 2009 | 4,911,239 | $ | 62.72 | |||
December 31, 2008 | 4,221,713 | 62.15 | ||||
December 31, 2007 | 3,866,627 | 57.15 | ||||
We issue new authorized shares for the exercise of stock options. The total intrinsic value of stock options exercised was approximately $3 thousand in 2009, $0.9 million in 2008, and $59.0 million in 2007 and $50.82007. Cash received from the exercise of stock options was $2 thousand in 2009, $1.6 million in 2006.2008 and $59.5 million in 2007.
Additional selected information on stock options at December 31, 20072009 follows:
| Outstanding stock options | Exercisable stock options | |||||||||||
Exercise price range | Number of shares | Weighted average exercise price | Weighted average remaining contractual life (years) | Number of shares | Weighted Average Exercise Price | |||||||
$ 0.32 to $ 19.99 | 42,929 | $ | 9.03 | 1.1 (1) | 42,929 | $ | 9.03 | |||||
$ 20.00 to $ 39.99 | 121,888 | 28.72 | 1.6 | 121,888 | 28.72 | |||||||
$ 40.00 to $ 49.99 | 692,261 | 44.49 | 3.0 | 692,261 | 44.49 | |||||||
$ 50.00 to $ 54.99 | 775,509 | 53.66 | 1.5 | 774,528 | 53.66 | |||||||
$ 55.00 to $ 59.99 | 1,149,961 | 56.86 | 3.8 | 1,110,797 | 56.82 | |||||||
$ 60.00 to $ 64.99 | 140,795 | 61.67 | 1.9 | 134,647 | 61.58 | |||||||
$ 65.00 to $ 69.99 | 165,471 | 67.38 | 5.5 | 145,816 | 67.42 | |||||||
$ 70.00 to $ 74.99 | 703,783 | 70.91 | 4.7 | 441,185 | 70.87 | |||||||
$ 75.00 to $ 79.99 | 116,126 | 75.92 | 5.0 | 86,399 | 75.87 | |||||||
$ 80.00 to $ 81.99 | 910,780 | 81.14 | 5.5 | 305,511 | 81.12 | |||||||
$ 82.00 to $ 83.38 | 991,480 | 83.25 | 6.4 | 10,666 | 83.31 | |||||||
| 5,810,983 | 64.82 | 4.2 (1) | 3,866,627 | 57.15 | ||||||||
| Outstanding stock options | Exercisable stock options | ||||||||||||
Exercise price range | Number of shares | Weighted average exercise price | Weighted average remaining contractual life (years) | Number of shares | Weighted average exercise price | ||||||||
$0.32 to $19.99 | 733,846 | $ | 14.16 | 6.4 | 1 | 30,761 | $ | 4.92 | |||||
$20.00 to $39.99 | 979,082 | 28.17 | 5.2 | 209,914 | 28.79 | ||||||||
$40.00 to $49.99 | 2,190,138 | 46.45 | 4.2 | 1,153,246 | 45.74 | ||||||||
$50.00 to $54.99 | 117,206 | 52.35 | 2.3 | 117,206 | 52.35 | ||||||||
$55.00 to $59.99 | 1,009,969 | 56.88 | 2.0 | 1,009,969 | 56.88 | ||||||||
$60.00 to $64.99 | 38,168 | 63.09 | 2.2 | 36,684 | 63.07 | ||||||||
$65.00 to $69.99 | 123,613 | 67.11 | 4.3 | 123,613 | 67.11 | ||||||||
$70.00 to $74.99 | 662,114 | 70.91 | 2.7 | 654,601 | 70.90 | ||||||||
$75.00 to $79.99 | 115,700 | 75.92 | 3.0 | 115,700 | 75.92 | ||||||||
$80.00 to $81.99 | 847,263 | 81.13 | 3.5 | 843,596 | 81.13 | ||||||||
$82.00 to $83.38 | 911,931 | 83.25 | 4.5 | 615,949 | 83.25 | ||||||||
| 7,729,030 | 53.61 | 4.0 | 1 | 4,911,239 | 62.72 | ||||||||
| 1 | The weighted average remaining contractual life excludes |
ForThe aggregate intrinsic value of outstanding stock options at December 31, 20072009 and 2006,2008 was $265 thousand and $600 thousand, respectively, while the aggregate intrinsic value of exercisable options was $5.7 million$243 thousand and $166.0 million, respectively.$600 thousand. For exercisable stock options, at December 31, 2007 and 2006, the aggregate intrinsic value was $5.7 million and $139.9
million and the weighted average remaining contractual life was 3.33.1 years and 3.43.2 years at December 31, 2009 and 2008, respectively, excluding the stock options previously noted without a fixed expiration date.
The previous tablesschedules do not include stock options for employees to purchase common stock of our subsidiaries, TCBO and NetDeposit.subsidiary. At December 31, 2007 for TCBO,2009, there were options to purchase 115,00074,700 TCBO shares at exercise prices from $20.00$17.85 to $20.58. At December 31, 2007,2009, there were 1,038,000 issued and outstanding shares of TCBO common stock. For
During the fourth quarter of 2008, our NetDeposit there weresubsidiary terminated its stock option plan, canceled all associated options, and recognized all unearned stock option expense. As part of the termination, NetDeposit made a payment to purchase 10,701,626 shares at exercise prices from $0.29 to $1.00. At December 31, 2007, there were 142,348,414 issued andoption holders of $0.10 per outstanding shares of NetDeposit common stock. TCBO and NetDeposit options are included in the previous pro forma disclosure.
option, which totaled approximately $0.9 million.
Restricted Stock
Restricted stock issued vests generally over four years. During 2009, nonemployee directors were granted 43,002 shares of restricted stock which vested over six months. During the vesting period, the holder has full voting rights and receives dividend equivalents. Compensation expense for issuances of restricted stock was $12.4 million in 2007, $6.8 million in 2006, and $1.7 million in 2005. The corresponding increase to shareholders’ equity is included in common stock. Compensation expense was determined based on the number of restricted shares issued and the market price of our common stock at the issue date.
The following summarizes our restricted stock activity for the three years ended December 31, 2007:2009:
| Number of shares | Weighted average issue price | ||||
Nonvested restricted shares at December 31, 2004 | 10,000 | $ | 61.07 | ||
Issued | 168,134 | 70.81 | |||
Assumed in acquisition | 143,504 | 57.45 | |||
Vested | (114,162) | 56.41 | |||
Forfeited | (3,493) | 70.90 | |||
Nonvested restricted shares at December 31, 2005 | 203,983 | 68.99 | |||
Issued | 293,650 | 80.14 | |||
Vested | (53,471) | 71.29 | |||
Forfeited | (24,029) | 76.09 | |||
Nonvested restricted shares at December 31, 2006 | 420,133 | 77.54 | |||
Issued | 357,961 | 71.91 | |||
Vested | (115,852) | 76.95 | |||
Forfeited | (27,180) | 76.42 | |||
Nonvested restricted shares at December 31, 2007 | 635,062 | 74.54 | |||
| Number of shares | Weighted average issue price | |||||
Nonvested restricted shares at December 31, 2006 | 420,133 | $ | 77.54 | |||
Issued | 357,961 | 71.91 | ||||
Vested | (115,852 | ) | 76.95 | |||
Forfeited | (27,180 | ) | 76.42 | |||
Nonvested restricted shares at December 31, 2007 | 635,062 | 74.54 | ||||
Issued | 849,156 | 37.64 | ||||
Vested | (191,605 | ) | 74.92 | |||
Forfeited | (43,332 | ) | 68.43 | |||
Nonvested restricted shares at December 31, 2008 | 1,249,281 | 49.61 | ||||
Issued | 698,311 | 14.64 | ||||
Vested | (349,186 | ) | 56.13 | |||
Forfeited | (73,756 | ) | 42.64 | |||
Nonvested restricted shares at December 31, 2009 | 1,524,650 | 32.44 | ||||
The total fair value of restricted stock vesting during the year was $4.7 million in 2009, $8.5 million in 2008, and $9.4 million in 2007, $4.3 million in 2006, and was not significant in 2005. The amount of tax benefit realized as a reduction of income taxes payable from the vesting of restricted stock was $3.8 million in 2007 and $1.9 million in 2006.
2007.
18. COMMITMENTS, GUARANTEES, CONTINGENT LIABILITIES, AND RELATED PARTIES
We use certain derivative instruments and other financial instruments in the normal course of business to meet the financing needs of our customers, to reduce our own exposure to fluctuations in interest rates, and to make a market in U.S. government,Government, agency, corporate, and municipal securities. These financial instruments involve, to varying degrees, elements of credit, liquidity, and interest rate risk in excess of the amount recognized in the balance sheet. Derivative instruments are discussed in Note 7.
FASB Interpretation No. 45 (“FIN 45”),Guarantor’s AccountingNotes 7 and Disclosure Requirements for Guarantees, Including Indirect Guarantees of Indebtedness of Others, establishes guidance for guarantees and related obligations. Financial and performance standby letters of credit are guarantees that come under the provisions of FIN 45.
21.
Contractual amounts of the off-balance sheet financial instruments used to meet the financing needs of our customers are as follows at December 31(in thousands):
| 2007 | 2006 | ||||
Commitments to extend credit | $ | 16,648,056 | 16,714,742 | ||
Standby letters of credit: | |||||
Financial | 1,317,304 | 1,157,205 | |||
Performance | 351,150 | 330,056 | |||
Commercial letters of credit | 49,346 | 132,615 | |||
| 2009 | 2008 | ||||
Commitments to extend credit | $ | 11,610,156 | 14,140,429 | ||
Standby letters of credit: | |||||
Financial | 1,071,851 | 1,293,729 | |||
Performance | 182,423 | 250,836 | |||
Commercial letters of credit | 30,179 | 65,889 | |||
Commitments to extend credit are agreements to lend to a customer as long as there is no violation of any condition established in the contract. Commitments generally have fixed expiration dates or other termination clauses and may require the payment of a fee. The amount of collateral obtained, if deemed necessary by us upon extension of credit, is based on our credit evaluation of the counterparty. Types of collateral vary, but may include accounts receivable, inventory, property, plant and equipment, and income-producing properties.
While establishing commitments to extend credit creates credit risk, a significant portion of such commitments is expected to expire without being drawn upon. As of December 31, 2007, $5.82009, $4.8 billion of commitments expire in 2008.2010. We use the same credit policies and procedures in making commitments to extend credit and conditional obligations as we do for on-balance sheet instruments. These policies and procedures include credit approvals, limits, and monitoring.
We issue standby and commercial letters of credit as conditional commitments generally to guarantee the performance of a customer to a third party. The guarantees are primarily issued to support public and private borrowing arrangements, including commercial paper, bond financing, and similar transactions. Standby letters of credit include remaining commitments of $1,042$654 million expiring in 20082010 and $627$600 million expiring thereafter through 2027. The credit risk involved in issuing letters of credit is essentially the same as that involved in extending loan facilities to customers. We generally hold marketable securities and cash equivalents as collateral supporting those commitments for which collateral is deemed necessary. At December 31, 2007,2009, the carrying value recorded by the Company as a liability for these guarantees was $7.1$6.3 million.
Certain mortgage loans sold have limited recourse provisions for periods ranging from three months to one year. The amount of losses resulting from the exercise of these provisions has not been significant.
At December 31, 2007,2009, we had commitments to make venture and other noninterest-bearing investments of $101.7$78.2 million. These obligations have no stated maturity.
The contractual or notional amount of financial instruments indicates a level of activity associated with a particular class of financial instrument and is not a reflection of the actual level of risk. As of December 31, 20072009 and 2006,2008, the regulatory risk-weighted values assigned to all off-balance sheet financial instruments and derivative instruments described herein were $7.0$4.0 billion and $6.7$5.3 billion, respectively.
At December 31, 2007,2009, we were required to maintain cash balances of $38.7$26.0 million with the Federal Reserve Banks to meet minimum balance requirements in accordance with Federal Reserve Board regulations.
As of December 31, 2007,2009, the Parent has guaranteed approximately $300.6$300.2 million of debt issued by our subsidiaries, as discussed in Note 13. See Note 6 for the discussion of Zions Bank’s commitment of $6.12 billion at December 31, 2007 to Lockhart, which is a QSPE conduit.
In October 2007, Visa Inc. (“Visa”) completed a reorganization in contemplation of its initial public offering (“IPO”) expected to occur in 2008. Asand as part of that reorganization, certain of the Company’s subsidiary banks received shares of common stock of Visa. During the first quarter of 2008, the banks recorded an aggregate pretax cash gain of approximately $12.4 million from the partial redemption of their equity interests in Visa Inc.upon completion of the IPO. The gain is included in equity securities gains, net in the statement of income. The Company’s subsidiary banks are also obligated as member banks under indemnification agreements to share in losses from certain litigation (“Covered Litigation”) of Visa. Although Visa is expected to set aside a portion of its proceeds from the IPO to fund any adverse settlements from the Covered Litigation, recent guidanceGuidance from the SEC staff indicates thatrequires Visa member banks shouldto record a liability for the fair value of any contingent obligation under the Covered Litigation. Estimation ofLitigation which is not funded into a litigation escrow account by Visa. At January 1, 2008, the proportionate share for the Company’s subsidiary banks is extremely difficult and highly judgmental. The Company hashad recorded a total accrual of approximately $8.1 million which isas an estimate of the fair value of the contingent obligation. ThisIn March 2008, Visa funded the litigation escrow upon completion of the IPO and in December 2008 and July 2009 additional funding of the escrow account was made in relation to a settlement of certain Covered Litigation. As a result, the Company’s accrual isfor this litigation amounted to $1.1 million and $2.5 million at December 31, 2009 and 2008, respectively, following the reversal of approximately $1.4 million in 2009 and $5.6 million in 2008. The litigation escrow account funding reduced the Company’s ownership interests in Visa. The original accrual and the reversal are included in other noninterest expense in the statement of income. Also, in accordance with generally accepted accounting principles and the recent SEC guidance, the Company’s subsidiary banks have not recognized any value for their investmentremaining investments in Visa.
We are a defendant in various legal proceedings arising in the normal course of business. We do not believe that the outcome of any such proceedings will have a material effect on our results of operations, financial position, or liquidity.
See additional discussion in Note 4.
We have commitments for leasing premises and equipment under the terms of noncancelable capital and operating leases expiring from 20082010 to 2046. Premises leased under capital leases at December 31, 20072009 were $1.7$1.2 million and accumulated amortization was $1.1$0.9 million. Amortization applicable to premises leased under capital leases is included in depreciation expense.
Future aggregate minimum rental payments under existing noncancelable operating leases at December 31, 20072009 are as follows(in thousands):
2008 | $ | 44,178 | |
2009 | 42,481 | ||
2010 | 38,659 | ||
2011 | 32,500 | ||
2012 | 28,691 | ||
Thereafter | 165,172 | ||
| $ | 351,681 | ||
2010 | $ | 48,269 | |
2011 | 46,617 | ||
2012 | 41,371 | ||
2013 | 36,620 | ||
2014 | 30,080 | ||
Thereafter | 152,137 | ||
| $ | 355,094 | ||
Future aggregate minimum rental payments have been reduced by noncancelable subleases as follows: $2.9 million in 2008, $2.3 million in 2009, $2.7$1.4 million in 2010, $2.4$1.3 million in 2011, $1.9$1.5 million in 2012, $1.5 million in 2013, $1.0 million in 2014, and $8.5$7.1 million thereafter. Aggregate rental expense on operating leases amounted to $59.2 million in 2009, $57.3 million in 2008, and $54.0 million in 2007, $51.5 million in 2006, and $41.6 million in 2005.2007.
We have a lease agreement on our corporate headquarters which provided for a rent holiday through December 31, 2006 while the building was being reconstructed. The reconstruction began in March 2005 and the lease term of this operating lease began in October 2005. We recorded and deferred rent expense during the rent holiday at applicable lease rates based on our occupancy of the building. We also recorded leasehold improvements funded by the landlord incentive and amortize them over their estimated useful lives or the term of the lease, whichever is shorter. The amount of deferred rent, including the leasehold improvements, is amortized using the straight-line method over the term of the lease, in accordance with applicable accounting and other SEC guidance.
We have no material related party transactions requiring disclosure. In the ordinary course of business, the Company and its banking subsidiaries extend credit to related parties, including executive officers, directors, principal shareholders, and their associates and related interests. These related party loans are made in compliance with applicable banking regulations under substantially the same terms as comparable third-party lending arrangements.
19. REGULATORY MATTERS
We are subject to various regulatory capital requirements administered by federal banking agencies. Failure to meet minimum capital requirements can initiate certain mandatory – and possibly additional discretionary – actions by regulators that, if undertaken, could have a direct material effect on our financial statements. Under capital adequacy guidelines and the regulatory framework for prompt corrective action, we must meet specific capital guidelines that involve quantitative measures of our assets, liabilities, and certain off-balance sheet items as calculated under regulatory accounting practices. Our capital amounts and classification are also subject to qualitative judgments by regulators about components, risk weightings, and other factors.
Quantitative measures established by regulation to ensure capital adequacy require us to maintain minimum amounts and ratios (set forth in the following table)schedule) of Total and Tier I1 capital (as defined in the regulations) to risk-weighted assets (as defined), and of Tier I1 capital (as defined) to average assets (as defined). We believe, as of December 31, 2007,2009, that we meetexceed all capital adequacy requirements to which we are subject.
As discussed further in Note 14, the preferred shares and warrant to purchase common stock issued to the U.S. Treasury under the TARP Capital Purchase Program qualify for Tier 1 capital.
As of December 31, 2007,2009, our capital ratios exceeded the minimum capital levels, and we are considered well capitalized under the regulatory framework for prompt corrective action. Our subsidiary banks also met the well capitalized minimum. To be categorized as well capitalized, we must maintain minimum Total risk-based, Tier I1 risk-based, and Tier I1 leverage ratios as set forth in the table. There are no conditions or events that we believeschedule. We have changed ourdetermined it is appropriate in the current uncertain economic and credit environment to maintain capital levels significantly in excess of minimum well capitalized regulatory category.
requirements.
Dividends declared by our banking subsidiariessubsidiary banks in any calendar year may not, without the approval of the appropriate federal regulator, exceed their net earnings for that year combined with their net earnings less dividends paid for the preceding two years. We are also required to maintain the banking subsidiariessubsidiary banks at the well capitalized level. At December 31, 2007,2009, our banking subsidiariessubsidiary banks had approximately $304.1$12.9 million available for the payment of dividends under the foregoing restrictions.
The actual capital amounts and ratios for the Company and its three largest banking subsidiariessubsidiary banks are as follows(in thousands):
| Actual | Minimum for capital adequacy purposes | To be well capitalized | Actual | Minimum for capital adequacy purposes | To be well capitalized | ||||||||||||||||||||||||||||
| Amount | Ratio | Amount | Ratio | Amount | Ratio | Amount | Ratio | Amount | Ratio | Amount | Ratio | ||||||||||||||||||||||
As of December 31, 2007: | |||||||||||||||||||||||||||||||||
As of December 31, 2009: | |||||||||||||||||||||||||||||||||
Total capital (to risk-weighted assets) | |||||||||||||||||||||||||||||||||
The Company | $ | 5,547,973 | 11.68% | $ | 3,801,256 | 8.00% | $ | 4,751,570 | 10.00% | $ | 6,822,713 | 13.28 | % | $ | 4,108,785 | 8.00 | % | $ | 5,135,981 | 10.00 | % | ||||||||||||
Zions First National Bank | 1,622,137 | 10.75 | 1,206,859 | 8.00 | 1,508,574 | 10.00 | 2,017,910 | 11.52 | 1,401,389 | 8.00 | 1,751,736 | 10.00 | |||||||||||||||||||||
California Bank & Trust | 1,088,798 | 11.58 | 752,253 | 8.00 | 940,316 | 10.00 | 1,081,079 | 11.51 | 751,272 | 8.00 | 939,090 | 10.00 | |||||||||||||||||||||
Amegy Bank N.A. | 1,178,538 | 10.94 | 861,581 | 8.00 | 1,076,977 | 10.00 | 1,404,939 | 13.57 | 828,128 | 8.00 | 1,035,160 | 10.00 | |||||||||||||||||||||
Tier I capital (to risk-weighted assets) | |||||||||||||||||||||||||||||||||
Tier 1 capital (to risk-weighted assets) | |||||||||||||||||||||||||||||||||
The Company | 3,596,234 | 7.57 | 1,900,628 | 4.00 | 2,850,942 | 6.00 | 5,406,796 | 10.53 | 2,054,392 | 4.00 | 3,081,588 | 6.00 | |||||||||||||||||||||
Zions First National Bank | 1,032,562 | 6.84 | 603,430 | 4.00 | 905,144 | 6.00 | 1,803,166 | 10.29 | 700,694 | 4.00 | 1,051,041 | 6.00 | |||||||||||||||||||||
California Bank & Trust | 689,380 | 7.33 | 376,126 | 4.00 | 564,190 | 6.00 | 962,121 | 10.25 | 375,636 | 4.00 | 563,454 | 6.00 | |||||||||||||||||||||
Amegy Bank N.A. | 742,630 | 6.90 | 430,791 | 4.00 | 646,186 | 6.00 | 1,271,949 | 12.29 | 414,064 | 4.00 | 621,096 | 6.00 | |||||||||||||||||||||
Tier I capital (to average assets) | |||||||||||||||||||||||||||||||||
Tier 1 capital (to average assets) | |||||||||||||||||||||||||||||||||
The Company | 3,596,234 | 7.37 | 1,463,464 | 3.00 | 2,439,106 | 5.00 | 5,406,796 | 10.38 | 1,562,645 | 3.00 | na | na | 1 | ||||||||||||||||||||
Zions First National Bank | 1,032,562 | 6.22 | 498,409 | 3.00 | 830,681 | 5.00 | 1,803,166 | 8.84 | 612,141 | 3.00 | 1,020,234 | 5.00 | |||||||||||||||||||||
California Bank & Trust | 689,380 | 6.97 | 296,545 | 3.00 | 494,242 | 5.00 | 962,121 | 8.81 | 327,679 | 3.00 | 546,132 | 5.00 | |||||||||||||||||||||
Amegy Bank N.A. | 742,630 | 7.58 | 294,038 | 3.00 | 490,064 | 5.00 | 1,271,949 | 11.79 | 323,530 | 3.00 | 539,216 | 5.00 | |||||||||||||||||||||
As of December 31, 2006: | |||||||||||||||||||||||||||||||||
As of December 31, 2008: | |||||||||||||||||||||||||||||||||
Total capital (to risk-weighted assets) | |||||||||||||||||||||||||||||||||
The Company | $ | 5,293,253 | 12.29% | $ | 3,445,531 | 8.00% | $ | 4,306,914 | 10.00% | $ | 7,385,958 | 14.32 | % | $ | 4,125,223 | 8.00 | % | $ | 5,156,529 | 10.00 | % | ||||||||||||
Zions First National Bank | 1,469,553 | 11.30 | 1,040,178 | 8.00 | 1,300,223 | 10.00 | 1,920,176 | 11.33 | 1,356,314 | 8.00 | 1,695,393 | 10.00 | |||||||||||||||||||||
California Bank & Trust | 1,200,874 | 11.50 | 835,632 | 8.00 | 1,044,541 | 10.00 | 1,158,262 | 11.05 | 838,538 | 8.00 | 1,048,172 | 10.00 | |||||||||||||||||||||
Amegy Bank N.A. | 916,454 | 10.35 | 708,239 | 8.00 | 885,299 | 10.00 | 1,290,617 | 11.13 | 927,404 | 8.00 | 1,159,255 | 10.00 | |||||||||||||||||||||
Tier I capital (to risk-weighted assets) | |||||||||||||||||||||||||||||||||
Tier 1 capital (to risk-weighted assets) | |||||||||||||||||||||||||||||||||
The Company | 3,437,413 | 7.98 | 1,722,766 | 4.00 | 2,584,148 | 6.00 | 5,269,330 | 10.22 | 2,062,612 | 4.00 | 3,093,917 | 6.00 | |||||||||||||||||||||
Zions First National Bank | 944,487 | 7.26 | 520,089 | 4.00 | 780,134 | 6.00 | 1,410,797 | 8.32 | 678,157 | 4.00 | 1,017,236 | 6.00 | |||||||||||||||||||||
California Bank & Trust | 751,100 | 7.19 | 417,816 | 4.00 | 626,724 | 6.00 | 872,714 | 8.33 | 419,269 | 4.00 | 628,903 | 6.00 | |||||||||||||||||||||
Amegy Bank N.A. | 636,517 | 7.19 | 354,120 | 4.00 | 531,180 | 6.00 | 939,442 | 8.10 | 463,702 | 4.00 | 695,553 | 6.00 | |||||||||||||||||||||
Tier I capital (to average assets) | |||||||||||||||||||||||||||||||||
Tier 1 capital (to average assets) | |||||||||||||||||||||||||||||||||
The Company | 3,437,413 | 7.86 | 1,312,658 | 3.00 | 2,187,763 | 5.00 | 5,269,330 | 9.99 | 1,583,071 | 3.00 | na | na | 1 | ||||||||||||||||||||
Zions First National Bank | 944,487 | 6.50 | 435,736 | 3.00 | 726,227 | 5.00 | 1,410,797 | 6.91 | 612,479 | 3.00 | 1,020,799 | 5.00 | |||||||||||||||||||||
California Bank & Trust | 751,100 | 7.36 | 306,240 | 3.00 | 510,401 | 5.00 | 872,714 | 8.77 | 298,587 | 3.00 | 497,645 | 5.00 | |||||||||||||||||||||
Amegy Bank N.A. | 636,517 | 7.64 | 249,864 | 3.00 | 416,441 | 5.00 | 939,442 | 8.67 | 325,140 | 3.00 | 541,899 | 5.00 | |||||||||||||||||||||
| 1 | There is no Tier 1 leverage ratio component in the definition of a well capitalized bank holding company. |
20. RETIREMENT PLANS
SFAS No. 158,Employers’ Accounting for Defined Benefit Pension and Other Postretirement Plans, an amendment of FASB Statements No. 87, 88, 106, and 132(R), requires an entity to recognize the overfunded or underfunded status of a defined benefit postretirement plan as an asset or liability in the balance sheet and to recognize changes in that funded status through other comprehensive income in the years in which changes occur. While the Statement does not change the determination of net periodic benefit cost included in net income, it does expand disclosure requirements about certain effects on net periodic benefit cost that may arise in subsequent fiscal years. We adopted SFAS 158 as of December 31, 2006.
We have a qualified noncontributory defined benefit pension plan which was amended January 1, 2003 after whichthat has been frozen to new employees were not allowed to participate. Allparticipation. No service-related benefit accrualsbenefits accrue for existing participants ceased as of that dateexcept for those with certain grandfathering exceptions.provisions. Benefits vest under the plan upon completion of five years of vesting service. Plan assets consist principally of corporate equity securities, mutual fund investments, and cash investments. Plan benefits are defined as a lump-sum cash value or an annuity at retirement age.
The following presents the change in benefit obligation, change in fair value of plan assets, and funded status of the pension plan and amounts recognized in the balance sheet as of the measurement date of December 31(in thousands):
Change in benefit obligation: Benefit obligation at beginning of year Service cost Interest cost Actuarial gain Benefits paid Benefit obligation at end of year Change in fair value of plan assets: Fair value of plan assets at beginning of year Actual return on plan assets Employer contribution Benefits paid Fair value of plan assets at end of year Funded status Amounts recognized in balance sheet: Liability for pension benefits Accumulated other comprehensive loss Accumulated other comprehensive loss consists of: Net loss 2007 2006 $ 155,084 157,404 384 499 8,564 8,624 (2,328) (3,242) (8,891) (8,201) 152,813 155,084 141,294 124,288 8,832 15,207 – 10,000 (8,891) (8,201) 141,235 141,294 $ (11,578) (13,790) $ (11,578) (13,790) 24,591 25,221 24,591 25,221
| 2009 | 2008 | ||||||
Change in benefit obligation: | |||||||
Benefit obligation at beginning of year | $ | 152,804 | 152,813 | ||||
Service cost | 229 | 288 | |||||
Interest cost | 8,889 | 8,849 | |||||
Actuarial loss | 6,618 | 1,137 | |||||
Benefits paid | (8,501 | ) | (10,283 | ) | |||
Benefit obligation at end of year | 160,039 | 152,804 | |||||
Change in fair value of plan assets: | |||||||
Fair value of plan assets at beginning of year | 90,174 | 141,235 | |||||
Actual return on plan assets | 14,566 | (41,778 | ) | ||||
Employer contribution | 2,500 | 1,000 | |||||
Benefits paid | (8,501 | ) | (10,283 | ) | |||
Fair value of plan assets at end of year | 98,739 | 90,174 | |||||
Funded status | $ | (61,300 | ) | (62,630 | ) | ||
Amounts recognized in balance sheet: | |||||||
Liability for pension benefits | $ | (61,300 | ) | (62,630 | ) | ||
Accumulated other comprehensive loss | 70,170 | 77,679 | |||||
Accumulated other comprehensive loss consists of: | |||||||
Net loss | 70,170 | 77,679 | |||||
The liability for pension/postretirement benefits is included in other liabilities in the balance sheet.
The amount of net loss in accumulated other comprehensive loss at December 31, 20072009 expected to be recognized as an expense component of net periodic benefit cost in 20082010 is approximately $1.0$5.7 million. The accumulated benefit obligation for the pension plan was $152.5$160.0 million and $154.7$152.6 million as of December 31, 20072009 and 2006,2008, respectively. Contributions to the plan are based on actuarial recommendation and pension regulations.
The following presents the components of net periodic benefit cost (credit) for the plan(in thousands):
| 2007 | 2006 | 2005 | |||||
Service cost | $ | 384 | 499 | 557 | |||
Interest cost | 8,564 | 8,624 | 8,630 | ||||
Expected return on plan assets | (11,618) | (10,250) | (10,211) | ||||
Amortization of net actuarial loss | 1,089 | 1,999 | 1,850 | ||||
Net periodic benefit cost (credit) | $ | (1,581) | 872 | 826 | |||
Weighted average assumptions for the plan are as follows:
| 2009 | 2008 | 2007 | ||||||||||||||
Service cost | $ | 229 | 288 | 384 | ||||||||||||
Interest cost | 8,889 | 8,849 | 8,564 | |||||||||||||
Expected return on plan assets | (7,074 | ) | (11,235 | ) | (11,618 | ) | ||||||||||
Amortization of net actuarial loss | 6,635 | 1,063 | 1,089 | |||||||||||||
Net periodic benefit cost (credit) | $ | 8,679 | (1,035 | ) | (1,581 | ) | ||||||||||
Weighted average assumptions for the plan are as follows: | ||||||||||||||||
| 2007 | 2006 | 2005 | 2009 | 2008 | 2007 | |||||||||||
Used to determine benefit obligation at year-end: | ||||||||||||||||
Discount rate | 6.00% | 5.65% | 5.60% | 5.60 | % | 6.00 | % | 6.00 | % | |||||||
Rate of compensation increase | 4.25 | 4.25 | 4.25 | 4.25 | 4.25 | 4.25 | ||||||||||
Used to determine net periodic benefit cost for the years ended December 31: | ||||||||||||||||
Discount rate | 5.65 | 5.60 | 5.75 | 6.00 | 6.00 | 5.65 | ||||||||||
Expected long-term return on plan assets | 8.30 | 8.50 | 8.60 | 8.30 | 8.30 | 8.30 | ||||||||||
Rate of compensation increase | 4.25 | 4.25 | 4.25 | 4.25 | 4.25 | 4.25 | ||||||||||
The discount rate reflects the yields available on long-term, high-quality fixed-incomefixed income debt instruments with cash flows similar to the obligations of the plan, reset annually on the measurement date. The expected long-term rate of return on plan assets is based on a review of the target asset allocation of the plan. This rate is intended to approximate the long-term rate of return that we anticipate receiving on the plan’s investments, considering the mix of the assets that the plan holds as investments, the expected return ofon these underlying investments, the diversification of these investments, and the rebalancing strategystrategies employed. An expected long-term rate of return is assumed for each asset class and an underlying inflation rate assumption is determined. The projected rate of compensation increases is management’s estimate of future pay increases that the remaining eligible employees will receive until their retirement.
Weighted average asset allocations at December 31 for the plan are as follows:
| 2007 | 2006 | |||
Equity securities | 3% | 5% | ||
Mutual funds: | ||||
Equity funds | 12 | 14 | ||
Debt funds | 19 | 18 | ||
Other: | ||||
Insurance company separate accounts – | 60 | 60 | ||
Guaranteed deposit account | 6 | 3 | ||
| 100% | 100% | |||
The plan’s investment strategy is predicated on its investment objectives and the risk and return expectations of asset classes appropriate for the plan. Investment objectives have been established by considering the plan’s liquidity needs and time horizon and the fiduciary standards under ERISA. The asset allocation strategy is developed to meet the plan’s long-term needs in a manner designed to control volatility and to reflect risk tolerance. Current targetTarget investment allocation percentages as of December 31, 2009 are 75% invested66.5% in equitiesequity and 25% invested33.5% in fixed income assets.
The following presents both the fair values of plan investments at December 31, 2009(in thousands) according to the fair value hierarchy described in Note 21, and the weighted average allocations at December 31:
Equity securities consist
| Level 1 | Level 2 | Level 3 | Total | 2009 | 2008 | ||||||||||
Company common stock | $ | 4,017 | 4,017 | 4 | % | 5 | % | ||||||||
Mutual funds: | |||||||||||||||
Equity | 3,358 | 3,358 | 3 | 9 | |||||||||||
Debt | 3,481 | 3,481 | 4 | 23 | |||||||||||
Insurance company separate accounts: | |||||||||||||||
Equity investments | 55,462 | 55,462 | 56 | 42 | |||||||||||
Debt investments | 18,899 | 18,899 | 19 | – | |||||||||||
Short-term fund | 4,428 | 4,428 | 4 | 11 | |||||||||||
Guaranteed deposit account | 7,595 | 7,595 | 8 | 9 | |||||||||||
Limited partnerships | 1,499 | 1,499 | 2 | 1 | |||||||||||
| $ | 10,856 | 78,789 | 9,094 | 98,739 | 100 | % | 100 | % | |||||||
Valuation methodologies used to measure plan investments at fair value were as follows:
Company common stock – Shares of 93,808the Company’s common stock are valued at the last reported sales price on the last business day of the plan year.
Mutual funds – These funds are valued at quoted market prices which represent the net asset values of shares held by the plan at year-end.
Insurance company separate accounts – Participation units in these pooled accounts are valued at quoted redemption values on the last business day of the plan year.
Guaranteed deposit account – This account is stated at book value as determined by the trustee, which approximates fair value. The account is credited with earnings from the underlying investments and charged for participants’ withdrawals and administrative expenses.
Limited partnerships – These partnerships are stated at book value, which approximates fair value, and is determined from the partnership’s capital account balance for the plan’s proportional interest. The capital account is credited with realized and unrealized earnings from the underlying investments and charged for operating expenses and distributions.
Shares of Company common stock with a fair value of $4.4 millionwere 283,405 and 169,973 at December 31, 20072009 and 91,606 shares with a fair value of $7.6 million at December 31, 2006.2008, respectively. Dividends received by the plan were approximately $161$18 thousand in 20072009 and $143$222 thousand in 2006.2008.
The following reconciles the beginning and ending balances of assets for 2009 that are measured at fair value on a recurring basis using Level 3 inputs(in thousands):
| Guaranteed deposit account | Limited partnerships | ||||||
Balance at January 1, 2009 | $ | 8,197 | 818 | ||||
Net increases (decreases) included in plan statement of changes in net assets available for benefits: | |||||||
Net appreciation (depreciation) in fair value of investments: | |||||||
Realized | – | – | |||||
Unrealized | – | (82 | ) | ||||
Interest and dividends | 325 | – | |||||
Purchases, sales, issuances, and settlements, net | (927 | ) | 763 | ||||
Balance at December 31, 2009 | $ | 7,595 | 1,499 | ||||
Benefit payments to pension plan participants, which reflect expected future service as appropriate, are estimated as follows for the years succeeding December 31, 20072009(in thousands):
2008 | $ | 8,580 | |
2009 | 9,190 | ||
2010 | 9,880 | ||
2011 | 8,945 | ||
2012 | 10,281 | ||
Years 2013 - 2017 | 51,796 |
Amegy also had a defined benefit pension plan which was terminated during 2007 at a net cost approximating the existing liability.
2010 | $ | 10,435 | |
2011 | 9,147 | ||
2012 | 10,242 | ||
2013 | 9,981 | ||
2014 | 9,998 | ||
Years 2015 - 2019 | 51,738 |
We also have unfunded nonqualified supplemental retirement plans for certain current and former employees. The following presents the change in benefit obligation, change in fair value of plan assets, and funded status of these plans and amounts recognized in the balance sheet as of the measurement date of December 31(in thousands):
Change in benefit obligation: Benefit obligation at beginning of year Interest cost Actuarial gain Benefits paid Settlements Benefit obligation at end of year Change in fair value of plan assets: Fair value of plan assets at beginning of year Employer contributions Benefits paid and settlements Fair value of plan assets at end of year Funded status Amounts recognized in balance sheet: Liability for pension benefits Accumulated other comprehensive loss Accumulated other comprehensive loss consists of: Net loss Prior service cost Transition liability 2007 2006 $ 13,052 13,415 693 719 (205) (236) (904) (846) (841) – 11,795 13,052 – – 1,745 846 (1,745) (846) – – $ (11,795) (13,052) $ (11,795) (13,052) 1,500 1,995 $ 702 1,057 798 922 – 16 $ 1,500 1,995
| 2009 | 2008 | ||||||
Change in benefit obligation: | |||||||
Benefit obligation at beginning of year | $ | 11,458 | 11,795 | ||||
Interest cost | 661 | 680 | |||||
Actuarial (gain) loss | 233 | (113 | ) | ||||
Benefits paid | (899 | ) | (904 | ) | |||
Benefit obligation at end of year | 11,453 | 11,458 | |||||
Change in fair value of plan assets: | |||||||
Fair value of plan assets at beginning of year | – | – | |||||
Employer contributions | 899 | 904 | |||||
Benefits paid and settlements | (899 | ) | (904 | ) | |||
Fair value of plan assets at end of year | – | – | |||||
Funded status | $ | (11,453 | ) | (11,458 | ) | ||
Amounts recognized in balance sheet: | |||||||
Liability for pension benefits | $ | (11,453 | ) | (11,458 | ) | ||
Accumulated other comprehensive loss | 1,428 | 1,290 | |||||
Accumulated other comprehensive loss consists of: | |||||||
Net loss | $ | 879 | 617 | ||||
Prior service cost | 549 | 673 | |||||
| $ | 1,428 | 1,290 | |||||
The amounts in accumulated other comprehensive loss at December 31, 20072009 expected to be recognized as an expense component of net periodic benefit cost in 20082010 are estimated as follows(in thousands):
| |||
| |||
Net gain | $ | (17 | ) | |
Prior service cost | 124 | |||
| $ | 107 | |||
The following presents the components of net periodic benefit cost for these plans(in thousands):
| 2007 | 2006 | 2005 | |||||
Interest cost | $ | 693 | 719 | 730 | |||
Amortization of net actuarial (gain) loss | 149 | (10) | (16) | ||||
Amortization of prior service cost | 124 | 124 | 124 | ||||
Amortization of transition liability | 16 | 16 | 16 | ||||
Net periodic benefit cost | $ | 982 | 849 | 854 | |||
| 2009 | 2008 | 2007 | |||||||
Interest cost | $ | 661 | 680 | 693 | |||||
Amortization of net actuarial (gain) loss | (29 | ) | (27 | ) | 149 | ||||
Amortization of prior service cost | 124 | 124 | 124 | ||||||
Amortization of transition liability | – | – | 16 | ||||||
Net periodic benefit cost | $ | 756 | 777 | 982 | |||||
Weighted average assumptions applicable for these plans are the same as the pension plan. Each year, Company contributions to these plans are made in amounts sufficient to meet benefit payments to plan participants. These benefit payments are estimated as follows for the years succeeding December 31, 20072009(in thousands):
2008 | $ | 1,821 | |
2009 | 1,053 | ||
2010 | 1,086 | ||
2011 | 1,152 | ||
2012 | 1,082 | ||
Years 2013 - 2017 | 4,331 |
2010 2011 2012 2013 2014 Years 2015 - 2019 $ 2,064 1,156 1,087 952 842 4,002
We are also obligated under several other supplemental retirement plans for certain current and former employees. At December 31, 20072009 and 2006,2008, our liability was $5.1$5.3 million and $5.4 million, respectively, for these plans.
We also sponsor an unfunded defined benefit health care plan that provides postretirement medical benefits to certain full-time employees who met minimum age and service requirements. The plan is contributory with retiree contributions adjusted annually, and contains other cost-sharing features such as deductibles and coinsurance. Plan coverage is provided by self-funding or health maintenance organizations (HMOs) options. Reductions in our obligations to provide benefits resulting from cost sharing changes have been applied to reduceOur contribution towards the plan’s unrecognized transition obligation. In 2000, we increased our contribution toward retiree medical coverage andpremium has been permanently froze our contributions.frozen. Retirees pay the difference between the full premium rates and our capped contribution.
Effective June 1, 2008, we amended the plan and curtailed coverage for certain participants, primarily those with post-65 coverage. The effect of this curtailment on the change in the plan’s benefit obligation and determination of net periodic benefit cost (credit) for 2008 was determined in accordance with applicable accounting standards.
The following tableschedule presents the change in benefit obligations, change in fair value of plan assets, and funded status of the plan and amounts recognized in the balance sheet as of the measurement date of December 31(in thousands):
| 2007 | 2006 | |||||||||||||
| 2009 | 2008 | |||||||||||||
Change in benefit obligation: | ||||||||||||||
Benefit obligation at beginning of year | $ | 5,919 | 6,454 | $ | 1,100 | 5,728 | ||||||||
Service cost | 105 | 101 | 34 | 56 | ||||||||||
Interest cost | 318 | 326 | 63 | 181 | ||||||||||
Actuarial gain | (18 | ) | (337 | ) | ||||||||||
Plan amendment/settlement | – | (4,239 | ) | |||||||||||
Actuarial (gain) loss | 40 | (96 | ) | |||||||||||
Benefits paid | (596 | ) | (625 | ) | (97 | ) | (530 | ) | ||||||
Benefit obligation at end of year | 5,728 | 5,919 | 1,140 | 1,100 | ||||||||||
Change in fair value of plan assets: | ||||||||||||||
Fair value of plan assets at beginning of year | – | – | – | – | ||||||||||
Employer contributions | 596 | 625 | 97 | 530 | ||||||||||
Benefits paid | (596 | ) | (625 | ) | (97 | ) | (530 | ) | ||||||
Fair value of plan assets at end of year | – | – | – | – | ||||||||||
Funded status | $ | (5,728 | ) | (5,919 | ) | $ | (1,140 | ) | (1,100 | ) | ||||
Amounts recognized in balance sheet: | ||||||||||||||
Liability for postretirement benefits | $ | (5,728 | ) | (5,919 | ) | $ | (1,140 | ) | (1,100 | ) | ||||
Accumulated other comprehensive loss | (1,090 | ) | (1,341 | ) | ||||||||||
Accumulated other comprehensive loss consists of: | ||||||||||||||
Accumulated other comprehensive income | (1,625 | ) | (2,105 | ) | ||||||||||
Accumulated other comprehensive income consists of: | ||||||||||||||
Net gain | (1,090 | ) | (1,341 | ) | $ | (744 | ) | (980 | ) | |||||
Prior service cost | (881 | ) | (1,125 | ) | ||||||||||
| $ | (1,625 | ) | (2,105 | ) | ||||||||||
The amount of net gainamounts in accumulated other comprehensive loss at December 31, 20072009 expected to be recognized as aan expense component of net periodic benefit cost in 2008 is approximately $218 thousand.2010 are estimated as follows(in thousands):
Net gain | $ | (149 | ) | |
Prior service credit | (243 | ) | ||
| $ | (392 | ) | ||
The following presents the components of net periodic benefit cost (credit) for the plan(in thousands):
| 2007 | 2006 | 2005 | ||||||||
Service cost | $ | 105 | 101 | 118 | ||||||
Interest cost | 318 | 326 | 357 | |||||||
Amortization of net actuarial gain | (268 | ) | (333 | ) | (357 | ) | ||||
Net periodic benefit cost | $ | 155 | 94 | 118 | ||||||
Service cost Interest cost Amortization of prior service credit Amortization of net actuarial gain Plan amendment/settlement gain Net periodic benefit cost (credit) 2009 2008 2007 $ 34 56 105 63 181 318 (243 ) (142 ) – (196 ) (206 ) (268 ) – (2,973 ) – $ (342 ) (3,084 ) 155
Weighted average assumptions for the plan are as follows:
| 2007 | 2006 | 2005 | 2009 | 2008 | 2007 | ||||||||||
Used to determine benefit obligation at year-end: | |||||||||||||||
Discount rate | 6.00% | 5.65% | 5.60% | 5.60 | % | 6.00 | % | 6.00 | % | ||||||
Used to determine net periodic benefit cost for the years ended December 31: | |||||||||||||||
Discount rate | 5.65 | 5.60 | 5.75 | 6.00 | 6.00 | 5.65 | |||||||||
Because our contribution rate is capped, there is no effect on the plan from assumed increases or decreases in health care cost trends. Each year, Company contributions to the plan are made in amounts sufficient to meet benefit payments to plan participants. These benefit payments are estimated as follows for the years succeeding December 31, 20072009(in thousands):
2008 | $ | 573 | |
2009 | 556 | ||
2010 | 541 | ||
2011 | 525 | ||
2012 | 511 | ||
Years 2013 - 2017 | 2,321 |
2010 | $ | 110 | |
2011 | 120 | ||
2012 | 127 | ||
2013 | 126 | ||
2014 | 126 | ||
Years 2015 - 2019 | 586 |
We have a 401(k) and employee stock ownership plan (“Payshelter”) under which employees select from several investment alternatives. Employees can contribute up to 80% of their earnings subject to the annual maximum allowed contribution. The Company matches 100% of the first 3% of employee contributions and 50% of the next 2% of employee contributions. Matching contributions are invested in the Company’s common stock and amounted to $19.8 million in 2007, $17.32009, $20.6 million in 2006,2008, and $12.4$19.8 million in 2005.
2007.
The Payshelter plan also has a noncontributory profit sharing feature which is discretionary and may range from 0% to 6% of eligible compensation based upon the Company’s return on average common equity for the year. The contribution percentage was 3.25% for 2007For 2009 and 4% for 2006, and the related2008, no profit sharing expense was $17.0 million and $17.9 million, respectively.accrued. The profit sharing contribution is invested in the Company’s common stock.
21. FAIR VALUE OF FINANCIAL INSTRUMENTS
ASC 820,Fair Value Measurements and Disclosures, defines fair value, establishes a consistent framework for measuring fair value, and enhances disclosures about fair value measurements. Effective January 1, 2009, we adopted new guidance under ASC 820 that affected our accounting and reporting of fair value as follows:
Inclusion of nonfinancial assets and nonfinancial liabilities, which for the Company primarily related to other real estate owned.
Estimation of fair value when the volume and level of activity for an asset or liability have significantly decreased in relation to normal market activity; additional guidance to determine when a transaction is not orderly; and enhanced disclosures of fair value measurements.
Disclosure of fair values on an interim rather than annual basis for certain financial instruments.
The carryingAs of December 31, 2009, we also adopted ASU 2009-05,Measuring Liabilities at Fair Value. This new guidance under ASC 820 clarifies and describes the pricing approaches that may be used to fair value certain liabilities, including debt that is publicly traded.
Fair Value Measurements
Fair value is defined as the exchange price that would be received for an asset or paid to transfer a liability (an exit price) in the principal or most advantageous market for the asset or liability in an orderly transaction between market participants on the measurement date. To measure fair value, a hierarchy has been established which requires an entity to maximize the use of observable inputs and estimatedminimize the use of unobservable inputs. This hierarchy uses three levels of inputs to measure the fair value of principalassets and liabilities as follows:
Level 1 – Quoted prices in active markets for identical assets or liabilities; includes certain U.S. Treasury and other U.S. Government and agency securities actively traded in over-the-counter markets; certain securities sold, not yet purchased; and certain derivatives.
Level 2 – Observable inputs other than Level 1 including quoted prices for similar assets or liabilities, quoted prices in less active markets, or other observable inputs that can be corroborated by observable market data; also includes derivative contracts whose value is determined using a pricing model with observable market inputs or can be derived principally from or corroborated by observable market data. This category generally includes certain U.S. Government and agency securities; certain CDO securities; corporate debt securities; certain private equity investments; certain securities sold, not yet purchased; and certain derivatives.
Level 3 – Unobservable inputs supported by little or no market activity for financial instruments whose value is determined using pricing models, discounted cash flow methodologies, or similar techniques, as well as instruments for which the determination of fair value requires significant management judgment or estimation; also includes observable inputs for nonbinding single dealer quotes not corroborated by observable market data. This category generally includes certain private equity investments and most CDO securities.
We use fair value to measure certain assets and liabilities on a recurring basis when fair value is the primary measure for accounting. This is done primarily for AFS and trading investment securities; private equity investments; securities sold, not yet purchased; and derivatives. Fair value is used on a nonrecurring basis to measure certain assets when applying lower of cost or market accounting or when adjusting carrying values, such as for loans held for sale, impaired loans, and other real estate owned. Fair value is also used when evaluating impairment on certain assets, including HTM and AFS securities, goodwill, core deposit and other intangibles, long-lived assets, and for disclosures of certain financial instruments.
AFS and trading investment securities are fair valued under Level 1 using quoted market prices when available for identical securities. When quoted prices are not available, fair values are determined under Level 2 using quoted prices for similar securities or independent pricing services that incorporate observable market data when possible. AFS securities also include certain CDOs that consist of trust preferred securities related to banks and insurance companies and to REITs.
Substantially all the CDO portfolio is fair valued under a Level 3 cash flow modeling approach using several methodologies that primarily include internal and third party models.
A licensed third party model is used internally to fair value bank and insurance trust preferred CDOs. This model uses third party, model-derived estimates of expected losses on underlying collateral and applies market-based discount rates on resultant cash flows to estimate fair value. Adverse market developments that continued in the first half of 2009 made it more difficult to determine appropriate assumptions for this model. These developments related to ratings downgrades, declines in trading volumes, increases in the number of defaulting and deferring collateral issuers, and other factors. Assumptions for discount rates, probabilities of default, loss-given-default rates, etc., reflect related risk assessments on specific CDO securities and tranches within those securities.
Third party models are used to fair value certain REIT and ABS CDOs. These models utilize relevant data assumptions, which we evaluate for reasonableness. These assumptions include but are not limited to discount rates, probabilities of default, loss-given-default rates, over-collateralization levels, and rating transition probability matrices from rating agencies. The model prices obtained from third party services were evaluated for reasonableness including quarter to quarter changes in assumptions and comparison to other available data which included third party and internal model results and valuations.
Private equity investments valued under Level 2 on a recurring basis are investments in partnerships that invest in financial institutions. Fair values are determined from net asset values provided by the partnerships. Private equity investments valued under Level 3 on a recurring basis are recorded initially at acquisition cost, which is considered the best indication of fair value unless there have been material subsequent positive or
negative developments that justify an adjustment in the fair value estimate. Subsequent adjustments to recorded fair values are based as necessary on current and projected financial performance, recent financing activities, economic and market conditions, market comparables, market liquidity, sales restrictions, and other factors.
Derivatives are fair valued according to their classification as either exchange-traded or over-the-counter (“OTC”). Exchange-traded derivatives consist of forward currency exchange contracts that have been fair valued under Level 1 because they are traded in active markets. OTC derivatives consist of interest rate swaps and options as well as energy commodity derivatives for customers. These derivatives are fair valued primarily under Level 2 using third party services. Observable market inputs include yield curves, option volatilities, counterparty credit risk, and other related data. Credit valuation adjustments are required to reflect both our own nonperformance risk and the respective counterparty’s nonperformance risk. These adjustments are determined generally by applying a credit spread for the counterparty or the Company as appropriate to the total expected exposure of the derivative. Amounts disclosed in the following schedule are also net of the cash collateral offsets discussed in Note 5.
Securities sold, not yet purchased are fair valued under Level 1 when quoted prices are available for the securities involved. Those under Level 2 are fair valued similar to trading account investment securities.
Assets and liabilities measured at fair value on a recurring basis, including one security elected under the fair value option, are summarized as follows at December 31, 2009 and 2008(in thousands):
| December 31, 2009 | ||||||||||
| Level 1 | Level 2 | Level 3 | Total | |||||||
ASSETS | ||||||||||
Investment securities: | ||||||||||
Available-for-sale: | ||||||||||
U.S. Treasury and agencies | $ | 24,777 | 1,403,680 | 1,428,457 | ||||||
Municipal securities | 177,180 | 64,314 | 241,494 | |||||||
Asset-backed securities: | ||||||||||
Trust preferred – banks and insurance | 1,656 | 1,359,444 | 1,361,100 | |||||||
Trust preferred – real estate investment trusts | 24,018 | 24,018 | ||||||||
Auction rate | 159,440 | 159,440 | ||||||||
Other | 14,722 | 62,430 | 77,152 | |||||||
Mutual funds and stock | 357,175 | 6,783 | 363,958 | |||||||
Trading account | 23,543 | 23,543 | ||||||||
Other noninterest-bearing investments: | ||||||||||
Private equity | 22,850 | 158,941 | 181,791 | |||||||
Other assets: | ||||||||||
Derivatives | 2,976 | 134,020 | 136,996 | |||||||
| $ | 384,928 | 1,784,434 | 1,828,587 | 3,997,949 | ||||||
LIABILITIES | ||||||||||
Securities sold, not yet purchased | $ | 43,404 | 43,404 | |||||||
Other liabilities: | ||||||||||
Derivatives | 2,833 | 71,842 | 74,675 | |||||||
Other | 522 | 522 | ||||||||
| $ | 2,833 | 115,246 | 522 | 118,601 | ||||||
| December 31, 2008 | ||||||||||
| Level 1 | Level 2 | Level 3 | Total | |||||||
ASSETS | ||||||||||
Investment securities: | ||||||||||
Available-for-sale | $ | 27,756 | 1,898,082 | 750,417 | 2,676,255 | |||||
Trading account | 41,108 | 956 | 1 | 42,064 | ||||||
Other noninterest-bearing investments: | ||||||||||
Private equity | 29,037 | 143,511 | 172,548 | |||||||
Other assets: | ||||||||||
Derivatives | 9,922 | 395,272 | 405,194 | |||||||
| $ | 37,678 | 2,363,499 | 894,884 | 3,296,061 | ||||||
LIABILITIES | ||||||||||
Securities sold, not yet purchased | $ | 35,657 | 35,657 | |||||||
Other liabilities: | ||||||||||
Derivatives | 8,812 | 175,670 | 184,482 | |||||||
Other | 527 | 527 | ||||||||
| $ | 8,812 | 211,327 | 527 | 220,666 | ||||||
| 1 | Elected under fair value option, as discussed subsequently. |
The following reconciles the beginning and ending balances of assets and liabilities for 2009 and 2008 that are measured at fair value on a recurring basis using Level 3 inputs(in thousands):
| Level 3 Instruments | |||||||||||||||||||||||||
| Year Ended December 31, 2009 | |||||||||||||||||||||||||
| Municipal securities | Trust preferred – banks and insurance | Trust preferred – REIT | Auction rate | Other asset- backed | Trading account1 | Private equity investments | Other liabilities | ||||||||||||||||||
Balance at January 1, 2009 | $ | – | 659,253 | 23,897 | 1,710 | 65,557 | 956 | 143,511 | (527 | ) | |||||||||||||||
Total net gains (losses) included in: | |||||||||||||||||||||||||
Statement of income2: | |||||||||||||||||||||||||
Dividends and other investment income (loss) | (10,626 | ) | |||||||||||||||||||||||
Fair value and nonhedge derivative income (loss) | (956 | ) | |||||||||||||||||||||||
Equity securities gains, net | 109 | ||||||||||||||||||||||||
Fixed income securities gains (losses), net | 16 | (10,491 | ) | 2,126 | 95 | ||||||||||||||||||||
Net impairment losses on investment securities | (130,898 | ) | (87,867 | ) | (11,110 | ) | |||||||||||||||||||
Valuation losses on securities purchased | (6,977 | ) | (172,729 | ) | (8,945 | ) | (17,265 | ) | (1,774 | ) | |||||||||||||||
Other noninterest expense | 5 | ||||||||||||||||||||||||
Other comprehensive income (loss) | 1,376 | (41,582 | ) | 56,480 | (239 | ) | 7,537 | ||||||||||||||||||
Fair value of HTM securities transferred to AFS | 565,282 | 15,280 | 15,674 | ||||||||||||||||||||||
Purchases, sales, issuances, and settlements, net | 66,624 | 490,609 | 25,173 | 167,928 | (13,549 | ) | 25,947 | ||||||||||||||||||
Net transfers in | 3,275 | 5,180 | |||||||||||||||||||||||
Balance at December 31, 2009 | $ | 64,314 | 1,359,444 | 24,018 | 159,440 | 62,430 | – | 158,941 | (522 | ) | |||||||||||||||
| Level 3 Instruments | ||||||||||||||||
| Year Ended December 31, 2008 | ||||||||||||||||
| Investment securities | Retained interests from securitizations1 | Private equity investments | Other liabilities | |||||||||||||
| Available- for-sale | Trading account1 | |||||||||||||||
Balance at January 1, 2008 | $ | 337,338 | 8,100 | 42,426 | 116,657 | (44 | ) | |||||||||
Total net gains (losses) included in: | ||||||||||||||||
Statement of income2: | ||||||||||||||||
Dividends and other investment income | 6,880 | |||||||||||||||
Fair value and nonhedge derivative loss | (7,144 | ) | (2,098 | ) | ||||||||||||
Equity securities gains (losses), net | (7,580 | ) | ||||||||||||||
Impairment losses on AFS securities and valuation losses on securities purchased from Lockhart Funding | (112,131 | ) | ||||||||||||||
Other noninterest expense | 517 | |||||||||||||||
Other comprehensive loss | (165,694 | ) | ||||||||||||||
Proceeds from ESOARS auction | (1,000 | ) | ||||||||||||||
Fair value of AFS securities transferred to HTM | (206,020 | ) | ||||||||||||||
Purchases, sales, issuances, and settlements, net | 68,158 | (13,593 | ) | 27,554 | ||||||||||||
Net transfers in (out) | 828,766 | – | (26,735 | ) | – | |||||||||||
Balance at December 31, 2008 | $ | 750,417 | 956 | – | 143,511 | (527 | ) | |||||||||
| 1 | Elected under fair value option, as discussed subsequently. |
| 2 | All amounts are unrealized except for realized gains of $1.4 million in 2009 and $5.9 million in 2008 included in dividends and other investment income, and $11.2 million in 2008 included in equity securities gains (losses), and realized losses in 2009 of $76.7 million included in net impairment losses on investment securities and $10.6 million included in fixed income securities gains (losses), net. |
Assets measured at fair value on a nonrecurring basis are summarized as follows(in thousands):
| December 31, 2007 | December 31, 2006 | ||||||||
| Carrying value | Estimated fair value | Carrying value | Estimated fair value | ||||||
Financial assets: | |||||||||
Cash and due from banks | $ | 1,855,155 | 1,855,155 | 1,938,810 | 1,938,810 | ||||
Money market investments | 1,500,208 | 1,500,208 | 369,276 | 369,276 | |||||
Investment securities | 5,860,900 | 5,858,607 | 5,767,467 | 5,763,171 | |||||
Loans and leases, net of allowance | 38,628,403 | 38,975,714 | 34,302,406 | 34,311,063 | |||||
Derivatives (included in other assets) | 307,452 | 307,452 | 51,749 | 51,749 | |||||
Total financial assets | $ | 48,152,118 | 48,497,136 | 42,429,708 | 42,434,069 | ||||
Financial liabilities: | |||||||||
Demand, savings, and money market deposits | $ | 26,593,376 | 26,593,376 | 25,869,197 | 25,869,197 | ||||
Time deposits | 6,953,951 | 7,017,862 | 6,560,023 | 6,574,080 | |||||
Foreign deposits | 3,375,426 | 3,374,886 | 2,552,526 | 2,551,651 | |||||
Securities sold, not yet purchased | 224,269 | 224,269 | 175,993 | 175,993 | |||||
Federal funds purchased and security repurchase agreements | 3,761,572 | 3,761,572 | 2,927,540 | 2,927,540 | |||||
Derivatives (included in other liabilities) | 104,002 | 104,002 | 63,191 | 63,191 | |||||
Commercial paper, FHLB advances and other borrowings | 3,607,452 | 3,613,520 | 875,490 | 880,630 | |||||
Long-term debt | 2,463,254 | 2,493,832 | 2,357,721 | 2,384,806 | |||||
Total financial liabilities | $ | 47,083,302 | 47,183,319 | 41,381,681 | 41,427,088 | ||||
| Gains (losses) from fair value changes | ||||||||||||
| Fair value at December 31, 2009 | Year Ended December 31, 2009 | |||||||||||
| Level 1 | Level 2 | Level 3 | Total | |||||||||
ASSETS | ||||||||||||
HTM securities adjusted for OTTI | $ | – | 3,100 | 3,100 | (3,301 | ) | ||||||
Loans held for sale | 15,571 | – | 15,571 | 60 | ||||||||
Impaired loans | – | 250,035 | 250,035 | (234,534 | ) | |||||||
Other real estate owned | 143,541 | – | 143,541 | (118,641 | ) | |||||||
| $ | – | 159,112 | 253,135 | 412,247 | (356,416 | ) | ||||||
| Gains (losses) from fair value changes | ||||||||||||
| Fair value at December 31, 2008 | Year Ended December 31, 2008 | |||||||||||
| Level 1 | Level 2 | Level 3 | Total | |||||||||
ASSETS | ||||||||||||
Loans held for sale | $ | 21,518 | – | 21,518 | 34 | |||||||
Impaired loans | – | 254,743 | 254,743 | (53,259 | ) | |||||||
| $ | – | 21,518 | 254,743 | 276,261 | (53,225 | ) | ||||||
Loans held for sale relate to loans purchased under the Small Business Administration 7(a) program. They are fair valued under Level 2 based on quotes of comparable instruments.
Impaired loans that are collateral-dependent are fair valued under Level 3 based on the fair value of the collateral, which is then further discounted (12-20%) to reflect marketing costs and potential volatility in realizable values.
Other real estate owned is fair valued under Level 2 at the lower of cost or fair value based on property appraisals at the time of transfer and as appropriate thereafter.
Fair Value Option
ASC 825,Financial AssetsInstruments, allows for the option to report certain financial assets and liabilities at fair value initially and at subsequent measurement dates with changes in fair value included in earnings. The fair value option may be applied instrument by instrument, but is on an irrevocable basis. At January 1, 2008, the Company elected the fair value option for one available-for-sale REIT trust preferred CDO security and three retained interests on selected small business loan securitizations. The cumulative effect of adopting the fair value option decreased retained earnings at January 1, 2008 by approximately $11.5 million.
The REIT trust preferred CDO was selected as part of a directional hedging program to hedge the credit exposure the Company has to homebuilders in its REIT CDO portfolio. This allowed the Company to avoid complex hedge accounting provisions associated with the implemented hedging program. Management selected this security because it had the most exposure to the homebuilder market compared to the other REIT CDOs in the Company’s portfolio, both in dollar amount and as a percentage, and was therefore considered the most suitable for hedging. This security was sold in 2009.
The retained interests had been selected to more appropriately reflect their fair value and to account for increases and decreases in their fair value through earnings. During 2008, Zions Bank purchased securities from Lockhart that comprised the entire remaining small business loan securitizations created by Zions Bank and held by Lockhart. These retained interests related to the securities purchased and, as part of the purchase transaction, were included with the premium recorded with the loan balances at Zions Bank.
Following is a summary of the carrying values and estimated fair values of certain financial instruments(in thousands):
| December 31, 2009 | December 31, 2008 | ||||||||
| Carrying value | Estimated fair value | Carrying value | Estimated fair value | ||||||
Financial assets: | |||||||||
HTM investment securities | $ | 869,595 | 833,455 | 1,790,989 | 1,443,555 | ||||
Loans and leases (including loans held for sale), net of allowance | 38,866,215 | 38,355,658 | 41,172,057 | 40,646,816 | |||||
Financial liabilities: | |||||||||
Time deposits | $ | 5,614,867 | 5,675,127 | 7,730,784 | 7,923,883 | ||||
Foreign deposits | 1,679,028 | 1,679,568 | 2,622,562 | 2,625,869 | |||||
FHLB advances and other borrowings | 135,911 | 138,062 | 2,168,106 | 2,179,562 | |||||
Long-term debt (less fair value hedges) | 1,993,508 | 2,139,942 | 2,257,633 | 1,838,555 | |||||
The estimated fairThis summary excludes financial assets and liabilities for which carrying value approximates the carrying value offair value. For financial assets, these include cash and due from banks and money market investments. For investment securities, thefinancial liabilities, these include demand, savings, and money market deposits, federal funds purchased, and security repurchase agreements. The estimated fair value of demand, savings, and money market deposits is basedthe amount payable on quoted market prices where available. If quoted market pricesdemand at the reporting date. Carrying value is used because the accounts have no stated maturity and the customer has the ability to withdraw funds immediately. Also excluded from the summary are not available,financial instruments recorded at value fair values are based on quoted market prices of comparable instruments or a discounted cash flow model based on established market rates. recurring basis, as previously described.
The fair value of loans is estimated by discounting future cash flows on “pass” grade loans using the LIBOR yield curve adjusted by a factor which reflects the credit and interest rate risk inherent in the loan.
Financial Liabilities
The These future cash flows are then reduced by the estimated fair value of demand, savings, and money market deposits is“life-of-the-loan” aggregate credit losses in the amount payable on demand at the reporting date. SFAS No. 107,Disclosures about Fair Value of Financial Instruments, requires the use of the carrying valueloan portfolio. These adjustments for lifetime future credit losses are highly judgmental because the accountsCompany does not have no stated maturitya validated model to estimate lifetime credit losses on large portions of its loan portfolio. However, the estimate of lifetime credit losses was increased during the third quarter of 2009 because of more recent loss experience and the customer has the abilityexpectation of a prolonged cycle of economic weakness. Impaired loans are not included in this credit adjustment as they are already considered to withdraw funds immediately. The estimatedbe held at fair value of securities soldvalue. Loans, other than those held for sale, are not yet purchased, federal fundsnormally purchased and security repurchase agreements also approximatessold by the carrying value. Company, and there are no active trading markets for most of this portfolio.
The fair value of time and foreign deposits, is estimated by discounting future cash flows using the LIBOR yield curve. Commercial paper is issued for short terms of duration. The fair value of fixed rate FHLB advances, and other borrowings is estimated by discounting future cash flows using the LIBOR yield curve. Variable rate FHLB advances reprice with changes in market rates; as such, their carrying amounts approximate fair value. Other borrowings are not significant. The estimated fair value of long-term debt is based on actual market trades (i.e., an asset value) when available or discounting cash flows using the LIBOR yield curve plusadjusted for credit spreads.
Derivative Instruments
The fair value of the derivatives reflects the estimated amounts that we would receive or pay to terminate these contracts at the reporting date based upon pricing or valuation models applied to current market information. Interest rate swaps are valued using the
market standard methodology of netting the discounted future fixed cash receipts (or payments) and the discounted expected variable cash payments (or receipts). The variable cash payments (or receipts) are based on an expectation of future interest rates derived from observed market interest rate curves.
Off-Balance Sheet Financial Instruments
The fair value of commitments to extend credit and letters of credit, based on fees currently charged for similar commitments, is not significant.
Limitations
These fair value disclosures represent our best estimates based on relevant market information and information about the financial instruments. Fair value estimates are based on judgments regarding future expected loss experience, current economic conditions, risk characteristics of the various instruments, and other factors. These estimates are subjective in nature and involve uncertainties and matters of significant judgment and therefore cannot be determined with precision. Changes in the above methodologies and assumptions could significantly affect the estimates.
Further, certain financial instruments and all nonfinancial instruments are excluded from the applicable disclosure requirements. Therefore, the fair value amounts shown in the tableschedule do not, by themselves, represent the underlying value of the Company as a whole.
On January 21, 2010, the FASB issued ASU 2010-6,Improving Disclosures about Fair Value Measurements. This new accounting guidance under ASC 820 would require additional disclosures about fair value measurements. Among other things, these additional disclosures would include (1) the amounts and reasons for certain significant transfers among the three hierarchy levels of inputs, (2) the gross, rather than net, basis for certain Level 3 rollforward information, (3) use of a “class” basis rather than a “major category” basis for assets and liabilities, and (4) valuation techniques and inputs used to estimate Level 2 and Level 3 fair value measurements. Generally, this new guidance will be effective for the first quarter of 2010; however, certain changes will not be required until the first quarter of 2011.
22. OPERATING SEGMENT INFORMATION
We manage our operations and prepare management reports and other information with a primary focus on geographical area. As of December 31, 2007,2009, we operate eight community/regional banks in distinct geographical areas. Performance assessment and resource allocation are based upon this geographical structure. The operating segment identified as “Other” includes the Parent, Zions Management Services Company (“ZMSC”), certain nonbank financial service and financial technology subsidiaries, other smaller nonbank operating units, TCBO (see Note 1), and eliminations of transactions between segments. Results for Amegy in 2005 only include the month of December.
ZMSC provides internal technology and operational services to affiliated operating businesses of the Company. ZMSC charges most of its costs to the affiliates on an approximate break-even basis.
The accounting policies of the individual operating segments are the same as those of the Company as described in Note 1. Transactions between operating segments are primarily conducted at fair value, resulting in profits that are eliminated for reporting consolidated results of operations. Operating segments pay for centrally provided services based upon estimated or actual usage of those services.
During 2009, Zions Bank, CB&T and NSB sold at fair value to the Parent investment securities with an amortized cost of $572 million and recorded $75.8 million, $288.1 million and $11.8 million, respectively, of fixed income securities losses. In the following schedules presenting operating segment information, these losses are included in “other noninterest income” of the respective subsidiary. The elimination of these losses is included in “other noninterest income” for the Other segment. For 2009, these transactions increased the net loss applicable to common shareholders at Zions Bank, CB&T and NSB by $46.8 million, $166.9 million and $7.7 million, respectively.
The following is a summary of selected operating segment information for the years ended December 31, 2007, 20062009, 2008 and 20052007(in millions):
| Zions Bank | CB&T | Amegy | NBA | NSB | Vectra | TCBW | Other | Consolidated Company | |||||||||||
2007: | |||||||||||||||||||
Net interest income | $ | 551.4 | 434.8 | 331.3 | 250.8 | 182.5 | 96.9 | 35.1 | (0.8) | 1,882.0 | |||||||||
Provision for loan losses | 39.1 | 33.5 | 21.2 | 30.5 | 23.3 | 4.0 | 0.3 | 0.3 | 152.2 | ||||||||||
Net interest income after provision for loan losses | 512.3 | 401.3 | 310.1 | 220.3 | 159.2 | 92.9 | 34.8 | (1.1) | 1,729.8 | ||||||||||
Impairment losses on available-for-sale securities and valuation losses on securities purchased from Lockhart Funding | (59.7) | (79.2) | – | – | – | – | – | (19.3) | (158.2) | ||||||||||
Other noninterest income | 236.8 | 87.3 | 126.7 | 33.4 | 32.9 | 28.1 | 2.5 | 22.8 | 570.5 | ||||||||||
Noninterest expense | 463.2 | 230.8 | 295.6 | 142.4 | 111.8 | 86.3 | 14.4 | 60.1 | 1,404.6 | ||||||||||
Income (loss) before income taxes and minority interest | 226.2 | 178.6 | 141.2 | 111.3 | 80.3 | 34.7 | 22.9 | (57.7) | 737.5 | ||||||||||
Income tax expense (benefit) | 72.2 | 71.2 | 46.7 | 43.5 | 27.9 | 12.5 | 7.5 | (45.7) | 235.8 | ||||||||||
Minority interest | 0.2 | – | 0.1 | – | – | – | – | 7.7 | 8.0 | ||||||||||
Net income (loss) | 153.8 | 107.4 | 94.4 | 67.8 | 52.4 | 22.2 | 15.4 | (19.7) | 493.7 | ||||||||||
Preferred stock dividend | – | – | – | – | – | – | – | 14.3 | 14.3 | ||||||||||
Net earnings applicable to common shareholders | $ | 153.8 | 107.4 | 94.4 | 67.8 | 52.4 | 22.2 | 15.4 | (34.0) | 479.4 | |||||||||
Assets | $ | 18,446 | 10,156 | 11,675 | 5,279 | 3,903 | 2,667 | 947 | (126) | 52,947 | |||||||||
Net loans and leases(1) | 12,997 | 7,792 | 7,902 | 4,585 | 3,231 | 1,987 | 509 | 85 | 39,088 | ||||||||||
Deposits | 11,644 | 8,082 | 8,058 | 3,871 | 3,304 | 1,752 | 608 | (396) | 36,923 | ||||||||||
Shareholder’s equity: | |||||||||||||||||||
Preferred equity | – | – | – | – | – | – | – | 240 | 240 | ||||||||||
Common equity | 1,048 | 1,067 | 1,932 | 581 | 261 | 329 | 67 | (232) | 5,053 | ||||||||||
Total shareholder’s equity | 1,048 | 1,067 | 1,932 | 581 | 261 | 329 | 67 | 8 | 5,293 | ||||||||||
| Zions Bank | CB&T | Amegy | NBA | NSB | Vectra | TCBW | Other | Consolidated Company | ||||||||||||||||||||
2009: | ||||||||||||||||||||||||||||
Net interest income | $ | 690.4 | 465.3 | 385.7 | 179.1 | 140.0 | 105.3 | 32.1 | (100.4 | ) | 1,897.5 | |||||||||||||||||
Provision for loan losses | 400.4 | 251.5 | 406.1 | 291.7 | 563.7 | 78.5 | 22.5 | 2.5 | 2,016.9 | |||||||||||||||||||
Net interest income after provision for loan losses | 290.0 | 213.8 | (20.4 | ) | (112.6 | ) | (423.7 | ) | 26.8 | 9.6 | (102.9 | ) | (119.4 | ) | ||||||||||||||
Impairment losses on investment securities: | ||||||||||||||||||||||||||||
Impairment losses on investment securities | (98.4 | ) | (165.1 | ) | – | – | (15.3 | ) | (25.8 | ) | (5.9 | ) | (259.4 | ) | (569.9 | ) | ||||||||||||
Noncredit-related losses on securities not expected to be sold (recognized in other comprehensive income) | 63.2 | 133.3 | – | – | 12.0 | 20.5 | 4.8 | 55.6 | 289.4 | |||||||||||||||||||
Net impairment losses on investment securities | (35.2 | ) | (31.8 | ) | – | – | (3.3 | ) | (5.3 | ) | (1.1 | ) | (203.8 | ) | (280.5 | ) | ||||||||||||
Valuation losses on securities purchased | (203.0 | ) | – | (7.5 | ) | – | – | – | – | (1.6 | ) | (212.1 | ) | |||||||||||||||
Gain on subordinated debt modification | – | – | – | – | – | – | – | 508.9 | 508.9 | |||||||||||||||||||
Acquisition related gains | – | 152.7 | – | – | 16.5 | – | – | – | 169.2 | |||||||||||||||||||
Other noninterest income | 123.5 | (135.3 | ) | 136.1 | 44.0 | 49.0 | 31.4 | 9.4 | 360.5 | 618.6 | ||||||||||||||||||
Noninterest expense | 522.5 | 295.2 | 345.6 | 170.0 | 180.6 | 96.4 | 15.9 | 45.3 | 1,671.5 | |||||||||||||||||||
Impairment loss on goodwill | – | – | 633.3 | – | – | – | – | 2.9 | 636.2 | |||||||||||||||||||
Income (loss) before income taxes | (347.2 | ) | (95.8 | ) | (870.7 | ) | (238.6 | ) | (542.1 | ) | (43.5 | ) | 2.0 | 512.9 | (1,623.0 | ) | ||||||||||||
Income tax expense (benefit) | (144.4 | ) | (45.6 | ) | (90.3 | ) | (94.4 | ) | (190.1 | ) | (17.9 | ) | 0.4 | 181.0 | (401.3 | ) | ||||||||||||
Net income (loss) | (202.8 | ) | (50.2 | ) | (780.4 | ) | (144.2 | ) | (352.0 | ) | (25.6 | ) | 1.6 | 331.9 | (1,221.7 | ) | ||||||||||||
Net income (loss) applicable to noncontrolling interests | 0.1 | – | – | – | – | – | – | (5.7 | ) | (5.6 | ) | |||||||||||||||||
Net income (loss) applicable to controlling interest | (202.9 | ) | (50.2 | ) | (780.4 | ) | (144.2 | ) | (352.0 | ) | (25.6 | ) | 1.6 | 337.6 | (1,216.1 | ) | ||||||||||||
Preferred stock dividends | – | (0.9 | ) | (1.5 | ) | – | – | (0.2 | ) | – | (100.3 | ) | (102.9 | ) | ||||||||||||||
Preferred stock redemption and conversion | – | – | – | – | – | – | – | 84.6 | 84.6 | |||||||||||||||||||
Net earnings (loss) applicable to common shareholders | $ | (202.9 | ) | (51.1 | ) | (781.9 | ) | (144.2 | ) | (352.0 | ) | (25.8 | ) | 1.6 | 321.9 | (1,234.4 | ) | |||||||||||
Assets | $ | 17,652 | 11,097 | 11,145 | 4,524 | 4,187 | 2,440 | 835 | (757 | ) | 51,123 | |||||||||||||||||
Net loans and leases1 | 13,990 | 8,951 | 8,262 | 3,609 | 2,752 | 1,981 | 578 | 66 | 40,189 | |||||||||||||||||||
Total deposits | 13,823 | 9,760 | 8,880 | 3,784 | 3,526 | 2,005 | 632 | (569 | ) | 41,841 | ||||||||||||||||||
Shareholder’s equity: | ||||||||||||||||||||||||||||
Preferred equity | 460 | 262 | 376 | 405 | 360 | 65 | 15 | (440 | ) | 1,503 | ||||||||||||||||||
Common equity | 1,282 | 1,120 | 1,435 | 228 | 296 | 199 | 69 | (439 | ) | 4,190 | ||||||||||||||||||
Noncontrolling interests | – | – | – | – | – | – | – | 17 | 17 | |||||||||||||||||||
Total shareholder’s equity | 1,742 | 1,382 | 1,811 | 633 | 656 | 264 | 84 | (862 | ) | 5,710 | ||||||||||||||||||
| Zions Bank | CB&T | Amegy | NBA | NSB | Vectra | TCBW | Other | Consolidated Company | Zions Bank | CB&T | Amegy | NBA | NSB | Vectra | TCBW | Other | Consolidated Company | |||||||||||||||||||||||||||||
2006: | ||||||||||||||||||||||||||||||||||||||||||||||
2008: | ||||||||||||||||||||||||||||||||||||||||||||||
Net interest income | $ | 472.3 | 469.4 | 304.7 | 214.9 | 197.5 | 94.2 | 33.6 | (21.9) | 1,764.7 | $ | 662.5 | 414.3 | 370.1 | 219.5 | 159.0 | 103.6 | 33.8 | 8.8 | 1,971.6 | ||||||||||||||||||||||||||
Provision for loan losses | 19.9 | 15.0 | 7.8 | 16.3 | 8.7 | 4.2 | 0.5 | 0.2 | 72.6 | 163.1 | 82.9 | 71.9 | 211.8 | 100.3 | 15.9 | 1.1 | 1.3 | 648.3 | ||||||||||||||||||||||||||||
Net interest income after provision for | 452.4 | 454.4 | 296.9 | 198.6 | 188.8 | 90.0 | 33.1 | (22.1) | 1,692.1 | 499.4 | 331.4 | 298.2 | 7.7 | 58.7 | 87.7 | 32.7 | 7.5 | 1,323.3 | ||||||||||||||||||||||||||||
Noninterest income | 263.7 | 80.7 | 114.9 | 25.4 | 31.2 | 26.8 | 2.0 | 6.5 | 551.2 | |||||||||||||||||||||||||||||||||||||
Impairment losses on investment securities | (79.4 | ) | (118.0 | ) | – | – | (2.0 | ) | (6.4 | ) | (1.3 | ) | (96.9 | ) | (304.0 | ) | ||||||||||||||||||||||||||||||
Valuation losses on securities purchased | (13.1 | ) | – | – | – | – | – | – | – | (13.1 | ) | |||||||||||||||||||||||||||||||||||
Other noninterest income | 207.3 | 82.6 | 192.9 | 46.8 | 42.8 | 29.9 | 4.4 | (98.9 | ) | 507.8 | ||||||||||||||||||||||||||||||||||||
Noninterest expense | 426.1 | 244.6 | 283.5 | 103.0 | 110.8 | 85.0 | 13.9 | 63.5 | 1,330.4 | 463.4 | 239.0 | 305.2 | 161.2 | 137.9 | 85.9 | 14.8 | 67.6 | 1,475.0 | ||||||||||||||||||||||||||||
Impairment loss on goodwill | – | – | – | 168.6 | 21.0 | 151.5 | – | 12.7 | 353.8 | |||||||||||||||||||||||||||||||||||||
Income (loss) before income taxes and minority interest | 290.0 | 290.5 | 128.3 | 121.0 | 109.2 | 31.8 | 21.2 | (79.1) | 912.9 | |||||||||||||||||||||||||||||||||||||
Income (loss) before income taxes | 150.8 | 57.0 | 185.9 | (275.3 | ) | (59.4 | ) | (126.2 | ) | 21.0 | (268.6 | ) | (314.8 | ) | ||||||||||||||||||||||||||||||||
Income tax expense (benefit) | 98.1 | 117.9 | 39.5 | 47.8 | 38.1 | 11.7 | 7.0 | (42.1) | 318.0 | 44.0 | 18.4 | 60.5 | (56.7 | ) | (13.6 | ) | 8.8 | 7.0 | (111.8 | ) | (43.4 | ) | ||||||||||||||||||||||||
Minority interest | 0.1 | – | 1.8 | – | – | – | – | 9.9 | 11.8 | |||||||||||||||||||||||||||||||||||||
Net income (loss) | 191.8 | 172.6 | 87.0 | 73.2 | 71.1 | 20.1 | 14.2 | (46.9) | 583.1 | 106.8 | 38.6 | 125.4 | (218.6 | ) | (45.8 | ) | (135.0 | ) | 14.0 | (156.8 | ) | (271.4 | ) | |||||||||||||||||||||||
Preferred stock dividend | – | – | – | – | – | – | – | 3.8 | 3.8 | |||||||||||||||||||||||||||||||||||||
Net income (loss) applicable to noncontrolling interests | 0.1 | – | 0.3 | – | – | – | – | (5.5 | ) | (5.1 | ) | |||||||||||||||||||||||||||||||||||
Net earnings applicable to common shareholders | $ | 191.8 | 172.6 | 87.0 | 73.2 | 71.1 | 20.1 | 14.2 | (50.7) | 579.3 | ||||||||||||||||||||||||||||||||||||
Net income (loss) applicable to controlling interest | 106.7 | 38.6 | 125.1 | (218.6 | ) | (45.8 | ) | (135.0 | ) | 14.0 | (151.3 | ) | (266.3 | ) | ||||||||||||||||||||||||||||||||
Preferred stock dividends | – | – | – | – | – | – | – | (24.4 | ) | (24.4 | ) | |||||||||||||||||||||||||||||||||||
Net earnings (loss) applicable to common shareholders | $ | 106.7 | 38.6 | 125.1 | (218.6 | ) | (45.8 | ) | (135.0 | ) | 14.0 | (175.7 | ) | (290.7 | ) | |||||||||||||||||||||||||||||||
Assets | $ | 14,823 | 10,416 | 10,366 | 4,599 | 3,916 | 2,385 | 808 | (343) | 46,970 | $ | 20,778 | 10,137 | 12,406 | 4,864 | 4,063 | 2,722 | 880 | (757 | ) | 55,093 | |||||||||||||||||||||||||
Net loans and leases(1) | 10,702 | 8,092 | 6,352 | 4,066 | 3,214 | 1,725 | 428 | 89 | 34,668 | |||||||||||||||||||||||||||||||||||||
Deposits | 10,450 | 8,410 | 7,329 | 3,695 | 3,401 | 1,712 | 513 | (528) | 34,982 | |||||||||||||||||||||||||||||||||||||
Net loans and leases1 | 14,684 | 7,861 | 9,027 | 4,108 | 3,200 | 2,059 | 588 | 132 | 41,659 | |||||||||||||||||||||||||||||||||||||
Total deposits | 16,118 | 7,964 | 8,625 | 3,923 | 3,514 | 2,127 | 603 | (1,558 | ) | 41,316 | ||||||||||||||||||||||||||||||||||||
Shareholder’s equity: | ||||||||||||||||||||||||||||||||||||||||||||||
Preferred equity | – | – | – | – | – | – | – | 240 | 240 | 250 | 158 | 80 | 430 | 260 | 10 | – | 394 | 1,582 | ||||||||||||||||||||||||||||
Common equity | 972 | 1,123 | 1,805 | 346 | 273 | 314 | 56 | (142) | 4,747 | 1,044 | 1,097 | 2,049 | 355 | 259 | 191 | 75 | (150 | ) | 4,920 | |||||||||||||||||||||||||||
Noncontrolling interests | 1 | – | – | – | – | – | – | 26 | 27 | |||||||||||||||||||||||||||||||||||||
Total shareholder’s equity | 972 | 1,123 | 1,805 | 346 | 273 | 314 | 56 | 98 | 4,987 | 1,295 | 1,255 | 2,129 | 785 | 519 | 201 | 75 | 270 | 6,529 | ||||||||||||||||||||||||||||
2005: | ||||||||||||||||||||||||||||||||||||||||||||||
2007: | ||||||||||||||||||||||||||||||||||||||||||||||
Net interest income | $ | 407.9 | 451.4 | 25.5 | 187.6 | 171.3 | 89.1 | 29.6 | (1.0) | 1,361.4 | $ | 551.4 | 434.8 | 331.3 | 250.8 | 182.5 | 96.9 | 35.1 | (0.8 | ) | 1,882.0 | |||||||||||||||||||||||||
Provision for loan losses | 26.0 | 9.9 | – | 5.2 | (0.4) | 1.6 | 1.0 | (0.3) | 43.0 | 39.1 | 33.5 | 21.2 | 30.5 | 23.3 | 4.0 | 0.3 | 0.3 | 152.2 | ||||||||||||||||||||||||||||
Net interest income after provision for | 381.9 | 441.5 | 25.5 | 182.4 | 171.7 | 87.5 | 28.6 | (0.7) | 1,318.4 | 512.3 | 401.3 | 310.1 | 220.3 | 159.2 | 92.9 | 34.8 | (1.1 | ) | 1,729.8 | |||||||||||||||||||||||||||
Noninterest income | 269.2 | 75.0 | 9.0 | 21.5 | 31.0 | 26.6 | 1.6 | 3.0 | 436.9 | |||||||||||||||||||||||||||||||||||||
Impairment losses on investment securities | (10.1 | ) | (79.2 | ) | – | – | – | – | – | (19.3 | ) | (108.6 | ) | |||||||||||||||||||||||||||||||||
Valuation losses on securities purchased | (49.6 | ) | – | – | – | – | – | – | – | (49.6 | ) | |||||||||||||||||||||||||||||||||||
Other noninterest income | 236.8 | 87.3 | 126.7 | 33.4 | 32.9 | 28.1 | 2.5 | 22.8 | 570.5 | |||||||||||||||||||||||||||||||||||||
Noninterest expense | 391.1 | 243.9 | 23.7 | 97.8 | 106.2 | 86.8 | 12.6 | 50.7 | 1,012.8 | 463.2 | 230.8 | 295.6 | 142.4 | 111.8 | 86.3 | 14.4 | 60.1 | 1,404.6 | ||||||||||||||||||||||||||||
Impairment loss on goodwill | 0.6 | – | – | – | – | – | – | –�� | 0.6 | |||||||||||||||||||||||||||||||||||||
Income (loss) before income taxes and minority interest | 259.4 | 272.6 | 10.8 | 106.1 | 96.5 | 27.3 | 17.6 | (48.4) | 741.9 | |||||||||||||||||||||||||||||||||||||
Income (loss) before income taxes | 226.2 | 178.6 | 141.2 | 111.3 | 80.3 | 34.7 | 22.9 | (57.7 | ) | 737.5 | ||||||||||||||||||||||||||||||||||||
Income tax expense (benefit) | 85.4 | 109.7 | 3.3 | 42.1 | 33.4 | 9.7 | 5.5 | (25.7) | 263.4 | 72.2 | 71.2 | 46.7 | 43.5 | 27.9 | 12.5 | 7.5 | (45.7 | ) | 235.8 | |||||||||||||||||||||||||||
Minority interest | (0.1) | – | – | – | – | – | – | (1.5) | (1.6) | |||||||||||||||||||||||||||||||||||||
Net income (loss) | $ | 174.1 | 162.9 | 7.5 | 64.0 | 63.1 | 17.6 | 12.1 | (21.2) | 480.1 | 154.0 | 107.4 | 94.5 | 67.8 | 52.4 | 22.2 | 15.4 | (12.0 | ) | 501.7 | ||||||||||||||||||||||||||
Net income (loss) applicable to noncontrolling interests | 0.2 | – | 0.1 | – | – | – | – | 7.7 | 8.0 | |||||||||||||||||||||||||||||||||||||
Net income (loss) applicable to controlling interest | 153.8 | 107.4 | 94.4 | 67.8 | 52.4 | 22.2 | 15.4 | (19.7 | ) | 493.7 | ||||||||||||||||||||||||||||||||||||
Preferred stock dividends | – | – | – | – | – | – | – | (14.3 | ) | (14.3 | ) | |||||||||||||||||||||||||||||||||||
Net earnings (loss) applicable to common shareholders | $ | 153.8 | 107.4 | 94.4 | 67.8 | 52.4 | 22.2 | 15.4 | (34.0 | ) | 479.4 | |||||||||||||||||||||||||||||||||||
Assets | $ | 12,651 | 10,896 | 9,350 | 4,209 | 3,681 | 2,324 | 789 | (1,120) | 42,780 | $ | 18,446 | 10,156 | 11,675 | 5,279 | 3,903 | 2,667 | 947 | (126 | ) | 52,947 | |||||||||||||||||||||||||
Net loans and leases(1) | 8,510 | 7,671 | 5,389 | 3,698 | 2,846 | 1,539 | 402 | 72 | 30,127 | |||||||||||||||||||||||||||||||||||||
Deposits | 9,213 | 8,896 | 6,905 | 3,599 | 3,171 | 1,636 | 442 | (1,220) | 32,642 | |||||||||||||||||||||||||||||||||||||
Shareholder’s equity | 836 | 1,072 | 1,768 | 299 | 244 | 299 | 50 | (331) | 4,237 | |||||||||||||||||||||||||||||||||||||
Net loans and leases1 | 12,910 | 7,792 | 7,811 | 4,566 | 3,230 | 1,975 | 509 | 87 | 38,880 | |||||||||||||||||||||||||||||||||||||
Total deposits | 11,644 | 8,082 | 8,058 | 3,871 | 3,304 | 1,752 | 608 | (396 | ) | 36,923 | ||||||||||||||||||||||||||||||||||||
Shareholder’s equity: | ||||||||||||||||||||||||||||||||||||||||||||||
Preferred equity | – | – | – | – | – | – | – | 240 | 240 | |||||||||||||||||||||||||||||||||||||
Common equity | 1,048 | 1,067 | 1,932 | 581 | 261 | 329 | 67 | (232 | ) | 5,053 | ||||||||||||||||||||||||||||||||||||
Noncontrolling interests | 1 | – | – | – | – | – | – | 30 | 31 | |||||||||||||||||||||||||||||||||||||
Total shareholder’s equity | 1,049 | 1,067 | 1,932 | 581 | 261 | 329 | 67 | 38 | 5,324 | |||||||||||||||||||||||||||||||||||||
Net of unearned income and fees, net of related costs. |
23. QUARTERLY FINANCIAL INFORMATION (UNAUDITED)
Financial information by quarter for 20072009 and 20062008 is as follows(in thousands, except per share amounts):
| Quarters | Quarters | ||||||||||||||||||||||||||
| First | Second | Third | Fourth | Year | First | Second | Third | Fourth | Year | ||||||||||||||||||
2007: | |||||||||||||||||||||||||||
2009: | |||||||||||||||||||||||||||
Gross interest income | $ | 770,451 | 789,614 | 817,742 | 827,519 | 3,205,326 | $ | 639,702 | 637,696 | 631,802 | 606,126 | 2,515,326 | |||||||||||||||
Net interest income | 457,083 | 469,347 | 476,637 | 478,885 | 1,881,952 | 474,775 | 493,688 | 472,180 | 456,889 | 1,897,532 | |||||||||||||||||
Provision for loan losses | 9,111 | 17,763 | 55,354 | 69,982 | 152,210 | 297,624 | 762,654 | 565,930 | 390,719 | 2,016,927 | |||||||||||||||||
Noninterest income: | |||||||||||||||||||||||||||
Impairment losses on available-for-sale securities and valuation losses on securities purchased from Lockhart Funding | – | – | – | (158,208) | (158,208) | ||||||||||||||||||||||
Securities gains, net | 8,899 | 113 | 11,130 | 596 | 20,738 | ||||||||||||||||||||||
Net impairment losses on investment securities and valuation losses on securities purchased | (283,064 | ) | (53,670 | ) | (56,515 | ) | (99,306 | ) | (492,555 | ) | |||||||||||||||||
Gain on subordinated debt modification | – | 493,725 | – | 15,220 | 508,945 | ||||||||||||||||||||||
Acquisition related gains | – | 22,977 | 146,153 | 56 | 169,186 | ||||||||||||||||||||||
Securities gains (losses), net | 2,958 | 825 | 95 | (9,549 | ) | (5,671 | ) | ||||||||||||||||||||
Other noninterest income | 136,515 | 141,228 | 134,693 | 137,378 | 549,814 | 134,844 | 148,879 | 181,007 | 159,466 | 624,196 | |||||||||||||||||
Noninterest expense | 351,979 | 347,612 | 352,031 | 352,966 | 1,404,588 | 376,205 | 419,469 | 434,707 | 441,129 | 1,671,510 | |||||||||||||||||
Income before income taxes and minority interest | 241,407 | 245,313 | 215,075 | 35,703 | 737,498 | ||||||||||||||||||||||
Net income | 153,258 | 159,214 | 135,732 | 45,541 | 493,745 | ||||||||||||||||||||||
Preferred stock dividend | 3,603 | 3,607 | 3,770 | 3,343 | 14,323 | ||||||||||||||||||||||
Net earnings applicable to common shareholders | 149,655 | 155,607 | 131,962 | 42,198 | 479,422 | ||||||||||||||||||||||
Net earnings per common share: | |||||||||||||||||||||||||||
Impairment loss on goodwill | 633,992 | – | – | 2,224 | 636,216 | ||||||||||||||||||||||
Loss before income taxes | (978,308 | ) | (75,699 | ) | (257,717 | ) | (311,296 | ) | (1,623,020 | ) | |||||||||||||||||
Net loss | (826,581 | ) | (51,938 | ) | (157,671 | ) | (185,487 | ) | (1,221,677 | ) | |||||||||||||||||
Net loss applicable to controlling interest | (826,041 | ) | (50,729 | ) | (155,277 | ) | (184,064 | ) | (1,216,111 | ) | |||||||||||||||||
Preferred stock dividends | (26,286 | ) | (25,447 | ) | (26,603 | ) | (24,633 | ) | (102,969 | ) | |||||||||||||||||
Preferred stock redemption and conversion | – | 52,418 | – | 32,215 | 84,633 | ||||||||||||||||||||||
Net loss applicable to common shareholders | (852,327 | ) | (23,758 | ) | (181,880 | ) | (176,482 | ) | (1,234,447 | ) | |||||||||||||||||
Net loss per common share: | |||||||||||||||||||||||||||
Basic | $ | 1.38 | 1.44 | 1.24 | 0.40 | 4.47 | $ | (7.47 | ) | (0.21 | ) | (1.43 | ) | (1.26 | ) | (9.92 | ) | ||||||||||
Diluted | 1.36 | 1.43 | 1.22 | 0.39 | 4.42 | (7.47 | ) | (0.21 | ) | (1.43 | ) | (1.26 | ) | (9.92 | ) | ||||||||||||
2006: | |||||||||||||||||||||||||||
2008: | |||||||||||||||||||||||||||
Gross interest income | $ | 638,655 | 686,616 | 731,553 | 761,297 | 2,818,121 | $ | 790,115 | 722,932 | 735,652 | 725,200 | 2,973,899 | |||||||||||||||
Net interest income | 422,847 | 436,327 | 446,511 | 459,039 | 1,764,724 | 486,458 | 484,743 | 492,003 | 508,442 | 1,971,646 | |||||||||||||||||
Provision for loan losses | 14,512 | 17,022 | 14,363 | 26,675 | 72,572 | 92,282 | 114,192 | 156,606 | 285,189 | 648,269 | |||||||||||||||||
Noninterest income: | |||||||||||||||||||||||||||
Securities gains, net | 801 | 3,392 | 14,743 | 5,321 | 24,257 | ||||||||||||||||||||||
Impairment losses on investment securities and valuation losses on securities purchased | (45,989 | ) | (38,761 | ) | (28,022 | ) | (204,340 | ) | (317,112 | ) | |||||||||||||||||
Securities gains (losses), net | 11,843 | (8,043 | ) | 13,106 | (15,264 | ) | 1,642 | ||||||||||||||||||||
Other noninterest income | 127,687 | 134,119 | 130,586 | 134,560 | 526,952 | 145,146 | 119,176 | 104,526 | 137,314 | 506,162 | |||||||||||||||||
Noninterest expense | 324,455 | 333,028 | 330,028 | 342,926 | 1,330,437 | 350,103 | 354,417 | 372,276 | 398,167 | 1,474,963 | |||||||||||||||||
Income before income taxes and minority interest | 212,368 | 223,788 | 247,449 | 229,319 | 912,924 | ||||||||||||||||||||||
Net income | 137,633 | 145,310 | 153,674 | 146,508 | 583,125 | ||||||||||||||||||||||
Preferred stock dividend | – | – | – | 3,835 | 3,835 | ||||||||||||||||||||||
Net earnings applicable to common shareholders | 137,633 | 145,310 | 153,674 | 142,673 | 579,290 | ||||||||||||||||||||||
Net earnings per common share: | |||||||||||||||||||||||||||
Impairment loss on goodwill | – | – | – | 353,804 | 353,804 | ||||||||||||||||||||||
Income (loss) before income taxes | 155,073 | 88,506 | 52,731 | (611,008 | ) | (314,698 | ) | ||||||||||||||||||||
Net income (loss) | 105,177 | 66,469 | 41,517 | (484,496 | ) | (271,333 | ) | ||||||||||||||||||||
Net income (loss) applicable to controlling interest | 106,749 | 72,198 | 37,760 | (482,976 | ) | (266,269 | ) | ||||||||||||||||||||
Preferred stock dividends | (2,453 | ) | (2,454 | ) | (4,409 | ) | (15,108 | ) | (24,424 | ) | |||||||||||||||||
Net earnings (loss) applicable to common shareholders | 104,296 | 69,744 | 33,351 | (498,084 | ) | (290,693 | ) | ||||||||||||||||||||
Net earnings (loss) per common share: | |||||||||||||||||||||||||||
Basic | $ | 1.30 | 1.37 | 1.45 | 1.34 | 5.46 | $ | 0.97 | 0.65 | 0.31 | (4.37 | ) | (2.68 | ) | |||||||||||||
Diluted | 1.28 | 1.35 | 1.42 | 1.32 | 5.36 | 0.97 | 0.65 | 0.31 | (4.37 | ) | (2.68 | ) | |||||||||||||||
24. PARENT COMPANY FINANCIAL INFORMATION
CONDENSED BALANCE SHEETS
DECEMBER 31, 20072009 AND 20062008
(In thousands)
| 2007 | 2006 | 2009 | 2008 | ||||||||
ASSETS | ||||||||||||
Cash and due from banks | $ | 2,003 | 1,907 | $ | 2,254 | 2,135 | ||||||
Interest-bearing deposits | 85,399 | 183,497 | 539,874 | 980,528 | ||||||||
Investment securities – available-for-sale, at fair value | 388,045 | 422,041 | ||||||||||
Loans, net of unearned fees of $33 and allowance for loan losses of $52 | 475 | – | ||||||||||
Investment securities: | ||||||||||||
Held-to-maturity, at adjusted cost (approximate fair value $2,633 and $191,952) | 2,633 | 197,841 | ||||||||||
Available-for-sale, at fair value | 432,761 | 59,153 | ||||||||||
Trading account, at fair value | – | 956 | ||||||||||
Loans, net of unearned fees of $45 and $379 and allowance for loan losses | 6,292 | 22,901 | ||||||||||
Other noninterest-bearing investments | 72,427 | 62,830 | 83,780 | 76,219 | ||||||||
Investments in subsidiaries: | ||||||||||||
Commercial banks and bank holding company | 5,293,994 | 4,899,646 | 6,579,075 | 6,266,229 | ||||||||
Other operating companies | 81,087 | 58,266 | 66,254 | 69,291 | ||||||||
Nonoperating – Zions Municipal Funding, Inc.(1) | 446,785 | 429,126 | ||||||||||
Nonoperating – ZMFU II, Inc.1 | 92,184 | 464,570 | ||||||||||
Receivables from subsidiaries: | ||||||||||||
Commercial banks | 1,407,500 | 1,294,452 | – | 760,500 | ||||||||
Other | 1,865 | 13,420 | 2,050 | 14,800 | ||||||||
Other assets | 179,552 | 83,432 | 76,574 | 411,584 | ||||||||
| $ | 7,959,132 | 7,448,617 | $ | 7,883,731 | 9,326,707 | |||||||
LIABILITIES AND SHAREHOLDERS’ EQUITY | ||||||||||||
Other liabilities | $ | 95,698 | 104,312 | $ | 233,550 | 252,519 | ||||||
Commercial paper | 337,840 | 220,507 | ||||||||||
Commercial paper: | ||||||||||||
Due to affiliates | 49,991 | 55,996 | ||||||||||
Due to others | 1,084 | 15,451 | ||||||||||
Other short-term borrowings | 117,263 | 235,550 | ||||||||||
Subordinated debt to affiliated trusts | 309,412 | 324,709 | 309,278 | 309,300 | ||||||||
Long-term debt | 1,923,382 | 1,812,066 | 1,479,907 | 1,956,195 | ||||||||
Total liabilities | 2,666,332 | 2,461,594 | 2,191,073 | 2,825,011 | ||||||||
Shareholders’ equity: | ||||||||||||
Preferred stock | 240,000 | 240,000 | 1,502,784 | 1,581,834 | ||||||||
Common stock | 2,212,237 | 2,230,303 | 3,318,417 | 2,599,916 | ||||||||
Retained earnings | 2,910,692 | 2,602,189 | 1,324,516 | 2,433,363 | ||||||||
Accumulated other comprehensive loss | (58,835) | (75,849) | (436,899 | ) | (98,958 | ) | ||||||
Deferred compensation | (11,294) | (9,620) | (16,160 | ) | (14,459 | ) | ||||||
Total shareholders’ equity | 5,292,800 | 4,987,023 | 5,692,658 | 6,501,696 | ||||||||
| $ | 7,959,132 | 7,448,617 | $ | 7,883,731 | 9,326,707 | |||||||
ZMFU II, Inc. is a wholly-owned nonoperating subsidiary whose sole purpose is to hold a portfolio of municipal bonds, loans and leases. |
CONDENSED STATEMENTS OF INCOME
YEARS ENDED DECEMBER 31, 2007, 20062009, 2008 AND 20052007
(In thousands)
| 2007 | 2006 | 2005 | 2009 | 2008 | 2007 | |||||||||||
Interest income: | |||||||||||||||||
Commercial bank subsidiaries | $ | 90,504 | 62,146 | 30,485 | $ | 18,939 | 68,642 | 90,504 | |||||||||
Other subsidiaries and affiliates | 852 | 1,245 | 1,168 | 326 | 781 | 852 | |||||||||||
Other loans and securities | 27,870 | 32,881 | 37,025 | 15,735 | 20,585 | 27,870 | |||||||||||
Total interest income | 119,226 | 96,272 | 68,678 | 35,000 | 90,008 | 119,226 | |||||||||||
Interest expense: | |||||||||||||||||
Affiliated trusts | 25,925 | 25,964 | 25,966 | 24,094 | 24,391 | 25,925 | |||||||||||
Other borrowed funds | 116,520 | 112,726 | 61,277 | 150,695 | 79,208 | 116,520 | |||||||||||
Total interest expense | 142,445 | 138,690 | 87,243 | 174,789 | 103,599 | 142,445 | |||||||||||
Net interest loss | (23,219) | (42,418) | (18,565) | (139,789 | ) | (13,591 | ) | (23,219 | ) | ||||||||
Provision for loan losses | 50 | (8) | (37) | (531 | ) | 605 | 50 | ||||||||||
Net interest loss after provision for loan losses | (23,269) | (42,410) | (18,528) | (139,258 | ) | (14,196 | ) | (23,269 | ) | ||||||||
Other income: | |||||||||||||||||
Dividends from consolidated subsidiaries: | |||||||||||||||||
Commercial banks and bank holding company | 460,200 | 431,000 | 261,250 | 4,603 | 110,500 | 460,200 | |||||||||||
Other operating companies | 560 | 600 | 300 | 425 | 500 | 560 | |||||||||||
Equity and fixed income securities gains, net | 2,882 | 8,180 | 1,534 | ||||||||||||||
Impairment losses on available-for-sale securities | (19,281) | – | – | ||||||||||||||
Other income | 8,498 | 2,730 | 3,522 | ||||||||||||||
Equity and fixed income securities gains (losses), net | (11,042 | ) | (11,220 | ) | 2,882 | ||||||||||||
Net impairment losses on investment securities | (191,351 | ) | (96,890 | ) | (19,281 | ) | |||||||||||
Gain on subordinated debt modification | 508,945 | – | – | ||||||||||||||
Other income (loss) | 2,737 | (7,611 | ) | 8,498 | |||||||||||||
| 452,859 | 442,510 | 266,606 | 314,317 | (4,721 | ) | 452,859 | |||||||||||
Expenses: | |||||||||||||||||
Salaries and employee benefits | 14,781 | 14,841 | 14,078 | 21,663 | 11,673 | 14,781 | |||||||||||
Other operating expenses | 20,328 | 23,388 | 18,001 | 2,882 | 16,962 | 20,328 | |||||||||||
| 35,109 | 38,229 | 32,079 | 24,545 | 28,635 | 35,109 | ||||||||||||
Income before income tax benefit and undistributed income of consolidated subsidiaries | 394,481 | 361,871 | 215,999 | ||||||||||||||
Income tax benefit | 40,422 | 29,541 | 21,207 | ||||||||||||||
Income (loss) before income tax benefit and undistributed income (losses) of consolidated subsidiaries | 150,514 | (47,552 | ) | 394,481 | |||||||||||||
Income taxes (benefit) | 27,939 | (71,837 | ) | (40,422 | ) | ||||||||||||
Income before equity in undistributed income of consolidated subsidiaries | 434,903 | 391,412 | 237,206 | ||||||||||||||
Equity in undistributed income of consolidated subsidiaries: | |||||||||||||||||
Income before equity in undistributed income (losses) of | 122,575 | 24,285 | 434,903 | ||||||||||||||
Equity in undistributed income (losses) of consolidated subsidiaries: | |||||||||||||||||
Commercial banks and bank holding company | 52,962 | 190,756 | 239,821 | (1,325,678 | ) | (272,963 | ) | 52,962 | |||||||||
Other operating companies | (11,778) | (15,302) | (12,081) | (21,995 | ) | (35,377 | ) | (11,778 | ) | ||||||||
Nonoperating – Zions Municipal Funding, Inc. | 17,658 | 16,259 | 15,175 | ||||||||||||||
Nonoperating – ZMFU II, Inc. | 8,987 | 17,786 | 17,658 | ||||||||||||||
Net income | 493,745 | 583,125 | 480,121 | ||||||||||||||
Preferred stock dividend | 14,323 | 3,835 | – | ||||||||||||||
Net income (loss) | (1,216,111 | ) | (266,269 | ) | 493,745 | ||||||||||||
Preferred stock dividends | (102,969 | ) | (24,424 | ) | (14,323 | ) | |||||||||||
Preferred stock redemption and conversion | 84,633 | – | – | ||||||||||||||
Net earnings applicable to common shareholders | $ | 479,422 | 579,290 | 480,121 | |||||||||||||
Net earnings (loss) applicable to common shareholders | $ | (1,234,447 | ) | (290,693 | ) | 479,422 | |||||||||||
CONDENSED STATEMENTS OF CASH FLOWS
YEARS ENDED DECEMBER 31, 2007, 20062009, 2008 AND 20052007
(In thousands)
| 2007 | 2006 | 2005 | ||||
CASH FLOWS FROM OPERATING ACTIVITIES: | |||||||
Net income | $ | 493,745 | 583,125 | 480,121 | |||
Adjustments to reconcile net income to net cash provided by operating activities: | |||||||
Undistributed net income of consolidated subsidiaries | (58,842) | (191,713) | (242,915) | ||||
Equity and fixed income securities (gains), net | (2,882) | (8,180) | (1,534) | ||||
Impairment losses on available-for-sale securities | 19,281 | – | – | ||||
Other | (15,582) | 34,160 | 40,048 | ||||
Net cash provided by operating activities | 435,720 | 417,392 | 275,720 | ||||
CASH FLOWS FROM INVESTING ACTIVITIES: | |||||||
Net (increase) decrease in interest-bearing deposits | 98,098 | (82,497) | 3,774 | ||||
Collection of advances to subsidiaries | 97,333 | 18,706 | 28,320 | ||||
Advances to subsidiaries | (201,862) | (702,581) | (131,600) | ||||
Proceeds from sales and maturities of equity and fixed income securities | 82,439 | 166,085 | 42,958 | ||||
Purchase of investment securities | (140,786) | – | (42,221) | ||||
Increase of investment in subsidiaries | (47,500) | (137,206) | (32,280) | ||||
Cash paid for acquisition | (879) | – | (609,523) | ||||
Other | (2,268) | (7,983) | (8,255) | ||||
Net cash used in investing activities | (115,425) | (745,476) | (748,827) | ||||
CASH FLOWS FROM FINANCING ACTIVITIES: | |||||||
Net change in commercial paper and other borrowings under one year | 117,333 | 53,319 | 1,741 | ||||
Proceeds from issuance of long-term debt | 295,627 | 395,000 | 595,134 | ||||
Payments on long-term debt | (274,957) | (248,425) | – | ||||
Proceeds from issuance of preferred stock | – | 235,833 | – | ||||
Proceeds from issuance of common stock | 59,473 | 79,511 | 90,800 | ||||
Payments to redeem common stock | (322,025) | (26,483) | (82,211) | ||||
Dividends paid on preferred stock | (14,323) | (3,835) | – | ||||
Dividends paid on common stock | (181,327) | (156,986) | (130,300) | ||||
Net cash provided by (used in) financing activities | (320,199) | 327,934 | 475,164 | ||||
Net increase (decrease) in cash and due from banks | 96 | (150) | 2,057 | ||||
Cash and due from banks at beginning of year | 1,907 | 2,057 | – | ||||
Cash and due from banks at end of year | $ | 2,003 | 1,907 | 2,057 | |||
As of December 31, 2007, the Parent has lines of credit of $98 million with Amegy Bank and $55 million with CB&T. No amounts were outstanding at December 31, 2007. Interest on these lines is at a variable rate based on specified indices. Actual amounts that may be borrowed at any given time are based on determined collateral requirements.
| (In thousands) | 2009 | 2008 | 2007 | |||||||
CASH FLOWS FROM OPERATING ACTIVITIES: | ||||||||||
Net income (loss) | $ | (1,216,111 | ) | (266,269 | ) | 493,745 | ||||
Adjustments to reconcile net income (loss) to net cash provided by operating activities: | ||||||||||
Undistributed net (income) losses of consolidated subsidiaries | 1,338,686 | 290,554 | (58,842 | ) | ||||||
Equity and fixed income securities (gains) losses, net | 11,042 | 11,220 | (2,882 | ) | ||||||
Net impairment losses on investment securities | 191,351 | 96,890 | 19,281 | |||||||
Gain on subordinated debt modification | (508,946 | ) | – | – | ||||||
Other | 171,173 | 93,859 | (15,582 | ) | ||||||
Net cash provided by (used in) operating activities | (12,805 | ) | 226,254 | 435,720 | ||||||
CASH FLOWS FROM INVESTING ACTIVITIES: | ||||||||||
Net (increase) decrease in interest-bearing deposits | 440,654 | (895,129 | ) | 98,098 | ||||||
Collection of advances to subsidiaries | 779,550 | 816,184 | 97,333 | |||||||
Advances to subsidiaries | (6,970 | ) | (184,731 | ) | (201,862 | ) | ||||
Proceeds from sales and maturities of equity and fixed | 2,383 | 264,528 | 82,439 | |||||||
Purchase of investment securities | (297,877 | ) | (241,846 | ) | (140,786 | ) | ||||
Increase of investment in subsidiaries | (1,509,150 | ) | (1,292,821 | ) | (47,500 | ) | ||||
Other | 15,392 | (29,281 | ) | (3,147 | ) | |||||
Net cash used in investing activities | (576,018 | ) | (1,563,096 | ) | (115,425 | ) | ||||
CASH FLOWS FROM FINANCING ACTIVITIES: | ||||||||||
Net change in commercial paper and other borrowings under one year | (138,659 | ) | (30,843 | ) | 117,333 | |||||
Proceeds from issuance of long-term debt | 703,932 | 28,495 | 295,627 | |||||||
Payments on long-term debt | (295,630 | ) | (155,025 | ) | (274,957 | ) | ||||
Proceeds from issuance of preferred stock | – | 1,338,605 | – | |||||||
Proceeds from issuance of common stock and warrants | 464,110 | 354,302 | 59,473 | |||||||
Payments to redeem common stock | (1,374 | ) | (2,881 | ) | (322,025 | ) | ||||
Payments to redeem and convert preferred stock | (47,166 | ) | – | – | ||||||
Dividends paid on preferred stock | (84,408 | ) | (21,775 | ) | (14,323 | ) | ||||
Dividends paid on common stock | (11,863 | ) | (173,904 | ) | (181,327 | ) | ||||
Net cash provided by (used in) financing activities | 588,942 | 1,336,974 | (320,199 | ) | ||||||
Net increase (decrease) in cash and due from banks | 119 | 132 | 96 | |||||||
Cash and due from banks at beginning of year | 2,135 | 2,003 | 1,907 | |||||||
Cash and due from banks at end of year | $ | 2,254 | 2,135 | 2,003 | ||||||
The Parent paid interest of $122.8 million in 2009, $99.5 million in 2008, and $141.9 million in 2007, $135.02007.
25. SUBSEQUENT EVENTS
On March 1, 2010, the Company announced that it entered into a new equity distribution agreement to sell an additional $250 million in 2006,of common stock. Also on March 1, 2010, the Company commenced an offer to exchange any and $80.5 million in 2005.all of its currently outstanding nonconvertible subordinated debt into shares of the Company’s common stock.
| ITEM 9. | CHANGES IN AND DISAGREEMENTS WITH ACCOUNTANTS ON ACCOUNTING AND FINANCIAL DISCLOSURE |
None.
| ITEM 9A. | CONTROLS AND PROCEDURES |
Evaluation of Disclosure Controls and Procedures
An evaluation was carried out by the Company’s management, with the participation of the Chief Executive Officer and the Chief Financial Officer, of the effectiveness of the Company’sThe Company maintains disclosure controls and procedures (as defined in RuleRules 13a-15(e) and 15d-15(e) under the Securities Exchange Act of 1934). Based on that are designed to ensure that information required to be disclosed in the Company’s reports under the Exchange Act is recorded, processed, summarized and reported within the time periods specified in the rules and forms of the Securities and Exchange Commission, and that such information is accumulated and communicated to the Company’s management, including the principal executive officer and principal financial officer, as appropriate, to allow for timely decisions regarding required disclosures.
In connection with filing the Form 10-Qs during 2009 for the quarterly periods ended June 30, 2009 and September 30, 2009, management, under the supervision and with the participation of the principal executive officer and principal financial officer, evaluated the effectiveness of the design and operation of the Company’s disclosure controls and procedures as of the end of each of those quarters. In this original evaluation, the Chief Executive Officerprincipal executive officer and Chief Financial Officerprincipal financial officer concluded that asthe design and operation of December 31, 2007, thesethe Company’s disclosure controls and procedures were effective. There
In connection with the revision to the financial statements as described in the Explanatory Notes of the amended Form 10-Qs for the quarterly periods ended June 30, 2009 and September 30, 2009, management reevaluated the effectiveness of the design and operation of the Company’s disclosure controls and procedures as of the end of each of those quarters. In connection therewith, management identified a material weakness in internal control over financial reporting. Management determined that the Company did not maintain effective controls over the process utilized to interpret the applicable accounting literature for computing and allocating the amount attributable to the beneficial conversion feature related to the subordinated debt modification. Management believes this control deficiency resulted in a misstatement of the net loss applicable to common shareholders and shareholders’ equity. As a result of this material weakness, management concluded that the Company’s disclosure controls and procedures were not effective as of June 30, 2009 and September 30, 2009.
In light of the material weakness described above, management revised its consolidated financial statements in the Form 10-Q/As for the quarterly periods ended June 30, 2009 and September 30, 2009 as discussed previously to ensure that the computation and allocation of the beneficial conversion feature related to the debt modification was in conformity with the applicable accounting guidance. Management also believes that the consolidated financial statements included in those Form 10-Q/As were prepared in accordance with generally accepted accounting principles (“GAAP”) in all material respects.
While management had identified the appropriate accounting guidance and recognized that the terms of the debt modification included a beneficial conversion feature, management misinterpreted how to compute and allocate the amount attributable to this feature. Management does not routinely execute debt modifications with terms similar to this transaction and management believes that as a result of the process to reevaluate the accounting treatment, this material weakness has been remediated. Management will continue to assess the actions necessary to maintain effective controls over the process utilized to evaluate the accounting for complex transactions such as debt modifications.
As a result of the preceding discussion, management has also concluded that the Company’s disclosure controls and procedures were not effective as of December 31, 2009. However, as discussed above, in connection with filing the amended Form 10-Qs for the quarterly periods ended June 30, 2009 and September 30, 2009 on February 11, 2010, management believes that the material weakness previously identified has been remediated.
Changes in Internal Control Over Financial Reporting
Other than the matter previously discussed, there have been no changes in the Company’s internal control over financial reporting during the fourth quarter of 20072009 that have materially affected, or are reasonably likely to materially affect, the Company’s internal control over financial reporting.
See “Report on Management’s Assessment of Internal Control over Financial Reporting” included in Item 8 on page 131 for management’s report on the adequacy of internal control over financial reporting. Also see “Report on Internal Control over Financial Reporting” issued by Ernst & Young LLP included in Item 8.8 on page 132.
| ITEM 9B. | OTHER INFORMATION |
None.
| ITEM 10. | DIRECTORS, EXECUTIVE OFFICERS AND CORPORATE GOVERNANCE |
Incorporated by reference from the Company’s Proxy Statement to be dated approximately March 10, 2008.subsequently filed.
| ITEM 11. | EXECUTIVE COMPENSATION |
Incorporated by reference from the Company’s Proxy Statement to be dated approximately March 10, 2008.
| ITEM 12. | SECURITY OWNERSHIP OF CERTAIN BENEFICIAL OWNERS AND MANAGEMENT AND RELATED STOCKHOLDER MATTERS |
EQUITY COMPENSATION PLAN INFORMATION
The following tableschedule provides information as of December 31, 20072009 with respect to the shares of the Company’s common stock that may be issued under existing equity compensation plans:
Plan Category (1) | (a) Number of securities to be issued upon exercise of outstanding options, warrants and rights | (b) Weighted average exercise price of outstanding options, warrants and rights | (c) Number of securities for future issuance under equity compensation plans (excluding securities reflected in column (a)) | |||||||||||||||||||||||||||
Equity Compensation Plans Approved by Security Holders: | ||||||||||||||||||||||||||||||
Zions Bancorporation 2005 Stock Option and Incentive Plan | 2,713,682 | $ | 79.04 | 5,367,875 | ||||||||||||||||||||||||||
Zions Bancorporation 1996 Non-Employee Directors Stock Option Plan | 160,289 | 54.80 | – | |||||||||||||||||||||||||||
Zions Bancorporation Key Employee Incentive Stock Option Plan | 1,966,236 | 52.91 | – | |||||||||||||||||||||||||||
Equity Compensation Plans Not Approved by Security Holders: | ||||||||||||||||||||||||||||||
1998 Non-Qualified Stock Option and Incentive Plan | 165,465 | 59.25 | – | |||||||||||||||||||||||||||
Total | 5,005,672 | 5,367,875 | ||||||||||||||||||||||||||||
Plan Category1 | (a) Number of securities to be issued upon exercise of outstanding options, warrants and rights | (b) Weighted average exercise price of outstanding options, warrants and rights | (c) Number of securities remaining available for future issuance under equity compensation plans (excluding securities reflected in column (a)) | ||||
Equity Compensation Plans Approved by Security Holders: | |||||||
Zions Bancorporation 2005 Stock Option and Incentive Plan | 5,714,731 | $ | 54.23 | 3,463,864 | |||
Zions Bancorporation 1996 Non-Employee Directors Stock Option Plan | 116,000 | 52.64 | – | ||||
Zions Bancorporation Key Employee Incentive Stock Option Plan | 1,236,777 | 52.41 | – | ||||
Total | 7,067,508 | 3,463,864 | |||||
The |
Other information required by Item 12 is incorporated by reference from the Company’s Proxy Statement to be dated approximately March 10, 2008.subsequently filed.
| ITEM 13. | CERTAIN RELATIONSHIPS AND RELATED TRANSACTIONS, AND DIRECTOR INDEPENDENCE |
Incorporated by reference from the Company’s Proxy Statement to be dated approximately March 10, 2008.subsequently filed.
| ITEM 14. | PRINCIPAL ACCOUNTING FEES AND SERVICES |
Incorporated by reference from the Company’s Proxy Statement to be dated approximately March 10, 2008.subsequently filed.
| ITEM 15. | EXHIBITS, FINANCIAL STATEMENT SCHEDULES |
(a) | (1) | Financial statements – The following consolidated financial statements of Zions Bancorporation and subsidiaries are filed as part of this | ||
| Consolidated balance sheets – December 31, | ||||
| Consolidated statements of income – Years ended December 31, | ||||
| Consolidated statements of changes in shareholders’ equity and comprehensive income – Years ended December 31, | ||||
| Consolidated statements of cash flows – Years ended December 31, | ||||
| Notes to consolidated financial statements – December 31, | ||||
| (2) | Financial statement schedules – All financial statement schedules for which provision is made in the applicable accounting regulations of the Securities and Exchange Commission are not required under the related instructions, the required information is contained elsewhere in the Form 10-K, or the schedules are inapplicable and have therefore been omitted. | |||
| (3) | List of Exhibits: | |||
Exhibit | Description | |||
| 3.1 | Restated Articles of Incorporation of Zions Bancorporation dated November 8, 1993, incorporated by reference to Exhibit 3.1 of Form S-4 filed on November 22, 1993. | * | ||
| 3.2 | Articles of Amendment to the Restated Articles of Incorporation of Zions Bancorporation dated April 30, 1997, incorporated by reference to Exhibit 3.2 of Form | * | ||
| 3.3 | Articles of Amendment to the Restated Articles of Incorporation of Zions Bancorporation dated April 24, 1998, incorporated by reference to Exhibit 3.3 of Form | * | ||
| 3.4 | Articles of Amendment to Restated Articles of Incorporation of Zions Bancorporation dated April 25, 2001, incorporated by reference to Exhibit 3.6 of Form S-4 filed July 13, 2001. | * | ||
| 3.5 | Articles of Amendment to the Restated Articles of Incorporation of Zions Bancorporation, dated December 5, 2006, incorporated by reference to Exhibit 3.1 of Form 8-K filed December 7, 2006. | * | ||
| 3.6 | Articles of Merger of The Stockmen’s Bancorp, Inc. with and into Zions Bancorporation, effective January 17, 2007, incorporated by reference to Exhibit 3.6 of Form 10-K for the year ended December 31, 2006. | * | ||||
| 3.7 | Articles of Amendment to the Restated Articles of Incorporation of Zions Bancorporation, dated July 7, 2008, incorporated by reference to Exhibit 3.1 of Form 8-K filed July 8, 2008. | * | ||||
| 3.8 | Articles of Amendment to the Restated Articles of Incorporation of Zions Bancorporation, dated November 12, 2008, incorporated by reference to Exhibit 3.1 of Form 8-K filed November 17, 2008. | * | ||||
| 3.9 | Articles of Amendment to the Restated Articles of Incorporation of Zions Bancorporation, dated June 30, 2009, incorporated by reference to Exhibit 3.1 of Form 8-K filed July 2, 2009. | * | ||||
| 3.10 | Articles of Amendment to the Restated Articles of Incorporation of Zions Bancorporation dated June 30, 2009, incorporated by reference to Exhibit 3.10 of Form 10-Q for the quarter ended June 30, 2009. | * | ||||
Exhibit | Description | |||
| 3.11 | Articles of Amendment to the Restated Articles of Incorporation of Zions Bancorporation dated June 30, 2009, incorporated by reference to Exhibit 3.11 of Form 10-Q for the quarter ended June 30, 2009. | * | ||
| 3.12 | Amended and Restated Bylaws of Zions Bancorporation | * | ||
| 4.1 | Senior Debt Indenture dated September 10, 2002 between Zions Bancorporation and The Bank of New York Mellon Trust Company, N.A. as successor to J.P. Morgan Trust Company, N.A., as trustee, with respect to senior debt securities of Zions Bancorporation, incorporated by reference to Exhibit 4.1 of Form S-3ARS filed March 31, 2006. | * | ||
| 4.2 | Subordinated Debt Indenture dated September 10, 2002 between Zions Bancorporation and The Bank of New York Mellon Trust Company, N.A. as successor to J.P. Morgan Trust Company, N.A., as trustee, with respect to subordinated debt securities of Zions Bancorporation, incorporated by reference to Exhibit 4.2 of Form S-3ARS filed March 31, 2006. | * | ||
| 4.3 | Junior Subordinated Indenture dated August 21, 2002 between Zions Bancorporation and The Bank of New York Mellon Trust Company, N.A. as successor to J.P. Morgan Trust Company, N.A., as trustee, with respect to junior subordinated debentures of Zions Bancorporation, incorporated by reference to Exhibit 4.3 of Form S-3ARS filed March 31, 2006. | * | ||
| 10.1 | Zions Bancorporation | |||
| * | ||||
| First amendment to the Zions Bancorporation 2006-2008 Value Sharing Plan, incorporated by reference to Exhibit 10.2 of Form 10-K for the year ended December 31, 2008. | * | |||
| 10.3 | Form of Zions Bancorporation 2006-2008 Value Sharing Plan, Subsidiary Banks, incorporated by reference to Exhibit 10.2 of Form 10-Q for the quarter ended June 30, 2006. | * | ||
| Amegy Bank of Texas 2007-2008 Value Sharing Plan, incorporated by reference to Exhibit 10.7 of Form 10-Q for the quarter ended June 30, 2007. | * | |||
| Zions Bancorporation 2009-2011 Value Sharing Plan (filed herewith). | ||||
| 10.6 | 2005 Management Incentive Compensation Plan, incorporated by reference to Appendix II of the Proxy Statement contained in the Company’s Schedule 14A | * | ||
| 10.7 | Zions Bancorporation Second Restated and Revised Deferred Compensation Plan, incorporated by reference to Exhibit 10.6 of Form 10-K for the year ended December 31, 2008. | * | ||
| 10.8 | Zions Bancorporation Third Restated Deferred Compensation Plan | |||
| * | ||||
| * | ||||
| Zions Bancorporation First Restated Excess Benefit Plan, | * | |||
| Trust Agreement establishing the Zions Bancorporation Deferred Compensation Plan Trust by and between Zions Bancorporation and Cigna Bank & Trust Company, FSB effective October 1, 2002, incorporated by reference to Exhibit 10.10 of Form 10-K for the year ended December 31, 2006. | * | |||
Exhibit | Description | |||
| 10.12 | Amendment to the Trust Agreement establishing the Zions Bancorporation Deferred Compensation Plan Trust by and between Zions Bancorporation and Cigna Bank & Trust Company, FSB substituting Prudential Bank & Trust, FSB as the trustee, | * | ||
| Amendment to Trust Agreement Establishing the Zions Bancorporation Deferred Compensation Plans Trust, effective September 1, 2006, incorporated by reference to Exhibit 10.12 of Form 10-K for the year ended December 31, 2006. | * | |||
| Zions Bancorporation Deferred Compensation Plans Master Trust between Zions Bancorporation and Fidelity Management Trust Company, effective September 1, 2006, incorporated by reference to Exhibit 10.13 of Form 10-K for the year ended December 31, 2006. | * | |||
| Revised | * | |||
| Zions Bancorporation Restated Pension Plan effective January 1, 2001, including amendments adopted through January 31, 2002, | * | |||
| Amendment dated December 31, 2002 to Zions Bancorporation Restated Pension Plan, incorporated by reference to Exhibit | * | |||||
| Second Amendment to the Restated and Amended Zions Bancorporation Pension Plan dated September 4, 2003, incorporated by reference to Exhibit 10.1 of Form 10-Q for the quarter ended March 31, 2005. | * | |||||
| Third Amendment to the Zions Bancorporation Pension Plan dated September 4, 2003, incorporated by reference to Exhibit 10.2 of Form 10-Q for the quarter ended March 31, 2005. | * | |||||
| Fourth Amendment to the Restated and Amended Zions Bancorporation Pension Plan dated March 28, 2005, incorporated by reference to Exhibit 10.4 of Form 10-Q for the quarter ended March 31, 2005. | * | |||||
| Fifth amendment to the Restated and Amended Zions Bancorporation Pension Plan, dated September 29, 2008, incorporated by reference to Exhibit 10.1 of Form 10-Q for the quarter ended September 30, 2009. | * | |||||
| 10.22 | Sixth amendment to the Restated and Amended Zions Bancorporation Pension Plan, dated September 15, 2009, incorporated by reference to Exhibit 10.2 of Form 10-Q for the quarter ended September 30, 2009. | * | ||||
| 10.23 | Seventh amendment to the Restated and Amended Zions Bancorporation Pension Plan, dated December 31, 2009 (filed herewith). | |||||
| 10.24 | Zions Bancorporation Executive Management Pension Plan, incorporated by reference to Exhibit | * | ||||
| Zions Bancorporation Payshelter 401(k) and Employee Stock Ownership Plan, Established and Restated Effective January 1, 2003, incorporated by reference to Exhibit | * | |||||
| First Amendment to the Zions Bancorporation Payshelter 401(k) and Employee Stock Ownership Plan, dated November 20, 2003, incorporated by reference to Exhibit 10.19 of Form 10-K for the year ended December 31, 2004. | * | |||||
| Second Amendment to the Zions Bancorporation Payshelter 401(k) and Employee Stock Ownership Plan, dated December 31, 2003, incorporated by reference to Exhibit 10.20 of Form 10-K for the year ended December 31, 2004. | * | |||||
Exhibit | Description | |||
| 10.28 | Third Amendment to the Zions Bancorporation Payshelter 401(k) and Employee Stock Ownership Plan, dated June 1, 2004, incorporated by reference to Exhibit 10.21 of Form 10-K for the year ended December 31, 2004. | * | ||
| Fourth Amendment to the Zions Bancorporation Payshelter 401(k) and Employee Stock Ownership Plan, dated March 18, 2005, incorporated by reference to Exhibit 10.31 of Form 10-Q for the quarter ended March 31, 2005. | * | |||
| Fifth Amendment to the Zions Bancorporation Payshelter 401(k) and Employee Stock Ownership Plan, dated February 28, 2006, incorporated by reference to Exhibit 10.1 of Form 10-Q for the quarter ended March 31, 2006. | * | |||
| Sixth Amendment to the Zions Bancorporation Payshelter 401(k) and Employee Stock Ownership Plan, dated July 31, 2006, incorporated by reference to Exhibit 10.4 of Form 10-Q for the quarter ended June 30, 2006. | * | |||
| Seventh Amendment to the Zions Bancorporation Payshelter 401(k) and Employee Stock Ownership Plan, dated December 28, 2006, incorporated by reference to Exhibit 10.28 of Form 10-K for the year ended December 31, 2006. | * | |||||
| Eighth Amendment to the Zions Bancorporation Payshelter 401(k) and Employee Stock Ownership Plan, dated May 14, 2007, incorporated by reference to Exhibit 10.3 of Form 10-Q for the quarter ended June 30, 2007. | * | |||||
| Ninth Amendment to the Zions Bancorporation Payshelter 401(k) and Employee Stock Ownership Plan, dated July 19, 2007, incorporated by reference to Exhibit 10.4 of Form 10-Q for the quarter ended June 30, 2007. | * | |||||
| 10.35 | Tenth amendment to the Zions Bancorporation Payshelter 401(k) and Employee Stock Ownership Plan, dated September 15, 2009, incorporated by reference to Exhibit 10.3 of Form 10-Q for the quarter ended September 30, 2009. | * | ||||
| 10.36 | Eleventh amendment to the Zions Bancorporation Payshelter 401(k) and Employee Stock Ownership Plan, dated December 31, 2009 (filed herewith). | |||||
| 10.37 | Zions Bancorporation Payshelter 401(k) and Employee Stock Ownership Plan Trust Agreement between Zions Bancorporation and Fidelity Management Trust Company, dated July 3, 2006, incorporated by reference to Exhibit 10.1 of Form 10-Q for the quarter ended March 31, 2007. | * | ||||
| Amended and Restated Zions Bancorporation Key Employee Incentive | ||||||
| 10.39 | Amended and Restated Zions Bancorporation | * | ||||
| 10.40 | ||||||
| * | ||||||
| Standard Stock Option Award Agreement, Zions Bancorporation 2005 Stock Option and Incentive Plan, incorporated by reference to Exhibit | * | |||||
| 10.42 | Standard Restricted Stock Award Agreement, Zions Bancorporation 2005 Stock Option and Incentive Plan, incorporated by reference to Exhibit 10.3 of Form 10-Q for the quarter ended June 30, 2009. | * | ||||
| 10.43 | Standard Directors Restricted Stock Award Agreement, Zions Bancorporation 2005 Stock Option and Incentive Plan, incorporated by reference to Exhibit 10.4 of Form 10-Q for the quarter ended June 30, 2009. | * | ||||
Exhibit | Description | |||
| 10.44 | Standard Directors Stock Option Award Agreement, Zions Bancorporation 2005 Stock Option and Incentive Plan, incorporated by reference to Exhibit 10.6 of Form 10-Q for the quarter ended March 31, 2005. | * | ||
| * | ||||
| Amegy Bancorporation (formerly Southwest Bancorporation of Texas, Inc.) 1996 Stock Option Plan, as amended and restated as of June 4, 2002, | ||||
| * | ||||
| 10.47 | Amegy Bancorporation 2004 (formerly Southwest Bancorporation of Texas, Inc.) Omnibus Incentive Plan (filed herewith). | |||
| 10.48 | Form of Change in Control Agreement between the Company and Certain Executive Officers, | * | ||
| Form of Change in Control Agreement between the Company and Certain Executive Officers, including Paul B. Murphy and Scott J. McLean, | * | |||
| Addendum to Change in Control Agreement, incorporated by reference to Exhibit 10.43 of Form 10-K for the year ended December 31, 2008. | * | |||
| 10.51 | Stock Purchase and Shareholder Agreement dated June 1, 2004 among Welman Holdings, Inc., the Company, Zions First National Bank and PSC Wealth Management, LLC, incorporated by reference to Exhibit 99.2 of Form 8-K filed April 1, 2005. | * | ||
| Employment Agreement between the Company and Paul B. Murphy, incorporated by reference to Exhibit 10.40 of Form 10-K for the year ended December 31, 2006. | * | |||
| Employment Agreement between the Company and Scott J. McLean, incorporated by reference to Exhibit 10.41 of Form 10-K for the year ended December 31, 2006. | * | |||
| Employment Agreement between the Company and Dallas Haun, | * | |||
| 10.55 | Warrant to purchase up to 5,789,909 shares of Common Stock, issued on November 14, 2008, incorporated by reference to Exhibit 4.2 of Form 8-K filed November 17, 2008. | * | ||
| 10.56 | Performance stock agreement between Zions Bancorporation and Paul B. Murphy, dated August 15, 2008, incorporated by reference to Exhibit 10.50 of Form 10-K filed December 31, 2008. | * | ||
| 10.57 | Performance stock agreement between Zions Bancorporation and Scott McLean, dated August 15, 2008, incorporated by reference to Exhibit 10.51 of Form 10-K filed December 31, 2008. | * | ||
| 10.58 | Form of Change in Control Agreement between the Company and Dallas E. Haun, dated May 23, 2008, incorporated by reference to Exhibit 10.52 of Form 10-K filed December 31, 2008. | * | ||
| 12 | Ratio of Earnings to Fixed Charges (filed herewith). | |||
| 21 | List of Subsidiaries of Zions Bancorporation (filed herewith). | |||
| 23 | Consent of Independent Registered Public Accounting Firm (filed herewith). | |||
| 31.1 | Certification by Chief Executive Officer required by Rules 13a-15(f) and 15d-15(f) under the Securities Exchange Act of 1934 (filed herewith). | |||
| 31.2 | Certification by Chief Financial Officer required by Rules 13a-15(f) and 15d-15(f) under the Securities Exchange Act of 1934 (filed herewith). | |||
Exhibit | Description | |||
| 32 | Certification by Chief Executive Officer and Chief Financial Officer required by Sections 13(a) or 15(d), as applicable, of the Securities Exchange Act of 1934 (15 U.S.C. 78m) and 18 U.S.C. Section 1350 (furnished herewith). | |||
| 99.1 | Certification by Chief Executive Officer required by 111(b)(4) of the Emergency Economic Stabilization Act (filed herewith). | |||
| 99.2 | Certification by Chief Financial Officer required by 111(b)(4) of the Emergency Economic Stabilization Act (filed herewith). | |||
| * | Incorporated by reference |
Certain instruments defining the rights of holders of long-term debt securities of the Registrant and its subsidiaries are omitted pursuant to Item 601(b)(4)(iii) of Regulation S-K. The Registrant hereby undertakes to furnish to the SEC, upon request, copies of any such instruments.
Pursuant to the requirements of Section 13 or 15(d) of the Securities Exchange Act of 1934, the Registrant has duly caused this report to be signed on its behalf by the undersigned, thereunto duly authorized.
| March 1, 2010 | ZIONS BANCORPORATION | |||||||
By |
| |||||||
HARRIS H. SIMMONS,Chairman, President and Chief Executive Officer | ||||||||
Pursuant to the requirements of the Securities Exchange Act of 1934, this report has been signed below by the following persons on behalf of the Registrant and in the capacities and on the date indicated.
March 1, 2010
February 28, 2008
/s/ HARRIS H. SIMMONS | /s/ DOYLE L. ARNOLD | |||
HARRIS H. SIMMONS,Director, Chairman, President and Chief Executive
| DOYLE L. ARNOLD,Vice Chairman and Chief Financial Officer (Principal Financial
| |||
/s/ NOLAN BELLON | /s/ JERRY C. ATKIN | |||
NOLAN BELLON,Controller (Principal
| JERRY C. ATKIN,Director | |||
/s/ R. D. CASH | /s/ PATRICIA FROBES | |||
R. D. CASH,Director | PATRICIA FROBES,Director | |||
/s/ J. DAVID HEANEY | /s/ ROGER B. PORTER | |||
J. DAVID HEANEY,Director | ROGER B. PORTER,Director | |||
/s/ STEPHEN D. QUINN | /s/ L. E. SIMMONS | |||
STEPHEN D. QUINN,Director | L. E. SIMMONS,Director | |||
/s/ STEVEN C. WHEELWRIGHT | /s/ SHELLEY THOMAS WILLIAMS | |||
STEVEN C. WHEELWRIGHT,Director | SHELLEY THOMAS WILLIAMS,Director | |||
182208