
UNITED STATES
SECURITIES AND EXCHANGE COMMISSION
Washington, D.C. 20549
FORM 10-K
(Mark One)
| x | ANNUAL REPORT PURSUANT TO SECTION 13 OR 15(d) OF THE SECURITIES EXCHANGE ACT OF 1934 |
For the fiscal year ended December 31, 20072008
or
| ¨ | TRANSITION REPORT PURSUANT TO SECTION 13 OR 15(d) OF THE SECURITIES EXCHANGE ACT OF 1934 |
For the transition period fromto
Commission file number 000-12896
OLD POINT FINANCIAL CORPORATION
(Exact name of registrant as specified in its charter)
| VIRGINIA | 54-1265373 | |
(State or other jurisdiction of incorporation or organization) | (I.R.S. Employer Identification No.) |
1 West Mellen Street, Hampton, Virginia 23663
(Address of principal executive offices) (Zip Code)
(757) 728-1200
(Registrant’s telephone number, including area code)
Securities registered pursuant to Section 12(b) of the Act:
| Common Stock, $5 par value | The NASDAQ Stock Market LLC | |
| (Title of each class) | (Name of each exchange on which registered) |
Securities registered pursuant to Section 12(g) of the Act:
None
Indicate by check mark if the registrant is a well-known seasoned issuer, as defined in Rule 405 of the Securities Act. Yes ¨ No x
Indicate by check mark if the registrant is not required to file reports pursuant to Section 13 or Section 15(d) of the Exchange Act. Yes ¨ No x
Indicate by check mark whether the registrant (1) has filed all reports required to be filed by Section 13 or 15(d) of the Securities Exchange Act of 1934 during the preceding 12 months (or for such shorter period that the registrant was required to file such reports), and (2) has been subject to such filing requirements for the past 90 days. Yes x No ¨
Indicate by check mark if disclosure of delinquent filers pursuant to Item 405 of Regulation S-K (§ 229.405 of this chapter) is not contained herein, and will not be contained, to the best of registrant’s knowledge, in definitive proxy or information statements incorporated by reference in Part III of this Form 10-K or any amendment to this Form 10-K. ¨
Indicate by check mark whether the registrant is a large accelerated filer, an accelerated filer, a non-accelerated filer, or a smaller reporting company. See the definitions of “large accelerated filer,” “accelerated filer,” and “smaller reporting company” in Rule 12b-2 of the Exchange Act.
Large accelerated filer ¨ Accelerated filer x Non-accelerated filer ¨ Smaller reporting company x
| Large accelerated filer | ¨ | Accelerated filer | x | |||
| Non-accelerated filer | ¨ (Do not check if a smaller reporting company) | Smaller reporting company | x | |||
Indicate by check mark whether the registrant is a shell company (as defined in Rule 12b-2 of the Act). Yes ¨ No x
The aggregate market value of voting and non-voting stock held by non-affiliates of the registrant as of June 29, 200730, 2008 was $60,448,140$54,773,075 based on the closing sales price on the NASDAQ Capital Market of $25.53.$17.80.
There were 4,907,5674,908,041 shares of common stock outstanding as of February 29, 2008.27, 2009.
DOCUMENTS INCORPORATED BY REFERENCE
Portions of the Proxy Statement for the Company’s Annual Meeting of Stockholders to be held on April 22, 2008,28, 2009, are incorporated by reference in Part III of this report.
OLD POINT FINANCIAL CORPORATION
FORM 10-K
INDEX
-i-
| Item 1. | Business |
GENERAL
Old Point Financial Corporation (the Company) was incorporated under the laws of Virginia on February 16, 1984, for the purpose of acquiring all the outstanding common stock of The Old Point National Bank of Phoebus (the Bank), in connection with the reorganization of the Bank into a one-bank holding company structure. At the annual meeting of the stockholders on March 27, 1984, the proposed reorganization was approved by the requisite stockholder vote. At the effective date of the reorganization on October 1, 1984, the Bank merged into a newly formed national bank as a wholly-owned subsidiary of the Company, with each outstanding share of common stock of the Bank being converted into five shares of common stock of the Company.
The Company completed a spin-off of its trust department as of April 1, 1999. The newly formed organization is chartered as Old Point Trust and Financial Services, N.A. (Trust). Trust is a nationally chartered trust company. The purpose of the spin-off was to have a corporate structure more ready to compete in the field of wealth management. Trust is a wholly-owned subsidiary of the Company. The Company’s primary activity is as a holding company for the common stock of the Bank and Trust. The principal business of the Company is conducted through its subsidiaries which continue to conduct business in substantially the same manner.
The Bank is a national banking association that was founded in 1922. As of the end of 2007,2008, the Bank had 1920 branch offices serving the Hampton Roads localities of Hampton, Newport News, Norfolk, Virginia Beach, Chesapeake, Williamsburg/James City County, York County and Isle of Wight County. The Bank offers a complete line of consumer, mortgage and business banking services, including loan, deposit, cash management, and investmentcash management services to individual and business customers.
The Company’s primary activity is as a holding company for the common stock of the Bank openedand Trust. The principal business of the Company is conducted through its 20th branch locationsubsidiaries which continue to conduct business in substantially the Hilltop area of Virginia in January 2008 in the City of Virginia Beach.same manner.
As of December 31, 2007,2008, the Company had assets of $822.6$835.0 million, loans of $597.1$637.5 million, deposits of $596.2$646.5 million, and stockholders’ equity of $79.7$82.9 million. At year-end, the Company and its subsidiaries had a total of 311336 employees, 2326 who were part-time.
MARKET AREA AND COMPETITION
The Company’s market area is located in Hampton Roads. According to the United States Census Bureau, Hampton Roads is the 3331rdst most populous Metropolitan Statistical Area (MSA) in the United States. Situated in the southeastern corner of Virginia and boasting the world’s largest natural deepwater harbor, the Hampton Roads MSA includes the cities of Chesapeake, Hampton, Newport News, Norfolk, Poquoson, Portsmouth, Suffolk, Virginia Beach and Williamsburg;Williamsburg and the counties of Isle of Wight, Gloucester, James City, Mathews, York and Surry.
The Hampton Roads MSA is the largest market between Washington, D.C. and Atlanta, Georgia, and the fourth largest MSA in the southeast. The region has seen a 4.3%7.0% increase in population between 2000 and 20062008 and was home to 1.651.7 million people as of July 2006.people. The Virginia Employment Commission projects the population in the Hampton Roads MSA to be nearly 1.82 million people by the year 2020.
The banking business in Virginia, and in the Bank’s primary service area in Hampton Roads, is highly competitive, and is dominated by a relatively small number of large banks with many offices operating over a wide geographic area. Among the advantages such large banks have over the Company is their ability to finance wide-ranging advertising campaigns and, by virtue of their greater total capitalization, to have substantially higher lending limits than the Bank.
Factors such as interest rates offered, the number and location of branches and the types of products offered, as well as the reputation of the institution affect competition for deposits and loans. The Bank competes by emphasizing customer service and technology, establishing long-term customer relationships and building customer loyalty, and providing products and services to address the specific needs of the Company’s customers. Through the Bank, the Company targets individual and small-to-medium size business customers.
- 1 -
Because federal regulation of financial institutions changes regularly and is the subject of constant legislative debate, we cannot foresee how federal regulation of financial institutions may change in the future. However, it is possible that current and future governmental regulatory and economic initiatives, such as the Emergency Economic Stabilization Act of 2008 enacted in October 2008, could impact the competitive landscape in the Company’s market area.
Because community banks typically rely on branch deposits to fund loans, competition for local deposits is fierce. As a result, the Bank launched several incentive programs to aid in the generation of core deposits. As of June 30, 2007,2008, the Bank holds sixthseventh place with 3% market share of all Hampton Roads deposits, up one place from last year, and two places since June 2005.deposits. The Bank’s total deposits for the entire Hampton Roads area grew by just
– 1 –
over $41$16.0 million, or 7%3% between June 20062007 and June 2007.2008. In addition, the Bank remains strong on the Peninsula with 13%12% market share. The Bank’s deposits onIn Hampton, the Peninsula grew by nearly $13Bank retains first place with 36% market share, deposit growth totaling almost $11.0 million, or 3%, between June 2006 and June 2007.4%.
Overall deposit growth remains strong in the Bank’s smaller markets as well. In Hampton, the Bank regains first place with 35% market share, deposit growth totaling almost $8 million, or 3%.
The Bank continues these growth trends in Chesapeake with 17%13% deposit growth between June 30, 2007 and alsoJune 30, 2008. Deposit growth has been flat in both Newport News and in Norfolk with 16% deposit growth. and in one region the Bank has seen some decline in deposits. In the Williamsburg/James City County market, the Bank had a -15% growth rate of deposits between June 2007 and June 2008. This decline in deposits can be attributed to the Bank’s Williamsburg Crossing location which has been experiencing a shift in the growth centers in and around the city. The two other Williamsburg branches, New Town and Norge Crossing, have experienced growth rates of 9% and 11% respectively.
With plans to open anothera second Norfolk branch in the Ghent area of Norfolk in earlylate 2009, the Bank’s market share is expected to increase. Deposit growth was a bit slowerincrease in other areas of the MSA, but the Bank experienced no negative growth in deposits between June 2006 and June 2007. Deposits grew 4% in the Williamsburg/James City County market and 2% in Newport News.
Eagle Harbor, the Bank’s first branch in Carrollton/Isle of Wight County, opened in April 2006, and is doing very well. In fourteen months, as of June 30, 2007, Eagle Harbor had 319% deposit growth, and had acquired 1% share of the Isle of Wight/Suffolk market. The Company expects the Bank’s market share to continue to increase over the next year.
Independence, the Bank’s first branch in Virginia Beach, has seen 97% deposit growth as of June 30, 2007. The staff in the Independence branch continues to work hard to increase Old Point’s name recognition in this region of the MSA. With the increasing level of business and revitalization occurring in the Independence branch’s area of the city, the Bank expects its market share to continue to grow, particularly with the addition of a second Virginia Beach location in the Hilltop area that opened in January 2008.MSA.
Moving forward, it is important that the Bank maintains its strong presence on the Peninsula, while striving to increase and grow the Company’s presence on the Southside. This effort has been ongoing beginning with the opening of the Great Bridge branch in 1999, the opening of the Crown Center branch in Norfolk in February 2001, the opening of the Greenbrier branch in the fall of 2003, the opening of the Independence branch in Virginia Beach in October of 2005, the opening of the Eagle Harbor branch in Isle of Wight County in April 2006, the opening of the Hilltop branch in Virginia Beach in January of 2008 and the upcoming branch opening in Ghent in 2009.
AVAILABLE INFORMATION
The Company maintains a website on the Internet atwww.oldpoint.com. The Company makes available free of charge, on or through its website, its proxy statements, annual reports on Form 10-K, quarterly reports on Form 10-Q, current reports on Form 8-K, and any amendments to those reports as soon as reasonably practicable after such material is electronically filed with the Securities and Exchange Commission (SEC). This reference to the Company’s Internet address shall not, under any circumstances, be deemed to incorporate the information available at such Internet address into this Form 10-K or other SEC filings. The information available at the Company’s Internet address is not part of this Form 10-K or any other report filed by the Company with the SEC. The public may read and copy any documents the Company files at the SEC’s Public Reference Room at 100 F Street, N.E. Washington, D.C. 20549. The public may obtain information on the operation of the Public Reference Room by calling the SEC at 1-800-SEC-0330. The Company’s SEC filings can also be obtained on the SEC’s website on the Internet atwww.sec.gov.
REGULATION AND SUPERVISION
Set forth below is a brief description of some of the material laws and regulations that affect the Company. The description of these statutes and regulations is only a summary and does not purport to be complete. This discussion is qualified in its entirety by reference to the statutes and regulations summarized below. No assurance can be given that these statutes or regulations will not change in the future.
General.The Company is subject to the periodic reporting requirements of the Securities Exchange Act of 1934, as amended (the Exchange Act), which include, but are not limited to, the filing of annual, quarterly and other reports with the SEC. As an Exchange Act reporting company, the Company is directly affected by the Sarbanes-Oxley Act of 2002 (the SOX), which is aimed at improving corporate governance and reporting procedures and requires additional corporate governance measures and expanded disclosure of the Company’s corporate
- 2 -
operations and internal controls. The Company is complying with the applicable SEC and other rules and regulations implemented pursuant to the SOX and intends to comply with any applicable rules and regulations implemented in the future. Although the Company has incurred and will continue to incur additional expense in complying with the provisions of the SOX and the resulting regulations, this compliance has not had, and is not expected to have, a material impact on the Company’s financial condition or results of operations.
– 2 –
The Company is a bank holding company within the meaning of the Bank Holding Company Act of 1956, and is registered as such with, and subject to the supervision of, the Board of Governors Federal Reserve System (the FRB). Generally, a bank holding company is required to obtain the approval of the FRB before it may acquire all or substantially all of the assets of any bank, and before it may acquire ownership or control of the voting shares of any bank if, after giving effect to the acquisition, the bank holding company would own or control more than 5% of the voting shares of such bank. The FRB’s approval is also required for the merger or consolidation of bank holding companies.
The Company is required to file periodic reports with the FRB and provide any additional information the FRB may require. The FRB also has the authority to examine the Company and its subsidiaries, as well as any arrangements between the Company and its subsidiaries, with the cost of any such examinations to be borne by the Company.
Banking subsidiaries of bank holding companies are also subject to certain restrictions imposed by Federal law in dealings with their holding companies and other affiliates. Subject to certain restrictions set forth in the Federal Reserve Act, a bank can loan or extend credit to an affiliate, purchase or invest in the securities of an affiliate, purchase assets from an affiliate or issue a guarantee, acceptance or letter of credit on behalf of an affiliate, as long as the aggregate amount of such transactions of a bank and its subsidiaries with its affiliates does not exceed 10% of the capital stock and surplus of the bank on a per affiliate basis or 20% of the capital stock and surplus of the bank on an aggregate affiliate basis. In addition, such transactions must be on terms and conditions that are consistent with safe and sound banking practices. In particular, a bank and its subsidiaries generally may not purchase from an affiliate a low-quality asset, as defined in the Federal Reserve Act. These restrictions also prevent a bank holding company and its other affiliates from borrowing from a banking subsidiary of the bank holding company unless the loans are secured by marketable collateral of designated amounts. Additionally, the Company and its subsidiaries are prohibited from engaging in certain tie-in arrangements in connection with any extension of credit, sale or lease of property or furnishing of services.
A bank holding company is prohibited from engaging in or acquiring direct or indirect ownership or control of more than 5% of the voting shares of any company engaged in nonbanking activities. A bank holding company may, however, engage in or acquire an interest in a company that engages in activities which the FRB has determined by regulation or order are so closely related to banking as to be a proper incident to banking. In making these determinations, the FRB considers whether the performance of such activities by a bank holding company would offer advantages to the public that outweigh possible adverse effects.
As a national bank, the Bank is subject to regulation, supervision and regular examination by the Office of the Comptroller of the Currency (the Comptroller). Each depositor’s account with the Bank is insured by the Federal Deposit Insurance Corporation (the FDIC) to the maximum amount permitted by law. The Bank is also subject to certain regulations promulgated by the FRB and applicable provisions of Virginia law, insofar as they do not conflict with or are not preempted by Federal banking law.
As a non-depository national banking association, Trust is subject to regulation, supervision and regular examination by the Comptroller. Trust’s exercise of fiduciary powers must comply with Regulation 9 promulgated by the Comptroller and with Virginia law.
The regulations of the FDIC, the Comptroller and FRB govern most aspects of the Company’s business, including deposit reserve requirements, investments, loans, certain check clearing activities, issuance of securities, payment of dividends, branching, deposit interest rate ceilings and numerous other matters. As a consequence of the extensive regulation of commercial banking activities in the United States, the Company’s business is particularly susceptible to changes in state and Federal legislation and regulations, which may have the effect of increasing the cost of doing business, limiting permissible activities or increasing competition.
- 3 -
Emergency Economic Stabilization Act of 2008.It is not clear at this time what impact the Emergency Economic Stabilization Act of 2008, enacted October 3, 2008, as amended by the American Recovery and Reinvestment Act of 2009, enacted February 17, 2009, (the EESA) or other initiatives of the United States Treasury and other bank regulatory agencies that have been announced, or any additional programs that may be initiated in the future, will have on the financial markets, the financial services industry, the Company, the Bank or Trust.
Capital Requirements.The FRB, the Comptroller and the FDIC have adopted risk-based capital adequacy guidelines for bank holding companies and banks. These capital adequacy regulations are based upon a risk-based capital determination, whereby a bank holding company’s capital adequacy is determined in light of the risk, both on- and off-balance sheet, contained in the company’s assets. Different categories of assets are assigned risk weightings by the regulatory agencies and are counted as a percentage of their book value. See “Management’s Discussion and Analysis – Capital Resources” in Item 7 of this report on Form 10-K.
– 3 –
Federal Deposit Insurance Corporation Improvement Act of 1991 (FDICIA).There are five capital categories applicable to insured institutions, each with specific regulatory consequences. If the appropriate Federal banking agency determines, after notice and an opportunity for hearing, that an insured institution is in an unsafe or unsound condition, it may reclassify the institution to the next lower capital category (other than critically undercapitalized) and require the submission of a plan to correct the unsafe or unsound condition. The Comptroller has issued regulations to implement these provisions. Under these regulations, the categories are:
a. Well Capitalized — the institution exceeds the required minimum level for each relevant capital measure. A well capitalized institution is one (i) having a Risk-based Capital Ratio of 10% or greater, (ii) having a Tier 1 Risk-based Capital Ratio of 6% or greater, (iii) having a Leverage Ratio of 5% or greater and (iv) that is not subject to any order or written directive to meet and maintain a specific capital level for any capital measure.
b. Adequately Capitalized — the institution meets the required minimum level for each relevant capital measure. No capital distribution may be made that would result in the institution becoming undercapitalized. An adequately capitalized institution is one (i) having a Risk-based Capital Ratio of 8% or greater, (ii) having a Tier 1 Risk-based Capital Ratio of 4% or greater and (iii) having a Leverage Ratio of 4% or greater or a Leverage Ratio of 3% or greater if the institution is rated composite 1 under the CAMELS (Capital, Assets, Management, Earnings, Liquidity and Sensitivity to market risk) rating system.
c. Undercapitalized — the institution fails to meet the required minimum level for any relevant capital measure. An undercapitalized institution is one (i) having a Risk-based Capital Ratio of less than 8% or (ii) having a Tier 1 Risk-based Capital Ratio of less than 4% or (iii) having a Leverage Ratio of less than 4%, or if the institution is rated a composite 1 under the CAMELS rating system, a Leverage Ratio of less than 3%.
d. Significantly Undercapitalized — the institution is significantly below the required minimum level for any relevant capital measure. A significantly undercapitalized institution is one (i) having a Risk-based Capital Ratio of less than 6% or (ii) having a Tier 1 Risk-based Capital Ratio of less than 3% or (iii) having a Leverage Ratio of less than 3%.
e. Critically Undercapitalized — the institution fails to meet a critical capital level set by the appropriate federal banking agency. A critically undercapitalized institution is one having a ratio of tangible equity to total assets that is equal to or less than 2%.
An institution which is less than adequately capitalized must adopt an acceptable capital restoration plan, is subject to increased regulatory oversight, and is increasingly restricted in the scope of its permissible activities. Each company having control over an undercapitalized institution must provide a limited guarantee that the institution will comply with its capital restoration plan. Except under limited circumstances consistent with an accepted capital restoration plan, an undercapitalized institution may not grow. An undercapitalized institution may not acquire another institution, establish additional branch offices or engage in any new line of business unless determined by the appropriate Federal banking agency to be consistent with an accepted capital restoration plan, or unless the FDIC determines that the proposed action will further the purpose of prompt corrective action. The appropriate Federal banking agency may take any action authorized for a significantly undercapitalized institution if an undercapitalized institution fails to submit an acceptable capital restoration plan or fails in any material respect to implement a plan accepted by the agency. A critically undercapitalized institution is subject to having a receiver or conservator appointed to manage its affairs and for loss of its charter to conduct banking activities.
- 4 -
An insured depository institution may not pay a management fee to a bank holding company controlling that institution or any other person having control of the institution if, after making the payment, the institution would be undercapitalized. In addition, an institution cannotmay not make a capital distribution, such as a dividend or other distribution that is in substance a distribution of capital to the owners of the institution if following such a distribution the institution would be undercapitalized. Thus, if payment of such a management fee or the making of such dividend would cause the Bank to become undercapitalized, it could not pay a management fee or dividend to the Company.
Deposit Insurance Assessments. The Bank’s deposits are insured up to applicable limits by the Deposit Insurance Fund (the DIF) of the FDIC. The DIF is the successor to the Bank Insurance Fund and the Savings Association Insurance Fund, which were merged in 2006. The FDIC recently amended its risk-based assessment
– 4 –
system for 2007 to implement authority granted by the Federal Deposit Insurance Reform Act of 2005 (FDIRA). Under the revised system, insured institutions are assigned to one of four risk categories based on supervisory evaluations, regulatory capital levels and certain other factors. An institution’s assessment rate depends upon the category to which it is assigned. Unlike the other categories, Risk Category I, which contains the least risky depository institutions, contains further risk differentiation based on the FDIC’s analysis of financial ratios, examination component ratings and other information.
Mortgage Banking Regulation.The Bank’s mortgage banking operation is subjectFDIC may adjust rates uniformly from one quarter to the rules and regulationsnext, except that no single adjustment can exceed three basis points.
FDIRA also provided for a one-time credit for eligible institutions based on their assessment base as of and examination by the U.S. Department of Housing and Urban Development, the Federal Housing Administration, the Veterans Administration and other federal and state regulatory authoritiesDecember 31, 1996. Subject to certain limitations with respect to originating, processinginstitutions that are exhibiting weaknesses, credits can be used to offset assessments until exhausted. The Bank’s one-time credit was $360 thousand, of which $135 thousand and selling mortgage loans.$225 thousand were applied to offset assessments in 2008 and 2007, respectively. FDIRA also provided for the possibility that the FDIC may pay dividends to insured institutions if the DIF reserve ratio equals or exceeds 1.35 percent of estimated insured deposits.
The Emergency Economic Stabilization Act of 2008, which was enacted on October 3, 2008, temporarily raised the basic limit on federal deposit insurance coverage from $100,000 to $250,000 per depositor. The legislation provides that the basic deposit insurance limit will return to $100,000 after December 31, 2009. The legislation did not increase coverage for retirement accounts, which will continue to be $250,000 beyond December 31, 2009.
On October 13, 2008, the FDIC adopted the Temporary Liquidity Guarantee Program (the TLGP) because of disruptions in the credit market, particularly the interbank lending market, which reduced banks’ liquidity and impaired their ability to lend. The goal of the TLGP is to decrease the cost of bank funding so that bank lending to consumers and businesses will normalize. The TLGP is industry funded and does not rely on the DIF to achieve its goals. The final rule implementing the TLGP was approved by the FDIC Board of Directors on November 21, 2008. The TLGP consists of two components: a temporary guarantee of newly-issued senior unsecured debt (the Debt Guarantee Program) and a temporary unlimited guarantee of funds in noninterest-bearing transaction accounts at FDIC-insured institutions (the Transaction Account Guarantee Program). The Company is participating in both of these programs and will be required to pay assessments associated with the TLGP as follows:
Under the Debt Guarantee Program, all newly-issued senior unsecured debt (as defined in the regulation) will be charged an annualized assessment of up to 100 basis points (depending on debt term) on the amount of debt issued, and calculated through the maturity date of that debt or June 30, 2012, whichever is earlier. The Company has thus far issued no debt and has incurred no assessments under the Debt Guarantee Program.
Under the Transaction Account Guarantee Program, amounts exceeding the existing deposit insurance limit of $250,000 in any noninterest-bearing transaction accounts (as defined in the regulation) will be assessed an annualized 10 basis points collected quarterly for coverage through December 31, 2009.
With higher levels of bank failures, the FDIC’s resolution costs have increased significantly. On December 16, 2008, the FDIC adopted a final rule increasing risk-based assessment rates uniformly by 7 basis points, on an
- 5 -
annual basis, for the first quarter of 2009. The FDIC also proposed changes to take effect beginning in the second quarter of 2009 that would require riskier institutions to pay larger assessments. The comment period for these proposed changes ended on December 17, 2008. The FDIC has not yet announced a final rule with respect to these proposed changes.
Gramm-Leach-Bliley Act of 1999.The Gramm-Leach-Bliley Act of 1999 (the GLBA) implemented major changes to the statutory framework for providing banking and other financial services in the United States. The GLBA, among other things, eliminated many of the restrictions on affiliations among banks and securities firms, insurance firms and other financial service providers. A bank holding company that qualifies as a financial holding company will be permitted to engage in activities that are financial in nature or incident or complementary to financial activities. The activities that the GLBA expressly lists as financial in nature include insurance underwriting, sales and brokerage activities, providing financial and investment advisory services, underwriting services and limited merchant banking activities.
To become eligible for these expanded activities, a bank holding company must qualify as a financial holding company. To qualify as a financial holding company, each insured depository institution controlled by the bank holding company must be well-capitalized, well-managed and have at least a satisfactory rating under the CRA (discussed below). In addition, the bank holding company must file with the FRB a declaration of its intention to become a financial holding company. While the Company satisfies these requirements, the Company has elected for various reasons not to be treated as a financial holding company under the GLBA.
The GLBA has not had a material adverse impact on the Company’s or the Bank’s operations. To the extent that it allows banks, securities firms and insurance firms to affiliate, the financial services industry has experienced further consolidation, which has the result of increasing competition that we face from larger institutions and other companies offering financial products and services, many of which may have substantially greater financial resources.
The GLBA and certain new regulations issued by federal banking agencies also provide protections against the transfer and use by financial institutions of consumer nonpublic personal information. A financial institution must provide to its customers, at the beginning of the customer relationship and annually thereafter, the institution’s policies and procedures regarding the handling of customers’ nonpublic personal financial information. These privacy provisions generally prohibit a financial institution from providing a customer’s personal financial information to unaffiliated third parties unless the institution discloses to the customer that the information may be so provided and the customer is given the opportunity to opt out of such disclosure.
Community Reinvestment Act.The Bank is subject to the requirements of the Community Reinvestment Act (the CRA). The CRA imposes on financial institutions an affirmative and ongoing obligation to meet the credit needs of their local communities, including low and moderate-income neighborhoods, consistent with the safe and sound operation of those institutions. A financial institution’s efforts in meeting community credit needs currently are evaluated as part of the examination process. These efforts also are considered in evaluating mergers, acquisitions and applications to open a branch or facility.
USA Patriot Act.The USA Patriot Act became effective on October 26, 2001 and provides for the facilitation of information sharing among governmental entities and financial institutions for the purpose of combating terrorism and money laundering. Among other provisions, the USA Patriot Act permits financial institutions, upon providing notice to the United States Treasury, to share information with one another in order to better identify and report to the federal government concerning activities that may involve money laundering or terrorists’ activities. The USA Patriot Act is considered a significant banking law in terms of information disclosure regarding certain customer transactions. Certain provisions of the USA Patriot Act impose the obligation to establish anti-money laundering programs, including the development of a customer identification program, and the screening of all customers
– 5 –
against any government lists of known or suspected terrorists. Although it does create a reporting obligation and compliance costs, the USA Patriot Act has not materially affected the Bank’s products, services or other business activities.
Reporting Terrorist Activities.The Office of Foreign Assets Control (OFAC), which is a division of the Department of the Treasury, is responsible for helping to insure that United States entities do not engage in transactions with “enemies” of the United States, as defined by various Executive Orders and Acts of Congress.
- 6 -
OFAC has sent, and will send, our banking regulatory agencies lists of names of persons and organizations suspected of aiding, harboring or engaging in terrorist acts. If the Bank finds a name on any transaction, account or wire transfer that is on an OFAC list, it must freeze such account, file a suspicious activity report and notify the FBI. The Bank has appointed an OFAC compliance officer to oversee the inspection of its accounts and the filing of any notifications. The Bank actively checks high-risk OFAC areas such as new accounts, wire transfers and customer files. The Bank performs these checks utilizing software, which is updated each time a modification is made to the lists provided by OFAC and other agencies of Specially Designated Nationals and Blocked Persons.
Consumer Laws and Regulations.The Bank is also subject to certain consumer laws and regulations that are designed to protect consumers in transactions with banks. While the list set forth herein is not exhaustive, these laws and regulations include the Truth in Lending Act, the Truth in Savings Act, the Electronic Funds Transfer Act, the Expedited Funds Availability Act, the Equal Credit Opportunity Act, the Fair Credit Reporting Act and the Fair Housing Act, among others. These laws and regulations mandate certain disclosure requirements and regulate the manner in which financial institutions transact business with customers. The Bank must comply with the applicable provisions of these consumer protection laws and regulations as part of its ongoing customer relations.
| Item 1A. | Risk Factors |
U.S. and international credit markets and economic conditions could adversely affect our liquidity and financial condition. Global market and economic conditions continue to be disrupted and volatile and the disruption has been particularly acute in the financial sector. Although the Company remains well capitalized and has not suffered any liquidity issues as a result of these recent events, the cost and availability of funds may be adversely affected by illiquid credit markets. Continued turbulence in the U.S. and international markets and economy may adversely affect the Company’s liquidity, financial condition and profitability.
The Company is subject to interest rate risk and variations in interest rates may negatively affect its financial performance.The Company’s profitability depends in substantial part on its net interest margin, which is the difference between the rates received on loans and investments and the rates paid for deposits and other sources of funds. The net interest margin depends on many factors that are partly or completely outside of the Company’s control, including competition, federal economic, monetary and fiscal policies, and economic conditions. Changes in interest rates affect operating performance and financial condition. The Company tries to minimize its exposure to interest rate risk, but it is unable to completely eliminate this risk. Because of the differences in the maturities and repricing characteristics of interest-earning assets and interest-bearing liabilities, changes in interest rates do not produce equivalent changes in interest income earned on interest-earning assets and interest paid on interest-bearing liabilities. Accordingly, fluctuations in interest rates could adversely affect the Company’s net interest margin and, in turn, its profitability. At December 31, 2007,2008, based on scheduled maturities only, the Company’s balance sheet was liability sensitive at the one year time frame and, as a result, its net interest margin will tend to decrease in a rising interest rate environment and increase in a declining interest rate environment.
In addition, any substantial and prolonged increase in market interest rates could reduce the Bank’s customers’ desire to borrow money or adversely affect their ability to repay their outstanding loans by increasing their credit costs. Interest rate changes could also affect the fair value of the Company’s financial assets and liabilities. Accordingly, changes in levels of market interest rates could materially and adversely affect the Company’s net interest margin, asset quality, loan origination volume, business, financial condition, results of operations and cash flows.
The Company’s substantial dependence on dividends from its subsidiaries may prevent it from paying dividends to its stockholders and adversely affect its business, results of operations or financial condition.The Company is a separate legal entity from its subsidiaries and does not have significant operations or revenues of its own. The Company substantially depends on dividends from its subsidiaries to pay dividends to stockholders and to pay its operating expenses. The availability of dividends from the subsidiaries is limited by various statues and regulations. It is possible, depending upon the financial condition of the Company and other factors, that the Comptroller could assert that payment of dividends by the subsidiaries is an unsafe or unsound practice. In the event the subsidiaries are unable to pay dividends to the Company, the Company may not be able to pay dividends on the Company’s common stock, service debt or pay operating expenses. Consequently, the inability to receive dividends from the subsidiaries could adversely affect the Company’s financial condition, results of operations, cash flows and prospects and limit stockholders’ return, if any, to capital appreciation.
– 6 –- 7 -
The Company’s profitability depends significantly on local economic conditions.The Company’s success depends primarily on the general economic conditions of the markets the Company operates in. Unlike larger financial institutions that are more geographically diversified, the Company provides banking and financial services to customers primarily in the Hampton Roads MSA. The local economic conditions in this area have a significant impact on the demand for loans, the ability of the borrowers to repay these loans and the value of the collateral securing these loans. A significant decline in general economic conditions, caused by inflation, recession, acts of terrorism, an outbreak of hostilities or other international or domestic calamities, unemployment or other factors beyond our control could impact these local economic conditions. The decline in general economic conditions and couldthe current recession have negatively affectaffected the financial results of the Company’s operations.
A decline in real estate values could cause a significant portion of the Company’s loan portfolio to be under-collateralized and adversely impact the Company’s operating results and financial condition. The market value of real estate, particularly real estate held for investment, can fluctuate significantly in a short period of time as a result of market conditions in the geographic area in which the real estate is located. If the value of the real estate serving as collateral for the Company’s loan portfolio were to decline materially, a significant part of the loan portfolio could become under-collateralized. If the loans that are collateralized by real estate become troubled during a time when market conditions are declining or have declined, then, in the event of foreclosure, the Company may not be able to realize the amount of collateral that it anticipated at the time of originating the loan. In that event,The market value of real estate has declined, leaving the Company maywith certain loans that are under-collateralized. Some of these loans have become troubled and have been foreclosed upon, and the Company was unable to increaserealize the expected value of the collateral. Due to these events, the Company has increased its loan loss provision and established a valuation reserve for loan losses,other real estate owned (OREO), both of which could have a materialhad an adverse effectaffect on its operating results and financial condition.results.
Market Riskrisk affects the earnings of Trust.The fee structure of Trust is generally based upon the market value of accounts under administration. Most of these accounts are invested in equities of publicly traded companies and debt obligations of both government agencies and publicly traded companies. As such, fluctuations in the equity and debt markets in general can have a direct impact upon the earnings of Trust.
The Company may be adversely affected by changes in government monetary policy.As a bank holding company, the Company’s business is affected by the monetary policies established by the Board of Governors of the FRB, which regulates the national money supply in order to mitigate recessionary and inflationary pressures. In setting its policy, the FRB may utilize techniques such as the following:
Engaging in open market transactions in United States government securities;
Setting the discount rate on member bank borrowings; and
Determining reserve requirements.
These techniques may have an adverse effect on deposit levels, net interest margin, loan demand or the Company’s business and operations.
The allowance for loan losses may not be adequate to cover actual losses. A significant source of risk arises from the possibility that losses could be sustained because borrowers, guarantors, and related parties may fail to perform in accordance with the terms of their loans and leases. Like all financial institutions, the Company maintains an allowance for loan losses to provide for loan defaults and non-performance. The allowance for loan losses may not be adequate to cover actual loan losses. In addition, future provisions for loan losses could materially and adversely affect the Company’s operating results. The allowance for loan losses is determined by analyzing historical loan losses, current trends in delinquencies and charge-offs, plans for problem loan resolutions, changes in the size and composition of the loan portfolio and industry information. Also included in management’s estimates for loan losses are considerations with respect to the impact of economic events, the outcome of which are uncertain. The amount of future losses is susceptible to changes in economic and other conditions, including changes in interest rates, that may be beyond the Company’s control and these future losses may exceed current estimates. Federal regulatory agencies, as an integral part of their examination process, review the Company’s loans and allowance for loan losses. While management believes that the Company’s allowance is adequate to cover current losses, the Company cannot assure investors that it will not need to increase the allowance or that regulators will not require the allowance to be increased. Either of these occurrences could materially and adversely affect earnings and profitability.
– 7 –- 8 -
The Company and its subsidiaries are subject to extensive regulation which could adversely affect them. The Company is subject to extensive regulation by federal, state and local governmental authorities and is subject to various laws and judicial and administrative decisions imposing requirements and restrictions on part or all of operations. Regulations adopted by these agencies, which are generally intended to protect depositors and customers rather than to benefit stockholders, govern a comprehensive range of matters including, without limitation, ownership and control of the Company’s shares, acquisition of other companies and businesses, permissible activities for the Company and its subsidiaries may engage in, maintenance of adequate capital levels and other aspects of operations. These regulations could limit the Company’s growth by restricting certain of its activities. The laws, rules and regulations applicable to the Company are subject to regular modification and change. Regulatory changes could subject the Company to more demanding regulatory compliance requirements which could affect the Company in unpredictable and adverse ways. Such changes could subject the Company to additional costs, limit the types of financial services and products it may offer and/or increase the ability of non-banks to offer competing financial services and products, among other things. Failure to comply with laws, regulations or policies could result in sanctions by regulatory agencies, civil money penalties and/or reputation damage, which could have a material adverse effect on the Company’s business, financial condition and results of operations. Legislation and regulatory initiative containing wide-ranging proposals for altering the structure, regulation and competitive relationship of financial institutions are introduced regularly. The Company cannot predict whether or what form of proposed statute or regulation will be adopted or the extent to which such adoption may affect our business.
The Company’s future success depends on its ability to compete effectively in the highly competitive financial services industry.The Company faces substantial competition in all phases of its operations from a variety of different competitors. Growth and success depends on the Company’s ability to compete effectively in this highly competitive financial services environment. Many competitors offer products and services that are not offered by the Company, and many have substantially greater resources, name recognition and market presence that benefit them in attracting business. In addition, larger competitors may be able to price loans and deposit more aggressively and may have larger lending limits that would allow them to serve the credit needs of larger customers. Some of the financial service organizations with which the Company competes are not subject to the same degree of regulation as is imposed on bank holding companies and federally insured national banks. As a result, these non-bank competitors have certain advantages over the Company in accessing funding and in providing various services. The financial services industry could become even more competitive as a result of legislative, regulatory and technological changes and continued consolidation. Failure to compete effectively to attract new and retain current customers in the Company’s markets could cause it to lose market share, slow its growth rate and may have an adverse effect on its financial condition and results of operations.
Negative public opinion could damage the Company’s reputation and adversely impact the Company’s business, financial condition and results of operation.Reputation risk, or the risk to the Company’s business, financial condition and results of operation from negative public opinion, is inherent in the financial services industry. Negative public opinion can result from actual or alleged conduct in any number of activities, including lending practices and corporate governance, and from actions taken by government regulators and community organizations in response to those activities. Negative public opinion could adversely affect the Company’s ability to keep and attract customers and employees and could expose it to litigation and regulatory action. Damage to the Company’s reputation could adversely affect deposits and loans and otherwise negatively affect the Company’s business, financial condition and results of operation.
The Company and its subsidiaries are subject to transaction risk, which could adversely affect business, financial condition and results of operation.The Company and its subsidiaries, like all businesses, are subject to transaction risk, which is the risk of loss resulting from human error, fraud or unauthorized transactions due to inadequate or failed internal processes and systems, and external events that are wholly or partially beyond the Company’s control (including, for example, computer viruses or electrical or telecommunications outages). Transaction risk also encompasses compliance (legal) risk, which is the risk of loss from violations of, or noncompliance with, laws, rules, regulations, prescribed practices or ethical standards. Although the Company and its subsidiaries seek to mitigate operational risk through a system of internal controls, there can be no assurance that they will not suffer losses from operational risks in the future that may be material in amount. Any
- 9 -
losses resulting from transaction risk could take the form of explicit charges, increased operational costs, litigation costs, harm to reputation or forgone opportunities, any and all of which could have a material adverse effect on business, financial condition and results of operations.
– 8 –
| Item 1B. | Unresolved Staff Comments |
None.
| Item 2. | Properties |
As of December 31, 2007,2008, the Bank owns the main office located in Hampton, Virginia, fivefour office buildings and 1415 branches. All of these are owned directly and free of any encumbrances. The land at the Fort Monroe branch is leased by the Bank under an agreement expiring in October 2011. The remaining three branches are leased from unrelated parties under leases with renewal options that expire anywhere from twoone to eleventen years.
For more information concerning the commitments under current leasing agreements, see Note 11 of the Notes to Consolidated Financial Statements included in Item 8, “Financial Statements and Supplementary Data” of this report on Form 10-K.
The Bank owns one property in Norfolk which is designated as a future branch location. The Bank anticipates opening this branch in earlylate 2009. The Bank opened its 20th branch location in the Hilltop area of Virginia in January 2008 in the City of Virginia Beach.
| Item 3. | Legal Proceedings |
Neither the Company nor any of its subsidiaries is a party to any material pending legal proceedings before any court, administrative agency, or other tribunal.
| Item 4. | Submission of Matters to a Vote of Security Holders |
There were no matters submitted to a vote of security holders during the quarter ended December 31, 2007.2008.
– 9 –- 10 -
EXECUTIVE OFFICERS OF THE REGISTRANT
Name (Age) And Present Position | Served in Since | Principal Occupation During Past Five Years | ||
Robert F. Shuford | 1965 | Banker | ||
Chairman, President & Chief Executive Officer | ||||
Old Point Financial Corporation | ||||
Louis G. Morris | 1988 | Banker | ||
Executive Vice President/OPNB | ||||
Old Point Financial Corporation | ||||
Margaret P. Causby | 1996 | Banker | ||
Senior Vice President/Risk Management | ||||
Old Point Financial Corporation | ||||
Laurie D. Grabow | 1999 | Banker | ||
Chief Financial Officer & Senior Vice President/Finance | ||||
Old Point Financial Corporation | ||||
Eugene M. Jordan, II | 2003 | Banker | ||
Executive Vice President/Trust | ||||
Old Point Financial Corporation | ||||
Robert F. Shuford, Jr. | 2003 | Banker | ||
Senior Vice President/Operations | ||||
Old Point Financial Corporation | ||||
Melissa L. Burroughs | 2007 | Banker | ||
Senior Vice President/Lending & Business Development | ||||
Old Point Financial Corporation | ||||
Joseph R. Witt(48) | 2008 | Treasurer | ||
Senior Vice President/Corporate Banking | ||||
Old Point Financial Corporation | ||||
– 10 –- 11 -
| Item 5. | Market for Registrant’s Common Equity, Related Stockholder Matters and Issuer Purchases of Equity Securities |
The common stock of the Company is quoted on the NASDAQ Capital Market under the symbol “OPOF”. The approximate number of stockholders of record as of February 29, 200827, 2009 was 1,244.1,237. On that date, the closing price of the Company’s common stock on the NASDAQ Capital Market was $17.55.$15.75. The range of high and low prices and dividends paid per share of the Company’s common stock for each quarter during 20072008 and 20062007 is presented in Item 7 of this report on Form 10-K under “Capital Resources” and is incorporated herein by reference. Additional information related to stockholder matters can be found in Note 15 of the Notes to Consolidated Financial Statements included in Item 8, “Financial Statements and Supplementary Data” of this report on Form 10-K.
On January 8, 2008, the Company authorized a program to repurchase during any given calendar year up to an aggregate of five percent (5%) of the shares of the Company’s common stock outstanding as of January 1 of that calendar year. As of December 31, 2008, the Company had repurchased 5,400 shares of the Company’s common stock during 2008 and none of these shares were repurchased in the quarter ended December 31, 2008. On January 6, 2009, the Company replaced the 2008 plan with a similar plan. There is currently no stated expiration date for this program.
Period | Total Number of Shares Purchased | Average Price Paid Per Share | Total Number of Shares Purchased as Part of the Repurchase Program (1) | Maximum Number of Shares that May Yet Be Purchased Under the Repurchase Program (1) | ||||
10/1/2007 - 10/31/2007 | 8,125 | — | 8,125 | 161,528 | ||||
11/1/2007 - 11/30/2007 | 17,000 | — | 17,000 | 144,528 | ||||
12/1/2007 - 12/31/2007 | — | — | — | 144,528 | ||||
Total | 25,125 | 25,125 | ||||||
– 11 –- 12 -
| Item 6. | Selected Financial Data |
The following table summarizes the Company’s performance for the past five years.
SELECTED FINANCIAL HIGHLIGHTS
| SELECTED FINANCIAL HIGHLIGHTS | ||||||||||||||||||||
Years ended December 31, | 2007 | 2006 | 2005 | 2004 | 2003 | |||||||||||||||
| (in thousands except per share data) | ||||||||||||||||||||
RESULTS OF OPERATIONS | ||||||||||||||||||||
Interest income | $ | 49,021 | $ | 44,885 | $ | 36,487 | $ | 33,639 | $ | 33,167 | ||||||||||
Interest expense | 23,349 | 20,276 | 12,321 | 9,248 | 9,643 | |||||||||||||||
Net interest income | 25,672 | 24,609 | 24,166 | 24,391 | 23,524 | |||||||||||||||
Provision for loan losses | 1,000 | 1,200 | 1,050 | 850 | 1,000 | |||||||||||||||
Net interest income after provision for loan losses | 24,672 | 23,409 | 23,116 | 23,541 | 22,524 | |||||||||||||||
Net gains on available-for-sale securities | 3 | 9 | 10 | 215 | 60 | |||||||||||||||
Noninterest income | 12,483 | 11,397 | 10,355 | 9,205 | 7,408 | |||||||||||||||
Noninterest expenses | 26,023 | 25,181 | 23,585 | 21,172 | 19,596 | |||||||||||||||
Income before income taxes | 11,135 | 9,634 | 9,896 | 11,789 | 10,396 | |||||||||||||||
Income tax expense | 3,166 | 2,610 | 2,628 | 3,209 | 2,571 | |||||||||||||||
Net income | $ | 7,969 | $ | 7,024 | $ | 7,268 | $ | 8,580 | $ | 7,825 | ||||||||||
FINANCIAL CONDITION | ||||||||||||||||||||
Total assets | $ | 822,557 | $ | 847,521 | $ | 739,993 | $ | 686,275 | $ | 645,915 | ||||||||||
Total deposits | 596,165 | 588,414 | 536,744 | 512,160 | 490,422 | |||||||||||||||
Total loans | 597,144 | 583,593 | 494,697 | 433,253 | 405,111 | |||||||||||||||
Stockholders’ equity | 79,707 | 74,665 | 71,056 | 69,139 | 63,299 | |||||||||||||||
Average assets | 824,727 | 794,367 | 706,076 | 669,869 | 600,733 | |||||||||||||||
Average equity | 77,479 | 72,540 | 70,472 | 66,456 | 61,085 | |||||||||||||||
PERTINENT RATIOS | ||||||||||||||||||||
Return on average assets | 0.97 | % | 0.88 | % | 1.03 | % | 1.28 | % | 1.30 | % | ||||||||||
Return on average equity | 10.29 | % | 9.68 | % | 10.31 | % | 12.91 | % | 12.81 | % | ||||||||||
Dividends paid as a percent of net income | 37.78 | % | 39.76 | % | 36.47 | % | 28.92 | % | 27.35 | % | ||||||||||
Average equity as a percent of average assets | 9.39 | % | 9.13 | % | 9.98 | % | 9.92 | % | 10.17 | % | ||||||||||
PER SHARE DATA *** | ||||||||||||||||||||
Basic earnings per share | $ | 1.61 | $ | 1.41 | $ | 1.45 | $ | 1.72 | $ | 1.58 | ||||||||||
Diluted earnings per share | 1.59 | 1.39 | 1.42 | 1.68 | 1.54 | |||||||||||||||
Cash dividends declared | 0.61 | 0.56 | 0.53 | 0.50 | 0.43 | |||||||||||||||
Book value | 16.24 | 14.96 | 14.16 | 13.78 | 12.74 | |||||||||||||||
GROWTH RATES | ||||||||||||||||||||
Year-end assets | -2.95 | % | 14.53 | % | 7.83 | % | 6.25 | % | 12.02 | % | ||||||||||
Year-end deposits | 1.32 | % | 9.63 | % | 4.80 | % | 4.43 | % | 8.01 | % | ||||||||||
Year-end loans | 2.32 | % | 17.97 | % | 14.18 | % | 6.95 | % | 7.18 | % | ||||||||||
Year-end equity | 6.75 | % | 5.08 | % | 2.77 | % | 9.23 | % | 8.92 | % | ||||||||||
Average assets | 3.82 | % | 12.50 | % | 5.41 | % | 11.51 | % | 10.59 | % | ||||||||||
Average equity | 6.81 | % | 2.93 | % | 6.04 | % | 8.79 | % | 10.90 | % | ||||||||||
Net income | 13.45 | % | -3.36 | % | -15.29 | % | 9.65 | % | 10.98 | % | ||||||||||
Cash dividends declared | 8.93 | % | 6.06 | % | 6.45 | % | 14.81 | % | 19.21 | % | ||||||||||
Book value | 8.56 | % | 5.65 | % | 2.73 | % | 8.23 | % | 7.84 | % | ||||||||||
Years ended December 31, | 2008 | 2007 | 2006 | 2005 | 2004 | |||||||||||||||
| (in thousands except per share data) | ||||||||||||||||||||
RESULTS OF OPERATIONS | ||||||||||||||||||||
Interest income | $ | 46,501 | $ | 49,021 | $ | 44,885 | $ | 36,487 | $ | 33,639 | ||||||||||
Interest expense | 19,006 | 23,349 | 20,276 | 12,321 | 9,248 | |||||||||||||||
Net interest income | 27,495 | 25,672 | 24,609 | 24,166 | 24,391 | |||||||||||||||
Provision for loan losses | 2,400 | 1,000 | 1,200 | 1,050 | 850 | |||||||||||||||
Net interest income after provision for loan losses | 25,095 | 24,672 | 23,409 | 23,116 | 23,541 | |||||||||||||||
Net gains (losses) on available-for-sale securities | (47 | ) | 3 | 9 | 10 | 215 | ||||||||||||||
Noninterest income | 12,769 | 12,483 | 11,397 | 10,355 | 9,205 | |||||||||||||||
Noninterest expenses | 28,376 | 26,023 | 25,181 | 23,585 | 21,172 | |||||||||||||||
Income before income taxes | 9,441 | 11,135 | 9,634 | 9,896 | 11,789 | |||||||||||||||
Income tax expense | 2,651 | 3,166 | 2,610 | 2,628 | 3,209 | |||||||||||||||
Net income | $ | 6,790 | $ | 7,969 | $ | 7,024 | $ | 7,268 | $ | 8,580 | ||||||||||
FINANCIAL CONDITION | ||||||||||||||||||||
Total assets | $ | 834,965 | $ | 822,557 | $ | 847,521 | $ | 739,993 | $ | 686,275 | ||||||||||
Total deposits | 646,524 | 596,165 | 588,414 | 536,744 | 512,160 | |||||||||||||||
Total loans | 637,452 | 597,144 | 583,593 | 494,697 | 433,253 | |||||||||||||||
Stockholders’ equity | 82,898 | 79,707 | 74,665 | 71,056 | 69,139 | |||||||||||||||
Average assets | 832,533 | 824,727 | 794,367 | 706,076 | 669,869 | |||||||||||||||
Average equity | 82,195 | 77,479 | 72,540 | 70,472 | 66,456 | |||||||||||||||
PERTINENT RATIOS | ||||||||||||||||||||
Return on average assets | 0.82 | % | 0.97 | % | 0.88 | % | 1.03 | % | 1.28 | % | ||||||||||
Return on average equity | 8.26 | % | 10.29 | % | 9.68 | % | 10.31 | % | 12.91 | % | ||||||||||
Dividends paid as a percent of net income | 47.66 | % | 37.78 | % | 39.76 | % | 36.47 | % | 28.92 | % | ||||||||||
Average equity as a percent of average assets | 9.87 | % | 9.39 | % | 9.13 | % | 9.98 | % | 9.92 | % | ||||||||||
PER SHARE DATA *** | ||||||||||||||||||||
Basic earnings per share | $ | 1.39 | $ | 1.61 | $ | 1.41 | $ | 1.45 | $ | 1.72 | ||||||||||
Diluted earnings per share | 1.38 | 1.59 | 1.39 | 1.42 | 1.68 | |||||||||||||||
Cash dividends declared | 0.66 | 0.61 | 0.56 | 0.53 | 0.50 | |||||||||||||||
Book value | 16.90 | 16.24 | 14.96 | 14.16 | 13.78 | |||||||||||||||
GROWTH RATES | ||||||||||||||||||||
Year-end assets | 1.51 | % | -2.95 | % | 14.53 | % | 7.83 | % | 6.25 | % | ||||||||||
Year-end deposits | 8.45 | % | 1.32 | % | 9.63 | % | 4.80 | % | 4.43 | % | ||||||||||
Year-end loans | 6.75 | % | 2.32 | % | 17.97 | % | 14.18 | % | 6.95 | % | ||||||||||
Year-end equity | 4.00 | % | 6.75 | % | 5.08 | % | 2.77 | % | 9.23 | % | ||||||||||
Average assets | 0.95 | % | 3.82 | % | 12.50 | % | 5.41 | % | 11.51 | % | ||||||||||
Average equity | 6.09 | % | 6.81 | % | 2.93 | % | 6.04 | % | 8.79 | % | ||||||||||
Net income | -14.79 | % | 13.45 | % | -3.36 | % | -15.29 | % | 9.65 | % | ||||||||||
Cash dividends declared | 8.20 | % | 8.93 | % | 6.06 | % | 6.45 | % | 14.81 | % | ||||||||||
Book value | 4.06 | % | 8.56 | % | 5.65 | % | 2.73 | % | 8.23 | % | ||||||||||
| *** | Per share data have been adjusted to reflect the 5 for 4 stock split in the form of a dividend declared on August 16, 2007 and paid on October 1, 2007. |
– 12 –- 13 -
| Item 7. | Management’s Discussion and Analysis of Financial Condition and Results of |
The following discussion is intended to assist readers in understanding and evaluating the financial condition, changes in financial condition and the results of operations of the Company, consisting of the parent company and its wholly-owned subsidiaries, the Bank and Trust. This discussion should be read in conjunction with the consolidated financial statements and other financial information contained elsewhere in this report.
Caution About Forward-Looking Statements
In addition to historical information, this report may contain forward-looking statements. For this purpose, any statement, that is not a statement of historical fact may be deemed to be a forward-looking statement. These forward-looking statements may include statements regarding profitability, liquidity, allowance for loan losses, interest rate sensitivity, market risk, growth strategy and financial and other goals. Forward-looking statements often use words such as “believes,” “expects,” “plans,” “may,” “will,” “should,” “projects,” “contemplates,” “anticipates,” “forecasts,” “intends” or other words of similar meaning. You can also identify them by the fact that they do not relate strictly to historical or current facts. Forward-looking statements are subject to numerous assumptions, risks and uncertainties, and actual results could differ materially from historical results or those anticipated by such statements.
FactorsThere are many factors that could have a material adverse effect on the operations and future prospects of the Company include,including, but are not limited to, changes in:in interest rates, general economic conditions, monetary and fiscal policies of the U.S. Government, including policies of the Comptroller of the Currency, U.S. Treasury and the Federal Reserve Board, the quality or composition of the loan or investment portfolios, the level of nonperforming assets and charge-offs, the local real estate market, volatility and disruption in national and international financial markets, government intervention in the U.S. financial system, demand for loan products, deposit flows, competition, and accounting principles, policies and guidelines. Monetary and fiscal policies of the U.S. Government could also adversely effect the Company; such policies include the impact of any regulations or programs implemented pursuant to the Emergency Economic Stabilization Act of 2008 (EESA), the American Recovery and Reinvestment Act of 2009 (ARRA) and other policies of the Office of the Comptroller of the Currency, U.S. Treasury and the Federal Reserve Board.
While the Company has not experienced significant losses during the current economic climate, a continuation of the recent turbulence in significant portions of the global financial markets, particularly if it worsens, could impact the Company’s performance, both directly by affecting revenues and the value of the Company’s assets and liabilities, and indirectly by affecting the Company’s counterparties and the economy generally. Dramatic declines in the housing market in the past year have resulted in significant write-downs of asset values by financial institutions in the United States. Concerns about the stability of the U.S. financial markets generally have reduced the availability of funding to certain financial institutions, leading to a tightening of credit, reduction of business activity, and increased market volatility. It is not clear at this time what impact the EESA, the ARRA or other liquidity and funding initiatives of the Treasury and other bank regulatory agencies that have been announced or any additional programs that may be initiated in the future will have on the financial markets and the financial services industry. The extreme levels of volatility and limited credit availability currently being experienced could continue to affect the U.S. banking industry and the broader U.S. and global economies, which would have an effect on all financial institutions, including the Company.
These risks and uncertainties should be considered in evaluating the forward-looking statements contained herein, and readers are cautioned not to place undue reliance on such statements. Any forward-looking statement speaks only as of the date on which it is made, and we undertakethe Company undertakes no obligation to update any forward-looking statement to reflect events or circumstances after the date on which it is made. In addition, past results of operations are not necessarily indicative of future results.
Executive Overview
Description of Operations
Headquartered in Hampton, Virginia, the Company is the parent company of Trust and the Bank. Trust is a wealth management services provider. The Bank offers a complete line of consumer, mortgage and business banking services, including loan, deposit, cash management, and investmentcash management services to individual and business customers. The Bank is an independent community bank. AsIn January of January 2008, the Bank hadopened the Hilltop office in Virginia Beach. With this opening, the Bank has 20 branches throughout the Hampton Roads localities of Chesapeake, Hampton, Isle of Wight County, Newport News, Norfolk, Virginia Beach, Williamsburg/James City County and York County.
- 14 -
Primary Financial Data for 20072008
The Company earned $8.0$6.8 million in 2007,2008, a 13.45% increase14.79% decrease in net income from 2006. The increase in net2007. Net interest income was impactedfor 2008 increased by the$1.8 million as compared to net interest marginincome for 2007. Due to the economy and by noninterest income. While total interesttrends in nonaccruals and dividend income rose by $4.1 million, total interest expense rose by $3.1 million. Thepast due loans, the Company provided $200 thousand less in theincreased its provision for loan losslosses to $2.4 million in 20072008 as compared to the 2006 provision. Therefore, net interest$1.0 million in 2007. While noninterest income after provision for loan loss was $1.3 million more in 2007 when2008 rose slightly as compared to 2006. Noninterestnoninterest income rose by $1.1 million. Mostfor 2007, noninterest expense was $2.4 million higher. While the Company has not been immune to the recession, its continued profitability illustrates its long tradition of this increase in income came from fiduciary activitiesstrength and service charges on deposits.consistency.
Significant Factors Affecting Earnings in 2008
TheMajor factors in the decrease in 2008 income as compared to 2007 were an increase in the provision for loan losses and a one-time write-off consisting of $165 thousand for an undeveloped branch site as well as the establishment of a $263 thousand valuation reserve for OREO. In addition, the Bank opened a branch office in the Hilltop section of Virginia Beach in January 2008. The opening of the Hilltop branch is expected to negatively impactimpacted 2008 earnings in 2008 due to pre-opening expenses that willhave not bebeen completely offset by the new branch’s earnings. Over the long term, the Hilltop branch is expected to be accretive to earnings.
The new consumer checking account initiative that began in 2005 increased the Company’s customer base. We intend to continue this initiative in 2008 and expect it to be a relevant factor in increased earnings. In addition, management intends to continue its focus on cross-selling other products and services to these new customers in order to build stronger and longer lasting relationships. In addition, the Company plans to continue its incentive plan started in the last half of 2006 directed at the generation of low cost deposits.
– 13 –
On September 10, 2007, the Bank entered into a joint venture agreement with Tidewater Mortgage Services, Inc. to provide mortgage origination services. Under the terms of the agreement, the joint venture is called Old Point Mortgage, LLC and is headquartered in Hampton. The Bank owns 49% of Old Point Mortgage, LLC. Tidewater Mortgage Services, Inc. owns 51% of Old Point Mortgage, LLC and is the managing member. Earnings from this joint venture were minimal in 2008 but are expected to increase in 20082009 as a result of the joint venture.Old Point Mortgage, LLC has been approved to originate Federal Housing Administration (FHA) loans.
Critical Accounting Estimates
The accounting and reporting policies of the Company are in accordance with U.S. generally accepted accounting principles (GAAP) and conform to general practices within the banking industry. The Company’s financial position and results of operations are affected by management’s application of accounting policies, including estimates, assumptions and judgments made to arrive at the carrying value of assets and liabilities and amounts reported for revenues, expenses and related disclosures. Different assumptions in the application of these policies could result in material changes in the Company’s consolidated financial position and/or results of operations. The accounting policy that required management’s most difficult, subjective or complex judgments is the Company’s Allowance for Loan Losses, which is described below.
Allowance for Loan Losses
The allowance for loan losses is an estimate of the losses that may be sustained in the loan portfolio. The allowance is based on three basic principles of accounting: (i) Statement of Financial Accounting Standards (SFAS) No. 5, “Accounting for Contingencies,” which requires that losses be accrued when they are probable of occurring and estimable, (ii) SFAS No. 114, “Accounting by Creditors for Impairment of a Loan,” which requires that losses be accrued based on the differences between the value of collateral, present value of future cash flows or values that are observable in the secondary market and the loan balance and (iii) U.S. Securities and Exchange Commission Staff Accounting Bulletin (SAB) No. 102, “Selected Loan Loss Allowance Methodology and Documentation Issues,” which requires adequate documentation to support the allowance for loan losses estimate.
The Company’s allowance for loan losses is the accumulation of various components that are calculated based on independent methodologies. All components of the allowance represent an estimation performed pursuant to either SFAS No. 5 or SFAS No. 114. Management’s estimate of each SFAS No. 5 component is based on certain observable data that management believes are most reflective of the underlying credit losses being estimated. This evaluation includes credit quality trends; collateral values; loan volumes; geographic, borrower and industry concentrations; seasoning of the loan portfolio; the findings of internal credit quality assessments and results from external bank regulatory examinations. These factors, as well as historical losses and current economic and business conditions, are used in developing estimated loss factors used in the calculations.
The Company adopted SFAS No. 114, which has been amended by SFAS No. 118, “Accounting by Creditors for Impairment of a Loan—Income Recognition and Disclosures.” SFAS No. 114, as amended, requires that the impairment of loans that have been separately identified for evaluation be measured based on the present value of
- 15 -
expected future cash flows or, alternatively, the observable market price of the loans or the fair value of the collateral. However, for those loans that are collateral dependent (that is, if repayment of those loans is expected to be provided solely by the underlying collateral) and for which management has determined foreclosure is probable, the measure of impairment is to be based on the net realizable value of the collateral. SFAS No. 114, as amended, also requires certain disclosures about investments in impaired loans and the allowance for loan losses and interest income recognized on loans.
Reserves for commercial loans are determined by applying estimated loss factors to the portfolio based on management’s evaluation and “risk grading” of the commercial loan portfolio. Reserves are provided for noncommercial loan categories using estimated loss factors applied to the total outstanding loan balance of each loan category. Specific reserves are determined on a loan-by-loan basis based on management’s evaluation of the Company’s exposure for each credit, given the current payment status of the loan and the net market value of any underlying collateral.
While management uses the best information available to establish the allowance for loan and lease losses, future adjustment to the allowance may be necessary if economic conditions differ substantially from the assumptions used in making the valuations or if required by regulators, based upon information available to them at the time of their examinations. Such adjustments to original estimates, as necessary, are made in the period in which these factors and other relevant considerations indicate that loss levels may vary from previous estimates.
– 14 –
Income Taxes
The Company recognizes expense for federal income and state bank franchise taxes payable as well as deferred federal income taxes for estimated future tax effects of temporary differences between the tax basis of assets and liabilities and amounts reported in the consolidated financial statements. Income and franchise tax returns are subject to audit by the Internal Revenue Service and state taxing authorities. Income and franchise tax expense for current and prior periods is subject to adjustment based on the outcome of such audits. The Company believes it has adequately provided for all taxes payable.
Earnings Summary
Net income was $6.8 million, or $1.38 diluted earnings per share in 2008 compared to $8.0 million, or $1.59 diluted earnings per share in 2007 compared toand $7.0 million, or $1.39 diluted earnings per share in 2006 and $7.3 million, or $1.42 diluted earnings per share in 2005.2006. Management was able to improve the net interest margin by realigning the Company’s balance sheet during 2007.2008. During 2007,2008, proceeds from maturing lower yielding maturing securitiesinvestments were used to fund loan growth and retire higher cost Federal Home Loan Bank (FHLB) advances.
Return on average assets was 0.82% in 2008, 0.97% in 2007 and 0.88% in 2006 and 1.03% in 2005.2006. Return on average equity was 8.26% in 2008, 10.29% in 2007 and 9.68% in 2006 and 10.31% in 2005.2006.
Net Interest Income
The principal source of earnings for the Company is net interest income. Net interest income is the difference between interest and fees generated by earning assets and interest expense paid to fund them. Changes in the volume and mix of interest-earning assets and interest-bearing liabilities, as well as their respective yields and rates, have a significant impact on the level of net interest income. The net interest margin is calculated by dividing tax equivalent net interest income by average earning assets. Net interest income, on a fully tax equivalent basis, was $26.4$28.0 million in 2007,2008, up $959 thousand$1.7 million from 20062007 and up $1.3$2.6 million from 2005.2006. The net interest margin was 3.42%3.61% in 20072008 as compared to 3.42% in 20062007 and 3.81%3.42% in 2005.2006.
Tax equivalent interest income increased $4.0decreased $2.7 million, or 8.82%5.41%, in 2007.2008. Average earning assets grew $28.2$4.0 million, or 3.79%0.51%. Total average loans increased $44.5$35.2 million, or 8.19%6.00%, while average investment securities decreased $27.4$28.7 million, or 14.31%17.51%. The yield on earning assets increaseddecreased in 20072008 by 3038 basis points primarily due to increasingdecreasing yields in the loan portfolio.
Interest expense increased $3.1decreased $4.3 million, or 15.16%18.60% in 2007,2008, while average interest-bearing liabilities increased $27.0decreased $5.8 million, or 4.35%0.90% in 2007.2008. The cost of funding thoseinterest-bearing liabilities increased 33decreased 64 basis points due to higherlower interest rates.
– 15 –- 16 -
The following table shows an analysis of average earning assets, interest-bearing liabilities and rates and yields. Nonaccrual loans are included in loans outstanding.
TABLE I
AVERAGE BALANCE SHEETS, NET INTEREST INCOME* AND RATES*
| TABLE I AVERAGE BALANCE SHEETS, NET INTEREST INCOME* AND RATES* | ||||||||||||||||||||||||||||||||||||||||||||||||||||||||||||
Years ended December 31, | 2007 | 2006 | 2005 | 2008 | 2007 | 2006 | ||||||||||||||||||||||||||||||||||||||||||||||||||||||
| Average Balance | Interest Income/ Expense | Yield/ Rate | Average Balance | Interest Income/ Expense | Yield/ Rate | Average Balance | Interest Income/ Expense | Yield/ Rate | Average Balance | Interest Income/ Expense | Yield/ Rate | Average Balance | Interest Income/ Expense | Yield/ Rate | Average Balance | Interest Income/ Expense | Yield/ Rate | |||||||||||||||||||||||||||||||||||||||||||
| (in thousands) | (in thousands) | |||||||||||||||||||||||||||||||||||||||||||||||||||||||||||
| ASSETS | ||||||||||||||||||||||||||||||||||||||||||||||||||||||||||||
Loans | $ | 587,645 | $ | 41,964 | 7.14 | % | $ | 543,136 | $ | 37,520 | 6.91 | % | $ | 450,053 | $ | 29,041 | 6.45 | % | $ | 622,883 | $ | 40,941 | 6.57 | % | $ | 587,645 | $ | 41,964 | 7.14 | % | $ | 543,136 | $ | 37,520 | 6.91 | % | ||||||||||||||||||||||||
Investment securities: | ||||||||||||||||||||||||||||||||||||||||||||||||||||||||||||
Taxable | 136,937 | 4,893 | 3.57 | % | 160,108 | 5,533 | 3.46 | % | 164,311 | 5,536 | 3.37 | % | 115,687 | 4,318 | 3.73 | % | 136,937 | 4,893 | 3.57 | % | 160,108 | 5,533 | 3.46 | % | ||||||||||||||||||||||||||||||||||||
Tax-exempt | 26,914 | 1,890 | 7.02 | % | 31,113 | 2,189 | 7.04 | % | 36,094 | 2,584 | 7.16 | % | 19,481 | 1,402 | 7.20 | % | 26,914 | 1,890 | 7.02 | % | 31,113 | 2,189 | 7.04 | % | ||||||||||||||||||||||||||||||||||||
Total investment securities | 163,851 | 6,783 | 4.14 | % | 191,221 | 7,722 | 4.04 | % | 200,405 | 8,120 | 4.05 | % | 135,168 | 5,720 | 4.23 | % | 163,851 | 6,783 | 4.14 | % | 191,221 | 7,722 | 4.04 | % | ||||||||||||||||||||||||||||||||||||
Federal funds sold | 20,255 | 994 | 4.91 | % | 9,198 | 467 | 5.08 | % | 8,356 | 270 | 3.23 | % | 17,653 | 387 | 2.19 | % | 20,255 | 994 | 4.91 | % | 9,198 | 467 | 5.08 | % | ||||||||||||||||||||||||||||||||||||
Total earning assets | 771,751 | 49,741 | 6.45 | % | 743,555 | 45,709 | 6.15 | % | 658,814 | 37,431 | 5.68 | % | 775,704 | 47,048 | 6.07 | % | 771,751 | 49,741 | 6.45 | % | 743,555 | 45,709 | 6.15 | % | ||||||||||||||||||||||||||||||||||||
Reserve for loan losses | (5,092 | ) | (4,588 | ) | (4,210 | ) | (5,269 | ) | (5,092 | ) | (4,588 | ) | ||||||||||||||||||||||||||||||||||||||||||||||||
| 766,659 | 738,967 | 654,604 | 770,435 | 766,659 | 738,967 | |||||||||||||||||||||||||||||||||||||||||||||||||||||||
Cash and due from banks | 13,531 | 14,695 | 15,554 | 12,715 | 13,531 | 14,695 | ||||||||||||||||||||||||||||||||||||||||||||||||||||||
Bank premises and equipment, net | 26,686 | 23,322 | 20,025 | 29,331 | 26,686 | 23,322 | ||||||||||||||||||||||||||||||||||||||||||||||||||||||
Other assets | 17,851 | 17,383 | 15,893 | 20,052 | 17,851 | 17,383 | ||||||||||||||||||||||||||||||||||||||||||||||||||||||
Total assets | $ | 824,727 | $ | 794,367 | $ | 706,076 | $ | 832,533 | $ | 824,727 | $ | 794,367 | ||||||||||||||||||||||||||||||||||||||||||||||||
LIABILITIES AND STOCKHOLDERS’ EQUITY | ||||||||||||||||||||||||||||||||||||||||||||||||||||||||||||
Time and savings deposits: | ||||||||||||||||||||||||||||||||||||||||||||||||||||||||||||
Interest-bearing transaction accounts | $ | 10,658 | $ | 27 | 0.25 | % | $ | 9,210 | $ | 24 | 0.26 | % | $ | 8,360 | $ | 22 | 0.26 | % | $ | 10,271 | $ | 14 | 0.14 | % | $ | 10,658 | $ | 27 | 0.25 | % | $ | 9,210 | $ | 24 | 0.26 | % | ||||||||||||||||||||||||
Money market deposit accounts | 149,518 | 2,279 | 1.52 | % | 150,950 | 2,063 | 1.37 | % | 144,655 | 1,196 | 0.83 | % | 139,109 | 977 | 0.70 | % | 149,518 | 2,279 | 1.52 | % | 150,950 | 2,063 | 1.37 | % | ||||||||||||||||||||||||||||||||||||
Savings accounts | 38,698 | 196 | 0.51 | % | 40,612 | 203 | 0.50 | % | 42,559 | 213 | 0.50 | % | 37,832 | 103 | 0.27 | % | 38,698 | 196 | 0.51 | % | 40,612 | 203 | 0.50 | % | ||||||||||||||||||||||||||||||||||||
Time deposits, $100,000 or more | 111,650 | 5,481 | 4.91 | % | 106,227 | 4,071 | 3.83 | % | 79,321 | 2,367 | 2.98 | % | 122,666 | 4,766 | 3.89 | % | 111,650 | 5,481 | 4.91 | % | 106,227 | 4,071 | 3.83 | % | ||||||||||||||||||||||||||||||||||||
Other time deposits | 187,198 | 8,468 | 4.52 | % | 157,133 | 6,932 | 4.41 | % | 141,526 | 4,620 | 3.26 | % | 203,208 | 8,242 | 4.06 | % | 187,198 | 8,468 | 4.52 | % | 157,133 | 6,932 | 4.41 | % | ||||||||||||||||||||||||||||||||||||
Total time and savings deposits | 497,722 | 16,451 | 3.31 | % | 464,132 | 13,293 | 2.86 | % | 416,421 | 8,418 | 2.02 | % | 513,086 | 14,102 | 2.75 | % | 497,722 | 16,451 | 3.31 | % | 464,132 | 13,293 | 2.86 | % | ||||||||||||||||||||||||||||||||||||
Federal funds purchased, repurchase agreements and other borrowings | 51,882 | 1,970 | 3.80 | % | 51,167 | 1,913 | 3.74 | % | 51,134 | 1,160 | 2.27 | % | 50,749 | 877 | 1.73 | % | 51,882 | 1,970 | 3.80 | % | 51,167 | 1,913 | 3.74 | % | ||||||||||||||||||||||||||||||||||||
Federal Home Loan Bank advances | 98,085 | 4,928 | 5.02 | % | 105,386 | 5,070 | 4.81 | % | 63,316 | 2,743 | 4.33 | % | 78,038 | 4,027 | 5.16 | % | 98,085 | 4,928 | 5.02 | % | 105,386 | 5,070 | 4.81 | % | ||||||||||||||||||||||||||||||||||||
Total interest-bearing liabilities | 647,689 | 23,349 | 3.60 | % | 620,685 | 20,276 | 3.27 | % | 530,871 | 12,321 | 2.32 | % | 641,873 | 19,006 | 2.96 | % | 647,689 | 23,349 | 3.60 | % | 620,685 | 20,276 | 3.27 | % | ||||||||||||||||||||||||||||||||||||
Demand deposits | 96,475 | 98,622 | 102,722 | 104,954 | 96,475 | 98,622 | ||||||||||||||||||||||||||||||||||||||||||||||||||||||
Other liabilities | 3,084 | 2,520 | 2,011 | 3,511 | 3,084 | 2,520 | ||||||||||||||||||||||||||||||||||||||||||||||||||||||
Total liabilities | 747,248 | 721,827 | 635,604 | 750,338 | 747,248 | 721,827 | ||||||||||||||||||||||||||||||||||||||||||||||||||||||
Stockholders’ equity | 77,479 | 72,540 | 70,472 | 82,195 | 77,479 | 72,540 | ||||||||||||||||||||||||||||||||||||||||||||||||||||||
Total liabilities and stockholders’ equity | $ | 824,727 | $ | 794,367 | $ | 706,076 | $ | 832,533 | $ | 824,727 | $ | 794,367 | ||||||||||||||||||||||||||||||||||||||||||||||||
Net interest margin | $ | 26,392 | 3.42 | % | $ | 25,433 | 3.42 | % | $ | 25,110 | 3.81 | % | $ | 28,042 | 3.61 | % | $ | 26,392 | 3.42 | % | $ | 25,433 | 3.42 | % | ||||||||||||||||||||||||||||||||||||
| * | Computed on a fully |
– 16 –- 17 -
The following table summarizes changes in net interest income attributable to changes in the volume of interest- bearing assets and liabilities and changes in interest rates.
TABLE II
VOLUME AND RATE ANALYSIS*
(in thousands)
| TABLE II VOLUME AND RATE ANALYSIS* (in thousands) | ||||||||||||||||||||||||||||||||||||||||||||||||||||||||||||||||||||||||
| 2007 vs. 2006 Increase (Decrease) Due to Changes in: | 2006 vs. 2005 Increase (Decrease) Due to Changes in: | 2005 vs. 2004 Increase (Decrease) Due to Changes in: | 2008 vs. 2007 Increase (Decrease) Due to Changes in: | 2007 vs. 2006 Increase (Decrease) Due to Changes in: | 2006 vs. 2005 Increase (Decrease) Due to Changes in: | |||||||||||||||||||||||||||||||||||||||||||||||||||||||||||||||||||
| Volume | Rate | Total | Volume | Rate | Total | Volume | Rate | Total | Volume | Rate | Total | Volume | Rate | Total | Volume | Rate | Total | |||||||||||||||||||||||||||||||||||||||||||||||||||||||
EARNING ASSETS: | ||||||||||||||||||||||||||||||||||||||||||||||||||||||||||||||||||||||||
Loans | $ | 3,075 | $ | 1,369 | $ | 4,444 | $ | 6,006 | $ | 2,473 | $ | 8,479 | $ | 1,968 | $ | 712 | $ | 2,680 | $ | 2,517 | $ | (3,540 | ) | $ | (1,023 | ) | $ | 3,075 | $ | 1,369 | $ | 4,444 | $ | 6,006 | $ | 2,473 | $ | 8,479 | ||||||||||||||||||||||||||||||||||
Investment Securities: | ||||||||||||||||||||||||||||||||||||||||||||||||||||||||||||||||||||||||
Taxable | (801 | ) | 161 | (640 | ) | (142 | ) | 139 | (3 | ) | 296 | (47 | ) | 249 | (759 | ) | 184 | (575 | ) | (801 | ) | 161 | (640 | ) | (142 | ) | 139 | (3 | ) | |||||||||||||||||||||||||||||||||||||||||||
Tax-exempt | (295 | ) | (4 | ) | (299 | ) | (357 | ) | (38 | ) | (395 | ) | (284 | ) | 6 | (278 | ) | (522 | ) | 34 | (488 | ) | (295 | ) | (4 | ) | (299 | ) | (357 | ) | (38 | ) | (395 | ) | ||||||||||||||||||||||||||||||||||||||
Total investment securities | (1,096 | ) | 157 | (939 | ) | (499 | ) | 101 | (398 | ) | 12 | (41 | ) | (29 | ) | (1,281 | ) | 218 | (1,063 | ) | (1,096 | ) | 157 | (939 | ) | (499 | ) | 101 | (398 | ) | ||||||||||||||||||||||||||||||||||||||||||
Federal funds sold | 561 | (34 | ) | 527 | 27 | 170 | 197 | (66 | ) | 163 | 97 | (128 | ) | (479 | ) | (607 | ) | 561 | (34 | ) | 527 | 27 | 170 | 197 | ||||||||||||||||||||||||||||||||||||||||||||||||
Total earning assets | 2,540 | 1,492 | 4,032 | 5,534 | 2,744 | 8,278 | 1,914 | 834 | 2,748 | 1,108 | (3,801 | ) | (2,693 | ) | 2,540 | 1,492 | 4,032 | 5,534 | 2,744 | 8,278 | ||||||||||||||||||||||||||||||||||||||||||||||||||||
INTEREST-BEARING LIABILITIES: | ||||||||||||||||||||||||||||||||||||||||||||||||||||||||||||||||||||||||
Interest-bearing transaction accounts | 4 | (1 | ) | 3 | 2 | (0 | ) | 2 | (3 | ) | 0 | (3 | ) | (1 | ) | (12 | ) | (13 | ) | 4 | (1 | ) | 3 | 2 | (0 | ) | 2 | |||||||||||||||||||||||||||||||||||||||||||||
Money market deposit accounts | (20 | ) | 236 | 216 | 52 | 815 | 867 | 34 | 364 | 398 | (159 | ) | (1,143 | ) | (1,302 | ) | (20 | ) | 236 | 216 | 52 | 815 | 867 | |||||||||||||||||||||||||||||||||||||||||||||||||
Savings accounts | (10 | ) | 3 | (7 | ) | (10 | ) | (0 | ) | (10 | ) | 3 | 1 | 4 | (4 | ) | (89 | ) | (93 | ) | (10 | ) | 3 | (7 | ) | (10 | ) | (0 | ) | (10 | ) | |||||||||||||||||||||||||||||||||||||||||
Time deposits, $100,000 or more | 208 | 1,202 | 1,410 | 803 | 901 | 1,704 | 244 | 587 | 831 | 441 | (1,156 | ) | (715 | ) | 208 | 1,202 | 1,410 | 803 | 901 | 1,704 | ||||||||||||||||||||||||||||||||||||||||||||||||||||
Other time deposits | 1,326 | 210 | 1,536 | 509 | 1,803 | 2,312 | 51 | 523 | 574 | 624 | (850 | ) | (226 | ) | 1,326 | 210 | 1,536 | 509 | 1,803 | 2,312 | ||||||||||||||||||||||||||||||||||||||||||||||||||||
Total time and savings deposits | 1,508 | 1,650 | 3,158 | 1,356 | 3,519 | 4,875 | 329 | 1,475 | 1,804 | 901 | (3,250 | ) | (2,349 | ) | 1,508 | 1,650 | 3,158 | 1,356 | 3,519 | 4,875 | ||||||||||||||||||||||||||||||||||||||||||||||||||||
Federal funds purchased, repurchase agreements and other borrowings | 27 | 30 | 57 | 1 | 752 | 753 | 158 | 631 | 789 | (43 | ) | (1,050 | ) | (1,093 | ) | 27 | 30 | 57 | 1 | 752 | 753 | |||||||||||||||||||||||||||||||||||||||||||||||||||
Federal Home Loan Bank advances | (351 | ) | 209 | (142 | ) | 1,823 | 504 | 2,327 | 375 | 105 | 480 | (1,007 | ) | 106 | (901 | ) | (351 | ) | 209 | (142 | ) | 1,823 | 504 | 2,327 | ||||||||||||||||||||||||||||||||||||||||||||||||
Total interest-bearing liabilities | 1,184 | 1,889 | 3,073 | 3,180 | 4,775 | 7,955 | 862 | 2,211 | 3,073 | (149 | ) | (4,194 | ) | (4,343 | ) | 1,184 | 1,889 | 3,073 | 3,180 | 4,775 | 7,955 | |||||||||||||||||||||||||||||||||||||||||||||||||||
Change in net interest income | $ | 1,356 | $ | (397 | ) | $ | 959 | $ | 2,354 | $ | (2,031 | ) | $ | 323 | $ | 1,052 | $ | (1,377 | ) | $ | (325 | ) | $ | 1,257 | $ | 393 | $ | 1,650 | $ | 1,356 | $ | (397 | ) | $ | 959 | $ | 2,354 | $ | (2,031 | ) | $ | 323 | ||||||||||||||||||||||||||||||
| * | Computed on a fully |
Interest Sensitivity
An important element of earnings performance and the maintenance of sufficient liquidity is proper management of the interest sensitivity gap. The interest sensitivity gap is the difference between interest sensitive assets and interest sensitive liabilities in a specific time interval. This gap can be managed by repricing assets or liabilities, which are variable rate instruments, by replacing an asset or liability at maturity or by adjusting the interest rate during the life of the asset or liability. Matching the amounts of assets and liabilities maturing in the same time interval helps to hedge interest rate risk and to minimize the impact of rising or falling interest rates on net interest income.
The Company determines the overall magnitude of interest sensitivity risk and then formulates policies governing asset generating and pricing, funding sources and pricing, and off-balance sheet commitments. These decisions are based on management’s expectations regarding future interest rate movements, the state of the national and regional economy, and other financial and business risk factors. The Company uses computer simulations to measure the effect of various interest rate scenarios on net interest income. This modeling reflects interest rate changes and the related impact on net interest income and net income over specified time horizons.
– 17 –- 18 -
Based on scheduled maturities only, the Company was liability sensitive at the one-year timeframe as of December 31, 2007.2008. It should be noted, however, that non-maturing deposit liabilities, which consist of interest checking, money market and savings accounts, are less interest sensitive than other market driven deposits. On December 31, 20072008 non-maturing deposit liabilities totaled $185.8$187.1 million, or 28.84%29.89%, of total interest-bearing liabilities. In a rising rate environment these deposit rates have historically lagged behind the changes in earning asset rates, thus mitigating the impact from the liability sensitivity position. The asset/liability model allows the Company to reflect the fact that non-maturing deposits are less rate sensitive than other deposits by using a decay rate. The decay rate is a type of artificial maturity that simulates maturities for non-maturing deposits over the number of months that more closely reflects historic data. Using the decay rate, the model reveals that the Company is slightly asset sensitive.
When the Company is liability sensitive, net interest income should decrease if interest rates rise since liabilities will reprice faster than assets. Conversely, if interest rates fall, net interest income should increase, depending on the optionality (prepayment speeds) of the assets. When the Company is asset sensitive, net interest income should rise if rates rise and should fall if rates fall.
The most likely scenario represents the rate environment as management forecasts it to occur. Management uses a “static” test to measure the effects of changes in interest rates on net interest income. This test assumes that management takes no steps to adjust the balance sheet to respond to the shock by repricing assets/liabilities, as discussed in the first paragraph of this section.
Under the rate environment forecasted by management, rate shocks in 50 to 100 basis point increments are applied to see the impact on the Company’s earnings. The rate shock model reveals that a 10050 basis point decrease in rates would cause an approximate 2.60% annual decrease in net income and a 200 basis point decrease in rates would cause an approximate 8.37%1.87% annual decrease in net income. The rate shock model reveals that a 100 basis point rise in rates would cause an approximate 2.10%3.11% annual increase in net income and that a 200 basis point rise in rates would cause an approximate 3.44%5.86% annual increase in net income.
– 18 –- 19 -
Interest Sensitivity
The following table reflects the earlier of the maturity or repricing data for various assets and liabilities.
TABLE III
INTEREST SENSITIVITY ANALYSIS
As of December 31, 2007 (in thousands) | Within 3 Months | 4-12 Months | 1-5 Years | Over 5 Years | Total | |||||||||||||||||||||||||||||
As of December 31, 2008 (in thousands) | Within 3 Months | 4-12 Months | 1-5 Years | Over 5 Years | Total | |||||||||||||||||||||||||||||
Uses of funds | ||||||||||||||||||||||||||||||||||
Federal funds sold | $ | 35,197 | $ | — | $ | — | $ | — | $ | 35,197 | $ | 17,814 | $ | — | $ | — | $ | — | $ | 17,814 | ||||||||||||||
Taxable investments | 23,492 | 22,997 | 59,525 | 981 | 106,995 | 8,913 | 20,252 | 55,308 | 921 | 85,394 | ||||||||||||||||||||||||
Tax-exempt investments | 1,894 | 4,853 | 11,124 | 7,094 | 24,965 | 500 | 2,104 | 8,474 | 3,583 | 14,661 | ||||||||||||||||||||||||
Total investments | 60,583 | 27,850 | 70,649 | 8,075 | 167,157 | 27,227 | 22,356 | 63,782 | 4,504 | 117,869 | ||||||||||||||||||||||||
Loans | ||||||||||||||||||||||||||||||||||
Commercial | 30,878 | 5,000 | 20,383 | 10,148 | 66,409 | 32,908 | 3,783 | 19,845 | 13,816 | 70,352 | ||||||||||||||||||||||||
Tax-exempt | 26 | — | — | 2,966 | 2,992 | — | — | — | 2,738 | 2,738 | ||||||||||||||||||||||||
Consumer | 3,448 | 2,205 | 34,807 | 11,452 | 51,912 | 2,468 | 2,580 | 26,982 | 8,760 | 40,790 | ||||||||||||||||||||||||
Real estate | 108,651 | 36,141 | 231,240 | 95,466 | 471,498 | 119,322 | 28,493 | 282,820 | 90,204 | 520,839 | ||||||||||||||||||||||||
Other | 1,755 | 365 | 1,684 | 529 | 4,333 | 1,373 | 547 | 312 | 501 | 2,733 | ||||||||||||||||||||||||
Total loans | 144,758 | 43,711 | 288,114 | 120,561 | 597,144 | 156,071 | 35,403 | 329,959 | 116,019 | 637,452 | ||||||||||||||||||||||||
Total earning assets | $ | 205,341 | $ | 71,561 | $ | 358,763 | $ | 128,636 | $ | 764,301 | $ | 183,298 | $ | 57,759 | $ | 393,741 | $ | 120,523 | $ | 755,321 | ||||||||||||||
Sources of funds | ||||||||||||||||||||||||||||||||||
Interest-bearing transaction accounts | $ | 12,051 | $ | — | $ | — | $ | — | $ | 12,051 | $ | 12,902 | $ | — | $ | — | $ | — | $ | 12,902 | ||||||||||||||
Money market deposit accounts | 137,364 | — | — | — | 137,364 | 135,791 | — | — | — | 135,791 | ||||||||||||||||||||||||
Savings accounts | 36,408 | — | — | — | 36,408 | 38,412 | — | — | — | 38,412 | ||||||||||||||||||||||||
Time deposits $100,000 or more | 26,549 | 70,468 | 21,599 | — | 118,616 | 32,591 | 69,934 | 25,237 | — | 127,762 | ||||||||||||||||||||||||
Other time deposits | 39,253 | 90,715 | 65,788 | — | 195,756 | 37,648 | 96,730 | 73,524 | — | 207,902 | ||||||||||||||||||||||||
Federal funds purchased, repurchase agreements and FHLB advances | 63,691 | 10,000 | 45,000 | 25,000 | 143,691 | |||||||||||||||||||||||||||||
Other borrowings | 534 | — | — | — | 534 | |||||||||||||||||||||||||||||
Federal funds purchased, repurchase agreements and other borrowings | 33,282 | — | — | — | 33,282 | |||||||||||||||||||||||||||||
FHLB advances | 70,000 | — | — | — | 70,000 | |||||||||||||||||||||||||||||
Total interest bearing liabilities | $ | 315,850 | $ | 171,183 | $ | 132,387 | $ | 25,000 | $ | 644,420 | $ | 360,626 | $ | 166,664 | $ | 98,761 | $ | — | $ | 626,051 | ||||||||||||||
Rate sensitivity GAP | $ | (110,509 | ) | $ | (99,622 | ) | $ | 226,376 | $ | 103,636 | $ | 119,881 | $ | (177,328 | ) | $ | (108,905 | ) | $ | 294,980 | $ | 120,523 | $ | 129,270 | ||||||||||
Cumulative GAP | $ | (110,509 | ) | $ | (210,131 | ) | $ | 16,244 | $ | 119,880 | $ | (177,328 | ) | $ | (286,233 | ) | $ | 8,747 | $ | 129,270 | ||||||||||||||
Provision for Loan Losses
The provision for loan losses is a charge against earnings necessary to maintain the allowance for loan losses at a level consistent with management’s evaluation of the loan portfolio.
The provision for loan losses was $2.4 million in 2008 as compared to $1.0 million in 2007 as compared toand $1.2 million in 2006 and $1.1 million in 2005.2006.
Loans that were charged off during 20072008 totaled $1.0$1.6 million compared to $1.0 million in 2007 and $1.2 million in 2006 and $1.3 million in 2005.2006. Recoveries amounted to $463 thousand in 2008, $381 thousand in 2007 and $331 thousand in 2006 and $370 thousand in 2005.2006. The Company’s net loans charged off to year-end loans were 0.18% in 2008, 0.11% in 2007, and 0.15% in 2006, and 0.20% in 2005.2006. The allowance for loan losses, as a percentage of year-end loans, was 1.00% in 2008, 0.86% in 2007, and 0.82% in 2006, and 0.90% in 2005.2006.
– 19 –
As of December 31, 2007,2008, nonperforming assets totaled $3.2$14.9 million, up from $1.5$3.2 million at year-end 2006.2007. The December 20072008 total consisted of $1.1$3.8 million of other real estate, $1.3$6.6 million in troubled debt restructured, debt, $623 thousand$3.5 million in loans still accruing interest but past due 90 days or more, and $84 thousand$1.0 million in nonaccrual loans. The $1.1$3.8 million of other real estate consisted of $165 thousand the following:
Other Real Estate Owned
(in commercial property originally acquired as a potential branch site and $955 thousand in foreclosed property. thousands)
Construction, land development, and other land | $ | 1,015 | |
1-4 family residential properties | 1,236 | ||
Nonfarm nonresidential properties | 1,500 | ||
Total | $ | 3,751 |
- 20 -
Loans still accruing interest but past due 90 days or more decreasedincreased to $3.5 million as of December 31, 2008 compared to $623 thousand as of December 31, 2007 compared to $826 thousand as of December 31, 2006.2007. Although nonperforming assets as of December 31, 20072008 were approximately $1.7$11.7 million higher than December 31, 2006, $1.32007, $5.3 million of this amountincrease is due to restructured debt.an increase in troubled debt restructured.
Impaired loans increased to $9.3$12.9 million from $3.1$8.0 million as of December 31, 20062007 as detailed in Note 4 of the Notes to Consolidated Financial Statements included in Item 8, “Financial Statements and Supplemental Data” of this report on Form 10-K. The increase is attributed to the fact that management was more aggressive in its approach to separate the identification of impaired loans as described by SFAS No. 114. As shown in Note 4, the majority of these loans are collateralized.
Noninterest Income
Noninterest income increased $1.1 million,$236 thousand, or 9.46%1.89%, in 20072008 from 20062007 compared to an increase of $1.0$1.1 million, or 10.04%9.55%, in 20062007 from 2005. The majority of the growth in noninterest income was attributed to fiduciary income and increases in service charges on deposit accounts. $447 thousand of the growth in noninterest income was attributed to income2006. Income from fiduciary activities aswas down slightly. The gain on disposal of premises and equipment is primarily attributed to a result$230 thousand gain on the sale of a fee increase and growthBank building that was no longer needed. The reduction in new business. The majorityother operating income is attributed to the closing of the $334 thousandCompany’s in-house brokered mortgage department at the Bank in the fall of the increase in service charges on deposit accounts is related to lower charge offs of nonsufficient fund charges assessed on demand deposit accounts and higher income from nonsufficient funds charges.2007.
Noninterest Expenses
Noninterest expenses increased by only $842$2.4 million, or 9.04%, in 2008 over 2007 after increasing $850 thousand, or 3.34%3.38%, in 2007 over 2006 after increasing $1.62006. $1.1 million or 6.77%, in 2006 over 2005. The majority of this increase was in the category of salaries and employee benefits which increased by 4.86%6.97%. This increase is due to annual salary increases and an increase of 421 full-time equivalent employees over 2007.
Occupancy and equipment expense increased $263 thousand, or 7.23%, over 2007. The increase is related to the Hilltop Branch that was opened in full time equivalents over 2006.January 2008.
The $428 thousand loss on write down of other real estate owned consists of two items. During the fourth quarter of 2008 the Company had a one-time write-off consisting of $165 thousand for an undeveloped branch site as well as the establishment of a $263 thousand valuation reserve for foreclosed property currently held as other real estate owned.
The remaining increase in noninterest expense is attributed to data processing, advertising, customer development and other costs. The majority of the data processing increase is related to increased debit card and ATM interchange costs and providing key employees with data processing devices that allow them access to their email when they are not in the office. Most of the increase in marketing and customer development costs can be attributed to the grand opening of the Hilltop Branch, the initiation of a contract related to ATMs in a chain of drug stores throughout Hampton Roads and higher contributions to non-profit organizations. Increases in foreclosed property and repossessed asset expense, FDIC insurance costs, courier expense, Federal Reserve costs and director fees account for the majority of the increase in the category titled Other.
Balance Sheet Review
At December 31, 2007,2008, the Company had total assets of $822.6$835.0 million, a decreasean increase of 2.95%1.51% from $847.5$822.6 million at December 31, 2006.2007. Net loans as of December 31, 20072008 were $592.0$631.0 million, an increase of 2.28%6.59% from $578.8$592.0 million at December 31, 2006.2007.
Total investment securities at December 31, 20072008 were $132.0$104.8 million, a decrease of 29.90%20.48% from $188.2$131.8 million on December 31, 2006.2007. The Company’s goal is to provide maximum return on the investment portfolio within the framework of its asset/liability objectives. The objectives include managing interest sensitivity, liquidity and pledging requirements.
During 2008, as in 2007, one of the Company’s strategic goals was to restructure the balance sheet in order to improve the net interest margin. At the Bank, $93.2 million in government agency securities matured in 2007. AsThe use of December 31, 2006, these securities had an average annual yieldproceeds from maturing lower-yielding investments to fund loan growth was part of 3.16%.
this strategy. In addition, the Bank had $125.0 million in FHLB advances outstanding as of December 31, 2006 with an average annual yield of 4.81%. During 2007,during 2008, the Company used funds from the low yieldinglow-yielding maturing securities to pay down its higher cost FHLB advances or to invest in higher yielding loans or securities. During 2007 the Company reduced$10.0 million of its FHLB advances by $45.0 million.advances.
At December 31, 2007,2008, total deposits increased to $596.2$646.5 million, an increase of 1.32%8.45% from $588.4$596.2 million on December 31, 2006.2007. Noninterest-bearing deposits decreased $683 thousand,increased $27.8 million or 0.71%28.95% at year-end 20072008 over 2006. 2007.
- 21 -
Savings and time deposits increased $8.4$22.6 million, or 1.72%4.51% in 20072008 over 2006. Several2007. In 2008, the Bank joined the Certificate of Deposit Account Registry Service network (CDARS), a service that allows member banks to share FDIC insurance coverage for their customers. As a result, a customer’s deposit is fully FDIC-insured up to $50.0 million. Only certificates of deposit can be placed through CDARS; all other account types are ineligible. Also in 2008, the Bank introduced new time deposit products were introduced in 2007 that offered a choice of higher rates or special features. Management’s goal for 2008 is to reverse the downward trend of noninterest-bearing deposits as these funds provide a low cost source of funds for our lending divisions.attract additional deposits.
– 20 –
Investment Portfolio
The following table sets forth a summary of the investment portfolio:
TABLE IV
INVESTMENT PORTFOLIO
As of December 31, | 2007 | 2006 | 2005 | 2008 | 2007 | 2006 | ||||||||||||
| (in thousands) | (in thousands) | |||||||||||||||||
Available-for-sale securities, at fair value: | ||||||||||||||||||
United States Treasury securities | $ | 988 | $ | 981 | $ | 985 | ||||||||||||
U.S. Treasury securities | $ | 400 | $ | 988 | $ | 981 | ||||||||||||
Obligations of U.S. Government agencies | 95,711 | 146,086 | 150,392 | 78,112 | 95,711 | 146,086 | ||||||||||||
Obligations of state and political subdivisions | 25,341 | 29,615 | 35,583 | 15,115 | 25,341 | 29,615 | ||||||||||||
Mortgage-backed securities | 2,453 | — | — | |||||||||||||||
Money market investments | 1,604 | 721 | 686 | 908 | 1,604 | 721 | ||||||||||||
Federal Home Loan Bank stock - restricted | 5,115 | 7,094 | 4,963 | |||||||||||||||
Federal Reserve Bank stock - restricted | 169 | 169 | 169 | |||||||||||||||
Other marketable equity securities | 128 | 140 | 165 | — | 9 | 22 | ||||||||||||
| $ | 129,056 | $ | 184,806 | $ | 192,943 | $ | 96,988 | $ | 123,653 | $ | 177,425 | |||||||
Held-to-maturity securities, at cost: | ||||||||||||||||||
Obligations of U.S. Government agencies | $ | 2,300 | $ | 2,700 | $ | 2,300 | $ | 2,600 | $ | 2,300 | $ | 2,700 | ||||||
Obligations of state and political subdivisions | 604 | 732 | 823 | 467 | 604 | 732 | ||||||||||||
| $ | 2,904 | $ | 3,432 | $ | 3,123 | $ | 3,067 | $ | 2,904 | $ | 3,432 | |||||||
Restricted securities: | ||||||||||||||||||
Federal Home Loan Bank stock | 4,622 | 5,115 | 7,094 | |||||||||||||||
Federal Reserve Bank stock | 169 | 169 | 169 | |||||||||||||||
| $ | 4,791 | $ | 5,284 | $ | 7,263 | |||||||||||||
Total | $ | 131,960 | $ | 188,238 | $ | 196,066 | $ | 104,846 | $ | 131,841 | $ | 188,120 | ||||||
– 21 –- 22 -
The following table summarizes the contractual maturity of the investment portfolio and their weighted average yields as of December 31, 2007:2008:
| 1 year or less | 1-5 years | 5-10 years | Over 10 years | Total | 1 year or less | 1-5 years | 5-10 years | Over 10 years | Total | |||||||||||||||||||||||||||||||
| (in thousands) | (in thousands) | |||||||||||||||||||||||||||||||||||||||
United States Treasury securities | $ | 988 | $ | — | $ | — | $ | — | $ | 988 | ||||||||||||||||||||||||||||||
U.S. Treasury securities | $ | 400 | $ | — | $ | — | $ | — | $ | 400 | ||||||||||||||||||||||||||||||
Weighted average yield | 3.74 | % | — | — | — | 3.74 | % | 0.99 | % | — | — | — | 0.99 | % | ||||||||||||||||||||||||||
Obligations of U.S. Government agencies | $ | 38,487 | $ | 59,524 | $ | — | $ | — | $ | 98,011 | $ | 27,857 | $ | 52,855 | $ | — | $ | — | $ | 80,712 | ||||||||||||||||||||
Weighted average yield | 3.65 | % | 5.01 | % | — | — | 4.48 | % | 3.05 | % | 3.57 | % | — | — | 3.39 | % | ||||||||||||||||||||||||
Obligations of state and political subdivisions | $ | 6,747 | $ | 11,123 | $ | 7,094 | $ | 981 | $ | 25,945 | $ | 2,604 | $ | 8,474 | $ | 3,583 | $ | 921 | $ | 15,582 | ||||||||||||||||||||
Weighted average yield | 4.65 | % | 4.61 | % | 4.58 | % | 6.37 | % | 4.72 | % | ||||||||||||||||||||||||||||||
Mortgage-backed securities | $ | — | $ | 2,453 | $ | — | $ | — | $ | 2,453 | ||||||||||||||||||||||||||||||
Weighted average yield | 4.68 | % | 4.46 | % | 4.70 | % | — | 4.65 | % | — | 3.87 | % | — | — | 3.87 | % | ||||||||||||||||||||||||
Money market investments | $ | 1,604 | $ | — | $ | — | $ | — | $ | 1,604 | $ | 908 | $ | — | $ | — | $ | — | $ | 908 | ||||||||||||||||||||
Weighted average yield | 2.60 | % | — | — | — | 2.60 | % | 3.55 | % | — | — | — | 3.55 | % | ||||||||||||||||||||||||||
Federal Home Loan Bank stock - restricted | $ | — | $ | — | $ | — | $ | 5,115 | $ | 5,115 | $ | — | $ | — | $ | — | $ | 4,622 | $ | 4,622 | ||||||||||||||||||||
Weighted average yield | — | — | — | 6.90 | % | 6.90 | % | — | — | — | 4.14 | % | 4.14 | % | ||||||||||||||||||||||||||
Federal Reserve Bank stock - restricted | $ | — | $ | — | $ | — | $ | 169 | $ | 169 | $ | — | $ | — | $ | — | $ | 169 | $ | 169 | ||||||||||||||||||||
Weighted average yield | — | — | — | 6.00 | % | 6.00 | % | — | — | — | 6.00 | % | 6.00 | % | ||||||||||||||||||||||||||
Other marketable equity securities | $ | — | $ | — | $ | — | $ | 128 | $ | 128 | ||||||||||||||||||||||||||||||
Weighted average yield | — | — | — | 30.73 | % | 30.73 | % | |||||||||||||||||||||||||||||||||
Total securities | $ | 47,826 | $ | 70,647 | $ | 7,094 | $ | 6,393 | $ | 131,960 | $ | 31,769 | $ | 63,782 | $ | 3,583 | $ | 5,712 | $ | 104,846 | ||||||||||||||||||||
Weighted average yield | 3.77 | % | 4.92 | % | 4.70 | % | 6.30 | % | 4.56 | % | 3.17 | % | 3.72 | % | 4.58 | % | 4.56 | % | 3.63 | % | ||||||||||||||||||||
Yields are calculated on a fully tax equivalenttax-equivalent basis using a 34% rate.
Loan Portfolio
The following table shows a breakdown of total loans by type at December 31 for years 20032004 through 2007:2008:
TABLE V
LOAN PORTFOLIO
As of December 31, | 2007 | 2006 | 2005 | 2004 | 2003 | ||||||||||
| (in thousands) | |||||||||||||||
Commercial and other | $ | 70,741 | $ | 67,697 | $ | 63,224 | $ | 56,231 | $ | 53,711 | |||||
Real estate construction | 56,007 | 81,227 | 36,517 | 44,228 | 32,844 | ||||||||||
Real estate mortgage | 415,492 | 367,808 | 325,677 | 263,096 | 241,868 | ||||||||||
Tax exempt | 2,992 | 3,191 | 2,376 | 2,568 | 2,844 | ||||||||||
Installment loans to individuals | 51,912 | 63,670 | 66,903 | 67,130 | 73,844 | ||||||||||
Total | $ | 597,144 | $ | 583,593 | $ | 494,697 | $ | 433,253 | $ | 405,111 | |||||
– 22 –
As of December 31, | 2008 | 2007 | 2006 | 2005 | 2004 | ||||||||||
| (in thousands) | |||||||||||||||
Commercial and other | $ | 73,086 | $ | 70,741 | $ | 67,697 | $ | 63,224 | $ | 56,231 | |||||
Real estate construction | 60,604 | 56,007 | 81,227 | 36,517 | 44,228 | ||||||||||
Real estate mortgage | 460,235 | 415,492 | 367,808 | 325,677 | 263,096 | ||||||||||
Tax exempt | 2,738 | 2,992 | 3,191 | 2,376 | 2,568 | ||||||||||
Installment loans to individuals | 40,789 | 51,912 | 63,670 | 66,903 | 67,130 | ||||||||||
Total | $ | 637,452 | $ | 597,144 | $ | 583,593 | $ | 494,697 | $ | 433,253 | |||||
Based on Standardthe North American Industry Code,Classification System code, there are no categories of loans that exceed 10% of total loans other than the categories disclosed in the preceding table.
- 23 -
The maturity distribution and rate sensitivity of certain categories of the Bank’s loan portfolio at December 31, 20072008 is presented below:
TABLE VI
MATURITY SCHEDULE OF SELECTED LOANS
December 31, 2007 | Within 1 year | 1 to 5 years | After 5 years | Total | ||||||||||||||||||||
December 31, 2008 | Within 1 year | 1 to 5 years | After 5 years | Total | ||||||||||||||||||||
| (in thousands) | (in thousands) | |||||||||||||||||||||||
Commercial and other | $ | 36,634 | $ | 23,430 | $ | 10,677 | $ | 70,741 | $ | 38,366 | $ | 20,402 | $ | 14,318 | $ | 73,086 | ||||||||
Real estate construction | 42,814 | 13,192 | 1 | 56,007 | 50,683 | 9,921 | — | 60,604 | ||||||||||||||||
Total | $ | 79,448 | $ | 36,622 | $ | 10,678 | $ | 126,748 | $ | 89,049 | $ | 30,323 | $ | 14,318 | $ | 133,690 | ||||||||
Loans due after 1 year with: | ||||||||||||||||||||||||
Fixed interest rate | $ | — | $ | 33,086 | $ | 10,678 | $ | 43,764 | $ | — | $ | 28,722 | $ | 14,318 | $ | 43,040 | ||||||||
Variable interest rate | $ | — | $ | 3,536 | $ | — | $ | 3,536 | $ | — | $ | 1,601 | $ | — | $ | 1,601 | ||||||||
The following table presents information concerning the aggregate amount of nonaccrual, past due loans and troubled debt restructured loans as of December 31 for the years 20032004 through 2007:2008:
TABLE VII
NONACCRUAL, PAST DUE AND TROUBLED DEBT RESTRUCTURED LOANS
As of December 31, | 2007 | 2006 | 2005 | 2004 | 2003 | 2008 | 2007 | 2006 | 2005 | 2004 | ||||||||||||||||||||
| (in thousands) | (in thousands) | |||||||||||||||||||||||||||||
Nonaccrual loans | $ | 84 | $ | 458 | $ | 308 | $ | 402 | $ | 243 | $ | 1,045 | $ | 84 | $ | 458 | $ | 308 | $ | 402 | ||||||||||
Loans past due 90 days or more and accruing interest | 623 | 826 | 935 | 1,122 | 736 | 3,529 | 623 | 826 | 935 | 1,122 | ||||||||||||||||||||
Restructured loans | 1,321 | — | — | 1,806 | — | |||||||||||||||||||||||||
Troubled debt restructured | 6,594 | 1,321 | — | — | 1,806 | |||||||||||||||||||||||||
Interest income that would have been recorded under original loan terms | 79 | 38 | 66 | 42 | 34 | 244 | 79 | 38 | 66 | 42 | ||||||||||||||||||||
Interest income recorded for the period | 105 | 24 | 35 | 35 | 12 | 185 | 105 | 24 | 35 | 35 | ||||||||||||||||||||
Loans are placed in nonaccrual status if principal or interest has been in default for a period of 90 days or more unless the obligation is both well secured and in the process of collection. A debt is “well secured” if it is secured (i) by collateral in the form of liens on or pledges of real or personal property, including securities, that have a realizable value sufficient to discharge the debt in full or (ii) by the guaranty of a financially responsible party. A debt is “in the process of collection” if collection of the debt is proceeding in due course either through legal action, including judgment enforcement procedures, or, in appropriate circumstances, through collection efforts not involving legal action which are reasonably expected to result in repayment of the debt or in its restoration to a current status.
Potential problem loans consist of loans that, because of potential credit problems of the borrowers, have caused management to have serious doubts as to the ability of such borrowers to comply with the loan repayment terms. At December 31, 20072008 such problem loans, not included in Table VII, amounted to approximately $9.1$4.8 million.
– 23 –
Summary of Loan Loss Experience
The determination of the balance of the Allowance for Loan Losses is based upon a review and analysis of the loan portfolio and reflects an amount which, in management’s judgment, is adequate to provide for possible future losses. Management’s review includes monthly analysis of past due and nonaccrual loans and detailed periodic loan by loan analyses.
- 24 -
The principal factors considered by management in determining the adequacy of the allowance are the growth and composition of the loan portfolio, historical loss experience, the level of nonperforming loans, economic conditions, the value and adequacy of collateral, and the current level of the allowance.
– 24 –
The following table shows an analysis of the Allowance for Loan Losses for the years 20032004 through 2007:2008:
TABLE VIII
ANALYSIS OF THE ALLOWANCE FOR LOAN LOSSES
As of December 31, | 2007 | 2006 | 2005 | 2004 | 2003 | |||||||||||||||
| (in thousands) | ||||||||||||||||||||
Balance at the beginning of period | $ | 4,784 | $ | 4,448 | $ | 4,303 | $ | 4,832 | $ | 4,565 | ||||||||||
Charge-offs: | ||||||||||||||||||||
Commercial, financial and agricultural | 87 | 223 | 76 | 468 | 149 | |||||||||||||||
Real estate construction | — | — | — | 4 | — | |||||||||||||||
Real estate mortgage | 71 | 69 | 108 | 327 | 244 | |||||||||||||||
Consumer loans | 501 | 558 | 584 | 702 | 802 | |||||||||||||||
Other loans | 376 | 345 | 507 | 229 | — | |||||||||||||||
Total charge-offs | 1,035 | 1,195 | 1,275 | 1,730 | 1,195 | |||||||||||||||
Recoveries: | ||||||||||||||||||||
Commercial, financial and agricultural | 23 | 49 | 21 | 29 | 219 | |||||||||||||||
Real estate mortgage | 89 | 6 | 9 | 36 | 6 | |||||||||||||||
Consumer loans | 126 | 138 | 230 | 220 | 237 | |||||||||||||||
Other loans | 143 | 138 | 110 | 66 | — | |||||||||||||||
Total recoveries | 381 | 331 | 370 | 351 | 462 | |||||||||||||||
Net charge-offs | 654 | 864 | 905 | 1,379 | 733 | |||||||||||||||
Additions charged to operations | 1,000 | 1,200 | 1,050 | 850 | 1,000 | |||||||||||||||
Balance at end of period | $ | 5,130 | $ | 4,784 | $ | 4,448 | $ | 4,303 | $ | 4,832 | ||||||||||
Selected loan loss statistics | ||||||||||||||||||||
Loans (net of unearned income): | ||||||||||||||||||||
End of period balance | $ | 597,144 | $ | 583,593 | $ | 494,697 | $ | 433,253 | $ | 405,111 | ||||||||||
Average balance | $ | 587,645 | $ | 543,136 | $ | 450,053 | $ | 418,781 | $ | 387,137 | ||||||||||
Net charge-offs to average total loans | 0.11 | % | 0.16 | % | 0.20 | % | 0.32 | % | 0.19 | % | ||||||||||
Provision for loan losses to average total loans | 0.17 | % | 0.22 | % | 0.23 | % | 0.20 | % | 0.26 | % | ||||||||||
Provision for loan losses to net charge-offs | 152.91 | % | 138.89 | % | 116.02 | % | 61.64 | % | 136.43 | % | ||||||||||
Allowance for loan losses to period end loans | 0.86 | % | 0.82 | % | 0.90 | % | 0.99 | % | 1.19 | % | ||||||||||
Earnings to loan loss coverage* | 18.56 | 12.54 | 12.10 | 9.17 | 15.55 | |||||||||||||||
As of December 31, | 2008 | 2007 | 2006 | 2005 | 2004 | |||||||||||||||
| (in thousands) | ||||||||||||||||||||
Balance at the beginning of period | $ | 5,130 | $ | 4,784 | $ | 4,448 | $ | 4,303 | $ | 4,832 | ||||||||||
Charge-offs: | ||||||||||||||||||||
Commercial, financial and agricultural | 190 | 87 | 223 | 76 | 468 | |||||||||||||||
Real estate construction | — | — | — | — | 4 | |||||||||||||||
Real estate mortgage | 401 | 71 | 69 | 108 | 327 | |||||||||||||||
Consumer loans | 649 | 501 | 558 | 584 | 702 | |||||||||||||||
Other loans | 347 | 376 | 345 | 507 | 229 | |||||||||||||||
Total charge-offs | 1,587 | 1,035 | 1,195 | 1,275 | 1,730 | |||||||||||||||
Recoveries: | ||||||||||||||||||||
Commercial, financial and agricultural | 118 | 23 | 49 | 21 | 29 | |||||||||||||||
Real estate mortgage | 6 | 89 | 6 | 9 | 36 | |||||||||||||||
Consumer loans | 183 | 126 | 138 | 230 | 220 | |||||||||||||||
Other loans | 156 | 143 | 138 | 110 | 66 | |||||||||||||||
Total recoveries | 463 | 381 | 331 | 370 | 351 | |||||||||||||||
Net charge-offs | 1,124 | 654 | 864 | 905 | 1,379 | |||||||||||||||
Provision for loan loss | 2,400 | 1,000 | 1,200 | 1,050 | 850 | |||||||||||||||
Balance at end of period | $ | 6,406 | $ | 5,130 | $ | 4,784 | $ | 4,448 | $ | 4,303 | ||||||||||
Selected loan loss statistics | ||||||||||||||||||||
Loans (net of unearned income): | ||||||||||||||||||||
End of period balance | $ | 637,452 | $ | 597,144 | $ | 583,593 | $ | 494,697 | $ | 433,253 | ||||||||||
Average balance | $ | 622,883 | $ | 587,645 | $ | 543,136 | $ | 450,053 | $ | 418,781 | ||||||||||
Net charge-offs to average total loans | 0.18 | % | 0.11 | % | 0.16 | % | 0.20 | % | 0.32 | % | ||||||||||
Provision for loan losses to average total loans | 0.39 | % | 0.17 | % | 0.22 | % | 0.23 | % | 0.20 | % | ||||||||||
Provision for loan losses to net charge-offs | 213.52 | % | 152.91 | % | 138.89 | % | 116.02 | % | 61.64 | % | ||||||||||
Allowance for loan losses to period end loans | 1.00 | % | 0.86 | % | 0.82 | % | 0.90 | % | 0.99 | % | ||||||||||
Earnings to loan loss coverage* | 10.53 | 18.56 | 12.54 | 12.10 | 9.17 | |||||||||||||||
| ||||||||||||||||||||
* Income before taxes plus provision for loan losses, divided by net charge-offs. |
| |||||||||||||||||||
–- 25 –-
The following table shows the amount of the Allowance for Loan Losses (ALL) allocated to each category at December 31 for the years 20032004 through 2007.2008. Although the ALL is allocated into these categories, the entire ALL is available to cover loan losses in any category. For example, if real estate construction loans experienced losses of $74$40 thousand, the ALL could handle these losses even though only $67$31 thousand is allocated to that category.
TABLE IX
ALLOCATION OF THE ALLOWANCE FOR LOAN LOSSES
As of December 31, | 2007 | 2006 | 2005 | 2004 | 2003 | 2008 | 2007 | 2006 | 2005 | 2004 | ||||||||||||||||||||||||||||||||||||||||||||||||||
| Amount | Percent of loans to Total Loans | Amount | Percent of loans to Total Loans | Amount | Percent of loans to Total Loans | Amount | Percent of loans to Total Loans | Amount | Percent of loans to Total Loans | Amount | Percent of loans to Total Loans | Amount | Percent of loans to Total Loans | Amount | Percent of loans to Total Loans | Amount | Percent of loans to Total Loans | Amount | Percent of loans to Total Loans | |||||||||||||||||||||||||||||||||||||||||
| (in thousands) | (in thousands) | |||||||||||||||||||||||||||||||||||||||||||||||||||||||||||
Commercial and other | 1,305 | 12.6 | % | 1,668 | 12.2 | % | 1,426 | 13.3 | % | 1,207 | 13.6 | % | 1,032 | 14.0 | % | 1,467 | 11.9 | % | 1,305 | 12.6 | % | 1,668 | 12.2 | % | 1,426 | 13.3 | % | 1,207 | 13.6 | % | ||||||||||||||||||||||||||||||
Real Estate Construction | 67 | 9.4 | % | 55 | 13.9 | % | 31 | 7.4 | % | 18 | 10.2 | % | 106 | 8.1 | % | |||||||||||||||||||||||||||||||||||||||||||||
Real Estate Mortgage | 3,116 | 69.4 | % | 2,398 | 63.0 | % | 2,224 | 65.8 | % | 1,957 | 60.7 | % | 743 | 59.7 | % | |||||||||||||||||||||||||||||||||||||||||||||
Real estate construction | 31 | 9.5 | % | 67 | 9.4 | % | 55 | 13.9 | % | 31 | 7.4 | % | 18 | 10.2 | % | |||||||||||||||||||||||||||||||||||||||||||||
Real estate mortgage | 4,318 | 72.2 | % | 3,116 | 69.4 | % | 2,398 | 63.0 | % | 2,224 | 65.8 | % | 1,957 | 60.7 | % | |||||||||||||||||||||||||||||||||||||||||||||
Consumer | 642 | 8.7 | % | 663 | 10.9 | % | 767 | 13.5 | % | 1,014 | 15.5 | % | 777 | 18.2 | % | 590 | 6.4 | % | 642 | 8.7 | % | 663 | 10.9 | % | 767 | 13.5 | % | 1,014 | 15.5 | % | ||||||||||||||||||||||||||||||
Unallocated | N/A | N/A | N/A | N/A | N/A | N/A | 107 | N/A | 2,174 | N/A | N/A | N/A | N/A | N/A | N/A | N/A | N/A | N/A | 107 | N/A | ||||||||||||||||||||||||||||||||||||||||
Total | $ | 5,130 | 100.0 | % | $ | 4,784 | 100.0 | % | $ | 4,448 | 100.0 | % | $ | 4,303 | 100.0 | % | $ | 4,832 | 100.0 | % | $ | 6,406 | 100.0 | % | $ | 5,130 | 100.0 | % | $ | 4,784 | 100.0 | % | $ | 4,448 | 100.0 | % | $ | 4,303 | 100.0 | % | ||||||||||||||||||||
Deposits
The following table shows the average balances and average rates paid on deposits for the years ended December 31, 2008, 2007 2006 and 2005.2006.
TABLE X
DEPOSITS
Years ended December 31, | 2007 | 2006 | 2005 | 2008 | 2007 | 2006 | ||||||||||||||||||||||||||||||
| Average Balance | Average Rate | Average Balance | Average Rate | Average Balance | Average Rate | Average Balance | Average Rate | Average Balance | Average Rate | Average Balance | Average Rate | |||||||||||||||||||||||||
| (in thousands) | (in thousands) | |||||||||||||||||||||||||||||||||||
Interest-bearing transaction accounts | $ | 10,658 | 0.25 | % | $ | 9,210 | 0.26 | % | $ | 8,360 | 0.26 | % | $ | 10,271 | 0.14 | % | $ | 10,658 | 0.25 | % | $ | 9,210 | 0.26 | % | ||||||||||||
Money market deposit accounts | 149,518 | 1.52 | % | 150,950 | 1.37 | % | 144,655 | 0.83 | % | 139,109 | 0.70 | % | 149,518 | 1.52 | % | 150,950 | 1.37 | % | ||||||||||||||||||
Savings accounts | 38,698 | 0.51 | % | 40,612 | 0.50 | % | 42,559 | 0.50 | % | 37,832 | 0.27 | % | 38,698 | 0.51 | % | 40,612 | 0.50 | % | ||||||||||||||||||
Time deposits, $100,000 or more | 111,650 | 4.91 | % | 106,227 | 3.83 | % | 79,321 | 2.98 | % | 122,666 | 3.89 | % | 111,650 | 4.91 | % | 106,227 | 3.83 | % | ||||||||||||||||||
Other time deposits | 187,198 | 4.52 | % | 157,133 | 4.41 | % | 141,526 | 3.26 | % | 203,208 | 4.06 | % | 187,198 | 4.52 | % | 157,133 | 4.41 | % | ||||||||||||||||||
Total interest-bearing deposits | 497,722 | 3.31 | % | 464,132 | 2.86 | % | 416,421 | 2.02 | % | 513,086 | 2.75 | % | 497,722 | 3.31 | % | 464,132 | 2.86 | % | ||||||||||||||||||
Demand deposits | 96,475 | 98,622 | 102,722 | 104,954 | 96,475 | 98,622 | ||||||||||||||||||||||||||||||
Total deposits | $ | 594,197 | $ | 562,754 | $ | 519,143 | $ | 618,040 | $ | 594,197 | $ | 562,754 | ||||||||||||||||||||||||
–- 26 –-
The following table shows time deposits in amounts of $100,000 or more as of December 31, 2008, 2007 2006, and 20052006 by time remaining until maturity.
TABLE XI
TIME DEPOSITS OF $100,000 OR MORE
As of December 31, | 2007 | 2006 | 2005 | 2008 | 2007 | 2006 | ||||||||||||
| (in thousands) | (in thousands) | |||||||||||||||||
Maturing in: | ||||||||||||||||||
3 months or less | $ | 43,827 | $ | 34,561 | $ | 23,647 | $ | 31,675 | $ | 43,827 | $ | 34,561 | ||||||
3 through 6 months | 27,797 | 19,826 | 10,537 | 30,987 | 27,797 | 19,826 | ||||||||||||
6 through 12 months | 24,525 | 26,779 | 16,438 | 39,147 | 24,525 | 26,779 | ||||||||||||
Greater than 12 months | 22,467 | 26,523 | 30,000 | 25,953 | 22,467 | 26,523 | ||||||||||||
| $ | 118,616 | $ | 107,689 | $ | 80,622 | $ | 127,762 | $ | 118,616 | $ | 107,689 | |||||||
Return on Equity and Assets
The return on average stockholders’ equity and assets, the dividend pay-out ratio, and the average equity to average assets ratio for the past three years are presented below.
As of December 31, | 2007 | 2006 | 2005 | |||||||||||||||
Years Ended December 31, | 2008 | 2007 | 2006 | |||||||||||||||
Return on average assets | 0.97 | % | 0.88 | % | 1.03 | % | 0.82 | % | 0.97 | % | 0.88 | % | ||||||
Return on average equity | 10.29 | % | 9.68 | % | 10.31 | % | 8.26 | % | 10.29 | % | 9.68 | % | ||||||
Dividend pay-out ratio | 37.78 | % | 39.76 | % | 36.47 | % | 47.66 | % | 37.78 | % | 39.76 | % | ||||||
Average equity to average assets | 9.39 | % | 9.13 | % | 9.98 | % | 9.87 | % | 9.39 | % | 9.13 | % | ||||||
Capital Resources
Total stockholders’ equity as of December 31, 20072008 was $79.7$82.9 million, up 6.75%4.00% from $74.7$79.7 million on December 31, 2006.2007. The Company’s capital position remains strong as evidenced by the regulatory capital measurements. Under the banking regulations, Total Capital is composed of core capital (Tier 1) and supplemental capital (Tier 2). Tier 1 capital consists of common stockholders’ equity less goodwill. Tier 2 capital consists of certain qualifying debt and a qualifying portion of the allowance for loan losses. The following is a summary of the Company’s capital ratios for 2008, 2007 2006 and 2005.2006. As shown below, these ratios were all well above the regulatory minimum levels.
| 2007 Regulatory Minimums | 2007 | 2006 | 2005 | 2008 Regulatory Minimums | 2008 | 2007 | 2006 | ||||||||||||||||
Tier 1 | 4.00% | 12.64 | % | 12.41 | % | 13.79 | % | 4.00 | % | 12.48 | % | 12.64 | % | 12.41 | % | ||||||||
Total Capital | 8.00% | 13.45 | % | 13.18 | % | 14.62 | % | 8.00 | % | 13.44 | % | 13.45 | % | 13.18 | % | ||||||||
Tier 1 Leverage | 3.00% | 9.67 | % | 9.19 | % | 9.98 | % | 4.00 | % | 10.00 | % | 9.67 | % | 9.19 | % | ||||||||
Year-end book value was $16.90 in 2008 and $16.24 in 2007 and $14.96 in 2006.2007. Cash dividends were $3.2 million, or $0.66 per share in 2008 and $3.0 million, or $0.61 per share in 2007 and $2.8 million, or $0.56 per share in 2006.2007. The common stock of the Company has not been extensively traded. The table below shows the high and low sales prices for each quarter of 20072008 and 2006.2007. The stock is quoted on the NASDAQ Capital Market under the symbol “OPOF” and the prices below are based on trade information as reported by The NASDAQ Stock Market, LLC. There were 1,2451,233 stockholders of record of the Company as of December 31, 2007.2008. This stockholder count does not include stockholders who hold their stock in a nominee registration.
–- 27 –-
The following is a summary of the quarterly dividends paid and high and low market prices on Old Point Financial Corporation common stock for 20072008 and 2006.2007. The share data is adjusted to reflect the 5 for 4 stock split in the form of a dividend declared on August 16, 2007 and paid on October 1, 2007.
| 2007 | 2006 | 2008 | 2007 | |||||||||||||||||||||||||||||||||
| Market Price | Market Price | Dividend | Market Price | Dividend | Market Price | |||||||||||||||||||||||||||||||
| Dividend | High | Low | Dividend | High | Low | High | Low | High | Low | |||||||||||||||||||||||||||
1st Quarter | $ | 0.14 | $ | 23.16 | $ | 21.20 | $ | 0.14 | $ | 23.60 | $ | 22.16 | $ | 0.16 | $ | 20.95 | $ | 16.43 | $ | 0.14 | $ | 23.16 | $ | 21.20 | ||||||||||||
2nd Quarter | $ | 0.15 | $ | 22.38 | $ | 20.40 | $ | 0.14 | $ | 24.00 | $ | 22.42 | $ | 0.16 | $ | 19.03 | $ | 16.25 | $ | 0.15 | $ | 22.38 | $ | 20.40 | ||||||||||||
3rd Quarter | $ | 0.16 | $ | 21.00 | $ | 16.78 | $ | 0.14 | $ | 23.57 | $ | 21.61 | $ | 0.17 | $ | 22.00 | $ | 16.00 | $ | 0.16 | $ | 21.00 | $ | 16.78 | ||||||||||||
4th Quarter | $ | 0.16 | $ | 20.47 | $ | 17.43 | $ | 0.14 | $ | 23.80 | $ | 22.57 | $ | 0.17 | $ | 20.99 | $ | 16.05 | $ | 0.16 | $ | 20.47 | $ | 17.43 | ||||||||||||
Liquidity
Liquidity is the ability of the Company to meet present and future financial obligations through either the sale or maturity of existing assets or the acquisition of additional funds through liability management. Liquid assets include cash, interest-bearing deposits with banks, federal funds sold, investments in securities and loans maturing within one year.
In addition, secondary sources are available through the use of borrowed funds if the need should arise. The Company’s sources of funds include a large stable deposit base and secured advances from the FHLB. As of December 31, 2007,2008, the Company had $165.4$179.2 million in FHLB borrowing availability. The Company has available short-term unsecured borrowed funds in the form of federal funds with correspondent banks. As of year-end 2007,2008, the Company had $40.0 million available in federal funds to handle any short-term borrowing needs.
As a result of the Company’s management of liquid assets, availability of borrowed funds and the ability to generate liquidity through liability funding, management believes that the Company maintains overall liquidity sufficient to satisfy its depositors’ requirements and to meet its customers’ future borrowing needs.
The following table sets forth information relating to the Company’s sources of liquidity and the outstanding commitments for use of liquidity at December 31, 20072008 and December 31, 2006.2007. Dividing the total sources of liquidity by the outstanding commitments for use of liquidity derives the liquidity coverage ratio.
LIQUIDITY SOURCES AND USES
(in thousands)
| December 31, 2007 | December 31, 2006 | December 31, 2008 | December 31, 2007 | |||||||||||||||||||||||||||||||||||
| Total | In Use | Available | Total | In Use | Available | Total | In Use | Available | Total | In Use | Available | |||||||||||||||||||||||||||
Sources: | ||||||||||||||||||||||||||||||||||||||
Federal funds lines of credit | $ | 40,000 | — | $ | 40,000 | $ | 40,000 | — | $ | 40,000 | $ | 40,000 | $ | — | $ | 40,000 | $ | 40,000 | $ | — | $ | 40,000 | ||||||||||||||||
Federal Home Loan Bank advances | 245,352 | 80,000 | 165,352 | 252,552 | 125,000 | 127,552 | 249,234 | 70,000 | 179,234 | 245,352 | 80,000 | 165,352 | ||||||||||||||||||||||||||
Federal funds sold | 35,197 | 18,213 | 17,814 | 35,197 | ||||||||||||||||||||||||||||||||||
Securities, available for sale and unpledged at fair value | 29,062 | 53,470 | 12,405 | 29,062 | ||||||||||||||||||||||||||||||||||
Total short-term funding sources | $ | 269,611 | $ | 239,235 | $ | 249,453 | $ | 269,611 | ||||||||||||||||||||||||||||||
Uses: | ||||||||||||||||||||||||||||||||||||||
Unfunded loan commitments and lending lines of credit | 43,926 | 39,933 | 32,856 | 43,926 | ||||||||||||||||||||||||||||||||||
Letters of credit | 1,650 | 1,617 | 1,708 | 1,650 | ||||||||||||||||||||||||||||||||||
Commitments to purchase assets | 708 | 1,148 | 1,775 | 708 | ||||||||||||||||||||||||||||||||||
Anticipated decline in borrowed funds (demand note) | 315 | 356 | 427 | 315 | ||||||||||||||||||||||||||||||||||
Total potential short-term funding uses | $ | 46,599 | $ | 43,054 | $ | 36,766 | $ | 46,599 | ||||||||||||||||||||||||||||||
Ratio of short-term funding sources to potential uses | 578.6 | % | 555.7 | % | ||||||||||||||||||||||||||||||||||
Liquidity coverage ratio | 678.5 | % | 578.6 | % | ||||||||||||||||||||||||||||||||||
–- 28 –-
Management is not aware of any market or institutional trends, events or uncertainties that are expected to have a material effect on the liquidity, capital resources or operations of the Company. Nor is management aware of any current recommendations by regulatory authorities that would have a material affect on liquidity, capital resources or operations. The Company’s internal sources of such liquidity are deposits, loan and investment repayments and securities available for sale. The Company’s primary external source of liquidity is advances from the FHLB of Atlanta.
Effects of Inflation
Management believes that the key to achieving satisfactory performance in an inflationary environment is its ability to maintain or improve its net interest margin and to generate additional fee income. The Company’s policy of investing in and funding with interest-sensitive assets and liabilities is intended to reduce the risks inherent in a volatile inflationary economy.
Off-Balance Sheet Lending Related Commitments
The Company had $135.8$108.5 million in consumer and commercial commitments at December 31, 2007.2008. The Company also had $5.5 million at December 31, 20072008 in letters of credit that the Bank will fund if certain future events occur. It is expected that only a portion of these commitments will ever actually be funded.
TheManagement believes that the Company has the liquidity and capital resources to handle these commitments in the normal course of business. See Note 13 of the Notes to Consolidated Financial Statements included in Item 8, “Financial Statements and Supplemental Data” of this report on Form 10-K.
Contractual Obligations
In the normal course of business there are various outstanding contractual obligations of the Company that will require future cash outflows. In addition, there are commitments and contingent liabilities, such as commitments to extend credit that may or may not require future cash outflows. The following table provides the Company’s contractual obligations as of December 31, 2007:
Payments due by period2008:
| (in thousands) | Less | More | ||||||||||||||||||||||||||||
| Than 1 | 1-3 | 3-5 | Than 5 | |||||||||||||||||||||||||||
Contractual Obligations | Total | Year | Years | Years | Years | |||||||||||||||||||||||||
(in thousands)
Contractual Obligations | Total | Less Than 1 Year | 1-3 Years | 3-5 Years | More Than 5 Years | |||||||||||||||||||||||||
Short-Term Debt Obligations | $ | 64,225 | $ | 64,225 | — | — | — | $ | 33,282 | $ | 33,282 | — | — | — | ||||||||||||||||
Long-Term Debt Obligations | $ | 80,000 | $ | 10,000 | $ | 45,000 | — | $ | 25,000 | $ | 70,000 | $ | 5,000 | $ | 40,000 | — | $ | 25,000 | ||||||||||||
Operating Lease Obligations | $ | 746 | $ | 259 | $ | 465 | $ | 22 | — | $ | 922 | $ | 331 | $ | 558 | $ | 33 | — | ||||||||||||
Commitment to purchase assets | $ | 708 | $ | 708 | — | — | — | $ | 1,775 | $ | 1,775 | — | — | — | ||||||||||||||||
Total contractual cash obligations excluding deposits | $ | 145,679 | $ | 75,192 | $ | 45,465 | $ | 22 | $ | 25,000 | $ | 105,979 | $ | 40,388 | $ | 40,558 | $ | 33 | $ | 25,000 | ||||||||||
Deposits | $ | 596,165 | $ | 505,271 | $ | 86,402 | $ | 4,492 | — | $ | 646,524 | $ | 545,392 | $ | 94,101 | $ | 7,031 | — | ||||||||||||
Total | $ | 741,844 | $ | 580,463 | $ | 131,867 | $ | 4,514 | $ | 25,000 | $ | 752,503 | $ | 585,780 | $ | 134,659 | $ | 7,064 | $ | 25,000 | ||||||||||
Short-term debt obligations include federal funds purchased, repurchase agreements and Demand Note U.S. Treasury.Treasury demand note. As of December 31, 2007,2008, the long-term debt obligations of FHLB advances decreased to $80.0$70.0 million as compared to $125.0$80.0 million as of December 31, 2006.2007.
–- 29 –-
Short-Term Borrowings
Short-term borrowings consist of the following at December 31, 2008, 2007 2006 and 2005:2006:
TABLE XII
SHORT-TERM BORROWINGS
| 2007 | 2006 | 2005 | 2008 | 2007 | 2006 | |||||||||||||||||||||||||||||||
| Balance | Rate | Balance | Rate | Balance | Rate | Balance | Rate | Balance | Rate | Balance | Rate | |||||||||||||||||||||||||
| (in thousands) | (in thousands) | |||||||||||||||||||||||||||||||||||
Balance at December 31, | ||||||||||||||||||||||||||||||||||||
Repurchase agreements | $ | 63,691 | 3.43 | % | $ | 56,696 | 3.99 | % | $ | 48,911 | 2.96 | % | $ | 32,855 | 0.85 | % | $ | 63,691 | 3.43 | % | $ | 56,696 | 3.99 | % | ||||||||||||
U.S. Treasury demand notes and other borrowed money | 534 | 4.00 | % | 357 | 5.00 | % | 1,711 | 4.00 | % | 427 | 0.00 | % | 534 | 4.00 | % | 357 | 5.00 | % | ||||||||||||||||||
Total | $ | 64,225 | 3.43 | % | $ | 57,053 | 4.00 | % | $ | 50,622 | 3.00 | % | $ | 33,282 | 0.84 | % | $ | 64,225 | 3.43 | % | $ | 57,053 | 4.00 | % | ||||||||||||
Average daily balance at December 31, | ||||||||||||||||||||||||||||||||||||
Federal funds purchased | $ | 503 | 5.59 | % | $ | 2,863 | 4.96 | % | $ | 2,862 | 3.26 | % | $ | 1,066 | 2.31 | % | $ | 503 | 5.59 | % | $ | 2,863 | 4.96 | % | ||||||||||||
Repurchase agreements | 50,967 | 3.77 | % | 47,682 | 3.66 | % | 47,196 | 2.27 | % | 49,194 | 1.72 | % | 50,967 | 3.77 | % | 47,682 | 3.66 | % | ||||||||||||||||||
U.S. Treasury demand notes and other borrowed money | 412 | 4.79 | % | 622 | 4.71 | % | 1,076 | 2.73 | % | 489 | 1.39 | % | 412 | 4.79 | % | 622 | 4.71 | % | ||||||||||||||||||
Total | $ | 51,882 | 3.80 | % | $ | 51,167 | 3.74 | % | $ | 51,134 | 2.27 | % | $ | 50,749 | 1.73 | % | $ | 51,882 | 3.80 | % | $ | 51,167 | 3.74 | % | ||||||||||||
Maximum month-end outstanding balance: | ||||||||||||||||||||||||||||||||||||
Federal funds purchased | $ | — | $ | 11,100 | $ | 7,500 | $ | 9,000 | $ | — | $ | 11,100 | ||||||||||||||||||||||||
Repurchase agreements | $ | 64,783 | $ | 56,696 | $ | 55,495 | $ | 60,385 | $ | 64,783 | $ | 56,696 | ||||||||||||||||||||||||
U.S. Treasury demand notes and other borrowed money | $ | 1,886 | $ | 1,256 | $ | 5,213 | $ | 1,944 | $ | 1,886 | $ | 1,256 | ||||||||||||||||||||||||
| Item 7A. | Quantitative and Qualitative Disclosures About Market Risk |
This information is incorporated herein by reference from Item 7, “Management’s Discussion and Analysis of Financial Condition and Results of Operation”Operations”, on pages 1714 through 1930 of this report on Form 10-K.
| Item 8. | Financial Statements and Supplementary Data |
The consolidated financial statements and related footnotes of the Company are presented below followed by the financial statements of the Parent.
–- 30 –-
To the Stockholders and Board of Directors
Old Point Financial Corporation
Hampton, Virginia
REPORT OF INDEPENDENT REGISTERED PUBLIC ACCOUNTING FIRM
To the Board of Directors and Shareholders
Old Point Financial Corporation and subsidiaries
Hampton, Virginia
We have audited the accompanying consolidated balance sheets of Old Point Financial Corporation and subsidiaries as of December 31, 20072008 and 2006,2007, and the related consolidated statements of income, changes in stockholders’ equity, and cash flows for the years ended December 31, 2008, 2007 and 2006. These financial statements are the responsibility of the Corporation’s management. Our responsibility is to express an opinion on these financial statements based on our audits.
We conducted our audits in accordance with the standards of the Public Company Accounting Oversight Board (United States). Those standards require that we plan and perform the audit to obtain reasonable assurance about whether the financial statements are free of material misstatement. An audit includes examining, on a test basis, evidence supporting the amounts and disclosures in the financial statements. An audit also includes assessing the accounting principles used and significant estimates made by management, as well as evaluating the overall financial statement presentation. We believe that our audits provide a reasonable basis for our opinion.
In our opinion, the consolidated financial statements referred to above present fairly, in all material respects, the financial position of Old Point Financial Corporation and subsidiaries as of December 31, 2008 and 2007, and the results of their operations and their cash flows for the years ended December 31, 2008, 2007 and 2006, in conformity with U.S. generally accepted accounting principles.
We have also audited, in accordance with the standards of the Public Company Accounting Oversight Board (United States), Old Point Financial Corporation and 2005. subsidiaries’ internal control over financial reporting as of December 31, 2008, based on criteria established inInternal Control — Integrated Framework issued by the Committee of Sponsoring Organizations of the Treadway Commission, and our report dated March 5, 2009 expressed an unqualified opinion on the effectiveness of Old Point Financial Corporation and subsidiaries’ internal control over financial reporting.

Winchester, Virginia
March 5, 2009
- 31 -
REPORT OF INDEPENDENT REGISTERED PUBLIC ACCOUNTING FIRM
To the Board of Directors and Shareholders
Old Point Financial Corporation and subsidiaries
Hampton, Virginia
We also have audited Old Point Financial Corporation and subsidiaries’ internal control over financial reporting as of December 31, 2007,2008, based on criteria established inInternal Control—Control — Integrated Frameworkissued by the Committee of Sponsoring Organizations of the Treadway Commission (COSO).Commission. Old Point Financial Corporation and subsidiaries’ management is responsible for these financial statements, for maintaining effective internal control over financial reporting and for its assessment of the effectiveness of internal control over financial reporting included in the accompanyingManagement’s Report on Internal Control over Financial Reporting. Our responsibility is to express an opinion on these financial statements and an opinion on the Corporation’s internal control over financial reporting based on our audits.audit.
We conducted our auditsaudit in accordance with the standards of the Public Company Accounting Oversight Board (United States). Those standards require that we plan and perform the auditsaudit to obtain reasonable assurance about whether the financial statements are free of material misstatement and whether effective internal control over financial reporting was maintained in all material respects. Our audits of the financial statements included examining, on a test basis, evidence supporting the amounts and disclosures in the financial statements, assessing the accounting principles used and significant estimates made by management, and evaluating the overall financial statement presentation. Our audit of internal control over financial reporting included obtaining an understanding of internal control over financial reporting, assessing the risk that a material weakness exists, and testing and evaluating the design and operating effectiveness of internal control based on the assessed risk. Our auditsaudit also included performing such other procedures as we considered necessary in the circumstances. We believe that our audits provideaudit provides a reasonable basis for our opinions.opinion.
A company’scorporation’s internal control over financial reporting is a process designed to provide reasonable assurance regarding the reliability of financial reporting and the preparation of financial statements for external purposes in accordance with generally accepted accounting principles. A company’scorporation’s internal control over financial reporting includes those policies and procedures that (1)(a) pertain to the maintenance of records that, in reasonable detail, accurately and fairly reflect the transactions and dispositions of the assets of the company; (2)corporation;(b) provide reasonable assurance that transactions are recorded as necessary to permit preparation of financial statements in accordance with generally accepted accounting principles, and that receipts and expenditures of the companycorporation are being made only in accordance with authorizations of management and directors of the company;corporation; and (3)(c) provide reasonable assurance regarding prevention or timely detection of unauthorized acquisition, use, or disposition of the company’scorporation’s assets that could have a material effect on the financial statements.
– 31 –
Because of its inherent limitations, internal control over financial reporting may not prevent or detect misstatements. Also, projections of any evaluation of effectiveness to future periods are subject to the risk that controls may become inadequate because of changes in conditions, or that the degree of compliance with the policies or procedures may deteriorate.
In our opinion, the financial statements referred to above present fairly, in all material respects, the financial position of Old Point Financial Corporation and subsidiaries as of December 31, 2007 and 2006, and the results of their operations and their cash flows for the years ended December 31, 2007, 2006 and 2005, in conformity with accounting principles generally accepted in the United States of America. Also in our opinion, Old Point Financial Corporation and subsidiaries maintained, in all material respects, effective internal control over financial reporting as of December 31, 2007,2008, based on criteria established inInternal Control—Control — Integrated Frameworkissued by the Committee of Sponsoring Organizations of the Treadway Commission (COSO).Commission.

- 32 -
Winchester, Virginia
March 7, 20085, 2009
– 32 –- 33 -
Old Point Financial Corporation and Subsidiaries
Consolidated Balance Sheets
| December 31, | December 31, | |||||||||||||||
| 2007 | 2006 | 2008 | 2007 | |||||||||||||
| (in thousands) | (in thousands) | |||||||||||||||
Assets | ||||||||||||||||
Cash and due from banks | $ | 16,367 | $ | 18,571 | $ | 29,511 | $ | 16,367 | ||||||||
Federal funds sold | 35,197 | 18,213 | 17,814 | 35,197 | ||||||||||||
Cash and cash equivalents | 51,564 | 36,784 | 47,325 | 51,564 | ||||||||||||
Securities available-for-sale, at fair value | 129,056 | 184,806 | 96,988 | 123,653 | ||||||||||||
Securities held-to-maturity (fair value approximates $2,947 and $3,454) | 2,904 | 3,432 | ||||||||||||||
Loans, net of allowance for loan losses of $5,130 and $4,784 | 592,014 | 578,809 | ||||||||||||||
Securities held-to-maturity (fair value approximates $3,116 and $2,947) | 3,067 | 2,904 | ||||||||||||||
Restricted securities | 4,791 | 5,284 | ||||||||||||||
Loans, net of allowance for loan losses of $6,406 and $5,130 | 631,046 | 592,014 | ||||||||||||||
Premises and equipment, net | 27,002 | 26,410 | 27,143 | 27,002 | ||||||||||||
Bank owned life insurance | 12,801 | 10,608 | 14,018 | 12,801 | ||||||||||||
Other real estate owned, net | 3,751 | 1,119 | ||||||||||||||
Other assets | 7,216 | 6,672 | 6,836 | 6,216 | ||||||||||||
| $ | 834,965 | $ | 822,557 | |||||||||||||
| $ | 822,557 | $ | 847,521 | |||||||||||||
Liabilities & Stockholders’ Equity | ||||||||||||||||
Deposits: | ||||||||||||||||
Noninterest-bearing deposits | $ | 95,970 | $ | 96,653 | $ | 123,755 | $ | 95,970 | ||||||||
Savings deposits | 185,823 | 201,273 | 187,105 | 185,823 | ||||||||||||
Time deposits | 314,372 | 290,488 | 335,664 | 314,372 | ||||||||||||
Total deposits | 596,165 | 588,414 | 646,524 | 596,165 | ||||||||||||
Federal funds purchased, repurchase agreements and other borrowings | 64,225 | 57,053 | 33,282 | 64,225 | ||||||||||||
Federal Home Loan Bank advances | 80,000 | 125,000 | 70,000 | 80,000 | ||||||||||||
Accrued expenses and other liabilities | 2,460 | 2,389 | 2,261 | 2,460 | ||||||||||||
Total liabilities | 742,850 | 772,856 | 752,067 | 742,850 | ||||||||||||
Commitments and contingencies | ||||||||||||||||
Stockholders’ equity: | ||||||||||||||||
Common stock, $5 par value, 10,000,000 shares authorized; 4,907,567 and 3,992,155 shares issued | 24,538 | 19,961 | ||||||||||||||
Common stock, $5 par value, 10,000,000 shares authorized; 4,905,229 and 4,907,567 shares issued | 24,526 | 24,538 | ||||||||||||||
Additional paid-in capital | 15,357 | 14,719 | 15,506 | 15,357 | ||||||||||||
Retained earnings | 40,039 | 42,245 | 43,251 | 40,039 | ||||||||||||
Accumulated other comprehensive loss | (227 | ) | (2,260 | ) | (385 | ) | (227 | ) | ||||||||
Total stockholders’ equity | 79,707 | 74,665 | 82,898 | 79,707 | ||||||||||||
| $ | 822,557 | $ | 847,521 | $ | 834,965 | $ | 822,557 | |||||||||
See Notes to Consolidated Financial Statements.
– 33 –- 34 -
Old Point Financial Corporation and Subsidiaries
Consolidated Statements of Income
| Years Ended December 31, | Years Ended December 31, | |||||||||||||||||||
| 2007 | 2006 | 2005 | 2008 | 2007 | 2006 | |||||||||||||||
| (in thousands, except per share data) | (in thousands, except per share data) | |||||||||||||||||||
Interest and Dividend Income: | ||||||||||||||||||||
Interest and fees on loans | $ | 41,887 | $ | 37,440 | $ | 28,975 | $ | 40,870 | $ | 41,887 | $ | 37,440 | ||||||||
Interest on federal funds sold | 994 | 467 | 270 | 387 | 994 | 467 | ||||||||||||||
Interest on securities: | ||||||||||||||||||||
Taxable | 4,470 | 5,118 | 5,311 | 3,377 | 4,470 | 5,118 | ||||||||||||||
Tax-exempt | 1,247 | 1,445 | 1,705 | 925 | 1,247 | 1,445 | ||||||||||||||
Dividends and interest on all other securities | 423 | 415 | 226 | 942 | 423 | 415 | ||||||||||||||
Total interest and dividend income | 49,021 | 44,885 | 36,487 | 46,501 | 49,021 | 44,885 | ||||||||||||||
Interest Expense: | ||||||||||||||||||||
Interest on savings and interest-bearing demand deposits | 2,502 | 2,290 | 1,431 | 1,095 | 2,502 | 2,290 | ||||||||||||||
Interest on time deposits | 13,949 | 11,003 | 6,987 | 13,007 | 13,949 | 11,003 | ||||||||||||||
Interest on federal funds purchased, repurchase agreements and other borrowings | 1,970 | 1,913 | 1,160 | 877 | 1,970 | 1,913 | ||||||||||||||
Interest on Federal Home Loan Bank advances | 4,928 | 5,070 | 2,743 | 4,027 | 4,928 | 5,070 | ||||||||||||||
Total interest expense | 23,349 | 20,276 | 12,321 | 19,006 | 23,349 | 20,276 | ||||||||||||||
Net interest income | 25,672 | 24,609 | 24,166 | 27,495 | 25,672 | 24,609 | ||||||||||||||
Provision for loan losses | 1,000 | 1,200 | 1,050 | 2,400 | 1,000 | 1,200 | ||||||||||||||
Net interest income, after provision for loan losses | 24,672 | 23,409 | 23,116 | 25,095 | 24,672 | 23,409 | ||||||||||||||
Noninterest Income: | ||||||||||||||||||||
Income from fiduciary activities | 3,116 | 2,669 | 2,705 | 3,109 | 3,116 | 2,669 | ||||||||||||||
Service charges on deposit accounts | 5,779 | 5,445 | 4,852 | 5,894 | 5,779 | 5,445 | ||||||||||||||
Other service charges, commissions and fees | 2,480 | 2,197 | 1,779 | 2,587 | 2,480 | 2,197 | ||||||||||||||
Income from bank owned life insurance | 622 | 547 | 497 | 716 | 622 | 547 | ||||||||||||||
Net gains on available-for-sale securities | 3 | 9 | 10 | |||||||||||||||||
Gain (loss) on disposal of premises and equipment | 227 | 134 | (8 | ) | ||||||||||||||||
Gain (loss) on available-for-sale securities | (47 | ) | 3 | 9 | ||||||||||||||||
Other operating income | 486 | 539 | 522 | 236 | 352 | 539 | ||||||||||||||
Total noninterest income | 12,486 | 11,406 | 10,365 | 12,722 | 12,486 | 11,398 | ||||||||||||||
Noninterest Expense: | ||||||||||||||||||||
Salaries and employee benefits | 15,931 | 15,192 | 14,378 | 17,041 | 15,931 | 15,192 | ||||||||||||||
Occupancy and equipment | 3,640 | 3,514 | 3,190 | 3,903 | 3,640 | 3,514 | ||||||||||||||
Supplies | 527 | 525 | 491 | |||||||||||||||||
Postage and courier | 519 | 516 | 489 | |||||||||||||||||
Service fees | 370 | 706 | 698 | 390 | 370 | 706 | ||||||||||||||
Data processing | 878 | 738 | 612 | 996 | 878 | 738 | ||||||||||||||
Advertising | 724 | 775 | 748 | 773 | 724 | 775 | ||||||||||||||
Customer development | 696 | 684 | 547 | 752 | 696 | 684 | ||||||||||||||
Employee professional development | 645 | 591 | 546 | 662 | 645 | 591 | ||||||||||||||
Loss on write down of other real estate owned | 428 | — | — | |||||||||||||||||
Other | 2,093 | 1,940 | 1,886 | 3,431 | 3,139 | 2,973 | ||||||||||||||
Total noninterest expenses | 26,023 | 25,181 | 23,585 | 28,376 | 26,023 | 25,173 | ||||||||||||||
Income before income taxes | 11,135 | 9,634 | 9,896 | 9,441 | 11,135 | 9,634 | ||||||||||||||
Income tax expenses | 3,166 | 2,610 | 2,628 | |||||||||||||||||
Income tax expense | 2,651 | 3,166 | 2,610 | |||||||||||||||||
Net income | $ | 7,969 | $ | 7,024 | $ | 7,268 | $ | 6,790 | $ | 7,969 | $ | 7,024 | ||||||||
Basic Earnings per Share * | ||||||||||||||||||||
Average shares outstanding (in thousands) | 4,957 | 4,990 | 5,020 | 4,904 | 4,957 | 4,990 | ||||||||||||||
Net income per share of common stock | $ | 1.61 | $ | 1.41 | $ | 1.45 | $ | 1.39 | $ | 1.61 | $ | 1.41 | ||||||||
Diluted Earnings per Share * | ||||||||||||||||||||
Average shares outstanding (in thousands) | 4,998 | 5,061 | 5,116 | 4,935 | 4,998 | 5,061 | ||||||||||||||
Net income per share of common stock | $ | 1.59 | $ | 1.39 | $ | 1.42 | $ | 1.38 | $ | 1.59 | $ | 1.39 | ||||||||
See Notes to Consolidated Financial Statements.
| * | Per share data has been adjusted to reflect the 5 for 4 stock split in the form of a dividend declared on August 16, 2007 and paid on October 1, 2007. |
– 34 –- 35 -
Old Point Financial Corporation and Subsidiaries
Consolidated Statements of Changes in Stockholders’ Equity
Years ended December 31, 2008, 2007, 2006 and 20052006
| Shares of Common Stock | Common Stock | Additional Paid-in Capital | Retained Earnings | Accumulated Other Comprehensive Income (Loss) | Total | Shares of Common Stock | Common Stock | Additional Paid-in Capital | Retained Earnings | Accumulated Other Comprehensive Income (Loss) | Total | |||||||||||||||||||||||||||||||||
| (in thousands, except share data) | ||||||||||||||||||||||||||||||||||||||||||||
Balance at December 31, 2004 | 4,013,644 | $ | 20,068 | $ | 14,074 | $ | 34,804 | $ | 193 | $ | 69,139 | |||||||||||||||||||||||||||||||||
Comprehensive income: | ||||||||||||||||||||||||||||||||||||||||||||
Net income | — | — | 7,268 | — | 7,268 | |||||||||||||||||||||||||||||||||||||||
Unrealized holding losses arising during the period (net of tax, $1,335) | (2,592 | ) | (2,592 | ) | ||||||||||||||||||||||||||||||||||||||||
Reclassification adjustment, (net of tax, $3) | — | — | — | (7 | ) | (7 | ) | |||||||||||||||||||||||||||||||||||||
Total comprehensive income (loss) | — | — | 7,268 | (2,599 | ) | 4,669 | ||||||||||||||||||||||||||||||||||||||
Sale of common stock | 7,046 | 35 | 237 | (172 | ) | — | 100 | |||||||||||||||||||||||||||||||||||||
Repurchase and retirement of common stock | (7,137 | ) | (35 | ) | (175 | ) | (210 | ) | ||||||||||||||||||||||||||||||||||||
Nonqualified stock options | 9 | 9 | ||||||||||||||||||||||||||||||||||||||||||
Cash dividends ($.53 per share) | — | — | (2,651 | ) | — | (2,651 | ) | |||||||||||||||||||||||||||||||||||||
| (in thousands, except share data) | ||||||||||||||||||||||||||||||||||||||||||||
Balance at December 31, 2005 | 4,013,553 | $ | 20,068 | $ | 14,320 | $ | 39,074 | $ | (2,406 | ) | $ | 71,056 | 4,013,553 | $ | 20,068 | $ | 14,320 | $ | 39,074 | $ | (2,406 | ) | $ | 71,056 | ||||||||||||||||||||
Comprehensive income: | ||||||||||||||||||||||||||||||||||||||||||||
Net income | — | — | 7,024 | — | 7,024 | — | — | — | 7,024 | — | 7,024 | |||||||||||||||||||||||||||||||||
Unrealized holding gains arising during the period (net of tax, $404) | 785 | 785 | — | — | — | 0 | 785 | 785 | ||||||||||||||||||||||||||||||||||||
Reclassification adjustment, (net of tax, $3) | — | — | — | (6 | ) | (6 | ) | — | — | — | — | (6 | ) | (6 | ) | |||||||||||||||||||||||||||||
Total comprehensive income | — | — | 7,024 | 779 | 7,803 | — | — | 7,024 | 779 | 7,803 | ||||||||||||||||||||||||||||||||||
Adjustment to initially apply FASB Statement No. 158 (net of tax, $326) (in regards to pension plan) | (633 | ) | (633 | ) | — | — | — | — | (633 | ) | (633 | ) | ||||||||||||||||||||||||||||||||
Sale of common stock | 12,215 | 61 | 358 | (260 | ) | — | 159 | 12,215 | 61 | 358 | (260 | ) | — | 159 | ||||||||||||||||||||||||||||||
Repurchase and retirement of common stock | (33,613 | ) | (168 | ) | — | (800 | ) | (968 | ) | (33,613 | ) | (168 | ) | — | (800 | ) | — | (968 | ) | |||||||||||||||||||||||||
Nonqualified stock options | 41 | 41 | — | — | 41 | — | — | 41 | ||||||||||||||||||||||||||||||||||||
Cash dividends ($.56 per share) | — | — | (2,793 | ) | — | (2,793 | ) | — | — | — | (2,793 | ) | — | (2,793 | ) | |||||||||||||||||||||||||||||
Balance at December 31, 2006 | 3,992,155 | $ | 19,961 | $ | 14,719 | $ | 42,245 | $ | (2,260 | ) | $ | 74,665 | 3,992,155 | $ | 19,961 | $ | 14,719 | $ | 42,245 | $ | (2,260 | ) | $ | 74,665 | ||||||||||||||||||||
Comprehensive income: | ||||||||||||||||||||||||||||||||||||||||||||
Net income | — | — | 7,969 | — | 7,969 | — | — | — | 7,969 | — | 7,969 | |||||||||||||||||||||||||||||||||
Unrealized holding gains arising during the period (net of tax, $914) | 1,775 | 1,775 | — | — | — | — | 1,775 | 1,775 | ||||||||||||||||||||||||||||||||||||
Reclassification adjustment, (net of tax, $1) | (2 | ) | (2 | ) | — | — | — | — | (2 | ) | (2 | ) | ||||||||||||||||||||||||||||||||
Pension liability adjustment (net of tax, $134) | — | — | — | 260 | 260 | — | — | — | — | 260 | 260 | |||||||||||||||||||||||||||||||||
Total comprehensive income | — | — | 7,969 | 2,033 | 10,002 | — | — | 7,969 | 2,033 | 10,002 | ||||||||||||||||||||||||||||||||||
Sale of common stock | 19,716 | 99 | 575 | (500 | ) | — | 174 | 19,716 | 99 | 575 | (500 | ) | — | 174 | ||||||||||||||||||||||||||||||
Repurchase and retirement of common stock | (90,310 | ) | (452 | ) | — | (1,731 | ) | (2,183 | ) | (90,310 | ) | (452 | ) | — | (1,731 | ) | — | (2,183 | ) | |||||||||||||||||||||||||
Stock split in the form of a 25% stock dividend | 986,006 | 4,930 | (4,930 | ) | 0 | 986,006 | 4,930 | — | (4,930 | ) | — | 0 | ||||||||||||||||||||||||||||||||
Cash paid in lieu of fractional shares | (4 | ) | (4 | ) | — | — | — | (4 | ) | — | (4 | ) | ||||||||||||||||||||||||||||||||
Nonqualified stock options | 34 | 34 | — | — | 34 | — | — | 34 | ||||||||||||||||||||||||||||||||||||
Stock compensation expense | 29 | 29 | — | — | 29 | — | — | 29 | ||||||||||||||||||||||||||||||||||||
Cash dividends ($.61 per share) | — | — | (3,010 | ) | — | (3,010 | ) | — | — | — | (3,010 | ) | — | (3,010 | ) | |||||||||||||||||||||||||||||
Balance at December 31, 2007 | 4,907,567 | $ | 24,538 | $ | 15,357 | $ | 40,039 | $ | (227 | ) | $ | 79,707 | 4,907,567 | $ | 24,538 | $ | 15,357 | $ | 40,039 | $ | (227 | ) | $ | 79,707 | ||||||||||||||||||||
Comprehensive income: | ||||||||||||||||||||||||||||||||||||||||||||
Net income | — | — | — | 6,790 | — | 6,790 | ||||||||||||||||||||||||||||||||||||||
Unrealized holding gains arising during the period (net of tax, $256) | — | — | — | — | 496 | 496 | ||||||||||||||||||||||||||||||||||||||
Reclassification adjustment (net of tax, $16) | 31 | 31 | ||||||||||||||||||||||||||||||||||||||||||
Pension liability adjustment (net of tax benefit, $353) | — | — | — | — | (685 | ) | (685 | ) | ||||||||||||||||||||||||||||||||||||
Total comprehensive income (loss) | — | — | — | 6,790 | (158 | ) | 6,632 | |||||||||||||||||||||||||||||||||||||
Adjustment to apply FASB Statement No.158 (net of tax, $11) (in regards to pension plan) | — | — | — | 22 | — | 22 | ||||||||||||||||||||||||||||||||||||||
Adjustment to apply EITF 06-4 (net of tax, $144) (in regards to split-dollar life insurance) | — | — | — | (281 | ) | — | (281 | ) | ||||||||||||||||||||||||||||||||||||
Sale of common stock | 3,062 | 15 | 37 | (13 | ) | — | 39 | |||||||||||||||||||||||||||||||||||||
Repurchase and retirement of common stock | (5,400 | ) | (27 | ) | — | (70 | ) | — | (97 | ) | ||||||||||||||||||||||||||||||||||
Stock compensation expense | — | — | 112 | — | — | 112 | ||||||||||||||||||||||||||||||||||||||
Cash dividends ($.66 per share) | — | — | — | (3,236 | ) | — | (3,236 | ) | ||||||||||||||||||||||||||||||||||||
Balance at December 31, 2008 | 4,905,229 | $ | 24,526 | $ | 15,506 | $ | 43,251 | $ | (385 | ) | $ | 82,898 | ||||||||||||||||||||||||||||||||
See Notes to Consolidated Financial Statements.
– 35 –- 36 -
Old Point Financial Corporation and Subsidiaries
Consolidated Statements of Cash Flows
Years Ended December 31, | 2007 | 2006 | 2005 | 2008 | 2007 | 2006 | ||||||||||||||||||
| (in thousands) | (in thousands) | |||||||||||||||||||||||
CASH FLOWS FROM OPERATING ACTIVITIES | ||||||||||||||||||||||||
Net income | $ | 7,969 | $ | 7,024 | $ | 7,268 | $ | 6,790 | $ | 7,969 | $ | 7,024 | ||||||||||||
Adjustments to reconcile net income to net cash provided by operating activities: | ||||||||||||||||||||||||
Depreciation and amortization | 1,688 | 1,589 | 1,397 | 1,768 | 1,688 | 1,589 | ||||||||||||||||||
Provision for loan losses | 1,000 | 1,200 | 1,050 | 2,400 | 1,000 | 1,200 | ||||||||||||||||||
Net gain on available-for-sale securities | (3 | ) | (9 | ) | (10 | ) | ||||||||||||||||||
Net accretion of securities | (64 | ) | (54 | ) | (7 | ) | ||||||||||||||||||
(Gain) loss on disposal of equipment | (134 | ) | 5 | 8 | ||||||||||||||||||||
Gain on sale of other real estate owned | (14 | ) | — | — | ||||||||||||||||||||
Net (gain) loss on sale of available-for-sale securities | 47 | (3 | ) | (9 | ) | |||||||||||||||||||
Net accretion and amortization of securities | (73 | ) | (64 | ) | (54 | ) | ||||||||||||||||||
Net (gain) loss on disposal of premises and equipment | (227 | ) | (134 | ) | 5 | |||||||||||||||||||
Net gain on sale of other real estate owned | — | (14 | ) | — | ||||||||||||||||||||
Stock compensation expense | 29 | — | — | 112 | 29 | — | ||||||||||||||||||
Deferred tax expense (benefit) | (183 | ) | (36 | ) | 51 | |||||||||||||||||||
Valuation allowance on OREO properties | 428 | — | — | |||||||||||||||||||||
Deferred tax expense benefit | (565 | ) | (183 | ) | (36 | ) | ||||||||||||||||||
Increase in other assets | (2,516 | ) | (850 | ) | (1,102 | ) | (2,536 | ) | (2,516 | ) | (850 | ) | ||||||||||||
Increase in other liabilities | 333 | 184 | 523 | |||||||||||||||||||||
Increase (decrease) in other liabilities | (198 | ) | 333 | 184 | ||||||||||||||||||||
Net cash provided by operating activities | 8,105 | 9,053 | 9,178 | 7,946 | 8,105 | 9,053 | ||||||||||||||||||
CASH FLOWS FROM INVESTING ACTIVITIES | ||||||||||||||||||||||||
Purchases of available-for-sale securities | (47,415 | ) | (6,977 | ) | (5,153 | ) | (90,091 | ) | (47,415 | ) | (6,977 | ) | ||||||||||||
Purchases of held-to-maturity securities | (1,400 | ) | (1,200 | ) | (700 | ) | (3,400 | ) | (1,400 | ) | (1,200 | ) | ||||||||||||
Proceeds from maturities and calls of securities | 104,217 | 14,387 | 11,871 | 113,291 | 104,217 | 14,387 | ||||||||||||||||||
Proceeds from sales of available-for-sale securities | 3,630 | 2,860 | 4,799 | 8,066 | 3,630 | 2,860 | ||||||||||||||||||
Loans made to customers | (181,961 | ) | (300,785 | ) | (187,795 | ) | (293,706 | ) | (183,156 | ) | (300,785 | ) | ||||||||||||
Principal payments received on loans | 167,756 | 211,026 | 125,447 | 249,215 | 167,756 | 211,026 | ||||||||||||||||||
Proceeds from sales of other real estate owned | — | 254 | — | |||||||||||||||||||||
Purchases of premises and equipment | (2,146 | ) | (6,727 | ) | (4,140 | ) | (1,682 | ) | (2,146 | ) | (6,727 | ) | ||||||||||||
Additions to other real estate owned | (1,195 | ) | — | — | ||||||||||||||||||||
Proceeds from sales of other real estate owned | 254 | — | — | |||||||||||||||||||||
Net cash provided by (used in) investing activities | 41,740 | (87,416 | ) | (55,671 | ) | (18,307 | ) | 41,740 | (87,416 | ) | ||||||||||||||
CASH FLOWS FROM FINANCING ACTIVITIES | ||||||||||||||||||||||||
Decrease in noninterest-bearing deposits | (683 | ) | (2,033 | ) | (2,841 | ) | ||||||||||||||||||
Increase (decrease) in noninterest-bearing deposits | 27,785 | (683 | ) | (2,033 | ) | |||||||||||||||||||
Increase (decrease) in savings deposits | (15,450 | ) | 5,440 | (4,652 | ) | 1,282 | (15,450 | ) | 5,440 | |||||||||||||||
Proceeds from the sale of time deposits | 240,299 | 191,905 | 163,346 | 275,748 | 240,299 | 191,905 | ||||||||||||||||||
Payments for maturing time deposits | (216,415 | ) | (143,641 | ) | (131,269 | ) | (254,456 | ) | (216,415 | ) | (143,641 | ) | ||||||||||||
Increase in federal funds purchased and repurchase agreements | 6,995 | 7,785 | 3,143 | |||||||||||||||||||||
Increase (decrease) in federal funds purchased and repurchase agreements | (30,836 | ) | 6,995 | 7,785 | ||||||||||||||||||||
Increase (decrease) in Federal Home Loan Bank advances | (45,000 | ) | 45,000 | 25,000 | (10,000 | ) | (45,000 | ) | 45,000 | |||||||||||||||
Increase (decrease) in interest-bearing demand notes and other borrowed money | 178 | (1,354 | ) | (1,449 | ) | (107 | ) | 178 | (1,354 | ) | ||||||||||||||
Proceeds from issuance of common stock | 174 | 159 | 100 | 39 | 174 | 159 | ||||||||||||||||||
Repurchase and retirement of common stock | (2,183 | ) | (968 | ) | (210 | ) | (97 | ) | (2,183 | ) | (968 | ) | ||||||||||||
Cash paid in lieu of fractional shares | (4 | ) | — | — | ||||||||||||||||||||
Cash in lieu of shares | — | (4 | ) | — | ||||||||||||||||||||
Effect of nonqualified stock options | 34 | 41 | 9 | — | 34 | 41 | ||||||||||||||||||
Cash dividends paid on common stock | (3,010 | ) | (2,793 | ) | (2,651 | ) | (3,236 | ) | (3,010 | ) | (2,793 | ) | ||||||||||||
Net cash provided by (used in) financing activities | (35,065 | ) | 99,541 | 48,526 | 6,122 | (35,065 | ) | 99,541 | ||||||||||||||||
Net increase in cash and cash equivalents | 14,780 | 21,178 | 2,033 | |||||||||||||||||||||
Net increase (decrease) in cash and cash equivalents | (4,239 | ) | 14,780 | 21,178 | ||||||||||||||||||||
Cash and cash equivalents at beginning of period | 36,784 | 15,606 | 13,573 | 51,564 | 36,784 | 15,606 | ||||||||||||||||||
Cash and cash equivalents at end of period | $ | 51,564 | $ | 36,784 | $ | 15,606 | $ | 47,325 | $ | 51,564 | $ | 36,784 | ||||||||||||
SUPPLEMENTAL DISCLOSURES OF CASH FLOW INFORMATION | ||||||||||||||||||||||||
Cash payments for: | ||||||||||||||||||||||||
Interest | $ | 23,245 | $ | 19,463 | $ | 11,785 | $ | 19,667 | $ | 23,245 | $ | 19,463 | ||||||||||||
Income taxes | 3,375 | 2,625 | 2,550 | |||||||||||||||||||||
Income tax | $ | 3,275 | $ | 3,375 | $ | 2,625 | ||||||||||||||||||
SUPPLEMENTAL SCHEDULE OF NONCASH TRANSACTIONS | ||||||||||||||||||||||||
Unrealized gain (loss) on investment securities | $ | 2,686 | $ | 1,180 | $ | (3,937 | ) | |||||||||||||||||
Unrealized gain on investment securities | $ | 752 | $ | 2,686 | $ | 1,180 | ||||||||||||||||||
Loans transferred to other real estate owned | $ | 2,921 | $ | 955 | $ | — | ||||||||||||||||||
Change in pension liability | $ | (394 | ) | $ | 959 | $ | — | $ | (1,005 | ) | $ | (394 | ) | $ | 959 | |||||||||
Loans transferred to Other Real Estate Owned | $ | 955 | $ | — | $ | — | ||||||||||||||||||
Adjustment to reflect change in accounting principle - split-dollar post retirement benefits | $ | (425 | ) | $ | — | $ | — | |||||||||||||||||
See Notes to Consolidated Financial Statements.
– 36 –- 37 -
NOTES TO CONSOLIDATED FINANCIAL STATEMENTS
NOTE 1, Significant Accounting Policies
PRINCIPLES OF CONSOLIDATION:
The consolidated financial statements include the accounts of Old Point Financial Corporation (the Company) and its wholly-owned subsidiaries, The Old Point National Bank of Phoebus (the Bank) and Old Point Trust & Financial Services N.A. (Trust). All significant intercompany balances and transactions have been eliminated in consolidation.
NATURE OF OPERATIONS:
Old Point Financial Corporation is a holding company that conducts substantially all of its operations through two subsidiaries, The Old Point National Bank of Phoebus and Old Point Trust and Financial Services, N.A. The Bank services individual and commercial customers, the majority of which are in Hampton Roads. As of December 31, 2007,2008, the Bank had 1920 branch offices. The Bank offers a full range of deposit and loan products to its retail and commercial customers. Trust offers a full range of services for individuals and businesses. Products and services include retirement planning, estate planning, financial planning, trust accounts, tax services and investment management services.
USE OF ESTIMATES:
In preparing consolidated financial statements in conformity with U.S. generally accepted accounting principles, management is required to make estimates and assumptions that affect the reported amounts of assets and liabilities as of the date of the balance sheet and reported amounts of revenues and expenses during the reporting period. Actual results could differ from those estimates. Material estimates that are particularly susceptible to significant change in the near term relate to the determination of the allowance for loan losses and the valuation of deferred tax assets.
CASH AND CASH EQUIVALENTS:
For purposes of the consolidated statements of cash flows, cash and cash equivalents includes cash and balances due from banks and federal funds sold, all which mature within 90 days.
INVESTMENT SECURITIES:
Statement of Financial Accounting Standards (SFAS)SFAS No. 115, “Accounting for Certain Investments in Debt and Equity Securities” (SFAS 115), addresses the accounting and reporting for investments in equity securities that have readily determinable fair values and for all investments in debt securities. Those investments are to be classified in two categories and accounted for as follows:
Held-to-maturity - Debt securities for which the Company has the positive intent and ability to hold to maturity are classified as held-to-maturity securities and reported at cost, adjusted for premiums and discounts that are recognized in interest income using the interest method over the period to maturity.
Available-for-sale - Debt and equity securities not classified as held-to-maturity securities are classified as available-for-sale securities and recorded at fair value, with unrealized gains and losses reported as a component of comprehensive income. Gains and losses on the sale of available-for-sale securities are determined using the specific identification method.
Purchase premiums and discounts are recognized in interest income using the interest method over the terms of the securities. Declines in the fair value of held-to-maturity and available-for-sale securities below their cost that are deemed to be other than temporary are reflected in earnings as realized losses. In estimating other-than-temporary impairment losses, management considers (i) the length of time and the extent to which the fair value has been less than cost, (ii) the financial condition and near-term prospects of the issuer, and (iii) the intent and ability of the Company to retain its investment in the issuer for a period of time sufficient to allow for any anticipated recovery in fair value.
– 37 –
LOANS:
The Company grants mortgage, commercial and consumer loans to customers. A substantial portion of the loan portfolio is represented by mortgage loans throughout Hampton Roads. The ability of the Company’s debtors to honor their contracts is dependent upon the real estate and general economic conditions in this area.
- 38 -
Loans that management has the intent and ability to hold for the foreseeable future or until maturity or pay-off generally are reported at their outstanding unpaid principal balances adjusted for charge-offs, the allowance for loan losses and any deferred fees or costs on originated loans. Interest income is accrued on the unpaid principal balance. Loan origination fees and certain direct origination costs are capitalized and recognized as an adjustment of the yield on the related loan.
Accrual of interest is discontinued on a loan when management believes, after considering collection efforts and other factors, that the borrower’s financial condition is such that collection of interest is doubtful.
All interest accrued but not collected for loans that are placed on non-accrualnonaccrual or charged off is reversed against interest income. The interest on these loans is accounted for on the cash basis or cost recovery method, until qualifying for return to accrual. Loans are returned to accrual status when all the principal and interest amounts contractually due are brought current and future payments are reasonably assured.
ALLOWANCE FOR LOAN LOSSES:
The allowance for loan losses is established as losses are estimated to have occurred through a provision for loan losses charged to earnings. Loan losses are charged against the allowance when management believes the uncollectibility of a loan balance is confirmed. Subsequent recoveries, if any, are credited to the allowance.
The allowance for loan losses is evaluated on a regular basis by management and is based upon management’s periodic review of the collectibility of the loans in light of historical experience, the nature and volume of the loan portfolio, adverse situations that may affect the borrower’s ability to repay, estimated value of any underlying collateral and prevailing economic conditions. This evaluation is inherently subjective as it requires estimates that are susceptible to significant revision as more information becomes available.
The allowance consists of specific and general components. The specific component relates to loans that are classified as doubtful or substandard. For such loans that are also classified as impaired, an allowance is established when the discounted cash flows (or collateral value or observable market price) of the impaired loan is lower than the carrying value of that loan. The general component covers non-classified loans and is based on historical loss experience adjusted for qualitative factors. An unallocated component is maintained to cover uncertainties that could affect management’s estimate of probable losses. The unallocated component of the allowance reflects the margin of imprecision inherent in the underlying assumptions used in estimating specific and general losses in the portfolio.
A loan is considered impaired when, based on current information and events, it is probable that the Company will be unable to collect the scheduled payments of principal or interest when due according to the contractual terms of the loan agreement. Factors considered by management in determining impairment include payment status, collateral value and the probability of collecting scheduled principal and interest payments when due. Loans that experience insignificant payment delays and payment shortfalls generally are not classified as impaired. Management determines the significance of payment delays and payment shortfalls on a case-by-case basis, taking into consideration all of the circumstances surrounding the loan and the borrower, including the length of the delay, the reasons for the delay, the borrower’s prior payment record, and the amount of the shortfall in relation to the principal and interest owed. Impairment is measured on a loan by loan basis for commercial and construction loans by either the present value of expected future cash flows discounted at the loan’s effective interest rate, the loan’s obtainable market price, or the fair value of the collateral if the loan is collateral dependent.
Large groups of smaller balance homogeneous loans are collectively evaluated for impairment. Accordingly, the Company does not separately identify individual consumer and residential loans for impairment disclosures, unless such loans are the subject of a restructuring agreement.
– 38 –
OFF-BALANCE SHEET CREDIT RELATED FINANCIAL INSTRUMENTS:
In the ordinary course of business, the Company has entered into commitments to extend credit, including commitments under commercial letters of credit and lines of credit. Such financial instruments are recorded when they are funded.
- 39 -
OTHER REAL ESTATE OWNED:
Other real estate owned is carried at the lower of costcarrying amount or estimated fair value less cost to sell and consists of foreclosed real property and other property held for sale. The estimated fair value is reviewed periodically by management and any write-downs are charged against current earnings. Revenue and expenses and changes in the valuation allowance are included in net expenses from foreclosed assets.
PREMISES AND EQUIPMENT:
Land is carried at cost. Premises and equipment are stated at cost less accumulated depreciation and amortization. Premises and equipment are depreciated over their estimated useful lives ranging from three to 39 years; leasehold improvements are amortized over the lives of the respective leases or the estimated useful life of the leasehold improvement, whichever is less. Software is amortized over its estimated useful life ranging from three to five years. Depreciation and amortization are calculated on the straight-line method.
INCOME TAXES:
Deferred income tax assets and liabilities are determined using the liability (or balance sheet) method. Under this method, the new deferred tax asset or liability is determined based on the tax effects of the temporary differences between the book and tax basis of the various balance sheet assets and liabilities and gives current recognition to changes in tax rates and laws.
When tax returns are filed, it is highly certain that some positions taken would be sustained upon examination by the taxing authorities, while others are subject to uncertainty about the merits of the position taken or the amount of the position that would be ultimately sustained. The benefit of a tax position is recognized in the financial statements in the period during which, based on all available evidence, management believes it is more likely than not that the position will be sustained upon examination, including the resolution of appeals or litigation processes, if any. Tax positions taken are not offset or aggregated with other positions. Tax positions that meet the more-likely-than-not recognition threshold are measured as the largest amount of tax benefit that is more than 50 percent likely of being realized upon settlement with the applicable taxing authority. The portion of the benefits associated with tax positions taken that exceeds the amount measured as described above is reflected as a liability for unrecognized tax benefits in the accompanying balance sheet along with any associated interest and penalties that would be payable of the taxing authorities upon examination.
Interest and penalties associated with unrecognized tax benefits are classified as additional income taxes in the statement of income.
PENSION PLAN:
The Company has a non-contributory defined benefit pension plan. Effective September 30, 2006, the Company took action to freeze the plan. Benefits for participants will remain frozen in the plan until such time as further action occurs. No additional participants will be added to the plan.
Although the plan is frozen, contributions to the plan will continue using the Company’s policy to fund the maximum amount of contributions allowed for tax purposes. The Company accrues an amount equal to its actuarially computed obligation under the plan.
The actuarial valuation was performed using the initial frozen liability method. Under this method, the Company’s contribution equals the sum of the amount necessary to amortize the frozen initial liability (past service base) over a period of years and the normal cost of the plan.
STOCK COMPENSATION PLANS:
The Company adopted SFAS 123R effective January 1, 2006 using the modified prospective method and as such, results for prior periods have not been restated. Share-based compensation arrangements include stock options, restricted stock plans, performance-based awards, stock appreciation rights and employee stock purchase plans. SFAS 123R, “Share-Based Payments”, requires all share-based payments to employees to be valued using a fair value method on the date of grant and to be expensed based on that fair value over the applicable vesting period.
– 39 –
Had compensation cost for the Company’s stock option plan been determined based on the fair value at the grant dates for awards under the plan consistent with the method prescribed by SFAS 123, the Company’s net income and earnings per share would have been adjusted to the pro forma amounts indicated below:
| Pro forma disclosure under SFAS 123 | ||||
| 2005 | ||||
(in thousands, except per share data) | ||||
Net income: | ||||
As reported | $ | 7,268 | ||
Fair value-based expense, net of tax | (349 | ) | ||
Pro forma | $ | 6,919 | ||
Basic earnings per share: | ||||
As reported | $ 1.45 | |||
Pro forma | $ 1.38 | |||
Diluted earnings per share: | ||||
As reported | $ 1.42 | |||
Pro forma | $ 1.35 | |||
The pro forma disclosures include the effects of all unexpired awards.
For additional information on stock-based compensation, see Note 9 of the Notes to Consolidated Financial Statements of this report on Form 10-K.
EARNINGS PER COMMON SHARE:
Basic earnings per share represents income available to common stockholders divided by the weighted-average
- 40 -
number of common shares outstanding during the period. Diluted earnings per share reflects additional common shares that would have been outstanding if dilutive potential common shares had been issued, as well as any adjustment to income that would result from the assumed issuance. Potential common shares that may be issued by the Company relate solely to outstanding stock options and are determined using the treasury stock method.
Per share data has been adjusted to reflect the 5 for 4 stock split in the form of a dividend declared on August 16, 2007 and paid on October 1, 2007. Earnings per common share have been computed based on the following:
| Years Ended December 31, | Years Ended December 31, | |||||||||||||||||
| 2007 | 2006 | 2005 | 2008 | 2007 | 2006 | |||||||||||||
| (in thousands) | (in thousands) | |||||||||||||||||
Net Income applicable to common stock | $ | 7,969 | $ | 7,024 | $ | 7,268 | $ | 6,790 | $ | 7,969 | $ | 7,024 | ||||||
Average number of common shares outstanding | 4,957 | 4,990 | 5,020 | 4,904 | 4,957 | 4,990 | ||||||||||||
Effect of dilutive options | 41 | 71 | 96 | 31 | 41 | 71 | ||||||||||||
Average number of common shares outstanding used to calculate diluted earnings per common share | 4,998 | 5,061 | 5,116 | 4,935 | 4,998 | 5,061 | ||||||||||||
There were 261,290188,210 anti-dilutive shares in 2008, 261,290 in 2007 and 87,000 in 2006 and 91,375 in 2005.2006.
– 40 –
TRUST ASSETS AND INCOME:
Securities and other property held by Trust in a fiduciary or agency capacity are not assets of the Company and are not included in the accompanying consolidated financial statements.
ADVERTISING EXPENSES:
Advertising expenses are expensed as incurred.
RECLASSIFICATIONS:
Certain amounts in the consolidated financial statements have been reclassified to conform with classifications adopted in the current year.
RECENT ACCOUNTING PRONOUNCEMENTS:
In September 2006, the Financial Accounting Standards Board (FASB) reached a consensus on Emerging Issues Task Force (EITF) Issue 06-4, “Accounting for Deferred Compensation and Postretirement Benefit Aspects of Endorsement Split-Dollar Life Insurance Arrangements,” (EITF Issue 06-4). In March 2007, the FASB reached a consensus on EITF Issue 06-10, “Accounting for Collateral Assignment Split-Dollar Life Insurance Arrangements,” (EITF Issue 06-10). Both of these standards require a company to recognize an obligation over an employee’s service period based upon the substantive agreement with the employee such as the promise to maintain a life insurance policy or provide a death benefit postretirement. The Company adopted the provisions of these standards effective January 1, 2008. The Company charged $281 thousand to retained earnings (net of tax) and $26 thousand to expense in 2008 due to the adoption of these standards.
In September 2006, the FASB issued Statement of Financial Accounting StandardsSFAS No. 157, “Fair Value Measurements” (SFAS 157). SFAS 157 defines fair value, establishes a framework for measuring fair value in generally accepted accounting principles, and expands disclosures about fair value measurements. SFAS 157 does not require any new fair value measurements, but rather, provides enhanced guidance to other pronouncements that require or permit assets or liabilities to be measured at fair value. This Statement is effective for financial statements issued for fiscal years beginning after November 15, 2007 and interim periods within those years. The FASB approved a one-year deferral for the implementation of the Statement for nonfinancial assets and nonfinancial liabilities that are recognized or disclosed at fair value in the financial statements on a nonrecurring basis. The Company does not expect the implementationadopted SFAS 157 effective January 1, 2008. The adoption of SFAS 157 todid not have a material impact on its consolidated financial statements.
In September 2006, the FASB issued Statement of Financial Accounting Standards No. 158, “Employers’ Accounting for Defined Benefit Pension and Other Postretirement Plans – an amendment of FASB Statements No. 87, 88, 106, and 132(R)” (SFAS 158). This Statement requires that employers measure plan assets and obligations as of the balance sheet date. This requirement is effective for fiscal years ending after December 15, 2008. The other provisions of SFAS 158 were implemented by the Company as of December 31, 2006. The Company does not expect the implementation of the measurement date provisions of SFAS 158 to have a material impact on itsCompany’s consolidated financial statements.
In February 2007, the FASB issued Statement of Financial Accounting StandardsSFAS No. 159, “The Fair Value Option for Financial Assets and Financial Liabilities” (SFAS 159). This Statement permits entities to choose to measure many financial instruments and
- 41 -
certain other items at fair value. The objective of this Statement is to improve financial reporting by providing entities with the opportunity to mitigate volatility in reported earnings caused by measuring related assets and liabilities differently without having to apply complex hedge accounting provisions. The fair value option established by this Statement permits all entities to choose to measure eligible items at fair value at specified election dates. A business entity shall report unrealized gains and losses on items for which the fair value option has been elected in earnings at each subsequent reporting date. The fair value option may be applied instrument by instrument and is irrevocable. SFAS 159 is effective as of the beginning of an entity’s first fiscal year that begins after November 15, 2007, with early adoption available in certain circumstances. The Company does not expect the implementation ofadopted SFAS 159 effective January 1, 2008. The Company decided not to report any existing financial assets or liabilities at fair value that are not already reported, thus the adoption of this statement did not have a material impact on itsthe Company’s consolidated financial statements.
In December 2007, the FASB issued Statement of Financial Accounting StandardsSFAS No. 141(R), “Business Combinations” (SFAS 141(R)). The Standard will significantly change the financial accounting and reporting of business combination transactions. SFAS 141(R) establishes principles for how an acquirer recognizes and measures the identifiable assets acquired, liabilities assumed, and any noncontrolling interest in the acquiree; recognizes and measures the goodwill acquired in the business combination or a gain from a bargain purchase; and determines what information to disclose to enable users of the financial statements to evaluate the nature and financial effects of the business combination. SFAS 141(R) is effective for acquisition dates on or after the beginning of an entity’s first year that begins after December 15, 2008. The Company does not expect the implementation of SFAS 141(R) to have a material impact on its consolidated financial statements.statements, at this time.
In December 2007, the FASB issued Statement of Financial Accounting StandardsSFAS No. 160, “Noncontrolling Interests in Consolidated Financial Statements an Amendment of ARB No. 51” (SFAS 160). The Standard will significantly change the financial accounting and reporting of noncontrolling (or minority) interests in consolidated financial statements. SFAS 160 is effective as of the beginning of an entity’s first fiscal year that begins after December 15, 2008, with early adoption prohibited. The Company does not expect the implementation of SFAS 160 to have a material impact on its consolidated financial statements.
– 41 –
In September 2006, the Emerging Issues Task Force (EITF) issued EITF 06-4, “Accounting for Deferred Compensation and Postretirement Benefit Aspects of Endorsement Split-Dollar Life Insurance Arrangements.” This consensus concludes that for a split-dollar life insurance arrangement within the scope ofstatements, at this Issue, an employer should recognize a liability for future benefits in accordance with SFAS 106 (if, in substance, a postretirement benefit plan exists) or APB Opinion No. 12 (if the arrangement is, in substance, an individual deferred compensation contract) based on the substantive agreement with the employee. The consensus is effective for fiscal years beginning after December 15, 2007, with early application permitted. The Company does not expect the implementation of EITF 06-4 to have a material impact on its consolidated financial statements.
In November 2006, the EITF issued “Accounting for Collateral Assignment Split-Dollar Life Insurance Arrangements” (EITF 06-10). In this Issue, a consensus was reached that an employer should recognize a liability for the postretirement benefit related to a collateral assignment split-dollar life insurance arrangement in accordance with either SFAS 106 or APB Opinion No. 12, as appropriate, if the employer has agreed to maintain a life insurance policy during the employee’s retirement or provide the employee with a death benefit based on the substantive agreement with the employee. A consensus also was reached that an employer should recognize and measure an asset based on the nature and substance of the collateral assignment split-dollar life insurance arrangement. The consensuses are effective for fiscal years beginning after December 15, 2007, including interim periods within those fiscal years, with early application permitted. The Company does not expect the implementation of EITF 06-10 to have a material impact on its consolidated financial statements.
In February 2007, the FASB issued FSP No. FAS 158-1, “Conforming Amendments to the Illustrations in FASB Statements No. 87, No. 88 and No. 106 and to the Related Staff Implementation Guides.” This FSP provides conforming amendments to the illustrations in SFAS 87, 88, and 106 and to related staff implementation guides as a result of the issuance of SFAS 158. The conforming amendments made by this FSP are effective as of the effective dates of SFAS 158. The unaffected guidance that this FSP codifies into SFAS 87, 88, and 106 does not contain new requirements and therefore does not require a separate effective date or transition method. The Company does not expect the implementation of FSP No. FAS 158-1 to have a material impact on its consolidated financial statements.time.
In November 2007, the Securities and Exchange Commission (SEC) issued Staff Accounting Bulletin No. 109,No.109, “Written Loan Commitments Recorded at Fair Value Throughthrough Earnings” (SAB 109). SAB 109 expresses the current view of the staff that the expected net future cash flows related to the associated servicing of the loan should be included in the measurement of all written loan commitments that are accounted for at fair value through earnings. SEC registrants are expected to apply the views in Question 1 of SAB 109 on a prospective basis to derivative loan commitments issued or modified in fiscal quarters beginning after December 15, 2007. The Company does not expect the implementationImplementation of SAB 109 todid not have a material impact on itsthe Company’s consolidated financial statements.
In December 2007, the SEC issued Staff Accounting Bulletin No. 110, “Use of a Simplified Method in Developing Expected Term of Share Options” (SAB 110). SAB 110 expresses the current view of the staff that it will accept a company’s election to use the simplified method discussed in SAB 107 for estimating the expected term of “plain vanilla” share options regardless of whether the company has sufficient information to make more refined estimates. The staff noted that it understands that detailed information about employee exercise patterns may not be widely available by December 31, 2007. Accordingly, the staff will continue to accept, under certain circumstances, the use of the simplified method beyond December 31, 2007. The Company does not expect the implementationImplementation of SAB 110 did not have a material impact on the Company’s consolidated financial statements.
In March 2008, the FASB issued SFAS No. 161, “Disclosures about Derivative Instruments and Hedging Activities – an amendment of SFAS No. 133,” (SFAS No. 161). SFAS No. 161 requires that an entity provide enhanced disclosures related to derivative and hedging activities. SFAS No. 161 is effective for the Company on January 1, 2009 and is not expected to have a material impact on the Company’s consolidated financial statements.
In April 2008, the FASB issued FASB Staff Position (FSP) No. 142-3, “Determination of the Useful Life of Intangible Assets” (FSP No. 142-3). FSP No. 142-3 amends the factors an entity should consider in developing renewal or extension assumptions used in determining the useful life of recognized intangible assets under FASB SFAS No. 142, “Goodwill and Other Intangible Assets” (SFAS No. 142). The intent of FSP No. 142-3 is to improve the consistency between the useful life of a recognized intangible asset under SFAS No. 142 and the period of expected cash flows used to measure the fair value of the assets under SFAS No. 141(R). FSP No. 142-3 is
- 42 -
effective for the Company on January 1, 2009, and applies prospectively to intangible assets that are acquired individually or with a group of other assets in business combinations and asset acquisitions. The adoption of FSP No. 142-3 is not expected to have a material impact on the Company’s consolidated financial statements.
In May 2008, the FASB issued SFAS No. 162, “The Hierarchy of Generally Accepted Accounting Principles,” (SFAS No. 162). SFAS No. 162 identifies the sources of accounting principles and the framework for selecting the principles to be used in the preparation of financial statements of nongovernmental entities that are presented in conformity with generally accepted accounting principles. SFAS No. 162 is effective 60 days following the SEC’s approval of the Public Company Accounting Oversight Board amendments to AU Section 411, “The Meaning of Present Fairly in Conformity With Generally Accepted Accounting Principles.” Management does not expect the adoption of the provision of SFAS No. 162 to have any impact on the Company’s consolidated financial statements.
In September 2008, the FASB issued FSP FAS 133-1 and FIN 45-4, “Disclosures about Credit Derivatives and Certain Guarantees: An Amendment of FASB Statement No. 133 and FASB Interpretation No. 45; and Clarification of the Effective Date of FASB Statement No. 161,” (FSP 133-1 and FIN 45-4). FSP 133-1 and FIN 45-4 require a seller of credit derivatives to disclose information about its credit derivatives and hybrid instruments that have embedded credit derivatives to enable users of financial statements to assess their potential effect on its financial position, financial performance and cash flows. The disclosures required by FSP 133-1 and FIN 45-4 will be effective for the Company on December 31, 2008 and are not expected to have a material impact on the Company’s consolidated financial statements.
In October 2008, the FASB issued FSP FAS 157-3, “Determining the Fair Value of a Financial Asset When the Market for That Asset Is Not Active,” (FSP 157-3). FSP 157-3 clarifies the application of SFAS No. 157 in determining the fair value of a financial asset during periods of inactive markets. FSP 157-3 was effective as of September 30, 2008 and did not have material impact on the Company’s consolidated financial statements.
In December 2008, the FASB issued FSP No. FAS 140-4 and FIN 46(R)-8, “Disclosures by Public Entities (Enterprises) about Transfers of Financial Assets and Interests in Variable Interest Entities.” FSP No. FAS 140-4 and FIN 46(R)-8 requires enhanced disclosures about transfers of financial assets and interests in variable interest entities. The FSP is effective for interim and annual periods ending after December 15, 2008. Since the FSP requires only additional disclosures concerning transfers of financial assets and interest in variable interest entities, adoption of the FSP will not affect the Company’s financial condition, results of operations or cash flows.
In January 2009, the FASB reached a consensus on EITF Issue 99-20-1. This FSP amends the impairment guidance in EITF Issue No. 99-20, “Recognition of Interest Income and Impairment on Purchased Beneficial Interests and Beneficial Interests That Continue to Be Held by a Transferor in Securitized Financial Assets,” to achieve more consistent determination of whether an other-than-temporary impairment has occurred. The FSP also retains and emphasizes the objective of an other-than-temporary impairment assessment and the related disclosure requirements in FASB Statement No. 115, “Accounting for Certain Investments in Debt and Equity Securities,” and other related guidance. The FSP is effective for interim and annual reporting periods ending after December 15, 2008 and shall be applied prospectively. The FSP was effective as of December 31, 2008 and did not have a material impact on the Company’s consolidated financial statements.
NOTE 2, Restrictions on Cash and Amounts Due from Banks
The Company must maintain a reserve against its deposits in accordance with Regulation D of the Federal Reserve Act. For the final weekly reporting period in the years ended December 20072008 and 2006,2007, the aggregate amount of daily average required reserves, net of vault cash, was approximately $350 thousand for both years.
TheDue to the Temporary Liquidity Guarantee Program, all of the deposits that the Company has approximately $16.1 million in deposits inhad at other financial institutions in excessas of amountsDecember 31, 2008 are fully insured by the FDIC at December 31, 2007.FDIC.
– 42 –
NOTE 3, Securities Portfolio
At December 31, 2007,2008, the securities portfolio iswas composed of securities classified as held-to-maturity and available-for-sale, in conjunction with SFAS 115. Securities held-to-maturity are carried at cost, adjusted for amortization of premiums and accretion of discounts, and securities available-for-sale are carried at fair value.
- 43 -
The amortized cost and fair value of securities held-to-maturity at December 31, 20072008 and 20062007 were:
| Amortized Cost | Gross Unrealized Gains | Gross Unrealized Losses | Fair Value | ||||||||||
| (in thousands) | |||||||||||||
December 31, 2007 | |||||||||||||
Obligations of U. S. Government agencies | $ | 2,300 | $ | 7 | $ | (2 | ) | $ | 2,305 | ||||
Obligations of state and political subdivisions | 604 | 38 | — | 642 | |||||||||
| $ | 2,904 | $ | 45 | $ | (2 | ) | $ | 2,947 | |||||
December 31, 2006 | |||||||||||||
Obligations of U. S. Government agencies | $ | 2,700 | $ | — | $ | (24 | ) | $ | 2,676 | ||||
Obligations of state and political subdivisions | 732 | 46 | — | 778 | |||||||||
| $ | 3,432 | $ | 46 | $ | (24 | ) | $ | 3,454 | |||||
– 43 –
| Amortized Cost | Gross Unrealized Gains | Gross Unrealized Losses | Fair Value | ||||||||||
| (in thousands) | |||||||||||||
December 31, 2008 | |||||||||||||
Obligations of U. S. Government agencies | $ | 2,600 | $ | 28 | $ | — | $ | 2,628 | |||||
Obligations of state and political subdivisions | 467 | 21 | — | 488 | |||||||||
| $ | 3,067 | $ | 49 | $ | — | $ | 3,116 | ||||||
December 31, 2007 | |||||||||||||
Obligations of U. S. Government agencies | $ | 2,300 | $ | 7 | $ | (2 | ) | $ | 2,305 | ||||
Obligations of state and political subdivisions | 604 | 38 | — | 642 | |||||||||
| $ | 2,904 | $ | 45 | $ | (2 | ) | $ | 2,947 | |||||
The amortized cost and fair values of securities available-for-sale at December 31, 20072008 and 20062007 were:
| Amortized Cost | Gross Unrealized Gains | Gross Unrealized Losses | Fair Value | |||||||||||||||||||||||
| (in thousands) | ||||||||||||||||||||||||||
December 31, 2008 | ||||||||||||||||||||||||||
U. S. Treasury securities | $ | 399 | $ | 1 | $ | — | $ | 400 | ||||||||||||||||||
Obligations of U. S. Government agencies | 77,241 | 871 | — | 78,112 | ||||||||||||||||||||||
Obligations of state and political subdivisions | 14,959 | 156 | — | 15,115 | ||||||||||||||||||||||
Mortgage-backed securities | 2,462 | — | (9 | ) | 2,453 | |||||||||||||||||||||
Money market investments | 908 | — | — | 908 | ||||||||||||||||||||||
Total | $ | 95,969 | $ | 1,028 | $ | (9 | ) | $ | 96,988 | |||||||||||||||||
| Amortized Cost | Gross Unrealized Gains | Gross Unrealized Losses | Fair Value | |||||||||||||||||||||||
| (in thousands) | ||||||||||||||||||||||||||
December 31, 2007 | ||||||||||||||||||||||||||
U. S. Treasury securities | $ | 986 | $ | 2 | $ | — | $ | 988 | $ | 986 | $ | 2 | $ | — | $ | 988 | ||||||||||
Obligations of U. S. Government agencies | 95,760 | 233 | (282 | ) | 95,711 | 95,760 | 233 | (282 | ) | 95,711 | ||||||||||||||||
Obligations of state and political subdivisions | 25,031 | 310 | — | 25,341 | 25,031 | 310 | — | 25,341 | ||||||||||||||||||
Money market investments | 1,604 | — | — | 1,604 | 1,604 | — | — | 1,604 | ||||||||||||||||||
Federal Home Loan Bank stock—restricted | 5,115 | — | — | 5,115 | ||||||||||||||||||||||
Federal Reserve Bank stock—restricted | 169 | — | — | 169 | ||||||||||||||||||||||
Other marketable equity securities | 169 | — | (41 | ) | 128 | 50 | — | (41 | ) | 9 | ||||||||||||||||
Total | $ | 128,834 | $ | 545 | $ | (323 | ) | $ | 129,056 | $ | 123,431 | $ | 545 | $ | (323 | ) | $ | 123,653 | ||||||||
December 31, 2006 | ||||||||||||||||||||||||||
U. S. Treasury securities | $ | 981 | $ | — | $ | — | $ | 981 | ||||||||||||||||||
Obligations of U. S. Government agencies | 148,981 | — | (2,895 | ) | 146,086 | |||||||||||||||||||||
Obligations of state and political subdivisions | 29,157 | 458 | — | 29,615 | ||||||||||||||||||||||
Money market investments | 721 | — | — | 721 | ||||||||||||||||||||||
Federal Home Loan Bank stock—restricted | 7,094 | — | — | 7,094 | ||||||||||||||||||||||
Federal Reserve Bank stock—restricted | 169 | — | — | 169 | ||||||||||||||||||||||
Other marketable equity securities | 168 | — | (28 | ) | 140 | |||||||||||||||||||||
Total | $ | 187,271 | $ | 458 | $ | (2,923 | ) | $ | 184,806 | |||||||||||||||||
Securities with an amortized cost of $91.8$82.8 million and $125.5$91.8 million at December 31, 20072008 and 2006,2007, respectively, were pledged to secure public deposits and securities sold under agreements to repurchase, FHLB advances and for other purposes required or permitted by law. The FHLB stock and the FRB stock are stated at cost as these are restricted securities without readily determinable fair values.
- 44 -
The amortized cost and fair value of securities at December 31, 20072008 by contractual maturity are shown below.
| December 31, 2007 | ||||||||||||
| Available-For-Sale | Held-To-Maturity | |||||||||||
| Amortized Cost | Fair Value | Amortized Cost | Fair Value | |||||||||
| (in thousands) | ||||||||||||
Due in one year or less | $ | 45,184 | $ | 45,123 | $ | 1,100 | $ | 1,099 | ||||
Due after one year through five years | 69,215 | 69,446 | 1,804 | 1,848 | ||||||||
Due after five years through ten years | 6,413 | 6,490 | — | — | ||||||||
Due after ten years | 965 | 981 | — | — | ||||||||
Total debt securities | 121,777 | 122,040 | 2,904 | 2,947 | ||||||||
Other securities without stated maturities | 7,057 | 7,016 | — | — | ||||||||
Total securities | $ | 128,834 | $ | 129,056 | $ | 2,904 | $ | 2,947 | ||||
– 44 –
| December 31, 2008 | ||||||||||||
| Available-For-Sale | Held-To-Maturity | |||||||||||
| Amortized Cost | Fair Value | Amortized Cost | Fair Value | |||||||||
| (in thousands) | ||||||||||||
Due in one year or less | $ | 30,252 | $ | 30,561 | $ | 300 | $ | 300 | ||||
Due after one year through five years | 60,340 | 61,015 | 2,767 | 2,816 | ||||||||
Due after five years through ten years | 3,554 | 3,583 | — | — | ||||||||
Due after ten years | 915 | 921 | — | — | ||||||||
Total debt securities | 95,061 | 96,080 | 3,067 | 3,116 | ||||||||
Other securities without stated maturities | 908 | 908 | — | — | ||||||||
Total securities | $ | 95,969 | $ | 96,988 | $ | 3,067 | $ | 3,116 | ||||
Information pertaining to securities with gross unrealized losses at December 31, 20072008 aggregated by investment category and length of time that individual securities have been in a continuous loss position, follows:
| Year Ended December 31, 2007 | ||||||||||||||||||
| Less Than Twelve Months | More Than Twelve Months | Total | ||||||||||||||||
| Gross Unrealized Losses | Fair Value | Gross Unrealized Losses | Fair Value | Gross Unrealized Losses | Fair Value | |||||||||||||
| (in thousands) | ||||||||||||||||||
| Securities Available-for-Sale | ||||||||||||||||||
Debt securities: | ||||||||||||||||||
Obligations of U. S. Government agencies | $ | — | $ | — | $ | 282 | $ | 55,480 | $ | 282 | $ | 55,480 | ||||||
Total debt securities | — | — | 282 | 55,480 | 282 | 55,480 | ||||||||||||
Other marketable equity securities | — | — | 41 | 9 | 41 | 9 | ||||||||||||
Total securities available-for-sale | $ | — | $ | — | $ | 323 | $ | 55,489 | $ | 323 | $ | 55,489 | ||||||
| Securities Held-to-Maturity | ||||||||||||||||||
Obligations of U. S. Government agencies | $ | — | $ | — | $ | 2 | $ | 899 | $ | 2 | $ | 899 | ||||||
Total securities held-to-maturity | $ | — | $ | — | $ | 2 | $ | 899 | $ | 2 | $ | 899 | ||||||
Total | $ | — | $ | — | $ | 325 | $ | 56,388 | $ | 325 | $ | 56,388 | ||||||
| Year Ended December 31, 2006 | ||||||||||||||||||
| Less Than Twelve Months | More Than Twelve Months | Total | ||||||||||||||||
| Gross Unrealized Losses | Fair Value | Gross Unrealized Losses | Fair Value | Gross Unrealized Losses | Fair Value | |||||||||||||
| (in thousands) | ||||||||||||||||||
| Securities Available-for-Sale | ||||||||||||||||||
Debt securities: | ||||||||||||||||||
Obligations of U. S. Government agencies | $ | — | $ | — | $ | 2,895 | $ | 146,087 | $ | 2,895 | $ | 146,087 | ||||||
Obligations of state and political subdivisions | — | — | — | — | — | — | ||||||||||||
Total debt securities | — | — | 2,895 | 146,087 | 2,895 | 146,087 | ||||||||||||
Other marketable equity securities | — | — | 28 | 22 | 28 | 22 | ||||||||||||
Total securities available-for-sale | $ | — | $ | — | $ | 2,923 | $ | 146,109 | $ | 2,923 | $ | 146,109 | ||||||
| Securities Held-to-Maturity | ||||||||||||||||||
Obligations of U. S. Government agencies | $ | 1 | $ | 499 | $ | 23 | $ | 1,677 | $ | 24 | $ | 2,176 | ||||||
Total securities held-to-maturity | $ | 1 | $ | 499 | $ | 23 | $ | 1,677 | $ | 24 | $ | 2,176 | ||||||
Total | $ | 1 | $ | 499 | $ | 2,946 | $ | 147,786 | $ | 2,947 | $ | 148,285 | ||||||
| Year Ended December 31, 2008 | ||||||||||||||||||
| Less Than Twelve Months | More Than Twelve Months | Total | ||||||||||||||||
| Gross Unrealized Losses | Fair Value | Gross Unrealized Losses | Fair Value | Gross Unrealized Losses | Fair Value | |||||||||||||
| (in thousands) | ||||||||||||||||||
| Securities Available-for-Sale | ||||||||||||||||||
Debt securities: | ||||||||||||||||||
Mortgage-backed securities | $ | 9 | $ | 2,453 | $ | — | $ | — | $ | 9 | $ | 2,453 | ||||||
Total securities available-for-sale | $ | 9 | $ | 2,453 | $ | — | $ | — | $ | 9 | $ | 2,453 | ||||||
| Year Ended December 31, 2007 | ||||||||||||||||||
| Less Than Twelve Months | More Than Twelve Months | Total | ||||||||||||||||
| Gross Unrealized Losses | Fair Value | Gross Unrealized Losses | Fair Value | Gross Unrealized Losses | Fair Value | |||||||||||||
| (in thousands) | ||||||||||||||||||
| Securities Available-for-Sale | ||||||||||||||||||
Debt securities: | ||||||||||||||||||
Obligations of U. S. Government agencies | $ | — | $ | — | $ | 282 | $ | 55,480 | $ | 282 | $ | 55,480 | ||||||
Total debt securities | — | — | 282 | 55,480 | 282 | 55,480 | ||||||||||||
Other marketable equity securities | — | — | 41 | 9 | 41 | 9 | ||||||||||||
Total securities available-for-sale | $ | — | $ | — | $ | 323 | $ | 55,489 | $ | 323 | $ | 55,489 | ||||||
| Securities Held-to-Maturity | ||||||||||||||||||
Obligations of U. S. Government agencies | $ | — | $ | — | $ | 2 | $ | 899 | $ | 2 | $ | 899 | ||||||
Total securities held-to-maturity | $ | — | $ | — | $ | 2 | $ | 899 | $ | 2 | $ | 899 | ||||||
Total | $ | — | $ | — | $ | 325 | $ | 56,388 | $ | 325 | $ | 56,388 | ||||||
- 45 -
Management evaluates securities for other-than-temporary impairment on at least a quarterly basis, and more frequently when economic or market concerns warrant such evaluation. Consideration is given to (i) the length of time and the extent to which the fair value has been less than cost, (ii) the financial condition and near-term prospects of the issuer, and (iii) the intent and ability of the Company to retain its investment in the issuer for a period of time sufficient to allow for any anticipated recovery in fair value.
– 45 –
At December 31, 2008, 2 debt securities had unrealized losses with aggregate depreciation of 0.009% from the Company’s amortized cost basis. At December 31, 2007, 36 debt securities had unrealized losses with aggregate depreciation of 0.2% from the Company’s amortized cost basis. At December 31, 2006, 95 debt securities had unrealized losses with aggregate depreciation of 1.5% from the Company’s amortized cost basis. TheseThe 2008 unrealized losses relate principally to U.S. Government agencymortgage-backed securities. In analyzing an issuer’s financial condition, management considers whether the securities are issued by the federal government or its agencies, whether downgrades by bond rating agencies have occurred, and industry analysts’ reports. The unrealized losses are a result of interest rates and not credit issues. As the Company has the ability to hold debt securities until maturity, or for the foreseeable future if classified as available for sale, no declines are deemed to be other than temporary.
NOTE 4, Loans
A summary of the balances of loans follows:
| 2007 | 2006 | 2008 | 2007 | |||||||||||||
| (in thousands) | (in thousands) | |||||||||||||||
Commercial and other loans | $ | 70,741 | $ | 67,697 | $ | 73,086 | $ | 70,741 | ||||||||
Real estate loans: | ||||||||||||||||
Construction | 56,007 | 81,227 | 60,604 | 56,007 | ||||||||||||
Farmland | 44 | 220 | 726 | 44 | ||||||||||||
Equity lines of credit | 30,383 | 26,809 | 33,624 | 30,383 | ||||||||||||
1-4 family residential | 123,006 | 120,915 | 134,965 | 123,006 | ||||||||||||
Multifamily residential | 7,031 | 5,898 | 6,623 | 7,031 | ||||||||||||
Nonfarm nonresidential | 254,790 | 213,606 | 283,983 | 254,790 | ||||||||||||
Installment loans to individuals | 51,912 | 63,670 | 40,789 | 51,912 | ||||||||||||
Tax-exempt loans | 2,992 | 3,191 | 2,738 | 2,992 | ||||||||||||
Total loans | 596,906 | 583,233 | 637,138 | 596,906 | ||||||||||||
Less: Allowance for loan losses | (5,130 | ) | (4,784 | ) | (6,406 | ) | (5,130 | ) | ||||||||
Net deferred loan costs | 238 | 360 | 314 | 238 | ||||||||||||
Loans, net | $ | 592,014 | $ | 578,809 | $ | 631,046 | $ | 592,014 | ||||||||
At December 31, 20072008 and 2006,2007, there were $351.2 million and $317.8 million, or 55.1% and $300.7 million, or 53.2% and 51.6%, respectively of total loans concentrated in commercial real estate. Commercial real estate for purposes of this note includes all construction loans, loans secured by multifamily residential properties and loans secured by nonfarm, nonresidential properties. At December 31, 20072008 and 2006,2007, construction loans represented 9.4%9.5% and 13.9%9.4% of total loans, loans secured by multifamily residential properties represented 1.2%1.0% and 1.0%1.2%, and loans secured by nonfarm, nonresidential properties represented 42.7%44.6% and 36.6%42.7%, respectively. Construction loans at December 31, 2008 and 2007 and 2006 included $32.6$39.7 million and $27.6$32.6 million in loans to commercial builders of single family housing in the Hampton Roads market, representing 5.5%6.2% and 4.7%5.5% of total loans, respectively.
At December 31, 2007, 2006 and 2005 impaired loans amounted to $9.3 million, $3.1 million and $2.9 million, respectively. Included in the allowance for loan losses was $655 thousand related to $9.3 million of impaired loans at December 31, 2007, $485 thousand related to $3.1 million of impaired loans at December 31, 2006, and $467 thousand related to $2.9 million of impaired loans at December 31, 2005. For the years ended December 31, 2007, 2006 and 2005, the average recorded investment in impaired loans was $9.5 million, $2.8 million and $2.5 million, respectively; and $610 thousand, $196 thousand and $153 thousand, respectively, of interest income was recognized on loans while they were impaired.
–- 46 –-
Information concerning loans which are contractually past due or in non-accrual status asThe following is a summary of December 31, is as follows:information pertaining to impaired and nonaccrual loans:
| 2007 | 2006 | |||||
| (in thousands) | ||||||
Contractually past due loans—past due 90 days or more and still accruing interest | $ | 623 | $ | 826 | ||
Loans which are in non-accrual status | $ | 84 | $ | 458 | ||
| December 31, | ||||||
| 2008 | 2007 | |||||
| (in thousands) | ||||||
Impaired loans without a valuation allowance | $ | 12,023 | $ | 7,939 | ||
Impaired loans with a valuation allowance | 888 | 84 | ||||
Total impaired loans | $ | 12,911 | $ | 8,023 | ||
Valuation allowance related to impaired loans | $ | 269 | $ | 27 | ||
Total nonaccrual loans | $ | 1,045 | $ | 84 | ||
Total loans past-due ninety days or more and still accruing interest | $ | 3,529 | $ | 623 | ||
| Years Ended December 31, | |||||||||
| 2008 | 2007 | 2006 | |||||||
| (in thousands) | |||||||||
Average investment in impaired loans | $ | 10,467 | $ | 5,562 | $ | 2,800 | |||
Interest income recognized on impaired loans | $ | 393 | $ | 610 | $ | 196 | |||
Interest that would have been recognized if loans had been accruing | $ | 459 | $ | 79 | $ | 38 | |||
The Bank has had, and may be expected to have in the future, banking transactions in the ordinary course of business with directors, executive officers, their immediate families and companies in which they are principal owners (commonly referred to as related parties), on the same terms, including interest rates and collateral, as those prevailing at the time for comparable transactions with others. The aggregate direct and indirect loans to these persons totaled $2.9 million and $3.7 million at December 31, 20072008 and 2006, respectively.2007. These totals do not include loans made in the ordinary course of business to other companies where a director or executive officer of the Bank was also a director or officer of such company but not a principal owner. None of the directors or executive officers had direct or indirect loans exceeding 10% of stockholders’ equity at December 31, 2007.2008. Changes to the outstanding loan balances are as follows:
| 2007 | 2006 | 2008 | 2007 | |||||||||||||
| (in thousands) | (in thousands) | |||||||||||||||
Balance, beginning of year | $ | 3,675 | $ | 3,819 | $ | 2,867 | $ | 3,675 | ||||||||
Additions | 1,839 | 1,980 | 280 | 1,839 | ||||||||||||
Reductions | (2,647 | ) | (2,124 | ) | (299 | ) | (2,647 | ) | ||||||||
Balance, end of year | $ | 2,867 | $ | 3,675 | $ | 2,848 | $ | 2,867 | ||||||||
NOTE 5, Allowance for Loan Losses
Changes in the allowance for loan losses are as follows:
| 2007 | 2006 | 2005 | 2008 | 2007 | 2006 | |||||||||||||||||||
| (in thousands) | (in thousands) | |||||||||||||||||||||||
Balance, beginning of year | $ | 4,784 | $ | 4,448 | $ | 4,303 | $ | 5,130 | $ | 4,784 | $ | 4,448 | ||||||||||||
Recoveries | 381 | 331 | 370 | 463 | 381 | 331 | ||||||||||||||||||
Provision for loan losses | 1,000 | 1,200 | 1,050 | 2,400 | 1,000 | 1,200 | ||||||||||||||||||
Loans charged off | (1,035 | ) | (1,195 | ) | (1,275 | ) | (1,587 | ) | (1,035 | ) | (1,195 | ) | ||||||||||||
Balance, end of year | $ | 5,130 | $ | 4,784 | $ | 4,448 | $ | 6,406 | $ | 5,130 | $ | 4,784 | ||||||||||||
–- 47 –-
NOTE 6, Premises and Equipment
At December 31, premises and equipment consisted of:
| 2007 | 2006 | 2008 | 2007 | |||||||||
| (in thousands) | (in thousands) | |||||||||||
Land | $ | 7,854 | $ | 7,711 | $ | 7,711 | $ | 7,854 | ||||
Buildings | 21,697 | 20,188 | 22,065 | 21,697 | ||||||||
Leasehold improvements | 837 | 964 | 855 | 837 | ||||||||
Furniture, fixtures and equipment | 13,074 | 12,527 | 14,400 | 13,074 | ||||||||
| 43,462 | 41,390 | 45,031 | 43,462 | |||||||||
Less accumulated depreciation and amortization | 16,460 | 14,980 | 17,888 | 16,460 | ||||||||
| $ | 27,002 | $ | 26,410 | $ | 27,143 | $ | 27,002 | |||||
Depreciation expense for the years ended December 31, 2008, 2007 2006 and 20052006 amounted to $1.8 million, $1.7 million $1.6 million and $1.4$1.6 million, respectively.
NOTE 7, Deposits
The aggregate amount of time deposits in denominations of $100,000 or more at December 31, 2008 and 2007 and 2006 was $118.6$127.8 million and $107.7$118.6 million, respectively.
At December 31, 2007,2008, the scheduled maturities of time deposits (in thousands) are as follows:
2008 | $ | 223,477 | ||||
2009 | 57,542 | $ | 234,532 | |||
2010 | 21,796 | 72,986 | ||||
2011 | 7,064 | 16,467 | ||||
2012 | 4,479 | 4,648 | ||||
Thereafter | 14 | |||||
2013 | 7,031 | |||||
| $ | 314,372 | $ | 335,664 | |||
NOTE 8, Federal Home Loan Bank Advances and Other Borrowings
The Bank’s short-term borrowings include federal funds purchased, repurchase agreements (including $171 thousand and $248 thousand to directors of the Company in 2007 and 2006, respectively) and U. S. Treasury demand notes. Securities sold under agreements to repurchase, which totaled $32,855 and $63,691 as of December 31, 2008 and 2007, respectively, are classified as secured borrowings generally mature within one to four days from the transaction date. Securities sold under agreements to repurchase are reflected at the amount of cash received in connection with the transaction. The Company may be required to provide additional collateral based on the fair value of the underlying securities. The U. S.U.S. Treasury demand notes are subject to call by the U. S.U.S. Treasury with interest paid monthly at the rate of 25 basis points ( 1/4%) below the federal funds rate. U.S. Treasury demand notes totaled $427 thousand and $534 thousand as of December 31, 2008 and 2007, respectively.
The Bank’s fixed-rate, long-term debt of $80.0$70.0 million at December 31, 20072008 matures through 2016. The Bank had $80.0 million in fixed-rate, long-term debt at December 31, 2007. At December 31, 20072008 and 2006,2007, the interest rates ranged from 4.74% to 6.49% and from 3.33% to 6.49%, respectively.. At December 31, 20072008 and 2006,2007, the weighted average interest rate was 5.08%5.12% and 4.83%5.08%, respectively.
Advances on FHLB advances are secured by a blanket lien on qualified 1 – 4 family residential real estate loans and by selected commercial real estate loans.
–- 48 –-
The contractual maturities of long-term debt are as follows:
| December 31, | December 31, | |||||||||||||||||||||||||||||
| 2007 | 2006 | 2008 | 2007 | |||||||||||||||||||||||||||
| Fixed Rate | Floating Rate | Total | Fixed Rate | Floating Rate | Total | Fixed Rate | Total | Fixed Rate | Total | |||||||||||||||||||||
| (in thousands) | (in thousands) | |||||||||||||||||||||||||||||
Due in 2007 | — | — | — | 10,000 | 15,000 | 25,000 | ||||||||||||||||||||||||
Due in 2008 | 10,000 | — | 10,000 | 10,000 | — | 10,000 | — | — | 10,000 | 10,000 | ||||||||||||||||||||
Due in 2009 | 5,000 | — | 5,000 | 5,000 | — | 5,000 | 5,000 | 5,000 | 5,000 | 5,000 | ||||||||||||||||||||
Due in 2010 | 30,000 | — | 30,000 | 15,000 | — | 15,000 | 30,000 | 30,000 | 30,000 | 30,000 | ||||||||||||||||||||
Due in 2012 | 10,000 | — | 10,000 | 5,000 | — | 5,000 | 10,000 | 10,000 | 10,000 | 10,000 | ||||||||||||||||||||
Due in 2013 | — | — | — | 10,000 | 5,000 | 15,000 | ||||||||||||||||||||||||
Due in 2016 | 25,000 | — | 25,000 | 50,000 | — | 50,000 | 25,000 | 25,000 | 25,000 | 25,000 | ||||||||||||||||||||
Total long-term debt | $ | 80,000 | $ | — | $ | 80,000 | $ | 105,000 | $ | 20,000 | $ | 125,000 | $ | 70,000 | $ | 70,000 | $ | 80,000 | $ | 80,000 | ||||||||||
NOTE 9, Employee Benefit Plans
Stock Option PlansPlan
The Company hasOn March 9, 2008, the Company’s 1998 stock option plans which have 476,086plan expired. Currently, options to purchase 286,899 shares of common stock reserved for grants to key employees and directors. Currently, 363,041 shares of common stock issued upon exercise of options granted under these plansthe stock option plan are outstanding at December 31, 2007.2008. The exercise price of each option equals the market price of the Company’s common stock on the date of the grant and an option’s maximum term is ten years. All share data have been adjusted to reflect the 5 for 4 stock split in the form of a dividend declared on August 16, 2007 and paid on October 1, 2007.
Stock option plan activity for the year ended December 31, 20072008 is summarized below:
| Shares | Weighted Average Exercise Price | Weighted Average Remaining Contractual Life (in years) | Aggregate Intrinsic Value | Shares | Weighted Average Exercise Price | Weighted Average Remaining Contractual Life (in years) | Aggregate Intrinsic Value (in thousands) | |||||||||||||||
Options outstanding, January 1, 2007 | 304,676 | $ | 17.82 | |||||||||||||||||||
Options outstanding, January 1, 2008 | 363,041 | $ | 18.99 | |||||||||||||||||||
Granted | 114,960 | — | — | — | ||||||||||||||||||
Exercised | (32,845 | ) | 11.12 | (3,062 | ) | 12.65 | ||||||||||||||||
Canceled or expired | (23,750 | ) | 20.05 | (73,080 | ) | 22.18 | ||||||||||||||||
Options outstanding, December 31, 2007 | 363,041 | $ | 18.99 | 5.60 | $ | 870,923 | ||||||||||||||||
Options exercisable, December 31, 2007 | 248,081 | $ | 18.50 | 3.66 | $ | 870,823 | ||||||||||||||||
Options outstanding, December 31, 2008 | 286,899 | 18.25 | 5.67 | $ | 727 | |||||||||||||||||
Options exercisable, December 31, 2008 | 199,931 | 17.46 | 4.31 | $ | 727 | |||||||||||||||||
The aggregate intrinsic value of a stock option in the table above represents the total pre-tax intrinsic value (the amount by which the current market value of the underlying stock exceeds the exercise price of the option) that would have been received by the option holders had all option holders exercised their options on December 31, 2007.2008. This amount changes based on changes in the market value of the Company’s stock.
The fair value of each option granted in 2007 is estimated using the Black Scholes option pricing model with the following assumptions: dividend yield of 2.46%, expected volatility of 27.398%, risk-free interest rate of 4.47% and an expected option life of six and one-half years. The grant date fair value of options granted during 2007 was $5.48. There were no options granted in 20062008 and 2005.2006.
– 49 –
The total proceeds of the in-the-money options exercised during the year ended December 31, 20072008 and December 31, 20062007 was $365$39 thousand and $434$365 thousand. Total intrinsic value of options exercised during years ended December 31, 2008, 2007 and 2006 and 2005 was $14 thousand, $344 thousand $153 thousand and $94$153 thousand, respectively.
- 49 -
As of December 31, 2008, there was $478 thousand unrecognized compensation expense. As of December 31, 2007 there was $543 thousand unrecognized compensation expense. AsCompensation expense was $112 thousand and $29 thousand as of December 31, 2006 there was no unrecognized compensation expense. Compensation expense was $29 thousand as of2008 and December 31, 2007.
Information pertaining to options (in thousands) outstanding at December 31, 20072008 is as follows:
| Options Outstanding | Options Exercisable | |||||||||||
Range of Exercise Prices | Number Outstanding at December 31, 2007 | Weighted Average Remaining Contractual Life | Weighted Average Exercise Price | Number Exercisable at December 31, 2007 | Exercise Price | |||||||
$22.33 | 64,330 | 0.5 | $ | 22.33 | 64,330 | $ | 22.33 | |||||
$ 9.81 | 36,710 | 2.7 | 9.81 | 36,710 | 9.81 | |||||||
$12.91 | 65,041 | 3.6 | 12.91 | 65,041 | 12.91 | |||||||
$23.83 | 82,000 | 6.6 | 23.83 | 82,000 | 23.83 | |||||||
$20.05 | 114,960 | 9.8 | 20.05 | — | — | |||||||
$ 9.81 - $23.83 | 363,041 | 3.7 | $ | 18.99 | 248,081 | $ | 18.50 | |||||
| Options Outstanding | Options Exercisable | |||||||||||
Range of Exercise Prices | Number Outstanding | Weighted Average Remaining Contractual Life | Weighted Average Exercise Price | Number Exercisable | Exercise Price | |||||||
| $9.81 | 36,460 | 8.3 | $ | 9.81 | 36,460 | $ | 9.81 | |||||
| 12.91 | 62,229 | 7.4 | 12.91 | 62,229 | 12.91 | |||||||
| 20.05 | 108,710 | 1.2 | 20.05 | 21,742 | 20.05 | |||||||
| 23.83 | 79,500 | 4.4 | 23.83 | 79,500 | 23.83 | |||||||
| 286,899 | 5.67 | $ | 18.25 | 199,931 | $ | 17.46 | ||||||
401(k) Plan
The Company has a 401(k) Plan in which substantially all employees are eligible to participate. Employees may contribute up to 15% of their compensation subject to certain limits based on federal tax laws. The Company makes matching contributions equal to 100% of the first 4% of an employee’s compensation contributed to the plan. Matching contributions vest to the employee immediately. The Company may make profit sharing contributions to the plan as determined by the Board of Directors. Contributions vest to the employee over a six-year period. For the years ended December 31, 2008, 2007 2006 and 2005,2006, expense attributable to the plan amounted to $601 thousand, $628 thousand $421 thousand and $474$421 thousand, respectively.
NOTE 10, Income Taxes
The Company files income tax returns in the U.S. federal jurisdiction and the Commonwealth of Virginia. With few exceptions, the Company is no longer subject to U.S. federal, state and local income tax examinations by tax authorities for years prior to 2004.
The Company adopted the provisions of FIN 48, “Accounting for Uncertainty in Income Taxes,” on January 1, 2007 with no impact on the financial statements.2005.
–- 50 –-
The components of the net deferred tax asset, included in other assets, are as follows:
| December 31, | December 31, | |||||||||||||||
| 2007 | 2006 | 2008 | 2007 | |||||||||||||
| (in thousands) | (in thousands) | |||||||||||||||
Deferred tax assets: | ||||||||||||||||
Allowance for loan losses | $ | 1,744 | $ | 1,626 | $ | 2,178 | $ | 1,744 | ||||||||
Interest on non-accrual loans | 15 | 15 | 26 | 15 | ||||||||||||
Foreclosed assets | 64 | 64 | 234 | 64 | ||||||||||||
Pension — adjustment to apply FASB 158 | 192 | 326 | ||||||||||||||
Net unrealized loss on securities available-for-sale | — | 838 | ||||||||||||||
Pension - adjustment to apply FASB 158 | 545 | 192 | ||||||||||||||
BOLI benefit liability* | 62 | 145 | ||||||||||||||
Unexercised nonqualified options | 2 | — | 9 | 2 | ||||||||||||
| $ | 2,017 | $ | 2,869 | $ | 3,054 | $ | 2,162 | |||||||||
Deferred tax liabilities: | ||||||||||||||||
Depreciation | $ | (408 | ) | $ | (450 | ) | $ | (345 | ) | $ | (408 | ) | ||||
Accretion of discounts on securities | (12 | ) | (19 | ) | (6 | ) | (12 | ) | ||||||||
Deferred loan fees and costs | (327 | ) | (371 | ) | (325 | ) | (327 | ) | ||||||||
Pension | (404 | ) | (374 | ) | ||||||||||||
Pension* | (461 | ) | (416 | ) | ||||||||||||
Net unrealized gains on securities available-for-sale | (75 | ) | — | (347 | ) | (75 | ) | |||||||||
| (1,226 | ) | (1,214 | ) | (1,484 | ) | (1,238 | ) | |||||||||
Net deferred tax assets | $ | 791 | $ | 1,655 | $ | 1,570 | $ | 924 | ||||||||
| * | 2007 figures adjusted for change in accounting principle. |
The components of income tax expense are as follows:
| 2007 | 2006 | 2005 | |||||||||
| (in thousands) | |||||||||||
Current tax expense | $ | 3,349 | $ | 2,646 | $ | 2,577 | |||||
Deferred tax expense | (183 | ) | (36 | ) | 51 | ||||||
Reported tax expense | $ | 3,166 | $ | 2,610 | $ | 2,628 | |||||
– 51 –
| 2008 | 2007 | 2006 | ||||||||||
| (in thousands) | ||||||||||||
Current tax expense | $ | 3,216 | $ | 3,349 | $ | 2,646 | ||||||
Deferred tax expense | (565 | ) | (183 | ) | (36 | ) | ||||||
Reported tax expense | $ | 2,651 | $ | 3,166 | $ | 2,610 | ||||||
A reconciliation of the “expected” Federal income tax expense on income before income taxes with the reported income tax expense follows:
| 2007 | 2006 | 2005 | 2008 | 2007 | 2006 | |||||||||||||||||||
| (in thousands) | (in thousands) | |||||||||||||||||||||||
Expected tax expense (34%) | $ | 3,786 | $ | 3,276 | $ | 3,365 | $ | 3,210 | $ | 3,786 | $ | 3,276 | ||||||||||||
Interest expense on tax-exempt assets | 56 | 58 | 45 | 34 | 56 | 58 | ||||||||||||||||||
Tax-exempt interest | (475 | ) | (544 | ) | (623 | ) | (360 | ) | (475 | ) | (544 | ) | ||||||||||||
Officer’s life | (212 | ) | (187 | ) | (170 | ) | ||||||||||||||||||
Officers’ life insurance | (243 | ) | (212 | ) | (187 | ) | ||||||||||||||||||
Other, net | 11 | 7 | 11 | 10 | 11 | 7 | ||||||||||||||||||
Reported tax expense | $ | 3,166 | $ | 2,610 | $ | 2,628 | $ | 2,651 | $ | 3,166 | $ | 2,610 | ||||||||||||
The effective tax rates for 2008, 2007 and 2006 were 28.1%, 28.4% and 2005 were 28.4%, 27.1% and 26.6%, respectively.
- 51 -
NOTE 11, Lease Commitments
The Bank has noncancellable leases on premises and equipment expiring at various dates, not including extensions, to the year 2012.2013. Certain leases provide for increased annual payments based on increases in real estate taxes and the Consumer Price Index.
The total approximate minimum rental commitment at December 31, 20072008 under noncancellable leases is $746$922 thousand which is due as follows:
Year | (in thousands) | (in thousands) | ||||
2008 | 259 | |||||
2009 | 230 | 331 | ||||
2010 | 158 | 257 | ||||
2011 | 77 | 175 | ||||
2012 | 22 | 126 | ||||
2013 | 33 | |||||
Total | $ | 746 | $ | 922 | ||
The aggregate rental expense of premises and equipment was $337 thousand, $346 thousand and $360 thousand for 2008, 2007 and $342 thousand for 2007, 2006, and 2005, respectively.
– 52 –
NOTE 12, Pension Plan
The Company provides pension benefits for eligible participants through a non-contributory defined benefits pension plan. The plan was frozen effective September 30, 2006; therefore no additional participants will be added to the plan.
FASB No. 158 requires that employers measure plan assets and obligations as of the balance sheet date. This requirement was effective for fiscal years ending after December 15, 2008. Prior to FASB No. 158, information pertaining to activity in the plan used a measurement date of September 30.
- 52 -
Information pertaining to the activity in the plan, using a measurement date of September 30,December 31, is as follows:
| Years ended December 31 | Years ended December 31 | |||||||||||||||
| 2007 | 2006 | 2008 | 2007 | |||||||||||||
| (in thousands) | (in thousands) | |||||||||||||||
Change in benefit obligation | ||||||||||||||||
Benefit obligation at beginning of year | $ | 5,320 | $ | 6,639 | $ | 5,085 | $ | 5,320 | ||||||||
Service cost | — | 504 | — | — | ||||||||||||
Interest cost | 288 | 335 | 304 | 364 | ||||||||||||
Benefits paid | (372 | ) | (462 | ) | (163 | ) | (511 | ) | ||||||||
Gain due to change in discount rate | (315 | ) | (499 | ) | (145 | ) | (315 | ) | ||||||||
Actuarial change | 227 | 362 | (424 | ) | 227 | |||||||||||
Plan amendment | — | (1,559 | ) | |||||||||||||
Benefit obligation at end of year | $ | 5,148 | $ | 5,320 | $ | 4,657 | $ | 5,085 | ||||||||
Change in plan assets | ||||||||||||||||
Fair value of plan assets at beginning of year | $ | 5,460 | $ | 5,059 | $ | 5,743 | $ | 5,460 | ||||||||
Expected return on plan assets | 411 | 384 | (1,169 | ) | 794 | |||||||||||
Employer contribution | — | 500 | — | — | ||||||||||||
Benefits paid | (372 | ) | (462 | ) | (163 | ) | (511 | ) | ||||||||
Net gain (loss) for year | 273 | (21 | ) | |||||||||||||
Fair value of plan assets at end of year | $ | 5,772 | $ | 5,460 | $ | 4,411 | $ | 5,743 | ||||||||
Funded Status at end of year | $ | 624 | $ | 140 | $ | (246 | ) | $ | 658 | |||||||
Accumulated benefit obligation | $ | 5,148 | $ | 5,320 | ||||||||||||
Amounts recognized in the consolidated balance sheets at December 31 | ||||||||||||||||
Prepaid pension cost (pension liability) | $ | (246 | ) | $ | 658 | |||||||||||
Amounts recognized in accumulated other comprehensive income (loss), net of tax consist of: | ||||||||||||||||
Net loss | $ | 373 | $ | 633 | $ | 1,058 | $ | 373 | ||||||||
Accumulated benefit obligation | $ | 4,657 | $ | 5,085 | ||||||||||||
| 2008 | 2007 | |||||||||||||||
| 2007 | 2006 | |||||||||||||||
Assumptions used to determine the benefit obligations at December 31 | ||||||||||||||||
Discount rate | 6.25 | % | 5.75 | % | 6.49 | % | 6.25 | % | ||||||||
Rate of compensation increase | N/A | N/A | ||||||||||||||
Amounts recognized in the consolidated balance sheets at December 31 | ||||||||||||||||
Prepaid pension cost | $ | 624 | $ | 140 | ||||||||||||
–- 53 –-
| 2007 | 2006 | 2005 | ||||||||||
| (in thousands) | ||||||||||||
Components of net periodic pension cost (benefit) | ||||||||||||
Service cost | $ | — | $ | 504 | $ | 425 | ||||||
Interest cost | 288 | 335 | 320 | |||||||||
Actual return on plan assets | (684 | ) | (363 | ) | (170 | ) | ||||||
Amortization of deferred asset gain (loss) | 273 | (21 | ) | (151 | ) | |||||||
Amortization of prior service cost | — | 4 | 1 | |||||||||
Amortization of unrecognized loss | 34 | 179 | 152 | |||||||||
Net periodic pension (benefit) cost | $ | (89 | ) | $ | 638 | $ | 577 | |||||
Components of other amounts recognized in accumulated other comprehensive income (loss) | ||||||||||||
Net loss | $ | (360 | ) | (1,676 | ) | N/A | ||||||
Amortization of loss | (34 | ) | (179 | ) | N/A | |||||||
Amortization of prior service cost | — | (4 | ) | N/A | ||||||||
Total recognized in OCI | $ | (394 | ) | $ | (1,859 | ) | N/A | |||||
Total recognized in net periodic benefit cost and accumulated other comprehensive income (loss) | $ | (483 | ) | $ | (1,221 | ) | N/A | |||||
The estimated net loss and prior service cost for the pension plan that will be amortized from accumulated OCI into net periodic pension cost over the next fiscal year are $34 and $0, respectively.
| Years ended December 31 | ||||||||||||
| 2008 | 2007 | 2006 | ||||||||||
| (in thousands) | ||||||||||||
Components of net periodic pension cost (benefit) | ||||||||||||
Service cost | $ | — | $ | — | $ | 504 | ||||||
Interest cost | 304 | 288 | 335 | |||||||||
Actual return on plan assets | (439 | ) | (411 | ) | (363 | ) | ||||||
Amortization of deferred asset gain (loss) | — | — | (21 | ) | ||||||||
Amortization of prior service cost | — | — | 4 | |||||||||
Amortization of unrecognized loss | — | 34 | 179 | |||||||||
Net periodic pension (benefit) cost | $ | (135 | ) | $ | (89 | ) | $ | 638 | ||||
Components of other amounts recognized in accumulated other comprehensive income (loss) | ||||||||||||
Net loss | $ | (1,038 | ) | (360 | ) | (1,676 | ) | |||||
Amortization of loss | — | (34 | ) | (179 | ) | |||||||
Amortization of prior service cost | — | — | (4 | ) | ||||||||
Total recognized in OCI | $ | (1,038 | ) | $ | (394 | ) | $ | (1,859 | ) | |||
Total recognized in net periodic benefit cost and accumulated other comprehensive income (loss) | $ | (1,173 | ) | $ | (483 | ) | $ | (1,221 | ) | |||
| Years ended December 31 | Years ended December 31 | |||||||||
| 2007 | 2006 | 2008 | 2007 | |||||||
Assumptions used to determine net periodic pension cost | ||||||||||
Discount rate | 5.75% | 5.25% | 6.25 | % | 5.75 | % | ||||
Expected long-term rate of return on plan assets | 8.00% | 8.00% | 8.00 | % | 8.00 | % | ||||
Annual salary increase | N/A | 4.50% | ||||||||
The overall expected long-term rate of return on plan assets was determined based on the current asset allocation and the related volatility of those investments.
| Percentage of Plan Assets | Percentage of Plan Assets | |||||||||
| 2007 | 2006 | 2008 | 2007 | |||||||
Weighted average asset allocations at September 30 | ||||||||||
Weighted average asset allocations at December 31 | ||||||||||
Cash and cash equivalents | 6% | 14% | 18 | % | 6 | % | ||||
Government agencies | 39% | 36% | 37 | % | 39 | % | ||||
Corporate debt and equity | 55% | 50% | 45 | % | 55 | % | ||||
| 100% | 100% | 100 | % | 100 | % | |||||
The pension invests in large and mid-cap equities and government and corporate bonds, with the following target allocations: equities 55%50%, fixed income 40% and cash 5%10%. The pension does not invest in options or derivatives.
Although the plan is frozen,No contributions were made to the plan will continue using the Company’s policy to fund the maximum amount of contributions allowed for tax purposes. The Company accrues an amount equal to its actuarially computed obligation under the plan.in 2008 or 2007.
– 54 –
The actuarial valuation was performed using the initial frozen liability method. Under this method, the Company’s contribution equals the sum of the amount necessary to amortize the frozen initial liability (past service base) over a period of years and the normal cost of the plan.
- 54 -
Estimated future benefit payments, which reflect expected future service, as appropriate, are as follows:follows (in thousands):
| (in thousands) | ||||||
2008 | $ | 556 | ||||
2009 | 127 | $ | 556 | |||
2010 | 302 | 259 | ||||
2011 | 187 | 169 | ||||
2012 | 256 | 258 | ||||
Years 2013 - 2017 | 1,904 | |||||
2013 | 231 | |||||
Years 2014 - 2018 | 1,748 | |||||
Total | $ | 3,332 | $ | 3,221 | ||
NOTE 13, Commitments and Contingencies
In the normal course of business, the Bank makes various commitments and incurs certain contingent liabilities. These commitments and contingencies represent off-balance sheet risk for the Bank. To meet the financing needs of its customers, the Bank makes lending commitments under commercial lines of credit, home equity lines and construction and development loans. The Bank also incurs contingent liabilities related to irrevocable letters of credit.
Off-balance sheet items at December 31 are as follows:
| 2007 | 2006 | 2008 | 2007 | |||||||||
| (in thousands) | (in thousands) | |||||||||||
Commitments to extend credit: | ||||||||||||
Home equity lines of credit | $ | 27,341 | $ | 29,737 | $ | 28,729 | $ | 27,341 | ||||
Commercial real estate, construction and development loans committed but not funded | 63,031 | 48,078 | 35,624 | 63,031 | ||||||||
Other lines of credit (principally commercial) | 45,459 | 35,338 | 44,101 | 45,459 | ||||||||
Total | $ | 135,831 | $ | 113,153 | $ | 108,454 | $ | 135,831 | ||||
Irrevocable letters of credit | $ | 5,502 | $ | 5,392 | $ | 5,515 | $ | 5,502 | ||||
Commitments to extend credit are agreements to lend to a customer as long as there is no violation of any condition established in the contract. Commitments generally have fixed expiration dates or other termination clauses and may require payment of a fee. Since many of the commitments are expected to expire without being drawn upon, the total commitment amounts do not necessarily represent future cash requirements. The Bank evaluates each customer’s credit worthiness on a case-by-case basis. The amount of collateral obtained, if deemed necessary by the Bank, upon extensions of credit is based on management’s credit evaluation of the customer. Collateral held varies but may include accounts receivable, inventory, property, plant and equipment and income-producing commercial properties.
Unfunded commitments under commercial lines-of-credit, revolving credit lines, and overdraft protection agreements are commitments for possible future extensions of credit to existing customers. These lines-of-credit are uncollateralized and usually do not contain a specified maturity date, and ultimately may not be drawn upon to the total extent to which the Bank is committed.
Standby letters of credit and financial guarantees written are conditional commitments issued by the Bank to guarantee the performance of a customer to a third party. Those guarantees are primarily issued to support private borrowing agreements. The majority of guarantees extendextends for less than two years and expire in decreasing amounts through 2009,2010, with the exception of one guarantee which extends for 10 years and expires in 2014. The credit risk involved in issuing letters of credit is essentially the same as that involved in extending loans to customers. The Bank holds various collateral supporting those commitments for which collateral is deemed necessary.
Various legal claims arise from time to time in the normal course of business, which management does not anticipate will have a material effect on the Company’s consolidated financial statements.
–- 55 –-
NOTE 14, Fair Value of Financial InstrumentsMeasurements
The fair value of a financial instrument is the current amount that would be exchanged between willing parties, other than in a forced liquidation. Fair value is best determined based upon quoted market prices. However, in many instances, there are no quoted market prices for the Company’s various financial instruments. In cases where quoted market prices are not available, fair values are based on estimates using present value or other valuation techniques. Those techniques are significantly affected by the assumption used, including the discount rate and estimates of future cash flows. Accordingly, the fair value estimates may not be realized in an immediate settlement of the instrument. SFAS No. 107 “Disclosures about Fair Value of Financial Instruments” (SFAS 107) excludes certain financial instruments and all non-financial instruments from its disclosure requirements. Accordingly, the aggregate fair value amounts presented may not necessarily represent the underlying fair value of the Company.
The following methods and assumptions were used by the Company in estimating fair value disclosures for financial instruments:
Cash and cash equivalents
The carrying amounts of cash and short-term instruments approximate fair values.
Investment securities
Fair values for securities, excluding FHLBrestricted stock, are based on quoted market prices. The carrying value of FHLBrestricted stock approximates fair value based on the redemption provisions of the FHLB.
Loans receivable
For variable-rate loans that reprice frequently and with no significant change in credit risk, fair values are based on carrying values. Fair values for certain mortgage loans (e.g., one-to-four family residential), credit card loans, and other consumer loans are based on quoted market prices of similar loans sold in conjunction with securitization transactions, adjusted for differences in loan characteristics. Fair values for other loans (e.g., commercial real estate and investment property mortgage loans, commercial and industrial loans) are estimated using discounted cash flow analyses, using interest rates currently being offered for loans with similar terms to borrowers of similar credit quality. Fair values for non-performing loans are estimated using discounted cash flow analyses or underlying collateral values, where applicable.
Deposit liabilities
The fair value of demand deposits, savings and certain money market deposits is the amount payable on demand at the reporting date. The fair value of certificates of deposits is estimated by discounting the future cash flows using the rates currently offered for deposits of similar remaining maturities.
Short-term borrowings
The carrying amounts of federal funds purchased, repurchase agreements, and other short-term borrowings maturing within 90 days approximate their fair values. Fair values of other short-term borrowings are estimated using discounted cash flow analyses based on the Company’s current incremental borrowing rates for similar types of borrowing arrangements.
Long-term borrowings
The fair values of the Company’s long-term borrowings are estimated using discounted cash flow analyses based on the Company’s current incremental borrowing rates for similar types of borrowing arrangements.
Accrued interest
The carrying amounts of accrued interest approximate fair value.
– 56 –
Commitments to extend credit and irrevocable letters of credit
The fair value of commitments is estimated using the fees currently charged to enter into similar agreements, taking into account the remaining terms of the agreements and the present creditworthiness of the counterparties. For fixed-rate loan commitments fair value also considers the difference between current levels of interest rates and the committed rates. The fair value of letters of credit is based on fees currently charged for similar agreements or on the estimated cost to terminate them or otherwise settle the obligations with the counterparties at the reporting date. At December 31, 20072008 and 2006,2007, the fair value of fees charged for loan commitments and irrevocable letters of credit was immaterial.
- 56 -
The estimated fair values, and related carrying or notional amounts, of the Company’s financial instruments are as follows:
| December 31, | December 31, | |||||||||||||||||||||||
| 2007 | 2006 | 2008 | 2007 | |||||||||||||||||||||
| Carrying Amount | Fair Value | Carrying Amount | Fair Value | Carrying Amount | Fair Value | Carrying Amount | Fair Value | |||||||||||||||||
| (in thousands) | (in thousands) | |||||||||||||||||||||||
Financial assets: | ||||||||||||||||||||||||
Cash and cash equivalents | $ | 51,564 | $ | 51,564 | $ | 36,784 | $ | 36,784 | $ | 47,325 | $ | 47,325 | $ | 51,564 | $ | 51,564 | ||||||||
Securities available-for-sale | 129,056 | 129,056 | 184,806 | 184,806 | 96,988 | 96,988 | 123,653 | 123,653 | ||||||||||||||||
Securities held-to-maturity | 2,904 | 2,947 | 3,432 | 3,454 | 3,067 | 3,116 | 2,904 | 2,947 | ||||||||||||||||
Loans, net of allowances for loan losses | 592,014 | 593,945 | 578,809 | 566,982 | 631,046 | 633,820 | 592,014 | 593,945 | ||||||||||||||||
Accrued interest receivable | 3,211 | 3,211 | 3,720 | 3,720 | 3,210 | 3,210 | 3,211 | 3,211 | ||||||||||||||||
Financial liabilities: | ||||||||||||||||||||||||
Deposits | 596,165 | 595,623 | 588,414 | 587,150 | 646,524 | 649,055 | 596,165 | 595,623 | ||||||||||||||||
Federal funds purchased, repurchase agreements and other borrowings | 64,225 | 64,223 | 57,053 | 57,050 | 33,282 | 33,282 | 64,225 | 64,223 | ||||||||||||||||
Federal Home Loan Bank advances | 80,000 | 83,296 | 125,000 | 123,749 | 70,000 | 77,219 | 80,000 | 83,296 | ||||||||||||||||
Accrued interest payable | 2,438 | 2,438 | 2,333 | 2,333 | 1,777 | 1,777 | 2,438 | 2,438 | ||||||||||||||||
The Company adopted SFAS No. 157, “Fair Value Measurements” (SFAS 157), on January 1, 2008 to record fair value adjustments to certain assets and liabilities and to determine fair value disclosures. SFAS 157 clarifies that fair value of certain assets and liabilities is an exit price, representing the amount that would be received to sell an asset or paid to transfer a liability in an orderly transaction between market participants.
In February of 2008, the FASB issued Staff Position No. 157-2 (FSP 157-2) which delayed the effective date of SFAS 157 for certain nonfinancial assets and nonfinancial liabilities except for those items that are recognized or disclosed at fair value in the financial statements on a recurring basis. FSP 157-2 defers the effective date of SFAS 157 for such nonfinancial assets and nonfinancial liabilities to fiscal years beginning after November 15, 2008, and interim periods within those fiscal years. Thus, the Company has only partially applied SFAS 157. Those items affected by FSP 157-2 include other real estate owned (OREO).
In October of 2008, the FASB issued Staff Position No. 157-3 (FSP 157-3) to clarify the application of SFAS 157 in a market that is not active and to provide key considerations in determining the fair value of a financial asset when the market for that financial asset is not active. FSP 157-3 was effective upon issuance, including prior periods for which financials statements were not issued.
SFAS 157 specifies a hierarchy of valuation techniques based on whether the inputs to those valuation techniques are observable or unobservable. Observable inputs reflect market data obtained from independent sources, while unobservable inputs reflect the Company’s market assumptions. The three levels of the fair value hierarchy under SFAS 157 based on these two types of inputs are as follows:
| Level 1 – | Valuation is based on quoted prices in active markets for identical assets and liabilities. | |
| Level 2 – | Valuation is based on observable inputs including quoted prices in active markets for similar assets and liabilities, quoted prices for identical or similar assets and liabilities in less active markets, and model-based valuation techniques for which significant assumptions can be derived primarily from or corroborated by observable data in the market. | |
- 57 -
| Level 3 – | Valuation is based on model-based techniques that use one or more significant inputs or assumptions that are unobservable in the market. |
The following describes the valuation techniques used by the Company to measure certain financial assets and liabilities recorded at fair value on a recurring basis in the financial statements:
Securities available for sale
Securities available for sale are recorded at fair value on a recurring basis. Fair value measurement is based upon quoted market prices, when available (Level 1). If quoted market prices are not available, fair values are measured utilizing independent valuation techniques of identical or similar securities for which significant assumptions are derived primarily from or corroborated by observable market data. Third party vendors compile prices from various sources and may determine the fair value of identical or similar securities by using pricing models that considers observable market data (Level 2).
The following table presents the balances of financial assets and liabilities measured at fair value on a recurring basis as of December 31, 2008:
| Fair Value Measurements at December 31, 2008 | ||||||||||||
| (in thousands) | ||||||||||||
| Description | Balance | Quoted Prices in Active Markets for Identical Markets (Level 1) | Significant Other Observable Inputs (Level 2) | Significant Unobservable Inputs (Level 3) | ||||||||
Assets: | ||||||||||||
Available-for-sale securities | $ | 96,988 | $ | — | $ | 96,988 | $ | — | ||||
Certain financial assets are measured at fair value on a nonrecurring basis in accordance with GAAP. Adjustments to the fair value of these assets usually result from the application of lower-of-cost-or-market accounting or write-downs of individual assets.
The following describes the valuation techniques used by the Company to measure certain financial assets recorded at fair value on a nonrecurring basis in the financial statements:
Impaired Loans
Loans are designated as impaired when, in the judgment of management based on current information and events, it is probable that all amounts due according to the contractual terms of the loan agreement will not be collected. The measurement of loss associated with impaired loans can be based on either the observable market price of the loan or the fair value of the collateral. Fair value is measured based on the value of the collateral securing the loans. Collateral may be in the form of real estate or business assets including equipment, inventory, and accounts receivable. The vast majority of the collateral is real estate. The value of real estate collateral is determined utilizing an income or market valuation approach based on an appraisal conducted by an independent, licensed appraiser outside of the Company using observable market data (Level 2). However, if the collateral is a house or building in the process of construction or if an appraisal of the real estate property is over two years old, then the fair value is considered Level 3. The value of business equipment is based upon an outside appraisal if deemed significant, or the net book value on the applicable business’ financial statements if not considered significant using observable market data. Likewise, values for inventory and accounts receivables collateral are based on financial statement balances or aging reports (Level 3). Impaired loans allocated to the Allowance for Loan Losses are measured at fair value on a nonrecurring basis. Any fair value adjustments are recorded in the period incurred as provision for loan losses on the Consolidated Statements of Income.
- 58 -
The following table summarizes the Company’s financial assets that were measured at fair value on a nonrecurring basis during the period.
| Carrying Value at December 31, 2008 | ||||||||||||
| (in thousands) | ||||||||||||
| Description | Balance | Quoted Prices in Active Markets for Identical Markets (Level 1) | Significant Other Observable Inputs (Level 2) | Significant Unobservable Inputs (Level 3) | ||||||||
Assets: | ||||||||||||
Impaired Loans | $ | 12,642 | $ | — | $ | 2,117 | $ | 10,525 | ||||
NOTE 15, Regulatory Matters
The Company (on a consolidated basis) and the Bank are subject to various regulatory capital requirements administered by the federal banking agencies. Failure to meet minimum capital requirements can cause certain mandatory and possibly additional discretionary actions to be initiated by regulators that, if undertaken, could have a direct material effect on the Company’s and the Bank’s financial statements. Under capital adequacy guidelines and the regulatory framework for prompt corrective action, the Company and the Bank must meet specific capital guidelines that involve quantitative measures of their assets, liabilities and certain off-balance sheet items as calculated under regulatory accounting practices. The capital amounts and classification are also subject to qualitative judgments by the regulators about components, risk weightings and other factors. Prompt corrective action provisions are not applicable to bank holding companies.
Quantitative measures established by regulation to ensure capital adequacy require the Company and the Bank to maintain minimum amounts and ratios (set forth in the following table) of total and Tier 1 capital (as defined in the regulations) to risk-weighted assets (as defined) and of Tier 1 capital (as defined) to average assets (as defined). Management believes, as of December 31, 20072008 and 2006,2007, that the Company and the Bank meets all capital adequacy requirements to which they are subject.
– 57 –
As of December 31, 2007,2008, the most recent notification from the Comptroller categorized the Bank as well-capitalized under the regulatory framework for prompt corrective action. To be categorized as well-capitalized, an institution must maintain minimum total risk-based, Tier 1 risk-based and Tier 1 leverage ratios as set forth in the following tables. There are no conditions or events since the notification that management believes have changed the Bank’s category. The Company’s and the Bank’s actual capital amounts and ratios as of December 31, 20072008 and 20062007 are also presented in the table.
| Actual | Minimum Capital Requirement | Minimum To Be Well Capitalized Under Prompt Corrective Action Provisions | ||||||||||||||||
| Amount | Ratio | Amount | Ratio | Amount | Ratio | |||||||||||||
| (in thousands) | ||||||||||||||||||
December 31, 2007: | ||||||||||||||||||
Total Capital to Risk Weighted Assets: | ||||||||||||||||||
Consolidated | $ | 84,905 | 13.45 | % | $ | 50,486 | 8.00 | % | N/A | N/A | ||||||||
Old Point National Bank | 80,014 | 12.68 | % | 50,476 | 8.00 | % | $ | 63,095 | 10.00 | % | ||||||||
Tier 1 Capital to Risk Weighted Assets: | ||||||||||||||||||
Consolidated | 79,775 | 12.64 | % | 25,243 | 4.00 | % | N/A | N/A | ||||||||||
Old Point National Bank | 74,884 | 11.87 | % | 25,238 | 4.00 | % | 37,857 | 6.00 | % | |||||||||
Tier 1 Capital to Average Assets: | ||||||||||||||||||
Consolidated | 79,775 | 9.67 | % | 24,761 | 3.00 | % | N/A | N/A | ||||||||||
Old Point National Bank | 74,884 | 9.13 | % | 24,612 | 3.00 | % | 41,020 | 5.00 | % | |||||||||
December 31, 2006: | ||||||||||||||||||
Total Capital to Risk Weighted Assets: | ||||||||||||||||||
Consolidated | $ | 81,858 | 13.18 | % | $ | 49,686 | 8.00 | % | N/A | N/A | ||||||||
Old Point National Bank | 74,535 | 12.03 | % | 49,566 | 8.00 | % | $ | 61,958 | 10.00 | % | ||||||||
Tier 1 Capital to Risk Weighted Assets: | ||||||||||||||||||
Consolidated | 77,074 | 12.41 | % | 24,843 | 4.00 | % | N/A | N/A | ||||||||||
Old Point National Bank | 69,751 | 11.26 | % | 24,778 | 4.00 | % | 37,167 | 6.00 | % | |||||||||
Tier 1 Capital to Average Assets: | ||||||||||||||||||
Consolidated | 77,074 | 9.19 | % | 25,160 | 3.00 | % | N/A | N/A | ||||||||||
Old Point National Bank | 69,751 | 8.37 | % | 25,000 | 3.00 | % | 41,667 | 5.00 | % | |||||||||
- 59 -
| Actual | Minimum Capital Requirement | Minimum To Be Well Capitalized Under Prompt Corrective Action Provisions | ||||||||||||||||
| Amount | Ratio | Amount | Ratio | Amount | Ratio | |||||||||||||
| (in thousands) | ||||||||||||||||||
December 31, 2008: | ||||||||||||||||||
Total Capital to Risk Weighted Assets: | ||||||||||||||||||
Consolidated | $ | 89,689 | 13.44 | % | $ | 53,367 | 8.00 | % | N/A | N/A | ||||||||
Old Point National Bank | 84,484 | 12.69 | % | 53,267 | 8.00 | % | $ | 66,584 | 10.00 | % | ||||||||
Tier 1 Capital to Risk Weighted Assets: | ||||||||||||||||||
Consolidated | 83,283 | 12.48 | % | 26,684 | 4.00 | % | N/A | N/A | ||||||||||
Old Point National Bank | 78,078 | 11.73 | % | 26,633 | 4.00 | % | 39,950 | 6.00 | % | |||||||||
Tier 1 Capital to Average Assets: | ||||||||||||||||||
Consolidated | 83,283 | 10.00 | % | 33,301 | 4.00 | % | N/A | N/A | ||||||||||
Old Point National Bank | 78,078 | 9.38 | % | 33,308 | 4.00 | % | 41,635 | 5.00 | % | |||||||||
December 31, 2007: | ||||||||||||||||||
Total Capital to Risk Weighted Assets: | ||||||||||||||||||
Consolidated | $ | 84,905 | 13.45 | % | $ | 50,486 | 8.00 | % | N/A | N/A | ||||||||
Old Point National Bank | 80,014 | 12.68 | % | 50,476 | 8.00 | % | $ | 63,095 | 10.00 | % | ||||||||
Tier 1 Capital to Risk Weighted Assets: | ||||||||||||||||||
Consolidated | 79,775 | 12.64 | % | 25,243 | 4.00 | % | N/A | N/A | ||||||||||
Old Point National Bank | 74,884 | 11.87 | % | 25,238 | 4.00 | % | 37,857 | 6.00 | % | |||||||||
Tier 1 Capital to Average Assets: | ||||||||||||||||||
Consolidated | 79,775 | 9.67 | % | 24,761 | 3.00 | % | N/A | N/A | ||||||||||
Old Point National Bank | 74,884 | 9.13 | % | 24,612 | 3.00 | % | 41,020 | 5.00 | % | |||||||||
The approval of the Comptroller is required if the total of all dividends declared by a national bank in any calendar year exceeds the Bank’s net profits for that year combined with its retained net profits for the preceding two calendar years. Under this formula, the Bank and Trust can distribute as dividends to the Company in 2008, without approval of the Comptroller, $13.8$12.9 million plus an additional amount equal to the Bank’s and Trust’s retained net profits for 20082009 up to the date of any dividend declaration.
– 58 –- 60 -
NOTE 16, Quarterly Data (Unaudited)
| Year Ended December 31, | Year Ended December 31, | |||||||||||||||||||||||||||||||||||||||||||||||||||||||||||||||
| 2007 | 2006 | 2008 | 2007 | |||||||||||||||||||||||||||||||||||||||||||||||||||||||||||||
| (in thousands, except per share data) | (in thousands, except per share data) | |||||||||||||||||||||||||||||||||||||||||||||||||||||||||||||||
| Fourth Quarter | Third Quarter | Second Quarter | First Quarter | Fourth Quarter | Third Quarter | Second Quarter | First Quarter | Fourth Quarter | Third Quarter | Second Quarter | First Quarter | Fourth Quarter | Third Quarter | Second Quarter | First Quarter | |||||||||||||||||||||||||||||||||||||||||||||||||
Interest and dividend income | $ | 12,356 | $ | 12,418 | $ | 12,181 | $ | 12,067 | $ | 12,285 | $ | 11,663 | $ | 10,822 | $ | 10,115 | $ | 11,254 | $ | 11,717 | $ | 11,656 | $ | 11,874 | $ | 12,356 | $ | 12,418 | $ | 12,181 | $ | 12,067 | ||||||||||||||||||||||||||||||||
Interest expense | (5,897 | ) | (5,891 | ) | (5,703 | ) | (5,858 | ) | (5,949 | ) | (5,446 | ) | (4,716 | ) | (4,165 | ) | (4,220 | ) | (4,552 | ) | (4,850 | ) | (5,384 | ) | (5,897 | ) | (5,891 | ) | (5,703 | ) | (5,858 | ) | ||||||||||||||||||||||||||||||||
Net interest income | 6,459 | 6,527 | 6,478 | 6,209 | 6,336 | 6,217 | 6,106 | 5,950 | 7,034 | 7,165 | 6,806 | 6,490 | 6,459 | 6,527 | 6,478 | 6,209 | ||||||||||||||||||||||||||||||||||||||||||||||||
Provision for loan losses | (300 | ) | (200 | ) | (200 | ) | (300 | ) | (300 | ) | (300 | ) | (300 | ) | (300 | ) | (1,000 | ) | (800 | ) | (300 | ) | (300 | ) | (300 | ) | (200 | ) | (200 | ) | (300 | ) | ||||||||||||||||||||||||||||||||
Net interest income, after provision for loan losses | 6,159 | 6,327 | 6,278 | 5,909 | 6,036 | 5,917 | 5,806 | 5,650 | 6,034 | 6,365 | 6,506 | 6,190 | 6,159 | 6,327 | 6,278 | 5,909 | ||||||||||||||||||||||||||||||||||||||||||||||||
Noninterest income | 3,238 | 3,036 | 3,133 | 3,078 | 2,880 | 2,713 | 3,025 | 2,788 | 2,958 | 3,367 | 3,174 | 3,223 | 3,238 | 3,036 | 3,133 | 3,078 | ||||||||||||||||||||||||||||||||||||||||||||||||
Noninterest expenses | (6,539 | ) | (6,585 | ) | (6,574 | ) | (6,325 | ) | (6,407 | ) | (6,289 | ) | (6,345 | ) | (6,140 | ) | (7,825 | ) | (6,933 | ) | (6,957 | ) | (6,661 | ) | (6,539 | ) | (6,585 | ) | (6,574 | ) | (6,325 | ) | ||||||||||||||||||||||||||||||||
Income before income taxes | 2,858 | 2,778 | 2,837 | 2,662 | 2,509 | 2,341 | 2,486 | 2,298 | 1,167 | 2,799 | 2,723 | 2,752 | 2,858 | 2,778 | 2,837 | 2,662 | ||||||||||||||||||||||||||||||||||||||||||||||||
Provision for income taxes | (813 | ) | (798 | ) | (810 | ) | (745 | ) | (692 | ) | (630 | ) | (680 | ) | (608 | ) | (260 | ) | (821 | ) | (788 | ) | (782 | ) | (813 | ) | (798 | ) | (810 | ) | (745 | ) | ||||||||||||||||||||||||||||||||
Net income | $ | 2,045 | $ | 1,980 | $ | 2,027 | $ | 1,917 | $ | 1,817 | $ | 1,711 | $ | 1,806 | $ | 1,690 | $ | 907 | $ | 1,978 | $ | 1,935 | $ | 1,970 | $ | 2,045 | $ | 1,980 | $ | 2,027 | $ | 1,917 | ||||||||||||||||||||||||||||||||
Earnings per common share:* | ||||||||||||||||||||||||||||||||||||||||||||||||||||||||||||||||
Basic | $ | 0.42 | $ | 0.40 | $ | 0.41 | $ | 0.38 | $ | 0.37 | $ | 0.34 | $ | 0.36 | $ | 0.34 | $ | 0.19 | $ | 0.40 | $ | 0.40 | $ | 0.40 | $ | 0.42 | $ | 0.40 | $ | 0.41 | $ | 0.38 | ||||||||||||||||||||||||||||||||
Diluted | $ | 0.41 | $ | 0.40 | $ | 0.40 | $ | 0.38 | $ | 0.36 | $ | 0.34 | $ | 0.36 | $ | 0.34 | $ | 0.18 | $ | 0.40 | $ | 0.39 | $ | 0.40 | $ | 0.41 | $ | 0.40 | $ | 0.40 | $ | 0.38 | ||||||||||||||||||||||||||||||||
* Per share data have been adjusted to reflect the 5 for 4 stock split in the form of a dividend declared on August 16, 2007 and paid on October 1, 2007. |
| |||||||||||||||||||||||||||||||||||||||||||||||||||||||||||||||
| * | Per share data have been adjusted to reflect the 5 for 4 stock split in the form of a dividend declared on August 16, 2007 and paid on October 1, 2007. |
– 59 –- 61 -
NOTE 17, Condensed Financial Statements of Parent Company
Financial information pertaining to Old Point Financial Corporation (parent company only) is as follows:
| December 31, | |||||||||||
| Balance Sheets | 2007 | 2006 | |||||||||
| (in thousands) | |||||||||||
Assets | |||||||||||
Cash and cash equivalents | $ | 243 | $ | 445 | |||||||
Repurchase agreement | — | 330 | |||||||||
Securities available-for-sale | 1,100 | 1,100 | |||||||||
Securities held-to-maturity | 604 | 732 | |||||||||
Investment in common stock of subsidiaries | 78,898 | 71,839 | |||||||||
Other assets | 231 | 219 | |||||||||
Total assets | $ | 81,076 | $ | 74,665 | |||||||
Liabilities and Stockholders’ Equity | |||||||||||
Note payable—OPNB | $ | 1,364 | $ | — | |||||||
Other liabilities | 5 | — | |||||||||
Common stock, $5 par value, 10,000,000 shares authorized; | 24,538 | 19,961 | |||||||||
Additional paid-in capital | 15,357 | 14,719 | |||||||||
Retained earnings | 40,039 | 42,245 | |||||||||
Accumulated other comprehensive loss | (227 | ) | (2,260 | ) | |||||||
Total liabilities and stockholders’ equity | $ | 81,076 | $ | 74,665 | |||||||
| Years Ended December 31, | |||||||||||
| Statements of Income | 2007 | 2006 | 2005 | ||||||||
| (in thousands) | |||||||||||
Income: | |||||||||||
Dividends from subsidiary | $ | 3,200 | $ | 3,200 | $ | 2,700 | |||||
Interest on investments | 77 | 87 | 104 | ||||||||
Other income | 144 | 144 | 144 | ||||||||
Total income | 3,421 | 3,431 | 2,948 | ||||||||
Expenses: | |||||||||||
Salary and benefits | 398 | 369 | 367 | ||||||||
Stationery, supplies and printing | 44 | 40 | 47 | ||||||||
Service fees | 127 | 102 | 90 | ||||||||
Other operating expenses | 85 | 26 | 35 | ||||||||
Total expenses | 654 | 537 | 539 | ||||||||
Income before income taxes and equity in undistributed net income of subsidiaries | 2,767 | 2,894 | 2,409 | ||||||||
Income tax benefit | 151 | 122 | 117 | ||||||||
| 2,918 | 3,016 | 2,526 | |||||||||
Equity in undistributed net income of subsidiaries | 5,051 | 4,008 | 4,742 | ||||||||
Net income | $ | 7,969 | $ | 7,024 | $ | 7,268 | |||||
| December 31, | ||||||||
| 2008 | 2007 | |||||||
| (in thousands) | ||||||||
Balance Sheets | ||||||||
Assets | ||||||||
Cash and cash equivalents | $ | 159 | $ | 243 | ||||
Securities available-for-sale | 100 | 1,100 | ||||||
Securities held-to-maturity | 467 | 604 | ||||||
Investment in common stock of subsidiaries | 82,273 | 78,898 | ||||||
Other assets | 144 | 231 | ||||||
Total assets | $ | 83,143 | $ | 81,076 | ||||
Liabilities and Stockholders’ Equity | ||||||||
Note payable - subsidiary | $ | 244 | $ | 1,364 | ||||
Other liabilities | 1 | 5 | ||||||
Common stock | 24,526 | 24,538 | ||||||
Additional paid-in capital | 15,506 | 15,357 | ||||||
Retained earnings | 43,251 | 40,039 | ||||||
Accumulated other comprehensive loss | (385 | ) | (227 | ) | ||||
Total liabilities and stockholders’ equity | $ | 83,143 | $ | 81,076 | ||||
| Years Ended December 31, | |||||||||
| 2008 | 2007 | 2006 | |||||||
| (in thousands) | |||||||||
Statements of Income | |||||||||
Income: | |||||||||
Dividends from subsidiary | $ | 3,400 | $ | 3,200 | $ | 3,200 | |||
Interest on investments | 38 | 77 | 87 | ||||||
Other income | 300 | 144 | 144 | ||||||
Total income | 3,738 | 3,421 | 3,431 | ||||||
Expenses: | |||||||||
Salary and benefits | 563 | 398 | 369 | ||||||
Stationery, supplies and printing | 65 | 44 | 40 | ||||||
Service fees | 138 | 127 | 102 | ||||||
Other operating expenses | 207 | 85 | 26 | ||||||
Total expenses | 973 | 654 | 537 | ||||||
Income before income taxes and equity in undistributed net income of subsidiaries | 2,765 | 2,767 | 2,894 | ||||||
Income tax benefit | 228 | 151 | 122 | ||||||
| 2,993 | 2,918 | 3,016 | |||||||
Equity in undistributed net income of subsidiaries | 3,797 | 5,051 | 4,008 | ||||||
Net income | $ | 6,790 | $ | 7,969 | $ | 7,024 | |||
– 60 –- 62 -
| Years Ended December 31, | ||||||||||||||||||||||||
| 2008 | 2007 | 2006 | ||||||||||||||||||||||
| (in thousands) | ||||||||||||||||||||||||
| Statements of Cash Flows | 2007 | 2006 | 2005 | |||||||||||||||||||||
| (in thousands) | ||||||||||||||||||||||||
Cash flows from operating activities: | ||||||||||||||||||||||||
Net income | $ | 7,969 | $ | 7,024 | $ | 7,268 | $ | 6,790 | $ | 7,969 | $ | 7,024 | ||||||||||||
Adjustments to reconcile net income to net cash provided by operating activities: | ||||||||||||||||||||||||
Equity in undistributed net income of subsidiaries | (5,051 | ) | (4,008 | ) | (4,742 | ) | (3,797 | ) | (5,051 | ) | (4,008 | ) | ||||||||||||
Stock compensation expense | 29 | — | — | 112 | 29 | — | ||||||||||||||||||
Decrease (increase) in other assets | 13 | (15 | ) | (229 | ) | 93 | 13 | (15 | ) | |||||||||||||||
Increase in other liabilities | 5 | — | — | |||||||||||||||||||||
Increase (decrease) in other liabilities | (5 | ) | 5 | — | ||||||||||||||||||||
Net cash provided by operating activities | 2,965 | 3,001 | 2,297 | 3,193 | 2,965 | 3,001 | ||||||||||||||||||
Cash flows from investing activities: | ||||||||||||||||||||||||
Proceeds from sale of investment securities | 128 | — | — | 1,137 | 128 | — | ||||||||||||||||||
Maturities and calls of investment securities | — | 91 | 92 | — | — | 91 | ||||||||||||||||||
Payments for investments in subsidiaries | 330 | 645 | — | — | 330 | 645 | ||||||||||||||||||
Net cash provided by investing activities | 458 | 736 | 92 | 1,137 | 458 | 736 | ||||||||||||||||||
Cash flows from financing activities: | ||||||||||||||||||||||||
Proceeds from advances from subsidiaries | 1,492 | — | — | 36 | 1,492 | — | ||||||||||||||||||
Repayment of advances from subsidiaries | (128 | ) | — | — | (1,156 | ) | (128 | ) | — | |||||||||||||||
Proceeds from issuance of common stock | 174 | 159 | 100 | 39 | 174 | 159 | ||||||||||||||||||
Repurchase and retirement of common stock | (2,183 | ) | (968 | ) | (210 | ) | (97 | ) | (2,183 | ) | (968 | ) | ||||||||||||
Cash paid in lieu of fractional shares | (4 | ) | — | — | — | (4 | ) | — | ||||||||||||||||
Effect of nonqualified stock options | 34 | 41 | 9 | 34 | 41 | |||||||||||||||||||
Cash dividends paid on common stock | (3,010 | ) | (2,793 | ) | (2,651 | ) | (3,236 | ) | (3,010 | ) | (2,793 | ) | ||||||||||||
Net cash used in financing activities | (3,625 | ) | (3,561 | ) | (2,752 | ) | (4,414 | ) | (3,625 | ) | (3,561 | ) | ||||||||||||
Net increase (decrease) in cash and cash equivalents | (202 | ) | 176 | (363 | ) | (84 | ) | (202 | ) | 176 | ||||||||||||||
Cash and cash equivalents at beginning of year | 445 | 269 | 632 | 243 | 445 | 269 | ||||||||||||||||||
Cash and cash equivalents at end of year | $ | 243 | $ | 445 | $ | 269 | $ | 159 | $ | 243 | $ | 445 | ||||||||||||
– 61 –
Item 9. Changes in and Disagreements With Accountants on Accounting and Financial Disclosure
| Item 9. | Changes in and Disagreements With Accountants on Accounting and Financial Disclosure |
None.
| Item 9A. | Controls and Procedures |
Evaluation of Disclosure Controls and Procedures. The Company maintains “disclosureManagement evaluated, with the participation of the Company’s Chief Executive Officer and Chief Financial Officer, the effectiveness of the Company’s disclosure controls and procedures” as such term is (as defined in Rule 13a-15(e) under the Securities Exchange Act of 1934, as amended (the Exchange Act),) as of the end of the period covered by this report. Based on that evaluation, the Company’s Chief Executive Officer and Chief Financial Officer concluded that the Company’s disclosure controls and procedures are designedeffective as of the end of the period covered by this report to ensure that information required to be disclosed in the reports that itthe Company files or submits under the Exchange Act, is recorded, processed, summarized and reported, within the time periods specified in the Securities and Exchange Commission’sSEC’s rules and forms, and that such information is accumulated and communicated to management, including the Company’s Chief Executive Officer and Chief Financial Officer, as appropriate, to allow timely decisions regarding required disclosure.
In designing and evaluating its disclosure controls and procedures, management recognized that disclosure controls and procedures, no matter how well conceived and operated, can provide only reasonable, not absolute, assurance that the objectives of the disclosure controls and procedures are met. The design of any disclosure controls and procedures also is based in part upon certain assumptions about the likelihood of future events, and there can be no assurance that any design will succeed in achieving its stated goals under all potential future conditions.
As required, management, including the Chief Executive Officer and Chief Financial Officer, evaluated the effectiveness of the design and operation of the Company’s disclosure controls and procedures as of the end of the period covered by this report. Based on this evaluation, the Chief Executive Officer and Chief Financial Officer concluded that the Company’s disclosure controls and procedures were operating effectively.
Management’s Report on Internal Control over Financial Reporting. Management is responsible for establishing and maintaining adequate internal control over financial reporting as defined in Rule 13a-15(f) of the Exchange Act. Our internal control system was designed to provide reasonable assurance regarding the reliability of financial reporting and the preparation of financial statements for external purposes, in accordance with generally accepted accounting principles.
Because of its inherent limitations, a system of internal control over financial reporting may not prevent or detect misstatements. Also, projections of any evaluation of effectiveness to future periods are subject to the risk that controls may become inadequate because of changes in conditions, or that the degree of compliance with the policies or procedures may deteriorate.
- 63 -
Management includingevaluated, with the participation of the Company’s Chief Executive Officer and Chief Financial Officer, conducted an evaluation of the effectiveness of our internal control over financial reporting as of December 31, 2007.2008. In conducting this evaluation, management used the criteria set forth by the Committee of Sponsoring Organizations of the Treadway Commission (COSO) inInternal Control-Integrated Framework. Based on this evaluation, using those criteria, management concluded that our internal control over financial reporting was effective as of December 31, 2007.2008.
The Company’s internal control over financial reporting as of December 31, 20072008 has been audited by Yount, Hyde & Barbour, P.C., the independent registered public accounting firm that also audited the Company’s consolidated financial statements included in this report on Form 10-K. Yount, Hyde & Barbour, P.C.’s attestation report on effectiveness of the Company’s internal control over financial reporting appears on page 3130 of this report.
Changes in Internal Control over Financial Reporting. There was no change in the internal control over financial reporting that occurred during the fiscal quarter ended December 31, 20072008 that has materially affected, or is reasonably likely to materially affect, the Company’s internal control over financial reporting.
| Item 9B. | Other Information |
None.
– 62 –
Except as otherwise indicated, information called for by the following items under Part III is contained in the Proxy Statement for the Company’s 20082009 Annual Meeting of Stockholders (the 20082009 Proxy Statement) to be held on April 22, 2008.28, 2009.
| Item 10. | Directors, Executive Officers and Corporate Governance |
The information with respect to the directors of the Company is set forth under the caption “Election of Directors” in the 20082009 Proxy Statement and is incorporated herein by reference. The information regarding the Section 16(a) reporting requirements of the directors and executive officers is set forth under the caption “Section 16(a) Beneficial Ownership Reporting Compliance” in the 20082009 Proxy Statement and is incorporated herein by reference. The information concerning the executive officers of the Company required by this item is included in Part I of this report on Form 10-K under the caption “Executive Officers of the Registrant.” The information regarding the Company’s Audit Committee and its Audit Committee Financial Expert is set forth under the caption “Board Committees and Attendance” in the 20082009 Proxy Statement and is incorporated herein by reference.
The Company has a Code of Ethics which details principles and responsibilities governing ethical conduct for all Company directors, officers, employees and principal stockholders. The Code of Ethics is attached as Exhibit 14 of this report on Form 10-K.
A copy of the Code of Ethics will be provided free of charge, upon written request made to Company’s secretary at 1 West Mellen Street, Hampton, Virginia 23663 or by calling (757) 728-1200. The Code of Ethics is also posted on the Company’s website atwww.oldpoint.com in the “About Old Point” section under “Investor Relations” and then “Governance Documents” of the website. The Company intends to satisfy the disclosure requirements of Form 8-K with respect to waivers of or amendments to the Code of Ethics with respect to certain officers of the Company by posting such disclosures on its website under “Waivers of or amendments to the Code of Ethics.” The Company may, however, elect to disclose any such amendment or waiver in a report on Form 8-K filed with the SEC either in addition to or in lieu of the website disclosure.
| Item 11. | Executive Compensation |
The information set forth under the captions “Compensation Committee Interlocks and Insider Participation” and “Executive Compensation” in the 20082009 Proxy Statement is incorporated herein by reference.
Five Year Stock Performance. The line graph below compares the Company’s stockholder return with the return of the NASDAQ Bank Index and the Russell 2000 Index.
- 64 -
This performance graph was created by comparing the percentage change in stock prices for the Company and the indices on a year to year basis, factoring in dividend payments, and looking only at the closing price of the stock as of December 31 of each year surveyed. This graph may be affected by unusually high or low prices at December 31, 20022003 or by temporary swings in stock price at December 31 of any given year. Accordingly, this is not necessarily the best measure of the Company’s performance.
The index reflects the total return on the stock that is shown, including price appreciation, all stock splits and stock dividends, and reinvestment of cash dividends at time of payment, relative to the value of the stock at the beginning of the time period. Thus a move from 100 to 150 on the index scale indicates a 50% increase in the value of the investment. The NASDAQ Bank Composite Index contains all non-holding company banking institutions traded on the NASDAQ exchange. In addition to traditional banks this includes thrifts, but does not include other non-regulated finance companies. The Russell 2000 Index is comprised of the smallest 2000 companies in the Russell 3000 Index, which tracks almost 99% of the stocks included in portfolios of institutional investors.
– 63 –
Old Point Financial Corporation Five Year Price Performance
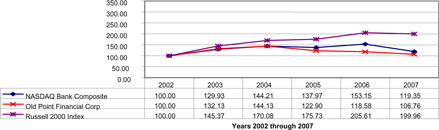
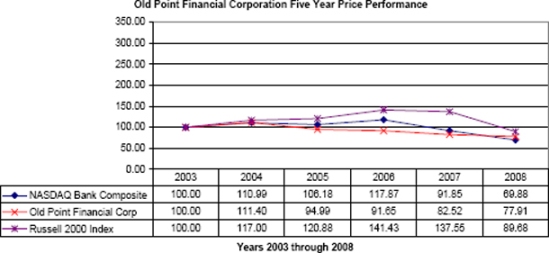
| Item 12. | Security Ownership of Certain Beneficial Owners and Management and Related Stockholder Matters |
The information set forth under the caption “Securities Authorized for Issuance Under Equity Compensation Plans” in the 20082009 Proxy Statement is incorporated herein by reference.
The information set forth under the caption “Security Ownership of Certain Beneficial Owners and Management” in the 20082009 Proxy Statement is incorporated herein by reference.
| Item 13. | Certain Relationships and Related Transactions, and Director Independence |
The information set forth under the caption “Interest of Management in Certain Transactions” in the 20082009 Proxy Statement is incorporated herein by reference.
The information regarding director independence set forth under the captions “Board Committees and Attendance” in the 20082009 Proxy Statement is incorporated herein by reference.
- 65 -
| Item 14. | Principal Accounting Fees and Services |
The information set forth under the caption “Principal AccountingAccountant Fees” and “Audit Committee Pre-Approval Policy” in the 20082009 Proxy Statement is incorporated herein by reference.
– 64 –
| Item 15. | Exhibits, Financial Statement Schedules |
|
|
The following exhibits are filed as part of this Form 10-K and this list includes the Exhibit Index.
Exhibit No. | Description | |
3.1 | Articles of Incorporation of Old Point Financial Corporation, as amended | |
3.2 | Bylaws of Old Point Financial Corporation, as amended and restated September 11, 2007 (incorporated by reference to Exhibit 3.2 to Form 8-K/A filed on September 20, 2007) | |
10.1* | Old Point Financial Corporation 1998 Stock Option Plan, as amended April 24, 2001 (incorporated by reference to Exhibit 4.4 to Form S-8 filed July 24, 2001) | |
10.2* | Form of Incentive Stock Option Agreement (incorporated by reference to Exhibit 10.2 to Form 10-K filed March 30, 2005) | |
10.3* | Form of Non-Qualified Stock Option Agreement (incorporated by reference to Exhibit 10.3 to Form 10-K filed March 30, 2005) | |
10.4* | Form of Life Insurance Endorsement Method Split Dollar Plan Agreement with The Northwestern Mutual Life Insurance Company entered into with each of Robert F. Shuford, Louis G. Morris, Margaret P. Causby, Laurie D. Grabow and Eugene M. Jordan, II (incorporated by reference to Exhibit 10.4 to Form 10-K filed March 30, 2005) | |
10.5* | Directors’ Compensation | |
10.6* | Base Salaries of | |
10.7* | Description of | |
10.7.1* | ||
– 65 –- 66 -
10.8* | Form of Life Insurance Endorsement Method Split Dollar Plan Agreement with Ohio National Life Assurance Corporation entered into with each of Louis G. Morris, Laurie D. Grabow, Eugene M. Jordan, II and Melissa L. Burroughs (incorporated by reference to Exhibit 10.8 to form 10-K filed March 14, 2008) | |
10.9 | Memorandum of Understanding between The Old Point National Bank of Phoebus and Tidewater Mortgage Services, Inc., dated September 10, 2007 (incorporated by reference to Exhibit 10.8 to Form 10-Q filed November 9, 2007) | |
| ||
21 | Subsidiaries of the Registrant (incorporated by reference to Exhibit 21 to Form 10-K filed March 30, 2005) | |
23 | Consent of Yount, Hyde & Barbour, P.C. | |
24 | Powers of Attorney | |
31.1 | Certification of Chief Executive Officer pursuant to Section 302 of the Sarbanes-Oxley Act of 2002 | |
31.2 | Certification of Chief Financial Officer pursuant to Section 302 of the Sarbanes-Oxley Act of 2002 | |
32.1 | Certification of Chief Executive Officer and Chief Financial Officer pursuant to Section 906 of the Sarbanes-Oxley Act of 2002 | |
| * | Denotes management contract. |
– 66 –- 67 -
Pursuant to the requirements of Section 13 or 15(d) of the Securities Exchange Act of 1934, the registrant has duly caused this report to be signed on its behalf by the undersigned, thereunto duly authorized.
| OLD POINT FINANCIAL CORPORATION |
/s/ Robert F. Shuford |
| Robert F. Shuford, |
| Chairman, President & Chief Executive Officer |
| Date: March |
Pursuant to the requirements of the Securities Exchange Act of 1934, this report has been signed below by the following persons on behalf of the registrant and in the capacities and on the dates indicated.
/s/ Robert F. Shuford | Chairman, President & Chief Executive Officer | |||
| Robert F. Shuford | and Director | |||
| Principal Executive Officer | ||||
| Date: March | ||||
/s/ Laurie D. Grabow | Chief Financial Officer & Senior Vice President/ | |||
| Laurie D. Grabow | Finance | |||
| Principal Financial & Accounting Officer | ||||
| Date: March | ||||
/s/ David L. Bernd* | Director | |||
| David L. Bernd | ||||
/s/ James Reade Chisman* | Director | |||
| James Reade Chisman | ||||
/s/ Richard F. Clark* | Director | |||
| Richard F. Clark | ||||
/s/ Russell S. Evans, Jr.* | Director | |||
| Russell S. Evans, Jr. | ||||
/s/ Dr. Arthur D. Greene* | Director | |||
| Dr. Arthur D. Greene | ||||
/s/ Stephen D. Harris* | Director | |||
| Stephen D. Harris | ||||
/s/ John Cabot Ishon* | Director | |||
| John Cabot Ishon | ||||
/s/ | ||||
| Director | |||
| John B. Morgan, II | ||||
/s/ Louis G. Morris* | Director | |||
| Louis G. Morris | ||||
– 67 –
/s/ Robert L. Riddle* | Director | |||||
| Robert L. Riddle | ||||||
/s/ Dr. H. Robert Schappert* | Director | |||||
| Dr. H. Robert Schappert | ||||||
- 68 -
/s/ Robert F. Shuford, Jr.* | Director | |||
| Robert F. Shuford, Jr. | ||||
/s/ Ellen Clark Thacker* | Director | |||
| Ellen Clark Thacker | ||||
/s/ Joseph R. Witt* | Director | |||
| Joseph R. Witt | ||||
/s/ Melvin R. Zimm* | Director | |||
| Melvin R. Zimm | ||||
*By Robert F. Shuford, as Attorney in Fact
| * | By Robert F. Shuford, as Attorney in Fact |
Date: March 14, 200812, 2009
– 68 –- 69 -