UNITED STATES
SECURITIES AND EXCHANGE COMMISSION
WASHINGTON, D.C. 20549
FORM 10-K
| x | ANNUAL REPORT PURSUANT TO SECTION 13 OR 15(d) OF THE SECURITIES EXCHANGE ACT OF 1934 |
For the fiscal year ended December 30, 200731, 2009
or
| ¨ | TRANSITION REPORT PURSUANT TO SECTION 13 OR 15(d) OF THE SECURITIES EXCHANGE ACT OF 1934 |
For the transition period from to
Commission File Number: 001-33164
Domtar Corporation
(Exact name of registrant as specified in its charter)
| Delaware | 20-5901152 | |
(State or Other Jurisdiction of Incorporation or Organization) | (I.R.S. Employer Identification No.) |
395 de Maisonneuve Blvd. West
Montreal, Quebec H3A 1L6 Canada
(Address of Principal Executive Offices)(Zip Code)
Registrant’s telephone number, including area code: (514) 848-5555
Securities registered pursuant to Section 12(b) of the Act:
Title of Each Class | Name of Each Exchange on Which Registered | |
Common Stock, par value $0.01 per share | New York Stock Exchange |
Securities registered pursuant to Section 12(g) of the Act: None
Indicate by check mark if the registrant is a well-known seasoned issuer, as defined in Rule 405 of the Securities Act. Yes ¨x No x¨
Indicate by check mark if the registrant is not required to file reports pursuant to Section 13 or Section 15(d) of the Act. Yes ¨ No x
Indicate by check mark whether the registrant: (1) has filed all reports required to be filed by Section 13 or 15(d) of the Securities Exchange Act of 1934 during the preceding 12 months (or for such shorter period that the registrant was required to file such reports), and (2) has been subject to such filing requirements for the past 90 days. Yes x No ¨
Indicate by check mark whether the registrant has submitted electronically and posted on its corporate Website, if any, every Interactive Data File required to be submitted and posted pursuant to Rule 405 of Regulations S-T during the preceding 12 months (or for such shorter period that the registrant was required to submit and post such files). Yes ¨ No ¨
Indicate by check mark if disclosure of delinquent filers pursuant to Item 405 of Regulation S-K is not contained herein, and will not be contained, to the best of registrant’s knowledge, in definitive proxy or information statements incorporated by reference in Part III of this Form 10-K or any amendment to this Form 10-K. ¨
Indicate by check mark whether the registrant is a large accelerated filer, an accelerated filer, a non-accelerated filer, or a smaller reporting company. See definition of “large accelerated filer”,filer,” “accelerated filer” and “smaller reporting company” in Rule 12b-2 of the Exchange Act. (Check one):
Large Accelerated Filer ¨x Accelerated Filer ¨ Non-Accelerated Filer x¨ Smaller reporting company ¨
(Do not check if a smaller reporting company)
Indicate by check mark whether the registrant is a shell company (as defined in Rule 12b-2 of the Exchange Act). Yes ¨ No x
As of July 1, 2007,June 30, 2009, the aggregate market value of the registrant’s common stock held by non-affiliates of the registrant was $5,145,844,440.$689,235,723.
Number of shares of common stock outstanding as of March 17, 2008: 471,964,399February 24, 2010: 42,083,664
DOCUMENTS INCORPORATED BY REFERENCE
Portions of the Registrant’s Proxy Statement forfiled within 120 days of the close of the registrant’s fiscal year in connection with its 2010 Annual Meeting of Stockholders to be held on May 6, 2008 are incorporated by reference into Part III of this Annual Report on Form 10-K.
DOMTAR CORPORATION
ANNUAL REPORT ON FORM 10-K
FOR THE YEAR ENDED DECEMBER 31, 2009
TABLE OF CONTENTS
| PART I | ||||
ITEM 1 | 4 | |||
| 4 | ||||
| 4 | ||||
| 4 | ||||
| 5 | ||||
| 16 | ||||
| 17 | ||||
| 19 | ||||
ITEM 1A | 20 | |||
ITEM 1B | ||||
ITEM 2 | ||||
ITEM 3 | ||||
ITEM 4 | ||||
| PART II | ||||
ITEM 5 | ||||
ITEM 6 | ||||
ITEM 7 | MANAGEMENT’S DISCUSSION AND ANALYSIS OF FINANCIAL CONDITION AND RESULTS OF OPERATIONS | |||
| 37 | ||||
Consolidated Results and | ||||
| 54 | ||||
| 57 | ||||
| 63 | ||||
ITEM 7A | ||||
ITEM 8 | ||||
| 79 | ||||
Report of PricewaterhouseCoopers LLP, Independent Registered Public Accounting Firm | ||||
| ||||
ITEM 9 | CHANGES IN AND | |||
ITEM 9A | ||||
ITEM 9B | ||||
| PART III | ||||
ITEM 10 | ||||
ITEM 11 | ||||
ITEM 12 | SECURITY OWNERSHIP OF CERTAIN BENEFICIAL OWNERS AND MANAGEMENT AND RELATED STOCKHOLDER MATTERS | |||
ITEM 13 | CERTAIN RELATIONSHIPS AND RELATED TRANSACTIONS, AND DIRECTOR INDEPENDENCE | |||
ITEM 14 | ||||
ITEM 15 | ||||
Report of Independent Registered Public Accounting Firm on Financial Statement Schedule | ||||
PART I
| ITEM 1. | BUSINESS |
We are the largest integrated manufacturer and marketer of uncoated freesheet paper in North America and the second largest in the world based on production capacity. We are also a manufacturer of papergrade, fluff and specialty pulp. Through our subsidiaries, weWe design, manufacture, market and distribute a wide range of paper products for a variety of customers, including merchants, retail outlets, stationers, printers, publishers, converters and end-users. We own and operate Domtar Distribution Group, an extensive network of strategically located paper distribution facilities. We also produce lumber and other specialty and industrial wood products. We have three business segments: Papers, Paper Merchants and Wood. We had revenues of $5.9$5.5 billion in 2007,2009, of which approximately 82%81% was from the Papers segment, approximately 14%16% was from the Paper Merchants segment and approximately 4%3% was from the Wood segment.
Throughout this Annual Report on Form 10-K, unless otherwise specified, “Domtar Corporation,” “the Company,” “Domtar,” “we,” “us” and “our” refer to Domtar Corporation, its subsidiaries, as well as its investments. Unless otherwise specified, “Domtar Inc.” refers to Domtar Inc., a wholly-owned100% owned Canadian subsidiary. Information regarding our recent developments is included in Part II, Item 7, Management’s Discussion and Analysis of Financial Condition and Results of Operations of this Annual Report on Form 10-K, under the caption “Recent Developments.”
Domtar Corporation was incorporated on August 16, 2006, for the sole purpose of holding the Weyerhaeuser Fine Paper Business (the “Predecessor”) and consummating the combination of the Weyerhaeuser Fine Paper Business with Domtar Inc. (the “Transaction”). The Predecessor was owned by Weyerhaeuser Company (“Weyerhaeuser”) prior to the completion of the Transaction on March 7, 2007. Domtar Corporation had no operations prior to March 7, 2007 when, upon the completion of the Transaction, we became an independent public holding company. Information regarding the Transaction is included in Part II, Item 7, Management’s Discussion and Analysis of Financial Conditions and Results of Operations of this Annual Report on Form 10-K, under the caption “The Transaction” and “Accounting for the Transaction.”
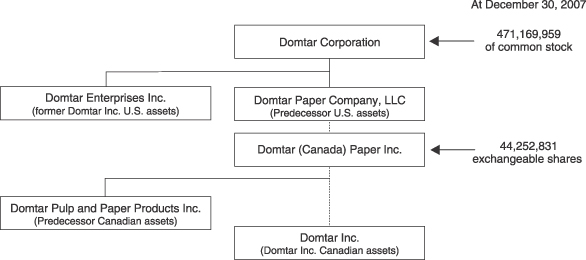
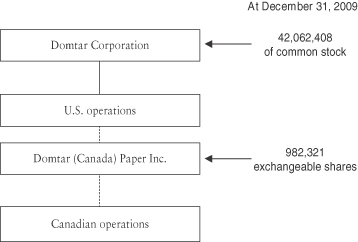
At December 30, 2007,31, 2009, Domtar Corporation had a total of 471,169,95942,062,408 shares of common stock issued and outstanding, and Domtar (Canada) Paper Inc., an indirectly 100% owned subsidiary, had a total of 44,252,831982,321 exchangeable shares issued and outstanding. These exchangeable shares are intended to be substantially the economic equivalent to shares of our common stock and are currently exchangeable at the option of the holder on a one-for-one basis for shares of our common stock. As such, the total combined number of shares of common stock and exchangeable shares issued and outstanding was 515,422,79043,044,729 at December 30, 2007.31, 2009. Our common shares are traded on the New York Stock Exchange and the Toronto Stock Exchange under the symbol “UFS” and our exchangeable shares are traded on the Toronto Stock Exchange under the symbol “UFX.” Information regarding our common stock and the exchangeable shares is included in Part II, Item 8, Financial Statements and Supplementary Data of this Annual Report on Form 10-K, under Note 2022 “Shareholders’ Equity.”
4
The following chart summarizes our corporate structure.
We operate in the three reportable segments described below. Each reportable segment offers different products and services and requires different manufacturing processes, technology andand/or marketing strategies. The following summary briefly describes the operations included in each of our reportable segments:
Papers – represents the aggregation of the manufacturing and distribution of business, commercial printing and publication,publishing, and converting and specialty papers, as well as market pulp.
Paper Merchants – involves the purchasing, warehousing, sale and distribution of our paper products and those of other paper manufacturers. These products include business and printing papers and certain industrial products.
Wood – comprises the manufacturing and marketing of lumber and wood-based value-addedother specialty and industrial wood products and the management of forest resources.
5
| Fifty-two weeks ended | Fifty-three weeks ended | Fifty-two weeks ended | ||||||||||
FINANCIAL HIGHLIGHTS PER SEGMENT | December 30, 2007 | December 31, 2006 | December 25, 2005 | |||||||||
| (In millions of U.S. dollars, unless otherwise noted) | ||||||||||||
Sales: | ||||||||||||
Papers | $ | 5,116 | $ | 3,143 | $ | 3,074 | ||||||
Paper Merchants | 813 | — | — | |||||||||
Wood | 304 | 234 | 338 | |||||||||
Total for reportable segments | 6,233 | 3,377 | 3,412 | |||||||||
Intersegment sales—Papers | (235 | ) | — | (2 | ) | |||||||
Intersegment sales—Paper Merchants | (1 | ) | — | — | ||||||||
Intersegment sales—Wood | (50 | ) | (71 | ) | (143 | ) | ||||||
Consolidated sales | $ | 5,947 | $ | 3,306 | $ | 3,267 | ||||||
Operating income (loss): | ||||||||||||
Papers | $ | 321 | $ | (608 | ) | $ | (492 | ) | ||||
Paper Merchants | 13 | — | — | |||||||||
Wood | (63 | ) | 52 | (86 | ) | |||||||
Corporate | (1 | ) | — | — | ||||||||
Total | $ | 270 | $ | (556 | ) | $ | (578 | ) | ||||
Segmented assets: | ||||||||||||
Papers | $ | 6,888 | $ | 3,933 | ||||||||
Paper Merchants | 108 | — | ||||||||||
Wood | 320 | 65 | ||||||||||
Corporate | 432 | — | ||||||||||
Total | $ | 7,748 | $ | 3,998 | ||||||||
Information regarding our reportable segments is included in Part II, Item 7, Management’s Discussion and Analysis of Financial Condition and Results of Operations as well as Item 8, Financial Statements and Supplementary Data, under Note 24,25, of this Annual Report on Form 10-K. Geographic information is also included under Note 2425 of the Financial Statements.Statements and Supplementary Data.
5
FINANCIAL HIGHLIGHTS PER SEGMENT | Year ended December 31, 2009 | Year ended December 31, 2008 | Year ended December 30, 2007 (1) | |||||||||
| (In millions of dollars, unless otherwise noted) | ||||||||||||
Sales: | ||||||||||||
Papers | $ | 4,632 | $ | 5,440 | $ | 5,116 | ||||||
Paper Merchants | 873 | 990 | 813 | |||||||||
Wood | 211 | 268 | 304 | |||||||||
Total for reportable segments | 5,716 | 6,698 | 6,233 | |||||||||
Intersegment sales—Papers | (231 | ) | (276 | ) | (235 | ) | ||||||
Intersegment sales—Paper Merchants | — | — | (1 | ) | ||||||||
Intersegment sales—Wood | (20 | ) | (28 | ) | (50 | ) | ||||||
Consolidated sales | $ | 5,465 | $ | 6,394 | $ | 5,947 | ||||||
Operating income (loss): | ||||||||||||
Papers(2) | $ | 650 | $ | (369 | ) | $ | 321 | |||||
Paper Merchants | 7 | 8 | 13 | |||||||||
Wood(2) | (42 | ) | (73 | ) | (63 | ) | ||||||
Corporate | — | (3 | ) | (1 | ) | |||||||
Total | $ | 615 | $ | (437 | ) | $ | 270 | |||||
Segment assets: | ||||||||||||
Papers | $ | 5,538 | $ | 5,399 | ||||||||
Paper Merchants | 101 | 120 | ||||||||||
Wood | 250 | 247 | ||||||||||
Corporate | 630 | 338 | ||||||||||
Total | $ | 6,519 | $ | 6,104 | ||||||||
| (1) | The year 2007 consists of 52 weeks ended December 30, 2007 and includes the consolidated financial results of the Weyerhaeuser Fine Paper Business, on a carve-out basis, from January 1, 2007 to March 6, 2007 and of the Successor for the period from March 7, 2007 to December 30, 2007. Information regarding the Transaction is included in Part II, Item 7, Management’s Discussion and Analysis of Financial Conditions and Results of Operations of this Annual Report on Form 10-K. |
| (2) | Factors that affected the year-over-year comparison of financial results are discussed in the year-over-year and segment analysis included in Part II, Item 7, Management’s Discussion and Analysis of Financial Condition and Results of Operation of this Annual Report on Form 10-K. |
6
Our Operations
We are the largest integrated manufacturer and marketer of uncoated freesheet paper in North America and the second largest in the world based on production capacity. In uncoated freesheet, weWe have 1210 pulp and paper mills in operation (nine(eight in the United States and threetwo in Canada) with an annual paper production capacity of approximately 4.63.9 million tons of uncoated freesheet paper.paper, after giving effect to the conversion of our Plymouth facility to 100% fluff pulp production in 2010. In addition, we have an annual production capacity of 238,000 tons of coated groundwood at our Columbus paper mill. Approximately 81% of our paper production capacity is domestic and the remaining 19% is located in Canada. Our paper manufacturing operations are supported by 1715 converting and distribution operations, including a network of 1112 plants located offsite of our paper making operations. Also, we have forms manufacturing operations at twothree of the offsite converting and distribution operations and threetwo stand-alone forms manufacturing operations.
We alsoIn addition, we manufacture and sell pulp in excess of our internal requirements, and we purchase papergrade pulp from third parties allowing us to optimize the logistics of our pulp capacity while reducing transportation costs. We have the capacity to sell approximately 1.51.9 million metric tonnes of pulp per year depending on market conditions.conditions, after giving effect to the conversion of our Plymouth facility to 100% fluff pulp production in 2010. Approximately 45%51% of our trade pulp production capacity is domestic, and the remaining 55%49% is located in Canada. Our net pulp position, the amount of pulp produced and sold net of purchases from third
6
parties, was approximately 1.1 million metric tonnes of pulp in 2007. We produce market pulp at our twothree non-integrated pulp mills in Kamloops, Woodland and Woodland,Dryden, as well as at our pulp and paper mills in Dryden, Espanola, Ashdown, Hawesville, and Windsor. Also, weWe also produce fluff pulp at our Plymouth mill. We also have pulping operations in Prince Albert and Lebel-sur-Quévillon that are not in operation.
7
The table below lists our operating pulp and paper mills and their annual production capacity.
| Saleable | Saleable | |||||||||||||||||||
Production Facility | Fiberline Pulp Capacity | Paper Capacity | Trade Pulp (1) | Fiberline Pulp Capacity | Paper Capacity | Trade Pulp (1) | ||||||||||||||
| # lines | (‘000 ADMT) | # machines | (‘000 ST) | (‘000 ADMT) | # lines | (‘000 ADMT) | # machines | (‘000 ST) | (‘000 ADMT) | |||||||||||
Uncoated freesheet | Uncoated freesheet | |||||||||||||||||||
Ashdown, Arkansas | 3 | 810 | 4 | 933 | 86 | 3 | 810 | 4 | 933 | 86 | ||||||||||
Windsor, Quebec | 1 | 454 | 2 | 670 | 33 | 1 | 454 | 2 | 670 | 33 | ||||||||||
Hawesville, Kentucky | 1 | 455 | 2 | 634 | 47 | 1 | 455 | 2 | 634 | 47 | ||||||||||
Plymouth, North Carolina | 2 | 486 | 2 | 489 | 153 | |||||||||||||||
Kingsport, Tennessee | 1 | 272 | 1 | 425 | 1 | 272 | 1 | 425 | ||||||||||||
Marlboro, South Carolina | 1 | 356 | 1 | 391 | 1 | 356 | 1 | 391 | ||||||||||||
Johnsonburg, Pennsylvania | 1 | 231 | 2 | 374 | 1 | 231 | 2 | 374 | ||||||||||||
Dryden, Ontario | 1 | 319 | 1 | 151 | 197 | |||||||||||||||
Nekoosa, Wisconsin | 1 | 162 | 3 | 167 | 1 | 162 | 3 | 167 | ||||||||||||
Rothschild, Wisconsin | 1 | 60 | 1 | 147 | 1 | 60 | 1 | 147 | ||||||||||||
Port Huron, Michigan | — | — | 4 | 116 | — | — | 4 | 116 | ||||||||||||
Espanola, Ontario | 2 | 351 | 2 | 77 | 114 | 2 | 351 | 2 | 77 | 114 | ||||||||||
Total uncoated freesheet | 15 | 3,956 | 25 | 4,574 | 630 | |||||||||||||||
Total Uncoated freesheet | 12 | 3,151 | 22 | 3,934 | 280 | |||||||||||||||
Coated groundwood | ||||||||||||||||||||
Columbus, Mississippi | 1 | 70 | 1 | 238 | — | 1 | 70 | 1 | 238 | — | ||||||||||
Total coated grandwood | 1 | 70 | 1 | 238 | — | |||||||||||||||
Total Coated groundwood | 1 | 70 | 1 | 238 | — | |||||||||||||||
Pulp | ||||||||||||||||||||
Kamloops, British Columbia | 2 | 477 | — | — | 477 | 2 | 477 | — | — | 477 | ||||||||||
Woodland, Maine | 1 | 398 | — | — | 398 | 1 | 398 | — | — | 398 | ||||||||||
Dryden, Ontario | 1 | 319 | — | — | 319 | |||||||||||||||
Plymouth, North Carolina | 2 | 444 | — | — | 444 | |||||||||||||||
Total pulp | 3 | 875 | — | — | 875 | |||||||||||||||
Total Pulp | 6 | 1,638 | — | — | 1,638 | |||||||||||||||
Total | 19 | 4,901 | 26 | 4,812 | 1,505 | 19 | 4,859 | 23 | 4,172 | 1,918 | ||||||||||
Pulp purchases | 288 | 171 | ||||||||||||||||||
Net pulp | 1,217 | 1,747 | ||||||||||||||||||
| (1) | Estimated third-party shipments dependent upon market conditions. |
8
Our Raw Materials
The manufacturing of pulp and paper requires wood fiber, chemicals and energy. We outlinediscuss below details of these three major raw materials used in our manufacturing operations.
Wood Fiber
United States pulp and paper mills
The fiber used by our pulp and paper mills in the United States is primarily hardwood and secondarily softwood, both arebeing readily available in the market from multiple third-party sources. The mills obtain fiber from a variety of sources, depending on their location. These sources include a combination of long-term supply contracts, wood lot management arrangements, advance stumpage purchases and spot market purchases.
7
Canadian pulp and paper mills
The fiber used at our Windsor pulp and paper mill is hardwood originating from a variety of sources, including purchases on the open market in Canada and the United States, contracts with Quebec wood producers’ marketing boards, public land where we have wood fiber harvesting rights and Domtar’s private lands. Our Espanola pulp and paper mill and Dryden pulp and paper mills,mill, which consume both hardwood and softwood, obtain fiber from third parties, or directly or indirectly from public lands, either through designated wood harvesting rights for the pulp mills or from our Ontario sawmills. The fiber used at our Kamloops pulp mill is all softwood, originating mostly from third-party sawmilling operations in the southern part of the British Columbia interior.
Cutting rights on public lands related to our pulp and paper mills in Canada represent about 0.80.7 million cubic meters of softwood and 1.31.2 million cubic meters of hardwood, for a total of 2.11.9 million cubic meters of wood per year. Access to harvesting of fiber on public lands in Ontario and Quebec is subject to licenses and review by the respective governmental authorities.
During 2007,2009, the cost of wood fiber relating to our Papers businesssegment comprised approximately 19%24% of the aggregate amount of coststotal cost of sales.
Chemicals
We use various chemical compounds in our pulp and paper manufacturing facilities that are purchasedwe purchase, primarily on a central basis, through contracts varying in general between one toand twelve years in length to ensure product availability. Most of the contracts have pricing that fluctuates based on prevailing market conditions. For pulp manufacturing, we use numerous chemicals including caustic soda, sodium chlorate, sulfuric acid, lime peroxide and liquid oxygen.peroxide. For paper manufacturing, we also use several chemical products including starch, precipitated calcium carbonate, optical brighteners, dyes and aluminum sulfate.
During 2007,2009, the cost of chemicals relating to our Papers segment comprised approximately 12% of the aggregate amount of coststotal cost of sales.
Energy
Our operations consume substantial amounts of fossil fuel including natural gas, fuel oil, coal and hog fuel as well as electricity. We purchase substantial portions of the fuel we consume under supply contracts. Under most of these contracts, suppliers are committed to provide quantities within pre-determined ranges that provide us with our needs for a particular type of fuel at a specific facility. Most of thethese contracts have pricing that fluctuates based on prevailing market conditions. Natural gas, fuel oil, coal and hog fuel are consumed primarily to produce steam that is used in the manufacturing process and, to a lesser extent, to provide direct heat to be used in the chemical recovery process. We provide about 68%About 78% of the total energy required to manufacture our products comes from renewable fuels such as bark and spent cooking liquor. The remainder of the energy required to produce steam internally through our recovery boilers and cogeneration assets with the remaining fuelcomes from purchased in the form of bark,fossil fuels such as natural gas, oil and coal.
We own power generating assets, including steam turbines, at thirteen locations: Ashdown, Dryden, Espanola, Hawesville, Johnsonburg, Kamloops, Kingsport, Nekoosa, Plymouth, Port Huron, Rothschild, Windsor
9
and Woodland, as well as hydro assets at five locations: Espanola, Gatineau, Nekoosa, Woodland and Rothschild. Electricity is primarily used to drive motors and other equipment, as well as provide lighting. Approximately 69%66% of our electric power requirements are produced internally. We purchase the balance of our power requirements from local utilities.
During 2007,2009, energy costs relating to our Papers businesssegment comprised approximately 8%7% of the aggregate amount of coststotal cost of sales.
Our Product Offering and Go-to-Market Strategy
Our uncoated freesheet papers and coated groundwood papers are used for business, commercial printing and publication,publishing, and converting and specialty applications.
8
Business papers include copy and electronic imaging papers, which are used with ink jet and laser printers, photocopiers and plain-paper fax machines, as well as computer papers, preprinted forms and digital papers. These products are primarily for office and home use. Business papers accounted for approximately 43%47% of our shipments of paper products in 2007.2009.
Our commercial printing and publicationpublishing papers include uncoated freesheet papers, such as offset papers and opaques and coated groundwood. These uncoated freesheet grades are used in sheet and roll fed offset presses across the spectrum of commercial printing end-uses, including digital printing. Our publicationpublishing papers include tradebook and lightweight uncoated papers used primarily in book publishing applications such as textbooks, dictionaries, catalogs, magazines, hard cover novels and financial documents. Design papers, a sub-group of commercial printing and publicationpublishing papers, have distinct features of color, brightness and texture and are targeted towards graphic artists, design and advertising agencies, primarily for special brochures and annual reports. Coated groundwood papers are used primarily in magazines, catalogs and inserts. Commercial printing and publicationpublishing papers accounted for approximately 35%29% of our shipments of paper products in 2007.2009.
We also produce paper for several converting and specialty markets. These converting and specialty papers consist primarily of base papers that are converted into finished products, such as envelopes, tablets, business forms and data processing/computer forms and base stock used by the flexible packaging industry in the production of food and medical packaging and other specialty papers for various other industrial applications, including base stock for sandpaper, base stock for medical gowns, drapes and packaging, as well as transfer paper for printing processes. We also participate in several converting grades for specialty and security applications. These converting and specialty papers accounted for approximately 22%24% of our shipments of paper products in 2007.2009.
The chart below illustrates our main paper products and their applications.
Category | Business Papers | Commercial Printing and | Converting and
| |||||||||
Type | Uncoated Freesheet | Coated | Uncoated Freesheet | |||||||||
Grade | Copy | Premium imaging / technology papers | Offset Colors Index Tag Bristol | Opaques Premium opaques
Lightweight Tradebook |
| Business converting Flexible packaging Abrasive papers Decorative papers Imaging papers Label papers Medical disposables | ||||||
Application | Photocopies Office documents Presentations | Commercial
Direct mail Pamphlets Brochures |
Brochures Annual reports Books Catalogs | Catalogs Magazines Direct mail Cards Posters Packaging | Forms & envelopes Food & candy packaging Surgical gowns Repositionable note pads Check and Security | |||||||
10
Our customer service personnel work closely with sales, marketing and production staff to provide service and support to merchants, converters, end-users, stationers, printers and retailers. We promote our products directly to end-users and others who influence paper purchasing decisions in order to enhance brand recognition and increase product demand. In addition, our sales representatives work closely with mill-based new product development personnel and undertake joint marketing initiatives with customers in order to better understand their businesses and needs and to support their future requirements.
We sell business papers primarily to paper merchants, office equipment manufacturers, stationers and retail outlets. We distribute uncoated commercial printing and publicationpublishing papers to end-users and commercial printers, mainly through paper merchants, as well as selling directly to converters. We sell our converting and specialty
9
products mainly to converters, who apply a further production process such as coating, laminating, folding or waxing to our papers before selling them to a variety of specialized end-users. We distributed approximately 49%41% of our paper products in 20072009 through a large network of paper merchants operating throughout North America, one of which we own (see “—Paper Merchants”). Paper merchants, who sell our products to their own customers, represent our largest group of customers. Our ten largest paper customers represented approximately 55%
The chart below illustrates our channels of our 2007 Paper business sales or 46% of our total sales in 2007. The sales to our largest customer, Office Depot, amounted to 10% of our total sales in 2007. The majority of our customers purchase products through individual purchase orders. In 2007, approximately 84% ofdistribution for our paper sales were domestic, 9% were in Canada, and 7% were in other countries.products.
Category | Business Papers | Commercial Printing and Publishing Papers | Converting and Specialty Papers | |||||||||||
Domtar sells to: | Merchants i | Office Equipment Manufacturers / Stationers i | Retailers i | Merchants i | Converters i | End-Users | Converters i | |||||||
Customer sells to: | Printers / Retailers / End-users | Retailers / Stationers / End-users | Printers / End-users | Printers / Converters / End-users | Merchants / Retailers | End-users | ||||||||
We sell market pulp to customers in North America mainly through a North American sales force while sales to most overseas customers are made directly or through commission agents. We maintain pulp supplies at strategically located warehouses, which allow us to respond to orders on short notice. In 2007,2009, approximately 33%26% of our sales of market pulp were domestic, 4%11% were in Canada 4%and 63% were in Mexicoother countries.
Our ten largest customers represented approximately 52% of our 2009 Papers segment sales or 44% of our total sales in 2009. In 2009, none of our customers represented more than 10% of our total sales. The majority of our customers purchase products through individual purchase orders. In 2009, approximately 79% of our Papers segment sales were domestic, 9% were in Canada, and 59%12% were overseas.in other countries.
Transportation
Transportation of raw materials, wood fiber, chemicals and pulp to our mills is mostly done by rail although trucks are used in certain circumstances. We rely strictly on third parties for the transportation of our pulp and paper products between our mills, converting operations, distribution centers and customers. Our paper products are shipped mostly by truck, and logistics are managed centrally in collaboration with each location. Our pulp is either shipped by vessel, rail or truck. We work with all major railroads and truck companies in the U.S. and Canada. The chart below illustrateslength of our channelscarrier contracts are generally from one to three years. We pay diesel fuel surcharges which vary depending on market conditions, but are mostly tied to the cost of distribution fordiesel fuel.
During 2009, outbound transportation costs relating to our paper products.Papers segment comprised approximately 9% of the total cost of sales.
|
|
|
| |||||||||||
|
|
|
|
|
| |||||||||
|
|
|
|
|
| |||||||||
11
Our Operations
Our Paper Merchants business involves the purchasing, warehousing, sale and distribution of our products and those of other manufacturers. Products include business, printing and publishing papers and certain industrial products. These products are sold to a wide and diverse customer base, which includes small, medium and large commercial printers, publishers, quick copy firms, catalog and retail companies and institutional entities.
Our paper merchantsPaper Merchants operate in the United States and Canada under a single banner and umbrella name, the Domtar Distribution Group. Ris Paper, part of the Domtar Distribution Group, operates throughout the Northeast, Mid-Atlantic and Midwest areas from 20 locations in the United States, including 16 distribution centers serving customers in over 18 states.across North America. The Canadian business operates as Buntin Reid in three locations in Ontario; JBR/La Maison du Papier in two locations in Quebec; and The Paper House from two locations in Atlantic Canada.
Sales are executed by our sales force, based at branches strategically located in served markets. We distribute about 53%50% of our paper sales from our own warehouse distribution system and about 47%50% of our paper sales through mill-direct deliveries (i.e., deliveries directly from manufacturers, including ourselves, to our customers).
10
The table below lists all of our Domtar Distribution Group locations.
RIS Paper | Buntin Reid | JBR / La Maison du
| The Paper House | |||||
Eastern Region | MidWest Region | Ontario, Canada | Quebec, Canada | Atlantic Canada | ||||
Albany, New York | London, Ontario | Montreal, Quebec | ||||||
Boston, Massachusetts | Cincinnati, Ohio | Ottawa, Ontario | Quebec City, Quebec | |||||
| Cincinnati, Ohio (I.T.) Cleveland, Ohio | Toronto, Ontario | ||||||
| Columbus, Ohio | |||||||
| Covington, Kentucky | |||||||
| Dayton, Ohio | |||||||
| Uniontown, Ohio | |||||||
Southport, Connecticut | Dallas/Forth Worth, Texas | |||||||
| Fort Wayne, Indiana
| |||||||
|
| |||||||
| Indianapolis, Indiana | |||||||
Our Raw Materials
The distribution business sells annually over 0.8approximately 0.7 million tons of paper, forms and industrial/packaging products from over 60 suppliers located around the world. Domtar products represent approximately 39%33% of the total.
Our Product Offering and Go-to-Market Strategy
Our product offerings addressesaddress a broad range of printing, publishing, imaging, advertising, consumer and industrial needs and are comprised of uncoated, coated and specialized papers and industrial products. Our go-to-market strategy is to serve numerous segments of the commercial printing, publishing, retail, wholesale, catalog and industrial markets with logistics and services tailored to the needs of our customers. In 2007,2009, approximately 69%68% of our sales were made in the United States and 31%32% were made in Canada.
12
Our Operations
Our Wood business comprises the manufacturing, marketing and distribution of lumber and wood-based value-added products, and the management of forest resources. We operate fiveseven sawmills with a production capacity of approximately 660890 million board feet of lumber and one remanufacturing facility. In addition, we own six sawmills that are currently not in operation but have an aggregate production capacity of approximately 796 million board feet of lumber. We also have investments in five companies, one of which is not in operation.two companies. We seek to optimize the 2831 million acres of forestland we directly license or own in Canada and the United States and Canada through efficient management and the application of certified sustainable forest management practices to help ensure that a continuous supply of wood is available for future needs. Additional information regarding our Wood business is included in Part II, Item 7, Management’s Discussion and Analysis of Financial Condition and Results of Operations of this Annual report on Form 10-K, under the caption “Recent Developments.”
11
The table below lists all of our sawmills and their annual production capacity.
Production facilities | Province | Annual Wood Capacity (MFBM) | ||
Operating sawmills: | ||||
Ear Falls | Ontario | 190 | ||
Val d’Or | Quebec | 160 | ||
Timmins | Ontario | 140 | ||
Nairn Centre | Ontario | 130 | ||
Matagami | Quebec | 100 | ||
Gogama | Ontario | 100 | ||
Ste-Marie | Quebec | 70 | ||
Total capacity of operating sawmills | ||||
Remanufacturing | ||||
Sullivan | Quebec | 75 | ||
| ||||
| ||||
| ||||
| ||||
| ||||
| ||||
| ||||
| ||||
The following table lists our investments.
Investments | Province | Ownership | |||
Elk Lake | Ontario | 66 | % | ||
| |||||
| |||||
Anthony Domtar | Ontario | 50 | % | ||
|
Our Raw Materials
Wood Fiber
Fiber costs, net of revenues from wood chip sales, representsrepresent approximately 50%38% of our total manufacturing costs in the wood businessour Wood segment, or approximately 1% of the aggregate amount oftotal cost of sales. In Quebec, our annual allowable softwood harvesting amounts to approximately 1.71.0 million cubic meters and is granted by the Ministry of Natural Resources (Quebec). We obtain most of the wood fiber required for our northern Quebec sawmilling operations either directly or indirectly from these harvesting rights. Additional information regarding wood fiber availability in Quebec is included in Part II, Item 7, Management’s Discussion and Analysis of Financial Condition and Results of Operations of this Annual Report on Form 10-K, under the caption “Fiber Supply.”
In Ontario, our annual allowable softwood harvesting on public lands amounts to approximately 2.8 million cubic meters pursuant to Sustainable Forest Licenses that have been granted by the Ontario Ministry of Natural Resources. We obtain most of the wood fiber required for our northern Ontario sawmilling operations either directly or indirectly from these harvesting rights. The remaining required fiber is either harvested from our private lands, or purchased under various contractual arrangements and on the open market.
1213
All wood fiber received by Domtar mills must conform to Domtar’s Fiber Use and Sourcing Policy, which forbids the inclusion of fiber that is illegally harvested, derived from improperly managed High Conservation Value Forests, harvested without respect for aboriginal communities, or is genetically engineered. Further, 67%58% of Domtar’s Ontario and Quebec timber supply area is currently third-party certified, with 53% of the total supply area certified to the Forestry Stewardship Council (“FSC”) standards. Domtar’s goal is to reach 100% certification of all lands under its control by the FSC and to have all of its wood suppliers conform to the FSC Controlled Wood Standard.
Energy
Our wood operations require the use of two types of energy: electric energy is used to operate our manufacturing machinery and fossil fuel is used for the drying of wood. The type of fossil fuel used to dry the wood varies among our sawmills and depends on the technology available. Some of our assets operate with energy produced with biomass through residual products such as bark, sawdust and shavings. The use of our own productsbiomass in the production of energy results in lower energy costs. In other sawmills, we use fuel oil and natural gas and propane.gas.
Our Product Offering and Go-to-Market Strategy
We produce primarily dimensional lumber used in the construction industry and our offerings include a variety of grades of kiln-dried softwood lumber, produced mainly from black spruce and jack pine which are known for their strength, stability, light weight and good workability. Most of our production capacity is used to produce studs and random length lumber in dimensions of 2 inches by 3 inches through 2 inches by 10 inches in lengths of 86 feet to 16 feet. We also manufacture quality #1 and #2 wood, utility quality #3 wood, economic wood as well as “rough” wood that we sell green and dried. We also manufacture a wide variety of value-added products including MSR 2100, MSR 1650, Premium, Select and Mid-line. Our remanufacturing facility produces specialty products mainly for the bed frame industry and home centers and can produce a large variety of products in most dimensions, in lengths of 4 inches to 16 feet.
We sell substantially all of our softwood lumber through our sales office in Montreal to a wide range of retailers, distributors, manufacturers and wholesalers in the United States and Canada who sell to end-users. These wood products are consumed in the home construction, renovation and industrial markets. Our marketing efforts for lumber products are focused on providing our customers with efficient value-added supply chain integration, in order to achieve a high level of customer satisfaction and a balanced and diversified customer base for our products. In 2007,2009, approximately 70%47% of our lumber sales were made in the United States and 30%53% were made in Canada.
Our ten biggest clientscustomers represented approximately 48%45% of our Wood segment sales in 2007.2009. None of these clientscustomers represented 10% or more of our total sales in 2007.2009.
We believe that our competitive strengths provide a solid foundation for the execution of our business strategy:
Leading market position. We are the largest integrated manufacturer and marketer of uncoated freesheet paper in North America and the second largest in the world based on production capacity. This leading market position provides us with key competitive advantages, including economies of scale, wider sales and marketing coverage and a broad product offering such asof business, printing and publishing and converting and specialty paper grades.
Efficient and cost-competitive assets. Our papers business is comprisedwide network of a mix ofworld-class assets which allowallows us to be a low-cost producer of high volume papers and an efficient producer of value-added specialty papers. Our sixfive largest mills focus on the production of high volume copy and offset papers while the others focusproduction at our other mills focuses on the production of
14
value-added paper products where quality, flexibility and service are key determinants.factors. Most of our paper production is produced at mills with integrated pulp production and cogeneration facilities, reducing their exposure to price volatility for purchased pulp and energy.
13
Proximity to customers. We have a broad distribution and manufacturing footprint completedsupported by a network of converting and distribution operations located across North America. This proximity to customers provides opportunities for direct and enhanced customer service and the minimization ofminimizes freight distance,distances, response time and delivery cost, whichcost. These constitute key competitive advantages, particularly in the high volume copy and offset paper grades market segment. Customer proximity also allows for just-in-time delivery of high demand paper products in less than 48 hours to most major North American cities.markets.
Strong franchise with attractive service solutions. We sell paper to multiple market segments through a variety of channels, including paper merchants, converters, retail companies and publishers throughout North America. In addition, we maintain a strong market presence through our ownership of the Domtar Distribution Group. We will continue to build on those positions by maximizing our strengths with centralized planning capability and supply-chain management solutions.
High quality products with strong brand recognition. We enjoy a strong reputation for producing high quality paper products and market some of the most recognized and preferred papers in North America, including a wide range of business and commercial printing paper brands, such as Cougar®, Lynx® Opaque, Husky® Offset, First Choice®, and Domtar EarthChoice® Office Paper, part of a family of environmentally and socially responsible paper.
Experienced management team with proven integration expertise. Our management team has significant experience and a record of success in the North Americanpulp and paper industry, including with respect to business integration issues. To support the management team, weindustry. We believe our employees’ expertise and know-how not only support the management team but help create operational efficiencies and enable us to deliver improved profitability from our manufacturing operations.
OUR STRATEGIC INITIATIVES AND FINANCIAL PRIORITIES
Our goal isWe strive to be recognized as the supplier of choice of branded and private branded paper products for consumer channels, stationers, merchants, printers and converters in North America. WeTo achieve this goal and to generate cash flow and create shareholder value, we have implementedestablished the following business strategies in order to enhance cash flow and generate shareholder value:strategies:
build customer loyalty and balance supply with demand;
successfully integrate the combined businesses and optimize the operating platform;
increase depth of product offerings including our offering of environmentally and ethically responsible line of papers;
deliver on synergies;
focus on free cash flow generation and maintain financial discipline; and
conduct operations in a sustainable way.
Build customer loyalty and balance supply andour production with our customer demand. We are building on the successful relationships that the Predecessor and Domtar Inc.we have developed with key customers to support their businesses and to provide inventory reduction solutions through just-in-time delivery for the most-demanded products. We believe that we are a supplier of choice for customers who seek competitively-priced paper products and services.
Successfully integrate the combined businesses and optimize the operating platform. We believe that the combination of the Predecessor and Domtar Inc. represents a strategic fit because of the similarity of both their fine paper offerings in uncoated freesheet grades and their geographic presence. Our integration efforts have been focused on providing a single faceContinue to grow our customers, utilizing our greater sales and marketing coverage to enhance customer service, and achieving synergies. The combination provides an opportunity to combine the operational strengths and best practices of two of the industry’s leading manufacturers. We are implementing plans to improve our operating efficiency and cost structure and to achieve synergies within two years through a combination of process optimization resulting in lower operating costs, reductions in transportation, logistics and
14
purchasing costs, implementation of best-in-class business practices and reductions in sales and administrative costs. We are also optimizing our distribution network, reviewing our organizational structure and consolidating our regional centers and back-office functions where appropriate.
Increase depth of product offering including our offeringline of environmentally and ethically responsible line of papers. We believe that we are delivering improved service to customers through increased deptha broad range of product offerings and greater access to volume. We believe the development of EarthChoice®, our line of environmentally and socially responsible paper, is providing a platform upon which to expand our offerings to customers. The EarthChoice® line of papers, a product line endorsed and supported by leading environmental groups, offers customers solutions and peace of mind through the use of a combination of Forest Stewardship Council (FSC) virgin fiber and recycled fiber. FSC is the certification recognized by environmental groups as the most stringent and is third-party audited.
DeliverFocus on synergies.We have targeted $200 million of synergies from the Transaction to be achieved by the end of March 2009. There are more than 650 synergy projects covering best-in-class practices, selling, general and administration, transportation and logistics, process optimization, procurement and maintenance. Given the success to date, we are optimistic that we will exceed our synergy goal of $200 million run rate by the end of fiscal year 2008.
Focus ongenerating free cash flow generation and maintainmaintaining financial discipline.We believe that value creation is achieved by operating ourefficiently operated assets efficiently and reducingcarefully managed manufacturing costs while managingare key to creating shareholder value. To generate free cash flow, we are focused on assigning our capital expenditures effectively and minimizing working capital requirements to generate free cash flow.by reducing discretionary spending, reviewing procurement costs and pursuing the balancing of production and inventory control.
15
Conduct operationsOperate in a sustainable way. Customers and end-users as well as all stakeholders in communities where we operate seek assurances from the pulp and paper industry that resources are managed in a sustainable manner. We strive to provide these assurances by certifying our forest, manufacturing and distribution operations and we intend to subscribe to internationally recognized environmental management systems, namely ISO 14001.
The markets in which our businesses operate are highly competitive with well-established domestic and foreign manufacturers.
In the Paperspaper business, our paper production does not rely on proprietary processes or formulas, except in highly specialized papers or customized products. In order to gain market share in uncoated freesheet, we compete primarily on the basis of product quality, breadth of offering, service solutions and competitively priced paper products. We seek product differentiation through an extensive offering of high quality FSC-certified paper products. While we have a leading position in the North American uncoated freesheet market, we also compete with other paper grades, including coated freesheet and uncoated groundwood, and with electronic transmission and document storage alternatives. As the use of these alternative products continues to grow, we maycontinue to see a decrease in the overall demand for paper products or shifts from one type of paper to another. All of our pulp and paper manufacturing facilities are located in the United States or in Canada where we sell 93%88% of our papers.products. The five largest manufacturers of uncoated freesheet papers in North America ownrepresent approximately 80% of the total production capacity. On a global basis, there are hundreds of manufacturers that produce and sell uncoated freesheet papers, ten of which have an annual production capacity of over 1 million tons. The level of competitive pressures from foreign producers in the North American market is highly dependent upon exchange rates, including the rate between the U.S. dollar and the Euro.Euro as well as the U.S. dollar and the Brazilian real.
The market pulp we sell is either hardwood or softwood and, to a lesser extent, fluff pulp. The pulp market is highly fragmented with many manufacturers competing worldwide, some of whom have lower operating costs than we do. Competition is primarily on the basis of access to low-cost wood fiber, product quality and prices.
15
The pulp we sell is primarily slow growth northern bleached hardwood and softwood kraft, and we produce speciallyspecialty engineered pulp grades with a pre-determined mix of wood species that go into the makingspecies. Our pulps are sold to a combination of all kinds“paper grade” customers who make printing and writing grades, and “non-paper grade” customers who make a variety of papers, from business toproducts for specialty papers.paper, packaging, tissue and industrial applications. We also seek product differentiation through the certification of our pulp mills to the FSC chain-of-custody standard and the procurement of FSC-certified virgin fiber. All of our market pulp production capacity is located in the United States or in Canada, and we sell 59%63% of our pulp overseas.to other countries.
In Wood, we sell primarily kiln-dried softwood lumber and other value added products. We are the 10th largest producer of lumber in North America with a production capacity of 1.5 MFBM and ourOur competitors include other major lumber producers, most of which are located in Eastern Canada. Competition is primarily on the basis of access to low-cost fiber, service and prices. All of our lumber production capacity is located in Canada, and we sell 70%47% of our lumberwood products to the United States, resulting in anStates. As a result, we have exposure to currency fluctuations and are potentially subject to softwood lumber export taxes.taxes and duties.
We have approximately 13,000over 10,000 employees, of which approximately 56%62% are employed in the United States and 44%38% in Canada. Approximately 69%60% of our employees are covered by collective bargaining agreements, generally on a facility-by-facility basis, which will expire between 2010 and 2015.
In 2008, we signed a four year umbrella agreement with the United Steelworkers Union, affecting approximately 4,000 employees at our U.S. locations. This agreement only covers certain economic elements, and all other contract issues will be negotiated at each operating location, as the related collective bargaining
16
agreements become subject to renewal. The parties have agreed not to strike or lock-out during the terms of the respective local agreements.
OUR APPROACH TO SUSTAINABILITY
We adopted our Statement on Sustainable Growth to govern our pathway to sustainability, from excellence in corporate and ethical standards to product stewardship. Derived fromConsistently with our Statement, we define our actions under our Code of Ethics, policies addressing health and safety, environment, forestry fiber procurement and others.
Our business is subject to a wide range of general and industry-specific laws and regulations in the United States and Canada relating to the protection of the environment, including those governing harvesting, air emissions, wastewatergreenhouse gases and climate change, waste water discharges, the storage, management and disposal of hazardous substances and wastes, contaminated sites, landfill operation and closure obligations and health and safety matters. Compliance with these laws and regulations is a significant factor in the operation of our business. We may encounter situations in which our operations fail to maintain full compliance with applicable environmental requirements, possibly leading to civil or criminal fines, penalties or enforcement actions, including those that could result in governmental or judicial orders that stop or interrupt our operations or require us to take corrective measures at substantial costs, such as the installation of additional pollution control equipment or other remedial actions.
Compliance with U.S. federal, state and local and Canadian federal and provincial environmental laws and regulations involves capital expenditures as well as additional operating costs. For example, the United States Environmental Protection Agency has promulgated regulations dealing with air emissions from pulp and paper mills, including regulations on hazardous air pollutants that require use of maximum achievable control technology and controls for pollutants that contribute to smog and haze. Additional information regarding Environmental Mattersenvironmental matters is included in Item 3, Legal Proceedings, under the caption “Climate change regulation” and in Part II, Item 7, Management’s Discussion and Analysis of Financial Condition and Results of Operations of this Annual Report on Form 10-K, under the section of Critical accounting policies, caption “Environmental Mattersmatters and Other Asset Retirement Obligations.other asset retirement obligations.”
Many of our brand name paper products are protected by registered trademarks. Our key trademarks include Cougar®, Lynx® Opaque, Husky® Offset, First Choice® and Domtar EarthChoice®. These brand names and trademarks are important to the business. Our numerous trademarks have been registered in the United States and/or in other countries where our products are sold. The current registrations of these trademarks are effective for various periods of time. These trademarks may be renewed periodically, provided that we, as the registered owner, and/or licenseeslicensee comply with all applicable renewal requirements, including the continued use of the trademarks in connection with similar goods.
16
We own U.S. and foreign patents, some of which have expired or been abandoned, and have several pending patent applications. Our management regards these patents and patent applications as important but does not consider any single patent or group of patents to be materially important to our business as a whole.
In connection with the Transaction, we entered into a contribution and distribution agreement with Weyerhaeuser and Domtar Paper Company, LLC, dated as of January 25, 2007 (as amended from time to time, the “Contribution and Distribution Agreement”). Under the terms of the Contribution and Distribution Agreement and the intellectual property license agreement, we received a fully paid-up, royalty free, non-exclusive license to use certain intellectual property and technology that is retained by Weyerhaeuser.
INTERNET AVAILABILITY OF INFORMATION
In this Annual Report on Form 10-K, we incorporate by reference certain information contained in other documents filed with the Securities and Exchange Commission (“SEC”) and we refer you to such information. We file annual, quarterly and current reports and other information with the SEC. You may read and copy any materials we file with the SEC at the SEC’s Public Reference Room at 100F Street, NE, Washington DC, 20549.
17
You may obtain information on the operation of the Public Reference Room by calling 1-800-SEC-0330. The SEC maintains a website at www.sec.gov that contains our quarterly and current reports, proxy and information statements, and other information we file electronically with the SEC. You may also access, free of charge, our reportreports filed with the SEC through our website. Reports filed or furnished to the SEC will be available through our website as soon as reasonably practicable after they are filed or furnished to the SEC. The information contained on our website, www.domtar.com, is not, and should in no way be construed as, a part of this or any other report that we filed with or furnished to the SEC.
Raymond RoyerJohn D. Williams,, age 69, is the55, has been president, chief executive officer and a director of the Company.Company since January 1, 2009. Previously, Mr. Royer wasWilliams served as president of SCA Packaging Europe between 2005 and chief executive officer2008. Prior to assuming his leadership position with SCA Packaging Europe, Mr. Williams held increasingly senior management and director of Domtar Inc. since joining Domtar Inc.operational roles in 1996. Hethe packaging business and related industries.
Melissa Anderson, age 45, is also a director of Power Financial Corporation. Mr. Royer is an Officerthe senior vice-president, human resources of the Order of Canada, a Commander of the Order of Léopold II of Belgium and an Officer of the Ordre national du Quebec.
Marvin D. Cooper, age 64, has been executive vice-president and chief operating officer of the Company since March 2007. Mr. CooperCompany. Ms. Anderson joined Domtar in January 2010. Previously, she was senior vice-president, cellulose fiber, white papershuman resources and containerboard manufacturing and engineering of Weyerhaeuser from 2002 to 2006 when he stepped down to work full-time ongovernment relations, at The Pantry, Inc., an independently operated convenience store chain in the Transaction.southeastern United States. Prior to joining Weyerhaeuser in 2002, hethis, she held a number of executivesenior management positions with Willamette Industries, Inc., including executive vice-president, pulp and paper mills from 1998 to 2002. His career inInternational Business Machine (“IBM”) over the pulp and paper industry spans over 36span of 17 years.
Daniel Buron, age 44,46, is the senior vice-president and chief financial officer of the Company. Mr. Buron was senior vice-president and chief financial officer of Domtar Inc. since May 2004. He joined Domtar Inc. in 1999. Prior to May 2004 he was vice-president, finance, pulp and paper sales division and, prior to September 2002, he was vice-president and controller. He has over 1921 years of experience in finance.
Steven A. Barker, age 54, is the senior vice-president, pulp and paper marketing of the Company. Mr. Barker was senior vice-president pulp and paper sales and marketing of Domtar Inc. since December 2004. He joined Domtar Inc. in 2000 following the acquisition of Ris Paper Company, Inc. (a wholly-owned subsidiary of Domtar Inc. since 2000) where he held a number of executive positions. His career in the paper industry spans over 25 years.
Roger H. Brear, age 60, is the senior vice-president, southern region mills of the Company. Mr. Brear was senior vice-president, paper manufacturing of Domtar Inc. since 2001 when he joined following the acquisition of four U.S. paper mills from Georgia-Pacific Corporation, where he held various senior manufacturing positions. His career in the paper industry spans over 35 years.
17
Michel Dagenais, age 58, is the senior vice-president, human resources of the Company. Mr. Dagenais was vice-president, human resources of Domtar Inc. since 2005. Previously, he was director, human resources of the Forest Products Group since joining Domtar Inc. in 2001. During his career that spans over 36 years, he has held various management and consulting positions in human resources and labor relations.
Ghislain Dinel, age 59, is the senior vice-president, northern region mills of the Company. Mr. Dinel was vice-president, operations, optimization and technology of Domtar Inc. since 2004. Since joining Domtar Inc. in 1970, he has held various management positions in the pulp and paper operations. His career in the pulp and paper industry spans over 37 years.
Michael Edwards, age 60,62, is the group senior vice-president, pulp and paper manufacturing of the Company. Mr. Edwards was vice-president, fine paper manufacturing of Weyerhaeuser since 2002. Since joining Weyerhaeuser in 1994, he has held various management positions in the pulp and paper operations. Prior to Weyerhaeuser, Mr. Edwards worked at Domtar Inc. for 11 years. His career in the pulp and paper industry spans over 4446 years.
James F. Lenhoff,Zygmunt Jablonski, age 57,56, is the senior vice-president, Distributionlaw and corporate affairs of the Company. Mr. Lenhoff was the senior vice-president, Domtar Distribution Group of Domtar Inc. since 2004. HeJablonski joined Domtar Inc. in 2000 following the acquisition of Ris Paper Company Inc. where he was vice president, sales2008, after serving in various in-house counsel positions for major manufacturing and marketing. His careerdistribution companies in the paper industry spansfor 13 years – most recently, as executive vice-president, general counsel and secretary. From 1985 to 1994, he practiced law in Washington, DC.
Mark Ushpol, age 46, is the senior vice-president, distribution of the Company. Mr. Ushpol joined Domtar in January 2010. Previously, he was sales and marketing director of Mondi Europe & International Uncoated Fine Paper, where he was in charge of global uncoated fine paper sales. He has over 2620 years experience in senior marketing and sales management with the last 13 years in the pulp and paper sector. Prior to that, he was involved in the plastics industry in South Africa for 8 years.
Patrick Loulou, age 39,41, is the senior vice-president, corporate development since he joined the Company in March 2007. Previously, he held a number of positions in the telecommunications sector as well as in management consulting. He has over 1011 years experience in corporate strategy and business development.
Jean-François Mérette, age 41,43, is the senior vice-president, forest products of the Company. Mr. Mérette was the vice-president, sawmills since he joined Domtar Inc. in 2005. Previously, he has held various management positions with a major forest products company. His career in the forest products industry spans over 1618 years.
Bart Nicholson, age 48, is the senior vice-president, specialty mills and converting operations of the Company. Mr. Nicholson was vice-president, fine paper converting operations since he joined Weyerhaeuser in 2002. Previously, he held various technical and management positions in the pulp and paper operations of Willamette Industries, Inc. since 1981. His career in the pulp and paper industry spans over 26 years.
Yves L. Parent, age 54, is the senior vice-president, information technology of the Company since March 2007. He joined Domtar Inc. in 2005 as vice-president, information technology. He has over 25 years of experience in IT management, including 15 years in the pulp and paper industry and 10 years as senior director, IT in an international manufacturing organization.18
Gilles Pharand, age 63, is the senior vice-president, law and corporate affairs of the Company. Mr. Pharand joined Domtar Inc. in 1970; and has been senior vice-president, corporate affairs since 1994 and general counsel since 1986, being responsible for secretariat, environmental and legal affairs, communications and government relations, internal audit and head office operations. His career in the pulp and paper industry spans over 37 years.
Richard L. Thomas, age 54,56, is the senior vice-president, sales and marketing of the Company. Mr. Thomas was vice-president of fine papers of Weyerhaeuser since 2005. Prior to 2005, he was vice-president, business papers of Weyerhaeuser. Mr. Thomas joined Weyerhaeuser in 2002 when Willamette Industries, Inc. was acquired by Weyerhaeuser. At Willamette, he held various management positions in operations since joining in 1992. Previously, he was with Champion International Corporation for 12 years.
18
The information included in this Annual Report on Form 10-K may contain forward-looking statements relating to trends in, or representing management’s beliefs about, Domtar Corporation’s future growth, results of operations, performance and business prospects and opportunities. These forward-looking statements are generally denoted by the use of words such as “anticipate,” “believe,” “expect,” “intend,” “aim,” “target,” “plan,” “continue,” “estimate,” “project,” “may,” “will,” “should” and similar expressions. These statements reflect management’s current beliefs and are based on information currently available to management. Forward-looking statements are necessarily based upon a number of estimates and assumptions that, while considered reasonable by management, are inherently subject to known and unknown risks and uncertainties and other factors that could cause actual results to differ materially from historical results or those anticipated. Accordingly, no assurances can be given that any of the events anticipated by the forward-looking statements will occur, or if any occurs, what effect they will have on Domtar Corporation’s results of operations or financial condition. These factors include, but are not limited to:
conditions in the effect of general economic conditions,global capital and credit markets, and the economy generally, particularly in the U.S. and Canada;
market demand for Domtar Corporation’s products, which may be tied to the relative strength of various U.S. and/or Canadian business segments;
product selling prices;
raw material prices, including wood fiber, energychemical and chemical;energy;
performance of Domtar Corporation’s manufacturing operations, including unexpected maintenance requirements;
the successful integration of the Weyerhaeuser Fine Paper Business with Domtar Inc. and the ability to realize anticipated cost savings;
the level of competition from domestic and foreign producers;
the effect of, or change in, forestry, land use, environmental and other governmental regulations (including tax), and changes in accounting regulations;
the effect of weather and the risk of loss from fires, floods, windstorms, hurricanes and other natural disasters;
transportation costs;
the loss of current customers or the inability to obtain new customers;
legal proceedings;
changes in asset valuations, including write downs of property, plant and equipment, inventory, accounts receivable or other assets for impairment or other reasons;
changes in currency exchange rates, particularly the relative value of the U.S. dollar to the Canadian dollar;
the effect of timing of retirements and changes in the market price of Domtar Corporation’s common stock on charges for stock-based compensation;
performance of pension fund investments and related derivatives; and
the other factors described under “Risk Factors,” in item 1A of this Annual Report on Form 10-K.
19
You are cautioned not to unduly rely on such forward-looking statements, which speak only as of the date made, when evaluating the information presented in this Annual Report on Form 10-K. Unless specifically required by law, Domtar Corporation assumes no obligation to update or revise these forward-looking statements to reflect new events or circumstances.
19
| ITEM 1A. | RISK FACTORS |
You should carefully consider the risks described below in addition to the other information presented in this Annual Report on Form 10-K. Some of the following risks relate principally to the Company’s business and the industry in which it operates, while others relate principally to the Transaction.
RISKS RELATING TO THE INDUSTRIES AND BUSINESSES OF THE COMPANY
The pulp, paper and wood product industries are highly cyclical. Fluctuations in the prices of and the demand for the Company’s products could result in lower sales volumes and smaller profit margins and lower sales volumes.margins.
The pulp, paper and wood product industries are highly cyclical. Historically, economic and market shifts, fluctuations in capacity and changes in foreign currency exchange rates have created cyclical changes in prices, sales volume and margins for the Company’s products. The length and magnitude of industry cycles have varied over time and by product, but generally reflect changes in macroeconomic conditions and levels of industry capacity. Most of the Company’s paper products are commodities that are widely available from other producers. Even the Company’s non-commodity products, such as value-added papers, are susceptible to commodity dynamics. Because commodity products have few distinguishing qualities from producer to producer, competition for these products is based primarily on price, which is determined by supply relative to demand.
The overall levels of demand for the products the Company manufactures and distributes, and consequently its sales and profitability, reflect fluctuations in levels of end-user demand, which depend in part on general macroeconomic conditions in North America and worldwide, as well as competition from electronic substitution. See—“SomeConditions in the global capital and credit markets, and the economy generally, can adversely affect the Company business, results of operations and financial position” and “Some of the Company’s products are vulnerable to long-term declines in demand due to competing technologies or materials.” For example, demand for cut-size office paper may fluctuate with levels of white-collar employment. Demand for many such products was materially and negatively impacted by the global economic downturn among other things, in the early part of this decade, and the Company expects that it will be susceptible to such downturns in the future.2009.
Industry supply of pulp, paper and wood products is also subject to fluctuation, as changing industry conditions can influence producers to idle or permanently close individual machines or entire mills. Such closures can result in significant cash and/or non-cash charges. In addition, to avoid substantial cash costs in connection with idling or closing a mill, some producers will choose to continue to operate at a loss, sometimes even a cash loss, which could prolong weak pricing environments due to oversupply. Oversupply can also result from producers introducing new capacity in response to favorable short-term pricing trends.
Industry supply of pulp, paper and wood products is also influenced by overseas production capacity, which has grown in recent years and is expected to continue to grow. While the weakness of the U.S. dollar has mitigated the levels of imports in recent years, imports of pulp, paper and wood products from overseas may increase, putting downward pressure on prices.
As a result, prices for all of the Company’s products are driven by many factors outside of its control, and itthe Company has little influence over the timing and extent of price changes, which are often volatile. Because market conditions beyond the Company’s control determine the prices for its commodity products, the price for any one or more of these products may fall below its cash production costs, requiring the Company to either incur cash losses on product sales or cease production at one or more of its manufacturing facilities. The Company continues to evaluatecontinuously evaluates potential adjustments to its production capacity, which may include additional closures of machines or entire mills, and the Company could recognize significant cash and/or non-cash charges relating to any such closures in future periods. See Part II, Item 7, Management’s Discussion and Analysis of Financial Condition and Results of Operation, under “Restructuring activities.” Therefore, the Company’s
20
profitability with respect to these products depends on managing its cost structure, particularly wood fiber, chemical and energy costs, which represent the largest components of its operating costs and can fluctuate based upon factors beyond its control, as described below. If the prices of or demand for its products decline, or if its wood fiber, chemical or energy costs increase, or both, its sales and profitability could be materially and adversely affected.
Conditions in the global capital and credit markets, and the economy generally, can adversely affect the Company business, results of operations and financial position.
20A significant or prolonged downturn in general economic condition may affect the Company’s sales and profitability. The Company has exposure to counterparties with which we routinely execute transactions. Such counterparties include commercial banks, insurance companies and other financial institutions, some of which may be exposed to bankruptcy or liquidity risks. While the Company has not realized any significant losses to date, a bankruptcy or illiquidity event by one of its significant counterparties may materially and adversely affect the Company access to capital, future business and results of operations.
Some of the Company’s products are vulnerable to long-term declines in demand due to competing technologies or materials.
The Company’s business competes with electronic transmission and document storage alternatives, as well as with paper grades it does not produce, such as uncoated groundwood. As a result of such competition, the Company has experienced decreased demand for some of its existing pulp and paper products. As the use of these alternatives grows, demand for pulp and paper products is likely to further decline. Moreover, demand for some of the Company’s wood products may decline if customers purchase alternativesalternative products.
The Company faces intense competition in its markets, and the failure to compete effectively would have a material adverse effect on its business and results of operations.
The Company competes with both U.S. and Canadian paper producers and, for many of its product lines, global producers, some of which may have greater financial resources and lower production costs than the Company. The principal basis for competition is selling price. The Company’s ability to maintain satisfactory margins depends in large part on its ability to control its costs. The Company cannot assure youprovide assurance that it canwill compete effectively and maintain current levels of sales and profitability. If the Company cannot compete effectively, such failure will have a material adverse effect on its business and results of operations.
The Company’s intellectual property rights are valuable, and any inability to protect them could reduce the value of its products and its brands.
The Company relies on patent, trademark, and other intellectual property laws of the United States and other countries to protect its intellectual property rights. However, the Company may be unable to prevent third parties from using its respective intellectual property without its authorization, which may reduce any competitive advantage it has developed. If the Company had to litigate to protect these rights, any proceedings could be costly, and it may not prevail. The Company cannot guarantee that any United States or foreign patents, issued or pending, will provide it with any competitive advantage or will not be challenged by third parties. Additionally, the Company has obtained and applied for United States and foreign trademark registrations, and will continue to evaluate the registration of additional service marks and trademarks, as appropriate. The Company cannot guarantee that any of its pending patent or trademark applications will be approved by the applicable governmental authorities and, even if the applications are approved, third parties may seek to oppose or otherwise challenge these registrations. The failure to secure any pending patent or trademark applications may limit the Company’s ability to protect the intellectual property rights that these applications were intended to cover.
The Company’s manufacturing businesses may have difficulty obtaining wood fiber at favorable prices, or at all.
Wood fiber is the principal raw material used by the Company, comprising approximately 19%24% of the aggregate amount oftotal cost of sales during 2007.2009. Wood fiber is a commodity, and prices historically have been cyclical. The primary source for wood fiber is timber. Environmental litigation and regulatory developments, alternative use for energy production and reduction in harvesting related to the housing market, have caused, and may cause in the future, significant reductions in the amount of timber available for commercial harvest in the United States and Canada. In addition, future domestic or foreign legislation and litigation concerning the use of timberlands, the protection of endangered species, the promotion of forest health and the response to and prevention of catastrophic wildfires could also affect timber supplies. Availability of harvested timber maybemay be further limited by adverse weather, fire, insect infestation, disease, ice storms, wind storms, flooding and other natural and man made causes, thereby reducing supply and increasing prices. Wood fiber pricing is subject to regional market influences, and the Company’s cost of wood fiber may increase in particular regions due to market shifts in those regions. Any sustained increase in wood fiber prices would increase the Company’s operating costs, and the Company may be unable to increase prices for its products in response to increased wood fiber costs due to additional factors affecting the demand or supply of these products.
The Province of Quebec adopted legislation, which became effective April 1, 2005, that reduced allowable wood-harvesting volumes by an average of 20% on public lands and 25% on territories covered by an agreement
21
between the Government of Quebec and the Cree First Nations. As a result, the amount of fiber, primarily softwood fiber, the Company is permitted to harvest annually, under its existing licenses from the Quebec government, was reduced by approximately 500,000 cubic meters to approximately 1.8 million cubic meters, reflecting a 21% reduction. The Chief Forester of Quebec has proposed a further reduction of 55,000 cubic meters, or 3%, of the total softwood annual allowable cut of forests managed by the Company. The reduction will be effective from April 2008 to March 2009 and would significantly affect the supply of fiber for the Company’s Northern Quebec softwood sawmill and market pulp operations. In addition, on October 1, 2007 Domtar Inc. received written notice from the Minister of Natural Resources and Wildlife for the province of Quebec purporting to revoke, effective September 14, 2007, Domtar Inc.’s forest license rights relating to its Grand Remous and Malartic sawmills representing approximately 567,000 cubic meters of fiber on an annual basis. While we are currently seeking the reinstatement of these license rights through formal legal proceedings, there is no assurance that we will be successful and we may lose these forest license rights permanently. The reduction in harvest volume would also result in a corresponding increase in the unit cost of wood delivered to the sawmills. In addition, as a result of the impact of the strength of the Canadian dollar against the U.S. dollar, low lumber prices and other factors, a significant portion of the Company’s wood fiber harvesting operations in Quebec have been shut down and all but two, Val d’Or and Matagami, of the facilities related to such operations have been closed indefinitely. As a result of the reduced availability, the Company may face increased costs in purchasing, and have difficulty locating wood fiber sufficient to satisfy its requirements.
Historically, Weyerhaeuser provided, on average, approximately 45% of the Weyerhaeuser Fine Paper Business’ wood fiber requirements, which is approximately 19% of the Company’s wood fiber requirements. The Company currently obtains its wood fiber requirements in part by harvesting timber pursuant to its forest licenses and forest management agreements in part by purchasing wood fiber from Weyerhaeuser pursuant to the fiber and pulp supply agreements entered into in connection with the Transaction, which expire between 2008 and 2027, and in part by purchasing wood fiber from third parties. If the Company’s cutting rights, pursuant to its forest licenses or forest management agreements are reduced, or if Weyerhaeuser or any third-party supplier of wood fiber stops selling or is unable to sell wood fiber to the Company, its financial condition and operatingor results of operations could be materially and adversely affected.
An increase in the cost of the Company’s purchased energy or chemicals would lead to higher manufacturing costs, thereby reducing its margins.
The Company’s operations consume substantial amounts of energy such as electricity, natural gas, fuel oil, coal and hog fuel. Energy comprised approximately 8% of the aggregate amount oftotal cost of sales in 2007.2009. Energy prices, particularly for electricity, natural gas and fuel oil, have been volatile in recent years and currently exceed historical averages.years. As a result, fluctuations in energy prices will impact the Company’s manufacturing costs and contribute to earnings volatility. While the Company purchases substantial portions of its energy under supply contracts, manymost of these contracts are based on market pricing.
Other raw materials the Company uses include various chemical compounds, such as precipitated calcium carbonate, sodium chlorate and sodium hydroxide, sulfuric acid, dyes, peroxide, methanol and aluminum sulfate. Purchases of chemicals comprised approximately 12% of the aggregate amount oftotal cost of sales in 2007.2009. The costs of these chemicals have been volatile historically, and they are influenced by capacity utilization, energy prices and other factors beyond the Company’s control. Chemical prices have been increasing although the impact has been partially mitigated by long term purchasing contracts that reflect our increased purchasing power.
Due to the commodity nature of the Company’s products, the relationship between industry supply and demand for these products, rather than solely changes in the cost of raw materials, will determine the Company’s ability to increase prices. Consequently, the Company may be unable to pass on increases in its operating costs to its customers. Any sustained increase in chemical or energy prices without any corresponding increase in product pricing would reduce the Company’s operating margins and potentially require it to limit or cease operationsmay have a material adverse effect on its business and results of one or more of its machines.operations.
22
The Company could experience disruptions in operations and/or increased labor costs due to labor disputes.disputes or restructuring activities.
Employees at 4439 of the Company’s facilities, a majority of the Company’s 13,00010,000 employees, are represented by unions through collective bargaining agreements, generally on a facility-by-facility basis, which will expire between 20082010 and 2012.2015. Currently, six13 collective bargaining agreements are up for renegotiation of which only three are currently under negotiation. The Company may not be able to negotiate acceptable new collective bargaining agreements, which could result in strikes or work stoppages or other labor disputes by affected workers. Renewal of collective bargaining agreements could also result in higher wages or benefits paid to union members. In addition, labor organizing activities could occur at any of the Company’s facilities. Therefore, the Company could experience a disruption of its operations or higher ongoing labor costs, which could have a material adverse effect on its business and financial condition.
In connection with the Company’s restructuring efforts, the Company has suspended operations at, or closed or announced its intention to close, various facilities and may incur liability with respect to affected employees, which could have a material adverse effect on its business or financial condition. In addition, the Company continues to evaluate potential adjustments to its production capacity, which may include additional closures of machines or entire mills, and the Company could recognize significant cash and/or non-cash charges relating to any such closures in the future.
In the early part of 2006, Weyerhaeuser closed itsThe pulp and paper mill in Prince Albert Saskatchewan, which the Company acquiredwas closed in the Transaction, which remains closed. Certain unionized parties filed a grievance against Weyerhaeuser following the shut down, alleging that certain post-closure actions taken by Weyerhaeuser violated their collective bargaining agreement.first quarter of 2006 and has not been operated since. In particular, the union disputed Weyerhaeuser’s post-closure contracting with a third-party vendorDecember 2009, we decided to oversee on-site security at Prince Albert. In connection with the Transaction, the Company has assumed any liability with respect to this grievance. In November 2007, the Company was informed that the Government of Saskatchewan was not prepared to participate in the financing and redevelopment ofdismantle the Prince Albert facility into a Northern Bleached Softwood Kraft pulp mill producing 100% Forest Stewardship Council (FSC) certified softwood pulp for the North America and offshore markets, as set forth in the memorandum of understanding signed on September 12, 2007. As such, the Company has not determined whether this facility will be reopened, sold or closed.facility. In a separate grievance relatedrelating to the closure of the Prince Albert facility, which could result in liability in excess of $20 million, the union is claiming that it is entitled to the accumulated pension benefits
22
during the actual layoff period because, according to the union, a majority of employees retained still had recall rights during the layoff. Arbitration in this matter was held on February 16 to 18, 2010, and the parties are awaiting the arbitrator’s decision. The Company is currently evaluating its position with respect to these grievances and cannot be certain that it will not incur a liability, which could be material, with respect to these grievances.in excess of $20 million.
The Company relies heavily on a small number of significant customers, including one customer that represented approximately 10%8% of the Company’s sales in 2007.2009. A loss of any of these significant customers could materially adversely affect the Company’s business, financial condition or results of operations.
The Company heavily relies on a small number of significant customers. The Company’s largest customer is Office Depot. Office Depot was historically a major customerrepresented approximately 8% of the Weyerhaeuser Fine Paper Business and Willamette Industries.Company’s sales in 2009. A significant reduction in sales to any of the Company’s key customers, including Office Depot (whichwhich could be due to factors outside its control, such as purchasing diversification)diversification or financial difficulties experienced by these customers, could materially adversely affect the Company’s business, financial condition or results of operations.
A material disruption at one or more of the Company’s manufacturing facilities could prevent it from meeting customer demand, reduce its sales and/or negatively impact its net income.
Any of the Company’s pulp or paper manufacturing facilities, or any of its machines within an otherwise operational facility, could cease operations unexpectedly due to a number of events, including:
unscheduled maintenance outages;
prolonged power failures;
23
equipment failure;
chemical spill or release;
explosion of a boiler;
the effect of a drought or reduced rainfall on its water supply;
labor difficulties;
disruptions in the transportation infrastructure, including roads, bridges, railroad tracks and tunnels;
adverse weather, fires, floods, earthquakes, hurricanes or other catastrophes;
terrorism or threats of terrorism; or
other operational problems, including those resulting from the risks described in this section.
Events such as those listed above have resulted in operating losses in the past. In May 2006, the Weyerhaeuser Fine Paper Business facilities in Plymouth, North Carolina experienced a disruption in their power supply, causing damage to a turbine generator necessary to convert high pressure steam to medium and low pressure steam used by the various mill processes. As a result of this damage, various mill operations at the Weyerhaeuser Fine Paper Business’s Plymouth facilities were shut down for repairs for up to eleven days. The Company estimates the total financial impact of this incident on its operating income was $11 million including repair costs, the opportunity value of lost production and increased operating costs. Future events may cause similar shutdowns, which may result in additional downtime and/or cause additional damage to the Company’s facilities. Any such downtime or facility damage could prevent the Company from meeting customer demand for its products and/or require it to make unplanned capital expenditures. If one or more of these machines or facilities were to incur significant downtime, it may have a material adverse effect on the Company financial results and financial position.
The Company’s indebtedness, which is approximately $1.7billion as of December 31, 2009, could adversely affect its financial condition and impair its ability to operate its business.
As of December 31, 2009, the Company had approximately $1.7 billion of outstanding indebtedness, including $336 million of indebtedness under its senior secured credit facilities, $23 million of capital leases and $1.4 billion of unsecured notes.
23
The Company’s degree of indebtedness could have important consequences to the Company’s financial condition, operating results and business, including the following:
it may limit the Company’s ability to obtain additional debt or equity financing for working capital, capital expenditures, product development, debt service requirements, acquisitions and general corporate or other purposes;
a substantial portion of the Company’s cash flows from operations will be dedicated to payments on its indebtedness and will not be available for other purposes, including operations, capital expenditures and future business opportunities;
the debt service requirements of the Company’s indebtedness could make it more difficult for the Company to satisfy its other obligations;
the Company’s borrowings under the senior secured credit facilities are at variable rates of interest, exposing the Company to increased debt service obligations in the event of increased interest rates;
it may limit the Company’s ability to adjust to changing market conditions and place it at a competitive disadvantage compared to its competitors that have less debt; and
it may increase the Company’s vulnerability to a downturn in general economic conditions or in its business, and may make the Company unable to carry out capital spending that is important to its growth.
In addition, the Company is subject to agreements that require meeting and maintaining certain financial ratios and tests. A significant or prolonged downturn in general business and economic conditions may affect the Company’s ability to comply with these covenants or meet those financial ratios and tests and could require the Company to take action to reduce its production targetsdebt or to act in a manner contrary to its current business objectives.
A breach of any of the senior secured credit facility or long-term note indenture covenants may result in an event of default under those agreements. This may allow the counterparties to those agreements to declare all amounts outstanding thereunder, together with accrued interest, to be immediately due and satisfy customer requirements wouldpayable. If this occurs, the Company may not be impaired, resulting in lower sales and income.able to refinance the indebtedness on favorable terms, or at all, or repay the accelerated indebtedness.
The Company’s operations require substantial capital, and it may not have adequate capital resources to provide for all of its capital requirements.
The Company’s businesses are capital intensive and require that it regularly incur capital expenditures in order to maintain its equipment, increase its operating efficiency and comply with environmental laws. In 2007,2009, the Company’s total capital expenditures were approximately $116$106 million including approximately $65 million for maintenance capital and approximately $11 million for environmental expenditures. The Company’s total capital expenditures in 2006 were approximately $64 million, including approximately $62 million for maintenance capital and approximately $2 million for environmental expenditures.(2008—$163 million).
If the Company’s available cash resources and cash generated from operations are not sufficient to fund its operating needs and capital expenditures, the Company would have to obtain additional funds from borrowings or other available sources or reduce or delay its capital expenditures. The Company may not be able to obtain additional funds on favorable terms, or at all. In addition, the Company’s debt service obligations will reduce its available cash flows. If the Company cannot maintain or upgrade its equipment as it requires or allocate funds to ensure environmental compliance, it could be required to curtail or cease some of its manufacturing operations, or it may become unable to manufacture products that compete effectively in one or more of its product lines.
Despite current indebtedness levels, the Company and its subsidiaries may incur substantially more debt. This could further exacerbate the risks associated with its leverage.
The Company and its subsidiaries may incur substantial additional indebtedness in the future. Although the senior secured credit facility contain restrictions on the incurrence of additional indebtedness, including secured
24
indebtedness, these restrictions are subject to a number of qualifications and exceptions, and additional indebtedness incurred in compliance with these restrictions could be substantial. For example, as of December 31, 2009, the Company had $6 million outstanding as overdraft recorded in Bank indebtedness under the revolving credit facility and had outstanding letters of credit amounting to $53 million under this credit facility, resulting in $691 million of availability for future drawings under this credit facility. Other new borrowings could also be incurred by Domtar Corporation or its subsidiaries. If the Company incurs additional debt, the risks associated with its leverage would increase.
The Company’s ability to generate the significant amount of cash needed to pay interest and principal on the Domtar Corporation notes and service its other debt and financial obligations and its ability to refinance all or a portion of its indebtedness or obtain additional financing depends on many factors beyond the Company’s control.
The Company has considerable debt service obligations. The Company’s ability to make payments on and refinance its debt, including the Domtar Corporation notes and amounts borrowed under its senior secured credit facility and other financial obligations and to fund its operations will depend on its ability to generate substantial operating cash flow. The Company’s cash flow generation will depend on its future performance, which will be subject to prevailing economic conditions and to financial, business and other factors, many of which are beyond its control.
The Company’s business may not generate sufficient cash flow from operations and future borrowings may not be available to the Company under its senior secured credit facility or otherwise in amounts sufficient to enable the Company to service its indebtedness, including the Domtar Corporation notes, and borrowings under its senior secured credit facilities or to fund its other liquidity needs. If the Company cannot service its debt, the Company will have to take actions such as reducing or delaying capital investments, selling assets, restructuring or refinancing its debt or seeking additional equity capital. Any of these remedies may not be effected on commercially reasonable terms, or at all, and may impede the implementation of its business strategy. Furthermore, the senior secured credit facility may restrict the Company from adopting any of these alternatives. Because of these and other factors that may be beyond its control, the Company may be unable to service its indebtedness.
The Company is affected by changes in currency exchange rates.
The Company manufactures all of its wood products and a significant portion of pulp and paper in Canada. Sales of these products by the Company’s Canadian operations will be invoiced in U.S. dollars or in Canadian dollars linked to U.S. pricing but most of the costs relating to these products will be incurred in Canadian dollars. As a result, any decrease in the value of the U.S. dollar relative to the Canadian dollar will reduce the Company’s profitability.
Exchange rate fluctuations are beyond the Company’s control. From 2003 to 2009, the Canadian dollar had appreciated over 50% relative to the U.S. dollar. In 2009, when compared to 2008, the Canadian dollar increased in value by approximately 17% relative to the U.S. dollar. The level of the Canadian dollar can have a material adverse effect on the sales and profitability of the Canadian operations.
The Company has liabilities with respect to its pension plans and the actual cost of its pension plan obligations could exceed current provisions. As of December 31, 2009, the Company’s defined benefit plans had a surplus of $32million on certain plans and a deficit of $112million on others on an ongoing basis.
The Company’s future funding obligations for the defined benefit pension plans depend upon changes to the level of benefits provided by the plans, the future performance of assets set aside in trusts for these plans, the level of interest rates used to determine minimum funding levels, actuarial data and experience, and any changes in government laws and regulations. As of December 31, 2009, the Company’s Canadian defined benefit pension plans held assets with a fair value of $1,211 million (CDN$1,267 million), including a fair value of $205 million
25
(CDN$214 million) of asset backed commercial paper (“ABCP”). Most of the ABCP investments were subject to restructuring (under the court order governing the Montreal Accord that was completed in January 2009) while the remainder are in conduits restructured outside the Montreal Accord or subject to litigation between the sponsor and the credit counterparty.
At December 31, 2009, the Company determined that the fair value of these ABCP investments was $205 million (CDN$214 million) (2008—$198 million (CDN$242 million)). Possible changes that could have a material effect on the future value of the ABCP include (1) changes in the value of the underlying assets and the related derivatives transaction, (2) developments related to the liquidity of the ABCP market, and (3) a severe and prolonged economic slowdown in North America and the bankruptcy of referenced corporate credits.
The Company does not expect any potential short term liquidity issues to affect the pension funds since pension fund obligations are primarily long-term in nature. Losses in pension fund investments, if any, would result in future increased contributions by the Company or its Canadian subsidiaries. Additional contributions to these pension funds would be required to be paid over 5 year or 10 year periods, depending upon the applicable provincial requirement for funding solvency deficits. Losses, if any, would also impact operating results over a longer period of time and immediately increase liabilities and reduce equity.
The Company may be required to pay significant lumber export taxes and/or countervailing and antidumping duties.
The Company may experience reduced revenues and margins on its softwood lumber business as a result of lumber export taxes and/or countervailing and antidumping duty applications. In April 2001, the Coalition for Fair Lumber Imports (“Coalition”) filed two petitions with the U.S. Department of Commerce (“Department”) and the International Trade Commission (“ITC”) claiming that production of softwood lumber in Canada was being subsidized by Canada and that imports from Canada were being “dumped” into the U.S. market (sold at less than fair value). The Coalition asked that countervailing duty (“CVD”) and antidumping (“AD”) tariffs be imposed on softwood lumber imported from Canada, commencing in 2002.
In 2006, the Canadian and U.S. governments reached a final settlement to this long-standing dispute, the Softwood Lumber Agreement (“SLA”). The provisions of the SLA included repayment of approximately 81% of the CVD and AD deposits, imposition of export measures in Canada and measures to address long-term policy reform. Under the SLA, Canadian softwood lumber exporters pay an export tax when the price of lumber is at or below a threshold price. Under present market conditions, the Company’s softwood lumber exports are subject to a 5% export charge plus a market restriction on access managed by a quota system.
In February 2009, a tribunal operating under the auspices of the London Court of International Arbitration (“LCIA”) issued its decision on a remedy in the softwood lumber arbitration in which Canada was found to have breached the 2006 SLA between the United States and Canada by failing to calculate quotas properly during the first six months of 2007. The LCIA tribunal determined that, as appropriate adjustment to compensate for its breach, Canada must collect an additional 10%ad valorem export charge on softwood lumber shipments from four Canadian provinces (Ontario, Quebec, Manitoba and Saskatchewan) until $55 million has been collected. Starting in April 2009, the United States imposed tariffs on softwood lumber from four Canadian provinces due to Canada’s failure to comply with the SLA. On September 26, 2009, the tribunal ordered Canada to impose a 10%ad valorem export charge on softwood lumber exports to the United States from the four provinces. Canada has indicated its intention to comply with this ruling. Once Canada has imposed a 10% export tax, the United States is expected to cease collecting its 10% import duty, with the result that the affected exports from Canada will continue to be subject to a 10% charge, as has been in effect since April 2009.
The Company experienced and may continue to experience reduced revenues and margins in the softwood lumber business as a result of the application of the SLA and the potential imposition of CVD and AD tariffs. The SLA, or the potential imposition of CVD and AD tariffs, could have a material adverse effect on the
26
Company’s business, financial results and financial condition, including, but not limited to, facility closures or impairment of assets.
The Company could incur substantial costs as a result of compliance with, violations of or liabilities under applicable environmental laws and regulations. It could also incur costs as a result of asbestos-related personal injury litigation.
The Company is subject, in both the United States and Canada, to a wide range of general and industry-specific laws and regulations relating to the protection of the environment and natural resources, including those governing air emissions, greenhouse gases and climate change, wastewater discharges, harvesting, silvicultural activities, the storage, management and
24
disposal of hazardous substances and wastes, the cleanup of contaminated sites, landfill operation and closure obligations, forestry operations and endangered species habitat, and health and safety matters. In particular, the pulp and paper industry in the United States is subject to the United States Environmental Protection Agency’s (“EPA”) Cluster Rule and was until recently subject to the EPA’s Boiler MACT Rule (the Boiler MACT Rule has been vacated, however, alternative U.S. federal and state regulations are being discussed) that further regulate effluent and air emissions. These laws and regulations require the Company to obtain authorizations from and comply with the requirements of the appropriate governmental authorities, which have considerable discretion over the terms and timing of permits.
The Company has incurred, and expects that it will continue to incur, significant capital, operating and other expenditures complying with applicable environmental laws and regulations as a result of remedial obligations. The Company incurred approximately $85$71 million of operating expenses and $11$2 million of capital expenditures in connection with environmental compliance and remediation for 2007.2009. As of December 30, 2007,31, 2009, the Company had a provision of $119$111 million for environmental expenditures, including certain asset retirement obligations (such as for land fill capping and asbestos removal) ($99 million as of December 31, 2008). In addition, during the first half of 2006, the Company closed itsThe pulp and paper mill in Prince Albert Saskatchewanwas closed in the first quarter of 2006 and the Big River Sawmill in Saskatchewan. The Company has not determined whether either of these facilities will be reopened, sold or permanently closed.been operated since. In December 2009, the eventCompany decided to dismantle the facilities are permanently closed, thePrince Albert facility. The Province of Saskatchewan may require active decommissioning and reclamation at one or both facilities, which wouldthe facility. In the event decommissioning and reclamation is required at the facility, the work is likely to include investigation and remedial action for areas of significant environmental impacts. The Province of Saskatchewan has required certain facilities located in the Province to submit preliminary decommissioning and reclamation plans and to include in such plans estimates of costs associated with decommissioning and reclamation activities. Weyerhaeuser submitted such a plan for its pulp and paper facility in Prince Albert, Saskatchewan. In its preliminary decommissioning and reclamation plan, Weyerhaeuser included a preliminary, generalized estimate of costs ranging from CDN$20 to CDN$25 million (approximately $20 to $25 million). Weyerhaeuser advised the Province of Saskatchewan that it was not providing a detailed delineation of costs at this time because such costs will depend on site specific factors, the professional judgments of environmental specialists and experts, further detailed environmental site assessments, and most fundamentally, a decision about the future use or closure of the site. The estimate referred to above does not take into account the equipment resale value or scrap material value which is considered to be significant, nor does it include the cost of completing a phase II environmental site assessment (which could involve sampling and analysis of building materials and environmental media), or the cost of any remediation required based on such assessment. The Company has not undertaken an in depth review of Weyerhaeuser’s estimate anda reserve for the net decommissioning and reclamation costs could exceed Weyerhaeuser’s estimate.estimated required environmental remediation at the site.
The Company also could incur substantial costs, such as civil or criminal fines, sanctions and enforcement actions (including orders limiting its operations or requiring corrective measures, installation of pollution control equipment or other remedial actions), cleanup and closure costs, and third-party claims for property damage and personal injury as a result of violations of, or liabilities under, environmental laws and regulations. The Company’s ongoing efforts to identify potential environmental concerns that may be associated with its past and present properties will lead to future environmental investigations. Those efforts will likely result in the determination of additional environmental costs and liabilities which cannot be reasonably estimated at this time.
As the owner and operator of real estate, the Company may be liable under environmental laws for cleanup, closure and other damages resulting from the presence and release of hazardous substances, including asbestos, on or from its properties or operations. The amount and timing of environmental expenditures is difficult to predict, and, in some cases, the Company’s liability may be imposed without regard to contribution or to whether it knew of, or caused, the release of hazardous substances and may exceed forecasted amounts or the value of the property itself. The discovery of additional contamination or the imposition of additional cleanup obligations at the Company’s or third-party sites may result in significant additional costs. Any material liability the Company incurs could adversely impact its financial condition or preclude it from making capital expenditures that would otherwise benefit its business.
25
In addition, the Company may be subject to asbestos-related personal injury litigation arising out of exposure to asbestos on or from its properties or operations, and may incur substantial costs as a result of any defense, settlement, or adverse judgment in such litigation. The Company may not have access to insurance proceeds to cover costs associated with asbestos-related personal injury litigation.
27
Enactment of new environmental laws or regulations or changes in existing laws or regulations, or interpretation thereof, might require significant expenditures. For example, changes in climate change regulation—See Item 3, Legal Proceedings, under the caption “Climate change regulation.”
The Company may be unable to generate funds or other sources of liquidity and capital to fund environmental liabilities or expenditures.
The Company is affected by changes in currency exchange rates.
The Company manufactures a significant amount of pulp and paper in Canada. Sales of pulp and paper products by the Company’s Canadian mills will be invoiced in U.S. dollars or in Canadian dollars linked to U.S. pricing but most of the costs relating to these products will be incurred in Canadian dollars. As a result, any decrease in the value of the U.S. dollar relative to the Canadian dollar will reduce the Company’s profitability.
Exchange rate fluctuations are beyond the Company’s control. Since January 1, 2002, the Canadian dollar has appreciated more than 60% relative to the U.S. dollar. This has had a material adverse effect on the sales and profitability of the Canadian operations of both the Predecessor and Domtar Inc. and is continuing to have an adverse effect on the Company’s business, financial results and financial condition.
The Company may be required to pay significant lumber export taxes and/or countervailing and antidumping duties.
The Company may experience reduced revenues and margins on its softwood lumber business as a result of lumber export taxes and/or countervailing and antidumping duty applications. In April 2001, the Coalition for Fair Lumber Imports (“Coalition”) filed two petitions with the U.S. Department of Commerce (“Department”) and the International Trade Commission (“ITC”) claiming that production of softwood lumber in Canada was being subsidized by Canada and that imports from Canada were being “dumped” into the U.S. market (sold at less than fair value). The Coalition asked that countervailing duty (“CVD”) and antidumping (“AD”) tariffs be imposed on softwood lumber imported from Canada.
In 2006, the Canadian and U.S. governments reached a final settlement to this long-standing dispute. The provisions of the settlement included repayment of approximately 81% of the deposits, imposition of export measures in Canada, and measures to address long-term policy reform. It is possible that the CVD and AD tariffs or tariffs similar to the CVD and AD tariffs may again be imposed on the Company, in the future.
Under the settlement agreement, Canadian softwood lumber exporters pay an export tax when the price of lumber is at or below a threshold price. Under present market conditions, the Company’s softwood lumber exports are subject to a 5% export charge plus a market restriction on access managed by a quota system.
The Company experienced and may continue to experience reduced revenues and margins in the softwood lumber business as a result of the application of the settlement agreement. The settlement agreement could have a material adverse effect on the Company’s business, financial results and financial condition, including, but not limited to, facility closures or impairment of assets.
The Company depends on third parties for transportation services.
The Company relies primarily on third parties for transportation of the products it manufactures and/or distributes, as well as delivery of its raw materials. In particular, a significant portion of the goods it
26
manufactures and raw materials it uses are transported by railroad or trucks, which are highly regulated. If any of its third-party transportation providers were to fail to deliver the goods the Company manufactures or distributes in a timely manner, the Company may be unable to sell those products at full value, or at all. Similarly, if any of these providers were to fail to deliver raw materials to the Company in a timely manner, it may be unable to manufacture its products in response to customer demand. In addition, if any of these third parties were to cease operations or cease doing business with the Company, it may be unable to replace them at reasonable cost. Any failure of a third-party transportation provider to deliver raw materials or finished products in a timely manner could harm the Company’s reputation, negatively impact its customer relationships and have a material adverse effect on its financial condition and operating results.
The transition services provided by Weyerhaeuser may be difficult forCompany’s intellectual property rights are valuable, and any inability to protect them could reduce the Company to replace without operational problemsvalue of its products and additional costs.its brands.
The Company entered into a transition services agreement with Weyerhaeuser pursuant to which Weyerhaeuser agreed to provide the Company certain transition services for a period of time following the Closing Date. These services include, among others, certain services relating to financerelies on patent, trademark, and administration, human resources, payroll and information technology. If, after the expirationother intellectual property laws of the agreement, the Company is unable to perform these services or replace them in a timely manner or on terms and conditions as favorable as those the Company receives from Weyerhaeuser, the Company may experience operational problems and an increase in its costs. In addition, the cost for such services may be higher than the cost for such services when the Weyerhaeuser Fine Paper Business was operated as part of Weyerhaeuser. See “Risks related to the transaction—The historical financial information of the Predecessor may not be representative of its results if the Weyerhaeuser Fine Paper Business had been operated independently of Weyerhaeuser and, as a result, may not be a reliable indicator of its future results.” At December 30, 2007, the transition services agreement for both human resources and payroll services as well as finance and administration had been terminated as all activities related to those agreements had been successfully transferred to the Company.
As a result of the separation of the Weyerhaeuser Fine Paper Business from Weyerhaeuser, the Company may experience increased costs resulting from decreased purchasing power, which could decrease its overall profitability.
Prior to its separation from Weyerhaeuser, the Predecessor was able to take advantage of Weyerhaeuser’s size and reputation in procuring raw materialsUnited States and other goods and services used both for the Predecessor and Weyerhaeuser’s other businesses. As an independent public company,countries to protect its intellectual property rights. However, the Company may be unable to obtain similar goods, servicesprevent third parties from using its intellectual property without its authorization, which may reduce any competitive advantage it has developed. If the Company had to litigate to protect these rights, any proceedings could be costly, and technology at pricesit may not prevail. The Company cannot guarantee that any United States or on termsforeign patents, issued or pending, will provide it with any competitive advantage or will not be challenged by third parties. Additionally, the Company has obtained and applied for United States and foreign trademark registrations, and will continue to evaluate the registration of additional service marks and trademarks, as favorable as those obtainedappropriate. The Company cannot guarantee that any of its pending patent or trademark applications will be approved by the Predecessor priorapplicable governmental authorities and, even if the applications are approved, third parties may seek to its separation from Weyerhaeuser.
oppose or otherwise challenge these registrations. The Company has liabilities with respectfailure to its pension plans and the actual cost of its pension plan obligations could exceed current provisions. As of December 30, 2007, the Company’s defined benefit plans had a surplus of $38million on certain plans and a deficit of $185million on others on a ongoing basis.
The Company’s future funding obligations for the defined benefit pension plans depend upon changes to the level of benefits provided by the plans, the future performance of assets set aside in trusts for these plans, the level of interest rates used to determine minimum funding levels, actuarial data and experience, andsecure any changes in government laws and regulations. As of December 30, 2007, the Company’s Canadian defined benefit pension funds had approximately CDN$1,491 million (approximately $1,509 million) of assets, of which approximately CDN$445 million (approximately $450 million) is held by Domtar Inc.’s Canadian pension funds, invested in multiple third party asset backed commercial paper (“ABCP”) conduits, which are currently subject to restructuringpending patent or repayment delay, and of which CDN$389 million (approximately $393 million) is subject to the interim arrangement of the “Montreal Proposal” pursuant to which banks and major investors are negotiating restructuring proposals with respect to certain ABCP conduits; however, these discussions are not finalized, and the outcome and the effect it would have on the value of the Company’s Canadian pension fund assets has yet to be determined.
27
Losses in the pension fund investments, if any, would result in future increased contributions by the Company or its Canadian subsidiaries. Additional contributions to these pension funds would be required to be paid over a 5-year period. Losses, if any, would also impact operating results over a longer period of time and immediately increase liabilities and reduce equity.
RISKS RELATED TO THE TRANSACTION
The Companytrademark applications may not realize anticipated synergies, cost savings and growth opportunities from the Transaction.
The success of the Transaction depends, in part, onlimit the Company’s ability to realizeprotect the anticipated synergies, cost savings and growth opportunities from integrating the Weyerhaeuser Fine Paper Business with the Domtar Inc. business. The Company’s success in realizing these synergies, cost savings and growth opportunities, and the timing of this realization, depends on the successful integration of such businesses and operations. Even if the Company is able to integrate such businesses and operations successfully, there can be no assurance that this integration will result in the realization of the full benefits of synergies, cost savings and growth opportunities that the Company expects from this integration orintellectual property rights that these benefits will be achieved within the anticipated time frame. For example, the elimination of duplicative costs may not be possible or may take longer than anticipated, or the benefits from the Transaction may be offset by the loss of Weyerhaeuser’s purchasing power or the costs incurred in integrating the businesses and operations.
The Company incurred and expectsapplications were intended to continue to incur significant costs related to the Transaction that could have a material adverse effect on its operating results.
The Company incurred financial, legal and accounting costs and sales and transfer taxes in connection with the Transaction. In addition, the Company estimates that it will incur costs in connection with the separation of the Weyerhaeuser Fine Paper Business from Weyerhaeuser. The Company also anticipates that it will incur significant costs in connection with the integration of the Weyerhaeuser Fine Paper Business and the Domtar Inc. business, including, among other things, costs relating to information technology integration, severance costs and the potential write-down of assets, which cannot be reasonably estimated at this time. These costs may have a material adverse effect on the Company’s cash flows and operating results in the periods in which they are recorded.
The historical financial information of the Predecessor may not be representative of its results if the Weyerhaeuser Fine Paper Business had been operated independently of Weyerhaeuser and, as a result, may not be a reliable indicator of its future results.
Prior to the Closing Date, the Predecessor was a fully integrated business unit of Weyerhaeuser. Consequently, the financial information of the Predecessor included in this document has been derived from the consolidated financial statements and accounting records of Weyerhaeuser and reflects assumptions and allocations made by Weyerhaeuser. The financial position, results of operations and cash flows of the Predecessor presented may be different from those that would have resulted had the Predecessor been operated independently. For example, in preparing the Predecessor financial statements, Weyerhaeuser has made an appropriate allocation of costs and expenses that are attributable to the Predecessor. However, these costs and expenses reflect the costs and expenses attributable to the Predecessor operated as part of a larger organization and do not reflect costs and expenses that would be incurred by this business had it been operated independently. As a result, the historical financial information of the Predecessor may not be a reliable indicator of future results.
Material weaknesses in our internal control over financial reporting could result in a material misstatement of our financial condition.
A material weakness is a control deficiency, or combination of control deficiencies, that results in more than a remote likelihood that a material misstatement of the annual or interim financial statements will not be prevented or detected. Management of the Company identified the following material weaknesses as of April 1, 2007, which were remediated as of December 30, 2007.
28
The Company did not maintain effective controls over the completeness and accuracy of financial information produced under the transition services agreement with Weyerhaeuser. Specifically, the Company did not have controls designed and in place to ensure that financial data regarding the Predecessor was complete, accurate, produced on a timely basis and supported with appropriate documentation. Further, the Company did not maintain an appropriate accounting and financial reporting organizational structure, specifically relating to the depth of resources, to be able to ensure that the accounting records being maintained by Weyerhaeuser under the transition services agreement were accurate and complete. The financial data produced under the transition services agreement affects substantially all balance sheet and income statement accounts.
These control deficiencies resulted in adjustments to the interim financial statements as of and for the thirteen week period ended April 1, 2007 and a delay in the filing of the Quarterly Report on Form 10-Q for that period.
Aboriginal interests may delay or result in challenges to the transfer of certain forest licenses and forest management agreements.
Under applicable forestry legislation in Saskatchewan, Weyerhaeuser must obtain consent from the Government of Saskatchewan in order to complete the transfer of certain timber rights in Saskatchewan to the Company. Pursuant to the agreements governing the Transaction, the transfer of these timber rights were delayed until the appropriate approvals are received. Recent Supreme Court of Canada decisions have confirmed that the federal and provincial governments in Canada have a duty to consult with, and in certain circumstances, seek to accommodate aboriginal groups whenever there is a reasonable prospect that a government’s decision may adversely affect an aboriginal group’s interests in relevant land and resources that are the subject of the decision. The Company believes that the Government of Saskatchewan has consulted with relevant aboriginal groups in connection with these consent approvals. This consultation process could result in delays, constrain access to the timber or give rise to additional costs. In addition, if the Government of Saskatchewan does not adequately discharge its obligation this could result in litigation. It is not possible at present to predict the risks associated with such litigation.
If the distribution by Weyerhaeuser of its shares of Company common stock to the holders of Weyerhaeuser common shares and Weyerhaeuser exchangeable shares pursuant to an exchange offer (“Distribution”) did not constitute a tax-free transaction, either as a result of actions taken in connection with the distribution or as a result of subsequent acquisitions of shares of Company common stock, then the Company may be responsible for payment of substantial U.S. federal income taxes under its tax sharing agreement with Weyerhaeuser.
Weyerhaeuser received a private letter ruling from the Internal Revenue Service on February 5, 2007 to the effect that, based on the facts, assumptions, representations and undertakings set forth in the ruling, the Contribution and Distribution qualified as tax-free to Weyerhaeuser and the holders of Weyerhaeuser common shares for U.S. federal income tax purposes under Sections 355 and 368 and related provisions of the Code.
The Distribution would become taxable to Weyerhaeuser pursuant to Section 355(e) of the Code if 50% or more (by vote or value) of equity securities of the Company were acquired, directly or indirectly, by persons other than Weyerhaeuser shareholders as part of a plan or series of related transactions that included the Distribution. Because Weyerhaeuser shareholders owned more than 50% of Company common stock following the Arrangement, the Arrangement, by itself, would not have caused the Distribution to be taxable to Weyerhaeuser under Section 355(e) of the Code. However, if the IRS were to determine that other acquisitions of Company equity securities, either before or after the Distribution and the Arrangement, were part of a plan or series of related transactions that included the Distribution such determination could result in the recognition of a gain by Weyerhaeuser under Section 355(e) of the Code. In such case, the gain recognized by Weyerhaeuser likely would include the entire fair market value of the Company common stock distributed to Weyerhaeuser’s shareholders, and thus would be substantial.
29
Under the tax sharing agreement among Weyerhaeuser, the Company, and Domtar Inc., the Company generally would be required to indemnify Weyerhaeuser against tax-related losses to Weyerhaeuser and/or its shareholders that arise as a result of certain actions taken or omissions to act by the Company, its subsidiaries or certain affiliates of the Company (“Disqualifying Actions”) after the Transaction. See “Risks related to the transaction—The Company may be affected by significant restrictions following the Transaction in order to avoid significant tax-related liabilities.”
The Company may be affected by significant restrictions following the Transaction in order to avoid significant tax-related liabilities.
Even if the Distribution qualifies as a tax-free reorganization, it may not qualify as a transaction that is tax-free to Weyerhaeuser if 50% or more (by vote or value) of the equity securities of the Company are acquired by persons other than Weyerhaeuser shareholders as part of a “plan” that includes the Distribution pursuant to Section 355(e) of the Code.
The tax sharing agreement requires that the Company, its subsidiaries and certain affiliates of the Company, for a two-year period following the Closing Date, avoid taking certain actions that might cause the Distribution to be treated as part of a plan pursuant to which 50% or more of the Company’s equity securities are acquired. Certain of these Disqualifying Actions subject to restrictions include:
The redemption, recapitalization, repurchase or acquisition by the Company of its capital stock;
The issuance by the Company of capital stock or convertible debt;
The liquidation of the Company;
The discontinuance of the operations of the Predecessor;
The sale or disposition (other than in the ordinary course of business) of all or a substantial part of the Predecessor; or
The other actions, omissions to act or transactions that could jeopardize the tax-free status of the Distribution.
To the extent that the tax-free status of the Distribution is lost because of a Disqualifying Action after the date of consummation of the Transaction, the Company generally will be required to indemnify, defend and hold harmless Weyerhaeuser from and against any and all resulting tax-related losses incurred by Weyerhaeuser and/or Weyerhaeuser shareholders, without regard to whether Weyerhaeuser gave the Company prior written consent to the specific action taken by the Company.
Because of these restrictions, the Company may be limited in its ability to pursue strategic transactions or equity or convertible debt financing or engage in new business or other transactions that may maximize the value of its business.cover.
A third party has demanded an increase in consideration from Domtar Inc. under an existing contract in connection with the Transaction.contract.
In July 1998, Domtar Inc. acquired all of the issued and outstanding shares of E.B. Eddy Limited and E.B. Eddy Paper, Inc. (E.B. Eddy), an integrated producer of specialty paper and wood products. The purchase agreement relating to this acquisition includes a purchase price adjustment whereby, in the event of the acquisition by a third-party of more than 50% of the shares of Domtar Inc. in specified circumstances, Domtar Inc. may be required to pay an increase in consideration of up to a maximum of CDN$120$115 million (approximately $121(CDN$120 million). This amount gradually declines over a 25-year period and at March 7, 2007, the Closing Date,closing date of the combination of the Weyerhaeuser Fine Paper Business with Domtar Inc., the maximum amount of the purchase price adjustment was CDN$110approximately $105 million (approximately $111(CDN$110 million). No provision was recorded for this potential purchase price adjustment.
30
On March 14, 2007, Domtar Inc.the Company received a letter from George Weston Limited (the previous owner of E.B. Eddy and a party to the purchase agreement) demanding payment of CDN$110$105 million (approximately $111(CDN$110 million) as a result of the consummation of the Transaction.March 2007 combination of the Weyerhaeuser Fine Paper Business with
28
Domtar Inc. On June 12, 2007, an action was commenced by George Weston Limited against Domtar Inc. in the Superior Court of Justice of the province of Ontario, Canada, claiming that the consummation of the TransactionMarch 2007 combination of the Weyerhaeuser Fine Paper Business with Domtar Inc. triggered the purchase price adjustment and seekingsought a purchase price adjustment of CDN$110$105 million (approximately $111(CDN$110 million) as well as additional compensatory damages. The Company and Domtar Inc. does not believe that the consummation of the TransactionMarch 2007 combination of the Weyerhaeuser Fine Paper Business with Domtar Inc. triggers an obligation to pay an increase in consideration under the purchase price adjustment and it intends to defend itself vigorously against any claims with respect thereto. However, the Company may not be successful in its defense of such claims, and if it is ultimately required to pay an increase in consideration, such payment may have a material adverse effect on the Company’s liquidity,financial position, results of operations and financial condition.
The Company’s substantial indebtedness, which is approximately $2.2billion as of December 30, 2007, could adversely affect its financial condition and impair its ability to operate its business.
As of December 30, 2007, the Company had approximately $2.2 billion of outstanding indebtedness, including $693 million of indebtedness under its senior secured credit facilities, $39 million of capital leases and $1.5 billion of unsecured long-term notes.
The Company’s substantial degree of indebtedness could have important consequences to the Company’s financial condition, operating results and business, including the following:
it may limit the Company’s ability to obtain additional debt or equity financing for working capital, capital expenditures, product development, debt service requirements, acquisitions and general corporate or other purposes;
a substantial portion of the Company’s cash flows from operations will be dedicated to payments on its indebtedness and will not be available for other purposes, including operations, capital expenditures and future business opportunities;
the debt service requirements of the Company’s indebtedness could make it more difficult for the Company to satisfy its other obligations;
the Company’s borrowings under the senior secured credit facilities are at variable rates of interest, exposing the Company to increased debt service obligations in the event of increased interest rates;
it may limit the Company’s ability to adjust to changing market conditions and place it at a competitive disadvantage compared to its competitors that have less debt; and
it may increase the Company’s vulnerability to a downturn in general economic conditions or in its business, and may make the Company unable to carry out capital spending that is important to its growth.
Despite current indebtedness levels, the Company and its subsidiaries may incur substantially more debt. This could further exacerbate the risks associated with its substantial leverage.
The Company and its subsidiaries may incur substantial additional indebtedness in the future. Although the Credit Agreement contains restrictions on the incurrence of additional indebtedness, including secured indebtedness, these restrictions are subject to a number of qualifications and exceptions, and the indebtedness incurred in compliance with these restrictions could be substantial. For example, as of December 30, 2007, the Company had $50 million drawn under its senior secured revolving credit facility and $46 million of letters of credit outstanding, resulting in $654 million of availability for future drawings under this facility. Other new borrowing could also be incurred by Domtar Corporation or its subsidiaries. If the Company incurs additional debt, the risks associated with its substantial leverage would increase.
31
The Company’s ability to generate the significant amount of cash needed to pay interest and principal on the Domtar Corporation notes and service its other debt and financial obligations and its ability to refinance all or a portion of our indebtedness or obtain additional financing depends on many factors beyond the Company’s control.
The Company has considerable debt service obligations. The Company’s ability to make payments on and refinance its debt, including the Domtar Corporation debt securities and amounts borrowed under its senior secured credit facilities and other financial obligations and to fund its operations will depend on its ability to generate substantial operating cash flow. The Company’s cash flow generation will depend on its future performance, which will be subject to prevailing economic conditions and to financial, business and other factors, many of which are beyond its control.
The Company business may not generate sufficient cash flow from operations and future borrowings may not be available to the Company under its senior secured credit facilities or otherwise in amounts sufficient to enable the Company to service its indebtedness, including the Domtar Corporation notes, and borrowings under its senior secured credit facilities or to fund its other liquidity needs. If the Company cannot service its debt, the Company will have to take actions such as reducing or delaying capital investments, selling assets, restructuring or refinancing its debt or seeking additional equity capital. Any of these remedies may not be effected on commercially reasonable terms, or at all, and may impede the implementation of its business strategy. Further, the Credit Agreement may restrict the Company from adopting any of these alternatives. In addition, the restrictions on the Company’s ability to issue equity securities or convertible debt securities during the two year period following the Closing Date without jeopardizing the intended tax consequences of the Transaction may make it difficult for the Company to raise equity capital if needed to service its indebtedness. Because of these and other factors that may be beyond its control, the Company may be unable to pay the principal, premium, if any, interest or other amounts on the Domtar Corporation notes. See “Risks related to the Transaction—The Company may be affected by significant restrictions following the Transaction in order to avoid significant tax-related liabilities.”flows.
| ITEM 1B. | UNRESOLVED STAFF COMMENTS |
None.
| ITEM 2. | PROPERTIES |
A description of our mills and related properties is included in Part I, Item I, Business, of this Annual Report on Form 10-K.
Production facilities
We own all of our production facilities with the exception of certain portions that are subject to leases with government agencies in connection with industrial development bond financings or fee-in-lieu-of-tax agreements, and lease substantially all of our sales offices, regional replenishment centers and warehouse facilities. We believe our properties are in good operating condition and are suitable and adequate for the operations for which they are used. We own substantially all of the equipment used in our facilities.
Forestlands
We optimize 2831 million acres of forestland directly licensed or owned in Canada and the United States and Canada through efficient management and the application of certified sustainable forest management practices such that a continuous supply of wood is available for future needs.
32
Listing of facilities and locations
Head Office
Montreal, Quebec
Papers
Operation Center:
Fort Mill, South Carolina
Uncoated Freesheet:
Ashdown, Arkansas
Dryden, Ontario
Espanola, Ontario
Hawesville, Kentucky
Johnsonburg, Pennsylvania
Kingsport, Tennessee
Marlboro, South Carolina
Nekoosa, Wisconsin
Plymouth, North Carolina
Port Huron, Michigan
Rothschild, Wisconsin
Windsor, Quebec
Coated Groundwood:
Columbus, Mississippi
Pulp:
Dryden, Ontario
Kamloops, British Columbia
Lebel-sur-Quévillon, Quebec
Prince Albert, SaskatchewanPlymouth, North Carolina
Woodland, Maine
Chip Mills:
Hawesville, Kentucky
Johnsonburg, Pennsylvania
Kingsport, Tennessee
Marlboro, South Carolina
Converting and Distribution – Distribution—Onsite:
Ashdown, Arkansas
Dryden, Ontario
Plymouth, North Carolina
Port Edwards, Wisconsin
Rothschild, Wisconsin
Windsor, Quebec
Converting and Distribution – Distribution—Offsite:
Addison, Illinois
Brownsville, Tennessee
Cerritos, California
Dallas, Texas
29
Dubois, Pennsylvania
Griffin, Georgia
Indianapolis, Indiana
Mira Loma, California
Owensboro, Kentucky
Ridgefields, Tennessee
Tatum, South Carolina
Terrebonne, Quebec
Washington Court House, Ohio
Forms ManufacturingManufacturing::
Cerritos, California
Dallas, Texas
Indianapolis, Indiana
Langhorne, Pennsylvania
Rock Hill, South Carolina
Enterprise Group* – —United StatesStates::
Birmingham, Alabama
Chandler, Arizona
Ft. Smith, Arkansas
Little Rock, Arkansas
Buena Park, California
Cerritos, California
Hayward, California
Riverside, California
Denver, Colorado
Jacksonville, Florida
Lakeland, Florida
Miami, Florida
Duluth, Georgia
Boise, Idaho
Peoria,Addison, Illinois
West Chicago,East Peoria, Illinois
Evansville, Indiana
Ft.Fort Wayne, Indiana
Indianapolis, Indiana
Des Moines, Iowa
Kansas City, Kansas
Lexington, Kentucky
Louisville, Kentucky
Harahan, Louisiana
Shreveport, Louisiana
Boston, Massachusetts
Livonia, Michigan
Wayland, Michigan
Fridley,Wayne, Michigan
Minneapolis, Minnesota
Jackson, Mississippi
St. Louis, Missouri
Omaha, Nebraska
Las Vegas, Nevada
Hoboken, New Jersey
Albuquerque, New Mexico
Buffalo, New York
Syracuse, New York
Charlotte, North Carolina
Cincinnati, Ohio
Cleveland, Ohio
Columbus,Plain City, Ohio
Oklahoma City, Oklahoma
Tulsa, Oklahoma
Langhorne, Pennsylvania
Pittsburgh, Pennsylvania
Rock Hill, South Carolina
Chattanooga, Tennessee
Knoxville, Tennessee
Memphis, Tennessee
Nashville, Tennessee
DFW Airport, Texas
El Paso, Texas
Garland, Texas
Houston, Texas
San Antonio, Texas
Salt Lake City, Utah
Richmond, Virginia
Kent, Washington
Vancouver, Washington
Milwaukee, Wisconsin
Enterprise Group* – Canada—Canada::
Calgary, Alberta
Montreal, Quebec
Toronto, Ontario
Vancouver, British Columbia
Paper MerchantsRegional Replenishment Centers (RRC)—United States:
Charlotte, North Carolina
Chicago, Illinois
Dallas, Texas
Jacksonville, Florida
Langhorne, Pennsylvania
Los Angeles, California
Vancouver, Washington
Head Office:Regional Replenishment Centers (RRC)—Canada:
Covington, Kentucky
RIS Paper – Eastern Region:
Albany, New York
Boston, Massachusetts
Buffalo, New York
Harrisburg, Pennsylvania
Hartford, Connecticut
Lancaster, Pennsylvania
New York, New York
Philadelphia, Pennsylvania
Southport, Connecticut
Washington, DC / Baltimore, Maryland
RIS Paper – MidWest Region:
Cincinnati, Ohio
Cincinnati, Ohio (I.T.)
Cleveland, Ohio
33
Columbus, Ohio
Dayton, Ohio
Dallas/Fort Worth, Texas
Fort Wayne, Indiana
Indianapolis, Indiana
Kalamazoo, Michigan
Buntin Reid – Canada:
London, Ontario
Ottawa, OntarioRichmond, Quebec
Toronto, Ontario
JBR / La Maison du Papier – Canada:
Montreal, Quebec
Quebec City, QuebecWinnipeg, Manitoba
The Paper House – Canada:
Dartmouth, Nova Scotia
Mt. Pearl, Newfoundland
Wood
Big River, Saskatchewan
Ear Falls, Ontario
Grand-Remous, Quebec
Lebel-sur-Quévillon, Quebec
Nairn Centre, Ontario
Malartic, Quebec
Matagami, Quebec
Ste-Marie, Quebec
Sullivan, Quebec
Timmins, Ontario
Val d’Or, Quebec
White River, Ontario
* Enterprise Group is involved in the sale and distribution of Domtar papers, notably continuous forms, cut size business papers as well as digital papers, converting rolls and specialty products.
Pursuant to the Contribution and Distribution Agreement and other agreements entered into or to be entered into in connection with the Transaction, the Company assumes responsibility for certain claims and litigation matters arising out of or relating to the Company’s businesses whether or not asserted prior to the Transaction. Currently, a small number of claims and litigation matters have arisen in the ordinary course of business. Although the final outcome of any legal proceeding is subject to a number of variables and cannot be predicted with any degree of certainty, management currently believes that the ultimate outcome of these legal proceedings will not have a material adverse effect on the Company’s long-term results of operations, cash flow or financial position.
The Company is involved in various legal proceedings relating to contracts, commercial disputes, taxes, environmental issues, labor and employment and other matters related to former and ongoing operations. The Company periodically reviews the status of these proceedings and assesses the likelihood of any adverse judgments or outcomes of these legal proceedings, as well as analyzes probable losses. While the Company believes that the ultimate disposition of these matters will not have a material adverse effect on its financial condition, an adverse outcome in one or more of the following significant legal proceedings could have a material adverse effect on our results or cash flow in a given quarter or year.
In the early part of 2006, Weyerhaeuser closed its pulp and paper mill in Prince Albert, Saskatchewan, which the Company acquired in connection with the Transaction, and which remains closed. Certain unionized parties filed a grievance against Weyerhaeuser following the shut down, alleging that certain post-closure actions taken by Weyerhaeuser violated their collective bargaining agreement. In particular, the union disputed Weyerhaeuser’s post-closure contracting with a third-party vendor to oversee on-site security at the Prince Albert facility. In connection with the Transaction, the Company has assumed any liability with respect to this grievance. In a separate grievance relating to the closure of the Prince Albert facility, which could result in liability in excess of $20 million, the union is disputing the accumulation of pension benefits during the actual layoff period because, according to the union, a majority of employees retained still had recall rights during the layoff. The Company is currently evaluating its positions with respect to these grievances and cannot be certain that it will not incur liability, which could be material, with respect to these grievances.
Domtar Inc. is subject to a motion by Joachim Laferrière Électricien Inc., filed in the Quebec Superior Court on January 9, 2006, for authorization to bring a class action suit against Domtar Inc. and others for alleged damages relating to a conspiracy to fix prices of carbonless sheets during the period of January through December 2000 in the Province of Quebec. The claim seeks estimated compensatory damages in the amount of CDN$50 million (approximately $50 million) plus estimated exemplary damages in the amount of
34
CDN$1 million to CDN$5 million (approximately $1 million to $5 million). Domtar Inc. is also subject to a motion by McLay & Company Inc. filed in Ontario Superior Court on January 11, 2006, for authorization to bring a class action suit against Domtar Inc. and others, for alleged inflated prices of carbonless sheets during the period of October 1999 through September 2000 in the Province of Ontario. These class actions have been settled in principle for an insignificant amount and are subject to Court approval. The amount had been previously provided for in the purchase price allocation related to the acquisition of Domtar Inc.
On June 12, 2007, an action was commenced by George Weston Limited (“Weston”) in the Superior Court of Justice of the Province of Ontario against Domtar Inc. The claim alleges that the consummation of the Transaction triggered an obligation of Domtar Inc. to pay an increase in consideration under the purchase price adjustment contained in the Share Purchase Agreement, dated June 16, 1998 (as amended by Amendment No. 1 thereto, dated July 31, 1998, the “Agreement”) between Weston, Weston Investments Inc., Domtar Inc. and Domtar Industries Inc. pursuant to which Domtar Inc. acquired all of the issued and outstanding shares of E.B. Eddy Limited and E.B. Eddy Paper, Inc., an integrated producer of specialty paper and wood products. The claim seeks a payment of CDN$110 million (approximately $111 million) under the purchase price adjustment provision of the Agreement and additional compensatory damages. On August 13, 2007, Domtar Inc. served its statement of defense in response to this claim. Neither the Company nor Domtar Inc. believes that the consummation of the Transaction triggered an obligation to pay an increase in consideration under the purchase price adjustment and Domtar Inc. intends to defend itself vigorously against any claims with respect thereto. However, Domtar Inc. may not be successful in its defense of such claims, and if it is ultimately required to pay an increase in consideration, such payment may have a material adverse effect on the Company’s and on Domtar Inc.’s liquidity, results of operations and financial condition.
Several asbestos-related personal injury claims have been filed in U.S. state and federal courts against Domtar Industries Inc. and certain other affiliates of the Company in connection with alleged exposure by people to products or premises containing asbestos. While the Company believes that the ultimate disposition of these matters, both individually and on an aggregate basis, will not have a material adverse effect on its financial condition, there can be no assurance that the Company will not incur substantial costs as a result of any such claim.
Environment
Domtar Inc. and the Company is or may be a “potentially responsible party” with respect to various hazardous waste sites that are being addressed pursuant to the Comprehensive Environmental Response, Compensation, and Liability Act of 1980 (“Superfund”) or similar laws. Domtar Inc. continues to take remedial action under its Care and Control Program, as such sites mostly relate to its former wood preserving operating sites, and a number of operating sites due to possible soil, sediment or groundwater contamination. The investigation and remediation process is lengthy and subject to the uncertainties of changes in legal requirements, technological developments and, if and when applicable, the allocation of liability among potentially responsible parties.
An action was commenced by Seaspan Pulp sales office—International Ltd. (“Seaspan”) in the Supreme Court of British Columbia, on March 31, 1999 against Domtar Inc. and others with respect to alleged contamination of Seaspan’s site bordering Burrard Inlet in North Vancouver, British Columbia including contamination of sediments in Burrard Inlet, due to the presence of creosote. As of July 3, 2002, the parties entered into a partial Settlement Agreement (the “Settlement Agreement”) which provides that while the agreement is performed in accordance with its terms, the action commenced by Seaspan will be held in abeyance. The Settlement Agreement focused on the sharing of costs between Seaspan and Domtar Inc. for certain remediation of contamination referred to in the plaintiff’s claim. The Settlement Agreement does not address all of the plaintiff’s claims as that cannot be reasonably determined at this time. Due to the complexity in the implementation of the Settlement, the parties are currently renegotiating the terms and conditions of the Settlement. No party has exercised its right to terminate the Settlement. The Company has recorded a provision for the estimated settlement amount.
35
Domtar Inc. was issued a Request for Response Action (“RFRA”) by the Minnesota Pollution Control Agency (“MPCA”) for the clean-up of tar seeps and soils at a former coal tar distillation plant located in Duluth, Minnesota. On March 27, 1996, the MPCA issued the RFRA to Domtar Inc., Interlake Corp., Allied-Signal, Inc. and Beazer East, Inc. requiring the investigation and potential remediation of a portion of an industrial site located in Duluth, Minnesota, believed to contain contaminated sediments originating from former coke and gas plants and coal tar distillation plants. Domtar Inc. formerly operated one coal tar distillation plant at this site. The total cost of the likely remediation for which Domtar will remain responsible under the RFRA is estimated to be between $3 million and $7 million. Under a final and binding arbitration process, an arbitration panel rendered, with respect to the allocation of responsibility between the potentially responsible parties, a decision on November 8, 2007 which is under review as per the rules of arbitration. A decision is expected in the second quarter of 2008. The Company has a provision of $4 million at December 30, 2007.
At December 30, 2007, the Company had a provision of $119 million for environmental matters and other asset retirement obligations. Additional costs, not known or identifiable, could be incurred for remediation efforts. Based on policies and procedures in place to monitor environmental exposure, management believes that such additional remediation costs would not have a material adverse effect on the Company’s financial position, earnings or cash flows.
While the Company believes that it has determined the cost for environmental matters likely to be incurred based on known information, their ongoing efforts to identify potential environmental concerns that may be associated with their past and present properties will lead to future environmental investigations. These efforts will likely result in the determination of additional environmental costs and liabilities, which cannot be reasonably estimated at this time.
There were no matters submitted to a vote of security holders during the fourth quarter of the fiscal year ended December 30, 2007.
Domtar Corporation’s common stock is traded on the New York Stock Exchange and the Toronto Stock Exchange under the symbol “UFS.” Price ranges of our common stock during 2007 on the New York Stock Exchange and the Toronto Stock Exchange were:
| New York Stock Exchange ($) | Toronto Stock Exchange (CDN$) | |||||||||||
| High | Low | Close | High | Low | Close | |||||||
2007 Quarter | ||||||||||||
First(1) | 9.92 | 8.55 | 9.31 | 11.55 | 10.08 | 10.51 | ||||||
Second | 11.49 | 9.21 | 11.16 | 12.29 | 10.31 | 11.83 | ||||||
Third | 11.52 | 6.67 | 8.20 | 12.23 | 7.23 | 8.18 | ||||||
Fourth | 8.74 | 6.81 | 7.69 | 8.39 | 6.72 | 7.59 | ||||||
Year | 11.52 | 6.67 | 7.69 | 12.23 | 6.72 | 7.59 | ||||||
36
At December 30, 2007, the number of shareholders of record of Domtar Corporation common stock was approximately 2,000 and the number of shareholders of record of Domtar (Canada) Paper Inc. exchangeable shares was approximately 4,600.
During 2007, the Company did not pay dividends on its common stock and did not buy back any of its common stock.
In December 2007, Domtar Inc., a wholly-owned subsidiary of Domtar Corporation, announced the redemption of its Series A and Series B preferred shares. The Series A and Series B preferred shares were redeemed on December 21, 2007 at a price per share of CDN$25.
This graph compares the return on a $100 investment in the Company’s common stock on March 7, 2007 with a $100 investment in an equally-weighted portfolio of a Peer Group(1), a $100 investment in the S&P 500 Index and a $100 investment in the S&P 500 Materials Index.
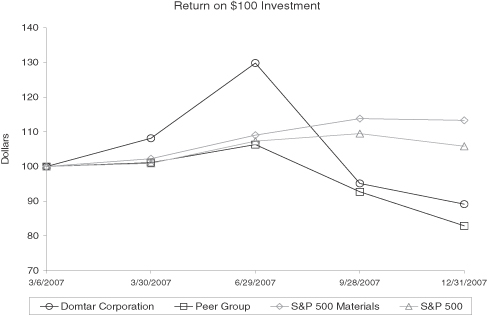
ASSUMPTIONS:
Hong Kong, China
Returns are in local currencies and assume quarterly reinvestment of dividends
Measurement dates are the last trading day of the period as shown
37
The following sets forth selected historical financial data of the Company for the periods and as of the dates indicated. The selected financial data as of December 25, 2005, December 31, 2006 and December 30, 2007 and for the fiscal years ended December 26, 2004, December 25, 2005, December 31, 2006 and December 30, 2007 have been derived from the audited financial statements of Domtar Corporation for 2007, and the Weyerhaeuser Fine Paper Business for 2004, 2005 and 2006. The selected financial data as of December 28, 2003 and December 26, 2004 and for the fiscal year ended December 28, 2003 have been derived from the financial statements for the Weyerhaeuser Fine Paper Business, which have not been audited. The Company’s fiscal year ends on the last Sunday of the calendar year. Fiscal year 2007 consisted of 52 weeks, as did all other fiscal years presented except for fiscal 2006, which consisted of 53 weeks.
The Company acquired Domtar Inc. as of March 7, 2007. Accordingly, the results of operations for Domtar Inc. are reflected in the financial statements only as of and for the period after that date. Prior to March 7, 2007, the financial statements of the Company reflect only the results of operations of the Weyerhaeuser Fine Paper Business. Since the selected historical financial information of the Company as of and for the 52 weeks ended December 30, 2007 excludes the results of Domtar Inc. prior to March 7, 2007, they are not necessarily indicative of results that may be expected in future years. See Item 1A, Risk Factors – “The historical financial information of the Predecessor Company may not be representative of its results if the Weyerhaeuser Fine Paper Business had been operated independently of Weyerhaeuser and, as a result, may not be a reliable indicator of its future results.” The following table should be read in conjunction with Items 7, Management’s Discussion and Analysis of Financial Condition and Results of Operations and 8, Financial Statements and Supplementary Data of this Annual Report on Form 10-K.
| Year ended | |||||||||||||||||||
FIVE YEAR FINANCIAL SUMMARY | December 30, 2007 | December 31, 2006 | December 25, 2005 | December 26, 2004 | December 28, 2003 | ||||||||||||||
| (In millions of U.S. dollars, except per share figures) | |||||||||||||||||||
Statement of Income Data: | |||||||||||||||||||
Sales | $ | 5,947 | $ | 3,306 | $ | 3,267 | $ | 3,026 | $ | 2,854 | |||||||||
Closure and restructuring costs and, impairment of goodwill and property, plant and equipment | 110 | 764 | 538 | 17 | 24 | ||||||||||||||
Depreciation and amortization | 471 | 311 | 357 | 348 | 338 | ||||||||||||||
Operating income (loss) | 270 | (556 | ) | (578 | ) | (41 | ) | (96 | ) | ||||||||||
Net earnings (loss) | 70 | (609 | ) | (478 | ) | (17 | ) | (67 | ) | ||||||||||
Net earnings (loss) per share—basic | $ | 0.15 | $ | (2.14 | ) | $ | (1.68 | ) | $ | (0.06 | ) | $ | (0.24 | ) | |||||
Net earnings (loss) per share—diluted | $ | 0.15 | $ | (2.14 | ) | $ | (1.68 | ) | $ | (0.06 | ) | $ | (0.24 | ) | |||||
Balance Sheet Data: | |||||||||||||||||||
Cash and cash equivalents | $ | 71 | $ | 1 | $ | 1 | $ | 2 | $ | 1 | |||||||||
Net property, plant and equipment | 5,362 | 3,065 | 3,270 | 3,923 | 4,113 | ||||||||||||||
Total assets | 7,748 | 3,998 | 4,970 | 5,565 | 5,649 | ||||||||||||||
Long-term debt | 2,213 | 32 | 24 | 27 | 32 | ||||||||||||||
Total shareholders’ equity | 3,197 | 2,915 | 3,773 | 4,261 | 4,316 | ||||||||||||||
38
Throughout this Management’s Discussion and Analysis of Financial Condition and Results of Operations (“MD&A”), unless otherwise specified, “Domtar Corporation,” “the Company,” “Domtar,” “we,” “us” and “our” refer to Domtar Corporation and its subsidiaries, as well as its investments. Domtar Corporation’s common stock is listed on the New York Stock Exchange and the Toronto Stock Exchange. Except where otherwise indicated, all financial information reflected herein is determined on the basis of accounting principles generally accepted in the United States (“GAAP”). This MD&A should be read in conjunction with Domtar Corporation’s audited consolidated financial statements and notes thereto included in Item 8, Financial Statements and Supplementary Data of this Annual Report on Form 10-K.
In accordance with industry practice, in this report, the term “ton” or the symbol “ST” refers to a short ton, an imperial unit of measurement equal to 0.9072 metric tons. The term “tonne” or the symbol “ADMT” refers to an air dry metric ton and the term “MFBM” refers to million foot board measure. In this report, unless otherwise indicated, all dollar amounts are expressed in U.S. dollars, and the term “dollars” and the symbol “$” refer to U.S. dollars. In the following discussion, unless otherwise noted, references to increases or decreases in income and expense items, prices, contribution to net earnings (loss), and shipment volume are based on the fifty-two week periods ended December 30, 2007 and December 25, 2005, as compared to the fifty-three week period ended December 31, 2006. The fifty-two week periods are also referred to as 2007 and 2005, and the fifty-three week period is referred to as 2006.
Domtar Corporation was incorporated on August 16, 2006 for the sole purpose of holding the Weyerhaeuser Fine Paper Business and consummating the combination of the Weyerhaeuser Fine Paper Business with Domtar Inc. (the “Transaction”). The Weyerhaeuser Fine Paper Business was owned by Weyerhaeuser Company (“Weyerhaeuser”) prior to the completion of the Transaction. The Transaction was consummated on March 7, 2007. Domtar Corporation had no operations prior to March 7, 2007 when, upon the completion of the Transaction, it became an independent public holding company that, directly or indirectly through its subsidiaries, owns the Weyerhaeuser Fine Paper Business and Domtar Inc. We refer to Domtar Corporation, as of the consummation of the Transaction, as the “Successor.”
Although Weyerhaeuser does not have a continuing proprietary interest in Domtar Corporation, we have entered into several agreements with Weyerhaeuser and/or some of its subsidiaries in connection with the Transaction, including a tax sharing agreement, an intellectual property licensing agreement, a transition services agreement, fiber and pulp supply agreements and site services agreements. These agreements enable us to continue to operate the Weyerhaeuser Fine Paper Business efficiently following the completion of the Transaction.
The following MD&A of Domtar Corporation covers certain periods prior to the Transaction. For accounting and financial reporting purposes, the Weyerhaeuser Fine Paper Business is considered to be the “Predecessor” to Domtar Corporation and as a result, its historical financial statements now constitute the historical financial statements of Domtar Corporation. Accordingly, the results reported for 2006 and for 2005 include only the results of operations of the Weyerhaeuser Fine Paper Business, on a carve-out basis. The results reported for the fourth quarter of 2007 include results of the Successor for the entire period and those reported for 2007 include the results of operations of the Weyerhaeuser Fine Paper Business, on a carve-out basis, for the period from January 1, 2007 to March 6, 2007 and the results of operations of the Successor for the period from March 7, 2007 to December 30, 2007, which represents forty-three weeks of operations. These historical financial statements may not be indicative of our future performance, see Part I, Item 1A, Risk Factors, “The historical financial information of the Predecessor may not be representative of its results if the Weyerhaeuser Fine Paper Business had been operated independently of Weyerhaeuser and, as a result, may not be a reliable indicator of its future results.”
39
For more information on the Transaction, refer to Note 1 of the consolidated financial statements, included in Item 8, Financial Statements, in this Annual Report on Form 10-K.
In 2007, we reported operating income of $270 million, an increase of $826 million compared to an operating loss of $556 million in 2006 mainly due to a goodwill impairment charge recorded in the first quarter of 2006 and in part due to the acquisition of Domtar Inc. Excluding operating income of $168 million attributable to Domtar Inc., the operating income in 2007 amounted to $102 million, an increase in operating income of $658 million compared to 2006. The increase was mostly attributable to a $749 million goodwill impairment charge recorded in the first quarter of 2006 based on an evaluation of goodwill relating to the Papers segment, higher average selling prices for pulp and paper, higher shipments for pulp and lower costs for freight and for maintenance. These factors were partially offset by an aggregate $96 million charge for the impairment of goodwill and property, plant and equipment recorded in the fourth quarter of 2007 associated with the reorganization of our Dryden paper mill and the goodwill impairment of our Wood business, the non-recurring benefit of the $65 million duties refund recorded in the fourth quarter of 2006, as well as lower shipments for paper and wood, partially resulting from the additional week of operations in 2006. Additional factors include lower average selling prices for wood products, higher costs for fiber and chemicals, the negative impact of a stronger Canadian dollar, severance costs related to the reorganization of our Dryden paper mill and a $9 million increase in environmental provisions recorded in 2007.
For 2008, inflation pressures on energy-related costs, including those related to fiber and chemicals, are expected to remain while costs related to integration are expected to decrease in the second half of the year. Average paper price realizations are expected to increase after giving effect to price increases implemented toward the end of 2007 and additional pricing initiatives announced for 2008. Paper volumes are expected to stay relatively steady when compared to 2007. While there are indications that growth in the U.S. economy may continue to slow in the next months, this has not yet impacted Domtar’s Papers business.
While all of our businesses are affected by changes in economic conditions in North America, there are a number of business-specific factors affecting Domtar Corporation’s operating results. Sales in our Papers business and Paper Merchants business are affected by the overall demand for printing and writing papers in North America. Our operating results are affected primarily by sales volumes, selling prices, currency fluctuations and raw materials costs. Factors affecting volumes and prices include per capita usage of uncoated freesheet papers, changes in white-collar employment, cycles in marketing and advertising activities, ongoing substitution of electronic media, inventory fluctuations at the end-users and imports of uncoated freesheet papers in North America. Currency fluctuations affect mainly the operating results of our Canadian operations exporting to the U.S. market. Raw materials costs are affected by the direct and indirect impact of energy prices including fossil fuels, supply constraints and the changes in economic conditions.
Sales in our Wood business are affected by demand for framing lumber and overall economic conditions. Our operating results are affected primarily by sales volumes, selling prices, currency fluctuations and fiber costs. Factors affecting volumes and prices include changes in housing starts, unsold inventories of homes, fluctuations in interest rates and changes in the unemployment rate. Currency fluctuations impact the Canadian-dollar denominated cost structure of all of our sawmilling operations affecting the operating results. Fiber costs on public lands are affected by energy prices, changes in harvesting volumes and regulations in place.
During 2007, we completed a significant transaction creating a new leader in our industry, conducted a review of our operations resulting in the streamlining of our portfolio of assets and, as a result of our synergy
40
efforts, identified and launched multiple projects aimed at reducing costs and improving efficiency. We completed a bond exchange and tender offers, for debentures and preferred shares, for the purpose of simplifying our capital structure, achieved and surpassed our first-year synergy target and strengthened our balance sheet.
Potential Redevelopment of Prince Albert Facility
On November 30, 2007, we were informed that the Government of Saskatchewan was not prepared to participate in the financing and redevelopment of the Prince Albert facility into a Northern Bleached Softwood Kraft (“NBSK”) pulp mill producing 100% Forest Stewardship Council (“FSC”) certified softwood pulp for the North American and offshore markets, as set forth in the memorandum of understanding signed on September 12, 2007. As such, the Company has not determined whether this previously idled facility will be reopened, sold or closed.
Debt restructuring
During November 2007, certain of Domtar Inc.’s bondholders elected to exchange their Domtar Inc. bonds for Domtar Corporation bonds with the same maturity and interest rate pursuant to an exchange offer. The amounts exchanged were 99.96% of the outstanding principal amount of 7.875% Notes, 99.55% of the outstanding principal amount of 5.375% Notes, 99.93% of the outstanding principal amount of 7.125 % Notes, and 99.30% of the outstanding principal amount of 9.5% Notes. During December 2007, 97.32% of the outstanding principal amount of the 10% Debentures and 99.33% of the outstanding principal amount of the 10.85% Debentures were purchased and cancelled by Domtar Inc. pursuant to a tender offer.
Restructuring
We regularly review our overall production capacity with the objective of adjusting our production capacity with anticipated long-term demand. In December 2007, we announced the reorganization of our Dryden facility as well as the closure of our Port Edwards mill, effective in the first and second quarters of 2008, respectively. These measures will result in the curtailment of approximately 336,000 tons of paper capacity per year and will affect approximately 625 employees.
In July 2007, we announced the closure of two paper machines, one located at our Woodland paper mill and another at our Port Edwards paper mill, as well as the closure of our paper mill in Gatineau and our converting center in Ottawa, effective October 2007. In total, these closures resulted in the curtailment of approximately 284,000 tons of paper capacity per year and affected approximately 430 employees. We continue to evaluate potential adjustments to our production capacity, which may include additional closures of machines or entire mills, and we could recognize cash and/or non-cash charges relating to any such closures in future periods.
In 2005, we announced the indefinite closure of our Big River and 51% owned Wapawekka, Saskatchewan sawmills (effective in the first quarter of 2006) and the indefinite closure of our Prince Albert pulp and paper mill and one paper machine at our Dryden pulp and paper mill (effective in the second quarter of 2006).
Agreement for the Sale of Wood Business
On January 7, 2008, Domtar announced that Domtar Inc. and Conifex Inc. have terminated the agreement announced June 22, 2007, relating to the sale of Domtar Inc.’s Wood business. Conifex Inc. was to acquire sawmills and other forest operations situated in Ontario and Quebec. Both parties recognized that the closing conditions had not been met pursuant to the terms of the agreement.
Domtar intends to continue to seek opportunities to maximize the value of these assets as well as pursue initiatives to improve their operational efficiency.
41
Kamloops Fiber Supply
We entered into a number of fiber supply agreements with Weyerhaeuser pursuant to which Weyerhaeuser had agreed to supply our Kamloops pulp mill with fiber. In February 2008, Weyerhaeuser announced the closure effective May 12, 2008 of its sawmill in Kamloops. The mill is a source of fiber for our Kamloops pulp mill. This closure will not have a significant impact on our Kamloops pulp mill operations because under the terms of the supply agreements, Weyerhaeuser will still be responsible for supplying our mill with the agreed upon amount of fiber.
ACCOUNTING FOR THE TRANSACTION
The Transaction was considered, for accounting purposes, as the acquisition of Domtar Inc. by Domtar Corporation and has been accounted for using the purchase method of accounting. Accordingly, the purchase price is based upon the estimated fair value of Domtar Corporation common stock issued in addition to acquisition costs directly related to the Transaction. Since no quoted market price existed for the shares of Domtar Corporation’s common stock, the purchase price is based on the fair value of the net assets acquired on August 23, 2006, the date on which the terms of the Transaction were agreed to and announced. The fair value of Domtar Inc. common shares of $6.63 per share used in the calculation of the purchase price is based upon the average closing price of Domtar Inc. common shares on the Toronto Stock Exchange for the five trading days beginning August 21, 2006 and ending August 25, 2006, converted at the average daily foreign exchange rate of the Bank of Canada. The number of outstanding Domtar Inc. common shares used in the calculation of the fair value is based on the same periods.
The total purchase price is allocated to tangible and intangible assets acquired and liabilities assumed based on our estimates of their fair value, which are based on information currently available. During the fourth quarter of 2007, we have completed the valuation of all assets and liabilities. In the process of completing such valuation, we have revised the amounts allocated to certain assets and liabilities from those previously reported in the third quarter of 2007. The principal significant elements for which such amounts have been modified include property, plant and equipment, intangible assets, income tax balances and goodwill.
42
The following table summarizes the components of the total purchase price and the purchase price allocation.
| (In millions of U.S. dollars, unless otherwise noted) | |||
231,436,850 common shares of Domtar Inc. outstanding at an average closing price of $6.63 per share | $ | 1,534 | |
Direct acquisition costs | 28 | ||
Estimated total purchase price, net of assumed debt | $ | 1,562 | |
The total purchase price of the transaction has been allocated as follows: | |||
Fair value of net assets acquired at the date of acquisition | |||
Cash and cash equivalents | $ | 573 | |
Receivables | 166 | ||
Inventories | 448 | ||
Prepaid expenses | 12 | ||
Income and other taxes receivable | 10 | ||
Deferred income taxes—current | 63 | ||
Property, plant and equipment | 2,469 | ||
Intangible assets | 98 | ||
Deferred income taxes—non current | 34 | ||
Goodwill | 300 | ||
Other assets | 39 | ||
Total assets | $ | 4,212 | |
Less: Liabilities | |||
Bank indebtedness | $ | 67 | |
Trade and other payables | 410 | ||
Income and other taxes payable | 15 | ||
Long-term debt due within one year | 1 | ||
Long-term debt | 1,660 | ||
Deferred income tax liability—non-current | 141 | ||
Other liabilities and deferred credits | 328 | ||
Minority interests | 28 | ||
Total liabilities | 2,650 | ||
Fair value of net assets acquired at the date of acquisition | $ | 1,562 | |
Domtar Corporation’s reporting segments correspond to the following business activities: Papers, Paper Merchants and Wood. A description of our business is included in Part I, Item 1, Business of this Annual Report on Form 10-K.
Papers
We are the largest integrated manufacturer and marketer of uncoated freesheet paper in North America and the second largest in the world based on production capacity. In uncoated freesheet, we have 12 pulp and paper mills in operation (nine in the United States and three in Canada) with an annual paper production capacity of approximately 4.6 million tons of uncoated freesheet paper, after giving effect to the announced closure of our Port Edwards facility and the restructuring of our Dryden facility. In addition, we have an annual production capacity of 238,000 tons of coated groundwood at our Columbus paper mill. Our paper manufacturing operations are supported by 17 converting and distribution operations including a network of 11 plants located offsite of our paper making operations. Also, we have forms manufacturing operations at two of the offsite converting and distribution operations and three stand-alone forms manufacturing operations.
43
We design, manufacture, market and distribute a wide range of fine paper products for a variety of consumers, including merchants, retail outlets, stationers, printers, publishers, converters and end-users. Approximately 81% of our paper production capacity is domestic and the remaining 19% is located in Canada. We also manufacture and sell pulp in excess of our internal requirements and we purchase papergrade pulp from third parties allowing us to optimize the logistics of our pulp capacity while reducing transportation costs. We have the capacity to sell to third parties approximately 1.5 million metric tonnes of pulp per year depending on market conditions. Approximately 45% of our trade pulp production capacity is domestic and the remaining 55% is located in Canada. We shipped approximately 1.3 million metric tonnes of pulp in excess of our internal requirements in 2007.
Paper Merchants
Head Office:
Covington, Kentucky
RIS Paper—Eastern Region:
Albany, New York
Boston, Massachusetts
Harrisburg, Pennsylvania
Hartford, Connecticut
Lancaster, Pennsylvania
New York, New York
Philadelphia, Pennsylvania
Southport, Connecticut
Washington, DC / Baltimore, Maryland
RIS Paper—MidWest Region:
Buffalo, New York
Covington, Kentucky
Cincinnati, Ohio
Cincinnati, Ohio (I.T.)
Cleveland, Ohio
Columbus, Ohio
Uniontown, Ohio
Dayton, Ohio
Dallas/Fort Worth, Texas
Fort Wayne, Indiana
Indianapolis, Indiana
Buntin Reid—Canada:
London, Ontario
Ottawa, Ontario
Toronto, Ontario
JBR / La Maison du Papier—Canada:
Montreal, Quebec
Quebec City, Quebec
The Paper House—Canada:
Halifax, Nova Scotia
Mount Pearl, Newfoundland
Wood
Ear Falls, Ontario
Gogama, Ontario
Nairn Centre, Ontario
Matagami, Quebec
Ste-Marie, Quebec
Sullivan, Quebec
Timmins, Ontario
Val d’Or, Quebec
* Enterprise Group is involved in the sale and distribution of Domtar papers, notably continuous forms, cut size business papers as well as digital papers, converting rolls and specialty products.
30
| ITEM 3. | LEGAL PROCEEDINGS |
Currently, a small number of claims and litigation matters have arisen in the ordinary course of business. Although the final outcome of any legal proceeding is subject to a number of variables and cannot be predicted with any degree of certainty, management currently believes that the ultimate outcome of these legal proceedings will not have a material adverse effect on the Company’s long-term results of operations, cash flow or financial position.
In the normal course of operations, the Company becomes involved in various legal actions mostly related to contract disputes, patent infringements, environmental and product warranty claims, and labor issues. The Company periodically reviews the status of these proceedings and assesses the likelihood of any adverse judgments or outcomes of these legal proceedings, as well as analyzes probable losses. While the Company believes that the ultimate disposition of these matters will not have a material adverse effect on its financial condition, an adverse outcome in one or more of the following significant legal proceedings could have a material adverse effect on our results or cash flow in a given quarter or year.
Prince Albert facility
The pulp and paper mill in Prince Albert was closed in the first quarter of 2009 and has not been operated since. In December 2009, the Company decided to dismantle the Prince Albert facility. In a grievance relating to the closure of the Prince Albert facility, the union is claiming that it is entitled to the accumulated pension benefits during the actual layoff period because, according to the union, a majority of employees still had recall rights during the layoff. The Company cannot be certain that it will not incur a liability, which could be in excess of $20 million. Arbitration in this matter was held on February 16 to 18, 2010, and the parties are awaiting the arbitrator’s decision.
Acquisition of E.B. Eddy Limited and E.B. Eddy Paper, Inc.
In July 1998, Domtar Inc. acquired all of the issued and outstanding shares of E.B. Eddy Limited and E.B. Eddy Paper, Inc. (E.B. Eddy), an integrated producer of specialty paper and wood products. The purchase agreement relating to this acquisition includes a purchase price adjustment whereby, in the event of the acquisition by a third party of more than 50% of the shares of Domtar Inc. in specified circumstances, Domtar Inc. may be required to pay an increase in consideration of up to a maximum of $115 million (CDN$120 million), an amount gradually declining over a 25-year period. At March 7, 2007, the closing date of the combination of the Weyerhaeuser Fine Paper Business with Domtar Inc., the maximum amount of the purchase price adjustment was approximately $105 million (CDN$110 million). No provision was recorded for this potential purchase price adjustment.
On March 14, 2007, the Company received a letter from George Weston Limited (the previous owner of E.B. Eddy and a party to the purchase agreement) demanding payment of $105 million (CDN$110 million) as a result of the consummation of the March 2007 combination of the Weyerhaeuser Fine Paper Business with Domtar Inc. On June 12, 2007, an action was commenced by George Weston Limited against Domtar Inc. in the Superior Court of Justice of the Province of Ontario, Canada, claiming that the consummation of the March 2007 combination of the Weyerhaeuser Fine Paper Business with Domtar Inc., triggered the purchase price adjustment and sought a purchase price adjustment of $105 million (CDN$110 million) as well as additional compensatory damages. The Company does not believe that the consummation of the March 2007 combination of the Weyerhaeuser Fine Paper Business with Domtar Inc. triggers an obligation to pay an increase in consideration under the purchase price adjustment and intends to defend itself vigorously against any claims with respect thereto. However, the Company may not be successful in the defense of such claims, and if the Company is ultimately required to pay an increase in consideration, such payment may have a material adverse effect on the Company’s financial position, results of operations or cash flows.
31
Asbestos claims
Various asbestos-related personal injury claims have been filed in U.S. state and federal courts against Domtar Industries Inc. and certain other affiliates of the Company in connection with alleged exposure by people to products or premises containing asbestos. While the Company believes that the ultimate disposition of these matters, both individually and on an aggregate basis, will not have a material adverse effect on its financial condition, there can be no assurance that the Company will not incur substantial costs as a result of any such claim.
Environment
The Company is subject to environmental laws and regulations enacted by federal, provincial, state and local authorities.
Domtar Inc. and the Company is or may be a “potentially responsible party” with respect to various hazardous waste sites that are being addressed pursuant to the Comprehensive Environmental Response, Compensation, and Liability Act of 1980 (“Superfund”) or similar laws. Domtar Inc. continues to take remedial action under its Care and Control Program, as such sites mostly relate to its former wood preserving operating sites, and a number of operating sites due to possible soil, sediment or groundwater contamination. The investigation and remediation process is lengthy and subject to the uncertainties of changes in legal requirements, technological developments and, if and when applicable, the allocation of liability among potentially responsible parties.
The pulp and paper mill in Prince Albert was closed in the first quarter of 2006 and has not been operated since. In December 2009, the Company decided to dismantle the Prince Albert facility. The Province of Saskatchewan may require active decommissioning and reclamation at the facility. In the event decommissioning and reclamation is required at the facility, the work is likely to include investigation and remedial action for areas of significant environmental impacts. The Company has a reserve for the estimated required environmental remediation at the site.
An action was commenced by Seaspan International Ltd. (“Seaspan”) in the Supreme Court of British Columbia, on March 31, 1999 against Domtar Inc. and others with respect to alleged contamination of Seaspan’s site bordering Burrard Inlet in North Vancouver, British Columbia, including contamination of sediments in Burrard Inlet, due to the presence of creosote. As of July 3, 2002, the parties entered into a partial Settlement Agreement (the “Settlement Agreement”) which provided that, while the agreement is performed in accordance with its terms, the action commenced by Seaspan will be held in abeyance. The Settlement Agreement focused on the sharing of costs between Seaspan and Domtar Inc. for certain remediation of contamination referred to in the plaintiff’s claim. The Settlement Agreement did not address all of the plaintiff’s claims and such claims cannot be reasonably determined at this time. On June 3, 2008, Domtar was notified by Seaspan that it terminated the Settlement Agreement. The government of British Columbia issued on February 16, 2010 a Remediation Order to Seaspan and Domtar Inc. in order to define and implement an action plan to address soil, sediment and groundwater issues. This Order may be appealed within 30 days from the date of this Order but there is no suspension in the executions of this Order unless the Appeal Board orders otherwise. The Company is currently reviewing its options in this respect. The Company has recorded an environmental reserve to address estimated exposure.
At December 31, 2009, the Company had a provision of $111 million for environmental matters and other asset retirement obligations ($99 million in 2008). Additional costs, not known or identifiable, could be incurred for remediation efforts. Based on policies and procedures in place to monitor environmental exposure, management believes that such additional remediation costs would not have a material adverse effect on the Company’s financial position, results of operations or cash flows.
32
Climate change regulation
Since 1997, when an international conference on global warming concluded an agreement known as the Kyoto Protocol, which called for reductions of certain emissions that may contribute to increases in atmospheric greenhouse gas (“GHG”) concentrations, various international, national and local laws have been proposed or implemented focusing on reducing GHG emissions. These actual or proposed laws do or may apply in the countries where the Company currently has, or may have in the future, manufacturing facilities or investments.
In the United States, the U.S. Congress is considering legislation to reduce emissions of GHGs. In June 2009, the U.S. House of Representatives passed The American Clean Energy and Security Act of 2009, a cap-and-trade bill designed to reduce GHG emissions. In September 2009 the Clean Energy Jobs and American Power Act was introduced in the U.S. Senate. In December 2009, the Carbon Limits and Energy for America’s Recovery (CLEAR) Act was also introduced in the U.S. Senate. In addition, several states are already requiring the reduction of GHG emissions by certain companies and public utilities, primarily through the planned development of GHG emission inventories and/or state GHG cap-and-trade programs. In addition, the U.S. Environmental Protection Agency (“EPA”) is beginning to regulate GHG emissions. The U.S. Supreme Court ruled in April 2007 inMassachusetts et al. v. EPA, that GHGs fall under the federal Clean Air Act’s definition of “air pollutant.” In December 2009, the EPA issued its “endangerment findings” which found that GHGs endanger public health and welfare. The finding itself does not impose any requirement on our industry but is a pre-requisite for EPA to regulate GHG emissions. Passage of climate control legislation or other regulatory initiatives by Congress or various U.S. States, or the adoption of regulations by the EPA or analogous state agencies that restrict emissions of GHGs in areas in which the Company conducts business may have a material effect on our operations. The Company expects not to be disproportionately affected by these measures compared with other pulp and paper operations in the United States. There are presently no federal or provincial legislative or regulatory obligations to reduce GHG for our pulp and paper operations in Canada.
While it is likely that there will be increased regulation relating to GHG and climate change, at this stage it is not possible to estimate either a timetable for the promulgation or implementation of any new regulations or the Company’s cost of compliance to said regulations.
| ITEM 4. | SUBMISSION OF MATTERS TO A VOTE OF SECURITY HOLDERS |
There were no matters submitted to a vote of security holders during the fourth quarter of the fiscal year ended December 31, 2009.
33
PART II
| ITEM 5. | MARKET FOR REGISTRANT’S COMMON EQUITY, RELATED STOCKHOLDER MATTERS AND ISSUER PURCHASES OF EQUITY SECURITIES |
Domtar Corporation’s common stock is traded on the New York Stock Exchange and the Toronto Stock Exchange under the symbol “UFS.” The following table sets forth the price ranges of our common stock during 2009 and 2008 on the New York Stock Exchange and the Toronto Stock Exchange. Effective June 10, 2009 at 6:01 p.m. (ET), the Company effected a reverse stock split of Domtar’s outstanding shares, at a split ratio of 1-for-12. Shareholder approval for the reverse stock split was obtained at the Annual General Meeting held on May 29, 2009. Price ranges for both 2008 and 2009 were adjusted to reflect the reverse stock split.
| New York Stock Exchange ($) | Toronto Stock Exchange (CDN$) | |||||||||||
| High | Low | Close | High | Low | Close | |||||||
2009 Quarter | ||||||||||||
First | 25.56 | 6.12 | 11.40 | 30.84 | 7.80 | 14.16 | ||||||
Second | 23.28 | 10.56 | 16.58 | 27.72 | 13.20 | 19.30 | ||||||
Third | 42.00 | 13.91 | 35.22 | 44.93 | 15.60 | 37.86 | ||||||
Fourth | 59.10 | 35.41 | 55.41 | 62.07 | 38.29 | 58.21 | ||||||
Year | 59.10 | 6.12 | 55.41 | 62.07 | 7.80 | 58.21 | ||||||
2008 Quarter | ||||||||||||
First | 98.76 | 71.28 | 81.96 | 99.84 | 71.76 | 84.36 | ||||||
Second | 89.40 | 60.24 | 65.40 | 91.08 | 60.96 | 66.24 | ||||||
Third | 78.36 | 52.08 | 55.20 | 83.28 | 52.08 | 59.88 | ||||||
Fourth | 57.24 | 12.12 | 20.04 | 60.60 | 15.60 | 24.84 | ||||||
Year | 98.76 | 12.12 | 20.04 | 99.84 | 15.60 | 24.84 | ||||||
At December 31, 2009, the number of shareholders of record (registered and non-registered) of Domtar Corporation common stock was approximately 10,047 and the number of shareholders of record (registered and non-registered) of Domtar (Canada) Paper Inc. exchangeable shares was approximately 11,734.
During 2009, the Company did not pay dividends and did not buy back any of its common stock.
34
This graph compares the return on a $100 investment in the Company’s common stock on March 7, 2007 with a $100 investment in an equally-weighted portfolio of a peer group(1), a $100 investment in the S&P 500 Index and a $100 investment in the S&P 500 Materials Index. This graph assumes that returns are in local currencies and assumes quarterly reinvestment of dividends. The measurement dates are the last trading day of the period as shown.

| (1) | On May 18, 2007, the Human Resources Committee of the Board of Directors established performance measures as part of the Performance Conditioned Restricted Stock Unit (“PCRSUs”) Agreement including the achievement of a total shareholder return compared to a peer group. In 2008, modifications were made to the peer group to include fine paper producers Boise Inc. and M-real Corp., as well as the new entity of AbitibiBowater Inc. Other companies in the peer group are Glatfelter, International Paper, MeadWestvaco, Packaging Corp. of America, Sappi, Smurfit-Stone, Stora Enso, UPM-Kymmene and Wausau Paper. |
AbitibiBowater Inc. and Smurfit-Stone are traded on the Pink OTC Markets effective April 16, 2009 and February 4, 2009, respectively.
35
| ITEM 6. | SELECTED FINANCIAL DATA |
The following sets forth selected historical financial data of the Company for the periods and as of the dates indicated. The selected financial data as of December 25, 2005, December 31, 2006, December 30, 2007, December 31, 2008 and December 31, 2009 and for the fiscal years ended December 25, 2005, December 31, 2006, December 30, 2007, December 31, 2008 and December 31, 2009 have been derived from the audited financial statements of Domtar Corporation for 2009, 2008 and 2007, and the Weyerhaeuser Fine Paper Business for 2006 and 2005. The fiscal years of 2005, 2006 and 2007 ended on the last Sunday of the calendar year. Starting in 2008, the fiscal year was based on the calendar year and ends December 31. Fiscal year 2009 and 2008 consisted of 52 weeks and one day and 52 weeks and three days, respectively, and all other fiscal years presented consisted of 52 weeks, except for fiscal 2006, which consisted of 53 weeks. The additional one day in 2009 and three days in 2008 had no significant impact on our results of operations when compared to other fiscal years presented.
The Company acquired Domtar Inc. as of March 7, 2007. Accordingly, the results of operations for Domtar Inc. are reflected in the financial statements only as of and for the period after that date. Prior to March 7, 2007, the financial statements of the Company reflect only the results of operations of the Weyerhaeuser Fine Paper Business. The following table should be read in conjunction with Items 7, Management’s Discussion and Analysis of Financial Condition and Results of Operations and Item 8, Financial Statements and Supplementary Data of this Annual Report on Form 10-K.
| Year ended | ||||||||||||||||||
FIVE YEAR FINANCIAL SUMMARY | December 31, 2009 | December 31, 2008 | December 30, 2007 | December 31, 2006 | December 25, 2005 | |||||||||||||
| (In millions of dollars, except per share figures) | ||||||||||||||||||
Statement of Income Data: | ||||||||||||||||||
Sales | $ | 5,465 | $ | 6,394 | $ | 5,947 | $ | 3,306 | $ | 3,267 | ||||||||
Closure and restructuring costs and, impairment and write-down of goodwill, property, plant and equipment and intangible assets | 125 | 751 | 110 | 764 | 538 | |||||||||||||
Depreciation and amortization | 405 | 463 | 471 | 311 | 357 | |||||||||||||
Operating income (loss) | 615 | (437 | ) | 270 | (556 | ) | (578 | ) | ||||||||||
Net earnings (loss) | 310 | (573 | ) | 70 | (609 | ) | (478 | ) | ||||||||||
Net earnings (loss) per share—basic | $ | 7.21 | ($ | 13.33 | ) | $ | 1.77 | ($ | 25.70 | ) | ($ | 20.17 | ) | |||||
Net earnings (loss) per share—diluted | $ | 7.18 | ($ | 13.33 | ) | $ | 1.76 | ($ | 25.70 | ) | ($ | 20.17 | ) | |||||
Balance Sheet Data: | ||||||||||||||||||
Cash and cash equivalents | $ | 324 | $ | 16 | $ | 71 | $ | 1 | $ | 1 | ||||||||
Net property, plant and equipment | 4,129 | 4,301 | 5,362 | 3,065 | 3,270 | |||||||||||||
Total assets | 6,519 | 6,104 | 7,726 | 3,998 | 4,970 | |||||||||||||
Long-term debt | 1,701 | 2,110 | 2,213 | 32 | 24 | |||||||||||||
Total shareholders’ equity | 2,662 | 2,143 | 3,197 | 2,915 | 3,773 | |||||||||||||
36
| ITEM 7. | MANAGEMENT’S DISCUSSION AND ANALYSIS OF FINANCIAL CONDITION AND RESULTS OF OPERATIONS |
This Management’s Discussion and Analysis of Financial Condition and Results of Operations (“MD&A”) should be read in conjunction with Domtar Corporation’s audited consolidated financial statements and notes thereto included in Item 8, Financial Statements and Supplementary Data of this Annual Report on Form 10-K. Throughout this MD&A, unless otherwise specified, “Domtar Corporation,” “the Company,” “Domtar,” “we,” “us” and “our” refer to Domtar Corporation and its subsidiaries, as well as its investments. Domtar Corporation’s common stock is listed on the New York Stock Exchange and the Toronto Stock Exchange. Except where otherwise indicated, all financial information reflected herein is determined on the basis of accounting principles generally accepted in the United States (“GAAP”).
In accordance with industry practice, in this report, the term “ton” or the symbol “ST” refers to a short ton, an imperial unit of measurement equal to 0.9072 metric tons. The term “metric ton” or the symbol “ADMT” refers to an air dry metric ton and the term “MFBM” refers to million foot board measure. In this report, unless otherwise indicated, all dollar amounts are expressed in U.S. dollars, and the term “dollars” and the symbol “$” refer to U.S. dollars. In the following discussion, unless otherwise noted, references to increases or decreases in income and expense items, prices, contribution to net earnings (loss), and shipment volume are based on the fifty-two week periods ended December 31, 2009, December 31, 2008 and December 30, 2007. The fifty-two week periods are also referred to as 2009, 2008 and 2007. Starting in 2008, the fiscal year is based on the calendar year and ends December 31.
In 2009, we reported operating income of $615 million, an increase of $1,052 million compared to operating loss of $437 million in 2008. The increase was primarily attributable to the $498 million in alternative fuel tax credits recorded in 2009, partially offset by an aggregate $62 million charge in 2009 attributable to the impairment and write-down of property, plant and equipment compared to an aggregate $708 million charge for the impairment and write-down of goodwill, property, plant and equipment and intangible assets recorded in 2008. Our 2009 results were negatively impacted by the decrease in our paper business, which experienced a 15% decrease in shipments in 2009 compared to 2008. Our strategy of maintaining our production levels in line with our customer demand has resulted in taking lack-of-order downtime and machine slowdowns of 467,000 tons of paper and 261,000 metric tons of pulp in 2009 compared to 234,000 tons of paper and 100,000 metric tons of pulp in 2008. In 2009, we had lower average selling prices on all our products, as well as lower shipments of our wood products and higher closure and restructuring costs. These factors were partially offset by lower freight costs, lower costs related to maintenance, the favorable impact of a weaker Canadian dollar (net of our hedging program), the realization of savings stemming from restructuring activities as well as lower costs related to synergies and integration. The cost of raw materials including wood fiber, energy and chemicals was lower for our Papers segment in 2009 when compared to 2008, and we saw an improvement in our pulp shipments, which experienced a 12% volume increase compared to 2008. Other items impacting comparability of 2009 and 2008 results include the 2009 gains on sale of property, plant and equipment of $7 million compared to 2008 during which we recorded a reversal of a provision for $23 million due to the early termination by the counterparty of an unfavorable contract and a gain of $6 million related to the sale of certain trademarks.
These and other factors that affected the year-over-year comparison of financial results are discussed in the year-over-year and segment analysis.
We expect that increased economic activity will partially offset the secular decline in paper demand in 2010 and that pulp demand will remain strong in the short-term. We should also benefit from the recently announced price increases in the upcoming quarters. The economic recovery has been slow and patchy and we will continue to manage our business conservatively. Due to the seasonality of the business and the impact of the price increases being implemented, we expect to make working capital investments in the first quarter of 2010.
37
Restructuring activities
We regularly review our overall production capacity with the objective of aligning our production capacity with anticipated long-term demand. The decline in demand for paper in 2009 accelerated beyond our original expectations as a result of the sharp decline in economic activity earlier in 2009. Accordingly, in 2009 we continued to repurpose facilities.
In February 2009, we announced the permanent shut down of a paper machine at our Plymouth pulp and paper mill, effective at the end of February 2009. This measure resulted in the permanent curtailment of approximately 293,000 tons of paper production capacity per year and affected approximately 185 employees. In October 2009, we announced that we will convert our Plymouth pulp and paper mill to 100% fluff pulp production. This conversion will require approximately $74 million of investment. Our annual fluff pulp making capacity will increase to 444,000 metric tons. The mill conversion, which is expected to be completed in the fourth quarter of 2010, will also result in the permanent shut down of Plymouth’s remaining paper machine with a annual production capacity of 199,000 tons. The mill conversion will help preserve approximately 360 positions. In connection with this announcement, we recognized $13 million of accelerated depreciation in the fourth quarter of 2009, and we expect to record a further $39 million of accelerated depreciation over the first nine months of 2010 in relation to the assets that will cease productive use in October 2010. The assets of this facility have been tested for impairment, and no additional impairment charge was required.
In April 2009, we announced that we would idle our Dryden pulp facility for approximately ten weeks, effective April 25, 2009. This decision was taken in response to continued weak global demand at that time for pulp and the need to manage inventory levels. In addition, we also idled our Ear Falls sawmill for approximately seven weeks, effective April 10, 2009, as this sawmill is a supplier of chips to our Dryden pulp mill. These temporary measures affected approximately 500 employees at the pulp mill, sawmill and related forestland operations. Our Dryden pulp mill has an annual softwood pulp production capacity of 319,000 metric tons. The Ear Falls sawmill has an annual production capacity of 190 MFBM. Our Dryden pulp mill restarted its pulp production in July 2009. Our Ear Falls sawmill restarted its operations in August 2009, but we decided to indefinitely idle the sawmill again, effective in the fourth quarter of 2009.
In December 2008, we announced the permanent closure of our Lebel-sur-Quévillon pulp mill. Operations at our Lebel-sur-Quévillon pulp mill had been indefinitely idled in November 2005 due to unfavorable economic conditions. As of November 2005, our Lebel-sur-Quévillon pulp mill had an annual production capacity of approximately 300,000 metric tons and employed approximately 425 employees. In addition, we announced the permanent closure of our Lebel-sur-Quévillon sawmill, which had been indefinitely idled since 2006, at which time it employed approximately 140 employees.
In November 2008, we announced and closed our paper machine and converting operations at our Dryden mill. This measure resulted in the permanent curtailment of approximately 151,000 tons of paper capacity per year and affected approximately 195 employees. Our Dryden pulp production and related forestland activities will remain in operation. Dryden has one pulp line with an annual production capacity of 319,000 metric tons.
In December 2007, we announced the reorganization of our Dryden facility as well as the closure of our Port Edwards mill, effective in the first and second quarters of 2008, respectively. These measures resulted in the curtailment of approximately 336,000 tons of paper capacity per year and affected approximately 625 employees.
We continue to evaluate potential adjustments to our production capacity, which may include additional closures of machines or entire mills, and we could recognize significant cash and/or non-cash charges relating to any such closures in future periods.
Domtar Corporation was incorporated on August 16, 2006 for the sole purpose of holding the Weyerhaeuser Fine Paper Business and consummating the combination of the Weyerhaeuser Fine Paper Business with Domtar Inc. (the “Transaction”). The Weyerhaeuser Fine Paper Business was operated by Weyerhaeuser Company
38
(“Weyerhaeuser”) prior to the completion of the Transaction. The Transaction was consummated on March 7, 2007. Domtar Corporation had no operations prior to March 7, 2007 when, upon the completion of the Transaction, it became an independent public holding company that, directly or indirectly through its subsidiaries, owns the Weyerhaeuser Fine Paper Business and Domtar Inc. We refer to Domtar Corporation, as of the consummation of the Transaction, as the “Successor.”
Although Weyerhaeuser does not have a continuing proprietary interest in Domtar Corporation, we have entered into several agreements with Weyerhaeuser and/or certain of its subsidiaries in connection with the Transaction, including a tax sharing agreement, an intellectual property licensing agreement, a transition services agreement, fiber and pulp supply agreements and site services agreements. These agreements enabled us to continue to operate the Weyerhaeuser Fine Paper Business efficiently following the completion of the Transaction. At the end of 2008, the majority of the transition services was completed and the remainder of the transition services agreement was completed in early 2009.
The following MD&A of Domtar Corporation covers periods prior to the Transaction. For accounting and financial reporting purposes, the Weyerhaeuser Fine Paper Business is considered to be the “Predecessor” to Domtar Corporation and as a result, its historical financial statements now constitute the historical financial statements of Domtar Corporation. Accordingly, the results reported for the year ended 2009 and 2008 include the results of the Successor for the entire period and those reported for 2007 include the results of operations of the Weyerhaeuser Fine Paper Business, on a carve-out basis, for the period from January 1, 2007 to March 6, 2007 and the results of operations of the Successor for the period from March 7, 2007 to December 30, 2007. These historical financial statements may not be indicative of our future performance.
ACCOUNTING FOR THE TRANSACTION
The Transaction was considered, for accounting purposes, as the acquisition of Domtar Inc. by Domtar Corporation and has been accounted for using the purchase method of accounting. Accordingly, the purchase price was based upon the estimated fair value of Domtar Corporation common stock issued in addition to acquisition costs directly related to the Transaction. Since no quoted market price existed for the shares of Domtar Corporation’s common stock, the purchase price was based on the fair value of the net assets acquired on August 23, 2006, the date on which the terms of the Transaction were agreed to and announced. The fair value of Domtar Inc. common shares of $79.56 per share used in the calculation of the purchase price was based upon the average closing price of Domtar Inc. common shares on the Toronto Stock Exchange for the five trading days beginning August 21, 2006 and ending August 25, 2006, converted at the average daily foreign exchange rate of the Bank of Canada. The number of outstanding Domtar Inc. common shares used in the calculation of the fair value was based on the same periods.
For more information on the accounting for the Transaction, refer to Note 3 of Item 8, Financial Statements and Supplementary Data of this Annual Report on Form10-K.
Our reporting segments correspond to the following business activities: Papers, Paper Merchants and Wood. A description of our business is included in Part I, Item 1, Business of this Annual Report on Form 10-K.
Papers
We are the largest integrated manufacturer and marketer of uncoated freesheet paper in North America and the second largest in the world based on production capacity. In uncoated freesheet, we have 10 pulp and paper mills in operation (eight in the United States and two in Canada) with an annual paper production capacity of approximately 3.9 million tons of uncoated freesheet paper, after giving effect to the conversion of our Plymouth facility to 100% fluff pulp production in 2010. In addition, we have an annual production capacity of
39
238,000 tons of coated groundwood at our Columbus paper mill. Our paper manufacturing operations are supported by 15 converting and distribution operations including a network of 12 plants located offsite of our paper making operations. Also, we have forms manufacturing operations at three of the offsite converting and distribution operations and two stand-alone forms manufacturing operations.
We design, manufacture, market and distribute a wide range of fine paper products for a variety of consumers, including merchants, retail outlets, stationers, printers, publishers, converters and end-users. Approximately 81% of our paper production capacity is domestic and the remaining 19% is located in Canada. We also manufacture and sell pulp in excess of our internal requirements and we purchase papergrade pulp from third parties allowing us to optimize the logistics of our pulp capacity while reducing transportation costs. We have the capacity to sell to third parties approximately 1.9 million metric tons of pulp per year depending on market conditions, after giving effect to the conversion of our Plymouth facility to 100% fluff pulp production in 2010. Approximately 51% of our trade pulp production capacity is domestic and the remaining 49% is located in Canada.
Paper Merchants
Our Paper Merchants business consists of an extensive network of strategically located paper distribution facilities, comprising the purchasing, warehousing, sale and distribution of our various products and those of other manufacturers. These products include business and printing papers and certain industrial products. These products are sold to a wide and diverse customer base, which includes small, medium and large commercial printers, publishers, quick copy firms, catalog and retail companies and institutional entities. Our paper merchants operate in the United States and Canada under a single banner and umbrella name, the Domtar Distribution Group. Ris Paper, part of the Domtar Distribution Group, operates throughout the Northeast, Mid-Atlantic and Midwest areas from 20 locations in the United States, including 16 distribution centers.centers serving customers across North America. In Canada, Domtar Distribution Group operates as Buntin Reid in three locations in Ontario; JBR/La Maison du Papier in two locations in Quebec; and The Paper House in two locations in Atlantic Canada.
Wood
Our Wood business comprises the manufacturing, marketing and distribution of lumber and wood-based value-added products, and the management of forest resources. We operate fiveseven sawmills with a production capacity of approximately 660890 million board feet of lumber and one remanufacturing facility. In addition, we own six sawmills that are currently not in operation but have an aggregate production capacity of approximately 796 million board feet of lumber. We also have investments in five companies, one of which is not in operation.two companies. We seek to optimize the 2831 million acres of forestland we directly license or own in Canada and the United States and Canada through efficient management and the application of certified sustainable forest management practices to help ensure that a continuous supply of wood is available for future needs.
4440
CONSOLIDATED AND SEGMENTED RESULTS OF OPERATIONS AND SEGMENT REVIEW
The following table includes the consolidated financial results of Domtar Corporation for the fifty-two week periodsyear ended December 31, 2009, December 31, 2008 and December 30, 2007. The year 2007 which consists of the consolidated financial results of the Weyerhaeuser Fine Paper Business, on a carve-out basis, from January 1, 2007 to March 6, 2007 and of the Successor for the period from March 7, 2007 to December 30, 2007, and the consolidated financial results of the Weyerhaeuser Fine Paper Business, on a carve-out basis, for the fifty-three week periods ended December 31, 2006 and the fifty-two weeks ended December 25, 2005.2007.
| Fifty-two weeks ended | Fifty-three weeks ended | Fifty-two weeks ended | Year ended December 31, 2009 | Year ended December 31, 2008 | Year ended December 30, 2007 | |||||||||||||||||||
FINANCIAL HIGHLIGHTS | December 30, 2007 | December 31, 2006 | December 25, 2005 | |||||||||||||||||||||
| (In millions of U.S. dollars, unless otherwise noted) | (In millions of dollars, unless otherwise noted) | |||||||||||||||||||||||
Sales | $ | 5,947 | $ | 3,306 | $ | 3,267 | $ | 5,465 | $ | 6,394 | $ | 5,947 | ||||||||||||
Operating income (loss) | 270 | (556 | ) | (578 | ) | 615 | (437 | ) | 270 | |||||||||||||||
Net earnings (loss) | 70 | (609 | ) | (478 | ) | 310 | (573 | ) | 70 | |||||||||||||||
Net earnings (loss) per common share (in dollars) (1): | ||||||||||||||||||||||||
Net earnings (loss) per common share (in dollars)1: | ||||||||||||||||||||||||
Basic | 0.15 | (2.14 | ) | (1.68 | ) | 7.21 | (13.33 | ) | 1.77 | |||||||||||||||
Diluted | 0.15 | (2.14 | ) | (1.68 | ) | 7.18 | (13.33 | ) | 1.76 | |||||||||||||||
Operating income (loss) per segment: | ||||||||||||||||||||||||
Papers | $ | 321 | $ | (608 | ) | $ | (492 | ) | $ | 650 | $ | (369 | ) | $ | 321 | |||||||||
Paper Merchants | 13 | — | — | 7 | 8 | 13 | ||||||||||||||||||
Wood | (63 | ) | 52 | (86 | ) | (42 | ) | (73 | ) | (63 | ) | |||||||||||||
Corporate | (1 | ) | — | — | — | (3 | ) | (1 | ) | |||||||||||||||
Total | $ | 270 | $ | (556 | ) | $ | (578 | ) | $ | 615 | $ | (437 | ) | $ | 270 | |||||||||
| At December 30, 2007 | At December 31, 2006 | At December 31, 2009 | At December 31, 2008 | At December 30, 2007 | ||||||||||||||||||||
Total assets | $ | 7,748 | $ | 3,998 | $ | 6,519 | $ | 6,104 | $ | 7,726 | ||||||||||||||
Total long-term debt, including current portion | $ | 2,230 | $ | 44 | $ | 1,712 | $ | 2,128 | $ | 2,230 | ||||||||||||||
Refer to Note |
41
FIFTY-TWO WEEK PERIODYEAR ENDED DECEMBER 30, 200731, 2009 VERSUS
FIFTY-THREE WEEK PERIODYEAR ENDED DECEMBER 31, 20062008
Sales
Sales for 20072009 amounted to $5,947$5,465 million, an increasea decrease of $2,641$929 million, or 80%15%, from sales of $3,306$6,394 million in 2006 due to the acquisition of Domtar Inc. Excluding2008. The decrease in sales of $2,807 millionwas mainly attributable to Domtar Inc.lower shipments for paper ($612 million), reflecting softer market demand for uncoated freesheet in our paper business, which declined approximately 15% when compared to 2008, lower average selling prices for pulp and paper ($239 million and $30 million, respectively), lower shipments for our wood products and lower average selling prices ($34 million and $15 million , respectively) as well as lower deliveries for our Paper Merchants business. These factors were partially offset by higher shipments for pulp ($117 million) reflecting an increase of 12% when compared to 2008.
Cost of Sales, excluding Depreciation and Amortization
Cost of sales, for 2007excluding depreciation and amortization, amounted to $3,140$4,472 million in 2009, a decrease of $166$753 million, or 14%, compared to cost of sales, for 2006. Theexcluding depreciation and amortization, of $5,225 million in 2008. This decrease was mainly attributable to lower shipments for paper ($427 million), lower freight costs ($88 million), lower costs for maintenance ($86 million), the favorable impact of a weaker Canadian dollar on our Canadian denominated expenses, net of our hedging program ($78 million), lower costs for raw materials, including fiber ($31 million), energy ($22 million) and wood, partially resultingchemicals ($15 million), and the realization of savings stemming from the additional week of operations in 2006, as well as lower average selling prices for wood products.restructuring activities. These factors were partially offset by higher average selling pricesshipments for pulp and paper and($128 million), higher shipments for pulp.
Domtar Inc.’s sales for the forty-three weeks ended December 30, 2007 amounted to $2,807 million. Domtar Inc.’s sales were impacted by lower shipments for paper, pulp and wood products and lower average selling prices for lumber, partially offset by higher average selling prices for paper and pulp.
45
Cost of Sales
Cost of sales amounted to $4,757 million, an increase of $2,081 million, or 78%, in 2007, compared to cost of sales in 2006 due to the acquisition of Domtar Inc. Excluding cost of sales of $2,181 million attributable to Domtar Inc., cost of sales in 2007 amounted to $2,576 million, a decrease of $100 million compared to cost of sales in 2006. This decrease was mainly attributable to lower production and shipments for paper and wood products, partially resulting from the additional week of operations in 2006, lower costs for freight, lower costs for maintenance, lower costs due to mill and sawmill closures mentioned above, and lower costs related to lack-of-order downtime. These factors were partially offset by higher costs for fiber and chemicals, the negative impact of a stronger Canadian dollar, severance costs related to the reorganizationincrease in lack-of-order downtime and machine slowbacks ($109 million) as well as higher costs for our variable compensation program. In the first quarter of 2008, we also recorded the reversal of a provision for $23 million due to the early termination by the counterparty of an unfavorable contract.
Depreciation and Amortization
Depreciation and amortization amounted to $405 million in 2009, a decrease of $58 million, or 13%, compared to depreciation and amortization of $463 million in 2008. This decrease is primarily due to the implementation of restructuring activities in 2008 which resulted in impairment charges and write-down of property, plant and equipment in the fourth quarter of 2008 at our Dryden facility as well as impairment charges at our Columbus paper mill and write-down of property, plant and equipment for accelerated depreciation due to the permanent closure of a $9 million increasepaper machine in environmental provisions recorded in 2007.
Domtar Inc.’s costthe first quarter of sales for the forty-three weeks ended December 30, 2007 amounted to $2,181 million, which were impacted by lower production and shipments for all of its major products except2009 at our Plymouth pulp and lower costs for freight, partially offsetpaper. The decrease was also influenced by higher costs for fiber and chemicals and the negativefavorable impact of a strongerweaker Canadian dollar.dollar in 2009 when compared to 2008.
Selling, General and Administrative Expenses
SG&A expenses increased by $234amounted to $345 million in 20072009, a decrease of $55 million, or 14%, compared to SG&A expenses of $400 million in 20062008. This decrease in SG&A is primarily due to integration costs in 2008 ($32 million) not recurring in 2009, the acquisitionfavorable impact of Domtar Inc. Excluding SG&A of $218 million attributable to Domtar Inc., SG&A in 2007 amounted to $190 million, an increase of $16 million compared to SG&A in 2006. This increase in SG&A is mostly due to integration and optimization costs, fees paid to Weyerhaeuser for transition services,a weaker Canadian dollar ($13 million) as well as stock-based compensation costs. These amounts were partially offset by the elimination of the corporate chargeslower overall expenses resulting from Weyerhaeuser.
Domtar Inc.’s SG&A amounted to $218 million for the forty-three weeks ended December 30, 2007, and included transaction costs as well as integration and optimization costs.
Operating Income
Operating income in 2007 amounted to $270 million, an increase of $826 million compared to an operating loss in 2006 of $556 million mainly due to a $749 million goodwill impairment charge recorded in the first quarter of 2006 and in part due to the acquisition of Domtar Inc. Excluding operating income of $168 million attributable to Domtar Inc., operating income in 2007 amounted to $102 million, an increase of $658 million compared to 2006. The improvement in operating income was mostly attributable to a $749 million goodwill impairment charge recorded in the first quarter of 2006 based on an evaluation of goodwill relating to the Papers segment, as well as the factors mentioned above.cost reduction initiatives. These factors were partially offset by higher costs related to our variable compensation program.
Other Operating Income
Other operating income amounted to $497 million in 2009, an increase of $489 million compared to other operating income of $8 million in 2008. This increase in other operating income is primarily due to a refundable excise tax credit for the production and use of alternative bio fuel mixtures of $498 million recognized in 2009 as
42
well as gains on sales of land recorded in 2009 ($7 million), partially offset by a gain of $6 million related to the sale of trademarks recorded in the second quarter of 2008.
Operating Income (Loss)
Operating income in 2009 amounted to $615 million, an increase of $1,052 million compared to operating loss in 2008 of $437 million, primarily due to the alternative fuel tax credits recorded in 2009, partially offset by an aggregate $96$62 million charge in 2009 for impairment and write-down of property, plant and equipment, compared to a $325 million charge for the impairment of goodwill and property, plant and equipmentintangible assets recorded in the fourth quarter of 2007 associated with2008, and a $383 million charge for the reorganizationimpairment and write-down on property, plant and equipment in 2008. Additional information about impairment and write-down charges is included under the section “Impairment of Long-Lived assets,” under the caption “Critical Accounting Policies” of this MD&A. The increase is also attributable to the factors mentioned above. This increase was partially offset by higher closure and restructuring costs ($20 million) in 2009 when compared to 2008. The increase in closure and restructuring costs is primarily due to the aforementioned closure of one paper machine at our DrydenPlymouth pulp and paper mill in the first quarter of 2009 and the goodwill impairmentsubsequent announcement in October 2009 of our Wood business as well as the non-recurring benefit of a $65 million duties refund recordedits conversion to 100% fluff pulp production, expected to be effective in the fourth quarter of 2006.
Domtar Inc.’s operating income for the forty-three weeks ended December 30, 2007 amounted to $168 million and was impacted by the factors mentioned above,2010, as well as gains on a lawsuit settlementthe closure of our paper machine at our Dryden pulp and an insurance claim settlement receivedpaper mill effective in the fourth quarter of 2007 of $39 million and $12 million, respectively, and gains of $18 million on financial instruments.2008.
Interest Expense
We incurred $171$125 million of interest expense for the fifty-two week period ended December 30, 2007 mainly relatingin 2009, a decrease of $8 million compared to interest incurred after March 6, 2007 under our new Credit Agreement that we entered intoexpense of $133 million in connection2008. This decrease in interest expense is primarily due to a gain of $15 million related to the reduction of the fair value increment associated with the Transaction, as well as interest on existing Domtar Inc.portion of the 7.875% Notes we repurchased in the second quarter of 2009, lower long-term debt exchanged for Domtar Corporation debtdue to our repurchase of $60 million and $400 million aggregate principal amount of our outstanding 7.875% Notes due 2011, in the fourth quarter of 2007. Our2008 and second quarter of 2009, respectively, as well as lower interest rates in 2009 compared to 2008 with respect to our tranche B term loan. These factors were partially offset by interest expense forfrom the fifty-two week period ended December 30, 2007 also includes costs related to our debt restructuringissuance of the 10.75% Notes due 2017 in the amountsecond quarter of $252009, a $4 million premium paid on the repurchase of our 7.875% Notes due 2011 in the second quarter of 2009 as well as tender expenses of $1 million.
46
Income Taxes
For the fifty-two week period ended December 30, 2007,2009, our income tax expense amounted to $29$180 million which was comprised of current tax expense of $102compared to $3 million and deferred tax recovery of $73 million. The current tax expense includes $15 million of expense related to the period prior to the Transaction and does not constitute cash taxes for the Company.2008.
The following table provides income tax expense by jurisdiction for 2009 and 2008:
| Year ended December 31, 2009 | Year ended December 31, 2008 | |||||||||||||||||||||||
JURISDICTION | U.S. | Canada | Total | U.S. | Canada | Total | ||||||||||||||||||
| (In million of dollars, unless otherwise noted) | ||||||||||||||||||||||||
Income (loss) before income taxes | $ | 560 | $ | (70 | ) | $ | 490 | $ | 15 | $ | (585 | ) | $ | (570 | ) | |||||||||
Income tax (benefit) expense | 180 | — | 180 | 34 | (31 | ) | 3 | |||||||||||||||||
Effective tax rate | 32 | % | — | % | 37 | % | 227 | % | 5 | % | (1 | )% | ||||||||||||
During 2009, we recorded a net liability of $162 million for unrecognized income tax benefits associated with the allocationalternative fuel mixture tax credits income. If our income tax positions with respect to the alternative fuel mixture tax credits are sustained, either all or in part, then we would recognize a tax benefit in the future equal to the amount of the benefits sustained. We do not expect any material changes to the amount of these benefits to occur within the next 12 months. Our tax treatment of the income related to the alternative fuel mixture tax expensecredits resulted in the recognition of each jurisdiction for 2007:
JURISDICTION | U.S. | Canada | Total | |||||||||
| (In million of U.S. dollars, unless otherwise noted) | ||||||||||||
Income (loss) before income taxes | $ | 217 | $ | (118 | ) | $ | 99 | |||||
Income tax (benefit) expense | 72 | (43 | ) | 29 | ||||||||
Effective tax rate | 33 | % | 36 | % | 29 | % | ||||||
Thea tax benefit of $36 million which impacted the U.S. effective tax rate includes $4 million relatedrate. Our current expectation is that this credit will not be available in 2010 and thus is not expected to a non-conventional fuelimpact our effective tax credit. The non-conventional fuel tax credits are subject to fluctuationsrate in the price of oil. Under current U.S. tax law, the sale of biomass gas will no longer generate non-conventional fuel tax credits after 2007.future unless new legislation is introduced and passed. The Canadian effective tax rate forwas impacted by the fifty-two week period ended December 30, 2007 differs from the combined statutory rate due to an $11 million benefit related to changesadditional valuation allowance recorded against new Canadian deferred tax assets in the federal incomeamount of $29 million.
43
During 2008, we recorded a non-tax deductible goodwill impairment charge of $321 million and as a result, both the Canadian and U.S. effective tax rates were impacted. The Canadian effective tax rate outwas also impacted by a valuation allowance taken on the net Canadian deferred tax assets in the amount of which $6 million is related to a previously reported out-of-period adjustment.$52 million.
Net Earnings (Loss)
Net earnings amounted to $70$310 million ($0.157.18 per common share on a diluted basis) in 2007,2009, an increase of $679$883 million compared to a net loss of $609$573 million ($2.1413.33 per common share on a diluted basis) in 20062008 mainly due to the charge for impairment of goodwill, property, plant and equipment and intangible assets recorded in the firstfourth quarter of 2006 and in part due to2008, as well as the acquisition of Domtar Inc. Excluding net earnings of $86 million attributable to Domtar Inc., net loss in 2007 amounted to $16 million, a decrease in net loss of $593 million compared to the net loss of 2006. This improvement in net earnings was mainly attributable to theother factors mentioned above.
FOURTH QUARTER OVERVIEW
For the fourth quarter of 2007,2009, we reported operating income of $7$203 million, a decreasean increase of $136$922 million compared to operating incomeloss of $143$719 million in the fourth quarter of 20062008. This increase is mainly attributable to the alternative fuel tax credits recorded in the fourth quarter of 2009 ($162 million pre-tax) partially offset by an aggregate $27 million charge in the fourth quarter of 2009 for impairment and write-down of property, plant and equipment primarily associated with the accelerated depreciation of the aforementioned reorganization of our Plymouth pulp and paper mill in the fourth quarter of 2009 and an impairment charge related to our Prince Albert facility, compared to an aggregate $708 million charge for the impairment and write-down of goodwill, property, plant and equipment and intangible assets recorded in the fourth quarter of 2008 mostly associated with the closure of the paper machine at our Dryden pulp and paper mill and the goodwill impairment of our Papers business. Overall, our operating results for the fourth quarter of 2009 improved when compared to the fourth quarter of 2008, primarily due to lower costs for raw materials including chemicals, fiber and energy, lower freight costs, higher shipments for pulp and lower maintenance costs. These factors were partially offset by lower average selling prices and lower shipments for paper as well as the unfavorable impact of a stronger Canadian dollar, net of our hedging program.
Our effective tax rate in the fourth quarter of 2009 of 25% was primarily impacted by the continued alternative fuel tax credits that expired on December 31, 2009.
YEAR ENDED DECEMBER 31, 2008 VERSUS
YEAR ENDED DECEMBER 30, 2007
Sales
Sales for 2008 amounted to $6,394 million, an increase of $447 million, or 8%, from sales of $5,947 million in 2007 in part due to the acquisition of Domtar Inc. Excluding operating income of $76 millionon March 7, 2007. The increase was also attributable to higher average selling prices for pulp and paper ($346 million). These factors were partially offset by lower shipments for pulp and paper ($495 million), reflecting softer shipments for uncoated freesheet in our paper business, which declined approximately 10% when compared to the previous year, and the implementation of further restructuring activities in 2008 (refer to the section Restructuring activities, above) as well as lower shipments and lower average selling prices for our wood products ($36 million and $6 million, respectively).
Cost of Sales, excluding Depreciation and Amortization
Cost of sales, excluding depreciation and amortization, amounted to $5,225 million in 2008, an increase of $468 million, or 10%, compared to cost of sales, excluding depreciation and amortization, of $4,757 million in 2007, in part due to the acquisition of Domtar Inc. on March 7, 2007. This increase was also attributable to
44
higher costs related to the increase in lack-of-order downtime and machine slowbacks ($67 million), higher costs for raw materials, including fiber ($121 million), chemicals ($78 million) and energy ($64 million), and higher freight costs ($46 million) as well as the negative impact on costs of a stronger Canadian dollar, net of our hedging program ($33 million). These factors were partially offset by lower shipments for paper and pulp ($361 million), the operating lossreversal of a provision for $23 million due to the early termination by the counterparty of an unfavorable contract in the first quarter of 2008, lower costs for maintenance ($21 million) and the realization of savings stemming from restructuring activities.
Depreciation and Amortization
Depreciation and amortization amounted to $463 million in 2008, a decrease of $8 million, or 2%, compared to depreciation and amortization of $471 million in 2007. This decrease is primarily due to the completion of our purchase price allocation in the fourth quarter of 2007 affecting the valuation of property, plant and equipment acquired in the Transaction, which reduced our depreciation and amortization expense, and the implementation of further restructuring activities in 2008. These factors were partially offset by the acquisition of Domtar Inc. on March 7, 2007.
Selling, General and Administrative Expenses
SG&A expenses amounted to $69$407 million in 2008, a variationdecrease of $212$1 million compared to SG&A expenses of $408 million in 2007. This decrease in SG&A is due to lower integration costs in 2008 when compared to 2007, lower overall expenses resulting from cost reduction initiatives and reduced variable employee compensation costs in 2008 due to a decrease in our financial results when compared to 2007. These factors were mainly offset by the fourth quarteracquisition of 2006. This variation is mainly attributableDomtar Inc. on March 7, 2007.
Other Operating Income
Other operating income amounted to an aggregate $96$15 million in 2008, a decrease of $54 million compared to other operating income of $69 million in 2007. Other operating income in 2008 included a gain related to the sale of certain trademarks ($6 million), foreign exchange impact on working capital items ($5 million) and net gain on disposal of fixed assets ($3 million). Other operating income in 2007 included a gain of $51 million related to lawsuit and insurance settlement claims and mark-to-market gains on financial instruments of $18 million.
Operating Income (Loss)
Operating loss in 2008 amounted to $437 million, a decrease of $707 million compared to operating income in 2007 of $270 million, primarily due to a $325 million charge for the impairment of goodwill and property, plant and equipmentintangible assets recorded in the fourth quarter of 2007 associated with the reorganization of our Dryden paper mill and the goodwill impairment of our Wood business as well as the non-recurring benefit of the $652008, compared to $4 million refund for antidumping and countervailing duties recorded in the fourth quarter of 2006. This variation is also attributable2007, and a $383 million charge for the impairment and write-down on property, plant and equipment in 2008, compared to lower shipments for paper and wood products, primarily due to the additional week of operations$92 million in the fourth quarter of 2006,2007. The decrease is also attributable to the negative impact of a stronger Canadian dollar,factors mentioned above as well as higher closure and higherrestructuring costs for fiber($29 million) in 2008. The increase in closure and chemicals. These factors were partially offset by higher average selling prices for paper and pulp, lowerrestructuring costs is primarily due to the one week differential when compared toclosure of the fourth quarter of 2006 as well as to the achieved synergies from the Transaction with Domtar Inc., lower maintenance costs, higher shipments for pulp and lower costs for energy.
47
FIFTY-THREE WEEK PERIOD ENDED DECEMBER 31, 2006 VERSUS
FIFTY-TWO WEEK PERIOD ENDED DECEMBER 25, 2005
Sales
Sales amounted to $3,306 million in 2006, an increase of $39 million, or 1.2%, compared to sales of $3,267 million in 2005. This increase is mainly attributable to higher average selling prices for both paper and pulp, resulting from an overall improvement in the pulp and paper markets, partially offset by a decrease in shipments for paper and pulp, mostly resulting from the closures of our Prince Albert, Saskatchewan pulp and paper mill and one paper machine at our Dryden pulp and paper mill, as well as a decrease in shipments of softwood lumber, partially due to the closuresclosure of our Big River and 51% owned Wapawekka, Saskatchewan sawmills.
Cost of Sales
Cost of sales amounted to $2,676 million in 2006, a decrease of $108 million, or 3.9%, compared to cost of sales of $2,784 million in 2005. This decrease was primarily due to a reduction in the costs incurred in the production process forLebel-sur-Quévillon pulp paper and lumber as a result of the paper mill and sawmill closures mentioned above, partially offset by an increase in operating costs atand the Canadian facilities as a result of the negative impactdismantling cost of a stronger Canadian dollar, an increasepaper machine in chemical costs, an increase in supplies (primarily packaging materials) and an increase in other miscellaneous items during 2006, for the facilities that continued to operate.
Operating Loss
Operating loss amounted to $556 million in 2006, a decrease of $22 million, or 3.8%, compared to an operating loss of $578 million in 2005 due to items mentioned above, as well as a $522 million decrease in aggregate impairment of property, plant and equipment and closure and restructuring costs in 2006 and the $65 million refund for countervailing and antidumping duties recorded in 2006.2008. These factors were partially offset by the acquisition of Domtar Inc. on March 7, 2007.
Interest Expense
We incurred $133 million of interest expense in 2008, a $749decrease of $38 million compared to interest expense of $171 million in 2007. This decrease in interest expense is mainly due to lower long-term debt due to the repayment of our outstanding Canadian dollar debentures and a portion of our Tranche B term loan, lower interest rates in 2008 compared to 2007 and a gain of $12 million on debt repurchased in the fourth quarter of 2008. These factors were partially offset by interest expense in the first quarter of 2007 including only 26 days of interest resulting from both the Transaction financing and interest on Domtar Inc. debt.
45
Income Taxes
For 2008, our income tax expense amounted to $3 million compared to $29 million for 2007.
The following table provides income tax expense by jurisdiction for 2008 and 2007:
| Year ended December 31, 2008 | Year ended December 30, 2007 | |||||||||||||||||||||||
JURISDICTION | U.S. | Canada | Total | U.S. | Canada | Total | ||||||||||||||||||
| (In million of dollars, unless otherwise noted) | ||||||||||||||||||||||||
Income (loss) before income taxes | $ | 15 | $ | (585 | ) | $ | (570 | ) | $ | 217 | $ | (118 | ) | $ | 99 | |||||||||
Income tax (benefit) expense | 34 | (31 | ) | 3 | 72 | (43 | ) | 29 | ||||||||||||||||
Effective tax rate | 227 | % | 5 | % | (1 | )% | 33 | % | 36 | % | 29 | % | ||||||||||||
During 2008, we recorded a non-tax deductible goodwill impairment related tocharge of $321 million and as a result, both the closureCanadian and U.S. effective tax rates were impacted. The Canadian effective tax rate was also impacted by a valuation allowance taken on the net Canadian deferred tax assets in the amount of paper facilities in 2006.$52 million.
Net LossEarnings (Loss)
Net loss amounted to $609$573 million ($13.33 per common share on a diluted basis) in 2006, an increase2008, a decrease of $131$643 million or 27%, compared to net earnings of $70 million ($1.76 per common share on a net loss of $478 milliondiluted basis) in 2005. This increase resulted from the factors mentioned above, in addition to an increase in income tax expense, mostly2007 mainly due to the non-deductibilitycharge for tax purposesimpairment of goodwill, property, plant and equipment and intangible assets recorded in the $749 million goodwill impairment charge in 2006.fourth quarter of 2008 as well as the other factors mentioned above.
48
PAPERS
| Fifty-two weeks ended | Fifty-three weeks ended | Fifty-two weeks ended | ||||||||||
SELECTED INFORMATION | December 30, 2007 | December 31, 2006 | December 25, 2005 | |||||||||
| (In millions of U.S. dollars, unless otherwise noted) | ||||||||||||
Sales | ||||||||||||
Total sales | $ | 5,116 | $ | 3,143 | $ | 3,074 | ||||||
Intersegment sales | (235 | ) | — | (2 | ) | |||||||
| $ | 4,881 | $ | 3,143 | $ | 3,072 | |||||||
Operating income (loss) | 321 | (608 | ) | (492 | ) | |||||||
Shipments | ||||||||||||
Paper (in thousands of ST) | 4,501 | 3,024 | 3,297 | |||||||||
Pulp (in thousands of ADMT) | 1,329 | 798 | 828 | |||||||||
Benchmark prices (1): | ||||||||||||
Copy 20 lb sheets ($/ton) | $ | 968 | $ | 902 | $ | 822 | ||||||
Offset 50 lb rolls ($/ton) | 818 | 823 | 726 | |||||||||
Coated publication, no.5, 40 lb Offset, rolls ($/ton) | 787 | 863 | 877 | |||||||||
Pulp NBSK—U.S. market ($/ADMT) | 824 | 722 | 647 | |||||||||
Pulp NBHK—Japan market (2) ($/ADMT) | 655 | 592 | 526 | |||||||||
SELECTED INFORMATION | Year ended December 31, 2009 | Year ended December 31, 2008 | Year ended December 30, 2007 | |||||||||
| (In millions of dollars, unless otherwise noted) | ||||||||||||
Sales | ||||||||||||
Total sales | $ | 4,632 | $ | 5,440 | $ | 5,116 | ||||||
Intersegment sales | (231 | ) | (276 | ) | (235 | ) | ||||||
| $ | 4,401 | $ | 5,164 | $ | 4,881 | |||||||
Operating income (loss) | 650 | (369 | ) | 321 | ||||||||
Shipments | ||||||||||||
Paper (in thousands of ST) | 3,757 | 4,406 | 4,501 | |||||||||
Pulp (in thousands of ADMT) | 1,539 | 1,372 | 1,329 | |||||||||
Sales and Operating Income
Sales
Sales in our Papers businesssegment amounted to $4,881$4,401 million in 2007, an increase2009, a decrease of $1,738$763 million, or 55%15%, compared to sales of $3,143$5,164 million in 2006 due to the acquisition of Domtar Inc. Excluding sales of $1,803 million attributable to Domtar Inc., sales in 2007 amounted to $3,078 million, a decrease of $65 million compared to sales in 2006.2008. The decrease in sales is attributable to lower shipments for paper of approximately 8%15%, excluding shipments attributable to Domtar Inc., in part due to the additional week of operation in 2006, partially offset by an increase inreflecting softer market demand for uncoated freesheet paper and coated groundwood, and lower average selling prices for pulp and paper. As a result of softer market demand for uncoated freesheet paper and coated groundwood, we also took higher shipments for pulp of approximately 5%, excluding shipments attributable to Domtar Inc.
Domtar Inc.’s sales for the forty-three week period ended December 30, 2007 amounted to $1,803 millionlack-of-order downtime and were impacted by higher average selling prices for paper and pulp, partially offset by lower shipments for paper and pulp.
Salesmachine slowdown in our Paper business amounted to $3,143 million in 2006, an increase of $71 million, or 2%2009 when compared to sales2008, resulting in the availability of $3,072 millionmore market pulp as pulp shipments increased approximately 12%. As a result of the softer demand for uncoated freesheet paper, we have undertook restructuring activities. These activities include the reorganization of our Dryden paper mill at the end of 2007 and its subsequent closure in 2005. The increase is attributable to an increase in average selling prices for pulp and paper, partially offset by lower shipments for pulp and paper of approximately 4% and 8%, respectively. The decrease in pulp and paper shipments is primarily due toNovember 2008, the closure of our Prince Albert pulp andPort Edwards paper mill as well aseffective at the end of the second quarter of 2008, the closure of one paper machine at our DrydenPlymouth pulp and paper mill effective in the secondfirst quarter of 2006.2009 and
Operating Income
Operating income46
the announcement in October 2009 of its conversion to 100% fluff pulp production, expected to be completed in the fourth quarter of 2010.
Sales in our Papers businesssegment amounted to $321$5,164 million in 2007,2008, an increase of $929$283 million, or 6% compared to an operating losssales of $608$4,881 million in 20062007. The increase in part duesales is attributable to the acquisition of Domtar Inc. Excluding the
49
operating income of $187 million attributable to Domtar Inc., operating income inon March 7, 2007, amounted to $134 million, an increase of $742 million compared to an operating loss in 2006. The increase is mostly attributable to the absence in 2007 of a $749 million goodwill impairment expense recorded in the first quarter of 2006 as well as higher average selling prices for pulp and paper, reflecting the price increases implemented towards the end of 2007 as well as in February and July of 2008. Our pulp lower costs for freightshipments increased by 3% in 2008 when compared to 2007, primarily due to the acquisition of Domtar Inc. as well as the higher lack-of-order downtime in paper taken in 2008, resulting from our freight optimization efforts, lower costs for energy and higher shipments forin the availability of more market pulp. These factors were partially offset by a $92lower shipments for paper of approximately 2%, reflecting softer market demand for uncoated freesheet paper which led to our restructuring activities, including the closure of the paper machine at our Woodland pulp and paper mill effective in the third quarter of 2007, the closure of our Ottawa paper mill effective in the fourth quarter of 2007, the reorganization of our Dryden paper mill at the end of 2007 and subsequently closed in November 2008, and the closure of our Port Edwards paper mill effective at the end of the second quarter of 2008.
Operating Income (Loss)
Operating income in our Papers segment amounted to $650 million in 2009, an increase of $1,019 million, when compared to operating loss of $369 million in 2008, mostly attributable to the $498 million in alternative fuel tax credits recorded in 2009, partially offset by the aggregate $62 million charge for impairment and write-down of property, plant and equipment in 2009, compared to the aggregate $694 million charge for impairment and write-down of goodwill and property, plant and equipment recorded in the fourth quarter of 2007 associated with the reorganization of2008. In addition, our Dryden paper mill, as well as lower shipments for paper, mostly due to the additional week of operations in the fourth quarter of 2006. Additional factors include the negative impact of a stronger Canadian dollar, higher costs for fiber, as well as higher costs for chemicals which is mostly due to the increase in the price of starch and sodium chlorate which are used in the production of paper and pulp, respectively.
Domtar Inc.’s operating income totaled $187 million for the forty-three week period ended December 30, 2007. Domtar Inc.’s operating income was impacted by lower freight costs, lower maintenance costs, the favorable impact of a weaker Canadian dollar, higher pulp shipments, lower cost for raw materials, including fiber, energy and chemicals, the realization of savings stemming from restructuring and synergy activities as well as lower depreciation and amortization expense. These factors were more than offset by lower shipments for paper, and pulp and higher costs for fiber and chemicals, partially offset by gains totaling $51 million received in the fourth quarter of 2007 related to a lawsuit settlement and an insurance claim settlement, higherlower average selling prices for paper and pulp and lower freightpaper as well as higher closure and restructuring costs. In the first quarter of 2008, we also recorded the reversal of a provision for $23 million due to the early termination by the counterparty of an unfavorable contract.
Operating loss in our Papers businesssegment amounted to $608$369 million in 2006, an increase2008, a decrease of $116$690 million, when compared to an operating lossincome of $492$321 million in 2005. The increase in operating loss is primarily due2007, mostly attributable to a $749the aggregate $694 million charge for impairment and write-down of goodwill impairment expenseand property, plant and equipment recorded in the firstfourth quarter of 2006,2008 compared to the negative impact$92 million charge for impairment of a stronger Canadian dollar,property, plant and equipment in 2007. In addition, our operating loss was impacted by higher costs for raw materials including fiber, energy and chemicals, an increaseespecially for starch, caustic soda, sulfuric acid and sodium chlorate, higher freight costs, lower shipments for paper as well as higher closure and restructuring costs, and the absence of a gain of $39 million related to a lawsuit settlement in supplies, primarily packaging materials, and an increase in other miscellaneous items during 2006 for our facilities that continued to operate.2007. These factors were partially offset by a decrease in impairmentthe acquisition of property, plant and equipment and closure and restructuring costs and a reduction in manufacturing costs as a result of the closure of our Prince AlbertDomtar Inc. on March 7, 2007, higher average selling prices for pulp and paper, millhigher shipments for pulp, lower maintenance costs, the realization of savings stemming from restructuring and synergy activities as well as one paper machine at our Dryden pulplower depreciation and paper mill in the second quarter of 2006.amortization expense.
Pricing Environment
In our Papers business, our overallOverall average sales prices increased in 2007our paper business experienced a small decrease in 2009 compared to 2006.2008. Our average sales priceprices for copy 20 lb sheets and offset 50 lb rolls was higher on averagewere lower by $106/$40/ton, or 12%, and $14/4% in 2009 compared to 2008, while our copy 20lb sheets were higher by $45/ton, or 2%, respectively,4% in 20072009 when compared to 2006. A $60/ton price increase has been announced for business paper grades, including copy and for several commercial printing and publication grades, including offset and opaque, effective in the first quarter of 2008.
Our average sales prices for both Northern Bleached Softwood Kraft (“NBSK”) pulp and Northern Bleached Hardwood Kraft (“NBHK”) pulp increaseddecreased by $80/tonne,$152/metric ton and $199/metric ton, or 13%21% and 30%, respectively, in 20072009 compared to 2006. A $20/tonne2008, reflecting a significant decrease in sales prices for both NBSK and
47
NBHK in the fourth quarter of 2008 and first half of 2009. This significant decrease in sales prices was partially offset by price increase has been announced for hardwood pulp, effectiveincreases implemented in February 2008.the third and fourth quarters of 2009.
Operations
Shipments
Our paper shipments excluding shipments attributable to Domtar Inc., decreased by 248,000649,000 tons, or 8%15%, in 20072009 compared to 2006 mostly2008, primarily due to softer market demand for uncoated freesheet paper and coated groundwood which resulted in higher lack-of-order downtime and paper machine slowbacks in 2009. The continued softer market demand for uncoated freesheet has resulted in the additional weekclosure of operationsone paper machine at our Plymouth pulp and paper mill effective in the first quarter of 2009 and the subsequent announcement in October 2009 of its conversion to 100% fluff pulp production facility (expected to be effective in the fourth quarter of 20062010), the closure of our Port Edwards paper mill effective at the end of the second quarter of 2008 and the higher lack-of-order downtime resulting in the reorganization of our Dryden paper mill.mill announced in the fourth quarter of 2007 (which began in January 2008 and was permanently closed in November 2008).
Our pulp trade shipments excluding shipments of Domtar Inc., increased by 43,000tonnes,167,000 metric tons, or 5%12%, in 20072009 compared to 20062008. The increase in pulp shipments resulted mostly from an increase in the availability of market pulp in 2009 due to increasedhigher lack-of-order downtime in paper resultingas well as a decrease in our pulp inventory.
Alternative Fuel Tax Credits
The U.S. Internal Revenue Code of 1986, as amended (the “Code”) permits a refundable excise tax credit for the production and use of alternative bio fuel mixtures derived from biomass. We submitted an application with the U.S. Internal Revenue Service (IRS) to be registered as an alternative fuel mixer and received notification that our registration had been accepted in late March 2009. We began producing and consuming alternative fuel mixtures in February 2009 at our eligible mills. In 2009, we recorded $498 million of such credits in “Other operating (income) loss” on the Consolidated Statement of Earnings. The amounts for the refundable credits are based on the volume of alternative bio fuel mixtures produced and burned during that period. According to the Code, the tax credit expired at the end of 2009.
In 2009, we received $140 million in cash related to these claims. Any receivables under this program are presented as a component of Income and other taxes receivables on the Consolidated Balance Sheet. In the second quarter of 2009, we stopped claiming these credits for immediate refund as they were being earned and ultimately decided to claim the remaining refundable credits on our 2009 annual U.S. income tax return, which is expected to be filed in the availabilityfirst half of more saleable market pulp.2010. Additional information regarding unrecognized tax benefits is included in Item 8, Financial Statements and Supplementary Data of this Annual Report on Form 10-K, under Note 10 “Income taxes.”
Labor
AWe have an umbrella agreement with the United Steelworkers Union, expiring in 2012, affecting approximately 4,000 employees at our U.S. locations. This agreement only covers certain economic elements, and all other issues will be negotiated at each operating location, as the related collective agreement expiredbargaining agreements become subject to renewal. The parties have agreed not to strike or lock-out during the terms of the respective local agreements.
We have four collective agreements that will expire in 2010, one of which expires in April 2004 forat our Lebel-sur-Quévillon pulp mill (affecting approximately 350 employees).Windsor facility, two that expire in May at our Nekoosa facility and one that expires in August at our Hawesville facility. Negotiations have ceased and the mill has been closednot started for an indefinite period since November 2005.
50
Negotiations for the renewal of thethese collective agreement that expired in November 2007 for our Ashdown mill (affecting approximately 900 employees) began in October 2007 and are still ongoing. Negotiations for the renewal of the collective agreement that expired in August 2007 for our Woodland mill began in November 2007, and are ongoing as well.agreements.
Closure and Restructuring
In 2009, we incurred $114 million of closure and restructuring costs ($732 million in 2008), including the impairment and write-down of property, plant and equipment of $62 million in 2009, compared to
48
$373 million in 2008 and impairment of goodwill of nil in 2009, compared to $321 million in 2008. For more details on the closure and restructuring costs, refer to Item 8, Financial Statements and Supplementary Data, Note 17, of this Annual Report on Form 10-K.
Closure and restructuring costs are based on management’s best estimates. Although the Company does not anticipate significant changes, actual costs may differ from these estimates due to subsequent developments such as the results of new environmental studies as well as other business developments. As such, additional costs, further write-downs and impairment charges may be required in future periods.
2009
Our Prince Albert pulp and paper mill was closed in the first quarter of 2006 and has not been operated since. In December 2009, we decided to dismantle our Prince Albert facility. We will continue to remove machinery and equipment from the site and will take steps to engage the services of demolition contractors and file for a demolition permit. The dismantling of the paper machine and converting equipment was completed in 2008 and the dismantling of the remaining assets is expected to start in 2010. As a result of a review of current options for the disposal of the assets of this facility in the fourth quarter of 2009, we revised the estimated net realizable values of the remaining assets and recorded a non-cash write-down of $14 million in the fourth quarter of 2009, related to fixed assets, mainly a turbine and a boiler. The write-down represents the difference between the new estimated liquidation or salvage value of the fixed assets and their carrying values.
In February 2009, we announced the permanent shut down of a paper machine at our Plymouth pulp and paper mill, effective at the end of February 2009. This measure resulted in the permanent curtailment of 293,000 tons of paper production capacity per year and affected approximately 185 employees. Our Plymouth pulp and paper mill continues to operate two pulp lines, one pulp dryer and one paper machine, with an annual paper production capacity of 199,000 tons. Subsequently, in October 2009, we announced that we will convert our Plymouth pulp and paper mill to 100% fluff pulp production. This conversion will require approximately $74 million of investment. Our annual fluff pulp making capacity will increase to 444,000 metric tons. The mill conversion, which is expected to be completed in the fourth quarter of 2010, will also result in the permanent shut down of Plymouth’s remaining paper machine with a annual production capacity of 199,000 tons. The mill conversion will help preserve approximately 360 positions. In connection with this announcement, we recognized $13 million of accelerated depreciation in the fourth quarter of 2009 and we expect to record a further $39 million of accelerated depreciation over the first nine months of 2010 in relation to the assets that will cease productive use in October 2010. The assets of this facility have been tested for impairment and no additional impairment charge was required.
Our Woodland pulp mill, which was indefinitely idled in May 2009, was reopened effective June 26, 2009, and substantially all employees were called back to work in June for the restart of pulp production. Our Woodland pulp mill has an annual hardwood production capacity of approximately 398,000 metric tons, and approximately 300 employees were reinstated. The timely benefits from the refundable tax credits for the production and use of alternative bio fuel mixtures, and other important conditions, such as stronger global demand, improving prices and favorable currency exchange rates have made the reopening possible.
In April 2009, we announced that we would idle our Dryden pulp facility for approximately ten weeks, effective April 25, 2009. This decision was taken in response to continued weak global demand for pulp and the need to manage inventory levels. Our Dryden pulp mill has an annual softwood pulp production capacity of 319,000 metric tons. Our Dryden pulp mill restarted its pulp production in July 2009.
2008
In December 2008, we announced the permanent closure of our Lebel-sur-Quévillon pulp mill. Operations at our Lebel-sur-Quévillon pulp mill had been indefinitely idled in November 2005 due to unfavorable economic conditions. At the time, our Lebel-sur-Quévillon pulp mill had an annual production capacity of approximately 300,000 metric tons and employed approximately 425 employees.
49
In November 2008, we announced the closure of the paper machine and converting operations at our Dryden mill, effective in November 2008. This measure resulted in the permanent curtailment of approximately 151,000 tons of paper capacity per year and affected approximately 195 employees. Our Dryden pulp production and related forestland activities will remain in operation. Dryden has one pulp line with an annual production capacity of 319,000 metric tons.
In December 2007, we announced the reorganization of our Dryden facility as well as the closure of our Port Edwards mill, effective in the first and second quarters of 2008, respectively. These measures will resultresulted in the curtailment of approximately 336,000 tons of paper capacity per year and will affectaffected approximately 625 employees.
In July 2007, Domtar announced the closure of two paper machines, one at our Woodland pulp and paper mill and another at our Port Edwards pulp and paper mill as well as our Gatineau paper mill and our Ottawa converting center, effective October 2007. In total, these closures resulted in the curtailment of approximately 284,000 tons of paper capacity per year and affected approximately 430 employees.
In 2006, we indefinitely closed our Prince Albert pulp and paper mill and one paper machine at our Dryden pulp and paper mill (effective in the second quarter of 2006).
In 2007, we incurred $106 million for closure and restructuring costs ($15 million in 2006 and $537 million in 2005), including impairment of property, plant and equipment of $92 million (nil in 2006 and $499 million in 2005). For more details on the closure and restructuring cost, refer to Item 8, Financial Statements, Note 16, of this Annual Report on Form 10-K.
At December 30, 2007, $78 million of the paper segment closure and restructuring cost liability relate to operations and activities of Domtar Inc., which was acquired by Domtar Corporation on March 7, 2007, and were part of a plan that had begun to be assessed and formulated by management at that date. As a result, these costs represent assumed liabilities and costs incurred as of the acquisition date and were treated as part of the purchase price allocation in accordance with Emerging Issues Task Force (“EITF”) 95-3, Recognition of Liabilities in Connection with a Purchase Business Combination. These closures also impacted the fair value of certain property, plant and equipment as part of the Domtar Inc. purchase price allocation.
In 2006, we recognized restructuring costs which included paper facilities and restructuring activities at our Dryden and Prince Albert facilities.
In the fourth quarter of 2005, we announced the indefinite closure of our Prince Albert pulp and paper mill and one paper machine at our Dryden pulp and paper mill and we recognized closure costs and impairment charges related to these closures. Additionally, we recognized impairment charges for our Big River and 51% owned Wapawekka, Saskatchewan, sawmill as they sold chips and hog fuel to the closed pulp and paper facility and did not have an alternate market for such residual.
Other
On September 12, 2007, we signedOur air permit for our Kamloops pulp mill required that the facility reduce air emissions of particulate matter by December 31, 2007. The Province of British Columbia agreed to extend the deadline for compliance under specific conditions for a memorandumperiod of understandingfive years. Compliance with the Province of Saskatchewan regarding a plan forpermit requirements is likely to require approximately $35 million in capital expenditures over the redevelopment ofnext five years. These projects will be funded under the Prince Albert facility. Natural Resources Canada Pulp and Paper Green Transformation Program, see below.
Natural Resources Canada Pulp and Paper Green Transformation Program
On November30,2007, we were informed thatJune 17, 2009, the Government of SaskatchewanCanada announced that it was not prepareddeveloping a Pulp and Paper Green Transformation Program (“the Program”) to participate inhelp pulp and paper companies make investments to improve the financingenvironmental performance of their Canadian facilities. The Program is capped at CDN$1 billion, and redevelopmentthe funding of capital investments at eligible mills must be completed no later than March 31, 2012.
Subject to the approval of Natural Resources Canada, eligible projects must demonstrate an environmental benefit by either improving energy efficiency or increasing renewable energy production. The investment must be made before the expiration of the Prince Albert facility into a NBSKprogram on March 31, 2012, and all projects are subject to the approval of the Government of Canada. Although amounts will not be received until qualifying capital expenditures have been made, we have been allocated $133 million (CDN$143 million) through this Program. The funds are to be spent on capital projects to improve energy efficiency and environmental performance in our Canadian pulp mill producing 100% Forest Stewardship Council (“FSC”) certified softwood pulp for the North American and offshore markets. As such, the Company has not determined whether this previously idled facilitypaper mills and any amounts received will be reopened, sold or closed.
On May 9, 2007, we concludedaccounted for as an offset to the sale of our Vancouver property for total proceeds of $20 million. No gain or loss was recorded on the sale.
51
Our Lebel-sur-Quévillon pulp mill, which was part of our acquisition of Domtar Inc., was indefinitely closed in the fourth quarter of 2005 due to unfavorable economic conditions. As of December30,2007, the Lebel-sur-Quévillon pulp mill remains indefinitely idled due to continuing unfavorable economic factors such as high wood fiber, energyapplicable plant and transportation costs, a strong Canadian dollar and uncompetitive labor costs. At December 30, 2007, our Lebel-sur-Quévillon pulp mill is recorded at its estimated fair value as it was included in the purchase price allocation upon acquisition.equipment asset amount.
PAPER MERCHANTS
| Fifty-two weeks ended | Fifty-three weeks ended | Fifty-two weeks ended | ||||||||||||||
SELECTED INFORMATION | December 30, 2007 | December 31, 2006 | December 25, 2005 | Year ended December 31, 2009 | Year ended December 31, 2008 | Year ended December 30, 2007 | ||||||||||
| (In millions of U.S. dollars) | (In millions of dollars) | |||||||||||||||
Sales | $ | 812 | — | — | $ | 873 | $ | 990 | $ | 812 | ||||||
Operating income | 13 | — | — | 7 | 8 | 13 | ||||||||||
Sales and operating incomeOperating Income
Sales
OurSales in our Paper Merchants business generatedsegment amounted to $873 million in 2009, a decrease of $117 million compared to sales of $990 million in 2008. This decrease in sales was mostly attributable to softer market demand which resulted in a decrease in deliveries of approximately 9%, as well as a decrease in selling prices.
50
Sales in our Paper Merchants segment amounted to $990 million in 2008, an increase of $178 million compared to sales of $812 million forin 2007. This increase in sales was mostly attributable to the fifty-two weeks ended December 30, 2007. The Predecessor had no Paper Merchants operations and as a result, sales for 2007 represent forty-three weeksacquisition of sales, fromDomtar Inc. on March 7, 2007, to December 30, 2007.as well as higher selling prices.
Operating Income
Operating income amounted to $7 million in 2009, a decrease of $1 million when compared to operating income of $8 million in 2008. The decrease in operating income is attributable to a decrease in deliveries in 2009 when compared to 2008, and an increase in closure and restructuring costs of $2 million in 2009. The factors were partially offset by lower SG&A costs in 2009 when compared to 2008.
Operating income amounted to $8 million in 2008, a decrease of $5 million when compared to operating income of $13 million in 2007. The decrease in operating income is attributable to an increase in costs, including an increase in the “last in first out” (LIFO) reserve and higher energy costs, an increase in the allowance for doubtful accounts and an increase in depreciation and amortization in 2008. These factors were partially offset by the fifty-two weeks ended December 30, 2007.acquisition of Domtar Inc. on March 7, 2007, and an increase in selling prices. In addition, the third quarter of 2007 included a decrease in the allowance for doubtful accounts of $2 million.
Operations
Labor
We have collective agreements covering six locations in the U.S., of which four will expire in 2010 and two in 2013. We have five collective agreements covering four locations in Canada, thatone of which expired in 2008 and two expired in 2009 (negotiations are expected to begin shortly) and two will expire between December 2008 and Decemberin 2010.
WOOD
| Fifty-two weeks ended | Fifty-three weeks ended | Fifty-two weeks ended | ||||||||||||||||||||||
SELECTED INFORMATION | December 30, 2007 | December 31, 2006 | December 25, 2005 | Year ended December 31, 2009 | Year ended December 31, 2008 | Year ended December 30, 2007 | ||||||||||||||||||
| (In millions of U.S. dollars, unless otherwise noted) | (In millions of dollars, unless otherwise noted) | |||||||||||||||||||||||
Sales | $ | 304 | $ | 234 | $ | 338 | $ | 211 | $ | 268 | $ | 304 | ||||||||||||
Intersegment sales | (50 | ) | (71 | ) | (143 | ) | (20 | ) | (28 | ) | (50 | ) | ||||||||||||
| 254 | 163 | 195 | 191 | 240 | 254 | |||||||||||||||||||
Operating income (loss) | (63 | ) | 52 | (86 | ) | (42 | ) | (73 | ) | (63 | ) | |||||||||||||
Shipments (millions of FBM) | 684 | 223 | 431 | 574 | 677 | 684 | ||||||||||||||||||
Benchmark prices (1): | ||||||||||||||||||||||||
Benchmark prices1: | ||||||||||||||||||||||||
Lumber G.L. 2x4x8 stud ($/MFBM) | $ | 321 | $ | 343 | $ | 418 | $ | 259 | $ | 280 | $ | 321 | ||||||||||||
Lumber G.L. 2x4 R/L no. 1 & no. 2 ($/MFBM) | 329 | 368 | 420 | 270 | 304 | 329 | ||||||||||||||||||
| Source: Random Lengths. As such, these prices do not necessarily reflect our sales prices. |
52
Sales and Operating Loss
Sales
Sales in our Wood businesssegment amounted to $254$191 million in 2007, an increase2009, a decrease of $91$49 million, or 56%20%, compared to sales of $163$240 million in 2006 primarily due to the acquisition of Domtar Inc. Excluding sales of $192 million attributable to Domtar Inc., sales in 2007 amounted to $62 million, a decrease of $101 million compared to sales in 2006.2008. The decrease in sales is attributable to lower shipments, mostly due to the indefinite closure of our Big River and 51% owned Wapawekka, Saskatchewan sawmills during the first quarter of 2006, the slowdown in the U.S. housing industry as well as the additional week of operationswhich resulted in the fourth quarter of 2006 and lower average selling prices.
Domtar Inc.’s sales amounted to $192 million in the forty-three week period ended December 30, 2007prices and were impacted by lower shipments and lower average selling prices.for wood products.
51
Sales in our Wood businesssegment amounted to $163$240 million in 2006,2008, a decrease of $32$14 million, or 16% when6%, compared to sales of $195$254 million in 2005.2007. The decrease in sales is primarily a resultattributable to the slowdown in the U.S. housing industry which resulted in lower average selling prices and lower shipments for wood products, as well as lower sales of wood chips, partially offset by the impact of the closurereopening of our Big RiverVal d’Or and 51% owned WapawekkaMatagami sawmills duringin June 2007 and January 2008, respectively, as well as the first quarteracquisition of 2006.Domtar Inc. on March 7, 2007.
Operating Loss
Operating loss in our Wood businesssegment amounted to $63$42 million in 2007,2009, a decrease in operating loss of $31 million compared to an operating loss of $73 million in 2008, mostly attributable to the aggregate $14 million charge for impairment of property, plant and equipment and intangible assets in 2008. This decrease in operating loss is also attributable to the favorable impact of a weaker Canadian dollar in 2009 when compared to 2008, lower depreciation and amortization expense due to the write-down of property, plant and equipment in the fourth quarter of 2008, lower SG&A expenses as well as gains of $8 million on sales of land in the third quarter of 2009 and a gain of $3 million on the dissolution of a subsidiary in the second quarter of 2009. These factors were partially offset by lower average selling prices and lower shipments of our wood products as well as higher closure and restructuring costs. Our second quarter of 2008 also included a gain of approximately $1 million on the sale of our investment in Olav Haavaldsrud Timber Company Limited (“Haavaldsrud”).
Operating loss in our Wood segment amounted to $73 million in 2008, an increase in operating loss of $115$10 million compared to an operating incomeloss of $52$63 million in 2006 primarily due2007, mostly attributable to the absenceaggregate $14 million charge for impairment of property, plant and equipment and intangible assets in 2008, compared to a $65$4 million refund for antidumping and countervailing duties recordedimpairment charge of goodwill in the fourth quarter of 20062007, as well as the acquisition of Domtar Inc. Excluding an operating loss of $36 million attributable to Domtar Inc., the operating loss in 2007 amounted to $27 million, an increase in operating loss of $79 million compared to 2006. Theon March 7, 2007. This increase in operating loss is also attributable to the above mentioned $65 million duties refund recorded in the fourth quarter of 2006, lower shipments, mostly due to the indefinite closure of our Big River and 51% owned Wapawekka sawmills during the first quarter of 2006 as well as the additional week of operations in the fourth quarter of 2006, lower average selling prices and a $4 million charge for the goodwill impairment recorded in the fourth quarter of 2007, partially offset by lower costs resulting from the sawmill closures mentioned above.
Domtar Inc.’s operating loss totaled $36 million for the forty-three week period ended December 30, 2007. Factors impacting Domtar Inc.’s operating loss includes lower average selling prices and lower shipments for lumber and chips, partially offset by lower energy costs and lower freight charges.
Operating income inof our Wood business amounted to $52 million in 2006, an increase in operating income of $138 million compared to operating loss of $86 million in 2005. The increase in operating income is primarily due to the absence in 2006 of a $77 million ofwood products, higher closure and restructuring costs including impairment of property, plant and equipment, recorded in 2005, the $65 million refundhigher costs for antidumping and countervailing duties recorded in 2006, lower manufacturing costs primarily due to the closure of our Big River and 51% owned Wapawekka sawmills during the first quarter of 2006,energy. These factors were partially offset by higher shipmentsthe reopening of wood products.our Matagami sawmill, lower costs and better productivity at several operations. Our second quarter of 2008 included a gain of approximately $1 million on the sale of our investment in Olav Haavaldsrud Timber Company Limited (“Haavaldsrud”).
Pricing Environment
Our average sales price for Great Lakes 2x4 stud lumber decreased by $30/$21/MFBM, or 10%9%, and our average sales price for Great Lakes 2x4 random length lumber decreased by $47/$34/MFBM, or 14%13%, in 20072009 compared to 2006.2008.
Operations
Shipments
On an annual basis, ourOur lumber and wood shipments excluding shipments of Domtar Inc.,in 2009 decreased by 87103 MFBM, or 39%15%, compared to last year, mostly as a result of the indefinite closure of our Big River and 51% owned Wapawekka sawmills during the first quarter of 2006, the additional week of operationsshipments in 2006 as well as2008, primarily due to the slowdown in the U.S. housing industry.
53
Labor
We have three collective agreements that have expired and are currently under negotiation and two that will expire in 2010. Other collective agreements have expiring dates from 2011 to 2014.
In May 2007,2009, we signed a five yeartwo-year collective agreement was ratified with the union at(expiring in 2011) for our Timmins sawmill, a four-year collective agreement (expiring in 2011) for our Gogama sawmill and a five-year collective agreement (expiring in 2011) for our Val d’Or sawmill (affectingfacility (debarking and slashing department) (expiring in 2014), affecting in total approximately 88 employees).160 employees. Agreements were also reached with our Elk Lake and Dryden forestland employees to modify their existing collective agreement.
Negotiations for a new collective agreement for our Sullivan remanufacturing facility (affecting approximately 60 employees) have ceased and the sawmill became a non-unionized facility effective in the second quarter of 2007.
A collective agreement expired in June 2007 for our Sainte-Marie sawmill. Negotiations for the renewal of this collective agreement (affecting approximately 70 employees) began in August 2007 and are still ongoing.52
A collective agreement expired in August 2005 for our Nairn Centre sawmill and a new agreement expiring in 2010 was ratified by the members in December 2007.
Fiber supply
The Province of Quebec adopted legislation, which became effective April 1, 2005, that reduced allowable wood-harvesting volumes by an average of 20% on public lands and 25% on territories covered by an agreement between the Government of Quebec and Cree First Nations. As a result, the amount of fiber, primarily softwood fiber, that we arewere permitted to harvest annually under our existing licenses from the Quebec government, was reduced by approximately 500,000 cubic meters21%, to approximately 1.8 million cubic meters, reflecting a 21% reduction. The Chief Forestermeters. In November 2008, the Government of Quebec has proposedannounced that they had implemented a further reductionnew consolidation plan affecting harvesting rights for Northern Quebec. This decision, which resulted in the permanent closure of 55,000our Lebel-sur-Quévillon sawmill announced in December 2008, provides for the reallocation of volume, for a period of five years, including the reallocation of 665,700 net annual cubic meters or 3%, of the total softwood annual allowable cut of forests managed by Domtar. The reduction will be effective from April 2008 to March 2009 and would significantly affect the supply of fiber for our Northern Quebec softwood sawmill. The reduction in harvest volume would also result in a corresponding increase in the unit cost of wood delivered to the sawmills. As a result of the strength of the Canadian dollar against the U.S. dollar, low lumber prices and other factors, a significant portion of our wood harvesting operations in Quebec have been shut down and all but two, Val d’Or and Matagami, of these facilities related to such operations have been closed indefinitely. In June 2007, we restartedfor our Val d’Or sawmill as(615,700 net annual cubic meters in addition to a resulttemporary volume of a new contract for our chips and more favorable economic conditions, which has an40,000 net annual capacity of approximately 160 million board feet, and in January 2008, we restarted our Matagami sawmill which has an annual capacity of approximately 100 million board feet.
On October 1, 2007, Domtar Inc. received a written notice from the Minister of Natural Resources and Wildlifecubic meters for the province of Quebec purporting to revoke, effective September 14, 2007, Domtar Inc.’s forest license rights relating to its Grand-Remousnext four years) and Malarctic sawmills representing approximately 567,000450,000 net annual cubic meters of fiberwood for our Matagami sawmill.
United States imposes tariffs on softwood lumber
In February 2009, a tribunal operating under the auspices of the London Court of International Arbitration (“LCIA”) issued its decision on a remedy in the softwood lumber arbitration in which Canada was found to have breached the 2006 Softwood Lumber Agreement (“SLA”) between the United States and Canada by failing to calculate quotas properly during the first six months of 2007. The LCIA tribunal determined that, as appropriate adjustment to compensate for its breach, Canada must collect an annual basis. While we are currently seekingadditional 10%ad valorem export charge on softwood lumber shipments from four Canadian provinces (Ontario, Quebec, Manitoba and Saskatchewan) until $55 million has been collected. Starting in April 2009, the reinstatement of these license rights through formal legal proceedings, thereUnited States imposed tariffs on softwood lumber from four Canadian provinces due to Canada’s failure to comply with the SLA. On September 26, 2009, the tribunal ordered Canada to impose a 10%ad valorem export charge on softwood lumber exports to the United States from the four provinces. Canada has indicated its intention to comply with this ruling. Once Canada has imposed a 10% export tax, the United States is no assuranceexpected to cease collecting its 10% import duty, with the result that wethe affected exports from Canada will continue to be successful and we may lose these forest license rights permanently.subject to a 10% charge, as has been in effect since April 2009. This measure did not have a significant impact on our financial results for 2009.
Other
We indefinitely idled our Ste-Marie sawmill in April 2009 and Ste-Marie planner in July 2009, in response to weak North American lumber market conditions.
In January 2008,April 2009, we announced that Domtar Inc. and Conifex Inc. agreedwe would idle our Ear Falls sawmill for approximately seven weeks, effective April 10, 2009, in response to terminate the agreement entered into in June 2007 to sell substantially all of our Wood business to Conifex Inc. See Recent Developments, “Agreement for the Sale of Wood Business” above for further details.
In September 2007, we concluded the sale of our 45% investment in Nabakatuk Forest Products Inc. for total proceeds of approximately $4 million. No gain or loss was recorded on the sale.
In the first quarter of 2006, we indefinitely closed our Big River and 51% owned Wapawekka, Saskatchewan sawmills due to the closure of our Prince Albert, Saskatchewan facility and poorweak North American lumber market conditions. These previously idled facilities are currently not in operation. At December 30, 2007, we had not
54
determined whether these facilities will be reopened, sold or closed. In the event that our Big River, SaskatchewanOur Ear Falls sawmill is closed, the Province of Saskatchewan may require active decommissioning and reclamation at the facility, which would likely include investigation and remedial action for areas of significant environmental impact.
In January 2007, due to the difficult market conditions that have prevailed in the wood sector in recent months, including the slowdown of the U.S. housing industry and the new softwood lumber agreement, we announced the indefinite closure of our White River sawmill which became effective prior to the end of the second quarter of 2007. The closure impacted approximately 140 permanent positions and reduced our production capacity by 110 million board feet of lumber.
CONSOLIDATED PRO FORMA RESULTS OF OPERATIONS FOR FIFTY-TWO WEEK PERIOD ENDED DECEMBER 30, 2007 VERSUS FIFTY-THREE WEEK PERIOD ENDED DECEMBER 31, 2006
The following unaudited pro forma information for the years ended December 30, 2007 and December 31, 2006 give effect to the Transaction as if it occurred as of the beginning of the respective fiscal periods. The December 31, 2006 pro forma information was prepared based on the historical financial information of the Predecessor and Domtar Inc. The December 30, 2007 pro forma information was prepared based on our historical financial information for the fifty-two week period ended December 30, 2007 as well as the historical financial information for Domtar Inc. for the period from January 1, 2007 to March 7, 2007. The unaudited pro forma financial information includes adjustments directly attributable to the Transaction.
This unaudited pro forma financial information is for illustrative and informational purposes only and is not necessarily indicative of the results of operations that would have been achieved had the Transaction actually taken place at the dates indicated, and does not purport to be indicative of future operating results.
| Fifty-two weeks ended | Fifty-three weeks ended | ||||||
PRO FORMA FINANCIAL HIGHLIGHTS | December 30, 2007 | December 31, 2006 | |||||
(In millions of U.S. dollars, unless otherwise noted) | |||||||
Sales | $ | 6,520 | $ | 6,750 | |||
Operating income (loss) | 300 | (251 | ) | ||||
Net earnings (loss) | 62 | (550 | ) | ||||
Sales
Pro forma sales amounted to $6,520 million in 2007, a decrease of $230 million, or 3%, from pro forma sales of $6,750 million in 2006. The decrease in sales was mainly attributable to lower shipments for paper and wood products, mostly resulting from the additional week ofrestarted its operations in 2006 and our restructuring efforts undertaken in 2007 including mill and sawmill closures, as well as lower average selling prices for our wood products. These factors were partially offset by higher average selling prices for paper and pulp and higher shipments for pulp.
Operating Income
Pro forma operating income amounted to $300 million in 2007, an increase of $551 million from a pro forma operating loss of $251 million in 2006. The increase in operating income is mostly attributable to the absence in 2007 of a $749 million goodwill impairment charge recorded in the first quarter of 2006 based on an evaluation of goodwill relating to the Papers segment, the realization of savings stemming from restructuring activities, higher average selling prices for pulp and paper, and synergy realizations including lower costs for freight. On a pro forma basis, operating income in 2007 was also positively impacted by an aggregate gain of
55
$51 million related to a lawsuit and insurance claim settlement, as well as gains on financial instruments. These factors were partially offset by a duties refund of approximately $210 million recordedAugust 2009, but has been indefinitely idled again in the fourth quarter of 2006 ($65 million recorded by2009.
In December 2008, we announced the Predecessor and $145 million recorded by Domtar Inc.), an aggregate $96 million charge for the impairment of goodwill and property, plant and equipment recorded in the fourth quarter of 2007 associated with the reorganizationpermanent closure of our Dryden paper millLebel-sur-Quévillon sawmill, which had been indefinitely idled since 2006 and at that time employed approximately 140 employees.
In July 2008, we completed a transaction, for total consideration of $12 million, to acquire full ownership of Gogama Forest Products Inc. (“Gogama”), located in Ostrom, Ontario. We had been operating the goodwill impairmentfacility as a 50% owned investment since 2003. The facility currently employs approximately 45 employees and has an annual lumber production capacity of 65 MFBM. This transaction did not have a significant impact on our Wood business,financial results.
We intend to continue to seek opportunities to maximize the negative impactvalue of a stronger Canadian dollar, higher costs for fiber and chemicals, and transaction, integration and optimization costs.these assets as well as pursue initiatives to improve their operational efficiency.
53
STOCK-BASED COMPENSATION EXPENSE
Prior to the consummation of the Transaction, employees of Weyerhaeuser who were being transferred to the Company were given the opportunity to exchange their outstanding Weyerhaeuser equity awards for awards of the Company having the same terms and conditions as their prior Weyerhaeuser awards. We have adopted three plans to provide for the grant of our equity awards in exchange for the prior plan awards. The Restricted Share Units (“RSU”), Stock Appreciation Rights (“SAR”) and Stock Options mirror the three Weyerhaeuser plans under which the prior plan awards were initially granted.
In connection with the Transaction, Domtar Corporation also exchanged outstanding options held by Domtar Inc. employees for options to purchase, on the same terms and conditions, shares of common stock of Domtar Corporation. The number of shares subject to the options granted in exchange was equal to the number of common shares of Domtar Inc. that would have been received or a number of shares of Domtar Corporation common stock that would provide the equivalent value to the Domtar Inc. common shares determined using the Black-Scholes option-pricing model, depending on if the exercise price was higher, equal to or less than the market value at the time of the exchange. Further, each outstanding award of restricted Domtar Inc. common shares and deferred share units was exchanged on a one-for-one basis, and on the same terms and conditions as applied to Domtar Inc. awards, for awards of restricted shares and deferred share units with respect to the Company’s common stock.
In June 2007,April 2009, a number of new equity awards were granted, consisting of performance conditioned restricted stock units, restricteddeferred stock units, non-qualified stock options and non-qualifiedperformance stock options, which are subject to a variety of service, performance and market conditions. As of December 30, 2007, one market condition for the first measurement period was achieved for the performance conditioned restricted stock units. No other performance condition was achieved.
For the year ended December 30, 2007,31, 2009, compensation expense recognized in our results of operations was approximately $15$27 million, for all of the outstanding awards.awards, compared to $16 million in 2008. Compensation costcosts not yet recognized amounted to approximately $29$21 million in 2009 (2008—$11 million), and will be recognized over the remaining service period. Compensation costs for performance awards are based on management’s best estimate of the final performance measurement.
LIQUIDITY AND CAPITAL RESOURCES
Our principal cash requirements are for ongoing operating cost,costs including pension contributions, working capital and capital expenditures, as well as principal and interest payments on our debt. We expect to fund our liquidity needs primarily with internally generated funds from our operations and, to the extent necessary, through borrowings under our revolving credit facility. We also have the ability to fundOur liquidity requirements through new financing, subject to satisfactorycan be satisfied by drawing upon our contractually committed revolving credit facility, of which $691 million is currently undrawn and available. Under extreme market conditions, and credit ratings.there can be no assurance that this agreement would be available or sufficient. See “Capital Resources” below.
Our ability to make payments on and to refinance our indebtedness, including debt we have incurred under the Credit Agreement and newoutstanding Domtar Corporation notes, and to fundfor ongoing operating costs including pension contributions, working capital and capital expenditures, debt serviceas well as principal and investmentsinterest payments on our debt, will depend on our ability to generate cash in the future, which is subject to general economic, financial, competitive, legislative, regulatory and other factors that are beyond our control. The terms of the debt we incurred under theOur Credit Agreement and thedebt indentures, as well as terms of any future indebtedness, impose, or may impose, various
restrictions and covenants on us that could limit our ability to respond to market conditions, to provide for unanticipated capital investments or to take advantage of business opportunities.
56
Operating Activities
Cash flows provided from operating activities totaled $606$792 million in 2007,2009, a $249$595 million increase compared to cash flows provided from operating activities of $357$197 million in 2006 in part due to the acquisition of Domtar Inc.2008. This increase in cash flows generatedprovided from operations reflects improved earnings as well asoperating activities reflected a decrease in requirements for working capital and other items. The decrease in partrequirements for working capital in 2009 when compared to 2008 is primarily due to the acquisitioninventory reduction (which was impacted in 2009 by a significant decrease in pulp inventory as well as a decrease in our paper inventory). Also, cash flow increased due to a decrease in employer pension and other post-retirement expense and contribution of Domtar Inc., partially$80 million in 2009 when compared to 2008. These factors were offset by pension contributions madean increase in excessincome and other taxes receivable, including $381 million of pension expensereceivables related to alternative fuel tax credits as well as an increase in receivables, including the use of $71 million.$90 million of cash related to a reduction in the securitization of trade receivables.
Our operating cash flow requirements are primarily for salaries and benefits, the purchase of fiber, energy and raw materials and other expenses such as property taxes.
Investing Activities
Cash flows provided from investing activities in 2007 amounted to $485 million. Excluding acquired cash of $573 million in 2007, cash flows used for investing activities was $88in 2009 amounted to $85 million, a $55 million decrease compared to cash flows used for investing activities of $63$140 million in 2006. The $25 million increase2008. This decrease in cash flowflows used for investing activities when excluding cash acquired, is primarily related to higherlower capital spending in part due2009 when compared to the acquisition of Domtar Inc.,2008, partially offset by thelower proceeds from our disposal of properties, plantscertain property, plant and equipment. equipment and sale of trademarks. In 2008, we also acquired the full ownership of Gogama Forest Products Inc.
54
We intend to limit our annual capital expenditures to below 60%50% of depreciation.annual depreciation expense in 2010.
Financing Activities
Cash flows used for financing activities totaled $1,025$414 million in 20072009 compared to cash flows used for financing activities of $294$109 million in 2006.2008. This $731$305 million increase in cash flows used for financing activities is mainly attributable to the distribution to Weyerhaeuser of $1,431 million upon the acquisition of Domtar Inc., and the repurchase of our Canadian debentures as well as the costs incurred as a result$400 million par value of the debt exchange undertaken7.875% Notes due 2011 and $38 million par value of the 5.375% Notes due 2013 in 2007. These factors were partially offset by net borrowings underthe second and third quarter of 2009, repayment of $270 million of our new Credit Agreement of $643 million (consisting of an $800 million Termtranche B term loan B facility less repayments) plus an additional $50 millionand repayment of borrowings under the revolving credit facility used in the third and fourth quarters of 2009. This was partially offset by the issuance of long-term debt exchange.of $385 million in the second quarter of 2009. This compares to additional borrowings of $10 million under our revolving credit facility and repayments of $95 million of our long-term debt in 2008.
Capital Resources
Net indebtedness, was $2,222 million at December 30, 2007, calculated asconsisting of bank indebtedness plusand long-term debt, net of cash and cash equivalents, compared to $43was $1,431 million at December 31, 2006.2009, compared to $2,155 million at December 31, 2008. The $2,179$724 million increasedecrease in net indebtedness is primarily due to a higher cash level, as well as the outstanding indebtednessrepurchase of Domtar Inc. at the time$400 million par value of the Transaction (exchanged for Domtar Corporation debt7.875% Notes due 2011 and $38 million par value of the 5.375% Notes due 2013 in the fourth quarter)second quarter of 2009, repayment of $270 million of our tranche B term loan and repayment of borrowings under ourthe revolving credit agreement entered intofacility in connection with the Transaction.third and fourth quarters of 2009, partially offset by the issuance of long-term debt of $385 million in the second quarter of 2009.
In connection with the Transaction, the Company, Domtar Paper Company, LLC and Domtar Inc. entered into a newOur Credit Agreement which consistedconsists of an $800a $336 million senior secured tranche B term loan facility(remaining outstanding balance at December 31, 2009) and a $750 million senior secured revolving credit facility. In connection with the closing of the Transaction, the Company borrowed $800 million under the tranche B term loan facility, which has subsequently been reduced to $643 million. The revolving credit facility may be used by the Company, Domtar Paper Company, LLC and Domtar Inc. for working capital needs and for general corporate purposes and a portion is available for letters of credit. Borrowings by the U.S. BorrowersCompany and Domtar Paper Company, LLC under the revolving credit facility will be madeare available in U.S. dollars, and borrowings by Domtar Inc. under the revolving credit facility will be madeare available in U.S. dollars and/or Canadian dollars and are limited to $150 million (or the Canadian dollar equivalent thereof).
The tranche B term loan facility matures on March 7, 2014, and the revolving credit facility matures on March 7, 2012. The tranche B term loan facility amortizes in nominal quarterly installments (equal to one percent of the aggregate initial principal amount thereof per annum) with the balance due on the maturity date. In addition, under certain conditions and to the extent we generate cash flow in excess of cash flow used for operating and capital requirements and repayments of debt, excluding optional repayments of the term loan, we are obligated to apply a portion of such calculated excess cash flow amount towards repayments of the term loan, which amount would include any repayments of the term loan already made.
Amounts drawn under the tranche B term loan facility bear annual interest at either a Eurodollar rate plus a margin of 1.375%, or an alternate base rate plus a margin of 0.375%. Amounts drawn under the revolving credit facility bear annual interest at either a Eurodollar rate plus a margin of between 1.25% and 2.25%, or an alternate base rate plus a margin of between 0.25% and 1.25%. Amounts drawn under the revolving credit facility by
57
Domtar Inc. in U.S. dollars bear annual interest at either a Eurodollar rate plus a margin of between 1.25% and 2.25%, or a U.S. base rate plus a margin of between 0.25% and 1.25%. Amounts drawn under the revolving credit facility by Domtar Inc. in Canadian dollars bear annual interest at the Canadian prime rate plus a margin of between 0.25% and 1.25%. Domtar Inc. may also issue bankers’ acceptances denominated in Canadian dollars which are subject to an acceptance fee, payable on the date of acceptance, which is calculated at a rate per annum equal to between 1.25% and 2.25%. The interest rate margins and the acceptance fee, in each case, with respect to the revolving credit facility, are subject to change based on the Company’s consolidated leverage ratio.
The Credit Agreement contains a number of covenants that, among other things, limit the ability of the Company and its subsidiaries to make capital expenditures and place restrictions on other matters customarily
55
restricted in senior secured credit facilities, including restrictions on indebtedness (including guarantee obligations), liens (including sale and leasebacks), fundamental changes, sales or disposition of property or assets, investments (including loans, advances, guarantees and acquisitions), transactions with affiliates, hedge agreements, dividends and other payments in respect of capital stock, changes in fiscal periods, environmental activity, optional payments and modifications of other material debt instruments, negative pledges and agreements restricting subsidiary distributions and changes in lines of business. For soAs long as the revolving credit commitments are outstanding, we are required to comply with a consolidated EBITDA (as defined under the Credit Agreement) to consolidated cash interest coverage ratio of greater than 2.50x2.5x and a consolidated debt to consolidated EBITDA (as defined under the Credit Agreement) ratio of less than 4.75x, decreasing to 4.5 on December 31, 2008.4.5x. The Credit Agreement contains customary events of default, provided that non-compliance with the consolidated cash interest coverage ratio or consolidated leverage ratio will not constitute an event of default under the tranche B term loan facility unless it has not been waived by the revolving credit lenders within a period of 45 days after notice. At December 31, 2009, we were in compliance with our covenants.
A significant or prolonged downturn in general business and economic conditions may affect our ability to comply with our covenants or meet those financial ratios and tests and could require us to take action to reduce our debt or to act in a manner contrary to our current business objectives.
A breach of any of our Credit Agreement or indenture covenants or failure to maintain a required ratio or meet a required test may result in an event of default under those agreements. This may allow the counterparties to those agreements to declare all amounts outstanding thereunder, together with accrued interest, to be immediately due and payable. If this occurs, we may not be able to refinance the indebtedness on favorable terms, or at all, or repay the accelerated indebtedness.
The Company’s direct and indirect, existing and future, U.S. wholly-owned100% owned subsidiaries serve as guarantors of the senior secured credit facilities for any obligations there underthereunder of the U.S. borrowers, subject to certain agreed exceptions. The Company and its subsidiaries serve as guarantors of Domtar Inc.’s obligations as a borrower under the senior secured credit facilities, subject to agreed exceptions. Domtar Inc. does not guarantee Domtar Corporation’s obligations under the Credit Agreement.
The obligations In 2008, we amended the credit facility in order to allow for the early repurchase of the Company7.875% Notes.
Our obligations in respect to the senior secured credit facilities are secured by all of the equity interests of the Company’s direct and indirect U.S. subsidiaries, andother than 65% of the equity interests of the Company’s direct and indirect “first-tier” foreign subsidiaries, subject to agreed exceptions, and a perfected first priority security interest in substantially all of the Company’s and its direct and indirect U.S. subsidiaries’ tangible and intangible assets. The obligations of Domtar Inc., and the obligations of the non-U.S. guarantors, in respect of the senior secured credit facilities are secured by all of the equity interests of the Company’s direct and indirect subsidiaries, subject to agreed exceptions, and a perfected first priority security interest, lien and hypothec in the inventory of Domtar Inc., its immediate parent, and its direct and indirect subsidiaries.
ThereAs of December 31, 2009, there was $50$6 million drawnoutstanding as overdraft recorded in Bank indebtedness under our revolving credit facility (2008—$60 million outstanding and no borrowings outstandingrecorded in the form of overdraft.Long-term debt). In addition, at December 30, 2007,31, 2009, we had outstanding letters of credit pursuantamounting to $53 million under this bank credit for an amount of $46 million.facility (2008—$43 million). We also have no other outstanding letters of credit for an amount of $2 million.(2008—$2 million).
During November 2007, certain of Domtar Inc.’s bondholders elected to exchange their Domtar Inc. bonds for Domtar Corporation bonds with the same maturity and interest rate pursuant to an exchange offer. The amounts exchanged were $599 million of 7.875% Notes due 2011 (99.96% of the outstanding principal amount), $348 million of 5.375% Notes due 2013 (99.55% of the outstanding principal amount), $399 million of 7.125 % Notes due 2015 (99.93% of the outstanding principal amount), and $124 million of 9.5% Notes due 2016 (99.30% of the outstanding principal amount). During December 2007, CDN$80 million of the 10% Debentures due 2011 (97.32% of the outstanding principal amount) and CDN$74 million of the 10.85% Debentures due 2017 (99.33% of the outstanding principal amount) were purchased and cancelled by Domtar Inc. pursuant to a tender offer. Also, during December 2007, Domtar Inc. redeemed its Series A and Series B preferred shares.
58
Credit Rating
RATING AGENCY | SECURITY | RATING | ||
Moody’s Investors Services | Secured Credit | |||
| Unsecured debt obligations | ||||
Standard & Poor’s | Secured Credit | |||
| Unsecured debt obligations | ||||
56
The ratings by Moody’s Investors Services (“Moody’s”) are the fifthfourth and sixthfifth best ratings in terms of quality within nine rating gradations, with the numerical modifier 13 indicating a ranking at the toplow end of a rating category. According to Moody’s, a rating of Baa has moderate credit risk with certain speculative characteristics and the rating of Ba has speculative elements and a rating of B is considered speculative.subject to substantial credit risk. The ratings by Standard & Poor’s (“S&P”) are the fifthfourth and sixthfifth best ratings in terms of quality within ten rating gradations, with the “plus”“minus” indicating a ranking at the higherlower end of this category. According to S&P, ratings of BBBBB have adequate protection parameters and Bratings of BB have significant speculative characteristics.
Both agencies Moody’s have a “stable” outlook inwith respect to these ratings. Any reductionsit ratings and S&P have a “positive” outlook with respect to its rating.
A reduction in our credit ratings would have a negative impact on our access to and cost of capital and financial flexibility. The above ratings are not a recommendation to buy, sell or hold securities and may be subject to revision or withdrawal at any time by the above rating agencies.
Domtar Canada Paper Inc. Exchangeable Shares
Upon the consummation of the Transaction, Domtar Inc. shareholders had the option to receive either common stock of the Company or shares of Domtar (Canada) Paper Inc. that are exchangeable for common stock of the Company. As of December 30, 2007, we had 44,252,83131, 2009, there were 982,321 exchangeable shares issued and outstanding. The exchangeable shares of Domtar (Canada) Paper Inc. are intended to be substantially the economical equivalent to shares of the Company’s common stock. These shareholders may exchange the exchangeable shares for shares of Domtar Corporation common stock on a one-for-one basis at any time. The exchangeable shares may be redeemed by Domtar (Canada) Paper Inc. on a redemption date to be set by the Board of Directors, which cannot be prior to July 31, 2023, or upon the occurrence of certain specified events.events, including, upon at least 60 days prior written notice to the holders, in the event less than 416,667 exchangeable shares (excluding any exchangeable shares held directly or indirectly by us) are outstanding at any time.
On May 29, 2009, our Board of Directors authorized the implementation of a reverse stock split at a 1-for-12 ratio of our outstanding shares. The Board of Directors of Domtar (Canada) Paper Inc. authorized the implementation of a comparable 1-for-12 split of the outstanding exchangeable shares. Shareholder approval for the reverse stock split was obtained at the Company’s Annual General Meeting held on May 29, 2009 and the reverse stock split became effective June 10, 2009 at 6:01p.m. (ET). At the effective time, every 12 exchangeable shares that were issued and outstanding were automatically combined into one issued and outstanding exchangeable share.
OFF BALANCE SHEET ARRANGEMENTS
In the normal course of business, we finance certain of our activities off balance sheet through leases and securitization.
Leases
On an ongoing basis, we enter into operating leases for property, plant and equipment. Minimum future rental payments under these operating leases, determined at December 30, 2007, amounted to $87 million.
Receivables Securitization
We sell certain of our trade receivables through a securitization program, which expires in February 2011. We use securitization of our receivables as a source of financing by reducing our working capital requirements. This securitization program consists of the sale of U.S. and Canadian dollar receivables or the sale ofto a bankruptcy remote entity which, in turn, transfers a senior beneficial interest in them to a special purpose trustentity managed by a financial institution for multiple sellers of receivables. The agreement governing our receivables securitization program normally allows the daily sale of new receivables to replace those that have been collected. ItThe agreement also limits the cash that can be received from the saletransfer of the senior beneficial interest to a maximum of $150 million.interest. The subordinated interest retained by uswe retain is included in “Receivables”Receivables on the consolidated balance sheetConsolidated Balance Sheet and will be collected only after the senior beneficial interest has been settled. The book value of the retained subordinated interest approximates fair value.
We retain responsibility for servicing the receivables sold but do not record a servicing asset or liability as the fees received for this service approximate the fair value of the services rendered.
59
57
In June 2009, we amended the agreement governing our receivables securitization program to include additional receivable pools. The amended agreement expires in October 2010. The maximum cash consideration that can be received from the sale of receivables under the amended agreement is $150 million. The accounting treatment with respect to the transfers of such receivables pursuant to the Transfers and Servicing Topic of FASB ASC has remained unchanged under the amended agreement.
As of December 30, 2007,31, 2009, the senior beneficial interest in receivables held by third parties was $130 million.$20 million (2008—$110 million). We expect to continue selling receivables on an ongoing basis, given the attractive discount rates.basis. Should this program be discontinued either by management’s decision or due to termination of the program by the provider, although not anticipated at this time, our working capital and bank debt requirements will increase.
Indemnifications
In the normal course of business, we offer indemnifications relating to the sale of our businesses and real estate. In general, these indemnifications may relate to claims from past business operations, the failure to abide by covenants and the breach of representations and warranties included in sales agreements. Typically, such representations and warranties relate to taxation, environmental, product and employee matters. The terms of these indemnification agreements are generally for an unlimited period of time. At December 30, 2007,31, 2009, we are unable to estimate the potential maximum liabilities for these types of indemnification guarantees as the amounts are contingent upon the outcome of future events, the nature and likelihood of which cannot be reasonably estimated at this time. Accordingly, no provisions have been recorded. These indemnifications have not yielded significant expenses in the past.
Tax Sharing Agreement
In conjunction with the Transaction, we signed a Tax Sharing Agreement that governs both our and Weyerhaeuser’sWeyerhaeuser rights and obligations after the Transaction with respect to taxes for both pre and post-Distribution periods in regards to ordinary course taxes, and also covers related administrative matters. The Distribution refers to the distribution of our common stockshares of the Company to Weyerhaeuser shareholders.
We will generally be required to indemnify Weyerhaeuser and itsWeyerhaeuser shareholders against any tax resulting from the Distribution if that tax results from an act or omission to act by us after the Distribution. However, ifIf Weyerhaeuser, however, should recognize a gain on the Distribution for reasons not related to an act or omission to act by usthe Company after the Distribution, Weyerhaeuser would be responsible for such taxes and would not be entitled to indemnification by us under the Tax Sharing Agreement. In addition, to preserve the tax-free treatment of the Distribution to Weyerhaeuser, the following actions will be subject to restrictions for a two-year period following the date of the Distribution:
redemption, recapitalization, repurchase or acquisition of our own capital stock;
issuance of capital stock or convertible debt;
liquidation of Domtar Corporation;
discontinuance of the operations of the Weyerhaeuser Fine Paper Business;
sale or disposition (other than in the ordinary course of business) of all or a substantial part of the Weyerhaeuser Fine Paper Business; or
other actions, omissions to act or transactions that could jeopardize the tax-free status of the Distribution.
Pension plansPlans
We have indemnified and held harmless the trustees of our pension funds, and the respective officers, directors, employees and agents of such trustees, from any and all costs and expenses arising out of the performance of their obligations under the relevant trust agreements, including in respect of their reliance on authorized instructions from us or for failing to act in the absence of authorized instructions. These indemnifications survive the termination of such agreements. At December 30, 2007,31, 2009, we had not recorded a liability associated with these indemnifications, as we do not expect to make any payments pertaining to these indemnifications.
60
E.B. Eddy Acquisition
OnIn July 31, 1998, Domtar Inc. acquired all of the issued and outstanding shares of E.B. Eddy Limited and E.B. Eddy Paper, Inc. (E.B. Eddy), an integrated producer of specialty paper and wood products. The purchase agreement relating to this agreement includes a purchase price adjustment whereby, in the event of the acquisition by a third partythird-party of more than 50% of the shares of Domtar Inc. in specified circumstances, Domtar Inc. may have hadbe required to pay an increase in consideration of up to a maximum of $115 million
58
(CDN$120 million (approximately $121 million), an amount which is gradually declining over a 25-year period. At March 7, 2007, the closing date of the Transaction, the maximum amount of the purchase price adjustment was CDN$110$105 million (approximately $111(CDN$110 million). No provision was recorded for this potential purchase price adjustment.
On March 14, 2007, we received a letter from George Weston Limited (the previous owner of E.B. Eddy and a party to the purchase agreement) demanding payment of CDN$110$105 million (approximately $111(CDN$110 million) as a result of the consummation of the Transaction. On June 12, 2007, an action was commenced by George Weston Limited against Domtar Inc. in the Superior Court of Justice of the Province of Ontario, Canada, claiming that the consummation of the Transaction triggered the purchase price adjustment and seekingsought a purchase price adjustment of CDN$110$105 million (approximately $111(CDN$110 million) as well as additional compensatory damages. We do not believe that the consummation of the Transaction triggers an obligation to pay an increase in consideration under the purchase price adjustment and intend to defend ourselves vigorously against any claims with respect thereto. However, we may not be successful in our defense of such claims, and if we are ultimately required to pay an increase in consideration, such payment may have a material adverse effect on our liquidity,financial position, results of operations and financial condition.or cash flows.
CONTRACTUAL OBLIGATIONS AND COMMERCIAL COMMITMENTS
In the normal course of business, we enter into certain contractual obligations and commercial commitments. The following tables provide our obligations and commitments at December 30, 2007:31, 2009:
CONTRACTUAL OBLIGATIONS
CONTRACT TYPE | 2008 | 2009 | 2010 | 2011 | 2012 | THEREAFTER | TOTAL | 2010 | 2011 | 2012 | 2013 | 2014 | THEREAFTER | TOTAL | ||||||||||||||||||||||||||||
Debentures and notes | $ | 12 | $ | 10 | $ | 8 | $ | 610 | $ | 58 | $ | 1,479 | $ | 2,177 | ||||||||||||||||||||||||||||
| (in million of dollars) | ||||||||||||||||||||||||||||||||||||||||||
Notes | $ | 8 | $ | 143 | $ | 8 | $ | 320 | $ | 304 | $ | 925 | $ | 1,708 | ||||||||||||||||||||||||||||
Capital leases | 8 | 7 | 6 | 4 | 4 | 26 | 55 | 3 | 4 | 4 | 3 | 3 | 18 | 35 | ||||||||||||||||||||||||||||
Long-term debt | 20 | 17 | 14 | 614 | 62 | 1,505 | 2,232 | 11 | 147 | 12 | 323 | 307 | 943 | 1,743 | ||||||||||||||||||||||||||||
Operating leases | 30 | 20 | 13 | 7 | 5 | 1 | 76 | |||||||||||||||||||||||||||||||||||
Liabilities related to uncertain tax benefits(1) | — | — | — | — | — | — | 40 | — | — | — | — | — | — | 226 | ||||||||||||||||||||||||||||
Operating leases | 29 | 22 | 16 | 9 | 5 | 6 | 87 | |||||||||||||||||||||||||||||||||||
Total obligations | $ | 49 | $ | 39 | $ | 30 | $ | 623 | $ | 67 | $ | 1,511 | $ | 2,359 | $ | 41 | $ | 167 | $ | 25 | $ | 330 | $ | 312 | $ | 944 | $ | 2,045 | ||||||||||||||
COMMERCIAL OBLIGATIONS
COMMITMENT TYPE | 2008 | 2009 | 2010 | 2011 | 2012 | THEREAFTER | TOTAL | 2010 | 2011 | 2012 | 2013 | 2014 | THEREAFTER | TOTAL | |||||||||||||||||||||||||||
| (in million of dollars) | |||||||||||||||||||||||||||||||||||||||||
Other commercial commitments(2) | $ | 97 | $ | 26 | $ | 9 | $ | 7 | $ | 5 | — | $ | 144 | $ | 117 | $ | 20 | $ | 12 | $ | 2 | $ | 2 | $ | 1 | $ | 154 | ||||||||||||||
| (1) | We have recognized total liabilities related to uncertain tax benefits of |
| (2) | Includes commitments to purchase property, plant and equipment, roundwood, wood chips, gas |
In addition, we expect to contribute a total amountminimum of $72$40 million to the pension plans in 2008.2010.
For 20082010 and the foreseeable future, we expect cash flows from operations and from our various sources of financing to be sufficient to meet our contractual obligations and commercial commitments.
6159
RECENT ACCOUNTING PRONOUNCEMENTS
Accounting for Planned Major MaintenanceChange Implemented in 2009
FASB Accounting Standards Codification
In September 2006,July 2009, the Financial Accounting Standards Board (“FASB”) issued FASB Staff Position AUG AIR-1, “Accounting for Planned Major Maintenance Activities.” This Staff Position prohibitsAccounting Standards Codification (“ASC”) became the usesingle source of authoritative GAAP in the United States. The previous GAAP hierarchy consisted of four levels of authoritative accounting and reporting guidance, including original pronouncements of the previously acceptable accrue-in-advance methodFASB, Emerging Issues Task Force (“EITF”) abstracts, and other accounting literature (together, “previous GAAP”). The Codification eliminated this hierarchy and replaced previous GAAP (other than rules and interpretive releases of the SEC), as used by all nongovernmental entities, with just two levels of literature; namely, authoritative and nonauthoritative.
The FASB has indicated that the ASC does not change previous GAAP, instead, the changes aim to reduce the time and effort it takes for users to research accounting questions and improve the usability of accounting standards by reorganizing them into a topical format, where each topic is subdivided into a number of levels that aggregate all elements of literature related to this topic.
For reporting purposes, the FASB ASC has become effective for planned major maintenance activities in annual and interim financial reporting periods. The three accounting methods permitted under the Staff Position are: 1) direct expensing method, 2) built-in overhaul method and 3) deferral method. On January 1, 2007, we adopted retroactively the direct expense method with restatement of prior interim periods. We previously used the accrue-in-advance methodstatements issued for interim periods. The adoption of this Staff Position hadand annual periods ended after September 15, 2009. We adopted the FASB ASC in our September 30, 2009 consolidated financial statements with no significant impact on our annual consolidated financial statements.impact.
Uncertainty in Income TaxesFair Value Measurements
In June 2006,We adopted the FASB issued Interpretation No. 48, “Accounting for Uncertainty in Income Taxes—An Interpretationguidance of Fair Value Measurements and Disclosures Topic of FASB Statement No. 109” (“FIN 48”). This interpretation, that we adopted on January 1, 2007, clarifiesASC, concerning the accounting for uncertain tax positions recognized in a company’s financial statements in accordance with Statement 109. FIN 48 prescribes a more likely than not recognition thresholdfair value measurements and measurement attribute for the financial statement recognition and measurementdisclosures of a tax position taken or expected to be taken in a tax return. FIN 48 also provides guidance on derecognition, classification of a liability for unrecognized tax benefits, accounting for interest and penalties, accounting in interim periods, and expanded income tax disclosures. The adoption of this Interpretation had no significant impact on our consolidated financial statements.
Fair Value Option
In February 2007, the FASB issued Statement No. 159, “The Fair Value Option for Financial Assets and Financial Liabilities” (“SFAS 159”). SFAS 159 permits an entity to measure certain financial assets and financial liabilities in the first quarter of 2008. The FASB deferred the effective date of this guidance for one year as it applies to nonfinancial assets and nonfinancial liabilities that are not recognized or disclosed at fair value. Under SFAS 159, entities that electvalue on a recurring basis. We adopted the deferred guidance in the first quarter of 2009. This guidance provides a common definition of fair value, option will report unrealized gains and losses in earnings at each subsequent reporting date. The fair value option may be elected on an instrument-by-instrument basis, with few exceptions, as long as it is applied to the instrument in its entirety. We have decided not to adopt the fair value option for any of our existing financial instruments.
Fair Value Measurements
In September 2006, the FASB issued Statement No. 157, “Fair Value Measurements” (“SFAS 157”). SFAS 157 establishes a framework for measuring fair value, in GAAP and expands disclosures about fair value. The guidance applies when other accounting standards require or permit fair value measurements but does not require any new fair value measurements.
In April 2009, the FASB issued a modification of the Fair Value Measurements and Disclosures Topic of FASB ASC concerning the determination of fair value when the volume and level of activity for the asset or liability have significantly decreased and for identifying transactions that are not orderly. This modification emphasizes that even if there has been a significant decrease in the volume and level of activity for the asset or liability and regardless of the valuation technique(s) used, the objective of a fair value measurement remains the same. Fair value is the price that would be received to sell an asset or paid to transfer a liability in an orderly transaction (that is, not a forced liquidation or distressed sale) between market participants at the measurement date under current market conditions. The modification also provides guidance on identifying transactions that are not orderly by assessing certain factors among which are: an adequate marketing period for the asset or liability, whether the seller is in a distressed state and whether the transaction price is an outlier compared with recent transactions. The modification amends the disclosure provisions required by the Fair Value Measurements and Disclosures Topic of FASB ASC to require entities to disclose in interim and annual periods the inputs and valuation technique(s) used to measure fair value.
These modifications are effective for interim and annual periods ending after June 15, 2009, and have consequently been adopted by us starting from our June 30, 2009 consolidated financial statements. Since we did not hold any assets or liabilities that are within the scope of these modifications, for which the volume and level of activity have significantly decreased, the measurement requirements outlined were of no impact on our fair value measurements. SFAS 157However, our defined benefit pension plans hold investments in asset backed commercial paper for which there is no active liquid market. See Item 8, Financial Statements and Supplementary Data, Note 7, of this Annual Report on Form 10-K.
60
Faire Value Disclosures for Interim Periods
In April 2009, the FASB issued a modification of the Fair Value Measurements and Disclosures Topic of FASB ASC concerning the interim disclosures about fair value of financial instruments, to require interim-period disclosures about fair value of financial instruments that were previously made on an annual basis only.
This modification is effective for interim and annual periods ending after June 15, 2009, with early adoption permitted. We adopted the disclosure requirements in our June 30, 2009 consolidated financial statements with no significant impact.
Measuring Liabilities at Fair Value
In August 2009, the FASB issued a modification of the Fair Value Measurements and Disclosures Topic of FASB ASC concerning the measurement of liabilities at fair value when there is a lack of observable market information. This modification provides clarification of the valuation techniques that are required in circumstances in which a quoted price in an active market for the identical liability is not available. The modification of the valuation techniques had no impact on our fair value measurements. This modification is effective for the first reporting period (including interim periods) beginning after issuance. We adopted the modification in our September 30, 2009 consolidated financial statements with no significant impact.
Pension Plan Assets
In December 2008, the FASB issued Employers’ Disclosures about Post-retirement Benefit Plan Assets (now included in Compensation—Retirement Benefits Topic of FASB ASC), providing guidance on an employer’s disclosures about plan assets of a defined benefit pension or other post-retirement plan to include:
qualitative disclosures about investments policies and strategies;
disclosures about the major categories of plan assets;
disclosures about fair value measurements of plan assets; and
disclosures about significant concentrations of risk.
This modification is effective for annual periods ending after December 15, 2009, with no obligation to present the same disclosures for earlier periods that are presented for comparative purposes and early adoption is permitted. We adopted the disclosure requirements in our December 31, 2009 consolidated financial statements with no significant impact.
Management’s Assessment of Subsequent Events
In May 2009, the FASB issued Subsequent Events that provides guidance on management’s assessment of subsequent events. Historically, management had relied on U.S. auditing literature for guidance on assessing and disclosing subsequent events. The topic represents the inclusion of guidance on subsequent events in the accounting literature and is directed specifically to management, since management is responsible for preparing an entity’s consolidated financial statements.
This new topic does not significantly change practice because its guidance is similar to that in existing U.S. auditing literature on subsequent events, although with some important modifications. The new topic clarifies that management must evaluate, as of each reporting period, events or transactions that occur after the balance sheet date “through the date that the financial statements are issued or are available to be issued.” Management must perform its assessment for both interim and annual financial reporting periods.
This topic is effective prospectively for interim or annual periods ending after June 15, 2009. We applied the requirements of this topic in the preparation of our consolidated financial statements beginning June 30, 2009 with no significant impact.
61
Equity
In January 2010, the FASB issued Accounting for Distributions to Shareholders with Components of Stock and Cash, which clarifies that the stock portion of a distribution to shareholders that allows them to elect to receive cash or stock with a potential limitation on the total amount of cash that all shareholders can elect to receive in the aggregate is considered a share issuance that is reflected in earnings per share prospectively and not a stock dividend for purposes of applying Equity and Earnings Per Share Topics of FASB ASC.
The amendments in this Update are effective for interim and annual periods ending on or after December 15, 2009, and will not impact us unless we decide to proceed with a distribution to shareholders with components of stock and cash.
Business Combinations
We adopted the guidance of Business Combination Topic of FASB ASC, in the first quarter of 2009. The application of this guidance had no impact on our financial position, results of operations or cash flows as there was expectedno business acquisition during the year. The guidance may materially change the accounting for future business combinations.
Derivative Instruments and Hedging Activities
We adopted during the first quarter of 2009, the guidance of Derivatives and Hedging Topic of FASB ASC, concerning the quarterly disclosure requirements of an entity’s derivative instruments and hedging activities without any significant impact.
Intangible Assets
We adopted during the first quarter of 2009, the guidance of Intangibles—Goodwill and Other Topic of FASB ASC, concerning the factors that should be considered in developing renewal or extensions assumptions used to determine the useful life of a recognized intangible asset and the additional disclosure requirements related to recognized intangible assets. The initial adoption of this accounting guidance had no impact on our financial position, results of operations or cash flows.
Future Accounting Changes
Transfers of Financial Assets
In June 2009, the FASB issued Accounting for Transfers of Financial Assets, which amends the derecognition guidance required by the Transfers and Servicing Topic of FASB ASC. Some of the major changes undertaken by this amendment include:
Eliminating the concept of a Qualified Special Purpose Entity (“QSPE”) since the FASB believes, on the basis of recent experience, that many entities that have been accounted for as QSPEs are not truly passive, a belief that challenges the premise on which the QSPE exception was based.
Modifying the derecognition provisions as required by the Transfers and Servicing Topic of FASB ASC. Specifically aimed to:
| o | require that all arrangements made in connection with a transfer of financial assets be considered in the derecognition analysis, |
| o | clarify when a transferred asset is considered legally isolated from the transferor, |
| o | modify the requirements related to a transferee’s ability to freely pledge or exchange transferred financial assets, and |
62
| o | provide guidance on when a portion of a financial asset can be derecognized, thereby restricting the circumstances when sale accounting can be achieved to the following cases: |
transfers of individual or groups of financial assets in their entirety, and
transfers of participating interests.
The new amendment is effective for financial asset transfers occurring after the beginning of an entity’s first fiscal year that begins after November 15, 2009. Although the new amendment will impact the way we account for transfers of financial assets, we do not expect the adoption of this accounting guidance to materially impact our financial position, results of operations or cash flows.
Variable Interest Entities
In June and December 2009, the FASB issued guidance which requires an enterprise to perform an analysis to determine whether the enterprise’s variable interest or interests give it a controlling financial interest in a variable interest entity. This guidance requires ongoing reassessments of whether an enterprise is the primary beneficiary of a variable interest entity, eliminates the quantitative approach previously required for determining the primary beneficiary of a variable interest entity and requires enhanced disclosures that will provide users of financial statements issuedwith more transparent information about an enterprise’s involvement in a variable interest entity. This guidance is effective for fiscal years beginning after November 15, 2007,2009, and for interim and annual reporting periods within those fiscal years. On February 12, 2008, the FASB issued FASB Staff Position No. 157-2, “Effective Datethereafter. The initial adoption of FASB Statement No. 157” (“FSP”) that amends Statement 157this standard is not expected to delay the effective date for all non-financial assets and non-financial liabilities, except those that are recognized or disclosed at fair value in the financial statements on a recurring basis (that is, at least annually). For such items, FSP defers the effective date of Statement 157 to fiscal years beginning after November 15, 2008. We do not expect the adoption will have a significant impact on our financial position or results of operations, however, additional disclosures in our financial statements will be required.
Business Combinations
In December 2007, the FASB issued Statement No. 141 (revised 2007), “Business Combinations” (SFAS No. 141(R)). This Statement replaces SFAS No. 141, “Business Combinations.” SFAS No. 141(R) requires an acquirer to recognize the assets acquired, the liabilities assumed, including those arising from contingent considerations and contractual contingencies based on their fair values as measured on the acquisition date. In addition, SFAS No. 141(R) requires the acquirer to measure the noncontrolling interest in the acquiree at fair value, which will result in recognizing the goodwill attributable to the noncontrolling interest in addition to the
62
goodwill attributable to the acquirer. SFAS No. 141(R) applies prospectively to business combinations for which the acquisition date is on or after the beginning of the first annual reporting period beginning on or after December 15, 2008. Since Statement 141(R) will only be applicable to future business combinations, it will not have a significantmaterial effect on our financial position, results of operations or cash flow prior to such acquisitions.flows.
Noncontrolling InterestsFair Value Disclosures
In December 2007,January 2010, the FASB issued Statement No. 160, “Noncontrolling Interests in Consolidated Financial Statements” (SFAS No. 160). SFAS No. 160 amends Accounting Research Bulletin 51, “Consolidated Financial Statements,” to establish accounting and reporting standards for the noncontrolling interest in a subsidiary and for the deconsolidation of a subsidiary. This Statement clarifies that a noncontrolling interest in a subsidiary is an ownership interest in the consolidated entity that should be reported as equity in the consolidated financial statements. SFAS No. 160 changes the way the consolidated earnings (loss) statement is presented by requiring consolidated net earnings (loss) to be reported including the amounts attributable to both the parent interest and the noncontrolling interest. In addition, the Statement requires disclosure on the faceUpdate of the consolidated statementFair Value Measurements and Disclosures Topic of operations ofFASB ASC requiring new disclosures and amending existing guidance. This Update provides amendments that require new disclosures as follows:
A reporting entity should disclose separately the amounts of consolidated net earnings (loss) attributablesignificant transfers in and out of Level 1 and Level 2 fair value measurements and describe the reasons for transfers;
In the reconciliation for fair value measurements using significant unobservable inputs (Level 3), a reporting entity should present separately information about purchases, sales, issuances, and settlements.
This Update also provides amendments that clarify existing disclosures as follows:
A reporting entity should provide fair value measurements for each class of assets and liabilities;
A reporting entity should provide disclosures about the valuation techniques and inputs used to the parent interestmeasure fair value for both recurring and to the noncontrolling interest. SFAS No. 160 isnonrecurring fair value measurements that fall either in Level 2 or Level 3.
These modifications are effective for fiscalinterim and annual periods and interim periods within those fiscal years, beginning on or after December 15, 2008.2009, except for the disclosures about purchases, sales, issuances, and settlements in the roll forward activity in Level 3 fair value measurements. Those disclosures are effective for interim and annual periods beginning after December 15, 2010. We aredo not expecting the initial adoption of SFAS No. 160anticipate these new disclosure requirements to have a significant effect on our financial position, resultsimpact compared to its present level of operations and cash flows as we have no significant non-controlling interests.disclosures.
The preparation of financial statements in conformity with GAAP requires management to make estimates and assumptions that affect our results of operations and financial position. On an ongoing basis, management
63
reviews its estimates, including those related to environmental matters and other asset retirement obligations, useful lives, impairment of long-lived assets and goodwill, pension plans and other post-retirement benefit plans and income taxes based on currently available information. Actual results could differ from those estimates.
These critical accounting policies reflect matters that contain a significant level of management estimates about future events, reflect the most complex and subjective judgments, and are subject to a fair degree of measurement uncertainty.
Environmental mattersMatters and other asset retirement obligationsOther Asset Retirement Obligations
Environmental expenditures for effluent treatment, air emission, landfill operation and closure, asbestos containment and removal, bark pile management, silvicultural activities and site remediation (together referred to as environmental matters) are expensed or capitalized depending on their future economic benefit. In the normal course of business, we incur certain operating costs for environmental matters that are expensed as incurred. Expenditures for property, plant and equipment that prevent future environmental impacts are capitalized and amortized on a straight-line basis over 10 to 40 years. Provisions for environmental matters are not discounted, except for a portion which are discounted due to more certainty with respect to timing of expenditures, and are recorded when remediation efforts are likelyprobable and can be reasonably determined.estimated.
We recognize asset retirement obligations, at fair value, in the period in which we incur a legal obligation associated with the retirement of an asset. Our asset retirement obligations are principally linked to landfill capping obligations, asbestos removal obligations and demolition of certain abandoned buildings. Conditional asset retirement obligations are recognized, at fair value, when the fair value of the liability can be reasonably estimated.estimated or on a probability weighted discounted cash flow estimate. The associated costs are capitalized as part of the carrying value of the related asset and depreciated over its remaining useful life. The liability is accreted using athe credit adjusted risk-free interest rate.rate used to discount the cash flow.
The estimate of fair value is based on the results of the expected future cash flow approach, in which multiple cash flow scenarios that reflect a range of possible outcomes are considered. We have established cash flow scenarios for each individual asset retirement obligation. Probabilities are applied to each of the cash flow
63
scenarios to arrive at an expected future cash flow. There is no supplemental risk adjustment made to the expected cash flows. The expected cash flow for each of the asset retirement obligations are discounted using the credit adjusted risk-free interest rate for the corresponding period until the settlement date. The rates used vary, based on the prevailing rate at the moment of recognition of the liability and on its settlement period. The rates used vary between 4.5%5.5% and 12.0%.
Cash flow estimates incorporate either assumptions that marketplace participants would use in their estimates of fair value, whenever that information is available without undue cost and effort, or assumptions developed by internal experts.
During the first quarter of 2006, we closed our pulp and paper mill in Prince Albert, Saskatchewan and the Big River sawmill in Prince Albert, Saskatchewan due to poor market conditions. We have not determined at this time whether the facilities will be reopened, sold or permanently closed. In the event the facilities are permanently closed, the Province of Saskatchewan may require active decommissioning and reclamation at one or both facilities. In the event decommissioning and reclamation is required at either facility, the work is likely to include investigation and remedial action for areas of significant environmental impacts.
In 2007,2009, our operating expenses for environmental matters amounted to $85 million.$71 million ($81 million in 2008).
We made capital expenditures for environmental matters of $11$2 million in 2007,2009 ($4 million in 2008) for the improvement of air emissions, effluent treatment and remedial actions to address environmental compliance. At this time, we cannot reasonably estimate the additional capital expenditures that may be required. However, management expects that any additional required expenditure would not have a material adverse effect on the Company’s financial position, earningsresults of operations or cash flows.
We are also a party to various proceedings relating to the cleanup of hazardous waste sites under the Comprehensive Environmental Response Compensation and Liability Act, commonly known as “Superfund,” and similar state laws. The EPA and/or various state agencies have notified us that we may be a potentially responsible party with respect to other hazardous waste sites as to which no proceedings have been instituted
64
against us. We continue to take remedial action under theour Care and Control Program, atas such sites mostly relate to our former wood preserving operating sites, and a number of former operating sites especially in the wood preserving sector, due to possible soil, sediment or groundwater contamination. The investigation and remediation process is lengthy and subject to the uncertainties of changes in legal requirements, technological developments and, if and when applicable, the allocation of liability among potentially responsible parties.
An action was commenced by Seaspan International Ltd. (“Seaspan”) in the Supreme Court of British Columbia, on March 31, 1999 against Domtar Inc. and others with respect to alleged contamination of Seaspan’s site bordering Burrard Inlet in North Vancouver, British Columbia, including contamination of sediments in Burrard Inlet, due to the presence of creosote. As of July 3, 2002, the parties entered into a partial Settlement Agreement which provided that while the agreement is performed in accordance with its terms, the action commenced by Seaspan would be held in abeyance. The Settlement Agreement focused on the sharing of costs between Seaspan and Domtar Inc. for certain remediation of contamination referred to in the plaintiff’s claim. The Settlement Agreement did not address all of the plaintiff’s claims, and such claims cannot be reasonably determined at this time. On June 3, 2008, Domtar was notified by Seaspan that it terminated the Settlement Agreement. The government of British Columbia issued on February 16, 2010 a Remediation Order in order to define and implement an action plan to address soil, sediment and groundwater issues. This Order may be appealed within 30 days from the date of this Order but there is no suspension in the execution of this Order unless the Appeal Board order otherwise. We are currently reviewing our options in this respect. We have recorded an environmental reserve to address estimated exposure.
While we believe that we have determined the costs for environmental matters likely to be incurred, based on known information, our ongoing efforts to identify potential environmental concerns that may be associated with the properties may lead to future environmental investigations. These efforts may result in the determination of additional environmental costs and liabilities, which cannot be reasonably estimated at this time. For example, changes in climate change regulations—see Part I, Item 3, Legal Proceedings, under the caption “Climate change regulation.”
Domtar Inc. was issued a Request for Response Action (“RFRA”) by the Minnesota Pollution Control Agency (“MPCA”) for the clean-up of tar seeps and soils at a former coal tar distillation plant located in Duluth, Minnesota. On March 27, 1996, the MPCA issued a RFRA to Domtar Inc., Interlake Corp., Allied-Signal, Inc. and Beazer East, Inc. requiring the investigation and potential remediation of a portion of an industrial site located in Duluth, Minnesota, believed to contain contaminated sediments originating from former coke and gas plants and coal tar distillation plants. Domtar Inc. formerly operated one coal tar distillation plant at this site. The total cost of the likely remediation is estimated to be between $3 million and $7 million. Final allocation of remediation cost is expected to be determined in the second quarter of 2008. At December 30, 2007,31, 2009, we had a provision of $4$111 million for remediation costs.
At($99 million at December 30, 2007, we had a provision of $119 million31, 2008) for environmental matters and other asset retirement obligations. Additional costs, not known or identifiable, could be incurred for remediation efforts. Based on policies and procedures in place to monitor environmental exposure, we believe that such additional remediation costs would not have a material adverse effect on our financial position, earningsresults of operations or cash flows.
64
At December 30, 2007,31, 2009, anticipated undiscounted payments in each of the next five years are as follows:
| 2008 | 2009 | 2010 | 2011 | 2012 | THEREAFTER | TOTAL | |||||||||||||||
Environmental provision and other asset retirement obligation | $ | 21 | $ | 32 | $ | 14 | $ | 7 | $ | 7 | $ | 38 | $ | 119 | |||||||
| 2010 | 2011 | 2012 | 2013 | 2014 | THEREAFTER | TOTAL | |||||||||||||||
| (in millions of dollars) | |||||||||||||||||||||
Environmental provision and other asset retirement obligations | $ | 15 | $ | 37 | $ | 18 | $ | 6 | $ | 8 | $ | 27 | $ | 111 | |||||||
Useful livesLives
Our property, plant and equipment are stated at cost less accumulated depreciation, including asset impairment write-down.write-downs. Interest costs are capitalized for significant capital projects. For timber limits and timberlands, amortization is calculated using the unit of production method. For deferred financing fees, amortization is calculated using the effective interest rate method. For all other assets, amortization is calculated using the straight-line method over the estimated useful lives of the assets.
We acquired intangible assets as part of the Transaction. Our intangible assets are stated at cost less accumulated amortization, including any applicable intangible asset impairment write-down. Water rights, customer relationships, trade names and a supplier agreement are amortized on a straight-line basis over their
65
estimated useful lives of 40 years, 20 years, 7 years and 5 years, respectively. Natural gas contracts and power purchase agreements are each amortized on a straight-line basis over the term of the respective contract. The weighted-average amortization period is 4 years for natural gas contracts and 25 years for power purchase agreements. Cutting rights are amortized using the units of production method.
On a regular basis, we review the estimated useful lives of our property, plant and equipment as well as our intangible assets. Assessing the reasonableness of the estimated useful lives of property, plant and equipment and intangible assets requires judgment and is based on currently available information. During the first quarter of 2007, we reviewed the useful lives of the property, plant and equipment and intangible assets acquired from Domtar Inc. using information obtained from the preliminary fair value and purchase price allocation. During the fourth quarter of 2007, we have completed the valuation of all assets acquired as well as their useful lives which did not change from our initial estimates. In the process of completing such allocation, in 2007 we have revised the amounts allocated to certain assets from those previously reported. The principal significant elements for which such amounts have beenwere modified includeincluded property, plant and equipment and intangible assets, changesassets. Changes in circumstances such as technological advances, changes to our business strategy, changes to our capital strategy or changes in regulation can result in the actual useful lives differing from our estimates. Revisions to the estimated useful lives of property, plant and equipment and intangible assets constitute a change in accounting estimate and are dealt with prospectively by amending depreciation and amortization rates.
A change in the remaining estimated useful life of a group of assets, or their estimated net salvage value, will affect the depreciation or amortization rate used to depreciate or amortize the group of assets and thus affect depreciation or amortization expense as reported in our results of operations. A change of one year in the composite estimated useful life of our fixed asset base would impact annual depreciation and amortization expense by approximately $19$18 million. In 2007,2009, we recorded depreciation and amortization expense of $471$405 million compared to $311$463 million in 2006.2008. At December 30, 2007,31, 2009, we had property, plant and equipment with a net book value of $5,362$4,129 million ($3,0654,301 million in 2006)2008) and intangible assets, net of amortization of $111$85 million (nil($81 million in 2006)2008).
Impairment of long-lived assetsLong-Lived Assets
We reviewLong-lived assets are reviewed for impairment upon the carrying amountoccurrence of long-lived assets when events or changes in circumstances indicateindicating that, at the lowest level of determinable cash flows, the carrying value of the long-lived assets may not be recoverable through future operations. This is accomplished by determining whether projectedrecoverable. Step I of the impairment test assesses if the carrying value of the long-lived assets exceeds their estimated undiscounted future cash flows from operations exceedin order to assess if the assets are impaired. In the event the estimated undiscounted future cash flows are lower than the net carrying amountbook value of the assets, as ofa Step II impairment test must be carried out to determine the assessment date (Step I test). Impairedimpairment charge. In Step II, long-lived assets are recorded atwritten down to their estimated fair values. Given that there is generally no readily available quoted value for our long-lived assets, we determine fair value determined principally byof long-lived assets using the estimated discounted future cash flowsflow (“DCF”) expected from their use and eventual disposition, (Stepand by using the liquidation or salvage value in the case of idled assets. The DCF in Step II test). Estimatesis based on the undiscounted cash flows in Step I.
Plymouth Pulp and Paper Mill—Conversion to Fluff Pulp
In the fourth quarter of 2009, as a result of the decision to permanently shut down the remaining paper machine and convert our Plymouth facility to 100% fluff pulp production by the fourth quarter of 2010, we recognized, under Impairment and write-down of property, plant and equipment, $13 million of accelerated depreciation in the fourth quarter of 2009 and we expect to record a further $39 million of accelerated depreciation over the first nine months of 2010 in relation to the assets that will cease productive use in October 2010 when the conversion is completed.
Given the substantial change in use of the pulp and paper mill, we conducted a Step I impairment test and concluded that the recognition of an impairment loss for the Plymouth mill’s long-lived assets was not required as the aggregate estimated undiscounted future cash flows exceeded the carrying value of the asset group of $336 million at the time of the announcement by a significant amount.
66
Estimates of undiscounted future cash flows used to test the recoverability of the fixed assets included key assumptions related to trend prices, inflation-adjusted cost projections, and the estimated useful life of the fixed assets. The main sources of such assumptions and related benchmarks were largely the same as those listed under “Impairment of Goodwill” below.
Changes in our assumptions and estimates may affect our forecasts and may lead to an outcome where impairment charges would be required. In addition, actual results may vary from our forecasts, and such variations may be material and unfavorable, thereby triggering the need for future impairment tests where our conclusions may differ in reflection of prevailing market conditions.
The following table summarizes the approximate impact that a change in certain key assumptions would have on the estimated undiscounted future cash flows at December 31, 2008, while holding all other assumptions constant:
Key Assumption | Increase of | Approximate impact on the undiscounted cash flows | ||||
| (In millions of dollars) | ||||||
Fluff pulp pricing | $ | 5/ton | $ | 31 | ||
Plymouth Pulp and Paper Mill—Closure of Paper Machine
In the first quarter of 2009, we announced that we would permanently reduce our paper manufacturing at our Plymouth pulp and paper mill, by closing one of the two paper machines comprising the mill’s paper production unit. As a result, at the end of February 2009, there was a curtailment of 293,000 tons of the mill’s paper production capacity and the closure affected approximately 185 employees and a $35 million accelerated depreciation charge was recorded in the first quarter of 2009 for the related write-down on plant and equipment. Given the closure of the paper machine, we conducted a Step I impairment test on our Plymouth mill operation’s fixed assets and concluded that the undiscounted estimated future cash flows associated with the long-lived assets exceeded their carrying value and, as such, no additional impairment charge was required.
Prince Albert Pulp Mill
As a result of a review of current options for the disposal of the assets of this facility in the fourth quarter of 2009, we revised the estimated net realizable values of the remaining assets and recorded a non-cash write-down of $14 million in the fourth quarter of 2009, related to fixed assets, mainly a turbine and a boiler. The write-down represents the difference between the new estimated liquidation or salvage value of the fixed assets and their carrying values.
Dryden Pulp and Paper Mill
In the fourth quarter of 2008, as a result of the decision to permanently shut down the remaining paper machine and converting center of the Dryden mill, we wrote-down $11 million of the net book value to bring these assets to their estimated recoverable amount. Given the substantial change in use of the pulp and paper mill, we conducted a Step I impairment test on the remaining Dryden pulp mill operation’s fixed assets. Estimates of undiscounted future cash flows used to test the recoverability of the fixed assets included key assumptions related to trend prices, inflation-adjusted cost projections, the forecasted exchange rate for the U.S. dollar and the estimated useful life of the fixed assets. The main sources of such assumptions and related benchmarks were largely the same as those listed under “Impairment of Goodwill” below.
Step I of the impairment test demonstrated that the carrying values of the fixed assets exceeded their estimated undiscounted future cash flows, indicating that an impairment exists. A Step II test was undertaken to determine the fair value require judgmentof the remaining assets and may change over time.we recorded a non-cash impairment charge of $265 million in the fourth quarter of 2008 to reduce the assets to their estimated fair value.
6567
Subsequent to the decision to shut down one paper machine at our Dryden mill and the write-offwrite-down of $92 million related to this paper machine, we conducted a Step I impairment test on ourthe remaining Dryden mill fixed assets during the fourth quarter of 2007. Estimates of undiscounted future cash flows used to test the recoverability of a long-lived asset includeincluded key assumptions related to trend prices, the 15-year forecasted exchange rate for the U.S. dollar and the estimated useful life of the long-lived assets. The trend prices were based on an analysis of external price trends, including published industry guidance. The forecasted Canadian-U.S. foreign exchange rate assumptions were based on independent market information, as well as analysis of historical data, trends and cycles. We concluded that the recognition of an impairment loss for ourthe Dryden mill was not required. Additional information regarding this
Columbus Paper Mill
During the fourth quarter of 2008, we were informed that beginning in early 2009, our Columbus mill would cease to benefit from a favorable power purchase agreement. This change in circumstances impacted the profitability outlook for the foreseeable future and triggered the need for a Step I impairment test can be found in Item 8, Financial Statements, Note 13 of this Annual Report on Form 10-K.the fixed assets. Estimates of undiscounted future cash flows used to test the recoverability of the fixed assets included key assumptions related to trend prices, inflation-adjusted cost projections, and the estimated useful life of the fixed assets. The main sources of such assumptions and related benchmarks were largely the same as those listed under “Impairment of Goodwill” below.
Step I of the impairment test demonstrated that the carrying values of the fixed assets exceeded their estimated undiscounted future cash flows, indicating that an impairment exists. A Step II test was undertaken to determine the fair value requireof the remaining assets, and we recorded a non-cash impairment charge of $95 million in the fourth quarter of 2008 to reduce the assets to their estimated fair value.
Wood Segment
In the fourth quarter of 2009 and 2008, we conducted an impairment test on the fixed assets and intangible assets (“the Asset Group”) of the Wood reportable segment. The need for such test was triggered by operating losses sustained by the segment in 2007, 2008 and 2009, as well as short-term forecasted operating losses.
We completed the Step I impairment test during each period and concluded that the recognition of an impairment loss for the Wood reportable segment’s long-lived assets was not required as the aggregate estimated undiscounted future cash flows exceeded the carrying value of the Asset Group of $161 million by a significant amount.
Estimates of undiscounted future cash flows used to test the recoverability of the Asset Group included key assumptions related to trend prices, inflation-adjusted cost projections, forecasted exchange rate for the U.S. dollar and the estimated useful life of the Asset Group. We believe such assumptions to be reasonable and to reflect forecasted market conditions at the valuation date. They involve a high degree of judgment and complexity and reflect our best estimates with the information available at the time our forecasts were developed. To this end, we evaluate the appropriateness of our assumptions as well as our overall forecasts by comparing projected results of upcoming years with actual results of preceding years and validating that differences therein are reasonable. Key assumptions were related to trend prices (based on data from Resource Information Systems Inc. or “RISI”, an authoritative independent source in the global forest products industry), material and energy costs and foreign exchange rates. A number of benchmarks from independent industry and other economic publications were used in order to develop projections for the forecast period.
68
The following table summarizes the approximate impact that a change in certain key assumptions would have on the estimated undiscounted future cash flows at December 31, 2009, while holding all other assumptions constant:
Key Assumptions | Increase of | Approximate impact on the undiscounted cash flows | |||||
| (In millions of dollars) | |||||||
Foreign exchange rates ($US to $CDN) | $ | 0.01 | $ | (30 | ) | ||
Lumber pricing | $ | 5 /MFBM | 32 | ||||
Changes in our assumptions and estimates may change over time, therefore it is reasonably possible that changes in future conditionsaffect our forecasts and may lead management to use different key assumptions, which could require aan outcome where impairment charges would be required. In addition, actual results may vary from our forecasts and such variations may be material changeand unfavorable, thereby triggering the need for future impairment tests where our conclusions may differ in reflection of prevailing market conditions.
Lebel-sur-Quévillon Pulp Mill and Sawmill
Pursuant to the decision in the net carrying amountfourth quarter of 2008 to permanently shut down the Lebel-sur-Quévillon pulp mill and sawmill of the Papers and Wood reportable segments, respectively, we have recorded a non-cash write-down of $4 million related to fixed assets tested for impairment.at both locations consisting mainly of a turbine, a recovery system and saw lines. The total netwrite-down represents the difference between the estimated liquidation or salvage value of the fixed assets and their carrying amount of these assets was $395 million at December 30, 2007.values.
GoodwillWhite River Sawmill
We haveIn the fourth quarter of 2008, the net assets of the White River sawmill of the Wood reportable segment were held for sale and measured at the lower of its carrying value or estimated fair value less cost to sell. The fair value was determined by analyzing values assigned to it in a significant amount of goodwillcurrent potential sale transaction together with conditions prevailing in the markets where the sawmill operates. Pursuant to such analysis, non-cash write-downs amounting to $8 million related to fixed assets and $4 million related to intangible assets were recorded in our consolidated balance sheet.the fourth quarter of 2008 to reflect the difference between their respective estimated fair values less cost to sell and their carrying values. The sawmill was sold in June 2009 and we recorded a gain of $1 million related to the transaction.
Impairment of Goodwill
Goodwill is not amortized and is subject to an annual goodwill impairment test. This test annually, oris carried out more frequently if events or changes in circumstances indicate that itgoodwill might be impaired. We performed the annualA Step I goodwill impairment test of goodwill during the fourth quarter of 2007, in accordance with SFAS 142 “Goodwill and Other Intangible Assets.” As a result, we determined that the Wood segment goodwill was impaired necessitating an impairment charge of $4 million, largely due to the deterioration of economic conditions in the Wood segment. Testing for impairment is accomplished mainly by determiningdetermines whether the fair value of a reporting unit based upon discounted cash flows, exceeds the net carrying amount of that reporting unit, including goodwill, as of the assessment date.date in order to assess if goodwill is impaired. If the fair value is greater than the net carrying amount, no impairment is necessary. In the event that the net carrying amount exceeds the sum of the discounted estimated cash flows,fair value, a secondStep II goodwill impairment test must be performed wherebyin order to determine the amount of the impairment charge. The implied fair value of the reporting unit’s goodwill must be estimated to determine if it is less than its net carrying amount. Fair value of goodwillin this test is estimated in the same way as goodwill was determined at the date of the acquisition in a business combination, thatcombination. That is, the excess of the fair value of the reporting unit over the fair value of the identifiable net assets of the reporting unit represents the implied value of goodwill. To accomplish this Step II test, the fair value of the reporting unit’s goodwill must be estimated and compared to its carrying value. The excess of the carrying value over the fair value is taken as an impairment charge in the period.
For purposes of impairment testing, goodwill must be assigned to one or more of our reporting units. We test goodwill at the reporting unit level. All goodwill, as of December 30, 2007, resided in the Papers segment and based upon the impairment test conducted in the fourth quarter of 2008, as described below, was determined to be impaired and written-off.
69
Step I Impairment Test
We determined that the discounted cash flow method (“DCF”) was the most appropriate approach to determine fair value of the Papers reporting unit. We have developed our projection of estimated future cash flows for the period from 2009 to 2013 (the “Forecast Period”) to serve as the basis of the DCF as well as a terminal value. In doing so, we have used a number of key assumptions and benchmarks that are discussed under “Key Assumptions” below. Our discounted future cash flow analysis resulted in a fair value of the reporting unit below the carrying value of the Papers reporting units net assets.
In order to evaluate the appropriateness of the conclusions of our Step I impairment test, our estimated fair value as a whole was reconciled to our market capitalization and compared to selected transactions involving the sale of comparable companies.
Step II Impairment Test
In Step II of the impairment test, the estimated fair value of the Papers reporting unit, determined in Step I, was allocated to its tangible and identified intangible assets, based on their relative fair values, in order to arrive at the fair value of goodwill. To this end, different valuation techniques were used to determine the fair values of individual tangible and intangible assets. A depreciated replacement cost method was mainly used to determine the fair value of fixed assets to the extent such values did not have economic obsolescence. Economic obsolescence was based on cash flow projections. For idled mills of the Papers reporting unit, liquidation or salvage values were largely used as an indication of the fair values of their assets. The fair value of identified intangible assets, mainly consisting of marketing, customer and contract-related assets, were determined using an income approach.
The impairment test concluded that goodwill was impaired and we recorded a non-cash impairment charge of $321 million in the fourth quarter of 2008 to reflect the complete write-off of the goodwill.
In 2007, we performed our annual impairment test of goodwill. As a result, we determined that the Wood segment goodwill was impaired, necessitating an impairment charge of $4 million. The impairment was largely due to the deteriorating of economic conditions in the Wood segment.
Key Assumptions
The various valuation techniques used in Steps I and II incorporate a number of assumptions that we believe to be reasonable and to reflect forecasted market conditions at the valuation date. Assumptions in estimating future cash flows are subject to a high degree of judgement. We make all efforts to forecast future cash flows as accurately as possible with the information available at the time a forecast is made. To this end, we evaluate the appropriateness of our assumptions as well as our overall forecasts by comparing projected results of upcoming years with actual results of preceding years and validating those differences therein are reasonable. Key assumptions relate to: prices trends, material and energy costs, the discount rate, rate of decline of demand, the terminal growth rate, and foreign exchange rates. A number of benchmarks from independent industry and other economic publications were used in order to develop projections for the forecast period. Examples of such benchmarks and other assumptions include:
Revenues—the evolution of pulp and paper pricing over the forecast period was based on data from RISI.
Direct costs mainly consisted of fiber, wood, chemical and energy costs. The evolution of these direct costs over the forecast period was based on data from a number of benchmarks related to: selling prices of pulp, oil prices, housing starts, US producer price index, mixed chemical index, corn, natural gas, coal and electricity.
Foreign exchange rate estimates were based on a number of economic forecasts including those of Consensus Economics, Inc. reports.
70
Discount rate—The discount rate used to determine the present value of the Papers reporting unit’s forecasted cash flows represented our weighted average cost of capital (“WACC”). Our WACC was determined to be between 10.5% and 11%.
Rate of decline of demand and terminal growth rate—we assumed that a number of business and commercial papers would see demand declines in line with industry expectations. This was reflected in our assumptions in the rate of decline in demand over the forecast period as well as in our assumption of the terminal growth rate.
Pension Plans and Other Post-Retirement Benefit Plans
As part of the acquisition of Domtar Inc., we nowWe have several additional defined contribution plans and multi-employer plans. The pension expense under these plans is equal to the Company’sour contribution. Pension expense was $10$24 million for the year ended December 30, 2007.31, 2009 ($21 million in 2008).
As part of the acquisition of Domtar Inc., the Company now hasWe have several additional defined benefit pension plans covering substantially all employees. In the United States, this includes pension plans that are qualified under the Internal Revenue Code (“qualified”) as well as a plan that provides benefits in addition to those provided under the qualified plans for a select group of employees, which is not qualified under the Internal Revenue Code (“unqualified’). In Canada, plans are registered under the Income Tax Act and under their respective provincial pension acts (“registered”), or plans may provide additional benefits to a select group of employees, and not be registered under the Income Tax Act or provincial pension acts (“non-registered”). The defined benefit plans are generally contributory in Canada and non-contributory in the United States. The CompanyWe also providesprovide post-retirement plans to eligible Canadian and U.S. employees; the plans are unfunded and include life insurance programs, medical and dental benefits and short-term and long-term disability programs. The pension and other post-retirement expense and the obligation related to the defined benefit plansobligations are actuarially determined using management’s most probable assumptions.
We account for pensions and other post-retirement benefits in accordance with FASB No. 158, “Employers’ Accounting for Defined Benefit Pension and Other Post-retirement Plans – an AmendmentCompensation-Retirement Benefits Topic of FASB Statements No. 87, 88, 106 and 132(R)” (SFAS 158)ASC which requires employers to recognize the overfunded or underfunded status of defined benefit pension plans as an asset or liability in its Consolidated balance sheet.Balance Sheets. Pension and other
66
post-retirement benefit assumptions include the discount rate, the expected long-term rate of return on plan assets, the rate of compensation increase, health care cost trend rates, mortality rates, employee early retirements and terminations or disabilities. Changes in these assumptions result in actuarial gains or losses which we have elected to amortize over the expected average remaining service life of the active employee group covered by the plans only to the extent that the unrecognized net actuarial gains and losses are in excess of 10% of the greater of the accrued benefit obligation and the market-related value of plan assets at the beginning of the year.
An expected rate of return on plan assets of 6.2%6.8% was considered appropriate by our management for the determination of pension expense for 2007.2009. Effective January 1, 2008,2010, we will use 6.3%7.0% as the expected return on plan assets, which reflects the current view of long-term investment returns. The overall expected long-term rate of return on plan assets assumption is based on an analysismanagement’s best estimate of the targetlong-term returns of the major asset classes (cash and cash equivalents, equities and bonds) weighted by the actual allocation and expected return by asset class.of assets at the measurement date, net of expenses. This rate is adjusted forincludes an equity risk premium over government bond returns for equity investments and by 0.5%a value-added premium for the contribution to take into consideration thereturns from active investment management of the plan assets.management.
We set our discount rate assumption annually to reflect the rates available on high-quality, fixed income debt instruments, with a duration that is expected to match the timing and amount of expected benefit payments. High-quality debt instruments are corporate bonds with a rating of AA or better. The discount rates at December 30, 200731, 2009 for pension plans were estimated at 5.5%6.4% for the accrued benefit obligation and 5.3%6.8% for the net periodic benefit cost for 20072009 and for post-retirement benefit plans were estimated at 5.6%6.3% for the accrued benefit obligation and 5.3%6.0% for the net periodic benefit cost for 2007.2009.
The rate of compensation increase is another significant assumption in the actuarial model for pension (set at 2.7% for the accrued benefit obligation and 2.8% for the net periodic benefit cost) and for post-retirement benefit
71
benefits (set at 2.9%2.8% for the accrued benefit obligation and 3.0% for the net periodic benefit cost) and is determined based upon our long-term plans for such increases.
For measurement purposes, a 5.8%7.0% weighted-average annual rate of increase in the per capita cost of covered health care benefits was assumed for 2008.2010. The rate was assumed to decrease gradually to 4.1% by 20132029 and remain at that level thereafter.
The following table provides a sensitivity analysis of the key weighted average economic assumptions used in measuring the accrued pension benefit obligation, the accrued other post-retirement benefit obligation and related net periodic benefit cost for 2007.2009. The sensitivity analysis should be used with caution as it is hypothetical and changes in each key assumption may not be linear. The sensitivities in each key variable have been calculated independently of each other.
SENSITIVITY ANALYSIS
PENSION AND OTHER POST-RETIREMENT | PENSION | OTHER POST-RETIREMENT BENEFIT | ||||||||||
| ACCRUED BENEFIT OBLIGATION | NET PERIODIC BENEFIT COST | ACCRUED BENEFIT OBLIGATION | NET PERIODIC BENEFIT COST | |||||||||
| (In millions of U.S. dollars) | ||||||||||||
Expected rate of return on assets | ||||||||||||
1% increase | N/A | (14 | ) | N/A | N/A | |||||||
1% decrease | N/A | 14 | N/A | N/A | ||||||||
Discount rate | ||||||||||||
1% increase | (224 | ) | (6 | ) | (14 | ) | — | |||||
1% decrease | 229 | 1 | 18 | 1 | ||||||||
Assumed overall health care cost trend Impact of: | ||||||||||||
1% increase | N/A | N/A | 13 | 1 | ||||||||
1% decrease | N/A | N/A | (11 | ) | (1 | ) | ||||||
67
| PENSION | OTHER POST-RETIREMENT BENEFIT | |||||||||||||||
PENSION AND OTHER POST-RETIREMENT | ACCRUED BENEFIT OBLIGATION | NET PERIODIC BENEFIT COST | ACCRUED BENEFIT OBLIGATION | NET PERIODIC BENEFIT COST | ||||||||||||
| (In millions of dollars) | ||||||||||||||||
Expected rate of return on assets | ||||||||||||||||
Impact of: | ||||||||||||||||
1% increase | N/A | $ | (11 | ) | N/A | N/A | ||||||||||
1% decrease | N/A | 11 | N/A | N/A | ||||||||||||
Discount rate | ||||||||||||||||
Impact of: | ||||||||||||||||
1% increase | $ | (153 | ) | $ | (7 | ) | $ | (9 | ) | $ | (1 | ) | ||||
1% decrease | 172 | 13 | 10 | 1 | ||||||||||||
Assumed overall health care cost trend | ||||||||||||||||
Impact of: | ||||||||||||||||
1% increase | N/A | N/A | 11 | 1 | ||||||||||||
1% decrease | N/A | N/A | (9 | ) | (1 | ) | ||||||||||
The assets of the pension plans are held by a number of independent trustees and are accounted for separately in our pension funds. Our investment strategy for the assets in the pension plans is to maintain a diversified portfolio of assets, invested in a prudent manner to maintain the security of funds while maximizing returns within the guidelines provided in the investment policy. The Company’s pension funds are not permitted to own any of the Company’s shares or debt instruments. The target asset allocation is based on the expected duration of the benefit obligation.
The following table shows the allocation of the plan assets, based on the fair value of the assets held at December 30, 2007 and the target allocation for 2007:2009:
| TARGET ALLOCATION | PERCENTAGE PLAN ASSETS AS AT DECEMBER 31, 2009 | PERCENTAGE PLAN ASSETS AS AT DECEMBER 31, 2008 | ||||||
Fixed income | ||||||||
Cash and cash equivalents | 0% -10% | 8 | % | 6 | % | |||
Bonds | 49% -59% | 51 | % | 53 | % | |||
Equity | ||||||||
Canadian Equity | 10% -18% | 13 | % | 11 | % | |||
U.S. Equity | 13% -23% | 17 | % | 19 | % | |||
International Equity | 7% -16% | 11 | % | 11 | % | |||
Total(1) | 100 | % | 100 | % | ||||
(1) Approximately 89% of the pension plan assets relate to Canadian plans and 11% relate to U.S. plans.
| ||||||
| ||||||
| ||||||
| ||||||
72
Our funding policy is to contribute annually the amount required to provide for benefits earned in the year, to fund solvency deficiencies and to fund past service obligations over periods not exceeding those permitted by the applicable regulatory authorities. Past service obligations primarily arise from improvements to plan benefits. We expect to contribute a minimum total amount of $72$40 million in 20082010 compared to $106$130 million in 20072009 (2008—$194 million) to the pension plans. The contributionspayments made in 20072009 to the post-retirement benefit plans amounted to $5 million. In conjunction with a partial wind-up declared in 2006 related to the pension plans of Domtar Inc., an estimated amount of $132$8 million (CDN$130(2008—$8 million) of plan assets and liabilities is expected to be settled from the pension funds in 2008..
The estimated future benefit payments from the plans for the next ten years at December 30, 200731, 2009 are as follows:
ESTIMATED FUTURE BENEFIT PAYMENTS FROM THE PLANS | PENSION PLANS | OTHER POST- RETIREMENT BENEFIT PLANS | PENSION PLANS | OTHER POST- RETIREMENT BENEFIT PLANS | ||||||||
2008 | $ | 257 | $ | 6 | ||||||||
2009 | 88 | 6 | ||||||||||
| (in millions of dollars) | ||||||||||||
2010 | 90 | 6 | $ | 102 | $ | 7 | ||||||
2011 | 93 | 6 | 96 | 7 | ||||||||
2012 | 96 | 7 | 97 | 7 | ||||||||
2013 – 2017 | 550 | 35 | ||||||||||
2013 | 130 | 7 | ||||||||||
2014 | 102 | 7 | ||||||||||
2015 – 2019 | 551 | 39 | ||||||||||
Asset Backed Commercial Paper
At December 30, 2007, our31, 2009, Domtar Corporation’s Canadian defined benefit pension funds have approximately $450 million (CDN$445 million) invested in multipleheld asset backed commercial paper (“ABCP”) conduits that may be restructured. Of this amount, $393valued at $205 million (CDN$389214 million) with a nominal value of $359 million (CDN$376 million). At December 31, 2008, the plans held ABCP investments valued at $198 million (CDN$242 million). The value of the notes benefited from an increase in the value of the Canadian dollar and improving credit markets. Repayments in 2009 reduced the total amount outstanding of the notes.
Most of these investments (87% of nominal value (2008—89% of nominal value) were subject to restructuring under the court order governing the Montreal Accord that was completed in January 2009, while the remainder are in conduits restructured outside the Montreal Accord or subject to litigation between the sponsor and the credit counterparty.
There is no active, liquid quoted market for the ABCP held by the Company’s pension plans. The fair value of the ABCP notes is mainly based on a financial model incorporating uncertainties regarding return, credit spreads, the nature and credit risk of underlying assets, the amounts and timing of cash inflows and the limited market for new notes as at December 31, 2009.
The largest conduit owned by the pension plans in the Montreal Accord contains mainly of collateral investments that back credit default derivatives that protect counterparties against credit defaults above a specified threshold on different portfolios of corporate credits. The valuation methodology was based upon determining an appropriate credit spread for each class of notes based upon the implied protection level provided by each class against potential credit defaults. This was done by comparison to spreads for an investment grade credit default index and the comparable tranches within the index for equivalent credit protection. In addition, a liquidity premium of 1.75% was added to this spread. The resulting spread was used to calculate the present value of all such notes, based upon the anticipated maturity date. An additional discount of 2.5% was applied to reflect uncertainty over collateral values held to support the derivative transactions. An increase in the discount rate of 1% would reduce the value by $9 million (CDN$9 million) for these notes.
The value of the remaining notes that were subject to the interim arrangementMontreal Accord were sourced either from the asset manager of these notes, or from trading values for similar securities of similar credit quality. The conduits outside the Montreal Accord, which also provide protection to counterparties against credit defaults through derivatives, were valued based upon the collateral value held in the conduit net of the “Montreal Proposal”. Pursuantmarket value of the credit
73
derivatives as provided by the sponsor of the conduit, with an additional discount (equivalent to 1.75% per annum) applied for illiquidity. One conduit still subject to litigation was valued at zero.
Possible changes that could have a material effect on the Montreal Proposal, banks and major investors are negotiating restructuring proposals with respect to suchfuture value of the ABCP conduits intended to minimize potential losses for investors. These discussions are not yet completed and the outcome and the effect it would have oninclude (1) changes in the value of our Canadian pension fundthe underlying assets has yetand the related derivative transactions, (2) developments related to be determined. The objectivethe liquidity of the Montreal Proposal is to restructureABCP market, and (3) a severe and prolonged economic slowdown in North America and the ABCP conduits to give investors the reasonable expectationbankruptcy of receiving full par value over time and reducing the risk that adverse credit market conditions will impact the restructured notes. The objective of the Investors Committee is to complete the restructuring process by the end of April 2008. At December 30, 2007, the company has determined that the fair value of these ABCP investments should be reduced by 13% or CDN$57 million to reflect management’s best estimate of fair value and assumes the successful completion of the Montreal Proposal. Additional information on the reduction of our ABCP investments is included in Item 8, Financial Statements, in Note 6 of this Annual Report on Form 10-K.referenced corporate credits.
68
We do not expect liquidity issues to affect the pension funds since pension fund obligations are primarily long-term in nature. Losses in the pension fund investments, if any, would result in future increased contributions by us andor our Canadian subsidiaries. Additional contributions to these pension funds would be required to be paid over a 5-year period.five-year or ten-year periods, depending upon applicable provincial jurisdiction and its requirements for amortization. Losses, if any, would also impact operating earnings over a longer period of time and immediately increase liabilities and reduce equity.
Income taxesTaxes
We use the asset and liability method of accounting for income taxes. Under this method, deferred tax assets and liabilities are determined according to differences between the carrying amounts and tax bases of the assets and liabilities. The change in the net deferred tax asset or liability is included in earnings. Deferred tax assets and liabilities are measured using enacted tax rates and laws expected to apply in the years in which assets and liabilities are expected to be recovered or settled. For these years, a projection of taxable income and an assumption of the ultimate recovery or settlement period for temporary differences are required. The projection of future taxable income is based on management’s best estimate and may vary from actual taxable income.
On a quarterly basis, we assess the need to establish a valuation allowance for deferred tax assets and, if it is deemed more likely than not that our deferred tax assets will not be realized based on these taxable income projections, a valuation allowance is recorded. In general, “realization” refers to the incremental benefit achieved through the reduction in future taxes payable or an increase in future taxes refundable from the deferred tax assets. Evaluating the need for an amount of a valuation allowance for deferred tax assets often requires significant judgment. All available evidence, both positive and negative, should be considered to determine whether, based on the weight of that evidence, a valuation allowance is needed.
Our short-term deferred tax assets are mainly composed of temporary differences related to various accruals, accounting provisions for acquisitions, restructuring, environmental matters, as well as a portion of our net operating loss carry forwards. The majority of these accrualsitems are expected to be utilized or paid out over the next five years.year. Our long-term deferred tax assets and liabilities are mainly composed of temporary differences pertaining to plant, equipment, pension and others.post-retirement liabilities, the remaining portion of net operating loss carry forwards and others items, net of valuation allowance on a portion of our Canadian deferred tax assets. Estimating the ultimate settlement period given the depreciation rates in effect are based on information as it develops, requires judgment and our best estimates. The reversal of timing differences is expected at future enacted tax rates, which could change due to changes in income tax laws or the introduction of tax changes through the presentation of annual budgets by different governments. As a result, a change in the timing and the income tax rate at which the components will reverse could materially affect deferred tax expense as recorded in our results of operations.
In addition, American and Canadian tax rules and regulations are subject to interpretation and require judgment that may be challenged by taxation authorities. To the best of our knowledge, we have adequately provided for our future tax consequences based upon current facts and circumstances and current tax law. On January 1, 2007, we adopted the provisions of FIN 48, “Accounting for Uncertainty in Income Taxes.”Taxes, Topic of FASB ASC. The adoption of FIN 48the provisions of Income Taxes pertaining to unrecognized tax benefits had no impact on our consolidated financial statements. In accordance with Income Taxes Topic of FASB ASC, we evaluate new tax positions that result in a tax benefit to the Company and determine the amount of tax benefits that can be recognized. The
74
remaining unrecognized tax benefits are evaluated on a quarterly basis to determine if changes in recognition or classification are necessary. Significant changes in the amount of unrecognized tax benefits expected within the next 12 months are disclosed quarterly. Future recognition of unrecognized tax benefits would impact the effective tax rate in the period the benefits are recognized, except to the extent that benefits recognized in Canada are offset by a change in the valuation allowance on deferred tax assets. At December 30, 2007,31, 2009, we had gross unrecognized tax benefits of approximately $40$226 million. If our income tax positions with respect to the alternative fuel mixture tax credits are sustained, either all or in part, then we would recognize a tax benefit in the future equal to the amount of the benefits sustained. We do not expect any material changes to the amount of these benefits to occur in the next 12 months. Our tax treatment of the income related to the alternative fuel mixture tax credits resulted in the recognition of a tax benefits of $36 million which impacted the U.S. effective tax rate in 2009. Our current expectation is that this credit will not be available in 2010 and thus is not expected to impact our effective tax rate in the future unless new legislation is introduced and passed. Refer to Item 8, Financial Statements and Supplementary Data, Note 9,10, of this Annual Report on Form 10-K for detail on the unrecognized tax benefits.
Alternative Fuel Mixture Tax Credits
69The U.S. Internal Revenue Code of 1986, as amended (the “Code”) permits a refundable excise tax credit for the production and use of alternative fuel mixtures derived from biomass. We submitted an application with the U.S. Internal Revenue Service (“IRS”) to be registered as an alternative fuel mixer and received notification that our registration had been accepted in late March 2009. We began producing and consuming alternative fuel mixtures in February 2009 at our eligible mills. In 2009, we recorded $498 million of such credits in Other operating income on the Consolidated Statements of Earnings (Loss). The amounts for the refundable credits are based on the volume of alternative mixtures produced and burned during that period. According to the Code, the tax credit expires at the end of 2009.
In 2009, we received $140 million in cash related to these claims. Any receivables under this program are presented as a component of Income and other taxes receivable on the Consolidated Balance Sheets. In the second quarter of 2009, we stopped claiming these credits for immediate refund as they were being earned and ultimately decided to claim the remaining refundable credits on our 2009 annual U.S. income tax return, which is expected to be filed in the first half of 2010. Refer to Note 10, “Income Taxes,” for additional information regarding unrecognized tax benefits.
Closure and Restructuring Costs
Closure and restructuring costs are recognized as liabilities in the period when they are incurred and are measured at their fair value. For such recognition to occur, management, with the appropriate level of authority, must have approved and committed to a firm plan and appropriate communication to those affected must have occurred. These provisions require an estimation of costs such as severance and termination benefits, pension and curtailments and environmental remediation, and an evaluation of the fair value of the working capital and property, plant and equipment is required to determine the required write-downs, if any. The closure and restructuring expense also includes costs relating to demolition, training and outplacement.
Estimates of cash flows and fair value relating to closures and restructurings require judgment. Closure and restructuring costs are based on management’s best estimates of future events at December 31, 2009. Closure costs and restructuring estimates are dependent on future events. Although we do not anticipate significant changes, the actual costs may differ from these estimates due to subsequent developments such as the results of environmental studies, the ability to find a buyer for assets set to be dismantled and demolished and other business developments. As such, additional costs and further working capital and property, plant and equipment write-downs may be required in future periods.
75
| ITEM 7A. | QUANTITATIVE AND QUALITATIVE DISCLOSURE ABOUT MARKET RISK |
Our income before depreciation and amortization and interest expense can be impacted by the following sensitivities:
| ||
| ||
| ||
| ||
| ||
| ||
| ||
| ||
| ||
| ||
| ||
| ||
| ||
| ||
SENSITIVITY ANALYSIS | |||
| (In millions of dollars, unless otherwise noted) | |||
Each $10/unit change in the selling price of the following products: 1 | |||
Papers | |||
20-lb repro bond, 92 bright (copy) | $ | 16 | |
50-lb offset, rolls | 3 | ||
Coated publication No.5, 40-lb offset, rolls | 2 | ||
Other | 15 | ||
Pulp—net position | 17 | ||
Wood (lumber)2 | 10 | ||
Interest rate3(1% change in interest rate on our floating rate debt) | 3 | ||
Foreign exchange, excluding depreciation and amortization(US $0.01 change in relative value to the Canadian dollar before hedging) | 11 | ||
Energy 4 | |||
Natural gas: $0.25/MMBtu change in price before hedging | 4 | ||
Crude oil: $10/barrel change in price before hedging | 4 | ||
| Based on estimated |
| Based on estimated |
| Based on balances of our secured term loan facility at December 31, 2009. |
| 4 | Based on estimated |
Note that Domtar may, from time to time, hedge part of its foreign exchange, pulp, interest rate and energy positions, which may therefore impact the above sensitivities.
In the normal course of business, we are exposed to certain financial risks. We do not use derivative instruments for speculative purposes; although all derivative instruments purchased to minimize risk may not qualify for hedge accounting.
INTEREST RATE RISK
We are exposed to interest rate risk arising from fluctuations in interest rates on our cash and cash equivalents, bank indebtedness, bank credit facility and long-term debt. We may manage this interest rate exposure by the use of derivative instruments such as interest rate swap contracts.
CREDIT RISK
We are exposed to credit risk on the accounts receivable from our customers. In order to reduce this risk, we review new customers’ credit histories before granting credit and conduct regular reviews of existing customers’ credit performance. In addition, we aim to not rely heavily on a small number of significant customers.customers, and we do not have a customer in 2009 that represents more than 10% of our total sales. We buy credit insurance to mitigate part of our exposure to credit risk. As at December 31, 2009, we had no customer that represented more than 10% of our receivables, prior to the effect of receivables securitization (2008—we had one customer that represented 11% of the receivables ($54 million)).
We are also exposed to credit risk in the event of non-performance by counterparties to our financial instruments. We minimize this exposure by entering into contracts with counterparties that we believe are of high
76
credit quality. We usually do not obtain collateralCollateral or other security to support financial instruments subject to credit risk.risk is usually not obtained. We regularly monitor the credit standing of counterparties. We are exposed to credit risk in the event of non-performance by our insurers. We minimize our exposure by doing business only with large reputable insurance companies.
COST RISK
Cash flow hedges
We purchase natural gas and oil at the prevailing market price at the time of delivery. In order to manage the cash flow risk associated with purchases of natural gas and oil, we may utilize derivative financial instruments or physical purchases to fix the price of forecasted natural gas and oil purchases. We formally document the hedge relationships, including identification of the hedging instruments and the hedged items, the risk management objectives and strategies for undertaking the hedge transactions, and the methodologies used to assess effectiveness and measure ineffectiveness. Current contracts are used to hedge forecasted purchases over the next three years. The effective portion of changes in the fair value of derivative contracts designated as cash flow hedges is recorded as a component of Accumulated other comprehensive loss within Shareholders’ equity, and is recognized in Cost of sales in the period in which the hedged transaction occurs.
The following table presents the volumes under derivative financial instruments for natural gas and oil contracts outstanding as of December 31, 2009 to hedge forecasted purchases:
Commodity | Notional contractual quantity under derivative contracts | Notional contractual value under derivative contracts (in millions of dollars) | Percentage of forecasted purchases under derivative contracts for (a) | |||||||||||||
| 2010 | 2011 | 2012 | ||||||||||||||
Natural gas | 6,540,000 | MMBTU (1) | $ | 50 | 26 | % | 12 | % | 3 | % | ||||||
Oil | 12,000 | BBL (2) | $ | 0.4 | 3 | % | — | % | — | % | ||||||
70
| (1) | MMBTU: Millions of British thermal units |
| (2) | BBL: Barrels |
| (a) | The percentage of coverage represents the derivative financial instrument positions. The percentage of natural gas and oil purchases under fixed price contracts, for both derivative financial instrument and physical delivery, for 2010 are 26% and 3%, 2011 are 12% and nil and 2012 are 3% and nil, respectively. |
FOREIGN CURRENCY RISK
Cash flow hedges
We have manufacturing operations in the United States and Canada. As a result, we are exposed to movements in the foreign currency exchange rate in Canada. Approximately 19% of our uncoated freesheet paper production capacity and 55% of our trade pulp production capacity as well as our Wood business are in Canada, with manufacturing costs primarily denominated in Canadian dollars. Also, certain assets and liabilities are denominated in Canadian dollars and are exposed to foreign currency movements. As a result, our earnings are affected by increaseincreases or decreasedecreases in the value of the Canadian dollar relative to the U.S. dollar. See Item 1A, Risk Factors—“The Company is affected by changesOur risk management policy allows us to hedge a significant portion of our exposure to fluctuations in foreign currency exchange rate.”
In order to reduce the potential negative effects of a fluctuating Canadian dollar, we may enter into various arrangements to stabilize anticipated future net cash outflows denominated in Canadian dollarsrates for periods of up to 36 months. Such arrangements are composed ofthree years. We may use derivative instruments (currency options and foreign exchange forward contracts) to mitigate our exposure to fluctuations in foreign contracts and currency options purchased and sold. Forward foreign exchange rates. Foreign exchange forward contracts are contracts whereby we have the obligation to buy Canadian dollars at a specific rate. Currency options purchased are contracts whereby we have the right, but not the obligation, to buy Canadian dollars at the strike rate if the Canadian dollar trades above that rate. Currency options sold are contracts whereby we have the obligation to buy Canadian dollars at the strike rate if the Canadian dollar trades below that rate. No arrangements were outstanding as at December 30, 2007 and December 31, 2006.
COST RISK
We purchase natural gas at the prevailing market price at the time of delivery and, as such, are subject to fluctuations in market prices. In order to manage the cash flow risk associated with purchases of natural gas, we may utilize derivative financial instruments to fix the price of forecasted natural gas purchases for periods of up to 36 months into the future as part of a hedging program. 77
We formally document the hedge relationships, including identification of therelationship between hedging instruments and the hedged items, theas well as our risk management objectives and strategies for undertaking the hedge transactions,transactions. Foreign exchange forward contracts and the methodologiescurrency options contracts used to assess effectiveness and measure ineffectiveness. Changeshedge forecasted purchases in Canadian dollars are designated as cash flow hedges. Current contracts are used to hedge forecasted purchases over the next twelve months. The effective portion of changes in the fair value of derivative contracts designated as cash flow hedges is recorded as a component of Accumulated other comprehensive loss within Shareholders’ equity, and is recognized in Cost of sales in the derivative financial instrumentsperiod in which the hedged transaction occurs.
The following table presents the currency values under contracts pursuant to currency options outstanding as of December 31, 2009 to hedge forecasted purchases:
Contract | Notional contractual value | Percentage of CDN denominated forecasted expenses, net of revenues, under contracts for | ||||||
| 2010 | ||||||||
Currency options purchased | CDN | $ | 440 | 55 | % | |||
Currency options sold | CDN | $ | 440 | 55 | % | |||
The currency options are allocated by us to individual facilities based on projected usage of natural gas. We recognize our allocable sharefully effective as at December 31, 2009. The critical terms of the gainshedging instruments and losses on our derivative financial instrumentsthe hedged items match. As a result, there were no amounts reflected in earnings when the forecasted purchases occur.Consolidated Statements of Earnings (Loss) for the year ended December 31, 2009 resulting from hedge ineffectiveness (2008—nil).
7178
| ITEM 8. | FINANCIAL STATEMENTS AND SUPPLEMENTARY DATA |
Management’s Reports to Shareholders of Domtar Corporation
Management’s Report on Financial Statements and Practices
The accompanying Consolidated Financial Statements of Domtar Corporation and its subsidiaries (the “Company”) were prepared by management. The statements were prepared in accordance with accounting principles generally accepted in the United States of America and include amounts that are based on management’s best judgments and estimates. Management is responsible for the completeness, accuracy and objectivity of the financial statements. The other financial information included in the annual report is consistent with that in the financial statements.
Management has established and maintains a system of internal accounting and other controls for the Company and its subsidiaries. This system and its established accounting procedures and related controls are designed to provide reasonable assurance that assets are safeguarded, that the books and records properly reflect all transactions, that policies and procedures are implemented by qualified personnel, and that published financial statements are properly prepared and fairly presented. The Company’s system of internal control is supported by written policies and procedures, contains self-monitoring mechanisms, and is audited by the internal audit function. Appropriate actions are taken by management to correct deficiencies as they are identified.
Management’s Report on Internal Control over Financial Reporting
Management is responsible for establishing and maintaining adequate internal control over financial reporting for the Company. In order to evaluate the effectiveness of internal control over financial reporting, management has conducted an assessment, including testing, using the criteria established inInternal Control— Integrated Framework, issued by the Committee of Sponsoring Organizations of the Treadway Commission (COSO). The Company’s system of internal control over financial reporting is designed to provide reasonable assurance regarding the reliability of financial reporting and the preparation of financial statements for external purposes in accordance with generally accepted accounting principles. The Company’s internal control over financial reporting includes those policies and procedures that (i) pertain to the maintenance of records that, in reasonable detail, accurately and fairly reflect the transactions and dispositions of the assets of the Company; (ii) provide reasonable assurance that transactions are recorded as necessary to permit preparation of financial statements in accordance with generally accepted accounting principles, and that receipts and expenditures of the Company are being made only in accordance with authorizations of management and directors of the Company; and (iii) provide reasonable assurance regarding prevention or timely detection of unauthorized acquisition, use, or disposition of the Company’s assets that could have a material effect on the financial statements.
Because of its inherent limitations, internal control over financial reporting may not prevent or detect misstatements. Also, projections of any evaluation of effectiveness to future periods are subject to the risk that controls may become inadequate because of changes in conditions, or that the degree of compliance with the policies or procedures may deteriorate.
Based on the assessment, management has concluded that the Company maintained effective internal control over financial reporting as of December 31, 2009, based on criteria inInternal Control – Integrated Framework issued by the COSO.
The effectiveness of the Company’s internal control over financial reporting as of December 31, 2009 has been audited by PricewaterhouseCoopers LLP, an independent registered public accounting firm, as stated in their report, which is included herein.
79
Report of Independent Registered Public Accounting Firm
To the Board of Directors and Shareholders of Domtar Corporation:
In our opinion, the accompanying consolidated balance sheetsheets and the related consolidated statements of earnings (loss), shareholders’ equity comprehensive income (loss), and cash flows present fairly, in all material respects, the financial position of Domtar Corporation and its subsidiaries at December 30, 2007,31, 2009 and December 31, 2008, and the results of their operations and their cash flows for each of the yearthree years in the period ended December 30, 200731, 2009 in conformity with accounting principles generally accepted in the United States of America. In addition, in our opinion, the financial statement schedule information for the year ended December 30, 2007 listed in the index appearing under Item 15 (a)15(a)(2) presents fairly, in all material respects, the information set forth therein when read in conjunction with the related consolidated financial statements. TheseAlso in our opinion, the Company maintained, in all material respects, effective internal control over financial statements and financial statement schedule arereporting as of December 31, 2009, based on criteria established inInternal Control—Integrated Framework issued by the responsibilityCommittee of Sponsoring Organizations of the Treadway Commission (COSO). The Company’s management. Our responsibilitymanagement is to express an opinion onresponsible for these financial statements and financial statement schedule, for maintaining effective internal control over financial reporting and for its assessment of the effectiveness of internal control over financial reporting, included in the accompanying Management’s Report on Internal Control over Financial Reporting. Our responsibility is to express opinions on these financial statements, on the financial statement schedule, and on the Company’s internal control over financial reporting based on our audit.audits which were integrated audits in 2009 and 2008. We conducted our audit of these statementsaudits in accordance with the standards of the Public Company Accounting Oversight Board (United States). Those standards require that we plan and perform the auditaudits to obtain reasonable assurance about whether the financial statements are free of material misstatement. An audit includesmisstatement and whether effective internal control over financial reporting was maintained in all material respects. Our audits of the financial statements included examining, on a test basis, evidence supporting the amounts and disclosures in the financial statements, assessing the accounting principles used and significant estimates made by management, and evaluating the overall financial statement presentation. We believeOur audit of internal control over financial reporting included obtaining an understanding of internal control over financial reporting, assessing the risk that our audit provides a reasonable basis for our opinion.
PricewaterhouseCoopers LLP
Charlotte, North Carolina
March 25, 2008
72
Reportmaterial weakness exists, and testing and evaluating the design and operating effectiveness of Independent Registered Public Accounting Firm
The Board of Directors and Shareholders
Domtar Corporation:
We have auditedinternal control based on the combined balance sheet of the Weyerhaeuser Fine Paper Business (a Business Unit of Weyerhaeuser Company)assessed risk. Our audits also included performing such other procedures as of December 31, 2006, and the related combined statements of operations, Business Unit equity, comprehensive income (loss), and cash flows for each of the yearswe considered necessary in the two-year period ended December 31, 2006. In connection with our audits of the combined financial statements, we have also audited financial statement schedule II. These combined financial statements and financial statement schedule are the responsibility of the Company’s management. Our responsibility is to express an opinion on these combined financial statements and financial statement schedule based on our audits.
We conducted our audits in accordance with the standards of the Public Company Accounting Oversight Board (United States). Those standards require that we plan and perform the audit to obtain reasonable assurance about whether the financial statements are free of material misstatement. An audit includes examining, on a test basis, evidence supporting the amounts and disclosures in the financial statements. An audit also includes assessing the accounting principles used and significant estimates made by management, as well as evaluating the overall financial statement presentation.circumstances. We believe that our audits provide a reasonable basis for our opinion.opinions.
In our opinion,A company’s internal control over financial reporting is a process designed to provide reasonable assurance regarding the combinedreliability of financial reporting and the preparation of financial statements referred to above present fairly,for external purposes in all material respects, the financial position of the Weyerhaeuser Fine Paper Business (a Business Unit of Weyerhaeuser Company) as of December 31, 2006, and the results of its operations and its cash flows for each of the years in the two-year period ended December 31, 2006, in conformityaccordance with U.S. generally accepted accounting principles. Also, in our opinion, the relatedA company’s internal control over financial statement schedule, when considered in relationreporting includes those policies and procedures that (i) pertain to the basic combinedmaintenance of records that, in reasonable detail, accurately and fairly reflect the transactions and dispositions of the assets of the company; (ii) provide reasonable assurance that transactions are recorded as necessary to permit preparation of financial statements taken asin accordance with generally accepted accounting principles, and that receipts and expenditures of the company are being made only in accordance with authorizations of management and directors of the company; and (iii) provide reasonable assurance regarding prevention or timely detection of unauthorized acquisition, use, or disposition of the company’s assets that could have a whole, presents fairly,material effect on the financial statements.
Because of its inherent limitations, internal control over financial reporting may not prevent or detect misstatements. Also, projections of any evaluation of effectiveness to future periods are subject to the risk that controls may become inadequate because of changes in all material respects,conditions, or that the information set forth therein.degree of compliance with the policies or procedures may deteriorate.
KPMG/s/ PricewaterhouseCoopers LLP
Seattle, WashingtonCharlotte, North Carolina
March 29, 2007, except as to Notes 5 and 24,
which are as of June 19, 2007, and NoteFebruary 26,
which is as of September 24, 2007 2010
7380
CONSOLIDATED STATEMENTSTATEMENTS OF EARNINGS (LOSS)
(IN MILLIONS OF US DOLLARS, UNLESS OTHERWISE NOTED)
| Year ended December 30, 2007 | Year ended December 31, 2006 | Year ended December 25, 2005 | ||||||||||
Sales | $ | 5,947 | $ | 3,306 | $ | 3,267 | ||||||
Operating expenses | ||||||||||||
Cost of sales, excluding depreciation and amortization | 4,757 | 2,676 | 2,784 | |||||||||
Depreciation and amortization | 471 | 311 | 357 | |||||||||
Selling, general and administrative | 408 | 174 | 174 | |||||||||
Impairment of property, plant and equipment (NOTE 16) | 92 | — | 499 | |||||||||
Impairment of goodwill (NOTE 12) | 4 | 749 | 1 | |||||||||
Closure and restructuring costs (NOTE 16) | 14 | 15 | 38 | |||||||||
Other operating income (NOTE 7) | (69 | ) | (63 | ) | (8 | ) | ||||||
| 5,677 | 3,862 | 3,845 | ||||||||||
Operating income (loss) | 270 | (556 | ) | (578 | ) | |||||||
Interest expense (NOTE 8) | 171 | — | — | |||||||||
Earnings (loss) before income taxes | 99 | (556 | ) | (578 | ) | |||||||
Income tax expense (benefit) (NOTE 9) | 29 | 53 | (100 | ) | ||||||||
Net earnings (loss) | 70 | (609 | ) | (478 | ) | |||||||
Per common share (in dollars) (NOTE 5) | ||||||||||||
Net earnings (loss) | ||||||||||||
Basic | 0.15 | (2.14 | ) | (1.68 | ) | |||||||
Diluted | 0.15 | (2.14 | ) | (1.68 | ) | |||||||
Weighted average number of common and exchangeable shares outstanding (millions) | ||||||||||||
Basic | 474.1 | 284.1 | 284.1 | |||||||||
Diluted | 475.9 | 284.1 | 284.1 | |||||||||
The accompanying notes are an integral part of the consolidated financial statements.
74
(IN MILLIONS OF US DOLLARS, UNLESS OTHERWISE NOTED)
| December 30, 2007 | December 31, 2006 | |||||||
Assets | ||||||||
Current assets | ||||||||
Cash and cash equivalents | $ | 71 | $ | 1 | ||||
Receivables, less allowances of $9 and $2 (NOTE 10) | 542 | 340 | ||||||
Inventories (NOTE 11) | 936 | 520 | ||||||
Prepaid expenses | 14 | 6 | ||||||
Income and other taxes receivable | 53 | — | ||||||
Deferred income taxes (NOTE 9) | 182 | 22 | ||||||
Total current assets | 1,798 | 889 | ||||||
Property, plant and equipment, at cost (NOTE 13) | 9,685 | 6,696 | ||||||
Accumulated depreciation (NOTE 13) | (4,323 | ) | (3,631 | ) | ||||
Net property, plant and equipment (NOTE 13) | 5,362 | 3,065 | ||||||
Goodwill (NOTE 12) | 372 | 14 | ||||||
Intangible assets, net of amortization (NOTE 14) | 111 | — | ||||||
Other assets (NOTE 15) | 105 | 30 | ||||||
Total assets | 7,748 | 3,998 | ||||||
Liabilities and shareholders’ equity | ||||||||
Current liabilities | ||||||||
Bank indebtedness | 63 | — | ||||||
Trade and other payables (NOTE 17) | 765 | 250 | ||||||
Income and other taxes payable | 50 | 6 | ||||||
Long-term debt due within one year (NOTE 18) | 17 | 12 | ||||||
Total current liabilities | 895 | 268 | ||||||
Long-term debt (NOTE 18) | 2,213 | 32 | ||||||
Deferred income taxes (NOTE 9) | 1,003 | 758 | ||||||
Other liabilities and deferred credits (NOTE 19) | 440 | 25 | ||||||
Commitments and contingencies (NOTE 21) | ||||||||
Shareholders’ equity | ||||||||
Business Unit equity | — | 2,852 | ||||||
Common stock (NOTE 20) | 5 | — | ||||||
Exchangeable shares (NOTE 20) | 293 | — | ||||||
Additional paid-in capital | 2,573 | — | ||||||
Retained earnings | 47 | — | ||||||
Accumulated other comprehensive income | 279 | 63 | ||||||
Total shareholders’ equity | 3,197 | 2,915 | ||||||
Total liabilities and shareholders’ equity | 7,748 | 3,998 | ||||||
The accompanying notes are an integral part of the consolidated financial statements.
75
CONSOLIDATED STATEMENT OF SHAREHOLDERS’ EQUITY
(IN MILLIONS OF US DOLLARS, UNLESS OTHERWISE NOTED)
CONSOLIDATED STATEMENT OF | Issued and outstanding common and exchangeable stock (millions of shares) | Common stock, at par | Exchangeable shares | Business Unit equity | Additional paid-in capital | Retained earnings | Accumulated other comprehensive income | Total shareholders’ equity | |||||||||||||||||||
Balance at December 26, 2004 | — | $ | — | $ | — | $ | 4,148 | $ | — | $ | — | $ | 113 | $ | 4,261 | ||||||||||||
Net loss | — | — | — | (478 | ) | — | — | — | (478 | ) | |||||||||||||||||
Foreign currency translation adjustments | — | — | — | — | — | — | (50 | ) | (50 | ) | |||||||||||||||||
Additional minimum pension liability adjustments, net of tax | — | — | — | — | — | — | (6 | ) | (6 | ) | |||||||||||||||||
Contribution from Weyerhaeuser Co | — | — | — | 37 | — | — | — | 37 | |||||||||||||||||||
Cash flow hedge fair value adjustment, | — | — | — | — | — | — | 9 | 9 | |||||||||||||||||||
Balance as at December 25, 2005 | — | — | — | 3,707 | — | — | 66 | 3,773 | |||||||||||||||||||
Net loss | — | — | — | (609 | ) | — | — | — | (609 | ) | |||||||||||||||||
Foreign currency translation adjustments | — | — | — | — | — | — | 19 | 19 | |||||||||||||||||||
Additional minimum pension liability adjustments, net of tax | — | — | — | — | — | — | 6 | 6 | |||||||||||||||||||
Adjustment to initially adopt SFAS 158 | — | — | — | — | — | — | (12 | ) | (12 | ) | |||||||||||||||||
Distribution to Weyerhaeuser Co | — | — | — | (246 | ) | — | — | — | (246 | ) | |||||||||||||||||
Cash flow hedge fair value adjustment, | — | — | — | — | — | — | (16 | ) | (16 | ) | |||||||||||||||||
Balance at December 31, 2006 | — | — | — | 2,852 | — | — | 63 | 2,915 | |||||||||||||||||||
Contribution of Weyerhaeuser fine paper business to Domtar Corporation | 284.1 | 3 | — | — | — | — | — | 3 | |||||||||||||||||||
Net earnings to March 6, 2007 | — | — | — | 23 | — | — | — | 23 | |||||||||||||||||||
Distribution to Weyerhaeuser Co prior to March 7, 2007 | — | — | — | (1,431 | ) | — | — | — | (1,431 | ) | |||||||||||||||||
Acquisition of Domtar Inc. (NOTE 3) | 231.0 | 2 | 500 | — | 1,032 | — | — | 1,534 | |||||||||||||||||||
Post closing adjustments (NOTE 1) | — | — | — | (112 | ) | — | — | 5 | (107 | ) | |||||||||||||||||
Transfer of business unit equity | — | — | — | (1,332 | ) | 1,332 | — | — | — | ||||||||||||||||||
Conversion of exchangeable shares | — | — | (207 | ) | — | 207 | — | — | — | ||||||||||||||||||
Issuance of common shares | 0.3 | — | — | — | 2 | — | — | 2 | |||||||||||||||||||
Net earnings from March 7 to December 30, 2007 (NOTE 1) | — | — | — | — | — | 47 | — | 47 | |||||||||||||||||||
Foreign currency translation adjustments, net of tax | — | — | — | — | — | — | 250 | 250 | |||||||||||||||||||
Change in unrecognized losses and prior service cost related to pension and post retirement benefit plans, net of tax | — | — | — | — | — | — | (39 | ) | (39 | ) | |||||||||||||||||
Balance at December 30, 2007 | 515.4 | 5 | 293 | — | 2,573 | 47 | 279 | 3,197 | |||||||||||||||||||
| Year ended December 31, 2009 | Year ended December 31, 2008 | Year ended December 30, 2007 | |||||||
| $ | $ | $ | |||||||
Sales | 5,465 | 6,394 | 5,947 | ||||||
Operating expenses | |||||||||
Cost of sales, excluding depreciation and amortization | 4,472 | 5,225 | 4,757 | ||||||
Depreciation and amortization | 405 | 463 | 471 | ||||||
Selling, general and administrative | 345 | 400 | 408 | ||||||
Impairment and write-down of property, plant and equipment (NOTE 4) | 62 | 383 | 92 | ||||||
Impairment of goodwill and intangible assets (NOTE 4) | — | 325 | 4 | ||||||
Closure and restructuring costs (NOTE 17) | 63 | 43 | 14 | ||||||
Other operating income (NOTE 8) | (497 | ) | (8 | ) | (69 | ) | |||
| 4,850 | 6,831 | 5,677 | |||||||
Operating income (loss) | 615 | (437 | ) | 270 | |||||
Interest expense (NOTE 9) | 125 | 133 | 171 | ||||||
Earnings (loss) before income taxes | 490 | (570 | ) | 99 | |||||
Income tax expense (NOTE 10) | 180 | 3 | 29 | ||||||
Net earnings (loss) | 310 | (573 | ) | 70 | |||||
Per common share (in dollars) (NOTE 6) | |||||||||
Net earnings (loss) | |||||||||
Basic | 7.21 | (13.33 | ) | 1.77 | |||||
Diluted | 7.18 | (13.33 | ) | 1.76 | |||||
Weighted average number of common and exchangeable shares outstanding (millions) | |||||||||
Basic | 43.0 | 43.0 | 39.5 | ||||||
Diluted | 43.2 | 43.0 | 39.7 |
The accompanying notes are an integral part of the consolidated financial statements.
7681
CONSOLIDATED STATEMENT OF COMPREHENSIVE INCOME (LOSS)BALANCE SHEETS
(IN MILLIONS OF US DOLLARS)DOLLARS, UNLESS OTHERWISE NOTED)
| Year ended December 30, 2007 | Year ended December 31, 2006 | Year ended December 25, 2005 | |||||||
Net earnings (loss) | $ | 70 | $ | (609) | $ | (478) | |||
Other comprehensive income (loss) | |||||||||
Foreign currency translation adjustments, net of tax | 250 | 19 | (50) | ||||||
Additional minimum pension liability adjustment, net of tax | — | 6 | (6) | ||||||
Change in unrecognized losses and prior service cost related to pension and post retirement benefit plans, net of tax | (39) | — | — | ||||||
Net change in cash flow fair value adjustments, net of tax | — | (16) | 9 | ||||||
Comprehensive income (loss) | 281 | (600) | (525) | ||||||
| December 31, 2009 | December 31, 2008 | |||||
| $ | $ | |||||
Assets | ||||||
Current assets | ||||||
Cash and cash equivalents | 324 | 16 | ||||
Receivables, less allowances of $8 and $11 (NOTE 11) | 536 | 477 | ||||
Inventories (NOTE 12) | 745 | 963 | ||||
Prepaid expenses | 46 | 27 | ||||
Income and other taxes receivable | 414 | 56 | ||||
Deferred income taxes (NOTE 10) | 137 | 116 | ||||
Total current assets | 2,202 | 1,655 | ||||
Property, plant and equipment, at cost | 9,575 | 8,963 | ||||
Accumulated depreciation | (5,446 | ) | (4,662 | ) | ||
Net property, plant and equipment (NOTE 14) | 4,129 | 4,301 | ||||
Intangible assets, net of amortization (NOTE 15) | 85 | 81 | ||||
Other assets (NOTE 16) | 103 | 67 | ||||
Total assets | 6,519 | 6,104 | ||||
Liabilities and shareholders’ equity | ||||||
Current liabilities | ||||||
Bank indebtedness | 43 | 43 | ||||
Trade and other payables (NOTE 19) | 686 | 646 | ||||
Income and other taxes payable | 31 | 36 | ||||
Long-term debt due within one year (NOTE 20) | 11 | 18 | ||||
Total current liabilities | 771 | 743 | ||||
Long-term debt (NOTE 20) | 1,701 | 2,110 | ||||
Deferred income taxes and other (NOTE 10) | 1,019 | 824 | ||||
Other liabilities and deferred credits (NOTE 21) | 366 | 284 | ||||
Commitments and contingencies (NOTE 23) | ||||||
Shareholders’ equity | ||||||
Common stock (NOTE 22) $0.01 par value; authorized 2,000,000,000 shares; issued and outstanding: 42,062,408 and 41,219,727 shares | — | 5 | ||||
Exchangeable shares (NOTE 22) No par value; unlimited shares authorized; issued and held by nonaffiliates: 982,321 and 1,741,358 shares | 78 | 138 | ||||
Additional paid-in capital | 2,816 | 2,743 | ||||
Accumulated deficit | (216 | ) | (526 | ) | ||
Accumulated other comprehensive loss | (16 | ) | (217 | ) | ||
Total shareholders’ equity | 2,662 | 2,143 | ||||
Total liabilities and shareholders’ equity | 6,519 | 6,104 | ||||
The accompanying notes are an integral part of the consolidated financial statements.
7782
CONSOLIDATED STATEMENTSTATEMENTS OF CASH FLOWSSHAREHOLDERS’ EQUITY
(IN MILLIONS OF US DOLLARS)DOLLARS, UNLESS OTHERWISE NOTED)
| Year ended December 30, 2007 | Year ended December 31, 2006 | Year ended December 25, 2005 | ||||||||||
Operating activities | ||||||||||||
Net earnings (loss) | $ | 70 | $ | (609 | ) | $ | (478 | ) | ||||
Adjustments to reconcile net earnings (loss) to cash flows from operating activities | ||||||||||||
Depreciation and amortization | 471 | 311 | 357 | |||||||||
Deferred income taxes (NOTE 9) | (73 | ) | (52 | ) | (135 | ) | ||||||
Closure and restructuring costs (NOTE 16) | 14 | 15 | 38 | |||||||||
Impairment of property, plant and equipment (NOTE 16) | 92 | — | 499 | |||||||||
Impairment of goodwill (NOTE 12) | 4 | 749 | 1 | |||||||||
Debt restructuring costs | 25 | — | — | |||||||||
Other | (2 | ) | 4 | — | ||||||||
Changes in assets and liabilities, net of effects of acquisition | ||||||||||||
Receivables | (75 | ) | (19 | ) | (40 | ) | ||||||
Inventories | 38 | 43 | (25 | ) | ||||||||
Prepaid expenses | 6 | (2 | ) | (4 | ) | |||||||
Trade and other payables | 54 | (79 | ) | (9 | ) | |||||||
Income and other taxes | 49 | — | — | |||||||||
Other assets and other liabilities | (67 | ) | (4 | ) | (14 | ) | ||||||
Cash flows provided from operating activities | 606 | 357 | 190 | |||||||||
Investing activities | ||||||||||||
Additions to property, plant and equipment | (116 | ) | (64 | ) | (113 | ) | ||||||
Proceeds from disposals of property, plant and equipment | 29 | 1 | 4 | |||||||||
Business acquisitions—cash acquired | 573 | — | — | |||||||||
Other | (1 | ) | — | — | ||||||||
Cash flows provided from (used for) investing activities | 485 | (63 | ) | (109 | ) | |||||||
Financing activities | ||||||||||||
Net change in bank indebtedness | (21 | ) | — | — | ||||||||
Drawdown of revolving bank credit facility | 50 | — | — | |||||||||
Issuance of short-term debt | 1,350 | — | — | |||||||||
Issuance of long-term debt | 800 | — | — | |||||||||
Repayment of short-term debt | (1,350 | ) | — | — | ||||||||
Repayment of long-term debt | (311 | ) | (7 | ) | (6 | ) | ||||||
Debt issue costs | (39 | ) | — | — | ||||||||
Premium on redemption of long-term debt | (40 | ) | — | — | ||||||||
Repurchase of minority interest | (28 | ) | — | — | ||||||||
Distribution to Weyerhaeuser prior to March 7, 2007 | (1,431 | ) | (287 | ) | (76 | ) | ||||||
Other | (5 | ) | — | — | ||||||||
Cash flows used for financing activities | (1,025 | ) | (294 | ) | (82 | ) | ||||||
Net increase (decrease) in cash and cash equivalents | 66 | — | (1 | ) | ||||||||
Translation adjustments related to cash and cash equivalents | 4 | — | — | |||||||||
Cash and cash equivalents at beginning of year | 1 | 1 | 2 | |||||||||
Cash and cash equivalents at end of year | 71 | 1 | 1 | |||||||||
Supplemental cash flow information | ||||||||||||
Net cash payments for: | ||||||||||||
Interest | 155 | — | — | |||||||||
Income taxes | 112 | — | — | |||||||||
| Issued and outstanding common and exchangeable shares (millions of shares) | Common stock, at par | Exchangeable shares | Business Unit equity | Additional paid-in capital | Retained earnings (Accumulated deficit) | Accumulated other comprehensive income (loss) | Total shareholders’ equity | ||||||||||||||||
| $ | $ | $ | $ | $ | $ | $ | |||||||||||||||||
Balance at December 31, 2006 | — | — | — | 2,852 | — | — | 63 | 2,915 | |||||||||||||||
Contribution of Weyerhaeuser fine paper business to Domtar Corporation | 284.1 | 3 | — | — | — | — | — | 3 | |||||||||||||||
Net earnings to March 6, 2007 | — | — | — | 23 | — | — | — | 23 | |||||||||||||||
Distribution to Weyerhaeuser Co prior to March 7, 2007 | — | — | — | (1,431 | ) | — | — | — | (1,431 | ) | |||||||||||||
Acquisition of Domtar Inc. (NOTE 3) | 231.0 | 2 | 500 | — | 1,032 | — | — | 1,534 | |||||||||||||||
Post closing adjustments (NOTE 1) | — | — | — | (112 | ) | — | — | 5 | (107 | ) | |||||||||||||
Transfer of business unit equity | — | — | — | (1,332 | ) | 1,332 | — | — | — | ||||||||||||||
Conversion of exchangeable shares | — | — | (207 | ) | — | 207 | — | — | — | ||||||||||||||
Issuance of common shares | 0.3 | — | — | — | 2 | — | — | 2 | |||||||||||||||
Net earnings from March 7 to December 30, 2007 | — | — | — | — | — | 47 | — | 47 | |||||||||||||||
Foreign currency translation adjustments, net of tax | — | — | — | — | — | — | 250 | 250 | |||||||||||||||
Change in unrecognized losses and prior service cost related to pension and post retirement benefit plans, net of tax | — | — | — | — | — | — | (39 | ) | (39 | ) | |||||||||||||
Balance at December 30, 2007 | 515.4 | 5 | 293 | — | 2,573 | 47 | 279 | 3,197 | |||||||||||||||
Conversion of exchangeable shares | — | — | (155 | ) | — | 155 | — | — | — | ||||||||||||||
Issuance of common shares | 0.1 | — | — | — | 1 | — | — | 1 | |||||||||||||||
Stock-based compensation | — | — | — | — | 14 | — | — | 14 | |||||||||||||||
Net loss | — | — | — | — | — | (573 | ) | — | (573 | ) | |||||||||||||
Net derivative losses on cash flow hedges: | |||||||||||||||||||||||
Net loss arising during the period, net of tax of $3 | — | — | — | — | — | — | (77 | ) | (77 | ) | |||||||||||||
Less: Reclassification adjustments for losses included in net loss, net of tax of nil | 25 | 25 | |||||||||||||||||||||
Foreign currency translation adjustments, net of tax | — | — | — | — | — | — | (392 | ) | (392 | ) | |||||||||||||
Change in unrecognized losses and prior service cost related to pension and post retirement benefit plans, net of tax | — | — | — | — | — | — | (53 | ) | (53 | ) | |||||||||||||
Amortization of prior service costs | — | — | — | — | — | — | 1 | 1 | |||||||||||||||
Balance at December 31, 2008 | 515.5 | 5 | 138 | — | 2,743 | (526 | ) | (217 | ) | 2,143 | |||||||||||||
Conversion of exchangeable shares | — | — | (60 | ) | — | 60 | — | — | — | ||||||||||||||
Reverse stock split (12:1) | (472.5 | ) | (5 | ) | — | — | 5 | — | — | — | |||||||||||||
Stock-based compensation | — | — | — | — | 8 | — | — | 8 | |||||||||||||||
Net earnings | — | — | — | — | — | 310 | — | 310 | |||||||||||||||
Net derivative gains on cash flow hedges: | |||||||||||||||||||||||
Net gain arising during the period, net of tax $2 | — | — | — | — | — | — | 51 | 51 | |||||||||||||||
Less: Reclassification adjustments for gains included in net earnings, net of tax of $1 | — | — | — | — | — | — | 18 | 18 | |||||||||||||||
Foreign currency translation adjustments, net of tax | — | — | — | — | — | — | 206 | 206 | |||||||||||||||
Change in unrecognized losses and prior service cost related to pension and post retirement benefit plans, net of tax | — | — | — | — | — | — | (74 | ) | (74 | ) | |||||||||||||
Balance at December 31, 2009 | 43.0 | — | 78 | — | 2,816 | (216 | ) | (16 | ) | 2,662 | |||||||||||||
The accompanying notes are an integral part of the consolidated financial statements.
7883
CONSOLIDATED STATEMENTS OF CASH FLOWS
(IN MILLIONS OF DOLLARS)
| Year ended December 31, 2009 | Year ended December 31, 2008 | Year ended December 30, 2007 | |||||||
| $ | $ | $ | |||||||
Operating activities | |||||||||
Net earnings (loss) | 310 | (573 | ) | 70 | |||||
Adjustments to reconcile net earnings (loss) to cash flows from operating activities | |||||||||
Depreciation and amortization | 405 | 463 | 471 | ||||||
Deferred income taxes and tax uncertainties (NOTE 10) | 157 | (42 | ) | (73 | ) | ||||
Impairment and write-down of property, plant and equipment (NOTE 4) | 62 | 383 | 92 | ||||||
Impairment of goodwill and intangible assets (NOTE 4) | — | 325 | 4 | ||||||
Gain on repurchase of long-term debt and debt restructuring costs | (12 | ) | (11 | ) | 25 | ||||
Net gains on disposals of property, plant and equipment and sale of trademarks | (5 | ) | (9 | ) | — | ||||
Stock-based compensation expense | 8 | 16 | 12 | ||||||
Other | 14 | 12 | (2 | ) | |||||
Changes in assets and liabilities, net of effects of acquisition | |||||||||
Receivables | (55 | ) | 7 | (39 | ) | ||||
Inventories | 261 | (85 | ) | 38 | |||||
Prepaid expenses | (3 | ) | (19 | ) | 6 | ||||
Trade and other payables | 38 | (117 | ) | 68 | |||||
Income and other taxes | (357 | ) | 13 | 13 | |||||
Difference between employer pension and other post-retirement contributions and pension and other post-retirement expense | (61 | ) | (141 | ) | (69 | ) | |||
Other assets and other liabilities | 30 | (25 | ) | (10 | ) | ||||
Cash flows provided from operating activities | 792 | 197 | 606 | ||||||
Investing activities | |||||||||
Additions to property, plant and equipment | (106 | ) | (163 | ) | (116 | ) | |||
Proceeds from disposals of property, plant and equipment and sale of trademarks | 21 | 35 | 29 | ||||||
Business acquisition—cash acquired | — | — | 573 | ||||||
Business acquisition—joint venture | — | (12 | ) | — | |||||
Other | — | — | (1 | ) | |||||
Cash flows provided from (used for) investing activities | (85 | ) | (140 | ) | 485 | ||||
Financing activities | |||||||||
Net change in bank indebtedness | — | (24 | ) | (21 | ) | ||||
Change of revolving bank credit facility | (60 | ) | 10 | 50 | |||||
Issuance of short-term debt | — | — | 1,350 | ||||||
Issuance of long-term debt | 385 | — | 800 | ||||||
Repayment of short-term debt | — | — | (1,350 | ) | |||||
Repayment of long-term debt | (725 | ) | (95 | ) | (311 | ) | |||
Debt issue costs | (14 | ) | — | (39 | ) | ||||
Premium on redemption of long-term debt | — | — | (40 | ) | |||||
Repurchase of minority interest | — | — | (28 | ) | |||||
Distribution to Weyerhaeuser prior to March 7, 2007 | — | — | (1,431 | ) | |||||
Other | — | — | (5 | ) | |||||
Cash flows used for financing activities | (414 | ) | (109 | ) | (1,025 | ) | |||
Net increase (decrease) in cash and cash equivalents | 293 | (52 | ) | 66 | |||||
Translation adjustments related to cash and cash equivalents | 15 | (3 | ) | 4 | |||||
Cash and cash equivalents at beginning of year | 16 | 71 | 1 | ||||||
Cash and cash equivalents at end of year | 324 | 16 | 71 | ||||||
Supplemental cash flow information | |||||||||
Net cash payments for: | |||||||||
Interest | 125 | 120 | 155 | ||||||
Income taxes paid (refund) | (20 | ) | 49 | 112 | |||||
The accompanying notes are an integral part of the consolidated financial statements.
84
TABLE OF CONTENTS
INDEX FOR NOTES TO CONSOLIDATED FINANCIAL STATEMENTS
NOTE 1 | ||||
NOTE 2 | ||||
NOTE 3 | ||||
NOTE 4 |
| |||
NOTE 5 |
| |||
NOTE 6 |
| |||
NOTE 7 | PENSION PLANS AND OTHER | |||
NOTE 8 |
| |||
NOTE 9 |
| |||
NOTE 10 |
| |||
NOTE 11 |
| |||
NOTE 12 |
| |||
NOTE 13 |
| |||
NOTE 14 |
| |||
NOTE 15 |
| |||
NOTE 16 |
| |||
NOTE 17 | ||||
NOTE 18 |
| |||
NOTE 19 | ||||
NOTE 20 |
| |||
NOTE 21 |
| |||
NOTE 22 |
| |||
NOTE 23 |
| |||
NOTE 24 |
| |||
NOTE 25 |
| |||
NOTE 26 | ||||
7985
NOTES TO CONSOLIDATED FINANCIAL STATEMENTS
DECEMBER 30, 200731, 2009
(IN MILLIONS OF US DOLLARS, UNLESS OTHERWISE NOTED)
NOTE 1.
SUMMARY OF SIGNIFICANT ACCOUNTING POLICIES
BACKGROUND
Domtar Corporation (“the Company” or “Domtar”) was incorporated on August 16, 2006 for the sole purpose of holding the Weyerhaeuser Fine Paper Business (the “Business Unit”) and consummating the combination of the Business Unit with Domtar Inc. (the “Transaction”). The Business Unit was operated by Weyerhaeuser Company (“Weyerhaeuser”) prior to the completion of the Transaction.
On August 22, 2006, Weyerhaeuser and certain wholly100% owned subsidiaries entered into an agreement with Domtar Inc. providing for:
A series of transfers and other transactions resulting in the Business Unit becoming wholly100% owned by the Company (the “Contribution”);
The distribution of shares of the Company to Weyerhaeuser shareholders (the “Distribution”); and
The combination of Domtar Inc., treated as a purchase for accounting purposes, with the Company.
The Transaction was consummated on March 7, 2007. Domtar Corporation had no operations prior to March 7, 2007 when, upon the completion of the Transaction, it became an independent public holding company that, directly or indirectly through its subsidiaries, owns the Business Unit and Domtar Inc. As of the date of consummation of the Transaction, Domtar Corporation is referred to as the “Successor.”
For accounting and financial reporting purposes, the Business Unit is considered to be the “Predecessor” to Domtar and as a result, its historical financial statements now constitute the historical financial statements of Domtar. Accordingly, the results reported for 2009 and 2008 include results of the Successor for the entire period and those reported for 2007 include the results of operations of the Business Unit, on a carve-out basis, for the period from January 1, 2007 to March 6, 2007 and the results of operations of the Successor for the period from March 7, 2007 to December 30, 2007.
Domtar Inc. is an integrated manufacturer of uncoated free sheetfreesheet with pulp, paper and converting facilities in the United States and Canada. Domtar Inc.’s paper business is thewas its most significant segment. In addition to the paper business, Domtar Inc. manufactures and markets lumber and wood-based value-added products and engages in the paper merchants business, which involves the purchasing, warehousing, sale and distribution of various paper products made by Domtar Inc. and by other manufacturers.
The Business Unit consists of pulp and paper mills, converting operations, sawmills, forest management licenses and related assets. These facilities are principally engaged in the harvesting of timber and the manufacture, distribution and sale of paper, pulp, and forest products, including softwood lumber.
Although Weyerhaeuser Company does not have a continuing proprietary interest in Domtar Corporation, the Company entered into several agreements with Weyerhaeuser Company and/or certain of its subsidiaries in connection with the Transaction, including a tax sharing agreement, an intellectual property licensing agreement, a transition services agreement, fiber and pulp supply agreements and site services agreements. These agreements enable
86
NOTES TO CONSOLIDATED FINANCIAL STATEMENTS
DECEMBER 31, 2009
(IN MILLIONS OF DOLLARS, UNLESS OTHERWISE NOTED)
enabled the Company to continue to operate the Business Unit efficiently following the completion of the Transaction. The majority of the transition services agreement was completed at the end of 2008, of which the balance was completed in early 2009.
BASIS OF PRESENTATION
The Contribution constituted a transfer of net assets between entities under common control, and as a result, the Company reports the accounts of the Business Unit at their historical cost or carry over basis as of the date of
80
NOTES TO CONSOLIDATED FINANCIAL STATEMENTS
DECEMBER 30, 2007
(IN MILLIONS OF US DOLLARS, UNLESS OTHERWISE NOTED)
the Contribution. The agreements giving effect to the spin-off of the Business Unit provide for various post-closing transaction adjustments and the resolution of outstandingmatters. There are no unresolved matters which are expected to be addressed by the parties during 2008.at December 31, 2009. The post-closing adjustments made through December 30, 2007 are as follows: $38 million increase in long-term liabilities and decrease in Business Unit equity related to the recognition of other post-retirement benefit obligations (including $3 million for post-employment benefit obligations) that were assumed as part of the Transaction but were not reflected in the historical carve outcarve-out financial statements of the Weyerhaeuser Fine Paper Business; $21 million increase in deferred tax liabilities and decrease in Business Unit equity related to the contribution of Canadian assets with a tax basis that was different Post-Transaction than was assumed in the carve outcarve-out financial statements; $44 million decrease in property, plant and equipment related to differences in the carve outcarve-out basis of shared assets versus the basis of assets actually transferred in the transaction; $4 million increase in trade and other payables. Certain balance sheet matters remain under discussion with Weyerhaeuser. Resolution of these discussions may lead to an adjustment to additional paid-in capital or results of operations.
The combination of Domtar Inc. with the Company constituted, for accounting purposes, the acquisition of Domtar Inc. by Domtar Corporation and, as a result, the Company reports the results of Domtar Inc. starting on March 7, 2007.
For accounting and financial reporting purposes, the Business Unit is considered to be the surviving entity following the Transaction. As a result,In June 2009, the Company is required to present historicalcarried out a reverse stock split, as described in Note 6. All previously reported share and per share amounts have been retrospectively restated in the accompanying consolidated financial statements as though it owned onlyand related notes to reflect the Business Unit priorreverse stock split.
The Company has evaluated events and transactions occurring subsequent to the Transaction. Further, asConsolidated Balance Sheet date of December 31, 2009, for items that should potentially be recognized or disclosed in these consolidated financial statements. The evaluation was conducted through February 26, 2010, the Company had no operations and substantially no assets prior todate the Contribution, the “Predecessor” financial statements are those of the Business Unit. Accordingly, the results reported for the years ended December 31, 2006 and December 25, 2005 include only the results of operations of the Predecessor and the results reported for the year ended December 30, 2007 include the results of operations of the Predecessor for the period from January 1, 2007 to March 6, 2007 and the results of operations of the Successor for the period from March 7, 2007 to December 30, 2007.were issued.
PREDECESSOR FINANCIAL STATEMENTS FOR PERIODSPERIOD PRIOR TO MARCH 7, 2007
The combined financial statements of the Business Unit have been prepared in accordance with accounting principles generally accepted in the United States of America (“GAAP”) for the purpose of presenting the Business Unit’s financial position, results of operations and cash flows. The combined financial statements have been derived from historical accounting records of Weyerhaeuser. The historical operating results and cash flows of the Business Unit may not be indicative of what they would have been had the Business Unit been a stand-alone entity, nor are they necessarily indicative of what the Business Unit’s operating results and cash flows may be in the future.
The combined statements of operationsearnings for the Business Unit include allocations of certain costs from Weyerhaeuser directly related to the operations of the Business Unit, including an apportionment of certain centralized general and administrative costs for accounting, human resources, purchasing, information systems, transaction services, payroll processing costs, legal fees and other overhead costs. These centralized costs were
87
NOTES TO CONSOLIDATED FINANCIAL STATEMENTS
DECEMBER 31, 2009
(IN MILLIONS OF DOLLARS, UNLESS OTHERWISE NOTED)
allocated to the Business Unit using a three-part apportionment factor based on relative headcount, assets and certain revenue. Weyerhaeuser pension and other post-retirement benefits expense was allocated based on relative salaried headcount, with the exception of pension expense of four Canadian pension plans related solely to the Business Unit which are directly included in the combined statements of operations. Management believes the methodology applied for the allocation of these costs is reasonable. Except for an immaterial amount of interest on capital leases and debt that was assumed by the Company, interest expense has not been allocated to the Business Unit.
81
NOTES TO CONSOLIDATED FINANCIAL STATEMENTS
DECEMBER 30, 2007
(IN MILLIONS OF US DOLLARS, UNLESS OTHERWISE NOTED)
Certain of the Business Unit’s working capital assets and liabilities were common assets and liabilities shared with Weyerhaeuser facilities not part of the Business Unit. Allocations were performed in order to reflect the appropriate portion of each asset and liability in the accounts of the Business Unit. The allocations were based on third party sales percentages, headcount percentages or a three-part apportionment factor based on relative headcount, assets and certain revenue. Goodwill is allocated based on relative fair value. Management believes the methodology used for the asset and liability allocations is reasonable.
Significant differences in the funding and operation of the Business Unit may have existed if it operated as an independent, stand-alone entity, including the need for debt and the incurrence of interest expense, which could have had a significant impact on the financial position and results of operations.
The consolidated financial statements include the accounts of Domtar Corporation and its controlled subsidiaries. The accounting policies applied by the Successor are the same as the ones applied by the Predecessor. Starting in 2008, the fiscal year is based on a calendar year and ends December 31. Fiscal years 2009 and 2008 consist of 52 weeks and one day and 52 weeks and three days, respectively, and fiscal year 2007, consisted of 52 weeks. To conform with the basis of presentation adopted in the current period, certain figures previously reported have been reclassified. For purposes of comparability between periods as well as ease of readability, the Predecessor financial statements included herein have been renamed to conform to the conventions used for the December 30, 2007 annual financial statements including the reference to “consolidated financial statements.” The consolidated financial statements include the accounts of Domtar Corporation and all wholly-owned subsidiaries.
USE OF ESTIMATES
The consolidated financial statements have been prepared in conformity with GAAP, which require management to make estimates and assumptions that affect the reported amounts of revenues and expenses during the year, the reported amounts of assets and liabilities, and the disclosure of contingent assets and liabilities at the date of the consolidated financial statements. On an ongoing basis, management reviews the estimates and assumptions, including those related to environmental matters, useful lives, impairment of long-lived assets, and goodwill, pension and other employee future benefit plans, income taxes, closure and restructuring costs, commitments and contingencies and asset retirement obligations, based on currently available information. Actual results could differ from those estimates.
TRANSLATION OF FOREIGN CURRENCIES
SELF-SUSTAINING FOREIGN OPERATIONS
The local currency is considered the functional currency for the Company’s operations outside the United States. For foreign subsidiaries that are considered financially and operationally self-sustaining, the current rate method of translation of foreign currencies has been used. Under this method,Foreign currency denominated assets and liabilities are translated into U.S. dollars at the rate in effect at the balance sheet date and revenues and expenses are translated at the average exchange rates during the year. All gains and losses arising from the translation of the financial statements of these foreign subsidiaries are included in the “AccumulatedAccumulated other comprehensive income” account under “Shareholders’loss a component of Shareholders’ equity.”
VARIABLE INTEREST ENTITIES
Variable interest entities (VIE) Foreign currency transaction gain and losses are entitiesincluded in which equity investors do not have a controlling financial interest oroperations in the equity investment at risk is not sufficient to permit the entity to finance its activities without additional subordinated financial support provided by other parties. Domtar Corporation consolidates the VIE if Domtar Corporation is considered the VIE’s primary beneficiary, defined as the party that receives the majorityperiod they occur.
8288
NOTES TO CONSOLIDATED FINANCIAL STATEMENTS
DECEMBER 30, 200731, 2009
(IN MILLIONS OF US DOLLARS, UNLESS OTHERWISE NOTED)
of the expected residual returns and/or that absorbs the majority of the entity’s expected losses. As a result, Domtar Corporation consolidates the operations of Wapawekka Lumber LP (“Wapawekka”). Wapawekka is considered a VIE because its equity at risk was deemed to be less than its expected losses. Wapawekka is a 51% owned limited partnership that operates a sawmill in Saskatchewan, Canada.
REVENUE RECOGNITION
Domtar Corporation recognizes revenue when persuasive evidence of an arrangement exists, when goods are shipped, when there are no uncertainties surrounding product acceptance, when the related revenue is fixed or determinable, when collection is considered reasonably assured andrevenues when the customer takes title and assumes the majority of the risks and rewards of ownership. Revenue is recorded at the time of shipment for terms designated free on board (f.o.b) shipping point. For sales transactions designated f.o.b. destination, revenue is recorded when the product is delivered to the customer’s delivery site, when the title and risk of loss are transferred.
SHIPPING AND HANDLING COSTS
The Company classifies shipping and handling costs as a component of Cost of sales in the consolidated statementsConsolidated Statements of earnings (loss)Earnings (Loss).
CLOSURE AND RESTRUCTURING COSTS
Closure and restructuring costs are recognized as liabilities in the period when they are incurred and are measured at their fair value. For such recognition to occur, management, with the appropriate level of authority, must have approved and committed to a firm plan and appropriate communication to those affected must have occurred. These provisions require an estimation of costs such as severance and termination benefits, pension and curtailments and environmental remediation, and an evaluation of the remaining assets and their estimated remaining useful life is required to determine the adjusted depreciation expense, and to determine the required write-downs, if any. The closure and restructuring costs also include expenses relating to demolition, training and outplacement.
Estimates of cash flows and fair value relating to closures and restructurings require judgment. Closure and restructuring costs are based on management’s best estimates of future events at December 31, 2009. Closure and restructuring costs estimates are dependent on future events. Although the Company does not anticipate significant changes, the actual costs may differ from these estimates due to subsequent developments such as the results of environmental studies, the ability to find a buyer for assets set to be dismantled and demolished and other business developments. As such, additional costs and further working capital write-downs may be required in future periods.
INCOME TAXES
Domtar Corporation uses the asset and liability method of accounting for income taxes. Under this method, deferred tax assets and liabilities are determined according to differences between the carrying amounts and tax bases of the assets and liabilities. The change in the net deferred tax asset or liability is included in earnings.earnings (loss) and accumulated other comprehensive loss. Deferred tax assets and liabilities are measured using enacted tax rates and laws expected to apply in the years in which the assets and liabilities are expected to be recovered or settled. Uncertain tax positions are recorded based upon the Company’s evaluation of whether it is “more likely than not” that, based upon its technical merits, the tax position will be sustained upon examination by the taxing authorities. The Company establishes a valuation allowance for deferred tax assets when it is more likely than not (a probability level of more than 50 percent) that they will not be realized. In general, “realization” refers to the incremental benefit achieved through the reduction in future taxes payable or an increase in future taxes refundable from the deferred tax assets.
The Company recognizes interest and penalties related to income tax matters as a component of Income tax expense in the consolidated statementConsolidated Statement of earnings (loss)Earnings (Loss).
89
NOTES TO CONSOLIDATED FINANCIAL STATEMENTS
DECEMBER 31, 2009
(IN MILLIONS OF DOLLARS, UNLESS OTHERWISE NOTED)
CASH AND CASH EQUIVALENTS
Cash and cash equivalents include cash and short-term investments with original maturities of less than three months and are presented at cost which approximates fair value.
RECEIVABLES
Receivables are recorded at cost net of a provision for doubtful accounts that is based on expected collectibility. Gains or losses on securitization of receivables are calculated as the difference between the carrying amount of the receivables sold and the sum of the cash proceeds on sale and the fair value of the retained subordinate interest in such receivables on the date of transfer. Fair value is determined on a discounted cash flow basis. Gains or losses related to the sales of receivables are recognized in earnings as a component of Interest expense in the Consolidated Statements of Earnings (Loss) in the period when the sale occurs.
INVENTORIES
Inventories are stated at the lower of cost or market. Cost includes labor, materials and production overhead. The last-in, first-out (“LIFO”) method is used to cost certain domestic raw materials, in process and finished
83
NOTES TO CONSOLIDATED FINANCIAL STATEMENTS
DECEMBER 30, 2007
(IN MILLIONS OF US DOLLARS, UNLESS OTHERWISE NOTED)
goods inventories. LIFO inventories were $350$304 million and $284$426 million at December 30, 200731, 2009 and December 31, 2006,2008, respectively. The balance of domestic raw material inventories, all materials and supplies inventories and all foreign inventories are costed at either the first-in, first-out (“FIFO”) or average cost methods. Had the inventories for which the LIFO method is used been valued under the FIFO method, the amounts at which product inventories are stated would have been $133$58 million and $98$97 million greater at December 30, 200731, 2009 and December 31, 2006,2008, respectively.
PROPERTY, PLANT AND EQUIPMENT
Property, plant and equipment are stated at cost less accumulated depreciation including asset impairment write-downs. Interest costs are capitalized for significant capital projects. For timber limits and timberlands, amortization is calculated using the units of production method. For all other assets, amortization is calculated using the straight-line method over the estimated useful lives of the assets. Buildings and improvements are amortized over periods of 10 to 40 years and machinery and equipment over periods of 3 to 20 years. The depreciation expense is reported net of the amount of the amortization of deferred credits related to property, plant and equipment. No depreciation is recorded on assets under construction.
IMPAIRMENT OF LONG-LIVED ASSETS
Long-lived assets are reviewed for impairment upon the occurrence of events or changes in circumstances indicating that the carrying value of the assets may not be recoverable, as measured by comparing their net book value to their estimated undiscounted future cash flows. Impaired assets are recorded at estimated fair value, determined principally by using discounted future cash flows expected from their use and eventual disposition.
GOODWILL AND INTANGIBLE ASSETS
Goodwill is not amortized and is subject to an annual impairment test, annually or more frequently if events or changes in circumstances indicate that it might be impaired. TestingFor purposes of testing for impairment, the balance of goodwill is assigned to one or more of the Company’s reporting units that are expected to benefit from the synergies of the Transaction. A reporting unit to which goodwill must be assigned is determined to be an operating segment or one level below an operating segment, referred to as a component. A component of an
90
NOTES TO CONSOLIDATED FINANCIAL STATEMENTS
DECEMBER 31, 2009
(IN MILLIONS OF DOLLARS, UNLESS OTHERWISE NOTED)
operating segment is a reporting unit if the component constitutes a business for which discrete financial information is available and segment management regularly reviews the operating results of that component. Two or more components of an operating segment shall be aggregated and deemed a single reporting unit if the components have similar economic characteristics.
A Step I impairment test of goodwill of one or more reporting units is accomplished mainly by determining whether the fair value of a reporting unit, based upon discounted estimated cash flows, exceeds the net carrying amount of that reporting unit as of the assessment date. If the fair value is greater than the net carrying amount, no impairment is necessary. In the event that the net carrying amount exceeds the sum of the discounted estimated cash flows, a secondStep II test must be performed whereby the fair value of the reporting unit’s goodwill must be estimated to determine if it is less than its net carrying amount. Fair value of goodwill in the Step II impairment test is estimated in the same way as goodwill was determined at the date of the acquisition in a business combination, that is, the excess of the fair value of the reporting unit over the fair value of the identifiable net assets of the reporting unit.
Intangible assets were acquired as part of the Transaction. Water rights, customer relationships, trade names and supplier agreements are amortized on a straight-line basis over their estimated useful lives of 40 years, 20 years, 7 years and 5 years, respectively. Natural gas contracts and power purchase agreements are each amortized on a straight-line basis over the term of the respective contract. The weighted-average amortization period is 4 years for natural gas contracts and 25 years for power purchase agreements. Cutting rights are amortized using the units of production method. Any potential impairment for intangible assets will be calculated in the same manner as that disclosed under impairment of long-lived assets.
84
NOTES TO CONSOLIDATED FINANCIAL STATEMENTS
DECEMBER 30, 2007
(IN MILLIONS OF US DOLLARS, UNLESS OTHERWISE NOTED)
OTHER ASSETS
Other assets are recorded at cost. Direct financing costs related to the issuance of long-term debt are deferred and amortized using the effective interest rate method.
ENVIRONMENTAL COSTS
Environmental expenditures for effluent treatment, air emission, landfill operation and closure, asbestos containment and removal, bark pile management, silvicultural activities and site remediation (together referred to as environmental matters) are expensed or capitalized depending on their future economic benefit. In the normal course of business, Domtar Corporation incurs certain operating costs for environmental matters that are expensed as incurred. Expenditures for property, plant and equipment that prevent future environmental impacts are capitalized and amortized on a straight-line basis over 10 to 40 years. Provisions for environmental matters are not discounted, except for a portion which are discounted, due to more certainty with respect to timing of expenditures and are recorded when remediation efforts are likelyprobable and can be reasonably determined.estimated.
ASSET RETIREMENT OBLIGATIONS
Asset retirement obligations are recognized, at fair value, in the period in which Domtar Corporation incurs a legal obligation associated with the retirement of an asset. Conditional asset retirement obligations are recognized, at fair value, when the fair value of the liability can be reasonably estimated.estimated or on a probability-weighted discounted cash flow estimate. The associated costs are capitalized as part of the carrying value of the related asset and depreciated over its remaining useful life. The liability is accreted using athe credit adjusted risk-free interest rate.rate used to discount the cash flow.
91
NOTES TO CONSOLIDATED FINANCIAL STATEMENTS
DECEMBER 31, 2009
(IN MILLIONS OF DOLLARS, UNLESS OTHERWISE NOTED)
STOCK-BASED COMPENSATION AND OTHER STOCK-BASED PAYMENTS
Domtar Corporation uses the fair value based approach of accounting for stock-based payments to directors and employees and for stock options granted to the employees. Any consideration paid by plan participants on the exercise of stock options or the purchase of shares is credited to Additional paid-in capital.
Unless otherwise determined at the time of the grant, time-based awards vest in approximately equal installments over four years beginning on the first anniversary of the grant date and performance-based awards vest based on achievement of pre-determined performance goals over performance periods of three years. Awards may be subject to both performance and time-based vesting. The contributed surplus component of the stock-based compensation is transferred to common shares upon the issuance of shares of common stock.
Deferred Share Units vest immediately at the grant date and are remeasured at each reporting period, until settlement, using the quoted market value. The cost of the common stock acquired by the Company under the Restricted Stock Plan is amortized over the restricted period. Deferred Share Units and common stock acquired under the Restricted Stock Plan are accounted for inas compensation expense and presented in “OtherOther liabilities and deferred credits.”credits on the Consolidated Balance Sheets.
DERIVATIVE INSTRUMENTS
Derivative instruments are contracts that require or provide an option to exchange cash flows or payments determined by applying certain rates, indices or changes therein to notional contract amounts. Derivative instruments are utilized by Domtar Corporation in the management of the foreign currency risk and price risk on certain purchases and sales, and interest rate exposures.
85
NOTES TO CONSOLIDATED FINANCIAL STATEMENTS
DECEMBER 30, 2007
(IN MILLIONS OF US DOLLARS, UNLESS OTHERWISE NOTED)
purchases.
DERIVATIVES DESIGNATED FOR HEDGE ACCOUNTING
In order for a derivative to qualify for hedge accounting, the hedge relationship must be designated and formally documented at its inception, outlining the particular risk, management objective and strategy, the specific asset, liability or cash flow being hedged, as well as how effectiveness is assessed. The derivative must be effective in accomplishing the objective of offsetting either changes in the fair value or cash flow attributable to the risk being hedged both at inception and over the term of the hedging relationship.
When derivative instruments have been designated within a hedge relationship and are highly effective in offsetting the identified risk characteristics of specific financial assets and liabilities, or group of financial assets and liabilities, hedge accounting is applied to these derivative instruments.
In a fair value hedge, hedging activitiesinstruments are carried on the Consolidated Balance Sheets at fair value, with changes in fair value recognized in the consolidated statementConsolidated Statement of earnings (loss)Earnings (Loss). The changes in fair value of the hedged item attributable to the hedged risk is also recorded in the consolidated statementConsolidated Statement of earnings (loss)Earnings (Loss) by way of a corresponding adjustment of the carrying amount of the hedged items recognized in the consolidated balance sheet.Consolidated Balance Sheet.
In a cash flow hedge, hedging instruments are carried on the Consolidated Balance Sheets at fair value, with changes in fair value of derivative financial instruments are recorded in otherOther comprehensive income.income (loss). These amounts are reclassified in the consolidated statementConsolidated Statement of earnings (loss)Earnings (Loss) in the periods in which results are affected by the cash flows of the hedged item. Hedges of net investments in self-sustaining operations are treated in a manner similar to cash flow hedges. Any hedge ineffectiveness is recorded in the consolidated statementConsolidated Statement of earnings (loss)Earnings (Loss) when incurred.
92
NOTES TO CONSOLIDATED FINANCIAL STATEMENTS
DECEMBER 31, 2009
(IN MILLIONS OF DOLLARS, UNLESS OTHERWISE NOTED)
DERIVATIVES NOT DESIGNATED FOR HEDGE ACCOUNTING
In conjunction with the Transaction, the various financial instruments of Domtar Inc. were recorded at fair value and, as such, did not meet the requirements for hedge accounting. As a result, Domtar Corporation accounts for these contracts at their fair value with resulting gains and losses being included as a component of Other operating income.
PENSION PLANS
Domtar Corporation’s plans include funded and unfunded defined benefit pension plans and defined contribution plans. Domtar Corporation recognizes the overfunded or underfunded status of defined benefit pension plans as an asset or liability in the consolidated balance sheets.Consolidated Balance Sheets. The net periodic benefit cost includes the following:
The cost of pension benefits provided in exchange for employees’ services rendered during the period,
The interest cost of pension obligations,
The expected long-term return on pension fund assets based on a market-related value determined using a five-year moving average market value for equity securities and fair value for other asset classes,of pension fund assets,
Gains or losses on settlements and curtailments,
The straight-line amortization of past service costs and plan amendments over the average remaining service period of approximately 1412 years of the active employee group covered by the plans,
86
NOTES TO CONSOLIDATED FINANCIAL STATEMENTS
DECEMBER 30, 2007
(IN MILLIONS OF US DOLLARS, UNLESS OTHERWISE NOTED)
The amortization of cumulative net actuarial gains and losses in excess of 10% of the greater of the accrued benefit obligation or market-relatedmarket value of plan assets at the beginning of the year over the average remaining service period of approximately 1412 years of the active employee group covered by the plans.
The defined benefit plan obligations are determined in accordance with the projected benefit method prorated on services.unit credit actuarial cost method.
OTHER POST-RETIREMENT BENEFIT PLANS
Domtar Corporation recognizes the underfunded status of other post-retirement benefit plans (other than multiemployer plans) as a liability in the consolidated balance sheets.Consolidated Balance Sheets. These benefits, which are funded by Domtar Corporation as they become due, include life insurance programs, medical and dental benefits and short-term and long-term disability programs. Domtar Corporation amortizes the cumulative net actuarial gains and losses in excess of 10% of the accrued benefit obligation at the beginning of the year over the average remaining service period of approximately 14 years of the active employee group covered by the plans.
INVESTMENT TAX CREDITS
Investment tax credits are recognized in earnings as a reduction of income tax expense when Domtar Corporation has made the qualifying expenditures and has a reasonable assurance that the credits will be realized.
GUARANTEES
A guarantee is a contract or an indemnification agreement that contingently requires Domtar Corporation to make payments to the other party of the contract or agreement, based on changes in an underlying item that is related to an asset, a liability or an equity security of the other party or on a third party’s failure to perform under an obligating agreement. It could also be an indirect guarantee of the indebtedness of another party, even though the payment to the other party may not be based on changes in an underlying item that is related to an asset, a liability or an equity security of the other party. Guarantees, when applicable, are accounted for at fair value.
NOTE 2.
RECENT ACCOUNTING PRONOUNCEMENTS
ACCOUNTING FOR PLANNED MAJOR MAINTENANCE
In September 2006, the Financial Accounting Standards Board (FASB) issued FASB Staff Position AUG AIR-1, “Accounting for Planned Major Maintenance Activities.” This Staff Position prohibits the use of the previously acceptable accrue-in-advance method of accounting for planned major maintenance activities in annual and interim financial reporting periods. The three accounting methods permitted under the Staff Position are: 1) direct expense method, 2) built-in overhaul method and 3) deferral method. On January 1, 2007, the Company adopted retroactively the direct expense method with restatement of prior interim periods. The Company previously used the accrue-in-advance method of interim periods. The Company previously used the accrue-in-advance method for interim periods. The adoption of this Staff Position had no significant impact on the annual consolidated financial statements.
8793
NOTES TO CONSOLIDATED FINANCIAL STATEMENTS
DECEMBER 30, 200731, 2009
(IN MILLIONS OF US DOLLARS, UNLESS OTHERWISE NOTED)
UNCERTAINTY IN INCOME TAXESALTERNATIVE FUEL MIXTURE TAX CREDITS
The U.S. Internal Revenue Code of 1986, as amended (the “Code”) permits a refundable excise tax credit for the production and use of alternative fuel mixtures derived from biomass. The Company submitted an application with the U.S. Internal Revenue Service (“IRS”) to be registered as an alternative fuel mixer and received notification that its registration had been accepted in late March 2009. The Company began producing and consuming alternative fuel mixtures in February 2009 at its eligible mills. In 2009, the Company recorded $498 million of such credits in Other operating income on the Consolidated Statements of Earnings (Loss). The amounts for the refundable credits are based on the volume of alternative mixtures produced and burned during that period. According to the Code, the tax credit expires at the end of 2009.
In June 2006, the FASB issued Interpretation No. 48, “Accounting for Uncertainty in Income Taxes—An Interpretation of FASB Statement No. 109” (FIN 48). This interpretation, which2009, the Company adoptedreceived $140 million in cash related to these claims. Any receivables under this program are presented as a component of Income and other taxes receivable on January 1, 2007, clarifies the accountingConsolidated Balance Sheets. In the second quarter of 2009, the Company stopped claiming these credits for uncertainimmediate refund as they were being earned, and ultimately decided to claim the remaining refundable credits on the Company’s 2009 annual U.S. income tax positions recognized in a company’s financial statements in accordance with Statement 109. FIN 48 prescribes a more likely than not recognition threshold and measurement attribute for the financial statement recognition and measurement of a tax position taken orreturn, which is expected to be takenfiled in a tax return. FIN 48 also provides guidance on derecognition, classificationthe first half of a liability2010. Please refer to Note 10, “Income Taxes,” for additional information regarding unrecognized tax benefits,benefits.
NOTE 2.
RECENT ACCOUNTING PRONOUNCEMENTS
ACCOUNTING CHANGES IMPLEMENTED IN 2009
FASB ACCOUNTING STANDARDS CODIFICATION
In July 2009, the Financial Accounting Standards Board (“FASB”) Accounting Standards Codification (“ASC”) became the single source of authoritative GAAP in the United States. The previous GAAP hierarchy consisted of four levels of authoritative accounting and reporting guidance, including original pronouncements of the FASB, Emerging Issues Task Force (“EITF”) abstracts, and other accounting literature (together, “previous GAAP”). The Codification eliminated this hierarchy and replaced previous GAAP (other than rules and interpretive releases of the SEC), as used by all nongovernmental entities, with just two levels of literature; namely, authoritative and nonauthoritative.
The FASB has indicated that the ASC does not change previous GAAP, instead, the changes aim to reduce the time and effort it takes for interestusers to research accounting questions and penalties,improve the usability of accounting standards by reorganizing them into a topical format, where each topic is subdivided into a number of levels that aggregate all elements of literature related to this topic.
For reporting purposes, the FASB ASC has become effective for financial statements issued for interim and annual periods ended after September 15, 2009. The Company adopted the FASB ASC in interim periods, and expanded income tax disclosures. The adoption of this Interpretation hadits September 30, 2009 consolidated financial statements with no significant impact on the consolidated financial statements.impact.
FAIR VALUE OPTIONMEASUREMENTS
In February 2007,The Company adopted the FASB issued Statement No. 159, “Theguidance of Fair Value Option for Financial AssetsMeasurements and Financial Liabilities” (SFAS 159). SFAS 159 permits an entity to measure certainDisclosures Topic of FASB ASC, concerning the fair value measurements and disclosures of financial assets and financial liabilities in the first
94
NOTES TO CONSOLIDATED FINANCIAL STATEMENTS
DECEMBER 31, 2009
(IN MILLIONS OF DOLLARS, UNLESS OTHERWISE NOTED)
quarter of 2008. The FASB deferred the effective date of this guidance for one year as it applies to nonfinancial assets and nonfinancial liabilities that are not recognized or disclosed at fair value. Under SFAS 159, entities that electvalue on a recurring basis. Domtar adopted the deferred guidance in the first quarter of 2009. This guidance provides a common definition of fair value, option will report unrealized gains and losses in earnings at each subsequent reporting date. The fair value option may be elected on an instrument-by-instrument basis, with few exceptions, as long as it is applied to the instrument in its entirety. The Company has decided not to adopt the fair value option for any of its existing financial instruments.
FAIR VALUE MEASUREMENTS
In September 2006, the FASB issued Statement No. 157, “Fair Value Measurements” (SFAS 157). SFAS 157 establishes a framework for measuring fair value, in GAAP and expands disclosures about fair value. The guidance applies when other accounting standards require or permit fair value measurements but does not require any new fair value measurements.
In April 2009, the FASB issued a modification of the Fair Value Measurements and Disclosures Topic of FASB ASC concerning the determination of fair value when the volume and level of activity for the asset or liability have significantly decreased and for identifying transactions that are not orderly. This modification emphasizes that even if there has been a significant decrease in the volume and level of activity for the asset or liability and regardless of the valuation technique(s) used, the objective of a fair value measurement remains the same. Fair value is the price that would be received to sell an asset or paid to transfer a liability in an orderly transaction (that is, not a forced liquidation or distressed sale) between market participants at the measurement date under current market conditions. The modification also provides guidance on identifying transactions that are not orderly by assessing certain factors among which are: an adequate marketing period for the asset or liability, whether the seller is in a distressed state and whether the transaction price is an outlier compared with recent transactions. The modification amends the disclosure provisions required by the Fair Value Measurements and Disclosures Topic of FASB ASC to require entities to disclose in interim and annual periods the inputs and valuation technique(s) used to measure fair value.
These modifications are effective for interim and annual periods ending after June 15, 2009, and have consequently been adopted by the Company starting from its June 30, 2009 consolidated financial statements. Since the Company did not hold any assets or liabilities that are within the scope of these modifications, for which the volume and level of activity have significantly decreased, the measurement requirements outlined were of no impact on its fair value measurements. Statement 157However, the Company’s defined benefit pension plans hold investments in asset backed commercial paper for which there is no active liquid market (see Note 7).
FAIR VALUE DISCLOSURES FOR INTERIM PERIODS
In April 2009, the FASB issued a modification of the Fair Value Measurements and Disclosures Topic of FASB ASC concerning the interim disclosures about fair value of financial instruments, to require interim-period disclosures about fair value of financial instruments that were previously made on an annual basis only.
This modification is effective for interim and annual periods ending after June 15, 2009, with early adoption permitted. The Company adopted the disclosure requirements in its June 30, 2009 consolidated financial statements with no significant impact.
MEASURING LIABILITIES AT FAIR VALUE
In August 2009, the FASB issued a modification of the Fair Value Measurements and Disclosures Topic of FASB ASC concerning the measurement of liabilities at fair value when there is a lack of observable market information. This modification provides clarification of the valuation techniques that are required in circumstances in which a quoted price in an active market for the identical liability is not available. The modification of the valuation techniques had no impact on the Company’s fair value measurements. This modification is effective for the first reporting period (including interim periods) beginning after issuance. The Company adopted the modification in its September 30, 2009 consolidated financial statements with no significant impact.
95
NOTES TO CONSOLIDATED FINANCIAL STATEMENTS
DECEMBER 31, 2009
(IN MILLIONS OF DOLLARS, UNLESS OTHERWISE NOTED)
PENSION PLAN ASSETS
In December 2008, the FASB issued Employers’ Disclosures about Post-retirement Benefit Plan Assets (now included in Compensation—Retirement Benefits Topic of FASB ASC), providing guidance on an employer’s disclosures about plan assets of a defined benefit pension or other post-retirement plan to include:
qualitative disclosures about investments policies and strategies;
disclosures about the major categories of plan assets;
disclosures about fair value measurements of plan assets; and
disclosures about significant concentrations of risk.
This modification is effective for annual periods ending after December 15, 2009, with no obligation to present the same disclosures for earlier periods that are presented for comparative purposes and early adoption is permitted. The Company adopted the disclosure requirements in its December 31, 2009 consolidated financial statements with no significant impact.
MANAGEMENT’S ASSESSMENT OF SUBSEQUENT EVENTS
In May 2009, the FASB issued Subsequent Events that provides guidance on management’s assessment of subsequent events. Historically, management had relied on U.S. auditing literature for guidance on assessing and disclosing subsequent events. The topic represents the inclusion of guidance on subsequent events in the accounting literature and is directed specifically to management, since management is responsible for preparing an entity’s consolidated financial statements.
This new topic does not significantly change practice because its guidance is similar to that in existing U.S. auditing literature on subsequent events, although with some important modifications. The new topic clarifies that management must evaluate, as of each reporting period, events or transactions that occur after the balance sheet date “through the date that the financial statements are issued or are available to be issued.” Management must perform its assessment for both interim and annual financial reporting periods.
This topic is effective prospectively for interim or annual periods ending after June 15, 2009. Management applied the requirements of this topic in the preparation of its consolidated financial statements, as mentioned in Note 1, beginning June 30, 2009 with no significant impact.
EQUITY
In January 2010, the FASB issued Accounting for Distributions to Shareholders with Components of Stock and Cash, which clarifies that the stock portion of a distribution to shareholders that allows them to elect to receive cash or stock with a potential limitation on the total amount of cash that all shareholders can elect to receive in the aggregate is considered a share issuance that is reflected in earnings per share prospectively and not a stock dividend for purposes of applying Equity and Earnings Per Share Topics of FASB ASC.
The amendments in this Update are effective for interim and annual periods ending on or after December 15, 2009, and will not impact the Company unless the Company decides to proceed with a distribution to shareholders with components of stock and cash.
96
NOTES TO CONSOLIDATED FINANCIAL STATEMENTS
DECEMBER 31, 2009
(IN MILLIONS OF DOLLARS, UNLESS OTHERWISE NOTED)
BUSINESS COMBINATIONS
The Company adopted the guidance of Business Combination Topic of FASB ASC, in the first quarter of 2009. The application of this guidance had no impact on the Company’s financial position, results of operations or cash flows as there was expectedno business acquisition during the year. The guidance may materially change the accounting for future business combinations.
DERIVATIVE INSTRUMENTS AND HEDGING ACTIVITIES
The Company adopted during the first quarter of 2009, the guidance of Derivatives and Hedging Topic of FASB ASC, concerning the quarterly disclosure requirements of an entity’s derivative instruments and hedging activities without any significant impact.
INTANGIBLE ASSETS
The Company adopted during the first quarter of 2009, the guidance of Intangibles—Goodwill and Other Topic of FASB ASC, concerning the factors that should be considered in developing renewal or extensions assumptions used to determine the useful life of a recognized intangible asset and the additional disclosure requirements related to recognized intangible assets. The initial adoption of this accounting guidance had no impact on the Company’s financial position, results of operations or cash flows.
FUTURE ACCOUNTING CHANGES
TRANSFERS OF FINANCIAL ASSETS
In June 2009, the FASB issued Accounting for Transfers of Financial Assets, which amends the derecognition guidance required by the Transfers and Servicing Topic of FASB ASC. Some of the major changes undertaken by this amendment include:
Eliminating the concept of a Qualified Special Purpose Entity (“QSPE”) since the FASB believes, on the basis of recent experience, that many entities that have been accounted for as QSPEs are not truly passive, a belief that challenges the premise on which the QSPE exception was based.
Modifying the derecognition provisions as required by the Transfers and Servicing Topic of FASB ASC. Specifically aimed to:
| o | require that all arrangements made in connection with a transfer of financial assets be considered in the derecognition analysis, |
| o | clarify when a transferred asset is considered legally isolated from the transferor, |
| o | modify the requirements related to a transferee’s ability to freely pledge or exchange transferred financial assets, and |
| o | provide guidance on when a portion of a financial asset can be derecognized, thereby restricting the circumstances when sale accounting can be achieved to the following cases: |
transfers of individual or groups of financial assets in their entirety and
transfers of participating interests.
The new amendment is effective for financial asset transfers occurring after the beginning of an entity’s first fiscal year that begins after November 15, 2009. Although the new amendment will impact the way the Company accounts for transfers of financial assets, the Company does not expect the adoption of this accounting guidance to materially impact our financial position, results of operations or cash flows.
97
NOTES TO CONSOLIDATED FINANCIAL STATEMENTS
DECEMBER 31, 2009
(IN MILLIONS OF DOLLARS, UNLESS OTHERWISE NOTED)
VARIABLE INTEREST ENTITIES
In June and December 2009, the FASB issued guidance which requires an enterprise to perform an analysis to determine whether the enterprise’s variable interest or interests give it a controlling financial interest in a variable interest entity. This guidance requires ongoing reassessments of whether an enterprise is the primary beneficiary of a variable interest entity, eliminates the quantitative approach previously required for determining the primary beneficiary of a variable interest entity and requires enhanced disclosures that will provide users of financial statements issuedwith more transparent information about an enterprise’s involvement in a variable interest entity. This guidance is effective for fiscal years beginning after November 15, 2007,2009, and for interim and annual reporting periods within those fiscal years. On February 12, 2008, the FASB issued FASB Staff Position No. 157-2, “Effective Datethereafter. The initial adoption of FASB Statement No. 157” (“FSP”) that amends Statement 157this standard is not expected to delay the effective date for all non-financial assets and non-financial liabilities, except those that are recognized or disclosed at fair value in the financial statements on a recurring basis (that is, at least annually). For such items, FSP defers the effective date of Statement 157 to fiscal years beginning after November 15, 2008. The Company does not expect the adoption will have a significant impact on the financial position or results of operations of the Company, however, additional disclosures in the Company’s financial statements will be required.
BUSINESS COMBINATIONS
In December 2007, the FASB issued Statement No. 141 (revised 2007), “Business Combinations” (SFAS No. 141(R)). This Statement replaces SFAS No. 141, “Business Combinations.” SFAS No. 141(R) requires an acquirer to recognize the assets acquired, the liabilities assumed, including those arising from contingent considerations and contractual contingencies based on their fair values as measured on the acquisition date. In addition, SFAS No. 141(R) requires the acquirer to measure the noncontrolling interest in the acquiree at fair value, which will result in recognizing the goodwill attributable to the noncontrolling interest in addition to the goodwill attributable to the acquirer. SFAS No. 141(R) applies prospectively to business combinations for which the acquisition date is on or after the beginning of the first annual reporting period beginning on or after December 15, 2008. Since Statement 141(R) will only be applicable to future business combinations, it will not have a significantmaterial effect on the Company’s financial position, results of operations or cash flows prior to such acquisitions.
88
NOTES TO CONSOLIDATED FINANCIAL STATEMENTSflows.
DECEMBER 30, 2007
(IN MILLIONS OF US DOLLARS, UNLESS OTHERWISE NOTED)
NONCONTROLLING INTERESTSFAIR VALUE DISCLOSURES
In December 2007,January 2010, the FASB issued Statement No. 160, “Noncontrolling Interests in Consolidated Financial Statements” (SFAS No. 160). SFAS No. 160 amends Accounting Research Bulletin 51, “Consolidated Financial Statements,” to establish accounting and reporting standards for the noncontrolling interest in a subsidiary and for the deconsolidation of a subsidiary. This Statement clarifies that a noncontrolling interest in a subsidiary is an ownership interest in the consolidated entity that should be reported as equity in the consolidated financial statements. SFAS No. 160 changes the way the consolidated earnings (loss) statement is presented by requiring consolidated net earnings (loss) to be reported including the amounts attributable to both the parent interest and the noncontrolling interest. In addition, the Statement requires disclosure on the faceUpdate of the consolidated statementFair Value Measurements and Disclosures Topic of operations ofFASB ASC requiring new disclosures and amending existing guidance. This Update provides amendments that require new disclosures as follows:
A reporting entity should disclose separately the amounts of consolidated net earnings (loss) attributablesignificant transfers in and out of Level 1 and Level 2 fair value measurements and describe the reasons for transfers;
In the reconciliation for fair value measurements using significant unobservable inputs (Level 3), a reporting entity should present separately information about purchases, sales, issuances, and settlements.
This Update also provides amendments that clarify existing disclosures as follows:
A reporting entity should provide fair value measurements for each class of assets and liabilities;
A reporting entity should provide disclosures about the valuation techniques and inputs used to the parent interestmeasure fair value for both recurring and to the noncontrolling interest. SFAS No. 160 isnonrecurring fair value measurements that fall either in Level 2 or Level 3.
These modifications are effective for fiscalinterim and annual periods and interim periods within those fiscal years, beginning on or after December 15, 2008.2009, except for the disclosures about purchases, sales, issuances, and settlements in the roll forward activity in Level 3 fair value measurements. Those disclosures are effective for interim and annual periods beginning after December 15, 2010. The Company does not expect the initial adoption of SFAS 160anticipate these new disclosure requirements to have a significant effect on the financial position, resultsimpact compared to its present level of operations and cash flows as the Company has no significant non-controlling interests.disclosures.
NOTE 3.
As discussed in Note 1, on March 7, 2007, Domtar Corporation completed the Transaction to combine the Weyerhaeuser Fine Paper Business with Domtar Inc. Under the Transaction, Domtar Corporation issued 155,947,30712,995,609 shares of common stock and Domtar Canada Paper Inc., a wholly100% owned subsidiary of Domtar Corporation, issued 75,004,3036,250,359 exchangeable shares to acquire Domtar Inc. This Transaction was considered, for accounting purposes, as the acquisition of Domtar Inc. by Domtar Corporation and has been accounted for using the purchase method. Accordingly, the purchase price iswas based upon the estimated fair value of Domtar
98
NOTES TO CONSOLIDATED FINANCIAL STATEMENTS
DECEMBER 31, 2009
(IN MILLIONS OF DOLLARS, UNLESS OTHERWISE NOTED)
Corporation common stock issued plus acquisition costs directly related to the Transaction. Since no quoted market price existed for the shares of the Company’s common stock, the purchase price iswas based on the fair value of the net assets acquired on August 23, 2006, the date on which the terms of the Transaction were agreed to and announced. The fair value of Domtar Inc. common shares of $6.63$79.56 per share used in the calculation of the purchase price iswas based upon the average closing price of Domtar Inc. common shares on the Toronto Stock Exchange for the five trading days beginning August 21, 2006 and endedending August 25, 2006, converted at the average daily foreign exchange rate of the Bank of Canada. The number of outstanding Domtar Inc. common shares used in the calculation of the fair value iswas based on the same periods.
The following table summarizes the components of the total purchase price :
231,436,850 common shares of Domtar Inc. outstanding at an average closing price of $6.63 per share | $ | 1,534 | ||||
19,286,404 common shares of Domtar Inc. outstanding at an average closing price of $79.56 per share | $ | 1,534 | ||||
Direct acquisition costs | 28 | 28 | ||||
Estimated total purchase price, net of assumed debt | 1,562 | $ | 1,562 | |||
The total purchase price iswas allocated to tangible and intangible assets acquired and liabilities assumed based on the Company’s estimates of their fair value, which arewere based on information currently available.available at that time. During the fourth quarter of 2007, the Company has completed the valuation of all assets and liabilities. In
The table below illustrates the process ofpurchase price allocation:
Fair value of net assets acquired at the date of acquisition | |||
Cash and cash equivalents | $ | 573 | |
Receivables | 166 | ||
Inventories | 448 | ||
Prepaid expenses | 12 | ||
Income and other taxes receivable | 10 | ||
Deferred income taxes—current | 63 | ||
Property, plant and equipment | 2,469 | ||
Intangible assets (Note 15) | 98 | ||
Deferred income taxes—non current | 34 | ||
Goodwill (Note 13) | 300 | ||
Other assets | 39 | ||
Total assets | 4,212 | ||
Less: Liabilities | |||
Bank indebtedness | 67 | ||
Trade and other payables | 410 | ||
Income and other taxes payable | 15 | ||
Long-term debt due within one year | 1 | ||
Long-term debt | 1,660 | ||
Deferred income tax liability—non-current | 141 | ||
Other liabilities and deferred credits | 328 | ||
Minority interests | 28 | ||
Total liabilities | 2,650 | ||
Fair value of net assets acquired at the date of acquisition | 1,562 | ||
89
99
NOTES TO CONSOLIDATED FINANCIAL STATEMENTS
DECEMBER 30, 200731, 2009
(IN MILLIONS OF US DOLLARS, UNLESS OTHERWISE NOTED)
completing such valuation, the Company has revised the amounts allocated to certain assets and liabilities from those previously reported in the third quarter of 2007. The principal significant elements for which such amounts have been modified include property, plant and equipment, intangible assets, income tax balances and goodwill.
The table below illustrates the purchase price allocation:
Fair value of net assets acquired at the date of acquisition | |||
Cash and cash equivalents | $ | 573 | |
Receivables | 166 | ||
Inventories | 448 | ||
Prepaid expenses | 12 | ||
Income and other taxes receivable | 10 | ||
Deferred income taxes—current | 63 | ||
Property, plant and equipment | 2,469 | ||
Intangible assets (NOTE 14) | 98 | ||
Deferred income taxes—non current | 34 | ||
Goodwill (NOTE 12) | 300 | ||
Other assets | 39 | ||
Total assets | 4,212 | ||
Less: Liabilities | |||
Bank indebtedness | 67 | ||
Trade and other payables | 410 | ||
Income and other taxes payable | 15 | ||
Long-term debt due within one year | 1 | ||
Long-term debt | 1,660 | ||
Deferred income tax liability—non-current | 141 | ||
Other liabilities and deferred credits | 328 | ||
Minority interests | 28 | ||
Total liabilities | 2,650 | ||
Fair value of net assets acquired at the date of acquisition | 1,562 | ||
90
NOTES TO CONSOLIDATED FINANCIAL STATEMENTS
DECEMBER 30, 2007
(IN MILLIONS OF US DOLLARS, UNLESS OTHERWISE NOTED)
The following unaudited pro-forma information for the yearsyear ended December 30, 2007, and December 31, 2006, presents a summary of consolidated results of operations of the Company as if the combination had occurred at the beginning of the respective fiscal periods. These unaudited pro forma results have been prepared for comparative purposes only.
| Year ended December 30, 2007 | Year ended December 31, 2006 | ||||||
| (In millions of US dollars, unless otherwise noted) | |||||||
Sales | $ | 6,520 | $ | 6,750 | |||
Operating expenses, excluding depreciation and amortization and impairment of goodwill and property, plant and equipment | 5,653 | 5,794 | |||||
Depreciation and amortization | 471 | 458 | |||||
Impairment of goodwill and property, plant and equipment | 96 | 749 | |||||
Operating income (loss) | 300 | (251 | ) | ||||
Earnings (loss) before income taxes | 98 | (448 | ) | ||||
Net earnings (loss) applicable to common shares | 62 | (550 | ) | ||||
Basic earnings (loss) per share | 0.12 | (1.07 | ) | ||||
Diluted earnings (loss) per share | 0.12 | (1.07 | ) | ||||
Basic weighted average number of common shares outstanding (millions) | 515.3 | 515.1 | |||||
Diluted weighted average number of common shares outstanding (millions) | 516.2 | 515.1 | |||||
| Year ended December 30, 2007 | ||
| $ | ||
Sales | 6,520 | |
Operating expenses, excluding depreciation and amortization and impairment of goodwill and property, plant and equipment | 5,646 | |
Depreciation and amortization | 506 | |
Impairment of goodwill and property, plant and equipment | 96 | |
Operating income | 272 | |
Earnings before income taxes | 70 | |
Net earnings applicable to common shares | 47 | |
Basic earnings per share (in dollars) | 1.19 | |
Diluted earnings per share (in dollars) | 1.18 | |
Basic weighted average number of common shares outstanding (millions) | 39.5 | |
Diluted weighted average number of common shares outstanding (millions) | 39.7 |
The above includes a charge of $749 million for the impairment of goodwill in the year ended December 31, 2006, not deductible for tax purposes. The above also includes a charge of $29 million for transaction related costs of Domtar Inc. incurred in the year ended December 30, 2007.
NOTE 4.
IMPAIRMENT AND WRITE-DOWN OF GOODWILL AND LONG-LIVED ASSETS
IMPAIRMENT OF LONG-LIVED ASSETS
Long-lived assets are reviewed for impairment upon the occurrence of events or changes in circumstances indicating that, at the lowest level of determinable cash flows, the carrying value of the long-lived assets may not be recoverable. Step I of the impairment test assesses if the carrying value of the long-lived assets exceeds their estimated undiscounted future cash flows in order to assess if the assets are impaired. In the event the estimated undiscounted future cash flows are lower than the net book value of the assets, a Step II impairment test must be carried out to determine the impairment charge. In Step II, long-lived assets are written down to their estimated fair values. Given there is generally no readily available quoted value for the Company’s long-lived assets, the Company determines fair value of its long-lived assets using the estimated discounted future cash flow (“DCF”) expected from their use and eventual disposition, and by using the liquidation or salvage value in the case of idled assets. The DCF in Step II is based on the undiscounted cash flows in Step I.
Plymouth Pulp and Paper Mill
Conversion to Fluff Pulp
In the fourth quarter of 2009, as a result of the decision to permanently shut down the remaining paper machine and convert our Plymouth facility to a dedicated fluff pulp production facility, the Company recognized,
100
NOTES TO CONSOLIDATED FINANCIAL STATEMENTS
DECEMBER 31, 2009
(IN MILLIONS OF DOLLARS, UNLESS OTHERWISE NOTED)
under Impairment and write-down of property, plant and equipment, $13 million of accelerated depreciation in relation to the assets that will cease productive use in October 2010 when the conversion is completed. We expect to record a further $39 million of accelerated depreciation over the first nine months of 2010 in relation to these assets.
Given the substantial change in use of the pulp and paper mill, we conducted a Step I impairment test and concluded that the recognition of an impairment loss for the Plymouth mill’s long-lived assets was not required as the aggregate estimated undiscounted future cash flows exceeded the carrying value of the asset group of $336 million at the time of the announcement by a significant amount.
Estimates of undiscounted future cash flows used to test the recoverability of the fixed assets included key assumptions related to trend prices, inflation-adjusted cost projections, and the estimated useful life of the fixed assets. The main sources of such assumptions and related benchmarks were largely the same as those listed under “Impairment of Goodwill” below.
Changes in our assumptions and estimates may affect our forecasts and may lead to an outcome where impairment charges would be required. In addition, actual results may vary from the Company’s forecasts and such variations may be material and unfavorable, thereby triggering the need for future impairment tests where our conclusions may differ in reflection of prevailing market conditions.
The following table summarizes the approximate impact that a change in the key assumption would have on the estimated undiscounted future cash flows at December 31, 2009, while holding all other assumptions constant:
Key Assumption | Increase of | Approximate impact on the undiscounted cash flows | ||||
| (in millions of dollars) | ||||||
Fluff pulp pricing | $ | 5/ton | $ | 31 | ||
Closure of Paper Machine
In the first quarter of 2009, the Company announced that it would permanently reduce its paper manufacturing at its Plymouth mill, by closing one of the two paper machines comprising the mill’s paper production unit. As a result, at the end of February 2009, there was a curtailment of 293,000 tons of the mill’s paper production capacity and the closure affected approximately 185 employees and a $35 million accelerated depreciation charge was recorded in the first quarter of 2009 for the related write-down on plant and equipment. Given the closure of the paper machine, the Company conducted a Step I impairment test on the Plymouth mill operation’s fixed assets and concluded that the undiscounted estimated future cash flows associated with the long-lived assets exceeded their carrying value and, as such, no additional impairment charge was required.
Prince Albert Pulp Mill
As a result of a review of the current options for the disposal of the assets of this facility in the fourth quarter of 2009, the Company revised the estimated net realizable values of the remaining assets and recorded a non-cash write-down of $14 million related to fixed assets, mainly a turbine and a boiler. The write-down represents the difference between the new estimated liquidation or salvage value of the fixed assets and their carrying values.
101
NOTES TO CONSOLIDATED FINANCIAL STATEMENTS
DECEMBER 31, 2009
(IN MILLIONS OF DOLLARS, UNLESS OTHERWISE NOTED)
Dryden Pulp and Paper Mill
In the fourth quarter of 2008, as a result of the decision to permanently shut down the remaining paper machine and converting center of the Dryden mill, the Company wrote-down of $11 million of the net book value to bring these assets to their estimated recoverable amount. Given the substantial change in use of the pulp and paper mill, the Company conducted a Step I impairment test on the remaining Dryden pulp mill operation’s fixed assets. Estimates of undiscounted future cash flows used to test the recoverability of the fixed assets included key assumptions related to trend prices, inflation-adjusted cost projections, the forecasted exchange rate for the U.S. dollar and the estimated useful life of the fixed assets. The main sources of such assumptions and related benchmarks were largely the same as those listed under “Impairment of Goodwill” below.
Step I of the impairment test demonstrated that the carrying values of the fixed assets exceeded their estimated undiscounted future cash flows, indicating that an impairment existed. A Step II test was undertaken to determine the fair value of the remaining assets and the Company recorded a non-cash impairment charge of $265 million in the fourth quarter of 2008, to reduce the assets to their estimated fair value.
Subsequent to the decision to shut down one paper machine at its Dryden mill and the write-off of $92 million related to this paper machine, Domtar conducted a Step I impairment test on the remaining Dryden mill fixed assets during the fourth quarter of 2007. Estimates of undiscounted future cash flows used to test the recoverability of a long-lived asset included key assumptions related to trend prices, the 15-year forecasted exchange rate for the U.S. dollar and the estimated useful life of the long-lived assets. The trend prices were based on an analysis of external price trends, including published industry guidance. The forecasted Canadian-U.S. foreign exchange rate assumptions were based on independent market information, as well as analysis of historical data, trends and cycles. Domtar concluded that the recognition of an impairment loss for the Dryden mill was not required.
Columbus Paper Mill
During the fourth quarter of 2008, the Company was informed that beginning in early 2009 the Columbus mill would cease to benefit from a favorable power purchase. This change in circumstances impacted the profitability outlook for the foreseeable future and triggered the need for a Step I impairment test of the fixed assets. Estimates of undiscounted future cash flows used to test the recoverability of the fixed assets included key assumptions related to trend prices, inflation-adjusted cost projections, and the estimated useful life of the fixed assets. The main sources of such assumptions and related benchmarks were largely the same as those listed under “Impairment of Goodwill” below.
Step I of the impairment test demonstrated that the carrying values of the fixed assets exceeded their estimated undiscounted future cash flows, indicating that an impairment existed. A Step II test was undertaken to determine the fair value of the remaining assets and the Company recorded a non-cash impairment charge of $95 million in the fourth quarter of 2008 to reduce the assets to their estimated fair value.
Wood Segment
In the fourth quarters of 2009 and 2008, the Company conducted an impairment test on the fixed assets and intangible assets (“the Asset Group”) of the Wood reportable segment. The need for such test was triggered by operating losses sustained by the segment in 2007, 2008 and 2009, as well as short-term forecasted operating losses.
102
NOTES TO CONSOLIDATED FINANCIAL STATEMENTS
DECEMBER 31, 2009
(IN MILLIONS OF DOLLARS, UNLESS OTHERWISE NOTED)
The Company completed the Step I impairment test during each period and concluded that the recognition of an impairment loss for the Wood reportable segment’s long-lived assets was not required as the aggregate estimated undiscounted cash flows exceeded the carrying value of the Asset Group of $161 million by a significant amount.
Estimates of undiscounted future cash flows used to test the recoverability of the Asset Group included key assumptions related to trend prices, inflation-adjusted cost projections, the forecasted exchange rate for the U.S. dollar and the estimated useful life of the Asset Group. The Company believes such assumptions to be reasonable and to reflect forecasted market conditions at the valuation date. They involve a high degree of judgment and complexity and reflect our best estimates with the information available at the time our forecasts were developed. To this end, the Company evaluates the appropriateness of the assumptions as well as the overall forecasts by comparing projected results of upcoming years with actual results of preceding years and validating that differences therein are reasonable. Key assumptions were related to trend prices (based on data from Resource Information Systems Inc. (“RISI”) (an authoritative independent source in the global forest products industry), material and energy costs and foreign exchange rates. A number of benchmarks from independent industry and other economic publications were used in order to develop projections for the forecast period.
The following table summarizes the approximate impact that a change in certain key assumptions would have on the estimated undiscounted future cash flows, while holding all other assumptions constant:
Key Assumptions | Increase of | Approximate impact on the undiscounted cash flows | |||||
| (in millions of dollars) | |||||||
| $ | |||||||
Foreign exchange rates ($US to $CDN) | $ | 0.01 | (30 | ) | |||
Lumber pricing | $ | 5 / MFBM | (1) | 32 | |||
| (1) | MFBM : Million Foot board measure |
Changes in the assumptions and estimates may affect the forecasts and may lead to an outcome where impairment charges would be required. In addition, actual results may vary from the forecasts and such variations may be material and unfavorable, thereby triggering the need for future impairment tests where the conclusions may differ in reflection of prevailing market conditions.
Lebel-sur-Quévillon Pulp Mill and Sawmill
Pursuant to the decision in the fourth quarter of 2008 to permanently shut down the Lebel-sur-Quévillon pulp mill and sawmill of the Papers and Wood reportable segments, respectively, the Company recorded a non-cash write-down of $4 million related to fixed assets at both locations consisting mainly of a turbine, a recovery system and saw lines. The write-down represented the difference between the estimated liquidation or salvage values of the fixed assets and their carrying values.
White River Sawmill
In the fourth quarter of 2008, the net assets of the White River sawmill of the Wood reportable segment were held for sale and measured at the lower of the sawmill’s carrying value or estimated fair value less cost to
103
NOTES TO CONSOLIDATED FINANCIAL STATEMENTS
DECEMBER 31, 2009
(IN MILLIONS OF DOLLARS, UNLESS OTHERWISE NOTED)
sell. The fair value was determined by analyzing values assigned to it in a current potential sale transaction together with conditions prevailing in the markets where the sawmill operated. Pursuant to such analysis, non-cash write-down amounting to $8 million related to fixed assets and $4 million related to intangible assets were recorded in the fourth quarter of 2008 to reflect the difference between their respective estimated fair values less cost to sell and their carrying values. The sawmill was sold in June 2009 and the Company recorded a gain of $1 million related to the transaction.
IMPAIRMENT OF GOODWILL
Goodwill is not amortized and is subject to an annual goodwill impairment test. This test is carried out more frequently if events or changes in circumstances indicate that goodwill might be impaired. A Step I goodwill impairment test determines whether the fair value of a reporting unit exceeds the net carrying amount of that reporting unit, including goodwill, as of the assessment date in order to assess if goodwill is impaired. If the fair value is greater than the net carrying amount, no impairment is necessary. In the event that the net carrying amount exceeds the fair value, a Step II goodwill impairment test must be performed in order to determine the amount of the impairment charge. The implied fair value of goodwill in this test is estimated in the same way as goodwill was determined at the date of the acquisition in a business combination. That is, the excess of the fair value of the reporting unit over the fair value of the identifiable net assets of the reporting unit represents the implied value of goodwill. To accomplish this Step II test, the fair value of the reporting unit’s goodwill must be estimated and compared to its carrying value. The excess of the carrying value over the fair value is taken as an impairment charge in the period.
For purposes of impairment testing, goodwill must be assigned to one or more of the Company’s reporting units. The Company tests goodwill at the reporting unit level. All goodwill as of December 30, 2007 resided in the Papers segment and based upon the impairment test conducted in the fourth quarter of 2008, as described below, was determined to be impaired and written-off.
Step I Impairment Test
The Company determined that the discounted cash flow method (“DCF”) was the most appropriate approach to determine fair value of the reporting unit. The Company developed a projection of estimated future cash flows for the period from 2009 to 2013 (the “Forecast Period”) to serve as the basis of the DCF as well as a terminal value. In doing so, the Company used a number of key assumptions and benchmarks that are discussed under “Key Assumptions” below. The discounted future cash flow analysis resulted in a fair value of the reporting unit below the carrying value of the reporting units net asset.
In order to evaluate the appropriateness of the conclusions of the Step I impairment test, the estimated fair value of the Company as a whole was reconciled to its market capitalization and compared to selected transactions involving the sale of comparable companies.
Step II Impairment Test
In Step II of the impairment test, the estimated fair value of the Papers reporting unit, determined in Step I, was allocated to its tangible and identified intangible assets, based on their relative fair values, in order to arrive at the fair value of goodwill. To this end, different valuation techniques were used to determine the fair values of individual tangible and intangible assets. A depreciated replacement cost method was mainly used to determine the fair value of fixed assets to the extent such values did not have economic obsolescence. Economic
104
NOTES TO CONSOLIDATED FINANCIAL STATEMENTS
DECEMBER 31, 2009
(IN MILLIONS OF DOLLARS, UNLESS OTHERWISE NOTED)
obsolescence was based on cash flow projections. For idled mills of the Papers reporting unit, liquidation or salvage values were largely used as an indication of the fair values of their assets. The fair value of identified intangible assets, mainly consisting of marketing, customer and contract-related assets, were determined using an income approach.
The impairment test concluded that goodwill was impaired and the Company recorded a non-cash impairment charge of $321 million in the fourth quarter of 2008 to reflect the complete write-off of the Company’s goodwill.
In 2007, the Company performed its annual impairment test of goodwill. As a result, the Company determined that the Wood segment goodwill was impaired, necessitating an impairment charge of $4 million. The impairment was largely due to the deteriorating of economic conditions in the Wood segment.
Key Assumptions
The various valuation techniques used in Steps I and II incorporated a number of assumptions that the Company believed to be reasonable and to reflect forecasted market conditions at the valuation date. Assumptions in estimating future cash flows were subject to a high degree of judgement. The Company made all efforts to forecast future cash flows as accurately as possible with the information available at the time a forecast was made. To this end, the Company evaluated the appropriateness of the assumptions as well as the overall forecasts by comparing projected results of upcoming years with actual results of preceding years and validating those differences therein were reasonable. Key assumptions related to: price trends, material and energy costs, the discount rate, rate of decline of demand, the terminal growth rate, and foreign exchange rates. A number of benchmarks from independent industry and other economic publications were used in order to develop projections for the forecast period. Examples of such benchmarks and other assumptions included:
Revenues—the evolution of pulp and paper pricing over the forecast period was based on data from RISI, an authoritative independent source in the global forest products industry.
Direct costs mainly consisted of fiber, wood, chemical and energy costs. The evolution of these direct costs over the forecast period was based on data from a number of benchmarks related to: selling prices of pulp, oil prices, housing starts, US producer price index, mixed chemical index, corn, natural gas, coal and electricity.
Foreign exchange rate estimates were based on a number of economic forecasts.
Discount rate—The discount rate used to determine the present value of the Papers reporting unit’s forecasted cash flows represented our weighted average cost of capital (“WACC”). Our WACC was determined to be between 10.5% and 11%.
Rate of decline of demand and terminal growth rate—the Company assumed that a number of business and commercial papers would see demand declines in line with industry expectations. This was reflected in our assumptions in the rate of decline in demand over the forecast period as well as in our assumption of the terminal growth rate.
105
NOTES TO CONSOLIDATED FINANCIAL STATEMENTS
DECEMBER 31, 2009
(IN MILLIONS OF DOLLARS, UNLESS OTHERWISE NOTED)
NOTE 5.
2007 OMNIBUS INCENTIVE PLAN
Under the Omnibus Incentive Plan (the “Omnibus Plan”), the Company may award to executives and other key employees non-qualified stock options, incentive stock options, stock appreciation rights, shares of restricted stock, restricted stock units, performance conditioned restricted stock units, performance shares, deferred share units and other stock-based awards. A total of 20,000,0001,666,667 common shares are reserved for issuance in connection with awards granted under the Omnibus Plan. Awards may be subject to both performance and time-based vesting.
The exercise price of options and stock appreciation rights is equal to the closing price per share of the Company’s common stock on the New York Stock Exchange on the date of grant.
91
NOTES TO CONSOLIDATED FINANCIAL STATEMENTS
DECEMBER 30, 2007
(IN MILLIONS OF US DOLLARS, UNLESS OTHERWISE NOTED)
During the second quarter of 2007, the Company granted awardsOn April 8, 2009, a third grant under the Omnibus Incentive Plan was provided to executives and other key employees as follows:described below.
PERFORMANCE CONDITIONED RESTRICTED STOCK UNITS (“PCRSUs”PCRSUS”)
In 2009, the Company did not grant any new PCRSUs. As a result of PCRSUs previously granted in 2007 having achieved their target, the Company issued 86,555 PCRSUs in 2009. On June 27, 2007,February 20, 2008, the Company granted 1,381,10063,881 (2007—115,092) PCRSUs having a weighted average grant date fair value of $10.44$80.52 (2007—$125.28) and a weighted average remaining contractual life of approximately 21 months.24 months (2007—24 months). Each PCRSU is equivalent in value to one common share and is subject to a service condition as well as a performance or market condition. These awards have an additional feature where the ultimate number of units that vest will be determined by the Company’s performance results or shareholder return in relation to a predetermined target over the period to vesting. No awards vest when the minimum thresholds are not achieved. The performance measurement date will vary depending on the specific award. Upon vesting, the participants will receive common shares of the Company or in certain instances cash of an equivalent value.
At December 31, 2007, 2009, one market condition for the two first measurement periods (2008—one market condition for the first measurement periodperiod), related to the 2008 grant, was achieved. As such this portion of the PCRSU grant, representing 76,66515,890 (2008—3,985) units, will cliff vest on December 31, 2009. No other2010.
At December 31, 2009, one market condition and one performance condition wasfor various measurement periods (2008—nil; 2007—one market condition for the first measurement period), related to the 2007 grant, were achieved. As such, these portions of the PCRSU grant, as well as a portion issued in 2009, representing 51,642 (2008—nil; 2007—6,389) units, cliff vested on December 31, 2009.
On March 31, 2009, PCRSUs granted in 2007 as well as a portion issued in 2009, representing 88,082 units, vested based on the attainment of a variety of business integration and synergy achievement goals.
106
NOTES TO CONSOLIDATED FINANCIAL STATEMENTS
DECEMBER 31, 2009
(IN MILLIONS OF DOLLARS, UNLESS OTHERWISE NOTED)
RESTRICTED STOCK UNITS (“RSUs”RSUS”)
On June 27, 2007,April 8, 2009, the Company granted 818,250436,575 (2008—49,198; 2007—68,188) RSUs having a weighted average grant date fair value of $10.64$12.60 (2008—$80.52; 2007—$127.68) and a weighted average remaining contractual life of approximately 27 months (2008—26 months; 2007—23 months.months). The Company will deliver one share of common stock in settlement of each outstanding RSU (including dividend equivalents) that has vested in accordance with the stipulated service conditions. The awards cliff vest at various dates up to April 8, 2012 (2008—February 20, 2011; 2007—February 28, 2010.
92
NOTES TO CONSOLIDATED FINANCIAL STATEMENTS
DECEMBER 30, 2007
(IN MILLIONS OF US DOLLARS, UNLESS OTHERWISE NOTED)
2010).
DEFERRED STOCK UNITS (“DSUs”DSUS”)
On April 8, 2009, the Company granted 26,667 (2008 and 2007—nil) DSUs having a weighted average grant date fair value of $12.60 that will vest in three equal annual installments beginning on April 8, 2009. The Company delivers, on a quarterly basis, DSUs to its Directors that vest immediately on the grant date. The Company will deliver at the option of the holder either one share of common stock or the cash equivalent of the fair market value on settlement of each outstanding DSU (including dividend equivalents accumulated) upon termination of service. In 2009, the Company granted 47,156 (2008—23,848; 2007—8,594) DSUs to its Directors.
NON-QUALIFIED STOCK OPTIONS
On June 27, 2007,April 8, 2009, the Company granted 615,900120,646 (2008 and 2007—nil) stock options, having an exercise price of $10.64$12.60 and grant date fair value of $2.88.$9.05. The stock options vest at various dates up to February 28, 2010April 8, 2012 subject to service conditions. Upon exercise, the option holders may elect to proceed with a cashless exercise and receive common shares net of the deduction for cashless exercise. The options expire at various dates no later than seven years from the date of grant.
PERFORMANCE STOCK OPTIONS
On April 8, 2009, the Company granted 151,831 (2008—28,375; 2007—51,325) performance stock options having an exercise price of $12.60 (2008—$80.52; 2007—$127.68) and grant date fair value of $9.05 (2008—$24.36; 2007—$34.56). The stock options vest at various dates up to April 8, 2012 if certain market conditions are met in addition to a service period. Upon exercise, the option holders may elect to proceed with a cashless exercise and receive common shares net of the deduction for cashless exercise. The options expire at various dates no later than seven years from the date of grant.
GENERAL TERMS OF AWARDS UNDER THE OMNIBUS PLAN
TERMINATION OF EMPLOYMENT
Upon a termination due to death, time-based awards vest in full, performance-based awards vest at target levels, and options and stock appreciation rights remain exercisable for one year. Upon a termination due to disability, time-based awards vest in full, performance-based awards continue to vest in accordance with the original vesting schedule, and options and stock appreciation rights remain exercisable for one year. Upon retirement, a pro-rated portion of time-based awards vest and a pro-rated portion of performance-based awards continue to vest based on actual performance during the applicable performance period, and all awards remain outstanding for five years. Upon a termination for cause or a voluntary termination by a plan participant, all awards, including vested but unexercised awards, are forfeited without payment. Upon an involuntary
107
NOTES TO CONSOLIDATED FINANCIAL STATEMENTS
DECEMBER 31, 2009
(IN MILLIONS OF DOLLARS, UNLESS OTHERWISE NOTED)
termination for any reason other than cause, vested awards remain outstanding for 90 days and unvested awards are forfeited.
CHANGE IN CONTROL
Upon a change in control, unless otherwise determined by the Company, a participant’s awards will be replaced with awards of the acquiring company having the same or better terms. If there is a change in control and a participant’s employment is terminated for business reasons in the three months prior to or twenty-four months after the change in control, his or her time-based awards will fully vest and performance-based awards will vest to the extent the applicable performance goals have been achieved as of the date of the change in control or the end of the fiscal quarter immediately prior to the date of termination, whichever is greater.
If replacement awards are not available, unless the Company determines otherwise, all time-based awards fully vest and performance-based awards vest to the extent the performance goals related to the award have been achieved as of the date of the change in control. Alternatively, the Human Resources Committee of the Board of Directors may determine that vested awards will be cancelled in exchange for a cash payment (or other form of change in control consideration) based on the value of the change in control payment and that unvested awards will be forfeited. The Company’s Board of Directors may also accelerate the vesting of any or all awards upon a change in control.
93
NOTES TO CONSOLIDATED FINANCIAL STATEMENTS
DECEMBER 30, 2007
(IN MILLIONS OF US DOLLARS, UNLESS OTHERWISE NOTED)
CLAWBACK FOR FINANCIAL REPORTING MISCONDUCT
If a participant in the Omnibus Plan knowingly or grossly negligently engages in financial reporting misconduct, then all awards and gains from the exercise of options or stock appreciation rights in the 12 months prior to the date the misleading financial statements were issued as well as any awards that vested based on the misleading financial statements will be disgorged to the Company.
For the year ended December 31, 2009, compensation expense recognized in the Company’s results of operations was approximately $27 million (2008—$16 million; 2007—$15 million) for all of the outstanding awards. Compensation costs not yet recognized amount to approximately $21 million (2008—$11 million; 2007—$29 million) and will be recognized over the remaining service period. Compensation costs for performance awards are based on management’s best estimate of the final performance measurement.
REPLACEMENT PLANS FOR AWARDS TO FORMER EMPLOYEES OF WEYERHAEUSER
Prior to the consummation of the Transaction, employees of Weyerhaeuser who were being transferred to the Company were given the opportunity to exchange their outstanding Weyerhaeuser equity awards for awards of the Company having the same terms and conditions as their prior Weyerhaeuser awards. The Company has adopted three plans to provide for the grant of the Company’s equity awards in exchange for the prior plan awards. The Restricted Share Units (“RSUs”), Stock Appreciation Rights (“SARs”) and Stock Options mirror the three Weyerhaeuser plans under which the prior plan awards were initially granted.
Awards were made under these plans in connection with the consummation of the Transaction only to those employees who elected to exchange their prior plan awards for the Company’s equity awards.
108
NOTES TO CONSOLIDATED FINANCIAL STATEMENTS
DECEMBER 31, 2009
(IN MILLIONS OF DOLLARS, UNLESS OTHERWISE NOTED)
REPLACEMENT PLANS FOR FORMER DOMTAR INC. AWARDS
Options granted to Domtar Inc. employees, whether vested or unvested, were exchanged on the same terms and conditions for an option to purchase a number of shares of common stock of Domtar Corporation equal to the number of the Company’s common shares or of equivalent value determined using the Black-Scholes option-pricing model, depending if the exercise price was higher, equal or less than the market value at the time of the exchange.
Each outstanding award of restricted Domtar Inc. common shares was exchanged on a one-for-one basis, and on the same terms and conditions as applied to Domtar Inc. restricted share awards, for awards of restricted shares of the Company’s common shares (“RSAs”). On March 7, 2007, 654,93554,578 common shares were acquired and are held in trust in exchange for the former Domtar Inc. restricted awards.
Each outstanding grant of DSUs with respect to Domtar Inc. common shares were exchanged on a one-for-one basis, on the same terms and conditions as applied to the Domtar Inc. DSUs, for DSUs with respect to shares of the Company’s common stock. On March 7, 2007, 351,71829,310 DSUs and 54,8154,568 DSUs were issued to outside directors and executives, respectively, in exchange for Domtar Inc. DSUs. DSUs granted after March 7, 2007 are granted under the Omnibus Incentive plan.
No new awards have been or will be made under any of the replacement plans.
For the year ended December 30, 2007, compensation expense recognized in the Company’s results of operations was approximately $15 million for all of the outstanding awards. Compensation cost not yet recognized amount to approximately $29 million and will be recognized over the remaining service period. Compensation costs for performance awards are based on management’s best estimate of the final performance measurement.
94
NOTES TO CONSOLIDATED FINANCIAL STATEMENTS
DECEMBER 30, 2007
(IN MILLIONS OF US DOLLARS, UNLESS OTHERWISE NOTED)
SUMMARY OF OUTSTANDING AWARDS
Details regarding Domtar Corporation outstanding awards are presented in the following tables:
NUMBER OF AWARDS | PCRSU | RSU/RSA | DSU | PCRSU | RSU/RSA | DSU | ||||||||||||||||
Outstanding at January 1, 2007 | Outstanding at January 1, 2007 |
| — | — | — | — | — | — | ||||||||||||||
Exchanged pursuant to the Transaction | Exchanged pursuant to the Transaction |
| — | 875,733 | 406,533 | — | 72,978 | 33,878 | ||||||||||||||
Granted | Granted |
| 1,381,100 | 818,250 | 103,132 | 115,092 | 68,187 | 8,594 | ||||||||||||||
Forfeited/expired | Forfeited/expired |
| — | (1,179 | ) | — | — | (98 | ) | — | ||||||||||||
Exercised/settled | Exercised/settled |
| — | — | (131,573 | ) | — | — | (10,964 | ) | ||||||||||||
Total outstanding at December 30, 2007 | Total outstanding at December 30, 2007 |
| 1,381,100 | 1,692,804 | 378,092 | 115,092 | 141,067 | 31,508 | ||||||||||||||
Granted | 63,881 | 49,198 | 23,848 | |||||||||||||||||||
Forfeited/expired | (4,503 | ) | (6,900 | ) | — | |||||||||||||||||
Exercised/settled | — | (25,848 | ) | (4,671 | ) | |||||||||||||||||
Total outstanding at December 31, 2008 | 174,470 | 157,517 | 50,685 | |||||||||||||||||||
Granted | 86,555 | 436,575 | 73,823 | |||||||||||||||||||
Forfeited/expired | (823 | ) | (37,493 | ) | — | |||||||||||||||||
Exercised/settled | (88,082 | ) | (31,131 | ) | — | |||||||||||||||||
OPTIONS | Number of options | Weighted average exercise price | Weighted average remaining life (in years) | Aggregate intrinsic value (in millions) | ||||||||||||||||||
Outstanding at January 1, 2007 | — | $ | — | $ | ||||||||||||||||||
Exchanged pursuant to the Transaction | 4,869,502 | 7.33 | ||||||||||||||||||||
Granted | 615,900 | 10.64 | ||||||||||||||||||||
Exercised | (295,416 | ) | 7.82 | |||||||||||||||||||
Forfeited/expired | (69,114 | ) | 8.20 | |||||||||||||||||||
Total outstanding at December 31, 2009 | 172,120 | 525,468 | 124,508 | |||||||||||||||||||
Outstanding at December 30, 2007 | 5,120,872 | 7.69 | 5.0 | 2.5 | ||||||||||||||||||
Options exercisable at December 30, 2007 | 2,040,578 | 7.84 | 4.2 | 0.8 | ||||||||||||||||||
SARs | Number of SARs | Weighted average exercise price | Weighted average remaining life (in years) | Aggregate intrinsic value (in millions) | ||||||||||||||||||
Outstanding at January 1, 2007 | — | $ | — | $ | ||||||||||||||||||
Exchanged pursuant to the Transaction | 195,395 | 6.58 | ||||||||||||||||||||
Outstanding at December 30, 2007 | 195,395 | 6.58 | 7.5 | 0.2 | ||||||||||||||||||
SARs exercisable at December 30, 2007 | 14,644 | 6.27 | 6.8 | — | ||||||||||||||||||
95109
NOTES TO CONSOLIDATED FINANCIAL STATEMENTS
DECEMBER 30, 200731, 2009
(IN MILLIONS OF US DOLLARS, UNLESS OTHERWISE NOTED)
OPTIONS | Number of options | Weighted average exercise price | Weighted average remaining life (in years) | Aggregate intrinsic value (in millions) | |||||
| $ | $ | ||||||||
Outstanding at January 1, 2007 | — | — | |||||||
Exchanged pursuant to the Transaction | 405,792 | 87.96 | |||||||
Granted | 51,325 | 127.68 | |||||||
Exercised | (24,618 | ) | 93.84 | ||||||
Forfeited/expired | (5,760 | ) | 98.40 | ||||||
Outstanding at December 30, 2007 | 426,739 | 92.28 | 5.4 | 2.5 | |||||
Options exercisable at December 30, 2007 | 170,048 | 94.08 | 4.2 | 0.8 | |||||
Outstanding at December 30, 2007 | 426,739 | 92.28 | 5.4 | 2.5 | |||||
Granted | 28,375 | 80.52 | 6.1 | — | |||||
Exercised | (928 | ) | 78.48 | — | — | ||||
Forfeited/expired | (22,022 | ) | 100.56 | — | — | ||||
Outstanding at December 31, 2008 | 432,164 | 91.08 | 4.7 | — | |||||
Options exercisable at December 31, 2008 | 237,631 | 86.77 | 4.1 | — | |||||
Outstanding at December 31, 2008 | 432,164 | 91.08 | 4.7 | — | |||||
Granted | 272,477 | 12.60 | 2.3 | 11.0 | |||||
Forfeited/expired | (46,058 | ) | 97.67 | — | — | ||||
Outstanding at December 31, 2009 | 658,583 | 58.15 | 3.3 | — | |||||
Options exercisable at December 31, 2009 | 325,736 | 92.64 | 3.1 | — | |||||
110
NOTES TO CONSOLIDATED FINANCIAL STATEMENTS
DECEMBER 31, 2009
(IN MILLIONS OF DOLLARS, UNLESS OTHERWISE NOTED)
SARs | Number of SARs | Weighted average exercise price | Weighted average remaining life (in years) | Aggregate intrinsic value (in millions) | |||||
| $ | $ | ||||||||
Outstanding at January 1, 2007 | — | — | |||||||
Exchanged pursuant to the transaction | 16,283 | 78.96 | |||||||
SARs exercisable at December 30, 2007 | 1,220 | 75.24 | 6.8 | — | |||||
Outstanding at December 30, 2007 | 16,283 | 78.96 | 7.5 | 0.2 | |||||
Forfeited | (568 | ) | 75.48 | — | — | ||||
Outstanding at December 31, 2008 | 15,715 | 78.95 | 6.5 | — | |||||
SARs exercisable at December 31, 2008 | 8,303 | 78.02 | 6.2 | — | |||||
Outstanding at December 31, 2008 | 15,715 | 78.95 | 6.5 | — | |||||
Forfeited | (331 | ) | 78.89 | — | — | ||||
Outstanding at December 31, 2009 | 15,384 | 78.94 | 5.4 | — | |||||
SARs exercisable at December 31, 2009 | 12,995 | 78.75 | 5.4 | — | |||||
The fair value of the stock options granted in 20072009 was estimated at the grant date of grant using a Black-Scholes based option pricing model or an option pricing model that incorporated the market conditions when applicable. The following assumptions were used in calculating the fair value of the options granted.
| ||
| ||
| ||
|
The weighted average grant date fair value for the options and stock appreciation awards exchanged pursuant to the transaction was $3.27.
| 2009 | 2008 | 2007 | ||||
Dividend yield | 0% | 0% | 0% | |||
Expected volatility | 77% | 39% | 30% – 35% | |||
Risk-free interest rate | 3% | 3% | 4% – 5% | |||
Expected life | 7 years | 4 years | 4 to 6 years | |||
NOTE 5.6.
On May 29, 2009 the Company’s Board of Directors authorized the implementation of a reverse stock split at a 1-for-12 ratio of its outstanding common stock. Shareholder approval for the reverse stock split was obtained at the Company’s Annual General Meeting held on May 29, 2009 and the reverse stock split became effective June 10, 2009 at 6:01 PM (ET). At the effective time, every 12 shares of the Company’s common stock that was issued and outstanding was automatically combined into one issued and outstanding share, without any change in par value of such shares.
111
NOTES TO CONSOLIDATED FINANCIAL STATEMENTS
DECEMBER 31, 2009
(IN MILLIONS OF DOLLARS, UNLESS OTHERWISE NOTED)
The following table provides the reconciliation between basic and diluted earnings (loss) per share:
| Year ended December 30, 2007 | Year ended December 31, 2006 | Year ended December 25, 2005 | Year ended December 31, 2009 | Year ended December 31, 2008 | Year ended December 30, 2007 | ||||||||||||||||
Net earnings (loss) | $ | 70 | $ | (609 | ) | $ | (478 | ) | $ | 310 | $ | (573 | ) | $ | 70 | ||||||
Weighted average number of common and exchangeable shares outstanding (millions) | 474.1 | 284.1 | 284.1 | 43.0 | 43.0 | 39.5 | |||||||||||||||
Effect of dilutive securities (millions) | 1.8 | — | — | 0.2 | — | 0.2 | |||||||||||||||
Weighted average number of diluted common and exchangeable shares outstanding (millions) | 475.9 | 284.1 | 284.1 | 43.2 | 43.0 | 39.7 | |||||||||||||||
Basic net earnings (loss) per share (in dollars) | $ | 0.15 | $ | (2.14 | ) | $ | (1.68 | ) | $ | 7.21 | $ | (13.33 | ) | $ | 1.77 | ||||||
Diluted net earnings (loss) per share (in dollars) | $ | 0.15 | $ | (2.14 | ) | $ | (1.68 | ) | $ | 7.18 | $ | (13.33 | ) | $ | 1.76 | ||||||
The following table includesprovides the potential maximum awards of certain performance-based awardssecurities that could potentially dilute basic earnings (loss) per share in the future but were not included in the computation of diluted earnings (loss) per share because to do so would have been anti-dilutive:
| December 31, 2009 | December 31, 2008 | December 30, 2007 | ||||
Restricted stock units | 6,586 | 58,550 | — | |||
Options | 386,106 | 432,164 | — | |||
Performance-based awards | 33,764 | 103,550 | 243,722 |
The calculation of basic earnings per common share for the year ended December 30, 2007 due to performance targets not being satisfied at31, 2009 is based on the endweighted average number of Domtar common stock outstanding during the year. The calculation for diluted earnings per common share recognizes the effect of all potential dilutive common stock. A portion of the year:stock options to purchase common shares is excluded in the computation of diluted net earnings (loss) per share in periods because to do so would have been anti-dilutive.
|
Prior to the Transaction, Domtar Corporation did not have publicly traded common stock or stock options outstanding. The weighted average number of shares of common stock of Domtar Corporation outstanding for the year ended December 30, 2007 assumes that all such common stock outstanding immediately after the Contribution but before the acquisition of Domtar Inc. were outstanding since January 1, 2007. The effect of dilutive securities for the year ended December 30, 2007 assumes that all replacement stock options of Domtar Corporation were outstanding immediately after the Contribution on March 5, 2007.
96112
NOTES TO CONSOLIDATED FINANCIAL STATEMENTS
DECEMBER 30, 200731, 2009
(IN MILLIONS OF US DOLLARS, UNLESS OTHERWISE NOTED)
The weighted average number of shares of Domtar Corporation common stock outstanding for the years ended December 31, 2006 and December 25, 2005 assumes that all such common stock outstanding immediately after the contribution of the Business Unit but before the acquisition of Domtar Inc. were outstanding since December 31, 2004.
NOTE 6.7.
PENSION PLANS AND OTHER POST-RETIREMENT BENEFIT PLANS
DEFINED CONTRIBUTION PLANS
As part of the acquisition of Domtar Inc., theThe Company now has several additional defined contribution plans and multi-employer plans. The pension expense under these plans is equal to the Company’s contribution. For the year ended December 30, 2007,31, 2009, the pension expense was $10$24 million (2006—(2008—$721 million; 2005—2007—$816 million).
DEFINED BENEFIT PLANS AND OTHER POST-RETIREMENT BENEFIT PLANS
As part of the acquisition of Domtar Inc., theThe Company now has several additional defined benefit pension plans covering substantially all employees. Non-unionized employees in Canada joining the Company after June 1, 2000 participate in defined contribution plans. The defined benefit plans are generally contributory in Canada and non-contributory in the United States. The Company also provides other post-retirement plans to eligible Canadian and USU.S. employees; the plans are unfunded and include life insurance programs, medical and dental benefits and short-term and long-term disability programs. At March 7, 2007, the funded status acquired by the Company was a net liability of $152 million for the pension plans and $71 million for other post-retirement benefit plans. Other post-retirement benefits were accounted for in the Predecessor financial statements using a multi-employer approach. As a result, an additional net liability of $35 million was recorded in 2007. Certain other pension liabilities, other than the ones related to the four Canadian pension plans, were retained by Weyerhaeuser.
The pension expense and the obligation related to the defined benefit plans are actuarially determined using management’s most probable assumptions.
Components of net periodic benefit cost for pension plans | Year ended December 30, 2007 | Year ended December 31, 2006 | Year ended December 25, 2005 | |||||||||
Service cost for the year | $ | 40 | $ | 7 | $ | 5 | ||||||
Interest expense | 74 | 15 | 15 | |||||||||
Expected return on plan assets | (86 | ) | (26 | ) | (22 | ) | ||||||
Curtailment gain | (1 | ) | — | — | ||||||||
Settlement loss (gain) | 7 | — | (8 | ) | ||||||||
Amortization of prior year service costs | 1 | 1 | 2 | |||||||||
Net periodic benefit cost | 35 | (3 | ) | (8 | ) | |||||||
97
NOTES TO CONSOLIDATED FINANCIAL STATEMENTS
DECEMBER 30, 2007
(IN MILLIONS OF US DOLLARS, UNLESS OTHERWISE NOTED)
The components of net periodic benefit cost for pension plans for the years ended December 31, 2006 and December 25, 2005, as disclosed in the table above, include the components for the Canadian Plans only.
Components of net periodic benefit cost for other post-retirement benefit plans | Year ended December 30, 2007 | Year ended December 31, 2006 | Year ended December 25, 2005 | |||||||
Service cost for the year | $ | 5 | $ | 11 | $ | 9 | ||||
Interest expense | 5 | — | — | |||||||
Curtailment gain | (3 | ) | — | — | ||||||
Net periodic benefit cost | 7 | 11 | 9 | |||||||
The Company’s pension plan funding policy is to contribute annually the amount required to provide for benefits earned in the year, to fund solvency deficiency over time and to fund past service obligations over periods not exceeding those permitted by the applicable regulatory authorities. Past service obligations primarily arise from improvements to plan benefits.
The Company expects to contribute a minimum total amount of $72$40 million in 20082010 compared to $106$130 million in 2007 (2006—2009 (2008—$8194 million) to the pension plans. The contributionspayments made in 20072009 to the other post-retirement benefit plans amounted to $5$8 million (2006 – nil)(2008—$8 million). In conjunction with a partial wind-up declared in 2006 related to the pension plans of Domtar Inc., an estimated amount of $132 million (CDN$130 million) of plan assets and liabilities is expected to be settled from the pension funds in 2008. The Company was required to make an augmented contribution to the plan in 2007 in the amount of approximately $38 million. This augmented contribution did not have an impact on the net periodic benefit cost.
113
NOTES TO CONSOLIDATED FINANCIAL STATEMENTS
DECEMBER 31, 2009
(IN MILLIONS OF DOLLARS, UNLESS OTHERWISE NOTED)
CHANGE IN ACCRUED BENEFIT OBLIGATION
The following table represents the change in the accrued benefit obligation as of December 30, 200731, 2009 and December 31, 2006,2008, the measurement date for each year:
| December 30, 2007 | December 31, 2006 | ||||||||||||||
| Pension plans | Other post- retirement benefit plans | Pension plans | Other post- retirement benefit plans | ||||||||||||
Accrued benefit obligation at beginning of year | $ | 318 | $ | — | $ | 310 | $ | — | |||||||
Post-closing adjustment (Note 1) | — | 35 | — | — | |||||||||||
Service cost for the year | 40 | 5 | 6 | — | |||||||||||
Interest expense | 74 | 5 | 15 | — | |||||||||||
Plan participants’ contributions | 7 | — | 2 | — | |||||||||||
Actuarial gain (loss) | (24 | ) | (5 | ) | 1 | — | |||||||||
Plan amendments | 3 | — | — | — | |||||||||||
Benefits paid | (89 | ) | (5 | ) | (16 | ) | — | ||||||||
Settlement | (92 | ) | — | — | — | ||||||||||
Curtailment | (15 | ) | (2 | ) | (1 | ) | — | ||||||||
Acquisition of Domtar Inc. (Note 3) | 1,254 | 71 | — | — | |||||||||||
Other | — | — | 1 | — | |||||||||||
Effect of foreign currency exchange rate change | 259 | 11 | — | — | |||||||||||
Accrued benefit obligation at end of year | 1,735 | 115 | 318 | — | |||||||||||
98
NOTES TO CONSOLIDATED FINANCIAL STATEMENTS
DECEMBER 30, 2007
(IN MILLIONS OF US DOLLARS, UNLESS OTHERWISE NOTED)
| December 31, 2009 | December 31, 2008 | |||||||||||
| Pension plans | Other post-retirement benefit plans | Pension plans | Other post-retirement benefit plans | |||||||||
| $ | $ | $ | $ | |||||||||
Accrued benefit obligation at beginning of year | 1,121 | 99 | 1,735 | 122 | ||||||||
Service cost for the year | 35 | 4 | 36 | 4 | ||||||||
Interest expense | 84 | 7 | 78 | 6 | ||||||||
Plan participants’ contributions | 7 | — | 7 | — | ||||||||
Actuarial loss (gain) | 141 | 19 | (274 | ) | (7 | ) | ||||||
Plan amendments | — | (11 | ) | 32 | — | |||||||
Benefits paid | (91 | ) | — | (94 | ) | — | ||||||
Direct benefit payments | (3 | ) | (8 | ) | — | (8 | ) | |||||
Settlement | (28 | ) | — | (137 | ) | — | ||||||
Curtailment | 1 | — | (6 | ) | (2 | ) | ||||||
Effect of foreign currency exchange rate change | 174 | 12 | (262 | ) | (16 | ) | ||||||
Special termination benefits | 1 | — | 6 | — | ||||||||
Accrued benefit obligation at end of year | 1,442 | 122 | 1,121 | 99 | ||||||||
CHANGE IN FAIR VALUE OF ASSETS
The following table represents the change in the fair value of assets reflecting the actual return on plan assets, the contributions and the benefits paid during the year:
| December 30, 2007 | December 31, 2006 | December 31, 2009 Pension plans | December 31, 2008 Pension plans | ||||||||||||||||||
| Pension plans | Other post- retirement benefit plans | Pension plans | Other post- retirement benefit plans | $ | $ | ||||||||||||||||
Fair value of assets at beginning of year | $ | 333 | $ | — | $ | 292 | $ | — | 1,045 | 1,588 | |||||||||||
Actual return on plan assets | (19 | ) | — | 47 | — | 145 | (267 | ) | |||||||||||||
Employer contributions | 106 | 5 | 8 | — | 130 | 194 | |||||||||||||||
Plan participants’ contributions | 7 | — | 2 | — | 7 | 7 | |||||||||||||||
Benefits paid | (89 | ) | (5 | ) | (16 | ) | — | (91 | ) | (94 | ) | ||||||||||
Settlement | (92 | ) | — | — | — | (28 | ) | (137 | ) | ||||||||||||
Acquisition of Domtar Inc. (Note 3) | 1,102 | — | — | — | |||||||||||||||||
Effect of foreign currency exchange rate change | 240 | — | — | — | 154 | (246 | ) | ||||||||||||||
Fair value of assets at end of year | 1,588 | — | 333 | — | 1,362 | 1,045 | |||||||||||||||
DESCRIPTION OF ASSETSINVESTMENT POLICIES AND STRATEGIES OF THE PENSION PLANSPLAN ASSETS
The assets of the pension plans are held by a number of independent trustees and are accounted for separately in the Company’s pension funds. The investment strategy for the assets in the pension plans is to maintain a diversified portfolio of assets, invested in a prudent manner to maintain the security of funds while maximizing returns within the guidelines provided in the investment policy. Diversification of the pension plans’
114
NOTES TO CONSOLIDATED FINANCIAL STATEMENTS
DECEMBER 31, 2009
(IN MILLIONS OF DOLLARS, UNLESS OTHERWISE NOTED)
holdings is maintained in order to reduce the pension plans’ annual return variability, reduce market exposure and credit exposure to any single issuer and to any single component of the capital markets, to reduce exposure to unexpected inflation, to enhance the long-term risk-adjusted return potential of the pension plans and to reduce funding risk.
In the long run, the performance of the pension plans is primarily determined by the long-term asset mix decisions. To manage the long-term risk of not having sufficient funds to match the obligations of the pension plans, the Company conducts asset/liability studies. These studies lead to the recommendation and adoption of a long-term asset mix target that sets the expected rate of return and reduces the risk of adverse consequences to the plan from increases in liabilities and decreases in assets. In identifying the asset mix target that would best meet the investment objectives, consideration is given to various factors, including (a) each plan’s characteristics, (b) the duration of each plan’s liabilities, (c) the solvency and going concern financial position of each plan and their sensitivity to changes in interest rates and inflation and (d) the long-term return and risk expectations for key asset classes.
The investments of each plan can be done directly through cash investments in equities or bonds or indirectly through derivatives or pooled funds. The use of derivatives must be in accordance with an approved mandate and cannot be used for speculative purposes.
The Company’s pension funds are not permitted to own any of the Company’s shares or debt instruments. The target asset allocation is based on the expected duration of the benefit obligation.
The following table shows the allocation of the plan assets, based on the fair value of the assets held and the target allocation for 2007:2009:
| Target allocation | Percentage plan assets as at December 30, 2007 | Percentage plan assets as at December 31, 2006 | ||||
Fixed income securities | 56% - 66% | 62% | 16% | |||
Equity securities | 34% - 44% | 38% | 27% | |||
Hedge fund securities | 0% | 0% | 53% | |||
Real estate | 0% | 0% | 4% | |||
Total | 100% | 100% | ||||
| Target allocation | Percentage plan assets as at December 31, 2009 | Percentage plan assets as at December 31, 2008 | ||||||
Fixed Income | ||||||||
Cash and cash equivalents | 0% – 10% | 8 | % | 6 | % | |||
Bonds | 49% – 59% | 51 | % | 53 | % | |||
Equity | ||||||||
Canadian Equity | 10% – 18% | 13 | % | 11 | % | |||
U.S. Equity | 13% – 23% | 17 | % | 19 | % | |||
International Equity | 7% – 16% | 11 | % | 11 | % | |||
Total(1) | 100 | % | 100 | % | ||||
ASSET BACKED COMMERCIAL PAPER
The Company and its subsidiaries, including Domtar Inc., have no direct holdings of asset backed commercial paper (ABCP).
At December 30, 2007, Domtar Corporation’s Canadian pension funds have approximately $450 million (CDN $445 million) invested in multiple ABCP conduits that may be restructured. $393 million (CDN $389 million) of this amount is subject to the interim arrangement of the “Montreal Proposal.”
| (1) | Approximately 89% of the pension plan assets relate to Canadian plans and 11% relate to U.S. plans. |
99115
NOTES TO CONSOLIDATED FINANCIAL STATEMENTS
DECEMBER 30, 200731, 2009
(IN MILLIONS OF US DOLLARS, UNLESS OTHERWISE NOTED)
Pursuant to the Montreal Proposal, banks and major investors are negotiating restructuring proposals with respect to such ABCP conduits intended to minimize potential losses for investors. These discussions are not yet completed and the outcome and the effect it would have on the value of the Company’s Canadian pension fund assets has yet to be determined. The objective of the Montreal Proposal is to restructure the ABCP conduits to give investors the reasonable expectation of receiving full par value over time and reducing the risk that adverse credit market conditions will impact the restructured notes. The objective of the Investors Committee is to complete the restructuring process by the end of April 2008.
At December 30, 2007, the Company has determined that the fair value of these ABCP investments should be reduced by 13% or $57 million to reflect management’s best estimate of fair value and assumes the successful completion of the Montreal Proposal.
The approach to determine the $57 million reduction in fair value was to segregate the ABCP conduits into three main categories. Category 1 represents conduits holding traditional securitized assets. Category 2 represents conduits mainly providing collateral to support leveraged super senior (LSS) tranches of collateralized debt obligations as well as other synthetic assets or traditional assets. Category 3 represents portions of conduits holding assets linked to US sub-prime mortgages. The Company looked to comparable fair values assuming the ACBP trusts were converted to long-term investments.
The Company does not expect liquidity issues to affect the pension funds since pension fund obligations are primarily long-term in nature. Losses in the pension fund investments, if any, would result in future increased contributions by the Company or its Canadian subsidiaries. Additional contributions to these pension funds would be required to be paid over a 5-year period. Losses, if any, would also impact operating earnings over a longer period of time and immediately increase liabilities and reduce equity.
RECONCILIATION OF FUNDED STATUS TO AMOUNTS RECOGNIZED IN THE CONSOLIDATED BALANCE SHEETSHEETS
The following table presents the difference between the fair value of assets and the actuarially determined accrued benefit obligation. This difference is also referred to as either the deficit or surplus, as the case may be, or the funded status of the plans. The table further reconciles the amount of the surplus or deficit (funded status) to the net amount recognized in the consolidated balance sheet.Consolidated Balance Sheets.
| December 30, 2007 | December 31, 2006 | ||||||||||||||
| Pension plans | Other post- retirement benefit plans | Pension plans | Other post- retirement benefit plans | ||||||||||||
Accrued benefit obligation at end of year | $ | (1,735 | ) | $ | (115 | ) | $ | (318 | ) | $ | — | ||||
Fair value of assets at end of year | 1,588 | — | 333 | — | |||||||||||
Funded status | (147 | ) | (115 | ) | 15 | — | |||||||||
100
NOTES TO CONSOLIDATED FINANCIAL STATEMENTS
DECEMBER 30, 2007
(IN MILLIONS OF US DOLLARS, UNLESS OTHERWISE NOTED)
| December 30, 2007 | December 31, 2006 | ||||||||||||||
| Pension plans | Other post- retirement benefit plans | Pension plans | Other post- retirement benefit plans | ||||||||||||
Trade and other payables (Note 17) | $ | (3 | ) | $ | (5 | ) | $ | — | $ | — | |||||
Other liabilities and deferred credits (Note 19) | (182 | ) | (110 | ) | (1 | ) | — | ||||||||
Other assets (Note 15) | 38 | — | 16 | — | |||||||||||
Net amount recognized in the consolidated balance sheet | (147 | ) | (115 | ) | 15 | — | |||||||||
| December 31, 2009 | December 31, 2008 | |||||||||||
| Pension plans | Other post-retirement benefit plans | Pension plans | Other post-retirement benefit plans | |||||||||
| $ | $ | $ | $ | |||||||||
Accrued benefit obligation at end of year | (1,442 | ) | (122 | ) | (1,121 | ) | (99 | ) | ||||
Fair value of assets at end of year | 1,362 | — | 1,045 | — | ||||||||
Funded status | (80 | ) | (122 | ) | (76 | ) | (99 | ) | ||||
| December 31, 2009 | December 31, 2008 | |||||||||||
| Pension plans | Other post-retirement benefit plans | Pension plans | Other post-retirement benefit plans | |||||||||
| $ | $ | $ | $ | |||||||||
Trade and other payables (Note 19) | — | (4 | ) | — | (7 | ) | ||||||
Other liabilities and deferred credits (Note 21) | (112 | ) | (118 | ) | (93 | ) | (92 | ) | ||||
Other assets (Note 16) | 32 | — | 17 | — | ||||||||
Net amount recognized in the Consolidated Balance Sheets | (80 | ) | (122 | ) | (76 | ) | (99 | ) | ||||
The following table presents the amount not yet recognized in net periodic benefit cost and included in accumulatedAccumulated other comprehensive income.income (loss).
| December 31, 2009 | December 31, 2008 | |||||||||||||||||||||||||
| December 30, 2007 | December 31, 2006 | Pension plans | Other post-retirement benefit plans | Pension plans | Other post-retirement benefit plans | |||||||||||||||||||||
| Pension plans | Other post- retirement benefit plans | Pension plans | Other post- retirement benefit plans | $ | $ | $ | $ | |||||||||||||||||||
Prior year service cost | $ | (11 | ) | $ | — | $ | (9 | ) | $ | — | (25 | ) | 10 | (35 | ) | — | ||||||||||
Accumulated gain (loss) | (79 | ) | 10 | (11 | ) | — | (188 | ) | (10 | ) | (119 | ) | 9 | |||||||||||||
Accumulated other comprehensive income (loss) | (90 | ) | 10 | (20 | ) | — | (213 | ) | — | (154 | ) | 9 | ||||||||||||||
Cumulative employer contributions in excess of net periodic benefit cost | (57 | ) | (125 | ) | 35 | — | ||||||||||||||||||||
Net liability amount recognized | (147 | ) | (115 | ) | 15 | — | ||||||||||||||||||||
116
NOTES TO CONSOLIDATED FINANCIAL STATEMENTS
DECEMBER 31, 2009
(IN MILLIONS OF DOLLARS, UNLESS OTHERWISE NOTED)
The following table presents the pre-tax amounts included in other comprehensive income.income (loss).
| Year ended December 31, 2009 | Year ended December 31, 2008 | Year ended December 30, 2007 | ||||||||||||||||||||||||||||
| Year ended December 30, 2007 | Year ended December 31, 2006 | Pension plans | Other post-retirement benefit plans | Pension plans | Other post-retirement benefit plans | Pension plans | Other post-retirement benefit plans | |||||||||||||||||||||||
| Pension plans | Other post- retirement benefit plans | Pension plans | Other post- retirement benefit plans | $ | $ | $ | $ | $ | $ | |||||||||||||||||||||
Prior year service cost | $ | (4 | ) | $ | — | $ | (9 | ) | $ | — | — | 10 | (30 | ) | — | (4 | ) | — | ||||||||||||
Amortization of prior year service cost | 2 | — | — | — | 10 | — | 4 | — | 2 | — | ||||||||||||||||||||
Net gain (loss) | (75 | ) | 10 | (11 | ) | — | (79 | ) | (19 | ) | (68 | ) | 6 | (75 | ) | 10 | ||||||||||||||
Amortization of net actuarial loss | 7 | — | — | — | 10 | — | 9 | — | 7 | — | ||||||||||||||||||||
Net amount recognized in other comprehensive income (pre-tax) | (70 | ) | 10 | (20 | ) | — | ||||||||||||||||||||||||
Net amount recognized in other comprehensive income (loss) (pre-tax) (Note 18) | (59 | ) | (9 | ) | (85 | ) | 6 | (70 | ) | 10 | ||||||||||||||||||||
An estimated amount of $1$9 million for pension plans and nil for other post-retirement benefit plans will be amortized from accumulated other comprehensive incomeloss into net periodic benefit cost in 2008.2010.
At December 30, 2007,31, 2009, the accrued benefit obligation and the fair value of defined benefit plan assets with an accrued benefit obligation in excess of fair value of plan assets were $1,344$854 million and $1,158$740 million, respectively.respectively (2008—$854 million and $760 million, respectively).
Components of net periodic benefit cost for pension plans | Year ended December 31, 2009 | Year ended December 31, 2008 | Year ended December 30, 2007 | ||||||
| $ | $ | $ | |||||||
Service cost for the year | 35 | 36 | 40 | ||||||
Interest expense | 84 | 78 | 74 | ||||||
Expected return on plan assets | (74 | ) | (80 | ) | (86 | ) | |||
Amortization of net actuarial loss | 4 | — | — | ||||||
Curtailment loss (gain) | 6 | 4 | (1 | ) | |||||
Settlement loss | 6 | 7 | 7 | ||||||
Amortization of prior year service costs | 3 | 1 | 1 | ||||||
Special termination benefits | 1 | 6 | — | ||||||
Net periodic benefit cost | 65 | 52 | 35 | ||||||
Components of net periodic benefit cost for other post-retirement benefit plans | Year ended December 31, 2009 | Year ended December 31, 2008 | Year ended December 30, 2007 | ||||||
| $ | $ | $ | |||||||
Service cost for the year | 4 | 4 | 7 | ||||||
Interest expense | 7 | 6 | 5 | ||||||
Curtailment gain | — | (2 | ) | (3 | ) | ||||
Net periodic benefit cost | 11 | 8 | 9 | ||||||
101
117
NOTES TO CONSOLIDATED FINANCIAL STATEMENTS
DECEMBER 30, 200731, 2009
(IN MILLIONS OF US DOLLARS, UNLESS OTHERWISE NOTED)
ESTIMATED FUTURE BENEFIT PAYMENTS FROM THE PLANS
Estimated future benefit payments from the plans for the next 10 years at December 30, 2007 are as follows:
| Pension plans | Other post-retirement benefit plans | |||||
2008 | $ | 257 | $ | 6 | ||
2009 | 88 | 6 | ||||
2010 | 90 | 6 | ||||
2011 | 93 | 6 | ||||
2012 | 96 | 7 | ||||
2013 - 2017 | 550 | 35 | ||||
WEIGHTED-AVERAGE ASSUMPTIONS
The Company used the following key assumptions to measure the accrued benefit obligation and the net periodic benefit cost. These assumptions are long-term, which is consistent with the nature of employee future benefits.
Pension plans | December 30, 2007 | December 31, 2006 | December 25, 2005 | December 31, 2009 | December 31, 2008 | December 30, 2007 | ||||||||||||
Accrued benefit obligation | ||||||||||||||||||
Discount rate | 5.5 | % | 5.2 | % | 5.2 | % | 6.4 | % | 7.3 | % | 5.5 | % | ||||||
Rate of compensation increase | 2.7 | % | 3.3 | % | 3.3 | % | 2.7 | % | 3.0 | % | 2.7 | % | ||||||
Net periodic benefit cost | ||||||||||||||||||
Discount rate | 5.3 | % | 5.2 | % | 6.0 | % | 6.8 | % | 5.5 | % | 5.2 | % | ||||||
Rate of compensation increase | 2.8 | % | 3.3 | % | 3.5 | % | 2.8 | % | 2.9 | % | 2.8 | % | ||||||
Expected long-term rate of return on plan assets | 6.2 | % | 9.5 | % | 9.5 | % | 6.8 | % | 6.3 | % | 6.2 | % | ||||||
Discount rate for Canadian plans: 6.4% based on a model whereby cash flows are projected for hypothetical plans and are discounted using a spot rate yield curve developed from bond yield data for AA corporate bonds provided by PC Bond Analytics with an adjustment to the yields to disregard yields provided for 25-year and 30-year maturities, a constant spot rate was assumed from 20 years onward.
Discount rate for US plans: 6.05% based on Domtar’s expected cash flows in the Mercer Yield Curve which is based on bonds rated AA or better by Moody’s, excluding callable bonds, bonds of less than a minimum issue size, and certain other bonds.
| |||||||
| |||||||
| |||||||
| |||||||
| |||||||
| |||||||
| |||||||
Other post-retirement benefit plans | December 31, 2009 | December 31, 2008 | December 30, 2007 | ||||||
Accrued benefit obligation | |||||||||
Discount rate | 6.3 | % | 6.9 | % | 5.6 | % | |||
Rate of compensation increase | 2.8 | % | 3.0 | % | 2.9 | % | |||
Net periodic benefit cost | |||||||||
Discount rate | 6.0 | % | 5.6 | % | 5.3 | % | |||
Rate of compensation increase | 3.0 | % | 3.0 | % | 3.0 | % |
Effective January 1, 2008,2010, the Company will use 7.0% (2009—6.8%; 2008—6.3%) as the expected return on plan assets, which reflects the current view of long-term investment returns.
The 2008overall expected long-term rate of return on plan assets assumption is based on an analysismanagement’s best estimate of the targetlong-term returns of the major asset classes (cash and cash equivalents, equities, and bonds) weighted by the actual allocation and expected return by asset class.of assets at the measurement date, net of expenses. This rate is adjusted forincludes an equity risk premium over government bond returns for equity investments and a value-added premium for the contribution to returns from active management. The sources used to determine management’s best estimate of long term returns are numerous and include country specific bond yields, which may be derived from the market using local bond indices or by 0.5% to take into consideration the active investment managementanalysis of the plan assets.local bond market, and country-specific inflation and investment market expectations derived from market data and analysts’ or governments’ expectations as applicable.
102118
NOTES TO CONSOLIDATED FINANCIAL STATEMENTS
DECEMBER 30, 200731, 2009
(IN MILLIONS OF US DOLLARS, UNLESS OTHERWISE NOTED)
For measurement purposes, a 5.8%7.0% weighted-average annual rate of increase in the per capita cost of covered health care benefits was assumed for 2008.2010. The rate was assumed to decrease gradually to 4.1% by 20132029 and remain at that level thereafter. An increase or decrease of 1% of this rate would have the following impact:
| Increase of 1% | Decrease of 1% | |||||||||||
| Increase of 1% | Decrease of 1% | $ | $ | |||||||||
Impact on net periodic benefit cost for other post-retirement benefit plans | $ | 1 | $ | (1 | ) | 1 | (1 | ) | ||||
Impact on accrued benefit obligation | 13 | (11 | ) | 11 | (9 | ) | ||||||
FAIR VALUE MEASUREMENT
Fair Value Measurements and Disclosures Topic of FASB ASC establishes a fair value hierarchy, which prioritizes the inputs to valuation techniques used to measure fair value into three levels. A financial instrument’s categorization within the fair value hierarchy is based upon the lowest level of input that is available and significant to the fair value measurement. Fair Value Measurements and Disclosures Topic of FASB ASC establishes and prioritizes three levels of inputs that may be used to measure fair value:
Level 1—Quoted prices in active markets for identical assets or liabilities.
Level 2—Observable inputs other than quoted prices in active markets for identical assets and liabilities, quoted prices for identical or similar assets or liabilities in inactive markets, or other inputs that are observable or can be corroborated by observable market data for substantially the full term of the assets or liabilities.
Level 3—Inputs that are generally unobservable and typically reflect management’s estimates of assumptions that market participants would use in pricing the asset or liability.
119
NOTES TO CONSOLIDATED FINANCIAL STATEMENTS
DECEMBER 31, 2009
(IN MILLIONS OF DOLLARS, UNLESS OTHERWISE NOTED)
The following tables present the fair value of the plan assets at December 31, 2009, by asset category:
| Fair Value Measurements at December 31, 2009 | ||||||||
Asset Category | Total | Quoted Prices in Active Markets for Identical Assets (Level 1) | Significant Observable Inputs (Level 2) | Significant Unobservable Inputs (Level 3) | ||||
| $ | $ | $ | $ | |||||
Cash and short term investments(1) | 449 | 449 | — | — | ||||
ABCP (2) | 205 | — | — | 205 | ||||
Canadian Government Bonds | 250 | 250 | — | — | ||||
Canadian and U.S. debt securities | 74 | 74 | — | — | ||||
U.S. Government Bonds | 6 | 6 | — | — | ||||
Bond index fund(3, 4) | 58 | — | 31 | 27 | ||||
Canadian equity securities(5) | 80 | 80 | — | — | ||||
International equities(6) | 108 | 108 | — | — | ||||
U.S. Stock index fund(3,7) | 91 | — | 91 | — | ||||
International stock index fund(3,8) | 34 | — | 34 | — | ||||
Asset backed securities(3) | 5 | — | 5 | — | ||||
Derivative contracts(9) | 2 | — | 2 | — | ||||
Total | 1,362 | 967 | 163 | 232 | ||||
| (1) | The level of cash and short term investments is related to $80 million of contributions made to the plans at the end of the year as well as $330 million of investments linked to equity and bond derivative positions. |
| (2) | This category is described in the section “Asset Backed Commercial Paper.” |
| (3) | The fair value of these plan assets are classified as Level 2 (inputs that are observable; directly or indirectly) as they are measured by the Trustee based on quoted prices in active markets and can be redeemed at the measurement date or in the near term. |
| (4) | The $27 million is considered Level 3 as the assets are restricted and are not redeemable in the near term. |
| (5) | This category represents an active segregated, large capitalization Canadian equity portfolio with the ability to purchase small and medium capitalized companies. |
| (6) | This category represents an active segregated, non North American multi-capitalization equity portfolio. |
| (7) | This category represents an equity index fund not actively managed that tracks the S&P 500 Index. |
| (8) | This category represents an equity index fund not actively managed that tracks a non North American index (MSCI—EAFE index). |
| (9) | The fair value of the derivative contracts are classified as Level 2 (inputs that are observable, directly or indirectly) as they are measured using equity indices and long term bond indices. |
120
NOTES TO CONSOLIDATED FINANCIAL STATEMENTS
DECEMBER 31, 2009
(IN MILLIONS OF DOLLARS, UNLESS OTHERWISE NOTED)
ASSET BACKED COMMERCIAL PAPER
At December 31, 2009, Domtar Corporation’s Canadian defined benefit pension funds held asset backed commercial paper (“ABCP”) valued at $205 million (CDN$214 million) with a nominal value of $359 million (CDN$376 million). At December 31, 2008, the plans held ABCP investments valued at $198 million (CDN$242 million) with a nominal value of $357 million (CDN$437 million). The value of the notes benefited from an increase in the value of the Canadian dollar and improving credit markets. Repayments in 2009 reduced the total amount outstanding of the notes.
Most of the ABCP investments (87% of nominal value (2008—89% of nominal value)) were subject to restructuring under the court order governing the Montreal Accord, that was completed in January 2009, while the remainder are in conduits restructured outside the Montreal Accord or subject to litigation between the sponsor and the credit counterparty.
There is no active, liquid quoted market for the ABCP held by the Company’s pension plans. The fair value of the ABCP notes is mainly based on a financial model incorporating uncertainties regarding return, credit spreads, the nature and credit risk of underlying assets, the amounts and timing of cash inflows and the limited market for the new notes as at December 31, 2009.
The largest conduit owned by the pension plans in the Montreal Accord contains mainly collateral investments that back credit default derivatives that protect counterparties against credit defaults above a specified threshold on different portfolios of corporate credits. The valuation methodology was based upon determining an appropriate credit spread for each class of notes based upon the implied protection level provided by each class against potential credit defaults. This was done by comparison to spreads for an investment grade credit default index and the comparable tranches within the index for equivalent credit protection. In addition, a liquidity premium of 1.75% was added to this spread. The resulting spread was used to calculate the present value of all such notes, based upon the anticipated maturity date. An additional discount of 2.5% was applied to reflect uncertainty over collateral values held to support the derivative transactions. An increase in the discount rate of 1% would reduce the value by $9 million (CDN$9 million) for these notes.
The value of the remaining notes that were subject to the Montreal Accord were sourced either from the asset manager of these notes, or from trading values for similar securities of similar credit quality. The conduits outside the Montreal Accord, which also provide protection to counterparties against credit defaults through derivatives, were valued based upon the collateral value held in the conduit net of the market value of the credit derivatives as provided by the sponsor of the conduit, with an additional discount (equivalent to 1.75% per annum) applied for illiquidity. One conduit still subject to litigation was valued at zero.
Possible changes that could have a material effect on the future value of the ABCP include (1) changes in the value of the underlying assets and the related derivative transactions, (2) developments related to the liquidity of the ABCP market, and (3) a severe and prolonged economic slowdown in North America and the bankruptcy of referenced corporate credits.
121
NOTES TO CONSOLIDATED FINANCIAL STATEMENTS
DECEMBER 31, 2009
(IN MILLIONS OF DOLLARS, UNLESS OTHERWISE NOTED)
The following table presents changes during the period for Level 3 fair value measurements of plan assets:
| Fair Value Measurements Using Significant Unobservable Inputs (Level 3) | ||||||||||||
| ABCP Montreal Accord | ABCP Outside Montreal Accord | Restricted Bond Index Fund | Total | |||||||||
| $ | $ | $ | $ | |||||||||
Balance at beginning of year | 176 | 22 | 31 | 229 | ||||||||
Purchases and settlements | (43 | ) | — | (6 | ) | (49 | ) | |||||
Actual return on plan assets | 27 | (6 | ) | 2 | 23 | |||||||
Effect of foreign currency exchange rate change | 26 | 3 | — | 29 | ||||||||
Balance at end of year | 186 | 19 | 27 | 232 | ||||||||
ESTIMATED FUTURE BENEFIT PAYMENTS FROM THE PLANS
Estimated future benefit payments from the plans for the next 10 years at December 31, 2009 are as follows:
| Pension plans | Other post-retirement benefit plans | |||
| $ | $ | |||
2010 | 102 | 7 | ||
2011 | 96 | 7 | ||
2012 | 97 | 7 | ||
2013 | 130 | 7 | ||
2014 | 102 | 7 | ||
2015 – 2019 | 551 | 39 |
122
NOTES TO CONSOLIDATED FINANCIAL STATEMENTS
DECEMBER 31, 2009
(IN MILLIONS OF DOLLARS, UNLESS OTHERWISE NOTED)
NOTE 7.8.
Other operating expenses (income) areincome is an aggregate of both recurring and occasional expenses (income)loss or income items and, as a result, can fluctuate from year to year. The Company’s other operating expenses (income) includeincome includes the following:
| Year ended December 30, 2007 | Year ended December 31, 2006 | Year ended December 25, 2005 | ||||||||||
Gain on lawsuit settlement | $ | (39 | ) | $ | — | $ | — | |||||
Gain on insurance claim | (12 | ) | — | — | ||||||||
Gain on financial instruments | (18 | ) | — | — | ||||||||
Foreign exchange gain | (5 | ) | — | — | ||||||||
Antidumping and countervailing duties refund | — | (65 | ) | — | ||||||||
Other, net | 5 | 2 | (8 | ) | ||||||||
Other operating income | $ | (69 | ) | $ | (63 | ) | $ | (8 | ) | |||
| Year ended December 31, 2009 | Year ended December 31, 2008 | Year ended December 30, 2007 | |||||||
| $ | $ | $ | |||||||
Alternative fuel tax credits (Note 1) | (498 | ) | — | — | |||||
Gain on lawsuit settlement | — | — | (39 | ) | |||||
Gain on insurance claims | (1 | ) | — | (12 | ) | ||||
Gain on financial instruments | — | — | (18 | ) | |||||
Gain on sale of trademarks | (1 | ) | (6 | ) | — | ||||
Gain on sale of property, plant and equipment | (5 | ) | (3 | ) | — | ||||
Foreign exchange loss (gain) | 6 | (5 | ) | (5 | ) | ||||
Other | 2 | 6 | 5 | ||||||
Other operating income | (497 | ) | (8 | ) | (69 | ) | |||
On November 23, 2007, the Company won a judgement by the Supreme Court of Canada in a claim against ABB Inc. and Alstom Canada Inc. In a unanimous decision rendered on November 22, 2007 the Court ordered ABB Inc. and Alstom Canada Inc. to pay Domtar approximately $39 million in damages and interest relative to a 1989 lawsuit on matters regarding manufacturers liability, latent defects and disclosure responsibility involving the installation of a recovery boiler at the Windsor Quebec facility.
During the year,In 2007, the Company won a settlement of approximately $12 million for past insurance claims relative to the recovery of past legal expenses incurred related to Phenolic foam insulation warranty claims.
In conjunction with the Transaction, the various financial instruments of Domtar Inc. were recorded at fair value and, as such, did not meet the requirements for hedge accounting. As a result, Domtar Corporation accountsaccounted for these contracts at their fair value with resulting gains and losses being included as a component of Other operating income.
The U.S. and Canada reached a final settlement in 2006 to a long-standing trade dispute over Canadian exports of softwood lumber into the U.S. Under the settlement agreement, a Canadian export tax was instituted that replaced countervailing and antidumping duties imposed These contracts were completed by the U.S., and Canadian softwood lumber exporters received refundsend of approximately 81% of countervailing and antidumping duties paid between 2002 and 2006. The Company recorded a refund of countervailing and antidumping duties of $65 million in the year ended December 31, 2006.2007.
103123
NOTES TO CONSOLIDATED FINANCIAL STATEMENTS
DECEMBER 30, 200731, 2009
(IN MILLIONS OF US DOLLARS, UNLESS OTHERWISE NOTED)
NOTE 8.9.
FINANCING EXPENSESINTEREST EXPENSE
The following table presents the components of financing expenses:interest expense:
| Year ended December 30, 2007 | Year ended December 31, 2006 | Year ended December 25, 2005 | ||||||||
Interest on long-term debt | $ | 142 | $ | — | $ | — | ||||
Premium and fees on debt-for-debt exchange | 50 | — | — | |||||||
Reversal of fair value increment on Canadian debentures | (25 | ) | — | — | ||||||
Receivables securitization (Note 10) | 5 | — | — | |||||||
Amortization of debt issue costs and other | 4 | — | — | |||||||
| 176 | — | — | ||||||||
Less: Income from short-term investments | 5 | — | — | |||||||
| $ | 171 | $ | — | $ | — | |||||
| Year ended December 31, 2009 | Year ended December 31, 2008 | Year ended December 30, 2007 | |||||||
| $ | $ | $ | |||||||
Interest on long-term debt(1) | 121 | 132 | 142 | ||||||
Premium and fees on debt-for-debt exchange | — | 1 | 50 | ||||||
Loss (gain) on repurchase of long-term debt | 3 | (8 | ) | — | |||||
Reversal of fair value increment on debentures | (12 | ) | (3 | ) | (25 | ) | |||
Receivables securitization (Note 11) | 2 | 5 | 5 | ||||||
Amortization of debt issue costs and other | 11 | 6 | 4 | ||||||
| 125 | 133 | 176 | |||||||
Less: Interest from short-term investments | — | — | 5 | ||||||
| 125 | 133 | 171 | |||||||
| (1) | The Company capitalized $1 million of interest expense in 2009 (2008 and 2007—nil) related to the borrowing costs associated with various construction projects at our facilities. |
NOTE 9.10.
The Components of Domtar Corporation’s earnings (loss) before income taxes by taxing jurisdiction were:
| Year ended December 30, 2007 | Year ended December 31, 2006 | Year ended December 25, 2005 | ||||||||||
U.S. earnings (loss) | $ | 217 | $ | (541 | ) | $ | 46 | |||||
Foreign losses | (118 | ) | (15 | ) | (624 | ) | ||||||
Earnings (loss) before income taxes | $ | 99 | $ | (556 | ) | $ | (578 | ) | ||||
Provisions for income taxes include the following:
| Year ended December 30, 2007 | Year ended December 31, 2006 | Year ended December 25, 2005 | ||||||||||
U.S. Federal and State: | ||||||||||||
Current | $ | 102 | $ | 105 | $ | 35 | ||||||
Deferred | (30 | ) | (55 | ) | (40 | ) | ||||||
Foreign: | ||||||||||||
Current | — | — | 2 | |||||||||
Deferred | (43 | ) | 3 | (97 | ) | |||||||
Income tax expense (benefit) | $ | 29 | $ | 53 | $ | (100 | ) | |||||
| Year ended December 31, 2009 | Year ended December 31, 2008 | Year ended December 30, 2007 | |||||||
| $ | $ | $ | |||||||
U.S. earnings | 560 | 15 | 217 | ||||||
Foreign losses | (70 | ) | (585 | ) | (118 | ) | |||
Earnings (loss) before income taxes | 490 | (570 | ) | 99 | |||||
104124
NOTES TO CONSOLIDATED FINANCIAL STATEMENTS
DECEMBER 30, 200731, 2009
(IN MILLIONS OF US DOLLARS, UNLESS OTHERWISE NOTED)
Provisions for income taxes include the following:
| Year ended December 31, 2009 | Year ended December 31, 2008 | Year ended December 30, 2007 | ||||||
| $ | $ | $ | ||||||
U.S. Federal and State: | ||||||||
Current | 101 | 45 | 102 | |||||
Deferred | 79 | (11 | ) | (30 | ) | |||
Foreign: | ||||||||
Current | — | — | — | |||||
Deferred | — | (31 | ) | (43 | ) | |||
Income tax expense | 180 | 3 | 29 | |||||
The provisions for income taxes of Domtar Corporation differ from the amounts computed by applying the statutory income tax rate of 35% to earnings (loss) before income taxes due to the following:
| Year ended December 30, 2007 | Year ended December 31, 2006 | Year ended December 25, 2005 | Year ended December 31, 2009 | Year ended December 31, 2008 | Year ended December 30, 2007 | ||||||||||||||||
U.S. federal statutory income tax | $ | 35 | $ | (195 | ) | $ | (202 | ) | |||||||||||||
| $ | $ | $ | |||||||||||||||||||
U.S. federal statutory income tax at 35% | 172 | (199 | ) | 35 | |||||||||||||||||
Reconcilling items: | |||||||||||||||||||||
State and local income taxes, net of federal income tax benefit | 10 | 7 | 1 | 4 | 4 | 10 | |||||||||||||||
Foreign income tax rate differential | 5 | (2 | ) | 120 | 6 | 25 | 5 | ||||||||||||||
Tax credits | (6 | ) | (12 | ) | (16 | ) | (13 | ) | (6 | ) | (6 | ) | |||||||||
Goodwill impairment | 1 | 262 | — | — | 113 | 1 | |||||||||||||||
Alternative fuel tax credit income | (176 | ) | — | — | |||||||||||||||||
Tax rate changes | (15 | ) | (3 | ) | (4 | ) | (2 | ) | 1 | (15 | ) | ||||||||||
Uncertain tax positions | 4 | — | — | 168 | 8 | 4 | |||||||||||||||
U.S. manufacturing deduction | (5 | ) | (3 | ) | (1 | ) | (2 | ) | (2 | ) | (5 | ) | |||||||||
Valuation allowance on foreign deferred tax assets | 29 | 52 | — | ||||||||||||||||||
Other | — | (1 | ) | 2 | (6 | ) | 7 | — | |||||||||||||
Income tax expense (benefit) | $ | 29 | $ | 53 | $ | (100 | ) | ||||||||||||||
Income tax expense | 180 | 3 | 29 | ||||||||||||||||||
During 2009, the Company recognized $503 million of income, before $5 million of related costs, from alternative fuel tax credits with no related tax expense, resulting in a benefit of $176 million and an additional liability for uncertain income tax positions of $162 million, with both items impacting the U.S. effective tax rate. If the Company’s income tax positions with respect to the alternative fuel mixture tax credits are sustained, either all or in part, the Company would recognize a tax benefit in the future equal to the amount of the benefits sustained. Additionally, the Canadian effective tax rate is impacted by the additional valuation allowance recorded against new Canadian deferred tax assets in the amount of $29 million.
During 2008, the Company recorded a goodwill impairment charge of $321 million with no tax benefit and both the Canadian and U.S. effective tax rates were impacted as a result. The Canadian effective tax rate was also impacted by the valuation allowance taken on net Canadian deferred tax assets in the amount of $52 million.
Deferred tax assets and liabilities are based on tax rates that are expected to be in effect in future periods when deferred items reverse. Changes in tax rates or tax laws affect the expected future benefit or expense. The
125
NOTES TO CONSOLIDATED FINANCIAL STATEMENTS
DECEMBER 31, 2009
(IN MILLIONS OF DOLLARS, UNLESS OTHERWISE NOTED)
effect of such changes that occurred during each of the last three fiscal years is included in “Tax rate changes” disclosed under the effective income tax rate reconciliation shown above. During the first quarter of 2007, the income tax expense included an out-of-period adjustment which decreased expense by approximately $6 million. This out-of-period adjustment is the result of an omission to account for a change in Canadian federal tax rate which occurred in the second quarter of 2006. In addition, duringin 2007 Domtar Corporation recognized an additional deferred tax benefit of $5 million resulting from a change in the federal rate in Canada, $3 million in South Carolina and $1 million in Texas. During 2006, Domtar Corporation recognized a deferred tax benefit of $3 million resulting from a change in the Texas state tax rate. During 2005, Domtar Corporation recognized deferred tax benefits of $3 million and $1 million resulting from a change in the Ohio state income tax law and a reduction in the British Columbia provincial corporate income tax rate, respectively. The benefits were due to the effect of the lower tax rates on accumulated temporary differences.
105
NOTES TO CONSOLIDATED FINANCIAL STATEMENTS
DECEMBER 30, 2007
(IN MILLIONS OF US DOLLARS, UNLESS OTHERWISE NOTED)
DEFERRED TAX ASSETS AND LIABILITIES
The tax effects of significant temporary differences representing deferred tax assets and liabilities at December 30, 200731, 2009 and December 31, 20062008 are comprised of the following:
| December 31, 2009 | December 31, 2008 | |||||||||||||
| December 30, 2007 | December 31, 2006 | $ | $ | |||||||||||
Accounting provisions | $ | 90 | $ | 28 | 93 | 82 | ||||||||
Asset impairments | — | 144 | ||||||||||||
Net operating loss carryforwards and other deductions | 306 | 121 | 223 | 298 | ||||||||||
Pension and other employee future benefit plans | 90 | — | 64 | 52 | ||||||||||
Inventory | 34 | 10 | 3 | 9 | ||||||||||
Other | 23 | 2 | 2 | 10 | ||||||||||
Gross deferred tax assets | 543 | 305 | 385 | 451 | ||||||||||
Valuation allowance | (72 | ) | (109 | ) | (164 | ) | (111 | ) | ||||||
Net deferred tax assets | 471 | 196 | 221 | 340 | ||||||||||
Property, plant and equipment | (1,157 | ) | (928 | ) | (824 | ) | (960 | ) | ||||||
Pension and other employee future benefit plans | — | (4 | ) | |||||||||||
Impact of foreign exchange on long-term debt and investments | (71 | ) | — | (27 | ) | (29 | ) | |||||||
Other | (37 | ) | — | |||||||||||
Total deferred tax liabilities | (1,265 | ) | (932 | ) | (851 | ) | (989 | ) | ||||||
Total net deferred taxes | $ | (794 | ) | $ | (736 | ) | ||||||||
Included in: | ||||||||||||||
Deferred income tax assets | 137 | 116 | ||||||||||||
Other assets (Note 16) | 32 | 22 | ||||||||||||
Income and other taxes payable | (6 | ) | (8 | ) | ||||||||||
Deferred income taxes and other | (793 | ) | (779 | ) | ||||||||||
Net deferred tax liabilities | (630 | ) | (649 | ) | ||||||||||
As a result of the Transaction, the Company has inherited federal net operating loss carry forwards and scientific research and experimental development expenditures not previously deducted of approximately of $1,147 million ($603 million in Canada and $544 million in the U.S). The March 7, 2007 transaction is considered to be an acquisition of control of Domtar Inc. for Canadian tax purposes and consequently part of the Canadian loss carry forwards amount has been utilized to increase the adjusted cost base of capital property with unrealized gains under paragraph 111(4)(e) of the Canadian Income Tax Act as well as increase the tax basis of depreciable property. At March 7, 2007, after the reallocation of losses and other adjustments, the Company hashad inherited federal net operating loss carry forwardscarryforwards and scientific research and experimental development expenditures not previously deducted of approximately $773 million ($213 million in Canada and $560 million in the U.S)U.S.).
At December 30, 2007,31, 2009, Domtar Corporation had U.S. federal net operating loss carryforwards of $465$227 million thatwhich expire between 20172023 and 20212026. The U.S. federal net operating losses are subject to annual limitations under Section 382 and separate return limitation year provisions (“SRLY”) of the Internal Revenue Code of 1986, as amended (the “Code”), that can vary from year to year. Canadian federal losses and scientific research and experimental development expenditures not previously deducted in therepresent an amount of $260 million. Canadian$315 million (CDN$330 million), out of which losses in the amount of $118$108 million (CDN$113 million) will begin to expire in 2025. The U.S. federal net operating losses are subject to annual limitations, including Section 382 of the Internal Revenue Code of 1986, as amended (the “Code”), for U.S.2027. However, a full valuation allowance has been applied against these Canadian deferred tax purposes.assets.
126
NOTES TO CONSOLIDATED FINANCIAL STATEMENTS
DECEMBER 31, 2009
(IN MILLIONS OF DOLLARS, UNLESS OTHERWISE NOTED)
In assessing the realizability of deferred tax assets, management considers whether it is more likely than not that some portion or all of the deferred tax assets will not be realized. The ultimate realization of deferred tax assets is dependent upon the generation of future taxable income during periods in which temporary differences become deductible. Management considers the scheduled reversal of deferred tax liabilities, projected future taxable income, and tax planning strategies in making this assessment. Management believes that it is more likely
106
NOTES TO CONSOLIDATED FINANCIAL STATEMENTS
DECEMBER 30, 2007
(IN MILLIONS OF US DOLLARS, UNLESS OTHERWISE NOTED)
than not that the results of future operations will generate sufficient taxable income to realize the net deferred tax assets in the U.S., notwithstanding thethat they are subject to annual limitation oflimitations under Section 382 and SRLY provisions of the Internal Revenue Code. However, the
The Company has established a valuation allowance against net deferred tax assets of the Canadian subsidiaries resulting in a valuation allowance of $164 million as of December 31, 2009. Domtar Inc.’sCorporation’s Canadian subsidiaries incurred substantial book losses inherited atin 2007 and 2008 (including the timeimpairment and closure costs related to the Dryden facility). Forecasted results for the Canadian operations did not provide sufficient positive evidence to overcome the negative evidence related to the accumulated book losses. Consequently, in 2008 the Company recorded a charge in the amount of acquisition$52 million to establish a valuation allowance against all of control on March 7, 2007the remaining net Canadian deferred tax assets that arose during 2008 and all prior years. The valuation allowance primarily relates to net operating losses, scientific research and experimental development expenditures not previously deducted and tax depreciable assets for which utilization in the foreseeable future is uncertain. Consequently, any income tax benefit recorded on any future operating losses generated in these Canadian operations will most likely be offset by additional increases to the valuation allowance. This may have a negative impact on the Company’s overall effective income tax rate in future periods. The amount of tax benefit offset by an increase in the valuation allowance in 2009 was $29 million.
We doThe Company does not provide for a U.S. income tax liability on undistributed earnings of ourthe Canadian subsidiaries. The earnings of the Canadian subsidiaries, which reflect full provision for Canadian income taxes, are currently indefinitely reinvested in Canadian operations or will be remitted substantially free of additionaloperations. Temporary differences related to the investment in the Canadian subsidiaries do not result in any unrecognized deferred tax to Domtar Corporation.liability.
127
NOTES TO CONSOLIDATED FINANCIAL STATEMENTS
DECEMBER 31, 2009
(IN MILLIONS OF DOLLARS, UNLESS OTHERWISE NOTED)
ACCOUNTING FOR UNCERTAINTY IN INCOME TAXES
OnIn January 1, 2007, the Company adopted the provisions of FIN 48, “Accounting for Uncertainty in Income Taxes.”Taxes Topic of FASB ASC. The adoption of FIN 48the standard had no impact on the consolidated financial statements of the Company. At December 30, 2007,31, 2009, the Company had gross unrecognized tax benefits of approximately $40 million.$226 million (2008—$45 million; 2007—$40 million). If recognized in 2008, $32 million of2010, these tax benefits would impact goodwill and $5 million wouldfavorably impact the effective tax rate. Ifrate, except for the amounts related to the Canadian subsidiaries for which a valuation allowance is recorded against the deferred tax assets. These amounts represent the gross amount of exposure in individual jurisdictions and do not reflect any additional benefits expected to be realized if such positions were sustained, such as a federal deduction that could be realized if an unrecognized state deduction was not sustained.
| December 31, 2009 | December 31, 2008 | December 30, 2007 | ||||||
| $ | $ | $ | ||||||
Balance at beginning of year | 45 | 40 | — | |||||
Domtar Inc March 7, 2007 opening balance (Note 3) | — | — | 35 | |||||
Additions based on tax positions related to current year | 179 | 7 | — | |||||
Additions for tax positions of prior years | — | 6 | 4 | |||||
Reductions for tax positions of prior years | — | (6 | ) | — | ||||
Interest | — | 1 | — | |||||
Foreign exchange impact | 2 | (3 | ) | 2 | ||||
Federal rate changes | — | — | (1 | ) | ||||
Balance at end of year | 226 | 45 | 40 | |||||
The Company recognized after 2008, theseless than $0.2 million interest accrual associated with unrecognized tax benefits would impactfor the effective tax rate.
| December 30, 2007 | ||||
Balance at beginning of year | $ | — | ||
Domtar Inc. March 7, 2007 opening balances (Note 3) | 35 | |||
Additions based on tax positions related to current year | 4 | |||
Foreign exchange impact | 2 | |||
Federal rate changes | (1 | ) | ||
Balance at end of year | $ | 40 | ||
period ending December 31, 2009 (2008—$1 million; 2007—nil). The Company accruesrecognizes accrued interest onand penalties, if any, related to unrecognized tax benefits as a component of interest expense. Penalties, if incurred, would be recognized as a component of income tax expense. The Company had no accrual for interest and penalties associated with unrecognized tax benefits at December 30, 2007.
In 2008, theThe Company and its subsidiaries will file three separateone consolidated U.S. federal income tax returnsreturn for 20072009 as well as returns in various states, Canada, and in Canada.Hong Kong. At December 30, 2007,31, 2009, the Company’s subsidiaries may beare subject to U.S. and Canadian federal income tax examinations for the tax years 20022006 through 2006,2008, with federal years prior to 20032006 being closed from a cash tax liability standpoint in the U.S. In addition,, but the Company’s subsidiaries are undergoing tax auditsloss carryforwards can be adjusted in various state and foreign jurisdictions forany open year where the years 2000 to 2006.loss has been utilized. The Company does not anticipate that adjustments stemming from these audits would result in a significant change to the results of its operations and financial condition. During December 2007, the Company has received a draft statement of adjustments related to the income tax examination by the Canada Revenue Agency of its Canadian subsidiary Domtar Inc. for 2003, 2004 and 2005. The draft statement of adjustments is not expected to have a significant impact to the results of the operations and financial condition.condition or cash flows. The Company does not expect a significant change to the amount of unrecognized tax benefits over the next 12 months. However, audit outcomes and the timing of audit settlementsettlements are subject to significant uncertainty.
TAX SHARING AGREEMENT
In conjunction with the Transaction, the Company signed a Tax Sharing Agreement that governs both Weyerhaeuser and the Company’s rights and obligations after the Transaction with respect to taxes for both pre
107
NOTES TO CONSOLIDATED FINANCIAL STATEMENTS
DECEMBER 30, 2007
(IN MILLIONS OF US DOLLARS, UNLESS OTHERWISE NOTED)
and post-Distribution periods in regards to ordinary course taxes, and also covers related administrative matters. The Distribution refers to the distribution of shares of the Company to Weyerhaeuser shareholders. The Company will generally be required to indemnify Weyerhaeuser and Weyerhaeuser shareholders against any tax resulting from the Distribution if that tax results from an act or omission to act by the Company after the Distribution. If Weyerhaeuser, however, should recognize a gain on the Distribution for reasons not related to an act or omission to act by the Company after the Distribution, Weyerhaeuser would be responsible for such taxes and would not be entitled to indemnification by the Company under the Tax Sharing Agreement. In addition, to preserve the tax-free treatment of the Distribution to Weyerhaeuser, the following actions will be subject to restrictions for a two-year period following the date of the Distribution:
the redemption, recapitalization, repurchase or acquisition by the Company of the capital stock;128
NOTES TO CONSOLIDATED FINANCIAL STATEMENTS
DECEMBER 31, 2009
(IN MILLIONS OF DOLLARS, UNLESS OTHERWISE NOTED)
the issuance by the Company of capital stock or convertible debt;
the liquidation of the Company;
the discontinuance of the operations of the Weyerhaeuser Fine Paper Business;
the sale or disposition (other than in the ordinary course of business) of all or a substantial part of the Weyerhaeuser Fine Paper Business; or
other actions, omissions to act or transactions that could jeopardize the tax-free status of the Distribution.
NOTE 10.11.
The following table presents the components of receivables:
| December 31, 2009 | December 31, 2008 | |||||||||||||
| December 30, 2007 | December 31, 2006 | $ | $ | |||||||||||
Trade receivables | $ | 315 | $ | 325 | — | 340 | ||||||||
Notes receivables | — | 1 | ||||||||||||
Subordinate interest in securitized receivables | 130 | — | 520 | 101 | ||||||||||
Allowance for doubtful accounts | (9 | ) | (2 | ) | (8 | ) | (11 | ) | ||||||
Sales taxes receivable | 39 | — | ||||||||||||
Other receivables | 67 | 16 | 24 | 47 | ||||||||||
Receivables | $ | 542 | $ | 340 | 536 | 477 | ||||||||
RECEIVABLES SECURITIZATION
The Company uses securitization of thecertain receivables as a source of financing by reducing its working capital requirements. The Company’s securitization program consists of the sale of U.S. and Canadian dollar receivables or the sale ofto a bankruptcy remote entity which, in turn, transfers a senior beneficial interest in them to a special purpose trustentity managed by a financial institution for multiple sellers of receivables. The agreement governing the Company’s receivables securitization program normally allows the
108
NOTES TO CONSOLIDATED FINANCIAL STATEMENTS
DECEMBER 30, 2007
(IN MILLIONS OF US DOLLARS, UNLESS OTHERWISE NOTED)
daily sale of new receivables to replace those that have been collected. The agreement also limits the cash that can be received from the saletransfer of the senior beneficial interest. The subordinated interest retained by the Company is included in “Receivables”Receivables on the Consolidated balance sheetBalance Sheets and will be collected only after the senior beneficial interest has been settled. The book value of the retained subordinated interest approximates fair value.
The Company retains responsibility for servicing the receivables sold but does not record a servicing asset or liability as the fees received by the Company for this service approximate the fair value of the services rendered.
In 2007, a net charge of $5 million (2006 – nil; 2005 – nil) resulted fromJune 2009, the programs described below and was includedCompany amended the agreement governing its receivables securitization program to include additional receivable pools. The amended agreement expires in “Financing expenses.”
The Company has a three-year agreement maturing in 2011, including both U.S. and Canadian receivables.October 2010. The maximum cash consideration that can be received from the sale of receivables under this combinedthe amended agreement is $150 million. The accounting treatment with respect to the transfers of such receivables pursuant to the Transfers and Servicing Topic of FASB ASC has remained unchanged under the amended agreement through December 31, 2009.
Gains or losses on securitization of receivables are calculated as the difference between the carrying amount of the receivables sold and the sum of the cash proceeds upon sale and the fair value of the retained subordinated interest in such receivables on the date of the transfer. Fair value is determined on a discounted cash flow basis.
In 2009, a net charge of $2 million (2008—$5 million; 2007—$5 million) resulted from the programs described above and was included in Interest expense in the Consolidated Statements of Earnings (Loss).
129
NOTES TO CONSOLIDATED FINANCIAL STATEMENTS
DECEMBER 31, 2009
(IN MILLIONS OF DOLLARS, UNLESS OTHERWISE NOTED)
The following balances were outstanding under this program:
| December 31, 2009 | December 31, 2008 | |||||||||
| December 30, 2007 | $ | $ | ||||||||
Securitized receivables | $ | 260 | 540 | 211 | ||||||
Senior beneficial interest held by third parties | (130 | ) | (20 | ) | (110 | ) | ||||
Subordinate interest in securitized receivables retained by Domtar | $ | 130 | 520 | 101 | ||||||
In 2007,2009, the net cash inflowoutflow from the salereduction of senior beneficial interests in the U.S. and Canadian receivables was nil.$90 million (2008—$20 million).
NOTE 11.12.
The following table presents the components of inventories:
| December 30, 2007 | December 31, 2006 | |||||
Work in process and finished goods | $ | 586 | $ | 335 | ||
Raw materials | 136 | 15 | ||||
Operating and maintenance supplies | 214 | 170 | ||||
| $ | 936 | $ | 520 | |||
109
NOTES TO CONSOLIDATED FINANCIAL STATEMENTS
DECEMBER 30, 2007
(IN MILLIONS OF US DOLLARS, UNLESS OTHERWISE NOTED)
| December 31, 2009 | December 31, 2008 | |||
| $ | $ | |||
Work in process and finished goods | 430 | 584 | ||
Raw materials | 114 | 170 | ||
Operating and maintenance supplies | 201 | 209 | ||
| 745 | 963 | |||
NOTE 12.13.
The carrying value of goodwill and changes in the carrying value are as follows:
| December 30, 2007 | December 31, 2006 | |||||||
Balance at beginning of year | $ | 14 | $ | 763 | ||||
Impairment of goodwill | (4 | ) | (749 | ) | ||||
Acquisition of Domtar Inc. (NOTE 3) | 300 | — | ||||||
Impact of foreign exchange | 62 | — | ||||||
Balance at end of year | $ | 372 | $ | 14 | ||||
The goodwill at December 30, 2007 is all related to the Paper segment. (December 31, 2006—$10 million related to Papers and $4 million related to Wood).
The goodwill resulting from the acquisition of Domtar Inc. as well as the goodwill impairment were not deductible for income tax purposes and represent a permanent book-tax difference. As a result, no tax benefit has been recognized for the goodwill and goodwill impairment charge.
Domtar performed its annual impairment test of goodwill during the fourth quarter, in accordance with SFAS 142 “Goodwill and Other Intangible Assets.” As a result, the Company determined that the Wood segment goodwill was impaired, necessitating an impairment charge of $4 million. The impairment was largely due to the deterioration of economic conditions in the Wood segment.
In April 2006, Weyerhaeuser announced that it was considering alternatives for some of its business units that ranged from continuing to hold and operate the assets to a possible sale or other disposition. In connection with the announcement, Weyerhaeuser received information that indicated that the carrying value of certain business units exceeded the fair value. Based on an evaluation of the assets and liabilities of the Company, it was concluded that the implied value of the Company’s goodwill relating to the paper segment, was $10 million. As a result of the above, a charge of $749 million was recorded in the first quarter of 2006.
| December 31, 2009 | December 31, 2008 | ||||
| $ | $ | ||||
Balance at beginning of year | — | 372 | |||
Impairment of goodwill (Note 4) | — | (321 | ) | ||
Other | — | 9 | |||
Impact of foreign exchange | — | (60 | ) | ||
Balance at end of year | — | — | |||
110130
NOTES TO CONSOLIDATED FINANCIAL STATEMENTS
DECEMBER 30, 200731, 2009
(IN MILLIONS OF US DOLLARS, UNLESS OTHERWISE NOTED)
NOTE 13.
PROPERTY, PLANT AND EQUIPMENT
The following table presents the components of property, plant and equipment:
| Range of useful lives | December 30, 2007 | December 31, 2006 | ||||||||
Machinery and equipment | 3-20 | $ | 7,897 | $ | 5,718 | |||||
Buildings and improvements | 10-40 | 1,318 | 831 | |||||||
Timber limits and land | 334 | 33 | ||||||||
Assets under construction | 77 | 14 | ||||||||
Other | 3 | 59 | 100 | |||||||
| 9,685 | 6,696 | |||||||||
Less allowance for depreciation and amortization | (4,323 | ) | (3,631 | ) | ||||||
| $ | 5,362 | $ | 3,065 | |||||||
At December 30, 2007, a net carrying amount of $6 million (2006—nil) included in Buildings is held under capital leases ($8 million for cost (2006—nil) and $2 million for accumulated amortization (2006—nil)), a net carrying amount of $27 million (2006—$37 million) included in Machinery and equipment ($60 million for cost (2006—$67 million) and $33 million for accumulated amortization (2006—$30 million)) and a carrying amount of $4 million (2006—nil) included in Land is held under capital leases.
Subsequent to the decision to shut down one paper machine at its Dryden mill and the write-off of $92 million related to this paper machine, Domtar conducted a Step I impairment test on the remaining Dryden mill fixed assets during the fourth quarter of 2007. Estimates of undiscounted future cash flows used to test the recoverability of a long-lived asset included key assumptions related to trend prices, the 15-year forecasted exchange rate for the U.S. dollar and the estimated useful life of the long-lived assets. The trend prices were based on an analysis of external price trends, including published industry guidance. The forecasted Canadian-U.S. foreign exchange rate assumptions were based on independent market information, as well as analysis of historical data, trends and cycles. Domtar concluded that the recognition of an impairment loss for the Dryden mill was not required.
111
NOTES TO CONSOLIDATED FINANCIAL STATEMENTS
DECEMBER 30, 2007
(IN MILLIONS OF US DOLLARS, UNLESS OTHERWISE NOTED)
NOTE 14.
The following table presents the components of property, plant and equipment:
| Range of useful lives | December 31, 2009 | December 31, 2008 | ||||||
| $ | $ | |||||||
Machinery and equipment | 3-20 | 8,048 | 7,519 | |||||
Buildings and improvements | 10-40 | 1,168 | 1,091 | |||||
Timber limits and land | 286 | 260 | ||||||
Assets under construction | 73 | 93 | ||||||
| 9,575 | 8,963 | |||||||
Less: Allowance for depreciation and amortization | (5,446 | ) | (4,662 | ) | ||||
| 4,129 | 4,301 | |||||||
NOTE 15.
The following table presents the components of intangible assets:
| Weighted average useful lives | December 31, 2009 | December 31, 2008 | ||||||||||||
| $ | $ | |||||||||||||
| Weighted average useful lives | December 30, 2007 | |||||||||||||
Intangible assets subject to amortization | ||||||||||||||
Water rights | 40 | $ | 15 | 40 | 15 | 14 | ||||||||
Power purchase agreements | 25 | 33 | 25 | 31 | 27 | |||||||||
Customer relationships | 20 | 9 | 20 | 11 | 9 | |||||||||
Trade names | 7 | 7 | 7 | 7 | 6 | |||||||||
Supplier agreements | 5 | 6 | ||||||||||||
Supplier agreement | 5 | 6 | 5 | |||||||||||
Natural gas contracts | 4 | 17 | 4 | — | 14 | |||||||||
Cutting rights | Units of production method | 29 | ||||||||||||
Cutting rights (Note 4) | Units of production method | 23 | 19 | |||||||||||
| 116 | 93 | 94 | ||||||||||||
Allowance for amortization | (5 | ) | (8 | ) | (13 | ) | ||||||||
Total intangible assets | $ | 111 | 85 | 81 | ||||||||||
The aggregate amortizationAmortization expense related to intangible assets for the year ended December 30, 2007 amounted to $5 million.31, 2009 was $8 million (2008—$10 million; 2007—$5 million).
131
NOTES TO CONSOLIDATED FINANCIAL STATEMENTS
DECEMBER 31, 2009
(IN MILLIONS OF DOLLARS, UNLESS OTHERWISE NOTED)
Amortization expense for the next five years related to intangible assets is expected to be as follows:
| 2008 | 2009 | 2010 | 2011 | 2012 | |||||||||||
Amortization expense related to intangible assets | $ | 8 | $ | 8 | $ | 9 | $ | 9 | $ | 5 | |||||
| 2010 | 2011 | 2012 | 2013 | 2014 | ||||||
| $ | $ | $ | $ | $ | ||||||
Amortization expense related to intangible assets | 4 | 4 | 4 | 3 | 3 | |||||
NOTE 15.16.
The following table presents the components of other assets:
| December 30, 2007 | December 31, 2006 | December 31, 2009 | December 31, 2008 | |||||||
Pension asset—defined benefit pension plans (Note 6) | $ | 38 | $ | 16 | ||||||
| $ | $ | |||||||||
Pension asset—defined benefit pension plans (Note 7) | 32 | 17 | ||||||||
Unamortized debt issue costs | 23 | — | 19 | 19 | ||||||
Deferred income tax assets | 27 | — | ||||||||
Deferred income tax assets (Note 10) | 32 | 22 | ||||||||
Investments and advances | 15 | — | 14 | 8 | ||||||
Other | 2 | 14 | 6 | 1 | ||||||
| $ | 105 | $ | 30 | 103 | 67 | |||||
NOTE 17.
CLOSURE AND RESTRUCTURING LIABILITY
The Company regularly reviews its overall production capacity with the objective of adjusting its production capacity with anticipated long-term demand.
On December 21, 2009, the Company decided to dismantle the Prince Albert facility. The Company will continue to remove machinery and equipment from the site and will take steps to engage the services of demolition contractors and file for a demolition permit. The Prince Albert pulp and paper mill was closed in the first quarter of 2006 and has not been operated since. The dismantling of the paper machine and converting equipment was completed in 2008 and the dismantling of the remaining assets is expected to start in 2010. The Company recorded a $14 million impairment charge for the related machinery and equipment in 2009.
On October 20, 2009, the Company announced that it would convert its Plymouth mill to 100% fluff pulp production. This conversion will require an approximately $74 million investment. Domtar’s annual fluff pulp making capacity will increase almost threefold to 444,000 metric tons. The mill reconfiguration, which is expected to be completed in the fourth quarter of 2010, will also result in the permanent shut down of Plymouth’s remaining paper machine with an annual paper production capacity of 199,000 tons. The mill reconfiguration will help preserve approximately 360 positions. The aggregate pre-tax earnings charge in connection with this
112132
NOTES TO CONSOLIDATED FINANCIAL STATEMENTS
DECEMBER 30, 200731, 2009
(IN MILLIONS OF US DOLLARS, UNLESS OTHERWISE NOTED)
NOTE 16.conversion is $26 million which includes $13 million in non-cash charges relating to accelerated depreciation of the carrying amounts of the manufacturing equipment as well as $3 million in write-down of related spare parts, and $10 million in severance and employee benefits. The Company expects to record $39 million of accelerated depreciation in 2010.
On February 5, 2009, the Company announced a permanent shut down of a paper machine in its Plymouth pulp and paper mill effective at the end of February 2009. This measure resulted in the permanent curtailment of 293,000 tons of paper production capacity and the shut down affected approximately 185 employees and a $35 million accelerated depreciation charge was recorded in the first quarter of 2009 for the related write-down on plant and equipment. Given the closure of the paper machine, the Company conducted a Step I impairment test on the remaining Plymouth mill operation’s fixed assets and concluded that the undiscounted estimated future cash flows associated with the long-lived assets exceeded their carrying value and, as such, no additional impairment charge was required.
On December 18, 2008, Domtar Corporation announced the permanent closure of its Lebel-sur-Quévillon pulp mill and sawmill. Operations at the pulp mill had been indefinitely idled in November 2005 due to unfavorable economic conditions and the sawmill had been indefinitely idled since 2006. At the time, the pulp mill and sawmill employed 425 and 140 employees, respectively. The Lebel-sur-Quévillon pulp mill had an annual production capacity of 300,000 metric tons.
CLOSURE AND RESTRUCTURING COSTSOn November 4, 2008, Domtar Corporation announced that it would permanently shut down the paper machine and converting operations of its Dryden mill. These measures resulted in the permanent curtailment of Domtar’s annual paper production capacity by approximately 151,000 tons and affected approximately 195 employees.
On December 13, 2007, Domtar Corporation announced that it willwould close its Port Edwards Wisconsin mill as well as reorganize production at its Dryden Ontario facility. These measures will resultresulted in a permanent curtailment of Domtar’s annual paper production capacity by approximately 336,000 tons. Approximately 625 employees at these facilities will bewere affected by these decisions.
On July 31, 2007, Domtar Corporation announced that it willwould permanently close two paper machines, one at the Woodland Maine pulp and paper mill and another at the Port Edwards Wisconsin pulp and paper mill as well as the Gatineau Quebec paper mill and the converting center in Ottawa, Ontario.Ottawa. In total, these closures will resultresulted in the permanent curtailment of approximately 284,000 tons of paper capacity per year and will affectaffected approximately 430 employees.
Closure and restructuring costs, including impairment of property, plant and equipment | Year ended December 30, 2007 | Year ended December 31, 2006 | Year ended December 25, 2005 | |||||||
Impairment of property, plant and equipment | $ | 92 | $ | — | $ | 499 | ||||
Termination benefits | 5 | — | 43 | |||||||
Inventory obsolescence | 6 | |||||||||
Loss (gain) on curtailment of pension benefits | — | 2 | (8 | ) | ||||||
Restructuring costs | — | — | 3 | |||||||
Other closure costs | 3 | 13 | — | |||||||
Total closure and restructuring costs, including impairment of property, plant and equipment | $ | 106 | $ | 15 | $ | 537 | ||||
At December 30, 2007, $78 millionThe following tables provide the components of the paper segment closure and restructuring cost liability, identified below, relates to operations and activities of Domtar Inc., which was acquiredcosts by Domtar Corporation on March 7, 2007, and was part of a plan that had begun to be assessed and formulated by management at that date. As a result, these costs represent assumed liabilities and costs incurred as of the acquisition date and were treated as part of the purchase price allocation in accordance with EITF 95-3, Recognition of Liabilities in Connection with a Purchase Business Combination. These closures also impacted the fair value of certain property, plant and equipment as part of the Domtar Inc. purchase price allocation as described in Note 3.segment:
| December 30, 2007 | ||||
Balance at beginning of year | $ | 2 | ||
Additions | 80 | |||
Severance payments | (25 | ) | ||
Reversal of provision | (2 | ) | ||
Acquisition of Domtar Inc. (Note 3) | 23 | |||
Effect of foreign currency exchange rate change | 5 | |||
Balance at end of year | $ | 83 | ||
| Year ended December 31, 2009 | ||||||||
| Papers | Paper Merchants | Wood | Total | |||||
| $ | $ | $ | $ | |||||
Severance and termination costs | 20 | 2 | 3 | 25 | ||||
Inventory obsolescence(1) | 15 | — | — | 15 | ||||
Loss on curtailment of pension benefits | 4 | — | 4 | 8 | ||||
Environmental provision | 4 | — | — | 4 | ||||
Other | 9 | — | 2 | 11 | ||||
Closure and restructuring costs | 52 | 2 | 9 | 63 | ||||
113133
NOTES TO CONSOLIDATED FINANCIAL STATEMENTS
DECEMBER 30, 200731, 2009
(IN MILLIONS OF US DOLLARS, UNLESS OTHERWISE NOTED)
| Year ended December 31, 2008 | ||||||||
| Papers | Paper Merchants | Wood | Total | |||||
| $ | $ | $ | $ | |||||
Severance and termination costs | 19 | — | 4 | 23 | ||||
Dismantling expense | 10 | — | — | 10 | ||||
Inventory obsolescence(1) | 1 | — | — | 1 | ||||
Loss on curtailment of pension benefits | 8 | — | — | 8 | ||||
Other | — | — | 1 | 1 | ||||
Closure and restructuring costs | 38 | — | 5 | 43 | ||||
| Year ended December 30, 2007 | ||||||||
| Papers | Paper Merchants | Wood | Total | |||||
| $ | $ | $ | $ | |||||
Severance and termination costs | 5 | — | — | 5 | ||||
Inventory obsolescence(1) | 6 | — | — | 6 | ||||
Other | 2 | — | 1 | 3 | ||||
Closure and restructuring costs | 13 | — | 1 | 14 | ||||
| (1) | Inventory obsolescence primarily relates to the write down of operating and maintenance supplies classified as inventories on the Consolidated Balance Sheets. |
The following table provides the activity in the closure and restructuring liability:
| December 31, 2009 | December 31, 2008 | |||||
| $ | $ | |||||
Balance at beginning of year | 47 | 83 | ||||
Additions | 29 | 24 | ||||
Severance payments | (32 | ) | (29 | ) | ||
Change in estimates (a) | (8 | ) | (24 | ) | ||
Other | — | (4 | ) | |||
Effect of foreign currency exchange rate change | 5 | (3 | ) | |||
Balance at end of year | 41 | 47 | ||||
| (a) | Includes $23 million of a provision reversal for a contract assumed in the Transaction as a result of its termination by the counterparty in the first quarter of 2008. |
Other costs related to the above 2009 closures expected to be incurred over 2008 and 20092010 include $7approximately $3 million for demolition, $1 million for training relocation, outplacement and security costs.$1 million for security. These costs will be expensed as incurred and are all included inrelated to the paperPapers segment.
Closure and restructuring costs are based on management’s best estimates at December 30, 2007.31, 2009. Although the Company does not anticipate significant changes, the actual costs may differ from these estimates due to subsequent developments such as the results of environmental studies, the ability to find a buyer for assets set to be dismantled and demolished and other business developments. As such, additional costs and further write-downs may be required in future periods.
In 2006, the Company recognized restructuring costs, which included Fine Paper facilities and restructuring activities at the Dryden, Ontario and Prince Albert, Saskatchewan facilities.
In 2005, the Company recognized closure costs and impairment charges related to the closure of a pulp and paper facility and a fine paper machine. Additionally, the Company recognized impairment charges for Big River and Wapawekka, Saskatchewan, sawmills as they sold chips and hog fuel to the closed pulp and paper facility and did not have an alternate market for such residuals.
NOTE 17.
TRADE AND OTHER PAYABLES
The following table presents the components of trade and other payables:
| December 30, 2007 | December 31, 2006 | |||||
Trade payables | $ | 460 | $ | 118 | ||
Payroll-related accruals | 172 | 74 | ||||
Accrued interest | 14 | — | ||||
Payables on capital projects | 11 | — | ||||
Pension liability—defined benefit pension plans (Note 6) | 3 | — | ||||
Liability—other post-retirement benefit plans (Note 6) | 5 | — | ||||
Provision for environment and other asset retirement obligations (Note 21) | 21 | — | ||||
Closure and restructuring costs liability (Note 16) | 50 | 2 | ||||
Other | 29 | 56 | ||||
| $ | 765 | $ | 250 | |||
114134
NOTES TO CONSOLIDATED FINANCIAL STATEMENTS
DECEMBER 30, 200731, 2009
(IN MILLIONS OF US DOLLARS, UNLESS OTHERWISE NOTED)
NOTE 18.
LONG-TERM DEBTCONSOLIDATED STATEMENTS OF COMPREHENSIVE INCOME (LOSS)
| Maturity | Nominal Amount | Currency | December 30, 2007 | December 31, 2006 | |||||||||
Unsecured debentures and notes | |||||||||||||
10% Debentures | 2011 | $ | 2 | CDN | $ | 2 | $ | — | |||||
7.875% Notes | 2011 | 600 | US | 630 | — | ||||||||
5.375% Notes | 2013 | 350 | US | 323 | — | ||||||||
7.125% Notes | 2015 | 400 | US | 398 | — | ||||||||
9.5% Notes | 2016 | 125 | US | 138 | — | ||||||||
10.85% Debentures | 2017 | 1 | CDN | 1 | — | ||||||||
Secured term loan facility | 2014 | US | 643 | — | |||||||||
Secured revolving credit facility | 2012 | US | 50 | — | |||||||||
Capital lease obligations | 2007 - 2028 | 39 | 39 | ||||||||||
Other | 6 | 5 | |||||||||||
| 2,230 | 44 | ||||||||||||
Less: Due within one year | 17 | 12 | |||||||||||
| $ | 2,213 | $ | 32 | ||||||||||
COMPREHENSIVE INCOME (LOSS) | Year ended December 31, 2009 | Year ended December 31, 2008 | Year ended December 30, 2007 | ||||||
| $ | $ | $ | |||||||
Net earnings (loss) | 310 | (573 | ) | 70 | |||||
Other comprehensive income (loss) | |||||||||
Net derivative gains (losses) on cash flow hedges: | |||||||||
Net gain (loss) arising during the period, net of tax of $2 (2008—$3) | 51 | (77 | ) | — | |||||
Less: Reclassification adjustment for losses included in net earnings (loss), net of tax of $1 (2008—nil) | 18 | 25 | — | ||||||
Foreign currency translation adjustments | 206 | (392 | ) | 250 | |||||
Change in unrecognized losses and prior service cost related to pension and post retirement benefit plans, net of tax of $6 (2008—$26) | (74 | ) | (53 | ) | (39 | ) | |||
Amortization of prior service costs | — | 1 | — | ||||||
Comprehensive income (loss) | 511 | (1,069 | ) | 281 | |||||
NOTE 19.
The following table presents the components of trade and other payables:
| December 31, 2009 | December 31, 2008 | |||
| $ | $ | |||
Trade payables | 395 | 350 | ||
Payroll-related accruals | 168 | 125 | ||
Accrued interest | 24 | 28 | ||
Payables on capital projects | 5 | 5 | ||
Rebates accruals | 17 | 17 | ||
Liability—other post-retirement benefit plans (Note 7) | 4 | 7 | ||
Provision for environment and other asset retirement obligations (Note 23) | 15 | 22 | ||
Closure and restructuring costs liability (Note 17) | 26 | 35 | ||
Derivative financial instrument | 12 | 57 | ||
Other | 20 | — | ||
| 686 | 646 | |||
135
NOTES TO CONSOLIDATED FINANCIAL STATEMENTS
DECEMBER 31, 2009
(IN MILLIONS OF DOLLARS, UNLESS OTHERWISE NOTED)
NOTE 20.
| Maturity | Notional Amount | Currency | December 31, 2009 | December 31, 2008 | ||||||
| $ | $ | $ | ||||||||
Unsecured and notes | ||||||||||
7.875% Notes | 2011 | 135 | US | 138 | 563 | |||||
5.375% Notes | 2013 | 312 | US | 293 | 323 | |||||
7.125% Notes | 2015 | 400 | US | 399 | 399 | |||||
9.5% Notes | 2016 | 125 | US | 137 | 139 | |||||
10.75% Notes | 2017 | 400 | US | 386 | — | |||||
Secured term loan facility | 2014 | US | 336 | 612 | ||||||
Secured revolving credit facility | 2012 | US | — | 60 | ||||||
Capital lease obligations | 2010 – 2028 | 23 | 28 | |||||||
Other | — | 4 | ||||||||
| 1,712 | 2,128 | |||||||||
Less: Due within one year | 11 | 18 | ||||||||
| 1,701 | 2,110 | |||||||||
Principal long-term debt repayments, including capital lease obligations, in each of the next five years amounted to:
| Long-term debt | Capital leases | Long-term debt | Capital leases | |||||||||
2008 | $ | 12 | $ | 8 | ||||||||
2009 | 10 | 7 | ||||||||||
| $ | $ | |||||||||||
2010 | 8 | 6 | 8 | 3 | ||||||||
2011 | 610 | 4 | 143 | 4 | ||||||||
2012 | 58 | 4 | 8 | 4 | ||||||||
2013 | 320 | 3 | ||||||||||
2014 | 304 | 3 | ||||||||||
Thereafter | 1,479 | 26 | 925 | 18 | ||||||||
| 2,177 | 55 | 1,708 | 35 | |||||||||
Less: Amounts representing interest | — | (16 | ) | — | (12 | ) | ||||||
Total payments, excluding the fair value increment of $14 million | $ | 2,177 | $ | 39 | ||||||||
Total payments, excluding fair value decrement of $5 million and debt discount of $14 million | 1,708 | 23 | ||||||||||
UNSECURED DEBENTURES AND NOTES
In November 2007, certainOn June 9, 2009, the Company issued $400 million 10.75% Notes due 2017 (“Notes”) at an issue price of Domtar Inc.’s bondholders elected to exchange their Domtar Inc. bonds for Domtar Corporation bonds with$385 million. The net proceeds from the same maturity and interest rate pursuant to an exchange offer. The amounts exchanged were 99.96%offering of the outstanding principal amountNotes were used to fund the portion of the purchase price of the 7.875% Notes due in 2011 99.55%tendered and accepted by the Company pursuant to a tender offer, including the payment of accrued interest and applicable early tender premiums, not funded with cash on hand. The Company recorded a gain of $15 million related to the fair value increment associated with the portion of the outstanding principal amount of 5.375%7.875% Notes 99.93% of the outstanding principal amount of 7.125% Notes, and 99.30% of the outstanding principal amount of 9.5% Notes.
CDN$80 million aggregate principal amount of the 10% Debentures, representing approximately 97.32% of the amount outstanding, and CDN$74 million aggregate principal amount of the 10.85% Debentures,
115136
NOTES TO CONSOLIDATED FINANCIAL STATEMENTS
DECEMBER 30, 200731, 2009
(IN MILLIONS OF US DOLLARS, UNLESS OTHERWISE NOTED)
representing approximately 99.33%repurchased, and recorded an expense of $4 million for the premium paid, and $1 million for other costs. Issuance expenses for the Notes of $8 million were deferred and are being amortized over the duration of the Notes.
The Notes are redeemable, in whole or in part, at the Company’s option at any time. In the event of a change in control, unless the Company has exercised the right to redeem all of the Notes, each holder will have the right to require the Company to repurchase all or any part of such holder’s Notes at a purchase price in cash equal to 101% of the principal amount outstanding, wereof the Notes plus any accrued and unpaid interest.
The Notes are general unsecured obligations and rank equally with existing and future unsecured and unsubordinated obligations. The Notes are fully and unconditionally guaranteed on an unsecured basis by direct and indirect, existing and future, U.S. 100% owned subsidiaries, which currently guarantee indebtedness under the Credit Agreement.
In December 2008, the Company repurchased by Domtar in December 2007a portion of the 7.875% Notes, which had a book value of $63 million, at a cash cost totalling CDN$194$51 million. A gain of $12 million pursuant to a tender offer to holders. This repurchase was not mandatory but atrecorded in the holders’ option.Consolidated Statements of Earnings (Loss).
BANK FACILITY
On March 7, 2007,The Company’s credit agreement consists of a $336 million senior secured tranche B term loan and a $750 million senior secured revolving credit facility. The revolving credit facility may be used by the Company, Domtar Paper Company, LLC and Domtar Inc. entered into a new credit agreement, which consisted of an $800 million senior secured tranche B term loan facilityfor general corporate purposes and a $750 million senior secured revolving credit facility.portion is available for letters of credit. Borrowings by the Company and Domtar Paper Company, LLC (the U.S. borrowers) under the senior revolving credit facility are made available in U.S. dollars, and borrowings by Domtar Inc. under the senior revolving credit facility will be madeare available in U.S. dollars and/or Canadian dollars and are limited to $150 million (or the Canadian dollar equivalent thereof). Upon
The tranche B term loan facility matures on March 7, 2014, and the closingrevolving credit facility matures on March 7, 2012. The tranche B term loan facility amortizes in nominal quarterly installments (equal to one percent of the Transactions,aggregate initial principal amount thereof per annum) with the balance due on the maturity date. In addition, under certain conditions and to the extent that the Company borrowed $800 million undergenerates cash flow in excess of cash flow used for operating and capital requirements and repayments of debt, excluding optional repayments of the Termterm loan, B facility and $60 million under the revolving loan facility. The borrowing proceeds from the new credit facility, combined with cash on hand that was advanced from Domtar Inc., served mainly to repay a temporary borrowing of $1.35 billion incurred by the Company as partis obligated to apply a portion of such calculated excess cash flow amount towards repayments of the Transaction.term loan, which amount would include any repayments of the term loan already made.
Amounts drawn under the tranche B term loan facility bear annual interest at either a eurodollarEurodollar rate plus a margin of 1.375%, or an alternate base rate plus a margin of 0.375%. Amounts drawn under the revolving credit facility bear annual interest at either a eurodollarEurodollar rate plus a margin of between 1.25% and 2.25%, or an alternate base rate plus a margin of between 0.25% and 1.25%. Amounts drawn under the revolving credit facility by Domtar Inc. in U.S. dollars bear annual interest at either a eurodollarEurodollar rate plus a margin of between 1.25% and 2.25%, or a U.S. base rate plus a margin of between 0.25% and 1.25%. Amounts drawn under the revolving credit facility by Domtar Inc. in Canadian dollars bear annual interest at the Canadian prime rate plus a margin of between 0.25% and 1.25%. Domtar Inc. may also issue bankers’ acceptances denominated in Canadian dollars which are subject to an acceptance fee, payable on the date of acceptance, which is calculated at a rate per annum equal to between 1.25% and 2.25%. The interest rate margins and the acceptance fee, in each case, with respect to the revolving credit facility are subject to adjustments based on the Company’s consolidated leverage ratio.
The tranche B term loan facility matures on March 7, 2014, and the revolving credit facility matures on March 7, 2012. The tranche B term loan facility amortizes in nominal quarterly installments (equal to one percent of the aggregate initial principal amount thereof per annum) with the balance due on the maturity date.
137
NOTES TO CONSOLIDATED FINANCIAL STATEMENTS
DECEMBER 31, 2009
(IN MILLIONS OF DOLLARS, UNLESS OTHERWISE NOTED)
At December 30, 2007,31, 2009, borrowings under the tranche B term loan facility had been reduced from the initial $800amounted to $336 million to $643 million.(2008—$612 million). There was $50$6 million of borrowingsoutstanding as overdraft recorded in Bank indebtedness under the revolving credit facility.facility (2008—$60 million outstanding and recorded in Long-term debt). In addition, at December 30, 2007, the Company had outstanding letters of credit pursuant to this bank credit agreement for an amount of $46 million.$53 million (2008—$43 million). The Company also has no other outstanding letters of credit for an amount of $2 million.(2008—$2 million).
The Credit Agreement contains a number of covenants that, among other things, limit the ability of the Company and its subsidiaries to make capital expenditures and place restrictions on other matters customarily restricted in senior secured credit facilities, including restrictions on indebtedness (including guarantee obligations), liens (including sale and leasebacks), fundamental changes, sales or disposition of property or assets, investments (including loans, advances, guarantees and acquisitions), transactions with affiliates, hedge agreements, dividends and other payments in respect of capital stock, changes in fiscal periods, environmental activity, optional payments and modifications of other material debt instruments, negative pledges and agreements restricting subsidiary distributions, changes in lines of business, and the proposed amendments to the transaction documents to the extent that any such amendment would be materially adverse to the interests of the
116
NOTES TO CONSOLIDATED FINANCIAL STATEMENTS
DECEMBER 30, 2007
(IN MILLIONS OF US DOLLARS, UNLESS OTHERWISE NOTED)
lenders.business. As long as the revolving credit commitments are outstanding, the Company is required to comply with a consolidated EBITDA (as defined)defined under the Credit Agreement) to consolidated cash interest coverage ratio of greater than 2.50x2.5x and a consolidated debt to consolidated EBITDA (as defined under the Credit Agreement) ratio of less than 4.75x, decreasing to 4.5x on December 31, 2008.4.5x. The Credit Agreement contains customary events of default, provided that non-compliance with the consolidated cash interest coverage ratio or consolidated leverage ratio will not constitute an event of default under the tranche B term loan facility unless it has not been waived by the revolving credit lenders within a period of 45 days after notice. At December 31, 2009, the Company was in compliance with these covenants.
The Company’s direct and indirect, existing and future, U.S. wholly-owned100% owned subsidiaries serve as guarantors of the senior secured credit facilities for any obligations thereunder of the U.S. borrowers, subject to agreed exceptions. Domtar Inc.’s direct and indirect, existing and future, wholly-owned100% owned subsidiaries, as well as the Company and its subsidiaries, serve as guarantors of Domtar Inc.’s obligations as a borrower under the senior secured credit facilities, subject to agreed exceptions. Domtar Inc. does not guarantee Domtar Corporation’s obligation under the Credit Agreement. In 2008, the Company amended the credit Agreement.facility in order to allow for the early repurchase of the 7.875% Notes.
The obligations of the Company in respect of the senior secured credit facilities are secured by all of the equity interests of the Company’s direct and indirect U.S. subsidiaries, other than 65% of the equity interests of the Company’s direct and indirect “first-tier” foreign subsidiaries, subject to agreed exceptions, and a perfected first priority security interest in substantially all of the Company’s and its direct and indirect U.S. subsidiaries’ tangible and intangible assets. The obligations of Domtar Inc., and the obligations of the non-U.S. guarantors, in respect of the senior secured credit facilities also are secured by all of the equity interests of the Company’s direct and indirect subsidiaries, subject to agreed exceptions, and a perfected first priority security interest, lien and hypothec in the inventory of Domtar Inc., its immediate parent, and its direct and indirect subsidiaries.
138
NOTES TO CONSOLIDATED FINANCIAL STATEMENTS
DECEMBER 31, 2009
(IN MILLIONS OF DOLLARS, UNLESS OTHERWISE NOTED)
NOTE 19.21.
OTHER LIABILITIES AND DEFERRED CREDITS
The following table presents the components of other liabilities and deferred credits:
| December 30, 2007 | December 31, 2006 | |||||
Liability—other post-retirement benefit plans (Note 6) | $ | 110 | $ | — | ||
Pension liability—defined benefit pension plans (Note 6) | 182 | 1 | ||||
Provision for environment and other asset retirement obligations (Note 21) | 98 | 20 | ||||
Provision for contracts assumed | 19 | — | ||||
Worker’s compensation | 6 | — | ||||
Other | 25 | 4 | ||||
| $ | 440 | $ | 25 | |||
| December 31, 2009 | December 31, 2008 | |||
| $ | $ | |||
Liability—other post-retirement benefit plans (Note 7) | 118 | 92 | ||
Pension liability—defined benefit pension plans (Note 7) | 112 | 93 | ||
Provision for environment and other asset retirement obligations (Note 23) | 96 | 77 | ||
Worker’s compensation | 3 | 4 | ||
Other | 37 | 18 | ||
| 366 | 284 | |||
ASSET RETIREMENT OBLIGATIONS
The asset retirement obligations are principally linked to landfill capping obligations, asbestos removal obligations and demolition of certain abandoned buildings. At December 30, 2007,31, 2009, Domtar has estimated the net
117
NOTES TO CONSOLIDATED FINANCIAL STATEMENTS
DECEMBER 30, 2007
(IN MILLIONS OF US DOLLARS, UNLESS OTHERWISE NOTED)
present value of its asset retirement obligations to be $39$46 million (2006 – $16(2008—$34 million); the present value wasis based on probability weighted undiscounted cash outflows of $112 million.$109 million (2008—$94 million). The majority of the asset retirement obligations are estimated to be settled prior to December 31, 2030.2025. However, some settlement scenarios call for obligations to be settled as late as December 31, 2047.2050. Domtar’s credit adjusted risk-free rates were used to calculate the net present value of the asset retirement obligations. The rates used vary between 4.50%5.50% and 12.00%, based on the prevailing rate at the moment of recognition of the liability and on its settlement period.
The following table reconciles Domtar’s asset retirement obligations:
| December 31, 2009 | December 31, 2008 | ||||||||||||
| December 30, 2007 | December 31, 2006 | $ | $ | ||||||||||
Asset retirement obligations, beginning of year | $ | 16 | $ | 17 | 34 | 39 | |||||||
Acquisition of Domtar Inc. (Note 3) | 21 | — | |||||||||||
Additions | 3 | — | |||||||||||
Revisions to estimated cash flows | 1 | (1 | ) | 3 | (6 | ) | |||||||
Settlements | (2 | ) | (1 | ) | |||||||||
Accretion expense | 3 | 1 | 3 | 2 | |||||||||
Effect of foreign currency exchange rate change | 3 | (1 | ) | ||||||||||
Asset retirement obligations, end of year | $ | 39 | $ | 16 | 46 | 34 | |||||||
139
NOTES TO CONSOLIDATED FINANCIAL STATEMENTS
DECEMBER 31, 2009
(IN MILLIONS OF DOLLARS, UNLESS OTHERWISE NOTED)
NOTE 20.22.
The authorized stated capital consists of the following:
PREFERRED SHARES
TwentyThe Company is authorized to issue twenty million preferred shares, par value $0.01 per share. The Board of Directors of the Company will determine the voting powers (if any) of the shares, and the preferences and relative, participating, optional or other special rights, if any, and any qualifications, limitations or restrictions thereof, of the shares at the time of issuance. No preferred shares were outstanding at December 30, 200731, 2009 or December 31, 2006.2008.
COMMON STOCK
On August 22, 2006, the Company was authorized to issue 1,000 shares of common stock par value, $0.01 per share. On March 7, 2007, the certificatecertification of incorporation of the Company was amended to authorize the issuance of two billion shares of common stock, par value $0.01 per share. Holders of the Company’s common stock are entitled to one vote per share.
On May 29, 2009, the Company’s Board of Directors authorized a reverse stock split at a 1-for-12 ratio of its outstanding common stock. Shareholder approval for the reverse stock split was obtained at the Company’s Annual General Meeting held on May 29, 2009 and the reverse stock split became effective June 10, 2009 at 6:01 PM (ET). At the effective time, every 12 shares of the Company’s common stock that was issued and outstanding was automatically combined into one issued and outstanding share, without any change in par value of such shares.
As a result of the reverse stock split, the Company reclassified $5 million from Common stock to Additional paid-in capital.
SPECIAL VOTING STOCK
One share of special voting stock, par value $0.01 per share was issued on March 7, 2007, upon consummation of the Transaction as described in Note 1.2007. The share of special voting stock is held by Computershare Trust Company of Canada (the “Trustee”) for the benefit of the holders of exchangeable shares of Domtar (Canada) Paper Inc. in accordance with the voting and exchange trust agreement. The Trustee holder of the share of special voting stock is entitled to vote on each matter which stockholders generally are entitled to vote, and the Trustee holder of the share of special voting stock will be entitled to cast on each such matter a
118
NOTES TO CONSOLIDATED FINANCIAL STATEMENTS
DECEMBER 30, 2007
(IN MILLIONS OF US DOLLARS, UNLESS OTHERWISE NOTED)
number of votes equal to the number of outstanding exchangeable shares of Domtar (Canada) Paper Inc. for which the Trustee holder has received voting instructions. The Trustee holder will not be entitled to receive dividends or distributions in its capacity as holder or owner thereof.
SHAREHOLDER RIGHTS PLAN
Subsequent to the Transaction, theThe Company entered into a rights agreement under which the shares of the Company’s common stock will include certain attached rights associated with a significant change in beneficial ownership of the Company. Under the rights agreement, one right is attached to each share of the Company’s common stock outstanding, but is not detachable until a distribution triggering event. The rights will not be exercisable before a distribution triggering event and will expireexpired on March 7, 2009.
140
NOTES TO CONSOLIDATED FINANCIAL STATEMENTS
DECEMBER 31, 2009
(IN MILLIONS OF DOLLARS, UNLESS OTHERWISE NOTED)
Under the rights agreement, the rights will detach from the shares of the Company’s common stock upon the earlier to occur of (a) a person, together with its affiliates and associates acquired beneficial ownership of 10% or more of the outstanding shares of the Company’s common stock; or (b) an acquirer commencing or announcing its intention to commence a tender or exchange offer, the consummation of which would result in beneficial ownership of such acquirer of 10% or more of the outstanding shares of the Company’s common stock.
No cash dividend was declared on these shares in 2007.2009. The changes in the number of outstanding common stock and their aggregate stated value from January 1, 2007 toduring the years ended December 30, 2007,31, 2009 and December 31, 2008, were as follows:
| December 30, 2007 | December 31, 2009 | December 31, 2008 | |||||||||||
Common stock | Number of shares | $ | Number of shares | $ | Number of shares | $ | |||||||
Balance at beginning of year | 1,000 | — | 41,219,727 | 5 | 39,264,163 | 5 | |||||||
Shares issued | |||||||||||||
Business Unit (Note 1) | 284,067,852 | 3 | |||||||||||
Domtar Inc. (Note 3) | 155,947,307 | 2 | |||||||||||
Stock options | 295,416 | — | 13,740 | — | 5,491 | — | |||||||
DSU conversions | 106,912 | — | |||||||||||
RSU conversions | 78,000 | — | 3,695 | — | |||||||||
Conversion of exchangeable shares | 30,751,472 | — | 750,941 | — | 1,946,378 | — | |||||||
Reverse stock split (12:1) | — | (5 | ) | — | — | ||||||||
Balance at the end of year | 471,169,959 | 5 | |||||||||||
Balance at end of year | 42,062,408 | — | 41,219,727 | 5 | |||||||||
EXCHANGEABLE SHARES
UponThe Company is authorized to issue unlimited exchangeable shares at no par value. On May 29, 2009, an equivalent reverse stock split was also authorized for the consummation of the Transaction as described in Note 1, Domtar Inc. shareholders could either receive common stock of the Company oroutstanding exchangeable shares of Domtar (Canada) Paper Inc. that are exchangeable foron the same terms and conditions as the Company’s common stock. The reverse stock of the Company.split became effective June 10, 2009 at 6:01 PM (ET). As such, a total of 44,252,831982,321 common stock remains reserved for future issuance for the exchangeable shares of Domtar (Canada) Paper Inc. outstanding at December 30, 2007.31, 2009 (2008—1,741,358). The exchangeable shares of Domtar (Canada) Paper Inc. are intended to be substantially economic equivalent to shares of the Company’s common stock. The rights, privileges, restrictions and conditions attaching to the exchangeable shares include the following:
The exchangeable shares are exchangeable at any time, at the option of the holder on a one-for-one basis for shares of common stock of the Company;
In the event the Company declares a dividend on the common stock, the holders of exchangeable shares are entitled to receive from Domtar (Canada) Paper Inc. the same dividend, or an economically equivalent dividend, on their exchangeable shares;
119
NOTES TO CONSOLIDATED FINANCIAL STATEMENTS
DECEMBER 30, 2007
(IN MILLIONS OF US DOLLARS, UNLESS OTHERWISE NOTED)
The holders of the exchangeable shares of Domtar (Canada) Paper Inc. are not entitled to receive notice of or to attend any meeting of the shareholders of Domtar (Canada) Paper Inc. or to vote at any such meeting, except as required by law or as specifically provided in the exchangeable share conditions;
The exchangeable shares of Domtar (Canada) Paper Inc. may be redeemed by Domtar (Canada) Paper Inc. on a redemption date to be set by the board of directors of Domtar (Canada) Paper Inc., which date cannot be prior to July 31, 2023 (or earlier upon the occurrence of certain specified events) in exchange for one share of Company common stock for each exchangeable share presented and surrendered by the holder thereof, together with all declared but unpaid dividends on each exchangeable share. The
141
Board of Directors of Domtar (Canada) Inc. is permitted to accelerate the July 31, 2023 redemption date upon the occurrence of certain events, including, upon at least 60 days prior written notice to the holders, in the event less than 416,667 exchangeable shares (excluding any exchangeable shares held directly or indirectly by the Company) are outstanding at any time. |
The holders of exchangeable shares of Domtar (Canada) Paper Inc. are entitled to instruct the Trustee to vote the special voting stock as described above.
NOTE 21.23.
ENVIRONMENT
The Company is subject to environmental laws and regulations enacted by federal, provincial, state and local authorities.
In 2009, the Company’s operating expenses for environmental matters, as described in Note 1, amounted to $71 million (2008—$81 million; 2007—$85 million).
The Company made capital expenditures for environmental matters of $2 million in 2009 (2008—$4 million; 2007—$11 million), for the improvement of air emissions, effluent treatment and remedial actions to address environmental compliance. At this time, management does not expect any additional required expenditure that would have a material adverse effect on the Company’s financial position, results of operations or cash flows.
During the first quarter of 2006, the Company closed the pulp and paper mill in Prince Albert, Saskatchewan and the sawmill at or near Big River sawmill in Prince Albert, Saskatchewanwere closed due to poor market conditions. The Company’s management determined that the Prince Albert facility was no longer a strategic fit for the Company hasand will not determined at this time whether the facilities will be reopened, sold or permanently closed. In the event the facilities are permanently closed, thereopened. The Province of Saskatchewan may require active decommissioning and reclamation at one or both facilities. In the event decommissioning and reclamation is required at either facility, the work is likely to include investigation and remedial action for areas of significant environmental impacts.
In 2007, the Company’s operating expenses for environmental matters, as described in Note 1, amounted to $85 million.
The Company made capital expenditures for environmental matters of $11 million in 2007,has a reserve for the improvement of air emissions, effluent treatment and remedial actions to addressestimated environmental compliance. At this time,remediation at the Company cannot reasonably estimate the additional capital expenditures that may be required. However, management expects any additional required expenditure would not have a material adverse effect on the Company’s financial position, earnings or cash flows.
The Company is also a party to various proceedings relating to the cleanup of hazardous waste sites under the Comprehensive Environmental Response Compensation and Liability Act, commonly known as “Superfund,” and similar state laws. The EPA and/or various state agencies have notified the Company that it may be a potentially responsible party with respect to other hazardous waste sites as to which no proceedings have been instituted against the Company. The Company continues to take remedial action under its Care and Control Program at a number of former operating sites, especially in the wood preserving sector, due to possible soil, sediment or groundwater contamination. The investigation and remediation process is lengthy and subject to the uncertainties of changes in legal requirements, technological developments and the allocation of liability among potentially responsible parties.
120
NOTES TO CONSOLIDATED FINANCIAL STATEMENTS
DECEMBER 30, 2007
(IN MILLIONS OF US DOLLARS, UNLESS OTHERWISE NOTED)
While the Company believes that it has determined the costs for environmental matters likely to be incurred based on known information, the Company’s ongoing efforts to identify potential environmental concerns that may be associated with the properties may lead to future environmental investigations. These efforts may result in the determination of additional environmental costs and liabilities, which cannot be reasonably estimated at this time.site.
An action was commenced by Seaspan International Ltd. (“Seaspan”) in the Supreme Court of British Columbia, on March 31, 1999 against Domtar Inc. and others with respect to alleged contamination of Seaspan’s site bordering Burrard Inlet in North Vancouver, British Columbia, including contamination of sediments in Burrard Inlet, due to the presence of creosote. As of July 3, 2002, the parties entered into a partial Settlement Agreement (the “Settlement Agreement”) which providesprovided that, while the agreement is performed in accordance with its terms, the action commenced by Seaspan will be held in abeyance. The Settlement Agreement focused on the sharing of costs between Seaspan and Domtar Inc. for certain remediation of contamination referred to in the plaintiff’s claim. The Settlement Agreement doesdid not address all of the plaintiff’s claims as thatand such claims cannot be reasonably determined at this time. DueOn June 3, 2008, Domtar was notified by Seaspan that it terminated the Settlement Agreement. The government of British Columbia issued on February 16, 2010 a Remediation Order to Seaspan and Domtar in order to define and implement an action plan to address soil, sediment and groundwater issues.
142
NOTES TO CONSOLIDATED FINANCIAL STATEMENTS
DECEMBER 31, 2009
(IN MILLIONS OF DOLLARS, UNLESS OTHERWISE NOTED)
This Order may be appealed within 30 days from the complexitydate of this Order but there is no suspension in the implementationexecution of this Order unless the Settlement, the parties areAppeal Board orders otherwise. The Company is currently renegotiating the terms and conditions of the Settlement. No party has exercisedreviewing its right to terminate the Settlement.options in this respect. The Company has recorded an environmental reserve to address estimated exposure.
The following table reflects changes in the reserve for environmental remediation and asset retirement obligations:
| December 31, 2009 | December 31, 2008 | |||||
| $ | $ | |||||
Balance at beginning of year | 99 | 119 | ||||
Additions | 11 | 10 | ||||
Revisions in estimated cash flows | (7 | ) | (17 | ) | ||
Environmental spending | (5 | ) | (5 | ) | ||
Accretion | 3 | — | ||||
Effect of foreign currency exchange rate change | 10 | (8 | ) | |||
Balance at end of year | 111 | 99 | ||||
At December 31, 2009, anticipated undiscounted payments in each of the next five years were as follows:
| 2010 | 2011 | 2012 | 2013 | 2014 | Thereafter | Total | ||||||||
| $ | $ | $ | $ | $ | $ | $ | ||||||||
Environmental provision and other asset retirement obligations | 15 | 37 | 18 | 6 | 8 | 27 | 111 | |||||||
Climate change regulation
Since 1997, when an international conference on global warming concluded an agreement known as the Kyoto Protocol, which called for reductions of certain emissions that may contribute to increases in atmospheric greenhouse gas (“GHG”) concentrations, various international, national and local laws have been proposed or implemented focusing on reducing GHG emissions. These actual or proposed laws do or may apply in the countries where the Company currently has, or may have in the future, manufacturing facilities or investments.
In the United States, the U.S. Congress is considering legislation to reduce emissions of GHGs. In June 2009, the U.S. House of Representatives passed The American Clean Energy and Security Act of 2009, a provisioncap-and-trade bill designated to reduce GHG emissions. In September 2009 the Clean Energy Jobs and American Power Act was introduced in the U.S. Senate. In December 2009, the Carbon Limits and Energy for America’s Recovery (CLEAR) Act was also introduced in the U.S. Senate. In addition, several states are already requiring the reduction of GHG emissions by certain companies and public utilities, primarily through the planned development of GHG emission inventories and/or state GHG cap-and-trade programs. In addition, the U.S. Environmental Protection Agency (“EPA”) is beginning to regulate GHG emissions. The U.S. Supreme Court ruled in April 2007 inMassachusetts, et al. v. EPA, that GHGs fall under the federal Clean Air Act’s definition of “air pollutant.” In December 2009, EPA issued its “endangerment findings” which found that GHG endanger public health and welfare. The finding itself does not impose any requirement on the Company industry but is a pre-requisite for EPA to regulate GHG emissions. Passage of climate control legislation or other regulatory initiatives by Congress or various U.S. States, or the adoption of regulations by the EPA or analogous state agencies that restrict emissions of GHGs in areas in which the Company conducts business may have a material effect on the Company’s operations. The Company expects not to be disproportionately affected by these
143
NOTES TO CONSOLIDATED FINANCIAL STATEMENTS
DECEMBER 31, 2009
(IN MILLIONS OF DOLLARS, UNLESS OTHERWISE NOTED)
measures compared with other pulp and paper operations in the United States. There are presently no federal or provincial legislation on regulatory obligations to reduce GHG for the estimated settlement amount.pulp and paper operations in Canada.
Domtar Inc. was issuedWhile it is likely that there will be increased regulation relating to GHG and climate change, at this stage it is not possible to estimate either a Request for Response Action (“RFRA”) by the Minnesota Pollution Control Agency (“MPCA”)timetable for the clean-uppromulgation or implementation of tar seeps and soils at a former coal tar distillation plant located in Duluth, Minnesota. On March 27, 1996,any new regulations or the MPCA issued a Request for Response Action (“RFRA”) to Domtar Inc., Interlake Corp., Allied-Signal, Inc. and Beazer East, Inc. requiring the investigation and potential remediation of a portion of an industrial site located in Duluth, Minnesota, believed to contain contaminated sediments originating from former coke and gas plants and coal tar distillation plants. Domtar Inc. formerly operated one coal tar distillation plant. The totalCompany’s cost of the likely remediation is estimatedcompliance to be between $3 million and $7 million. Final allocation of remediation cost is expected to be determined in the second quarter of 2008. said regulations.
At December 30, 2007,31, 2009, the Company had a provision of $4 million for remediation costs.
At December 30, 2007, the Company had a provision of $119$111 million for environmental matters and other asset retirement obligations.obligations (2008—$99 million). Additional costs, not known or identifiable, could be incurred for remediation efforts. Based on policies and procedures in place to monitor environmental exposure, management believes that such additional remediation costs would not have a material adverse effect on the Company’s financial position, earningsresults of operations or cash flows.
At December 30, 2007, anticipated undiscounted payments in each of the next five years were as follows:
| 2008 | 2009 | 2010 | 2011 | 2012 | Thereafter | Total | |||||||||||||||
Environmental provision and other asset retirement obligation | $ | 21 | $ | 32 | $ | 14 | $ | 7 | $ | 7 | $ | 38 | $ | 119 | |||||||
CONTINGENCIES
In the normal course of operations, the Company becomes involved in various legal actions mostly related to contract disputes, patent infringements, environmental and product warranty claims, and labor issues. While the final outcome with respect to actions outstanding or pending at December 30, 2007,31, 2009, cannot be predicted with certainty, it is management’s opinion that their resolution will not have a material adverse effect on the Company’s financial position, earningsresults of operation or cash flows.
121
NOTES TO CONSOLIDATED FINANCIAL STATEMENTS
DECEMBER 30, 2007
(IN MILLIONS OF US DOLLARS, UNLESS OTHERWISE NOTED)
Domtar Inc. is subject to a motion by Joachim Laferrière Électricien Inc., filed in the Quebec Superior Court on January 9, 2006, for authorization to bring a class action suit against Domtar Inc. and others for alleged damages relating to a conspiracy to fix prices of carbonless sheets during the period of January through December 2000 in the Province of Quebec, Canada. The claim seeks estimated compensatory damages in the amount of $50 million (CDN$50 million) plus estimated exemplary damages in the amount of $1 million to $5 million (CDN$1 million to CDN$5 million). Domtar is also subject to a motion by McLay & Company Inc. filed in Ontario Superior Court on January 11, 2006 for authorization to bring a class action suit against Domtar Inc. and others, for alleged inflated prices of carbonless sheets paper during the period of October 1999 through September 2000 in the Province of Ontario, Canada. These class actions have been settled in principle for an insignificant amount and are subject to Court approval. The amount had been previously provided for in the purchase price allocation related to the acquisition of Domtar Inc.
In the early part of 2006, the Company closed its pulp and paper mill in Prince Albert Saskatchewan. Certain unionized parties filed a grievance against Weyerhaeuser followingwas closed in the shut down, alleging that certain post-closure actions taken by Weyerhaeuser violated their collective bargaining agreement.first quarter of 2006 and has not been operated since. In particular, the union disputed the post-closure contracting with a third-party vendor to oversee on-site security at Prince Albert. In connection with the Transaction,December 2009, the Company has assumed any liability with respectdecided to this grievance. In November 2007, the Company was informed that the Government of the Province of Saskatchewan was not prepared to participate in the financing and redevelopment ofdismantle the Prince Albert Facility into a Northern Bleached Softwood Kraft (“NBSK”) pulp mill producing 100% Forest Stewardship Council (FSC) certified softwood pulp for the North America and offshore markets, as set forth in the memorandum of understanding signed on September 12, 2007. As such, the Company has not determined whether these previously idled facilities will be reopened, sold or closed.facility. In a separate grievance relating to the closure of the Prince Albert facility, which could result in liability in excess of $20 million, the union is claiming that it is entitled to the accumulated pension benefits during the actual layoff period because, according to the union, a majority of employees retained still had recall rights during the layoff. Arbitration in this matter was held on February 16 to 18, 2010, and the parties are awaiting the arbitrator’s decision. The Company is currently evaluating its position with respect to these grievances and cannot be certain that it will not incur a liability, which could be material,in excess of $20 million, with respect to these grievances.
E.B. EDDY ACQUISITIONthis grievance.
On July 31, 1998, Domtar Inc. acquired all of the issued and outstanding shares of E.B. Eddy Limited and E.B. Eddy Paper, Inc. (E.B. Eddy), an integrated producer of specialty paper and wood products. The purchase agreement includes a purchase price adjustment whereby, in the event of the acquisition by a third party of more than 50% of the shares of Domtar Inc. in specified circumstances, Domtar Inc. maycould have hadbeen obligated to pay up to a maximum of $121$115 million (CDN$120 million), an amount which is gradually declining over a 25-year period. At March 7, 2007, the maximum amount of the purchase price adjustment was $111approximately $105 million (CDN$110 million). No provision was recorded for this potential purchase price adjustment.
On March 14, 2007, the Company received a letter from George Weston Limited (the previous owner of E.B. Eddy and a party to the purchase agreement) demanding payment of $111$105 million (CDN$110 million) as a result of the consummation of the Transaction.March 2007 combination of the Weyerhaeuser Fine Paper Business with Domtar Inc. On June 12, 2007, an action was commenced by George Weston Limited against Domtar Inc. in the Superior Court of Justice of the Province of Ontario, Canada, claiming that the consummation of the Transaction combination of the Weyerhaeuser Fine Paper Business with Domtar Inc., triggered the purchase price adjustment and sought a purchase price adjustment of $111$105 million (CDN$110 million) as well as additional compensatory damages. The Company does not believe that the consummation of the TransactionMarch 2007 combination of the Weyerhaeuser Fine Paper Business with Domtar Inc. triggers an obligation to pay an increase in consideration under the purchase price adjustment and intends to defend itself vigorously against any claims with respect
122144
NOTES TO CONSOLIDATED FINANCIAL STATEMENTS
DECEMBER 30, 200731, 2009
(IN MILLIONS OF US DOLLARS, UNLESS OTHERWISE NOTED)
thereto. However, the Company may not be successful in the defense of such claims, and if the Company is ultimately required to pay an increase in consideration, such payment may have a material adverse effect on the liquidity,Company’s financial position, results of operations and financial condition.or cash flows.
LEASE AND OTHER COMMERCIAL COMMITMENTS
The Company has entered into operating leases for property, plant and equipment. The Company also has commitments to purchase property, plant and equipment, roundwood, wood chips, gas and certain chemicals. Purchase orders in the normal course of business are excluded from the table below. Any amounts for which the Company is liable under purchase orders are reflected in the Consolidated Balance Sheets as Trade and other payables. Minimum future payments under these operating leases and other commercial commitments, determined at December 30, 2007,31, 2009, were as follows:
| 2010 | 2011 | 2012 | 2013 | 2014 | Thereafter | Total | |||||||||||||||||||||||||||||
| 2008 | 2009 | 2010 | 2011 | 2012 | Thereafter | Total | $ | $ | $ | $ | $ | $ | $ | ||||||||||||||||||||||
Operating leases | $ | 29 | $ | 22 | $ | 16 | $ | 9 | $ | 5 | $ | 6 | $ | 87 | 30 | 20 | 13 | 7 | 5 | 1 | 76 | ||||||||||||||
Other commercial commitments | 97 | 26 | 9 | 7 | 5 | — | 144 | 117 | 20 | 12 | 2 | 2 | 1 | 154 | |||||||||||||||||||||
Total operating lease expense amounted to $31$36 million in 2007.2009 (2008—$39 million; 2007—$31 million).
GUARANTEES AND INDEMNIFICATIONS
In the normal course of business, the Company offers indemnifications relating to the sale of its businesses and real estate. In general, these indemnifications may relate to claims from past business operations, the failure to abide by covenants and the breach of representations and warranties included in the sales agreements. Typically, such representations and warranties relate to taxation, environmental, product and employee matters. The terms of these indemnification agreements are generally for an unlimited period of time. At December 30, 2007,31, 2009, the Company is unable to estimate the potential maximum liabilities for these types of indemnification guarantees as the amounts are contingent upon the outcome of future events, the nature and likelihood of which cannot be reasonably estimated at this time. Accordingly, no provisions haveprovision has been recorded. These indemnifications have not yielded a significant expense in the past.
NOTE 22.24.
FINANCIAL INSTRUMENTS
DERIVATIVES AND HEDGING ACTIVITIES AND FAIR VALUE OF FINANCIAL INSTRUMENTSMEASUREMENT
| December 30, 2007 | December 31, 2006 | |||||||||||
| Fair value | Carrying amount | Fair value | Carrying amount | |||||||||
Long-term debt | $ | 2,162 | $ | 2,230 | $ | 44 | $ | 44 | ||||
The fair value of the long-term debt, including the portion due within one year, is principally based on quoted market prices.
Due to their short-term maturity, the carrying amounts of cash and cash equivalents, receivables, bank indebtedness, trade and other payables and income and other taxes approximate their fair values.
123
NOTES TO CONSOLIDATED FINANCIAL STATEMENTS
DECEMBER 30, 2007
(IN MILLIONS OF US DOLLARS, UNLESS OTHERWISE NOTED)
INTEREST RATE RISK
The Company is exposed to interest rate risk arising from fluctuations in interest rates on its cash and cash equivalents, its bank indebtedness, its bank credit facility and its long-term debt. The Company may manage this interest rate exposure bythrough the use of derivative instruments such as interest rate swap contracts.
CREDIT RISK
The Company is exposed to credit risk on the accounts receivable from its customers. In order to reduce this risk, the Company reviews new customers’ credit historieshistory before granting credit and conducts regular reviews of
145
NOTES TO CONSOLIDATED FINANCIAL STATEMENTS
DECEMBER 31, 2009
(IN MILLIONS OF DOLLARS, UNLESS OTHERWISE NOTED)
existing customers’ credit performance. As at December 31, 2009, the Company did not have any customers that represented more than 10% of the receivables, prior to the effect of receivables securitization (2008—the Company had one customer that represented 11% of the receivables ($54 million)).
The Company is also exposed to credit risk in the event of non-performance by counterparties to its financial instruments. The Company minimizes this exposure by entering into contracts with counterparties that are believed to be of high credit quality. Collateral or other security to support financial instruments subject to credit risk is usually not obtained. The credit standing of counterparties is regularly monitored.
FOREIGN CURRENCY RISK
In order The Company is exposed to reducecredit risk in the potential negative effectsevent of a fluctuating Canadian dollar, thenon-performance by its insurers. The Company may enter into various arrangements to stabilize anticipated future net cash inflows denominated in U.S. dollars. Such arrangements are composed of forward foreign contracts and currency options purchased and sold. Forward foreign exchange contracts are contracts whereby the Company has the obligation to sell U.S. dollars at a specific rate. Currency options purchased are contracts whereby the Company has the right, but not the obligation, to sell U.S. dollars at the strike rate if the U.S. dollar trades below that rate. Currency options sold are contracts whereby the Company has the obligation to sell U.S. dollars at the strike rate if the U.S. dollar trades above that rate. No arrangements were outstanding at December 30, 2007 and December 31, 2006.minimizes this exposure by doing business only with large reputable insurance companies.
COST RISK
Cash flow hedges:
The Company purchases natural gas and oil at the prevailing market price at the time of delivery. In order to manage the cash flow risk associated with purchases of natural gas and oil, the Company may utilize derivative financial instruments or physical purchases to fix the price of forecasted natural gas and oil purchases. The Company formally documents the hedge relationships, including identification of the hedging instruments and the hedged items, the risk management objectives and strategies for undertaking the hedge transactions, and the methodologies used to assess effectiveness and measure ineffectiveness. ChangesCurrent contracts are used to hedge forecasted purchases over the next three years. The effective portion of changes in the fair value of derivative contracts designated as cash flow hedges are recorded as a component of Accumulated other comprehensive loss within Shareholders’ equity, and are recognized in Cost of sales in the period in which the hedged transaction occurs.
The following table presents the volumes under derivative financial instruments are allocated by the Companyfor natural gas and oil contracts outstanding as of December 31, 2009 to individual facilities based on projected usagehedge forecasted purchases:
Commodity | Notional contractual quantity under derivative contracts | Notional contractual value under derivative contracts (in millions of dollars) | Percentage of forecasted purchases under derivative contracts for (a) | |||||||||||||
| 2010 | 2011 | 2012 | ||||||||||||||
Natural gas | 6,540,000 | MMBTU (1) | $ | 50 | 26 | % | 12 | % | 3 | % | ||||||
Oil | 12,000 | BBL (2) | $ | 0.4 | 3 | % | — | — | ||||||||
| (1) | MMBTU: Millions of British thermal units |
| (2) | BBL: Barrels |
| (a) | The percentage of coverage represents the derivative financial instrument positions. The percentage of natural gas and oil purchases under fixed price contracts for both derivative financial instruments and physical delivery for 2010 are 26% and 3%, 2011 are 12% and nil and 2012 are 3% and nil, respectively. |
The natural gas and oil derivative contracts were fully effective for accounting purposes as of natural gas.December 31, 2009. The Company recognizes its allocable sharecritical terms of the gainshedging instruments and losses on the Company’s derivative financial instrumentshedged items match. As a result, there were no amounts reflected in earnings when the forecasted purchases occur. A summaryConsolidated Statements of amounts related toEarnings (Loss) for the Company’s hedging program follows:year ended December 31, 2009 resulting from hedge ineffectiveness (2008—nil).
| December 30, 2007 | December 31, 2006 | ||||||
Unrealized losses not yet recognized in the consolidated statements of earnings (loss) at end of year | $ | — | $ | (9 | ) | ||
124146
NOTES TO CONSOLIDATED FINANCIAL STATEMENTS
DECEMBER 30, 200731, 2009
(IN MILLIONS OF USDOLLARS, UNLESS OTHERWISE NOTED)
FOREIGN CURRENCY RISK
Cash flow hedges:
The Company has manufacturing operations in the United States and Canada. As a result, it is exposed to movements in the foreign currency exchange rate in Canada. Also, certain assets and liabilities are denominated in Canadian dollars and are exposed to foreign currency movements. As a result, the Company’s earnings are affected by increases or decreases in the value of the Canadian dollar relative to the U.S. dollar. The Company’s risk management policy allows it to hedge a significant portion of its exposure to fluctuations in foreign currency exchange rates for periods up to three years. The Company may use derivative instruments (currency options and foreign exchange forward contracts) to mitigate its exposure to fluctuations in foreign currency exchange rates. Foreign exchange forward contracts are contracts whereby the Company has the obligation to buy Canadian dollars at a specific rate. Currency options purchased are contracts whereby the Company has the right, but not the obligation, to buy Canadian dollars at the strike rate if the Canadian dollar trades above that rate. Currency options sold are contracts whereby the Company has the obligation to buy Canadian dollars at the strike rate if the Canadian dollar trades below that rate.
The Company formally documents the relationship between hedging instruments and hedged items, as well as its risk management objectives and strategies for undertaking the hedge transactions. Foreign exchange forward contracts and currency options contracts used to hedge forecasted purchases in Canadian dollars are designated as cash flow hedges. Current contracts are used to hedge forecasted purchases over the next 12 months. The effective portion of changes in the fair value of derivative contracts designated as cash flow hedges is recorded as a component of Accumulated other comprehensive loss within Shareholders’ equity, and is recognized in Cost of sales in the period in which the hedged transaction occurs.
The following table presents the currency values under contracts pursuant to currency options outstanding as of December 31, 2009 to hedge forecasted purchases:
Contract | Notional contractual value | Percentage of CDN denominated forecasted expenses, net of revenues under contracts for | ||||||
| 2010 | ||||||||
Currency options purchased | CDN | $ | 440 | 55 | % | |||
Currency options sold | CDN | $ | 440 | 55 | % | |||
The currency options are fully effective as at December 31, 2009. The critical terms of the hedging instruments and the hedged items match. As a result, there were no amounts reflected in the Consolidated Statements of Earnings (Loss) for the year ended December 31, 2009 resulting from hedge ineffectiveness (2008—nil).
147
NOTES TO CONSOLIDATED FINANCIAL STATEMENTS
DECEMBER 31, 2009
(IN MILLIONS OF DOLLARS, UNLESS OTHERWISE NOTED)
The Effect of Derivative Instruments on the Consolidated Statements of Earnings (Loss) and Consolidated Statements of Shareholders’ Equity
Derivatives Designated as Cash Flow | Gain (Loss) Recognized in Accumulated Other Comprehensive Loss on Derivatives (Effective Portion) | Gain (Loss) Reclassified from Accumulated Other Comprehensive Loss into Income (Effective Portion) | |||||||||||||
| For the year ended | For the year ended | ||||||||||||||
| December 31, 2009 | December 31, 2008 | December 30, 2007 | December 31, 2009 | December 31, 2008 | December 30, 2007 | ||||||||||
| $ | $ | $ | $ | $ | $ | ||||||||||
Natural gas swap contracts(a) | (4 | ) | 5 | — | (2 | ) | — | — | |||||||
Oil swap contracts(a) | 2 | — | — | 1 | — | — | |||||||||
Currency options(a) | 53 | 72 | — | (17 | ) | (25 | ) | — | |||||||
Total | 51 | 77 | — | (18 | ) | (25 | ) | — | |||||||
| (a) | The Gain (Loss) reclassified from Accumulated Other Comprehensive Loss into Income (Effective Portion) is recorded in Cost of sales. |
The loss recorded in Accumulated other comprehensive loss relating to natural gas contracts will be recognized in Cost of sales upon maturity of the derivatives over the next three years at the then prevailing values, which may be different from those at December 31, 2009.
The gain (loss) recorded in Accumulated other comprehensive loss relating to currency options will be recognized in Cost of sales upon maturity of the derivatives over the next 12 months at the then prevailing values, which may be different from those at December 31, 2009.
Fair Value Measurements and Disclosures Topic of FASB ASC establishes a fair value hierarchy, which prioritizes the inputs to valuation techniques used to measure fair value into three levels. A financial instrument’s categorization within the fair value hierarchy is based upon the lowest level of input that is available and significant to the fair value measurement. Fair Value Measurements and Disclosures Topic of FASB ASC establishes and prioritizes three levels of inputs that may be used to measure fair value:
| Level 1 | — | Quoted prices in active markets for identical assets or liabilities. | ||
| Level 2 | — | Observable inputs other than quoted prices in active markets for identical assets and liabilities, quoted prices for identical or similar assets or liabilities in inactive markets, or other inputs that are observable or can be corroborated by observable market data for substantially the full term of the assets or liabilities. | ||
| Level 3 | — | Inputs that are generally unobservable and typically reflect management’s estimates of assumptions that market participants would use in pricing the asset or liability. |
148
NOTES TO CONSOLIDATED FINANCIAL STATEMENTS
DECEMBER 31, 2009
(IN MILLIONS OF DOLLARS, UNLESS OTHERWISE NOTED)
The following tables present information about the Company’s financial assets and financial liabilities measured at fair value on a recurring basis for the years ended December 31, 2009 and December 31, 2008, in accordance with Fair Value Measurements and Disclosures Topic of FASB ASC and indicates the fair value hierarchy of the valuation techniques utilized by the Company to determine such fair value.
Fair Value of financial instruments at: | December 31, 2009 | Quoted prices in active markets for identical assets (Level 1) | Significant observable inputs (Level 2) | Significant unobservable inputs (Level 3) | Balance sheet classification | ||||||
| $ | $ | $ | $ | ||||||||
Derivatives designated as cash flow hedging instruments under the Derivatives and Hedging Topic of FASB ASC: | |||||||||||
Asset derivatives | |||||||||||
Currency options | 25 | — | 25 | — | (a) | Prepaid expenses | |||||
Total Assets | 25 | — | 25 | — | |||||||
Liabilities derivatives | |||||||||||
Currency options | 3 | — | 3 | — | (a) | Trade and other payables | |||||
Natural gas swap contracts | 9 | — | 9 | — | (a) | Trade and other payables | |||||
Natural gas swap contracts | 2 | — | 2 | — | (a) | Other liabilities and deferred credits | |||||
Total Liabilities | 14 | — | 14 | — | |||||||
Other Instruments: | |||||||||||
Long-term debt | 1,805 | 1,805 | — | — | (b) | Long-term debt | |||||
149
NOTES TO CONSOLIDATED FINANCIAL STATEMENTS
DECEMBER 31, 2009
(IN MILLIONS OF DOLLARS, UNLESS OTHERWISE NOTED)
Fair Value of financial instruments at: | December 31, 2008 | Quoted prices in active markets for identical assets (Level 1) | Significant observable inputs (Level 2) | Significant unobservable inputs (Level 3) | Balance sheet classification | ||||||
| $ | $ | $ | $ | ||||||||
Derivatives designated as cash flow hedging instruments under the Derivatives and Hedging Topic of FASB ASC: | |||||||||||
Asset derivatives | |||||||||||
Currency options | 13 | — | 13 | — | (a) | Prepaid expenses | |||||
Total Assets | 13 | — | 13 | — | |||||||
Liabilities derivatives | |||||||||||
Currency options | 54 | — | 54 | — | (a) | Trade and other payables | |||||
Natural gas swap contracts | 2 | — | 2 | — | (a) | Trade and other payables | |||||
Oil swap contracts | 1 | — | 1 | — | (a) | Trade and other payables | |||||
Natural gas swap contracts | 6 | — | 6 | — | (a) | Other liabilities and deferred credits | |||||
Total Liabilities | 63 | — | 63 | — | |||||||
Other Instruments: | |||||||||||
Long-term debt | 1,524 | 1,524 | — | — | (b) | Long-term debt | |||||
| (a) | Fair value of the Company’s derivatives is classified under Level 2 (inputs that are observable; directly or indirectly) as it is measured as follows: |
For currency options: Fair value is measured using techniques derived from the Black-Scholes pricing model. Interest rates, forward market rates and volatility are used as inputs for such valuation techniques.
For natural gas contracts: Fair value is measured using the discounted difference between contractual rates and quoted market future rates.
| (b) | Fair value of the Company’s long-term debt is measured by comparison to market prices of our debt. |
Due to their short-term maturity, the carrying amounts of cash and cash equivalents, receivables, bank indebtedness, trade and other payables and income and other taxes approximate their fair values.
150
NOTES TO CONSOLIDATED FINANCIAL STATEMENTS
DECEMBER 31, 2009
(IN MILLIONS OF DOLLARS, UNLESS OTHERWISE NOTED)
NOTE 23.25.
RELATED PARTYSEGMENT DISCLOSURES
Prior to the Transaction, the Weyerhaeuser Fine Paper Business was engaged in various transactions with Weyerhaeuser that were characteristic of a consolidated group under common control. For the years ended December 31, 2006 and December 25, 2005, the Business Unit purchased from Weyerhaeuser pulp, fiber and corrugated boxes for an amount of $209 million and $355 million, respectively, and sold pulp, paper and lumber for an amount of $91 million and $132 million, respectively.
NOTE 24.
SEGMENT DISCLOSURES
Following the Transaction, theThe Company operates in the three reportable segments described below. Each reportable segment offers different products and services and requires different technology and marketing strategies. The following summary briefly describes the operations included in each of the Company’s reportable segments:
Papers—represents the aggregation of the manufacturing and distribution businesses, commercial printing and publication, and technical and specialty papers, as well as market pulp.
Paper Merchants—involves the purchasing, warehousing, sale and distribution of various products made by the Company and by other manufacturers. These products include business and printing papers and certain industrial products.
Wood—comprises the manufacturing and marketing of lumber and wood-based value-added products and the management of forest resources.
The accounting policies of the reportable segments are the same as described in Note 1. The Company evaluates performance based on operating income, which represents sales, reflecting transfer prices between segments at fair value, less allocable expenses before financing expensesinterest expense and income taxes. Segment assets are those directly used in segment operations.
The Company attributes sales to customers in different geographical areas on the basis of the location of the customer.
Long-lived assets consist of goodwill and property, plant and equipment used in the generation of sales in the different geographical areas.
125151
NOTES TO CONSOLIDATED FINANCIAL STATEMENTS
DECEMBER 30, 200731, 2009
(IN MILLIONS OF US DOLLARS, UNLESS OTHERWISE NOTED)
An analysis and reconciliation of the Company’s business segment information to the respective information in the financial statements is as follows:
SEGMENT DATA | Year ended December 30, 2007 | Year ended December 31, 2006 | Year ended December 25, 2005 | Year ended December 31, 2009 | Year ended December 31, 2008 | Year ended December 30, 2007 | |||||||||||||||
| $ | $ | $ | |||||||||||||||||||
Sales | |||||||||||||||||||||
Papers | $ | 5,116 | $ | 3,143 | $ | 3,074 | 4,632 | 5,440 | 5,116 | ||||||||||||
Paper Merchants | 813 | — | — | 873 | 990 | 813 | |||||||||||||||
Wood | 304 | 234 | 338 | 211 | 268 | 304 | |||||||||||||||
Total for reportable segments | 6,233 | 3,377 | 3,412 | 5,716 | 6,698 | 6,233 | |||||||||||||||
Intersegment sales—Papers | (235 | ) | — | (2 | ) | (231 | ) | (276 | ) | (235 | ) | ||||||||||
Intersegment sales—Paper Merchants | (1 | ) | — | — | — | — | (1 | ) | |||||||||||||
Intersegment sales—Wood | (50 | ) | (71 | ) | (143 | ) | (20 | ) | (28 | ) | (50 | ) | |||||||||
Consolidated sales | 5,947 | 3,306 | 3,267 | 5,465 | 6,394 | 5,947 | |||||||||||||||
Depreciation and amortization | |||||||||||||||||||||
Papers | 444 | 302 | 341 | 382 | 435 | 444 | |||||||||||||||
Paper Merchants | 2 | — | — | 3 | 3 | 2 | |||||||||||||||
Wood | 25 | 9 | 16 | 20 | 25 | 25 | |||||||||||||||
Consolidated depreciation and amortization | 471 | 311 | 357 | 405 | 463 | 471 | |||||||||||||||
Charges for closure of facilities, restructuring costs and impairments | |||||||||||||||||||||
Impairments and write-downs | |||||||||||||||||||||
Papers | 105 | 765 | 461 | 62 | 694 | 92 | |||||||||||||||
Wood | 5 | (1 | ) | 77 | — | 14 | 4 | ||||||||||||||
Consolidated charges for closure of facilities, restructuring costs and impairments | 110 | 764 | 538 | ||||||||||||||||||
Consolidated impairments and write-downs | 62 | 708 | 96 | ||||||||||||||||||
Operating income (loss) | |||||||||||||||||||||
Papers | 321 | (608 | ) | (492 | ) | 650 | (369 | ) | 321 | ||||||||||||
Paper Merchants | 13 | — | — | 7 | 8 | 13 | |||||||||||||||
Wood | (63 | ) | 52 | (86 | ) | (42 | ) | (73 | ) | (63 | ) | ||||||||||
Corporate | (1 | ) | — | — | — | (3 | ) | (1 | ) | ||||||||||||
Consolidated operating income (loss) | 270 | (556 | ) | (578 | ) | 615 | (437 | ) | 270 | ||||||||||||
Interest expense | 171 | — | — | 125 | 133 | 171 | |||||||||||||||
Earnings (loss) before income taxes | 99 | (556 | ) | (578 | ) | 490 | (570 | ) | 99 | ||||||||||||
Income tax expense | 29 | 53 | (100 | ) | 180 | 3 | 29 | ||||||||||||||
Net earnings (loss) | $ | 70 | $ | (609 | ) | $ | (478 | ) | 310 | (573 | ) | 70 | |||||||||
126152
NOTES TO CONSOLIDATED FINANCIAL STATEMENTS
DECEMBER 30, 200731, 2009
(IN MILLIONS OF US DOLLARS, UNLESS OTHERWISE NOTED)
SEGMENT DATA (CONTINUED) | December 30, 2007 | December 31, 2006 | December 31, 2009 | December 31, 2008 | ||||||
| $ | $ | |||||||||
Segment assets | ||||||||||
Papers | $ | 6,888 | $ | 3,933 | 5,538 | 5,399 | ||||
Paper Merchants | 108 | — | 101 | 120 | ||||||
Wood | 320 | 65 | 250 | 247 | ||||||
Total for reportable segments | 7,316 | 3,998 | 5,889 | 5,766 | ||||||
Corporate | 432 | — | 630 | 338 | ||||||
Consolidated assets | $ | 7,748 | $ | 3,998 | 6,519 | 6,104 | ||||
| Year ended December 31, 2009 | Year ended December 31, 2008 | Year ended December 30, 2007 | |||||||||||||||
| Year ended December 30, 2007 | Year ended December 31, 2006 | Year ended December 25, 2005 | $ | $ | $ | ||||||||||||
Additions to property, plant and equipment | |||||||||||||||||
Papers | $ | 92 | $ | 64 | $ | 108 | 93 | 130 | 92 | ||||||||
Paper Merchants | 2 | — | — | 1 | 2 | 2 | |||||||||||
Wood | 4 | — | 5 | 4 | 7 | 4 | |||||||||||
Total for reportable segments | 98 | 64 | 113 | 98 | 139 | 98 | |||||||||||
Corporate | 25 | — | — | 8 | 18 | 25 | |||||||||||
Consolidated additions to property, plant and equipment | 123 | 64 | 113 | 106 | 157 | 123 | |||||||||||
Add: Change in payables on capital projects | (7 | ) | — | — | — | 6 | (7 | ) | |||||||||
Consolidated additions to property, plant and equipment per Consolidated cash flows | $ | 116 | $ | 64 | $ | 113 | |||||||||||
Consolidated additions to property, plant and equipment per Consolidated Statements of Cash Flows | 106 | 163 | 116 | ||||||||||||||
Geographic information | |||||||||||||||||
Sales | |||||||||||||||||
United States | $ | 4,841 | $ | 2,791 | $ | 2,663 | |||||||||||
Canada | 742 | 515 | 559 | ||||||||||||||
Other foreign countries | 364 | — | 45 | ||||||||||||||
| $ | 5,947 | $ | 3,306 | $ | 3,267 | ||||||||||||
| Year ended December 31, 2009 | Year ended December 31, 2008 | Year ended December 30, 2007 | ||||||||||
| December 30, 2007 | December 31, 2006 | $ | $ | $ | ||||||||
Property, plant and equipment and goodwill | ||||||||||||
Geographic information | ||||||||||||
Sales | ||||||||||||
United States | 4,139 | 5,012 | 4,841 | |||||||||
Canada | 789 | 832 | 742 | |||||||||
Other foreign countries | 537 | 550 | 364 | |||||||||
| 5,465 | 6,394 | 5,947 | ||||||||||
| December 31, 2009 | December 31, 2008 | |||||||||||
| $ | $ | |||||||||||
Property, plant and equipment | ||||||||||||
United States | $ | 3,760 | $ | 2,324 | 2,799 | 3,073 | ||||||
Canada | 1,974 | 755 | 1,330 | 1,228 | ||||||||
| $ | 5,734 | $ | 3,079 | 4,129 | 4,301 | |||||||
127153
NOTES TO CONSOLIDATED FINANCIAL STATEMENTS
DECEMBER 30, 200731, 2009
(IN MILLIONS OF US DOLLARS, UNLESS OTHERWISE NOTED)
NOTE 25.
SALE OF WOOD BUSINESS
On January 7, 2008, Domtar announced that Domtar Inc. and Conifex Inc. have terminated the agreement announced June 22, 2007, relating to the sale of Domtar Inc.’s forest products business. Conifex was to acquire sawmills and other forest operations situated in Ontario and Quebec. Both parties recognized that closing conditions had not been met pursuant to the terms of the agreement.
Domtar intends to continue to seek opportunities to maximize the value of these assets as well as pursue initiatives to improve their operational efficiency.
NOTE 26.
CONDENSED CONSOLIDATING FINANCIAL INFORMATION
The following information is presented as required under Rule 3.103-10 of Regulation S-X, in connection with the Company’s issuance of debt securities in exchange for outstanding debt securities of Domtar Inc, a wholly-owned100% owned subsidiary of the Company. Pursuant to this exchange transaction, the securities that were issued (the “Guaranteed Debt”) were fully and unconditionally guaranteed by Domtar Paper Company, LLC, a wholly-owned100% owned subsidiary of the Company (“Guarantor Subsidiary”) and the successor to the Weyerhaeuser Fine Paper Business U.S. Operations.Operations, Domtar Industries Inc. (and subsidiaries, excluding Domtar Funding LLC), Ris Paper Company Inc., Domtar A.W., LLC (and subsidiary) and Domtar Maine LLC (and subsidiary) all 100% owned subsidiaries of the Company (“Guarantor Subsidiaries”), on a joint and several basis. The Guaranteed Debt will not be guaranteed by the Guarantor Subsidiary’scertain of Domtar Paper Company LLC’s own wholly-owned100% owned subsidiaries; namelyincluding Domtar Delaware Investments Inc,Inc., Domtar Delaware Holdings Inc andInc., Domtar Delaware Holdings LLC, (and subsidiaries including Domtar Inc.) and Domtar Pulp & Paper Products Inc. (collectively the “Non-Guarantor Subsidiaries” and the successor to the Weyerhaeuser Fine Paper Business Canadian Operations)).
128154
NOTES TO CONSOLIDATED FINANCIAL STATEMENTS
DECEMBER 30, 200731, 2009
(IN MILLIONS OF US DOLLARS, UNLESS OTHERWISE NOTED)
The following supplemental condensed consolidating financial information sets forth, on an unconsolidated basis, the balance sheetsBalance Sheets at December 30, 200731, 2009 and December 31, 20062008 and the statementsStatements of earnings (loss)Earnings (Loss), and cash flowsCash Flows for the years ended December 30, 2007,31, 2009, December 31, 20062008 and December 25, 200530, 2007 for Domtar Corporation (the “Parent Company”), and on a combined basis for the Guarantor SubsidiarySubsidiaries and, on a combined basis, the Non-Guarantor Subsidiaries. The supplemental condensed consolidating financial information reflects for 2007 fiscal periods, the investments of the Parent Company in the Guarantor SubsidiarySubsidiaries, as well as the investments of the Guarantor SubsidiarySubsidiaries in the Non-Guarantor Subsidiaries, in both cases using the equity method. The Parent Company’s purchase price allocation adjustments, including applicable intangible assets, arising from the business acquisition in Note 3 have been pushed down to the applicable subsidiary columns.
| Year ended December 31, 2009 | ||||||||||||||||||||||||||||||||||
CONDENSED CONSOLIDATING STATEMENT OF EARNINGS (LOSS) | Year ended December 30, 2007 | Parent | Guarantor Subsidiaries | Non- Guarantor Subsidiaries | Consolidating Adjustments | Consolidated | ||||||||||||||||||||||||||||
| Parent | Guarantor Subsidiary | Non- Guarantor Subsidiaries | Consolidating Adjustments | Consolidated | ||||||||||||||||||||||||||||||
| $ | $ | $ | $ | $ | ||||||||||||||||||||||||||||||
Sales | $ | — | $ | 3,214 | $ | 2,925 | $ | (192 | ) | $ | 5,947 | — | 4,504 | 1,684 | (723 | ) | 5,465 | |||||||||||||||||
Operating expenses | ||||||||||||||||||||||||||||||||||
Cost of sales, excluding depreciation and amortization | — | 2,589 | 2,360 | (192 | ) | 4,757 | — | 3,659 | 1,536 | (723 | ) | 4,472 | ||||||||||||||||||||||
Depreciation and amortization | — | 227 | 244 | — | 471 | — | 299 | 106 | — | 405 | ||||||||||||||||||||||||
Selling, general and administrative | 16 | 196 | 196 | — | 408 | 30 | 241 | 74 | — | 345 | ||||||||||||||||||||||||
Impairment of property, plant and equipment | — | — | 92 | — | 92 | |||||||||||||||||||||||||||||
Impairment of goodwill | — | — | 4 | — | 4 | |||||||||||||||||||||||||||||
Impairment and write-down of property, plant and equipment | — | 48 | 14 | — | 62 | |||||||||||||||||||||||||||||
Closure and restructuring costs | — | — | 14 | — | 14 | — | 31 | 32 | — | 63 | ||||||||||||||||||||||||
Other operating expenses (income) | (2 | ) | 6 | (73 | ) | — | (69 | ) | ||||||||||||||||||||||||||
Other operating loss (income) | (143 | ) | (487 | ) | (11 | ) | 144 | (497 | ) | |||||||||||||||||||||||||
| 14 | 3,018 | 2,837 | (192 | ) | 5,677 | (113 | ) | 3,791 | 1,751 | (579 | ) | 4,850 | ||||||||||||||||||||||
Operating income (loss) | (14 | ) | 196 | 88 | — | 270 | 113 | 713 | (67 | ) | (144 | ) | 615 | |||||||||||||||||||||
Interest expense | 66 | 43 | 62 | — | 171 | |||||||||||||||||||||||||||||
Interest expense (income) | 122 | 47 | (44 | ) | — | 125 | ||||||||||||||||||||||||||||
Earnings (loss) before income taxes | (80 | ) | 153 | 26 | — | 99 | (9 | ) | 666 | (23 | ) | (144 | ) | 490 | ||||||||||||||||||||
Income tax expense (benefit) | (33 | ) | 49 | 13 | — | 29 | ||||||||||||||||||||||||||||
Share in earnings of equity accounted investees | 117 | 13 | — | (130 | ) | — | ||||||||||||||||||||||||||||
Income tax expense | 28 | 152 | — | — | 180 | |||||||||||||||||||||||||||||
Share in earnings (loss) of equity accounted investees | 491 | (23 | ) | — | (468 | ) | — | |||||||||||||||||||||||||||
Net earnings (loss) | $ | 70 | $ | 117 | $ | 13 | $ | (130 | ) | $ | 70 | 454 | 491 | (23 | ) | (612 | ) | 310 | ||||||||||||||||
129155
NOTES TO CONSOLIDATED FINANCIAL STATEMENTS
DECEMBER 30, 200731, 2009
(IN MILLIONS OF US DOLLARS, UNLESS OTHERWISE NOTED)
| Year ended December 31, 2006 | Year ended December 31, 2008 | ||||||||||||||||||||||||||||||
CONDENSED CONSOLIDATING STATEMENT OF EARNINGS (LOSS) | Guarantor Subsidiary | Non- Guarantor Subsidiaries | Consolidating Adjustments | Consolidated | Parent | Guarantor Subsidiaries | Non- Guarantor Subsidiaries | Consolidating Adjustments | Consolidated | ||||||||||||||||||||||
| $ | $ | $ | $ | $ | |||||||||||||||||||||||||||
Sales | $ | 2,656 | $ | 978 | $ | (328 | ) | $ | 3,306 | — | 5,138 | 2,421 | (1,165 | ) | 6,394 | ||||||||||||||||
Operating expenses | |||||||||||||||||||||||||||||||
Cost of sales, excluding depreciation and amortization | 2,095 | 904 | (323 | ) | 2,676 | — | 4,175 | 2,215 | (1,165 | ) | 5,225 | ||||||||||||||||||||
Depreciation and amortization | 232 | 79 | — | 311 | — | 311 | 152 | — | 463 | ||||||||||||||||||||||
Selling, general and administrative | 144 | 30 | — | 174 | 57 | 289 | 54 | — | 400 | ||||||||||||||||||||||
Impairment of goodwill | 749 | — | — | 749 | |||||||||||||||||||||||||||
Impairment and write-down of property, plant and equipment | — | 96 | 287 | — | 383 | ||||||||||||||||||||||||||
Impairment of goodwill and intangible assets | — | 85 | 240 | — | 325 | ||||||||||||||||||||||||||
Closure and restructuring costs | 1 | 14 | — | 15 | — | 2 | 41 | — | 43 | ||||||||||||||||||||||
Other operating expenses (income) | 5 | (68 | ) | — | (63 | ) | |||||||||||||||||||||||||
Other operating income | — | (4 | ) | (4 | ) | — | (8 | ) | |||||||||||||||||||||||
| 3,226 | 959 | (323 | ) | 3,862 | 57 | 4,954 | 2,985 | (1,165 | ) | 6,831 | |||||||||||||||||||||
Operating income (loss) | (570 | ) | 19 | (5 | ) | (556 | ) | (57 | ) | 184 | (564 | ) | — | (437 | ) | ||||||||||||||||
Interest expense (income) | 126 | (194 | ) | 201 | — | 133 | |||||||||||||||||||||||||
Earnings (loss) before income taxes | (570 | ) | 19 | (5 | ) | (556 | ) | (183 | ) | 378 | (765 | ) | — | (570 | ) | ||||||||||||||||
Income tax expense | 50 | 3 | — | 53 | |||||||||||||||||||||||||||
Income tax expense (benefit) | (59 | ) | 77 | (15 | ) | — | 3 | ||||||||||||||||||||||||
Share in earnings (loss) of equity accounted investees | (449 | ) | (750 | ) | — | 1,199 | — | ||||||||||||||||||||||||
Net earnings (loss) | $ | (620 | ) | $ | 16 | $ | (5 | ) | $ | (609 | ) | (573 | ) | (449 | ) | (750 | ) | 1,199 | (573 | ) | |||||||||||
| Year ended December 25, 2005 | |||||||||||||||||||||||||||||||
CONDENSED CONSOLIDATING STATEMENT OF EARNINGS (LOSS) | Guarantor Subsidiary | Non- Guarantor Subsidiaries | Consolidating Adjustments | Consolidated | |||||||||||||||||||||||||||
Sales | $ | 2,570 | $ | 1,078 | $ | (381 | ) | $ | 3,267 | ||||||||||||||||||||||
Operating expenses | |||||||||||||||||||||||||||||||
Cost of sales, excluding depreciation and amortization | 2,106 | 1,061 | (383 | ) | 2,784 | ||||||||||||||||||||||||||
Depreciation and amortization | 235 | 122 | — | 357 | |||||||||||||||||||||||||||
Selling, general and administrative | 150 | 24 | — | 174 | |||||||||||||||||||||||||||
Impairment of property, plant and equipment | — | 499 | — | 499 | |||||||||||||||||||||||||||
Impairment of goodwill | — | 1 | — | 1 | |||||||||||||||||||||||||||
Closure and restructuring costs | 1 | 37 | — | 38 | |||||||||||||||||||||||||||
Other operating expenses (income) | 2 | (10 | ) | — | (8 | ) | |||||||||||||||||||||||||
| 2,494 | 1,734 | (383 | ) | 3,845 | |||||||||||||||||||||||||||
Operating income (loss) | 76 | (656 | ) | 2 | (578 | ) | |||||||||||||||||||||||||
Earnings (loss) before income taxes | 76 | (656 | ) | 2 | (578 | ) | |||||||||||||||||||||||||
Income tax benefit | (5 | ) | (95 | ) | — | (100 | ) | ||||||||||||||||||||||||
Net earnings (loss) | $ | 81 | $ | (561 | ) | $ | 2 | $ | (478 | ) | |||||||||||||||||||||
130156
NOTES TO CONSOLIDATED FINANCIAL STATEMENTS
DECEMBER 30, 200731, 2009
(IN MILLIONS OF US DOLLARS, UNLESS OTHERWISE NOTED)
CONDENSED CONSOLIDATING BALANCE SHEET | December 30, 2007 | ||||||||||||||||||
| Parent | Guarantor Subsidiary | Non- Guarantor Subsidiaries | Consolidating Adjustments | Consolidated | |||||||||||||||
Assets | |||||||||||||||||||
Current assets | |||||||||||||||||||
Cash and cash equivalents | $ | 9 | $ | 22 | $ | 40 | $ | — | $ | 71 | |||||||||
Receivables | — | 332 | 210 | — | 542 | ||||||||||||||
Inventories | — | 404 | 532 | — | 936 | ||||||||||||||
Prepaid expenses | — | 3 | 11 | — | 14 | ||||||||||||||
Income and other taxes receivable | — | 36 | 17 | — | 53 | ||||||||||||||
Intercompany accounts | — | 427 | 578 | (1,005 | ) | — | |||||||||||||
Deferred income taxes | 5 | 21 | 156 | — | 182 | ||||||||||||||
Total current assets | 14 | 1,245 | 1,544 | (1,005 | ) | 1,798 | |||||||||||||
Property, plant and equipment, at cost | — | 4,188 | 5,497 | — | 9,685 | ||||||||||||||
Accumulated depreciation | — | (2,139 | ) | (2,184 | ) | — | (4,323 | ) | |||||||||||
Net property, plant and equipment | — | 2,049 | 3,313 | — | 5,362 | ||||||||||||||
Goodwill | — | — | 372 | — | 372 | ||||||||||||||
Intangible assets, net of amortization | — | — | 111 | — | 111 | ||||||||||||||
Investments in affiliates | 5,465 | 1,881 | 15 | (7,361 | ) | — | |||||||||||||
Intercompany advances | 2 | 450 | 659 | (1,111 | ) | — | |||||||||||||
Other assets | 23 | — | 82 | — | 105 | ||||||||||||||
Total assets | 5,504 | 5,625 | 6,096 | (9,477 | ) | 7,748 | |||||||||||||
Liabilities and shareholders’ equity | |||||||||||||||||||
Current liabilities | |||||||||||||||||||
Bank indebtedness | — | 32 | 31 | — | 63 | ||||||||||||||
Trade and other payables | 15 | 251 | 499 | — | 765 | ||||||||||||||
Intercompany accounts | 403 | 175 | 427 | (1,005 | ) | — | |||||||||||||
Income and other taxes payable | — | — | 50 | — | 50 | ||||||||||||||
Long-term debt due within one year | 8 | 5 | 4 | — | 17 | ||||||||||||||
Total current liabilities | 426 | 463 | 1,011 | (1,005 | ) | 895 | |||||||||||||
Long-term debt | 2,173 | 24 | 16 | — | 2,213 | ||||||||||||||
Intercompany long-term loans | — | 1,111 | — | (1,111 | ) | — | |||||||||||||
Deferred income taxes | — | 620 | 383 | — | 1,003 | ||||||||||||||
Other liabilities and deferred credits | 1 | 59 | 380 | — | 440 | ||||||||||||||
Shareholders’ equity | 2,904 | 3,348 | 4,306 | (7,361 | ) | 3,197 | |||||||||||||
Total liabilities and shareholders’ equity | $ | 5,504 | $ | 5,625 | $ | 6,096 | $ | (9,477 | ) | $ | 7,748 | ||||||||
| Year ended December 30, 2007 | |||||||||||||||
CONDENSED CONSOLIDATING | Parent | Guarantor Subsidiaries | Non- Guarantor Subsidiaries | Consolidating Adjustments | Consolidated | ||||||||||
| $ | $ | $ | $ | $ | |||||||||||
Sales | — | 4,921 | 1,929 | (903 | ) | 5,947 | |||||||||
Operating expenses | |||||||||||||||
Cost of sales, excluding depreciation and amortization | — | 3,969 | 1,691 | (903 | ) | 4,757 | |||||||||
Depreciation and amortization | — | 324 | 147 | — | 471 | ||||||||||
Selling, general and administrative | 16 | 302 | 90 | — | 408 | ||||||||||
Impairment of property, plant and equipment | — | — | 92 | — | 92 | ||||||||||
Impairment of goodwill | — | — | 4 | — | 4 | ||||||||||
Closure and restructuring costs | — | — | 14 | — | 14 | ||||||||||
Other operating income | (2 | ) | (67 | ) | — | — | (69 | ) | |||||||
| 14 | 4,528 | 2,038 | (903 | ) | 5,677 | ||||||||||
Operating income (loss) | (14 | ) | 393 | (109 | ) | — | 270 | ||||||||
Interest expense | 66 | 49 | 56 | — | 171 | ||||||||||
Earnings (loss) before income taxes | (80 | ) | 344 | (165 | ) | — | 99 | ||||||||
Income tax expense (benefit) | (33 | ) | 114 | (52 | ) | — | 29 | ||||||||
Share in earnings (loss) of equity accounted investees | 117 | (113 | ) | — | (4 | ) | — | ||||||||
Net earnings (loss) | 70 | 117 | (113 | ) | (4 | ) | 70 | ||||||||
131157
NOTES TO CONSOLIDATED FINANCIAL STATEMENTS
DECEMBER 30, 200731, 2009
(IN MILLIONS OF US DOLLARS, UNLESS OTHERWISE NOTED)
| December 31, 2009 | ||||||||||||||||||||||||||||||
CONDENSED CONSOLIDATING BALANCE SHEET | December 31, 2006 | Parent | Guarantor Subsidiaries | Non- Guarantor Subsidiaries | Consolidating Adjustments | Consolidated | ||||||||||||||||||||||||
| Guarantor Subsidiary | Non- Guarantor Subsidiaries | Consolidating Adjustments | Consolidated | |||||||||||||||||||||||||||
| $ | $ | $ | $ | $ | ||||||||||||||||||||||||||
Assets | ||||||||||||||||||||||||||||||
Current assets | ||||||||||||||||||||||||||||||
Cash and cash equivalents | $ | — | $ | 1 | $ | — | $ | 1 | 237 | 83 | 4 | — | 324 | |||||||||||||||||
Receivables | 300 | 40 | — | 340 | — | 469 | 67 | — | 536 | |||||||||||||||||||||
Inventories | 428 | 102 | (10 | ) | 520 | — | 446 | 299 | — | 745 | ||||||||||||||||||||
Prepaid expenses | 3 | 3 | — | 6 | 5 | 8 | 33 | — | 46 | |||||||||||||||||||||
Income and other taxes receivable | — | 453 | 23 | (62 | ) | 414 | ||||||||||||||||||||||||
Intercompany accounts | 205 | 1,808 | 179 | (2,192 | ) | — | ||||||||||||||||||||||||
Deferred income taxes | 21 | 1 | — | 22 | 1 | 136 | — | — | 137 | |||||||||||||||||||||
Total current assets | 752 | 147 | (10 | ) | 889 | 448 | 3,403 | 605 | (2,254 | ) | 2,202 | |||||||||||||||||||
Property, plant and equipment, at cost | 4,233 | 2,463 | — | 6,696 | — | 5,733 | 3,842 | — | 9,575 | |||||||||||||||||||||
Accumulated depreciation | (1,916 | ) | (1,715 | ) | — | (3,631 | ) | — | (2,932 | ) | (2,514 | ) | — | (5,446 | ) | |||||||||||||||
Net property, plant and equipment | 2,317 | 748 | — | 3,065 | — | 2,801 | 1,328 | — | 4,129 | |||||||||||||||||||||
Goodwill | 11 | 3 | — | 14 | ||||||||||||||||||||||||||
Intangible assets, net of amortization | — | 4 | 81 | — | 85 | |||||||||||||||||||||||||
Investments in affiliates | 5,753 | 1,321 | 25 | (7,099 | ) | — | ||||||||||||||||||||||||
Intercompany advances | 7 | 80 | 600 | (687 | ) | — | ||||||||||||||||||||||||
Other assets | — | 30 | — | 30 | 24 | 24 | 55 | — | 103 | |||||||||||||||||||||
Total assets | 3,080 | 928 | (10 | ) | 3,998 | 6,232 | 7,633 | 2,694 | (10,040 | ) | 6,519 | |||||||||||||||||||
Liabilities and shareholders’ equity | ||||||||||||||||||||||||||||||
Current liabilities | ||||||||||||||||||||||||||||||
Bank indebtedness | — | 27 | 16 | — | 43 | |||||||||||||||||||||||||
Trade and other payables | 191 | 59 | — | 250 | 33 | 393 | 260 | — | 686 | |||||||||||||||||||||
Intercompany accounts | 1,806 | 266 | 120 | (2,192 | ) | — | ||||||||||||||||||||||||
Income and other taxes payable | — | 6 | — | 6 | 43 | 31 | 19 | (62 | ) | 31 | ||||||||||||||||||||
Long-term debt due within one year | 6 | 6 | — | 12 | 8 | 3 | — | — | 11 | |||||||||||||||||||||
| �� | ||||||||||||||||||||||||||||||
Total current liabilities | 197 | 71 | — | 268 | 1,890 | 720 | 415 | (2,254 | ) | 771 | ||||||||||||||||||||
Long-term debt | 32 | — | — | 32 | 1,678 | 11 | 12 | — | 1,701 | |||||||||||||||||||||
Deferred income taxes | 698 | 60 | — | 758 | ||||||||||||||||||||||||||
Intercompany long-term loans | 80 | 606 | 1 | (687 | ) | — | ||||||||||||||||||||||||
Deferred income taxes and other | — | 999 | 20 | — | 1,019 | |||||||||||||||||||||||||
Other liabilities and deferred credits | 13 | 12 | — | 25 | — | 111 | 255 | — | 366 | |||||||||||||||||||||
Shareholders’ equity | 2,140 | 785 | (10 | ) | 2,915 | 2,584 | 5,186 | 1,991 | (7,099 | ) | 2,662 | |||||||||||||||||||
Total liabilities and shareholders’ equity | $ | 3,080 | $ | 928 | $ | (10 | ) | $ | 3,998 | 6,232 | 7,633 | 2,694 | (10,040 | ) | 6,519 | |||||||||||||||
132158
NOTES TO CONSOLIDATED FINANCIAL STATEMENTS
DECEMBER 30, 200731, 2009
(IN MILLIONS OF US DOLLARS, UNLESS OTHERWISE NOTED)
CONDENSED CONSOLIDATING STATEMENT OF | Year ended December 30, 2007 | |||||||||||||||||||
| Parent | Guarantor Subsidiary | Non- Guarantor Subsidiaries | Consolidating Adjustments | Consolidated | ||||||||||||||||
Operating activities | ||||||||||||||||||||
Net earnings (loss) | $ | 70 | $ | 117 | $ | 13 | $ | (130 | ) | $ | 70 | |||||||||
Changes in operating and intercompany assets and liabilities and non cash items, included in net earnings (loss) | 274 | (54 | ) | 186 | 130 | 536 | ||||||||||||||
Cash flows provided from (used for) operating activities | 344 | 63 | 199 | — | 606 | |||||||||||||||
Investing activities | ||||||||||||||||||||
Additions to property, plant and equipment | — | (14 | ) | (102 | ) | — | (116 | ) | ||||||||||||
Proceeds from disposals of property, plant and equipment | — | — | 29 | — | 29 | |||||||||||||||
Business acquisitions—cash acquired | — | — | 573 | — | 573 | |||||||||||||||
Increase in long-term advances to related parties | — | (663 | ) | (604 | ) | — | (1,267 | ) | ||||||||||||
Decrease in long-term advances to related parties | 663 | 604 | — | — | 1,267 | |||||||||||||||
Other | — | — | (1 | ) | — | (1 | ) | |||||||||||||
Cash flows provided from (used for) investing activities | 663 | (73 | ) | (105 | ) | — | 485 | |||||||||||||
Financing activities | ||||||||||||||||||||
Net change in bank indebtedness | — | 32 | (53 | ) | — | (21 | ) | |||||||||||||
Drawdown of revolving bank credit | 50 | — | — | — | 50 | |||||||||||||||
Issuance of short-term debt | 1,350 | — | — | — | 1,350 | |||||||||||||||
Issuance of long-term debt | 800 | — | — | — | 800 | |||||||||||||||
Repayment of short-term debt | (1,350 | ) | — | — | — | (1,350 | ) | |||||||||||||
Repayment of long-term debt | (310 | ) | — | (1 | ) | — | (311 | ) | ||||||||||||
Debt issue costs | (39 | ) | — | — | — | (39 | ) | |||||||||||||
Premium on redemption of long-term debt | (40 | ) | — | — | — | (40 | ) | |||||||||||||
Repurchase of minority interest | (28 | ) | — | — | — | (28 | ) | |||||||||||||
Distribution to Weyerhaeuser prior to March 7, 2007 | (1,431 | ) | — | — | — | (1,431 | ) | |||||||||||||
Other | — | — | (5 | ) | — | (5 | ) | |||||||||||||
Cash flows provided from (used for) financing activities | (998 | ) | 32 | (59 | ) | — | (1,025 | ) | ||||||||||||
Net increase in cash and cash equivalents | 9 | 22 | 35 | — | 66 | |||||||||||||||
Translation adjustments related to cash and cash equivalents | — | — | 4 | — | 4 | |||||||||||||||
Cash and cash equivalents at beginning of period | — | — | 1 | — | 1 | |||||||||||||||
Cash and cash equivalents at end of period | $ | 9 | $ | 22 | $ | 40 | $ | — | $ | 71 | ||||||||||
| December 31, 2008 | ||||||||||||||
CONDENSED CONSOLIDATING BALANCE SHEET | Parent | Guarantor Subsidiaries | Non- Guarantor Subsidiaries | Consolidating Adjustments | Consolidated | |||||||||
| $ | $ | $ | $ | $ | ||||||||||
Assets | ||||||||||||||
Current assets | ||||||||||||||
Cash and cash equivalents | — | 14 | 2 | — | 16 | |||||||||
Receivables | — | 409 | 68 | — | 477 | |||||||||
Inventories | — | 658 | 305 | — | 963 | |||||||||
Prepaid expenses | 2 | 3 | 22 | — | 27 | |||||||||
Income and other taxes receivable | 96 | — | 9 | (49 | ) | 56 | ||||||||
Intercompany accounts | 9 | 543 | 524 | (1,076 | ) | — | ||||||||
Deferred income taxes | 5 | 111 | — | — | 116 | |||||||||
Total current assets | 112 | 1,738 | 930 | (1,125 | ) | 1,655 | ||||||||
Property, plant and equipment, at cost | — | 5,712 | 3,251 | — | 8,963 | |||||||||
Accumulated depreciation | — | (2,612 | ) | (2,050 | ) | — | (4,662 | ) | ||||||
Net property, plant and equipment | — | 3,100 | 1,201 | — | 4,301 | |||||||||
Intangible assets, net of amortization | — | — | 81 | — | 81 | |||||||||
Investments in affiliates | 4,614 | 1,372 | 26 | (6,012 | ) | — | ||||||||
Intercompany advances | 2 | — | 600 | (602 | ) | — | ||||||||
Other assets | 38 | 16 | 13 | — | 67 | |||||||||
Total assets | 4,766 | 6,226 | 2,851 | (7,739 | ) | 6,104 | ||||||||
Liabilities and shareholders’ equity | ||||||||||||||
Current liabilities | ||||||||||||||
Bank indebtedness | — | 25 | 18 | — | 43 | |||||||||
Trade and other payables | 31 | 312 | 303 | — | 646 | |||||||||
Intercompany accounts | 636 | — | 440 | (1,076 | ) | — | ||||||||
Income and other taxes payable | — | 85 | — | (49 | ) | 36 | ||||||||
Long-term debt due within one year | 9 | 6 | 3 | — | 18 | |||||||||
Total current liabilities | 676 | 428 | 764 | (1,125 | ) | 743 | ||||||||
Long-term debt | 2,085 | 14 | 11 | — | 2,110 | |||||||||
Intercompany long-term loans | — | 602 | — | (602 | ) | — | ||||||||
Deferred income taxes and other | — | 821 | 3 | — | 824 | |||||||||
Other liabilities and deferred credits | — | 62 | 222 | — | 284 | |||||||||
Shareholders’ equity | 2,005 | 4,299 | 1,851 | (6,012 | ) | 2,143 | ||||||||
Total liabilities and shareholders’ equity | 4,766 | 6,226 | 2,851 | (7,739 | ) | 6,104 | ||||||||
| �� | ||||||||||||||
133159
NOTES TO CONSOLIDATED FINANCIAL STATEMENTS
DECEMBER 30, 200731, 2009
(IN MILLIONS OF US DOLLARS, UNLESS OTHERWISE NOTED)
CONDENSED CONSOLIDATING STATEMENT OF CASH FLOWS | Year ended December 31, 2006 | ||||||||||||||||||||||||||||||
| Guarantor Subsidiary | Non- Guarantor Subsidiaries | Consolidating Adjustments | Consolidated | ||||||||||||||||||||||||||||
Operating activities | |||||||||||||||||||||||||||||||
Net earnings (loss) | $ | (620 | ) | $ | 16 | $ | (5) | $ | (609 | ) | |||||||||||||||||||||
Changes in operating and intercompany assets and liabilities and non cash items, included in net earnings (loss) | 892 | 69 | 5 | 966 | |||||||||||||||||||||||||||
Cash flows provided from operating activities | 272 | 85 | — | 357 | |||||||||||||||||||||||||||
Investing activities | |||||||||||||||||||||||||||||||
Additions to property, plant and equipment | (50 | ) | (14 | ) | — | (64 | ) | ||||||||||||||||||||||||
Proceeds from disposals of property, plant and equipment | 1 | — | — | 1 | |||||||||||||||||||||||||||
Cash flows used for investing activities | (49 | ) | (14 | ) | — | (63 | ) | ||||||||||||||||||||||||
Financing activities | |||||||||||||||||||||||||||||||
Distribution to Weyerhaeuser | (218 | ) | (69 | ) | — | (287 | ) | ||||||||||||||||||||||||
Debt and capital lease payments | (5 | ) | (2 | ) | — | (7 | ) | ||||||||||||||||||||||||
Cash flows used for financing activities | (223 | ) | (71 | ) | — | (294 | ) | ||||||||||||||||||||||||
Net decrease in cash and cash equivalents | — | — | — | — | |||||||||||||||||||||||||||
Cash and cash equivalents at beginning of year | — | 1 | — | 1 | |||||||||||||||||||||||||||
Cash and cash equivalents at end of year | $ | — | $ | 1 | $ | — | $ | 1 | |||||||||||||||||||||||
| Year ended December 31, 2009 | |||||||||||||||||||||||||||||||
CONDENSED CONSOLIDATING STATEMENT OF CASH FLOWS | Year ended December 25, 2005 | Parent | Guarantor Subsidiaries | Non- Guarantor Subsidiaries | Consolidating Adjustments | Consolidated | |||||||||||||||||||||||||
| Guarantor Subsidiary | Non- Guarantor Subsidiaries | Consolidating Adjustments | Consolidated | ||||||||||||||||||||||||||||
| $ | $ | $ | $ | $ | |||||||||||||||||||||||||||
Operating activities | |||||||||||||||||||||||||||||||
Net earnings (loss) | $ | 81 | $ | (561 | ) | $ | 2 | $ | (478 | ) | 454 | 491 | (23 | ) | (612 | ) | 310 | ||||||||||||||
Changes in operating and intercompany assets and liabilities and non cash items, included in net earnings (loss) | 115 | 555 | (2 | ) | 668 | 498 | (736 | ) | 108 | 612 | 482 | ||||||||||||||||||||
Cash flows provided from (used for) operating activities | 196 | (6 | ) | — | 190 | 952 | (245 | ) | 85 | — | 792 | ||||||||||||||||||||
Investing activities | |||||||||||||||||||||||||||||||
Additions to property, plant and equipment | (71 | ) | (42 | ) | — | (113 | ) | — | (83 | ) | (23 | ) | — | (106 | ) | ||||||||||||||||
Proceeds from disposals of property, plant and equipment | 4 | — | — | 4 | — | 5 | 16 | — | 21 | ||||||||||||||||||||||
Increase in long-term advances to related parties | (309 | ) | — | (87 | ) | 396 | — | ||||||||||||||||||||||||
Decrease in long-term advances to related parties | — | 396 | — | (396 | ) | — | |||||||||||||||||||||||||
Cash flows used for investing activities | (67 | ) | (42 | ) | — | (109 | ) | ||||||||||||||||||||||||
Cash flows provided from (used for) investing activities | (309 | ) | 318 | (94 | ) | — | (85 | ) | |||||||||||||||||||||||
Financing activities | |||||||||||||||||||||||||||||||
Distribution to (from) Weyerhaeuser | (124 | ) | 48 | — | (76 | ) | |||||||||||||||||||||||||
Debt and capital lease payments | (5 | ) | (1 | ) | — | (6 | ) | ||||||||||||||||||||||||
Net change in bank indebtedness | — | 2 | (2 | ) | — | — | |||||||||||||||||||||||||
Change of revolving bank credit facility | (60 | ) | — | — | — | (60 | ) | ||||||||||||||||||||||||
Issuance of long-term debt | 385 | — | — | — | 385 | ||||||||||||||||||||||||||
Repayment of long-term debt | (717 | ) | (6 | ) | (2 | ) | — | (725 | ) | ||||||||||||||||||||||
Debt issue and tender offer costs | (14 | ) | — | — | — | (14 | ) | ||||||||||||||||||||||||
Cash flows provided from (used for) financing activities | (129 | ) | 47 | — | (82 | ) | |||||||||||||||||||||||||
Cash flows used for financing activities | (406 | ) | (4 | ) | (4 | ) | — | (414 | ) | ||||||||||||||||||||||
Net decrease in cash and cash equivalents | — | (1 | ) | — | (1 | ) | |||||||||||||||||||||||||
Net increase (decrease) in cash and cash equivalents | 237 | 69 | (13 | ) | — | 293 | |||||||||||||||||||||||||
Translation adjustments related to cash and cash equivalents | — | — | 15 | — | 15 | ||||||||||||||||||||||||||
Cash and cash equivalents at beginning of year | — | 2 | — | 2 | — | 14 | 2 | — | 16 | ||||||||||||||||||||||
Cash and cash equivalents at end of year | $ | — | $ | 1 | $ | — | $ | 1 | 237 | 83 | 4 | — | 324 | ||||||||||||||||||
134160
NOTES TO CONSOLIDATED FINANCIAL STATEMENTS
DECEMBER 31, 2009
(IN MILLIONS OF DOLLARS, UNLESS OTHERWISE NOTED)
| Year ended December 31, 2008 | |||||||||||||||
CONDENSED CONSOLIDATING STATEMENT OF | Parent | Guarantor Subsidiaries | Non- Guarantor Subsidiaries | Consolidating Adjustments | Consolidated | ||||||||||
| $ | $ | $ | $ | $ | |||||||||||
Operating activities | |||||||||||||||
Net earnings (loss) | (573 | ) | (449 | ) | (750 | ) | 1,199 | (573 | ) | ||||||
Changes in operating and intercompany assets and liabilities and non cash items, included in net earnings (loss) | 594 | 1,008 | 367 | (1,199 | ) | 770 | |||||||||
Cash flows provided from (used for) operating activities | 21 | 559 | (383 | ) | — | 197 | |||||||||
Investing activities | |||||||||||||||
Additions to property, plant and equipment | — | (99 | ) | (64 | ) | — | (163 | ) | |||||||
Proceeds from disposals of property, plant and equipment and sale of trademarks | — | 5 | 30 | — | 35 | ||||||||||
Business acquisition—Joint venture | — | — | (12 | ) | — | (12 | ) | ||||||||
Increase in long-term advances to related parties | — | (453 | ) | — | 453 | — | |||||||||
Decrease in long-term advances to related parties | 35 | — | 418 | (453 | ) | — | |||||||||
Cash flows provided from (used for) investing activities | 35 | (547 | ) | 372 | — | (140 | ) | ||||||||
Financing activities | |||||||||||||||
Net change in bank indebtedness | — | (33 | ) | 9 | — | (24 | ) | ||||||||
Change of revolving bank credit facility | 10 | — | — | — | 10 | ||||||||||
Repayment of long-term debt | (75 | ) | (18 | ) | (2 | ) | — | (95 | ) | ||||||
Cash flows provided from (used for) financing activities | (65 | ) | (51 | ) | 7 | — | (109 | ) | |||||||
Net decrease in cash and cash equivalents | (9 | ) | (39 | ) | (4 | ) | — | (52 | ) | ||||||
Translation adjustments related to cash and cash equivalents | — | — | (3 | ) | — | (3 | ) | ||||||||
Cash and cash equivalents at beginning of year | 9 | 53 | 9 | — | 71 | ||||||||||
Cash and cash equivalents at end of year | — | 14 | 2 | — | 16 | ||||||||||
161
2007 | 1st Quarter(a) | 2nd Quarter | 3rd Quarter | 4th Quarter | Year | ||||||||||||||
Sales | $ | 1,051 | $ | 1,583 | (b) | $ | 1,660 | $ | 1,653 | $ | 5,947 | ||||||||
Operating income | 71 | 69 | 123 | 7 | (c) | 270 | |||||||||||||
Earnings (loss) before income taxes | 60 | 22 | 75 | (58 | ) | 99 | |||||||||||||
Net earnings (loss) | 49 | 11 | 36 | (26 | ) | 70 | |||||||||||||
Basic net earnings (loss) per share | 0.14 | 0.02 | 0.07 | (0.05 | ) | 0.15 | |||||||||||||
Diluted net earnings (loss) per share | 0.14 | 0.02 | 0.07 | (0.05 | ) | 0.15 | |||||||||||||
Dividends per share | — | — | — | — | — | ||||||||||||||
2006 | 1st Quarter | 2nd Quarter | 3rd Quarter | 4th Quarter | Year | ||||||||||||||
Sales | $ | 829 | $ | 809 | $ | 795 | $ | 873 | $ | 3,306 | |||||||||
Operating income (loss) | (747 | ) (d) | (21 | ) | 69 | 143 | (556 | ) | |||||||||||
Earnings (loss) before income taxes | (747 | ) | (21 | ) | 69 | 143 | (556 | ) | |||||||||||
Net earnings (loss) | (747 | ) | (12 | ) | 48 | 102 | (609 | ) | |||||||||||
Basic net earnings (loss) per share | (2.63 | ) | (0.04 | ) | 0.17 | 0.36 | (2.14 | ) | |||||||||||
Diluted net earnings (loss) per share | (2.63 | ) | (0.04 | ) | 0.17 | 0.36 | (2.14 | ) | |||||||||||
Dividends per share | — | — | — | — | — | ||||||||||||||
NOTES TO CONSOLIDATED FINANCIAL STATEMENTS
DECEMBER 31, 2009
(IN MILLIONS OF DOLLARS, UNLESS OTHERWISE NOTED)
| Year ended December 31, 2007 | |||||||||||||||
CONDENSED CONSOLIDATING STATEMENT OF | Parent | Guarantor Subsidiaries | Non- Guarantor Subsidiaries | Consolidating Adjustments | Consolidated | ||||||||||
| $ | $ | $ | $ | $ | |||||||||||
Operating activities | |||||||||||||||
Net earnings (loss) | 70 | 117 | (113 | ) | (4 | ) | 70 | ||||||||
Changes in operating and intercompany assets and liabilities and non cash items, included in net earnings (loss) | 274 | (134 | ) | 392 | 4 | 536 | |||||||||
Cash flows provided from (used for) operating activities | 344 | (17 | ) | 279 | — | 606 | |||||||||
Investing activities | |||||||||||||||
Additions to property, plant and equipment | — | (53 | ) | (63 | ) | — | (116 | ) | |||||||
Proceeds from disposals of property, plant and equipment | — | 2 | 27 | — | 29 | ||||||||||
Business acquisition—cash acquired | — | 573 | — | — | 573 | ||||||||||
Increase in long-term advances to related parties | — | (451 | ) | (212 | ) | 663 | — | ||||||||
Decrease in long-term advances to related parties | 663 | — | — | (663 | ) | — | |||||||||
Other | — | — | (1 | ) | — | (1 | ) | ||||||||
Cash flows provided from (used for) investing activities | 663 | 71 | (249 | ) | — | 485 | |||||||||
Financing activities | |||||||||||||||
Net change in bank indebtedness | — | (1 | ) | (20 | ) | — | (21 | ) | |||||||
Drawdown on revolving bank credit facility | 50 | — | — | — | 50 | ||||||||||
Issuance of short-term debt | 1,350 | — | — | — | 1,350 | ||||||||||
Issuance of long-term debt | 800 | — | — | — | 800 | ||||||||||
Repayment of short-term debt | (1,350 | ) | — | — | — | (1,350 | ) | ||||||||
Repayment of long-term debt | (310 | ) | — | (1 | ) | — | (311 | ) | |||||||
Debt issue costs | (39 | ) | — | — | — | (39 | ) | ||||||||
Premium on redemption of long-term debt | (40 | ) | — | — | — | (40 | ) | ||||||||
Repurchase of minority interest | (28 | ) | — | — | — | (28 | ) | ||||||||
Distribution to Weyerhaeuser prior to March 7, 2007 | (1,431 | ) | — | — | — | (1,431 | ) | ||||||||
Other | — | — | (5 | ) | — | (5 | ) | ||||||||
Cash flows used for financing activities | (998 | ) | (1 | ) | (26 | ) | — | (1,025 | ) | ||||||
Net increase in cash and cash equivalents | 9 | 53 | 4 | — | 66 | ||||||||||
Translation adjustments related to cash and cash equivalents | — | — | 4 | — | 4 | ||||||||||
Cash and cash equivalents at beginning of year | — | — | 1 | — | 1 | ||||||||||
Cash and cash equivalents at end of year | 9 | 53 | 9 | — | 71 | ||||||||||
162
DOMTAR CORPORATION
INTERIM FINANCIAL RESULTS (UNAUDITED)
(IN MILLIONS OF DOLLARS, UNLESS OTHERWISE NOTED)
2009 | 1st Quarter | 2nd Quarter | 3rd Quarter | 4th Quarter | Year | |||||||||||||
Sales | $ | 1,302 | $ | 1,319 | $ | 1,440 | $ | 1,404 | $ | 5,465 | ||||||||
Operating income (loss) | (22 | )(a) | 139 | 295 | 203 | (b) | 615 | |||||||||||
Earnings (loss) before income taxes | (53 | ) | 116 | 261 | 166 | 490 | ||||||||||||
Net earnings (loss) | (45 | ) | 48 | 183 | 124 | 310 | ||||||||||||
Basic net earnings (loss) per share | (1.05 | ) | 1.12 | 4.26 | 2.88 | 7.21 | ||||||||||||
Diluted net earnings (loss) per share | (1.05 | ) | 1.12 | 4.24 | 2.86 | 7.18 | ||||||||||||
2008 | 1st Quarter | 2nd Quarter | 3rd Quarter | 4th Quarter | Year | |||||||||||||
Sales | $ | 1,665 | $ | 1,639 | $ | 1,625 | $ | 1,465 | $ | 6,394 | ||||||||
Operating income (loss) | 94 | 80 | 108 | (719 | )(c) | (437 | ) | |||||||||||
Earnings (loss) before income taxes | 55 | 43 | 73 | (741 | ) | (570 | ) | |||||||||||
Net earnings (loss) | 36 | 24 | 43 | (676 | ) | (573 | ) | |||||||||||
Basic net earnings (loss) per share | 0.84 | 0.56 | 1.00 | (15.72 | ) | (13.33 | ) | |||||||||||
Diluted net earnings (loss) per share | 0.84 | 0.56 | 1.00 | (15.72 | ) | (13.33 | ) | |||||||||||
| (a) | The |
| (b) | The |
| (c) | The operating income for the 4th quarter of |
135163
| ITEM 9. | CHANGES IN AND DISAGREEMENTS WITH ACCOUNTANTS ON ACCOUNTING AND FINANCIAL DISCLOSURE |
The Company has nothing to report under this item.
| ITEM 9A. | CONTROLS AND PROCEDURES |
This annual report does not include a report of management’s assessment regarding internal control over financial reporting or an attestation report of the company’s registered public accounting firm due to a transition period established by rules of the Securities and Exchange Commission for newly public companies.
Transition to New Public Company
As discussed in detail under the caption “The Transaction” in Note 1 of the financial statements (refer to Part II, Item 8), on March 7, 2007, we completed a transaction pursuant to which we became an independent public holding company that, directly or indirectly through our subsidiaries, owns both the Weyerhaeuser Fine Paper Business and Domtar Inc. In connection with the Transaction we entered into a Transition Services Agreement (“TSA”) with Weyerhaeuser to provide services to us relating to finance and administration, human resources and payroll, and information technology to enable us to manage an orderly transition in the operation of the Weyerhaeuser Fine Paper Business. Pursuant to the TSA, certain financial and accounting information used to complete our financial statements for fiscal year 2007, and the comparable period of 2006 was prepared by Weyerhaeuser based on Weyerhaeuser systems and controls.
There were many complexities arising from the Transaction that impacted the preparation of our financial information including the timing of the closing of the Transaction late in the first quarter and the related availability of the financial systems and related system conversion, and the allocation of the purchase price of Domtar Inc. to its assets and application of purchase accounting. In addition, in conjunction with the TSA with Weyerhaeuser, additional time was required to obtain certain key information and supporting documentation necessary to complete our review of all financial statement accounts. Our disclosure controls and procedures include extensive management and senior management review of all financial matters and disclosures before any public filing is made.
During the fourth quarter 2007, we completed the process of integrating the procedures and practices we inherited from Weyerhaeuser (with respect to the Weyerhaeuser Fine Paper Business) and from Domtar (with respect to the Domtar business) with respect to finance and administration previously under the TSA. Human resources and payroll procedures and practices previously under the TSA agreement were integrated in late December 2007. We expect to integrate the procedures and practices currently covered under the information technology portion of the TSA in the fourth quarter of 2008.
Evaluation of Disclosure Controls and Procedures
We maintain disclosure controls and procedures that are designed to ensureprovide reasonable assurance that information required to be disclosed in our reports under the Securities and Exchange Act of 1934, as amended (“Exchange Act”), is recorded, processed, summarized and reported within the time periods specified in the SEC’s rules and forms, and that such information is accumulated and communicated to management, including our Chief Executive Officer and Chief Financial Officer, as appropriate, to allow timely decisions regarding required disclosure. In connection with the preparationAs of this Annual Report on Form 10-K,December 31, 2009, an evaluation was performed as of December 30, 2007, by members of management, at the direction and with the participation of our Chief Executive Officer and Chief Financial Officer, of the effectiveness of the design and operation of our disclosure controls and procedures (as defined in Rule 13a-15(e) or 15d-15(e) under the Exchange Act). Based upon this evaluation, our Chief Executive Officer and Chief Financial Officer concluded that, as of December 30, 2007,31, 2009, our disclosure controls and procedures were effective at aeffective.
Management’s Report on Internal Control over Financial Reporting
Management is responsible for establishing and maintaining adequate internal control over financial reporting for the Company. In order to evaluate the effectiveness of internal control over financial reporting, management has conducted an assessment, including testing, using the criteria established in Internal Control – Integrated Framework, issued by the Committee of Sponsoring Organizations of the Treadway Commission (COSO). The Company’s system of internal control over financial reporting is designed to provide reasonable assurance level.regarding the reliability of financial reporting and the preparation of financial statements for external purposes in accordance with generally accepted accounting principles. The Company’s internal control over financial reporting includes those policies and procedures that (i) pertain to the maintenance of records that, in reasonable detail, accurately and fairly reflect the transactions and dispositions of the assets of the Company; (ii) provide reasonable assurance that transactions are recorded as necessary to permit preparation of financial statements in accordance with generally accepted accounting principles, and that receipts and expenditures of the Company are being made only in accordance with authorizations of management and directors of the Company; and (iii) provide reasonable assurance regarding prevention or timely detection of unauthorized acquisition, use, or disposition of the Company’s assets that could have a material effect on the financial statements.
Because of its inherent limitations, internal control over financial reporting may not prevent or detect misstatements. Also, projections of any evaluation of effectiveness to future periods are subject to the risk that controls may become inadequate because of changes in conditions, or that the degree of compliance with the policies or procedures may deteriorate.
Based on its assessment, management has concluded that the Company maintained effective internal control over financial reporting as of December 31, 2009, based on criteria established inInternal Control—Integrated Frameworkissued by the COSO.
The effectiveness of the Company’s internal control over financial reporting as of December 31, 2009 has been audited by PricewaterhouseCoopers LLP, an independent registered public accounting firm, as stated in their report, which is included under Part II, Item 8, Financial Statements and Supplementary Data.
136164
Previously Reported Material WeaknessesChange in Internal Control over Financial Reporting
A material weakness is a control deficiency, or combination of control deficiencies, that resultsThere were no changes in more than a remote likelihood that a material misstatement of the annual or interim financial statements will not be prevented or detected. Management identified the following material weaknesses as of April 1, 2007.
The Company did not maintain effective controls over the completeness and accuracy of financial information produced under the TSA with Weyerhaeuser. Specifically, the Company did not have controls designed and in place to ensure that financial data regarding the Weyerhaeuser Fine Paper Business was complete, accurate, produced on a timely basis and supported with appropriate documentation. Further, the Company did not maintain an appropriate accounting and financial reporting organizational structure, specifically relating to the depth of resources, to be able to ensure that the accounting records being maintained by Weyerhaeuser under the TSA were accurate and complete. The financial data produced under the TSA affects substantially all balance sheet and income statement accounts.
These control deficiencies resulted in adjustments to the April 1, 2007 interim financial statements and a delay in the filing of that Quarterly Report on Form 10-Q for our first quarter of 2007. These material weaknesses were remediated as of December 30, 2007.
Remediation of the Material Weaknesses
The Company has hired additional professional financial and accounting staff and engaged temporary professional resources to help review the accounting records prepared under the TSA as well as to help to integrate the procedures and practices. During the fourth quarter 2007, we completed the process of integrating the procedures and practices we inherited from Weyerhaeuser (with respect to the Weyerhaeuser Fine Paper Business) and from Domtar (with respect to the Domtar business) with respect to finance and administration previously under the TSA. Human resources and payroll procedures and practices previously under the TSA agreement were integrated in late December 2007. These changes have materially affected our internal control over financial reporting. reporting that have materially affected or are reasonably likely to materially affect our internal control over financial reporting during the period covered by this report.
We believe that we have controlsongoing initiatives to standardize and upgrade certain of our financial and operating systems. The system upgrades will be implemented in stages over the completeness and accuracy of financial information produced both undernext several years. Management believes the TSA and by the Corporation thatnecessary procedures are designed to be effective and that these controls have been in place for a sufficient period of time to demonstrate operating effectiveness.maintain effective internal control over financial reporting as these initiatives continue.
| ITEM 9B. | OTHER INFORMATION |
The Company has nothing to report under this item.
PART III
| ITEM 10. | DIRECTORS, EXECUTIVE OFFICERS AND CORPORATE GOVERNANCE |
The information included under the captions “Governance of the Corporation,” “Election of Directors” and “Section 16(a) Beneficial ownership reporting compliance”Ownership Reporting Compliance” in our Proxy Statement for the 20082010 Annual Meeting of Stockholders is incorporated herein by reference.
Information regarding our executive officers is presented in Part I, Item 1, Our Business, of this Form 10-K under the caption “Our Executive Officers.”
| ITEM 11. | EXECUTIVE COMPENSATION |
The information appearing under the caption “Compensation discussionDiscussion and analysis,Analysis,” “Executive Compensation” and “Director Compensation” in our Proxy Statement for the 20082010 Annual Meeting of Stockholders is incorporated herein by reference.
137
| ITEM 12. | SECURITY OWNERSHIP OF CERTAIN BENEFICIAL OWNERS AND MANAGEMENT AND RELATED STOCKHOLDER MATTERS |
The information appearing under the caption “Security ownershipOwnership of certain beneficial owners, directorsCertain Beneficial Owners, Directors and officers”Officers” in our Proxy Statement for the 20082010 Annual Meeting of Stockholders is incorporated herein by reference.
| ITEM 13. | CERTAIN RELATIONSHIPS AND RELATED TRANSACTIONS, AND DIRECTOR INDEPENDENCE |
The information appearing under the captions “Governance of the Corporation—Board Independence”Independence and “Governance of the Corporation—Certain relationships and related transactions”Other Determinations” in our Proxy Statement for the 20082010 Annual Meeting of Stockholders is incorporated herein by reference.
| ITEM 14. | PRINCIPLE ACCOUNTANT FEES AND SERVICES |
The information appearing under the caption “Ratification of appointmentAppointment of independent registered public accounting firm”Independent Registered Public Accounting Firm” and “Independent registered public accounting firm fees”Registered Public Accounting Firm Fees” in our Proxy Statement for the 20082010 Annual Meeting of Stockholders is incorporated herein by reference.
165
| ITEM 15. | EXHIBITS AND FINANCIAL STATEMENT SCHEDULES |
(a) 1. Financial Statements—See Item 8, Financial Statements and Supplementary Data.
| 2. | Schedule II—Valuation and Qualifying Accounts |
All other schedules are omitted as the information required is either included elsewhere in the consolidated financial statements in Item 8—8 – or is not applicableapplicable.
| 3. |
Exhibit | Exhibit Description | |
| 3.1 | Amended and Restated Certificate of Incorporation (incorporated by reference to Exhibit 3.1 to the Company’s Quarterly Report on Form 10-Q filed with the SEC on August 8, 2008) | |
| 3.2 | Certificate of Amendment of the Amended and Restated Certificate of Incorporation (incorporated by reference to Exhibit 3.1 to the Company’s Current Report on Form 8-K filed with the SEC on | |
| | Amended and Restated By-Laws (incorporated by reference to Exhibit 3.2 to the Company’s | |
| 4.1 | Form of Rights Agreement between the Company and Computershare Trust Company, N.A. (incorporated by reference to Exhibit 4.2 to the Company’s Registration Statement on Form 10, Amendment No. 2 filed with the SEC on January 26, 2007) | |
| 4.2 | Form of Indenture among Domtar Corp., Domtar Paper Company, LLC and The Bank of New York, as trustee, relating to Domtar Corp.’s (i) 7.125% Notes due 2015, (ii) 5.375% Notes due 2013, (iii) | |
| 4.3 | Supplemental Indenture, dated February 15, 2008, among Domtar Corp., Domtar Paper Company, LLC, The Bank of New York, as Trustee, and the new subsidiary guarantors parties thereto, relating to Domtar Corp.’s (i) 7.125% Notes due 2015, (ii) 5.375% Notes due 2013, (iii) | |
138
|
| |
| 4.4 | Second Supplemental Indenture, dated February 20, 2008, among Domtar Corp., Domtar Paper Company, LLC, The Bank of New York, as Trustee, and the new subsidiary guarantor party thereto, relating to Domtar Corp.’s (i) 7.125% Notes due 2015, (ii) 5.375% Notes due 2013, (iii) | |
| 4.5 | Third Supplement Indenture, dated June 9, 2009, among Domtar Corp., The Bank of New York Mellon, as Trustee, and the subsidiary guarantors party thereto, relating to Domtar Corp.’s 10.75% Senior Notes due 2017 (incorporated by reference to Exhibit 4.1 to the Company’s Current Report on Form 8-K filed with the SEC on June 9, 2009) | |
| 9.1 | Form of Voting and Exchange Trust Agreement (incorporated by reference to Exhibit 9.1 to the Company’s Registration Statement on Form 10, Amendment No. 2 filed with the SEC on January 26, 2007) | |
| 10.1 | Form of Tax Sharing Agreement (incorporated by reference to Exhibit 10.1 to the Company’s Registration Statement on Form 10, Amendment No. 2 filed with the SEC on January 26, 2007) | |
| 10.2 | Form of Transition Services Agreement (incorporated by reference to Exhibit 10.2 to the Company’s Registration Statement on Form 10, Amendment No. 2 filed with the SEC on January 26, 2007) | |
166
Exhibit | Exhibit Description | |
| 10.3 | Form of Pine Chip Supply Agreement (Plymouth, North Carolina) (incorporated by reference to Exhibit 10.3 to the Company’s Registration Statement on Form 10, Amendment No. 2 filed with the SEC on January 26, 2007) | |
| 10.4 | Form of Hog Fuel Supply Agreement (Plymouth, North Carolina) (incorporated by reference to Exhibit 10.4 to the Company’s Registration Statement on Form 10, Amendment No. 2 filed with the SEC on January 26, 2007) | |
| 10.5 | Form of | |
| ||
| ||
Form of Site Services Agreement (Columbus, Mississippi) (incorporated by reference to Exhibit 10.9 to the Company’s Registration Statement on Form 10, Amendment No. 2 filed with the SEC on January 26, 2007) | ||
Form of Fiber Supply Agreement (Princeton, British Columbia) (incorporated by reference to Exhibit 10.10 to the Company’s Registration Statement on Form 10, Amendment No. 2 filed with the SEC on January 26, 2007) | ||
Form of Fiber Supply Agreement (Okanagan Falls, British Columbia) (incorporated by reference to Exhibit 10.11 to the Company’s Registration Statement on Form 10, Amendment No. 2 filed with the SEC on January 26, 2007) | ||
Form of Fiber Supply Agreement (Kamloops, British Columbia) (incorporated by reference to Exhibit 10.12 to the Company’s Registration Statement on Form 10, Amendment No. 2 filed with the SEC on January 26, 2007) | ||
Form of Fiber Supply Agreement (Carrot River and Hudson Bay) (incorporated by reference to Exhibit 10.13 to the Company’s Registration Statement on Form 10, Amendment No. 2 filed with the SEC on January 26, 2007) | ||
139
|
| |
Form of Fiber Supply Agreement (Prince Albert, Saskatchewan) (incorporated by reference to Exhibit 10.14 to the Company’s Registration Statement on Form 10, Amendment No. 2 filed with the SEC on January 26, 2007) | ||
Form of Fiber Supply Agreement (White River, Ontario) (incorporated by reference to Exhibit 10.15 to the Company’s Registration Statement on Form 10, Amendment No. 2 filed with the SEC on January 26, 2007) | ||
Form of Site Services Agreement (Utilities) (Columbus, Mississippi) (incorporated by reference to Exhibit 10.16 to the Company’s Registration Statement on Form 10, Amendment No. 2 filed with the SEC on January 26, 2007) | ||
| 10.14 | Form of Site Services Agreement (Utilities) (Plymouth, North Carolina) (incorporated by reference to Exhibit 10.17 to the Company’s Registration Statement on Form 10, Amendment No. 2 filed with the SEC on January 26, 2007) | |
Pine and Hardwood Roundwood Supply Agreement (Plymouth, North Carolina) (incorporated by reference to Exhibit 10.18 to the Company’s Registration Statement on Form S-1 filed with the SEC on May 9, 2007) | ||
Agreement for the Purchase and Supply of Pulp (Plymouth, North Carolina) (incorporated by reference to Exhibit 10.19 to the Company’s Registration Statement on Form S-1 filed with the SEC on May 9, 2007) | ||
167
Exhibit | Exhibit Description | |
Pine In-Woods Chip Supply Agreement (Plymouth, North Carolina) (incorporated by reference to Exhibit 10.20 to the Company’s Registration Statement on Form S-1 filed with the SEC on May 9, 2007) | ||
Pine and Amory Hardwood Roundwood Supply Agreement (Columbus, Mississippi) (incorporated by reference to Exhibit 10.21 to the Company’s Registration Statement on Form S-1 filed with the SEC on May 9, 2007) | ||
OSB Supply Agreement (Hudson Bay, Saskatchewan) (incorporated by reference to Exhibit 10.24 to the Company’s Registration Statement on Form S-1 filed with the SEC on May 9, 2007) | ||
Hog Fuel Supply Agreement (Kenora, Ontario) (incorporated by reference to Exhibit 10.25 to the Company’s Registration Statement on Form S-1 filed with the SEC on May 9, 2007) | ||
Fiber Supply Agreement (Trout Lake and Wabigoon, Ontario) (incorporated by reference to Exhibit 10.26 to the Company’s Registration Statement on Form S-1 filed with the SEC on May 9, 2007) | ||
Form of Intellectual Property License Agreement (incorporated by reference to Exhibit 10.18 to the Company’s Registration Statement on Form 10, Amendment No. 2 filed with the SEC on January 26, 2007) | ||
Form of Indemnification Agreement (incorporated by reference to Exhibit 10.28 to the Company’s Registration Statement on Form S-1 filed with the SEC on May 9, 2007) | ||
Domtar Corporation 2007 Omnibus Incentive Plan (incorporated by reference to Exhibit | ||
Domtar Corporation 2004 Replacement Long-Term Incentive Plan for Former Employees of Weyerhaeuser Company (incorporated by reference to Exhibit 10.30 to the Company’s Registration Statement on Form S-1 filed with the SEC on May 9, 2007)* | ||
Domtar Corporation 1998 Replacement Long-Term Incentive Compensation Plan for Former Employees of Weyerhaeuser Company (incorporated by reference to Exhibit 10.31 to the Company’s Registration Statement on Form S-1 filed with the SEC on May 9, 2007) | ||
140
|
| |
Domtar Corporation Replacement Long-Term Incentive Compensation Plan for Former Employees of Weyerhaeuser Company (incorporated by reference to Exhibit 10.32 to the Company’s Registration Statement on Form S-1 filed with the SEC on May 9, 2007)* | ||
Domtar Corporation Executive Stock Option and Share Purchase Plan (applicable to eligible employees of Domtar Inc. for grants prior to March 7, 2007) (incorporated by reference to Exhibit 10.33 to the Company’s Registration Statement on Form S-1 filed with the SEC on May 9, 2007)* | ||
Domtar Corporation Executive Deferred Share Unit Plan (applicable to members of the Management Committee of Domtar Inc. prior to March 7, 2007) (incorporated by reference to Exhibit | ||
Domtar Corporation Deferred Share Unit Plan for Outside Directors (for former directors of Domtar Inc.) (incorporated by reference to Exhibit | ||
Supplementary Pension Plan for Senior Executives of Domtar Corporation (for certain designated senior executives) (incorporated by reference to Exhibit 10.36 to the Company’s Registration Statement on Form S-1 filed with the SEC on May 9, 2007)* | ||
Supplementary Pension Plan for Designated | ||
168
Exhibit | Exhibit Description | |
Domtar Retention Plan (incorporated by reference to Exhibit 10.38 to the Company’s Registration Statement on Form S-1 filed with the SEC on May 9, 2007)* | ||
Domtar Corporation Restricted Stock Plan (applicable to eligible employees of Domtar Inc. for grants prior to March 7, 2007) (incorporated by reference to Exhibit 10.39 to the Company’s Registration Statement on Form S-1 filed with the SEC on May 9, 2007)* | ||
Director Deferred Stock Unit Agreement (incorporated by reference to Exhibit 10.1 to the Company’s Current Report on Form 8-K filed with the SEC on May 24, | ||
| 10.36 | Non-Qualified Stock Option Agreement (incorporated by reference to Exhibit 10.2 to the Company’s Current Report on Form 8-K filed with the SEC on May 24, | |
Restricted Stock Unit Agreement (incorporated by reference to Exhibit 10.3 to the Company’s Current Report on Form 8-K filed with the SEC on May 24, | ||
Senior Executive Restricted Stock Unit Agreement (incorporated by reference to Exhibit 10.4 to the Company’s Current Report on Form 8-K filed with the SEC on May 24, | ||
Credit Agreement among the Company, Domtar, JPMorgan Chase Bank, N.A., as administrative agent, Morgan Stanley Senior Funding, Inc., as syndication agent, Bank of America, N.A., Royal | ||
Indenture between Domtar Inc. and the Bank of New York dated as of July 31, 1996 relating to Domtar’s $125,000,000 9.5% debentures due 2016 (incorporated by reference to Exhibit 10.20 to the Company’s registration statement on Form 10, Amendment No. 2 filed with the SEC on January 26, 2007) | ||
Employment Agreement of Mr. | ||
| 10.42 | Employment Agreement of Mr. Marvin Cooper (incorporated by reference to Exhibit 10.2 to the Company’s Current Report on Form 8-K filed with the SEC on August 15, | |
| 10.43 | Severance Program for Management Committee Members (incorporated by reference to Exhibit 10.1 to the Company’s Current Report on Form 8-K filed with the SEC on August 12, 2008)* | |
| 10.44 | First Amendment, dated August 13, 2008, to Credit Agreement among the Company, Domtar, JPMorgan Chase Bank, N.A., as administrative agent, Morgan Stanley Senior Funding, Inc., as syndication agent, Bank of America, N.A., Royal Bank of Canada and The Bank of Nova Scotia, as co-documentation agents, and the lenders from time to time parties thereto. | |
| 10.45 | DB SERP for Management Committee Members of Domtar (incorporated by reference to Exhibit 10.46 to the Company’s Annual Report on Form 10-K filed with the SEC on February 27, 2009)* | |
| 10.46 | DC SERP for Designated Executives of Domtar (incorporated by reference to Exhibit 10.47 to the Company’s Annual Report on Form 10-K filed with the SEC on February 27, 2009)* | |
| 10.47 | Supplementary Pension Plan for Steven Barker (incorporated by reference to Exhibit 10.48 to the Company’s Annual Report on Form 10-K filed with the SEC on February 27, 2009)* | |
| 10.48 | Form of Indemnification Agreement for members of Pension Administration Committee of Domtar Corporation (incorporated by reference to Exhibit 10.50 to the Company’s Annual Report on Form 10-K files with the SEC on February 27, 2009)* | |
| 10.49 | Consulting Agreement of Mr. Marvin Cooper* | |
141169
Exhibit | Exhibit Description | |
Separation Agreement of Mr. | ||
| 10.51 | Separation Agreement of Mr. Gilles Pharand | |
| 10.52 | Separation Agreement of Mr. Michel Dagenais | |
| 12.1 | Computation of Ratio of Earnings to Fixed Charges | |
| 21.1 | Subsidiaries of Domtar Corporation | |
| 23 | Consent of Independent Registered Public Accounting Firm | |
| 24.1 | Powers of Attorney (included in signature page) | |
| 31.1 | Certification of the Chief Executive Officer Pursuant to Section 302 of the Sarbanes-Oxley Act of | |
| 31.2 | Certification of the Chief Financial Officer Pursuant to Section 302 of the Sarbanes-Oxley Act of | |
| 32.1 | Certification of the Chief Executive Officer Pursuant to Section 906 of the Sarbanes-Oxley Act of | |
| 32.2 | Certification of the Chief Financial Officer Pursuant to Section 906 of the Sarbanes-Oxley Act of | |
| * | Indicates management contract or compensatory arrangement |
142170
(IN MILLIONS OF US DOLLARS, UNLESS OTHERWISE NOTED)
SCHEDULE II—VALUATION AND QUALIFYING ACCOUNTS
For the three years ended:
| Balance at beginning of year | Charged to income | (Deductions) from / Additions to reserve | Balance at end of year | ||||||||||||||||||||
| Balance at beginning of year | Charged to income | (Deductions) from / Additions to reserve | Balance at end of year | $ | $ | $ | $ | ||||||||||||||||
Allowances deducted from related asset accounts: | |||||||||||||||||||||||
Doubtful accounts—Accounts receivable | |||||||||||||||||||||||
2009 | 11 | 4 | (7 | ) | 8 | ||||||||||||||||||
2008 | 9 | 6 | (4 | ) | 11 | ||||||||||||||||||
2007 | $ | 2 | $ | (4 | ) | $ | 11 | $ | 9 | 2 | (4 | ) | 11 | 9 | |||||||||
2006 | 2 | — | — | 2 | |||||||||||||||||||
2005 | 2 | — | — | 2 | |||||||||||||||||||
The additions to reserve during 2007 include the acquisition of Domtar Inc. of $12 million.million
143171
Pursuant to the requirements of the Securities Exchange Act of 1934, as amended, the registrant has duly caused this registration statement to be signed on its behalf by the undersigned, thereunto duly authorized in the City of Montreal, Quebec, Canada, on March 25, 2008.February 26, 2010.
| DOMTAR CORPORATION | ||
| By: | /s/ | |
| Name: | ||
| Title: | President and Chief Executive Officer | |
We, the undersigned directors and officers of Domtar Corporation, hereby severally constitute Gilles PharandZygmunt Jablonski and Razvan L. Theodoru, and each of them singly, our true and lawful attorneys with full power to them and each of them to sign for us, in our names in the capacities indicated below, any and all amendments to this Annual Report on Form 10-K filed with the Securities and Exchange Commission.
Pursuant to the requirements of the Securities Exchange Act of 1934, as amended, this registration statement has been signed by the following persons in the capacities and on the dates indicated.
Signature | Title | Date | ||
/
| President and Chief Executive Officer (Principal Executive Officer) and Director | |||
/ Daniel Buron | Senior Vice-President and Chief Financial Officer (Principal Financial Officer and Principal Accounting Officer) | |||
/ Harold H. MacKay | Director | |||
/ Jack C. Bingleman | Director | |||
/
| ||||
/ Louis P. Gignac | Director | |||
/ Brian M. Levitt | Director | |||
/ W. Henson Moore | Director | |||
/ Michael R. Onustock | Director | |||
/S/ ROBERT J. STEACY Robert J. Steacy | Director | February 26, 2010 | ||
144172
Signature | Title | Date | ||
/
| ||||
/ William C. Stivers | Director | |||
/ Pamela B. Strobel | Director | |||
/ Richard Tan | Director | |||
/ Denis Turcotte | Director | |||
145173