
UNITED STATES
SECURITIES AND EXCHANGE COMMISSION
Washington, D.C. 20549
FORM 10–KForm 10-K
(Mark One)
ANNUAL REPORT PURSUANT TO SECTION 13 OR 15(d) OF THE SECURITIES EXCHANGE ACT OF 1934 |
For the fiscal year ended May 31, 20082010
ORor
| ¨ | TRANSITION REPORT PURSUANT TO SECTION 13 OR 15(d) OF THE SECURITIES EXCHANGE ACT OF 1934 |
For the transition period from to
Commission File Number 1-8399
WORTHINGTON INDUSTRIES, INC.
(Exact nameName of registrantRegistrant as specifiedSpecified in its charter)Charter)
Ohio | 31-1189815 | |
| (State or | (I.R.S. Employer Identification No.) | |
200 Old Wilson Bridge Road, Columbus, Ohio | 43085 | |
| (Address of | (Zip Code) |
Registrant’s telephone number, including area | (614) 438-3210 | |
Securities registered pursuant to Section 12(b) of the Act:
Title of | Name of Each Exchange on Which Registered | |
Common Shares, Without Par Value |
New York Stock Exchange |
Securities registered pursuant to Section 12(g) of the Act: None
Indicate by check mark if the registrant is a well-known seasoned issuer, as defined in Rule 405 of the Securities Act. x YES
Indicate by check mark if the Registrant is a well-known seasoned issuer, as defined in Rule 405 of the Securities Act. | Yes þ No ¨
|
Indicate by check mark if the Registrant is not required to file reports pursuant to Section 13 or Section 15(d) of the Act. | Yes ¨ No þ |
Indicate by check mark whether the registrantRegistrant (1) has filed all reports required to be filed by Section 13 or 15(d) of the Securities Exchange Act of 1934 during the preceding 12 months (or for such shorter period that the registrantRegistrant was required to file such reports), and (2) has been subject to such filing requirements for the past 90 days. Yes xþ YESNo ¨ NO
Indicate by check mark whether the Registrant has submitted electronically and posted on its corporate Web site, if any, every Interactive Data File required to be submitted and posted pursuant to Rule 405 of Regulation S-T (§232.405 of this chapter) during the preceding 12 months (or for such shorter period that the Registrant was required to submit and post such files). Yes ¨ No ¨
Indicate by check mark if disclosure of delinquent filers pursuant to Item 405 of Regulation S-K (§229.405 of this chapter) is not contained herein, and will not be contained, to the best of registrant’sRegistrant’s knowledge, in definitive proxy or information statements incorporated by reference in Part III of this Form 10-K or any amendment to this Form 10-K. ¨
Indicate by check mark whether the registrantRegistrant is a large accelerated filer, an accelerated filer, a non-accelerated filer, or a smaller reporting company. See the definitions of “large accelerated filer,” “accelerated filer” and “smaller reporting company” in Rule 12b-2 of the Exchange Act:Act.
Large accelerated filer xþ Accelerated filer ¨ Non-accelerated filer ¨ Smaller reporting company ¨��
(Do not check if a smaller reporting company)
Indicate by check mark whether the registrantRegistrant is a shell company (as defined in Rule 12b-2 of the Act). Yes ¨ YESNo xþ NO
State the aggregate market value of the voting and non-voting common equity held by non-affiliates computed by reference to the price at which the common equity was last sold, or the average bid and asked price of such common equity, as of the last business day of the registrant’s most recently completed second fiscal quarter. The aggregate market value of the Common Shares (the only common equity)equity of the Registrant) held by non-affiliates based oncomputed by reference to the closing price on the New York Stock Exchange on November 30, 2007,2009, the last business day of the Registrant’s most recently completed second fiscal quarter, was approximately $1,385,500,000.$717,342,269. For this purpose, executive officers and directors of the Registrant are considered affiliates.
Indicate the number of shares outstanding of each of the registrant’sRegistrant’s classes of common stock, as of the latest practicable date. On July 24, 2008,23, 2010, the Registrant had 78,769,498number of Common Shares issued and outstanding.outstanding was 77,892,544.
DOCUMENT INCORPORATED BY REFERENCEREFERENCE:
Selected portions of the Registrant’s definitive Proxy Statement to be furnished to shareholders of the Registrant in connection with the Annual Meeting of Shareholders to be held on September 24, 2008,30, 2010, are incorporated by reference into Part III of this Annual Report on Form 10-K to the extent provided herein.
| ii | ||||
PART I | ||||
Item 1. | 1 | |||
Item 1A. | ||||
Item 1B. | ||||
Item 2. | ||||
Item 3. | ||||
Item 4. | ||||
Supplemental Item. | ||||
PART II | ||||
Item 5. | ||||
Item 6. | ||||
Item 7. | Management’s Discussion and Analysis of Financial Condition and Results of Operations | |||
Item 7A. | ||||
Item 8. | ||||
Item 9. | Changes in and Disagreements With Accountants on Accounting and Financial Disclosure | |||
Item 9A. | ||||
Item 9B. | ||||
PART III | ||||
Item 10. | ||||
Item 11. | ||||
Item 12. | Security Ownership of Certain Beneficial Owners and Management and Related Stockholder Matters | |||
Item 13. | Certain Relationships and Related Transactions, and Director Independence | |||
Item 14. | ||||
PART IV | ||||
Item 15. | ||||
| E-1 | ||||
i
Selected statements contained in this Annual Report on Form 10-K, including, without limitation, in “PART I – Item 1. – Business” and “PART II – Item 7. – Management’s Discussion and Analysis of Financial Condition and Results of Operations,” constitute “forward-looking statements” as that term is used in the Private Securities Litigation Reform Act of 1995 (the “Act”). Forward-looking statements reflect our current expectations, estimates or projections concerning future results or events. These statements are often identified by the use of forward-looking words or phrases such as “believe,” “expect,” “anticipate,” “may,” “could,” “intend,” “estimate,” “plan,” “foresee,” “likely,” “will,” “should” or other similar words or phrases. These forward-looking statements include, without limitation, statements relating to:
| • | business plans or future or expected growth, |
| • | the sustainability of earnings; |
| • | projected profitability potential, capacity and working capital needs; |
| • | demand trends for the Company or its markets; |
| • | pricing trends for raw materials and finished goods and the impact of pricing changes; |
| • | anticipated capital expenditures and asset sales; |
| • | anticipated improvements and efficiencies in costs, operations, sales, inventory management, sourcing and the supply chain and the results thereof; |
| • | projected timing, results, benefits, costs, charges and expenditures related to acquisitions, |
| • | the alignment of operations with demand; |
| • | the ability to capture and maintain margins and market share and to develop or take advantage of future opportunities, new products |
| • | expectations for Company and customer inventories, jobs and orders; |
| • | expectations for the economy and markets or improvements in the economy or markets; |
| • | expected benefits from |
| • | expectations for |
|
| • | effects of judicial |
| • | other non-historical matters. |
Because they are based on beliefs, estimates and assumptions, forward-looking statements are inherently subject to risks and uncertainties that could cause actual results to differ materially from those projected. Any number of factors could affect actual results, including, without limitation, those that follow:
| • | the effect of national, regional and worldwide economic conditions generally and within major product markets, including a prolonged or substantial economic downturn; |
| • | the effect of conditions in national and worldwide financial markets; |
| • | product demand and pricing; |
| • | changes in product mix, product substitution and market acceptance of the Company’s products; |
| • | fluctuations in pricing, quality or availability of raw materials (particularly steel),supplies, transportation, utilities and other items required by operations; |
| • | effects of facility closures and the consolidation of operations; |
| • | the effect of financial difficulties, consolidation and other changes within the steel, automotive, construction and |
| • | failure to maintain appropriate levels of inventories; |
| • | financial difficulties (including bankruptcy filings) of original equipment manufacturers, end-users and customers, suppliers, joint venture partners and others with whom the Company does business; |
| • | the ability to realize targeted expense reductions |
| • | the ability to realize other cost savings and operational, sales and sourcing improvements and efficiencies, and |
ii
| • | the overall success of, and the ability to integrate, newly-acquired businesses and achieve synergies |
| • | capacity levels and efficiencies, within facilities and within the industry as a whole; |
| • |
|
the effect of |
|
| • | changes in customer demand, inventories, spending patterns, product choices, and supplier choices; |
| • | risks associated with doing business internationally, including economic, political and social instability, and foreign currency |
| • | the ability to improve and maintain processes and business practices to keep pace with the economic, competitive and technological environment; |
| • | adverse claims experience with respect to workers’ compensation, product recalls or product liability, casualty events or other matters; |
| • | deviation of actual results from estimates and/or assumptions used by the Company in the application of its significant accounting policies; |
| • |
|
| • | the impact of judicial rulings and governmental regulations, including those adopted by the SEC and other governmental agencies as contemplated by the recently enacted Dodd-Frank Wall Street Reform and Consumer Protection Act of 2010, both in the United States and abroad; and |
| • | other risks described from time to time in the filings of Worthington Industries, Inc. with the United States Securities and Exchange Commission, including those described in “PART I – Item 1A. – Risk Factors” of this Annual Report on Form 10-K. |
We note these factors for investors as contemplated by the Act. It is impossible to predict or identify all potential risk factors. Consequently, you should not consider the foregoing list to be a complete set of all potential risks and uncertainties. Any forward-looking statements in this Annual Report on Form 10-K are based on current information as of the date of this Annual Report on Form 10-K, and we assume no obligation to correct or update any such statements in the future, except as required by applicable law.
iiiii
PART I
General Overview
Worthington Industries, Inc. is a corporation formed under the laws of the State of Ohio (individually, the “Registrant” or “Worthington Industries” or, collectively with the subsidiaries of Worthington Industries, Inc., “we,” “our,” “Worthington,” or the “Company”). Founded in 1955, Worthington is primarily a diversified metalmetals processing company, focused on value-added steel processing and manufactured metal products. Our manufactured metal products include: pressure cylinder products such as metalpropane, refrigerant, oxygen, hand torch and camping cylinders, scuba tanks and helium balloon kits; light gauge steel framing pressure cylinders,for commercial and residential construction; framing systems and stairs for mid-rise buildings; current and past model automotive past-model service stampingsstampings; and, through joint ventures, metal ceilingsuspension grid systems for concealed and laser-weldedlay-in panel ceilings and laser welded blanks.
Worthington is headquartered at 200 Old Wilson Bridge Road, Columbus, Ohio 43085, telephone (614) 438-3210. The common shares of Worthington Industries are traded on the New York Stock Exchange under the symbol WOR.
Worthington Industries maintains an Internet web site at www.worthingtonindustries.com. This uniform resource locator, or URL, is an inactive textual reference only and is not intended to incorporate Worthington Industries’ web site into this Annual Report on Form 10-K. Annual reportsReports on Form 10-K, quarterly reportsQuarterly Reports on Form 10-Q, current reportsCurrent Reports on Form 8-K and amendments to those reports, filed or furnished pursuant to Section 13(a) or 15(d) of the Securities Exchange Act of 1934, as amended (the “Exchange Act”), as well as Worthington Industries’ definitive annual meeting proxy materials filed pursuant to Section 14 of the Exchange Act, are available free of charge, on or through the Worthington Industries web site, as soon as reasonably practicable after such material is electronically filed with, or furnished to, the Securities and Exchange Commission (the “SEC”).
Business Segments
At the end of the fiscal year ended May 31, 20082010 (“fiscal 2008”2010”), the Company had 4441 manufacturing facilities worldwide and held equity positions in teneight joint ventures, which operated an additional 2224 manufacturing facilities worldwide.
The Company has three principal reportable operatingbusiness segments: Steel Processing, Pressure Cylinders and Metal Framing and Pressure Cylinders.Framing. The Steel Processing reportable business segment consists of the Worthington Steel business unit (“Worthington Steel”). The Pressure Cylinders reportable business segment consists of the Worthington Cylinders business unit (“Worthington Cylinders”). The Metal Framing reportable business segment consists of the Dietrich Metal Framing business unit (“Dietrich”). The Steel processing, Pressure Cylinders segment consists ofand Metal Framing operating segments are the Worthington Cylinderonly operating segments within the Company that met the applicable criteria for separate disclosure as reportable business unit (“Worthington Cylinders”).segments. All other business units not included in these three reportable operating segments are combined and disclosed in the Other category, which also includes income and expense items not allocated to the operatingreportable business segments. The Other category includes the Automotive Body Panels, Steel Packaging, Mid-Rise Construction, Military Construction and Commercial Stairs operating segments.
During the Company’s third quarter ended February 28, 2010, we made certain organizational changes that impacted the internal reporting and management structure of our previously reported Construction Services operating segment which had been reported in the Other category. This operating segment consisted of the Worthington Integrated Building Systems (“WIBS”) business unit, which included the Mid-Rise Construction, Military Construction and Steel Packaging segments.Commercial Stairs businesses. As a result of continued
challenges facing those businesses, the interaction between those businesses and other operations within the Company and other industry factors, management responsibilities and internal reporting were re-aligned and separated for those entities within WIBS. The composition of the Company’s reportable business segments is unchanged from this development (see description within “Item 8. – Financial Statements and Supplementary Data – Notes to Consolidated Financial Statements – Note H – Segment Data” of this Annual Report on Form 10-K for fiscal 2010 of Worthington Industries for a full description of the reportable business segments), but the level of aggregation within the Other category for segment reporting purposes is impacted, as are the identified reporting units used for testing of potential goodwill impairment. Subsequent to this change, and as of February 28, 2010, the Other category, for purposes of reporting segment financial information, continues to include Mid-Rise Construction, Military Construction and Commercial Stairs. However, those operating units are no longer combined together as the Construction Services operating segment, but are each separate and distinct operating segments, as well as separate reporting units.
Worthington holds equity positions in teneight joint ventures, which are further discussed below under the subheading “Joint Ventures.” Only one of the teneight joint ventures is consolidated and its operating results are reported in the Steel Processing reportable business segment.
During fiscal 2008,2010, the Steel Processing, Pressure Cylinders and Metal Framing and Pressure Cylindersoperating segments served approximately 1,200, 3,8001,100, 2,400 and 2,4003,100 customers, respectively, located primarily in the United States. Foreign salesoperations accounted for approximately 9%6% of consolidated net sales for fiscal 2010 and were comprised primarily of sales to customers in Canada and Europe. No single customer accounted for over 5%10% of consolidated net sales.sales during fiscal 2010. Further reportable operatingbusiness segment data is provided in “Item 8. – Financial Statements and Supplementary Data – Notes to Consolidated Financial Statements – Note H – Segment Data” of this Annual Report on Form 10-K. That data is incorporated herein by reference.
Transformation Plan
In our fiscal year ended May 31, 2008 (“fiscal 2008”), we initiated a Transformation Plan (the “Transformation Plan”) with the overall goal to improve the Company’s sustainable earnings potential, asset utilization and operational performance. The Transformation Plan focuses on cost reduction, margin expansion and organizational capability improvements and, in the process, seeks to drive excellence in three core competencies: sales; operations; and supply chain management. The Transformation Plan is comprehensive in scope and includes aggressive diagnostic and implementation phases in the Steel Processing and Metal Framing operating segments.
We retained a consulting firm to assist in the development and implementation of the Transformation Plan. The services provided by this firm included assistance through diagnostic tools, performance improvement technologies, project management techniques, benchmarking information and insights that directly related to the Transformation Plan. We also formed internal teams dedicated to the Transformation Plan efforts. These internal teams assumed full responsibility for executing the Transformation Plan starting in the fourth quarter of the fiscal year ended May 31, 2009 (“fiscal 2009”).
We continued to execute our Transformation Plan through fiscal 2010. In our Steel Processing operating segment, we have completed the diagnostic and implementation phases at each of our core facilities. Additionally, we have initiated the diagnostic process at our west coast stainless steel operation and our newly acquired facility in Cleveland, as well as in our Mexican joint venture, Serviacero. We anticipate that we will have substantially completed the Transformation Plan process at these facilities and one additional Steel Processing facility by December 31, 2010. In our Metal Framing operating segment, we have substantially completed the Transformation Plan process at eight facilities and anticipate completing the process at four additional facilities by December 31, 2010.
Transformation Plan initiatives executed to date include facility closings, headcount reductions, other cost reductions, an enhanced and more focused commercial sales effort, improved operating efficiencies, a
consolidated sourcing and supply chain strategy and a continued emphasis on safety. We have seen positive results from these efforts; however, their impact has been dampened by the negative impact of the economic recession.
As of May 31, 2010, we had recorded a total of $65.4 million of restructuring charges associated with the Transformation Plan: $18.1 million was incurred during fiscal 2008; $43.0 million was incurred during fiscal 2009; and $4.2 million was incurred during fiscal 2010. We expect to incur additional restructuring charges relating to the Transformation Plan as we progress through the remaining Metal Framing and Steel Processing facilities, although these charges should decline over the coming quarters. The need for other restructuring charges will depend largely on recommendations developed from the Transformation Plan. See “Item 8. – Financial Statements and Supplementary Data – Notes to Consolidated Financial Statements – Note M – Restructuring” of this Annual Report on Form 10-K for further information on restructuring charges. That information is incorporated herein by reference.
Recent Developments
On September 14, 2007, the Company segment acquired certain cylinder production assets of Wolfedale Engineering, the largest Canadian manufacturer of portable propane gas steel cylinders for use with
barbeque gas grills, recreational vehicles, campers and trailers. These assets and production were integrated into existing facilities.
On September 17, 2007, the Company acquired a 50% interest in Serviacero Planos which operates two steel processing facilities in central Mexico. This joint venture is known as Serviacero Planos, S.A. de C.V. (“Serviacero Worthington”). On March 5, 2008, Serviacero Worthington announced plans to add a greenfield site in the Monterrey, Mexico region. This will be the third facility in Mexico for the Serviacero Worthington joint venture.
On September 25, 2007, a steel processing joint venture was formed with The Magnetto Group to construct and operate a Class One steel processing facility in Slovakia. This 49%-owned joint venture started operations in February 2008 as Canessa Worthington Slovakia s.r.o. (“Canessa Worthington”) and services customers throughout central Europe.
On September 25, 2007, Worthington announced the closure or downsizing of five production facilities in the Metal Framing segment. The affected facilities were: East Chicago, Indiana; Rock Hill, South Carolina; Goodyear, Arizona; Wildwood, Florida; and Montreal, Canada which is being downsized. The Rock Hill facility continues to operate as a steel processing operation and will also produce product for the Aegis joint venture. In addition to the plant closures, the Metal Framing executive and administrative offices will be relocated from Pittsburg, Pennsylvania, to our corporate offices in Columbus, OH. Annual net sales generated by the closed facilities totaled approximately $125.0 million, the majority of which are expected to be transferred to other nearby Metal Framing locations. As of May 31, 2008, all five of the Metal Framing operating facilities have been closed or downsized. Of the $9.0 million in annual savings expected from these actions, $2.1 million was realized in fiscal 2008. The balance will be realized in fiscal 2009. Restructuring charges related to these closures totaled $8.1 million in fiscal 2008 with an additional $4.6 million expected in fiscal 2009.
On September 26, 2007, Worthington Industries announced that the Board of Directors had approved the repurchase of ten million of its outstanding common shares. A prior authorization to repurchase up to ten million common shares, originally approved by the Board of Directors on June 13, 2005, had 1,370,800 common shares remaining under it, making a total of 11,370,800 common shares available for repurchase at the time of the announcement. During fiscal 2008, the Company repurchased 6,451,500 common shares, and at year-end, there were 9,099,500 common shares authorized for repurchase.
On October 25, 2007, Worthington acquired a 49% interest in crate and pallet maker LEFCO Industries, LLC, a minority business enterprise. The resulting joint venture, called LEFCO Worthington, LLC, will manufacture steel rack systems for the automotive and trucking industries, in addition to continuing LEFCO’s existing products.
On March 1, 2008 TWB Company, L.L.C. (“TWB”), our joint venture with ThyssenKrupp Steel North America, Inc. (“ThyssenKrupp”), acquired ThyssenKrupp Tailored Blanks, S.A. de C.V., the Mexican subsidiary of ThyssenKrupp, to expand TWB’s presence in Mexico. As a result, ThyssenKrupp now owns 55% of TWB and Worthington now owns 45%.
On June 2, 2008, Worthington made an additional capital contribution of $392,000 to Viking & Worthington Steel Enterprise, LLC. The other member in the joint venture did not make its contribution as required by the operating agreement. As a result, Worthington became the majority owner of the joint venture, and the joint venture will be consolidated in Worthington’s financial statements starting in fiscal 2009.
On June 2, 2008, the Company acquired2009, we purchased substantially all of the assets related to the business of The Sharon Companies Ltd. (“Sharon Stairs”). The Sharon Stairs business designsPiper Metal Forming Corporation, U.S. Respiratory, Inc. and manufacturesPacific Cylinders, Inc. (collectively, “Piper”) for cash of $9,713,000. Piper is a manufacturer of aluminum high pressure cylinders and impact extruded steel egress stair systems forand aluminum parts, serving the medical, automotive, defense, oil services and other commercial construction market and operatesmarkets, with one manufacturing facilitylocation in Akron, Ohio. It will operateNew Albany, Mississippi. Piper operates as part of Worthington Integratedour Pressure Cylinders operating segment. Piper’s aluminum products increase our line of industrial gas product offerings and present an opportunity to increase our participation in the medical cylinder market.
On August 12, 2009, we joined with ClarkWestern Building Systems, Inc., to create DMFCWBS, LLC (the “Clark JV”). We contributed certain intangible assets and committed to pay a portion of certain costs and expenses in return for 50% of the equity units and voting power of the joint venture. The purpose of the Clark JV is to develop, test and obtain approvals for metal framing stud designs, as well as to develop, own and license intellectual property related to such designs. The Clark JV does not manufacture or sell any products, but will license its designs to its members and possibly to third parties. The Clark JV is accounted for using the equity method of accounting, as both parties have equal voting rights and control.
On September 3, 2009, we acquired the membership interests of Structural Composites Industries, LLC (“Worthington-IBS”SCI”). for cash of $24,221,000. SCI is a manufacturer of lightweight, aluminum-lined, composite-wrapped high pressure cylinders used in commercial, military, marine and aerospace applications. Product lines include cylinders for alternative fuel vehicles using compressed natural gas or hydrogen, self-contained breathing apparatuses, aviation oxygen and escape slides, military applications, home oxygen therapy and advanced and cryogenic structures. SCI operates as part of our Pressure Cylinders operating segment. The acquisition of SCI allows us to continue to grow the Pressure Cylinders business and provides an entry into weight critical applications, further broadening the portfolio beyond the operating segment’s original, core markets.
On November 2, 2009, our Metal Framing operating segment announced the formation of a strategic alliance with Bailey Metal Products Limited (“Bailey”) that included the sale of our Metal Framing operations in Canada to Bailey. The sale included two manufacturing facilities located in Burnaby, British Columbia, and Mississauga, Ontario, and two sales and distribution centers located in LaSalle, Quebec, and Edmonton, Alberta. The alliance provides for Bailey to be the exclusive distributor of Metal Framing’s proprietary and vinyl products in Canada. Bailey has licensed its paper-faced metal corner bead product to Metal Framing to manufacture and sell in most of the United States.
On February 1, 2010, we acquired the steel processing assets of Gibraltar Industries, Inc. and its subsidiaries (collectively, “Gibraltar”) for cash of $29,164,000. Those assets are now operated within our Steel Processing operating segment. The acquisition expanded the capabilities of Worthington Steel’s cold-rolled
strip business and its ability to service the needs of new and existing customers. The assets acquired were Gibraltar’s inventories, its Cleveland, Ohio, facility, the equipment of Gibraltar’s Buffalo, New York, facility and a warehouse in Detroit, Michigan. Also acquired was the stock of Cleveland Pickling, Inc., whose only asset is a 31.25% interest in Samuel Steel Pickling Company, a joint venture which operates a steel pickling facility in Twinsburg, Ohio, and one in Cleveland, Ohio.
On June 21, 2010, our Pressure Cylinders operating segment acquired the assets of Hy-Mark Cylinders, Inc. (“Hy-Mark”) for cash of $12,125,000. Hy-Mark manufactures extruded aluminum cylinders for medical oxygen, scuba, beverage service, industrial specialty and professional racing applications and was based in Hampton, Virginia. The assets acquired included Hy-Mark’s manufacturing equipment and inventories, which will be relocated to the Worthington Cylinders Mississippi manufacturing location, complementing the medical cylinder lines and adding a range of new products.
Steel Processing
The Steel Processing operating segment consists of the Worthington Steel business unit, and includes Precision Specialty Metals, Inc., a specialty stainless processor located in Los Angeles, California (“PSM”), and Spartan Steel Coating LLC (“Spartan”), a consolidated joint venture.venture which operates a cold-rolled hot dipped galvanizing line. For fiscal 2008, the2010, fiscal year ended May 31, 2007 (“2009 and fiscal 2007”), and the fiscal year ended May 31, 2006 (“fiscal 2006”),2008, the percentage of consolidated net sales generated by the Steel Processing operating segment was 48%approximately 51%, 49%,45% and 51%48%, respectively.
Worthington Steel is one of America’sthe largest independent intermediate processors of flat-rolled steel.steel in the United States. It occupies a niche in the steel industry by focusing on products requiring exact specifications. These products cannot typically be supplied as efficiently by steel mills or end-users of these products.
The Steel Processing operating segment, including Spartan, owns and operates tennine manufacturing facilities – one each in California, Indiana, Kentucky and Maryland, two facilities in Michigan, and threefour facilities in Ohio – and leases one manufacturing facility in Alabama.
Worthington Steel serves approximately 1,2001,100 customers from these facilities, principally in the automotive, construction, lawn and garden, hardware, furniture, office equipment, electrical control, tubing, leisure and recreation, appliance, agricultural, HVAC, container and aerospace markets. Automotive-related customers have historically represented approximately half of itsthis operating segment’s net sales. No single customer represented greater than 7%10% of net sales for the Steel Processing operating segment during fiscal 2008.2010.
Worthington Steel buys coils of steel from integrated steel mills and mini-mills and processes them to the precise type, thickness, length, width, shape, temper and surface quality required by customer specifications. Computer-aided processing capabilities include, among others:
pickling, a chemical process using an acidic solution to remove surface oxide which develops on hot-rolled steel;
slitting, which cuts steel to specific widths;
cold reducing, which achieves close tolerances of thickness and temper by rolling;
hot-dipped galvanizing, which coats steel with zinc and zinc alloys through a hot-dipped process;
hydrogen annealing, a thermal process that changes the hardness and certain metallurgical characteristics of steel;
cutting-to-length, which cuts flattened steel to exact lengths;
tension leveling, a method of applying pressure to achieve precise flatness tolerances for steel;
edging, which conditions the edges of the steel by imparting round, smooth or knurled edges;
non-metallic coating, including dry lubrication, acrylic and paint; and
configured blanking, which stamps steel into specific shapes.
Worthington Steel also toll processes steel for steel mills, large end-users, service centers and other processors. Toll processing is different from typical steel processing in that the mill, end-user or other party retains title to the steel and has the responsibility for selling the end product. Toll processing enhances Worthington Steel’s participation in the market for wide sheet steel and large standard orders, which is a market generally served by steel mills rather than by intermediate steel processors.
The steel processing industry is fragmented and highly competitive. There are many competitors, including other independent intermediate processors. Competition is primarily on the basis of price, product quality and the ability to meet delivery requirements. Technical service and support for material testing and customer-specific applications enhance the quality of products (See “Item 1. – Business – Technical Services”). However, the extent to which technical service capability has improved Worthington Steel’s competitive
position has not been quantified. Worthington Steel’s ability to meet tight delivery schedules is, in part, based on the proximity of our facilities to customers, suppliers and one another. The extent to which plant location has impacted Worthington Steel’s competitive position has not been quantified. Processed steel products are priced competitively, primarily based on market factors, including, among other things, competitivemarket pricing, the cost and availability of raw materials, transportation and shipping costs, and overall economic conditions in the United States and abroad.
Metal Framing
The Metal Framing segment, consisting ofAs noted under “Recent Developments”, the Dietrich Metal Framingrecently acquired Gibraltar steel processing business unit, designs and produces metal framing components, systems and related accessories for the commercial and residential construction markets within the United States and Canada. For fiscal 2008, fiscal 2007, and fiscal 2006, the percentage of consolidated net sales generated by the Metal Framing segment was 26%, 26%, and 28%, respectively.
Metal Framing products include steel studs and track, floor and wall system components, roof trusses and other building product accessories, such as metal corner bead, lath, lath accessories, clips, fasteners and vinyl bead and trim.
The Metal Framing segment has 20 operating facilities located throughout the United States: one each in Arizona, Colorado, Georgia, Hawaii, Illinois, Indiana, Kansas, Maryland, Massachusetts, New Jersey, South Carolina and Washington; two each in California, Florida, Ohio and Texas. This segment also has 2 operating facilities in Canada: one each in British Columbia and Ontario.
Dietrich is the largest metal framing manufacturer in the United States, supplying approximately 35% of the metal framing products sold in the United States. Dietrich is the second largest metal framing manufacturer in Canada with a market share of between 20% and 25%. Dietrich serves approximately 3,800 customers, primarily consisting of wholesale distributors, commercial and residential building contractors, and mass merchandisers. During fiscal 2008, Dietrich’s three largest customers represented approximately 16%, 10% and 10%, respectively, of the net sales for the segment, while no other customer represented more than 2% of net sales for the segment.
The light-gauge metal framing industry is very competitive. Dietrich competes with seven large regional or national competitors and numerous small, more localized competitors, primarily on the basis of price, service and quality. As is the caseincluded in the Steel Processing segment, the proximity of facilities to customers and their project sites provides a service advantage and impacts freight and shipping costs. Dietrich’s products are transported by both common and dedicated carriers. The extent to which facility location has impacted Dietrich’s competitive position has not been quantified.operating segment.
Dietrich uses numerous trademarks and patents in its business. Dietrich licenses from Hadley Industries the “UltraSTEEL®” registered trademark and the United States and Canadian patents to manufacture “UltraSTEEL®” metal framing and accessory products. The “Spazzer®” trademark is used in connection with wall component products that are the subject of four United States patents, two foreign patents, one pending United States patent application, and several pending foreign patent applications. The trademark “TradeReady®” is used in connection with floor-system products that are the subject of four United States patents, numerous foreign patents, one pending United States patent application, and several pending foreign patent applications. The “Clinch-On®” trademark is used east of the Rockies in connection with corner bead and metal trim products for gypsum wallboard. Dietrich licenses the “SLP-TRK®” trademark as well as the patent to manufacture “SLP-TRK®” slotted track in the United States from Brady Construction Innovations, Inc. Aegis Metal Framing, LLC, an unconsolidated joint venture, uses the “Ultra-Span®” registered trademark in connection with certain patents for proprietary roof trusses. Dietrich intends to continue to use and renew its registered trademarks. Dietrich also has a number of other patents, trademarks and trade names relating to specialized products.
Pressure Cylinders
The Pressure Cylinders operating segment consists of the Worthington Cylinders business unit. For fiscal 2008,2010, fiscal 2007,2009 and fiscal 2006,2008, the percentage of consolidated net sales generated by Worthington Cylinders was 20%approximately 24%, 18%,20% and 16%19%, respectively.
Worthington Cylinders operates eightten manufacturing facilities with three facilities in Ohio and one facility in each inof California, Mississippi, Wisconsin, Austria, Canada, the Czech Republic and Portugal.
The Pressure Cylinders operating segment produces a diversified line of pressure cylinders, including low-pressure liquefied petroleum gas (“LPG”) and refrigerant gas cylinders; high-pressure and industrial/specialty gas cylinders; aluminum-lined, composite-wrapped high-pressure cylinders; airbrake tanks; and certain consumer products. LPG cylinders are sold to manufacturers, distributors and mass merchandisers and are used to hold fuel for gas barbecue grills, recreational vehicle equipment, residential and light commercial heating systems, industrial forklifts, propane-fueled camping equipment, hand held torches and commercial/residential cooking (the latter, generally outside North America). Refrigerant gas cylinders are sold primarily to major refrigerant gas producers and distributors and are used to hold refrigerant gases for commercial, residential and automotive air conditioning and refrigeration systems. High-pressure and industrial/specialty gas cylinders are sold primarily to gas producers and distributors as containers for gases used in:in cutting and welding metals;metals, breathing (medical, diving and firefighting);, semiconductor production;production, beverage delivery;delivery and compressed natural gas systems. Worthington Cylinders also produces recovery tanks for refrigerant gases, air reservoirs for truck and trailer original equipment manufacturers and “Balloon Time®” helium kits which include non-refillable cylinders. While a large percentage of cylinder sales are made to major accounts, Worthington Cylinders has approximately 2,400 customers. During fiscal 2008,2010, no single customer represented more than 6%11% of net sales for the Pressure Cylinders operating segment.
Worthington Cylinders produces low-pressure steel cylinders with refrigerant capacities of 15 to 1,000 pounds and steel and aluminum cylinders with LPG capacities of 14.1 ounces to 420 pounds. Low-pressure cylinders are produced by precision stamping, drawing, welding and/or brazing component parts to customer specifications. They are then tested, painted and packaged, as required. High-pressure steel cylinders are manufactured by several processes, including deep drawing, tube spinning and billet piercing.
In the United States and Canada, high-pressure and low-pressure cylinders are primarily manufactured in accordance with U.S.United States Department of Transportation and Transport Canada specifications. Outside the United States and Canada, cylinders are manufactured according to European norm specifications, as well as various other international standards.
In the United States and Canada, Worthington Cylinders has one principal domestic competitor in the low-pressure non-refillable refrigerant market, one principal domestic competitor in the low-pressure LPG cylinder market and twoone principal domestic competitorscompetitor in the high-pressure cylinder market. There are also several foreign competitors in these markets. Worthington Cylinders believes that it has the largest domestic market share in both low-pressure cylinder markets. In the European high-pressure cylinder market, there are several competitors. Worthington Cylinders believes that it is a leading producer in both the high-pressure cylinder and low-pressure non-refillable cylinder markets in Europe. As with Worthington’s other operating segments, competition is based upon price, service and quality.
The Pressure Cylinders operating segment uses the trade name “Worthington Cylinders” to conduct business and the registered trademark “Balloon Time®” to market low-pressure helium balloon kits; the trademark “FLAMESAVER™“FLAMESAVER®” to market certain LPlow-pressure gas cylinders; the trademark “WORTHINGTON PRO GRADE™GRADE®” to market certain LPG cylinders, hand torch cylinderstorches and camping fuel cylinders; and the trademark “MAP-PRO™“MAP-PRO®”. to market certain hand torch cylinders; and uses the registered trademark SCI® to market certain cylinders for transportation of compressed gases for inflation of flotation bags and escape slides, Self Contained Breathing Cylinders (SCBA) for fire fighting and cylinders to contain compressed natural gas. The Pressure Cylinders operating segment intends to continue to use these trademarks and renew its registered trademarks. This intellectual property is important to
As noted under “Recent Developments”, the recently acquired Piper and SCI businesses are included in the Pressure Cylinders operating segment butfor fiscal 2010. The Hy-Mark business will be included in the Pressure Cylinders operating segment beginning in the fiscal year ending May 31, 2011.
Metal Framing
The Metal Framing operating segment, consisting of the Dietrich Metal Framing business unit, designs and produces metal framing components and systems and related accessories for the commercial and residential construction markets within the United States. For fiscal 2010, fiscal 2009 and fiscal 2008, the percentage of consolidated net sales generated by the Metal Framing operating segment was approximately 17%, 25% and 26%, respectively.
Metal Framing products include steel studs and track, floor and wall system components, roof trusses and other building product accessories, such as metal corner bead, lath, lath accessories, clips, fasteners and vinyl bead and trim.
The Metal Framing operating segment has 14 operating facilities located throughout the United States: one facility in each of Colorado, Florida, Georgia, Hawaii, Indiana, Kansas, Maryland and New Jersey, and two facilities in each of California, Ohio and Texas.
Dietrich is not considered material.the largest metal framing manufacturer in the United States, supplying approximately one-third of the metal framing products sold in the United States. Dietrich serves approximately 3,100
customers, primarily consisting of wholesale distributors, commercial and residential building contractors and mass merchandisers. During fiscal 2010, Dietrich’s three largest customers represented approximately 17%, 8% and 8%, respectively, of the net sales for the operating segment, while no other customer represented more than 3% of net sales for the Metal Framing operating segment.
The light gauge metal framing industry is very competitive. Dietrich competes with seven large regional or national competitors and numerous small, more localized competitors, primarily on the basis of price, service, breadth of product line and quality. As is the case in the Steel Processing operating segment, the proximity of facilities to customers and their project sites provides a service advantage and impacts freight and shipping costs. Dietrich’s products are transported by both common and dedicated carriers. Our Metal Framing business has been an industry leader in driving code compliance for light gauge metal framing.
Dietrich uses numerous trademarks and patents in its business. Dietrich licenses from Hadley Industries the “UltraSTEEL®” registered trademark and the United States patents to manufacture “UltraSTEEL®” metal framing which is sold as an additional line to Dietrich’s standard metal framing products. Dietrich licenses from the Clark JV the patent pending nonstructural framing product under the trademarks of “ProSTUD™” and “ProTRAK™.” “FastClip™” is a trademarked line of structural connectors that are protected under various United States patents.
The “Spazzer®” registered trademark is used in connection with wall component products that are the subject of four United States patents, two foreign patents and several pending foreign patent applications. The registered trademark “TradeReady®” is used in connection with floor-system products that are the subject of five United States patents and several foreign patents. The “Clinch-On®” registered trademark is used east of the Rocky Mountains in the United States in connection with corner bead and metal trim products for gypsum wallboard. Dietrich licenses from Brady Construction Innovations, Inc. the “PROX™” and the “SLP-TRK®” registered trademarks as well as the patents to manufacture “Pro XR™” header system. Dietrich also has a number of other patents, trademarks and trade names relating to specialized products. The Metal Framing operating segment intends to continue to use these trademarks and renew its registered trademarks.
Other
The “Other”Other category consists of operating segments that do not meet the applicable aggregation criteria and materiality tests for purposes of separate disclosure as reportable business segments, and other corporate related entities. These operating segments are Automotive Body Panels, Steel Packaging, Mid-Rise Construction, ServicesMilitary Construction and Steel Packaging.Commercial Stairs.
The Automotive Body Panels operating segment consists of The Gerstenslager Company (“Gerstenslager”), which is ISO/TS 16949:2002 and ISO14001 certified. Gerstenslager provides stamping, blanking, assembly, painting, packaging, die management, warehousing, distribution management and other services to customers, primarily in the automotive industry. Gerstenslager operates two facilities in Ohio. Gerstenslager is a major supplier to the automotive past-model year market and manages more than 3,3003,800 finished good part numbers and more than 12,60013,400 stamping dies/fixture sets for the past- and current-model year automotive and truck manufacturers, both domestic and transplant.
The Construction Services segment consists of the Worthington-IBS business unit which includes Worthington Mid-Rise Construction, Inc., which designs and builds mid-rise light-gauge steel framed commercial structures and multi-family housing units; Worthington Military Construction, Inc., which is involved in the supply and construction of metal framing products for, and in the framing of, single family housing, with a focus on military; a 36 unit mid-rise light-gauge steel framed apartment project in China entered into primarily for research and development purposes; and recently acquired Sharon Stairs, a manufacturer of pre-engineered egress stair solutions.
The Steel Packaging operating segment consists of Worthington Steelpac Systems LLC (“Steelpac”), which is an ISO-9001: 2000 certified manufacturer of engineered, recyclable steel shippingpackaging solutions. Steelpac operates three facilities, with one facility in each of Indiana, Ohio and Pennsylvania. Steelpac designs and manufactures reusable custom platforms, racks and pallets made of steel for supporting, protecting and handling products throughout the shipping process for industries such as automotive, lawn and garden and recreational vehicles.
The Mid-Rise Construction operating segment, consisting of Worthington Mid-Rise Construction located in Cleveland, Ohio, designs, supplies and builds mid-rise light gauge steel framed commercial structures and multi-family housing units.
The Military Construction operating segment, consisting of Worthington Military Construction located in Franklin, Tennessee, is involved in the supply and construction of metal framing products for, and in the framing of, single family housing, with a focus on military housing.
The Commercial Stairs operating segment, consisting of Worthington Stairs located in Akron, Ohio, is a manufacturer of pre-engineered steel egress stair solutions.
Segment Financial Data
Financial information for the reportable business segments is provided in “Item 8. – Financial Statements and Supplementary Data – Notes to Consolidated Financial Statements – Note H – Segment Data” of this Annual Report on Form 10-K. That financial information is incorporated herein by reference.
Financial Information About Geographic Areas
ForeignIn fiscal 2010, our foreign operations represented 9%, 8%, and 6% of consolidated net sales, for fiscal 2008, fiscal 2007,7% of earnings attributable to controlling interest, pre-tax, and fiscal 2006, respectively.28% of consolidated net assets. Summary information about Worthington’s foreign operations is set forth in “Item 8. – Financial Statements and Supplementary Data – Notes to Consolidated Financial Statements – Note A – Summary of Significant Accounting Policies –Risks and Uncertainties”Uncertainties” of this Annual Report on Form 10-K. That summary information is incorporated herein by reference. For fiscal 2008,2010, fiscal 2007,2009 and fiscal 2006,2008, Worthington had operations in North America and Europe. Net sales and net fixed assets by geographic region are provided in “Item 8. – Financial Statements and Supplementary Data – Notes to Consolidated Financial Statements – Note H – Segment Data” of this Annual Report on Form 10-K. That information is incorporated herein by reference.
Suppliers
The primary raw material purchased by Worthington is steel. We purchase steel from major primary producers of steel, both domestic and foreign. The amount purchased from any particular supplier varies from year to year depending on a number of factors including market conditions, then current relationships and prices and terms offered. In nearly all market conditions, steel is available from a number of suppliers and generally any supplier relationship or contract can and has been replaced with little or no significant interruption to our business. In fiscal 2008,2010, Worthington purchased approximately three1.8 million tons of steel (58%(65% hot-rolled, 29%21% galvanized and 13%14% cold-rolled) on a consolidated basis. Steel is purchased in large quantities at regular intervals from major primary producers, both domestic and foreign. In the Steel Processing operating segment, steel is primarily purchased and processed based on specific customer orders. The Pressure Cylinders and Metal Framing and Pressure Cylindersoperating segments purchase steel to meet production schedules. For certain raw materials, there are more limited suppliers – for example, hydrogen and zinc, which are generally purchased at market prices. Since there is a limited number of suppliers in the hydrogen and zinc markets, if delivery from a major supplier is disrupted due to a force majeure type occurrence, it may be difficult to obtain an alternative supply. Raw materials are generally purchased in the open market on a negotiated spot-market basis at prevailing market prices. Supply contracts are also entered into, some of which have fixed pricing. During fiscal 2008,2010, the Company purchased steel from the following major suppliers, of steel were, in
alphabetical order: AK Steel Corporation; ArcelorMittal; California Steel Industries, Inc.;Inc; Duferco Farrell Corp; Gallatin Steel Company; North Star BlueScope Steel LLC; Nucor Corporation; SeverCorr, LLC; Severstal North America, Inc.; Steel Dynamics, Inc.; Stemcor Holdings Limited; United States Steel Corporation;Corporation (“U.S. Steel”); and USS-POSCO Industries; and WCI Steel, Inc.Industries. Alcoa, Inc. was the primary aluminum supplier for the Pressure Cylinders operating segment in fiscal 2008.2010. Major suppliers of zinc to the Steel Processing operating segment were, in
alphabetical order: Considar Metal Marketing Inc. (a/k/a HudBay),; Industrias Peñoles,oles; Teck Cominco LimitedLimited; U.S. Zinc; and Xstrata Zinc Canada. Approximately 3529 million pounds of zinc were purchased in fiscal 2008.2010. Worthington believes its supplier relationships are good.
Technical Services
Worthington employs a staff of engineers and other technical personnel and maintains fully equipped laboratories to support operations. These facilities enable verification, analysis and documentation of the physical, chemical, metallurgical and mechanical properties of raw materials and products. Technical service personnel also work in conjunction with the sales force to determine the types of flat-rolled steel required for customer needs. Additionally, technical service personnel design and engineer metal framing structures and provide sealed shop drawings to the building construction markets. To provide these services, Worthington maintains a continuing program of developmental engineering with respect to product characteristics and performance under varying conditions. Laboratory facilities also perform metallurgical and chemical testing as dictated by the regulations of the U.S.United States Department of Transportation, Transport Canada, and other associated agencies, along with International Organization for Standardization (ISO) and customer requirements. All design work complies with applicable current local and national building code requirements. An IAS (International Accreditations Service, Incorporated) accredited product-testing laboratory supports these design efforts.
Seasonality and Backlog
Sales are generally weaker in the third quarter of the fiscal year, primarily due to reduced activity in the building and construction industry as a result of the weather, as well as customer plant shutdowns in the automotive industry due to holidays. Sales are generally strongest in the fourth quarter of the fiscal year when all of the segments are normally operating at seasonal peaks.
We do not believe backlog is a significant indicator of our business.
Employees
As of May 31, 2008,2010, Worthington employed approximately 6,9006,400 employees in its operations, excluding theincluding unconsolidated joint ventures. Approximately 14%13% of these employees were represented by collective bargaining units. Worthington believes it has good relationships with its employees in general, including those covered by collective bargaining units.
Joint Ventures
As part of a strategy to selectively develop new products, markets and technological capabilities and to expand an international presence, while mitigating the risks and costs associated with those activities, Worthington participates in one consolidated and nineseven unconsolidated joint ventures.
Consolidated
Spartan Steel Coating, LLC (“Spartan”) is a 52%-owned consolidated joint venture with a subsidiary of Severstal North America, Inc. (“Severstal”), located in Monroe, Michigan. It operates a cold-rolled, hot-dipped galvanizing line for toll processing steel coils into galvanized and galvannealed products intended primarily for the automotive industry. Spartan’s financial results are fully consolidated into the Steel Processing reportable business segment. The equity ownership ofowned by Severstal is shown as minoritynoncontrolling interest on the Company’s consolidated balance sheets and itsSeverstal’s portion of operating incomenet earnings is eliminatedincluded as net earnings attributable to noncontrolling interest in miscellaneous expense on the Company’s consolidated statements of earnings.
Unconsolidated
| The Clark JV is a 50% |
|
|
Canessa Worthington Slovakia s.r.o. (“Canessa Worthington”), a 49%-owned joint venture with ClarkWestern Building Systems, Inc. The Magnetto Group, operates one manufacturing facility in Kosice, Slovakia. Canessa Worthington offers Class One steel processing servicespurpose of the Clark JV is to develop, test and obtain approvals for metal framing stud designs and to develop, own and license intellectual property related to such as slitting, blankingdesigns. The Clark JV does not manufacture or sell any products, but will license its designs to its members and cutting-to-length for customers throughout central Europe.possibly to third parties.
LEFCO Worthington, LLC (“LEFCO Worthington”), a 49%-owned joint venture with LEFCO Industries, LLC, is a minority business enterprise which offers engineered wooden crates, specialty pallets and steel rack systems for a variety of industries, including defense and automotive. LEFCO Worthington also mass produces the first light-weight, flame-resistant steel pallet designed to meet the Grocery Manufacturers Association’s capacity and compatibility standards.industries. LEFCO Worthington operates one manufacturing facility in Cleveland, Ohio.
Samuel Steel Pickling Company (“Samuel”), a 31.25%-owned joint venture with Samuel Manu-Tech Pickling, operates a steel pickling facility in Twinsburg, Ohio, and one in Cleveland, Ohio. Samuel specializes in in-line slitting, side trimming, pickle dry, under winding and the application of dry lube coatings during the pickling process.
Serviacero Planos, S.A. de C.V. (“Serviacero Worthington”), a 50%-owned joint venture with Inverzer, S.A. de C.V., operates twothree facilities in Mexico, one each in Leon, Queretaro and one in Queretaro.Monterrey. Serviacero Worthington provides steel processing services such as slitting, multi-blanking and cutting-to-length forto customers in a variety of industries including automotive, appliance, electronics and electronics related customers.heavy equipment.
TWB Company, L.L.C. (“TWB”), a 45%-owned joint venture with ThyssenKrupp Steel North America, Inc., is a leading North American supplier of tailor welded blanks, manufacturing 13 million per year.blanks. TWB produces laser-welded blanks for use in the automotive industry for products such as inner-door panels, bodysides,body sides, rails and pillars. TWB operates facilities inin: Prattville, Alabama; Monroe, Michigan; Columbus, Indiana; and in Puebla, Ramos Arizpe (Saltillo) and Hermosillo, Mexico.
Viking & Worthington Steel Enterprise, LLC (“VWSE”), a joint venture with Bainbridge Steel, LLC, an affiliate of Viking Industries, LLC, operates a steel processing facility in Valley City, Ohio. VWSE closed its manufacturing operations in June 2008 and its business will be reorganized or wound down.
Worthington Armstrong Venture (“WAVE”), a 50%-owned joint venture with Armstrong Ventures, Inc., a subsidiary of Armstrong World Industries, Inc., is one of fourthe three largest global manufacturers and multiple smaller international manufacturers of suspension grid systems for concealed and lay-in panel ceilings used in commercial and residential ceiling markets. It competes with the two other global manufacturers and numerous smaller manufacturers. WAVE operates seveneight facilities in fivesix countries: Aberdeen, Maryland; Benton Harbor, Michigan; and North Las Vegas, Nevada, within the United States; Shanghai, the Peoples Republic of China; Team Valley, United Kingdom; Valenciennes,Prouvy, France; Marval, Pune, India; and Madrid, Spain.
Worthington Specialty Processing (“WSP”), a 50%51%-owned joint venture with United StatesU.S. Steel, Corporation (“U.S. Steel”), operates athree steel processing facilityfacilities located in Canton, Jackson Michigan. The facility isand Taylor, Michigan, which are managed by Worthington Steel andSteel. WSP serves primarily as a toll processor for U.S. Steel.Steel and others. Its services include slitting, blanking, cutting-to-length, laser welding, tension leveling and warehousing. WSP processesis considered to be jointly controlled and not consolidated due to substantive participating rights of the minority partner.
|
See “Item 8. – Financial Statements and Supplementary Data – Notes to Consolidated Financial Statements – Note J – Investments in Unconsolidated Affiliates” for further information about Worthington’s participation in unconsolidated joint ventures.
Environmental Regulation
Worthington’s manufacturing facilities, generally in common with those of similar industries making similar products, are subject to many federal, state and local requirements relating to the protection of the environment. Worthington continually examines ways to reduce emissions and waste and to decrease costs related to environmental compliance. The cost of compliance or capital expenditures for environmental control facilities required to meet environmental requirements are not anticipated to be material when compared with overall costs and capital expenditures and, accordingly, are not anticipated to have a material effect on the financial position, results of operations, or cash flows, or the competitive position of the Company.
Future results and the market price for Worthington Industries’ common shares are subject to numerous risks, many of which are driven by factors that cannot be controlled or predicted. The following discussion, as well as other sections of this Annual Report on Form 10-K, including “Item 7. – Management’s Discussion and Analysis of Financial Condition and Results of Operations,” describe certain business risks. Consideration should be given to the risk factors described below as well as those in the Safe Harbor Statement at the beginning of this Annual Report on Form 10-K, in conjunction with reviewing the forward-looking statements and other information contained in this Annual Report on Form 10-K. These risks are not the only risks we face. Our business operations could also be affected by additional factors that are not presently known to us or that we currently consider to be immaterial in our operations.
Economic or Industry Downturns
The current global recession has adversely affected and is likely to continue to adversely affect our business and our industries, as well as the industries of many of our customers and suppliers. The volatile domestic and global recessionary climate is having significant negative impacts on our business. The global recession has resulted in a significant decrease in customer demand throughout nearly all of our markets, including our two largest markets – construction and automotive. The impacts of recent government approved and proposed measures, including various measures intended to provide stimulus to the economy in general or to certain industries, are currently unknown. Overall, operating levels across our businesses have fallen and may remain at depressed levels until economic conditions improve and demand increases.
Continued volatility in the United States and worldwide capital and credit markets has impacted and is likely to continue to significantly impact our end markets and result in continued negative impacts on demand, increased credit and collection risks and other adverse effects on our business. The domestic and worldwide capital and credit markets have experienced and are experiencing significant volatility, disruptions and dislocations with respect to price and credit availability. These have caused diminished availability of credit and other capital in our end markets, including automotive and construction, and for participants in, and the customers of, those markets. There is continued uncertainty as to when and if the capital and credit markets will improve and the impact this period of volatility will have on our end markets and business in general.
The construction and automotive industries account for a significant portion of our net sales, and reductions in demand from these industries have adversely impacted and are likely to continue to adversely affect our business. The overall downturn in the economy, the disruption in capital and credit markets, declining real estate values and reduced consumer spending have caused significant reductions in demand from our end markets in general and, in particular, the construction and automotive end markets.
Demand in the commercial and residential construction markets has weakened as it has become more difficult for companies and consumers to obtain credit for construction projects and the economic slowdown has caused delays in or cancellations of construction projects.
The domestic auto industry is currently experiencing a very difficult operating environment, which has resulted in and will likely continue to result in lower levels of vehicle production and an associated decrease in demand for products sold to the automotive industry. Many automotive manufacturers and their suppliers have reduced production levels and eliminated manufacturing capacity, through the closure of facilities, extension of temporary shutdowns, reduction in operations and other cost reduction actions. The difficulties faced by these industries are likely to continue to adversely affect our business.
Financial difficulties and bankruptcy filings by customers could have an adverse impact on our business. Many of our customers are experiencing extremely challenging financial conditions. General Motors and Chrysler have gone through bankruptcy proceedings and both companies have implemented
plans to significantly reduce production capacity and their dealership networks. Certain other customers have filed or are contemplating filing bankruptcy petitions. These and other customers may be in need of additional capital or credit to continue operations. The bankruptcies and financial difficulties of certain customers and/or failure in their efforts to obtain credit or otherwise improve their overall financial condition could result in numerous changes within the markets we serve, including additional plant closings, decreased production, reduced demand, changes in product mix, unfavorable changes in the prices, terms or conditions we are able to obtain and other changes that may result in decreased purchases from us and otherwise negatively impact our business. These conditions also increase the risk that our customers may default on their payment obligations to us, particularly customers in hard hit industries such as automotive and construction.
The overall weakness among automotive manufacturers and their suppliers has increased the risk that at least some of our customers, which are suppliers to the automotive industry, could have further financial difficulties. The same is true of our customers in other industries, including construction, which are also experiencing significant financial weakness. Should the economy or any applicable market not improve, the risk of bankruptcy filings by our customers will continue to increase. Such filings may result not only in a reduction in sales, but also in a loss associated with the potential inability to collect outstanding accounts receivable. While we take steps intended to mitigate the impact of financial difficulties and potential bankruptcy filings by our customers, these matters could have a negative impact on our business.
Raw Material PricesPricing and Availability
The costs of manufacturing our products and the ability to supply our customers could be negatively impacted if we experience interruptions in deliveries of needed raw materials or supplies. If, for any reason, our supply of flat-rolled steel or other key raw materials, such as aluminum and zinc, is curtailed or we are otherwise unable to obtain the quantities we need at competitive prices, our business could suffer and our financial results could be adversely affected. Such interruptions might result from a number of factors, including events such as a shortage of capacity in the supplier base or of the raw materials, energy or the inputs needed to make steel or other supplies, failure of suppliers to fulfill their supply obligations, financial difficulties of suppliers resulting in the closing or idling of supplier facilities, other significant events affecting supplier facilities, significant weather events, those factors listed in the immediately following paragraph or other factors beyond our control. Further, the number of suppliers has decreased in recent years due to industry consolidation and the financial difficulties of certain suppliers, and consolidation may continue. Accordingly, if delivery from a major supplier is disrupted, it may be more difficult to obtain an alternative supply than in the past.
Our future operating results may be affected by fluctuations in raw material prices. Our principal raw material is flat-rolled steel, which we purchase from multiple primary steel producers. The steel industry as a whole has been cyclical, and at times availability and pricing can be volatile due to a number of factors beyond our control. Thesecontrol.These factors include general economic conditions, domestic and worldwide demand, curtailed production atfrom major millssuppliers due to factors such as the closing or idling of facilities, equipment breakdowns, repairs or catastrophic events, labor costs or problems, competition, import duties, tariffs, energy costs, availability and cost of steel inputs (e.g. ore, scrap, coke energy, etc.)and energy), currency exchange rates and other factors described below under “Raw Material Availability.”immediately in the preceding paragraph. This volatility can significantly affect our steel costs.
In an environment of increasing prices for steel and other raw materials, competitive conditions may impact how much of the price increases we can pass on to our customers. To the extent we are unable to pass on future price increases in our raw materials to our customers, our financial results could be adversely affected. Also, if steel prices decrease, in general, competitive conditions may impact how quickly we must reduce our prices to our customers and we could be forced to use higher-priced raw materials to complete orders for which the selling prices have decreased.
Raw Material Availability
The costs of manufacturing our products and the ability Decreasing steel prices may also require us to supply our customers could be negatively impacted if we experience interruptions in deliveries of needed raw materials or supplies. If, for any reason, our supply of flat-rolled steel or other key raw materials, such as aluminum and zinc, is curtailed or we arewrite-down
otherwise unablethe value of our inventory to obtainreflect current market pricing, as was the quantities we need at competitive prices, our business could suffercase during fiscal 2009. These write- downs are discussed further in “Item 7. – Management’s Discussion and our financial results could be adversely affected. Such interruptions might result from a numberAnalysis of factors including events such as a shortageFinancial Condition and Results of capacity in the supplier base or of the raw materials, energy or the inputs needed to make steel or other supplies, failure of suppliers to fulfill their supply obligations, financial difficulties of suppliers, significant events affecting supplier facilities, significant weather events, those factors listed above under “Raw Material Prices” or other factors beyond our control. Further, the number of suppliers has decreased in recent years due to industry consolidation and the financial difficulties of certain suppliers, and consolidation may continue. Accordingly, if delivery from a major supplier is disrupted, it may be more difficult to obtain an alternative supply than in the past.Operations.”
Inventories
Our business could be harmed if we fail to maintain proper inventory levels. We are required to maintain sufficient inventories to accommodate the needs of our customers including, in many cases, short lead times and just-in-time delivery requirements. Although we typically have customer orders in hand prior to placement of our raw material orders for Steel Processing, we anticipate and forecast customer demand for all operating segments. We purchase raw materials on a regular basis in an effort to maintain our inventory at levels that we believe are sufficient to satisfy the anticipated needs of our customers based upon orders, customer volume expectations, historic buying practices and market conditions. Inventory levels in excess of customer demand may result in the use of higher-priced inventory to fill orders reflecting lower selling prices, if steel prices have significantly decreased. These events could adversely affect our financial results. Conversely, if we underestimate demand for our products or if our suppliers fail to supply quality products in a timely manner, we may experience inventory shortages. Inventory shortages might result in unfilled orders, negatively impacting our customer relationships, and resulting in lost revenues, any of which could harm our business and adversely affect our financial results.
Economic or Industry DownturnsSuppliers and Customers
Downturns or weakness in the economy in general or in key industries, such as construction or automotive, may adversely affect our customers, which may cause the demand for our products and services to decline and adversely affect our financial results. Many of our customers are in industries and businesses that are cyclical in nature and affected by changes in general economic conditions or conditions specific to their respective markets, such as the construction and automotive industries. Product demand in our customer’s end markets is based on numerous factors such as interest rates, general economic conditions, consumer confidence, and other factors beyond our control. Downturns in demand from the construction industry, the automotive industry or any of the other industries we serve, or a decrease in the margins that we can realize from sales of our products to customers in any of these industries, could adversely affect our financial results.
Reduced construction activity, especially in office buildings, could negatively impact our financial results. The construction market is a key end market with approximately 40% of our net sales going to that market in fiscal 2008. If construction activity in the United States, in general, or by one or more of our major customers, in particular, were to be reduced significantly, it could negatively affect our sales and financial results.
Reduced automotive/truck production and the financial difficulties of customers in this market could negatively impact our financial results. The automotive and truck market remains a key customer group with approximately 26% of the Company’s net sales derived from that market in fiscal 2008. If domestic automotive production, in general, or by one or more of our major domestic customers, in particular, were to be reduced significantly, it could negatively affect our sales and financial results.
The financial difficulties and internal strategies of customers could adversely affect us. A portion of our business is highly dependent on automotive manufacturers, many of which have publicly announced plans to
reduce production levels and eliminate excess manufacturing capacity including plans to eliminate jobs and reduce costs. These actions are impacting automotive suppliers who are also taking similar actions. Some customers in the construction and other industries are also experiencing cutbacks. The financial difficulties of certain customers and the efforts under way by our customers to improve their overall financial condition could result in numerous changes that are beyond our control, including additional unannounced customer plant closings, decreased production, changes in product mix or distribution patterns, volume reductions, labor disruptions, collectibility of our accounts receivable, mandatory reductions or other unfavorable changes in our pricing, terms or service conditions or market share losses, as well as other changes we may not accurately anticipate. These events could adversely impact our financial results.
The loss of significant volume from key customers could adversely affect us. us. In fiscal 2008,2010, our largest customer accounted for approximately 4%6% of our grossconsolidated net sales, and our ten largest customers accounted for approximately 24%27% of our grossconsolidated net sales. A significant loss of, or decrease in, business from any of these customers could have an adverse effect on our sales and financial results if we cannot obtain replacement business. Also, due to consolidation in the industries we serve, including the construction, automotive and retail industries, our gross sales may be increasingly sensitive to deterioration in the financial condition of, or other adverse developments with respect to, one or more of our top customers.
Many of our key industries, such as construction and automotive, are cyclical in nature. These industries can be impacted by both market demand and raw material supply, particularly steel. The demand for our products is directly related to, and quickly impacted by, customer demand in our industries, which can change as the result of changes in the general United States or worldwide economy and other factors beyond our control. Adverse changes in demand or pricing can have a negative effect on our business.
Significant sales reductions for any of the Detroit 3 automakers could have a negative impact on our business. Approximately half of the net sales of our Steel Processing operating segment and substantially all of the net sales of the Automotive Body Panels operating segment are to automotive-related customers. Although we do sell to the domestic operations of foreign automakers, a significant portion of our automotive sales are to Ford, General Motors, and Chrysler (the “Detroit 3”) and their suppliers.
The closing or relocation of customer facilities could adversely affect us. Our ability to meet delivery requirements and the overall cost of our products as delivered to a customer facility are important competitive factors. If customers close or move production facilities further away from our manufacturing facilities which can supply them, it can have an adverse effect on our ability to meet competitive conditions which could result in the loss of sales. Likewise, if customers move production facilities overseas, it can result in the loss of potential sales for the Company.
Sales conflicts with our customers and/or suppliers can adversely impact us. In some instances, we may compete with one or more customers and/or suppliers in pursuing the same business. Such conflicts can strain our relationships with those parties, which can adversely affect our future business with them.
The closing or idling of steel manufacturing facilities could have a negative impact on us. As steel makers have reduced their production capacities by closing or idling production lines in light of the current recessionary conditions, the number of facilities from which we can purchase steel, in particular certain specialty steels, has decreased. Accordingly, if delivery from a supplier is disrupted, particularly with respect to certain types of specialty steel, it may be more difficult to obtain an alternate supply than in the past. Also, these closures can have an adverse effect on the supplier’s on-time delivery performance which can have an adverse effect on our ability to meet our own delivery commitments and may have other adverse effects on our business.
The loss of key supplier relationships could adversely affect us. Over the years, our various manufacturing operations had developed relationships with certain steel and other suppliers which have been beneficial to us by providing more assured delivery and a more favorable all-in cost, which includes price and shipping costs. If those relationships are disrupted, it can have an adverse effect on delivery times and the overall cost of our raw materials, which can have a negative impact on our business.
Competition
Our business is highly competitive, and increased competition could negatively impact our financial results. Generally, the markets in which we conduct business are highly competitive. Competition for most of our products is primarily on the basis of price, product quality and our ability to meet delivery requirements. The current economic recession has also resulted in significant open capacity which could increase competitive presence. Competition may also increase if suppliers to or customers of our industries begin to more directly compete with our businesses through acquisition or otherwise. Increased competition could cause us to lose market share, increase expenditures, lower our margins or offer additional services at a higher cost to us, which could adversely impact our financial results.
Sales by competitors of light guage metal framing products which are not code compliant could adversely affect us. Our Metal Framing business has been an industry leader in driving code compliance for light gauge metal framing. If our competitors offer products which are not code compliant and thus are cheaper, and certain customers are willing to purchase such non-compliant products, it may be difficult for us to be cost competitive on these sales.
Material Substitution
In certain applications, steel competes with other materials, such as aluminum (particularly in the automobile industry), cement and wood (particularly in the construction industry), composites, glass and plastic. Prices of all of these materials fluctuate widely and differences between them and steel prices may adversely affect demand for our products and/or encourage substitution, which could adversely affect prices and demand for steel products. The sharp increase in thehigh cost of steel during fiscal 2008 couldrelative to other materials can make material substitution more attractive for certain uses.
Freight and Energy
The availability and cost of freight and energy, such as electricity, natural gas and diesel fuel, is important in the manufacture and transport of our products. Our operating costs increase when energy costs rise. During periods of increasing freight and energy costs, we might not be able to fully recover our operating cost increases through price increases without reducing demand for our products. Our financial results could be adversely affected if we are unable to pass all of the increases on to our customers or if we are unable to obtain the necessary freight and energy. Also, increasing energy costs could put a strain on the transportation of materials and products if it forces certain transporters to close.
Information Systems
We are subject to information system security risks and systems integration issues that could disrupt our internal operations. We are dependent upon information technology for the distribution of information internally and also to our customers and suppliers. This information technology is subject to damage or interruption from a variety of sources, including but not limited to computer viruses, security breaches and defects in design. There also could be system or network disruptions if new or upgraded business
management systems are defective or are not installed properly, or are not properly integrated into operations. We are currently in the process of implementingrecently implemented a new software-based enterprise resource planning system (“ERP”).system. Various measures have been implemented to manage our risks related to information system and network disruptions, but a system failure or failure to implement new systems properly could negatively impact our operations and financial results.
Business Disruptions
Disruptions to our business or the business of our customers or suppliers, could adversely impact our operations and financial results. Business disruptions, including increased costs for or interruptions in the supply of energy or raw materials, resulting from shortages of supply or transportation, from severe weather events (such as hurricanes, floods and blizzards), from casualty events (such as explosions, fires or material equipment breakdown), from acts of terrorism, from pandemic disease, from labor disruptions or from other events (such as required maintenance shutdowns), could cause interruptions to our businesses as well as the operations of our customers and suppliers. Such interruptionsWhile we maintain insurance coverage that can offset some losses relating to certain types of these events, losses from business disruptions could have an adverse effect on our operations and financial results.results and we can be adversely impacted to the extent any such losses are not covered by insurance or cause some other adverse impact to the us.
Foreign
Economic, political and other risks associated with foreign operations could adversely affect our international financial results. Although the substantial majority of our business activity takes place in the United States, we derive a portion of our revenues and earnings from operations in foreign countries, and are subject to risks associated with doing business internationally. We have wholly-owned facilities in Austria, Canada, the Czech Republic and Portugal and joint venture facilities in China, France, India, Mexico, Slovakia, Spain and the United Kingdom. Our Mid-Rise Construction business is also becoming more active in pursuing foreign business. The risks of doing business in foreign countries includeinclude: the potential for adverse changes in the local political climate, in diplomatic relations between foreign countries and the United States or in government policies, laws or regulations; terrorist activity that may cause social disruption; logistical and communications challenges; costs of complying with a variety of laws and regulations; difficulty in staffing and managing geographically diverse operations; deterioration of foreign economic conditions; currency rate fluctuations; foreign exchange restrictions; differing local business practices and cultural considerations; restrictions on imports and exports or sources of supply; and changes in duties or taxes.taxes; and potential issues related to matters covered by the Foreign Corrupt Practices Act or similar laws. We believe that our business activities outside of the United States involve a higher degree of risk than our domestic activities.
The global recession and the volatility of worldwide capital and credit markets have impacted and will likely continue to significantly impact our foreign customers and markets. This has decreased demand in our foreign operations and is having significant negative impacts on our business. See, in general, the discussion under“Economic or Industry Downturns” above.
Joint Ventures
A change in the relationship between the members of any of our joint ventures may have an adverse effect on that joint venture. Worthington has been successful in the development and operation of various joint ventures, and equity in net income from our joint ventures, particularly WAVE, has been important to our
financial results. We believe an important element in the success of any joint venture is a solid relationship between the members of that joint venture. If there is a change in ownership, a change of control, a change in management or otheranother event with respect to a member that adversely impacts the relationship between the members, it may adversely impact the joint venture.
Acquisitions
We may not be able to consummate, manage and integrate future acquisitions successfully. Some of our growth has been through acquisitions. We continue to seek additional businesses to acquire in the future. There are no assurances, however, that any acquisition opportunities will arise or, if they do, that they will be consummated, or that any needed additional financing will be available on satisfactory terms when required. In addition, acquisitions involve risks that the businesses acquired will not perform in accordance with expectations, that business judgments concerning the value, strengths and weaknesses of businesses acquired will prove incorrect, that the acquired businesses may not be integrated successfully and that the acquisitions may strain our management resources.
Accounting & Tax Estimates
We are required to make accounting and tax-related estimates and judgments in preparing our consolidated financial statements. In preparing our consolidated financial statements in accordance with accounting principles generally accepted in the United States, we make certain estimates and assumptions that affect the accounting for and recognition of assets, liabilities, revenues and expenses. These estimates and assumptions must be made because certain information that is used in the preparation of our consolidated financial statements is dependent on future events, or cannot be calculated with a high degree of precision from data available. In some cases, these estimates are particularly difficult to determine and we must exercise significant judgment. The estimates and the assumptions having the greatest amount of uncertainty, subjectivity and complexity are related to our accounting for bad debts, returns and allowances, inventory, self-insurance reserves, derivatives, stock-based compensation, deferred income taxes and asset impairments. Actual results could differ materially from the estimates and assumptions that we use, which could have a material adverse effect on our financial condition and results of operations.
Claims and Insurance
Adverse claims experience, to the extent not covered by insurance, may have an adverse effect on our financial results. We self-insure a significant portion of our potential liability for workers’ compensation, product liability, general liability, property, automobile liability stop loss and employee medical claims. In order to reduce risk, we purchase insurance from highly rated, licensed insurance carriers that covers most claims in excess of the deductible or retained amounts. We maintain an accrualreserves for the estimated cost to resolve open claims as well as an estimate of the cost of claims that have been incurred but not reported. The occurrence of significant claims, our failure to adequately reserve for such claims, a significant cost increase to maintain our insurance or the failure of our insurance provider to perform could have an adverse impact on our financial condition and results of operations.
Principal Shareholder
Our principal shareholder may have the ability to exert significant influence in matters requiring a shareholder vote and could delay, deter or prevent a change in control of Worthington Industries. Pursuant to our charter documents, certain matters such as those in which a person would attempt to acquire or take control of the Company, must be approved by the vote of the holders of common shares representing at least 75% of Worthington Industries’ outstanding voting power. Approximately 23%22% of our outstanding common shares may be votedare beneficially owned by John P. McConnell, our Chairman of the Board and Chief Executive Officer. As a result of his voting power, John P.beneficial ownership, Mr. McConnell may have the ability to exert significant influence in these matters and other proposals upon which our shareholders vote.
Credit Ratings
Rating agencies may downgrade our credit ratings, which could make it more difficult for us to raise capital and could increase our financing costs. Any downgrade in our credit ratings may make raising capital more difficult, may increase the cost and affect the terms of future borrowings, may affect the terms under which we purchase goods and services and may limit our ability to take advantage of potential business opportunities. The rate on some of our credit facilities is tied to our credit rating. Any downgrade would likely result in an increase in the current cost of our revolving credit facility.
Difficult Financial Markets
Should we be required to raise capital in the current financing environment, potential outcomes might include higher borrowing costs, less available capital, more stringent terms and tighter covenants, or in extreme conditions, an inability to raise capital. Although we currently have significant borrowing availability under our existing credit facilities, should those facilities become unavailable due to covenant or other defaults, or should we otherwise be required to raise capital outside existing facilities, given the current uncertainty in the financial markets, our ability to access capital and the terms under which we do so may change. Any adverse change in our access to capital or the terms of our borrowings, including increased costs, would have a negative impact on us.
Environmental, Health and Safety
We may incur additional costs related to environmental and health and safety matters. Our operations and facilities are subject to a variety of federal, state, local and foreign laws and regulations relating to the protection of the environment and human health and safety. Failure to maintain or achieve compliance with these laws and regulations or with the permits required for our operations could result in increased costs and capital expenditures and potentially fines and civil or criminal sanctions, third-party claims for property damage or personal injury, cleanup costs or temporary or permanent discontinuance of operations. Over time, we and other predecessor operators of our facilities have generated, used, handled and disposed of hazardous and other regulated wastes. Environmental liabilities could exist, including cleanup obligations at these facilities or at off-site locations where materials from our operations were disposed of or at facilities we have divested, which could result in future expenditures that cannot be currently quantified and which could reduce our profits and cash flow. We may be held strictly liable for the contamination of these sites, and the amount of that liability could be material. Due to our stringent commitment toward safety, it is probable that we may incur costs which exceed compliance in many areas. Under the “joint and several” liability principle of certain environmental laws, we may be held liable for all remediation costs at a particular site, even with respect to contamination for which we are not responsible. Changes in environmental laws, regulations or enforcement policies, including without limitation new or more stringent regulations affecting greenhouse gas emissions, could have a material adverse effect on our business, financial condition or results of operations.
Legislation and Regulation
Certain proposed legislation and regulations can have an adverse impact on the economy in general and in our markets specifically, which may adversely affect our business. For example, legislation and regulations proposing increases in taxation on or heightened regulation of carbon emissions may result in higher prices for steel, higher prices for utilities required to run our facilities, higher fuel costs for us and our shippers and other adverse impacts. To the extent this or other new legislation or regulation increases our costs, we may not be able to fully pass these costs on to our customers without a resulting decline in sales and adverse impact to our profits. Likewise, to the extent new legislation or regulation would have an adverse effect on the economy, our markets or the ability of domestic businesses to compete against foreign operations, it could also have an adverse impact on us.
Impairment Charges
Continued or enhanced weakness in the economy, our markets or our results of operations could result in future asset impairments, which would reduce our reported earnings and net worth. We review the carrying value of our long-lived assets, including intangible assets with finite useful lives, whenever events or changes in circumstances indicate that the carrying value of an asset or a group of assets may not be recoverable. When a potential impairment is indicated, accounting standards require a charge to be recognized in the consolidated financial statements if the carrying amount of an asset or group of assets exceeds the fair value of that asset or group of assets. The loss recognized would be the difference between the fair value and the carrying amount of the asset or group of assets.
Item 1B. — Unresolved Staff Comments
No response required.None.
Item 2. — PropertiesProperties.
General
The principal corporate offices of Worthington Industries, as well as the corporate offices for Worthington Steel, Worthington Cylinders and Worthington Steel,Dietrich, are located in a leased office building in Columbus, Ohio, containing approximately 117,700 square feet. Worthington also owns three facilities used for administrative and medical facilitiespurposes in Columbus, Ohio, containing an aggregate of approximately 166,000 square feet. The corporate and administrative offices of Dietrich Metal Framing are being relocated from Pennsylvania to Columbus, OH in calendar 2008. As of May 31, 2008,2010, Worthington owned or leased a total of approximately 9,500,0009,700,000 square feet of space for operations, of which approximately 8,000,0008,200,000 square feet (9,100,000(9,200,000 square
feet with warehouses) was devoted to manufacturing, product distribution and sales offices. Major leases contain renewal options for periods of up to ten years. For information concerning rental obligations, see the discussion of contractual obligations under “Item 7. – Management’s Discussion and Analysis of Financial Condition and Results of Operations –Contractual Cash Obligations and Other Commercial Commitments” as well as “Item 8. – Financial Statements and Supplementary Data – Notes to Consolidated Financial Statements – Note L – Operating Leases” of this Annual Report on Form 10-K. DistributionWorthington believes the distribution and office facilities provide adequate space for operations and are well maintained and suitable.
Excluding joint ventures, Worthington operates 4441 manufacturing facilities and twelveten warehouses. The manufacturing facilities are generally well maintained and in good operating condition, and are believed to be sufficient to meet current needs.
Steel Processing
The Steel Processing operating segment, which includes the consolidated joint venture Spartan, operates ten manufacturing facilities, nine of which are wholly-owned, containing a total of approximately 2,990,0002,860,000 square feet, and one of which is leased, containing approximately 228,500150,000 square feet. These facilities are located in Alabama, California, Indiana, Kentucky, Maryland, Michigan (2), and Ohio (3)(4). This operating segment also owns one warehouse in Ohio, containing approximately 110,000 square feet, one warehouse in Michigan, containing approximately 100,000 square feet, and one warehouse in California, containing approximately 60,000 square feet. As noted above, itsthis operating segment’s corporate offices are located in Columbus, Ohio.
Pressure Cylinders
The Pressure Cylinders operating segment operates nine owned manufacturing facilities and one leased manufacturing facility, which are located in California, Mississippi, Ohio (3), Wisconsin, Austria, Canada, the Czech Republic and Portugal, containing a total of approximately 1,800,000 square feet. The Pressure
Cylinders operating segment also operates two owned warehouses, one in Austria and one in Czech Republic, containing a total of approximately 97,000 square feet and two leased warehouses, one in Ohio and one in Canada, containing a total of approximately 95,000 square feet.
Metal Framing
The Metal Framing operating segment operates 2214 manufacturing facilities: 20 in the United States and two in Canada. In the United States, thesefacilities. These facilities are located in Arizona, California (2), Colorado, Florida, (2), Georgia, Hawaii, Illinois, Indiana, Kansas, Maryland, Massachusetts, New Jersey, Ohio (2), South Carolina,and Texas (2), and Washington. The facilities in Canada are located in British Columbia and Ontario.. Of these manufacturing facilities, 12seven are leased, containing a total of approximately 880,000490,000 square feet, and 10seven are owned, containing a total of approximately 1,500,0001,300,000 square feet. This operating segment operates three warehouses — one warehouse in Ohio which is owned and contains approximately 314,000 square feet and two in Canada which are leased and contain approximately 36,000 square feet. This operating segment also owns and operates an administrative facility containing approximately 37,000 square feet in Indiana; and leases administrative space in three locations, containing an aggregate of approximately 40,00030,000 square feet, in California, Indiana and Pennsylvania (2). The PennsylvaniaPennsylvania. During fiscal 2009, the Metal Framing corporate and administrative offices are beingwere closed and will movemoved from Pennsylvania to Columbus, Ohio by the end of calendar 2008.Ohio. As part of the RestructuringTransformation Plan announced by the Company in September 2007, this operating segment has ceased manufacturing operations at eleven facilities: two owned and nine leased facilities — of which one lease expires in August 2008 and the other in 2011, which is being offered for sublet — and at onefacilities. The two owned manufacturing facilities both of which are currently up for sale.
Pressure Cylinders
The Pressure Cylinders segment operates Of the leased facilities, one lease expired concurrently with the closing of the facility and the other eight owned manufacturing facilities located in Ohio (3), Wisconsin, Austria, Canada, the Czech Republicleases, which expire between 2010 and Portugal containing approximately 1,200,000 square feet and two owned warehouses in Canada and Czech Republic containing approximately 121,000 square feet.2015, are being offered for subletting.
Other
Steelpac operates three facilities, one each in Indiana, Ohio and Pennsylvania. The manufacturing facilities in Indiana and Pennsylvania are leased manufacturingand contain a total of approximately 290,000 square feet; and the facility located in Pennsylvania.Ohio is owned and contains approximately 21,000 square feet. Gerstenslager owns and operates two manufacturing facilities, both located in Ohio, containing a total of approximately 1,200,0001,100,000 square feet; leases approximately 150,000 square feet in one warehouse in Ohio; and owns approximately 135,000 square feet in one warehouse in Ohio. Military Construction operates a manufacturing facility in Tennessee which contains approximately 4,500 square feet and leases approximately 616,0001,800 square feet for administrative offices in Hawaii. Mid-Rise Construction leases and operates a manufacturing facility in Washington which contains approximately 19,000 square feet and leases administrative space containing approximately 16,500 square feet in six warehouses throughout Ohio. Construction Services operates manufacturing facilities in Ohio and Washington and leases approximately 4,800 square feet for three administrative offices in Hawaii, Tennessee and China. The newly acquired SharonCommercial Stairs operation leases one manufacturing facility in Akron, Ohio, which has not been included in this count.contains approximately 200,000 square feet.
Joint Ventures
The Spartan consolidated joint venture owns and operates one manufacturing facility in Michigan, which is included in the number disclosed above for the Steel Processing operating segment. The unconsolidated joint ventures operate a total of 2123 manufacturing facilities, located in Alabama, Indiana, Kentucky, Maryland, Michigan (3)(6), Missouri, Nevada and Ohio (2)(4), domestically, and in China, France, India, Mexico (5)(6), Slovakia, Spain and the United Kingdom, internationally.
Various legal actions,proceedings, which generally have arisen in the ordinary course of business, are pending against Worthington. None of this pending litigation, individually or collectively, is expected to have a material adverse effect on the financial position, results of operation or cash flows of the Company.
Notwithstanding the statement above, see “Item 8 – Financial Statements and Supplementary Data– Notes to Consolidated Financial Statements – Note G – Contingent Liabilities and Commitments” within this Annual Report on Form 10-K for additional information regarding certain litigation during fiscal 2010.
Item 4. — Submission of Matters to a Vote of Security Holders[Reserved]
No response required.
Supplemental Item — Executive Officers of the Registrant
The following table lists the names, positions held and ages of the Registrant’s executive officers as of July 30, 2008:2010:
Name | Age | Position(s) with the Registrant | Present Office Held Since | Age | Position(s) with the Registrant | Present Office Held Since | ||||||
John P. McConnell | 54 | Chairman of the Board and Chief Executive Officer; a Director | 1996 | 56 | Chairman of the Board and Chief Executive Officer; a Director | 1996 | ||||||
John S. Christie | 58 | President and Chief Financial Officer; a Director | 2004 | |||||||||
George P. Stoe | 62 | Executive Vice President and Chief Operating Officer | 2007 | 64 | President and Chief Operating Officer | 2008 | ||||||
B. Andrew Rose | 40 | Vice President and Chief Financial Officer | 2008 | |||||||||
Dale T. Brinkman | 55 | Vice President-Administration, General Counsel and Secretary | 2000 | 57 | Vice President-Administration, General Counsel and Secretary | 2000 | ||||||
Harry A. Goussetis | 54 | President, Worthington Cylinder Corporation | 2005 | 56 | President, Worthington Cylinder Corporation | 2005 | ||||||
Lester V. Hess | 53 | Treasurer | 2006 | |||||||||
Matthew A. Lockard | 41 | Vice President-Corporate Development and Treasurer | 2009 | |||||||||
John E. Roberts | 53 | President, Dietrich Industries, Inc. | 2007 | 55 | President, Dietrich Industries, Inc. | 2007 | ||||||
Ralph V. Roberts | 61 | Senior Vice President-Marketing; President, Worthington Integrated Building Systems, LLC | 2006 | 63 | Senior Vice President-Marketing | 2006 | ||||||
Mark A. Russell | 45 | President, The Worthington Steel Company | 2007 | 47 | President, The Worthington Steel Company | 2007 | ||||||
Eric M. Smolenski | 40 | Vice President-Human Resources | 2005 | |||||||||
Richard G. Welch | 50 | Controller | 2000 | 52 | Controller | 2000 | ||||||
Virgil L. Winland | 60 | Senior Vice President-Manufacturing | 2001 | 62 | Senior Vice President-Manufacturing | 2001 | ||||||
John P. McConnell has served as Worthington Industries’ Chief Executive Officer since June 1993, as a director of Worthington Industries continuously since 1990, and as Chairman of the Board of Worthington Industries since September 1996. Mr. McConnell serves as the Chair of the Executive Committee of Worthington Industries’ Board of Directors. He has served in various positions with Worthington Industries since 1975.
John S. ChristieGeorge P. Stoe has served as President and as a director of Worthington Industries continuously since June 1999. He became interim Chief Financial Officer of Worthington Industries in September 2003 and Chief Financial Officer in January 2004. He also served as Chief Operating Officer of Worthington Industries from June 1999 until September 2003. Mr. Christie will retire from his positions as President and Chief Financial Officer and a director of Worthington Industries on July 31,since October 2008.
George P. Stoe has He served as Executive Vice President and Chief Operating Officer of Worthington Industries sincefrom December 2005.2005 to October 2008. He alsopreviously served as President of Worthington Cylinder Corporation from January 2003 to December 2005.
B. Andrew ‘Andy’ Rose has served as Vice President and Chief Financial Officer of Worthington Industries since December 2008. From 2007 to 2008, he served as a senior investment professional with MCG Capital Corporation; and from 2002 to 2007, he was a founding partner at Peachtree Equity Partners, L.P., a private equity firm backed by Goldman Sachs. Prior to 2002, Mr. Rose was vice president of private equity at Wachovia Capital Associates, a private equity firm.
Dale T. Brinkman has served as Worthington Industries’ Vice President-Administration since December 1998 and General Counsel since September 1982. He has been Secretary of Worthington Industries since September 2000 and served as Assistant Secretary of Worthington Industries from September 1982 to September 2000.
Harry A. Goussetis has served as President of Worthington Cylinder Corporation since December 2005. From January 2001 to December 2005, Mr. Goussetis served as Vice President-Human Resources for Worthington Industries, and he held various other positions with Worthington Industries from November 1983 to January 2001.
Lester V. Hess
Matthew A. Lockard has served as Treasurer of Worthington Industries as Treasurer since February 2006. Prior thereto, he served2009, and as Vice President-Corporate Development of Worthington Industries since July 2005. From April 2001 to July 2005, Mr. Lockard served as Assistant TreasurerVice President-Global Business Development for Worthington Cylinder Corporation. Mr. Lockard served in various other positions with Worthington Industries from November 2003January 1994 to February 2006; and as Director of Treasury from August 2002 to November 2003.April 2001.
John E. Roberts has served as President of Dietrich Industries, Inc. since October 2007, and prior thereto, served as its Vice President of Sales and Marketing from June 2007 to October 2007. He was Regional General Manager, Director of Sales and Marketing for Owens Corning, a producer of residential and commercial building materials, glass fiber reinforcements and engineered materials for composite systems, from June 1996 through June 2007.
Ralph V. Roberts has served as President of Worthington Integrated Building Systems, LLC since November 2006; and has been Senior Vice President-Marketing of Worthington Industries since January 2001.2001, and served as President of Worthington Integrated Building Systems, LLC from November 2006 to January 2010. From June 1998 through January 2001, he served as President of The Worthington Steel Company, and he has held various other positions with Worthington Industries sincefrom December 1973 to June 1998, including Vice President-Corporate Development and Chief Executive Officer of the WAVE joint venture.
Mark A. Russell has served as President of The Worthington Steel Company since February 2007. From August 2004 through February 2007, Mr. Russell was a Partnerpartner in Russell & Associates, an acquisition group formed to acquire aluminum products companies. Mr. Russell served as Chief Executive Officer of Indalex Inc., a producer of extruded aluminum products, from January 2002 to March 2004.
Eric M. Smolenski has served as Vice President-Human Resources of Worthington Industries since January 2004. From January 2001 to January 2004, Mr. Smolenski served as the Director of Corporate Human Resources Services of Worthington Industries, and he served in various other positions with Worthington Industries from January 1994 to January 2001.
Richard G. Welch has served as the Corporate Controller of Worthington Industries since March 2000. He2000 and prior thereto, he served as Assistant Controller of Worthington Industries from SeptemberAugust 1999 to March 2000. He served as Principal Financial Officer of Worthington Industries on an interim basis from September 2008 to December 2008.
Virgil L. Winland has served as Senior Vice President-Manufacturing of Worthington Industries since January 2001. He has served in various other positions with Worthington Industries sincefrom 1971 to January 2001, including President of Worthington Cylinder Corporation from June 1998 through January 2001.
Executive officers serve at the pleasure of the directors of the Registrant. There are no family relationships among any of the Registrant’s executive officers or directors. No arrangements or understandings exist pursuant to which any individual has been, or is to be, selected as an executive officer of the Registrant.
PART II
Item 5.—Market for Registrant’s Common Equity, Related Stockholder Matters and Issuer Purchases of Equity Securities
Common Shares Information
The common shares of Worthington Industries, Inc. (“Worthington Industries”) trade on the New York Stock Exchange (“NYSE”) under the symbol "WOR"“WOR” and are listed in most newspapers as "WorthgtnInd."“WorthgtnInd.” As of July 24, 2008,23, 2010, Worthington Industries had 8,4377,141 registered shareholders. The following table sets forth (i) the low and high closing prices and the closing price per share for Worthington Industries’ common shares for each quarter of fiscal 20082010 and fiscal 2007,2009, and (ii) the cash dividends per share declared on Worthington Industries’ common shares duringfor each quarter of fiscal 20082010 and fiscal 2007.2009.
| Market Price | Cash Dividends Declared | |||||||||||
| Low | High | Closing | ||||||||||
Fiscal 2008 Quarter Ended | ||||||||||||
August 31, 2007 | $ | 19.60 | $ | 23.00 | $ | 21.16 | $ | 0.17 | ||||
November 30, 2007 | $ | 20.38 | $ | 25.86 | $ | 21.19 | $ | 0.17 | ||||
February 29, 2008 | $ | 14.58 | $ | 22.87 | $ | 17.59 | $ | 0.17 | ||||
May 31, 2008 | $ | 16.00 | $ | 19.94 | $ | 19.94 | $ | 0.17 | ||||
Fiscal 2007 Quarter Ended | ||||||||||||
August 31, 2006 | $ | 16.36 | $ | 21.74 | $ | 19.11 | $ | 0.17 | ||||
November 30, 2006 | $ | 16.64 | $ | 19.58 | $ | 18.50 | $ | 0.17 | ||||
February 28, 2007 | $ | 16.84 | $ | 20.42 | $ | 19.91 | $ | 0.17 | ||||
May 31, 2007 | $ | 18.28 | $ | 23.25 | $ | 21.11 | $ | 0.17 | ||||
| Market Price | Cash Dividends Declared | |||||||||||
| Low | High | Closing | ||||||||||
Fiscal 2010 Quarter Ended | ||||||||||||
August 31, 2009 | $ | 11.19 | $ | 15.49 | $ | 13.17 | $ | 0.10 | ||||
November 30, 2009 | $ | 11.05 | $ | 15.95 | $ | 11.71 | $ | 0.10 | ||||
February 28, 2010 | $ | 11.47 | $ | 17.35 | $ | 15.84 | $ | 0.10 | ||||
May 31, 2010 | $ | 13.95 | $ | 17.67 | $ | 14.72 | $ | 0.10 | ||||
Fiscal 2009 Quarter Ended | ||||||||||||
August 31, 2008 | $ | 16.65 | $ | 24.11 | $ | 17.60 | $ | 0.17 | ||||
November 30, 2008 | $ | 8.83 | $ | 18.99 | $ | 13.28 | $ | 0.17 | ||||
February 28, 2009 | $ | 8.20 | $ | 13.89 | $ | 8.20 | $ | 0.17 | ||||
May 31, 2009 | $ | 7.15 | $ | 15.88 | $ | 13.99 | $ | 0.10 | ||||
Dividends are declared at the discretion of the Worthington IndustriesIndustries’ Board of Directors. Worthington IndustriesIndustries’ Board of Directors declared quarterly dividends of $0.17 per common share in fiscal 2008 and2009, until reducing the dividend declared in the fourth quarter of fiscal 2007.2009 to $0.10 per common share. A $0.10 per common share dividend was declared for each quarter of fiscal 2010. The Board of Directors reviews the dividend on a quarterly basis and establishes the dividend rate based upon Worthington Industries’ financial condition, results of operations, capital requirements, current and projected cash flows, business prospects and other factors which the directors may deem relevant. While Worthington Industries has paid a dividend every quarter since becoming a public company in 1968, there is no guarantee that this will continue in the future.
Shareholder Return Performance
The following information in this Item 5 of this Annual Report on Form 10-K is not deemed to be “soliciting material” or to be “filed” with the Securities and Exchange Commission or subject to Regulation 14A or 14C under the Securities Exchange Act of 1934, as amended (the “Exchange Act”), or to the liabilities of Section 18 of the Exchange Act, and will not be deemed to be incorporated by reference into any filing under the Securities Act of 1933, as amended, or the Exchange Act, except to the extent we specifically incorporate such information into such a filing.
The following graph compares the five-year cumulative return on Worthington Industries’ common shares, the S&P Midcap 400 Index and the S&P 1500 Steel Composite Index. The graph assumes that $100.00$100 was invested at May 31, 2003,2005, in Worthington Industries’ common shares and each index.
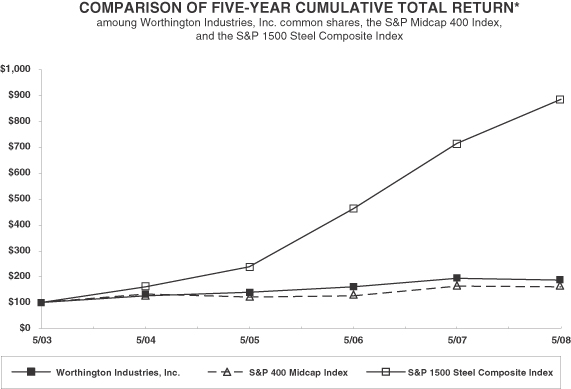
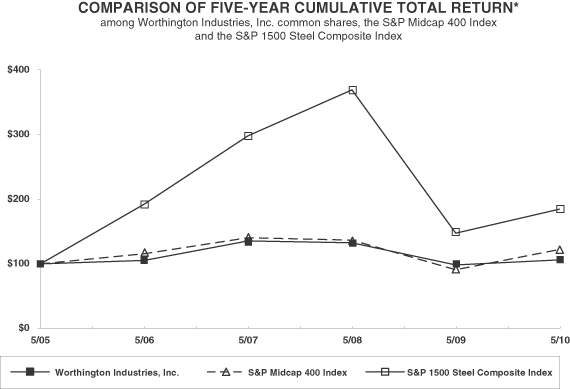
* $100 invested on 5/31/0305 in stockcommon shares or index. Assumes reinvestment of dividends when received. Fiscal year ending May 31.
| 5/03 | 5/04 | 5/05 | 5/06 | 5/07 | 5/08 | |||||||
Worthington Industries, Inc. | 100.00 | 133.44 | 120.74 | 127.25 | 163.83 | 160.29 | ||||||
S&P Midcap 400 | 100.00 | 125.32 | 141.20 | 161.33 | 193.09 | 185.86 | ||||||
S&P 1500 Steel Composite | 100.00 | 160.85 | 239.46 | 462.03 | 715.17 | 884.73 |
| 5/05 | 5/06 | 5/07 | 5/08 | 5/09 | 5/10 | |||||||||||||
Worthington Industries, Inc. | $ | 100.00 | $ | 105.34 | $ | 135.33 | $ | 132.32 | $ | 98.00 | $ | 106.08 | ||||||
S&P Midcap 400 Index | $ | 100.00 | $ | 115.57 | $ | 140.05 | $ | 136.55 | $ | 90.81 | $ | 122.16 | ||||||
S&P 1500 Steel Composite Index | $ | 100.00 | $ | 192.33 | $ | 297.80 | $ | 368.45 | $ | 147.06 | $ | 184.82 | ||||||
Data and graph provided by Zacks Investment Research, Inc. Copyright© 2010, Standard & Poor’s, a division of The McGraw-Hill Companies, Inc. All rights reserved. Used with permission.
Worthington Industries becameis a partcomponent of the S&P Midcap 400 Index on December 17, 2004.Index. The S&P 1500 Steel Composite Index, of which Worthington Industries is a component, is the most specific index relative to the largest line of business of Worthington Industries and its subsidiaries. At May 31, 2008,2010, the indexS&P 1500 Steel Composite Index included 1112 steel related companies from the S&P 500, S&P Midcap 400 and S&P 600 indices: AK Steel Holding Corporation; Allegheny Technologies Incorporated; Carpenter Technology Corporation; A.M. Castle & Co.; Cleveland-CliffsCarpenter Technology Corporation; Cliffs Natural Resources Inc.; Commercial Metals Company; Nucor Corporation; Olympic Steel, Inc.; Reliance Steel & Aluminum Co.; Steel Dynamics, Inc.; United States Steel Corporation; and Worthington Industries.
Issuer Purchases of Equity Securities
No common shares of Worthington Industries were purchasedThe following table provides information about purchases made by, or on behalf of, Worthington Industries, Inc. or any “affiliated purchaser” (as defined in Rule 10b – 18(a) (3) under the Securities Exchange Act)Act of 1934, as amended) of common shares of Worthington Industries, Inc. during each month of the fiscal quarter ended May 31, 2008. The following table provides information about the number of common shares of Worthington Industries that may yet be purchased under the publicly announced repurchase authorization:2010:
| ||||||||
| ||||||||
| ||||||||
| ||||||||
|
Period | Total Number of Common Shares Purchased | Average Price Paid per Common Share | Total Number of Common Shares Purchased as Part of Publicly Announced Plans or Programs | Maximum Number of Common Shares that May Yet Be Purchased Under the Plans or Programs (1) | ||||||
March 1-31, 2010 | 12,137 | (2) | $ | 17.41 | - | 8,449,500 | ||||
April 1-30, 2010 | - | - | - | 8,449,500 | ||||||
May 1-31, 2010 | 66,982 | (2) | $ | 15.96 | - | 8,449,500 | ||||
Total | 79,119 | $ | 16.18 | - | 8,449,500 | |||||
| (1) | The number shown represents, as of the end of each period, the maximum number of common shares that could be purchased under the publicly announced repurchase authorization then in effect. On September 26, 2007, Worthington Industries announced that the Board of Directors had authorized the repurchase of up to 10,000,000 of Worthington Industries’ outstanding common shares. A total of |
| (2) | Reflects common shares tendered by employees to cover the cost of exercising options. These common shares were not part of the 10,000,000 share repurchase authorization noted above. |
The Company has begun to repurchase common shares under this authorization during the first quarter of the fiscal year ending May 31, 2011. See “Item 8. – Financial Statements and Supplementary Data – Notes to Consolidated Financial Statements – Note U – Subsequent Events” within this Annual Report on Form 10-K for additional information regarding common share repurchase activity subsequent to May 31, 2010.
Item 6. — Selected Financial Data
| Fiscal Years Ended May 31, | ||||||||||||||||||||
| In thousands, except per share | 2008 | 2007 | 2006 | 2005 | 2004 | |||||||||||||||
FINANCIAL RESULTS | ||||||||||||||||||||
Net sales | $ | 3,067,161 | $ | 2,971,808 | $ | 2,897,179 | $ | 3,078,884 | $ | 2,379,104 | ||||||||||
Cost of goods sold | 2,711,414 | 2,610,176 | 2,525,545 | 2,580,011 | 2,003,734 | |||||||||||||||
Gross margin | 355,747 | 361,632 | 371,634 | 498,873 | 375,370 | |||||||||||||||
Selling, general and administrative expense | 231,602 | 232,487 | 214,030 | 225,915 | 195,785 | |||||||||||||||
Restructuring charges and other | 18,111 | - | - | 5,608 | 69,398 | |||||||||||||||
Operating income | 106,034 | 129,145 | 157,604 | 267,350 | 110,187 | |||||||||||||||
Miscellaneous income (expense) | (6,348 | ) | (4,446 | ) | (1,524 | ) | (7,991 | ) | (1,589 | ) | ||||||||||
Nonrecurring losses | - | - | - | - | - | |||||||||||||||
Gain on sale of Acerex | - | - | 26,609 | - | - | |||||||||||||||
Interest expense | (21,452 | ) | (21,895 | ) | (26,279 | ) | (24,761 | ) | (22,198 | ) | ||||||||||
Equity in net income of unconsolidated affiliates | 67,459 | 63,213 | 56,339 | 53,871 | 41,064 | |||||||||||||||
Earnings from continuing operations before income taxes | 145,693 | 166,017 | 212,749 | 288,469 | 127,464 | |||||||||||||||
Income tax expense | 38,616 | 52,112 | 66,759 | 109,057 | 40,712 | |||||||||||||||
Earnings from continuing operations | 107,077 | 113,905 | 145,990 | 179,412 | 86,752 | |||||||||||||||
Discontinued operations, net of taxes | - | - | - | - | - | |||||||||||||||
Extraordinary item, net of taxes | - | - | - | - | - | |||||||||||||||
Cumulative effect of accounting change, net of | - | - | - | - | - | |||||||||||||||
Net earnings | $ | 107,077 | $ | 113,905 | $ | 145,990 | $ | 179,412 | $ | 86,752 | ||||||||||
Earnings per share-diluted: | ||||||||||||||||||||
Continuing operations | $ | 1.31 | $ | 1.31 | $ | 1.64 | $ | 2.03 | $ | 1.00 | ||||||||||
Discontinued operations, net of taxes | - | - | - | - | - | |||||||||||||||
Extraordinary item, net of taxes | - | - | - | - | - | |||||||||||||||
Cumulative effect of accounting change, net of taxes | - | - | - | - | - | |||||||||||||||
Net earnings per share | $ | 1.31 | $ | 1.31 | $ | 1.64 | $ | 2.03 | $ | 1.00 | ||||||||||
Continuing operations: | ||||||||||||||||||||
Depreciation and amortization | $ | 63,413 | $ | 61,469 | $ | 59,116 | $ | 57,874 | $ | 67,302 | ||||||||||
Capital expenditures (including acquisitions and investments) | 97,343 | 90,418 | 66,904 | 112,937 | 30,089 | |||||||||||||||
Cash dividends declared | 54,640 | 58,380 | 60,110 | 57,942 | 55,312 | |||||||||||||||
Per share | $ | 0.68 | $ | 0.68 | $ | 0.68 | $ | 0.66 | $ | 0.64 | ||||||||||
Average shares outstanding-diluted | 81,898 | 87,002 | 88,976 | 88,503 | 86,950 | |||||||||||||||
FINANCIAL POSITION | ||||||||||||||||||||
Current assets | $ | 1,104,970 | $ | 969,383 | $ | 996,241 | $ | 938,333 | $ | 833,110 | ||||||||||
Current liabilities | 664,895 | 420,494 | 490,786 | 545,443 | 475,060 | |||||||||||||||
Working capital | $ | 440,075 | $ | 548,889 | $ | 505,455 | $ | 392,890 | $ | 358,050 | ||||||||||
Net fixed assets | $ | 549,944 | $ | 564,265 | $ | 546,904 | $ | 552,956 | $ | 555,394 | ||||||||||
Total assets | 1,988,031 | 1,814,182 | 1,900,397 | 1,830,005 | 1,643,139 | |||||||||||||||
Total debt* | 380,450 | 276,650 | 252,684 | 388,432 | 289,768 | |||||||||||||||
Shareholders' equity | 885,377 | 936,001 | 945,306 | 820,836 | 680,374 | |||||||||||||||
Per share | $ | 11.16 | $ | 11.02 | $ | 10.66 | $ | 9.33 | $ | 7.83 | ||||||||||
Shares outstanding | 79,308 | 84,908 | 88,691 | 87,933 | 86,856 | |||||||||||||||
| Fiscal Year Ended May 31, | ||||||||||||||||||||
| (in thousands, except per share) | 2010 | 2009 | 2008 | 2007 | 2006 | |||||||||||||||
FINANCIAL RESULTS | ||||||||||||||||||||
Net sales | $ | 1,943,034 | $ | 2,631,267 | $ | 3,067,161 | $ | 2,971,808 | $ | 2,897,179 | ||||||||||
Cost of goods sold | 1,663,104 | 2,456,533 | 2,711,414 | 2,610,176 | 2,525,545 | |||||||||||||||
Gross margin | 279,930 | 174,734 | 355,747 | 361,632 | 371,634 | |||||||||||||||
Selling, general and administrative expense | 218,315 | 210,046 | 231,602 | 232,487 | 214,030 | |||||||||||||||
Impairment of long-lived assets | 35,409 | 96,943 | - | - | - | |||||||||||||||
Restructuring and other expense | 4,243 | 43,041 | 18,111 | - | - | |||||||||||||||
Operating income (loss) | 21,963 | (175,296 | ) | 106,034 | 129,145 | 157,604 | ||||||||||||||
Miscellaneous income (expense) | 1,127 | (2,329 | ) | 620 | 963 | 4,564 | ||||||||||||||
Gain on sale of investments in unconsolidated affiliates | - | 8,331 | - | - | 26,609 | |||||||||||||||
Interest expense | (9,534 | ) | (20,734 | ) | (21,452 | ) | (21,895 | ) | (26,279 | ) | ||||||||||
Equity in net income of unconsolidated affiliates | 64,601 | 48,589 | 67,459 | 63,213 | 56,339 | |||||||||||||||
Earnings (loss) before income taxes | 78,157 | (141,439 | ) | 152,661 | 171,426 | 218,837 | ||||||||||||||
Income tax expense (benefit) | 26,650 | (37,754 | ) | 38,616 | 52,112 | 66,759 | ||||||||||||||
Net earnings (loss) | 51,507 | (103,685 | ) | 114,045 | 119,314 | 152,078 | ||||||||||||||
Net earnings attributable to noncontrolling interest | 6,266 | 4,529 | 6,968 | 5,409 | 6,088 | |||||||||||||||
Net earnings (loss) attributable to controlling interest | $ | 45,241 | $ | (108,214 | ) | $ | 107,077 | $ | 113,905 | $ | 145,990 | |||||||||
Earnings (loss) per share – diluted: | ||||||||||||||||||||
Net earnings (loss) per share attributable to controlling interest | $ | 0.57 | $ | (1.37 | ) | $ | 1.31 | $ | 1.31 | $ | 1.64 | |||||||||
Depreciation and amortization | $ | 64,653 | $ | 64,073 | $ | 63,413 | $ | 61,469 | $ | 59,116 | ||||||||||
Capital expenditures (including acquisitions and investments) | 98,275 | 109,491 | 97,343 | 90,418 | 66,904 | |||||||||||||||
Cash dividends declared | 31,676 | 48,115 | 54,640 | 58,380 | 60,110 | |||||||||||||||
Per common share | $ | 0.40 | $ | 0.61 | $ | 0.68 | $ | 0.68 | $ | 0.68 | ||||||||||
Average common shares outstanding –diluted | 79,143 | 78,903 | 81,898 | 87,002 | 88,976 | |||||||||||||||
FINANCIAL POSITION | ||||||||||||||||||||
Current assets | $ | 782,285 | $ | 598,935 | $ | 1,104,970 | $ | 969,383 | $ | 996,241 | ||||||||||
Current liabilities | 379,802 | 372,080 | 664,895 | 420,494 | 490,786 | |||||||||||||||
Working capital | $ | 402,483 | $ | 226,855 | $ | 440,075 | $ | 548,889 | $ | 505,455 | ||||||||||
Property, plant and equipment, net | $ | 506,163 | $ | 521,505 | $ | 549,944 | $ | 564,265 | $ | 546,904 | ||||||||||
Total assets | 1,520,347 | 1,363,829 | 1,988,031 | 1,814,182 | 1,900,397 | |||||||||||||||
Total debt | 250,238 | 239,393 | 380,450 | 276,650 | 252,684 | |||||||||||||||
Total shareholders’ equity – controlling interest | 711,413 | 706,069 | 885,377 | 936,001 | 945,306 | |||||||||||||||
Per share | $ | 8.98 | $ | 8.94 | $ | 11.16 | $ | 11.02 | $ | 10.66 | ||||||||||
Common shares outstanding | 79,217 | 78,998 | 79,308 | 84,908 | 88,691 | |||||||||||||||
The acquisition of PSM capital stockthe steel processing assets of Gibraltar Industries, Inc. and its subsidiaries has been includedreflected since August 2006.February 2010. Our Metal Framing operations in Canada have been excluded since their disposition in November 2009. The acquisition of the Western Cylinder Assetsmembership interests of Structural Composites Industries, LLC has been includedreflected since September 2004.2009. The dispositionacquisition of certain Decaturthe assets related to the businesses of Piper Metal Forming Corporation, U.S. Respiratory, Inc. and Pacific Cylinders, Inc. has been reflected since June 2009. The acquisition of the Laser Products assets has been reflected since August 2004.July 2008. The acquisition of Unimast IncorporatedThe Sharon Companies Ltd. assets has been includedreflected since July 2002.June 2008. The acquisition of the capital stock of Precision Specialty Metals, Inc. has been reflected since August 2006.
| Fiscal Years Ended May 31, | ||||||||||||||||||||||||
| 2003 | 2002 | 2001 | 2000 | 1999 | 1998 | |||||||||||||||||||
| $ | 2,219,891 | $ | 1,744,961 | $ | 1,826,100 | $ | 1,962,606 | $ | 1,763,072 | $ | 1,624,449 | |||||||||||||
| 1,916,990 | 1,480,184 | 1,581,178 | 1,629,455 | 1,468,886 | 1,371,841 | |||||||||||||||||||
| 302,901 | 264,777 | 244,922 | 333,151 | 294,186 | 252,608 | |||||||||||||||||||
| 182,692 | 165,885 | 173,264 | 163,662 | 147,990 | 117,101 | |||||||||||||||||||
| (5,622 | ) | 64,575 | 6,474 | - | - | - | ||||||||||||||||||
| 125,831 | 34,317 | 65,184 | 169,489 | 146,196 | 135,507 | |||||||||||||||||||
| (7,240 | ) | (3,224 | ) | (928 | ) | 2,653 | 5,210 | 1,396 | ||||||||||||||||
| (5,400 | ) | (21,223 | ) | - | (8,553 | ) | - | - | ||||||||||||||||
| - | - | - | - | - | - | |||||||||||||||||||
| (24,766 | ) | (22,740 | ) | (33,449 | ) | (39,779 | ) | (43,126 | ) | (25,577 | ) | |||||||||||||
| 29,973 | 23,110 | 25,201 | 26,832 | 24,471 | 19,316 | |||||||||||||||||||
| 118,398 | 10,240 | 56,008 | 150,642 | 132,751 | 130,642 | |||||||||||||||||||
| 43,215 | 3,738 | 20,443 | 56,491 | 49,118 | 48,338 | |||||||||||||||||||
| 75,183 | 6,502 | 35,565 | 94,151 | 83,633 | 82,304 | |||||||||||||||||||
| - | - | - | - | (20,885 | ) | 17,337 | ||||||||||||||||||
| - | - | - | - | - | 18,771 | |||||||||||||||||||
| - | - | - | - | (7,836 | ) | - | ||||||||||||||||||
| $ | 75,183 | $ | 6,502 | $ | 35,565 | $ | 94,151 | $ | 54,912 | $ | 118,412 | |||||||||||||
| $ | 0.87 | $ | 0.08 | $ | 0.42 | $ | 1.06 | $ | 0.90 | $ | 0.85 | |||||||||||||
| - | - | - | - | (0.23 | ) | 0.18 | ||||||||||||||||||
| - | - | - | - | - | 0.19 | |||||||||||||||||||
| - | - | - | - | (0.08 | ) | - | ||||||||||||||||||
| $ | 0.87 | $ | 0.08 | $ | 0.42 | $ | 1.06 | $ | 0.59 | $ | 1.22 | |||||||||||||
| $ | 69,419 | $ | 68,887 | $ | 70,582 | $ | 70,997 | $ | 64,087 | $ | 41,602 | |||||||||||||
| 139,673 | 60,100 | 64,943 | 72,649 | 132,458 | 297,516 | |||||||||||||||||||
| 54,938 | 54,667 | 54,762 | 53,391 | 52,343 | 51,271 | |||||||||||||||||||
| $ | 0.64 | $ | 0.64 | $ | 0.64 | $ | 0.61 | $ | 0.57 | $ | 0.53 | |||||||||||||
| 86,537 | 85,929 | 85,623 | 88,598 | 93,106 | 96,949 | |||||||||||||||||||
| $ | 506,246 | $ | 490,340 | $ | 449,719 | $ | 624,229 | $ | 624,255 | $ | 642,995 | |||||||||||||
| 318,171 | 339,351 | 306,619 | 433,270 | 427,725 | 410,031 | |||||||||||||||||||
| �� | ||||||||||||||||||||||||
| $ | 188,075 | $ | 150,989 | $ | 143,100 | $ | 190,959 | $ | 196,530 | $ | 232,964 | |||||||||||||
| $ | 743,044 | $ | 766,596 | $ | 836,749 | $ | 862,512 | $ | 871,347 | $ | 933,158 | |||||||||||||
| 1,478,069 | 1,457,314 | 1,475,862 | 1,673,873 | 1,686,951 | 1,842,342 | |||||||||||||||||||
| 292,028 | 295,613 | 324,750 | 525,072 | 493,313 | 501,950 | |||||||||||||||||||
| 636,294 | 606,256 | 649,665 | 673,354 | 689,649 | 780,273 | |||||||||||||||||||
| $ | 7.40 | $ | 7.09 | $ | 7.61 | $ | 7.85 | $ | 7.67 | $ | 8.07 | |||||||||||||
| 85,949 | 85,512 | 85,375 | 85,755 | 89,949 | 96,657 | |||||||||||||||||||
|
Item 7. — Management’s Discussion and Analysis of Financial Condition and Results of Operations
Selected statements contained in this “Item 7. —– Management’s Discussion and Analysis of Financial Condition and Results of Operations” constitute “forward-looking statements” as that term is used in the Private Securities Litigation Reform Act of 1995. Such forward-looking statements are based, in whole or in part, on management’s beliefs, estimates, assumptions and currently available information. For a more detailed discussion of what constitutes a forward-looking statement and of some of the factors that could cause actual results to differ materially from such forward-looking statements, please refer to the “Safe Harbor Statement” in the beginning of this Annual Report on Form 10-K and “Part I —– Item 1A. —– Risk Factors” of this Annual Report on Form 10-K.
OverviewIntroduction
Worthington Industries, Inc., together with its subsidiaries (collectively, “we,” “our,” “Worthington,” or the “Company”), is primarily a diversified metalmetals processing company, focused on value-added steel processing and manufactured metal products. Our manufactured metal products include: pressure cylinder products such as metalpropane, refrigerant, oxygen, hand torch and camping cylinders, scuba tanks and helium balloon kits; light gauge steel framing pressure cylinders,for commercial and residential construction; framing systems and stairs for mid-rise buildings; current and past model automotive past-model service stampingsstampings; and, through joint ventures, metal ceilingsuspension grid systems for concealed and laser-weldedlay-in panel ceilings and laser welded blanks. Our number one goal is to increase shareholder value, which we seek to accomplish by optimizing existing operations, developing and commercializing new products and applications and pursuing strategic acquisitions and joint ventures.
As of May 31, 2008,2010, excluding our joint ventures, we operated 4441 manufacturing facilities worldwide, principally in three reportable business segments: Steel Processing, Pressure Cylinders and Metal FramingFraming. Other operating segments, which do not meet the materiality tests for purposes of separate disclosure, include Automotive Body Panels, Steel Packaging, Mid-Rise Construction, Military Construction and Pressure Cylinders.Commercial Stairs. We also held equity positions in teneight joint ventures, which operated 22an additional 24 manufacturing facilities worldwide as of May 31, 2008. Each of these segments and key joint ventures hold a leadership position in its respective market. We have capacity in each of our segments to handle additional sales growth without significantly increasing our capital investment.2010. For more information on our operating segments, please refer to “Item“Part I – Item 1. —– Business” of Part I of this Annual Report on Form 10-K.
Overview
During our fiscal year ended May 31, 2010 (“fiscal 2010”), we began to recover from the global recession that, from an earnings perspective, resulted in our fiscal year ended May 31, 2009 (“fiscal 2009”) being the worst in our Company’s history. The recession negatively affected automotive production, particularly for General Motors and Chrysler, as they both filed for bankruptcy protection in calendar 2009. However, since the settlement of the bankruptcies, automotive production seems to have stabilized and shown signs of strengthening, providing for some of the recovery in our Steel Processing operating segment. In addition, we acquired the steel processing assets of Gibraltar Industries, Inc., which have been fully integrated into our Steel Processing operating segment and generated positive earnings since the acquisition.
In our Pressure Cylinders operating segment, the global recession had the most impact on our industrial gas, air brake and forklift product lines. The industrial gas and air brake cylinders are the primary products in our European operations, which have suffered through the recession. However, during fiscal 2010, we continued to see strong demand across most of the other cylinder product lines; and, toward the end of the year, we began to see some modest improvement in our European operations. During fiscal 2010, we completed two largest markets we serve areacquisitions in the Pressure Cylinders operating segment, as noted below, which increased our product offerings.
Activity in the construction and automotive, representing 40% and 26%, respectively,market continues to be stagnant. The recession in the construction market has not only affected our Metal Framing operating segment, but also the operations of our consolidated net salespreviously reported Construction Services operating segment. Lower projections in these segments led to the
impairment of Metal Framing’s goodwill in fiscal 2008.2009 and the impairment of Construction Services’ goodwill and certain other of its intangible assets in fiscal 2010. The Metal Framing operating segment has been challenged for more than a year with weak demand. Volumes were down 39% from fiscal 2009 and 58% from the fiscal year ended May 31, 2008 (“fiscal 2008”). We have responded by sizing the business to keep pace with the current demand by closing facilities and reducing headcount. In addition to reducing costs, we introduced a new flat-rolled steel product, ProStud™, during fiscal 2010. This provides us with an additional product that will hopefully improve sales and capture market share. Our results are primarilyjoint ventures continue to perform well, despite weak market conditions.
Much of our response to the recession has been driven by two factors, product demandthe Transformation Plan (the “Transformation Plan”), which began in the first quarter of fiscal 2008, prior to the beginning of the recession. We continued to execute our Transformation Plan through fiscal 2010. In our Steel Processing operating segment, we have completed the diagnostic and the spread between the average selling priceimplementation phases at each of our productscore facilities. Additionally, we have initiated the diagnostic process at our west coast stainless steel operation and our newly acquired facility in Cleveland, as well as in our Mexican joint venture, Serviacero. We anticipate that we will have substantially completed the cost of raw materials, mainly steel.Transformation Plan process at these facilities and one additional Steel Processing facility by December 31, 2010. In our Metal Framing operating segment, we have substantially completed the Transformation Plan process at eight facilities and anticipate completing the process at four additional facilities by December 31, 2010. We expect to incur additional restructuring charges relating to the Transformation Plan as we progress through the remaining Metal Framing and Steel Processing facilities, although these charges should decline over the coming quarters. The spread can be significantly affected by our first-in, first-out (“FIFO”) inventory costing method. In a rising steel-price environment, our reported income is often favorably impacted as lower-priced inventory acquired duringneed for other restructuring charges will depend largely on recommendations developed from the previous months flows through cost of goods sold while our selling prices increase to meetTransformation Plan. We believe that the rising replacement cost of steel. In a decreasing steel-price environment,Transformation Plan has lowered the inverse often occurs as higher-priced inventory on hand flows through cost of goods sold as our selling prices decrease. The results from these market dynamics are referred to as inventory holding gains or losses. We strive to limit the inventory holding impact by controlling inventory levels.
A majoritybreak-even points of our full-time employees participate in profit sharingfacilities and bonus programs which are tiedhas positioned us to performance. Generally, when earnings are up, profit sharingrespond more quickly to current and bonus expenses increase; when earnings are down, profit sharingfuture opportunities and bonus expenses decrease. Because of this relationship, profit sharing and bonus expenses may somewhat lessen the volatility of our earnings.challenges.
Market & Industry Overview
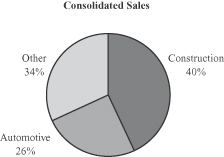 |
ForNo single customer contributed more than 10% of our consolidated net sales for fiscal year ended May 31, 2008 (“fiscal 2008”), our2010. Our consolidated net sales breakdown by end user market is illustrated by the chart to the left.following chart. Substantially all of the net sales of our Metal Framing, segmentMid-Rise Construction, Military Construction, and the Construction Services segment,Commercial Stairs operating segments, as well as approximately 25%16% of the net sales for theof our Steel Processing operating segment, are to the construction market, both residential and non-residential. We estimate that approximately 10% of our consolidated sales, or one-fourth of our construction market sales, are to the residential market. While the market price of steel significantly impacts this business, there are other key indicators that are meaningful in analyzing construction market demand including U.S.the United States of America gross domestic product (GDP)(“U.S. GDP”), the Dodge Index of construction contracts and trends in the relative price of framing lumber and steel. Construction is also the predominant end market for three of our joint ventures, including our largest,venture, Worthington Armstrong Venture (“WAVE”). The net sales of these joint venturesWAVE are not consolidated in our results; however, adding our ownership percentage of joint venture construction marketnet sales to our reported net sales would not materially change the consolidated net sales breakdown in the following chart.
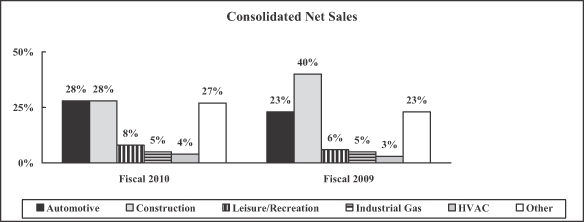
The automotive industry is the largest consumer of flat-rolled steel and thus the largest end market for our Steel Processing operating segment. Approximately half46% of the net sales of our Steel Processing operating segment, and substantially all of the net sales of theour Automotive Body Panels operating segment, are to the automotive market. North American vehicle production, primarily by Chrysler, Ford and General Motors (the “Big“Detroit Three automakers”), has a considerable impact on the customersactivity within these two operating segments. These segments are also impacted by the market price of steel and, to a lesser extent, the market price of commodities used in their operations, such as zinc, natural gas and diesel fuel. The majority of the net sales of threefrom four of our unconsolidated joint ventures are also go to the automotive end market. These net sales are not consolidated in our results; however, adding our ownership percentage of joint venture automotive marketnet sales to our reported net sales doeswould not materially change the consolidated net sales breakdown in the previousabove chart.
The net sales of our Pressure Cylinders and Steel Packaging operating segments, and approximately 30%38% of the net sales of our Steel Processing operating segment, are to other markets such as appliance, leisure and recreation, distribution and transportation,industrial gas, HVAC, lawn and garden, agriculture and consumer specialty products.appliance. Given the many different product lines that make up these net sales and the wide variety of end markets, it is very difficult to listdetail the key market indicators that drive this portion of our business. However, we believe that the trend in U.S. GDP growth is generally a good economic indicator for analyzing these segments.this activity.
We use the following information to monitor our costcosts and demand in our major end markets:
| Fiscal Year Ended May 31, | Inc / (Dec) | Fiscal Year Ended May 31, | Inc / (Dec) | |||||||||||||||||||||||||||||||||||||
| 2008 | 2007 | 2006 | 2008 vs. 2007 | 2007 vs. 2006 | 2010 | 2009 | 2008 | 2010 vs. 2009 | 2009 vs. 2008 | |||||||||||||||||||||||||||||||
U.S. GDP (% growth year-over-year) | 2.4 | % | 2.2 | % | 3.1 | % | 0.2 | % | -0.9 | % | 0.1 | % | -1.0 | % | 2.4 | % | 1.1 | % | -3.4 | % | ||||||||||||||||||||
Hot Rolled Steel ($ per ton)1 | $ | 636 | $ | 571 | $ | 528 | $ | 65 | $ | 43 | ||||||||||||||||||||||||||||||
Big Three Auto Build (,000s vehicles)2 | 8,691 | 9,331 | 10,348 | (640 | ) | (1,017 | ) | |||||||||||||||||||||||||||||||||
No. America Auto Build (,000s vehicles)2 | 14,662 | 15,068 | 15,998 | (406 | ) | (930 | ) | |||||||||||||||||||||||||||||||||
Hot-Rolled Steel ($ per ton)1 | $ | 549 | $ | 726 | $ | 636 | $ | (177 | ) | $ | 90 | |||||||||||||||||||||||||||||
Detroit Three Auto Build (000s vehicles)2 | 5,650 | 5,606 | 8,643 | 44 | (3,037 | ) | ||||||||||||||||||||||||||||||||||
No. America Auto Build (000s vehicles)2 | 10,643 | 9,880 | 14,662 | 763 | (4,782 | ) | ||||||||||||||||||||||||||||||||||
Dodge Index | 121 | 137 | 150 | (16 | ) | (13 | ) | 89 | 98 | 130 | (9 | ) | (32 | ) | ||||||||||||||||||||||||||
Framing Lumber ($ per 1,000 board ft)3 | $ | 265 | $ | 286 | $ | 392 | $ | (21 | ) | $ | (106 | ) | $ | 271 | $ | 230 | $ | 269 | $ | 41 | $ | (39 | ) | |||||||||||||||||
Zinc ($ per pound)4 | $ | 1.24 | $ | 1.65 | $ | 0.89 | $ | (0.41 | ) | $ | 0.77 | $ | 0.94 | $ | 0.65 | $ | 1.24 | $ | 0.29 | $ | (0.59 | ) | ||||||||||||||||||
Natural Gas ($ per mcf)5 | $ | 7.66 | $ | 6.73 | $ | 9.32 | $ | 0.94 | $ | (2.60 | ) | $ | 4.35 | $ | 7.02 | $ | 7.66 | $ | (2.67 | ) | $ | (0.64 | ) | |||||||||||||||||
Retail Diesel Prices, All types ($ per gallon)6 | $ | 3.36 | $ | 2.72 | $ | 2.61 | $ | 0.64 | $ | 0.11 | $ | 2.77 | $ | 3.17 | $ | 3.41 | $ | (0.40 | ) | $ | (0.24 | ) | ||||||||||||||||||
1 CRU Index; annual average 2 CSM Autobase 3 Random Lengths; annual average 4 LME Zinc; annual average 5 NYMEX Henry Hub Natural Gas; annual average 6 Energy Information Administration; annual average
U.S. GDP growth rate trends are generally indicative of the strength in demand and, in many cases, pricing for our products. Historically, we have seen that year-over-year increasing U.S. GDP growth rates year-over-year can have a positive effect on our results, as a stronger economy generally improves demand and pricing for our products. Conversely, the opposite is also generally true. Changes in U.S. GDP growth rates can also signal, or be indicative of, changes in conversion costs related to production and in selling, general and administrative expenses (“SG&A”&A expenses”) expenses. However, these are all general assumptions, which do not hold true. Conversely, the opposite is also generally true. Decreases in all cases.U.S. GDP growth rates can signal negative trends in our results, as a weaker economy generally reduces demand and pricing for our products.
TheIn recent years, the market price of hot-rolled steel is ahas been one of the most significant factorfactors impacting selling prices and can also impact earnings. Inhas materially impacted earnings, particularly on a quarter to quarter basis. When steel prices fall, we typically have higher-priced material flowing through cost of goods sold, while selling prices compress to what the market will bear, negatively impacting our results. On the other hand, in a rising price environment, such as we experienced during the third and fourth quarters of fiscal 2008, our results are generally favorably impacted as lower-priced material, purchased in previous periods, flows through cost of goods sold, while our selling prices increase at a faster pace to cover current replacement costs. OnThe following table shows the other hand, whenaverage market price per ton of hot-rolled steel prices fall, as they did duringfor the first part oflast two fiscal 2008, we typically have higher-priced material flowing through cost of goods sold while selling prices compress to what the market will bear, negatively impacting our results. These are all general assumptions, however, which do not hold true in all cases. Our FIFO inventory costing method results in inventory holding gains and losses, which we attempt to limit through inventory management.years.
No single customer makes up more than 5% of our consolidated net sales. While our automotive business is largely driven by Big Three production schedules, our customer base is much broader than the Big Three automakers and includes many of their suppliers as well. Seasonal automotive shutdowns in July and December can cause weaker demand in our first and third quarters. Domestic automotive sales have been hurt in recent quarters as the rising cost of gasoline has shifted consumer demand to smaller, more fuel efficient vehicles — a market historically dominated by foreign manufacturers. We continue to pursue customer diversification beyond the Big Three automakers and their suppliers.
| (dollars per ton1) | |||||||||||||
| Fiscal Year | Inc / (Dec) | ||||||||||||
| 2010 | 2009 | 2010 vs. 2009 | |||||||||||
1st Quarter | $ | 439 | $ | 1,067 | $ | (628 | ) | -58.9 | % | ||||
2nd Quarter | $ | 538 | $ | 873 | $ | (335 | ) | -38.4 | % | ||||
3rd Quarter | $ | 549 | $ | 527 | $ | 22 | 4.2 | % | |||||
4th Quarter | $ | 669 | $ | 437 | $ | 232 | 53.1 | % | |||||
Annual Avg. | $ | 549 | $ | 726 | $ | (177 | ) | -24.4 | % | ||||
1 CRU Index
The Dodge Index represents the value of total construction contracts, including residential and non-residential building construction. This overall index serves as a broad indicator of the construction markets in which we participate, as it consists oftracks actual construction starts. The relative pricingprice of framing lumber, an alternative construction material withagainst which we compete, can also affect our Metal Framing operating segment, as certain applications may permit the use of this alternative building materials.material.
The market trends of certain other commodities such as zinc, natural gas and diesel fuel arecan be important to us as they represent a significant portion of our cost of goods sold, both directly through our plant operations and indirectly through transportation and freight. A rise in the price of any of these commodities could
increase our cost of goods sold. We attempt to limit the impact of pricing fluctuations through contracts, hedging activities and, specifically for transportation, leveraging opportunities across multiple business units, where available.Fiscal 2010 Business Developments
As previously stated, residential construction does not make up a large portion of our overall business, about 10%. However, the slowdown in this industry and the related struggles in the credit markets have negatively affected most of our segments, each to a varying degree. Although much
On June 1, 2009, we purchased substantially all of the impact falls on those segments which directly serveassets related to the construction markets, other segments are indirectly impacted bybusinesses of Piper Metal Forming Corporation, U.S. Respiratory, Inc. and Pacific Cylinders, Inc. (collectively, “Piper”). These assets have been included in our Pressure Cylinders operating segment. See “Item 8. – Financial Statements and Supplementary Data – Notes to Consolidated Financial Statements – NOTE P – Acquisitions” for more information.
On July 13, 2009, the ripple effect felt in other parts of the economy, for example, in consumer spendingServiacero Worthington joint venture opened its greenfield steel processing facility near Monterrey, Mexico. The 65,000 square foot facility, with rail access, currently operates a slitting and the labor market.packaging line.
Business Strategy
Our first goal is to increase shareholder value. To accomplish this goal, we focus on driving top line growth; increasing operating margins; and improving asset utilization. During fiscal 2008, we completed a number of value-added growth initiatives which further extend our product lines and penetrate new markets. These included the following actions:
| • | On August 12, 2009, our Metal Framing operating segment announced the formation of a joint venture with ClarkWestern Building Systems, Inc., to co-develop the new ProSTUDTM drywall framing product. The components of the product are lightweight and feature a number of technological advances to enhance rigidity. |
On September 14, 2007, our3, 2009, the Pressure Cylinders operating segment acquired certain cylinder production assetspurchased the membership interests of Wolfedale Engineering,Structural Composites Industries, LLC (“SCI”). SCI produces lightweight, aluminum-lined, composite-wrapped high pressure cylinders which enhanced the largest Canadian manufacturer of portable propane gas steel cylindersPressure Cylinders operating segment’s growing product line. See “Item 8. – Financial Statements and Supplementary Data – Notes to Consolidated Financial Statements – NOTE P – Acquisitions” for use with barbeque gas grills, recreational vehicles, campers and trailers. These assets and related production were integrated into our existing facilities.more information.
On September 17, 2007,30, 2009, we acquired a 50% interest in Serviacero Planos, S.A. de C.V. (“Serviacero Worthington”) which operates two steel processing facilities in central Mexico. On March 5, 2008, Serviacero Worthington announced plans to add a greenfield site in the Monterrey, Mexico, region.consolidation, within our Metal Framing operating segment, of our Joliet, Illinois, roll forming operations into our Hammond, Indiana, facility.
On September 25, 2007, weNovember 2, 2009, our Metal Framing operating segment formed a steel processing joint venture, in which we have an equity intereststrategic alliance with Bailey Metal Products Limited (“Bailey”) that included the sale of 49%, with The Magnetto Group to construct and operate a Class One steel processing facility in Slovakia. This joint venture startedour Metal Framing operations in February 2008 as Canessa Worthington Slovakia s.r.o. (“Canessa Worthington”)Canada to Bailey. The alliance provides for Bailey to be the exclusive distributor of Metal Framing’s proprietary and services customers throughout central Europe.vinyl products in Canada, and Bailey has licensed its paper-faced metal corner bead product to Metal Framing to manufacture and sell in most of the United States.
On October 25, 2007, weFebruary 1, 2010, the Steel Processing operating segment acquired a 49% interest in cratethe steel processing assets of Gibraltar Industries, Inc. and pallet maker LEFCO Industries, LLC (“LEFCO”its subsidiaries (the “Gibraltar Assets”), a minority. The acquisition expands the capabilities of our existing cold-rolled strip business enterprise. The joint venture, called LEFCO Worthington, LLC, (“LEFCO Worthington”) will manufacture steel rack systemsand our ability to service the needs of new and existing customers. See “Item 8. – Financial Statements and Supplementary Data – Notes to Consolidated Financial Statements – NOTE P – Acquisitions” for the automotive and trucking industries, in addition to LEFCO’s existing product offerings.more information.
On March 1, 2008, TWBApril 13, 2010, we issued $150.0 million aggregate principal amount of senior notes due 2020 (the “2020 Notes”). The 2020 Notes bear interest at a rate of 6.50%. The Company L.L.C. (“TWB”), our joint venture with ThyssenKrupp Steel North America, Inc. (“ThyssenKrupp”), acquired ThyssenKrupp Tailored Blanks, S.A. de C.V.,used the Mexican subsidiary of ThyssenKrupp,net proceeds from the offering to expand TWB’s presence in Mexico. Asrepay a result, ThyssenKrupp now owns 55% of TWB and Worthington now owns 45%.
To increase our operating margins and asset utilization we began two initiatives, one focused on reducing costs and the other on reviewing the utilization of our facilities in Metal Framing. These two initiatives have grown into a much larger transformational effort (the “Transformation Plan”) which now includes the additional initiatives of increasing efficiency throughout the Company, and improving our supply chain. The intent behind these initiatives is to significantly transform the Company’s earnings potential over the next three years. At this point, we have identified opportunities to generate an estimated $38.5 million in annual savings, excluding the expenses related to achieving these savings. Of the savings, $30.4 million will come from overhead expense reductions with the remaining $8.1 million coming from announced plant closures in our Metal Framing segment. Updates on these initiatives are as follows:
Expense reduction: We realized $18.5 million in savings during fiscal 2008. However, these savings were almost entirely offset by increases in other expenses, primarily in employee compensation, which increased due to favorable earnings, depreciation expense related to our new enterprise resource planning system, and bad debt expense. The balanceportion of the savings will come in fiscal 2009 with a portion to be realized in fiscal 2010.then outstanding borrowings under our revolving credit facility and amounts then outstanding under our revolving trade accounts receivable securitization facility.
Asset utilization: On September 25, 2007, we announced the closure or downsizing of five production facilities in our Metal Framing segment. The affected facilities were: East Chicago, Indiana; Rock Hill, South Carolina; Goodyear, Arizona; Wildwood, Florida; and Montreal, Canada which is being downsized. The Rock Hill facility continues to operate only as a steel processing operation and will also produce product for the Aegis joint venture. In addition to the plant closures, the Metal Framing corporate offices will be relocated from Pittsburgh, Pennsylvania, to our corporate offices in Columbus, Ohio. Annual net sales generated by the closed facilities totaled approximately $125.0 million, the majority of which are expected to be transferred to other nearby Metal Framing locations. As of May 31, 2008, all five of the Metal Framing operating facilities have been closed or downsized. Of the $9.0 million in annual savings expected from these actions, $2.1 million was realized in fiscal 2008. The balance will be realized in fiscal 2009. Restructuring charges related to these closures and the relocation of the executive and administrative offices totaled $8.1 million in fiscal 2008 with an additional $4.6 million expected in fiscal 2009.
Rapid improvement team: We have created a rapid improvement team focused on improving the efficiency at each of our facilities. They have completed a review of one facility, but it is too early to provide the beneficial impact of their findings.
High performance organization: Under this initiative we have identified a number of efforts to enhance our talent management and business performance management processes. Those efforts are aimed at driving sustainable performance improvement.
Results of Operations
Fiscal 20082010 Compared to Fiscal 20072009
Consolidated Operations
The following table presents consolidated operating results:
| Fiscal Year Ended May 31, | Fiscal Year Ended May 31, | |||||||||||||||||||||||||||||||||||
| Dollars in millions | 2008 | % of Net sales | 2007 | % of Net sales | Increase/ (Decrease) | |||||||||||||||||||||||||||||||
| (dollars in millions) | 2010 | % of Net sales | 2009 | % of Net sales | Increase/ (Decrease) | |||||||||||||||||||||||||||||||
Net sales | $ | 3,067.2 | 100.0 | % | $ | 2,971.8 | 100.0 | % | $ | 95.4 | $ | 1,943.0 | 100.0 | % | $ | 2,631.3 | 100.0 | % | $ | (688.3 | ) | |||||||||||||||
Cost of goods sold | 2,711.5 | 88.4 | % | 2,610.2 | 87.8 | % | 101.3 | 1,663.1 | 85.6 | % | 2,456.6 | 93.4 | % | (793.5 | ) | |||||||||||||||||||||
Gross margin | 355.7 | 11.6 | % | 361.6 | 12.2 | % | (5.9 | ) | 279.9 | 14.4 | % | 174.7 | 6.6 | % | 105.2 | |||||||||||||||||||||
Selling, general and administrative expense | 231.6 | 7.6 | % | 232.5 | 7.8 | % | (0.9 | ) | 218.3 | 11.2 | % | 210.0 | 8.0 | % | 8.3 | |||||||||||||||||||||
Restructuring charges | 18.1 | 0.6 | % | - | 0.0 | % | 18.1 | |||||||||||||||||||||||||||||
Impairment of long-lived assets | 35.4 | 1.8 | % | 97.0 | 3.7 | % | (61.6 | ) | ||||||||||||||||||||||||||||
Restructuring and other expense | 4.2 | 0.2 | % | 43.0 | 1.6 | % | (38.8 | ) | ||||||||||||||||||||||||||||
Operating income | 106.0 | 3.5 | % | 129.1 | 4.3 | % | (23.1 | ) | ||||||||||||||||||||||||||||
Other expense, net | (6.3 | ) | -0.2 | % | (4.4 | ) | -0.1 | % | 1.9 | |||||||||||||||||||||||||||
Operating income (loss) | 22.0 | 1.1 | % | (175.3 | ) | -6.7 | % | 197.3 | ||||||||||||||||||||||||||||
Miscellaneous income (expense) | 1.1 | 0.1 | % | (2.4 | ) | -0.1 | % | (3.5 | ) | |||||||||||||||||||||||||||
Gain on sale of investment in Aegis Metal Framing, LLC | - | 0.0 | % | 8.3 | 0.3 | % | (8.3 | ) | ||||||||||||||||||||||||||||
Interest expense | (21.5 | ) | -0.7 | % | (21.9 | ) | -0.7 | % | (0.4 | ) | (9.5 | ) | -0.5 | % | (20.7 | ) | -0.8 | % | (11.2 | ) | ||||||||||||||||
Equity in net income of unconsolidated affiliates | 67.5 | 2.2 | % | 63.2 | 2.1 | % | 4.3 | 64.6 | 3.3 | % | 48.6 | 1.8 | % | 16.0 | ||||||||||||||||||||||
Income tax expense | (38.6 | ) | -1.3 | % | (52.1 | ) | -1.8 | % | (13.5 | ) | ||||||||||||||||||||||||||
Income tax (expense) benefit | (26.7 | ) | -1.4 | % | 37.8 | 1.4 | % | 64.5 | ||||||||||||||||||||||||||||
Net earnings | $ | 107.1 | 3.5 | % | $ | 113.9 | 3.8 | % | $ | (6.8 | ) | |||||||||||||||||||||||||
Net earnings (loss) | 51.5 | 2.7 | % | (103.7 | ) | -3.9 | % | 155.2 | ||||||||||||||||||||||||||||
Net earnings attributable to noncontrolling interest | (6.3 | ) | -0.3 | % | (4.5 | ) | -0.2 | % | (1.8 | ) | ||||||||||||||||||||||||||
Net earnings (loss) attributable to controlling interest | $ | 45.2 | 2.3 | % | $ | (108.2 | ) | -4.1 | % | $ | 153.4 | |||||||||||||||||||||||||
Net earnings (loss) represents the results for our consolidated operations, including 100% of our consolidated joint venture, Spartan Steel Coating, LLC (“Spartan”), of which we own 52%. The net earnings attributable to noncontrolling interest, or 48% of Spartan, is subtracted to arrive at net earnings (loss) attributable to controlling interest. For fiscal 2010, the net earnings attributable to controlling interest were $45.2 million, compared to a net loss attributable to controlling interest of $108.2 million for fiscal 2008 decreased $6.8 million from the prior year to $107.1 million.2009.
Net sales increased $95.4 million to $3,067.2in fiscal 2010 decreased $688.3 million from the prior year. Most of the increasefiscal 2009 to $1,943.0 million. Decreased volumes, primarily in our Metal Framing, Mid-Rise Construction and Military Construction operating segments, lowered net sales was due to higher volumes ($63.4 million), stronger foreign currencies relative to the U.S. dollar ($31.3 million) and a marginal increase inby $363.3 million. Lower average selling prices. Volume increases boostedprices made up the remaining decrease, lowering net sales in nearly allby $325.0 million. Selling prices are affected by the market price of our segments, especially Construction Services, where sales increased $36.5 million.steel, which averaged $549 per ton for fiscal 2010 as compared to an average of $726 per ton for fiscal 2009 (down 24%).
Gross margin decreased $5.9in fiscal 2010 increased $105.2 million from the prior yearfiscal 2009, and as a percent of net sales increased to 14.4% from 6.6%. This was primarily due to declinesa $129.4 million improvement in our Pressure Cylinders segmentthe spread between selling prices and material costs, and $60.9 million in savings and efficiencies in manufacturing expenses, largely as a result of lower average selling prices in local currencies in Europethe Transformation Plan. The improved spread and increased material costs. All of our other segments reported increasedmanufacturing efficiencies were partially offset by depressed volumes, which reduced the gross margin due to stronger volumes.by $85.1 million.
SG&A expense decreased $0.9increased $8.3 million from fiscal 2009, largely as a result of higher profit sharing and bonus expense. Improvements in current year earnings and lower award achievement in the prior year. The Transformation Plan provided $15.2year resulted in an $18.7 million increase in SG&A savings, whichfiscal 2010 expense. This was partially offset by increased compensation, depreciation and bad debt expense.
decreased bad debt expense of $9.2 million in fiscal 2010, primarily related to large automotive customers in the Steel Processing and Automotive Body Panels operating segments emerging from bankruptcy, making payments on their accounts and no longer requiring previously established allowances due to risks of insolvency. |
RestructuringImpairment charges of $18.1$35.4 million for fiscal 2010 represented the third quarter write-off of goodwill and impairment charges for the previously reported Construction Services operating segment ($32.7 million) and the second quarter impairment of long-lived assets related to the Steel Packaging operating segment ($2.7 million). The fiscal 2009 goodwill impairment charge of $97.0 million related to the Transformation Plan.Metal Framing operating segment. The restructuring and other expense charges of $4.2 million in fiscal 2010 and $43.0 million in fiscal 2009 related to the Transformation Plan, is being ledand included costs related to professional fees, facility closures and job reductions.
Interest expense of $9.5 million in fiscal 2010 declined $11.2 million from fiscal 2009 due to lower interest rates and lower average borrowings. We redeemed $118.5 million of 6.70% senior notes due December 1, 2009 (the “2009 Notes”) in June 2009, and the remaining $19.5 million of the 2009 Notes upon maturity in December 2009. The redemptions were funded by Company management witha combination of cash on hand and borrowings under existing credit facilities, which carry a much lower interest rate than the assistance of outside consultants, who specialize in these types of plans. Restructuring charges included asset accelerated depreciation, employee early retirements and severance, facility restoration, equipment relocations, and professional fees.2009 Notes.
Equity in net income of unconsolidated affiliates of $67.5$64.6 million was largely made up of earnings from our WAVE joint venture, which increased $5.8 million overwere up 6%. Although WAVE is predominantly in the last year. Increased earnings from WAVE andconstruction market, a majority of its sales go to the additionrenovation sector, which has not been as heavily affected by the general downturn in the construction markets. Most of earnings from Serviacero Worthington ($3.1 million) were offset by decreased earnings at WSP, TWB, and certainour other joint ventures.ventures also experienced improvements in their earnings. See “Item 8. – Financial Statements and Supplementary Data – Notes to Consolidated Financial Statements – Note J – Investments in Unconsolidated Affiliates” for further information about our participation in unconsolidated joint ventures.
Income tax expense for fiscal 2010 was $26.7 million compared to a tax benefit of $37.8 million from the year decreased $13.5 millionnet loss in fiscal 2009. The fiscal 2010 expense represents an effective tax rate attributable to controlling interest of 37.1% versus 25.9% in fiscal 2009. These rates are calculated on net earnings or loss attributable to controlling interest, as reflected in our consolidated statements of earnings. The change in the effective tax rate attributable to controlling interest was primarily due to the weakness in our European cylinders operations, resulting in a higher mix of domestic income, which is taxed at a higher rate relative to foreign income, and the effectivenon-deductible goodwill impairment in fiscal 2009. In addition, a $3.0 million valuation allowance was recorded during the fourth quarter of fiscal 2010 against deferred tax assets, related to net operating losses previously reported in state income tax filings, of the Metal Framing operating segment.
The 37.1% rate is higher than the federal statutory rate of 35.0%, largely as a result of the change in valuation allowances, income tax accruals for tax audit resolutions and changes in estimated deferred taxes (collectively increasing the rate by 6.6%). These impacts are partially offset by benefits from the qualified production activities deduction and lower tax rates on foreign income (collectively decreasing the rate by 3.7%). For additional information regarding the deviation from statutory income tax rates, see “Item 8. – Financial Statements and Supplementary Data – Notes to Consolidated Financial Statements – Note D – Income Taxes.”
Segment Operations
Steel Processing
The following table presents a summary of operating results for the Steel Processing operating segment for the periods indicated:
| Fiscal Year Ended May 31, | ||||||||||||||||||
| (dollars in millions) | 2010 | % of Net sales | 2009 | % of Net sales | Increase/ (Decrease) | |||||||||||||
Net sales | $ | 989.0 | 100.0 | % | $ | 1,183.0 | 100.0 | % | $ | (194.0 | ) | |||||||
Cost of goods sold | 853.2 | 86.3 | % | 1,167.4 | 98.7 | % | (314.2 | ) | ||||||||||
Gross margin | 135.8 | 13.7 | % | 15.6 | 1.3 | % | 120.2 | |||||||||||
Selling, general and administrative expense | 84.9 | 8.6 | % | 79.8 | 6.7 | % | 5.1 | |||||||||||
Restructuring and other expense (income) | (0.5 | ) | -0.1 | % | 3.9 | 0.3 | % | (4.4 | ) | |||||||||
Operating income (loss) | $ | 51.4 | 5.2 | % | $ | (68.1 | ) | -5.8 | % | $ | 119.5 | |||||||
Material cost | $ | 685.3 | $ | 991.4 | $ | (306.1 | ) | |||||||||||
Tons shipped (in thousands) | 2,055 | 2,011 | 44 | |||||||||||||||
Net sales and operating income (loss) highlights were as follows:
Net sales decreased by $194.0 million from fiscal 2009 to $989.0 million. The decrease was 26.5%primarily attributable to lower average pricing ($217.1 million) due to the lower base prices of hot-rolled steel during fiscal 2010. Partially offsetting the decrease was stronger demand, particularly in the automotive market, as well as additional net sales resulting from the acquisition of the Gibraltar Assets in fiscal 2010.
Operating income was $51.4 million in fiscal 2010, compared to 31.4%an operating loss of $68.1 million in fiscal 2009. Stronger demand, driven by the prior year.improved economy and a larger spread between average selling prices and material costs, along with the acquisition of the Gibraltar Assets, resulted in an aggregate $119.5 million increase to operating income. SG&A expense was $5.1 million higher than in fiscal 2009, primarily due to higher profit sharing and bonus expenses, as well as the acquisition of the Gibraltar Assets, but was partially offset by a reduction in bad debt expense. Restructuring and other expense in fiscal 2009 related largely to the Transformation Plan.
Pressure Cylinders
The following table presents a summary of operating results for the Pressure Cylinders operating segment for the periods indicated:
| Fiscal Year Ended May 31, | ||||||||||||||||
| (dollars in millions) | 2010 | % of Net sales | 2009 | % of Net sales | Increase/ (Decrease) | |||||||||||
Net sales | $ | 467.6 | 100.0 | % | $ | 537.4 | 100.0 | % | $ | (69.8 | ) | |||||
Cost of goods sold | 376.0 | 80.4 | % | 429.8 | 80.0 | % | (53.8 | ) | ||||||||
Gross margin | 91.6 | 19.6 | % | 107.6 | 20.0 | % | (16.0 | ) | ||||||||
Selling, general and administrative expense | 61.2 | 13.1 | % | 45.4 | 8.4 | % | 15.8 | |||||||||
Restructuring and other expense | 0.3 | 0.1 | % | 1.0 | 0.2 | % | (0.7 | ) | ||||||||
Operating income | $ | 30.1 | 6.4 | % | $ | 61.2 | 11.4 | % | $ | (31.1 | ) | |||||
Material cost | $ | 208.3 | $ | 257.5 | $ | (49.2 | ) | |||||||||
Units shipped (in thousands) | 55,436 | 47,639 | 7,797 | |||||||||||||
Net sales and operating income highlights were as follows:
Net sales of $467.6 million represented a decrease of $69.8 million from fiscal 2009. Weak demand, primarily in our European operations, and lower average selling prices were the drivers behind this decrease. The decrease in net sales was partially offset by the SCI and Piper acquisitions, which took place during fiscal 2010 and contributed $43.1 million in net sales.
Operating income in fiscal 2010 decreased $31.1 million from fiscal 2009. An unfavorable change in the sales mix reduced gross margin by $21.4 million, while operational improvements and efficiencies in manufacturing expenses aided gross margin by $5.4 million. Gross margin as a percentage of net sales was stable at 19.6%. SG&A expenses increased $15.8 million, primarily due to the acquisitions of Piper and SCI, charges and expenses related to litigation and an increased share of corporate profit sharing, bonus and other expenses.
Metal Framing
The following table presents a summary of operating results for the Metal Framing operating segment for the periods indicated:
| Fiscal Year Ended May 31, | ||||||||||||||||||
| (dollars in millions) | 2010 | % of Net sales | 2009 | % of Net sales | Increase/ (Decrease) | |||||||||||||
Net sales | $ | 330.6 | 100.0 | % | $ | 661.0 | 100.0 | % | $ | (330.4 | ) | |||||||
Cost of goods sold | 294.6 | 89.1 | % | 638.1 | 96.5 | % | (343.5 | ) | ||||||||||
Gross margin | 36.0 | 10.9 | % | 22.9 | 3.5 | % | 13.1 | |||||||||||
Selling, general and administrative expense | 42.3 | 12.8 | % | 54.9 | 8.3 | % | (12.6 | ) | ||||||||||
Goodwill impairment | - | 0.0 | % | 96.9 | 14.7 | % | (96.9 | ) | ||||||||||
Restructuring and other expense | 3.9 | 1.2 | % | 13.7 | 2.1 | % | (9.8 | ) | ||||||||||
Operating loss | $ | (10.2 | ) | -3.1 | % | $ | (142.6 | ) | -21.6 | % | $ | 132.4 | ||||||
Material cost | $ | 200.2 | $ | 502.1 | $ | (301.9 | ) | |||||||||||
Tons shipped (in thousands) | 278 | 459 | (181 | ) | ||||||||||||||
Net sales and operating loss highlights were as follows:
Net sales decreased by $330.4 million from fiscal 2009 to $330.6 million. Lower volumes reduced net sales by $259.3 million, and lower average selling prices decreased net sales by $71.1 million. Lower volumes are largely attributable to the weak economy and depressed levels of demand in the commercial and residential construction markets. Lower average selling prices were mainly due to the lower average base prices of steel in fiscal 2010.
The operating loss of $10.2 million in fiscal 2010 improved from a $142.6 million operating loss in fiscal 2009. Fiscal 2009’s results included a $96.9 million goodwill impairment charge recorded in the second fiscal quarter. In fiscal 2010, weak volumes were offset by lower manufacturing and SG&A expenses realized from plant closures and headcount reductions. Additionally, the spread between average selling prices and material costs improved as reductions in material costs were realized.
Other
The Other category includes the Automotive Body Panels, Steel Packaging, Mid-Rise Construction, Military Construction and Commercial Stairs operating segments, which do not meet the materiality tests for purposes of separate disclosure, along with income and expense items not allocated to the operating segments.
The following table presents a summary of operating results for the Other category for periods indicated:
| Fiscal Year ended May 31, | ||||||||||||||||||
| (dollars in millions) | 2010 | % of Net sales | 2009 | % of Net sales | Increase/ (Decrease) | |||||||||||||
Net sales | $ | 155.9 | 100.0 | % | $ | 249.9 | 100.0 | % | $ | (94.0 | ) | |||||||
Cost of goods sold | 139.5 | 89.5 | % | 221.3 | 88.6 | % | (81.8 | ) | ||||||||||
Gross margin | 16.4 | 10.5 | % | 28.6 | 11.4 | % | (12.2 | ) | ||||||||||
Selling, general and administrative expense | 29.8 | 19.1 | % | 29.9 | 12.0 | % | (0.1 | ) | ||||||||||
Impairment of long-lived assets | 35.4 | 22.7 | % | - | 0.0 | % | 35.4 | |||||||||||
Restructuring and other expense | 0.5 | 0.3 | % | 24.5 | 9.8 | % | (24.0 | ) | ||||||||||
Operating loss | $ | (49.3 | ) | -31.6 | % | $ | (25.8 | ) | -10.3 | % | $ | (23.5 | ) | |||||
Net sales and operating loss highlights were as follows:
Net sales decreased by $94.0 million in fiscal 2010 to $155.9 million. Net sales in the Mid-Rise Construction, Military Construction and Commercial Stairs operating segments decreased an aggregate of $71.8 million from fiscal 2009, primarily due to the ongoing depressed construction market. The Automotive Body Panels and Steel Packaging operating segments also experienced lower volumes, resulting in reductions in net sales of $10.9 million and $11.3 million, respectively.
The operating loss widened by $23.5 million versus fiscal 2009 due to the lower volumes mentioned above and $35.4 million in impairment charges during fiscal 2010. We recognized a $24.7 million write-off of goodwill and an $8.0 million impairment of other long-lived assets related to the previously reported Construction Services operating segment, and a $2.7 million impairment of long-lived assets related to the Steel Packaging operating segment. These impairments were partially offset by lower restructuring charges related to the Transformation Plan, as the outside consulting fees associated with this effort ceased in fiscal 2009. The responsibility for executing the Transformation Plan has since been assumed by our internal teams.
Fiscal 2009 Compared to Fiscal 2008
Consolidated Operations
The following table presents consolidated operating results:
| Fiscal Year Ended May 31, | ||||||||||||||||||
| (dollars in millions) | 2009 | % of Net sales | 2008 | % of Net sales | Increase/ (Decrease) | |||||||||||||
Net sales | $ | 2,631.3 | 100.0 | % | $ | 3,067.2 | 100.0 | % | $ | (435.9 | ) | |||||||
Cost of goods sold | 2,456.6 | 93.4 | % | 2,711.5 | 88.4 | % | (254.9 | ) | ||||||||||
Gross margin | 174.7 | 6.6 | % | 355.7 | 11.6 | % | (181.0 | ) | ||||||||||
Selling, general and administrative expense | 210.0 | 8.0 | % | 231.6 | 7.6 | % | (21.6 | ) | ||||||||||
Impairment of long-lived assets | 97.0 | 3.7 | % | - | 0.0 | % | 97.0 | |||||||||||
Restructuring and other expense | 43.0 | 1.6 | % | 18.1 | 0.6 | % | 24.9 | |||||||||||
Operating income (loss) | (175.3 | ) | -6.7 | % | 106.0 | 3.5 | % | (281.3 | ) | |||||||||
Miscellaneous income (expense) | (2.4 | ) | -0.1 | % | 0.7 | 0.0 | % | 3.1 | ||||||||||
Gain on sale of Aegis Metal Framing LLC | 8.3 | 0.3 | % | - | 0.0 | % | (8.3 | ) | ||||||||||
Interest expense | (20.7 | ) | -0.8 | % | (21.5 | ) | -0.7 | % | (0.8 | ) | ||||||||
Equity in net income of unconsolidated affiliates | 48.6 | 1.8 | % | 67.5 | 2.2 | % | (18.9 | ) | ||||||||||
Income tax (expense) benefit | 37.8 | 1.4 | % | (38.6 | ) | -1.3 | % | (76.4 | ) | |||||||||
Net earnings (loss) | (103.7 | ) | -3.9 | % | 114.1 | 3.7 | % | (217.8 | ) | |||||||||
Net earnings attributable to noncontrolling interest | (4.5 | ) | -0.2 | % | (7.0 | ) | -0.2 | % | (2.5 | ) | ||||||||
Net earnings (loss) attributable to controlling interest | $ | (108.2 | ) | -4.1 | % | $ | 107.1 | 3.5 | % | $ | (215.2 | ) | ||||||
Net earnings attributable to controlling interest for fiscal 2009 decreased $215.2 million from fiscal 2008, resulting in a net loss attributable to controlling interest of $108.2 million.
Net sales decreased by $435.9 million to $2,631.3 million in fiscal 2009. Decreased volumes, primarily in our Steel Processing and Metal Framing operating segments, lowered net sales by $736.6 million. Higher average selling prices in the first half of the year more than offset the dramatic drop in prices in the second half of the year, resulting in an overall increase to net sales of $300.6 million.
Gross margin decreased $181.0 million from fiscal 2008, primarily due to depressed volumes and declining spreads. Volumes declined 39% in the Steel Processing operating segment and 31% in the Metal Framing operating segment, which reduced the gross margin by $61.8 million and $40.5 million, respectively. In addition, the declining spreads resulted in aggregate inventory write-downs of $100.6 million.
SG&A expense decreased $21.6 million from fiscal 2008. Profit sharing and bonus expenses were lower by $27.0 million, but were partially offset by increased bad debt expenses of $6.9 million primarily due to automotive accounts in the Steel Processing and Automotive Body Panels operating segments.
Goodwill impairment charges of $97.0 million and pre-tax restructuring charges of $43.0 million were recognized for fiscal 2009 compared to $18.1 million in pre-tax restructuring charges in fiscal 2008. The goodwill impairment for the Metal Framing operating segment was recorded in the second quarter of fiscal 2009, as changes in key assumptions used in valuations related to the economy and construction market no longer supported the goodwill balance. The restructuring charges in both years related to the Transformation Plan, and included costs related to professional fees, job reductions and facility closures.
We recognized a pre-tax gain of $8.3 million on the sale of our interest in Aegis to our partner, MiTek Industries, Inc. in January 2009.
Equity in net income of unconsolidated affiliates of $48.6 million was largely made up of earnings from our WAVE joint venture, which were down 13%. Our other joint ventures also experienced declines in their earnings. Aegis earnings were down year over year largely because of the sale, Worthington Specialty Processing’s loss increased by $2.6 million and inventory write-downs at our Serviacero Planos joint venture negatively impacted our results by $4.4 million. See “Item 8. – Financial Statements and Supplementary Data – Notes to Consolidated Financial Statements – Note J – Investments in Unconsolidated Affiliates” for further information about our participation in unconsolidated joint ventures.
Due to the pre-tax loss for fiscal 2009, an income tax is primarily becausebenefit of lower earnings and a lower effective$37.8 million, or 25.9% of the pre-tax loss attributable to controlling interest, was recorded. This compares to the $38.6 million tax rate.expense, or 26.5% of the pre-tax income attributable to controlling interest, recorded in fiscal 2008. The decreasechange in the effective income tax rate isattributable to controlling interest was primarily because of adjustmentsdue to our current and deferred estimated tax liabilities and athe change in the mix of our foreign earnings.income among the jurisdictions in which we do business, as well as the portion of the goodwill impairment that is not deductible for tax purposes.
Segment Operations
Steel Processing
The following table presents a summary of operating results for the Steel Processing operating segment for the periods indicated:
| Fiscal Year Ended May 31, | Fiscal Year Ended May 31, | ||||||||||||||||||||||||||||||||
| Dollars in millions | 2008 | % of Net Sales | 2007 | % of Net Sales | Increase/ (Decrease) | ||||||||||||||||||||||||||||
| (dollars in millions) | 2009 | % of Net sales | 2008 | % of Net sales | Increase/ (Decrease) | ||||||||||||||||||||||||||||
Net sales | $ | 1,463.2 | 100.0 | % | $ | 1,460.7 | 100.0 | % | $ | 2.5 | $ | 1,183.0 | 100.0 | % | $ | 1,463.2 | 100.0 | % | $ | (280.2 | ) | ||||||||||||
Cost of goods sold | 1,313.5 | 89.8 | % | 1,313.2 | 89.9 | % | 0.3 | 1,167.4 | 98.7 | % | 1,313.5 | 89.8 | % | (146.1 | ) | ||||||||||||||||||
Gross margin | 149.7 | 10.2 | % | 147.5 | 10.1 | % | 2.2 | 15.6 | 1.3 | % | 149.7 | 10.2 | % | (134.1 | ) | ||||||||||||||||||
Selling, general and administrative expense | 92.8 | 6.3 | % | 92.1 | 6.3 | % | 0.7 | 79.8 | 6.7 | % | 92.8 | 6.3 | % | (13.0 | ) | ||||||||||||||||||
Restructuring charges | 1.1 | 0.1 | % | - | 0.0 | % | 1.1 | ||||||||||||||||||||||||||
Restructuring and other expense | 3.9 | 0.3 | % | 1.1 | 0.1 | % | 2.8 | ||||||||||||||||||||||||||
Operating income | $ | 55.8 | 3.8 | % | $ | 55.4 | 3.8 | % | $ | 0.4 | |||||||||||||||||||||||
Operating income (loss) | $ | (68.1 | ) | -5.8 | % | $ | 55.8 | 3.8 | % | $ | (123.9 | ) | |||||||||||||||||||||
Material cost | $ | 1,105.7 | $ | 1,106.5 | $ | (0.8 | ) | $ | 991.4 | $ | 1,105.7 | $ | (114.3 | ) | |||||||||||||||||||
Tons shipped (in thousands) | 3,286 | 3,282 | 4 | 2,011 | 3,286 | (1,275 | ) | ||||||||||||||||||||||||||
Net sales and operating income (loss) highlights were as follows:
Net sales increased $2.5decreased by $280.2 million from the prior yearfiscal 2008 to $1,463.2$1,183.0 million. The increasedecrease was attributable to a full year of operations at our stainless steel processing facility, Precision Specialty Metals, Inc. (“PSM”), compared to nine and one-half months of operationsweakened demand in the prior year. Increased sales at PSM were partially offsetautomotive and construction markets, the two largest markets served by decreases in net sales at our carbon steel processing facilities, due to decreased average selling prices early in the year and lower volumes.
Operating income increased $0.4 million compared to last year. Gross margin improved $2.2 million as a result of increased volumes at PSM due to a full year of operations, offset by higher freight expense, wages and utilities. SG&A expense was up slightly, primarily due to a higher allocation of corporate expenses. Restructuring charges of $1.1 million related to employee early retirements and severance.
Metal Framing
The following table presents a summary ofSteel Processing operating results for the Metal Framing segment for the periods indicated:
| Fiscal Year Ended May 31, | ||||||||||||||||||
| Dollars in millions | 2008 | % of Net Sales | 2007 | % of Net Sales | Increase/ (Decrease) | |||||||||||||
Net sales | $ | 788.8 | 100.0 | % | $ | 771.4 | 100.0 | % | $ | 17.4 | ||||||||
Cost of goods sold | 729.0 | 92.4 | % | 711.7 | 92.3 | % | 17.3 | |||||||||||
Gross margin | 59.8 | 7.6 | % | 59.7 | 7.7 | % | 0.1 | |||||||||||
Selling, general and administrative expense | 67.0 | 8.5 | % | 68.9 | 8.9 | % | (1.9 | ) | ||||||||||
Restructuring charges | 9.0 | 1.1 | % | - | 0.0 | % | 9.0 | |||||||||||
Operating loss | $ | (16.2 | ) | -2.1 | % | $ | (9.2 | ) | -1.2 | % | $ | (7.0 | ) | |||||
Material cost | $ | 557.3 | $ | 547.6 | $ | 9.7 | ||||||||||||
Tons shipped (in thousands) | 666 | 644 | 22 | |||||||||||||||
Net sales and operating loss highlights were as follows:
Net sales increased $17.4 million from the prior year to $788.8 million. The increase in net sales was due to higher volumes ($28.3 million) offset by lower average selling prices ($10.9 million).segment.
TheOperating income decreased by $123.9 million compared to fiscal 2008, resulting in an operating loss of $16.2 million was $7.0 million worse than last year due to $9.0 million in restructuring charges recorded in$68.1 million. Weakened demand, caused by the current year. Metal Framing was able to return to operating profitability in the fourth quarter, but that was not enough to make up for the losses recorded earlier in the fiscal year. Overall volumes were up over last year contributing $8.9 million to gross margin; however, improved volumes were nearly offset by lower spreadsglobal recession, and a compressed spread between average selling prices and material costcosts resulted in inventory write-downs of $62.6 million and increased conversion costs.were the main drivers behind the operating loss. SG&A decreased $1.9expense was $13.0 million as we have begun to recognized benefits from our Transformation Plan. Restructuring charges of $9.0 million were associated with the Transformation Plan that is expected to reduce expenses by $16.5 million annually. The Transformation Plan has already provided $9.6 million in savingslower than in fiscal 2008, with an additional $6.9 millionprimarily due to lower profit sharing and bonus expenses. Restructuring charges in annual savings expectedboth years related to be recognized in fiscal 2009.the Transformation Plan.
Pressure Cylinders
The following table presents a summary of operating results for the Pressure Cylinders operating segment for the periods indicated:
| Fiscal Year Ended May 31, | Fiscal Year Ended May 31, | |||||||||||||||||||||||||||||||
| Dollars in millions | 2008 | % of Net Sales | 2007 | % of Net Sales | Increase/ (Decrease) | |||||||||||||||||||||||||||
| (dollars in millions) | 2009 | % of Net sales | 2008 | % of Net sales | Increase/ (Decrease) | |||||||||||||||||||||||||||
Net sales | $ | 578.8 | 100.0 | % | $ | 544.8 | 100.0 | % | $ | 34.0 | $ | 537.4 | 100.0 | % | $ | 578.8 | 100.0 | % | $ | (41.4 | ) | |||||||||||
Cost of goods sold | 457.2 | 79.0 | % | 411.1 | 75.5 | % | 46.1 | 429.8 | 80.0 | % | 457.2 | 79.0 | % | (27.4 | ) | |||||||||||||||||
Gross margin | 121.6 | 21.0 | % | 133.7 | 24.5 | % | (12.1 | ) | 107.6 | 20.0 | % | 121.6 | 21.0 | % | (14.0 | ) | ||||||||||||||||
Selling, general and administrative expense | 51.5 | 8.9 | % | 49.1 | 9.0 | % | 2.4 | 45.4 | 8.4 | % | 51.5 | 8.9 | % | (6.1 | ) | |||||||||||||||||
Restructuring charges | 0.1 | 0.0 | % | - | 0.0 | % | 0.1 | |||||||||||||||||||||||||
Restructuring and other expense | 1.0 | 0.2 | % | 0.1 | 0.0 | % | 0.9 | |||||||||||||||||||||||||
Operating income | $ | 70.0 | 12.1 | % | $ | 84.6 | 15.5 | % | $ | (14.6 | ) | $ | 61.2 | 11.4 | % | $ | 70.0 | 12.1 | % | $ | (8.8 | ) | ||||||||||
Material cost | $ | 273.1 | $ | 251.1 | $ | 22.0 | $ | 257.5 | $ | 273.1 | $ | (15.6 | ) | |||||||||||||||||||
Units shipped (in thousands) | 48,058 | 44,891 | 3,167 | 47,639 | 48,058 | (419 | ) | |||||||||||||||||||||||||
Net sales and operating income highlights were as follows:
Net sales of $578.8$537.4 million increaseddecreased by $34.0$41.4 million overfrom fiscal 2007. Stronger2008. An unfavorable change in the sales mix combined with lower North American volumes, reduced net sales by $38.7 million. Weaker foreign currencies relative to the U.S. dollar positivelynegatively impacted reported U.S. dollar sales of the non-U.S. operations by $26.9$9.0 million compared to last year. This was offset by a $9.8 million decline in sales from our European operations in local currencies, primarily as a result of lower average selling prices. The remaining increase in net sales was due to improved volumes in our 14.1 ounce cylinders and higher selling prices across most North American product lines.fiscal 2008.
Operating income for fiscal 2009 decreased $14.6by $8.8 million from last year.fiscal 2008. Gross margin declined to 21.0%20.0% of net sales from 24.5%21.0% as the lower volumes combined with a lower spread between average selling prices in European local currencies and increased material costs resultedto result in a $12.1$14.0 million decline in gross margin for fiscal 2009.
Metal Framing
The following table presents a summary of operating results for the year.Metal Framing operating segment for the periods indicated:
| Fiscal Year Ended May 31, | ||||||||||||||||||
| (dollars in millions) | 2009 | % of Net sales | 2008 | % of Net sales | Increase/ (Decrease) | |||||||||||||
Net sales | $ | 661.0 | 100.0 | % | $ | 788.8 | 100.0 | % | $ | (127.8 | ) | |||||||
Cost of goods sold | 638.1 | 96.5 | % | 729.1 | 92.4 | % | (91.0 | ) | ||||||||||
Gross margin | 22.9 | 3.5 | % | 59.7 | 7.6 | % | (36.8 | ) | ||||||||||
Selling, general and administrative expense | 54.9 | 8.3 | % | 67.0 | 8.5 | % | (12.1 | ) | ||||||||||
Restructuring and other expense | 110.6 | 16.7 | % | 9.0 | 1.1 | % | 101.6 | |||||||||||
Operating loss | $ | (142.6 | ) | -21.6 | % | $ | (16.3 | ) | -2.1 | % | $ | (126.3 | ) | |||||
Material cost | $ | 502.1 | $ | 557.3 | $ | (55.2 | ) | |||||||||||
Tons shipped (in thousands) | 459 | 666 | (207 | ) | ||||||||||||||
Net sales and operating loss highlights were as follows:
Net sales decreased $127.8 million from fiscal 2008 to $661.0 million. Lower volumes reduced net sales by $242.0 million, which more than offset the $114.2 million benefit from higher average selling prices realized primarily in the first half of fiscal 2009.
The operating loss of $142.6 million increased from a $16.3 million loss in fiscal 2008, and included a $97.0 million goodwill impairment charge recorded in the second quarter of fiscal 2009. In addition,
rapidly declining steel prices resulted in an inventory write-down of $38.0 million. Weak volumes were partially offset by lower SG&A expenses realized from plant closures and headcount reductions. |
Other
The “Other” category includes the Automotive Body Panels, Construction Services and Steel Packaging, Mid-Rise Construction, Military Construction and Commercial Stairs operating segments, which are immaterial for purposes of separate disclosure, along with income and expense items not allocated to the operating segments.
The following table presents a summary of operating results for the periods indicated:
| Fiscal Year Ended May 31, | ||||||||||||||||||
| Dollars in millions | 2008 | % of Net Sales | 2007 | % of Net Sales | Increase/ (Decrease) | |||||||||||||
Net sales | $ | 236.4 | 100.0 | % | $ | 194.9 | 100.0 | % | $ | 41.5 | ||||||||
Cost of goods sold | 211.9 | 89.6 | % | 174.2 | 89.4 | % | 37.7 | |||||||||||
Gross margin | 24.5 | 10.4 | % | 20.7 | 10.6 | % | 3.8 | |||||||||||
Selling, general and administrative expense | 20.2 | 8.5 | % | 22.4 | 11.5 | % | (2.2 | ) | ||||||||||
Restructuring charges | 7.9 | 3.3 | % | - | 0.0 | % | 7.9 | |||||||||||
Operating loss | $ | (3.6 | ) | -1.5 | % | $ | (1.7 | ) | -0.9 | % | $ | (1.9 | ) | |||||
Net sales and operating loss highlights were as follows:
The $41.5 million net sales increase in 2008 was almost entirely attributable to the Construction Services segment driven by higher volumes in the military construction group.
The operating loss widened by $1.9 million versus last year due to $7.9 million in restructuring charges. These charges include professional fees and early retirement and severance costs largely related to corporate employees. Gross margin improved $3.8 million due to the operating performance of the Construction Services segment, which improved significantly over the prior year due to a combination of higher volumes in the military construction group and stronger margins for the mid-rise construction projects.
Fiscal 2007 Compared to Fiscal 2006
Consolidated Operations
The following table presents consolidated operating results:
| Fiscal Year Ended May 31, | ||||||||||||||||||
| Dollars in millions | 2007 | % of Net Sales | 2006 | % of Net Sales | Increase/ (Decrease) | |||||||||||||
Net sales | $ | 2,971.8 | 100.0 | % | $ | 2,897.2 | 100.0 | % | $ | 74.6 | ||||||||
Cost of goods sold | 2,610.2 | 87.8 | % | 2,525.6 | 87.2 | % | 84.6 | |||||||||||
Gross margin | 361.6 | 12.2 | % | 371.6 | 12.8 | % | (10.0 | ) | ||||||||||
Selling, general and administrative expense | 232.5 | 7.8 | % | 214.0 | 7.4 | % | 18.5 | |||||||||||
Operating income | 129.1 | 4.3 | % | 157.6 | 5.4 | % | (28.5 | ) | ||||||||||
Other expense, net | (4.4 | ) | -0.1 | % | (1.5 | ) | -0.1 | % | 2.9 | |||||||||
Interest expense | (21.9 | ) | -0.7 | % | (26.3 | ) | -0.9 | % | (4.4 | ) | ||||||||
Gain on sale of Acerex | - | 0.0 | % | 26.6 | 0.9 | % | (26.6 | ) | ||||||||||
Equity in net income of unconsolidated affiliates | 63.2 | 2.1 | % | 56.3 | 1.9 | % | 6.9 | |||||||||||
Income tax expense | (52.1 | ) | -1.8 | % | (66.7 | ) | -2.3 | % | (14.6 | ) | ||||||||
Net earnings | $ | 113.9 | 3.8 | % | $ | 146.0 | 5.0 | % | $ | (32.1 | ) | |||||||
Our fiscal 2007 net earnings decreased $32.1 million, or 22%, from fiscal 2006. Fiscal 2006 earnings included a $12.5 million after-tax gain on the sale of our Acerex, S.A. de C.V. (“Acerex”) Mexican steel processing joint venture.
Net sales increased by $74.6 million to $2,971.8 million. The fiscal 2007 acquisition of PSM contributed $46.2 million of the increase. In addition, average selling prices throughout our segments improved over fiscal 2006, contributing $240.5 million to net sales. However, lower volumes related to soft market conditions in our Steel Processing and Metal Framing segments negatively impacted net sales by $163.4 million, partially offset by volume increases of $43.7 million in our Pressure Cylinders segment and Other category.
Gross margin decreased $10.0 million from fiscal 2006, and decreased as a percent of net sales from 12.8% to 12.2%, primarily due to lower volumes related to soft market conditions in our Steel Processing and Metal Framing segments as well as a lower spread between average selling prices and material costs in Metal Framing.
SG&A expense increased $18.5 million over fiscal 2006 primarily as a result of increases in benefits ($9.9 million), wages ($8.8 million), stock-based compensation ($3.5 million) and bad debt expense ($3.6 million). These increases were partially offset by lower professional fees ($5.9 million) and insurance and taxes ($2.2 million).
Interest and other expense, net decreased $1.5 million compared to fiscal 2006. Interest expense decreased $4.4 million primarily due to lower average debt levels compared to fiscal 2006, while other expense increased $2.9 million primarily due to lower interest income.
Equity in net income of unconsolidated affiliates increased $6.9 million, primarily due to the negative impact in fiscal 2006 of a $6.0 million income tax accrual adjustment at Acerex, and increased equity income from WAVE. The unconsolidated joint ventures generated $652.2 million in sales and $124.5 million in net income during fiscal 2007.
Income tax expense decreased $14.6 million due to lower earnings and the tax impact from the gain on sale of Acerex in fiscal 2006. The effective tax rate was 31.4% for both years.
Segment Operations
Steel Processing
The following table presents a summary of operating results for the Steel Processing segment for the periods indicated:
| Fiscal Year Ended May 31, | ||||||||||||||||
| Dollars in millions | 2007 | % of Net sales | 2006 | % of Net sales | Increase/ (Decrease) | |||||||||||
Net sales | $ | 1,460.7 | 100.0 | % | $ | 1,486.2 | 100.0 | % | $ | (25.5 | ) | |||||
Cost of goods sold | 1,313.2 | 89.9 | % | 1,347.6 | 90.7 | % | (34.4 | ) | ||||||||
Gross margin | 147.5 | 10.1 | % | 138.6 | 9.3 | % | 8.9 | |||||||||
Selling, general and administrative expense | 92.1 | 6.3 | % | 76.8 | 5.2 | % | 15.3 | |||||||||
Operating income | $ | 55.4 | 3.8 | % | $ | 61.8 | 4.2 | % | $ | (6.4 | ) | |||||
Material cost | $ | 1,106.5 | $ | 1,139.0 | $ | (32.5 | ) | |||||||||
Tons shipped (in thousands) | 3,282 | 3,611 | (329 | ) | ||||||||||||
Net sales and operating income highlights were as follows:
Net sales decreased $25.5 million from fiscal 2006 to $1,460.7 million. Volumes were down 9% from fiscal 2006 resulting in a $184.3 million reduction to net sales, as virtually all end markets served by this segment, especially automotive and construction, were weak compared to fiscal 2006. Volume declines were partially offset by $112.6 million in higher average selling prices and additional net sales of $46.2 million generated by PSM.
Operating income decreased $6.4 million primarily due to lower volumes as well as higher SG&A expense. SG&A expense increased due to the acquisition of PSM and because SG&A expense in fiscal 2006 was significantly decreased by a favorable bad debt recovery.
Metal Framing
The following table presents a summary of operating results for the Metal Framing segment for the periods indicated:
| Fiscal Year Ended May 31, | |||||||||||||||||
| Dollars in millions | 2007 | % of Net sales | 2006 | % of Net sales | Increase/ (Decrease) | ||||||||||||
Net sales | $ | 771.4 | 100.0 | % | $ | 796.3 | 100.0 | % | $ | (24.9 | ) | ||||||
Cost of goods sold | 711.7 | 92.3 | % | 673.4 | 84.6 | % | 38.3 | ||||||||||
Gross margin | 59.7 | 7.7 | % | 122.9 | 15.4 | % | (63.2 | ) | |||||||||
Selling, general and administrative expense | 68.9 | 8.9 | % | 76.2 | 9.6 | % | (7.3 | ) | |||||||||
Operating income (loss) | $ | (9.2 | ) | -1.2 | % | $ | 46.7 | 5.9 | % | $ | (55.9 | ) | |||||
Material cost | $ | 547.6 | $ | 508.6 | $ | 39.0 | |||||||||||
Tons shipped (in thousands) | 644 | 704 | (60.0 | ) | |||||||||||||
Net sales and operating income (loss) highlights were as follows:
Net sales decreased $24.9 million from fiscal 2006 to $771.4 million primarily due to the effect of a 9% decline in volume ($71.5 million), partially offset by an increase in average selling prices ($46.6 million). Lower volume was the result of weak demand due to: reduced residential and commercial construction activity, especially in the significant Florida market; product substitution, as steel remained higher priced than alternative building materials, such as wood; increased competition; and delays in commercial construction projects as developers anticipated lower material prices. Average selling prices rose from fiscal 2006 in an attempt to offset increasing galvanized material costs resulting from higher zinc prices.
The segment reported an operating loss of $9.2 million compared to operating income of $46.7 million in fiscal 2006, primarily due to a $32.7 million decrease in the spread between average selling prices and material costs. While selling prices increased over fiscal 2006, the increase was not enough to offset significantly higher material costs. Material costs climbed significantly due to higher galvanized steel costs and an unfavorable mix of prime and secondary steel inventory for a portion of the year. SG&A expenses decreased $7.4 million, primarily due to lower professional fees and a favorable bad debt recovery recorded in fiscal 2007. In addition, we reduced the value of assets by $1.7 million as a result of the LaPorte, Indiana, facility closure in fiscal 2007.
Pressure Cylinders
The following table presents a summary of operating results for the Pressure Cylinders segment for the periods indicated:
| Fiscal Year Ended May 31, | ||||||||||||||||
| Dollars in millions | 2007 | % of Net sales | 2006 | % of Net sales | Increase/ (Decrease) | |||||||||||
Net sales | $ | 544.8 | 100.0 | % | $ | 461.9 | 100.0 | % | $ | 82.9 | ||||||
Cost of goods sold | 411.1 | 75.5 | % | 367.2 | 79.5 | % | 43.9 | |||||||||
Gross margin | 133.7 | 24.5 | % | 94.7 | 20.5 | % | 39.0 | |||||||||
Selling, general and administrative expense | 49.1 | 9.0 | % | 45.4 | 9.8 | % | 3.7 | |||||||||
Operating income | $ | 84.6 | 15.5 | % | $ | 49.3 | 10.7 | % | $ | 35.3 | ||||||
Material cost | $ | 251.1 | $ | 221.8 | $ | 29.3 | ||||||||||
Units shipped (in thousands) | 44,891 | 48,621 | (3,730 | ) | ||||||||||||
Net sales and operating income highlights were as follows:
Net sales grew $82.9 million from fiscal 2006 to $544.8 million primarily due to higher average selling prices ($75.2 million). Changes in the overall product mix and price increases in certain product lines to cover increased material costs were the primary reasons for the higher average selling prices. Volume increases, especially in the higher priced cylinders, contributed $7.7 million to net sales. Net sales in North America increased $28.8 million as most product lines showed increases over fiscal 2006. European revenues increased $54.1 million as a result of the continued strong market conditions for our steel high-pressure cylinders and the growth in air tank unit sales for truck braking applications.
Operating income increased over fiscal 2006 as a result of the strong performances in North America and Europe. Earnings were impacted by a strategy implemented to cut costs, exit unprofitable product lines, introduce new product lines, consolidate facilities and grow profitable lines through capacity and geographic expansion over a several year period. These actions, combined with a strong overall sales effort, led to a 71% increase in operating income over fiscal 2006.
Other
The “Other” category includes the Automotive Body Panels, Construction Services and Steel Packaging segments, which are immaterial for purposes of separate disclosure, and also includes income and expense items not allocated to the segments.
The following table presents a summary of operating results for the periods indicated:
| Fiscal Year Ended May 31 | Fiscal Year ended May 31, | |||||||||||||||||||||||||||||||||||
| Dollars in millions | 2007 | % of Net sales | 2006 | % of Net sales | Increase/ (Decrease) | |||||||||||||||||||||||||||||||
| (dollars in millions) | 2009 | % of Net sales | 2008 | % of Net sales | Increase/ (Decrease) | |||||||||||||||||||||||||||||||
Net sales | $ | 194.9 | 100.0 | % | $ | 152.9 | 100.0 | % | $ | 42.0 | $ | 249.9 | 100.0 | % | $ | 236.4 | 100.0 | % | $ | 13.5 | ||||||||||||||||
Cost of goods sold | 174.2 | 89.4 | % | 137.4 | 89.9 | % | 36.8 | 221.3 | 88.6 | % | 211.8 | 89.6 | % | 9.5 | ||||||||||||||||||||||
Gross margin | 20.7 | 10.6 | % | 15.5 | 10.1 | % | 5.2 | 28.6 | 11.4 | % | 24.6 | 10.4 | % | 4.0 | ||||||||||||||||||||||
Selling, general and administrative expense | 22.4 | 11.5 | % | 15.7 | 10.3 | % | 6.7 | 29.9 | 12.0 | % | 20.2 | 8.5 | % | 9.7 | ||||||||||||||||||||||
Restructuring and other expense | 24.5 | 9.8 | % | 7.9 | 3.3 | % | 16.6 | |||||||||||||||||||||||||||||
Operating loss | $ | (1.7 | ) | -0.9 | % | $ | (0.2 | ) | -0.1 | % | $ | (1.5 | ) | $ | (25.8 | ) | -10.3 | % | $ | (3.5 | ) | -1.5 | % | $ | (22.3 | ) | ||||||||||
Net sales and operating loss highlights were as follows:
Net sales increased $42.0$13.5 million overfrom fiscal 2006 primarily2008. Net sales increased $28.6 million due to the Worthington Stairs acquisition (operating as a result of increasedthe Commercial Stairs operating segment) in June 2008, and higher volumes in both the Mid-Rise Construction and Military Construction operating segments. This increase was partially offset by an $18.8 million decline in net sales in the Construction Services and Automotive Body Panels segments. The Steel Packagingoperating segment, also realized a small increasewhich was negatively impacted by the downturn in net sales over the same period in fiscal 2006.automotive market.
This category reported an increase inThe operating loss of $1.5widened by $22.3 million compared toversus fiscal 2006. The Construction Services segment expenses were higher2008 due to $1.6$24.5 million in restructuring charges related to the Transformation Plan, which included professional fees, employee severance and relocation expenses. In addition, SG&A expenses increased $9.7 million due to the acquisition of Worthington Stairs and higher bad debt expense of a development project in China combined with the higher expenses from increased domestic activity. The Automotive Body Panels segmentoperating segment. Results improved its operating incomesignificantly over fiscal 2006.2008 in both the Military Construction and Mid-Rise Construction operating segments due to strength in those end markets.
Liquidity and Capital Resources
CashDuring fiscal 2010, we generated cash from operating activities of $110.4 million, received $16.0 million in proceeds from the sale of assets and increased cash equivalents for fiscal 2008 increased $35.5by $7.9 million comparedthrough net borrowing activity. We also paid $31.7 million in dividends (excluding $4.5 million in dividend payments made to the endnoncontrolling interest), made $34.3 million of the same period last year.capital expenditures and completed acquisitions requiring $63.1 million in cash. The following table summarizesis a summary of our consolidated cash flows.flows for each period shown:
| Fiscal Years Ended May 31, | Fiscal Years Ended May 31, | |||||||||||||||
Cash Flow Summary (in millions) | 2008 | 2007 | 2010 | 2009 | ||||||||||||
Cash provided by operating activities | $ | 180.5 | $ | 180.4 | ||||||||||||
Cash used by investing activities | (70.7 | ) | (95.5 | ) | ||||||||||||
Cash used by financing activities | (74.3 | ) | (102.8 | ) | ||||||||||||
Net cash provided by operating activities | $ | 110.4 | $ | 254.3 | ||||||||||||
Net cash used by investing activities | (81.9 | ) | (53.3 | ) | ||||||||||||
Net cash used by financing activities | (25.8 | ) | (218.5 | ) | ||||||||||||
Increase (decrease) in cash and cash equivalents | 35.5 | (17.9 | ) | 2.7 | (17.5 | ) | ||||||||||
Cash and cash equivalents at beginning of period | 38.3 | 56.2 | 56.3 | 73.8 | ||||||||||||
Cash and cash equivalents at end of period | $ | 73.8 | $ | 38.3 | $ | 59.0 | $ | 56.3 | ||||||||
We believe we have access to adequate resources to meet our needs for normal operating costs, mandatory capital expenditures, mandatory debt redemptions, dividend payments and working capital for our existing businesses. These resources include cash and cash equivalents, cash provided by operating activities access to capital markets and unused lines of credit. We also believe that we have adequate access to the financial markets to allow us to be in a position to sell long-term debt or equity securities. However, given the current uncertainty and volatility in the financial markets, our ability to access capital and the terms under which we can do so may change.
Operating activities
CashOur business is cyclical and cash flows from operating activities may fluctuate during the year and from year-to-yearyear to year due to economic conditions. We rely on cash and short-term financing to meet cyclical increases in working capital needs. Cash requirements generally rise during periods of increasingincreased economic activity or increasing raw material prices due to higher levels of inventory volumes and/or cost and increased accounts receivable. During economic slowdowns, or periods of decreasing raw material prices, positivecosts, cash flowrequirements generally results fromdecrease as a result of the reduction in the amount of and/or cost of inventories and lower levels of accounts receivable. This cash is typically used to reduce, or eliminate, short-term debt.
Net cash provided by operating activities was $180.5$110.4 million and $180.4$254.3 million in fiscal 20082010 and fiscal 2007. Fiscal 20082009, respectively. A significant amount of cash needs for inventorywas generated in fiscal 2009 by a large decrease in net working capital. Inventories, receivables and accounts payable increases were affected by the large increase in steel cost in the second half of fiscal 2008 versus fiscal 2007. Receivablesall decreased significantly due to a $100.0 million increase in usage of our accounts receivable securitization facility, partially offset by higher selling prices. Accounts payablelower actual and projected sales volumes, coupled with lower raw material costs. As sales and production activity levels increased primarily due to the higher steel prices for raw material. Also during fiscal 2008, distributions from our unconsolidated affiliates of $58.9 million2010, this prior year trend reversed and working capital requirements increased, causing a corresponding decrease in cash as those needs were $72.8 million less than in fiscal 2007.met. Consolidated net working capital was $440.1$402.5 million at May 31, 2008,2010, compared to $548.9$226.9 million at May 31, 2007, primarily due to a $103.8 million2009. The impact from working capital changes was offset somewhat by an increase in short-term debt outstanding.cash generated by higher earnings.
We review our receivables on an ongoing basis to ensure they are properly valued. Based on this review, we believe our reserve for doubtful accounts is sized appropriately. The reserve for doubtful accounts decreased approximately $6.7 million during fiscal 2010. This reduction was the result of the write-off of previously reserved accounts, as well as reduced risk related to large automotive customers, some of which have emerged from bankruptcy and others whose balances were otherwise settled. However, if the economic environment and market conditions deteriorate, particularly in the automotive and construction markets where our exposure is greatest, additional reserves may be required.
As noted above, while an economic slowdown adversely affects sales, it generally decreases working capital needs. We will continue to adjust operating activities and cash levels based on economic conditions and their impact on our markets and businesses.
Investing activities
Net cash used by investing activities was $70.7$81.9 million and $95.5$53.3 million in fiscal 20082010 and fiscal 2007.2009, respectively. This change of $28.6 million was caused by several factors, as explained below.
Capital expenditures by reportable business segment represent cash used for investment in property, plant and equipment and are presented below:below. (The below information does not include cash flows from acquisition or divestiture activity):
| Fiscal Year Ended May 31, | Fiscal Year Ended May 31, | |||||||||||
| In millions | 2008 | 2007 | ||||||||||
| (in millions) | 2010 | 2009 | ||||||||||
Steel Processing | $ | 7.2 | $ | 14.0 | $ | 5.9 | $ | 25.0 | ||||
Pressure Cylinders | 19.4 | 26.6 | ||||||||||
Metal Framing | 6.8 | 15.7 | 2.6 | 4.5 | ||||||||
Pressure Cylinders | 16.5 | 14.1 | ||||||||||
Other | 17.0 | 13.9 | 6.4 | 8.1 | ||||||||
| $ | 47.5 | $ | 57.7 | $ | 34.3 | $ | 64.2 | |||||
TheCapital expenditures in the Steel Processing operating segment capital expenditures decreased $19.1 million in fiscal 20082010 compared to fiscal 2007, which had included a furnace upgrade2009, due primarily to the completion of the capacity expansion at our Spartan joint venture facility.
The Metal Framing segment capital expenditures decreasedDelta, Ohio, steel galvanizing plant. This activity was largely completed in fiscal 20082009.
Capital expenditures in the Pressure Cylinders operating segment decreased $7.2 million in fiscal 2010 compared to fiscal 2007 due to reduced spending for the conversion of drywall metal framing lines to UltraSTEEL®.
Capital expenditures for the Other category increased $3.1 million from fiscal 20072009, due primarily to increased expenditures related tofor an upgrade of the capabilities at our enterprise resource planning system.Austrian Pressure Cylinders facility. The expenditures on this project were significantly higher in fiscal 2009 than in fiscal 2010, when the project was completed.
In addition to capital expenditures, other significantfiscal 2009, we received distributions from an unconsolidated joint venture that were $23.5 million in excess of the Company’s cumulative equity in the earnings of that joint venture. This $23.5 million cash inflow was included in investing activities in 2008 included an aggregatethe consolidated statements of $47.6 million invested in our newcash flows due to the nature of the distribution as a return of investment, rather than a return on investment. Distributions from unconsolidated joint ventures Serviacero Worthington, Canessa Worthingtonthat did not exceed the Company’s cumulative equity in the earnings of respective joint ventures are included as operating cash flows in the consolidated statements of cash flows. In fiscal 2010, there were only $0.4 million in distributions from unconsolidated joint ventures classified as investing cash flows.
In fiscal 2010, we also had greater acquisition outlays and LEFCO Worthington, and $25.6 million receivedlower proceeds from the sale of short-term investments. Fiscal 2007 includedinvestments in unconsolidated affiliates, partially offset by a decrease in capital spending. The aggregate price paid for the $31.7 million acquisitionacquisitions of PSM, $25.6 million purchasethe Gibraltar Assets, the assets of short-termPiper and the membership interests of SCI in fiscal 2010 was more than the aggregate price paid for the acquisitions of the assets of The Sharon Companies Ltd. and Laser Products in fiscal 2009. Additionally, the sale of assets in fiscal 2010 generated less cash than the sale of assets and the sale of investments and $16.4 millionin unconsolidated affiliates in fiscal 2009. The proceeds we received in fiscal 2010 were largely related to the sale of our Metal Framing operations in Canada, while the proceeds we received in fiscal 2009 resulted largely from the salesales of our investments in the Aegis, Canessa Worthington Slovakia and subsequent leasebackAccelerated Building Technologies joint ventures. Capital spending was $29.9 million lower in fiscal 2010, largely due to the completion of a corporate aircraft.two major projects, as noted above, and an effort by management to reduce spending.
Investment activities are largely discretionary and future investment activities could be reduced significantly or eliminated as economic conditions warrant. We assess acquisition opportunities as they arise, whichand such opportunities may require additional financing. There can be no assurance, however, that any such opportunities will arise, that any such acquisitions will be consummated or that any needed additional financing will be available on satisfactory terms when required.
Financing activities
Net cash used by financing activities was $25.8 million and $218.5 million in fiscal 2010 and fiscal 2009, respectively. In fiscal 2009, we paid down a significant amount of debt as working capital needs decreased. In fiscal 2010, the net proceeds from the issuance of the $150.0 million aggregate principal amount of senior notes due 2020 were used to pay down other debt and reduce amounts then outstanding under the trade accounts receivable securitization facility. The decreased level of common share repurchase activity and lower dividend payments in fiscal 2010 compared to fiscal 2009, discussed below, also decreased cash used.
Long-term debt -– Our senior unsecured long-term debt is rated “investment grade” by both Moody’s Investors Service, Inc. (Baa2) and Standard & Poor’s Ratings Group (BBB). We typically use the net proceeds from long-term debt for acquisitions, refinancing outstanding debt, capital expenditures and general corporate purposes. As of May 31, 2008,2010, we were in compliance with our long-term debt covenants and expect to remain compliant in the future.covenants. Our long-term debt agreements do not include ratings triggers or material adverse change provisions.
On June 12, 2009, we redeemed $118.5 million of the then $138.0 million outstanding 6.70% senior notes due December 1, 2009 (the “2009 Notes”). The consideration paid for the 2009 Notes was $1,025 per $1,000 principal amount of the 2009 Notes, plus accrued and unpaid interest. The remainder of the 2009 Notes became due and were redeemed, at face value, on December 1, 2009. The redemptions were funded by a combination of cash on hand and borrowings under existing credit facilities.
On April 13, 2010, we issued $150.0 million aggregate principal amount of senior notes due 2020 (the “2020 Notes”). The 2020 Notes bear interest at a rate of 6.50%. The 2020 Notes were sold to the public at 99.890% of the principal amount thereof, to yield 6.515% to maturity. The Company used the net proceeds from the offering to repay a portion of the then outstanding borrowings under its revolving credit facility and amounts then outstanding under its revolving trade accounts receivable securitization facility. The proceeds on the issuance of the 2020 Notes were reduced for debt discount ($0.2 million), payment of debt issuance costs ($1.5 million) and settlement of a hedging instrument entered into in anticipation of the issuance of the 2020 Notes ($1.4 million).
Short-term debt - On May 6, 2008, we amended our– We maintain a $435.0 million five-year revolving credit facility (the “Credit Facility”), which had been due to expire on September 29, 2010. The amendment extended the commitment date toexpires in May 6, 2013, except for a $35.0 million commitment by one lender, that will expirewhich expires in September 29, 2010. In addition, the amendment increased the facility fees and applicable percentage for base rate and Eurodollar loans payable. Borrowings under this facility have maturities of less than one year. We also have a $100.0 million revolving trade accounts receivable securitization facility as well as $40.0 million of uncommitted credit lines available at the discretion of several banks. These facilities were established with major domestic banks. We had $125.5 million and $21.7 million of committed borrowings, $100.0 million and $0.0 million of
securitization facility usage, and $10.0 million and $10.0 million of uncommitted borrowings outstanding at May 31, 2008 and 2007. We also provided $9.1 million in letters of credit for third parties as of May 31, 2008.
We were in compliance with our short-term debt covenants at May 31, 2008.2010. Our short-term debt agreements do not include ratings triggers or material adverse change provisions. Borrowings under the Credit Facility have maturities of less than one year and given that our intention has been to repay them within a year, they have been classified as notes payable within current liabilities on the consolidated balance sheets. However, we can also extend the term of amounts borrowed by renewing these borrowings for the term of the Credit Facility. We have the option to borrow at rates equal to an applicable margin over the LIBOR, Prime or Fed Funds rates. The applicable margin is determined by our credit rating. At May 31, 2010, there were no outstanding borrowings under the Credit Facility. At May 31, 2009, borrowings under the Credit Facility bore interest at rates based on LIBOR.
We provided $8.3 million in letters of credit for third-party beneficiaries as of May 31, 2010. The letters of credit secure potential obligations to certain bond and insurance providers. These letters can be drawn at any time at the option of the beneficiaries, and while not drawn against at May 31, 2010, these letters of credit are issued against and therefore reduce availability under the Credit Facility. Letters of credit were not issued
against the Credit Facility at May 31, 2009 and therefore did not reduce availability under the Credit Facility at that date. We had $426.7 million available to us under the Credit Facility at May 31, 2010, compared to $434.0 million available to us at May 31, 2009.
We also have a $100.0 million revolving trade accounts receivable securitization facility (the “AR Facility”), of which $45.0 million and $60.0 million was utilized at May 31, 2010 and 2009, respectively. See the description that follows under “Off-Balance Sheet Arrangements.” The AR Facility is backed by a committed liquidity facility that expires during January 2011.
The adoption of certain United States of America generally accepted accounting principles (“U.S. GAAP”) amendments effective June 1, 2010, as discussed below under “Recently Issued Accounting Standards,” will result in recognition on the consolidated balance sheets of the AR Facility. Recognition on the consolidated balance sheets will include reporting of amounts sold under the AR Facility as accounts receivable and outstanding secured borrowings. Also, prospectively upon adoption, related Facility fees will be treated as interest expense in the consolidated statements of earnings.
Common shares -– We maintained ourdeclared quarterly dividends of $0.10 per common share for each quarter of fiscal 2010. The dividend declared during the first three quarters of fiscal 2008 at2009 was $0.17 per common share.share, and this was reduced to $0.10 per common share during the fiscal quarter ended May 31, 2009. We paid dividends on our common shares of $55.6$31.7 million and $59.0$53.7 million in fiscal 20082010 and fiscal 2007. We currently have no material contractual or regulatory restrictions on the payment of dividends.2009, respectively.
At its meeting on September 27, 2006, the Board of Directors of Worthington reconfirmed its authorization to repurchase up to 10,000,000 of Worthington’s outstanding common shares, which had initially been announced on June 13, 2005. This repurchase authorization was completed during December 2007. On September 26, 2007, Worthington Industries, Inc. announced that the Board of Directors had authorized the repurchase of up to an additional 10,000,000 of Worthington’sWorthington Industries, Inc.’s outstanding common shares. A total of 9,099,5008,449,500 common shares remained available under this repurchase authorization as of May 31, 2008.2010. The common shares available for purchaserepurchase under this authorization may be purchased from time to time, with consideration given to the market price of the common shares, the nature of other investment opportunities, cash flows from operations, and general economic conditions.conditions and other relevant considerations. Repurchases may be made on the open market or through privately negotiated transactions. No common share repurchases were made under this authorization during fiscal 2010. During fiscal 2008 and fiscal 2007,2009, we spent $125.8$12.4 million and $76.6 million, respectively, on common share repurchases. The Company has begun to repurchase common shares under this authorization during the first quarter of the fiscal year ending May 31, 2011. See “Item 8. – Financial Statements and Supplementary Data – Notes to Consolidated Financial Statements – Note U – Subsequent Events” within this Annual Report on Form 10-K for additional information regarding common share repurchase activity subsequent to May 31, 2010.
Dividend Policy
We currently have no material contractual or regulatory restrictions on the payment of dividends. Dividends are declared at the discretion of the Board of Directors of Worthington.Worthington Industries, Inc. The Board reviews the dividend quarterly and establishes the dividend rate based upon our financial condition, results of operations, capital requirements, current and projected cash flows, business prospects and other relevant factors. While we have paid a dividend every quarter since becoming a public company in 1968, there is no guarantee that this will continue in the future.
Contractual Cash Obligations and Other Commercial Commitments
The following table summarizes our contractual cash obligations as of May 31, 2008.2010. Certain of these contractual obligations are reflected on our consolidated balance sheet, while others are disclosed as future obligations under accounting principles generally accepted in the United States.U.S. GAAP.
| Payments Due by Period | Payments Due by Period | |||||||||||||||||||||||||||||
| In millions | Total | Less Than 1 Year | 1 - 3 Years | 4 - 5 Years | After 5 Years | |||||||||||||||||||||||||
Notes payable | $ | 135.5 | $ | 135.5 | $ | - | $ | - | $ | - | ||||||||||||||||||||
| (in millions) | Total | Less Than 1 Year | 1 - 3 Years | 4 - 5 Years | After 5 Years | |||||||||||||||||||||||||
Long-term debt | 245.0 | - | 145.0 | - | 100.0 | $ | 250.4 | $ | - | $ | 0.1 | $ | 100.2 | $ | 150.1 | |||||||||||||||
Interest expense on long-term debt | 56.8 | 15.1 | 20.4 | 10.7 | 10.6 | 124.3 | 15.1 | 30.2 | 30.2 | 48.8 | ||||||||||||||||||||
Operating leases | 47.8 | 10.7 | 17.8 | 12.4 | 6.9 | 39.7 | 10.7 | 16.1 | 7.9 | 5.0 | ||||||||||||||||||||
Unconditional purchase obligations | 26.0 | 2.4 | 4.7 | 4.7 | 14.2 | 21.3 | 2.4 | 4.7 | 4.7 | 9.5 | ||||||||||||||||||||
Total contractual cash obligations | $ | 511.1 | $ | 163.7 | $ | 187.9 | $ | 27.8 | $ | 131.7 | $ | 435.7 | $ | 28.2 | $ | 51.1 | $ | 143.0 | $ | 213.4 | ||||||||||
The interest expense on long-term debt is computed by using the fixed rates of interest on the debt, including impacts of the related interest rate swap hedge. The unconditional purchase obligations are to secure access to a facility used to regenerate acid used in our Steel Processing facilities through the fiscal year ending May 31, 2019. Due to the uncertainty regarding the timing of future cash outflows associated with our unrecognized tax benefits of $2.1$5.9 million, we are unable to make a reliable estimate of the periods of cash settlement with the respective tax authorities and have not included such amount in the contractual obligations table above.
The following table summarizes our other commercial commitments as of May 31, 2008.2010. These commercial commitments are not reflected on our consolidated balance sheet.sheets.
| Commitment Expiration by Period | Commitment Expiration by Period | |||||||||||||||||||||||||||||
| In millions | Total | Less Than 1 Year | 1 - 3 Years | 4 - 5 Years | After 5 Years | |||||||||||||||||||||||||
Guarantees | $ | 6.3 | $ | 6.3 | $ | - | $ | - | $ | - | ||||||||||||||||||||
| (in millions) | Total | Less Than 1 Year | 1 - 3 Years | 4 - 5 Years | After 5 Years | |||||||||||||||||||||||||
Guarantee (aircraft residual value) | $ | 14.7 | $ | 14.7 | $ | - | $ | - | $ | - | ||||||||||||||||||||
Standby letters of credit | 9.1 | 9.1 | - | - | - | 8.3 | 8.3 | - | - | - | ||||||||||||||||||||
Total commercial commitments | $ | 15.4 | $ | 15.4 | $ | - | $ | - | $ | - | $ | 23.0 | $ | 23.0 | $ | - | $ | - | $ | - | ||||||||||
Off BalanceOff-Balance Sheet Arrangements
We maintain a $100.0 million revolving trade accounts receivable securitization facility, which expires in January 2011. The AR Facility was available throughout fiscal 2010 and fiscal 2009. Transactions under the AR Facility have been accounted for as sales. Pursuant to the terms of the facility,AR Facility, certain of our subsidiaries sell their accounts receivable without recourse, on a revolving basis, to Worthington Receivables Corporation (“WRC”), a wholly-owned, consolidated, bankruptcy-remote subsidiary. In turn, WRC may sell without recourse, on a revolving basis, up to $100.0 million of undivided ownership interests in this pool of accounts receivable to independent third parties.a multi-sell, asset-backed commercial paper conduit (the “Conduit”). Purchases by the Conduit are financed with the sale of A1/P1 commercial paper. We retain an undivided interest in this pool and are subject to risk of loss based on the collectability of the receivables from this retained interest. Because the amount eligible to be sold excludes receivables more than 90 days past due, receivables offset by an allowance for doubtful accounts because ofdue to bankruptcy or other cause, receivables from certain foreign customers, concentrations over certain limits with specific customers and certain reserve amounts, we believe additional risk of loss is minimal. The book value of the retained portion of the pool of accounts receivable approximates fair value. Accounts receivable sold under the AR Facility are excluded from accounts receivable in the consolidated financial statements. As of May 31, 2008,2010, the pool of eligible accounts receivable exceeded the $100.0 million limit, and $45.0 million of undivided ownership interests in this pool of accounts receivable had been sold.
The adoption of certain U.S. GAAP amendments effective June 1, 2010, as discussed below under “Recently Issued Accounting Standards,” will result in recognition on the consolidated balance sheets of the AR Facility. Recognition on the consolidated balance sheets will include reporting of amounts sold under the AR Facility as accounts receivable and outstanding secured borrowings. Also, prospectively upon adoption, related Facility fees will be treated as interest expense in the consolidated statements of earnings.
We do not have guarantees or other off-balance sheet financing arrangements that we believe are reasonably likely to have a material current or future effect on our financial condition, changes in financial condition, revenue or expenses, results of operations, liquidity, capital expenditures or capital resources. However, as of May 31, 2010, the Company was party to an operating lease for an aircraft in which the Company has guaranteed a residual value at the termination of the lease. The maximum obligation under the terms of this guarantee was approximately $14.7 million at May 31, 2010. Based on current facts and circumstances, the Company has estimated the likelihood of payment pursuant to this guarantee, and determined that the fair value of the obligation based on those likely outcomes is not material.
Recently Issued Accounting Standards
In September 2006,June 2009, the Financial Accounting Standards Board (“FASB”) issued Statementan amendment to the accounting and disclosure requirements for transfers of Financial Accounting Standards (“SFAS”) No. 157,Fair Value Measurements, to establishfinancial assets. This amendment removes the concept of a framework for measuringqualifying special-purpose entity and requires that a transferor recognize and initially measure at fair value all assets obtained and expandliabilities incurred as a result of a transfer of financial assets accounted for as a sale. This amendment also requires additional disclosures about fair value measurements. SFAS No. 157any transfers of financial assets and a transferor’s continuing involvement with transferred financial assets. This amendment is effective for fiscal years beginning after November 15, 2009, and interim periods within those fiscal years. The adoption of this amendment effective June 1, 2010 will result in recognition on the consolidated balance sheets of our trade accounts receivable securitization facility (see the description above, under “Off-Balance Sheet Arrangements” for details regarding the AR facility).
In June 2009, the FASB issued an amendment to the accounting and disclosure requirements for variable interest entities. This amendment changes how a reporting entity determines when an entity that is insufficiently capitalized or is not controlled through voting (or similar rights) should be consolidated. The determination of whether a reporting entity is required to consolidate another entity is based on, among other things, the purpose and design of the other entity and the reporting entity’s ability to direct the activities of the other entity that most significantly impact its economic performance. The amendment also requires additional disclosures about a reporting entity’s involvement with variable interest entities and any significant changes in risk exposure due to that involvement. A reporting entity will be required to disclose how its involvement with a variable interest entity affects the reporting entity’s financial assetsstatements. This amendment is effective for fiscal years beginning after November 15, 2009, and liabilities after May 31, 2008,interim periods within those fiscal years. Worthington will adopt this amendment on June 1, 2010; and, for non-financial assets and liabilities after May 31, 2009. SFAS No. 157while we continue to fully evaluate the anticipated impacts, that adoption is not expected to materiallyhave a material impact on our consolidated financial position or results of operations.
In September 2006, the FASB issued SFAS No. 158,Employers’ Accounting for Defined Benefit Pension and Other Postretirement Plans—an amendment of FASB Statements No. 87, 88, 106, and 132(R), to improve financial reporting regarding defined benefit pension and other postretirement plans. We adopted the recognition provisions of SFAS No. 158 at May 31, 2007. The measurement date provision of SFAS No. 158 is effective at May 31, 2009, and is not expected to materially impact our consolidated financial position or results of operations.
In February 2007, the FASB issued SFAS No. 159,The Fair Value Option for Financial Assets and Financial Liabilities - Including an amendment of FASB Statement No. 115,to improve financial reporting by providing entities with the opportunity to mitigate volatility in reported earnings caused by measuring related assets and liabilities differently through the use of fair value measurements. SFAS No. 159 is effective June 1, 2008, and is not expected to materially impact our consolidated financial position or results of operations.
In December 2007, the FASB issued SFAS No. 141 (revised 2007) (“SFAS No. 141(R)”),Business Combinations,to improve the relevance, representational faithfulness and comparability of the information that a reporting entity provides in its financial reports about a business combination and its effects. SFAS No. 141(R) applies prospectively to business combinations after May 31, 2009, and is not expected to materially impact our consolidated financial position or results of operations.
In December 2007, the FASB issued SFAS No. 160,Noncontrolling Interests In Consolidated Financial Statements - an amendment of ARB No. 51,to improve the relevance, comparability and transparency of the financial information that a reporting entity provides in its consolidated financial statements by establishing accounting and reporting standards for the noncontrolling interest (minority interest) in a subsidiary and for the deconsolidation of a subsidiary. SFAS No. 160 is effective June 1, 2009, and will require a change in the presentation of the minority interest in the consolidated financial statements.
In March 2008, the FASB issued SFAS No. 161,Disclosures about Derivative Instruments and Hedging Activities - an amendment of FASB Statement No. 133,to improve the transparency of financial reporting by requiring enhanced disclosures about derivative and hedging activities. SFAS No. 161 is effective December 1, 2008.
Environmental
We believe environmental issues will not have a material effect on our capital expenditures, future results of operations or financial position.
Inflation
The effects of inflation on our operations were not significant during the periods presented in the consolidated financial statements.
Critical Accounting Policies
The discussion and analysis of our financial condition and results of operations are based upon our consolidated financial statements, which have been prepared in accordance with accounting principles generally accepted in the United States.U.S. GAAP. The preparation of these consolidated financial statements requires us to make estimates and assumptions that affect the reported amounts of assets and liabilities and the disclosure of contingent assets and liabilities at the date of the consolidated financial statements and the reported amounts of revenues and expenses during the reporting periods. We continually evaluate our estimates, including those related to our valuation of receivables, inventories, intangible assets, accrued liabilities, income and other tax accruals and contingencies and litigation. We base our estimates on historical experience and various other assumptions that we believe to be reasonable under the circumstances. These results form the basis for making judgments about the carrying values of assets and liabilities that are not readily apparent from other sources. Critical accounting policies are defined as those that reflect our significant judgments and uncertainties that could potentially result in materially different results under different assumptions and conditions. Although actual results historically have not deviated significantly from those determined using our estimates, as discussed below, our financial position or results of operations could be materially different if we were to report under different conditions or to use different assumptions in the application of such policies. We believe the following accounting policies are the most critical to us, sinceas these are the primary areas where financial information is subject to our estimates, assumptions and judgment in the preparation of our consolidated financial statements.
Revenue Recognition: We recognize revenue upon transfer of title and risk of loss provided evidence of an arrangement exists, pricing is fixed and determinable and the ability to collect is probable. In circumstances where the collection of payment is highly questionable at the time of shipment, we defer recognition of revenue until payment is collected. We provide an allowance for returns and allowances based on experience and current customer activities. As of May 31, 20082010 and May 31, 2007,2009, we had deferred $9.1$9.3 million and $2.4 million, respectively, of revenue related to pricing disputes. See “Item 8. – Financial Statements and Supplementary Data – Notes to Consolidated Financial Statements – Note G – Contingent Liabilities and Commitments” within this Annual Report on Form 10-K for additional information regarding this item and related litigation during fiscal 2010.
Within our Mid-Rise Construction, Services segment,Military Construction and Commercial Stairs businesses, which represented less than 4.0%5.0% of consolidated net sales for each of the last three fiscal years, revenue is recognized on a percentage-of-completion method.
Receivables: We review our receivables on an ongoing basisIn order to ensure that theyour receivables are properly valued, and collectible. This is accomplished throughwe utilize two contra-receivable accounts: returns and allowances and allowance for doubtful accounts. Returns and allowances are used to record estimates of returns or other allowances resulting from quality, delivery, discounts or other issues affecting the value of receivables. This account is estimated based on historical trends and current market conditions, with the offset to net sales.
The allowance for doubtful accounts is used to record the estimated risk of loss related to the customers’ inability to pay. This allowance is maintained at a level that we consider appropriate based on factors that affect collectability, such as the financial health of the customer, historical trends of charge-offs and recoveries and current economic and market conditions. As we monitor our receivables, we identify customers that may have payment problems, and we adjust the allowance accordingly, with the offset to SG&Aselling, general and administrative expense. Account balances are charged off against the allowance when recovery is considered remote.
We review our receivables on an ongoing basis to ensure that they are properly valued and collectible. Based on this review, we believe our related reserves are sized appropriately. The reserve for doubtful accounts has decreased approximately $6.7 million during fiscal 2010. This reduction was the result of the write-off of previously reserved accounts, as well as reduced risk related to large automotive customers, some of which have emerged from bankruptcy and others whose balances were otherwise settled.
While we believe theseour allowances are adequate, changes in economic conditions, the financial health of customers and bankruptcy settlements could impact our future earnings. If the economic environment and market conditions deteriorate, particularly in the automotive and construction end markets where our exposure is greatest, additional reserves may be required.
Inventory Valuation: Our inventory is valued at the lower of cost or market, with cost determined using a first-in, first-out method. To ensure that inventory is not stated above the current market value requires the significant use of estimates to determine the replacement cost, cost to complete, normal profit margin and ultimate selling price of the inventory. We believe that our inventories are valued appropriately as of May 31, 2010 and May 31, 2009.
Impairment of Long-Lived Assets:Assets: We review the carrying value of our long-lived assets, including intangible assets with finite useful lives, whenever events or changes in circumstances indicate that the carrying value of an asset or a group of assets may not be recoverable. AccountingWhen a potential impairment is indicated, accounting standards require an impairmenta charge to be recognized in the consolidated financial statements if the carrying amount of an asset or group of assets exceeds the undiscounted cash flows generated byfair value of that asset or group of assets. The loss recognized would be the difference between the fair value and the carrying amount of the asset or group of assets.
Annually,Due to continued deterioration in business and market conditions impacting the Steel Packaging operating segment during the second quarter of fiscal 2010, we determined that certain indicators of potential impairment were present for certain long-lived assets. Therefore, those long-lived assets were tested for impairment during the fiscal quarter ended November 30, 2009. Recoverability of the identified asset groups was tested using future cash flow projections based on management’s long range estimates of market conditions. The sum of the undiscounted future cash flows related to the Steel Packaging asset group was less than the net book value for the asset group. Therefore, an impairment loss was recognized in the amount of $2.7 million. The impairment loss was recorded within impairment of long-lived assets in our consolidated statement of earnings, and was based on the excess of the assets’ carrying amounts over their respective fair values at November 30, 2009.
Due to continued deterioration in business and market conditions impacting our Metal Framing operating segment and the then Construction Services operating segment during the first and second quarters of fiscal 2010, we determined that certain indicators of potential impairment were present for long-lived assets. Therefore, long-lived assets, including intangible assets with finite useful lives, were tested for impairment during the fiscal quarters ended August 31, 2009 and November 30, 2009. Recoverability of the identified asset groups was tested using future cash flow projections based on management’s long range estimates of market conditions. Other than as described at “Item 8. – Financial Statements and Supplementary Data – Notes to Consolidated Financial Statements – Note M – Restructuring,” the sum of the undiscounted future cash flows related to each asset group was more than the net book value for each of the asset groups; therefore, no impairment losses were indicated.
Due to continued deterioration in business and market conditions impacting our Metal Framing operating segment and the then Construction Services operating segment during the third quarter of fiscal 2010, we determined that certain indicators of potential impairment were present for long-lived assets. Therefore, long-lived assets, including intangible assets with finite useful lives, were tested for impairment during the fiscal quarter ended February 28, 2010. Recoverability of the identified asset groups was tested using future cash flow projections based on management’s long range estimates of market conditions.
The sum of the undiscounted future cash flows related to the Metal Framing asset group was more than the net book value for the asset group. Therefore, there was no impairment loss at February 28, 2010 in the Metal Framing operating segment, other than that described at “Item 8. – Financial Statements and
Supplementary Data – Notes to Consolidated Financial Statements – Note R – Fair Value” and “Item 8. – Financial Statements and Supplementary Data – Notes to Consolidated Financial Statements – Note M – Restructuring” of this Annual Report on Form 10-K.
The sum of the undiscounted future cash flows related to an identified asset group within the previously reported Construction Services operating segment was less than the net book value for the asset group. Therefore, an impairment loss was recognized during the fiscal quarter ended February 28, 2010 in the amount of $8.1 million. The impairment loss was recorded within impairment of long-lived assets in our consolidated statements of earnings, and was based on the excess of the assets’ carrying amounts over their respective fair values at February 28, 2010. The impaired assets consisted largely of customer lists and also included trade name and technology assets.
Due largely to changes in the use of certain assets during the fourth quarter of fiscal 2010, we review goodwilldetermined that indicators of impairment were present. Therefore, long-lived assets were tested for impairment during the fourth quarter of fiscal 2010. Recoverability of the identified asset groups was tested using future cash flow projections based on management’s long range estimates of market conditions. The sum of the presentundiscounted future cash flows related to each asset group was more than the net book value techniquefor each of the asset groups; therefore, no impairment loss was indicated at May 31, 2010, other than that described at “Item 8. – Financial Statements and Supplementary Data – Notes to determineConsolidated Financial Statements – Note R – Fair Value” and “Item 8. – Financial Statements and Supplementary Data – Notes to Consolidated Financial Statements – Note M – Restructuring” of this Annual Report on Form 10-K.
We test our goodwill balances for impairment annually, during the estimated impliedfourth quarter, and more frequently if events or changes in circumstances indicate that goodwill may be impaired. We test goodwill at the operating segment level as we have determined that the characteristics of the components within each operating segment are similar and allow for their aggregation to the operating segment level for testing purposes. The test consists of determining the fair value of goodwill associated with each reporting entity. There are three significant sets of values used to determine the implied fair value: estimated futureoperating segments, using discounted cash flows, capitalization rates and tax rates.comparing the result to the carrying values of the operating segments. If the estimated fair value of an operating segment exceeds its carrying value, there is no impairment. If the carrying amount of the operating segment exceeds its estimated fair value, an impairment of the goodwill is indicated. The amount of the impairment would be determined by establishing the fair value of all assets and liabilities of the operating segment, excluding the goodwill, and comparing the total to the estimated future discountedfair value of the operating segment. The difference would represent the fair value of the goodwill; and, if it is lower than the book value of the goodwill, the difference would be recorded as a loss in the consolidated statements of earnings.
Due to industry changes, weakness in the construction market and the depressed results in the Metal Framing operating segment over the fiscal 2009 year, we tested this operating segment for impairment on a quarterly basis during fiscal 2009. During the fiscal quarter ended November 30, 2008, we again tested the value of the goodwill balances in the Metal Framing operating segment. Given the significant decline in the economy during fiscal 2009 and its impact on the construction market, we revised the forecasted cash flows and discount rate assumptions used in our previous valuations of this operating segment. The forecasted cash flows were revised downward due to the model are based on planned growth with an assumed perpetual growth rate.significant decline in, and the future uncertainty of, the economy. The capitalizationdiscount rate, is based on our then current cost of debt and equity capital. Tax rates are maintainedcapital, was changed due to the increased risk in our forecast. After reviewing the revised valuation and the fair value estimates of the remaining assets, it was determined that the value of the business no longer supported its $96.9 million goodwill balance. As a result, the full amount was written-off in the fiscal quarter ended November 30, 2008.
The results of the previously reported Construction Services operating segment continued to deteriorate as the anticipated economic recovery in the commercial construction industry was pushed further into the future. As a result, management determined that impairment indicators existed and the assets (long-lived assets as well as goodwill) of the then Construction Services operating segment were reviewed for potential
impairment on a quarterly basis during fiscal 2010. These tests were performed in earlier periods with no impairment resulting. However, each successive test yielded a result closer to the point at current levels.which an impairment would be indicated. During the fiscal quarter ended February 28, 2010, we again tested the value of the goodwill balances in the then Construction Services operating segment. Based upon the continued depression of the industry and the future uncertainty of the market, we revised the forecasted cash flows used in our previous valuations of this operating segment downward. After reviewing the revised valuation and the fair value estimates of the remaining net assets, it was determined that the value of the business no longer supported its $24.7 million goodwill balance. As a result, the full amount was written-off in the third fiscal quarter ended February 28, 2010. The impairment loss was recorded within impairment of long-lived assets in our consolidated statements of earnings. Management continues to assess these businesses, as well as market and industry factors impacting the businesses, in order to determine the appropriate course of action going forward.
During the fourth quarter of fiscal 2010, at which point only the Pressure Cylinders operating segment had remaining non-impaired goodwill recorded, the Company completed its annual test of goodwill. No additional impairments were identified during the Company’s annual assessment of goodwill, as the estimated fair value of the Pressure Cylinders operating segment exceeded its carrying value by a substantial amount. However, future declines in the market and deterioration in earnings could lead to additional impairment of goodwill and other long-lived assets.
Accounting for Derivatives and Other Contracts at Fair Value:We use derivatives in the normal course of business to manage our exposure to fluctuations in commodity prices, foreign currency and interest rates. These derivatives are based on quoted market values. These estimatesFair values for these contracts are based upon valuation methodologies deemed appropriate in the circumstances; however, the use of different assumptions could affect the estimated fair values.
Stock-Based Compensation: Effective June 1, 2006, we adopted SFAS No. 123 (revised 2004),Share-Based Payment(“SFAS 123(R)”). SFAS 123(R) requires allAll share-based paymentsawards to employees, including grants of employee stock options, to beare recorded as expense in the statementconsolidated statements of earnings based on their fair values. For the periods prior to June 1, 2006, we accounted for employee and non-employee stock option plans under the recognition and measurement principles of APB Opinion No. 25,Accounting for Stock Issued to Employees, and the related interpretations.No stock-based employee compensation costs for the prior fiscal periods were reflected in net earnings, as all options granted under our plans had an exercise price equal to the fair market value of the underlying common shares on the grant date. Had we accounted for stock-based compensation plans using this fair value method, we estimate that diluted earnings per share would have been reduced by $0.03 per share in fiscal 2006.
Income Taxes: In accordance with the provisions of SFAS No. 109,authoritative guidanceAccounting for Income Taxes,, we account for income taxes using the asset and liability method. The asset and liability method requires the recognition of deferred tax assets and liabilities for expected future tax consequences of temporary differences that currently exist between the tax basis and financial reporting basis of our assets and liabilities. In assessing the realizability of deferred tax assets, we consider whether it is more likely than not that some, or
a portion, of the deferred tax assets will not be realized. We provide a valuation allowance for deferred income tax assets when in our judgment, based upon currently available information and other factors, it is more likely than not that a portion of such deferred income tax assets will not be realized. The determination of the need for a valuation allowance is based on an on-going evaluation of current information including, among other things, estimates of future earnings in different tax jurisdictions and the expected timing of deferred income tax asset reversals. We believe that the determination to record a valuation allowance to reduce deferred income tax assets is a critical accounting estimate because it is based on an estimate of future taxable income in the various tax jurisdictions in which we do business, which is susceptible to change and may or may not occur, and because the impact of adjusting a valuation allowance may be material.
In June 2006, the FASB issued FASB Interpretation No. 48,Accounting for Uncertaintyaccordance with accounting literature related to uncertainty in Income Taxes - an interpretation of FASB Statement No. 109income taxes, (“FIN 48”). The interpretation addresses the determination of whether tax benefits claimed, or expected to be claimed, on a tax return should be recorded in the financial statements. Under FIN 48, a tax benefit may be recognized from an uncertain tax position only if it is more likely than notpositions that the tax position will be sustained on examination by the taxing authorities, including resolution of any related appeals or litigation processes, based on the technical merits of the position. The tax benefitsare recognized in the financial statements from such a position should beare measured based on the largest benefit that has a greater than fifty percent likelihood of being realized upon ultimate settlement. FIN 48 also provides guidance on income tax related issues such as derecognition, classification, interest and penalties, accounting treatment in interim periods and increased disclosure requirements.
We have reserves for taxes and associated interest and penalties that are determined in accordance with FIN 48, that may become payable in future years as a result of audits by taxing authorities. It is our policy to record these in income tax expense. While we believe the positions taken on previously filed tax returns are appropriate, we have established the tax and interest reserves in recognition that various taxing authorities may challenge our positions. The tax and interest reserves are analyzed periodically, and adjustments are made as events occur to warrant adjustment to the reserves, such as lapsing of applicable statutes of limitations, conclusion of tax audits, additional exposure based on current calculations, identification of new issues, release of administrative guidance or court decisions affecting a particular tax issue.
Self-Insurance Reserves:We are largely self-insured with respect to workers’ compensation, general and autoautomobile liability, property damage, employee medical claims and other potential losses. In order to reduce risk and better manage our overall loss exposure, we purchase stop-loss insurance that covers individual
claims in excess of the deductible amounts. We maintain reserves for the estimated cost to settle open claims, which includes estimates of legal costs expected to be incurred, as well as an estimate of the cost of claims that have been incurred but not reported. These estimates are based on actuarial valuations that take into consideration the historical average claim volume, the average cost for settled claims, current trends in claim costs, changes in our business and workforce, general economic factors and other assumptions believed to be reasonable under the circumstances. The estimated reserves for these liabilities could be affected if future occurrences and claims differ from assumptions used and historical trends. Facility consolidations, a focus on investment in safety initiatives and an emphasis on property loss prevention and product quality have resulted in an improvement in our loss history and the related assumptions used to analyze many of the property and casualty insurancecurrent self-insurance reserves. This improvement resulted in reductions to these reserves of $5.3 million in fiscal 2008 and $3.6 million in fiscal 2007. We will continue to review these reserves on a quarterly basis, or more frequently if factors dictate a more frequent review is warranted.
The critical accounting policies discussed herein are not intended to be a comprehensive list of all of our accounting policies. In many cases, the accounting treatment of a particular transaction is specifically dictated by accounting principles generally accepted in the United States,U.S. GAAP, with noa lesser need for our judgment in their application. There are also areas in which our judgment in selecting an available alternative would not produce a materially different result.
Item 7A. — Quantitative and Qualitative Disclosures About Market Risk
In the normal course of business, we are exposed to various market risks. We continually monitor these risks and regularly develop appropriate strategies to manage them. Accordingly, from time to time, we may enter into certain derivative financial and commoditycommodity-based derivative instruments. These instruments are used solely to mitigate market exposure and are not used for trading or speculative purposes.
Interest Rate Risk
We entered into an interest rate swap in October 2004, which was amended December 17, 2004. The swap hadhas a notional amount of $100.0 million to hedge changes in cash flows attributable to changes in the LIBOR rate associated with the December 17, 2004, issuance of the unsecured Floating Rate Senior Notes due December 17, 2014. See “Item 8 – Financial Statements and Supplementary Data – Notes to Consolidated Financial Statements – Note C – Debt”Debt and Receivables Securitization” of this Annual Report on Form 10-K. The critical terms of the derivative correspond with the critical terms of the underlying exposure. The interest rate swap was executed with a highly rated financial institution, therefore, noinstitution. No credit loss is anticipated. We pay a fixed rate of 4.46% and receive a variable rate based on the six-month LIBOR. A sensitivity analysis of changes in the interest rate yield curve associated with our interest rate swap indicates that a 10% parallel decline in the yield curve would reducenot materially impact the fair value of our interest rate swap by $2.3 million.swap. A sensitivity analysis of changes in the interest rates on our variable rate debt indicates that a 10% increase in those rates would not have materially impacted our net earnings.results. Based on the terms of the noted derivative contract, such changes would also be expected to materially offset against each other.
We entered into a U.S. Treasury Rate-based treasury lock in April 2010, in anticipation of the issuance of $150.0 million principal amount of our 2020 Notes. See “Item 8. – Financial Statements and Supplementary Data – Notes to Consolidated Financial Statements – Note C – Debt and Receivables Securitization” of this Annual Report on Form 10-K. The treasury lock had a notional amount of $150.0 million to hedge the risk of changes in the semi-annual interest payments attributable to changes in the benchmark interest rate during the several days leading up to the issuance of the 10-year fixed-rate debt. Upon pricing of the 2020 Notes, the derivative was settled and resulted in a loss to the Company of approximately $1.4 million, which has been reflected within other comprehensive income on the consolidated statements of equity. That balance will be recognized in earnings, as an increase to interest expense, over the life of the related 2020 Notes.
Foreign Currency Risk
The translation of foreign currencies into United States dollars subjects the Companyus to exposure related to fluctuating exchange rates. Derivative instruments are not used to manage this risk; however, the Company doeswe do make use of forward contracts to manage exposure to certain inter-companyintercompany loans with our foreign affiliates. Such contracts limit exposure to both favorable and unfavorable currency fluctuations. At May 31, 2008,2010, the difference between the contract and book value of these instruments was not material to the Company’sour consolidated financial position, results of operations or cash flows. A 10% change in the exchange rate to the U.S. dollar forward rate is not expected to materially impact our consolidated financial position, results of operations or cash flows. A sensitivity analysis of changes in the U.S. dollar on these foreign currency-denominated contracts indicates that if the U.S. dollar uniformly weakened by 10% against all of these currency exposures, the fair value of these instruments would decrease by $6.3 million.not be materially impacted. Any resulting changes in fair value would be offset by changes in the underlying hedged balance sheet position. A sensitivity analysis of changes in the currency exchange rates of our foreign locations indicates that a 10% increase in those rates would not have materially impacted our net earnings.results. The sensitivity analysis assumes a uniform shift in all foreign currency exchange rates. The assumption that exchange rates change in uniformity may overstate the impact of changing exchange rates on assets and liabilities denominated in a foreign currency.
Commodity Price Risk
We are exposed to market risk for price fluctuations on purchases of steel, natural gas, zinc (see additional information below regarding natural gas and zinc) and other raw materials and utility requirements. The Company attemptsWe attempt to negotiate the best prices for commodities and to competitively price products and services to reflect the fluctuations in market prices. Derivative financial instruments arehave been used to manage a portion of our exposure to fluctuations in the cost of steel, zinc and natural gas. These contracts covercovered periods commensurate with known or expected exposures through calendar 2008.the fiscal year ending May 31, 2011. The derivative instruments were executed with highly rated financial institutions. No credit loss is anticipated. No derivatives are held for trading purposes. No credit loss is anticipated, as the counterparties to these agreements are major financial institutions that are highly rated.
A sensitivity analysis of changes in the price of hedged commodities indicates that a 10% decline in the market prices of steel, zinc, pricesgas or any combination of these would reducenot have a material impact to the fair value of our hedge position by $0.3 million. A similar 10% decline in natural gas prices would reduce the fair value of the natural gas hedge position by $0.2 million.hedges or our net results.
Fair values for the outstanding derivative positions as of May 31, 2008,2010 and 2007,2009 are summarized below. Fair values of the derivatives do not consider the offsetting underlying hedged item.
| Fair Value At May 31, | Change In Fair Value | ||||||||||
| In millions | 2008 | 2007 | |||||||||
Zinc | $ | 3.1 | $ | 18.9 | $ | (15.8 | ) | ||||
Natural gas | 1.5 | 2.2 | (0.7 | ) | |||||||
Interest rate | (0.3 | ) | 5.8 | (6.1 | ) | ||||||
| $ | 4.3 | $ | 26.9 | $ | (22.6 | ) | |||||
| Fair Value At May 31, | Change In Fair Value | |||||||||||
| (in millions) | 2010 | 2009 | ||||||||||
Interest rate | $ | (10.6 | ) | $ | (7.9 | ) | $ | (2.7 | ) | |||
Foreign currency | (0.2 | ) | 0.4 | (0.6 | ) | |||||||
Commodity | 0.4 | - | 0.4 | |||||||||
| $ | (10.4 | ) | $ | (7.5 | ) | $ | (2.9 | ) | ||||
Safe Harbor
Quantitative and qualitative disclosures about market risk include forward-looking statements with respect to management’s opinion about risks associated with the use of derivative instruments. These statements are based on certain assumptions with respect to market prices and industry supply of, and demand for, steel products and certain raw materials. To the extent these assumptions prove to be inaccurate, future outcomes with respect to hedging programs may differ materially from those discussed in the forward-looking statements.
Item 8. — Financial Statements and Supplementary Data
Report of Independent Registered Public Accounting Firm
The Board of Directors and StockholdersShareholders
Worthington Industries, Inc.:
We have audited the accompanying consolidated balance sheets of Worthington Industries, Inc. and subsidiaries as of May 31, 20082010 and 2007,2009, and the related consolidated statements of earnings, shareholders’ equity, and cash flows for each of the years in the three-year period ended May 31, 2008.2010. In connection with our audits of the consolidated financial statements, we also have audited the financial statementsstatement schedule of valuation and qualifying accounts. These consolidated financial statements and financial statement schedule are the responsibility of the Company’s management. Our responsibility is to express an opinion on these consolidated financial statements and financial statement schedule based on our audits.
We conducted our audits in accordance with the standards of the Public Company Accounting Oversight Board (United States). Those standards require that we plan and perform the audit to obtain reasonable assurance about whether the financial statements are free of material misstatement. An audit includes examining, on a test basis, evidence supporting the amounts and disclosures in the financial statements. An audit also includes assessing the accounting principles used and significant estimates made by management, as well as evaluating the overall financial statement presentation. We believe that our audits provide a reasonable basis for our opinion.
In our opinion, the consolidated financial statements referred to above present fairly, in all material respects, the financial position of Worthington Industries, Inc. and subsidiaries as of May 31, 20082010 and 2007,2009, and the results of their operations and their cash flows for each of the years in the three-year period ended May 31, 2008,2010, in conformity with U.S. generally accepted accounting principles. Also in our opinion, the related financial statement schedule, when considered in relation to the basic consolidated financial statements taken as a whole, presents fairly, in all material respects, the information set forth therein.
As discussed in Note A to the consolidated financial statements, effective June 1, 2006, Worthington Industries, Inc. and subsidiaries adopted the provisions of Statement of Financial Accounting Standards No. 123 (revised 2004),Share-Based Payment.
We also have audited, in accordance with the standards of the Public Company Accounting Oversight Board (United States), Worthington Industries, Inc.’s internal control over financial reporting as of May 31, 2008,2010, based on criteria established inInternal Control – Integrated Framework issued by the Committee of Sponsoring Organizations of the Treadway Commission (COSO), and our report dated July 30, 20082010 expressed an unqualified opinion on the effectiveness of the Company’s internal control over financial reporting.
/s/ KPMG LLP |
Columbus, Ohio
July 30, 20082010
WORTHINGTON INDUSTRIES, INC.
CONSOLIDATED BALANCE SHEETS
(Dollars in thousands)
| May 31, | May 31, | |||||||||||
| 2008 | 2007 | 2010 | 2009 | |||||||||
ASSETS | ||||||||||||
Current assets: | ||||||||||||
Cash and cash equivalents | $ | 73,772 | $ | 38,277 | $ | 59,016 | $ | 56,319 | ||||
Short-term investments | - | 25,562 | ||||||||||
Receivables, less allowances of $4,849 and $3,641 at May 31, 2008 and 2007 | 384,354 | 400,916 | ||||||||||
Receivables, less allowances of $5,752 and $12,470 at May 31, 2010 and 2009 | 301,455 | 182,881 | ||||||||||
Inventories: | ||||||||||||
Raw materials | 350,256 | 261,849 | 177,819 | 141,082 | ||||||||
Work in process | 123,106 | 97,633 | 106,261 | 57,612 | ||||||||
Finished products | 119,599 | 88,382 | 80,251 | 71,878 | ||||||||
Total inventories | 592,961 | 447,864 | 364,331 | 270,572 | ||||||||
Income taxes receivable | 1,443 | 29,749 | ||||||||||
Assets held for sale | 1,132 | 4,600 | 2,637 | 707 | ||||||||
Deferred income taxes | 17,966 | 13,067 | 21,964 | 24,868 | ||||||||
Prepaid expenses and other current assets | 34,785 | 39,097 | 31,439 | 33,839 | ||||||||
Total current assets | 1,104,970 | 969,383 | 782,285 | 598,935 | ||||||||
Investments in unconsolidated affiliates | 119,808 | 57,540 | 113,001 | 100,395 | ||||||||
Goodwill | 183,523 | 179,441 | 79,543 | 101,343 | ||||||||
Other intangible assets, net of accumulated amortization of $17,768 and $15,328 at May 31, 2010 and 2009 | 23,964 | 23,642 | ||||||||||
Other assets | 29,786 | 43,553 | 15,391 | 18,009 | ||||||||
Property, plant and equipment: | ||||||||||||
Land | 34,241 | 33,228 | 31,660 | 30,960 | ||||||||
Buildings and improvements | 249,624 | 241,729 | 242,990 | 242,558 | ||||||||
Machinery and equipment | 901,067 | 875,737 | 898,439 | 879,871 | ||||||||
Construction in progress | 11,758 | 8,268 | 13,725 | 22,783 | ||||||||
Total property, plant and equipment | 1,196,690 | 1,158,962 | 1,186,814 | 1,176,172 | ||||||||
Less accumulated depreciation | 646,746 | 594,697 | 680,651 | 654,667 | ||||||||
Total property, plant and equipment, net | 549,944 | 564,265 | 506,163 | 521,505 | ||||||||
Total assets | $ | 1,988,031 | $ | 1,814,182 | $ | 1,520,347 | $ | 1,363,829 | ||||
LIABILITIES AND SHAREHOLDERS’ EQUITY | ||||||||||||
Current liabilities: | ||||||||||||
Accounts payable | $ | 356,129 | $ | 263,665 | ||||||||
Notes payable | 135,450 | 31,650 | ||||||||||
Accrued compensation, contributions to employee benefit plans and related taxes | 59,619 | 46,237 | ||||||||||
Dividends payable | 13,487 | 14,440 | ||||||||||
Other accrued items | 68,545 | 45,519 | ||||||||||
Income taxes payable | 31,665 | 18,983 | ||||||||||
Total current liabilities | 664,895 | 420,494 | ||||||||||
Other liabilities | 49,785 | 57,383 | ||||||||||
Long-term debt | 245,000 | 245,000 | ||||||||||
Deferred income taxes | 100,811 | 105,983 | ||||||||||
Total liabilities | 1,060,491 | 828,860 | ||||||||||
Contingent liabilities and commitments - Note G | ||||||||||||
Minority interest | 42,163 | 49,321 | ||||||||||
Shareholders’ equity: | ||||||||||||
Preferred shares, without par value; authorized - 1,000,000 shares; issued and outstanding - none | - | - | ||||||||||
Common shares, without par value; authorized - 150,000,000 shares; issued and outstanding, 2008 - 79,308,056 shares, 2007 - 84,908,476 shares | - | - | ||||||||||
Additional paid-in capital | 174,900 | 166,908 | ||||||||||
Cumulative other comprehensive income, net of taxes of $78 and $(6,168) at May 31, 2008 and 2007 | 24,633 | 23,181 | ||||||||||
Retained earnings | 685,844 | 745,912 | ||||||||||
Total shareholders’ equity | 885,377 | 936,001 | ||||||||||
Total liabilities and shareholders’ equity | $ | 1,988,031 | $ | 1,814,182 | ||||||||
See notes to consolidated financial statements.
WORTHINGTON INDUSTRIES, INC.
CONSOLIDATED BALANCE SHEETS
(Dollars in thousands)
| May 31, | |||||||
| 2010 | 2009 | ||||||
LIABILITIES AND EQUITY | |||||||
Current liabilities: | |||||||
Accounts payable | $ | 258,730 | $ | 136,215 | |||
Notes payable | - | 980 | |||||
Accrued compensation, contributions to employee benefit plans and related taxes | 62,413 | 34,503 | |||||
Dividends payable | 7,932 | 7,916 | |||||
Other accrued items | 41,635 | 49,488 | |||||
Income taxes payable | 9,092 | 4,965 | |||||
Current maturities of long-term debt | - | 138,013 | |||||
Total current liabilities | 379,802 | 372,080 | |||||
Other liabilities | 68,380 | 65,400 | |||||
Long-term debt | 250,238 | 100,400 | |||||
Deferred income taxes | 71,893 | 82,986 | |||||
Total liabilities | 770,313 | 620,866 | |||||
Shareholders’ equity – controlling interest: | |||||||
Preferred shares, without par value; authorized – 1,000,000 shares; issued and outstanding – none | - | - | |||||
Common shares, without par value; authorized – 150,000,000 shares; issued and outstanding, 2010 – 79,217,421 shares, 2009 – 78,997,617 shares | - | - | |||||
Additional paid-in capital | 189,918 | 183,051 | |||||
Accumulated other comprehensive income (loss), net of taxes of $5,653 and $3,251 at May 31, 2010 and 2009 | (10,631 | ) | 4,457 | ||||
Retained earnings | 532,126 | 518,561 | |||||
Total shareholders’ equity – controlling interest | 711,413 | 706,069 | |||||
Noncontrolling interest | 38,621 | 36,894 | |||||
Total equity | 750,034 | 742,963 | |||||
Total liabilities and equity | $ | 1,520,347 | $ | 1,363,829 | |||
See notes to consolidated financial statements.
WORTHINGTON INDUSTRIES, INC.
CONSOLIDATED STATEMENTS OF EARNINGS
(In thousands, except per share)
| Fiscal Years Ended May 31, | ||||||||||||
| 2008 | 2007 | 2006 | ||||||||||
Net sales | $ | 3,067,161 | $ | 2,971,808 | $ | 2,897,179 | ||||||
Cost of goods sold | 2,711,414 | 2,610,176 | 2,525,545 | |||||||||
Gross margin | 355,747 | 361,632 | 371,634 | |||||||||
Selling, general and administrative expense | 231,602 | 232,487 | 214,030 | |||||||||
Restructuring charges | 18,111 | - | - | |||||||||
Operating income | 106,034 | 129,145 | 157,604 | |||||||||
Other income (expense): | ||||||||||||
Miscellaneous expense | (6,348 | ) | (4,446 | ) | (1,524 | ) | ||||||
Gain on sale of Acerex | - | - | 26,609 | |||||||||
Interest expense | (21,452 | ) | (21,895 | ) | (26,279 | ) | ||||||
Equity in net income of unconsolidated affiliates | 67,459 | 63,213 | 56,339 | |||||||||
Earnings before income taxes | 145,693 | 166,017 | 212,749 | |||||||||
Income tax expense | 38,616 | 52,112 | 66,759 | |||||||||
Net earnings | $ | 107,077 | $ | 113,905 | $ | 145,990 | ||||||
Average common shares outstanding - basic | 81,232 | 86,351 | 88,288 | |||||||||
Earnings per share - basic | $ | 1.32 | $ | 1.32 | $ | 1.65 | ||||||
Average common shares outstanding - diluted | 81,898 | 87,002 | 88,976 | |||||||||
Earnings per share - diluted | $ | 1.31 | $ | 1.31 | $ | 1.64 | ||||||
| Fiscal Years Ended May 31, | ||||||||||||
| 2010 | 2009 | 2008 | ||||||||||
Net sales | $ | 1,943,034 | $ | 2,631,267 | $ | 3,067,161 | ||||||
Cost of goods sold | 1,663,104 | 2,456,533 | 2,711,414 | |||||||||
Gross margin | 279,930 | 174,734 | 355,747 | |||||||||
Selling, general and administrative expense | 218,315 | 210,046 | 231,602 | |||||||||
Impairment of long-lived assets | 35,409 | 96,943 | - | |||||||||
Restructuring and other expense | 4,243 | 43,041 | 18,111 | |||||||||
Operating income (loss) | 21,963 | (175,296 | ) | 106,034 | ||||||||
Other income (expense): | ||||||||||||
Miscellaneous income (expense) | 1,127 | (2,329 | ) | 620 | ||||||||
Gain on sale of investment in Aegis | - | 8,331 | - | |||||||||
Interest expense | (9,534 | ) | (20,734 | ) | (21,452 | ) | ||||||
Equity in net income of unconsolidated affiliates | 64,601 | 48,589 | 67,459 | |||||||||
Earnings (loss) before income taxes | 78,157 | (141,439 | ) | 152,661 | ||||||||
Income tax expense (benefit) | 26,650 | (37,754 | ) | 38,616 | ||||||||
Net earnings (loss) | 51,507 | (103,685 | ) | 114,045 | ||||||||
Net earnings attributable to noncontrolling interest | 6,266 | 4,529 | 6,968 | |||||||||
Net earnings (loss) attributable to controlling interest | $ | 45,241 | $ | (108,214 | ) | $ | 107,077 | |||||
Basic | ||||||||||||
Average common shares outstanding | 79,127 | 78,903 | 81,232 | |||||||||
Earnings (loss) per share attributable to controlling interest | $ | 0.57 | $ | (1.37 | ) | $ | 1.32 | |||||
Diluted | ||||||||||||
Average common shares outstanding | 79,143 | 78,903 | 81,898 | |||||||||
Earnings (loss) per share attributable to controlling interest | $ | 0.57 | $ | (1.37 | ) | $ | 1.31 | |||||
See notes to consolidated financial statements.
WORTHINGTON INDUSTRIES, INC.
CONSOLIDATED STATEMENTS OF SHAREHOLDERS' EQUITY
(Dollars in thousands, except per share)
| Additional Paid-in Capital | Cumulative Other Comprehensive Income (Loss), Net of Tax | Retained Earnings | Total | Controlling Interest | ||||||||||||||||||||||||||||||||||||||||||||||||
| Common Shares | Common Shares | Additional Paid-in Capital | Accumulated Other Comprehensive Income (Loss), Net of Tax | Retained Earnings | Total | Noncontrolling Interest | Total | |||||||||||||||||||||||||||||||||||||||||||||
| Shares | Amount | Shares | Amount | |||||||||||||||||||||||||||||||||||||||||||||||||
Balance at June 1, 2005 | 87,933,202 | $ | - | $ | 149,167 | $ | (1,313 | ) | $ | 672,982 | $ | 820,836 | ||||||||||||||||||||||||||||||||||||||||
Comprehensive income: | ||||||||||||||||||||||||||||||||||||||||||||||||||||
Net earnings | - | - | - | - | 145,990 | 145,990 | ||||||||||||||||||||||||||||||||||||||||||||||
Unrealized gain on investment | - | - | - | 139 | - | 139 | ||||||||||||||||||||||||||||||||||||||||||||||
Foreign currency translation | - | - | - | 8,711 | - | 8,711 | ||||||||||||||||||||||||||||||||||||||||||||||
Minimum pension liability | - | - | - | 2,473 | - | 2,473 | ||||||||||||||||||||||||||||||||||||||||||||||
Cash flow hedges | - | - | - | 17,106 | - | 17,106 | ||||||||||||||||||||||||||||||||||||||||||||||
Total comprehensive income | 174,419 | |||||||||||||||||||||||||||||||||||||||||||||||||||
Common shares issued | 758,002 | - | 10,161 | - | - | 10,161 | ||||||||||||||||||||||||||||||||||||||||||||||
Cash dividends declared ($0.68 per share) | - | - | - | - | (60,110 | ) | (60,110 | ) | ||||||||||||||||||||||||||||||||||||||||||||
Balance at May 31, 2006 | 88,691,204 | - | 159,328 | 27,116 | 758,862 | 945,306 | ||||||||||||||||||||||||||||||||||||||||||||||
Comprehensive income: | ||||||||||||||||||||||||||||||||||||||||||||||||||||
Net earnings | - | - | - | - | 113,905 | 113,905 | ||||||||||||||||||||||||||||||||||||||||||||||
Unrealized loss on investment | - | - | - | (296 | ) | - | (296 | ) | ||||||||||||||||||||||||||||||||||||||||||||
Foreign currency translation | - | - | - | 4,507 | - | 4,507 | ||||||||||||||||||||||||||||||||||||||||||||||
Minimum pension liability | - | - | - | 34 | - | 34 | ||||||||||||||||||||||||||||||||||||||||||||||
Cash flow hedges | - | - | - | (7,586 | ) | - | (7,586 | ) | ||||||||||||||||||||||||||||||||||||||||||||
Total comprehensive income | 110,564 | |||||||||||||||||||||||||||||||||||||||||||||||||||
Adjustment to initially apply FASB 158 | - | - | - | (594 | ) | - | (594 | ) | ||||||||||||||||||||||||||||||||||||||||||||
Common shares issued | 666,272 | - | 12,242 | - | - | 12,242 | ||||||||||||||||||||||||||||||||||||||||||||||
Stock-based compensation | - | - | 3,480 | - | - | 3,480 | ||||||||||||||||||||||||||||||||||||||||||||||
Purchases and retirement of common shares | (4,449,000 | ) | - | (8,142 | ) | - | (68,475 | ) | (76,617 | ) | ||||||||||||||||||||||||||||||||||||||||||
Cash dividends declared ($0.68 per share) | - | - | - | - | (58,380 | ) | (58,380 | ) | ||||||||||||||||||||||||||||||||||||||||||||
Balance at May 31, 2007 | 84,908,476 | - | 166,908 | 23,181 | 745,912 | 936,001 | ||||||||||||||||||||||||||||||||||||||||||||||
Comprehensive income: | ||||||||||||||||||||||||||||||||||||||||||||||||||||
Balance at June 1, 2007 | 84,908,476 | $ | - | $ | 166,908 | 23,181 | $ | 745,912 | $ | 936,001 | $ | 49,321 | $ | 985,322 | ||||||||||||||||||||||||||||||||||||||
Comprehensive income (loss): | ||||||||||||||||||||||||||||||||||||||||||||||||||||
Net earnings | - | - | - | - | 107,077 | 107,077 | - | - | - | - | 107,077 | 107,077 | 6,968 | 114,045 | ||||||||||||||||||||||||||||||||||||||
Foreign currency translation | - | - | - | 13,080 | - | 13,080 | - | - | - | 13,080 | - | 13,080 | 1,773 | 14,853 | ||||||||||||||||||||||||||||||||||||||
Minimum pension liability | - | - | - | 590 | - | 590 | ||||||||||||||||||||||||||||||||||||||||||||||
Cash flow hedges | - | - | - | (12,218 | ) | - | (12,218 | ) | ||||||||||||||||||||||||||||||||||||||||||||
Pension liability adjustment, net of tax of $(44) | - | - | - | 590 | - | 590 | - | 590 | ||||||||||||||||||||||||||||||||||||||||||||
Cash flow hedges, net of tax of $6,290 | - | - | - | (12,218 | ) | - | (12,218 | ) | (3,995 | ) | (16,213 | ) | ||||||||||||||||||||||||||||||||||||||||
Total comprehensive income | 108,529 | 108,529 | 4,746 | 113,275 | ||||||||||||||||||||||||||||||||||||||||||||||||
Common shares issued | 851,080 | - | 15,318 | - | - | 15,318 | 851,080 | - | 15,318 | - | - | 15,318 | - | 15,318 | ||||||||||||||||||||||||||||||||||||||
Stock-based compensation | - | - | 4,010 | - | - | 4,010 | - | - | 4,010 | - | - | 4,010 | - | 4,010 | ||||||||||||||||||||||||||||||||||||||
Gain from TWB dilution | - | - | 1,944 | - | - | 1,944 | ||||||||||||||||||||||||||||||||||||||||||||||
Gain from TWB Company, L.L.C. dilution | - | - | 1,944 | - | - | 1,944 | - | 1,944 | ||||||||||||||||||||||||||||||||||||||||||||
Purchases and retirement of common shares | (6,451,500 | ) | - | (13,280 | ) | - | (112,505 | ) | (125,785 | ) | (6,451,500 | ) | - | (13,280 | ) | - | (112,505 | ) | (125,785 | ) | - | (125,785 | ) | |||||||||||||||||||||||||||||
Dividends paid to noncontrolling interest | - | - | - | - | - | - | (11,904 | ) | (11,904 | ) | ||||||||||||||||||||||||||||||||||||||||||
Cash dividends declared ($0.68 per share) | - | - | - | - | (54,640 | ) | (54,640 | ) | - | - | - | - | (54,640 | ) | (54,640 | ) | - | (54,640 | ) | |||||||||||||||||||||||||||||||||
Balance at May 31, 2008 | 79,308,056 | $ | - | $ | 174,900 | $ | 24,633 | $ | 685,844 | $ | 885,377 | 79,308,056 | - | 174,900 | 24,633 | 685,844 | 885,377 | 42,163 | 927,540 | |||||||||||||||||||||||||||||||||
Comprehensive loss: | ||||||||||||||||||||||||||||||||||||||||||||||||||||
Net earnings (loss) | - | - | - | - | (108,214 | ) | (108,214 | ) | 4,529 | (103,685 | ) | |||||||||||||||||||||||||||||||||||||||||
Foreign currency translation | - | - | - | (9,866 | ) | - | (9,866 | ) | (1,874 | ) | (11,740 | ) | ||||||||||||||||||||||||||||||||||||||||
Pension liability adjustment, net of tax of $14 | - | - | - | (4,766 | ) | - | (4,766 | ) | - | (4,766 | ) | |||||||||||||||||||||||||||||||||||||||||
Cash flow hedges, net of tax of $3,187 | - | - | - | (5,544 | ) | - | (5,544 | ) | (772 | ) | (6,316 | ) | ||||||||||||||||||||||||||||||||||||||||
Total comprehensive income (loss) | (128,390 | ) | 1,883 | (126,507 | ) | |||||||||||||||||||||||||||||||||||||||||||||||
Common shares issued | 339,561 | - | 3,875 | - | - | 3,875 | - | 3,875 | ||||||||||||||||||||||||||||||||||||||||||||
Stock-based compensation | - | - | 5,767 | - | - | 5,767 | - | 5,767 | ||||||||||||||||||||||||||||||||||||||||||||
Purchases and retirement of common shares | (650,000 | ) | - | (1,448 | ) | - | (10,954 | ) | (12,402 | ) | - | (12,402 | ) | |||||||||||||||||||||||||||||||||||||||
Dividends paid to noncontrolling interest | - | - | - | - | - | - | (7,152 | ) | (7,152 | ) | ||||||||||||||||||||||||||||||||||||||||||
Cash dividends declared ($0.61 per share) | - | - | - | (48,115 | ) | (48,115 | ) | - | (48,115 | ) | ||||||||||||||||||||||||||||||||||||||||||
Other | - | - | (43 | ) | - | - | (43 | ) | - | (43 | ) | |||||||||||||||||||||||||||||||||||||||||
Balance at May 31, 2009 | 78,997,617 | - | 183,051 | 4,457 | 518,561 | 706,069 | 36,894 | 742,963 | ||||||||||||||||||||||||||||||||||||||||||||
Comprehensive income (loss): | ||||||||||||||||||||||||||||||||||||||||||||||||||||
Net earnings | - | - | - | - | 45,241 | 45,241 | 6,266 | 51,507 | ||||||||||||||||||||||||||||||||||||||||||||
Unrealized gain on investment | - | - | - | 5 | - | 5 | - | 5 | ||||||||||||||||||||||||||||||||||||||||||||
Foreign currency translation | - | - | - | (13,739 | ) | - | (13,739 | ) | - | (13,739 | ) | |||||||||||||||||||||||||||||||||||||||||
Pension liability adjustment, net of tax of $1,163 | - | - | - | 317 | - | 317 | - | 317 | ||||||||||||||||||||||||||||||||||||||||||||
Cash flow hedges, net of tax of $854 | - | - | - | (1,671 | ) | - | (1,671 | ) | - | (1,671 | ) | |||||||||||||||||||||||||||||||||||||||||
Total comprehensive income | 30,153 | 6,266 | 36,419 | |||||||||||||||||||||||||||||||||||||||||||||||||
Common shares issued | 219,804 | - | 2,291 | - | - | 2,291 | - | 2,291 | ||||||||||||||||||||||||||||||||||||||||||||
Stock-based compensation | - | - | 4,576 | - | - | 4,576 | - | 4,576 | ||||||||||||||||||||||||||||||||||||||||||||
Dividends paid to noncontrolling interest | - | - | - | - | - | - | (4,539 | ) | (4,539 | ) | ||||||||||||||||||||||||||||||||||||||||||
Cash dividends declared ($0.40 per share) | - | - | - | - | (31,676 | ) | (31,676 | ) | - | (31,676 | ) | |||||||||||||||||||||||||||||||||||||||||
Balance at May 31, 2010 | 79,217,421 | $ | - | $ | 189,918 | $ | (10,631 | ) | $ | 532,126 | $ | 711,413 | $ | 38,621 | $ | 750,034 | ||||||||||||||||||||||||||||||||||||
See notes to consolidated financial statements.
WORTHINGTON INDUSTRIES, INC.
CONSOLIDATED STATEMENTS OF CASH FLOWS
(Dollars in thousands)
| Fiscal Years Ended May 31, | Fiscal Years Ended May 31, | |||||||||||||||||||||||
| 2008 | 2007 | 2006 | 2010 | 2009 | 2008 | |||||||||||||||||||
Operating activities: | ||||||||||||||||||||||||
Net earnings | $ | 107,077 | $ | 113,905 | $ | 145,990 | ||||||||||||||||||
Adjustments to reconcile net earnings to net cash provided by operating activities: | ||||||||||||||||||||||||
Net earnings (loss) attributable to controlling interest | $ | 45,241 | $ | (108,214 | ) | $ | 107,077 | |||||||||||||||||
Adjustments to reconcile net earnings (loss) attributable to controlling interest to net cash provided by operating activities: | ||||||||||||||||||||||||
Depreciation and amortization | 63,413 | 61,469 | 59,116 | 64,653 | 64,073 | 63,413 | ||||||||||||||||||
Restructuring charges, non-cash | 5,169 | - | - | |||||||||||||||||||||
Impairment of long-lived assets | 35,409 | 96,943 | - | |||||||||||||||||||||
Restructuring and other expense, non-cash | 3,408 | 8,925 | 5,169 | |||||||||||||||||||||
Provision for deferred income taxes | (3,228 | ) | (3,068 | ) | (12,645 | ) | (6,110 | ) | (25,479 | ) | (3,228 | ) | ||||||||||||
Bad debt expense | (900 | ) | 8,307 | 1,398 | ||||||||||||||||||||
Equity in net income of unconsolidated affiliates, net of distributions | (8,539 | ) | 68,510 | 702 | (12,007 | ) | 8,491 | (8,539 | ) | |||||||||||||||
Minority interest in net income of consolidated subsidiaries | 6,969 | 5,409 | 6,088 | |||||||||||||||||||||
Net loss on sale of assets | 3,756 | 826 | 6,079 | |||||||||||||||||||||
Gain on sale of Acerex | - | - | (26,609 | ) | ||||||||||||||||||||
Net earnings attributable to noncontrolling interest | 6,266 | 4,529 | 6,969 | |||||||||||||||||||||
Net (gain) loss on sale of assets | (3,908 | ) | 1,317 | 3,756 | ||||||||||||||||||||
Stock-based compensation | 4,173 | 3,480 | - | 4,570 | 5,767 | 4,173 | ||||||||||||||||||
Excess tax benefits—stock-based compensation | (2,035 | ) | (2,370 | ) | - | |||||||||||||||||||
Excess tax benefits – stock-based compensation | (165 | ) | (433 | ) | (2,035 | ) | ||||||||||||||||||
Gain on acquisitions and sales of subsidiary investments | (891 | ) | (8,331 | ) | - | |||||||||||||||||||
Changes in assets and liabilities: | ||||||||||||||||||||||||
Receivables | 6,967 | 8,312 | 11,616 | (114,892 | ) | 226,690 | 5,569 | |||||||||||||||||
Inventories | (144,474 | ) | 19,588 | (33,788 | ) | (64,499 | ) | 329,892 | (144,474 | ) | ||||||||||||||
Prepaid expenses and other current assets | 8,252 | (2,078 | ) | (9,186 | ) | 30,425 | (20,805 | ) | 8,252 | |||||||||||||||
Other assets | (1,546 | ) | 4,898 | (563 | ) | 205 | (643 | ) | (1,546 | ) | ||||||||||||||
Accounts payable and accrued expenses | 138,822 | (99,283 | ) | 79,114 | 125,613 | (321,798 | ) | 138,822 | ||||||||||||||||
Other liabilities | (4,255 | ) | 833 | 1,152 | (1,999 | ) | (14,905 | ) | (4,255 | ) | ||||||||||||||
Net cash provided by operating activities | 180,521 | 180,431 | 227,066 | 110,419 | 254,326 | 180,521 | ||||||||||||||||||
Investing activities: | ||||||||||||||||||||||||
Investment in property, plant and equipment, net | (47,520 | ) | (57,691 | ) | (60,128 | ) | (34,319 | ) | (64,154 | ) | (47,520 | ) | ||||||||||||
Investment in aircraft | - | - | (16,435 | ) | ||||||||||||||||||||
Acquisitions, net of cash acquired | (2,225 | ) | (31,727 | ) | (6,776 | ) | (63,098 | ) | (42,199 | ) | (2,225 | ) | ||||||||||||
Investment in unconsolidated affiliates | (47,598 | ) | (1,000 | ) | - | |||||||||||||||||||
Distributions from (investments in) unconsolidated affiliates, net | (483 | ) | 20,362 | (47,598 | ) | |||||||||||||||||||
Proceeds from sale of assets | 1,025 | 18,237 | 3,225 | 15,950 | 6,883 | 1,025 | ||||||||||||||||||
Proceeds from sale of Acerex | - | - | 44,604 | |||||||||||||||||||||
Purchases of short-term investments | - | (25,562 | ) | (493,860 | ) | |||||||||||||||||||
Proceeds from sale of investments in unconsolidated affiliates | - | 25,863 | - | |||||||||||||||||||||
Sales of short-term investments | 25,562 | 2,173 | 491,687 | - | - | 25,562 | ||||||||||||||||||
Net cash used by investing activities | (70,756 | ) | (95,570 | ) | (37,683 | ) | (81,950 | ) | (53,245 | ) | (70,756 | ) | ||||||||||||
Financing activities: | ||||||||||||||||||||||||
Net proceeds from short-term borrowings | 103,800 | 31,650 | 7,684 | |||||||||||||||||||||
Net proceeds from (payments on) short-term borrowings | (980 | ) | (142,385 | ) | 103,800 | |||||||||||||||||||
Proceeds from long-term debt, net | 146,942 | - | - | |||||||||||||||||||||
Principal payments on long-term debt | - | (7,691 | ) | (143,416 | ) | (138,013 | ) | (7,241 | ) | - | ||||||||||||||
Proceeds from issuance of common shares | 13,171 | 9,866 | 9,138 | 2,313 | 3,899 | 13,171 | ||||||||||||||||||
Excess tax benefits—stock-based compensation | 2,035 | 2,370 | - | |||||||||||||||||||||
Excess tax benefits – stock-based compensation | 165 | 433 | 2,035 | |||||||||||||||||||||
Payments to minority interest | (11,904 | ) | (3,360 | ) | (3,840 | ) | (4,539 | ) | (7,152 | ) | (11,904 | ) | ||||||||||||
Repurchase of common shares | (125,785 | ) | (76,617 | ) | - | - | (12,402 | ) | (125,785 | ) | ||||||||||||||
Dividends paid | (55,587 | ) | (59,018 | ) | (59,982 | ) | (31,660 | ) | (53,686 | ) | (55,587 | ) | ||||||||||||
Net cash used by financing activities | (74,270 | ) | (102,800 | ) | (190,416 | ) | (25,772 | ) | (218,534 | ) | (74,270 | ) | ||||||||||||
Increase (decrease) in cash and cash equivalents | 35,495 | (17,939 | ) | (1,033 | ) | 2,697 | (17,453 | ) | 35,495 | |||||||||||||||
Cash and cash equivalents at beginning of year | 38,277 | 56,216 | 57,249 | 56,319 | 73,772 | 38,277 | ||||||||||||||||||
Cash and cash equivalents at end of year | $ | 73,772 | $ | 38,277 | $ | 56,216 | $ | 59,016 | $ | 56,319 | $ | 73,772 | ||||||||||||
See notes to consolidated financial statements.
WORTHINGTON INDUSTRIES, INC.
NOTES TO CONSOLIDATED FINANCIAL STATEMENTS
Fiscal Years Ended May 31, 2008, 20072010, 2009 and 20062008
Note A – Summary of Significant Accounting Policies
Consolidation: The consolidated financial statements include the accounts of Worthington Industries, Inc. and consolidated subsidiaries (collectively, “we,” “our,” “Worthington,” or the “Company”). Spartan Steel Coating, LLC (owned 52%) is fully consolidated with the equity owned by the other joint venture member shown as minority interest on the consolidated balance sheets, and its portion of net earnings eliminated in miscellaneous expense. Investments in unconsolidated affiliates are accounted for using the equity method. Significant intercompany accounts and transactions are eliminated. Certain prior year amounts have been reclassified to conform to current year presentation.
Spartan Steel Coating, LLC (“Spartan”), in which the Company owns a 52% controlling interest, is fully consolidated with the equity owned by the other joint venture member shown as noncontrolling interest on the consolidated balance sheets, and the other joint venture member’s portion of net earnings included as net earnings attributable to noncontrolling interest in the consolidated statements of earnings. Effective June 1, 2009, we adopted new accounting guidance concerning the treatment of noncontrolling interests in consolidated financial statements. The new guidance changed the accounting and reporting for minority interests, which have been recharacterized as noncontrolling interests, as discussed above. Prior period financial statements and disclosures relating to previously reported minority interests have been restated in accordance with the new guidance. All other requirements of the new guidance have been applied prospectively.
Use of Estimates: The preparation of financial statements in conformity with accounting principles generally accepted in the United States (“U.S. GAAP”) requires management to make estimates and assumptions that affect the amounts reported in the financial statements and accompanying notes. Actual results could differ from those estimates.
Cash and Cash Equivalents: We consider all highly liquid investments purchased with an original maturity of three months or less to be cash equivalents.
Short-term Investments: At May, 31, 2007, we held $25,562,000 in short-term investments consisting of money market mutual funds which were classified as available-for-sale securities. Unrealized holding gains (losses) were immaterial. These investments were sold during fiscal 2008.
Inventories: Inventories are valued at the lower of cost or market. Cost is determined using the first-in, first-out method for all inventories. We believe that inventories are valued appropriately as of May 31, 2010 and May 31, 2009.
Derivative Financial Instruments: We do not engage in currency or commodity speculation and generally enter into derivativesderivative instruments only to hedge specific interest, foreign currency or commodity transactions. All derivativesderivative instruments are accounted for using mark-to-market accounting. The accounting for changes in the fair value of a derivative instrument depends on whether it has been designated and qualifies as part of a hedging relationship and, if so, the reason for holding it. Gains orand losses from these transactions offseton fair value hedges are recognized in current period earnings in the same line item as the underlying hedged item. The effective portion of gains orand losses on cash flow hedges are deferred as a component of accumulated other comprehensive income (loss) (“AOCI”) and are recognized in earnings at the assets, liabilities or transactions being hedged. Current assets and other liabilities include derivative fair values at May 31, 2008, of $4,773,000 and $516,000.time the hedged item affects earnings, in the same line item as the underlying hedged item. Ineffectiveness of the hedges during the fiscal year ended May 31, 20082010 (“fiscal 2008”2010”), the fiscal year ended May 31, 20072009 (“fiscal 2007”2009”) and the fiscal year ended May 31, 20062008 (“fiscal 2006”2008”) was immaterialimmaterial. Classification in the consolidated statements of earnings of gains and was reportedlosses related to derivative instruments that do not qualify for hedge accounting is determined based on the underlying intent of the instruments. Cash flows related to derivative instruments are generally classified in other income (expense).the consolidated statements of cash flows within operating activities.
ForIn order for hedging relationships to qualify for hedge accounting under Statement of Accounting Standards (“SFAS”) No. 133 (“SFAS 133”),current accounting guidance, we formally document the hedging relationship and its risk management objective and the hedge strategy, the hedging instrument, the hedgehedged item, the nature of the risk being hedged, how the hedge instrumentinstrument’s effectiveness against offsetting the hedged risk will be assessed prospectively and retrospectively and a description of the method of measuring ineffectiveness.
Derivative instruments are executed only with highly rated financial institutions. No credit loss is anticipated on existing instruments, and no such material losses have been experienced to date. The Company continues to monitor its positions, as well as the credit ratings of counterparties to those positions.
We discontinue hedge accounting when it is determined that the derivative instrument is no longer effective in offsetting cash flows of the hedged item,risk, the derivative instrument expires or is sold, is terminated or is no longer designated as a hedging instrument because it is unlikely that a forecasted transaction will occur or we determine that designation of the hedging instrument is no longer appropriate. In all situations in which hedge accounting is discontinued and the derivative instrument is retained, we continue to carry the derivative instrument at its fair value on the consolidated balance sheetsheets and recognize any subsequent changes in its fair value in net earnings. When it is probable that a forecasted transaction will not occur, we discontinue hedge accounting and recognize immediately in net earnings gains and losses that were accumulated in other comprehensive income.
Interest Rate Risk
We entered into an interest rate swap in October 2004, which was amended December 17, 2004. The swap had a notional amount of $100,000,000Refer to hedge changes in cash flows attributable to changes in“Note S – Derivative Instruments and Hedging Activities” for additional information regarding the LIBOR rate associated withconsolidated balance sheets location and the December 17, 2004, issuancerisk classification of the unsecured Floating Rate Senior Notes due December 17, 2014. See “Note C – Debt.” No credit loss is anticipated as the interest rate swap was executed with a highly rated financial institution. We pay a fixed rate of 4.46% and receive a variable rate based on six-month LIBOR. The interest rateCompany’s derivative is classified as a cash flow hedge per SFAS 133. The effective portion of the change in the fair value of the derivative is recorded in other comprehensive income and is reclassified to interest expense in the period in which earnings are impacted by the hedged items or in the period that the transaction no longer qualifies as a cash flow hedge. A sensitivity analysis of changes in the interest rate yield curve associated with our interest rate swap indicates that a 10% parallel decline in the yield curve would reduce the fair value of our interest rate swap by $2.3 million.
Foreign Currency Risk
The translation of foreign currencies into United States dollars subjects the Company to exposure related to fluctuating exchange rates. Derivative instruments are not used to manage this risk; however, the Company does make use of forward contracts to manage exposure to certain inter-company loans with our foreign affiliates. Such contracts limit exposure to both favorable and unfavorable currency fluctuations. No credit loss is anticipated as the counterparties to these agreements are major financial institutions that are highly rated. At May 31, 2008, the difference between the contract and book value was not material to the Company’s consolidated financial position, results of operations or cash flows. The foreign currency derivatives are classified as fair value derivatives per SFAS 133. The change in the fair value of the derivatives are recorded either in the balance sheet under foreign currency translation or in net earnings in the same period in which foreign currency translation or net earnings are impacted by the hedged items. A 10% change in the exchange rate to the U.S. dollar forward rate is not expected to materially impact our consolidated financial position, results of operations, or cash flows. A sensitivity analysis of changes in the U.S. dollar on these foreign currency-denominated contracts indicates that if the U.S. dollar uniformly weakened by 10% against all of these currency exposures, the fair value of these instruments would decrease by $6,300,000. Any resulting changes in fair value would be offset by changes in the underlying hedged balance sheet position. The sensitivity analysis assumes a uniform shift in all foreign currency exchange rates. The assumption that exchange rates change in uniformity may overstate the impact of changing exchange rates on assets and liabilities denominated in a foreign currency.
Commodity Price Risk
We are exposed to market risk for price fluctuations on purchases of steel, natural gas, zinc and other raw materials and utility requirements. The Company attempts to negotiate the best prices for commodities and to competitively price products and services to reflect the fluctuations in market prices. Derivative financial instruments are used to manage a portion of our exposure to fluctuations in the cost of natural gas and zinc. These contracts cover periods commensurate with known or expected exposures through calendar 2008. No derivatives are held for trading purposes. No credit loss is anticipated as the counterparties to these agreements are major financial institutions that are highly rated. The zinc derivative is classified as a cash flow hedge per SFAS 133. The effective portion of the change in the fair value of the zinc derivative is recorded in other comprehensive income and is reclassified to cost of goods sold in the period in which earnings are impacted by the hedged items or in the period that the transaction no longer qualifies as a cash flow hedge. One natural gas derivative is classified as a cash flow hedge per SFAS 133. The effective portion of the change in the fair value of the derivative is recorded in other comprehensive income and is reclassified to cost of goods sold in the period in which earnings are impacted by the hedged items or in the period that the transaction no longer qualifies as a cash flow hedge. The other natural gas derivative’s change in fair value is recorded in cost of goods sold, as it does not qualify for hedge accounting under SFAS 133. A sensitivity analysis of changes in the price of hedged commodities indicates that a 10% decline in zinc prices would
reduce the fair value of our hedge position by $300,000. A similar 10% decline in natural gas prices would reduce the fair value of the natural gas hedge position by $200,000. Any resulting changes in fair value of the zinc hedge and one natural gas hedge would be recorded as adjustments to other comprehensive income.
Investments in Unconsolidated Affiliates: Securities and Exchange Commission (“SEC”) Staff Accounting Bulletin No. 51, “Accounting for Sales of Stock by a Subsidiary” (“SAB 51”), provides guidance on accounting for the effect of changes in an unconsolidated affiliate's stock or equity on the parent's investment in that unconsolidated affiliate. SAB 51 allows election of an accounting policy of recording such increases or decreases in a parent's investment either in net earnings or in equity. We record such increases or decreases to our equity as additional paid-in capital.
Fair Value of Financial Instruments: The non-derivative financial instruments included in the carrying amounts of cash and cash equivalents, short-term investments, receivables, other assets, accounts and notes payable, accrued expenses and income taxes payable, approximate fair values. The fair value of long-term debt, including current maturities, based upon quoted market prices was $252,073,000 and $249,524,000 at May 31, 2008 and 2007.instruments.
Risks and Uncertainties:Uncertainties: As of May 31, 2008,2010, the Company, includingtogether with our unconsolidated affiliates, operated 6665 production facilities in 2418 states and 11 countries. Our largest markets are the construction and the automotive and automotive supply markets, each of which comprised 40% and 26%,28% of our consolidated net sales in fiscal 2008.2010. Our foreign operations represented 9%6% of consolidated net sales, 35%7% of consolidatedearnings attributable to controlling interest, pre-tax, earnings and 16%28% of consolidated net assets. Approximately 14%13% of the Company'sCompany’s consolidated labor force is represented by collective bargaining agents.agreements. This includes 271608 employees whose labor contracts expire or will otherwise require renegotiation within the next fiscal year.year ending May 31, 2011 (“fiscal 2011”). The concentration of credit risks from financial instruments related to the markets served by the Company is not expected to have a material adverse effect on the Company'sCompany’s consolidated financial position, cash flows or future results of operations.
In fiscal 2010, our largest customer accounted for approximately 6% of our consolidated net sales, and our ten largest customers accounted for approximately 27% of our consolidated net sales. A significant loss of, or decrease in, business from any of these customers could have an adverse effect on our sales and financial results if we cannot obtain replacement business. Also, due to consolidation in the industries we serve, including the construction, automotive and retail industries, our sales may be increasingly sensitive to deterioration in the financial condition of, or other adverse developments with respect to, one or more of our largest customers.
The overall downturn in the economy, the disruption in capital and credit markets, declining real estate values and reduced consumer spending have caused significant reductions in demand from our end markets in general and, in particular, the construction and automotive end markets.
Demand in the commercial and residential construction markets has weakened as it has become more difficult for companies and consumers to obtain credit for construction projects and the economic slowdown has caused delays in or cancellations of construction projects. Our automotive business is largely driven by the production schedules of General Motors, Ford and Chrysler, as well as their suppliers. The domestic auto industry is currently experiencing a very difficult operating environment, which has resulted in and will likely continue to result in lower levels of vehicle production and an associated decrease in demand for products sold to the automotive industry. Many automotive manufacturers and their suppliers are having financial difficulties and have reduced production levels and eliminated manufacturing capacity. Similar difficulties are being experienced in our other end markets and by our customers in those end markets. While the Company has taken actions to mitigate the impact of these conditions, if they persist, they could continue to adversely impact the Company’s consolidated position, cash flows and future results of operations.
Our principal raw material is flat-rolled steel, which we purchase from multiple primary steel producers. The steel industry as a whole has been cyclical, and at times availability and pricing can be volatile due to a number of factors beyond our control. This volatility can significantly affect our steel costs. In an environment of increasing prices for steel and other raw materials, competitive conditions may impact how much of the price increases we can pass on to our customers. To the extent we are unable to pass on future price increases in our raw materials to our customers, our financial results could be adversely affected. Also, if steel prices decrease, in general, competitive conditions may impact how quickly we must reduce our prices to our customers and we could be forced to use higher-priced raw materials to complete orders for which the selling prices have decreased. Declining steel prices could also require the Company to write-down the value of its inventories to reflect current market pricing, as was the case during fiscal 2009. Further, the number of suppliers has decreased in recent years due to industry consolidation and the financial difficulties of certain suppliers, and consolidation may continue. Accordingly, if delivery from a major supplier is disrupted, it may be more difficult to obtain an alternative supply than in the past.
Receivables: We review our receivables on an ongoing basis to ensure that they are properly valued and collectible. This is accomplished through two contra-receivable accounts: returns and allowances and allowance for doubtful accounts. Returns and allowances are used to record estimates of returns or other allowances resulting from quality, delivery, discounts or other issues affecting the value of receivables. This account is estimated based on historical trends and current market conditions, with the offset to net sales.
The allowance for doubtful accounts is used to record the estimated risk of loss related to the customers’ inability to pay. This allowance is maintained at a level that we consider appropriate based on factors that affect collectability, such as the financial health of the customer, historical trends of charge-offs and recoveries and current economic and market conditions. As we monitor our receivables, we identify customers that may have payment problems, and we adjust the allowance accordingly, with the offset to SG&Aselling, general and administrative expense. Account balances are charged off against the allowance when recovery is considered remote.
We review our receivables on an ongoing basis to ensure that they are properly valued and collectible. Based on this review, we believe our related reserves are sized appropriately. The reserve for doubtful accounts has decreased approximately $6,718,000 during fiscal 2010. This reduction was the result of the write-off of previously reserved accounts, as well as reduced risk related to large automotive customers, some of which have emerged from bankruptcy and others whose balances were otherwise settled.
While we believe our allowances are adequate, changes in economic conditions, the financial health of customers and bankruptcy settlements could impact our future earnings. If the economic environment and market conditions deteriorate, particularly in the automotive and construction end markets where our exposure is greatest, additional reserves may be required.
Property and Depreciation: Property, plant and equipment are carried at cost and depreciated using the straight-line method. Buildings and improvements are depreciated over 10 to 40 years and machinery and equipment over 3 to 20 years. Depreciation expense was $60,529,000 for fiscal 2010, $60,178,000 for fiscal 2009, and $61,154,000 for fiscal 2008, $59,478,000 for fiscal 2007, and $56,769,000 for fiscal 2006.2008. Accelerated depreciation methods are used for income tax purposes.
Goodwill and Other Long-Lived Assets: We use the purchase method of accounting for any business combinations initiated after June 30, 2002, and recognize amortizable intangible assets separately from goodwill. The acquired assets and assumed liabilities in an acquisition are measured and recognized based on their estimated fair values at the date of acquisition, with goodwill representing the excess of the purchase price over the fair value of the identifiable net assets. A bargain purchase may occur, wherein the fair value of identifiable net assets exceeds the purchase price, and a gain is then recognized in the amount of that excess. Goodwill and indefinite-lived intangible assets are no longer amortized but are reviewed for impairment. The annual impairment test is performed during the fourth quarter of each fiscal year. We have no intangible assets with indefinite lives other than goodwill.
We review the carrying value of our long-lived assets, including intangible assets with finite useful lives, whenever events or changes in circumstances indicate that the carrying value of an asset or a group of assets may not be recoverable. When a potential impairment is indicated, accounting standards require a charge to be recognized in the financial statements if the carrying amount of an asset or group of assets exceeds the fair value of that asset or group of assets. The loss recognized would be the difference between the fair value and the carrying amount of the asset or group of assets.
The Company’s impairment testing for both goodwill and other long-lived assets, including intangible assets with finite useful lives, is largely based on discounted cash flow models that require significant judgment and require assumptions about future volume trends, revenue and expense growth rates; and, in addition, external factors such as changes in economic trends and cost of capital. Significant changes in any of these assumptions could impact the outcomes of the tests performed. See “Note N – Goodwill and Other Long-Lived Assets” for additional details regarding these assets and related impairment testing.
Planned Maintenance Activities: We use the deferral method to account for costs of planned maintenance shutdowns. Under this method, the costs of a qualifying shutdown are capitalized and amortized on a straight-line basis into maintenance expense until the next anticipated shutdown. In no case will the amortization period exceed twelve months.
Leases: Certain lease agreements contain fluctuating or escalating payments and rent holiday periods. The related rent expense is recorded on a straight-line basis over the length of the lease term. Leasehold improvements made by the lessee, whether funded by the lessee or by landlord allowances or incentives are
recorded as leasehold improvement assets and will be amortized over the shorter of the economic life or the lease term. These incentives are also recorded as deferred rent and amortized as reductions in rent expense over the lease term.
Capitalized Interest: We capitalize interest in connection with the construction of qualified assets. Under this policy, we capitalized interest of $184,000 in fiscal 2010, $346,000 in fiscal 2009, and $146,000 in fiscal 2008, $1,757,000 in fiscal 2007 and $638,000 in fiscal 2006.2008.
Stock-Based Compensation: At May 31, 2008,2010, we had stock-based compensation plans for employees and non-employee directors which are described more fully in “Note F – Stock-Based Compensation.” Effective June 1, 2006, we adopted SFAS No. 123 (revised 2004),Share-Based Payment(“SFAS 123(R)”). SFAS 123(R) requires allAll share-based payments,awards, including grants of stock options, to beare recorded as expense in the statementconsolidated statements of earnings based on their fair values. For the periods prior to June 1, 2006, we accounted for employee and non-employee director stock options under the recognition and measurement principles of APB Opinion No. 25,Accounting for Stock Issued to Employees, and the related interpretations.No stock-based compensation costs for the prior fiscal periods were reflected in net earnings, as all stock options granted under our plans had an exercise price equal to the fair market value of the underlying common shares on the grant date.
The following table illustrates the effect on net earnings and earnings per share as if the Company had accounted for the stock option plans under the fair value method of accounting, as required by SFAS 123, for fiscal 2006:
| In thousands, except per share | |||
Net earnings, as reported | $ | 145,990 | |
Deduct: total stock-based employee compensation expense determined under fair value based method, net of tax | 2,381 | ||
Pro forma net earnings | $ | 143,609 | |
Earnings per share: | |||
Basic, as reported | $ | 1.65 | |
Basic, pro forma | 1.63 | ||
Diluted, as reported | 1.64 | ||
Diluted, pro forma | 1.61 | ||
Revenue Recognition: Recognition: We recognize revenue upon transfer of title and risk of loss provided evidence of an arrangement exists, pricing is fixed and determinable and collectabilitythe ability to collect is probable. We provide, through charges to net sales, for returns and allowances based on experience and current customer activities. We also provide, through charges to net sales, for customer rebates and sales discounts based on specific agreements and recent and anticipated levels of customer activity. In circumstances where the collection of payment is highly questionable at the time of shipment, we defer recognition of revenue until payment is collected. We provide an allowance for expected returns based on experience and current customer activities. As of May 31, 20082010 and May 31, 2007,2009, we had deferred $9.1 million and $2.4 million, respectively,$9,304,000 of revenue related to pricing disputes. See “Note G – Contingent Liabilities and Commitments” for additional information regarding this item and related litigation during fiscal 2010.
Within theour Mid-Rise Construction, Services segment,Military Construction and Commercial Stairs businesses, which represented less than 4%5% of consolidated net sales for each of the last three fiscal years, revenue is recognized on a percentage-of-completion method. Taxes collected from customers on revenues are reported on a net basis (excluded from revenues).
Advertising Expense: We expense advertising costs as incurred. Advertising expense was $4,220,000, $4,117,000$3,838,000, $4,813,000, and $3,571,000$4,220,000 for fiscal 2008,2010, fiscal 20072009 and fiscal 2006.2008, respectively.
Shipping and Handling Fees and Costs: Shipping and handling fees billed to customers are included in net sales, and shipping and handling costs incurred are included in cost of goods sold.
Environmental Costs: Environmental costs are capitalized if the costs extend the life of the property, increase its capacity, and/or mitigate or prevent contamination from future operations. Costs related to environmental contamination treatment and clean up are charged to expense.
Statements of Cash Flows: Supplemental cash flow information for the years ended May 31 is as follows:
| In thousands | 2008 | 2007 | 2006 | ||||||
Interest paid, net of amount capitalized | $ | 21,442 | $ | 21,884 | $ | 27,734 | |||
Income taxes paid, net of refunds | 29,641 | 49,600 | 67,163 | ||||||
| (in thousands) | 2010 | 2009 | 2008 | |||||||
Interest paid, net of amount capitalized | $ | 9,814 | $ | 20,964 | $ | 21,442 | ||||
Income taxes paid, net of (refunds) | (1,601 | ) | 41,679 | 29,641 | ||||||
We use the “look-through”“cumulative earnings” approach for determining cash flow presentation of distributions from our unconsolidated joint ventures. Distributions paid out ofreceived on the cumulative operating cash flows of our joint venturesinvestments are included in our consolidated statements of cash flows in operating activities.activities, unless the cumulative distributions exceed our portion of cumulative equity in earnings of the joint venture, in which case the excess distributions are deemed to be returns of the investment and are classified as investing activity in our consolidated statements of cash flows.
Income Taxes: In accordance with the provisions of SFAS No. 109,Accounting for Income Taxes (“SFAS 109”), weWe account for income taxes using the asset and liability method. The asset and liability method requires the recognition of deferred tax assets and liabilities for expected future tax consequences of temporary differences that currently exist between the tax basis and financial reporting basis of our assets and liabilities. In assessing the realizability of deferred tax assets, we consider whether it is more likely than not that some, or a portion, of the deferred tax assets will not be realized. We provide a valuation allowance for deferred income tax assets when it is more likely than not that a portion of such deferred income tax assets will not be realized.
In June 2006, the Financial Accounting Standards Board (“FASB”) issued FASB Interpretation No. 48,Accounting for Uncertainty in Income Taxes – an interpretation of FASB Statement No. 109 (“FIN 48”). The interpretation addresses the determination of whether taxTax benefits claimed, or expected to be claimed, on a tax return should be recorded in the financial statements. Under FIN 48, a tax benefit may be recognized from an uncertain tax position only if it is more likely than notpositions that the tax position will be sustained on examination by the taxing authorities, including resolution of any related appeals or litigation processes, based on the technical merits of the position. The tax benefitsare recognized in the consolidated financial statements from such a position should beare measured based on the largest benefit that has a greater than fifty percent likelihood of being realized upon ultimate settlement. FIN 48 also provides guidance on income tax related issues such as derecognition, classification, interest and penalties, accounting treatment in interim periods and increased disclosure requirements.
We have reserves for taxes and associated interest and penalties that are determined in accordance with FIN 48, that may become payable in future years as a result of audits by taxing authorities. It is our policy to record these in income tax expense. While we believe the positions taken on previously filed tax returns are appropriate, we have established the tax and interest reserves in recognition that various taxing authorities may challenge our positions. The tax reserves are analyzed periodically, and adjustments are made as events occur to warrant adjustment to the reserves, such as lapsing of applicable statutes of limitations, conclusion of tax audits, additional exposure based on current calculations, identification of new issues, release of administrative guidance or court decisions affecting a particular tax issue.
Self-Insurance Reserves: We are largely self-insured with respect to workers’ compensation, general and automobile liability, property damage, employee medical claims and other potential losses. In order to reduce risk and better manage our overall loss exposure, we purchase stop-loss insurance that covers individual claims in excess of the deductible amounts. We maintain reserves for the estimated cost to settle open claims, which includes estimates of legal costs expected to be incurred, as well as an estimate of the cost of claims that have been incurred but not reported. These estimates are based on actuarial valuations that take into consideration the historical average claim volume, the average cost for settled claims, current trends in claim costs, changes in our business and workforce, general economic factors and other assumptions believed to be reasonable under the circumstances. The estimated reserves for these liabilities could be affected if future occurrences and claims differ from assumptions used and historical trends.
Recently Issued Accounting Standards:Standards: On September 15, 2009, the Financial Accounting Standards Board (“FASB”) Accounting Standards Codification (the “Codification”) became the single source of authoritative U.S. GAAP. The Codification changed the referencing of financial standards but did not change or alter existing U.S. GAAP. The Codification became effective for the Company in the second quarter of fiscal 2010.
In September 2006,June 2009, the FASB issued SFAS No. 157,Fair Value Measurements,an amendment to establishthe accounting and disclosure requirements for transfers of financial assets. This amendment removes the concept of a framework for measuringqualifying special-purpose entity and requires that a transferor recognize and initially measure at fair value all assets obtained and expandliabilities incurred as a result of a transfer of financial assets accounted for as a sale. This amendment also requires additional disclosures about fair value measurements. SFAS No. 157any transfers of financial assets and a transferor’s continuing involvement with transferred financial assets. This amendment is effective for fiscal years beginning after November 15, 2009, and interim periods within those fiscal years. The adoption of this amendment effective June 1, 2010 will result in recognition on the consolidated balance sheets of our trade accounts receivable securitization facility (see the description within “Note C – Debt and Receivables Securitization” for details regarding this facility).
In June 2009, the FASB issued an amendment to the accounting and disclosure requirements for variable interest entities. This amendment changes how a reporting entity determines when an entity that is insufficiently capitalized or is not controlled through voting (or similar rights) should be consolidated. The determination of whether a reporting entity is required to consolidate another entity is based on, among other things, the purpose and design of the other entity and the reporting entity’s ability to direct the activities of the other entity that most significantly impact its economic performance. The amendment also requires additional disclosures about a reporting entity’s involvement with variable interest entities and any significant changes in risk exposure due to that involvement. A reporting entity will be required to disclose how its involvement with a variable interest entity affects the reporting entity’s financial assetsstatements. This amendment is effective for fiscal years beginning after November 15, 2009, and liabilities after May 31, 2008,interim periods within those fiscal years. Worthington will adopt this amendment on June 1, 2010; and, for non-financial assets and liabilities after May 31, 2009. SFAS No. 157while we continue to fully evaluate the anticipated impacts, that adoption is not expected to materiallyhave a material impact on our consolidated financial position or results of operations.
In September 2006, the FASB issued SFAS No. 158,Employers’ Accounting for Defined Benefit Pension and Other Postretirement Plans – an amendment of FASB Statements No. 87, 88, 106, and 132(R), to improve financial reporting regarding defined benefit pension and other postretirement plans. We adopted the recognition provisions of SFAS No. 158 at May 31, 2007. The measurement date provision of SFAS No. 158 is effective at May 31, 2009, and is not expected to materially impact our consolidated financial position or results of operations.
In February 2007, the FASB issued SFAS No. 159,The Fair Value Option for Financial Assets and Financial Liabilities – Including an amendment of FASB Statement No. 115,to improve financial reporting by providing entities with the opportunity to mitigate volatility in reported earnings caused by measuring related assets and liabilities differently through the use of fair value measurements. SFAS No. 159 is effective June 1, 2008, and is not expected to materially impact our consolidated financial position or results of operations.
In December 2007, the FASB issued SFAS No. 141 (revised 2007) (“SFAS No. 141(R)”),Business Combinations,to improve the relevance, representational faithfulness and comparability of the information that a reporting entity provides in its financial reports about a business combination and its effects. SFAS No. 141(R) applies prospectively to business combinations after May 31, 2009, and is not expected to materially impact our consolidated financial position or results of operations.
In December 2007, the FASB issued SFAS No. 160,Noncontrolling Interests In Consolidated Financial Statements – an amendment of ARB No. 51,to improve the relevance, comparability and transparency of the financial information that a reporting entity provides in its consolidated financial statements by establishing accounting and reporting standards for the noncontrolling interest (minority interest) in a subsidiary and for the deconsolidation of a subsidiary. SFAS No. 160 is effective June 1, 2009, and will require a change in the presentation of the minority interest in the consolidated financial statements.
In March 2008, the FASB issued SFAS No. 161,Disclosures about Derivative Instruments and Hedging Activities – an amendment of FASB Statement No. 133,to improve the transparency of financial reporting by requiring enhanced disclosures about derivative and hedging activities. SFAS No. 161 is effective December 1, 2008.
Note B – Shareholders’ Equity
Preferred Shares: The Worthington Industries, Inc. Amended Articles of Incorporation authorize two classes of preferred shares and their relative voting rights. The Board of Directors of Worthington Industries, Inc. is empowered to determine the issue prices, dividend rates, amounts payable upon liquidation and other terms of the preferred shares when issued. No preferred shares are issued or outstanding.
Common Shares:Shares At its meeting on September 27, 2006, the Board of Directors of Worthington Industries, Inc. reconfirmed its authorization to repurchase up to 10,000,000 of Worthington Industries, Inc.’s outstanding common shares, which had initially been announced on June 13, 2005. This repurchase authorization was completed during December 2007.: On September 26, 2007, Worthington Industries, Inc. announced that the Board of Directors had authorized the repurchase of up to an additional 10,000,000 of Worthington Industries, Inc.’s outstanding common shares. A total of 9,099,5008,449,500 common shares remained available under this repurchase authorization as of May 31, 2008.2010. The common shares available for purchase under this authorization may be purchased from time to time, with consideration given to the market price of the common shares, the nature of other investment opportunities, cash flows from operations and general economic conditions. Repurchases may be made on the open market or through privately negotiated transactions.
Comprehensive Income: The components of other comprehensive income (loss) and related tax effects for the years ended May 31, were as follows:
| In thousands | 2008 | 2007 | 2006 | ||||||||
Other comprehensive income (loss): | |||||||||||
Unrealized gain (loss) on investment | $ | - | $ | (296 | ) | $ | 139 | ||||
Foreign currency translation, net of tax of $0, $212 and $677 in 2008, 2007 and 2006 | 13,080 | 4,507 | 8,711 | ||||||||
Minimum pension liability, net of tax of $(44), $(139) and $28 in 2008, 2007 and 2006 | 590 | 34 | 2,473 | ||||||||
Cash flow hedges, net of tax of $6,290, $4,300 and $(8,364) in 2008, 2007 and 2006 | (12,218 | ) | (7,586 | ) | 17,106 | ||||||
Other comprehensive income (loss), net of tax | $ | 1,452 | $ | (3,341 | ) | $ | 28,429 | ||||
The components of cumulative other comprehensive income (loss),AOCI, net of tax, at May 31 were as follows:
| In thousands | 2008 | 2007 | ||||||||||||||
Unrealized loss on investment | $ | (5 | ) | $ | (5 | ) | ||||||||||
| (in thousands) | 2010 | 2009 | ||||||||||||||
Unrealized gain on investment | $ | - | $ | (5 | ) | |||||||||||
Foreign currency translation | 24,047 | 10,967 | 442 | 14,181 | ||||||||||||
Defined benefit pension liability | (246 | ) | (836 | ) | (4,695 | ) | (5,012 | ) | ||||||||
Cash flow hedges | 837 | 13,055 | (6,378 | ) | (4,707 | ) | ||||||||||
Cumulative other comprehensive income, net of tax | $ | 24,633 | $ | 23,181 | ||||||||||||
Accumulated other comprehensive income (loss), net of tax | $ | (10,631 | ) | $ | 4,457 | |||||||||||
Reclassification adjustments
A net loss of $2,219,000 (net of tax of $1,222,000), net gain of $445,000 (net of tax of $234,000) and net gain of $7,514,000 (net of tax of $3,719,000) were reclassified from AOCI for cash flow hedges in fiscal 2008,2010, fiscal 20072009, and fiscal 2006 were $7,514,000 (net of tax of $3,719,000), $9,046,000 (net of tax of $4,617,000) and $4,382,000 (net of tax of $2,686,000).2008, respectively.
The estimated net amount of the existing gains or losses in other comprehensive incomeAOCI at May 31, 20082010 expected to be reclassified into net earnings within the succeeding twelve months was $2,235,000$953,000 (net of tax of $1,106,000)$525,000). This amount was computed using the fair value of the cash flow hedges at May 31, 2008,2010, and will change before actual reclassification from other comprehensive incomeAOCI to net earnings during the fiscal 2009.year ending May 31, 2011.
Note C – Debt and Receivables Securitization
Debt at May 31 is summarized as follows:
| In thousands | 2008 | 2007 | ||||||||||
| (in thousands) | 2010 | 2009 | ||||||||||
Notes payable | $ | 135,450 | $ | 31,650 | $ | - | $ | 980 | ||||
6.7% senior notes due December 1, 2009 | 145,000 | 145,000 | ||||||||||
6.70% senior notes due December 1, 2009 | - | 138,000 | ||||||||||
Floating rate senior notes due December 17, 2014 | 100,000 | 100,000 | 100,000 | 100,000 | ||||||||
6.50% senior notes due April 15, 2020 | 149,838 | - | ||||||||||
Other | 400 | 413 | ||||||||||
Total debt | 380,450 | 276,650 | 250,238 | 239,393 | ||||||||
Less current maturities and notes payable | 135,450 | 31,650 | - | 138,993 | ||||||||
Total long-term debt | $ | 245,000 | $ | 245,000 | $ | 250,238 | $ | 100,400 | ||||
At May 31, 2008, notes payable consisted of $125,450,000 of borrowings under our revolving credit facility, described below, and $10,000,000 of borrowings on uncommitted credit lines. The average variable rate was 3.16% at May 31, 2008, and is based on our senior unsecured long-term debt ratings assigned by Standard & Poor’s Ratings Group and Moody’s Investors Service, Inc. At May 31, 2007,2009, our notes payable consisted of $21,650,000$980,000 of borrowings under our unsecured $435,000,000 multi-year revolving credit facility and $10,000,000(the “Facility”) with a group of borrowings on uncommitted credit lines.lenders. The average variable rate was 5.81%.
OnFacility matures in May 6, 2008, we amended our $435,000,000 five-year revolving credit facility, which had been due to expire on September 29, 2010. The amendment extended the commitment date to May 6, 2013, except for a $35,000,000 commitment by one lender, that will expire onwhich expires in September 29, 2010. In addition, the amendment increased the facility fees and applicable percentage for base rate and Eurodollar loans payable. Borrowings under this facilitythe Facility have maturities of less than one year. We pay facility fees on the unused commitment amount. Interest rates on borrowings and related facility fees are based on our senior unsecured long-term debt ratings as assigned by Standard & Poor'sPoor’s Ratings Group and Moody'sMoody’s Investors Service, Inc. The covenants in the revolving credit facility include, among others, maintenance of a debt-to-total-capitalization ratio of not more than 55% at the end of any fiscal quarter and maintenance of an interest coverage ratio of not less than 3.25 times through maturity. We were in compliance with all covenants under the revolving credit facilityaverage variable rate was 0.90% at May 31, 2008.2009. There was no outstanding balance under the Facility at May 31, 2010. Additionally, and as discussed in “Note O – Guarantees and Warranties,” we provided $8,260,000 in letters of credit for third-party beneficiaries as of May 31, 2010. While not drawn against at May 31, 2010, these letters of credit are issued against availability under the Facility, leaving $426,740,000 available under the Facility at May 31, 2010.
We also have $40,000,000On June 12, 2009, we redeemed $118,545,000 of uncommittedthe then $138,000,000 outstanding 6.70% senior notes due December 1, 2009 (the “2009 Notes”). The consideration paid for the 2009 Notes was $1,025 per $1,000 principal amount of the 2009 Notes, plus accrued and unpaid interest. The remainder of the 2009 Notes became due and were redeemed, at face value, on December 1, 2009. The redemptions were funded by a combination of cash on hand and borrowings under existing credit lines availablefacilities.
Additionally, at the discretion of several banks. These facilities were established with major domestic banks.
TheMay 31, 2010, we had $100,000,000 unsecured floating rate senior notes outstanding, which are due on December 17, 2014 (“2014(the “2014 Notes”) and bear interest at a variable rate equal to six-month LIBOR plus 80 basis points. This rate was 5.63% as of May 31, 2008. However, we entered into an interest rate swap agreement whereby we receive interest on the $100,000,000 notional amount at the six-month LIBOR rate and we pay interest on the same notional amount at a fixed rate of 4.46%, effectively fixing the interest rate at 5.26%. See “Note S – Derivative Instruments and Hedging Activities” for additional information regarding the Company’s derivative instruments.
On April 13, 2010, we issued $150,000,000 aggregate principal amount of unsecured senior notes due 2020 (the “2020 Notes”). The 20142020 Notes bear interest at a rate of 6.50%. The 2020 Notes were sold to the
public at 99.890% of the principal amount thereof, to yield 6.515% to maturity. The Company used the net proceeds from the offering to repay a portion of the then outstanding borrowings under its revolving credit facility and amounts then outstanding under its revolving trade accounts receivable securitization facility. The proceeds on the issuance of the 2020 Notes were reduced for debt discount ($165,000), payment of debt issuance costs ($1,535,000) and settlement of a hedging instrument entered into in anticipation of the issuance of the 2020 Notes ($1,358,000). The debt discount, debt issuance costs and loss from treasury lock derivative are callable at par, at our option. The covenantsrecorded on the consolidated balance sheets within long-term debt as a contra-liability, short- and long-term other assets and AOCI, respectively. Each will be recognized, through interest expense, in the 2014 Notes,consolidated statements of earnings over the term of the 2020 Notes.
We maintain a $100,000,000 revolving trade accounts receivable securitization facility, which expires in January 2011 (the “AR Facility”). The AR Facility was available throughout fiscal 2010 and fiscal 2009. Transactions under the AR Facility have been accounted for as amended December 19, 2006, include among others, maintenancesales. Pursuant to the terms of the AR Facility, certain of our subsidiaries sell their accounts receivable without recourse, on a debt-to-total-capitalization ratiorevolving basis, to Worthington Receivables Corporation (“WRC”), a wholly-owned, consolidated, bankruptcy-remote subsidiary. In turn, WRC may sell without recourse, on a revolving basis, up to $100,000,000 of notundivided ownership interests in this pool of accounts receivable to a multi-sell, asset-backed commercial paper conduit (the “Conduit”). Purchases by the Conduit are financed with the sale of A1/P1 commercial paper. We retain an undivided interest in this pool and are subject to risk of loss based on the collectability of the receivables from this retained interest. Because the amount eligible to be sold excludes receivables more than 55%90 days past due, receivables offset by an allowance for doubtful accounts due to bankruptcy or other cause, receivables from certain foreign customers, concentrations over certain limits with specific customers and maintenancecertain reserve amounts, we believe additional risk of an interest coverage ratio, calculated atloss is minimal. Facility fees of $1,172,000, $2,628,000, and $341,000 were incurred during fiscal 2010, fiscal 2009 and fiscal 2008, respectively, and were recorded as miscellaneous expense. The book value of the endretained portion of any fiscal quarter,the pool of not less than 3.0 times through maturity. We were in compliance with all covenantsaccounts receivable approximates fair value. Accounts receivable sold under the 2014 Notes atAR Facility are excluded from accounts receivable in the consolidated financial statements. As of May 31, 2008.2010, the pool of eligible accounts receivable exceeded the $100,000,000 limit, and $45,000,000 of undivided ownership interests in this pool of accounts receivable had been sold.
The adoption of certain U.S. GAAP amendments effective June 1, 2010, as discussed within “Note A – Summary of Significant Accounting Policies,” will result in recognition on the consolidated balance sheets of the AR Facility. Recognition on the consolidated balance sheets will include reporting of amounts sold under the AR Facility as accounts receivable and outstanding secured borrowings. Also, prospectively upon adoption, related Facility fees will be treated as interest expense in the consolidated statements of earnings.
Principal payments due on long-term debt in the next five fiscal years, and the remaining years thereafter, are as follows:
| In thousands | ||||||
2009 | $ | - | ||||
2010 | 145,000 | |||||
| (in thousands) | ||||||
2011 | - | $ | - | |||
2012 | - | - | ||||
2013 | - | 80 | ||||
2014 | 80 | |||||
2015 | 100,080 | |||||
Thereafter | 100,000 | 150,160 | ||||
Total | $ | 245,000 | $ | 250,400 | ||
Note D – Income Taxes
Earnings (loss) before income taxes for the years ended May 31 include the following components:
| In thousands | 2008 | 2007 | 2006 | ||||||
Pre-tax earnings: | |||||||||
United States based operations | $ | 95,418 | $ | 106,246 | $ | 194,427 | |||
Non - United States based operations | 50,275 | 59,771 | 18,322 | ||||||
| $ | 145,693 | $ | 166,017 | $ | 212,749 | ||||
Significant components of income tax expense for the years ended May 31 were as follows:
| (in thousands) | 2010 | 2009 | 2008 | |||||||
United States based operations | $ | 73,122 | $ | (170,405 | ) | $ | 102,386 | |||
Non - United States based operations | 5,035 | 28,966 | 50,275 | |||||||
Earnings (loss) before income taxes | 78,157 | (141,439 | ) | 152,661 | ||||||
Less: Net earnings attributable to noncontrolling interest* | 6,266 | 4,529 | 6,968 | |||||||
Earnings (loss) before income taxes attributable to controlling interest | $ | 71,891 | $ | (145,968 | ) | $ | 145,693 | |||
| In thousands | 2008 | 2007 | 2006 | |||||||||
Current: | ||||||||||||
Federal | $ | 29,969 | $ | 38,644 | $ | 56,911 | ||||||
State and local | 2,617 | 1,617 | 8,343 | |||||||||
Foreign | 9,258 | 14,919 | 14,150 | |||||||||
| 41,844 | 55,180 | 79,404 | ||||||||||
Deferred: | ||||||||||||
Federal | (3,038 | ) | (2,402 | ) | (6,051 | ) | ||||||
State | (1,601 | ) | (334 | ) | (1,950 | ) | ||||||
Foreign | 1,411 | (332 | ) | (4,644 | ) | |||||||
| (3,228 | ) | (3,068 | ) | (12,645 | ) | |||||||
| $ | 38,616 | $ | 52,112 | $ | 66,759 | |||||||
| * | Net earnings attributable to noncontrolling interest are not taxable to Worthington. Significant components of income tax expense (benefit) for the years ended May 31 were as follows: |
| (in thousands) | 2010 | 2009 | 2008 | |||||||||
Current: | ||||||||||||
Federal | $ | 30,080 | $ | (21,609 | ) | $ | 29,969 | |||||
State and local | 1,333 | 3,146 | 2,617 | |||||||||
Foreign | 1,347 | 6,188 | 9,258 | |||||||||
| 32,760 | (12,275 | ) | 41,844 | |||||||||
Deferred: | ||||||||||||
Federal | (6,804 | ) | (19,393 | ) | (3,038 | ) | ||||||
State | 1,399 | (4,359 | ) | (1,601 | ) | |||||||
Foreign | (705 | ) | (1,727 | ) | 1,411 | |||||||
| (6,110 | ) | (25,479 | ) | (3,228 | ) | |||||||
| $ | 26,650 | $ | (37,754 | ) | $ | 38,616 | ||||||
Tax benefits related to stock-based compensation that were credited to additional paid-in capital were $2,035,000, $2,370,000$6,000, $433,000, and $1,279,000$2,035,000 for fiscal 2008,2010, fiscal 20072009 and fiscal 2006. Tax benefits (expenses) related to foreign currency translation adjustments that were credited to (deducted from) other comprehensive income were $0, $212,000, and $677,000 for fiscal 2008, fiscal 2007 and fiscal 2006.2008. Tax benefits (expenses) related to defined benefit pension liability that were credited to (deducted from) other comprehensive income (loss) (“OCI”) were $1,163,000, $14,000, and ($44,000), $(393,000), and $28,000 for fiscal 2008,2010, fiscal 20072009 and fiscal 2006.2008. Tax benefits (expenses) related to cash flow hedges that were credited to (deducted from) other comprehensive incomeOCI were $6,290,000, $4,300,000,$854,000, $3,187,000, and $(8,364,000)$6,290,000 for fiscal 2008,2010, fiscal 20072009 and fiscal 2006. Tax2008. The tax benefits related to the gain from the dilution of our interest in TWB Company, L.L.C. (“TWB”), as a result of our partner’s contribution to this unconsolidated joint venture, credited to additional paid-in capital were $1,032,000$1,031,000 for fiscal 2008 (see Note J)“Note J – Investments in Unconsolidated Affiliates”).
A reconciliation of the federal statutory tax rate of 35 percent to total provisions (benefits)tax provision (benefit) follows:
| 2008 | 2007 | 2006 | 2010 | 2009 | 2008 | |||||||||||||
Federal statutory rate | 35.0 | % | 35.0 | % | 35.0 | % | 35.0 | % | 35.0 | % | 35.0 | % | ||||||
State and local income taxes, net of federal tax benefit | 0.7 | 1.5 | 3.6 | (1.5 | ) | 2.3 | 0.4 | |||||||||||
Change in state and local valuation allowances | 5.0 | (0.7 | ) | 0.3 | ||||||||||||||
Change in income tax accruals for resolution of tax audits and change in estimate of deferred tax | (1.7 | ) | 1.1 | (1.4 | ) | 1.6 | (0.1 | ) | (1.7 | ) | ||||||||
Non-U.S. income taxes at other than 35% | (4.6 | ) | (3.6 | ) | (4.1 | ) | (1.6 | ) | 3.9 | (4.6 | ) | |||||||
Ohio income tax law change | - | - | (2.3 | ) | ||||||||||||||
Special foreign earnings repatriations and sale of non-U.S. company | - | - | 2.5 | |||||||||||||||
Deferred tax adjustment for foreign earnings | - | - | (2.2 | ) | ||||||||||||||
Qualified production activities deduction | (2.1 | ) | - | (0.6 | ) | |||||||||||||
Goodwill impairment non-deductible | - | (13.9 | ) | - | ||||||||||||||
Other | (2.9 | ) | (2.6 | ) | 0.3 | 0.7 | (0.6 | ) | (2.3 | ) | ||||||||
Effective tax rate | 26.5 | % | 31.4 | % | 31.4 | % | ||||||||||||
Effective tax rate attributable to controlling interest | 37.1 | % | 25.9 | % | 26.5 | % | ||||||||||||
The above effective tax rate attributable to controlling interest excludes any impact from the Under In June 2006,FASB issued FASB Interpretation No. 48,Accountinginclusion of net earnings attributable to noncontrolling interest in our consolidated statements of earnings. The effective tax rates upon inclusion of net earnings attributable to noncontrolling interest were 34.1%, 26.7% and 25.3% for Uncertaintyfiscal 2010, fiscal 2009 and fiscal 2008, respectively. The change in Income Taxes –effective income tax rates, upon inclusion of net earnings attributable to noncontrolling interest, is a result of the nature of Spartan as an interpretation of FASB Statement No. 109 (“FIN 48”). The interpretation addresses the determination of whetherentity that pays no federal income tax, benefits claimed, or expectedbut instead distributes its income to be claimed, onits investors, where it becomes taxable. As a result, net earnings attributable to noncontrolling interest do not generate tax return should be recorded in the financial statements. expense for Worthington.FIN 48,applicable accounting guidance, a tax benefit may be recognized from an uncertain tax position only if it is more likely than not that the tax position will be sustained on examination by the taxing authorities, including resolution of any related appeals or litigation processes, based on the technical merits of the position. TheAny tax benefits recognized in theour financial statements from such a position should bewere measured based on the largest
benefit that has a greater than fifty percent likelihood of being realized upon ultimate settlement. FIN 48 also provides guidance on income tax related issues such as derecognition, classification, interest and penalties, accounting treatment in interim periods and increased disclosure requirements.
On June 1, 2007, we adopted the provisions of FIN 48. There was no effect on our consolidated financial position or cumulative adjustment to our beginning retained earnings as a result of the implementation. However, certain amounts have been reclassified on the consolidated balance sheets in order to comply with the requirements of the interpretation.
The total amount of unrecognized tax benefits was $2,093,000$5,933,000, $3,897,000, and $16,826,000$2,093,000 as of May 31, 20082010, May 31, 2009 and June 1, 2007,2008, respectively. The total amount of unrecognized tax benefits that, if recognized, would affect the effective tax rate attributable to controlling interest was $1,966,000$3,935,000 as of May 31, 2008.2010. Unrecognized tax benefits are the differences between a tax position taken, or expected to be taken in a tax return, and the benefit recognized for accounting purposes pursuant to FIN 48.purposes. Accrued amounts of interest and penalties related to unrecognized tax benefits are recognized as part of income tax expense within our consolidated statementstatements of earnings. As of May 31, 20082010, May 31, 2009 and June 1, 2007,2008, we had accrued liabilities of $720,000$1,232,000, $1,143,000, and $5,056,000,$720,000, respectively, for interest and penalties within the unrecognized tax benefits.
A tabular reconciliation of unrecognized tax benefits follows:
| In thousands | ||||||||
Balance at June 1, 2007 | $ | 16,826 | ||||||
| (in thousands) | ||||||||
Balance at June 1, 2009 | $ | 3,897 | ||||||
Increases – tax positions taken in prior years | 403 | 1,538 | ||||||
Decreases – tax positions taken in prior years | (9,830 | ) | - | |||||
Increases – current tax positions | 63 | 1,177 | ||||||
Decreases – current tax positions | (112 | ) | - | |||||
Lapse of statute | (5,257 | ) | ||||||
Settlements | (541 | ) | ||||||
Lapse of statutes of limitations | (138 | ) | ||||||
Balance at May 31, 2008 | $ | 2,093 | ||||||
Balance at May 31, 2010 | $ | 5,933 | ||||||
Approximately $1,205,000$1,200,000 of the liability for unrecognized tax benefits is expected to be settled in the next twelve months due to the expiration of statutes of limitations in various tax jurisdictions and as a result of expected settlements with various tax jurisdictions. While it is expected that the amount of unrecognized tax benefits will change in the next twelve months, any change is not expected to have a material impact on our consolidated financial position, results of operations or cash flows.
Following is a summary of the tax years open to examination by major tax jurisdiction:
U.S. Federal – 2000 – 2003; 20052006 and forward
U.S. State and Local – 20032002 and forward
Austria – 20012003 and forward
Canada – 2006 and forward
We also adjusted our deferred taxes in fiscal 20082010, fiscal 2009 and fiscal 2007,2008, resulting in an increase (decrease) of $(2,057,000)$291,000, $1,316,000, and $917,000$(2,057,000) in income tax expense, respectively. Fiscal 2007 included adjustments for changes to estimated tax liabilities. Fiscal 2006 included a $4,623,000 adjustment for an over-accrual of deferred tax liabilities related to the foreign earnings of the Worthington Armstrong Venture (“WAVE”) joint venture and a $4,346,000 deferred tax liability adjustment for the Ohio tax law change, discussed below, offset by a $3,370,000 adjustment for changes in estimated tax liabilities.
On June 30, 2005, the state of Ohio enacted various changes to its tax laws. One change was the phase-out of the Ohio franchise tax, which is generally based on federal taxable income. This phase-out is scheduled to occur at the rate of 20% per year for 2006 through 2010. Our accrual forEarnings before income taxes for fiscal
2005 included 100% of the expected Ohio franchise tax liability. As a result of the law change, only 80% of that liability was due. As such, in fiscal 2006 we made an adjustment to reduce our accrued income taxes. In addition, as a result of various changes to Ohio’s tax laws in fiscal 2006, we adjusted our deferred taxes by $4,346,000.
Taxes on Foreign Income
Pre-tax earnings attributable to foreign sources for fiscal 2008,2010, fiscal 20072009 and fiscal 2006 is2008 were as noted above. Without regard to the one-time repatriation discussed above, asAs of May 31, 2008,2010, and based on the tax laws in effect at that time, it remains our intention to continue to indefinitely reinvest our undistributed foreign earnings, except for the foreign earnings of our TWB joint venture. Accordingly, where this election has been made, no deferred tax liability has been recorded for those foreign earnings. Undistributed earnings of our consolidated foreign subsidiaries at May 31, 2008,2010 amounted to $212,082,000.$244,517,000. If such earnings were not permanently reinvested, a deferred tax liability of $21,777,000$18,804,000 would have been required.
The American Jobs Creation Act of 2004 created a temporary incentive for U.S. corporations to repatriate accumulated income earned abroad by providing an 85 percent dividends-received deduction for certain dividends from controlled foreign corporations. During fiscal 2006, we approved a plan for reinvestment and repatriated a cash dividend amount of $42,157,000, of which $41,395,000 qualified for the 85 percent dividends-received deduction. Pursuant to the plan for reinvestment, during fiscal 2006, we made expenditures for capital additions and improvements and other qualifying amounts at our domestic facilities in excess of the $42,157,000 cash dividend amount. As a result, we recorded a related tax expense of $1,702,000 for the cash dividend repatriation.
The components of our deferred tax assets and liabilities as of May 31 were as follows:
| In thousands | 2008 | 2007 | ||||||
Deferred tax assets: | ||||||||
Accounts receivable | $ | 2,300 | $ | 3,044 | ||||
Inventories | 6,021 | 4,024 | ||||||
Accrued expenses | 18,609 | 14,900 | ||||||
Net operating loss carryforwards | 17,989 | 17,048 | ||||||
Tax credit carryforwards | 2,473 | 1,012 | ||||||
Stock-based compensation | 2,362 | 1,173 | ||||||
Other | 1,041 | 1,082 | ||||||
Total deferred tax assets | 50,795 | 42,283 | ||||||
Valuation allowance for deferred tax assets | (13,248 | ) | (12,930 | ) | ||||
Net deferred tax assets | 37,547 | 29,353 | ||||||
Deferred tax liabilities: | ||||||||
Property, plant and equipment | 97,057 | 94,462 | ||||||
Derivative contracts | 1,247 | 8,013 | ||||||
Undistributed earnings of unconsolidated affiliates | 17,207 | 14,552 | ||||||
Income taxes | 862 | 463 | ||||||
Other | 380 | 249 | ||||||
Total deferred tax liabilities | 116,753 | 117,739 | ||||||
Net deferred tax liability | $ | 79,206 | $ | 88,386 | ||||
Deferred tax assets: Accounts receivable Inventories Accrued expenses Net operating loss carryforwards Tax credit carryforwards Stock-based compensation Derivative contracts Other Total deferred tax assets Valuation allowance for deferred tax assets Net deferred tax assets Deferred tax liabilities: Property, plant and equipment Undistributed earnings of unconsolidated affiliates Income taxes Other Total deferred tax liabilities Net deferred tax liabilities(in thousands) 2010 2009 $ 2,938 $ 4,511 4,005 5,228 21,712 17,941 22,418 20,573 2,127 2,423 5,761 4,465 3,410 2,465 58 754 62,429 58,360 (19,629 ) (14,729 ) 42,800 43,631 (67,317 ) (77,454 ) (20,893 ) (15,802 ) (661 ) (273 ) (582 ) (1,010 ) (89,453 ) (94,539 ) $ (46,653 ) $ (50,908 )
The above amounts are classified in the consolidated balance sheets as of May 31 as follows:
| In thousands | 2008 | 2007 | ||||||||||||
| (in thousands) | 2010 | 2009 | ||||||||||||
Current assets: | ||||||||||||||
Deferred income taxes | $ | 17,966 | $ | 13,067 | $ | 21,964 | $ | 24,868 | ||||||
Other assets: | ||||||||||||||
Deferred income taxes | 3,639 | 4,530 | 3,276 | 7,210 | ||||||||||
Noncurrent liabilities: | ||||||||||||||
Deferred income taxes | 100,811 | 105,983 | (71,893 | ) | (82,986 | ) | ||||||||
Net deferred tax liabilities | $ | 79,206 | $ | 88,386 | $ | (46,653 | ) | $ | (50,908 | ) | ||||
At May 31, 2008,2010, we had tax benefits for federal net operating loss carryforwards of $131,000$232,000 that expire from fiscal 20092011 to the fiscal 2019.year ending May 31, 2020. These net operating loss carryforwards are subject to utilization limitations. At May 31, 2008,2010, we had tax benefits for state net operating loss carryforwards of $12,962,000$18,173,000 that expire from fiscal 20092011 to the fiscal 2028year ending May 31, 2030 and state credit carryforwards
of $1,411,000$1,253,000 that expire from fiscal 20092011 to the fiscal 2030.year ending May 31, 2024. At May 31, 2008,2010, we had tax benefits for foreign net operating loss carryforwards of $4,896,000$4,013,000 for income tax purposes that expire from fiscal 20092011 to the fiscal 2018.year ending May 31, 2029. At May 31, 2008,2010, we had tax benefits for foreign tax credit carryforwards of $1,062,000$874,000 that expire in the fiscal 2016.year ending May 31, 2019.
A valuation allowance of $13,248,000$19,629,000 has been recognized to offset the deferred tax assets related to the net operating loss carryforwards and foreign tax credit carryforwards and certain state tax credits. The valuation allowance includes $930,000$1,105,000 for federal, $10,914,000$15,593,000 for state and $1,404,000$2,931,000 for foreign. The majority of the federal valuation allowance relates to the foreign tax creditcredits with the remainder relating to the net operating loss carryforward.carryforwards. The majority of the state valuation allowance relates to owningMetal Framing operations in various states and the Company’s Decatur Alabama facility, while the foreign valuation allowance relates to operations in Portugalthe Czech Republic and China. WeBased on our history of profitability and taxable income projections, we have determined that it is more likely than not that deferred tax assets are realizable, except for certain net operating loss carryforwards and tax credits.otherwise realizable.
Note E – Employee Pension Plans
In December 2008, the FASB issued new accounting guidance for employers’ accounting for defined benefit pension and other postretirement plans. Beginning with fiscal 2009, the Company adopted the measurement date provisions of this new accounting literature. The measurement date provisions require plan assets and obligations to be measured as of the date of the Company’s year-end financial statements. The Company previously measured its pension benefits obligation as of March 31 each year. The adoption of these measurement date provisions did not have a material effect on the Company’s consolidated financial position or results of operations for fiscal 2010 or fiscal 2009.
The new guidance also requires enhanced disclosures about plan assets in an employer’s defined benefit pension or other postretirement plan. Companies are now required to disclose information about how investment allocation decisions are made, the fair value of each major category of plan assets, the basis used to determine the overall expected long-term rate of return on assets assumption, a description of the inputs and valuation techniques used to develop fair value measurements of plan assets and significant concentrations of credit risk. The disclosure provisions of the new guidance are effective for fiscal years ending after December 15, 2009. The adoption of the disclosure provisions of the new guidance in the fourth quarter of fiscal 2010 required expanded disclosure in the notes to the Company’s consolidated financial statements, but did not impact amounts within our consolidated financial statements.
We provide retirement benefits to employees mainly through contributory, deferred profit sharingdefined contribution retirement plans. ContributionsEligible participants make pre-tax contributions based on elected percentages of eligible compensation, subject to annual addition and other limitations imposed by the deferred profit sharing plans are determined as a percentageInternal Revenue Code and the various plans’ provisions. Company contributions consist of our pre-tax income before profit sharing, withcompany matching contributions, guaranteed to represent at least 3% of the participants’ compensation. We match employeeannual or monthly employer contributions at 50% up to defined maximums. and discretionary contributions, based on individual plan provisions.
We also have one defined benefit plan, The Gerstenslager Company Bargaining Unit Employees’ Pension Plan (the “Gerstenslager Plan” or “defined benefit plan”). The Gerstenslager Plan is a non-contributory pension plan, which covers certain employees based on age and length of service. Our contributions comply with ERISA'sERISA’s minimum funding requirements.
Effective May 31, 2007, we adopted SFAS No. 158, “Employers’ Accounting for Defined Benefit Pension and Other Postretirement Plans – an Amendment of FASB Statements No. 87, 88, 106 and 132(R)”. The adoption did not materially impact our consolidated financial position or results of operations. Also, as required by SFAS No. 158, for our fiscal year ending May 31, 2009, and thereafter, we will measure the assets and benefit obligations of the Gerstenslager Plan at May 31, rather than the current March 31 measurement date. We do not expect the change in measurement date to materially affect our consolidated financial position, results of operations or cash flows.
The following table summarizes the components of net periodic pension cost for the Gerstenslager Plan (i.e. the defined benefit plan)plan and the defined contribution plans for the years ended May 31:
| In thousands | 2008 | 2007 | 2006 | |||||||||||||||||||||
| (in thousands) | 2010 | 2009 | 2008 | |||||||||||||||||||||
Defined benefit plan: | ||||||||||||||||||||||||
Service cost | $ | 599 | $ | 610 | $ | 700 | $ | 490 | $ | 615 | $ | 599 | ||||||||||||
Interest cost | 900 | 818 | 719 | 1,059 | 1,146 | 900 | ||||||||||||||||||
Actual return on plan assets | 496 | (1,257 | ) | (1,621 | ) | 3,152 | (3,774 | ) | 496 | |||||||||||||||
Net amortization and deferral | (1,538 | ) | 396 | 1,149 | (3,811 | ) | 2,501 | (1,538 | ) | |||||||||||||||
Net pension cost on defined benefit plan | 457 | 567 | 947 | |||||||||||||||||||||
Net periodic pension cost on defined benefit plan | 890 | 488 | 457 | |||||||||||||||||||||
Defined contribution plans | 11,641 | 9,694 | 9,663 | 8,817 | 8,455 | 11,641 | ||||||||||||||||||
Total retirement plan cost | $ | 12,098 | $ | 10,261 | $ | 10,610 | $ | 9,707 | $ | 8,943 | $ | 12,098 | ||||||||||||
The following actuarial assumptions were used for our defined benefit plan:
| 2008 | 2007 | 2006 | 2010 | 2009 | 2008 | |||||||||||||
To determine benefit obligation: | ||||||||||||||||||
Discount rate | 6.82 | % | 6.14 | % | 6.03 | % | 6.00 | % | 7.45 | % | 6.82 | % | ||||||
To determine net periodic pension cost: | ||||||||||||||||||
Discount rate | 6.14 | % | 6.03 | % | 5.61 | % | 7.45 | % | 6.92 | % | 6.14 | % | ||||||
Expected long-term rate of return | 8.00 | % | 8.00 | % | 8.00 | % | 8.00 | % | 8.00 | % | 8.00 | % | ||||||
Rate of compensation increase | n/a | n/a | n/a | n/a | n/a | n/a | ||||||||||||
To calculate the discount rate, we used the expected cash flows of the benefit payments and the Citigroup Pension Index. The Gerstenslager Plan’s expected long-term rate of return on the defined benefit plan in fiscal 2008,2010, fiscal 20072009 and fiscal 20062008 was based on the actual historical returns adjusted for a change in the frequency of lump sumlump-sum settlements upon retirement. In determination of our obligation, we use the actuarial present value of the vested benefits to which an employee is currently entitled, based on the employee’s expected date of separation or retirement.
The following tables provide a reconciliation of the changes in the projected benefit obligation and fair value of plan assets and the funded status for the defined benefit planGerstenslager Plan during fiscal 20082010 and fiscal 20072009 as of the March 31,respective measurement date:dates:
| In thousands | 2008 | 2007 | ||||||||||||||
| (in thousands) | May 31, 2010 | May 31, 2009 | ||||||||||||||
Change in benefit obligation | ||||||||||||||||
Benefit obligation, beginning of year | $ | 14,626 | $ | 13,696 | $ | 14,300 | $ | 14,329 | ||||||||
Service cost | 599 | 610 | 490 | 615 | ||||||||||||
Interest cost | 900 | 818 | 1,059 | 1,146 | ||||||||||||
Actuarial gain | (1,577 | ) | (327 | ) | ||||||||||||
Actuarial gain (loss) | 3,989 | (1,390 | ) | |||||||||||||
Benefits paid | (219 | ) | (171 | ) | (387 | ) | (400 | ) | ||||||||
Benefit obligation, end of year | $ | 14,329 | $ | 14,626 | $ | 19,451 | $ | 14,300 | ||||||||
Change in plan assets | ||||||||||||||||
Fair value, beginning of year | $ | 16,135 | $ | 13,373 | $ | 11,246 | $ | 15,420 | ||||||||
Actual return on plan assets | (496 | ) | 1,257 | 3,152 | (3,774 | ) | ||||||||||
Company contributions | - | 1,677 | 982 | - | ||||||||||||
Benefits paid | (219 | ) | (172 | ) | (387 | ) | (400 | ) | ||||||||
Fair value, end of year | $ | 15,420 | $ | 16,135 | $ | 14,993 | $ | 11,246 | ||||||||
Funded Status | $ | 1,091 | $ | 1,509 | ||||||||||||
Funded status | $ | (4,458 | ) | $ | (3,054 | ) | ||||||||||
Amounts recognized in the statement of financial position consist of: | ||||||||||||||||
Noncurrent assets | $ | 1,091 | $ | 1,509 | ||||||||||||
Cumulative other comprehensive income | 869 | 909 | ||||||||||||||
Amounts recognized in cumulative other comprehensive income consist of: | ||||||||||||||||
Amounts recognized in the consolidated balance sheets consist of: | ||||||||||||||||
Other liabilities | $ | (4,458 | ) | $ | (3,054 | ) | ||||||||||
Accumulated other comprehensive income (loss) | 6,023 | 4,527 | ||||||||||||||
Amounts recognized in accumulated other comprehensive income (loss) consist of: | ||||||||||||||||
Net loss | 650 | 450 | 6,023 | 4,527 | ||||||||||||
Prior service cost | 219 | 459 | ||||||||||||||
Total | $ | 869 | $ | 909 | $ | 6,023 | $ | 4,527 | ||||||||
The following table shows other changes in plan assets and benefit obligations recognized in other comprehensive incomeOCI during the fiscal year ended May 31:
| In thousands | 2008 | 2007 | ||||||
Adjustment to minimum liability | $ | - | $ | 483 | ||||
Net actuarial gain (loss) | 201 | (483 | ) | |||||
Amortization of prior service cost | (240 | ) | (240 | ) | ||||
Elimination of minimum liability | - | (483 | ) | |||||
Total recognized in other comprehensive income | $ | (39 | ) | $ | (723 | ) | ||
Total recognized in net periodic benefit cost and other comprehensive income | $ | 417 | $ | (156 | ) | |||
| (in thousands) | 2010 | 2009 | ||||||
Net actuarial loss | $ | 1,762 | $ | 3,877 | ||||
Amortization of net loss | (266 | ) | - | |||||
Amortization of prior service cost | - | (219 | ) | |||||
Total recognized in other comprehensive income (loss) | $ | 1,496 | $ | 3,658 | ||||
Total recognized in net periodic benefit cost and other comprehensive income (loss) | $ | 2,386 | $ | 4,146 | ||||
The estimated net loss and prior service cost for the defined benefit pension plan that will be amortized from accumulated other comprehensive incomeAOCI into net periodic benefitpension cost over the next fiscal year ending May 31, 2011 are $257,000 and $0, respectively.
Pension plan assets are required to be disclosed at fair value in the consolidated financial statements. Fair value is $219,000.defined in “Note R – Fair Value.” The pension plan assets’ fair value measurement level within the fair value hierarchy is based on the lowest level of any input that is significant to the fair value measurement. Valuation techniques used need to maximize the use of observable inputs and minimize the use of unobservable inputs.
The following table sets forth, by level within the fair value hierarchy, a summary of the defined benefit plan’s assets measured at fair value on a recurring basis at May 31, 2010:
| (in thousands) | Fair Value | Quoted Prices in Active Markets (Level 1) | Significant Other Observable Inputs (Level 2) | Significant Unobservable Inputs (Level 3) | ||||||||
Investment: | ||||||||||||
Money Market Funds | $ | 275 | $ | 275 | $ | - | $ | - | ||||
Bond Funds | 4,632 | 4,632 | - | - | ||||||||
Equity Funds | 10,086 | 10,086 | - | - | ||||||||
Totals | $ | 14,993 | $ | 14,993 | $ | - | $ | - | ||||
Fair values for the money market, bond and equity funds held by the defined benefit plan were determined by quoted market prices.
Plan assets for the defined benefit plan consistconsisted principally of the following as of the March 31respective measurement date:dates:
| 2008 | 2007 | May 31, 2010 | May 31, 2009 | |||||||||
Asset category | ||||||||||||
Equity securities | 68 | % | 70 | % | 67 | % | 61 | % | ||||
Debt securities | 32 | % | 30 | % | 31 | % | 38 | % | ||||
Other | 2 | % | 1 | % | ||||||||
Total | 100 | % | 100 | % | 100 | % | 100 | % | ||||
Equity securities include no employer stock. The investment policy and strategy for the defined benefit plan is: (i) long-term in nature with liquidity requirements that are anticipated to be minimal due to the projected normal retirement date of the average employee and the current average age of participants; (ii) to earn nominal returns, net of investment fees, equal to or in excess of the actuarial assumptionassumptions of the plan; and (iii) to include a strategic asset allocation of 60-80% equities, including international, and 20-40% fixed income investments. NoEmployer contributions of $1,800,000 are expected to be made to the defined benefit plan are expected during fiscal 2009.2011. The following estimated future benefits, which reflect expected future service, as appropriate, are expected to be paid:paid during the fiscal years noted:
| In thousands | |||
2009 | $ | 260 | |
2010 | 287 | ||
2011 | 346 | ||
2012 | 404 | ||
2013 | 524 | ||
2014-2018 | 4,010 | ||
| (in thousands) | |||
2011 | $ | 423 | |
2012 | 508 | ||
2013 | 569 | ||
2014 | 662 | ||
2015 | 754 | ||
2016-2020 | 6,241 | ||
Commercial law requires us to pay severance and service benefits to employees at our Austrian Pressure Cylinders location. Severance benefits must be paid to all employees hired before December 31, 2002. Employees hired after that date are covered under a governmental plan that requires us to pay benefits as a percentage of compensation (included in payroll tax withholdings). Service benefits are based on a percentage of compensation and years of service. The accrued liability for these unfunded plans was $6,879,000$5,747,000 and $5,768,000$6,539,000 at May 31, 20082010 and 2007,2009, respectively, and was included in other liabilities on the
consolidated balance sheets. Net periodic pension cost for these plans was $587,000, $588,000,$728,000, $694,000 and $580,000$587,000 for fiscal 2008,2010, fiscal 20072009 and fiscal 2006.2008, respectively. The assumed salary rate increase was 3.0%, 3.5% and 3.5% for fiscal 2008,2010, fiscal 20072009 and fiscal 2006.2008, respectively. The discount rate at May 31, 2010, 2009 and 2008 2007was 5.00%, 6.20% and 2006 was 6.00%, 4.80% and 4.70%.respectively. This discount rate is based on a published corporate bond rate with a term approximating the estimated benefit payment cash flows and is consistent with European and Austrian regulations.
Note F – Stock-Based Compensation
Under our employee and non-employee directorsdirector stock-based compensation plans, we may grant incentive or non-qualified stock options, restricted common shares and performance shares to employees and non-qualified stock options and restricted stockcommon shares to non-employee directors. A total of 16,749,000 Worthington common shares have been authorized for issuance in connection with the stock-based compensation plans in place at May 31, 2010.
The stock options may be granted to purchase common shares at not less than 100% of fair market value on the date of the grant. All outstanding stock options are non-qualified stock options. The exercise price of all stock options granted has been set at 100% of the fair market value of the underlying common shares on the date of grant. Generally, the stock options granted to employees vest and become exercisable at the rate of 20% per year beginning one year from the date of grant and expire ten years after the date of grant. The non-qualified stock options granted to non-employee directors vest and become exercisable on the first to occur of (a) the first anniversary of the date of grant and (b) as to any option granted as of the date of an annual meeting of shareholders of Worthington Industries, Inc., the date on which the next annual meeting of shareholders is held following the
date of grant. Stock options can be exercised through net-settlement, at the election of the option holder.
In addition to the stock options previously discussed, we have awarded performance shares, to certain employees, performance shares that are contingent (i.e., vest) upon achieving corporate targets for cumulative corporate economic value added, earnings per share growth and, in the case of business unit executives, business unit operating income targets for the three-year periods ending May 31, 20092010, 2011 and 2010.2012. These performance share awards will be paid, to the extent earned, in common shares of Worthington Industries, Inc. in the fiscal quarter following the end of the applicable three-year performance period. The restricted shares granted to non-employee directors are valued at the closing market price of common shares of Worthington Industries, Inc. on the date of the grant. The restricted shares vest under the same parameters used forapplicable to non-employee director stock options discussed above.
Effective June 1, 2006, we adopted SFAS 123(R). SFAS 123(R)Non-Qualified Stock Options
U.S. GAAP requires that all share-based payments,awards, including grants of stock options, to be recorded as expense in the statement of earnings based on their fair values. In adopting SFAS 123(R),the most recent U.S. GAAP provisions, we selected the modified prospective transition method. This method requires that compensation expense be recorded prospectively over the remaining vesting period of the stock options on a straight-line basis using the fair value of the stock options on the date of grant. It does not require restatement of financial results for the prior period expense related to stock option awards that were outstanding prior to adoption.
We calculate the fair value of the stock options using the Black-Scholes option pricing model and certain assumptions. The computation of fair values for all stock options use the following assumptions: theThe expected volatility which is based on the historical volatility of the common shares of Worthington Industries, Inc.;, and the risk-free interest rate which is based on the United States Treasury strip rate for the expected term of the stock option.options. The expected term was developed using the simplified approach allowed byhistorical exercise experience. The dividend yield is based on annualized current dividends and an average quoted price of Worthington Industries, Inc. common shares over the Securities and Exchange Commission’s Staff Accounting Bulletin No. 107. preceding annual period.
The assumptions used to value specific grants are disclosed below.
We grantedtable below sets forth the non-qualified stock options effective July 2, 2007, covering 467,500 common shares under our employee stock-based compensation plans. Thegranted during each of the last three fiscal years ended May 31. For each grant, the option price of $22.73 per share was equal to the closing market price of the underlying common shares at theeach respective grant date. The fair valuevalues of these stock options based on the Black-Scholes option-pricing model, calculated at the grant date, was $6.94 per share. The following assumptions were used to value the stock options: dividend yield of 3.5%; expected term 6.5 years; expected volatility of 35.7%; and risk-free interest rate of 4.9%. The calculated pre-tax stock-based compensation expense for these stock options is $2,628,000, which will be recognized on a straight-line basis over the five-year vesting period of the stock options.
We granted non-qualified stock options, effective September 26, 2007, covering 42,500 common shares and 11,150 restricted shares under our equity incentive plan for non-employee directors. The option price of $22.95 per share was equal to the market price of the underlying common shares at the grant date. The fair value of these stock options, based on the Black-Scholes option-pricing model, calculated at the grant date, was $6.94 per share. The assumptions used to value the stock options were the same as those in the preceding paragraph. The restricted shares granted were valued at the closing market price of $22.95 for the underlying common shares at the grant date. The calculated pre-tax stock-based compensation expense for the stock options and the restricted shares granted on September 26, 2007, is $551,000, which will be recognized on a straight-line basis over the one-year vesting period.
We granted non-qualified stock options, during December 2007, covering an aggregate of 1,344,000 common shares under our employee stock-based compensation plan. The option prices of $20.80 and $21.61 per share were equal to the market price of the underlying common shares at the respective grant dates. The fair value of these stock options, based on the Black-Scholes option-pricing model, calculated at the respective grant dates, was $5.97 per share.dates. The following assumptions were used to value the stock options: dividend yield of 3.2%; expected term 6.5 years; expected volatility of 34.8%; and risk-free interest rate of 3.6%. Stock-basedcalculated pre-tax stock-based compensation expense of $6,499,000for these stock options, which is after an estimate for forfeitures, will be recognized on a straight-line basis over the five-year vesting period of the stock options.
Granted (in thousands) Weighted average price, per share Weighted average grant date fair value, per share Pre-tax stock-based compensation (in thousands) 2010 2009 2008 993 606 1,849 $ 13.36 $ 18.75 $ 21.34 $ 4.85 $ 5.57 $ 6.24 $ 3,968 $ 2,734 $ 9,346
The weighted average fair value of stock options granted in fiscal 2008,2010, fiscal 20072009 and fiscal 20062008 was $6.24, $4.08, and $3.62, respectively, based on the Black-Scholes option pricing model with the following weighted average assumptions:
| 2008 | 2007 | 2006 | |||||||
Assumptions used: | |||||||||
Dividend yield | 3.28 | % | 3.60 | % | 3.58 | % | |||
Expected volatility | 35.05 | % | 38.10 | % | 25.00 | % | |||
Risk-free interest rate | 3.96 | % | 5.00 | % | 4.38 | % | |||
Expected life (years) | 6.5 | 6.5 | 6.6 |
The calculated pre-tax stock-based compensation expense of $4,173,000 ($2,898,000 after-tax) for fiscal 2008 and $3,480,000 ($2,401,000 after-tax) for fiscal 2007, was recorded in selling, general and administrative expense.
In fiscal 2006, as allowed by SFAS 123, stock options were accounted for using the intrinsic-value method (i.e., the difference between the market price at exercise and the price paid by the employee to exercise the stock option). Under that method, no compensation expense was recognized on the grant date, since on that date the stock option exercise price equaled the market price of the underlying common shares. However, we complied with the disclosure-only provisions of SFAS 123. “Note A—Summary of Significant Accounting Policies” summarizes this information as disclosed in the prior year on a pro forma basis as if we had applied the fair value recognition provisions of SFAS 123.
| 2010 | 2009 | 2008 | |||||||
Assumptions used: | |||||||||
Dividend yield | 3.10 | % | 3.40 | % | 3.28 | % | |||
Expected volatility | 47.90 | % | 35.10 | % | 35.05 | % | |||
Risk-free interest rate | 2.90 | % | 3.50 | % | 3.96 | % | |||
Expected life (years) | 6.0 | 6.0 | 6.5 |
The following tables summarize our activities in respect of stock option plansoptions for the years ended May 31:
| 2008 | 2007 | 2006 | 2010 | 2009 | 2008 | |||||||||||||||||||||||||||||||
| In thousands, except per share | Stock Options | Weighted Average Price | Stock Options | Weighted Average Price | Stock Options | Weighted Average Price | ||||||||||||||||||||||||||||||
| (in thousands, except per share) | Stock Options | Weighted Average Price | Stock Options | Weighted Average Price | Stock Options | Weighted Average Price | ||||||||||||||||||||||||||||||
Outstanding, beginning of year | 5,241 | $ | 16.33 | 5,588 | $ | 16.09 | 5,803 | $ | 15.48 | 5,750 | $ | 18.16 | 5,958 | $ | 17.84 | 5,241 | $ | 16.33 | ||||||||||||||||||
Granted | 1,849 | 21.34 | 799 | 18.15 | 762 | 17.18 | 993 | 13.36 | 606 | 18.75 | 1,849 | 21.34 | ||||||||||||||||||||||||
Exercised | (840 | ) | 15.72 | (673 | ) | 14.87 | (773 | ) | 12.12 | (227 | ) | 12.75 | (318 | ) | 13.55 | (840 | ) | 15.72 | ||||||||||||||||||
Expired | (16 | ) | 18.61 | (174 | ) | 20.09 | (71 | ) | 19.76 | - | - | (200 | ) | 14.46 | (16 | ) | 18.61 | |||||||||||||||||||
Forfeited | (276 | ) | 18.99 | (299 | ) | 17.85 | (133 | ) | 17.32 | (344 | ) | 16.69 | (296 | ) | 20.08 | (276 | ) | 18.99 | ||||||||||||||||||
Outstanding, end of year | 5,958 | 17.84 | 5,241 | 16.33 | 5,588 | 16.09 | 6,172 | 17.67 | 5,750 | 18.16 | 5,958 | 17.84 | ||||||||||||||||||||||||
Exercisable at end of year | 2,714 | 15.37 | 2,680 | 14.81 | 2,702 | 14.33 | 3,631 | 17.79 | 3,185 | 16.83 | 2,714 | 15.37 | ||||||||||||||||||||||||
| Number of Stock Options (in thousands) | Weighted Average Remaining Contractual Life (in years) | Aggregate Intrinsic Value (in thousands) | ||||||||||||
May 31, 2010 | ||||||||||||||
Outstanding | 6,172 | 5.89 | $ | 2,671 | ||||||||||
Exercisable | 3,631 | 4.41 | 1,268 | |||||||||||
May 31, 2009 | ||||||||||||||
Outstanding | 5,750 | 6.10 | $ | 12,663 | ||||||||||
Exercisable | 3,185 | 4.63 | 10,551 | |||||||||||
| Number of Stock Options (in thousands) | Weighted Average Remaining Contractual Life (in years) | Aggregate Intrinsic Value (in thousands) | ||||||||||||
May 31, 2008 | ||||||||||||||
Outstanding | 5,958 | 6.47 | $ | 15,116 | 5,958 | 6.47 | $ | 15,116 | ||||||
Exercisable | 2,714 | 4.34 | 12,474 | 2,714 | 4.34 | 12,474 | ||||||||
May 31, 2007 | ||||||||||||||
Outstanding | 5,241 | 6.02 | 25,078 | |||||||||||
Exercisable | 2,680 | 4.52 | 16,907 | |||||||||||
May 31, 2006 | ||||||||||||||
Outstanding | 5,588 | 6.32 | 10,146 | |||||||||||
Exercisable | 2,702 | 4.63 | 8,891 | |||||||||||
During fiscal 2008,2010, the total intrinsic value of stock options exercised was $6,241,000.$786,000. The total amount of cash received from employees exercising stock options was $13,171,000$1,554,000 during fiscal 2008,2010, and the related net tax benefit realized from the exercise of these stock options was $2,035,000$165,000 during the same period.
The following table summarizes information about non-vested stock option awards for the year ended May 31, 2008:2010:
| Number of Stock Options (in thousands) | Weighted Average Grant Date Fair Value Per Share | Number of Stock Options (in thousands) | Weighted Average Grant Date Fair Value Per Share | |||||||||
Non-vested, beginning of year | 2,561 | $ | 4.28 | 2,565 | $ | 5.59 | ||||||
Granted | 1,849 | 6.24 | 993 | 4.85 | ||||||||
Vested | (874 | ) | 3.93 | (673 | ) | 5.91 | ||||||
Forfeited | (292 | ) | 4.73 | (344 | ) | 3.95 | ||||||
Non-vested, end of year | 3,244 | $ | 5.44 | 2,541 | $ | 5.47 | ||||||
Restricted Common Shares
The table below sets forth the restricted common shares we granted during each of the last three fiscal years ended May 31. The fair values of these restricted common shares were equal to the closing market prices of the underlying common shares at their respective grant dates. The calculated pre-tax stock-based compensation expense for these restricted common shares will be recognized on a straight-line basis over their respective vesting periods.
| 2010 | 2009 | 2008 | |||||||
Granted | 21,750 | 22,850 | 11,150 | ||||||
Weighted average grant date fair value, per share | $ | 13.90 | $ | 15.95 | $ | 22.95 | |||
Pre-tax stock-based compensation (in thousands) | $ | 302 | $ | 364 | $ | 256 | |||
The calculated pre-tax stock-based compensation expense for the stock option and restricted share awards above of $4,570,000 ($2,826,000 after-tax) for fiscal 2010, $5,767,000 ($3,777,000 after-tax) for fiscal 2009 and $4,173,000 ($2,898,000 after-tax) for fiscal 2008 was recorded in selling, general and administrative expense. At May 31, 2008,2010, the total unrecognized compensation cost related to non-vested non-qualified stock option awards was $12,853,000,$9,846,000, which will be expensed over the next five fiscal years.
Note G – Contingent Liabilities and Commitments
The Company has been involved in a dispute with a customer, Irwin Industrial Tool Company (d/b/a BernzOmatic), a subsidiary of Newell Rubbermaid, Inc. (“BernzOmatic”), relating to a three-year supply contract (the “Contract”) that took effect January 1, 2006, and which the Company terminated effective March 1, 2007. The dispute relates primarily to the Company’s early termination of the Contract as a result of certain actions of BernzOmatic which the Company believed breached the Contract, and the resulting price increases charged to BernzOmatic after such early termination. As required by U.S. GAAP, the Company deferred $9,304,000 of revenue relating to cash received for the price increases, which effectively created a reserve in that amount relating to this dispute.
The dispute was litigated in Federal District Court in Charlotte, North Carolina. On February 26, 2010, the jury awarded contract damages relating to the price increases and other items to BernzOmatic of approximately $13,002,000, which was $3,698,000 in excess of the revenue recognition reserve. The Company recorded this $3,698,000 pre-tax charge in net earnings, within selling, general and administrative expense, during fiscal 2010. The jury award has been stayed pending appeal.
In May 2010, the Company filed motions for judgment as a matter of law and for a new trial on certain matters. BernzOmatic also filed motions which included a request for pre-judgment interest of $1,828,000 and attorneys fees of $1,242,000 related to certain claims. The trial judge is expected to rule on these matters in September 2010. Based on the Company’s assessments of probability and estimates of related amounts involved in this matter, no adjustment to the $13,002,000 in related reserves has been recorded.
The Company believes that it has numerous grounds to appeal the jury’s verdict, and intends to pursue such an appeal unless its post-trial motions are favorably resolved by the trial court.
We are defendants in certain other legal actions. In the opinion of management, the outcome of these actions, which is not clearly determinable at the present time, would not significantly affect our consolidated financial position or future results of operations. We believe that environmental issues will not have a material effect on our capital expenditures, consolidated financial position or future results of operations.
To secure access to a facility used to regenerate acid used in certain steel processingSteel Processing locations, we have entered into unconditional purchase obligations with a third party under which three of our steel processingSteel Processing facilities deliver their spent acid for processing annually through the fiscal year ending May 31, 2019. In addition, we are required to pay for freight and utilities used in regenerating the spent acid. Total net payments to this third party were $5,359,000, $5,048,000,$4,270,000, $4,948,000, and $5,391,000$5,359,000 for fiscal 2008,2010, fiscal 20072009 and fiscal 2006,2008, respectively. The aggregate amount of required future payments at May 31, 2008, is2010, was as follows (in thousands):for the next five fiscal years and thereafter:
2009 | $ | 2,367 | ||||
2010 | 2,367 | |||||
| (in thousands) | ||||||
2011 | 2,367 | $ | 2,367 | |||
2012 | 2,367 | 2,367 | ||||
2013 | 2,367 | 2,367 | ||||
2014 | 2,367 | |||||
2015 | 2,367 | |||||
Thereafter | 14,202 | 9,468 | ||||
Total | $ | 26,037 | $ | 21,303 | ||
We may terminate the unconditional purchase obligations at any time by purchasing this facility. At May 31, 2008, the cost of this purchase option was not expected to exceed certain debt of the supplier related to the facility which was approximately $10,600,000.at its then fair market value.
Note H – Segment Data
During the fiscal quarter ended February 28, 2010, we made certain organizational changes that impacted the internal reporting and management structure of our previously reported Construction Services operating segment. This operating segment consisted of the Worthington Integrated Building Systems (“WIBS”) business unit, which included the Mid-Rise Construction, Military Construction and Commercial Stairs businesses. As a result of continued challenges facing those businesses, the interaction between those businesses and other operations within the Company and other industry factors, management responsibilities and internal reporting were re-aligned and separated for those entities within WIBS. Operational strategies have also been modified for these businesses in order to reduce redundancy and competition within the consolidated Company. While the composition of the Company’s reportable business segments is unchanged from this development (see description below), the level of aggregation within the Other category for segment reporting purposes is impacted, as are the identified reporting units used for testing of potential goodwill impairment. Subsequent to this change, and as of May 31, 2010, the Other category, for purposes of reporting segment financial information, continues to include Mid-Rise Construction, Military Construction and Commercial Stairs. However, those operating units are no longer combined together as the Construction Services operating segment, but are each separate and distinct operating segments, as well as separate reporting units.
During the fiscal quarter ended February 28, 2010, prior to the separation of those businesses formerly comprising the Construction Services operating segment and as a result of many of the same factors leading to that change, as described above, we again tested the value of the goodwill balances in the then Construction Services operating segment, after having tested the long-lived assets, including intangible assets with finite useful lives, for impairment. See “Note N – Goodwill and Other Long-Lived Assets” for additional details of that testing and the resulting impairments, which are included within the Other category in the tables below.
Our operations include three reportable business segments: Steel Processing, Pressure Cylinders and Metal Framing and Pressure Cylinders.Framing. Factors used to identify these reportable business segments include the products and services provided by each segment as well asbusiness, the management reporting structure, used.similarity of economic characteristics and certain quantitative measures, as prescribed by authoritative guidance. A discussion of each of the three operating segments that qualify as a reportable business segment is outlined below.
Steel Processing: The Steel Processing operating segment consists of the Worthington Steel business unit, and includes Precision Specialty Metals, Inc. (“PSM”)., a specialty stainless processor located in Los Angeles, California, and Spartan, a consolidated joint venture which operates a cold-rolled hot dipped galvanizing line. Worthington Steel is an intermediate processor of flat-rolled steel and stainless steel. This operating segment’s processing capabilities include pickling; slitting; cold reducing; hot-dipped galvanizing; hydrogen annealing; cutting-to-length; tension leveling; edging; non-metallic coating, including dry lubrication, acrylic and paint; and configured blanking; and stamping.blanking. Worthington Steel sells to customers principally in the automotive, construction, lawn and garden, hardware, furniture, office equipment, electrical control, tubing, leisure and recreation, appliance, agricultural, HVAC, container and aerospace markets.
Metal Framing: The Metal Framing segment consists of Worthington Steel also toll processes steel for steel mills, large end-users, service centers and other processors. Toll processing is different from typical steel processing in that the Dietrich Metal Framing business unit, which designsmill, end-user or other party retains title to the steel and produces metal framing components and systems and related accessorieshas the responsibility for selling the commercial and residential construction markets within the United States and Canada. Dietrich’s customers primarily consist of wholesale distributors, commercial and residential building contractors, and mass merchandisers.end product.
Pressure Cylinders: The Pressure Cylinders operating segment consists of the Worthington Cylinders business unit. Worthington Cylinders produces a diversified line of pressure cylinders, including low-pressure liquefied petroleum gas (“LPG”) and refrigerant gas cylinders; high-pressure and industrial/specialty gas cylinders; airbrake tanks; and certain consumer products. The LPG cylinders are sold to manufacturers, distributors and mass merchandisers and are used to hold fuel for gas barbecue grills, recreational vehicle equipment, residential and light commercial heating systems, industrial forklifts, hand held torches and propane-fueled camping equipment and commercial/residential cooking (the latter, generally outside North America).equipment. Refrigerant gas cylinders are sold primarily to major refrigerant gas producers and distributors and are used to hold refrigerant gases for commercial, residential and automotive air conditioning and refrigeration systems. High-pressure and industrial/specialty gas cylinders are sold primarily to gas producers and distributors as containers for gases used in the following: cutting and welding metals; breathing (medical, diving and firefighting); semiconductor production; beverage delivery; and compressed natural gas systems. Worthington Cylinders also produces recovery tanks for refrigerant gases, air reservoirs for truck and trailer original equipment manufacturers and non-refillable cylinders for “Balloon Time®” helium kits.kits, which include non-refillable cylinders.
Metal Framing: The Metal Framing operating segment consists of the Dietrich Metal Framing business unit, which designs and produces metal framing components and systems and related accessories for the commercial and residential construction markets within the United States. Dietrich’s customers primarily consist of wholesale distributors, commercial and residential building contractors and mass merchandisers.
Other: Included in the Other category are operating segments that do not fit intomeet the reportable segments,applicable aggregation criteria and are immaterialmateriality tests for purposes of separate disclosure andas reportable business segments, as well as other corporate relatedcorporate-related entities. These operating segments are: Automotive Body Panels, Steel Packaging, Mid-Rise Construction, ServicesMilitary Construction and Steel Packaging.Commercial Stairs. Each of these operating segments is explained in more detail below.
Automotive Body Panels: This operating segment consists of the Gerstenslager business unit which provides services including stamping, blanking, assembly, painting, packaging, die management, warehousing, distribution management and other services to customers primarily in the automotive industry.
Construction Services: This segment consists of Worthington Integrated Building Systems, LLC, which includes Worthington Mid-Rise Construction, Inc., which designs and builds mid-rise light-gauge steel framed commercial structures and multi-family housing units; Worthington Military Construction, Inc., which is involved in the supply and construction of metal framing products for, and in the framing of, single family housing, with a focus on military; and a 36 unit mid-rise light-gauge steel framed apartment project in China entered into primarily for research and development purposes.
Steel Packaging: This operating segment consists of Worthington Steelpac Systems, LLC (“Steelpac”), which designs and manufactures reusable custom platforms, racks and pallets made of steel for supporting, protecting and handling products throughout the shipping process for customers in industries such as automotive, lawn and garden and recreational vehicles.
Mid-Rise Construction: This operating segment consists of Worthington Mid-Rise Construction, Inc., which designs, supplies and builds mid-rise light-gauge steel framed commercial structures and multi-family housing units.
Military Construction: This operating segment consists of Worthington Military Construction, Inc., which is involved in the supply and construction of metal framing products for, and in the framing of, single family housing, with a focus on military housing.
Commercial Stairs: This operating segment consists of Worthington Stairs, LLC, a manufacturer of pre-engineered steel egress stair solutions.
The accounting policies of the reportable business segments and other operating segments are described in “Note A – Summary of Significant Accounting Policies.” We evaluate operating segment performance based on operating income.income (loss). Inter-segment sales are not material.
Summarized financial information for our reportable business segments as of, and for the indicated years ended May 31, is shown in the following table.
| In thousands | 2008 | 2007 | 2006 | |||||||||||||||||||||
| (in thousands) | 2010 | 2009 | 2008 | |||||||||||||||||||||
Net sales | ||||||||||||||||||||||||
Steel Processing | $ | 1,463,202 | $ | 1,460,665 | $ | 1,486,165 | $ | 988,950 | $ | 1,183,013 | $ | 1,463,202 | ||||||||||||
Pressure Cylinders | 467,572 | 537,373 | 578,808 | |||||||||||||||||||||
Metal Framing | 788,788 | 771,406 | 796,272 | 330,578 | 661,024 | 788,788 | ||||||||||||||||||
Pressure Cylinders | 578,808 | 544,826 | 461,875 | |||||||||||||||||||||
Other | 236,363 | 194,911 | 152,867 | 155,934 | 249,857 | 236,363 | ||||||||||||||||||
Total | $ | 3,067,161 | $ | 2,971,808 | $ | 2,897,179 | $ | 1,943,034 | $ | 2,631,267 | $ | 3,067,161 | ||||||||||||
Operating income (loss) | ||||||||||||||||||||||||
Steel Processing | $ | 55,799 | $ | 55,382 | $ | 61,765 | $ | 51,353 | $ | (68,149 | ) | $ | 55,799 | |||||||||||
Pressure Cylinders | 30,056 | 61,175 | 70,004 | |||||||||||||||||||||
Metal Framing | (16,215 | ) | (9,159 | ) | 46,735 | (10,186 | ) | (142,598 | ) | (16,215 | ) | |||||||||||||
Pressure Cylinders | 70,004 | 84,649 | 49,275 | |||||||||||||||||||||
Other | (3,554 | ) | (1,727 | ) | (171 | ) | (49,260 | ) | (25,724 | ) | (3,554 | ) | ||||||||||||
Total | $ | 106,034 | $ | 129,145 | $ | 157,604 | $ | 21,963 | $ | (175,296 | ) | $ | 106,034 | |||||||||||
Depreciation and amortization | ||||||||||||||||||||||||
Steel Processing | $ | 26,779 | $ | 25,662 | $ | 22,898 | $ | 26,290 | $ | 25,944 | $ | 26,779 | ||||||||||||
Pressure Cylinders | 12,936 | 10,680 | 10,454 | |||||||||||||||||||||
Metal Framing | 16,907 | 16,628 | 16,231 | 14,591 | 15,683 | 16,907 | ||||||||||||||||||
Other | 10,836 | 11,766 | 9,273 | |||||||||||||||||||||
Total | $ | 64,653 | $ | 64,073 | $ | 63,413 | ||||||||||||||||||
Pre-tax impairment of long-lived assets and restructuring and other expense (income) | ||||||||||||||||||||||||
Steel Processing | $ | (488 | ) | $ | 3,917 | $ | 1,096 | |||||||||||||||||
Pressure Cylinders | 10,454 | 9,858 | 10,853 | 309 | 1,045 | 103 | ||||||||||||||||||
Metal Framing | 3,892 | 110,536 | 8,979 | |||||||||||||||||||||
Other | 9,273 | 9,321 | 9,134 | 35,939 | 24,486 | 7,933 | ||||||||||||||||||
Total | $ | 63,413 | $ | 61,469 | $ | 59,116 | $ | 39,652 | $ | 139,984 | $ | 18,111 | ||||||||||||
Total assets | ||||||||||||||||||||||||
Steel Processing | $ | 942,885 | $ | 815,070 | $ | 812,024 | $ | 674,953 | $ | 469,701 | $ | 942,885 | ||||||||||||
Pressure Cylinders | 393,639 | 355,717 | 437,159 | |||||||||||||||||||||
Metal Framing | 527,446 | 476,100 | 498,409 | 203,072 | 226,285 | 527,446 | ||||||||||||||||||
Pressure Cylinders | 437,159 | 357,696 | 277,300 | |||||||||||||||||||||
Other | 80,541 | 165,316 | 312,664 | 248,683 | 312,126 | 80,541 | ||||||||||||||||||
Total | $ | 1,988,031 | $ | 1,814,182 | $ | 1,900,397 | $ | 1,520,347 | $ | 1,363,829 | $ | 1,988,031 | ||||||||||||
Capital expenditures | ||||||||||||||||||||||||
Steel Processing | $ | 7,157 | $ | 14,030 | $ | 14,303 | $ | 5,910 | $ | 24,975 | $ | 7,157 | ||||||||||||
Pressure Cylinders | 19,425 | 26,618 | 16,540 | |||||||||||||||||||||
Metal Framing | 6,770 | 15,657 | 19,700 | 2,614 | 4,467 | 6,770 | ||||||||||||||||||
Pressure Cylinders | 16,540 | 14,068 | 7,916 | |||||||||||||||||||||
Other | 17,053 | 13,936 | 18,209 | 6,370 | 8,094 | 17,053 | ||||||||||||||||||
Total | $ | 47,520 | $ | 57,691 | $ | 60,128 | $ | 34,319 | $ | 64,154 | $ | 47,520 | ||||||||||||
Net sales by geographic region for the years ended May 31 are shown in the following table:
| In thousands | 2008 | 2007 | 2006 | ||||||||||||||||||
| (in thousands) | 2010 | 2009 | 2008 | ||||||||||||||||||
United States | $ | 2,786,679 | $ | 2,719,240 | $ | 2,714,813 | $ | 1,832,286 | $ | 2,395,430 | $ | 2,786,679 | |||||||||
Canada | 74,623 | 60,340 | 44,288 | 39,751 | 66,467 | 74,623 | |||||||||||||||
Europe | 205,859 | 192,228 | 138,078 | 70,997 | 169,370 | 205,859 | |||||||||||||||
Total | $ | 3,067,161 | $ | 2,971,808 | $ | 2,897,179 | $ | 1,943,034 | $ | 2,631,267 | $ | 3,067,161 | |||||||||
Net fixed assetsProperty, plant and equipment, net, by geographic region as of May 31 areis shown in the following table:
| In thousands | 2008 | 2007 | 2006 | |||||||||
United States | $ | 505,988 | $ | 528,181 | $ | 513,915 | ||||||
Canada | 8,025 | 8,995 | 8,713 | |||||||||
Europe | 35,931 | 27,089 | 24,276 | |||||||||
Total | $ | 549,944 | $ | 564,265 | $ | 546,904 | ||||||
United States Canada Europe Total(in thousands) 2010 2009 2008 $ 459,174 $ 472,078 $ 505,988 1,055 2,567 8,025 45,934 46,860 35,931 $ 506,163 $ 521,505 $ 549,944
Note I – Related Party Transactions
We purchase from, and sell to, affiliated companies certain raw materials and services at prevailing market prices. Net sales to affiliated companies for fiscal 2008,2010, fiscal 20072009 and fiscal 20062008 totaled $9,336,000, $18,550,000, and $25,962,000, $34,915,000, and $30,503,000.respectively. Purchases from affiliated companies for fiscal 2008,2010, fiscal 20072009 and fiscal 20062008 totaled $4,701,000, $2,799,000, and $10,680,000, $6,394,000, and $9,063,000.respectively. Accounts receivable from affiliated companies were $5,107,000$4,377,000, and $2,019,000$3,301,000 at May 31, 20082010 and 2007.2009, respectively. Accounts payable to affiliated companies were $136,000$3,048,000 and $1,349,000$155,000 at May 31, 20082010 and 2007.2009, respectively.
Note J – Investments in Unconsolidated Affiliates
Our investments in affiliated companies whichthat are not controlled, either through majority ownership or otherwise, are accounted for using the equity method.method of accounting. At May 31, 2008,2010, these equity investments and the percentage interestinterests owned consisted of: WAVEDMFCWBS, LLC (the “Clark JV”) (50%), TWB (45%),LEFCO Worthington, Specialty Processing (50%), Aegis Metal Framing, LLC (60%), Viking & Worthington Steel Enterprise, LLC (49%), Accelerated Building Technologies, LLC (50%Samuel Steel Pickling Company (31%), Serviacero Planos, S.A. de C.V. (50%), TWB Company, L.L.C. (45%), Worthington Armstrong Venture (“WAVE”) (50%) and Worthington Specialty Processing (“WSP”) (51%). WSP is considered to be jointly controlled and not consolidated due to substantive participating rights of the minority partner.
As further discussed in “Note P – Acquisitions,” Worthington acquired certain assets from Gibraltar Industries, Inc. and its subsidiaries (collectively, “Gibraltar”) on February 1, 2010. Included in the assets acquired was a 31.25% partnership interest in Samuel Steel Pickling Company, a joint venture which operates a steel pickling facility in Twinsburg, Ohio, and one in Cleveland, Ohio. The joint venture is accounted for using the equity method of accounting, as the Company does not have a controlling financial interest in the joint venture.
On August 12, 2009, we joined with ClarkWestern Building Systems, Inc., to create the Clark JV. We contributed certain intangible assets and committed to pay a portion of certain costs and expenses in return for 50% of the equity units and voting power of the joint venture. The purpose of the Clark JV is to develop, test and obtain approvals for metal framing stud designs, as well as to develop, own and license intellectual property related to such designs. The Clark JV does not manufacture or sell any products, but will license its designs to its members and possibly to third parties. The Clark JV is accounted for using the equity method of accounting, as both parties have equal voting rights and control.
During May 2009, we sold our 50% equity interest in Accelerated Building Technologies, LLC to NOVA Chemicals Corporation, the other member of the joint venture. The sales price and loss on the transaction were immaterial.
During January 2009, we sold our 60% equity interest in Aegis Metal Framing, LLC for approximately $24,000,000 to MiTek Industries, Inc., the other member of the joint venture. This resulted in a gain of $8,331,000.
During October 2008, we sold our 49% equity interest in Canessa Worthington Slovakia s.r.o. (49%for approximately $3,700,000 to the Magnetto Group, the other member of the joint venture. The gain on the transaction was immaterial.
On October 1, 2008, we expanded and modified WSP, our joint venture with United States Steel Corporation (“U.S. Steel”). U.S. Steel contributed ProCoil Company, L.L.C., its steel processing facility in Canton, Michigan, and LEFCOwe contributed $2,500,000 of cash and Worthington Steel Taylor, our steel processing subsidiary in Taylor, Michigan, which had a book value of $13,851,000.
On June 2, 2008, we made an additional capital contribution of $392,000 to Viking & Worthington Steel Enterprise, LLC (49%(“VWSE”). The other member in the joint venture did not make its contribution as required by the operating agreement. As a result, we now own 100% of VWSE, which has been fully consolidated in our financial statements since the beginning of fiscal 2009. VWSE has closed its manufacturing operations and its business is being handled by the consolidated operations of the Steel Processing operating segment.
On March 1, 2008, our TWB joint venture TWB acquired ThyssenKrupp Tailored Blanks S.A. de C.V., the Mexican laser welding subsidiary of ThyssenKrupp Steel North America, Inc. (“ThyssenKrupp”), to expand TWB’s presence in Mexico. The acquisition was made through a contribution of capital by ThyssenKrupp, and as a result, ThyssenKrupp owns 55% of TWB and Worthington owns 45%. This resulted in a dilution gain of $1,944,000 (net of taxes of $1,031,000) and was recorded as additional paid-in capital.
On October 25, 2007, we acquired a 49% interest in crate and pallet maker LEFCO Industries, LLC, a minority business enterprise. The resulting joint venture, called LEFCO Worthington, LLC, will manufacturesoffers engineered wooden crates, specialty pallets and steel rack systems for the automotive and trucking industries, in addition to continuing LEFCO’s existing products.
On September 25, 2007, a steel processing joint venture was formed with The Magnetto Group to construct and operate a Class One steel processing facility in Slovakia. Our investment in the joint venture was $4,254,000. This 49%-owned joint venture is known as Canessa Worthington Slovakia s.r.o. and services customers throughout central Europe.variety of industries.
On September 17, 2007, Worthington acquired a 50% interest in Serviacero Planos inof central Mexico. This joint venture is known as Serviacero Planos, S.A de C.V. The purchase price of the investment was $41,767,000. The investment exceeded the book value of the underlying equity in net assets by $22,258,000. Of this excess amount, $12,828,000 was allocated based on the fair value of those underlying net assets and will be amortized to equity in net income of unconsolidated affiliates over the remaining useful lives of those assets, with the remainder of $9,430,000 allocated to goodwill.
We received distributions from unconsolidated affiliates totaling $58,920,000, $131,723,000$52,970,000, $80,580,000 and $57,040,000$58,920,000 in fiscal 2008,2010, fiscal 20072009 and fiscal 2006,2008, respectively. We have received cumulative distributions from WAVE in excess of our investment balance, which resulted in an amount within other liabilities on the consolidated balance sheets of $18,385,000 and $18,240,000 at May 31, 2010 and 2009, respectively. The accounting treatment of excess distributions for a general partnership is to reclassify the negative balance to the liability section of the balance sheet, which was done during fiscal 2010 and fiscal 2009. This liability is included in other liabilities on the consolidated balance sheets at May 31, 2010 and 2009. We will continue to record equity in net income from WAVE as a debit to the investment account, and when it becomes positive, it will again be shown as an asset on the consolidated balance sheets. If it becomes obvious that any excess distribution may not be returned (upon joint venture liquidation or for other reasons), we will record any balance in the liability as immediate income or gain.
FinancialWe use the “cumulative earnings” approach for determining cash flow presentation of distributions from our unconsolidated joint ventures. Distributions received on the investments are included in our consolidated statements of cash flows in operating activities, unless the cumulative distributions exceed our portion of cumulative equity in earnings of the joint venture, in which case the excess distributions are deemed to be returns of the investment and included in our consolidated statements of cash flows as an investing cash flow. During fiscal 2010 and fiscal 2009, the Company received distributions from an unconsolidated joint venture in excess of the Company’s cumulative equity in the earnings of that joint venture. These cash flows of $375,000 and $23,500,000, respectively, were included in investing activities in the consolidated statements of cash flows due to the nature of the distributions as returns of investment, rather than returns on investment.
Combined financial information for affiliated companies accounted for using the equity method as of, and for the years ended, May 31, was as follows:
| In thousands | 2008 | 2007 | 2006 | |||||||||||||||
| (in thousands) | 2010 | 2009 | 2008 | |||||||||||||||
Cash | $ | 79,538 | $ | 64,190 | $ | 93,877 | $ | 75,762 | $ | 72,103 | $ | 79,538 | ||||||
Other current assets | 225,469 | 154,797 | 163,718 | 199,288 | 165,615 | 225,469 | ||||||||||||
Noncurrent assets | 194,169 | 102,261 | 109,841 | 170,787 | 167,779 | 194,169 | ||||||||||||
Current maturities of long-term debt | $ | - | $ | 3,158 | $ | 3,158 | ||||||||||||
Other current liabilities | 124,258 | 78,281 | 81,176 | |||||||||||||||
Total assets | $ | 445,837 | $ | 405,497 | $ | 499,176 | ||||||||||||
Current liabilities | $ | 85,514 | $ | 57,995 | $ | 124,258 | ||||||||||||
Long-term debt | 101,411 | 124,214 | 37,813 | 150,212 | 150,596 | 101,411 | ||||||||||||
Other noncurrent liabilities | 34,394 | 7,228 | 6,049 | 10,244 | 24,373 | 34,394 | ||||||||||||
Equity | 199,867 | 172,533 | 239,113 | |||||||||||||||
Total liabilities and equity | $ | 445,837 | $ | 405,497 | $ | 499,176 | ||||||||||||
Net sales | $ | 745,437 | $ | 652,178 | $ | 810,271 | $ | 708,779 | $ | 719,635 | $ | 745,437 | ||||||
Gross margin | 206,927 | 183,603 | 188,109 | 189,622 | 175,832 | 206,927 | ||||||||||||
Depreciation and amortization | 13,056 | 14,164 | 18,479 | 10,690 | 14,044 | 13,056 | ||||||||||||
Interest expense | 7,575 | 3,701 | 3,346 | 1,482 | 3,708 | 7,575 | ||||||||||||
Income tax expense | 8,974 | 6,674 | 18,318 | 5,625 | 7,101 | 8,974 | ||||||||||||
Net earnings | 134,925 | 124,456 | 108,672 | 127,837 | 102,071 | 134,925 | ||||||||||||
Our shareAt May 31, 2010, $17,386,000 of the Company’s consolidated retained earnings represented undistributed earnings, net of tax, of our unconsolidated affiliates was $7,350,000 at May 31, 2008.affiliates.
On June 2, 2008, Worthington made an additional capital contribution of $392,000 to Viking & Worthington Steel Enterprise, LLC. The other member in the joint venture did not make its contribution as required by the operating agreement. As a result, Worthington became the majority owner of the joint venture, and the joint venture will be consolidated in Worthington’s financial statements starting in fiscal 2009.
Note K – Earnings (Loss) Per Share
The following table sets forth the computation of basic and diluted earnings (loss) per share for the years ended May 31:
| In thousands, except per share | 2008 | 2007 | 2006 | ||||||
Numerator (basic & diluted): | |||||||||
Net earnings – income available to common shareholders | $ | 107,077 | $ | 113,905 | $ | 145,990 | |||
Denominator: | |||||||||
Denominator for basic earnings per share – weighted average shares | 81,232 | 86,351 | 88,288 | ||||||
Effect of dilutive securities | 666 | 651 | 688 | ||||||
Denominator for diluted earnings per share – adjusted weighted average shares | 81,898 | 87,002 | 88,976 | ||||||
Earnings per share – basic | $ | 1.32 | $ | 1.32 | $ | 1.65 | |||
Earnings per share – diluted | 1.31 | 1.31 | 1.64 | ||||||
| (in thousands, except per share) | 2010 | 2009 | 2008 | |||||||
Numerator (basic & diluted): | ||||||||||
Net earnings (loss) attributable to controlling interest – income (loss) available to common shareholders | $ | 45,241 | $ | (108,214 | ) | $ | 107,077 | |||
Denominator: | ||||||||||
Denominator for basic earnings (loss) per share attributable to controlling interest – weighted average common shares | 79,127 | 78,903 | 81,232 | |||||||
Effect of dilutive securities | 16 | - | 666 | |||||||
Denominator for diluted earnings (loss) per share attributable to controlling interest – adjusted weighted average common shares | 79,143 | 78,903 | 81,898 | |||||||
Basic earnings (loss) per share attributable to controlling interest | $ | 0.57 | $ | (1.37 | ) | $ | 1.32 | |||
Diluted earnings (loss) per share attributable to controlling interest | 0.57 | (1.37 | ) | 1.31 | ||||||
Stock options covering 1,346,625, 1,818,813,5,820,514, 5,979,781 and 2,137,7981,346,625 common shares for fiscal 2008,2010, fiscal 20072009 and fiscal 20062008, respectively, have been excluded from the computation of diluted earnings per share because the effect would have been anti-dilutive for those periods.
Note L – Operating Leases
We lease certain property and equipment from third parties under non-cancelable operating lease agreements. Rent expense under operating leases was $14,188,000, $13,926,000$16,681,000, $15,467,000 and $12,637,000$14,188,000 in fiscal 2008,2010, fiscal 20072009 and fiscal 2006.2008, respectively. Future minimum lease payments for non-cancelable operating leases having an initial or remaining term in excess of one year at May 31, 2008, are2010, were as follows:
| In thousands | ||||||
2009 | $ | 10,753 | ||||
2010 | 9,804 | |||||
| (in thousands) | ||||||
2011 | 8,016 | $ | 10,662 | |||
2012 | 6,349 | 8,727 | ||||
2013 | 6,022 | 7,368 | ||||
2014 | 4,628 | |||||
2015 | 3,240 | |||||
Thereafter | 6,903 | 5,042 | ||||
Total | $ | 47,847 | $ | 39,667 | ||
Note M – Sale of Accounts ReceivableRestructuring
We maintain a $100,000,000 revolving trade accounts receivable securitization facility which expires in January 2011. Pursuant to the terms of the facility, certain of our subsidiaries sell their accounts receivable, on a revolving basis, to Worthington Receivables Corporation (“WRC”), a wholly-owned, consolidated, bankruptcy-remote subsidiary. In turn, WRC may sell, on a revolving basis, up to $100,000,000 of undivided ownership interests in this pool of accounts receivable to independent third parties. We retain an undivided interest in this pool and are subject to risk of loss based on the collectability of the receivables from this retained interest. Because the amount eligible to be sold excludes receivables more than 90 days past due, receivables offset by an allowance for doubtful accounts because of bankruptcy or other cause, receivables from foreign customers, concentrations over limits with specific customers and certain reserve amounts, we believe additional risk of loss is minimal. Facility fees of $341,000, $580,000, and $103,000 were incurred during fiscal 2008, fiscal 2007 and fiscal 2006, and were recorded as miscellaneous expense. The book value of the retained portion of the pool of accounts receivable approximates fair value. We continue to service the accounts receivable. No servicing asset or liability has been recognized, as our cost to service the accounts receivable is expected to approximate the servicing income.
As of May 31, 2008, $100,000,000 of undivided ownership interests in this pool of accounts receivable had been sold. The proceeds from the sale are reflected as a reduction of accounts receivable on the consolidated balance sheets and in net cash provided by operating activities in the consolidated statements of cash flows.
Note N – Restructuring Charges
During fiscal 2008, the Companywe initiated a transformational effortTransformation Plan (the “Transformation Plan”) with the overall goal of improvingto improve the Company’s sustainable earnings potential, asset utilization and operational and financial performance of the Company. As part of the Transformation Plan, we reviewed our businesses and established clear profitability goals and objectives for each of them. These goals and objectives include initiatives to reduce our cost structure through a combination of facility closures, productivity improvements and headcount reductions.performance. The Transformation Plan also includes searching for new growth opportunities, increasing efficiencies at productionfocuses on cost reduction, margin expansion and administrative offices,organizational capability improvements and, improvingin the management of ourprocess, seeks to drive excellence in three core competencies: sales; operations; and supply chain. Thischain management. The Transformation Plan will continue into fiscal 2009.is comprehensive in scope and includes aggressive diagnostic and implementation phases in the Steel Processing and Metal Framing segments. As a result of the
Under the
Transformation Plan a total of $18,111,000 wasand its related efforts, we have incurred in fiscal 2008,certain asset impairments which have been included within restructuring and has been recorded as restructuring chargesother expense in the consolidated statements of earnings. The detailsAsset impairment charges which are not a result of these charges are explainedefforts have been included within impairment of long-lived assets in more detail below.
To date, the following have taken place:
During the first quarter of fiscal 2008, an initial headcount reduction plan was put into place, utilizing a combination of voluntary retirement and severance packages. A total of 63 individuals, across the Company, were impacted.
On September 25, 2007, we announced the closure or downsizing of five locations in our Metal Framing segment was announced. The affected facilities were:segment. These actions were completed as of May 31, 2008 and included headcount reductions of approximately 165.
During the closurefirst quarter of East Chicago, Indiana; Rock Hill, South Carolina; Goodyear, Arizona; and Wildwood, Florida; and the downsizing of operations in Montreal, Canada. In addition, it was announced thatfiscal 2009, the Metal Framing corporate offices will bewere moved from Pittsburgh and Blairsville, Pennsylvania, to Columbus, Ohio. AsHeadcount was reduced by 33.
On October 23, 2008, we announced the closure of two facilities, one Steel Processing (Louisville, Kentucky) and one Metal Framing (Renton, Washington), as well as headcount reductions of 282. The Louisville facility was closed on February 28, 2009, and the Renton facility closed on December 31, 2008. During the second quarter of fiscal 2010, the remaining assets of the Louisville facility were sold, resulting in a gain of $1,003,000. That gain has been classified within restructuring and other expense in the consolidated statements of earnings, and is included in the gain on dispositions of $4,336,000 noted in the table below.
On December 5, 2008, we announced the closure and/or suspension of operations at three Metal Framing facilities and headcount reductions in Steel Processing of 186. The Lunenburg, Massachusetts, facility closed and operations were suspended in Miami, Florida, and Phoenix, Arizona, on February 28, 2009. The associated headcount impact for Metal Framing was a reduction of 125.
The decision was made during the first quarter of fiscal 2010 to close the Joliet, Illinois, Metal Framing facility. A majority of the roll forming operation located at that facility was moved to the Hammond, Indiana, facility during the third quarter of fiscal 2010. Approximately $1,717,000 of impairment was recognized during fiscal 2010 related to this closure.
During the third quarter of fiscal 2010, additional headcount reductions took place across locations within the Metal Framing, Military Construction and Mid-Rise Construction operating segments. A total of 113 individuals were impacted.
In February 2010, the Rock Hill, South Carolina, Steel Processing facility met the held for sale classification criteria under applicable accounting guidance. The $1,165,000 carrying value of that facility, which was determined to be below fair value, was included within assets held for sale in the consolidated balance sheet as of May 31, 2008,2010.
In May 2010, certain of the closure and downsizing process is complete, exceptBuffalo, New York, Steel Processing equipment met the held for sale classification criteria under applicable accounting guidance. After an immaterial adjustment to fair value, the corporate offices, which will occur$1,315,000 carrying value of that equipment was included within assets held for sale in fiscal 2009. The Rock Hill facility will continue to operatethe consolidated balance sheet as a steel processing operation and produce product for one of our joint ventures. Annual net sales generated by the closed operations totaled approximately $125,000,000, the majority of which are expected to be absorbed into nearby Metal Framing locations. As a result of this initiative, we expect to record $12,700,000 in restructuring charges including: $5,100,000 representing severance, benefits and personnel-related costs for approximately 165 employees; $2,400,000 representing lease termination and facility-related costs; and $5,200,000 for accelerated depreciation on assets to be disposed of as the facilities close. As of May 31, 2008, $8,097,000 of these costs had been recognized with the remainder of $4,603,0002010.
We retained a consulting firm to occur during the first half of fiscal 2009.
Through a combination of voluntary retirement and severance packages, we reduced our headcount by an additional 63 employees. As of May 31, 2008, $4,362,000 of these costs had been recognized in restructuring charges.
To assist in the development and implementation of the Transformation Plan, we retained a major consultingPlan. The services provided by this firm included assistance through diagnostic tools, performance improvement technologies, project management techniques, benchmarking information and incurred $6,013,000 in professionalinsights that directly related to the Transformation Plan. Accordingly, the firm’s fees which have been recordedwere included in restructuring charges forcharges. Those services began at the onset of the Transformation Plan and concluded in fiscal 2008.2009.
We continued to execute our Transformation Plan through fiscal 2010. In our Steel Processing operating segment, we have completed the diagnostic and implementation phases at each of our core facilities. Additionally, we have initiated the diagnostic process at our west coast stainless steel operation and our newly acquired facility in Cleveland, as well as in our Mexican joint venture, Serviacero. We anticipate that we will have substantially completed the Transformation Plan process at these facilities and one additional Steel Processing facility by December 31, 2010. In our Metal Framing operating segment, we have substantially completed the Transformation Plan process at eight facilities and anticipate completing the process at four additional facilities by December 31, 2010. We expect to incur an additional $13,400,000 through fiscal 2009.
In additionrestructuring charges relating to the aboveTransformation Plan as we progress through the remaining Metal Framing and Steel Processing facilities, although these charges should decline over the coming quarters. Recent charges have been, and future charges are expected to be, largely comprised of continued severance, retirement and internal transformation team expense, as well as non-cash impairment losses and accelerated depreciation expense for impacted assets. The need for other restructuring charges will depend largely on recommendations developed from the Transformation Plan.
As of May 31, 2010, a credittotal of $361,000$65,395,000 related to the adjustmentTransformation Plan had been recorded as restructuring and other expense in the consolidated statements of a prior year restructuring liability was recorded to restructuring charges duringearnings, as follows: $4,243,000 in fiscal 2010; $43,041,000 in fiscal 2009; and $18,111,000 in fiscal 2008. TheA progression of the liabilities created as part of the Transformation Plan, combined with a reconciliation to the restructuring chargesand other expense line item in our consolidated statement of earnings for fiscal 2008 are2010, is summarized as follows:
| In thousands | Beginning Liability | Expense | Payments | Adjustments | Ending Liability | |||||||||||
Early retirement and severance | $ | - | $ | 6,221 | $ | (5,078 | ) | $ | - | $ | 1,143 | |||||
Other costs | 535 | 6,721 | (5,616 | ) | 70 | 1,710 | ||||||||||
| $ | 535 | 12,942 | $ | (10,694 | ) | $ | 70 | $ | 2,853 | |||||||
Non-cash charges | 5,169 | |||||||||||||||
Total | $ | 18,111 | ||||||||||||||
| (in thousands) | 5/31/2009 Liability | Expense | Payments | Adjustments | 5/31/2010 Liability | |||||||||||||
Early retirement and severance | $ | 3,201 | $ | 3,948 | $ | (6,223 | ) | $ | (33 | ) | $ | 893 | ||||||
Professional fees and other costs | 999 | 3,160 | (3,599 | ) | - | 560 | ||||||||||||
| $ | 4,200 | 7,108 | $ | (9,822 | ) | $ | (33 | ) | $ | 1,453 | ||||||||
Non-cash charges | 3,408 | |||||||||||||||||
Net gain on dispositions | (4,336 | ) | ||||||||||||||||
Other | (1,937 | ) | ||||||||||||||||
Restructuring and other expense | $ | 4,243 | ||||||||||||||||
Cash expendituresThe non-cash charges of $10,694,000, associated with implementing$3,408,000, above, represent accelerated depreciation expense for assets determined to be impaired as a result of the efforts of the Transformation Plan, were paid during fiscal 2008, with the remainderbut which continue to be paidheld and used.
The $4,336,000 net gain on dispositions above includes the previously noted gain from the sale of remaining assets of the Louisville facility, immaterial losses from other above-noted facilities and a gain of $3,773,000 on the sale of our Metal Framing operations in Canada. The sale of our Metal Framing operations in Canada included two manufacturing facilities located in Burnaby, British Columbia, and Mississauga, Ontario, and two sales and distribution centers located in LaSalle, Quebec, and Edmonton, Alberta. Because the sale did not meet the criteria for classification as discontinued operations, the resulting gain has been included within operating income in the Company’s consolidated statements of earnings.
The other line item above represents the $1,937,000 reversal of a reserve that was established during the sale and related impairment of the steel processing facility in Decatur, Alabama, during the fourth quarter of the fiscal 2009.year ended May 31, 2004. Certain cash payments associated with lease terminations may be paid overconditions anticipated when the reserve was established did not materialize, and a portion of the reserve was therefore reversed. The remaining lease terms.reserve for this matter is not material.
Note ON – Goodwill and Other IntangiblesLong-Lived Assets
We usereview the purchase methodcarrying value of accounting for any business combinations initiated after June 30, 2002, and recognize amortizableour long-lived assets, including intangible assets separately from goodwill. Under SFAS No. 142,Goodwillwith finite useful lives, whenever events or changes in circumstances indicate that the carrying value of an asset or a group of assets may not be recoverable. When a potential impairment is indicated, accounting standards require a charge to be recognized in the consolidated financial statements if the carrying amount of an asset or group of assets exceeds the fair value of that asset or group of assets. The loss recognized would be the difference between the fair value and Other Intangible Assets, goodwillthe carrying amount of the asset or group of assets.
Due to continued deterioration in business and indefinite-livedmarket conditions during fiscal 2009, we determined that certain indicators of impairment were present. Therefore, long-lived assets, including intangible assets are no longer amortized but are reviewedwith finite useful lives, were tested for impairment. The annual impairment test was performed during the fourth quarter of fiscal 2009. Recoverability of the identified asset groups was tested using future cash flow projections based on management’s long range estimates of market conditions. The sum of the undiscounted future cash flows related to each asset group was more than the net book value for each of the asset groups; therefore, no impairment loss was indicated at May 31, 2009.
Due to continued deterioration in business and market conditions impacting the Steel Packaging operating segment during the second quarter of fiscal 2010, we determined that certain indicators of potential impairment were present for certain long-lived assets. Therefore, those long-lived assets were tested for impairment during the fiscal quarter ended November 30, 2009. Recoverability of the identified asset groups was tested using future cash flow projections based on management’s long range estimates of market conditions. The sum of the undiscounted future cash flows related to the Steel Packaging asset group was less than the net book value for the asset group. Therefore, an impairment loss was recognized in the amount of $2,703,000. The impairment loss was recorded within impairment of long-lived assets in our consolidated statement of earnings, and was based on the excess of the assets’ carrying amounts over their respective fair values at November 30, 2009. Refer to “Note R – Fair Value” for information regarding the determination of fair value for these assets.
Due to continued deterioration in business and market conditions impacting our Metal Framing operating segment and the then Construction Services operating segment during the first and second quarters of fiscal 20082010, we determined that certain indicators of potential impairment were present for long-lived assets. Therefore, long-lived assets, including intangible assets with finite useful lives, were tested for impairment during the fiscal quarters ended August 31, 2009 and November 30, 2009. Recoverability of the identified asset groups was tested using future cash flow projections based on management’s long range estimates of market conditions. Other than as described at “Note M – Restructuring,” the sum of the undiscounted future cash flows related to each asset group was more than the net book value for each of the asset groups; therefore, no impairment losses were indicated.
Due to continued deterioration in business and market conditions impacting our Metal Framing operating segment and the then Construction Services operating segment during the third quarter of fiscal 2007,2010, we determined that certain indicators of potential impairment were present for long-lived assets. Therefore, long-lived assets, including intangible assets with finite useful lives, were tested for impairment during the fiscal quarter ended February 28, 2010. Recoverability of the identified asset groups was tested using future cash flow projections based on management’s long range estimates of market conditions.
The sum of the undiscounted future cash flows related to the Metal Framing asset group was more than the net book value for the asset group. Therefore, there was no impairment loss at February 28, 2010 in the Metal Framing operating segment, other than that described at “Note R – Fair Value and “Note M – Restructuring.”
The sum of the undiscounted future cash flows related to an identified asset group within the then Construction Services operating segment (as previously reported and discussed within “Note H – Segment Data”) was less than the net book value for the asset group. Therefore, an impairment loss was recognized during the fiscal quarter ended February 28, 2010 in the amount of $8,055,000. The impairment loss was recorded within impairment of long-lived assets in our consolidated statements of earnings, and was based on the excess of the assets’ carrying amounts over their respective fair values at February 28, 2010. The impaired assets consisted largely of customer lists and also included trade name and technology assets. Refer to “Note R – Fair Value” for information regarding the determination of fair value for these assets.
Due largely to changes in the use of certain assets during the fourth quarter of fiscal 2010, we determined that indicators of impairment were present. Therefore, long-lived assets were tested for impairment during the fourth quarter of fiscal 2010. Recoverability of the identified asset groups was tested using future cash flow projections based on management’s long range estimates of market conditions. The sum of the undiscounted future cash flows related to each asset group was more than the net book value for each of the asset groups; therefore, no impairment loss was indicated at May 31, 2010, other than that described at “Note R – Fair Value” and “Note M – Restructuring.”
We test our goodwill was written offbalances for impairment annually, during the fourth quarter, and more frequently if events or changes in circumstances indicate that goodwill may be impaired. We test goodwill at the operating segment level as we have determined that the characteristics of the components within each operating segment are similar and allow for their aggregation to the operating segment level for testing purposes. The test consists of determining the fair value of the operating segments, using discounted cash flows, and comparing the result to the carrying values of the operating segments. If the estimated fair value of an operating segment exceeds its carrying value, there is no impairment. If the carrying amount of the operating segment exceeds its estimated fair value, an impairment of the goodwill is indicated. The amount of the impairment would be determined by establishing the fair value of all assets and liabilities of the operating segment, excluding the goodwill, and comparing the total to the estimated fair value of the operating segment. The difference would represent the fair value of the goodwill; and, if it is lower than the book value of the goodwill, the difference would be recorded as a result. We haveloss in the consolidated statements of earnings.
Due to industry changes, weakness in the construction market and the depressed results in the Metal Framing operating segment over the fiscal 2009 year, we tested this operating segment for impairment on a quarterly basis during fiscal 2009. During the fiscal quarter ended November 30, 2008, we again tested the value of the goodwill balances in the Metal Framing operating segment. Given the significant decline in the economy during fiscal 2009 and its impact on the construction market, we revised the forecasted cash flows and discount rate assumptions used in our previous valuations of this operating segment. The forecasted cash flows were revised downward due to the significant decline in, and the future uncertainty of, the economy. The discount rate, based on our then current cost of debt and equity capital, was changed due to the increased risk in our forecast. After reviewing the revised valuation and the fair value estimates of the remaining assets, it was determined that the value of the business no intangibleslonger supported its $96,943,000 goodwill balance. As a result, the full amount was written-off in the fiscal quarter ended November 30, 2008.
The results of the then Construction Services operating segment (as previously reported and discussed within “Note H – Segment Data) continued to deteriorate as the anticipated economic recovery in the commercial construction industry has been pushed further into the future. As a result, management determined that impairment indicators existed in the recent past, as noted above, and the assets (long-lived assets as well as goodwill) of the then Construction Services operating segment were reviewed for potential impairment on a quarterly basis during fiscal 2010. These tests were performed in earlier periods with indefinite lives other than goodwill.no impairment resulting. However, each successive test yielded a result closer to the point at which an impairment would be indicated. During the fiscal quarter ended February 28, 2010, we again tested the value of the goodwill balances in the then Construction Services operating segment. Based upon the continued
Goodwilldepression of the industry and the future uncertainty of the market, we revised the forecasted cash flows used in our previous valuations of this operating segment downward. After reviewing the revised valuation and the fair value estimates of the remaining net assets, it was determined that the value of the business no longer supported its $24,651,000 goodwill balance. As a result, the full amount was written-off in the third fiscal quarter ended February 28, 2010. The impairment loss was recorded within impairment of long-lived assets in our consolidated statements of earnings. Management continues to assess these businesses, as well as market and industry factors impacting the businesses, in order to determine the appropriate course of action going forward.
During the fourth quarter of fiscal 2010, at which point only the Pressure Cylinders operating segment had remaining non-impaired goodwill recorded, the Company completed its annual test of goodwill. No additional impairments were identified during the Company’s annual assessment of goodwill, as the estimated fair value of the Pressure Cylinders operating segment exceeded its carrying value by a substantial amount. However, future declines in the market and deterioration in earnings could lead to additional impairment of goodwill and other long-lived assets.
Changes in the carrying amount of goodwill for the fiscal years ending May 31, 2010 and 2009, by reportable business segment, is summarizedwere as follows at May 31:follows:
| In thousands | 2008 | 2007 | ||||
Metal Framing | $ | 97,316 | $ | 97,176 | ||
Pressure Cylinders | 79,507 | 75,564 | ||||
Other | 6,700 | 6,701 | ||||
Total | $ | 183,523 | $ | 179,441 | ||
| Pressure Cylinders | Metal Framing | Other | Total | |||||||||||||
| (in thousands) | ||||||||||||||||
Balance at June 1, 2008 | ||||||||||||||||
Goodwill | $ | 79,507 | $ | 97,316 | $ | 6,700 | $ | 183,523 | ||||||||
Accumulated impairment losses | - | - | - | - | ||||||||||||
| 79,507 | 97,316 | 6,700 | 183,523 | |||||||||||||
Acquisitions and purchase accounting adjustments | - | - | 17,951 | 17,951 | ||||||||||||
Translation adjustments | (2,815 | ) | (373 | ) | - | (3,188 | ) | |||||||||
Impairment losses | - | (96,943 | ) | - | (96,943 | ) | ||||||||||
Balance at May 31, 2009 | ||||||||||||||||
Goodwill | $ | 76,692 | $ | 96,943 | $ | 24,651 | $ | 198,286 | ||||||||
Accumulated impairment losses | - | (96,943 | ) | - | (96,943 | ) | ||||||||||
| 76,692 | - | 24,651 | 101,343 | |||||||||||||
Acquisitions and purchase accounting adjustments | 5,495 | - | - | 5,495 | ||||||||||||
Translation adjustments | (2,644 | ) | - | - | (2,644 | ) | ||||||||||
Impairment losses | - | - | (24,651 | ) | (24,651 | ) | ||||||||||
Balance at May 31, 2010 | ||||||||||||||||
Goodwill | 79,543 | 96,943 | 24,651 | 201,137 | ||||||||||||
Accumulated impairment losses | - | (96,943 | ) | (24,651 | ) | (121,594 | ) | |||||||||
| $ | 79,543 | $ | - | $ | - | $ | 79,543 | |||||||||
The changedecrease in goodwill is primarilyfor the Other category was due to foreign currency translation adjustments.the impairment of the entire goodwill balance during fiscal 2010, as noted above.
Other amortizable
Amortizable intangible assets are summarized as follows at May 31:
| 2008 | 2007 | 2010 | 2009 | |||||||||||||||||||||
| In thousands | Cost | Accumulated Amortization | Cost | Accumulated Amortization | ||||||||||||||||||||
| (in thousands) | Cost | Accumulated Amortization | Cost | Accumulated Amortization | ||||||||||||||||||||
Patents and trademarks | $ | 11,364 | $ | 6,217 | $ | 11,518 | $ | 5,218 | $ | 13,119 | $ | 8,246 | $ | 14,119 | $ | 7,655 | ||||||||
Customer relationships | 12,258 | 4,534 | 11,738 | 3,810 | 23,443 | 6,775 | 19,981 | 5,845 | ||||||||||||||||
Non compete agreement | 1,520 | 681 | 1,520 | 301 | ||||||||||||||||||||
Non-compete agreement | 2,100 | 1,844 | 1,900 | 1,286 | ||||||||||||||||||||
Other | 3,070 | 903 | 2,970 | 542 | ||||||||||||||||||||
Total | $ | 25,142 | $ | 11,432 | $ | 24,776 | $ | 9,329 | $ | 41,732 | $ | 17,768 | $ | 38,970 | $ | 15,328 | ||||||||
The net increase in other amortizable intangible assets iswas due largely to the Wolfedale acquisition.acquisition of the membership interests of Structural Composites Industries, LLC on September 3, 2009 ($7,800,000, See “Note P – Acquisitions”), the acquisition of the steel processing assets of Gibraltar ($4,701,000, See “Note P – Acquisitions”) and the impairment of intangible assets associated with the asset write-down within the then Construction Services operating segment, as noted above ($8,055,000). Currency translation adjustments comprised the remainder of the change in cost basis. Amortization expense was $2,258,000, $1,991,000,$4,124,000, $3,896,000 and $2,348,000$2,258,000 for fiscal 2008,2010, fiscal 20072009 and fiscal 2006.2008, respectively. These intangible assets are amortized on the straight-line method over their estimated useful lives, which range from 21 to 15 years.
Estimated amortization expense for these intangiblesintangible assets for the next five fiscal years is as follows:
| In thousands | ||||||
2009 | $ | 2,283 | ||||
2010 | 2,045 | |||||
| (in thousands) | ||||||
2011 | 1,682 | $ | 3,123 | |||
2012 | 1,584 | 2,956 | ||||
2013 | 1,584 | 2,498 | ||||
2014 | 2,398 | |||||
2015 | 2,360 | |||||
Note PO – Guarantees and Warranties
AsThe Company does not have guarantees that it believes are reasonably likely to have a material current or future effect on our financial condition, changes in financial condition, revenues or expenses, results of operations, liquidity, capital expenditures or capital resources. However, as of May 31, 2008, we had guarantees totaling $27,628,000 related2010, the Company was party to an operating lease for an aircraft in which the Company has guaranteed a residual value guarantees for certain aircraft leasesat the termination of the lease. The maximum obligation under the terms of this guarantee was approximately $14,667,000 at May 31, 2010. Based on current facts and for purchases by onecircumstances, the Company has estimated the likelihood of our unconsolidated joint venturespayment pursuant to this guarantee, and a subsidiary.determined that the fair value of the obligation based on those likely outcomes is not material.
The Company also had in place $8,260,000 of outstanding stand-by letters of credit as of May 31, 2010. These letters of credit were issued to third-party service providers and had no amounts drawn against them at May 31, 2010. Fair value of theses guarantee instruments, based on premiums paid, was not material at May 31, 2010.
We have established reserves for anticipated sales returns and allowances, including limited warranties on certain products. The liability for sales returns and allowances is primarily based on historical experience and current information. The liability amounts related to warranties were immaterial at May 31, 20082010 and 2007.2009.
Note QP – Acquisitions
On August 16, 2006,Effective June 1, 2009, we purchased 100%adopted updated accounting standards aimed at improving the relevance, representational faithfulness and comparability of the capitalinformation that a reporting entity provides in its financial reports about a business combination and its effects. As a result, transaction costs associated with the acquisitions of the steel processing assets of Gibraltar, assets related to the businesses of Piper Metal Forming Corporation, U.S. Respiratory, Inc. and Pacific Cylinders, Inc. (collectively, “Piper”) and the membership interests of Structural Composites Industries, LLC (“SCI”) were expensed, and recorded within selling, general and administrative expense in the consolidated statements of earnings, and a gain on the Piper acquisition was recorded, as discussed below.
On February 1, 2010, the Company acquired the steel processing assets of Gibraltar for cash of $29,164,000. Those assets became part of the Steel Processing operating segment of Worthington. The acquisition expanded the capabilities of the Company’s cold-rolled strip business and its ability to service the needs of new and existing customers. The assets acquired were Gibraltar’s Cleveland, Ohio, facility, equipment and inventory of Gibraltar’s Buffalo, New York, facility and a warehouse in Detroit, Michigan. Also acquired was the stock of PSM for $31,727,000, net of cash acquired. PSMCleveland Pickling, Inc., whose only asset is a specialty stainless31.25% interest in Samuel Steel Pickling Company, a joint venture which operates a steel processor locatedpickling facility in Los Angeles, California,Twinsburg, Ohio, and is includedone in our Steel Processing segment. Cleveland, Ohio.
The purchase price is subject to change due to targeted earn-outs of up to $8,500,000 through August 2009. The purchase price was allocated to the acquired assets and assumed liabilities in the Gibraltar acquisition were measured and recognized based on their estimated fair values at the date of acquisition. Intangible assets, consisting mostly of customer list, will be amortized over a weighted average life of 9.7 years on a straight-line basis. The purchase price included fair values of other assets that were not identifiable, not separately recognizable under accounting rules (e.g., assembled workforce) or of immaterial value. The estimated fair value of assets acquired and liabilities assumed approximated the purchase price, and therefore no goodwill, nor any bargain purchase gain, was generated. While the Company does not anticipate any changes to the initial accounting for this transaction, final review of the purchased net assets and related fair value determinations remains in process and could result in future adjustments within the measurement period, as defined within applicable accounting guidance.
The assets acquired and liabilities assumed in the Gibraltar acquisition were as follows:
| (in thousands) | ||||
Accounts receivable | $ | 274 | ||
Inventories | 24,059 | |||
Other current assets | 143 | |||
Intangible assets | 4,701 | |||
Property, plant and equipment, net | 18,406 | |||
Investment in affiliate | 2,500 | |||
Total assets | 50,083 | |||
Accounts payable | (19,832 | ) | ||
Accrued liabilities | (1,087 | ) | ||
Identifiable net assets | 29,164 | |||
Goodwill | - | |||
Total purchase price | $ | 29,164 | ||
On September 3, 2009, the Company acquired the membership interests of SCI for cash of $24,221,000. SCI is a manufacturer of lightweight, aluminum-lined, composite-wrapped high pressure cylinders used in commercial, military, marine and aerospace applications. Product lines include cylinders for alternative fuel vehicles using compressed natural gas or hydrogen, self-contained breathing apparatuses,
aviation oxygen and escape slides, military applications, home oxygen therapy and advanced and cryogenic structures. SCI operates as part of Worthington’s Pressure Cylinders operating segment. The acquisition of SCI allowed the Company to continue to grow the Pressure Cylinders business and provided an entry into weight critical applications, further broadening the portfolio beyond the operating segment’s original, core markets.
The acquired assets and assumed liabilities in the SCI acquisition were measured and recognized based on their estimated fair values at the date of acquisition, and includedwith goodwill representing the accrual of $4,784,000excess of the earn-out as it was deemed to be probable of payment andpurchase price over the fair value of the identifiable net assets. Intangible assets, exceededconsisting mostly of customer lists, trade name and technology, will be amortized over a weighted average life of 13.5 years on a straight-line basis.
Cash flows used to determine the purchase price.price included strategic and synergistic benefits (investment value) specific to us, which resulted in a purchase price in excess of the fair value of identifiable net assets. Since the fair values assigned to the acquired assets could only assume strategies and synergies of market participants, that additional investment value specific to us was included in goodwill. The purchase price included fair values of other assets that were not identifiable, not separately recognizable under accounting rules (e.g., assembled workforce) or of immaterial value. Goodwill of $5,495,000 is expected to be deductible for income tax purposes.
The allocation wasassets acquired and liabilities assumed in the SCI acquisition were as follows:
| In thousands | ||||
Current assets | $ | 15,732 | ||
Intangibles | 6,920 | |||
Property, plant and equipment, net | 20,400 | |||
Total assets | 43,052 | |||
Current liabilities | 3,968 | |||
Identifiable net assets | 39,084 | |||
Earnout liability | 4,784 | |||
Total purchase price | 34,300 | |||
Less: cash acquired | (2,573 | ) | ||
Purchase price, net of cash | $ | 31,727 | ||
| (in thousands) | ||||
Accounts receivable | $ | 2,897 | ||
Inventories | 4,929 | |||
Other current assets | 116 | |||
Intangible assets | 7,800 | |||
Property, plant and equipment, net | 6,117 | |||
Total assets | 21,859 | |||
Accounts payable | (1,535 | ) | ||
Accrued liabilities | (1,576 | ) | ||
Other liabilities | (22 | ) | ||
Identifiable net assets | 18,726 | |||
Goodwill | 5,495 | |||
Total purchase price | $ | 24,221 | ||
Of the $2,000,000 related to the first earn-out period ended August 31, 2007, we made a $1,100,000 payment, reducing the future targeted earn-outs to $6,500,000 as of May 31, 2008
Pro forma results, including the acquired businesses described above since the beginningOn June 1, 2009, Worthington purchased substantially all of the fiscal yearassets of Piper for cash of $9,713,000. Piper is a manufacturer of aluminum high pressure cylinders and impact extruded steel and aluminum parts, serving the medical, automotive, defense, oil services and other commercial markets, with one manufacturing location in New Albany, Mississippi. It operates as part of Worthington’s Pressure Cylinders operating segment. Piper’s aluminum products increase our line of industrial gas product offerings and present an opportunity to increase our participation in the growing medical market.
The acquired assets and assumed liabilities in the Piper acquisition were measured and recognized based on their respectiveestimated fair values at the date of acquisition, would not be materially different than actual results.with the gain on the acquisition of $891,000 representing the excess of the fair value of identifiable net assets over the purchase price. The Company was able to realize a gain on this transaction as a result of the then current market conditions and the sellers’ desire to exit the business. The gain on this transaction was recorded in miscellaneous income (expense) on the consolidated statements of earnings.
The assets acquired and liabilities assumed in the Piper acquisition were as follows:
| (in thousands) | ||||
Accounts receivable | $ | 3,935 | ||
Inventories | 4,142 | |||
Other current assets | 296 | |||
Property, plant and equipment, net | 4,300 | |||
Total assets | 12,673 | |||
Accounts payable | (1,711 | ) | ||
Accrued liabilities | (358 | ) | ||
Identifiable net assets | 10,604 | |||
Gain on acquisition | (891 | ) | ||
Total purchase price | $ | 9,713 | ||
On July 31, 2008, our Steelpac subsidiary purchased the assets of Laser Products (“Laser”) for $3,425,000. Laser is a steel rack fabricator primarily serving the auto industry. The acquired assets and assumed liabilities in the Laser acquisition, which consisted of working capital, fixed assets and the customer list, were measured and recognized based on their estimated fair values at the date of acquisition. The customer list is being amortized over ten years.
On June 2, 2008, Worthington purchased substantially all of the assets of theThe Sharon Companies Ltd. business (“Sharon Stairs”) for $37,000,000, net of cash acquired.$37,150,000. Sharon Stairs, now referred to as Worthington Stairs, LLC, designs and manufactures steel egress stair systems for the commercial construction market, and operates one manufacturing facility in Akron, Ohio. It will operateSharon Stairs was acquired in order to compliment the existing construction businesses and to build synergies across the Company while sharing best practices in manufacturing and fabricating.
The acquired assets in the Sharon Stairs acquisition were measured and recognized based on their estimated fair values at the date of acquisition, with goodwill representing the excess of the purchase price over the fair value of the identifiable net assets. Intangible assets, consisting mostly of customer lists, trade name and technology, were to be amortized over a weighted average life of 13 years on a straight-line basis.
Cash flows used to determine the purchase price included strategic and synergistic benefits (investment value) specific to us, which resulted in a purchase price in excess of the fair value of identifiable net assets. Since the fair values assigned to the acquired assets could only assume strategies and synergies of market participants, that additional investment value specific to us was included in goodwill. The purchase price included fair values of other assets that were not identifiable, not separately recognizable under accounting rules (e.g., assembled workforce) or of immaterial value. Goodwill of $17,951,000 is expected to be deductible for income tax purposes.
The assets acquired and liabilities assumed in the Sharon Stairs acquisition were as partfollows:
| (in thousands) | |||
Current assets | $ | 8,520 | |
Intangible assets | 12,440 | ||
Property, plant and equipment, net | 2,500 | ||
Total assets | 23,460 | ||
Current liabilities | 3,841 | ||
Other liabilities | 20 | ||
Long-term debt | 400 | ||
Identifiable net assets | 19,199 | ||
Goodwill | 17,951 | ||
Total purchase price | $ | 37,150 | |
During fiscal 2010, the Company recognized an impairment loss that significantly reduced the value of Worthington Integrated Building Systems, LLC.intangible assets (including goodwill) recorded in conjunction with the acquisition of the assets of Sharon Stairs. See “Note N – Goodwill and Other Long-Lived Assets” for additional details.
Operating results of each above-noted business has been included in the consolidated statements of earnings from the respective acquisition date, forward. Pro forma results, including the acquired businesses described above since the beginning of fiscal 2009, would not be materially different than the actual results reported.
Note RQ – Business Interruption
On January 5, 2008, Severstal North America, Inc. (“Severstal”) incurredexperienced a furnace outage. Severstal is a primary steel supplier to, and a minority partner in, our Spartan Steel Coating, LLC joint venture.Spartan. Severstal is also a steel supplier to some of our other Steel Processing locations and to our Pressure Cylinders operating segment. Business interruption losses have been and will continue to bewere incurred in the form of lost sales and added costs for material, freight, scrap and other items. We expect thatThe additional expenses incurred for material costs, freight and scrap in excess of our business interruptiondeductible have been offset by proceeds from our insurance will cover a substantialcompany. Net proceeds of $5,749,000 from final settlement of the insurance claim were recorded in cost of goods sold during the fiscal quarter ended February 28, 2009 to offset the reduced profit from lost sales at Spartan. Our partner’s portion of these losses,the net proceeds was $2,760,000, and included in net earnings attributable to noncontrolling interest in our consolidated statements of earnings for fiscal 2009.
Note R – Fair Value
Effective June 1, 2008, we adopted accounting guidance that the negative net impact to operating income, after insurance, will not exceed $1,000,000. The majority of the expected losses were incurred during the fourth quarter of fiscal 2008, but some will continue through the end of calendar year 2008. Forestablished a framework for measuring fair value and expanded disclosures about fair value measurements. This guidance was effective for our financial statement reporting, losses willassets and liabilities after May 31, 2008, and was effective for our non-financial assets and liabilities after May 31, 2009. The adoption of this fair value guidance did not have a material impact on amounts within our consolidated financial statements.
Fair value is an exit price, representing the amount that would be netted against insurance proceeds,received to sell an asset, or paid to transfer a liability, in an orderly transaction between market participants. Fair value is to be determined based on assumptions that market participants would use in pricing an asset or liability. Current authoritative accounting guidance uses a three-tier hierarchy that classifies assets and liabilities based on the inputs used in the valuation methodologies. In accordance with this guidance, we measured our derivative contracts at fair value. We classified these as level 2 assets and liabilities, as they are based upon models utilizing market observable inputs and credit risk. Derivative instruments are executed only with highly rated financial
institutions. No credit loss is anticipated on existing instruments, and no material credit losses have been experienced to date. The Company continues to monitor its positions, as well as the credit ratings of counterparties to those positions.
At May 31, 2010, our financial assets and liabilities measured at fair value on a recurring basis were as follows:
| (in thousands) | Quoted Prices in Active Markets (Level 1) | Significant Other Observable Inputs (Level 2) | Significant Unobservable Inputs (Level 3) | Totals | ||||||||
Assets | ||||||||||||
Commodity derivative contracts | $ | - | $ | 768 | $ | - | $ | 768 | ||||
Liabilities | ||||||||||||
Foreign currency derivative contracts | $ | - | $ | 233 | $ | - | $ | 233 | ||||
Interest rate derivative contracts | - | 10,584 | - | 10,584 | ||||||||
Commodity derivative contracts | - | 409 | - | 409 | ||||||||
Total liabilities | $ | - | $ | 11,226 | $ | - | $ | 11,226 | ||||
At May 31, 2009, our financial assets and liabilities measured at fair value on a recurring basis were as follows:
| (in thousands) | Quoted Prices in Active Markets (Level 1) | Significant Other Observable Inputs (Level 2) | Significant Unobservable Inputs (Level 3) | Totals | ||||||||
Assets | ||||||||||||
Foreign currency derivative contracts | $ | - | $ | 1,135 | $ | - | $ | 1,135 | ||||
Liabilities | ||||||||||||
Foreign currency derivative contracts | $ | - | $ | 769 | $ | - | $ | 769 | ||||
Interest rate derivative contracts | - | 7,899 | - | 7,899 | ||||||||
Total liabilities | $ | - | $ | 8,668 | $ | - | $ | 8,668 | ||||
Refer to “Note S – Derivative Instruments and Hedging Activities” for additional information regarding the location within the consolidated balance sheets and the risk classification of the Company’s derivative instruments.
At May 31, 2010, the fair values of the Company’s assets measured on a non-recurring basis were categorized as follows:
| (in thousands) | Quoted Prices in Active Markets (Level 1) | Significant Other Observable Inputs (Level 2) | Significant Unobservable Inputs (Level 3) | Totals | ||||||||
Assets | ||||||||||||
Long-lived assets held for sale | $ | - | $ | 1,315 | $ | - | $ | 1,315 | ||||
Long-lived assets held and used | - | 4,420 | 1,628 | 6,048 | ||||||||
Total assets | $ | - | $ | 5,735 | $ | 1,628 | $ | 7,363 | ||||
Certain assets of the Buffalo, New York, Steel Processing facility were written down to their fair value of $1,315,000, resulting in an immaterial impairment charge, which was included in net earnings, within restructuring and other expense, for fiscal 2010. The assets’ fair values were determined based on market prices for similar assets. See “Note M – Restructuring” for additional details.
Certain assets of the Joliet, Illinois Metal Framing facility were written down to their fair value of $3,848,000, resulting in an impairment charge of $1,717,000, which was included in net earnings, within restructuring and other expense, for fiscal 2010. The assets’ fair values were determined based on market prices for similar assets. See “Note M – Restructuring” for additional details.
Certain assets of the Steel Packaging operating segment were written down to their fair value of $572,000, resulting in an impairment charge of $2,703,000, which was included in net earnings, within impairment of long-lived assets, for fiscal 2010. The assets’ fair values were determined based on market prices for similar assets. See “Note N – Goodwill and Other Long-Lived Assets” for additional details.
Certain assets within the then Construction Services operating segment (as previously reported and discussed within “Note H – Segment Data”) were written down to their fair value of $1,628,000, resulting in an impairment charge of $8,055,000, which was included in net earnings, within impairment of long-lived assets, for fiscal 2010. The assets’ fair values were determined based on discounted cash flow models utilizing market observable inputs, as well as certain unobservable inputs. In determining the fair values of these assets, management was required to make certain assumptions regarding the expected cash flows and the discount rates used to determine the present values of those cash flows. Due to the weight of the unobservable inputs used, we have classified the values of these impaired assets as Level 3 within the fair value hierarchy. See “Note N – Goodwill and Other Long-Lived Assets” for additional details.
Effective August 31, 2009, we adopted an accounting standard that updated guidance concerning interim disclosures about fair values of financial instruments. That standard requires disclosures about fair values of financial instruments in all interim financial statements as well as in annual financial statements.
The non-derivative financial instruments included in the carrying amounts of cash and cash equivalents, receivables, income taxes receivable, other assets, deferred income taxes, accounts payable, notes payable, accrued compensation, contributions to employee benefit plans and related taxes, other accrued expenses, income taxes payable and other liabilities approximate fair values. The fair value of long-term debt, including current maturities, based upon models utilizing market observable inputs and credit risk, was $250,319,000 and $242,136,000 at May 31, 2010 and May 31, 2009, respectively. The carrying amounts of long-term debt, including current maturities, were $250,238,000 and $239,393,000 at May 31, 2010 and May 31, 2009, respectively.
Note S – Derivative Instruments and Hedging Activities
Interest Rate Risk – We entered into an interest rate swap in October 2004, which was amended December 17, 2004. The swap has a notional amount of $100,000,000 to hedge changes in cash flows attributable to changes in the LIBOR rate associated with the December 17, 2004 issuance of the 2014 Notes (see “Note C – Debt and Receivables Securitization”). We pay a fixed rate of 4.46% and receive a variable rate based on six-month LIBOR. The interest rate derivative is classified as a cash flow hedge. The effective portion of the changes in the fair value of the derivative is recorded in OCI and is reclassified to interest expense in the period in which earnings are impacted by the hedged item or in the period that the transaction no longer qualifies as a cash flow hedge.
Foreign Currency Risk – The translation of foreign currencies into United States Dollars subjects the Company to exposure related to fluctuating exchange rates. Derivative instruments are not used to manage this risk; however, the Company does make use of forward contracts to manage exposure to certain
intercompany loans with our foreign affiliates. Such contracts limit exposure to both favorable and unfavorable currency fluctuations. At May 31, 2010, the difference between the contract and book value of these instruments was not material to the Company’s consolidated financial position, results of operations or cash flows. The changes in the fair value of the derivative instruments are recorded either in the consolidated balance sheets under foreign currency translation or in net earnings in the same period in which foreign currency translation or net earnings are impacted by the hedged items.
Commodity Price Risk – The Company attempts to negotiate the best prices for commodities and to competitively price products and services to reflect the fluctuations in market prices. To further manage its exposure to fluctuations in the cost of steel, natural gas, zinc and other raw materials and utility requirements, the Company has used derivative instruments to cover periods commensurate with known or expected exposures. No derivative instruments are held for trading purposes. When qualified for hedge accounting, the effective portion of the changes in the fair value of cash flow derivatives is recorded in OCI and reclassified to cost of goods sold in the period in which earnings are impacted by the hedged items or in the period that the transaction no longer qualifies as a cash flow hedge. If the derivative instruments do not qualify for hedge accounting, changes in their fair value are recorded directly in cost of goods sold.
Refer to “Note R – Fair Value” for additional information regarding the accounting treatment and Company policy for derivative instruments, as well as how fair value is determined for the Company’s derivative instruments.
The fair value of derivative instruments at May 31, 2010 is summarized in the following table:
| Asset Derivatives | Liability Derivatives | |||||||||
| (in thousands) | Balance Sheet Location | Fair Value | Balance Sheet Location | Fair Value | ||||||
Derivatives designated as hedging instruments: | ||||||||||
Interest rate contracts | Receivables | $ | - | Accounts payable | $ | 2,026 | ||||
| Other assets | - | Other liabilities | 8,558 | |||||||
| - | 10,584 | |||||||||
Commodity contracts | Receivables | 768 | Accounts payable | - | ||||||
| Other assets | - | Other liabilities | - | |||||||
| 768 | - | |||||||||
Totals | $ | 768 | $ | 10,584 | ||||||
Derivatives not designated as hedging instruments: | ||||||||||
Commodity contracts | Receivables | $ | - | Accounts payable | $ | 409 | ||||
| Other assets | - | Other accrued items | - | |||||||
| - | 409 | |||||||||
Foreign exchange contracts | Receivables | - | Accounts payable | - | ||||||
| Other assets | - | Other accrued items | 233 | |||||||
| - | 233 | |||||||||
Totals | $ | - | $ | 642 | ||||||
Total Derivative Instruments | $ | 768 | $ | 11,226 | ||||||
The fair value of derivative instruments at May 31, 2009 is summarized in the following table:
| (in thousands) | Balance Sheet Location | Fair Value | Balance Sheet Location | Fair Value | ||||||
Derivative instruments designated as hedging instruments: | ||||||||||
Interest rate contracts | Receivables | $ | - | Accounts payable | $ | 1,134 | ||||
| Other assets | - | Other liabilities | 6,765 | |||||||
Totals | - | 7,899 | ||||||||
Derivative instruments not designated as hedging instruments: | ||||||||||
Foreign exchange contracts | Receivables | 1,135 | Accounts payable | - | ||||||
| Other assets | - | Other accrued items | 769 | |||||||
Totals | 1,135 | 769 | ||||||||
Total Derivative Instruments | $ | 1,135 | $ | 8,668 | ||||||
The effect of derivative instruments on the consolidated statements of earnings is summarized in the following tables:
Derivatives designated as cash flow hedging instruments:
| (in thousands) | Income (Loss) Recognized in OCI (Effective Portion) | Location of Income (Loss) Reclassified from Accumulated OCI (Effective Portion) | Income (Loss) Reclassified from Accumulated OCI (Effective Portion) | Location of Income (Loss) (Ineffective Portion) Excluded from Effectiveness Testing | Income (Loss) (Ineffective Portion) Excluded from Effectiveness Testing | ||||||||||
For the twelve months ended May 31, 2010: | |||||||||||||||
Interest rate contracts | $ | (6,857 | ) | Interest expense | $ | (3,643 | ) | Interest expense | $ | - | |||||
Commodity contracts | 883 | Cost of goods sold | 202 | Cost of goods sold | 95 | ||||||||||
Totals | $ | (5,974 | ) | $ | (3,441 | ) | $ | 95 | |||||||
For the twelve months ended May 31, 2009: | |||||||||||||||
Interest rate contracts | $ | (7,997 | ) | Interest expense | $ | (1,627 | ) | Interest expense | $ | - | |||||
Commodity contracts | (847 | ) | Cost of goods sold | 2,306 | Cost of goods sold | - | |||||||||
Totals | $ | (8,844 | ) | $ | 679 | $ | - | ||||||||
The estimated net amount of the existing losses in AOCI at May 31, 2010 expected to be directly relatedreclassified into net earnings within the succeeding twelve months was $953,000 (net of tax of $525,000). This amount was computed using the fair value of the cash flow hedges at May 31, 2010, and will change before actual reclassification from AOCI to net earnings during fiscal 2011.
Derivatives not designated as hedging instruments:
| Income (Loss) Recognized in Earnings | ||||||||||
| Location of Income (Loss) Recognized in Earnings | Twelve Months Ended May 31, | |||||||||
| (in thousands) | 2010 | 2009 | ||||||||
Commodity contracts | Cost of goods sold | $ | (15 | ) | $ | (1,433 | ) | |||
Foreign exchange contracts | Miscellaneous income (expense) | 6,481 | 5,570 | |||||||
Total | $ | 6,466 | $ | 4,137 | ||||||
The gain on the insurable event and recovery fromforeign currency derivatives significantly offsets the insurance company is probable and estimable.loss on the hedged item.
Note ST – Quarterly Results of Operations (Unaudited)
The following is a summary of the unaudited quarterly consolidated results of operations for fiscal 20082010 and fiscal 2007:2009:
| In thousands, except per share | Three Months Ended | |||||||||||
| Fiscal 2008 | August 31 | November 30 | February 29 | May 31 | ||||||||
Net sales | $ | 758,955 | $ | 713,664 | $ | 725,667 | $ | 868,875 | ||||
Gross margin | 78,785 | 70,010 | 75,727 | 131,225 | ||||||||
Net earnings | 20,168 | 14,740 | 18,302 | 53,867 | ||||||||
Earnings per share - basic | $ | 0.24 | $ | 0.18 | $ | 0.23 | $ | 0.68 | ||||
Earnings per share - diluted | 0.24 | 0.18 | 0.23 | 0.68 | ||||||||
| Fiscal 2007 | August 31 | November 30 | February 28 | May 31 | ||||||||
Net sales | $ | 778,720 | $ | 729,262 | $ | 677,250 | $ | 786,576 | ||||
Gross margin | 121,351 | 84,098 | 56,319 | 99,864 | ||||||||
Net earnings | 43,227 | 26,945 | 5,510 | 38,223 | ||||||||
Earnings per share - basic | $ | 0.49 | $ | 0.31 | $ | 0.07 | $ | 0.45 | ||||
Earnings per share - diluted | 0.48 | 0.31 | 0.06 | 0.45 | ||||||||
| (in thousands, except per share) | Three Months Ended | ||||||||||||||
| Fiscal 2010 | August 31 | November 30 | February 28 | May 31 | |||||||||||
Net sales | $ | 417,527 | $ | 447,981 | $ | 451,113 | $ | 626,413 | |||||||
Gross margin | 49,200 | 67,233 | 57,714 | 105,783 | |||||||||||
Net earnings (loss) attributable to controlling interest | 6,675 | 23,249 | (17,740 | ) | 33,057 | ||||||||||
Earnings (loss) per share - basic | $ | 0.08 | $ | 0.29 | $ | (0.22 | ) | $ | 0.42 | ||||||
Earnings (loss) per share - diluted | 0.08 | 0.29 | (0.22 | ) | 0.42 | ||||||||||
| Fiscal 2009 | August 31 | November 30 | February 28 | May 31 | |||||||||||
Net sales | $ | 913,222 | $ | 745,350 | $ | 501,125 | $ | 471,570 | |||||||
Gross margin | 151,902 | (54,419 | ) | 39,921 | 37,330 | ||||||||||
Net earnings (loss) attributable to controlling interest | 68,624 | (164,654 | ) | 1,554 | (13,738 | ) | |||||||||
Earnings (loss) per share - basic | $ | 0.87 | $ | (2.09 | ) | $ | 0.02 | $ | (0.17 | ) | |||||
Earnings (loss) per share - diluted | 0.86 | (2.09 | ) | 0.02 | (0.17 | ) | |||||||||
The sum of the quarterly earnings (loss) per share data presented in the table may not equal the annual results due to rounding and the impact of dilutive securities on the annual versus the quarterly earnings (loss) per share calculations.
Results for the fourth quarter of fiscal 20082010 (ended May 31, 2008),2010) were favorably impacted by increased volumes in the Steel Processing and Pressure Cylinders operating segments, and improved spreads between average selling price and the cost of steel. Strong performance from the Company’s unconsolidated joint ventures also added to the favorable results during the fourth quarter of fiscal 2010.
Results for the third quarter of fiscal 2010 (ended February 28, 2010) were negatively impacted by $4,894,000pre-tax impairment and restructuring charges totaling $35,481,000, or $0.28 per share, primarily related to the previously reported Construction Services segment, which has since been reorganized. The impairment charges within the then Construction Services segment included a write-off of restructuring expensegoodwill of $24,651,000 and an additional $8,055,000 charge related to definitely-lived assets. During the third quarter of fiscal 2010, results were also negatively impacted by $4,855,000, or $0.04 per diluted share.Theshare, in charges and legal fees related to the litigation with BernzOmatic.
Results for the second quarter of fiscal 2010 (ended November 30, 2009) were negatively impacted by $2,122,000 of restructuring and other expense, and $2,703,000 of impairment of long-lived assets. The restructuring and other expense primarily related to previously announced plant closures in the Metal Framing operating segment and professional feesthe impairment of long-lived assets related to certain assets of the Steel Packaging operating segment. These negative impacts, however, were largely offset by restructuring and other income of $4,783,000, which resulted from gains on the sale of our Metal Framing operations in Canada and on the Other category. To maintain consistency insale of the treatmentremaining assets of these professional fees certain professional fees totaling $3,300,000 reported in the previous three quarters in selling, generalLouisville, Kentucky, Steel Processing facility. The results for the second quarter of fiscal 2010 were also favorably impacted by higher steel prices and administrative expense have been reclassified to restructuring charges in those quarters.operational improvements realized from efforts of the Transformation Plan.
Results for the thirdfirst quarter of fiscal 20082010 (ended February 29, 2008)August 31, 2009), were negatively impacted by $4,179,000$3,626,000 of restructuring and other expense, or $0.03 per diluted share. The restructuring and other expense primarily related to previously announced plant closures in the Metal Framing operating segment.
Results for the fourth quarter of fiscal 2009 (ended May 31, 2009) were negatively impacted by $6,044,000 of restructuring and other expense.The restructuring and other expense primarily related to previously announced plant closures in the Metal Framing operating segment and professional fees in the Other category. During the fourth quarter of fiscal 2009, results were also negatively impacted by an inventory write-down adjustment totaling $6,278,000. The inventory adjustment was necessitated by continued decline in demand and steel pricing within the Steel Processing operating segment. The combined negative impact of these items was $0.15 per diluted share.
Results for the third quarter of fiscal 2009 (ended February 28, 2009) were negatively impacted by $16,309,000 of restructuring and other expense, or $0.10 per diluted share. The restructuring and other expense primarily related to previously announced plant closures in the Metal Framing operating segment and professional fees in the Other category.
Results for the second quarter of fiscal 20082009 (ended November 30, 2007),2008) were negatively impacted by $4,602,000$11,936,000 of restructuring and other expense, or $0.04$0.10 per diluted share. The restructuring and other expense primarily related to previously announced plant closures in the Metal Framing operating segment and professional fees in the Other category. During the second quarter of fiscal 2009, results were also negatively impacted by an inventory write-down adjustment totaling $98,021,000, or $0.86 per diluted share. The inventory adjustment was necessitated by the speed and severity of the decline in demand and steel pricing within the Steel Processing and Metal Framing operating segments. Additionally, results for the second quarter of fiscal 2009 were negatively impacted by a $96,943,000 goodwill impairment, or $1.07 per diluted share.
Results for the first quarter of fiscal 20082009 (ended August 31, 2007)2008), were negatively impacted by $4,436,000$8,752,000 of restructuring and other expense, or $0.04$0.08 per diluted share. The restructuring and other expense primarily related to previously announced plant closures in the Metal Framing operating segment and professional fees in the Other category.
SCHEDULE IINote U – VALUATION AND QUALIFYING ACCOUNTSSubsequent Events
Effective August 31, 2009, we adopted guidance issued in May 2009 by the FASB, which established general standards of accounting for and disclosure of events that occur after the balance sheet date, but before financial statements are issued. That guidance requires disclosure of the date through which subsequent events are evaluated and whether the date corresponds with the time at which the financial statements were available for issue (as defined) or were issued. During February 2010, and effective immediately upon issuance, the FASB amended that guidance. As a result, the Company is no longer required to, and does not, disclose the date through which subsequent events have been evaluated.
On June 21, 2010, the Pressure Cylinders operating segment acquired the assets of Hy-Mark Cylinders, Inc. (“Hy-Mark”) for cash of $12,125,000. Hy-Mark is a manufacturer of extruded aluminum cylinders for medical oxygen, scuba, beverage service, industrial, specialty and professional racing applications. The assets acquired included Hy-Mark’s manufacturing assets and inventory. The assets will be relocated from Hy-Mark’s Hampton, Virginia, facility to the Worthington Cylinders Mississippi manufacturing location, complementing the medical cylinder lines and adding a range of beverage grade, industrial cylinders and aluminum scuba tanks. The initial purchase accounting for this transaction is not yet complete.
Subsequent to May 31, 2010 and through July 29, 2010, Worthington Industries, Inc. purchased 2,284,100 Worthington Industries common shares for approximately $31,323,000 from the 8,449,500 common shares remaining authorized for repurchase at May 31, 2010.
WORTHINGTON INDUSTRIES, INC. AND SUBSIDIARIES
| COL. A. | COL. B. | COL. C. | COL. D. | COL. E. | ||||||||||||||||||
| Description | Balance at Beginning of Period | Additions | Deductions – Describe | Balance at End of Period | ||||||||||||||||||
| Charged to Costs and Expenses | Charged to Other Accounts – Describe | |||||||||||||||||||||
Year Ended May 31, 2008:
Deducted from asset accounts: Allowance for possible losses on trade accounts receivable | $3,641,000 | 1,496,000 | 127,000 (A) | 415,000 (B) | $4,849,000 | |||||||||||||||||
Year Ended May 31, 2007:
Deducted from asset accounts: Allowance for possible losses on trade accounts receivable | $4,964,000 | 399,000 | 1,000 (A) | 1,723,000 (B) | $3,641,000 | |||||||||||||||||
Year Ended May 31, 2006:
Deducted from asset accounts: Allowance for possible losses on trade accounts receivable | $11,225,000 | 830,000 | 193,000 (A) | 7,284,000 (B) | $4,964,000 | |||||||||||||||||
| COL. A. | COL. B. | COL. C. | COL. D. | COL. E. | ||||||||||||||||||
| Description | Balance at Beginning of Period | Additions | ||||||||||||||||||||
| Charged to Costs and Expenses | Charged to Other Accounts – Describe (B) | Deductions – Describe (C) | Balance at End of Period | |||||||||||||||||||
Year Ended May 31, 2010:
Deducted from asset accounts: Allowance for possible losses on trade accounts receivable | $ 12,470,000 | $ (900,000) (A) | $ 29,000 | $ 5,847,000 | $ 5,752,000 | |||||||||||||||||
Year Ended May 31, 2009:
Deducted from asset accounts: Allowance for possible losses on trade accounts receivable | $ 4,849,000 | $ 8,472,000 | $ 217,000 | $ 1,068,000 | $ 12,470,000 | |||||||||||||||||
Year Ended May 31, 2008:
Deducted from asset accounts: Allowance for possible losses on trade accounts receivable | $ 3,641,000 | $ 1,496,000 | $ 127,000 | $ 415,000 | $ 4,849,000 | |||||||||||||||||
Note A – Net allowance reversal, adjusted through expense.
Note B – Miscellaneous amounts.
Note BC – Uncollectable accounts charged to the allowance and a favorable bankruptcy settlementallowance.
See accompanying Report of $5,515,000 during the year ended May 31, 2006.Independent Registered Public Accounting Firm
Item 9. — Changes in and Disagreements With Accountants on Accounting and Financial Disclosure
Not applicable.
Item 9A. — Controls and Procedures
Evaluation of Disclosure Controls and Procedures
We maintain disclosure controls and procedures [as defined in Rules 13a-15(e) and 15d-15(e) under the Securities Exchange Act of 1934, as amended (the “Exchange Act”)] that are designed to provide reasonable assurance that information required to be disclosed in the reports that we file or submit under the Exchange Act is recorded, processed, summarized and reported within the time periods specified in the Securities and Exchange Commission’s rules and forms, and that such information is accumulated and communicated to our management, including our principal executive officer and our principal financial officer, as appropriate, to allow timely decisions regarding required disclosure.
Management, with the participation of our principal executive officer and our principal financial officer, performed an evaluation of the effectiveness of our disclosure controls and procedures as of the end of the fiscal year covered by this Annual Report on Form 10-K (the fiscal year ended May 31, 2008)2010). Based on that evaluation, our principal executive officer and our principal financial officer have concluded that such disclosure controls and procedures were effective at a reasonable assurance level as of the end of the fiscal year covered by this Annual Report on Form 10-K.
Changes in Internal Control Over Financial Reporting
We implemented a new enterprise resource planning system to enhance automation of manufacturing processes at six of our Steel Processing plants with a plan to upgrade all of our Steel Processing locations. The new computer system automates certain control functions related to key manufacturing processes, such as inventory management.
There were no other changes in our internal control over financial reporting that occurred in the last fiscal quarter (the fiscal quarter ended May 31, 2008)2010) that have materially affected, or are reasonably likely to materially affect, our internal control over financial reporting.
Annual Report of Management on Internal Control Over Financial Reporting
Management is responsible for establishing and maintaining adequate internal control over financial reporting to provide reasonable assurance regarding the reliability of our financial reporting and the preparation of financial statements for external purposes in accordance with accounting principles generally accepted in the United States. Internal control over financial reporting includes those policies and procedures that (i) pertain to the maintenance of records that, in reasonable detail, accurately and fairly reflect the transactions and dispositions of the assets of Worthington Industries, Inc. and our consolidated subsidiaries; (ii) provide reasonable assurance that transactions are recorded as necessary to permit preparation of financial statements in accordance with accounting principles generally accepted in the United States, and that receipts and expenditures of Worthington Industries, Inc. and our consolidated subsidiaries are being made only in accordance with authorizations of management and directors of Worthington Industries, Inc. and our consolidated subsidiaries, as appropriate; and (iii) provide reasonable assurance regarding prevention or timely detection of unauthorized acquisition, use or disposition of the assets of Worthington Industries, Inc. and our consolidated subsidiaries that could have a material effect on the financial statements.
Management, with the participation of our principal executive officer and our principal financial officer, evaluated the effectiveness of our internal control over financial reporting as of May 31, 2008,2010, the end of our fiscal year. Management based its assessment on criteria established inInternal Control-IntegratedControl – Integrated Framework issued by the Committee of Sponsoring Organizations of the Treadway Commission. Management’s assessment included evaluation of such elements as the design and operating effectiveness of key financial reporting controls, process documentation, accounting policies and our overall control environment. This assessment is supported by testing and monitoring performed under the direction of management.
Because of its inherent limitations, internal control over financial reporting may not prevent or detect misstatements. Also, projections of any evaluation of effectiveness to future periods are subject to the risk that controls may become inadequate because of changes in conditions, or that the degree of compliance with the policies or procedures may deteriorate. Accordingly, even an effective system of internal control over financial reporting will provide only reasonable assurance with respect to financial statement preparation.
Based on the assessment of our internal control over financial reporting, management has concluded that our internal control over financial reporting was effective at a reasonable assurance level as of May 31, 2008.2010. The results of management’s assessment were reviewed with the Audit Committee of the Board of Directors of Worthington Industries, Inc.
Additionally, our independent registered public accounting firm, KPMG LLP, independently assessed the effectiveness of our internal control over financial reporting and issued the accompanying Attestation Report of Independent Registered Public Accounting Firm.
Attestation Report of Independent Registered Public Accounting Firm
The Board of Directors and Shareholders
Worthington Industries, Inc.:
We have audited Worthington Industries, Inc.’s internal control over financial reporting as of May 31, 2008,2010, based on criteria established inInternal Control—Control – Integrated Framework issued by the Committee of Sponsoring Organizations of the Treadway Commission (COSO). Worthington Industries, Inc.’s management is responsible for maintaining effective internal control over financial reporting and for its assessment of the effectiveness of internal control over financial reporting, included in the accompanying Annual Report of Management on Internal Control Over Financial Reporting. Our responsibility is to express an opinion on the Company’s internal control over financial reporting based on our audit.
We conducted our audit in accordance with the standards of the Public Company Accounting Oversight Board (United States). Those standards require that we plan and perform the audit to obtain reasonable assurance about whether effective internal control over financial reporting was maintained in all material respects. Our audit included obtaining an understanding of internal control over financial reporting, assessing the risk that a material weakness exists, and testing and evaluating the design and operating effectiveness of internal control based on the assessed risk. Our audit also included performing such other procedures as we considered necessary in the circumstances. We believe that our audit provides a reasonable basis for our opinion.
A company’s internal control over financial reporting is a process designed to provide reasonable assurance regarding the reliability of financial reporting and the preparation of financial statements for external purposes in accordance with generally accepted accounting principles. A company’s internal control over financial reporting includes those policies and procedures that (1) pertain to the maintenance of records that, in reasonable detail, accurately and fairly reflect the transactions and dispositions of the assets of the company; (2) provide reasonable assurance that transactions are recorded as necessary to permit preparation of financial statements in accordance with generally accepted accounting principles, and that receipts and
expenditures of the company are being made only in accordance with authorizations of management and directors of the company; and (3) provide reasonable assurance regarding prevention or timely detection of unauthorized acquisition, use, or disposition of the company’s assets that could have a material effect on the financial statements.
Because of its inherent limitations, internal control over financial reporting may not prevent or detect misstatements. Also, projections of any evaluation of effectiveness to future periods are subject to the risk that controls may become inadequate because of changes in conditions, or that the degree of compliance with the policies or procedures may deteriorate.
In our opinion, Worthington Industries, Inc. maintained, in all material respects, effective internal control over financial reporting as of May 31, 2008,2010, based on criteria established inInternal Control—Control – Integrated Framework issued by the Committee of Sponsoring Organizations of the Treadway Commission.
We also have audited, in accordance with the standards of the Public Company Accounting Oversight Board (United States), the consolidated balance sheets of Worthington Industries, Inc. and subsidiaries as of May 31, 20082010 and 2007,2009, and the related consolidated statements of earnings, shareholders’ equity, and cash flows for each of the years in the three-year period ended May 31, 2008,2010, and our report dated July 30, 20082010 expressed an unqualified opinion on those consolidated financial statements.
/ |
Columbus, Ohio
July 30, 20082010
Resignation of John S. Christie as a Director and Other Changes in the Composition of the Board of Directors of Worthington Industries, Inc.
On July 25, 2008, John S. Christie, who serves in the class of directors of the Company whose terms will expire at the 2008 Annual Meeting of Shareholders, notified the Company that he intended to resign as a director effective July 31, 2008. As previously disclosed in the Company's Current Report on Form 8-K filed on May 5, 2008, Mr. Christie previously notified the Company on May 2, 2008, that he wished to retire as President and Chief Financial Officer of the Company effective July 31, 2008. The Company's Board of Directors determined that they would accept his resignation from the Board at the time of his retirement with the Company on July 31, 2008.
To make the number of directors in each class equal, effective as of August 1, 2008, the directorship of Carl A. Nelson, Jr. shall be changed from a director in the class of directors whose term ends at the Annual Meeting of Shareholders in 2009 to a director in the class of directors whose term ends in 2008 to fill the vacancy created by Mr. Christie's resignation. The Board has also taken action to reduce the size of the Board from ten to nine directors, with three directors in each class, effective upon Mr. Nelson's change in class.
Entry into Indemnification Agreements with Directors and Executive Officers
In order to further ensure that the indemnification protections afforded under Ohio General Corporation Law and the Code of Regulations of Worthington Industries, Inc. (“Worthington Industries”) to directors and executive officers of Worthington Industries remain available, on July 25, 2008, Worthington Industries entered into indemnification agreements (the “Indemnification Agreements”) with each of Worthington Industries’ directors and executive officers (each, an “Indemnitee”). The Indemnification Agreements generally
require Worthington Industries to hold harmless and indemnify an Indemnitee, to the greatest extent permitted by Ohio law, against specified expenses and liabilities that may arise in connection with a proceeding by reason of the Indemnitee’s status or service as a director and/or officer of Worthington Industries, if the Indemnitee acted in good faith and in a manner the Indemnitee reasonably believedThere is nothing to be in or not opposed to the best interests of Worthington Industries and, with respect to any criminal proceeding, the Indemnitee had no reasonable cause to believe the Indemnitee’s conduct was unlawful. The Indemnification Agreements also require Worthington Industries to advance expenses to an Indemnitee prior to the final disposition of a proceeding if specified conditions are satisfied. The Indemnification Agreements provide procedures for determining an Indemnitee’s entitlement to indemnification and specify certain remedies for the Indemnitee relating to indemnification and advancement of expenses.
Worthington Industries is not obligated to make any payment to an Indemniteereported under an Indemnification Agreement (a) if and to the extent that the Indemnitee has actually received payment under any insurance policy, any contract, the Amended Articles of Incorporation or Code of Regulations of Worthington Industries or otherwise of amounts otherwise payable under the Indemnification Agreement; (b) for expenses and other liabilities arising from the purchase and sale by the Indemnitee of securities in violation of Section 16(b) of the Securities Exchange Act of 1934, as amended; (c) if such payment is prohibited by applicable law; (d) with respect to any claim brought or made by the Indemnitee in a proceeding, unless (i) the bringing or making of the claim was approved or ratified by Worthington Industries’ Board of Directors or joined by Worthington Industries or (ii) the claim is brought or made by the Indemnitee following a change in control (as defined in the Indemnification Agreement) in order to enforce a right of the Indemnitee to receive indemnification; or (e) for expenses and other liabilities arising from a proceeding in which the court finds the Indemnitee’s actions to be knowingly fraudulent, deliberately dishonest or willful misconduct, except to the extent such indemnity is otherwise permitted by applicable law.
The Indemnification Agreements do not exclude any other rights to indemnification or advancement of expenses to which an Indemnitee may be entitled under the Amended Articles of Incorporation or Code of Regulations of Worthington Industries, applicable law (including Ohio General Corporation Law), any insurance policy, any contract or otherwise.
The foregoing summary is qualified in its entirety by reference to the full text of the Indemnification Agreements. Each of the Indemnification Agreements with the directors of Worthington Industries is identical in all material respects to the form of indemnification agreement for directors that is filed with this Annual Report on Form 10-K as Exhibit [10.32] and incorporated herein by reference. Each of the Indemnification Agreements with the executive officers of Worthington Industries is identical in all material respects to the form of indemnification agreement for executive officers that is filed with this Annual Report on Form 10-K as Exhibit [10.33] and incorporated herein by reference.Item 9B.
The following are the directors and executive officers of Worthington Industries who entered into Indemnification Agreements with Worthington Industries on July 25, 2008:
|
| |||
|
| |||
|
| |||
|
| |||
|
| |||
|
| |||
|
| |||
|
| |||
|
| |||
|
| |||
|
| |||
|
| |||
|
| |||
|
| |||
|
| |||
|
| |||
|
| |||
|
| |||
|
| |||
PART III
Item 10. — Directors, Executive Officers and Corporate Governance
Directors, Executive Officers and Persons Nominated or Chosen to Become Directors or Executive Officers
The information required by Item 401 of SEC Regulation S-K concerning the directors of Worthington Industries, Inc. (“Worthington Industries” or the “Registrant”) and the nominees for re-election as directors of Worthington Industries at the Annual Meeting of Shareholders to be held on September 24, 200830, 2010 (the “2008“2010 Annual Meeting”) is incorporated herein by reference from the disclosure to be included under the caption “PROPOSAL 1: ELECTION OF DIRECTORS” in Worthington Industries’ definitive Proxy Statement relating to the 20082010 Annual Meeting (“Worthington Industries’ Definitive 20082010 Proxy Statement”), which will be filed pursuant to SEC Regulation 14A not later than 120 days after the end of Worthington Industries’ fiscal 20082010 (the fiscal year ended May 31, 2008)2010).
The information required by Item 401 of SEC Regulation S-K concerning the executive officers of Worthington Industries is incorporated herein by reference from the disclosure included under the caption “Supplemental Item – Executive Officers of the Registrant” in Part I of this Annual Report on Form 10-K.
Compliance with Section 16(a) of the Exchange Act
The information required by Item 405 of SEC Regulation S-K is incorporated herein by reference from the disclosure to be included under the caption “SECURITY OWNERSHIP OF CERTAIN BENEFICIAL OWNERS AND MANAGEMENT – Section 16(a) Beneficial Ownership Reporting Compliance” in Worthington Industries’ Definitive 20082010 Proxy Statement.
Procedures by which Shareholders may Recommend Nominees to Worthington Industries’ Board of Directors
Information concerning the procedures by which shareholders of Worthington Industries may recommend nominees to Worthington Industries’ Board of Directors is incorporated herein by reference from the disclosure to be included under the captions “PROPOSAL 1: ELECTION OF DIRECTORS – Committees of the Board – Nominating and Governance Committee” and “CORPORATE GOVERNANCE – Nominating Procedures” in Worthington Industries’ Definitive 20082010 Proxy Statement. These procedures have not materially changed from those described in Worthington Industries’ Definitive Proxy Statement for the 20072009 Annual Meeting of Shareholders held on September 26, 2007.30, 2009.
Audit Committee Matters
The information required by Items 407(d)(4) and 407(d)(5) of SEC Regulation S-K is incorporated herein by reference from the disclosure to be included under the captioncaptions “PROPOSAL 1: ELECTION OF DIRECTORS – Committees of the Board” and “PROPOSAL 1: ELECTION OF DIRECTORS – Committees of the Board – Audit Committee” in Worthington Industries’ Definitive 20082010 Proxy Statement.
Code of Conduct; Committee Charters; Corporate Governance GuidelinesGuidelines; Charter of Lead Independent Director
Worthington Industries’ Board of Directors has adopted Charters for each of the Audit Committee, the Compensation and Stock Option Committee, the Executive Committee and the Nominating and Governance Committee as well as Corporate Governance Guidelines as contemplated by the applicable sections of the New York Stock Exchange Listed Company Manual. Worthington Industries’ Board of Directors has also adopted a Charter of the Lead Independent Director of Worthington Industries’ Board of Directors.
In accordance with the requirements of Section 303A.10 of the New York Stock Exchange Listed Company Manual, the Board of Directors of Worthington Industries has adopted a Code of Conduct covering the directors, officers and employees of Worthington Industries and its subsidiaries, including Worthington
Industries’ Chairman of the Board and Chief Executive Officer (the principal executive officer), Worthington Industries’ Vice President and Chief Financial Officer (the principal financial officer) and Worthington Industries’ Controller (the principal accounting officer). The Registrant will disclose the following events, if they occur, in a current report on Form 8-K to be filed with the SEC within the required four business days following their occurrence: (A) the date and nature of any amendment to a provision of Worthington Industries’ Code of Conduct that (i) applies to Worthington Industries’ principal executive officer, principal financial officer, principal accounting officer or controller, or persons performing similar functions, (ii) relates to any element of the “code of ethics” definition enumerated in Item 406(b) of SEC Regulation S-K, and (iii) is not a technical, administrative or other non-substantive amendment; and (B) a description of any waiver (including the nature of the waiver, the name of the person to whom the waiver was granted and the date of the waiver), including an implicit waiver, from a provision of the Code of Conduct granted to Worthington Industries’ principal executive officer, principal financial officer, principal accounting officer or controller, or persons performing similar functions, that relates to one or more of the elements of the “code of ethics” definition set forth in Item 406(b) of SEC Regulation S-K. In addition, Worthington Industries will disclose any waivers from the provisions of the Code of Conduct granted to a director or executive officer of Worthington Industries in a current report on Form 8-K to be filed with the SEC within the required four business days following their occurrence.
The text of each of the Charter of the Audit Committee, the Charter of the Compensation and Stock Option Committee, the Charter of the Executive Committee, the Charter of the Nominating and Governance Committee, the Charter of the Lead Independent Director, the Corporate Governance Guidelines and the Code of Conduct is posted on the “Corporate Governance” page of the “Investor Relations” section of Worthington Industries’ web site located at www.worthingtonindustries.com. Interested persons and shareholders of Worthington Industries may also obtain copies of each of these documents, without charge, by writing to the Investor Relations Department of Worthington Industries at Worthington Industries, Inc., 200 Old Wilson Bridge Road, Columbus, Ohio 43085, Attention: Allison M. Sanders. In addition, a copy of the Code of Conduct was filed as Exhibit 14 to the Registrant’s AnnualQuarterly Report on Form 10-K10-Q for the fiscal yearquarterly period ended May 31, 2007.February 28, 2009.
Item 11. — Executive Compensation
The information required by Item 402 of SEC Regulation S-K is incorporated herein by reference from the disclosure to be included under the captions “EXECUTIVE COMPENSATION” and “COMPENSATION OF DIRECTORS” in Worthington Industries’ Definitive 20082010 Proxy Statement.
The information required by Item 407(e)(4) of SEC Regulation S-K is incorporated herein by reference from the disclosure to be included under the caption “CORPORATE GOVERNANCE — Compensation Committee Interlocks and Insider Participation” in Worthington Industries’ Definitive 20082010 Proxy Statement.
The information required by Item 407(e)(5) of SEC Regulation S-K is incorporated herein by reference from the disclosure to be included under the caption “EXECUTIVE COMPENSATION — Compensation Committee Report” in Worthington Industries’ Definitive 20082010 Proxy Statement.
Item 12. — Security Ownership of Certain Beneficial Owners and Management and Related Stockholder Matters
Ownership of Common Shares of Worthington Industries
The information required by Item 403 of SEC Regulation S-K is incorporated herein by reference from the disclosure to be included under the caption “SECURITY OWNERSHIP OF CERTAIN BENEFICIAL OWNERS AND MANAGEMENT” in Worthington Industries’ Definitive 20082010 Proxy Statement.
Equity Compensation Plan Information
The information required by Item 201(d) of SEC Regulation S-K is incorporated herein by reference from the disclosure to be included under the caption “EQUITY COMPENSATION PLAN INFORMATION” in Worthington Industries’ Definitive 20082010 Proxy Statement.
Item 13. — Certain Relationships and Related Transactions, and Director Independence
Certain Relationships and Related Person Transactions
The information required by Item 404 of SEC Regulation S-K is incorporated herein by reference from the disclosure in respect of John P. McConnell to be included under the caption “SECURITY OWNERSHIP OF CERTAIN BENEFICIAL OWNERS AND MANAGEMENT” and from the disclosure to be included under the caption “TRANSACTIONS WITH CERTAIN RELATED PERSONS” in Worthington Industries’ Definitive 20082010 Proxy Statement.
Director Independence
The information required by Item 407(a) of SEC Regulation S-K is incorporated herein by reference from the disclosure to be included under the caption “CORPORATE GOVERNANCE – Director Independence” in Worthington Industries’ Definitive 20082010 Proxy Statement.
Item 14. — Principal Accountant Fees and Services
The information required by this Item 14 is incorporated herein by reference from the disclosure to be included under the captions “AUDIT COMMITTEE MATTERS – Independent Registered Public Accounting Firm Fees” and “AUDIT COMMITTEE MATTERS – Pre-Approval of Services Performed by the Independent Registered Public Accounting Firm.”
PART IV
Item 15. — Exhibits, and Financial Statement Schedules
| (a) | The following documents are filed as a part of this Annual Report on Form 10-K: |
| (1) | Consolidated Financial Statements: |
The consolidated financial statements (and report thereon) listed below are filed as a part of this Annual Report on Form 10-K:
Report of Independent Registered Public Accounting Firm (KPMG LLP)
Consolidated Balance Sheets as of May 31, 20082010 and 20072009
Consolidated Statements of Earnings for the fiscal years ended May 31, 2008, 20072010, 2009 and 20062008
Consolidated Statements of Shareholders’ Equity for the fiscal years ended May 31, 2010, 2009 and 2008 2007 and
2006
Consolidated Statements of Cash Flows for the fiscal years ended May 31, 2008, 20072010, 2009 and 20062008
Notes to Consolidated Financial Statements – fiscal years ended May 31, 2008, 20072010, 2009 and 20062008
| (2) | Financial Statement |
Schedule II – Valuation and Qualifying Accounts
All other financial statement schedules for which provision is made in the applicable accounting regulations of the SEC are omitted because they are not required or the required information has been presented in the aforementioned consolidated financial statements or notes thereto.
| (3) | Listing of |
The exhibits listed on the “Index to Exhibits” beginning on page E-1 of this Annual Report on Form 10-K are filed with this Annual Report on Form 10-K or incorporated in this Annual Report on Form 10-K by reference as noted in the “Index to Exhibits.” The “Index to Exhibits” specifically identifies each management contract or compensatory plan or arrangement required to be filed as an exhibit to this Annual Report on Form 10-K or incorporated in this Annual Report on Form 10-K by reference.
| (b) |
|
| (c) | Financial Statement |
Pursuant to the requirements of Section 13 or 15(d) of the Securities Exchange Act of 1934, the Registrant has duly caused this report to be signed on its behalf by the undersigned, thereunto duly authorized.
| WORTHINGTON INDUSTRIES, INC. | ||||||
Date: July 30, |
| By: | / | |||
John P. McConnell, | ||||||
Chairman of the Board and Chief Executive Officer | ||||||
Pursuant to the requirements of the Securities Exchange Act of 1934, this report has been signed below by the following persons on behalf of the Registrant and in the capacities and on the date indicated.
SIGNATURE | DATE | TITLE | ||
/s/ John P. McConnell John P. McConnell | July 30, | Director, Chairman of the Board and Chief Executive Officer (Principal Executive Officer) | ||
/s/
| July 30, |
Chief Financial Officer (Principal Financial Officer) | ||
/s/ Richard G. Welch Richard G. Welch | July 30, | Controller (Principal Accounting Officer) | ||
* John B. Blystone | * | Director | ||
|
| |||
* Michael J. Endres | * | Director | ||
* Peter Karmanos, Jr. | * | Director | ||
* John R. Kasich | * | Director | ||
* Carl A. Nelson, Jr. | * | Director | ||
* Sidney A. Ribeau | * | Director | ||
* Mary Schiavo | * | Director | ||
*The undersigned, by signing his name hereto, does hereby sign this report on behalf of each of the above-identified directors of the Registrant pursuant to powers of attorney executed by such directors, which powers of attorney are filed with this report as exhibits.
*By: | /s/ John P. McConnell | Date: July 30, | ||||
John P. McConnell | ||||||
Attorney-In-Fact |
Exhibit | Description | Location | ||||
| 3.1 | Amended Articles of Incorporation of Worthington Industries, Inc., as filed with the Ohio Secretary of State on October 13, 1998 | Incorporated herein by reference to Exhibit 3(a) to the Quarterly Report on Form 10-Q of Worthington Industries, Inc., an Ohio corporation (the “Registrant”), for the quarterly period ended August 31, 1998 (SEC File No. 0-4016) | ||||
| 3.2 | Code of Regulations of Worthington Industries, Inc., as amended through September 28, 2000 [for SEC reporting compliance purposes only] | Incorporated herein by reference to Exhibit 3(b) to the Registrant’s Quarterly Report on Form 10-Q for the quarterly period ended August 31, 2000 (SEC File No. 1-8399) | ||||
|
| |||||
|
| |||||
|
| |||||
|
| |||||
|
| |||||
|
| |||||
$435,000,000 Second Amended and Restated Revolving Credit Agreement, dated as of September 29, 2005, among Worthington Industries, Inc., as Borrower; the Lenders party thereto; PNC Bank, National Association, as Issuing Lender, Swingline Lender and Administrative Agent; and The Bank of Nova Scotia, as Syndication Agent and Sole Bookrunner; with The Bank of Nova Scotia and PNC Capital Markets, Inc. serving as Joint Lead Arrangers, and U.S. Bank National Association, Wachovia Bank, National Association and Comerica Bank serving as Co-Documentation Agents | Incorporated herein by reference to Exhibit 4.1 to the Registrant’s Current Report on Form 8-K dated September 30, 2005 and filed with the SEC on the same date (SEC File No. 1-8399) | |||||
First Amendment to Credit Agreement, dated as of May 6, 2008, among Worthington Industries, Inc., as Borrower; the Lenders party thereto; and PNC Bank, National Association, as Administrative Agent for the Lenders | Incorporated herein by reference to Exhibit 4.1 to the Registrant’s Current Report on Form 8-K dated May 8, 2008 and filed with the SEC on the same date (SEC File No. 1-8399) | ||||||
Note Purchase Agreement, dated December 17, 2004, between Worthington Industries, Inc. and Allstate Life Insurance Company, Connecticut General Life Insurance Company, United of Omaha Life Insurance Company and Principal Life Insurance Company | Incorporated herein by reference to Exhibit 4.1 to the | ||||||
Form of Floating Rate Senior Note due December 17, 2014 | Incorporated herein by reference to Exhibit 4.2 to the Registrant’s Current Report on Form 8-K dated December 20, 2004 and filed with the SEC on December 21, 2004 (SEC File No. 1-8399) | ||||||
First Amendment to Note Purchase Agreement, dated as of December 19, 2006, between Worthington Industries, Inc. and the purchasers named therein regarding the Note Purchase Agreement, dated as of December 17, 2004, and the $100,000,000 Floating Rate Senior Notes due December 17, 2014 | Incorporated herein by reference to Exhibit 4.2 to the | ||||||
| 4.6 | Indenture, dated as of April 13, 2010, between Worthington Industries, Inc. and U.S. Bank National Association, as Trustee | Incorporated herein by reference to Exhibit 4.1 to the Registrant’s Current Report on Form 8-K dated April 13, 2010 and filed with the SEC on the same date (SEC File No. 1-8399) | ||||
| 4.7 | First Supplemental Indenture, dated as of April 13, 2010, between Worthington Industries, Inc. and U.S. Bank National Association, as Trustee | Incorporated herein by reference to Exhibit 4.2 to the Registrant’s Current Report on Form 8-K dated April 13, 2010 and filed with the SEC on the same date (SEC File No. 1-8399) | ||||
| 4.8 | Form of 6.50% Global Notes due 2020 (included in Exhibit 4.7) | Incorporated herein by reference to Exhibit 4.2 to the Registrant’s Current Report on Form 8-K dated April 13, 2010 and filed with the SEC on the same date (SEC File No. 1-8399) | ||||
| 4.9 | Agreement to furnish instruments and agreements defining rights of holders of long-term debt | Filed herewith | ||||
| 10.1 | Worthington Industries, Inc. Non-Qualified Deferred Compensation Plan effective March 1, 2000* | Incorporated herein by reference to Exhibit 10.1 to the Registrant’s Annual Report on Form 10-K for the fiscal year ended May 31, 2005 (SEC File No. 1-8399) | ||||
| 10.2 | Worthington Industries, Inc. Amended and Restated 2005 Non-Qualified Deferred Compensation | Incorporated herein by reference to Exhibit | ||||
|
| |||||
Worthington Industries, Inc. Deferred Compensation Plan for Directors, as Amended and Restated, effective June 1, 2000* | Incorporated herein by reference to Exhibit 10(d) to the | |||||
| 10.4 | Worthington Industries, Inc. Amended and Restated 2005 Deferred Compensation Plan for Directors (Restatement effective as of December 2008)* | Incorporated herein by reference to Exhibit 10.5 to the Registrant’s Quarterly Report on Form 10-Q for the quarterly period ended November 30, 2008 (SEC File No. 1-8399) | ||||
| 10.5 | Worthington Industries, Inc. |
| ||||
| Incorporated herein by reference to Exhibit 10(b) to the Registrant’s Annual Report on Form 10-K for the fiscal year ended May 31, 1999 (SEC File No. 0-4016) | |||||
Worthington Industries, Inc. Amended and Restated 1997 Long-Term Incentive Plan | Incorporated herein by reference to Exhibit | |||||
Form of | Filed herewith | |||||
| 10.8 | Form of Restricted Stock Award Agreement under the Worthington Industries, Inc. Amended and Restated 1997 Long-Term Incentive Plan to be entered into by Worthington Industries, Inc. in order to evidence the grant of restricted stock to employees of Worthington Industries, Inc.* | Incorporated herein by reference to Exhibit 10.3 to the Registrant’s Quarterly Report on Form 10-Q for the quarterly period ended November 30, 2008 (SEC File No. 1-8399) | ||||
| 10.9 | Form of Letter Evidencing Cash Performance Awards and Performance Share Awards Granted under the Worthington Industries, Inc. 1997 Long-Term Incentive Plan (now known as the Worthington Industries, Inc. Amended and Restated 1997 Long-Term Incentive Plan) – Targets for 3-Year Period Ending May 31, 2010* | Incorporated herein by reference to Exhibit 10.1 to the | ||||
| 10.10 | Form of Letter Evidencing Cash Performance Awards and Performance Share Awards Granted under the Worthington Industries, Inc. 1997 Long-Term Incentive Plan (now known as the Worthington Industries, Inc. Amended and Restated 1997 Long-Term Incentive Plan) – Targets for 3-Year Periods Ending on and after May 31, 2011* | Filed herewith | ||||
| 10.11 | Worthington Industries, Inc. Amended and Restated 2000 Stock Option Plan for Non-Employee Directors (Restatement effective as of November 1, 2008)* | Incorporated herein by reference to Exhibit 10.7 to the Registrant’s Quarterly Report on Form 10-Q for the quarterly period ended | ||||
|
| |||||
Form of Non-Qualified Stock Option Agreement for non-qualified stock options granted under the Worthington Industries, Inc. 2000 Stock Option Plan for Non-Employee Directors (now known as the Worthington Industries, Inc. Amended and Restated 2000 Stock Option Plan for Non-Employee Directors) from and after September 25, 2003* | Incorporated herein by reference to Exhibit 10.2 to the | |||||
Worthington Industries, Inc. Amended and Restated 2003 Stock Option Plan | Incorporated herein by reference to Exhibit | |||||
Form of | Filed herewith | |||||
| 10.15 | Worthington Industries, Inc. Amended and Restated 2006 Equity Incentive Plan for Non-Employee Directors (Restatement effective as of November 1, 2008)* | Incorporated herein by reference to Exhibit | ||||
|
| |||||
Form of | Incorporated herein by reference to Exhibit 10.2 to the | |||||
| 10.17 |
| Filed herewith | |||||
Form of Restricted Stock Award Agreement under the Worthington Industries, Inc. 2006 Equity Incentive Plan for Non-Employee Directors (now known as the Worthington Industries, Inc. Amended and Restated 2006 Equity Incentive Plan for Non-Employee Directors) entered into by Worthington Industries, Inc. in order to evidence the grant of restricted stock on September 27, 2006 and September 26, 2007 to non-employee directors of Worthington Industries, Inc.* | Incorporated herein by reference to Exhibit 10.3 to the Registrant’s Current Report on Form 8-K dated October 2, 2006 and filed with the SEC on the same date (SEC File No. 1-8399) | ||||||
| 10.19 | Form of Restricted Stock Award Agreement under the Worthington Industries, Inc. 2006 Equity Incentive Plan for Non-Employee Directors (now known as the Worthington Industries, Inc. Amended and Restated 2006 Equity Incentive Plan for Non-Employee Directors) entered into by Worthington Industries, Inc. in order to evidence the grant of restricted stock to non-employee directors of Worthington Industries, Inc. on September 24, 2008 and to be entered into by Worthington Industries, Inc. in order to evidence future grants of restricted stock to non-employee directors of Worthington Industries, Inc.* | Incorporated herein by reference to Exhibit 10.3 to the | |||||
| 10.20 | Worthington Industries, Inc. Annual Incentive Plan for Executives (approved by shareholders on September 24, 2008)* | Incorporated herein by reference to Exhibit 10.1 to the Registrant’s Current Report on Form 8-K dated | |||||
| 10.21 | Form of Letter Evidencing Cash Performance Bonus Awards Granted under the Worthington Industries, Inc. Annual Incentive Plan for Executives* | Incorporated herein by reference to Exhibit 10.23 to the Registrant’s Annual Report on Form 10-K for the fiscal year ended May 31, 2009 (SEC File No. 1-8399) | ||||
| 10.22 | Receivables Purchase Agreement, dated as of November 30, 2000, among Worthington Receivables Corporation, as Seller, Worthington Industries, Inc., as Servicer, members of various purchaser groups from time to time party thereto and PNC Bank, National Association, as Administrator | Incorporated herein by reference to Exhibit 10(h)(i) to the | ||||
Amendment No. 1 to Receivables Purchase Agreement, dated as of May 18, 2001, among Worthington Receivables Corporation, as Seller, Worthington Industries, Inc., as Servicer, members of various purchaser groups from time to time party thereto and PNC Bank, National Association, as Administrator | Incorporated herein by reference to Exhibit 10(h)(ii) to the | |||||
Amendment No. 2 to Receivables Purchase Agreement, dated as of May 31, 2004, among Worthington Receivables Corporation, as Seller, Worthington Industries, Inc., as Servicer, members of various purchaser groups from time to time party thereto and PNC Bank, National Association, as Administrator | Incorporated herein by reference to Exhibit 10(g)(x) to the | |||||
Amendment No. 3 to Receivables Purchase Agreement, dated as of January 27, 2005, among Worthington Receivables Corporation, as Seller, Worthington Industries, Inc., as Servicer, the members of the various purchaser groups from time to time party thereto and PNC Bank, National Association, as Administrator | Incorporated herein by reference to Exhibit 10.15 to the Registrant’s Annual Report on Form 10-K for the fiscal year ended May 31, 2005 (SEC File No. 1-8399) | |||||
Amendment No. 4 to Receivables Purchase Agreement, dated as of January 25, 2008, among Worthington Receivables Corporation, as Seller, Worthington Industries, Inc., as Servicer, the members of the various purchaser groups from time to time party thereto and PNC Bank, National Association, as Administrator |
| ||||||
Amendment No. 5 to Receivables Purchase Agreement, dated as of January 22, 2009, among Worthington Receivables Corporation, as Seller, Worthington Industries, Inc., as Servicer, the members of the various purchaser groups from time to time party thereto and PNC Bank, National Association, as Administrator | Incorporated herein by reference to Exhibit 10.1 to the Registrant’s Quarterly Report on Form 10-Q for the quarterly period ended February 28, 2009 (SEC File No. 1-8399) | ||||||
| 10.28 | Amendment No. 6 to Receivables Purchase Agreement, dated as of April 30, 2009, among Worthington Receivables Corporation, as Seller, Worthington Industries, Inc., as Servicer, the members of the various purchaser groups from time to time party thereto and PNC Bank, National Association, as Administrator | Incorporated herein by reference to Exhibit 10.30 to the Registrant’s Annual Report on Form 10-K for the fiscal year ended May 31, 2009 (SEC File No. 1-8399) | ||||
| 10.29 | Amendment No. 7 to Receivables Purchase Agreement, dated as of January 21, 2010, among Worthington Receivables Corporation, as Seller, Worthington Industries, Inc., as Servicer, the members of the various purchaser groups from time to time party thereto and PNC Bank, National Association, as Administrator | Incorporated herein by reference to Exhibit 10.1 to the Registrant’s Quarterly Report on Form 10-Q for the quarterly period ended February 28, 2010 (SEC File No. 1-8399) | ||||
| 10.30 | Amendment No. 8 to Receivables Purchase Agreement, dated as of April 16, 2010, among Worthington Receivables Corporation, as Seller, Worthington Industries, Inc., as Servicer, the members of the various purchaser groups from time to time party thereto and PNC Bank, National Association, as Administrator | Filed herewith | ||||
| 10.31 | Purchase and Sale Agreement, dated as of November 30, 2000, between the various originators listed therein and Worthington Receivables Corporation | Incorporated herein by reference to Exhibit 10(h)(iii) to the | ||||
Amendment No. 1, dated as of May 18, 2001, to Purchase and Sale Agreement, dated as of November 30, 2000, between the various originators listed therein and Worthington Receivables Corporation | Incorporated herein by reference to Exhibit 10(h)(iv) to the | |||||
Amendment No. 2, dated as of August 25, 2006, to Purchase and Sale Agreement, dated as of November 30, 2000, between the various originators listed therein and Worthington Receivables Corporation | Incorporated herein by reference to Exhibit 10.5 to the | |||||
Summary of Cash Compensation for Directors of Worthington Industries, Inc., effective June 1, 2006* | Incorporated herein by reference to Exhibit 10.22 to the Registrant’s Annual Report on Form 10-K for the fiscal year ended May 31, 2006 (SEC File No. 1-8399) | |||||
| Filed herewith | |||||
| 10.36 | Summary of Annual Cash Performance Bonus Awards, Long-Term | Incorporated herein by reference to Exhibit | ||||
|
| |||||
|
| |||||
|
| |||||
| 10.37 |
| Filed herewith | ||||
| 10.38 | Form of Indemnification Agreement entered into between | Incorporated herein by reference to Exhibit | ||||
|
| |||||
|
| |||||
Form of Indemnification Agreement entered into |
| |||||
|
| |||||
| 14 | Worthington Industries, Inc. Code of Conduct | Incorporated herein by reference to Exhibit 14 to the Registrant’s | ||||
| 21 | Subsidiaries of Worthington Industries, Inc. | Filed herewith | ||||
| 23.1 | Consent of Independent Registered Public Accounting Firm (KPMG LLP) | Filed herewith | ||||
| 23.2 | Consent of Independent Auditor (KPMG LLP) with respect to consolidated financial statements of Worthington Armstrong Venture | Filed herewith | ||||
| 24 | Powers of Attorney of Directors and Executive Officers of Worthington Industries, Inc. | Filed herewith | ||||
| 31.1 | Rule 13a - 14(a) / 15d - 14(a) | Filed herewith | ||||
| 31.2 | Rule 13a - 14(a) / 15d - 14(a) | Filed herewith | ||||
| 32.1 | Section 1350 | Filed herewith | ||||
| 32.2 | Section 1350 | Filed herewith | ||||
| 99.1 | Worthington Armstrong Venture | Filed herewith | |||||
| * | Indicates management contract or compensatory plan or arrangement |
E-8E-7