UNITED STATES
SECURITIES AND EXCHANGE COMMISSION
Washington, DC 20549
FORM 10-K
(Mark One)
| x | ANNUAL REPORT PURSUANT TO SECTION 13 OR 15 (d) OF THE SECURITIES EXCHANGE ACT OF 1934 |
For the fiscal year ended June 30, 20082009
OR
| ¨ | TRANSITION REPORT PURSUANT TO SECTION 13 OR 15 (d) OF THE SECURITIES EXCHANGE ACT OF 1934 |
For the transition period from to .
Commission file number 0-25259
BOTTOMLINE TECHNOLOGIES (de), INC.
(Exact Name of Registrant as Specified in Its Charter)
| Delaware | 02-0433294 | |
(State or Other Jurisdiction of Incorporation or Organization) | (I.R.S. Employer Identification No.) | |
325 Corporate Drive Portsmouth, New Hampshire | 03801 | |
| (Address of Principal Executive Offices) | (Zip Code) | |
Registrant’s telephone number, including area code: (603) 436-0700
Securities registered pursuant to Section 12(b) of the Act:
Title of each class: | Name of each exchange on which registered: | |
Common Stock, $.001 par value per share | The NASDAQ Global Market |
Securities registered pursuant to Section 12(g) of the Act: None
Indicate by check mark if the registrant is a well-known seasoned issuer, as defined in Rule 405 of the Securities Act. Yes ¨ No x
Indicate by check mark if the registrant is not required to file reports pursuant to Section 13 or Section 15(d) of the Act. Yes ¨ No x
Indicate by check mark whether the registrant: (1) has filed all reports required to be filed by Section 13 or 15 (d) of the Securities Exchange Act of 1934 during the preceding 12 months (or for such shorter period that the registrant was required to file such reports), and (2) has been subject to such filing requirements for the past 90 days. Yes x No ¨
Indicate by check mark whether the registrant has submitted electronically and posted on its corporate Web site, if any, every Interactive Data File required to be submitted and posted pursuant to Rule 405 of Regulation S-T (§ 229.405 of this chapter) during the preceding 12 months (or for such shorter period that the registrant was required to submit and post such files). Yes ¨ No ¨
Indicate by check mark if disclosure of delinquent filers pursuant to Item 405 of Regulation S-K is not contained herein, and will not be contained, to the best of registrant’s knowledge, in definitive proxy or information statements incorporated by reference in Part III of this Form 10-K or any amendment to this Form 10-K. ¨
Indicate by check mark whether the registrant is a large accelerated filer, an accelerated filer, a non-accelerated filer, or a smaller reporting company. See the definitions of “large accelerated filer,” “accelerated filer” and “smaller reporting company” in Rule 12b-2 of the Exchange Act.
Large Accelerated Filer ¨ | Accelerated Filer x | |||||
Non-Accelerated Filer ¨ | Smaller Reporting Company ¨ | |||||
(Do not check if a smaller reporting company) | ||||||
Indicate by check mark whether the registrant is a shell company (as defined in Rule 12b-2 of the Exchange Act.): Yes ¨ No x
The aggregate market value of the voting stock held by non-affiliates of the registrant, based on the last sale price of the registrant’s common stock at the close of business on December 31, 20072008 was $328,053,894$166,180,796 (reference is made to Part II, Item 5 herein for a statement of assumptions upon which this calculation is based). The registrant has no non-voting stock.
There were 24,813,71625,325,976 shares of common stock, $.001 par value per share, of the registrant outstanding as of August 29, 2008.31, 2009.
DOCUMENTS INCORPORATED BY REFERENCE
Items 10, 11, 12, 13 and 14 of Part III (except for information required with respect to our executive officers, which is set forth under “Part I—Executive Officers and Other Key Employees of the Registrant”) have been omitted from this report, as we expect to file with the Securities and Exchange Commission, not later than 120 days after the close of our fiscal year ended June 30, 2008,2009, a definitive proxy statement for our 20082009 annual meeting of stockholders. The information required by Items 10, 11, 12, 13 and 14 of Part III of this report, which will appear in our definitive proxy statement, is incorporated by reference into this report.
This Annual Report on Form 10-K contains forward-looking statements that involve risks and uncertainties. Any statements (including statements to the effect that we “believe,” “expect,” “anticipate,” “plan” and similar expressions) that are not statements relating to historical matters should be considered forward-looking statements. Our actual results may differ materially from the results discussed in the forward-looking statements as a result of numerous important factors, including those discussed in “Item 1A. Risk Factors.”
| Item 1. | Business. |
Our Company
We provide electronic payment, invoice and document automationmanagement solutions to corporations, financial institutions and banks around the world. Our solutions are used to streamline, automate and manage business critical daily processes and transactions involving global payments, invoice receipt and approval, collections, cash management, risk mitigation, document management, reporting and document archive. We offer software designed to run on-site at the customer’s location as well as hosted solutions. Historically, our software has been sold predominantly on a perpetual license basis. Today, however, certainmore of our newer offerings are being sold on a subscription and transaction basis.
Our corporate customers rely on our solutions to automate their payment and accounts payable processes and to streamline and manage the production and retention of electronic documents. We also provide Legal eXchange®, a Software as a Service (SaaS) offeringofferings that receives, managesreceive, manage and controls legalcontrol invoices, payment processes and the related spend management for insurance companies and other large consumers of outside legal services. Our offerings also include software solutions that banks use to provide web-based payment and reporting capabilities to their corporate customers.
Our solutions complement and leverage our customers’ existing information systems, accounting applications and banking relationships. As a result, our solutions can be deployed quickly and efficiently. To help our customers receive the maximum value from our products and meet their own particular needs, we also provide professional services for installation, training, consulting and product enhancement.
Bottomline was originally organized as a New Hampshire corporation in 1989 and was reincorporated as a Delaware corporation in August 1997. We maintain our corporate headquarters in Portsmouth, New Hampshire and our international headquarters in Reading, England. We maintain a website with the address www.bottomline.com. Our website includes links to our Code of Business Conduct and Ethics, and our Audit Committee, Compensation Committee, and Nominating and Corporate Governance Committee charters. We are not including the information contained in our website as part of, or incorporating it by reference into, this Annual Report on Form 10-K. We make available free of charge, through our website, our annual reports on Form 10-K, quarterly reports on Form 10-Q, and current reports on Form 8-K, and amendments to these reports, as soon as reasonably practical after such material is electronically filed with, or furnished to, the Securities and Exchange Commission (SEC).
Unless the context requires otherwise, references to “we,” “us,” “our,” “Bottomline” and the “Company” refer to Bottomline Technologies (de), Inc. and its subsidiaries.
Recent Developments
On August 5, 2009 we entered into an asset purchase agreement with Bank of America to acquire Bank of America’s PayMode business. PayMode facilitates the electronic exchange of payments and invoices between organizations and their suppliers and is operated as a Software as a Service (SaaS) offering. As of August 5, 2009, there were in excess of 80,000 vendors participating in the PayMode network. We expect to complete the acquisition of PayMode in September 2009.
Our Strategy
Our objective is to be the leading global provider of business payment, invoice and document automation software solutions and services. Key elements of our strategy include the following:
Continuing to add customers and functionality to our growing Legal eXchange network;
Providing software and services which enable banks to offer their corporate customers leading global payment capability and functionality;
Leveraging our leading payment and document automation software solutions for enterprise customers;
Increasing the deployment of our hosted solutions, as well as subscription and transaction based pricing, in order to increase our recurring revenue contribution;
Continuing to invest inenhance the capabilities and functionality of our accounts payable automation solutions to capitalize on the new and significant market opportunity for that offering;
Continuing to expand our presence outside of North America and Europe by leveraging our experience with changing global payment standards;
Broadening our relationships with our customer base by selling existing applications, as well as new product offerings, into that base;
Continuing to develop and broaden strategic relationships that enhance our global position; and
Pursuing strategic acquisitions that expand our geographical footprint or complement our product functionality.
Our Products and Services
Payment and Document Automation
The payments automation capabilities inherent in our WebSeries® and PayBase® solutions can produce a wide variety of domestic and international payment instructions along with consolidated bank reporting of cash activity including ACH, EDI, Fedwire transfer, BACSTEL-IP and SWIFT messaging and paper checks in most currencies. Through our payment automation capabilities, customers can reduce administrative expenses and strengthen compliance and anti-fraud controls. Users are able to gather and access data via the Internet on payment and bank account information, including account totals and detailed transaction data, providing improved workflow, financial reporting and bank communications.
To help augment financial document composition and delivery we offer a number of solutions for automating a wide variety of business documents and financial transaction processes as well as related web-based delivery and document archive. Our products offer advanced design, output formatting and delivery capabilities that enable customers to replace paper-based forms (such as invoices, purchase orders and shipping notices) with more efficient and cost-effective electronic documents. With the capabilities of these product suites, users can centrally manage, distribute and archive business and transaction documents and then distribute them via email, print, fax or the Internet.
Legal Spend Management
OurLegal eXchange, a SaaS solution, Legal eXchange,offering, integrates with claims management and time and billing systems to automate legal invoice management processes and to provide insight into all areas of a company’s outside legal spend. Legal eXchange’s combination of automated invoice routing and a sophisticated rules engine allows corporate legal and insurance claims departments to create more efficient processes for managing invoices generated by outside law firms and other service providers, while offering access to important legal spend factors including budgeting, expense monitoring and outside counsel performance.
Electronic Banking
Our WebSeries Electronic Banking Platform allows banks and financial institutions to deploy Internet-based cash management services for their corporate clients. Based on patented technology and complementary existing systems, our banking platform enables users to leverage a single Internet-based interface for the origination and processing of all types of inbound and outbound domestic and international payments. The software architecture of our banking platform allows banks and financial institutions to configure highly specialized solution sets for enterprise cash management, wholesale banking and retail branch payments using modules for ACH, international payments, check management, information reporting, unattended payment and file transmission, and distributed document printing.
Accounts Payable Automation
Our accounts payable automation solutions allow businesses and enterprises to automate the accounts payable invoice receipt and management process and facilitate the ultimate payment. We have continued to invest in the on-going development and enhancement of our accounts payable automation solutions to include a wider range of functionality.
Professional Services
Our teams of service professionals draw on extensive experience to provide consulting, project implementation and training services to our clients. By easing the implementation of our products, these services help our customers accelerate the time to value. By improving the overall customer experience, these services help us retain customers and drive future revenue generating arrangements from existing customers.
Equipment and Supplies
We offer consumable products for laser check printing, including magnetic ink character recognition toner and blank-paper check stock. We also provide printers and printer-related equipment, primarily through arrangements with our hardware vendors, to complement our software product offerings.
Our Customers
Our customers are in diverse industries including financial services, insurance, health care, technology, communications, education, media, manufacturing and government. We provide our products and services to approximately 80 of the Fortune 100 companies and approximately 70 of the FTSE (Financial Times) 100 companies. Our customers include leading organizations such as American International Group, Australia and New Zealand Banking Group (ANZ), Bank of America, British Airways, Hertz Corporation, Home Depot, Inc., Liberty Mutual, Safeco Insurance and Vodafone.
Our Competition
The markets in which we participate are highly competitive. We believe our ability to compete depends on factors within and beyond our control, including:
the performance, reliability, features, price and ease of use of our offerings as compared to competitor alternatives;
our industry knowledge and expertise;
the execution of our sales and services organizations;
our ability to attract and retain employees with the requisite domain knowledge and technical skill set necessary to develop and support our products; and
the timing and market acceptance of new products as well as enhancements to existing products, by us and by our current and future competitors.
Our payment and document automation products compete primarily with companies that provide solutions to create, publish, manage and archive electronic documents, such as Adobe, StreamServe and Xerox and companies that offer electronic payment and laser check printing software and services, such as Payformance (now
(now a division of Sungard), MHC Associates, and ACOM Solutions in the US and Microgen, Albany Software Ltd. and Experian Group, Ltd. in Europe. Our products also compete with companies that provide a diverse array of accounts payable automation and workflow capabilities, such as Xign (now part of JP Morgan Chase), BasWare and 170 Systems. To a lesser extent, we compete with providers of enterprise resource planning solutions and providers of traditional payment products, including check stock and check printing software and services. In addition, some financial institutions compete with us as outsourced check printing and electronic payment service providers.
For Electronic Banking, we primarily compete with companies such as S1 Corporation, CoCoNet Corporation, Clear2Pay, Dovetail Software, Inc.Fundtech and ACI Worldwide that offer a wide range of financial services including electronic banking applications. We also encounter competition to a lesser degree from, Metavante, SunGard,Dovetail Software, Inc., Infosys Technologies Limited and Fundtech,Oracle Financial Services Software Limited (i-flex), as well as companies that provide traditional treasury workstation solutions.
For our Legal eXchange solution, we compete with a number of companies, including Serengeti Law, DataCert, CT TyMetrix, LexisNexis CounselLink and Allegient Systems.
Although we believe that we compete favorably in each of the markets in which we participate, the markets for our products and services are intensely competitive and characterized by rapid technological change and a number of factors could adversely affect our ability to compete in the future, including those discussed in “Item 1A. Risk Factors.”
Our Operating Segments
We organize our business by segments in order to maximize market opportunities. Our operating segments are organized principally by the type of product or services offered and by geography. As of July 1, 2007, we revised the structure of our internal operating segments and changed the nature of the financial information that is provided to and used by our chief operating decision maker. The change in segment structure as of July 1, 2007 resulted in our hosted and outsourced accounts payable automation product offerings being included as a component of our Outsourced Solutions segment rather than our Payment and Transactional Documents segment. This change is reflected for all periods presented. In accordance with SFAS 131, we have aggregated similar operating segments into three reportable segments as follows:
Payments and Transactional Documents.Our Payments and Transactional Documents segment is a supplier of software products that provide a range of financial business process management solutions including making and collecting payments, sending and receiving invoices, and generating and storing business documents. This segment also provides a range of standard professional services and equipment and supplies that complement and enhance our core software products. Revenue forassociated with this segment is typically recorded upon delivery or, if extended payment terms have been granted to the customer, as payments become contractually due. This segment also incorporates our check printing solutions in the U.K.,UK, revenue for which is typically recorded on a per transaction basis or ratably over the expected life of the customer relationship.relationship, as well as certain solutions that are licensed on a subscription basis, revenue for which is typically recorded ratably over the contractual term.
Banking Solutions.OurThe Banking Solutions segment provides solutions that are specifically designed for banking and financial institution customers. These solutions typically involve longer implementation periods and a significant level of professional resources. Due to the customized nature of these products, revenue is generally recognized over the period of project performance, on a percentage of completion basis. Periodically, we license these solutions on a subscription basis, which has the effect of contributing to recurring revenue and the revenue predictability of future periods, but which also delays revenue recognition over a period that is longer than the period of project performance.
Outsourced Solutions.OurThe Outsourced Solutions segment provides customers with outsourced and hosted solution offerings that facilitate invoice receipt and presentment and spend management. Our Legal eXchange solution, which provides customers the opportunity to create more efficient processes for managing invoices generated by outside law firms, while offering access to important legal spend factors such as budgeting, expense monitoring
and outside counsel performance, is included within this segment. This segment also incorporates our hosted and outsourced accounts payable automation solutions. Revenue within this segment is generally recognized on a subscription or transaction basis or proportionately over the estimated life of the customer relationship.
Each operating segment has separate sales forces and, periodically, a sales person in one operating segment will sell products and services that are typically sold within a different operating segment. In such cases, the transaction is generally recorded by the operating segment to which the sales person is assigned. Accordingly, segment results can include the results of transactions that have been allocated to a specific segment based on the contributing sales resources, rather than the nature of the product or service. Conversely, a transaction can be recorded by the operating segment primarily responsible for delivery to the customer, even if the sales person is assigned to a different operating segment.
Our chief operating decision maker assesses segment performance based on a variety of factors that can include segment revenue and a segment measure of profit or loss. Each segment’s measure of profit or loss is on a pre-tax basis, and excludes stock compensation expense, acquisition-related expenses, amortization of intangible assets and chargesrestructuring related to acquired in-process research and development.charges. There are no inter-segment sales; accordingly, the measure of segment revenue and profit or loss reflects only revenues from external customers. The costs of certain corporate level expenses, primarily general and administrative expenses, are allocated to our operating segments at predetermined rates that approximate cost.
We do not track or assign our assets by operating segment.
The following represents a summary of our reportable segments for the years ended June 30, 2006, 20072009, 2008 and 2008.2007.
| Fiscal Year Ended June 30, | Fiscal Year Ended June 30, | |||||||||||||||||||||||
| 2006 | 2007 | 2008 | 2009 | 2008 | 2007 | |||||||||||||||||||
| (in thousands) | (in thousands) | |||||||||||||||||||||||
Revenues: | ||||||||||||||||||||||||
Payments and Transactional Documents | $ | 70,622 | $ | 75,099 | $ | 84,962 | $ | 90,786 | $ | 84,962 | $ | 75,099 | ||||||||||||
Banking Solutions | 12,706 | 20,017 | 22,107 | 22,936 | 22,107 | 20,017 | ||||||||||||||||||
Outsourced Solutions | 18,337 | 23,219 | 24,172 | 24,292 | 24,172 | 23,219 | ||||||||||||||||||
Total revenues | $ | 101,655 | $ | 118,335 | $ | 131,241 | $ | 138,014 | $ | 131,241 | $ | 118,335 | ||||||||||||
Segment measure of profit (loss): | ||||||||||||||||||||||||
Payments and Transactional Documents | $ | 9,070 | $ | 12,733 | $ | 14,052 | $ | 14,662 | $ | 14,052 | $ | 12,733 | ||||||||||||
Banking Solutions | (1,155 | ) | 576 | 1,150 | (1,739 | ) | 1,150 | 576 | ||||||||||||||||
Outsourced Solutions | (677 | ) | (7,131 | ) | (2,610 | ) | 2,349 | (2,610 | ) | (7,131 | ) | |||||||||||||
Total measure of segment profit | $ | 7,238 | $ | 6,178 | $ | 12,592 | $ | 15,272 | $ | 12,592 | $ | 6,178 | ||||||||||||
A reconciliation of the measure of segment profit to our GAAP loss for 2006,2009, 2008 and 2007, and 2008, before the provision for income taxes, is as follows:
| Fiscal Year Ended June 30, | Fiscal Year Ended June 30, | |||||||||||||||||||||||
| 2006 | 2007 | 2008 | 2009 | 2008 | 2007 | |||||||||||||||||||
| (in thousands) | (in thousands) | |||||||||||||||||||||||
Segment measure of profit | $ | 7,238 | $ | 6,178 | $ | 12,592 | $ | 15,272 | $ | 12,592 | $ | 6,178 | ||||||||||||
Less: | ||||||||||||||||||||||||
Amortization of intangible assets | (4,491 | ) | (9,324 | ) | (11,399 | ) | (15,563 | ) | (11,399 | ) | (9,324 | ) | ||||||||||||
Stock compensation expense | (6,984 | ) | (7,945 | ) | (8,803 | ) | (9,498 | ) | (8,803 | ) | (7,945 | ) | ||||||||||||
Acquisition related expenses | (189 | ) | — | (269 | ) | (581 | ) | (269 | ) | — | ||||||||||||||
Restructuring charges | (1,548 | ) | — | — | ||||||||||||||||||||
Other income, net | 3,252 | 3,177 | 3,082 | 443 | 3,082 | 3,177 | ||||||||||||||||||
Loss before provision for income taxes | $ | (1,174 | ) | $ | (7,914 | ) | $ | (4,797 | ) | $ | (11,475 | ) | $ | (4,797 | ) | $ | (7,914 | ) | ||||||
Financial Information About Geographic Areas
We have presented geographic information about our revenues below. This presentation allocates revenue based on the point of sale, not the location of the customer. Accordingly, we derive revenues from geographic locations, based on the location of the customer, that would vary from the geographic areas listed here; particularly in respect of a financial institution customer located in Australia for which the point of sale was the United States. Revenues based on the point of sales, not the location of the customer, aresale were as follows:
| Fiscal Year Ended June 30, | ||||||||||||||||||
| 2006 | 2007 | 2008 | ||||||||||||||||
| (in thousands) | ||||||||||||||||||
United States | $ | 54,331 | 53.5 | % | $ | 65,064 | 55.0 | % | $ | 74,846 | 57.0 | % | ||||||
Europe | 45,471 | 44.7 | % | 51,507 | 43.5 | % | 54,673 | 41.7 | % | |||||||||
Australia | 1,863 | 1.8 | % | 1,764 | 1.5 | % | 1,722 | 1.3 | % | |||||||||
Total | $ | 101,665 | 100.0 | % | $ | 118,335 | 100.0 | % | $ | 131,241 | 100.0 | % | ||||||
United States Europe Australia Total Fiscal Year Ended June 30, 2009 2008 2007 (in thousands) $ 85,698 62.1 % $ 74,846 57.0 % $ 65,064 55.0 % 50,826 36.8 % 54,673 41.7 % 51,507 43.5 % 1,490 1.1 % 1,722 1.3 % 1,764 1.5 % $ 138,014 100.0 % $ 131,241 100.0 % $ 118,335 100.0 %
Long-lived assets, which are based on geographical designation, were as follows:
| Fiscal Year Ended June 30, | Fiscal Year Ended June 30, | |||||||||||
| 2007 | 2008 | 2009 | 2008 | |||||||||
| (in thousands) | (in thousands) | |||||||||||
Long-lived assets: | ||||||||||||
United States | $ | 4,664 | $ | 9,194 | $ | 12,160 | $ | 9,194 | ||||
Europe | 5,195 | 6,386 | 2,313 | 6,386 | ||||||||
Australia | 195 | 175 | 137 | 175 | ||||||||
Total long-lived assets | $ | 10,054 | $ | 15,755 | $ | 14,610 | $ | 15,755 | ||||
A significant percentage of our revenues have been generated by our international operations and our future growth rates and success are in part dependent on continued growth and success in international markets. As is the case with most international operations, the success and profitability of these operations is subject to numerous risks and uncertainties including exchange rate fluctuations. We do not currently hedge against exchange rate fluctuations. A number of other factors could also have a negative effect on our business and results from operations outside the US, including different regulatory and industry standards and certification requirements, reduced protection for intellectual property rights in some countries, import or export licensing requirements, the complexities of foreign tax jurisdictions and difficulties and costs of staffing and managing our foreign operations.
Sales and Marketing
As of June 30, 2008,2009, we employed 141143 sales and marketing employees worldwide, of whom 8478 were focused on the Americas markets, 5560 were focused on European markets and 25 were focused on Asia Pacific markets. We market and sell our products directly through our sales force and indirectly through a variety of channel partners and reseller relationships. We market and sell our products domestically and internationally, with an international focus on Europe and Australia. We also maintain an inside sales group which provides a lower-cost channel into maintaining existing customers and expanding our customer base.
Product Development and Engineering
Our product development and engineering organization includes employees as well as offshore development resources who provide a flexible supplement to our internal resources. We have three primary development groups: software engineering, quality assurance and technical writing. We spent $12.3$20.1 million, $16.1$17.4 million, and $17.4
$16.1 million on product development and engineering costs in fiscal years 2006, 20072009, 2008 and 2008.2007. These expenditures include the impact of stock compensation expense.
Our software engineers have substantial experience in advanced software development techniques as well as extensive knowledge of the complex processes involved in business document, payment, and invoicing systems. Our engineers participate in the Microsoft Developer Network, IBM Partner World for Developers, and the Oracle Partner Developer Program. They maintain extensive knowledge of software development trends and best practices. Our technology focuses on providing business solutions utilizing industry standards, providing a path for extendibility and scalability of our products. Security, control and fraud prevention, as well as performance, data management and information reporting, are priorities in the technology we develop and deploy.
Our quality assurance engineers have extensive knowledge of our products and expertise in software quality assurance techniques. The quality assurance team participates in all phases of our product development processes. Members of the quality assurance group make use of both manual and automated software testing techniques to ensure high quality software is being delivered to our customers. The quality assurance group members participate in alpha and beta releases, testing of new product releases as well as customizations to our clients, and provide initial training materials for customer support and service.
Our technical support group provides all product documentation as well as technical support for released products. The technical writers are versed in current document technology and work closely with the software engineers to create and maintain documentation that is clear, current and complete. The technical support engineers are responsible for the analysis of reported software problems and work closely with customer support staff as well as other internal groups to provide the highest quality of support to our customers. The group’s broad knowledge of our products, our technology, and our customers’ infrastructure allows it to rapidly respond to customer support needs.
Backlog
At the end of fiscal year 2009, our backlog was $83.9 million, including deferred revenues of $43.2 million. At the end of fiscal year 2008, our backlog was $77.8 million, including deferred revenues of $34.5 million. At the end of fiscal year 2007, our backlog was $59.7 million, including deferred revenues of $27.5 million. The current year increase in backlog is due to an increase in orders during 2008 and due to the backlog arising through our acquisition of Optio Software, Inc. (Optio) in April, 2008.2009. We do not believe that backlog is a meaningful indicator of sales that can be expected for any future period, and there can be no assurance that backlog at any point in time will translate into revenue in any specific subsequent period.
Proprietary Rights
We rely upon a combination of patents, copyrights, trademarks and trade-secret laws to establish and maintain proprietary rights in our technology and products. We had 2314 active patent applications relating to our products as of June 30, 2008.2009. We have been awarded 912 patents and expect to receive others. The earliest year of expiration for our awarded patents is 2015.
We intend to continue to file patent applications as we develop new technologies. There can be no assurance, however, that our existing patent applications, or any others that may be filed in the future, will issue or will be of sufficient scope and strength to provide meaningful protection of our technology or any commercial advantage to us, or that the issued patents will not be challenged, invalidated or circumvented. In addition, we rely upon a combination of copyright and trademark laws and non-disclosure and other intellectual property contractual arrangements to protect our proprietary rights. Given the rapidly changing nature of the industry’s technology, the creative abilities of our development, marketing and service personnel may be as or more important to our competitive position as the legal protections and rights afforded by patents. We also enter into agreements with our employees and clients that seek to limit and protect our intellectual property and the distribution of proprietary information. However, there can be no assurance that the steps we have taken to protect our intellectual property will be adequate to deter misappropriation of proprietary information, and we may not be able to detect unauthorized use and take appropriate steps to enforce our proprietary rights.
Government Regulation
Although our operations have not been subject to any material industry-specific governmentalgovernment regulation, some of our existing and potential customers are subject to extensive federal and state governmental regulations. In addition, governmentalgovernment regulation in the financial services industry is evolving, particularly with respect to payment technology and our customers may become subject to increased regulation in the future. Accordingly, our products and services must be designed to work within the regulatory constraints under which our customers operate.
Employees
As of June 30, 2008,2009, we had 679676 full-time employees, 141143 of whom were in sales and marketing, 295322 of whom were in professional services and customer support, 133107 of whom were in development and 110104 of whom were in administration and finance. None of our employees are represented by a labor union. We have not
experienced any work stoppages and we believe that employee relationships are good. Our future success will depend in part on our continued ability to attract, retain and motivate highly qualified technical and managerial personnel in a highly competitive market.
| Item 1A. | Risk |
Investing in our common stock involves a high degree of risk. You should carefully consider the risks and uncertainties described below before making an investment decision involving our common stock. The risks and uncertainties described below are not the only ones facing our company. Additional risks and uncertainties may also impair our business operations.
If any of the following risks actually occur, our business, financial condition or results of operations would likely suffer. In that case, the trading price of our common stock could fall, and you may lose all or part of the money you paid to buy our common stock.
Ongoing financial market volatility and adverse changes in the domestic and global economic environment could have a significant adverse impact on our business, financial condition and operating results
Our business and operating results could be significantly impacted by general economic conditions. Over the past year, the US and global economies have experienced an unprecedented series of events due to the effects of the credit market crisis, slowing global economic activity, a decrease in consumer and business confidence and severe liquidity concerns. A prolonged economic downturn could result in a variety of risks to our business, including:
increased volatility in our stock price;
increased volatility in foreign currency exchange rates;
delays in, or curtailment of, purchasing decisions by our customers or potential customers either as a result of continuing economic uncertainty or anxiety, or as a result of their inability to access the liquidity necessary to engage in purchasing initiatives;
increased credit risk associated with our customers or potential customers, particularly those that may operate in industries most affected by the economic downturn, such as financial services; and
impairment of our goodwill or other assets.
During the fiscal year ended June 30, 2009, we experienced a decline in the foreign currency exchange rates associated with the British Pound Sterling, European Euro and Australian Dollar, which negatively impacted our overall revenue growth. Additionally, we have recently experienced a higher than anticipated level of volatility in our common stock price, which we believe has been a result of the general financial market turmoil rather than
the result of anything specific to our business. During 2009, we saw instances where customer deals were postponed, and in general terms closing new business tended to take longer. To the extent that the current economic downturn worsens or persists, or any of the above risks occur, our business and operating results could be significantly and adversely affected.
Our common stock has experienced and may continue to undergo extreme market price and volume fluctuations
Stock markets in general, and The NASDAQ Global Market in particular, havehas recently experienced extreme price and volume fluctuations, particularly in recent years.fluctuations. Broad market fluctuations of this type may adversely affect the market price of our common stock. The stock prices for many companies in the technology sector have experienced wide fluctuations that often have been unrelated to their operating performance. The market price of our common stock has experienced and may continue to undergo extreme fluctuations due to a variety of factors, including:
general and industry-specific business, economic and market conditions;
changes in or our failure to meet analysts’ or investors’ estimates or expectations;
general and industry-specific business, economic and market conditions;
actual or anticipated fluctuations in operating results, including those arising as a result of any impairment of goodwill or other intangible assets related to past or future acquisitions;
public announcements concerning us, including announcements of litigation, our competitors or our industry;
introductions of new products or services or announcements of significant contracts by us or our competitors;
acquisitions, divestitures, strategic partnerships, joint ventures, or capital commitments by us or our competitors;
adverse developments in patent or other proprietary rights; and
announcements of technological innovations by our competitors.
Our business and operating results are subject to fluctuations in foreign currency exchange rates
We conduct a substantial portion of our operations outside of the US, principally in Europe and Australia. In fiscal 2009, approximately 47% of our revenues were attributable to customers located outside of North America and approximately 35% of our operating expenses were attributable to our operations outside of the US. During 2009, the foreign currency exchange rates of the British Pound, European Euro and Australian Dollar to the US Dollar declined significantly, and we anticipate that foreign currency exchange rates may continue to fluctuate in the near term. As we experienced in fiscal 2009, continued appreciation of the US Dollar against these foreign currencies will have the impact of reducing both our revenues and operating expenses.
Our future financial results will be impacted by our success in selling new products in a subscription and transaction based revenue model
A substantial portion of our revenues and profitability were historically generated from software license revenues. We are currently offering certain of our newer product sets under a subscription and transaction based revenue model, which we believe has certain advantages over a perpetual license model, including better predictability of revenue.
A subscription and transaction based revenue model typically results in no up-front revenue. Additionally, there can be no assurance that our customers, or the markets in which we compete, will respond favorably to the approach we have taken with our newer offerings. To the extent that our new subscription and transaction based offerings do not receive general marketplace acceptance, our financial results could be materially and adversely affected.
An increasing number of large and more complex customer contracts, or contracts that involve the delivery of services over contractually committed periods, generally delay the timing of our revenue recognition and in the short-term may adversely affect our operating results, financial condition and the market price of our stock
Due to an increasing number of large and more complex customer contracts, particularly in our Banking Solutions segment, we have experienced, and will likely continue to experience, delays in the timing of our revenue recognition. These large and complex customer contractsarrangements generally require significant implementation work, product customization and modification and user acceptance and systems integration testing, resulting in the recognition of revenue over the period of project completion which normally spans several quarters. Delays in revenue recognition on these contracts, including delays that result from customer decisions to halt or otherwise slow down a long-term project due to their own staffing or other challenges, could affect our operating results, financial condition and the market price of our common stock. Similarly, if we are unable to continue to generate new large orders on a regular basis, our business operating results and financial condition could be adversely affected.
We make significant investments in existing products and new product offerings that can adversely affect our operating results and may not be successful
We operate in a highly competitive and rapidly evolving technology environment and believe that it is important to enhance existing product offerings and develop new product offerings to meet strategic opportunities as they evolve. Investments in existing products and new product offerings can have a negative impact on our operating results, and any existing product enhancements or new product offerings may not be accepted in the marketplace or generate material revenues. For example, our operating results have recently been affected by increases in product development expenses as we continued to make investments in our hosted, banking and accounts payable automation products.
Integration of acquisitions could interrupt our business and our financial condition could be harmed
Part of our operating strategy is to identify and pursue strategic acquisitions that can expand our geographical footprint or complement our existing product functionality. We acquired Optio Software in April 2008 and expect to complete the acquisition of PayMode during September 2009. We may in the future continue to acquire, or make investments in, other businesses, products or technologies. Any acquisition or strategic investment we have made in the past or may make in the future may entail numerous risks, including the following:
difficulties integrating acquired operations, personnel, technologies or products;
inadequacy of existing operating, financial and management information systems to support the combined organization or new operations;
write-offs related to impairment of goodwill and other intangible assets;
entrance into markets in which we have no or limited prior experience or knowledge;
diversion of management’s focus from our core business concerns;
dilution to existing stockholders and earnings per share;
incurrence of substantial debt; and
exposure to litigation from third parties, including claims related to intellectual property or other assets acquired or liabilities assumed.
Any such difficulties encountered as a result of any merger, acquisition or strategic investment could have a material adverse effect on our business, operating results and financial condition.
As a result of our acquisitions, we could be subject to significant future write-offs with respect to intangible assets, or expenses related to acquired in-process research and development costs, which may adversely affect our future operating results
We review our intangible assets including goodwill, periodically for impairment. At June 30, 2008,2009, the carrying value of our goodwill and our other intangible assets was approximately $72$65 million and $43$25 million, respectively. While we reviewed our goodwill and our other intangible assets during the fourth quarter of fiscal year 20082009 and concluded that there was no impairment, we could be subject to future impairment charges with respect to these intangible assets, or intangible assets arising as a result of acquisitions in future periods. Further, to the extent we acquire projects related to in-process research and development activities, such amounts require immediate, rather than ratable, expense recognition. Any such charges, to the extent occurring, would likely have a material adverse effect on our operating results.
Our fixed costs may lead to operating results below analyst or investor expectations if our revenues are below anticipated levels, which could adversely affect the market price of our common stock
A significant percentage of our expenses, particularly personnel and facilities costs, are relatively fixed and based in part on anticipated revenue levels. In recent years, we experienced slowing growth rates with certain of our licensed software products. In the fiscal year ended June 30, 2009, we experienced a decline in the foreign currency exchange rates of our European and Australian based revenues which negatively impacted our overall revenue growth. A decline in revenues without a corresponding and timely slowdown in expense growth could negatively affect our business. Significant revenue shortfalls in any quarter may cause significant declines in operating results since we may be unable to reduce spending in a timely manner.
Quarterly or annual operating results that are below the expectations of public market analysts could adversely affect the market price of our common stock. Factors that could cause fluctuations in our operating results include the following:
economic conditions, which may affect our customers’ and potential customers’ budgets for information technology expenditures;
the timing of orders and longer sales cycles;
the timing of product implementations, which are highly dependent on customers’ resources and discretion;
the incurrence of costs relating to the integration of software products and operations in connection with acquisitions of technologies or businesses; and
the timing and market acceptance of new products or product enhancements by either us or our competitors.
Because of these factors, we believe that period-to-period comparisons of our results of operations are not necessarily meaningful.
Our mix of products and services could have a significant effect on our financial condition, results of operations and the market price of our common stock
The gross margins for our products and services vary considerably. Our software revenues generally yield significantly higher gross margins than do our subscription and transaction, service and maintenance and equipment and supplies revenue streams. In fiscal 2008,2009, we experienced a slight decrease in our overall software license fees.revenues. If software license feesrevenues were to significantly decline in any future period, or if the mix of our products and services in any given period did not match our expectations, our results of operations and the market price of our common stock could be significantly adversely affected.
We face risks associated with our international operations that could harm our financial condition and results of operations
A significant percentage of our revenues have been generated by our international operations, and our future growth rates and success are in part dependent on our continued growth and success in international markets. We have operations in the US, UK, Australia, France and Germany. As is the case with most international operations, the success and profitability of these operations are subject to numerous risks and uncertainties that include, in addition to the risks our business as a whole faces, the following:
currency exchange rate fluctuations;
difficulties and costs of staffing and managing foreign operations;
currency exchange rate fluctuations;
differing regulatory and industry standards and certification requirements;
the complexities of foreign tax jurisdictions;
reduced protection for intellectual property rights in some countries; and
import or export licensing requirements.
A significant percentage of our revenues to date have come from our payment and document management offerings and our future performance will depend on continued market acceptance of these solutions
A significant percentage of our revenues to date have come from the license and maintenance of our payment and document management offerings and sales of associated products and services. Any significant reduction in demand for our payment and document management offerings could have a material adverse effect on our business, operating results and financial condition. Our future performance could depend on the following factors:
continued market acceptance of our payment and document management offerings;
our ability to introduce enhancements to meet the market’s evolving needs for secure payments and cash management solutions; and
acceptance of software solutions offered on a hosted basis.
A growing number of our customer arrangements involve selling our products and services on a hosted basis, which may have the effect of delaying revenue recognition and increasing development or start-up expenses
An increasing number of our customer arrangements involve offering certain of our products and services on a hosted basis. These arrangements typically include a contractually defined service period as well as performance criteria that our products or services are required to meet over the duration of the service period. Arrangements entered into on a hosted basis generally delay the timing of revenue recognition and often require the incurrence of up-front costs, which can be significant. We are continuing to make investments in certain of our hosted offerings, such as our accounts payable automation products, and there can be no assurance that these products will ultimately gain broad market acceptance. In September 2009 we expect to complete the acquisition of PayMode, which will be operated on a hosted basis. Additionally, there is a risk that we might be unable to consistently maintain the performance requirements, or service levels, called for under any such hosted arrangements. Such events, to the extent occurring, could have a material and adverse effect on our operating results.
Our future financial results will depend on our ability to manage growth effectively
Our ability to manage growth effectively will depend in part on our ability to continue to enhance our operating, financial and management information systems. If we are unable to manage growth effectively, the quality of our services, our ability to retain key personnel and our business, operating results and financial condition could be materially adversely affected.
We face significant competition in our targeted markets, including competition from companies with significantly greater resources
In recent years, we have encountered increasing competition in our targeted markets. We compete with a wide range of companies, ranging from small start-up enterprises with limited resources, which compete principally on the basis of technology features or specific customer relationships, to large companies, which can leverage significant customer bases and financial resources. Given the size and nature of the markets we target, the implementation of our growth strategy and our success in competing for market share is dependent on our ability to grow our sales and marketing capabilities and maintain an appropriate level of financial resources.
We depend on key employees who are skilled in e-commerce, payment, cash and document management and invoice presentment methodology and Internet and other technologies
Our success depends upon the efforts and abilities of our executive officers and key technical employees who are skilled in e-commerce, payment methodology and regulation, and Internet, database and network technologies. Our key employees are in high demand within the marketplace and many competitors, customers and industry organizations are able to offer considerably higher compensation packages than we currently provide. The loss of one or more of these individuals could have a material adverse effect on our business. In addition, we currently do not maintain “key man” life insurance policies on any of our employees. While some of our executive officers have employment or retention agreements with us, the loss of the services of any of our executive officers or other key employees could have a material adverse effect on our business, operating results and financial condition.
We must attract and retain highly skilled personnel with knowledge in e-commerce, payment, cash and document management and invoice presentment methodology and Internet and other technologies
We believe that our success is in part dependent upon our ability to attract, hire, train and retain highly skilled technical, sales and marketing, and support personnel, particularly with expertise in e-commerce, payment, cash management and invoice methodology and Internet and other technologies. Competition for qualified personnel is intense. As a result, we may experience increased compensation costs that may not be offset through either improved productivity or higher sales prices. There can be no assurance that we will be successful in attracting, recruiting or retaining existing personnel. Based on our experience, it takes an average of nine months for a new salesperson to become fully productive. We cannot assure you that we will be successful in increasing the productivity of our sales personnel, and the failure to do so could have a material adverse effect on our business, operating results and financial condition.
Increased competition may result in price reductions and decreased demand for our product solutions
The markets in which we compete are intensely competitive and characterized by rapid technological change. Some competitors in our targeted markets have longer operating histories, significantly greater financial, technical, and marketing resources, greater brand recognition and a larger installed customer base than we do. We expect to face additional competition as other established and emerging companies enter the markets we address. In addition, current and potential competitors may make strategic acquisitions or establish cooperative relationships to expand their product offerings and to offer more comprehensive solutions. This growing competition may result in price reductions of our products and services, reduced revenues and gross margins and loss of market share, any one of which could have a material adverse effect on our business, operating results and financial condition.
Our success depends on our ability to develop new and enhanced products, services and strategic partner relationships
The markets in which we compete are subject to rapid technological change and our success is dependent on our ability to develop new and enhanced products, services and strategic partner relationships that meet evolving market needs. Trends that could have a critical impact on us include:
evolving industry standards, mandates and laws, such as those mandated by the National Automated Clearing House Association and the Association for Payment Clearing Services;
rapidly changing technology, which could cause our software to become suddenly outdated or could require us to make our products compatible with new database or network systems;
developments and changes relating to the Internet that we must address as we maintain existing products and introduce any new products; and
the loss of any of our key strategic partners who serve as a valuable network from which we can leverage industry expertise and respond to changing marketplace demands.
There can be no assurance that technological advances will not cause our products to become obsolete or uneconomical. If we are unable to develop and introduce new products or enhancements to existing products in a timely and successful manner, our business, operating results and financial condition could be materially adversely affected. Similarly, if our new products diddo not receive general marketplace acceptance, or if the sales cycle of any of our new products significantly delayeddelays the timing of revenue recognition, our results could be negatively affected.
Our products could be subject to future legal or regulatory actions, which could have a material adverse effect on our operating results
Our software products and hosted services offerings facilitate the transmission of business documents and information including, in some cases, confidential financial data related to payments, invoices and cash management. Our web-based software products, and certain of our hosted services offerings, transmit this data electronically. While we believe that all of our product and service offerings comply with current regulatory and security requirements, there can be no assurance that future legal or regulatory actions will not impact our product and service offerings. To the extent that regulatory or legal developments mandate a change in any of our products or services, or alter the demand for or the competitive environment of our products and services, we might not be able to respond to such requirements in a timely or successful manner. If this were to occur, our business, operating results and financial condition could be materially adversely affected.
Any unanticipated performance problems or bugs in our product offerings could have a material adverse effect on our future financial results
If the products that we offer and continue to introduce do not sustain marketplace acceptance, our future financial results could be adversely affected. Since certain of our offerings are still in early stages of adoption and since most of our products are continually being enhanced or further developed in response to general marketplace demands, any unanticipated performance problems or bugs that we have not been able to detect could result in additional development costs, diversion of technical and other resources from our other development efforts, negative publicity regarding us and our products, harm to our customer relationships and exposure to potential liability claims. In addition, if our products do not enjoy wide commercial success, our long-term business strategy will be adversely affected, which could have a material adverse effect on our business, operating results and financial condition.
We could incur substantial costs resulting from warranty claims or product liability claims
Our software license agreements typically contain provisions that afford customers a degree of warranty protection in the event that our software fails to conform to its written specifications. These agreements typically
contain provisions intended to limit the nature and extent of our risk of warranty and product liability claims. There is a risk however that a court might interpret these terms in a limited way or could hold part or all of these terms to be unenforceable. Furthermore, some of our licenses with our customers are governed by non-U.S.non-US law, and there is a risk that foreign law might provide us less or different protection. While we maintain general liability insurance, including coverage for errors and omissions, we cannot be sure that our existing coverage will continue to be available on reasonable terms or will be available in amounts sufficient to cover one or more large claims. Although we have not experienced any material warranty or product liability claims to date, a warranty or product liability claim, whether or not meritorious, could result in substantial costs and a diversion of management’s attention and our resources, which could have an adverse effect on our business, operating results and financial condition.
We could be adversely affected if we are unable to protect our proprietary technology and could be subject to litigation regarding our intellectual property rights, causing serious harm to our business
We rely upon a combination of patent, copyright and trademark laws and non-disclosure and other intellectual property contractual arrangements to protect our proprietary rights. However, we cannot assure you that our patents, pending applications for patents that may issue in the future, or other intellectual property will be of sufficient scope and strength to provide meaningful protection to our technology or any commercial advantage to us, or that the patents will not be challenged, invalidated or circumvented. We enter into agreements with our employees and customers that seek to limit and protect the distribution of proprietary information. Despite our efforts to safeguard and maintain our proprietary rights, there can be no assurance that such rights will remain protected or that we will be able to detect unauthorized use and take appropriate steps to enforce our intellectual property rights.
In recent years, there has been significant litigation in the United States involving patents and other intellectual property rights. We may be a party to litigation in the future to protect our intellectual property rights or as a result of an alleged infringement of the intellectual property rights of others. Any such claims, whether or not meritorious, could require us to spend significant sums in litigation, pay damages, delay product implementations, develop non-infringing intellectual property or acquire licenses to intellectual property that is the subject of the infringement claim. These claims could have a material adverse effect on our business, operating results and financial condition.
We engage off-shore development resources which may not be successful and which may put our intellectual property at risk
In order to optimize our research and development capabilities and to meet development timeframes, we contract with off-shore third party vendors in India and elsewhere for certain development activities. While our experience to date with these resources has been positive, there are a number of risks associated with off-shore development activities that include, but are not limited to, the following:
less efficient and less accurate communication and information flow as a consequence of time, distance and language barriers between our primary development organization and the off-shore resources, resulting in delays or deficiencies in development efforts;
disruption due to political or military conflicts around the world;
misappropriation of intellectual property from departing personnel, which we may not readily detect; and
currency exchange rate fluctuations that could adversely impact the cost advantages intended from these agreements.
To the extent that these or unforeseen risks occur, our operating results and financial condition could be adversely impacted.
Some anti-takeover provisions contained in our charter and under Delaware law could hinder a takeover attempt
We are subject to the provisions of Section 203 of the General Corporation Law of the State of Delaware prohibiting, under some circumstances, publicly-held Delaware corporations from engaging in business combinations with some stockholders for a specified period of time without the approval of the holders of substantially all of our outstanding voting stock. Such provisions could delay or impede the removal of incumbent directors and could make more difficult a merger, tender offer or proxy contest involving us, even if such events could be beneficial, in the short-term, to the interests of our stockholders. In addition, such provisions could limit the price that some investors might be willing to pay in the future for shares of our common stock. Our certificate of incorporation and bylaws contain provisions relating to the limitations of liability and indemnification of our directors and officers, dividing our board of directors into three classes of directors serving three-year terms and providing that our stockholders can take action only at a duly called annual or special meeting of stockholders.
We may incur significant costs from class action litigation as a result of expected volatility in our common stock
In the past, companies that have experienced market price volatility of their stock have been the targets of securities class action litigation. In August 2001, we were named as a party in one of the so-called “laddering” securities class action suits relating to the underwriting of our initial public offering. In April 2008, we acquired Optio Software, which is also a party in a “laddering” securities class action suit. We could incur substantial costs and experience a diversion of our management’s attention and resources in connection with any such litigation, which could have a material adverse effect on our business, financial condition and results of operations.
| Item 1B. | Unresolved Staff Comments. |
There are no material unresolved written comments from the staff of the SEC regarding our periodic or current reports received not less than 180 days before the end of our fiscal year to which this Form 10-K relates.
| Item 2. | Properties. |
We currentlyAs of June 30, 2009, we lease approximately 65,000 square feet of office space at our corporate headquarters in Portsmouth, New Hampshire under a lease that expires in 2012. We also occupy approximately 88,00046,000 square feet of leased domestic offices in Alpharetta, Georgia, Great Neck, New York, Morrisville, North Carolina, and Chicago, Illinois.
We own approximately 16,000 square feet of office space in Reading, England, and this facility serves as our European headquarters. Additionally, we lease approximately 20,00032,000 square feet of office space throughout the UK. We also lease approximately 5,000 square feet of office space in Melbourne and Sydney, Australia and approximately 2,000 square feet in Linden, Germany.Australia.
Our New Hampshire facility serves as our corporate headquarters and is used by employees associated with all of our operating segments in addition to our management, administrative, sales and marketing and customer support teams. Our New York facility is used to support the product development initiatives of all of our operating segments. Our North Carolina and Georgia facilities, and all of our European facilities, are used predominantly by personnel associated with our payments and transactional documents operating segment. Our Illinois facility is used principally by personnel who support aspects of our Legal eXchange solution, which is a component of our outsourced solutions segment. Our Australian facilities are used by personnel associated with both our payment and transactional documents and banking solutions operating segments.
| Item 3. | Legal Proceedings. |
On August 10, 2001, a class action complaint was filed against the Company in the United States District Court for the Southern District of New York: Paul Cyrek v. Bottomline Technologies, Inc.; Daniel M. McGurl; Robert A. Eberle; FleetBoston Robertson Stephens, Inc.; Deutsche Banc Alex Brown Inc.; CIBC World Markets; and J.P. Morgan Chase & Co. A consolidated amended class action complaint,In re Bottomline Technologies Inc. Initial Public Offering Securities Litigation, was filed on April 20, 2002.
On November 13, 2001, a class action complaint was filed against Optio in the United States District Court for the Southern District of New York: Kevin Dewey v. Optio Software, Inc.; Merrill Lynch, Pierce, Fenner & Smith, Inc.; Bear, Stearns & Co., Inc.; Fleetboston Robertson Stephens, Inc.; Deutsche Bank Securities, Inc.; Dain Rauscher Inc.; U.S. Bancorp Piper Jaffray, Inc.; C. Wayne Cape; and F. Barron Hughes. A consolidated amended class action complaint,In re Optio Software, Inc. Initial Public Offering Securities Litigation, was filed on April 22, 2002.
The amended complaints filed in both the actions against the Company and Optio assert claims under Sections 11, 12(2) and 15 of the Securities Act of 1933, as amended, and Sections 10(b) and 20(a) of the Securities Exchange Act of 1934, as amended. The amended complaints assert, among other things, that the descriptions in the Company’s and Optio’s prospectuses for their initial public offerings were materially false and misleading in describing the compensation to be earned by the underwriters of the offerings, and in not describing certain alleged arrangements among underwriters and initial purchasers of the common stock from the underwriters. The amended complaints seek damages (or, in the alternative, tender of the plaintiffs’ and the class’s common stock and rescission of their purchases of the common stock purchased in the initial public offering), costs, attorneys’ fees, experts’ fees and other expenses.
In July 2002, the Company and Optio joined in an omnibus motion to dismiss, which challenged the legal sufficiency of plaintiffs’ claims. The motion was filed on behalf of hundreds of issuer and individual defendants named in similar lawsuits. On February 19, 2003, the court issued an order denying the motion to dismiss as to Bottomline and denying in part the motion to dismiss as to Optio. In addition, in October 2002, Daniel M. McGurl, Robert A. Eberle, C. Wayne Cape and F. Barron Hughes were dismissed from this case without prejudice. Both Bottomline and Optio authorized the negotiation of a settlement of the pending claims, and the parties negotiated a settlement, which was subject to approval by the court. On August 31, 2005, the court issued an order preliminarily approving the settlement. On December 5, 2006, the United States Court of Appeals for the Second Circuit overturned the District Court’s certification of the class of plaintiffs who are pursuing the claims that would be settled in the settlement against the underwriter defendants. Plaintiffs filed a Petition for Rehearing and Rehearing En Banc with the Second Circuit on January 5, 2007 in response to the Second Circuit’s decision. On April 6, 2007, plaintiffs’ Petition for Rehearing of the Second Circuit’s decision was denied. On June 25, 2007, the District Court signed an order terminating the settlement. On September 27, 2007, plaintiffs filed a motion for class certification in certain designated “focus cases” in the District Court, and thatCourt. That motion is currently pending before the District Court.was withdrawn. Neither Bottomline nor Optio’s cases are part of the designated focus case group. On November 13, 2007, the issuer defendants in the designated focus cases filed a motion to dismiss the second consolidated amended class action complaints that were filed in those cases. On March 26, 2008, the District Court issued an Opinion and Order denying, in large part, the motions to dismiss the amended complaints in these focus cases. On April 2, 2009, the plaintiffs filed a motion for preliminary approval of a new proposed settlement between plaintiffs, the underwriter defendants, the issuer defendants and the insurers for the issuer defendants. On June 10, 2009, the Court issued an opinion preliminarily approving the proposed settlement, and scheduling a settlement fairness hearing for September 10, 2009.
The Company, and its subsidiary Optio, intend to vigorously defend themselves in these actions. Bottomline does not currently believe that the outcome of these proceedings will have a material adverse impact on its financial condition, results of operations or cash flows.
| Item 4. | Submission of Matters to a Vote of Security Holders. |
No matter was submitted to a vote of our stockholders, through the solicitation of proxies or otherwise, during the fourth quarter of fiscal year 2008.2009.
Executive Officers and Other Key Employees of the Registrant
Our executive officers and other key employees and their respective ages as of August 31, 2008,2009, are as follows:
Name | Age | Positions | ||
Robert A. Eberle | President, Chief Executive Officer and Director | |||
| ||||
Kevin M. Donovan | Chief Financial Officer and Treasurer | |||
Richard A. Bell | Senior Vice President and General Manager, Financial Process Solutions North America | |||
Eric A. Campbell | Chief Technology Officer | |||
Paul J. Fannon | ||||
Thomas D. Gaillard | Senior Vice President and General Manager, Transactional Services North America | |||
| 51 | |||
Michael Lane | Senior Vice President and General Manager, Global Banking and Financial Services | |||
Andrew Mintzer | Senior Vice President, Product Strategy and Delivery | |||
Chris W. Peck | Managing Director, | |||
Nigel K. Savory | Managing Director, Europe |
Robert A. Eberle has served as a director since September 2000 and as Chief Executive Officer since November 2006. Mr. Eberle has served as President since August 2004. From April 2001 to November 2006, Mr. Eberle served as Chief Operating Officer. Mr. Eberle served as Chief Financial Officer from September 1998 to August 2004.
Peter S. Fortune has served as Chief Operating Officer since November 2006, and as President of Bottomline Europe since we acquired the predecessor company in August 2000. From November 2005 to November 2006, Mr. Fortune served as Chief Marketing Officer.
Kevin M. Donovanhas served as Chief Financial Officer since August 2004 and as Treasurer since May 2001. Mr. Donovan served as Vice President, Finance from January 2000 to August 2004.
Richard A. Bellhas served as Senior Vice President and General Manager, Financial Process Solutions North America since September 2005. From January 2001 to September 2005, Mr. Bell served as Vice President of Create!form, which we acquired in September 2003.
Eric A. Campbell has served as Chief Technology Officer since May 2000.
Paul J. Fannon has served as ManagingGroup Sales Director, Transactional Services Europe since December 2003.October 2008. From December 20012003 through December 2003,October 2008, Mr. Fannon served as Managing Director, Payment SolutionsTransactional Services Europe.
Thomas D. Gaillardhas served as Senior Vice President and General Manager, Transactional Services North America since July 2003.
Marcus G.R. Hugheshas served as Director of Global Marketing since March 2009. From January 2009 to March 2009, Mr. Hughes served as a consultant to the Company. From March 2007 to January 2009, Mr. Hughes served as Managing Director, Global Head of Trade Services at Banco Santander. From May 2002 to July 2003,March 2007, Mr. GaillardHughes served as Vice President, Corporate Development.
Craig A. Joneshas served as Senior Vice President and General Manager, GlobalHead of Banking, and Finance, since July 2006. From July 2003 to July 2006, Mr. Jones served as Vice President and General Manager, Financial Process Solutions North America. From July 2002 to July 2003, Mr. Jones served as Vice President of Product Management.Europe for Bottomline Technologies Europe.
Michael Lane has served as Senior Vice President and General Manager, Global Banking and Financial Services since March 2008. From May 2005 to February 2008, Mr. Lane served as Managing Director, Financial Services for Pegasystems, Inc. From March 2003 to April 2005, Mr. Lane served as Managing Director, Global Financial Services for Vitria Technology, Inc.
Andrew Mintzer has served as Senior Vice President, Product Strategy and Delivery since November 2007. From June 2003 to November 2007, Mr. Mintzer served as Vice President of Development.
Christopher W. Peck has served as Managing Director, Group SalesBanking Europe since July 2003.October 2008. From August 2000, when we acquired the predecessor company, through July 2003 through October 2008, Mr. Peck served as Managing Director, Group Sales Director of Bottomline Europe.
Nigel K. Savory has served as Managing Director, Europe since December 2003. From December 2001 through December 2003, Mr. Savory served as the Managing Director, Transaction Services Europe.
| Item 5. | Market for Registrant’s Common Equity, Related Stockholder Matters and Issuer Purchases of Equity Securities. |
Our common stock is traded on The NASDAQ Global Market under the symbol EPAY. The following table sets forth, for the periods indicated, the high and low sale prices of our common stock, as quoted on The NASDAQ Global Market (previously the NASDAQ National Market).
Period | High | Low | High | Low | ||||||||
Fiscal 2007 | ||||||||||||
First quarter | $ | 10.38 | $ | 6.98 | ||||||||
Second quarter | $ | 11.62 | $ | 9.28 | ||||||||
Third quarter | $ | 13.24 | $ | 10.24 | ||||||||
Fourth quarter | $ | 13.13 | $ | 10.50 | ||||||||
Fiscal 2008 | ||||||||||||
First quarter | $ | 14.14 | $ | 11.30 | $ | 14.14 | $ | 11.30 | ||||
Second quarter | $ | 16.37 | $ | 11.58 | $ | 16.37 | $ | 11.58 | ||||
Third quarter | $ | 14.04 | $ | 9.85 | $ | 14.04 | $ | 9.85 | ||||
Fourth quarter | $ | 13.79 | $ | 9.50 | $ | 13.79 | $ | 9.50 | ||||
Fiscal 2009 | ||||||||||||
First quarter | $ | 13.00 | $ | 9.61 | ||||||||
Second quarter | $ | 10.46 | $ | 4.46 | ||||||||
Third quarter | $ | 7.67 | $ | 4.66 | ||||||||
Fourth quarter | $ | 10.31 | $ | 6.43 | ||||||||
As of August 29, 2008,31, 2009, there were approximately 175201 holders of record of our common stock. Because many of the shares are held by brokers and other institutions on behalf of stockholders, we are unable to estimate the total number of individual stockholders represented by these holders of record.
The closing price for our common stock on August 29, 200831, 2009 was $11.52.$12.10. For purposes of calculating the aggregate market value of the shares of our common stock held by non-affiliates, as shown on the cover page of this report, it has been assumed that all the outstanding shares were held by non-affiliates except for the shares beneficially held by our directors and executive officers. However, there may be other persons who may be deemed to be affiliates of ours.
We have never paid dividends on our common stock. We intend to retain our earnings for use in our business and, therefore, do not anticipate paying any cash dividends on our common stock for the foreseeable future. Additionally, pursuant to the terms of our existing Loan and Security Agreement with Silicon Valley Bank any decision to pay dividends on our common stock would be subject to the bank’s approval.
The following table provides information about purchases by us of our common stock during the quarter ended June 30, 2008:2009:
Period | Total Number of Shares Purchased | Average Price Paid Per Share | Total Number of Shares Purchased as Part of Publicly Announced Plans or Programs | Approximate Dollar Value of Shares That May Yet be Purchased Under The Plans or Programs (1) | ||||||
April 1, 2008 – April 30, 2008 | 30,000 | $ | 10.86 | 30,000 | $ | 9,893,000 | ||||
May 1, 2008 – May 31, 2008 | 139,089 | $ | 10.91 | 139,089 | 8,376,000 | |||||
June 1, 2008 – June 30, 2008 | 49,900 | $ | 10.14 | 49,900 | 7,870,000 | |||||
Total | 218,989 | $ | 10.73 | 218,989 | $ | 7,870,000 | ||||
Period | Total Number of Shares Purchased | Average Price Paid Per Share | Total Number of Shares Purchased as Part of Publicly Announced Plans or Programs | Approximate Dollar Value of Shares That May Yet be Purchased Under The Plans or Programs (1) | ||||||
April 1, 2009 – April 30, 2009 | — | $ | — | — | $ | 4,802,000 | ||||
May 1, 2009 – May 31, 2009 | 18,638 | $ | 8.49 | 18,638 | $ | 4,644,000 | ||||
June 1, 2009 – June 30, 2009 | 25,377 | $ | 9.59 | 25,377 | $ | 4,401,000 | ||||
Total | 44,015 | $ | 9.12 | 44,015 | $ | 4,401,000 | ||||
| (1) | In April 2008, our board of directors authorized a repurchase program for the repurchase of up to $10.0 million of our common stock. |
Stock Performance Graph
The stock performance graph below compares the percentage change in cumulative stockholder return on our common stock for the period from June 30, 20032004 through June 30, 2008,2009, with the cumulative total return on The NASDAQ Stock Market (U.S.) and the NASDAQ Computer & Data Processing Index.
This graph assumes the investment of $100.00 in our common stock (at the closing price of our common stock on June 30, 2003)2004), The NASDAQ Stock Market (U.S.) and the NASDAQ Computer & Data Processing Index on June 30, 2003,2004, and assumes dividends, if any, are reinvested.
The stock price performance shown on the following graph is not necessarily indicative of future price performance.
Among Bottomline Technologies (de) Inc., The NASDAQ Composite Index
And The NASDAQ Computer & Data Processing Index
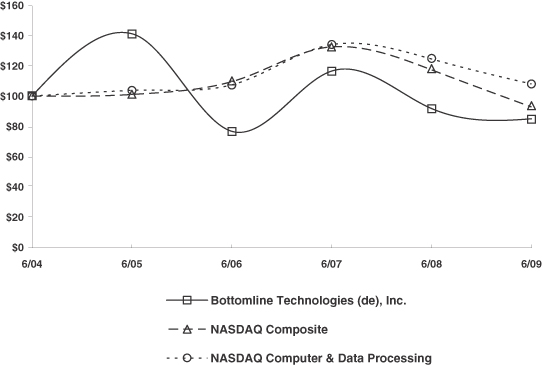
| 6/03 | 6/04 | 6/05 | 6/06 | 6/07 | 6/08 | 6/04 | 6/05 | 6/06 | 6/07 | 6/08 | 6/09 | |||||||||||||
Bottomline Technologies (de), Inc. | 100.00 | 131.35 | 185.50 | 100.87 | 153.04 | 120.57 | 100.00 | 141.23 | 76.79 | 116.51 | 91.79 | 85.00 | ||||||||||||
NASDAQ Composite | 100.00 | 129.09 | 127.97 | 136.00 | 164.15 | 142.67 | 100.00 | 101.09 | 109.49 | 132.47 | 117.33 | 92.91 | ||||||||||||
NASDAQ Computer & Data Processing | 100.00 | 121.02 | 125.04 | 129.29 | 161.03 | 148.94 | 100.00 | 103.70 | 107.43 | 133.90 | 124.41 | 107.96 |
The information included under the heading “Performance Graph” in Item 5 of this Annual Report on Form 10-K is “furnished” and not “filed” and shall not be deemed to be “soliciting material” or subject to Regulation 14A, shall not be deemed “filed” for purposes of Section 18 of the Securities Exchange Act of 1934, as amended (the “Exchange Act”), or otherwise subject to the liabilities of that section, nor shall it be deemed incorporated by reference in any filing under the Securities Act of 1933, as amended, or the Exchange Act.
| Item 6. | Selected Financial Data. |
You should read the following consolidated financial data in conjunction with the Financial Statements, including the related notes, and “Item 7—Management’s Discussion and Analysis of Financial Condition and Results of Operations.” The results shown herein are not necessarily indicative of the results to be expected for any future periods.
SELECTED CONSOLIDATED FINANCIAL DATA
| Fiscal Year Ended June 30, | Fiscal Year Ended June 30, | |||||||||||||||||||||||||||||||||||||
| 2004 | 2005 | 2006 | 2007 | 2008 | 2009 | 2008 | 2007 | 2006 | 2005 | |||||||||||||||||||||||||||||
| (in thousands, except per share data) | (in thousands, except per share data) | |||||||||||||||||||||||||||||||||||||
Statements of Operations Data: | ||||||||||||||||||||||||||||||||||||||
Revenues: | ||||||||||||||||||||||||||||||||||||||
Software licenses | $ | 14,366 | $ | 18,789 | $ | 12,236 | $ | 14,102 | $ | 13,949 | $ | 13,309 | $ | 13,949 | $ | 14,102 | $ | 12,236 | $ | 18,789 | ||||||||||||||||||
Subscriptions and transactions | 9,380 | 12,462 | 22,290 | 26,767 | 29,693 | 31,196 | 29,693 | 26,767 | 22,290 | 12,462 | ||||||||||||||||||||||||||||
Service and maintenance | 41,984 | 49,771 | 52,511 | 63,887 | 74,446 | 84,220 | 74,446 | 63,887 | 52,511 | 49,771 | ||||||||||||||||||||||||||||
Equipment and supplies | 16,402 | 15,483 | 14,628 | 13,579 | 13,153 | 9,289 | 13,153 | 13,579 | 14,628 | 15,483 | ||||||||||||||||||||||||||||
Total revenues | 82,132 | 96,505 | 101,665 | 118,335 | 131,241 | 138,014 | 131,241 | 118,335 | 101,665 | 96,505 | ||||||||||||||||||||||||||||
Cost of revenues: | ||||||||||||||||||||||||||||||||||||||
Software licenses | 1,678 | 2,295 | 1,398 | 744 | 880 | 821 | 880 | 744 | 1,398 | 2,295 | ||||||||||||||||||||||||||||
Subscriptions and transactions | 5,237 | 5,371 | 9,294 | 12,138 | 15,789 | 15,045 | 15,789 | 12,138 | 9,294 | 5,371 | ||||||||||||||||||||||||||||
Service and maintenance | 17,697 | 22,010 | 24,072 | 29,254 | 32,202 | 36,995 | 32,202 | 29,254 | 24,072 | 22,010 | ||||||||||||||||||||||||||||
Stock compensation expense | — | — | 474 | 755 | 987 | 1,105 | 987 | 755 | 474 | — | ||||||||||||||||||||||||||||
Equipment and supplies | 13,312 | 11,980 | 11,639 | 10,168 | 9,551 | 6,875 | 9,551 | 10,168 | 11,639 | 11,980 | ||||||||||||||||||||||||||||
Total cost of revenues | 37,924 | 41,656 | 46,877 | 53,059 | 59,409 | 60,841 | 59,409 | 53,059 | 46,877 | 41,656 | ||||||||||||||||||||||||||||
Gross profit | 44,208 | 54,849 | 54,788 | 65,276 | 71,832 | 77,173 | 71,832 | 65,276 | 54,788 | 54,849 | ||||||||||||||||||||||||||||
Operating expenses: | ||||||||||||||||||||||||||||||||||||||
Sales and marketing | 21,653 | 24,896 | 23,816 | 28,761 | 28,898 | 30,028 | 28,898 | 28,761 | 23,816 | 24,896 | ||||||||||||||||||||||||||||
Stock compensation expense | — | — | 2,489 | 2,893 | 2,841 | 2,489 | 2,841 | 2,893 | 2,489 | — | ||||||||||||||||||||||||||||
Product development and engineering | 19,378 | 16,596 | 15,308 | 11,448 | 9,375 | |||||||||||||||||||||||||||||||||
Product development and engineering | 9,319 | 9,375 | 11,448 | 15,308 | 16,596 | |||||||||||||||||||||||||||||||||
In-process research and development | 842 | — | — | — | — | |||||||||||||||||||||||||||||||||
Stock compensation expense | 41 | 14 | 841 | 761 | 780 | 718 | 780 | 761 | 841 | 14 | ||||||||||||||||||||||||||||
General and administrative | 10,613 | 11,546 | 12,949 | 15,784 | 15,002 | 15,729 | 15,002 | 15,784 | 12,949 | 11,546 | ||||||||||||||||||||||||||||
Stock compensation expense | — | — | 3,180 | 3,536 | 4,195 | 5,186 | 4,195 | 3,536 | 3,180 | — | ||||||||||||||||||||||||||||
Amortization of intangible assets | 4,277 | 3,217 | 4,491 | 9,324 | 11,399 | 15,563 | 11,399 | 9,324 | 4,491 | 3,217 | ||||||||||||||||||||||||||||
Total operating expenses | 46,745 | 49,048 | 59,214 | 76,367 | 79,711 | 89,091 | 79,711 | 76,367 | 59,214 | 49,048 | ||||||||||||||||||||||||||||
Income (loss) from operations | (2,537 | ) | 5,801 | (4,426 | ) | (11,091 | ) | (7,879 | ) | (11,918 | ) | (7,879 | ) | (11,091 | ) | (4,426 | ) | 5,801 | ||||||||||||||||||||
Other income, net | 288 | 444 | 3,252 | 3,177 | 3,082 | 443 | 3,082 | 3,177 | 3,252 | 444 | ||||||||||||||||||||||||||||
Income (loss) before provision (benefit) for income taxes | (2,249 | ) | 6,245 | (1,174 | ) | (7,914 | ) | (4,797 | ) | (11,475 | ) | (4,797 | ) | (7,914 | ) | (1,174 | ) | 6,245 | ||||||||||||||||||||
Provision (benefit) for income taxes | 169 | 357 | 660 | (884 | ) | 464 | 813 | 464 | (884 | ) | 660 | 357 | ||||||||||||||||||||||||||
Net income (loss) | $ | (2,418 | ) | $ | 5,888 | $ | (1,834 | ) | $ | (7,030 | ) | $ | (5,261 | ) | $ | (12,288 | ) | $ | (5,261 | ) | $ | (7,030 | ) | $ | (1,834 | ) | $ | 5,888 | ||||||||||
| Fiscal Year Ended June 30, | Fiscal Year Ended June 30, | |||||||||||||||||||||||||||||||||||||||
| 2004 | 2005 | 2006 | 2007 | 2008 | 2009 | 2008 | 2007 | 2006 | 2005 | |||||||||||||||||||||||||||||||
| (in thousands, except per share data) | (in thousands, except per share data) | |||||||||||||||||||||||||||||||||||||||
Basic net income (loss) per common share | $ | (0.15 | ) | $ | 0.33 | $ | (0.08 | ) | $ | (0.30 | ) | $ | (0.22 | ) | $ | (0.51 | ) | $ | (0.22 | ) | $ | (0.30 | ) | $ | (0.08 | ) | $ | 0.33 | ||||||||||||
Diluted net income (loss) per common share | $ | (0.15 | ) | $ | 0.31 | $ | (0.08 | ) | $ | (0.30 | ) | $ | (0.22 | ) | $ | (0.51 | ) | $ | (0.22 | ) | $ | (0.30 | ) | $ | (0.08 | ) | $ | 0.31 | ||||||||||||
Shares used in computing basic net income (loss) per share | 16,514 | 18,030 | 22,838 | 23,539 | 23,825 | 24,044 | 23,825 | 23,539 | 22,838 | 18,030 | ||||||||||||||||||||||||||||||
Shares used in computing diluted net income (loss) per share | 16,514 | 19,119 | 22,838 | 23,539 | 23,825 | 24,044 | 23,825 | 23,539 | 22,838 | 19,119 | ||||||||||||||||||||||||||||||
Non-GAAP presentation: | ||||||||||||||||||||||||||||||||||||||||
Income (loss) before provision for income taxes | $ | (2,249 | ) | $ | 6,245 | $ | (1,174 | ) | $ | (7,914 | ) | $ | (4,797 | ) | $ | (11,475 | ) | $ | (4,797 | ) | $ | (7,914 | ) | $ | (1,174 | ) | $ | 6,245 | ||||||||||||
Amortization of intangible assets | 4,277 | 3,217 | 4,491 | 9,324 | 11,399 | 15,563 | 11,399 | 9,324 | 4,491 | 3,217 | ||||||||||||||||||||||||||||||
Stock compensation expense | 41 | 14 | 6,984 | 7,945 | 8,803 | 9,498 | 8,803 | 7,945 | 6,984 | 14 | ||||||||||||||||||||||||||||||
Acquisition-related expenses | — | — | 189 | — | 269 | 581 | 269 | — | 189 | — | ||||||||||||||||||||||||||||||
In-process research and development | 842 | — | — | — | — | |||||||||||||||||||||||||||||||||||
(Provision) benefit for income taxes | (169 | ) | (357 | ) | (660 | ) | 884 | (464 | ) | |||||||||||||||||||||||||||||||
Restructuring charges | 1,548 | — | — | — | — | |||||||||||||||||||||||||||||||||||
(Provision for) benefit from income taxes | (813 | ) | (464 | ) | 884 | (660 | ) | (357 | ) | |||||||||||||||||||||||||||||||
Non-GAAP net income | $ | 2,742 | $ | 9,119 | $ | 9,830 | $ | 10,239 | $ | 15,210 | $ | 14,902 | $ | 15,210 | $ | 10,239 | $ | 9,830 | $ | 9,119 | ||||||||||||||||||||
The non-GAAP presentation above consists of a reconciliation of our net income or loss before income taxes to a measure of non-GAAP net income or loss. We present this supplemental information in the form of non-GAAP financial measures, which excludes certain non-cash items—specifically in-process research and development charges, acquisition related expenses, amortization of intangible assets, restructuring charges and stock compensation expense. We believe that this supplemental, non-GAAP presentation is useful to investors because it allows for an evaluation of Bottomline with a focus on the performance of its core operations. Our executive management team, including our chief operating decision maker, uses this same non-GAAP measure internally to assess the on-going performance of Bottomline.
Since the presentation above is not a GAAP measurement of financial performance, there are material limitations to its usefulness on a stand alone basis, including the lack of comparability of this presentation to the GAAP financial results of other companies. Accordingly the non-GAAP information should not be used in isolation from, or as a substitute for, our GAAP results.
Certain prior period amounts have been reclassified to reflect a comparable presentation of where certain classes of employees are now reported within our operating expense categories. Further, for fiscal year 2004 and 2005, we had not yet adopted SFAS 123(R), which requires expense recognition of all stock based compensation.
| Fiscal Year Ended June 30, | Fiscal Year Ended June 30, | |||||||||||||||||||||||||||||
| 2004 | 2005 | 2006 | 2007 | 2008 | 2009 | 2008 | 2007 | 2006 | 2005 | |||||||||||||||||||||
| (in thousands) | (in thousands) | |||||||||||||||||||||||||||||
Balance Sheet Data: | ||||||||||||||||||||||||||||||
Cash and cash equivalents | $ | 20,724 | $ | 20,789 | $ | 38,752 | $ | 38,997 | $ | 35,316 | $ | 50,255 | $ | 35,316 | $ | 38,997 | $ | 38,752 | $ | 20,789 | ||||||||||
Marketable securities | 4,291 | 15,127 | 41,745 | 26,876 | 57 | 48 | 57 | 26,876 | 41,745 | 15,127 | ||||||||||||||||||||
Working capital | 17,991 | 27,552 | 71,874 | 55,321 | 19,803 | 30,678 | 19,803 | 55,321 | 71,874 | 27,552 | ||||||||||||||||||||
Total assets | 91,243 | 110,441 | 175,834 | 189,794 | 201,446 | 183,151 | 198,766 | 189,794 | 175,834 | 110,441 | ||||||||||||||||||||
Long-term debt (capital leases) | — | — | — | 37 | 237 | 125 | 237 | 37 | — | — | ||||||||||||||||||||
Total stockholders’ equity | 59,253 | 72,793 | 136,608 | 140,436 | 138,265 | 120,549 | 138,265 | 140,436 | 136,608 | 72,793 | ||||||||||||||||||||
| Item 7. | Management’s Discussion and Analysis of Financial Condition and Results of Operations |
The following discussion and analysis of our financial condition and results of operations should be read in conjunction with the “Selected Consolidated Financial Data” and the financial statements and notes thereto appearing elsewhere in this Annual Report on Form 10-K. This Annual Report on Form 10-K contains forward-looking statements that involve risks and uncertainties. The statements contained in this Annual Report that are not purely historical are forward-looking statements within the meaning of Section 27A of the Securities Act of 1933 and Section 21E of the Securities Exchange Act of 1934. Without limiting the foregoing, the words “may,” “will,” “should,” “could,” “expects,” “plans,” “intends,” “anticipates,” “believes,” “estimates,” “predicts,” “potential” and similar expressions are intended to identify forward-looking statements. All forward-looking statements included in this Annual Report on Form 10-K are based on information available to us up to and including the date of this document, and we assume no obligation to update any such forward-looking statements. Our actual results could differ materially from those anticipated in these forward-looking statements as a result of certain factors, including those set forth in “Management’s Discussion and Analysis of Financial Condition and Results of Operations” and “Risk Factors” and elsewhere in this Form 10-K. You should carefully review those factors and also carefully review the risks outlined in other documents that we file from time to time with the Securities and Exchange Commission.
Overview
We provide electronic payment, invoice and document management solutions to corporations, financial institutions and banks around the world. Our solutions are used to streamline, automate and manage processes and transactions involving global payments, invoice receipt and approval, collections, cash management, risk mitigation, document management, reporting and document archive. We offer software designed to run on-site at the customer’s location as well as hosted solutions. Historically, our software has been sold predominantly on a perpetual license basis. Today, however, certain of our newer offerings are being sold on a subscription and transaction basis.
Our corporate customers rely on our solutions to automate their payment and accounts payable processes and to streamline and manage the production and retention of electronic documents. We also provide Legal eXchange®, a Software as a Service (SaaS) offering that receives, manages and controls legal invoices and the related spend management for insurance companies and other large consumers of outside legal services. Our offerings also include software solutions that banks use to provide web-based payment and reporting capabilities to their corporate customers.
Our solutions complement and leverage our customers’ existing information systems, accounting applications and banking relationships. As a result, our solutions can be deployed quickly and efficiently. To help our customers receive the maximum value from our products and meet their own particular needs, we also provide professional services for installation, training, consulting and product enhancement.
For thefiscal year ended June 30, 2008,2009, our revenuesrevenue increased to $131.2$138.0 million from $118.3$131.2 million in the prior year. This revenue increase was primarily attributable to an increase in revenues in our Payments and Transactional Documents operating segment. The revenue increase within this segment was driven principally by an increase in software maintenance revenue associated with our Formscape products and the revenue contribution from Optio Software, which we acquired in April 2008. To a lesser degree, the overall revenue increase was driven by an increase in the revenue contribution2008, and increased revenues from our Banking Solutions and our Legal eXchange products, due toproduct offering as a result of continued strong demand for these offerings. The revenue increase also reflects an impactcustomer adoption of approximately $1.9that product. These increases were offset in part by a decrease of $10.7 million as a result of increasingdeclining foreign exchange rates associated with the British Pound Sterling and the European Euro, which has appreciateddepreciated against the US dollar overDollar during fiscal year 2009.
We had a net loss of $12.3 million in fiscal year 2009 compared to a net loss of $5.3 million in 2008. The net loss in fiscal year 2009 reflected $25.1 million of expense associated with the past year.amortization of intangible assets and stock compensation. The increase of approximately $4.2 million in intangible asset amortization during fiscal year 2009 as compared to fiscal year 2008 principally reflects the expense impact of intangible assets associated with Optio Software, Inc., which we acquired in April 2008. Increases in our cost of revenue
During
and operating expense categories during fiscal year 2009 as compared to fiscal year 2008 largely reflect our overall increased operating costs as a result of our Optio acquisition and our general business growth, offset in part by a decrease of approximately $9.4 million due to a decline in foreign exchange rates associated with the British Pound Sterling and European Euro. Increases in our operating costs also reflect approximately $3.0 million (inclusive of approximately $1.4 million of stock compensation) of costs associated with severance related expenses incurred as a result of a workforce reduction of approximately 40 full-time positions and the departure of our Chief Operating Officer, during 2009.
In fiscal year 2009, we derived approximately 43%47% of our revenue through our international operations, the majorityfrom customers located outside of which was attributable to the UK.North America, principally in Europe and Australia. We expect future revenue growth to be driven by increased purchases of our products by new and existing bank and financial institution customers in both North America and international markets, the continued market adoptionincreased sales of our Legal eXchangepayments and transactional documents products, in the US, increased purchases of our payment and document management solutions by enterprise customers, the contribution of a full year’s revenue from our acquisition of Optio Software and the continued contribution of revenue from our newer subscription and transaction based products. Asproducts, and the demand forcontinued market adoption of our banking productsLegal eXchange product in the US. Upon the completion of our PayMode acquisition, which we expect to occur in September 2009, we also expect contribution to revenue from PayMode.
While we continued to grow our business, the overall economic environment during 2009 represented a significant challenge. While we did not experience any significant decline in our overall volume of customer orders we did observe that, in some cases, closing new business took somewhat longer. We also observed instances where customer buying decisions were postponed. Our customers operate in many different industries; a diversification that we believe continues to grow,help us in a challenging economic climate. Additionally, we are attemptingbelieve that our recurring and subscription revenue base helps position us defensively against any short term economic downturn. While we believe that we continue to develop opportunities to structure somecompete favorably in all of the markets we serve, ongoing or worsening economic stresses could impact our software license terms for certain of these productsbusiness more significantly in the form of annual subscription based pricing or revenue share. To the extent that this type of revenue model became more prevalent, we would likely experience more rapid revenue growth in our subscription and transaction based revenue streams than we would in our software license and maintenance revenue streams.future.
We had a net loss of $5.3 million during fiscal ended June 30, 2008 compared to a net loss of $7.0 million in the year ended June 30, 2007. The net loss in the year ended June 30, 2008 reflected $20.2 million of expense associated with the amortization of intangible assets and stock compensation. The increase of $2.1 million in intangible asset amortization in 2008 as compared to 2007 reflects the expense impact of our current year acquisition of Optio Software and a full year’s impact of our prior year acquisition of Formscape. Increases in other operating expense categories during the fiscal year ended June 30, 2008 largely reflect our overall increased operating costs as a result of current and prior year acquisitions and our general business growth.
Revenue Sources
Our revenues are derived from multiple sources, and are reported under the following classifications:
| • | Software License Fees. Software license revenues, which we derive from our software applications, are generally based on the number of software applications and user licenses purchased. Fees from the sale of perpetual software licenses are generally recognized upon delivery of the software to the customer, assuming that payment from the customer is deemed probable and there are no extended payment terms. However, certain of our software arrangements, particularly those related to banking and financial institution customers, are recognized on a percentage of completion basis over the life of the project because they require significant customization and modification and involve extended implementation periods. |
| • | Subscription and Transaction Fees. We derive subscription and transaction fees from a number of sources, principally our hosted products such as Legal eXchange and, to a lesser extent, certain of our newer solutions which are sold on a subscription, rather than a perpetual license, basis. Subscription revenues are typically recognized on a ratable basis over the subscription period. Transaction revenues are typically recorded at the time transactions are processed. Some of our hosted products require customers to pay non-refundable set up or installation fees. In these cases, since the up-front fees do not represent a separate revenue earnings process, |
| • | Service and Maintenance Fees. Our service and maintenance revenues consist of professional services fees and customer support and maintenance fees. Revenues relating to professional services not associated with customized software solutions are normally recognized at the time services are rendered. Professional services revenues associated with software license arrangements that include |
significant customization and modification are generally recognized on a percentage of completion basis over the life of the project. Software maintenance fees |
| • | Equipment and Supplies Revenues. We derive equipment and supplies revenues from the sale of printers, check paper and magnetic ink character recognition toners. These revenues are normally recognized at the time of delivery. Equipment and supplies revenue also includes postage and shipping related charges billed to customers. |
Reclassifications
Certain prior year amounts have been reclassified to conform to the current year presentation in our consolidated financial statements.
Critical Accounting Policies and Significant Judgments and Estimates
We believe that several accounting policies are important to understanding our historical and future performance. We refer to such policies as “critical” because these specific areas generally require us to make judgments and estimates about matters that are uncertain at the time we make the estimate, and different estimates—which also would have been reasonable—could have been used. These critical accounting policies and estimates relate to stock-based compensation, revenue recognition, the valuation of goodwill and intangible assets, and the valuation of acquired deferred revenue. These critical policies and our procedures related to these policies are discussed below. In addition, refer to Note 2 to the accompanying consolidated financial statements for a discussion of all of our significant accounting policies.
Stock Based Compensation
In fiscal year 2006, we adopted accounting rulesStatement of Financial Accounting Standard No. 123 (revised 2004), “Share Based Payment” (SFAS 123R, “Share-Based Payment”) requiring123R), requires the expense recognition of the estimated fair value of all share-based payments issued to employees. Prior to this, the estimated fair value associated with these awards was not recorded as an expense but rather was disclosed in a footnote to our financial statements. For the fiscal years ended June 30, 2006,2009, 2008 and 2007, and 2008, we recorded approximately $7.0$9.5 million, $7.9$8.8 million, and $8.8$7.9 million of expense associated with share-based payments, respectively. The substantial majority of this expense is related to awards of stock options and restricted stock.
The valuation of employee stock options is an inherently subjective process, since market values are generally not available for long-term, non-transferable employee stock options. Accordingly, anwe use a Black-Scholes option pricing model is utilized to derive an estimated fair value. In calculating the estimated fair value of our stock options, we use aThe Black-Scholes pricing model which requires the consideration of the following variables for purposes of estimating fair value:
the stock option exercise price,
the expected term of the option,
the grant date price of our common stock,
the expected volatility of our common stock,
expected dividends on our common stock (we do not anticipate paying dividends for the foreseeable future), and
the risk free interest rate for the expected option term.
Of the variables above, the selection of an expected term and expected stock price volatility are the most subjective. For purposes of estimating the expected option term, we review and consider our historic option activity, particularly the underlying option holding period (including the holding period inherent in currently vested but unexercised options) and, for. For stock options granted during 2008,2009 we estimated an expected term between
4.3 and 4.4 years. In estimating our stock price volatility, we analyzedanalyze our historical volatility for a period equal to the expected term of our stock option awards and, by reference to actual stock prices duringover this period, estimated volatility ranging from 44%45% to 48%50% for options granted during fiscal 2008.2009. We believe that each of these estimates, both expected term and volatility, are reasonable in light of the historical data we analyzed. However, as with any estimate, the ultimate accuracy of these estimates is only verifiable over time.
A portion of the stock option expense recorded during fiscal year 20082009 relates to the continued vesting of stock options that were granted prior to our adoption of the expense recognition requirements in fiscal year 2006. In accordance with the transition provisions of SFAS 123R, the grant date estimates of fair value associated with awards granted prior to fiscal 2006, which were also calculated using a Black-Scholes option pricing model, have not been changed. The specific valuation assumptions that were utilized for purposes of deriving an estimate of fair value at the time that prior awards were issued are as disclosed in our prior filings on Form 10-K.
Revenue Recognition
We derive our revenues from the sale of perpetual and subscription based software licenses, hosted subscription and transactional based product offerings, professional services, software maintenance and equipment and supplies. We recognize revenue when persuasive evidence of an arrangement exists, delivery of the product has occurred, the fee is fixed and determinable and collectibilitycollectability is probable. We consider a non-cancelable fully executed agreement or customer purchase order to be persuasive evidence of an arrangement. We consider delivery to have occurred upon transfer of product title to the customer, or completion of services rendered. We consider the fee to be fixed or determinable if the fee is not subject to adjustment or if we have not granted extended payment terms to the customer. Excluding our long-term contract arrangements for which revenue is recorded on a percentage of completion basis, our normal customer payment terms do not exceed 90 days from the date of delivery. To help secure revenue arrangements and enhance ourthe predictability of future revenue, we
periodically offer customers the ability to pay on an extended payment term basis. If extended payment terms are granted to a customer, revenue is recorded as payments become contractually due, assuming all other revenue recognition criteria have been met. We consider collection to be probable if our internal credit analysis indicates that the customer will be able to pay contractually committed amounts as they become due under the arrangement.
Our sales arrangements can contain multiple revenue elements, such as perpetual or subscription based software licenses, transaction fees, professional services, and software maintenance. Revenue earned on software arrangements involving multiple elements which qualify for separate element treatment is allocated to each element based on the relative fair values of those elements. Revenue allocated to the software element is based on the “residual value” method, under which revenue equal to the fair value of professional services and software support is allocated to those items based on their fair value and recognized as revenue as those items are delivered. Any “residual” or remaining portion of the total arrangement fee is then allocated to the software license. Revenue is recognized for each element when all of the aforementioned revenue recognition criteria have been met.
Certain of our software arrangements require significant customization and modification and involve extended implementation periods. These arrangements do not qualify for separate element revenue recognition treatment as described above, and instead must be accounted for under contract accounting. Under contract accounting, companies must select from two generally accepted methods of accounting: the completed contract method and the percentage of completion method. The completed contract method recognizes revenue onlyand costs upon contract completion, and all project costs and revenues are reported as deferred items in the balance sheet until that time. The percentage of completion method recognizes revenue and costs on a contract over time, as the work progresses.
We have historically used the percentage of completion method of accounting for our long-term contracts, as we believe that we can make reasonably reliable estimates of progress toward completion. Progress is measured based on labor hours, as measured at the end of each reporting period, as a percentage of total expected labor hours. Accordingly, the revenue we record in any reporting period for arrangements accounted for on a
percentage of completion basis is dependent upon our estimates of the remaining labor hours that will be incurred in fulfilling our contractual obligations. Our estimates at the end of any reporting period could prove to be materially different from final project results, as determined only at subsequent stages of project completion. To mitigate this risk, we solicit the input of our project professional staff on a monthly basis, as well as at the end of each financial reporting period, for purposes of evaluating cumulative labor hours incurred and verifying the estimated remaining effort to completion, so that our estimates are always based on the most current projections available.
Goodwill and Intangible Assets
We account for our goodwill and intangible assets under the provisions of Statement of Financial Accounting Standards No. 142 “Goodwill and Other Intangible Assets” (SFAS 142). We are required to perform an annual impairment test of our goodwill and for fiscal 20082009 we performed this review during our fourth quarter (which is consistent with the historic timing of our annual goodwill impairment review). Based on this review, we concluded that there was no goodwill impairment. Our analysis was performed at the “reporting unit” level and required an estimate of the fair value of each reporting unit. Based on the results of this review we concluded that none of our reporting units were impaired. However, there can be no assurance that there will not be impairment charges in subsequent periods as a result of our future impairment reviews. To the extent that future impairment charges occurred it would likely have a material impact on our financial results. At June 30, 2008,2009, the carrying value of goodwill for all of our reporting units was approximately $72$65 million.
In addition to our annual goodwill impairment review we also perform periodic reviews of the carrying value of our other intangible assets. These intangible assets consist primarily of acquired core technology and acquired customer related intangibles such as acquired customer lists and customer contracts. In evaluating potential impairment of these assets we specifically consider whether any indicators of impairment are present, including:
whether there has been a significant decreaseadverse change in the market pricebusiness climate that affects the value of an asset;
whether there has been a significant adverse change in the extent or manner in which an asset is used; and
whether there is an expectation that the asset will be sold or disposed of before the end of its originally estimated useful life.
If indicators of impairment are present, an estimate of the undiscounted cash flows that the specific asset is expected to generate must be made to ensure that the carrying value of the asset can be recovered. These estimates involve significant subjectivity. At June 30, 2008,2009, the carrying value of our intangible assets, excluding goodwill, was approximately $43$25 million. As a result of our fiscal 20082009 impairment review we concluded that none of these assets were deemed to be impaired.
Valuation of Acquired Intangible Assets and Acquired Deferred Revenue
In connection with our recent acquisitions we have recorded intangible assets relating principally to acquired technology and customer related intangible assets. The valuation process used to calculate the values assigned to these acquired intangible assets is complex and involves significant estimation relative to our financial projections. The principal component of the valuation process is the determination of discounted future cash flows, and there are a number of variables that we consider for purposes of projecting these future cash flows. There is inherent uncertainty involved with this estimation process and, while our estimates are consistent with our internal planning assumptions, the ultimate accuracy of these estimates is only verifiable over time. Further, the projections required for the valuation process generally utilize at least a ten-year forecast, which exceeds our normal internal planning and forecasting timeline. The particularly sensitive components of these estimates include, but are not limited to:
the selection of an appropriate discount rate;
the required return on all assets employed by the valued asset to generate future income streams;
our projected overall revenue growth and mix of revenue;
our gross margin estimates (which are highly dependent on our mix of revenue);
our technology and product life cycles;
the attrition rate of our customers, particularly those who contribute to our recurring revenue streams, such as software maintenance;
our planned level of operating expenses; and
our effective tax rate.
| ��� | our effective tax rate. |
Additionally, we are required to estimate the acquisition date fair value of software maintenance contracts that we assume as part of any acquisition (such as with our April 2008 acquisition of Optio). The estimated fair value of these acquired contracts is established as deferred revenue in the acquisition purchase price allocation and is recorded as revenue by us over the remaining contractual period. The acquisition date fair value of these arrangements is estimated based on the historical and projected costs we expect to incur in fulfilling the arrangements, plus a normal profit margin. These costs exclude amounts relating to any selling effort, since those costs would have been incurred by the predecessor company rather than by us. The cost estimates also exclude any ongoing research and development expenses associated with product upgrades since these amounts do not represent a legal obligation that we assume at the time of acquisition.
Recent Accounting Pronouncements
Determination of the Useful Life of Intangible Assets
In April 2008, the Financial Accounting Standards Board (FASB) issued FASB Staff Position (FSP) FAS 142-3,Determination “Determination of the Useful Life of Intangible Assets.Assets.” FSP FAS 142-3 amends the factors that should be considered in developing renewal or extension assumptions used to determine the useful life of a recognized intangible asset under FASB Statement No. 142,Goodwill and Other Intangible Assets.SFAS 142. FSP FAS 142-3 is effective for fiscal years beginning after December 15, 2008 (July 1, 2009 for us) and early adoption is prohibited. We are currently evaluatingdo not expect the impactadoption of this pronouncement to have a material impact on our consolidated financial statements.
Business Combinations
In December 2007, the FASB issued Statement No. 141(R), “Business Combinations” (SFAS 141(R)) which will significantly change the accounting for and reporting of business combination transactions. The most significant changes in the accounting for business combinations under SFAS 141(R) include:
Valuation of any acquirer shares issued as purchase consideration will be measured at fair value as of the acquisition date;
Contingent purchase consideration, if any, will generally be measured and recorded at the acquisition date, at fair value, with any subsequent change in fair value reflected in earnings rather than through an adjustment to the purchase price allocation;
Acquired in-process research and development costs, which have historically been expensed immediately upon acquisition, will now be capitalized at their acquisition date fair values, measured for impairment (without recurring amortization) over the remaining development period and, upon completion of a successful development project, amortized to expense over the asset’s estimated useful life;
Acquisition related costs will be expensed as incurred rather than capitalized as part of the purchase price allocation; and
Acquisition related restructuring cost accruals will be reflected within the acquisition accounting only if certain specific criteria are met as of the acquisition date. The prior accounting convention, which permitted an acquirer to record restructuring accruals within the purchase price allocation as long as certain, broad criteria had been met, generally around formulating, finalizing and communicating certain exit activities, will no longer be permitted.
SFAS 141(R) is effective for the first annual reporting period beginning on or after December 15, 2008 and earlier adoption is not permitted. Accordingly, the Company will adoptwe adopted SFAS 141(R) on July 1, 2009. The Company expectsWe expect that the adoption of this pronouncement will significantly affect how it accountswe account for business combination transactions consummated after the adoption date, in the areas noted above.
Accounting and Reporting of Noncontrolling Interests
In December 2007, the FASB issued SFAS No. 160, “Noncontrolling Interests in Consolidated Financial Statements, an Amendment of ARB No. 51” (SFAS 160). SFAS 160 clarifies the accounting for noncontrolling interests and establishes accounting and reporting standards for the noncontrolling interest in a subsidiary, including the requirement that the noncontrolling interest be classified as a component of equity. SFAS 160 is required to be adopted simultaneously with SFAS 141(R). The Company isWe are not presently a party to any transaction in which it haswe have a noncontrolling interest and, accordingly, doesdo not currently believe that this pronouncement will have a significant impact on itsour financial condition, results of operations or cash flows.
Fair Value Measurements
In September 2006, the FASB issued Statement No. 157, “Fair Value Measurements” (SFAS 157). The statement defines fair value, establishes a framework for measuring fair value, and expands disclosures about fair value measurements. In February 2008, the FASB issued FASB Staff Position No. FAS 157-2, “Effective Date of FASB Statement No. 157” (FSP 157-2). FSP 157-2 delayed the effective date of SFAS 157 to fiscal years beginning after November 15, 2008 for nonfinancial assets and nonfinancial liabilities, except for items that are recognized or disclosed at fair value in the financial statements on a recurring basis (at least annually). SFAS 157 became effective for us on July 1, 2008, excluding the items deferred by FSP 157-2 which became effective for us on July 1, 2009. SFAS 157 has resulted in additional disclosures within our consolidated financial statements, as further described in Note 2 to our financial statements.
Fair Value Option for Financial Assets and Financial Liabilities
In February 2007, the FASB issued Statement No. 159, “The Fair Value Option for Financial Assets and Financial Liabilities, including an amendment of FASB Statement No. 115” (SFAS 159). The statement permits all entities to choose, at specified election dates, to measure eligible items at fair value. Additionally, the statement requires that entities report unrealized gains and losses on items for which the fair value option has been elected in earnings. The statement also establishes additional presentation and disclosure requirements. SFAS 159 is effective for fiscal years beginning after November 15, 2007, with early adoption permitted, provided that the entity also adopts Statement 157. SFAS 159 became effective for us on July 1, 2008,2008; however, as we did not elect to measure any items at fair value, its adoption did not have an impact on our consolidated financial statements.
Fair Value Measurements
In September 2006, the FASB issued Statement No. 157, “Fair Value Measurements” (SFAS 157). The statement defines fair value, establishes a framework for measuring fair value, and expands disclosures about fair value measurements. In February 2008, the FASB issued FASB Staff Position No. FAS 157-2, “Effective Date of FASB Statement No. 157” (FSP 157-2). FSP 157-2 delays the effective date of SFAS 157 to fiscal years beginning after November 15, 2008 for nonfinancial assets and nonfinancial liabilities, except for items that are recognized or disclosed at fair value in the financial statements on a recurring basis (at least annually). SFAS 157 became effective for us on July 1, 2008, excluding the items deferred by FSP 157-2 which will become effective for us on July 1, 2009. We expect that SFAS 157 will result in additional disclosures within our consolidated financial statements.
Income Tax Uncertainties
We adopted the provisions of FASB Interpretation No. 48, “Accounting for UncertantiesUncertainties in Income Taxes”, or FIN 48, on July 1, 2007. As a result of our adoption of FIN 48, we recorded a decrease to our tax reserves and our accumulated deficit in the amount of $0.1 million during the first quarter of fiscal 2008.
Results of Operations
Fiscal Year Ended June 30, 2009 Compared to Fiscal Year Ended June 30, 2008
Revenues by Segment
We have aggregated similar operating segments into three reportable segments: Payments and Transactional Documents, Banking Solutions and Outsourced Solutions. The following table represents our revenues by segment:
| For the Fiscal Year Ended June 30, | |||||||||||||||
| 2009 | 2008 | Increase (Decrease) Between Periods | |||||||||||||
| Revenues | As % of total | Revenues | As % of total | Revenues | % Change | ||||||||||
| (in thousands) | |||||||||||||||
Payments and Transactional Documents | $ | 90,786 | 65.8 | $ | 84,962 | 64.7 | $ | 5,824 | 6.9 | ||||||
Banking Solutions | 22,936 | 16.6 | 22,107 | 16.9 | 829 | 3.7 | |||||||||
Outsourced Solutions | 24,292 | 17.6 | 24,172 | 18.4 | 120 | 0.5 | |||||||||
| $ | 138,014 | 100.0 | $ | 131,241 | 100.0 | $ | 6,773 | 5.2 | |||||||
Payments and Transactional Documents.The revenue increase for the fiscal year ended June 30, 2009 was primarily attributable to the revenue contribution from Optio, which we acquired in April 2008. This increase was offset in part by a decrease of $9.2 million as a result of declining foreign exchange rates associated with the British Pound Sterling and European Euro. We expect revenue for the Payments and Transactional Documents segment to increase in fiscal 2010 as a result of increased sales of our payment and document management solutions.
Banking Solutions.Revenues from our Banking Solutions segment increased as compared to fiscal 2008, as we continued to generate revenue from several large new and ongoing banking projects. We expect revenues for the Banking Solutions segment to increase in fiscal year 2010 as a result of the contribution of revenue from ongoing projects and from additional purchases by new and existing bank and financial institution customers in both North America and international markets.
Outsourced Solutions.The slight increase in revenue for the fiscal year ended June 30, 2009 was due to revenue increases related to our Legal eXchange product offering, offset in part by decreases in European foreign currency exchange rates of $1.6 million and a decrease in revenue from certain of our legacy outsourced accounts payable automation products in Europe. We expect revenue for the Outsourced Solutions segment to increase during fiscal year 2010 as current customers of Legal eXchange move from the implementation phase (during which no revenue is recorded) into live production and as a result of the revenue contribution from PayMode. We expect to complete the PayMode acquisition in September 2009.
Revenues by Category
| Fiscal Year Ended June 30, | Increase (Decrease) Between Periods | ||||||||||||
| 2009 | 2008 | 2009 Compared to 2008 | |||||||||||
| (in thousands) | % | ||||||||||||
Revenues: | |||||||||||||
Software licenses | $ | 13,309 | $ | 13,949 | $ | (640 | ) | (4.6 | ) | ||||
Subscriptions and transactions | 31,196 | 29,693 | 1,503 | 5.1 | |||||||||
Service and maintenance | 84,220 | 74,446 | 9,774 | 13.1 | |||||||||
Equipment and supplies | 9,289 | 13,153 | (3,864 | ) | (29.4 | ) | |||||||
Total revenues | $ | 138,014 | $ | 131,241 | $ | 6,773 | 5.2 | ||||||
Software Licenses.The decrease in software license revenues was due principally to a decrease of approximately $1.0 million as a result of declining foreign exchange rates associated with the British Pound Sterling and the European Euro and a small decrease in certain of our domestic payments and documents software license revenues, offset in part by the revenue contribution from Optio and an increase in revenue due to an increase in demand for certain of our European payment products. We expect software license revenues to increase in fiscal year 2010.
Subscriptions and Transactions.The increase in subscription and transaction revenues was due principally to the revenue contribution from new Legal eXchange customers and the revenue contribution from certain Optio products that are sold on a subscription basis. These increases were offset in part by a decrease of $3.0 million as a result of declining foreign exchange rates associated with the British Pound Sterling. We expect subscription and transaction revenues to increase in fiscal year 2010 as a result of new orders for our subscription and transaction based product offerings, the revenue contribution from new Legal eXchange customers, the revenue contribution from a subscription-based arrangement in our Banking Solutions segment and as a result of the revenue contribution from PayMode. We expect to complete the PayMode acquisition in September 2009.
Service and Maintenance.The increase in service and maintenance revenues was primarily the result of the revenue contribution from Optio and an increase in professional services from our Banking segment and certain of our European operations. These increases were offset in part by a decrease of $5.0 million as a result of declining foreign exchange rates associated with the British Pound Sterling and European Euro. We expect that service and maintenance revenues will increase in fiscal year 2010 as a result of the revenue contribution from new and existing projects within our Banking Solutions segment.
Equipment and Supplies. The decrease in equipment and supplies revenues was principally due to our continued de-emphasis of lower margin transactions within this aspect of our business and a decrease of approximately $1.8 million as a result of declining foreign exchange rates associated with the British Pound Sterling. We expect that equipment and supplies revenues will increase slightly in fiscal year 2010.
Cost of Revenues
| Fiscal Year Ended June 30, | Increase (Decrease) Between Periods | ||||||||||||
| 2009 | 2008 | 2009 Compared to 2008 | |||||||||||
| (in thousands) | % | ||||||||||||
Cost of revenues: | |||||||||||||
Software licenses | $ | 821 | $ | 880 | $ | (59 | ) | (6.7 | ) | ||||
Subscriptions and transactions | 15,045 | 15,789 | (744 | ) | (4.7 | ) | |||||||
Service and maintenance | 36,995 | 32,202 | 4,793 | 14.9 | |||||||||
Stock compensation expense | 1,105 | 987 | 118 | 12.0 | |||||||||
Equipment and supplies | 6,875 | 9,551 | (2,676 | ) | (28.0 | ) | |||||||
Total cost of revenues | $ | 60,841 | $ | 59,409 | $ | 1,432 | 2.4 | ||||||
Gross profit | $ | 77,173 | $ | 71,832 | $ | 5,341 | 7.4 | ||||||
Software Licenses.Software license costs consist of expenses incurred by us to manufacture, package and distribute our software products and related documentation and costs of licensing third party software that is incorporated into or sold with certain of our products. Software license costs remained consistent at 6% of software license revenues in the fiscal years ended June 30, 2009 and 2008. We expect that software license costs will remain relatively consistent, as a percentage of software license revenues, in fiscal year 2010.
Subscriptions and Transactions. Subscriptions and transaction costs include salaries and other related costs for our professional services teams as well as costs related to our hosting infrastructure such as depreciation and
facilities related expenses. Subscriptions and transactions costs decreased to 48% of subscription and transaction revenues in the fiscal year ended June 30, 2009 from 53% in the fiscal year ended June 30, 2008. The decrease in subscription and transaction costs as a percentage of revenue was due principally to the overall increase in our subscription and transaction revenue streams, some of which is related to our acquisition of Optio, improved margins for our transactional revenue streams in Europe and the shift of certain expenses from the subscriptions and transactions cost of sales category to the service and maintenance costs of sales category based on changes in where internal resources were deployed. We expect that subscription and transaction costs will decrease as a percentage of subscription and transaction revenue in fiscal year 2010, but will increase in dollar terms due to the expense impact of PayMode. We expect to complete the PayMode acquisition in September 2009.
Service and Maintenance.Service and maintenance costs include salaries and other related costs for our customer service, maintenance and help desk support staffs, as well as third party contractor expenses used to complement our professional services team. Service and maintenance costs increased as a percentage of service and maintenance revenues to 44% in the fiscal year ended June 30, 2009 as compared to 43% in the fiscal year ended June 30, 2008. The increase in service and maintenance costs as a percentage of service and maintenance revenues was due to lower margins in our Banking Solutions segment as we continued to expand our professional service and support teams to support new customers, the impact of the fair value discount applied to acquired software maintenance contracts in the Optio acquisition, and the shift of certain expenses from the subscriptions and transactions cost of sales category to the service and maintenance costs of sales category based on changes in where internal resources were deployed. In dollar terms, service and maintenance costs for fiscal 2009 were impacted by $0.3 million of expense associated with restructuring activities occurring during the year. We expect that service and maintenance costs will decrease as a percentage of service and maintenance revenue in fiscal year 2010.
Equipment and Supplies. Equipment and supplies costs include the costs associated with equipment and supplies that we resell, as well as freight, shipping and postage costs associated with the delivery of our products. Equipment and supplies costs remained relatively consistent at 74% of equipment and supplies revenues in the fiscal year ended June 30, 2009 compared to 73% of equipment and supplies revenues in the fiscal year ended June 30, 2008. The slight increase in equipment and supplies costs as a percentage of equipment and supplies revenues was due to an unfavorable mix of lower margin revenue transactions (supplies versus equipment) and due to higher costs of certain supplies in the fiscal year ended June 30, 2009. We expect that equipment and supplies costs will remain relatively consistent as a percentage of equipment and supplies revenues in fiscal year 2010.
Operating Expenses
| Fiscal Year Ended June 30, | Increase (Decrease) Between Periods | ||||||||||||
| 2009 | 2008 | 2009 Compared to 2008 | |||||||||||
| (in thousands) | % | ||||||||||||
Operating expenses: | |||||||||||||
Sales and marketing | $ | 30,028 | $ | 28,898 | $ | 1,130 | 3.9 | ||||||
Stock compensation expense | 2,489 | 2,841 | (352 | ) | (12.4 | ) | |||||||
Product development and engineering | 19,378 | 16,596 | 2,782 | 16.8 | |||||||||
Stock compensation expense | 718 | 780 | (62 | ) | (7.9 | ) | |||||||
General and administrative | 15,729 | 15,002 | 727 | 4.8 | |||||||||
Stock compensation expense | 5,186 | 4,195 | 991 | 23.6 | |||||||||
Amortization of intangible assets | 15,563 | 11,399 | 4,164 | 36.5 | |||||||||
Total operating expenses | $ | 89,091 | $ | 79,711 | $ | 9,380 | 11.8 | ||||||
Sales and Marketing.Sales and marketing expenses consist primarily of salaries and other related costs for sales and marketing personnel, sales commissions, travel, public relations and marketing materials and trade show participation. Sales and marketing expenses increased in the fiscal year ended June 30, 2009 as compared to the fiscal year ended June 30, 2008 due to expenses of $0.3 million associated with restructuring activities that occurred during 2009 and higher operating costs, largely as a result of headcount-related cost increases from our Optio acquisition. These increases were offset in part by a decrease of $2.5 million as a result of declining foreign exchange rates associated with the British Pound Sterling and the European Euro. We expect that sales and marketing expenses will increase in fiscal year 2010 as we continue to focus on our marketing initiatives to support our new and existing products and due to costs related to PayMode. We expect to complete the PayMode acquisition in September 2009.
Product Development and Engineering.Product development and engineering expenses consist primarily of personnel costs to support product development, which consists of enhancements and revisions to our products based on customer feedback and general marketplace demands, as well as development of our newer accounts payable automation products. The increase in product development and engineering expenses was primarily attributable to expenses of $0.2 million associated with restructuring activities that occurred during 2009, expenses associated with the activities of Optio and a decrease in the use of development resources in revenue-generating roles during the period the cost of which, to the extent occurring, is recorded as a cost of revenue. These increases were offset in part by a decrease of $0.8 million as a result of declining foreign exchange rates associated with the British Pound Sterling and the European Euro. We expect that product development and engineering expenses will increase in fiscal year 2010, largely as a result of the impact of PayMode. We expect to complete the PayMode acquisition in September 2009.
General and Administrative. General and administrative expenses consist primarily of salaries and other related costs for operations and finance employees and legal and accounting services. The increase in general and administrative expenses was principally attributable to expenses of $0.7 million associated with restructuring activities that occurred during 2009, acquisition-related costs of $0.6 million that were expensed in accordance with the accounting transition requirements of SFAS 141(R) and increased headcount costs, partially related to Optio. These increases were offset in part by a decrease of $1.0 million due to a decline in the foreign exchange rate of the British Pound Sterling and a decrease in the use of third party contractors. We expect that general and administrative expenses will remain relatively consistent during fiscal year 2010.
Stock Compensation Expense. During the fiscal year ended June 30, 2009, stock compensation expense increased to $9.5 million as compared to $8.8 million for the fiscal year ended June 30, 2008. This increase was due primarily to expense of approximately $1.4 million associated with restructuring activities that occurred in 2009, offset in part by the completion of vesting of awards with a higher valuation. The expense associated with share based payments is recorded as expense within the same functional expense category in which cash compensation for the applicable employee is recorded. For the fiscal year ended June 30, 2009 and 2008, stock compensation expense was allocated as follows:
| Fiscal Year Ended June 30, | Increase (Decrease) Between Periods | ||||||||||||
| 2009 | 2008 | 2009 Compared to 2008 | |||||||||||
| (in thousands) | % | ||||||||||||
Cost of revenues: service and maintenance | $ | 1,105 | $ | 987 | $ | 118 | 12.0 | ||||||
Sales and marketing | 2,489 | 2,841 | (352 | ) | (12.4 | ) | |||||||
Product development and engineering | 718 | 780 | (62 | ) | (7.9 | ) | |||||||
General and administrative | 5,186 | 4,195 | 991 | 23.6 | |||||||||
Total stock compensation expense | $ | 9,498 | $ | 8,803 | $ | 695 | 7.9 | ||||||
During fiscal year 2010, we expect stock compensation expense to decrease due to the non-recurring effect of restructuring costs incurred in fiscal 2009.
Amortization of Intangible Assets. Amortization expense increased as a result of the increase in intangible assets arising from our acquisition of Optio Software in April 2008. At current intangible asset levels, we expect that total amortization expense for fiscal 2010 will approximate $11.8 million. This excludes any impact from the acquisition of PayMode; which we expect to complete in September 2009.
Other Income (Expense), Net
| Fiscal Year Ended June 30, | Increase (Decrease) Between Periods | ||||||||||||||
| 2009 | 2008 | 2009 Compared to 2008 | |||||||||||||
| (in thousands) | % | ||||||||||||||
Interest income | $ | 635 | $ | 2,712 | $ | (2,077 | ) | (76.6 | ) | ||||||
Interest expense | (106 | ) | (36 | ) | (70 | ) | (194.4 | ) | |||||||
Other (expense) income, net | (86 | ) | 406 | (492 | ) | (121.2 | ) | ||||||||
Other income, net | $ | 443 | $ | 3,082 | $ | (2,639 | ) | (85.6 | ) | ||||||
Interest income decreased largely as a result of a decrease in our cash and investments balances and rates of return, due principally to our use of cash to acquire Optio in April 2008. We expect interest income to remain relatively consistent in 2010, based on our projected cash position. Interest expense remained insignificant in 2009. Other income decreased as a result of certain realized foreign exchange losses, however foreign exchange gains and losses continue to be a minor component of our overall operations. Excluding interest income, we expect that the individual components of other income and expense will continue to represent insignificant components of our overall operations in 2010.
Provision for Income Taxes
We recorded net income tax expense of $0.8 million for the fiscal year ended June 30, 2009 compared to net income tax expense of $0.5 million for the fiscal year ended June 30, 2008. The net expense position for the year ended June 30, 2009 was due to income tax expense associated with our Australian, German, French and US operations. This expense was partially offset by an income tax benefit associated with our UK operations. The fiscal 2009 net tax expense includes the impact of a non-recurring tax benefit of $0.1 million arising from a change in our German tax rate as a result of a restructuring of our German operations as well as a tax benefit of $0.2 million resulting from the enactment of legislation that allowed us to claim a tax refund for a portion of our unused research and development credit carryforwards. In the year ended June 30, 2008, income tax expense was attributable to our Australian and US operations, partially offset by income tax benefit associated with our European operations. In both 2009 and 2008, we recorded US income tax expense due to an increase in deferred tax liabilities associated with goodwill that is deductible for US tax purposes but not amortized for financial reporting purposes, and due to the use of certain acquired deferred tax assets for which the corresponding valuation allowance was recorded as a reduction to goodwill for financial reporting purposes.
Fiscal Year Ended June 30, 2008 Compared to Fiscal Year Ended June 30, 2007
Revenues by Segment
As of July 1, 2007, we revised the structure of our internal operating segments and changed the nature of the financial information that is provided to and used by our chief operating decision maker. We have aggregated similar operating segments into three reportable segments: Payments and Transactional Documents, Banking Solutions and Outsourced Solutions. The change in segment structure as of July 1, 2007 resulted in our hosted and outsourced accounts payable automation product offerings being included as a component of our Outsourced Solutions segment rather than our Payment and Transactional Documents segment. The change in segment composition is reflected for all financial periods presented. The following table represents our revenues by segment:
| For the Year Ended June 30, | |||||||||||||||
| 2007 | 2008 | Increase (Decrease) Between Periods | |||||||||||||
| Revenues | As % of total | Revenues | As % of total | Revenues | % Change | ||||||||||
| (in thousands) | |||||||||||||||
Payments and Transactional Documents | $ | 75,099 | 63.5 | $ | 84,962 | 64.7 | $ | 9,863 | 13.1 | ||||||
Banking Solutions | 20,017 | 16.9 | 22,107 | 16.9 | 2,090 | 10.4 | |||||||||
Outsourced Solutions | 23,219 | 19.6 | 24,172 | 18.4 | 953 | 4.1 | |||||||||
| $ | 118,335 | 100.0 | $ | 131,241 | 100.0 | $ | 12,906 | 10.9 | |||||||
Payments and Transactional Documents Banking Solutions Outsourced Solutions For the Year Ended June 30, 2008 2007 Increase (Decrease)
Between Periods Revenues As % of total Revenues As % of total Revenues % Change (in thousands) $ 84,962 64.7 $ 75,099 63.5 $ 9,863 13.1 22,107 16.9 20,017 16.9 2,090 10.4 24,172 18.4 23,219 19.6 953 4.1 $ 131,241 100.0 $ 118,335 100.0 $ 12,906 10.9
Payments and Transactional Documents.The revenue increase for the year ended June 30, 2008 was primarily attributable to an increase in software maintenance revenue from Formscape, which we acquired in October 2006, the revenue contribution from Optio, which we acquired in April 2008, and an increase in foreign currency exchange rates. We expect revenue for the Payments and Transactional Documents segment to increase in fiscal 2009 as a result of a full year’s revenue contribution from Optio and from increased sales of our payment and document management solutions.
Banking Solutions.The increase in revenue for the year ended June 30, 2008 was attributable to an increase in the revenue contribution from several large, ongoing, banking projects. We expect revenues for the Banking Solutions segment to increase next year as a result of the contribution of revenue from ongoing projects as well as from additional purchases by new and existing bank and financial institution customers in both North America and international markets.
Outsourced Solutions.The revenue increase for the year ended June 30, 2008 was due to an increase in revenue from our Legal eXchange offering as a result of new customers and an increase in foreign currency exchange rates, offset in part by a decrease in revenues from certain of our legacy outsourced accounts payable automation products in Europe. We expect revenue for the Outsourced Solutions segment to increase next year as current customers of Legal eXchange move from the implementation phase (during which no revenue is recorded) into live production and as new customers purchase this solution.
Revenues by Category
| Fiscal Year Ended June 30, | Increase (Decrease) Between Periods | Fiscal Year Ended June 30, | Increase (Decrease) Between Periods | |||||||||||||||||||||||
| 2007 | 2008 | 2008 Compared to 2007 | 2008 | 2007 | 2008 Compared to 2007 | |||||||||||||||||||||
| (in thousands) | % | (in thousands) | % | |||||||||||||||||||||||
Revenues: | ||||||||||||||||||||||||||
Software licenses | $ | 14,102 | $ | 13,949 | $ | (153 | ) | (1.1 | ) | $ | 13,949 | $ | 14,102 | $ | (153 | ) | (1.1 | ) | ||||||||
Subscriptions and transactions | 26,767 | 29,693 | 2,926 | 10.9 | 29,693 | 26,767 | 2,926 | 10.9 | ||||||||||||||||||
Service and maintenance | 63,887 | 74,446 | 10,559 | 16.5 | 74,446 | 63,887 | 10,559 | 16.5 | ||||||||||||||||||
Equipment and supplies | 13,579 | 13,153 | (426 | ) | (3.1 | ) | 13,153 | 13,579 | (426 | ) | (3.1 | ) | ||||||||||||||
Total revenues | $ | 118,335 | $ | 131,241 | $ | 12,906 | 10.9 | $ | 131,241 | $ | 118,335 | $ | 12,906 | 10.9 | ||||||||||||
Software Licenses.The decrease in software license revenues was principally due to a decrease in license revenue in Europe from certain of our legacy product offerings, offset in part by the revenue contribution from Optio, which we acquired in April 2008, an increase in revenue due to stronger demand for certain of our domestic payment products and an increase in foreign currency exchange rates. We expect software license revenues to increase during 2009, principally as a result of a full year’s revenue contribution from Optio and as a result of increased software license revenue within our Banking Solutions segment.
Subscriptions and Transactions.The increase in subscription and transaction revenues in 2008 was due principally to the revenue contribution from new Legal eXchange customers, an increase in foreign currency exchange rates and the revenue contribution from Optio’s subscription based products. We expect subscription and transaction revenues to increase during 2009, principally as a result of an increase in the revenue contribution from our Legal eXchange product and as a result of a full year’s revenue contribution from Optio’s subscription-based products.
Service and Maintenance.The increase in service and maintenance revenues occurred primarily as a result of a full year’s revenue contribution, as well as an overall increase in, software maintenance from Formscape, which we acquired in October 2006, the revenue contribution from Optio, which we acquired in April 2008, an increase in revenues associated with our Banking Solutions products as a result of several large, ongoing banking
projects and an increase in foreign currency exchange rates. We expect that service and maintenance revenues will increase during 2009, principally as a result of a full year’s revenue contribution from Optio and as a result of the revenue contribution from ongoing projects in our Banking Solutions segment.
Equipment and Supplies. The decrease in equipment and supplies revenues was principally due to our continued de-emphasis of lower margin transactions within this aspect of our business. We expect that equipment and supplies revenues will remain relatively consistent during 2008, but expect that this revenue stream will continue to decrease as a percentage of our total revenues.
Cost of Revenues
| Fiscal Year Ended June 30, | Increase (Decrease) Between Periods | Fiscal Year Ended June 30, | Increase (Decrease) Between Periods | |||||||||||||||||||||||
| 2007 | 2008 | 2008 Compared to 2007 | 2008 | 2007 | 2008 Compared to 2007 | |||||||||||||||||||||
| (in thousands) | % | (in thousands) | % | |||||||||||||||||||||||
Cost of revenues: | ||||||||||||||||||||||||||
Software licenses | $ | 744 | $ | 880 | $ | 136 | 18.3 | $ | 880 | $ | 744 | $ | 136 | 18.3 | ||||||||||||
Subscriptions and transactions | 12,138 | 15,789 | 3,651 | 30.1 | 15,789 | 12,138 | 3,651 | 30.1 | ||||||||||||||||||
Service and maintenance | 29,254 | 32,202 | 2,948 | 10.1 | 32,202 | 29,254 | 2,948 | 10.1 | ||||||||||||||||||
Stock compensation expense | 755 | 987 | 232 | 30.7 | 987 | 755 | 232 | 30.7 | ||||||||||||||||||
Equipment and supplies | 10,168 | 9,551 | (617 | ) | (6.1 | ) | 9,551 | 10,168 | (617 | ) | (6.1 | ) | ||||||||||||||
Total cost of revenues | $ | 53,059 | $ | 59,409 | $ | 6,350 | 12.0 | $ | 59,409 | $ | 53,059 | $ | 6,350 | 12.0 | ||||||||||||
Gross profit | $ | 65,276 | $ | 71,832 | $ | 6,556 | 10.0 | $ | 71,832 | $ | 65,276 | $ | 6,556 | 10.0 | ||||||||||||
Software Licenses.Software license costs consist of expenses incurred by us to manufacture, package and distribute our software products and related documentation and costs of licensing third party software that is incorporated into or sold with certain of our products. Software license costs increased to 6% of software license revenues in the year ended June 30, 2008, from 5% in year ended June 30, 2007. The slight increase in software license cost of revenues was primarily due to the contribution of Formscape software products, which carry a slightly lower gross margin than certain of our traditional software products . We expect that software license costs will remain relatively consistent as a percentage of software license revenues during fiscal year 2009.products.
Subscriptions and Transactions.Subscriptions and transaction costs include salaries and other related costs for our professional services teams as well as costs related to our hosting infrastructure such as depreciation and facilities related expenses. Subscriptions and transaction costs represented 53% of subscriptions and transaction revenues in the year ended June 30, 2008 as compared to 45% in the year ended June 30, 2007. The increase in subscriptions and transaction costs was due to continued investment in our hosted infrastructure and our customer delivery capabilities. We expect that subscription and transaction costs will decrease slightly as a percentage of subscription and transaction revenues during fiscal year 2009.
Service and Maintenance.Service and maintenance costs include salaries and other related costs for our customer service, maintenance and help desk support staffs, as well as third party contractor expenses used to complement our professional services team. Service and maintenance costs decreased to 43% of service and maintenance revenues during the year ended June 30, 2008 as compared to 46% in the year ended June 30, 2007. The decrease in service and maintenance cost of revenue as a percentage of service and maintenance revenue was due to an increase in the software maintenance revenue contribution from Formscape and the contribution of software maintenance revenue from Optio, which we acquired in April 2008, offset by slightly lower margins from our Banking Solutions segment as we continued to expand our professional service and support teams for new customers. We expect that service and maintenance costs will remain relatively consistent, as a percentage of service and maintenance revenues, during fiscal year 2009.
Equipment and Supplies. Equipment and supplies costs include the costs associated with equipment and supplies that we resell, as well as freight, shipping and postage costs associated with the delivery of our products. Equipment and supplies costs decreased to 73% of equipment and supplies revenues in the year ended June 30,
2008 compared to 75% of equipment and supplies revenues in the year ended June 30, 2007. The decrease in equipment and supplies costs as a percentage of equipment and supplies revenues was attributable to our continued de-emphasis of lower margin equipments and supplies transactions. We expect that equipment and supplies costs will remain relatively consistent as a percentage of equipment and supplies revenues in fiscal year 2009.
Operating Expenses
| Fiscal Year Ended June 30, | Increase (Decrease) Between Periods | Fiscal Year Ended June 30, | Increase (Decrease) Between Periods | |||||||||||||||||||||||
| 2007 | 2008 | 2008 Compared to 2007 | 2008 | 2007 | 2008 Compared to 2007 | |||||||||||||||||||||
| (in thousands) | % | (in thousands) | % | |||||||||||||||||||||||
Operating expenses: | ||||||||||||||||||||||||||
Sales and marketing | $ | 28,761 | $ | 28,898 | $ | 137 | 0.5 | $ | 28,898 | $ | 28,761 | $ | 137 | 0.5 | ||||||||||||
Stock compensation expense | 2,893 | 2,841 | (52 | ) | (1.8 | ) | 2,841 | 2,893 | (52 | ) | (1.8 | ) | ||||||||||||||
Product development and engineering | 15,308 | 16,596 | 1,288 | 8.4 | 16,596 | 15,308 | 1,288 | 8.4 | ||||||||||||||||||
Stock compensation expense | 761 | 780 | 19 | 2.5 | 780 | 761 | 19 | 2.5 | ||||||||||||||||||
General and administrative | 15,784 | 15,002 | (782 | ) | (5.0 | ) | 15,002 | 15,784 | (782 | ) | (5.0 | ) | ||||||||||||||
Stock compensation expense | 3,536 | 4,195 | 659 | 18.6 | 4,195 | 3,536 | 659 | 18.6 | ||||||||||||||||||
Amortization of intangible assets | 9,324 | 11,399 | 2,075 | 22.3 | 11,399 | 9,324 | 2,075 | 22.3 | ||||||||||||||||||
Total operating expenses | $ | 76,367 | $ | 79,711 | $ | 3,344 | 4.4 | $ | 79,711 | $ | 76,367 | $ | 3,344 | 4.4 | ||||||||||||
Sales and Marketing.Sales and marketing expenses consist primarily of salaries and other related costs for sales and marketing personnel, sales commissions, travel, public relations and marketing materials and trade show participation. The slight increase in sales and marketing expenses was primarily attributable to higher operating costs as a result of our April 2008 acquisition of Optio, a full year of headcount related costs associated with our Formscape acquisition and an increase in foreign currency exchange rates, offset in part by a reduction in personnel related costs, including commissions, and a reduction in advertising and travel costs. We expect that sales and marketing expenses will increase during fiscal year 2009 as a result of a full year’s expense contribution from Optio and as a result of our continued sales and marketing initiatives around our newer products.
Product Development and Engineering.Product development and engineering expenses consist primarily of personnel costs to support product development, which continues to be focused on enhancements and revisions to our products based on customer feedback and general marketplace demands. The increase in product development and engineering expenses was primarily attributable to higher operating costs associated with our April 2008 acquisition of Optio, a full year of costs associated with the Formscape acquisition, increased development costs related to our Legal eXchange and accounts payable automation products and an increase in foreign currency exchange rates. These increases were partially offset by an increased use of development resources in revenue generating roles during the period, the cost of which is recorded as a cost of revenue. We expect that product development and engineering expenses will increase during fiscal year 2009 due to a full year’s expense contribution from Optio.
General and Administrative.General and administrative expenses consist primarily of salaries and other related costs for operations and finance employees and legal and accounting services. The reduction in general and administrative expenses was primarily attributable to a decrease in third party professional services fees and personnel related costs, offset in part by operating expenses associated with Optio, a full year of costs associated with our Formscape acquisition and an increase in foreign currency exchange rates. We expect that general and
administrative expenses will increase in dollar terms during fiscal year 2009, due largely to the overall growth in our business, but that it will continue to decrease as a percentage of our total revenues.
Stock Compensation Expense. During the year ended June 30, 2008, stock compensation expense increased as compared to the year ended June 30, 2007, due to an increase in stock-based awards as we have experienced higher competition in attracting and retaining our senior and key employees and as our overall business has continued to grow. The expense associated with share-based payments is recorded as expense within the same functional expense category in which cash compensation for the applicable employee is recorded. For the years ended June 30, 2008 and 2007, stock compensation expense was allocated as follows:
| Fiscal Year Ended June 30, | Increase (Decrease) Between Periods | ||||||||||||
| 2007 | 2008 | 2008 Compared to 2007 | |||||||||||
| (in thousands) | % | ||||||||||||
Cost of revenues: service and maintenance | $ | 755 | $ | 987 | $ | 232 | 30.7 | ||||||
Sales and marketing | 2,893 | 2,841 | (52 | ) | (1.8 | ) | |||||||
Product development and engineering | 761 | 780 | 19 | 2.5 | |||||||||
General and administrative | 3,536 | 4,195 | 659 | 18.6 | |||||||||
Total Compensation Expense | $ | 7,945 | $ | 8,803 | $ | 858 | 10.8 | ||||||
During fiscal year 2009, we expect our stock compensation expense to increase as our overall business continues to grow.
| Fiscal Year Ended June 30, | Increase (Decrease) Between Periods | ||||||||||||
| 2008 | 2007 | 2008 Compared to 2007 | |||||||||||
| (in thousands) | % | ||||||||||||
Cost of revenues: service and maintenance | $ | 987 | $ | 755 | $ | 232 | 30.7 | ||||||
Sales and marketing | 2,841 | 2,893 | (52 | ) | (1.8 | ) | |||||||
Product development and engineering | 780 | 761 | 19 | 2.5 | |||||||||
General and administrative | 4,195 | 3,536 | 659 | 18.6 | |||||||||
Total stock compensation expense | $ | 8,803 | $ | 7,945 | $ | 858 | 10.8 | ||||||
Amortization of Intangible Assets. Amortization expense increased as a result of the increase to intangible assets arising from our current and prior year acquisitions. At current intangible asset levels, we expect that total amortization expense for fiscal 2009 will approximate $16.8 million.
Other Income (Expense), Net
| Fiscal Year Ended June 30, | Increase (Decrease) Between Periods | Fiscal Year Ended June 30, | Increase (Decrease) Between Periods | |||||||||||||||||||||||||||
| 2007 | 2008 | 2008 Compared to 2007 | 2008 | 2007 | 2008 Compared to 2007 | |||||||||||||||||||||||||
| (in thousands) | % | (in thousands) | % | |||||||||||||||||||||||||||
Interest income | $ | 3,187 | $ | 2,712 | $ | (475 | ) | (14.9 | ) | $ | 2,712 | $ | 3,187 | $ | (475 | ) | (14.9 | ) | ||||||||||||
Interest expense | (24 | ) | (36 | ) | (12 | ) | (50.0 | ) | (36 | ) | (24 | ) | (12 | ) | (50.0 | ) | ||||||||||||||
Other income, net | 14 | 406 | 392 | 2,800.0 | 406 | 14 | 392 | 2,800.0 | ||||||||||||||||||||||
Other income, net | $ | 3,177 | $ | 3,082 | $ | (95 | ) | (3.0 | ) | $ | 3,082 | $ | 3,177 | $ | (95 | ) | (3.0 | ) | ||||||||||||
Interest income decreased largely as a result of a decrease in our cash and investments balances, due principally to our use of cash to acquire Optio in April 2008. We expect interest income to decrease in 2009, reflecting the impact of a lower cash and investment balance as well as a reduction in rates from the fiscal 2008 average yield. Interest expense remained insignificant in 2008. Other income increased as a result of foreign exchange gains, however foreign exchange gains and losses continue to be a minor component of our overall operations. Excluding interest income, we expect that the individual components of other income and expense will continue to represent insignificant components of our overall operations in 2009.
Provision for Income Taxes
We recorded net income tax expense of $0.5 million for the fiscal year ended June 30, 2008 compared to a net benefit of $0.9 million for the fiscal year ended June 30, 2007. The net expense position for the year ended June 30, 2008 was due to income tax expense associated with our Australian and US operations. This expense was partially offset by an income tax benefit associated with our European operations, which included the impact
of a non-recurring tax benefit of $0.2 million arising from the enactment of legislation that decreased our tax rates in the UK and Germany. The US income tax expense is attributable to an increase in deferred tax liabilities associated with goodwill that is deductible for US tax purposes but not amortized for financial reporting purposes, as well as the use of certain acquired deferred tax assets for which the corresponding valuation allowance was recorded as a reduction to goodwill for financial reporting purposes. In the year ended June 30, 2007, income tax benefit was attributable to our European operations, partially offset by income tax expense associated with our Australian operations and to US tax expense related to an increase in deferred tax liabilities associated with goodwill that is deductible for US tax purposes but not for financial reporting purposes.
Fiscal Year Ended June 30, 2007 Compared to Fiscal Year Ended June 30, 2006
Revenues by Segment
| For the Year Ended June 30, | |||||||||||||||
| 2006 | 2007 | Increase (Decrease) Between Periods | |||||||||||||
| Revenues | As % of total | Revenues | As % of total | Revenues | % Change | ||||||||||
| (in thousands) | |||||||||||||||
Payments and Transactional Documents | $ | 70,622 | 69.5 | $ | 75,099 | 63.5 | $ | 4,477 | 6.3 | ||||||
Banking Solutions | 12,706 | 12.5 | 20,017 | 16.9 | 7,311 | 57.5 | |||||||||
Outsourced Solutions | 18,337 | 18.0 | 23,219 | 19.6 | 4,882 | 26.6 | |||||||||
| $ | 101,665 | 100.0 | $ | 118,335 | 100.0 | $ | 16,670 | 16.4 | |||||||
Payments and Transactional Documents.The revenue increase for the year ended June 30, 2007 was primarily attributable to the revenue contribution from Formscape, which we acquired in October 2006, and an increase in foreign exchange rates.
Banking Solutions.The increase in revenue for the year ended June 30, 2007 was as a result of the revenue contribution from several large banking projects and an increase in customer orders and demand for our banking software solutions.
Outsourced Solutions.The revenue increase for the year ended June 30, 2007 was primarily a result of the revenue contribution from new Legal eXchange customers in the US and a full year’s revenue contribution from Visibillity, which we acquired in fiscal 2006.
Revenues by Category
| Fiscal Year Ended June 30, | Increase (Decrease) Between Periods | ||||||||||||
| 2006 | 2007 | 2007 Compared to 2006 | |||||||||||
| (in thousands) | % | ||||||||||||
Revenues: | |||||||||||||
Software licenses | $ | 12,236 | $ | 14,102 | $ | 1,866 | 15.3 | ||||||
Subscriptions and transactions | 22,290 | 26,767 | 4,477 | 20.1 | |||||||||
Service and maintenance | 52,511 | 63,887 | 11,376 | 21.7 | |||||||||
Equipment and supplies | 14,628 | 13,579 | (1,049 | ) | (7.2 | ) | |||||||
Total revenues | $ | 101,665 | $ | 118,335 | $ | 16,670 | 16.4 | ||||||
The overall revenue increase in 2007 was due primarily to increases in revenues from our banking products and services, an increase in Legal eXchange revenues, a full year’s revenue contribution from our prior year acquisitions, the revenue contribution from our acquisition of Formscape in 2007 and an increase in foreign exchange rates. These increases were offset in part by a decrease in software license revenues in the UK as the BACSTEL-IP initiative ended in December 2005.
Software Licenses.The increase in software license revenues was due principally to the revenue contribution from Formscape, which we acquired in October 2006, an increase in license revenues in our Banking Solutions segment as a result of the revenue contribution from two large projects and an increase in foreign exchange rates.
Subscriptions and Transactions.The increase in subscription and transaction revenues in 2007 was due principally to the revenue contribution from new Legal eXchange customers, a full year’s revenue contribution from our prior year acquisition of Visibillity, an increase in foreign exchange rates and growth in our subscription and transactional based revenue streams.
Service and Maintenance.The increase in service and maintenance revenues occurred as a result of the revenue contribution from Formscape, an increase in professional services revenues associated with several large banking projects and an increase in foreign exchange rates.
Equipment and Supplies. Equipment and supplies revenue decreased slightly in the year ended 2007 as compared to the year ended 2006, as we continued to de-emphasize the sale of certain lower margin equipment and supplies products.
Cost of Revenues
| Fiscal Year Ended June 30, | Increase (Decrease) Between Periods | ||||||||||||
| 2006 | 2007 | 2007 Compared to 2006 | |||||||||||
| (in thousands) | % | ||||||||||||
Cost of revenues: | |||||||||||||
Software licenses | $ | 1,398 | $ | 744 | $ | (654 | ) | (46.8 | ) | ||||
Subscriptions and transactions | 9,294 | 12,138 | 2,844 | 30.6 | |||||||||
Service and maintenance | 24,072 | 29,254 | 5,182 | 21.5 | |||||||||
Stock compensation expense | 474 | 755 | 281 | 59.3 | |||||||||
Equipment and supplies | 11,639 | 10,168 | (1,471 | ) | (12.6 | ) | |||||||
Total cost of revenues | $ | 46,877 | $ | 53,059 | $ | 6,182 | 13.2 | ||||||
Gross profit | $ | 54,788 | $ | 65,276 | $ | 10,488 | 19.1 | ||||||
Software Licenses.Software license costs consist of expenses incurred by us to manufacture, package and distribute our software products and related documentation and costs of licensing third party software that is incorporated into or sold with certain of our products. Software license costs decreased to 5% of software license revenues in the year ended June 30, 2007, from 11% in year ended June 30, 2006. The decrease in software license cost of revenues was primarily due to the contribution of Formscape software revenue, which carries a slightly higher gross margin than certain of our traditional software products, and due to a lower mix of revenue from software licenses that required royalties to third parties.
Subscriptions and Transactions.Subscription and transaction costs include salaries and other related costs for the respective professional services teams as well as costs related to our hosting infrastructure such as depreciation and facilities related expenses. The increase in subscription and transaction costs was due principally to the increase in subscription and transaction revenues and costs associated with the expansion of our hosted infrastructure, as we continued to make investments in our newer subscription and transaction based products.
Service and Maintenance.Service and maintenance costs include salaries and other related costs for our customer service, maintenance and help desk support staffs, as well as third party contractor expenses used to complement our professional services team. Service and maintenance costs remained consistent as a percentage of service and maintenance revenues at 46% for the years ended June 30, 2007 and 2006.
Equipment and Supplies. Equipment and supplies costs include the costs associated with equipment and supplies that we resell, as well as freight, shipping and postage costs associated with the delivery of our products. Equipment and supplies costs decreased to 75% of equipment and supplies revenues in year ended June 30, 2007 compared to 80% of equipment and supplies revenues in the year ended June 30, 2006. The decrease in equipment and supplies costs as a percentage of equipment and supplies revenues was due to our continued de-emphasis of lower margin equipment and supplies transactions.
Operating Expenses
| Fiscal Year Ended June 30, | Increase (Decrease) Between Periods | ||||||||||||
| 2006 | 2007 | 2007 Compared to 2006 | |||||||||||
| (in thousands) | % | ||||||||||||
Operating expenses: | |||||||||||||
Sales and marketing | $ | 23,816 | $ | 28,761 | $ | 4,945 | 20.8 | ||||||
Stock compensation expense | 2,489 | 2,893 | 404 | 16.2 | |||||||||
Product development and engineering | 11,448 | 15,308 | 3,860 | 33.7 | |||||||||
Stock compensation expense | 841 | 761 | (80 | ) | (9.5 | ) | |||||||
General and administrative | 12,949 | 15,784 | 2,835 | 21.9 | |||||||||
Stock compensation expense | 3,180 | 3,536 | 356 | 11.2 | |||||||||
Amortization of intangible assets | 4,491 | 9,324 | 4,833 | 107.6 | |||||||||
Total operating expenses | $ | 59,214 | $ | 76,367 | $ | 17,153 | 29.0 | ||||||
Sales and Marketing.Sales and marketing expenses consist primarily of salaries and other related costs for sales and marketing personnel, sales commissions, travel, public relations and marketing materials and trade show participation. Sales and marketing expenses increased in the year ended June 30, 2007 as compared to the year ended June 30, 2006, with this increase principally attributable to higher operating costs as a result of the Formscape acquisition and an increase in foreign exchange rates. Costs related to customer conferences and product advertising initiatives also increased as we promoted our newer product offerings.
Product Development and Engineering.Product development and engineering expenses consist primarily of personnel costs to support product development, which was heavily focused on enhancing our accounts payable automation solutions and, to a lesser extent, on enhancements and revisions to our other products based on customer feedback and general marketplace demands. The increase in product development and engineering expenses was primarily attributable to expenses associated with our continued investment in our accounts payable automation products, increases in third party contractor expenses as a result of our continued investment in our banking products, expenses associated with the activities of Formscape and an increase in foreign exchange rates.
General and Administrative.General and administrative expenses consist primarily of salaries and other related costs for operations and finance employees and legal and accounting services. The increase in general and administrative expenses was attributable to expenses associated with the activities of Formscape, an increase in foreign exchange rates, and an increased use of external services providers to supplement our legal and finance functions.
Stock Compensation Expense. During the year ended June 30, 2007, stock compensation expense increased slightly to $7.9 million as compared to stock compensation expense of $7.0 million for the year ended June 30, 2006. The expense associated with share based payments is recorded as expense within the same functional expense category in which cash compensation for the applicable employee is recorded. For the years ended June 30, 2007 and 2006, stock compensation expense was allocated as follows:
| Fiscal Year Ended June 30, | Increase (Decrease) Between Periods | ||||||||||||
| 2006 | 2007 | 2007 Compared to 2006 | |||||||||||
| (in thousands) | % | ||||||||||||
Cost of revenues: service and maintenance | $ | 474 | $ | 755 | $ | 281 | 59.3 | ||||||
Sales and marketing | 2,489 | 2,893 | 404 | 16.2 | |||||||||
Product development and engineering | 841 | 761 | (80 | ) | (9.5 | ) | |||||||
General and administrative | 3,180 | 3,536 | 356 | 11.2 | |||||||||
Total Compensation Expense | $ | 6,984 | $ | 7,945 | $ | 961 | 13.8 | ||||||
Amortization of Intangible Assets. Amortization expense increased as a result of the amortization of intangible assets arising from our current and prior year acquisitions.
Other Income (Expense), Net
| Fiscal Year Ended June 30, | Increase (Decrease) Between Periods | ||||||||||||||
| 2006 | 2007 | 2007 Compared to 2006 | |||||||||||||
| (in thousands) | % | ||||||||||||||
Interest income | $ | 3,138 | $ | 3,187 | $ | 49 | 1.6 | ||||||||
Interest expense | (15 | ) | (24 | ) | (9 | ) | 60.0 | ||||||||
Other income, net | 129 | 14 | (115 | ) | (89.1 | ) | |||||||||
Other income, net | $ | 3,252 | $ | 3,177 | $ | (75 | ) | (2.3 | ) | ||||||
All components of our other income and expense categories remained largely consistent during fiscal year 2007 as compared to fiscal 2006. Excluding interest income, the individual components of other income and expense continue to represent insignificant components of our overall operations.
Provision for Income Taxes
We recorded a net income tax benefit of $0.9 million for the fiscal year ended June 30, 2007 compared to net expense of $0.7 million for the fiscal year ended June 30, 2006. The net benefit position for the year ended June 30, 2007 was due to an income tax benefit associated with our European operations. This benefit was partially offset by income tax expense associated with our Australian and US operations. The US income tax expense was attributable to an increase in deferred tax liabilities associated with goodwill that is deductible for US tax purposes but not amortized for financial reporting purposes. In the year ended June 30, 2006, income tax expense was attributable principally to our Australian operations and to US expense related to an increase in deferred tax liabilities associated with goodwill that is deductible for US tax purposes but not for financial reporting purposes.
Liquidity and Capital Resources
Historically, weWe have financed our operations primarily from cash provided by operating activities and from the sale of our common stock. Westock and at June 30, 2009 we had net working capital of $20 million at June 30, 2008, including cash, cash equivalents and marketable securities totaling $35$30.7 million.
We have generated positive operating cash flows in each of our last seveneight completed fiscal years. We believe that the cash generated from our operations and the cash, cash equivalents and marketable securities we have on hand will be sufficient to meet our working capital and capital expenditure requirements for the foreseeable future. We also may receive additional investments from, and make investments in, customers or other companies. However, any such transactions would be subject torequire the approval of our board of directors and, in some cases, stockholders and potentially stockholder, bank or regulatory approval. We expect to complete the PayMode acquisition in September 2009 for $17.0 million in cash, plus warrants for 1,000,000 shares of our common stock. The warrants have an exercise price of $8.50 per share and a ten-year contractual life. We also may undertake additional business or asset acquisitions.acquisitions or divestitures.
In April 2008, we paid approximately $37 million in purchase consideration and acquisition related costs (net of cash acquired of approximately $10 million) fromDuring the fiscal year ended June 30, 2009, our cash balances decreased by approximately $4.2 million as a result of a decline in connectionthe foreign currency exchange rates of the British Pound, European Euro, and Australian Dollar to the US Dollar. To the extent that exchange rates associated with these foreign currencies decline further, we could be subject to further decreases in our acquisition of Optio Software. Wecash balances upon translation to US Dollars. However, we continue to believe that our existing cash and investment balances, as well as cash generated from operations, will be sufficienteven in light of the foreign currency volatility we experienced during 2009, are adequate to meet our operatingliquidity and working capital requirements for the foreseeable future.
Operating Activities
| Fiscal Year Ended June 30, | Fiscal Year Ended June 30, | |||||||||||||||||||||||
| 2006 | 2007 | 2008 | 2009 | 2008 | 2007 | |||||||||||||||||||
| (in thousands) | (in thousands) | |||||||||||||||||||||||
Net loss | $ | (1,834 | ) | $ | (7,030 | ) | $ | (5,261 | ) | $ | (12,288 | ) | $ | (5,261 | ) | $ | (7,030 | ) | ||||||
Non-cash adjustments, net | 13,489 | 19,240 | 22,419 | 29,138 | 22,419 | 19,240 | ||||||||||||||||||
Decrease (increase) in accounts receivable | 3,358 | 207 | (2,021 | ) | ||||||||||||||||||||
(Increase) decrease in accounts receivable | 3,903 | (2,021 | ) | 207 | ||||||||||||||||||||
All other, net | (3,158 | ) | (456 | ) | 1,044 | 3,791 | 1,044 | (456 | ) | |||||||||||||||
Net cash provided by operating activities | $ | 11,855 | $ | 11,961 | $ | 16,181 | $ | 24,544 | $ | 16,181 | $ | 11,961 | ||||||||||||
Net cash provided by operating activities for the fiscal years ended June 30, 2009, 2008, 2007 and 20062007 was primarily due to our net loss, adjusted by favorable non-cash adjustments. Non-cash adjustments are principally transactions that result in the recognition of financial statement expense but not a corresponding cash disbursement, such as stock compensation expense, amortization of intangible assets, depreciation of property and equipment and the provision for allowances of accounts receivable.
As of June 30, 2008,2009, the deferred tax assets associated with our US operations and a portion of the deferred tax assets associated with our European operations have been reserved since, given the available evidence, it was deemed more likely than not that these deferred tax assets would not be realized.
At June 30, 2008,2009, we have available US net operating loss carryforwards of $47.8$53.3 million, which expire at various times through the year 2027. We also have $2.6$2.8 million of research and development tax credit carryforwards available, which expire at various points through year 2028.2029. The operating losses and tax credit carryforwards may be subject to limitations under provisions of the Internal Revenue Code.
Investing Activities
| Fiscal Year Ended June 30, | Fiscal Year Ended June 30, | |||||||||||||||||||||||
| 2006 | 2007 | 2008 | 2009 | 2008 | 2007 | |||||||||||||||||||
| (in thousands) | (in thousands) | |||||||||||||||||||||||
Acquisition of businesses and assets, net of cash acquired | $ | (18,195 | ) | $ | (17,016 | ) | $ | (36,730 | ) | $ | — | $ | (36,730 | ) | $ | (17,016 | ) | |||||||
Net proceeds from (purchases of) marketable securities | (26,612 | ) | 14,875 | 26,825 | ||||||||||||||||||||
Net proceeds from sales of marketable securities | — | 26,825 | 14,875 | |||||||||||||||||||||
Purchases of property and equipment | (2,612 | ) | (3,593 | ) | (4,971 | ) | (3,133 | ) | (4,971 | ) | (3,593 | ) | ||||||||||||
Net cash used in investing activities | $ | (47,419 | ) | $ | (5,734 | ) | $ | (14,876 | ) | $ | (3,133 | ) | $ | (14,876 | ) | $ | (5,734 | ) | ||||||
In the fiscal year ended June 30, 2009, cash was used to acquire property and equipment. In the fiscal year ended June 30, 2008, cashproceeds from the sale of marketable securities was primarily used to fund the acquisition of Optio and, to a lesser extent, to acquire property and equipment. Cash for these transactions was primarily provided through the sale of marketable securities. In the fiscal year ended June 30, 2007, cash was primarily used to acquire Formscape and to acquire property and equipment. Inequipment using proceeds from the fiscal year ended June 30, 2006 cash was primarily
used to acquire marketable securities and to fund our acquisitions of Visibillity, Tranmit and a patent. The significant purchasessale of marketable securities in the fiscal year ended June 30, 2006 was due to our investment of proceeds received from our follow-on offering of common stock completed in July 2005.securities.
Financing Activities
| Fiscal Year Ended June 30, | Fiscal Year Ended June 30, | |||||||||||||||||||||||
| 2006 | 2007 | 2008 | 2009 | 2008 | 2007 | |||||||||||||||||||
| (in thousands) | (in thousands) | |||||||||||||||||||||||
Proceeds from exercise of stock options, stock warrants and employee stock purchase plan | $ | 6,288 | $ | 4,154 | $ | 5,788 | ||||||||||||||||||
Proceeds from exercise of stock options and employee stock purchase plan | $ | 1,456 | $ | 5,788 | $ | 4,154 | ||||||||||||||||||
Repurchase of common stock | (61 | ) | (11,186 | ) | (10,961 | ) | (3,469 | ) | (10,961 | ) | (11,186 | ) | ||||||||||||
Proceeds from the sale of common stock, net | 46,772 | — | ||||||||||||||||||||||
Excess tax benefits associated with stock based compensation | 282 | 104 | 125 | 15 | 125 | 104 | ||||||||||||||||||
Capital lease payments | — | (90 | ) | (45 | ) | (131 | ) | (45 | ) | (90 | ) | |||||||||||||
Payment of bank financing fees | (33 | ) | (15 | ) | (28 | ) | (30 | ) | (28 | ) | (15 | ) | ||||||||||||
Payment of long-term financing obligation | (89 | ) | — | — | ||||||||||||||||||||
Net cash provided by (used in) financing activities | $ | 53,248 | $ | (7,033 | ) | $ | (5,121 | ) | ||||||||||||||||
Net cash used in financing activities | $ | (2,248 | ) | $ | (5,121 | ) | $ | (7,033 | ) | |||||||||||||||
Net cash used in financing activities for the fiscal years ended June 30, 2009, 2008, and 2007 was primarily the result of repurchasesthe repurchase of our common stock, offset in part by proceeds we received from the exercise of employee stock options and purchases under our employee stock purchase plan. Net cash provided by financing activities for the fiscal year ended June 30, 2006 was primarily the result of $46.8 million in net proceeds received from our follow-on offering of common stock in July 2005 and proceeds of $6.3 million from the exercise of stock options and purchases underfrom the purchase of our stock by participants in our employee stock purchase plan.
NoteNotes Payable and Credit Facilities
In April 2007,June 2009, we renewed, through March 24,September 21, 2009, our Loan and Security Agreement with Silicon Valley Bank (Credit Facility). The Credit Facility, as renewed, provides for aggregate borrowings of up to $2 million and requires us to maintain certain financial covenants. Borrowings under the Credit Facility are secured by substantially all our assets, bear interest at the bank’s prime rate (5.0%(4.0% at June 30, 2008)2009) and are due on the expiration date of the Credit Facility. The Credit Facility also provides for the issuance of up to $2 million in letters of credit for, and on behalf of, Bottomline. The borrowing capacity under the Credit Facility is reduced by any outstanding letters of credit. At June 30, 20082009, we were in the process of establishing a $2$0.5 million letter of credit had beento be issued to our landlord as part of the lease agreement for our corporate headquarters. The letter of credit was formally issued to the landlord in July, 2009.
Business Acquisitions
On August 5, 2009 we entered into an asset purchase agreement with Bank of America to acquire Bank of America’s PayMode business. We expect to complete the PayMode acquisition in September 2009. See Item 1. Business—Recent Developments.
On April 21, 2008, we acquired Optio Software, Inc. (Optio). Optio is a US based company with operations in the United States, theUS, UK, Germany and France that provides software solutions dedicated to automating, managing and controlling the entire lifecycle of document intensive processes, while extendingex tending the value of its customers’ enterprise resource planning and hospital information systems. The purchase consideration and acquisition related costs for Optio were approximately $37 million in cash, net of cash acquired. Optio operating results are included in our operating results from the date of acquisition forward, as a component of the Payments and Transactional Documents operating segment.
On October 13, 2006 we, through our UK subsidiary, acquired all of the outstanding share capital of Formscape Group, Ltd. (Formscape). The purchase consideration for Formscape was approximately $22.2 million, consisting of approximately $17.0 million of cash and $5.2 million (521,159 shares) of our common stock, as valued on the date of the acquisition. Formscape operating results are included in our operating results from the acquisition date forward, as a component of the Payments and Transactional Documents segment.
On January 24, 2006, we acquired all of the outstanding stock of Tranmit Plc (Tranmit). The purchase consideration for Tranmit was approximately $6.0 million of cash, $4.2 million (316,970 shares) of our common stock, as valued on the date of acquisition, and acquisition related costs. Tranmit operating results are included in our operating results from the acquisition date forward, as a component of the Outsourced Solutions segment.
On December 31, 2005, we acquired all of the outstanding stock of Visibillity, Inc. (Visibillity). The initial purchase consideration for Visibillity was $11.5 million in cash plus acquisition related costs. Subsequent to the payment of the initial purchase consideration, we recovered $0.5 million from the Visibillity selling stockholders pursuant to the terms of the acquisition, and this recovery was recorded as a reduction to the amount of goodwill recorded as part of the acquisition. Visibillity operating results are included in our operating results from the acquisition date forward, as a component of the Outsourced Solutions segment.
Contractual Obligations
Following is a summary of future payments that we are required to make under existing contractual obligations as of June 30, 2008:2009:
| Payments Due by Period | Payment Due by Period | |||||||||||||||||||||||||||||
| Total | Less Than 1 Year | 1-3 Years | 4-5 Years | More Than 5 Years | Total | Less Than 1 Year | 1-3 Years | 4-5 Years | More Than 5 Years | |||||||||||||||||||||
| (in thousands) | (in thousands) | |||||||||||||||||||||||||||||
Operating lease obligations | $ | 16,698 | $ | 4,012 | $ | 9,392 | $ | 2,973 | $ | 321 | $ | 13,615 | $ | 3,603 | $ | 7,974 | $ | 2,038 | $ | — | ||||||||||
Capital lease obligations | 407 | 152 | 252 | 3 | — | |||||||||||||||||||||||||
Capital lease obligations (inclusive of interest) | 254 | 123 | 131 | — | — | |||||||||||||||||||||||||
Other contractual obligations | 446 | 243 | 203 | — | — | |||||||||||||||||||||||||
Total | $ | 17,105 | $ | 4,164 | $ | 9,644 | $ | 2,976 | $ | 321 | $ | 14,315 | $ | 3,969 | $ | 8,308 | $ | 2,038 | $ | — | ||||||||||
Purchase orders are not included in the table above. Our purchase orders represent authorizations to purchase rather than binding agreements. The contractual obligation amounts in the table above are associated with agreements that are enforceable and legally binding and that specify all significant terms, including: fixed or minimum services to be used; fixed, minimum or variable price provisions; and the approximate timing of the transaction. Obligations under contract that we can cancel without a significant penalty are not included in the table above. Also excluded from the table is our estimate of unrecognized tax benefits, for which cash settlement may be required, in the amount of $0.5$0.6 million. These amounts have been excluded because, as of June 30, 2008,2009, we are unable to estimate the timing of future cash outflows, if any, associated with these liabilities as we do not currently anticipate settling any of these tax positions with cash payment in the foreseeable future.
Off-Balance Sheet Arrangements
During the twelve monthsfiscal year ended June 30, 2008,2009 we did not have any off-balance sheet arrangements.
| Item 7A. | Quantitative and Qualitative Disclosures about Market Risk. |
Interest rate risk
Our exposure to financial risk, including changes in interest rates, relates primarily to cash and cash equivalents and our short-term investments. These investments bear interest at variable interest rates which are subject to market changes. We have not entered into any interest rate swap agreements or other instruments to minimize our exposure to interest rate fluctuations. We have not had any derivative instruments in the past and do not presently plan to in the future. Our investment portfolio typically consists of demand deposit accounts, money market mutual funds, U.S. Treasury securities, corporate debt securities or debt securities issued by U.S.
state agencies and institutions. Based on our current average balances of cash, cash equivalents and marketable securities, a significant change in interest rates could have a material effect on our operating results. Based on our average cash, cash equivalents and investment portfolio and average actual interest rates during the respective annual periods, a 100 basis point
increase or decrease in interest rates would result in an increase or decrease of approximately $0.8$0.4 million, $0.7$0.6 million, and $0.6$0.7 million for the fiscal years ended 2006,2009, 2008 and 2007, and 2008, respectively, in our results of operations and cash flows.
Foreign currency exchange rate risk
We have significant operations located in the United Kingdom, where the functional currency is British Pound Sterling (the Pound).Sterling. We also have operations in Australia, where the functional currency is the Australian dollar, and in Germany and France, where the functional currency is the European Euro. We have not entered into any foreign currency hedging transactions or other instruments to minimize our exposure to foreign currency exchange rate fluctuations nor do we presently plan to in the future.
Foreign currency translation risk
Based on our cash and cash equivalents balances denominated in non-US currencies, a 10% increase or decrease in the exchange rate between the British Pound Sterling and the US Dollar would result in an increase or decrease to our cash and cash equivalents of approximately $2.1 million and $2.3 million as of June 30, 2009 and 2008, respectively. A 10% increase or decrease in the exchange rate between the European Euro and the US Dollar would result in an increase or decrease to our cash and cash equivalents of approximately $0.2 million at June 30, 2009 and 2008. A 10% increase or decrease in the exchange rate between the Australian Dollar and the US Dollar would result in an increase or decrease to our cash and cash equivalents of approximately $0.2 million at June 30, 2009 and 2008.
A 10% increase or decrease in the average exchange rate between the British Pound Sterling and the US dollar would result in an increase or decrease to revenue of approximately $4.5$4.7 million, $5.1$5.3 million, and $5.3$5.1 million for fiscal years 2006,2009, 2008 and 2007, and 2008, respectively. A 10% increase or decrease in the average exchange rate between the British Pound Sterling and the US dollar would result in an increase or decrease to our net loss of approximately $0.3$0.1 million, $0.4$0.1 million and $0.1$0.4 million for fiscal years 2006,2009, 2008 and 2007, respectively.
A 10% increase or decrease in the average exchange rate between the European Euro and the US dollar would result in an increase or decrease to revenue of approximately $0.4 million and $0.2 million for fiscal years 2009 and 2008, respectively. A 10% increase or decrease in rates would not have had a material impact on revenue in 2007 given our limited operations in Euro-denominated geographies in that year, and would not have had a material impact on our net loss in 2009, 2008 or 2007.
A 10% increase or decrease in the average exchange rate between the Australian dollar and the US dollar would result in an increase or decrease to revenue of approximately $0.2 million in each of fiscal years 2006, 20072009, 2008 and 2008.2007. A 10% increase or decrease in the average exchange rate between the Australian dollar and the US dollar would result in an increase or decrease to our net loss of approximately $0.2 million for fiscal 2009 and 2008, but would not have had a material impact on our net loss in either 2006 or 2007.
A 10% increase or decrease in the average exchange rate between the Euro and the US dollar would result in an increase or decrease to revenue of approximately $0.2 million and an increase or decrease to our net loss of approximately $43,000 for fiscal 2008, but would not have had a material impact on revenue or net loss in either 2006 or 2007 given our limited operations in Euro-denominated geographies in those years.
Foreign currency transaction risk
Foreign currency transaction gains and losses are generally not significant and our financial results would not be significantly impacted in the event of a 10% increase or decrease in the average exchange rates between the US dollar and the respective functional currencies of our international subsidiaries.
| Item 8. | Financial Statements and Supplementary Data. |
Index to Financial Statements, Financial Statements and Supplementary Data appear within Item 15 of this Annual Report on Form 10-K.
| Item 9. | Changes in and Disagreements with Accountants on Accounting and Financial Disclosure. |
None.
| Item 9A. | Controls and Procedures. |
Our management, with the participation of our chief executive officer and chief financial officer, evaluated the effectiveness of our disclosure controls and procedures as of June 30, 2008.2009. The term “disclosure controls and procedures,” as defined in Rules 13a-15(e) and 15d-15(e) under the Exchange Act, means controls and other procedures of a company that are designed to ensure that information required to be disclosed by a company in the reports that it files or submits under the Exchange Act is recorded, processed, summarized and reported, within the time periods specified in the SEC’s rules and forms. Disclosure controls and procedures include, without limitation, controls and procedures designed to ensure that information required to be disclosed by a company in the reports that it files or submits under the Exchange Act is accumulated and communicated to the company’s management, including its principal executive and principal financial officers as appropriate, to allow timely decisions regarding required disclosure. Management recognizes that any controls and procedures, no matter how well designed and operated, can provide only reasonable assurance of achieving their objectives and management necessarily applies its judgment in evaluating the cost-benefit relationship of possible controls and procedures. Based on the evaluation of our disclosure controls and procedures as of June 30, 2008,2009, our chief executive officer and chief financial officer concluded that, as of such date, our disclosure controls and procedures were effective at the reasonable assurance level.
Management’s report on internal control over financial reporting (as defined in Rules 13a-15(f) and 15d-15(f) under the Exchange Act) and the independent registered public accounting firm’s related audit report are included in Item 8 of this Form 10-K and are incorporated herein by reference.
No change in our internal control over financial reporting occurred during the fiscal quarter ended June 30, 20082009 that has materially affected, or is reasonably likely to materially affect, our internal control over financial reporting.
| Item 9B. | Other Information. |
Not applicable.
| Item 10. | Directors, Executive Officers and Corporate Governance. |
See “Executive Officers and Other Key Employees of the Registrant” in Part I of this Annual Report on Form 10-K. We will furnish to the Securities and Exchange Commission a definitive Proxy Statement (the Proxy Statement) not later than 120 days after the close of the fiscal year ended June 30, 2008.2009. The information required by this item is incorporated herein by reference to the information contained under the captions “Proposal I—Election of Class I Directors,” “Section 16(a) Beneficial Ownership Reporting Compliance” and “Corporate Governance” of the Proxy Statement.
We have adopted a Code of Business Conduct and Ethics that applies to our principal executive officer, principal financial officer, principal accounting officer or controller, or persons performing similar functions. The text of our Code of Business Conduct and Ethics is posted in the “Corporate Governance” section of our website, www.bottomline.com. We intend to disclose on our website any amendments to, or waivers from, our Code of Business Conduct and Ethics that are required to be disclosed pursuant to the disclosure requirements of Item 5.05 of Form 8-K.
| Item 11. | Executive Compensation. |
The information required by this item is incorporated herein by reference to the information contained under the captions “Executive Compensation,” “Director Compensation,” “Compensation Committee Interlocks and Insider Participation,” “Compensation Committee Report,” and “Employment and Other Agreements and Potential Payments Upon Termination or Change-In-Control” of the Proxy Statement.
| Item 12. | Security Ownership of Certain Beneficial Owners and Management and Related Stockholder Matters. |
The information required by this item is incorporated herein by reference to the information contained under the captions “Security Ownership of Certain Beneficial Owners and Management” and “Equity Compensation Plan Information” of the Proxy Statement.
| Item 13. | Certain Relationships and Related Transactions, and Director Independence. |
The information required by this item is incorporated herein by reference to the information contained under the captions “Employment and Other Agreements and Potential Payments Upon Termination or Change-In-Control,” “Proposal I—Election of Class I Directors,” “Corporate Governance” and “Certain Relationships and Related Transactions” of the Proxy Statement.
| Item 14. | Principal Accounting Fees and Services. |
The information required to be disclosed by this item is incorporated herein by reference to the information contained under the caption “Principal Accounting Fees and Services” and “Pre-Approval Policies and Procedures” of the Proxy Statement.
| Item 15. | Exhibits, Financial Statement Schedules. |
(a)Financial Statements, Financial Statement Schedule and Exhibits
| Page | Page | |||||||
(1) | Financial Statements—see “Index to Financial Statements” | 48 | Financial Statements—see “Index to Financial Statements” | 50 | ||||
(2) | 47 | Financial Statement Schedule for the Years Ended June 30, 2009, 2008 and 2007: Schedule II—Valuation and Qualifying Accounts | 49 | |||||
| Financial statement schedules not included have been omitted because of the absence of conditions under which they are required or because the required information, where material, is shown in the financial statements or notes. | Financial statement schedules not included have been omitted because of the absence of conditions under which they are required or because the required information, where material, is shown in the financial statements or notes. | |||||||
(3) | Exhibits: | Exhibits: | ||||||
| 81 | Exhibits filed as part of this Annual Report on Form 10-K are listed on the Exhibit Index immediately preceding such exhibits, which is incorporated herein by reference | 85 |
SCHEDULE II—VALUATION AND QUALIFYING ACCOUNTS
ALLOWANCE FOR DOUBTFUL ACCOUNTS AND RETURNS
Years Ended June 30, 2006,2009, 2008 and 2007 and 2008
| Activity | Activity | |||||||||||||||||||||||||||
Year Ended | Balance at Beginning of Year | (Charged to Revenue, Costs and Expenses) | Additions(1) | Recoveries | Deductions(2) | Balance at End of Year | Balance at Beginning of Year | (Charged to Revenue, Costs and Expenses) | Additions(1) | Recoveries | Deductions(2) | Balance at End of Year | ||||||||||||||||
| (in thousands) | (in thousands) | |||||||||||||||||||||||||||
June 30, 2006 | $ | 1,830 | 128 | 228 | 1 | 354 | $ | 1,833 | ||||||||||||||||||||
June 30, 2009 | $ | 1,433 | 13 | 102 | 1 | 904 | $ | 645 | ||||||||||||||||||||
June 30, 2008 | $ | 1,590 | — | 477 | 1 | 635 | $ | 1,433 | ||||||||||||||||||||
June 30, 2007 | $ | 1,833 | 52 | 65 | — | 360 | $ | 1,590 | $ | 1,833 | 52 | 65 | — | 360 | $ | 1,590 | ||||||||||||
June 30, 2008 | $ | 1,590 | — | 477 | 1 | 635 | $ | 1,433 | ||||||||||||||||||||
| (1) | Additions represent increases to the allowance for doubtful accounts and returns balances as a result of reserves recorded in connection with purchase business combinations as well as the impact of increases in foreign currency exchange |
| (2) | Deductions are principally write-offs and reductions to |
INDEX TO CONSOLIDATED FINANCIAL STATEMENTS
Management’s Annual Report on Internal Control Over Financial Reporting
The management of the Company is responsible for establishing and maintaining adequate internal control over financial reporting. Internal control over financial reporting is defined in Rule 13a-15(f) or 15d-15(f) promulgated under the Securities Exchange Act of 1934 as a process designed by, or under the supervision of, the Company’s principal executive and principal financial officers and effected by the Company’s board of directors, management and other personnel, to provide reasonable assurance regarding the reliability of financial reporting and the preparation of financial statements for external purposes in accordance with generally accepted accounting principles and includes those policies and procedures that:
Pertain to the maintenance of records that in reasonable detail accurately and fairly reflect the transactions and dispositions of the assets of the Company;
Provide reasonable assurance that transactions are recorded as necessary to permit preparation of financial statements in accordance with generally accepted accounting principles, and that receipts and expenditures of the Company are being made only in accordance with authorizations of management and directors of the Company; and
Provide reasonable assurance regarding prevention or timely detection of unauthorized acquisition, use or disposition of the Company’s assets that could have a material effect on the financial statements.
Because of its inherent limitations, internal control over financial reporting may not prevent or detect misstatements. Projections of any evaluation of effectiveness to future periods are subject to the risk that controls may become inadequate because of changes in conditions, or that the degree of compliance with the policies or procedures may deteriorate.
The Company’s management assessed the effectiveness of the Company’s internal control over financial reporting as of June 30, 2008.2009. In making this assessment, the Company’s management used the criteria set forth by the Committee of Sponsoring Organizations of the Treadway Commission (COSO) in Internal Control-Integrated Framework.
Based on our assessment, management concluded that, as of June 30, 2008,2009, the Company’s internal control over financial reporting is effective based on those criteria.
The Company’s independent registered public accounting firm has issued an audit report on our assessment of the Company’s internal control over financial reporting. This report appears on page 50.52.
REPORT OF INDEPENDENT REGISTERED PUBLIC ACCOUNTING FIRM
Board of Directors and Stockholders
Bottomline Technologies (de), Inc.
We have audited Bottomline Technologies (de), Inc.’s internal control over financial reporting as of June 30, 2008,2009, based on criteria established in Internal Control—Integrated Framework issued by the Committee of Sponsoring Organizations of the Treadway Commission (the COSO criteria). Bottomline Technologies (de), Inc.’s management is responsible for maintaining effective internal control over financial reporting, and for its assessment of the effectiveness of internal control over financial reporting included in the accompanying Management’s Annual Report on Internal Control Over Financial Reporting. Our responsibility is to express an opinion on the company’s internal control over financial reporting based on our audit.
We conducted our audit in accordance with the standards of the Public Company Accounting Oversight Board (United States). Those standards require that we plan and perform the audit to obtain reasonable assurance about whether effective internal control over financial reporting was maintained in all material respects. Our audit included obtaining an understanding of internal control over financial reporting, assessing the risk that a material weakness exists, testing and evaluating the design and operating effectiveness of internal control based on the assessed risk, and performing such other procedures as we considered necessary in the circumstances. We believe that our audit provides a reasonable basis for our opinion.
A company’s internal control over financial reporting is a process designed to provide reasonable assurance regarding the reliability of financial reporting and the preparation of financial statements for external purposes in accordance with generally accepted accounting principles. A company’s internal control over financial reporting includes those policies and procedures that (1) pertain to the maintenance of records that, in reasonable detail, accurately and fairly reflect the transactions and dispositions of the assets of the company; (2) provide reasonable assurance that transactions are recorded as necessary to permit preparation of financial statements in accordance with generally accepted accounting principles, and that receipts and expenditures of the company are being made only in accordance with authorizations of management and directors of the company; and (3) provide reasonable assurance regarding prevention or timely detection of unauthorized acquisition, use, or disposition of the company’s assets that could have a material effect on the financial statements.
Because of its inherent limitations, internal control over financial reporting may not prevent or detect misstatements. Also, projections of any evaluation of effectiveness to future periods are subject to the risk that controls may become inadequate because of changes in conditions, or that the degree of compliance with the policies or procedures may deteriorate.
In our opinion, Bottomline Technologies (de), Inc. maintained, in all material respects, effective internal control over financial reporting as of June 30, 2008,2009, based on the COSO criteria.
We also have also audited, in accordance with the standards of the Public Company Accounting Oversight Board (United States), the consolidated balance sheets of Bottomline Technologies (de), Inc. as of June 30, 20082009 and 2007,2008, and the related consolidated statements of operations, stockholders’ equity and comprehensive income and loss, and cash flows for each of the three years in the period ended June 30, 20082009 of Bottomline Technologies (de), Inc. and our report dated September 2, 200810, 2009 expressed an unqualified opinion thereon.
/s/ Ernst & Young LLP
Boston, Massachusetts
September 2, 200810, 2009
REPORT OF INDEPENDENT REGISTERED PUBLIC ACCOUNTING FIRM
Board of Directors and Stockholders
Bottomline Technologies (de), Inc.
We have audited the accompanying consolidated balance sheets of Bottomline Technologies (de), Inc. as of June 30, 20082009 and 2007,2008, and the related consolidated statements of operations, stockholders’ equity and comprehensive income and loss, and cash flows for each of the three years in the period ended June 30, 2008.2009. Our audits also included the consolidated financial statement schedule listed in the index at Item 15(a)(2). These financial statements and schedule are the responsibility of the Company’s management. Our responsibility is to express an opinion on these financial statements and schedule based on our audits.
We conducted our audits in accordance with the standards of the Public Company Accounting Oversight Board (United States). Those standards require that we plan and perform the audit to obtain reasonable assurance about whether the financial statements are free of material misstatement. An audit includes examining, on a test basis, evidence supporting the amounts and disclosures in the financial statements. An audit also includes assessing the accounting principles used and significant estimates made by management, as well as evaluating the overall financial statement presentation. We believe that our audits provide a reasonable basis for our opinion.
In our opinion, the financial statements referred to above present fairly, in all material respects, the consolidated financial position of Bottomline Technologies (de), Inc. at June 30, 20082009 and 2007,2008, and the consolidated results of its operations and its cash flows for each of the three years in the period ended June 30, 2008,2009, in conformity with U.S. generally accepted accounting principles. Also, in our opinion, the related consolidated financial statement schedule, when considered in relation to the basic consolidated financial statements taken as a whole, presents fairly, in all material respects, the information set forforth therein.
As discussed in NotesNote 2 and 12 to the consolidated financial statements, on July 1, 2007, the Company adopted the provisions of Financial Accounting Standards Board Interpretation No. 48,Accounting for Uncertainty in Income TaxesTaxes..
We also have audited, in accordance with the standards of the Public Company Accounting Oversight Board (United States), Bottomline Technologies (de), Inc.’s internal control over financial reporting as of June 30, 2008,2009, based on criteria established in Internal Control-Integrated Framework issued by the Committee of Sponsoring Organizations of the Treadway Commission and our report dated September 2, 200810, 2009 expressed an unqualified opinion thereon.
/s/ Ernst & Young LLP
Boston, Massachusetts
September 2, 200810, 2009
| June 30, | June 30, | |||||||||||||||
| 2007 | 2008 | 2009 | 2008 | |||||||||||||
| (in thousands) | (in thousands) | |||||||||||||||
| ASSETS | ||||||||||||||||
Current assets: | ||||||||||||||||
Cash and cash equivalents | $ | 38,997 | $ | 35,316 | $ | 50,255 | $ | 35,316 | ||||||||
Marketable securities | 26,876 | 57 | 48 | 57 | ||||||||||||
Accounts receivable, net of allowances for doubtful accounts and returns of $1,590 at June 30, 2007 and $1,433 at June 30, 2008 | 24,169 | 28,747 | ||||||||||||||
Accounts receivable, net of allowances for doubtful accounts and returns of $645 at June 30, 2009 and $1,433 at June 30, 2008 | 23,118 | 28,747 | ||||||||||||||
Inventory, net | 657 | 516 | 397 | 516 | ||||||||||||
Prepaid expenses and other current assets | 4,745 | 5,641 | 5,134 | 5,641 | ||||||||||||
Total current assets | 95,444 | 70,277 | 78,952 | 70,277 | ||||||||||||
Property, plant and equipment, net | 8,270 | 11,840 | 10,106 | 11,840 | ||||||||||||
Customer related intangible assets, net | 23,521 | 33,679 | 20,441 | 33,679 | ||||||||||||
Core technology intangible assets, net | 6,410 | 7,916 | 3,460 | 7,916 | ||||||||||||
Other intangible assets, net | 880 | 1,632 | 1,119 | 1,632 | ||||||||||||
Goodwill | 53,485 | 72,187 | 64,569 | 72,187 | ||||||||||||
Other assets | 1,784 | 3,915 | 4,504 | 1,235 | ||||||||||||
Total assets | $ | 189,794 | $ | 201,446 | $ | 183,151 | $ | 198,766 | ||||||||
| LIABILITIES AND STOCKHOLDERS’ EQUITY | ||||||||||||||||
Current liabilities: | ||||||||||||||||
Accounts payable | $ | 6,650 | $ | 8,856 | $ | 5,955 | $ | 8,856 | ||||||||
Accrued expenses | 8,475 | 10,997 | 9,290 | 10,997 | ||||||||||||
Deferred revenue | 24,998 | 30,621 | 33,029 | 30,621 | ||||||||||||
Total current liabilities | 40,123 | 50,474 | 48,274 | 50,474 | ||||||||||||
Deferred revenue, non current | 2,498 | 3,856 | 10,213 | 3,856 | ||||||||||||
Deferred income taxes | 6,258 | 6,859 | 2,263 | 4,179 | ||||||||||||
Other liabilities | 479 | 1,992 | 1,852 | 1,992 | ||||||||||||
Total liabilities | 49,358 | 63,181 | 62,602 | 60,501 | ||||||||||||
Stockholders’ equity: | ||||||||||||||||
Preferred Stock, $.001 par value: | ||||||||||||||||
Authorized shares—4,000; issued and outstanding shares—none | — | — | — | — | ||||||||||||
Common Stock, $.001 par value: | ||||||||||||||||
Authorized shares—50,000; issued shares—24,866 at June 30, 2007, and 25,854 at June 30, 2008; outstanding shares—23,814 at June 30, 2007, and 23,939 at June 30, 2008 | 25 | 26 | ||||||||||||||
Authorized shares—50,000; issued shares—26,516 at June 30, 2009 and 25,854 at June 30, 2008; outstanding shares—24,311 at June 30, 2009 and 23,939 at June 30, 2008 | 27 | 26 | ||||||||||||||
Additional paid-in-capital | 263,229 | 277,660 | 287,082 | 277,660 | ||||||||||||
Accumulated other comprehensive income | 8,292 | 7,766 | ||||||||||||||
Treasury stock: 1,052 shares at June 30, 2007, and 1,915 shares at June 30, 2008, at cost | (11,285 | ) | (22,195 | ) | ||||||||||||
Accumulated other comprehensive (loss) income | (4,920 | ) | 7,766 | |||||||||||||
Treasury stock: 2,205 shares at June 30, 2009 and 1,915 shares at June 30, 2008, at cost | (24,360 | ) | (22,195 | ) | ||||||||||||
Accumulated deficit | (119,825 | ) | (124,992 | ) | (137,280 | ) | (124,992 | ) | ||||||||
Total stockholders’ equity | 140,436 | 138,265 | 120,549 | 138,265 | ||||||||||||
Total liabilities and stockholders’ equity | $ | 189,794 | $ | 201,446 | $ | 183,151 | $ | 198,766 | ||||||||
See accompanying notes.
CONSOLIDATED STATEMENTS OF OPERATIONS
| Year ended June 30, | Year ended June 30, | |||||||||||||||||||||||
| 2006 | 2007 | 2008 | 2009 | 2008 | 2007 | |||||||||||||||||||
| (in thousands, except per share data) | (in thousands, except per share data) | |||||||||||||||||||||||
Revenues: | ||||||||||||||||||||||||
Software licenses | $ | 12,236 | $ | 14,102 | $ | 13,949 | $ | 13,309 | $ | 13,949 | $ | 14,102 | ||||||||||||
Subscriptions and transactions | 22,290 | 26,767 | 29,693 | 31,196 | 29,693 | 26,767 | ||||||||||||||||||
Service and maintenance | 52,511 | 63,887 | 74,446 | 84,220 | 74,446 | 63,887 | ||||||||||||||||||
Equipment and supplies | 14,628 | 13,579 | 13,153 | 9,289 | 13,153 | 13,579 | ||||||||||||||||||
Total revenues | 101,665 | 118,335 | 131,241 | 138,014 | 131,241 | 118,335 | ||||||||||||||||||
Cost of revenues: | ||||||||||||||||||||||||
Software licenses | 1,398 | 744 | 880 | 821 | 880 | 744 | ||||||||||||||||||
Subscriptions and transactions | 9,294 | 12,138 | 15,789 | 15,045 | 15,789 | 12,138 | ||||||||||||||||||
Service and maintenance(1) | 24,546 | 30,009 | 33,189 | 38,100 | 33,189 | 30,009 | ||||||||||||||||||
Equipment and supplies | 11,639 | 10,168 | 9,551 | 6,875 | 9,551 | 10,168 | ||||||||||||||||||
Total cost of revenues | 46,877 | 53,059 | 59,409 | 60,841 | 59,409 | 53,059 | ||||||||||||||||||
Gross profit | 54,788 | 65,276 | 71,832 | 77,173 | 71,832 | 65,276 | ||||||||||||||||||
Operating expenses: | ||||||||||||||||||||||||
Sales and marketing(1) | 26,305 | 31,654 | 31,739 | 32,517 | 31,739 | 31,654 | ||||||||||||||||||
Product development and engineering:(1) | 12,289 | 16,069 | 17,376 | |||||||||||||||||||||
Product development and engineering(1) | 20,096 | 17,376 | 16,069 | |||||||||||||||||||||
General and administrative(1) | 16,129 | 19,320 | 19,197 | 20,915 | 19,197 | 19,320 | ||||||||||||||||||
Amortization of intangible assets | 4,491 | 9,324 | 11,399 | 15,563 | 11,399 | 9,324 | ||||||||||||||||||
Total operating expenses | 59,214 | 76,367 | 79,711 | 89,091 | 79,711 | 76,367 | ||||||||||||||||||
Loss from operations | (4,426 | ) | (11,091 | ) | (7,879 | ) | (11,918 | ) | (7,879 | ) | (11,091 | ) | ||||||||||||
Interest income | 3,138 | 3,187 | 2,712 | 635 | 2,712 | 3,187 | ||||||||||||||||||
Interest expense | (15 | ) | (24 | ) | (36 | ) | (106 | ) | (36 | ) | (24 | ) | ||||||||||||
Other, net | 129 | 14 | 406 | (86 | ) | 406 | 14 | |||||||||||||||||
Other income, net | 3,252 | 3,177 | 3,082 | 443 | 3,082 | 3,177 | ||||||||||||||||||
Loss before provision (benefit) for income taxes | (1,174 | ) | (7,914 | ) | (4,797 | ) | ||||||||||||||||||
Provision (benefit) for income taxes | 660 | (884 | ) | 464 | ||||||||||||||||||||
Loss before provision for (benefit from) income taxes | (11,475 | ) | (4,797 | ) | (7,914 | ) | ||||||||||||||||||
Provision for (benefit from) income taxes | 813 | 464 | (884 | ) | ||||||||||||||||||||
Net loss | $ | (1,834 | ) | $ | (7,030 | ) | $ | (5,261 | ) | $ | (12,288 | ) | $ | (5,261 | ) | $ | (7,030 | ) | ||||||
Basic and diluted net loss per common share | $ | (0.08 | ) | $ | (0.30 | ) | $ | (0.22 | ) | $ | (0.51 | ) | $ | (0.22 | ) | $ | (0.30 | ) | ||||||
Shares used in computing basic and diluted net loss per common share | 22,838 | 23,539 | 23,825 | 24,044 | 23,825 | 23,539 | ||||||||||||||||||
(1) Stock based compensation is allocated as follows: |
(1) Stock based compensation is allocated as follows: |
|
(1) Stock based compensation is allocated as follows:
|
| ||||||||||||||||||||
| Fiscal Year Ended June 30 | ||||||||||||||||||||||||
| Fiscal Year Ended June 30 | 2009 | 2008 | 2007 | |||||||||||||||||||||
| 2006 | 2007 | 2008 | (in thousands) | |||||||||||||||||||||
| (in thousands) | ||||||||||||||||||||||||
Cost of revenues: service and maintenance | $ | 474 | $ | 755 | $ | 987 | $ | 1,105 | $ | 987 | $ | 755 | ||||||||||||
Sales and marketing | 2,489 | 2,893 | 2,841 | 2,489 | 2,841 | 2,893 | ||||||||||||||||||
Product development and engineering | 841 | 761 | 780 | 718 | 780 | 761 | ||||||||||||||||||
General and administrative | 3,180 | 3,536 | 4,195 | 5,186 | 4,195 | 3,536 | ||||||||||||||||||
| $ | 6,984 | $ | 7,945 | $ | 8,803 | $ | 9,498 | $ | 8,803 | $ | 7,945 | |||||||||||||
See accompanying notes.
CONSOLIDATED STATEMENTS OF STOCKHOLDERS’ EQUITY
AND COMPREHENSIVE INCOME AND LOSS
| Common Stock | Treasury Stock | Additional Paid-in Capital | Accumulated Other Comprehensive Income | Accumulated Deficit | Total Stockholders’ Equity | Common Stock | Treasury Stock | Additional Paid-in Capital | Accumulated Other Comprehensive Income | Accumulated Deficit | Total Stockholders’ Equity | |||||||||||||||||||||||||||||||||||||||||||||
| Shares | Amount | Shares | Amount | Shares | Amount | Shares | Amount | |||||||||||||||||||||||||||||||||||||||||||||||||
| (in thousands) | (in thousands) | |||||||||||||||||||||||||||||||||||||||||||||||||||||||
Balances at June 30, 2005 | 18,930 | $ | 19 | 143 | $ | (1,149 | ) | $ | 182,534 | $ | 2,350 | $ | (110,961 | ) | $ | 72,793 | ||||||||||||||||||||||||||||||||||||||||
Balances at June 30, 2006 | 23,647 | $ | 23 | 93 | $ | (748 | ) | $ | 246,543 | $ | 3,585 | $ | (112,795 | ) | $ | 136,608 | ||||||||||||||||||||||||||||||||||||||||
Issuance of common stock for employee stock purchase plan and upon exercise of stock options | 840 | 1 | (58 | ) | 462 | 5,825 | — | — | 6,288 | 506 | 1 | (67 | ) | 649 | 3,504 | — | — | 4,154 | ||||||||||||||||||||||||||||||||||||||
Issuance of common stock in connection with follow-on offering | 3,560 | 3 | — | — | 46,769 | — | — | 46,772 | ||||||||||||||||||||||||||||||||||||||||||||||||
Vesting of restricted stock awards | 192 | — | — | — | — | — | — | — | ||||||||||||||||||||||||||||||||||||||||||||||||
Stock compensation expense | — | — | — | — | 6,984 | — | — | 6,984 | — | — | — | — | 7,945 | — | — | 7,945 | ||||||||||||||||||||||||||||||||||||||||
Issuance of common stock in connection with acquisitions, net of share registration costs | 317 | — | — | — | 4,149 | — | — | 4,149 | ||||||||||||||||||||||||||||||||||||||||||||||||
Issuance of common stock in connection with Formscape acquisition | 521 | 1 | — | — | 5,205 | — | — | 5,206 | ||||||||||||||||||||||||||||||||||||||||||||||||
Repurchase of common stock to be held in treasury | — | — | 8 | (61 | ) | — | — | — | (61 | ) | — | — | 1,026 | (11,186 | ) | — | — | — | (11,186 | ) | ||||||||||||||||||||||||||||||||||||
Tax benefit associated with non-qualified stock option exercises | — | — | — | — | 282 | — | — | 282 | — | — | — | — | 32 | — | — | 32 | ||||||||||||||||||||||||||||||||||||||||
Net loss | — | — | — | — | — | — | (1,834 | ) | (1,834 | ) | — | — | — | — | — | — | (7,030 | ) | (7,030 | ) | ||||||||||||||||||||||||||||||||||||
Foreign currency translation adjustment | — | — | — | — | — | 1,235 | — | 1,235 | — | — | — | — | — | 4,707 | — | 4,707 | ||||||||||||||||||||||||||||||||||||||||
Comprehensive loss | — | — | — | — | — | — | — | (599 | ) | — | — | — | — | — | — | — | (2,323 | ) | ||||||||||||||||||||||||||||||||||||||
Balances at June 30, 2006 | 23,647 | $ | 23 | 93 | $ | (748 | ) | $ | 246,543 | $ | 3,585 | $ | (112,795 | ) | $ | 136,608 | ||||||||||||||||||||||||||||||||||||||||
Issuance of common stock for employee stock purchase plan and upon exercise of stock options | 506 | 1 | (67 | ) | 649 | 3,504 | — | — | 4,154 | |||||||||||||||||||||||||||||||||||||||||||||||
Vesting of restricted stock awards | 192 | — | — | — | — | — | — | |||||||||||||||||||||||||||||||||||||||||||||||||
Stock compensation expense | — | — | — | — | 7,945 | — | — | 7,945 | ||||||||||||||||||||||||||||||||||||||||||||||||
Issuance of common stock in connection Formscape acquisition | 521 | 1 | — | — | 5,205 | — | — | 5,206 | ||||||||||||||||||||||||||||||||||||||||||||||||
Repurchase of common stock to be held in treasury | — | — | 1,026 | (11,186 | ) | — | — | — | (11,186 | ) | ||||||||||||||||||||||||||||||||||||||||||||||
Tax benefit associated with non qualified stock option exercises | — | — | — | — | 32 | — | — | 32 | ||||||||||||||||||||||||||||||||||||||||||||||||
Net loss | — | — | — | — | — | — | (7,030 | ) | (7,030 | ) | ||||||||||||||||||||||||||||||||||||||||||||||
Foreign currency translation adjustment | — | — | — | — | — | 4,707 | — | 4,707 | ||||||||||||||||||||||||||||||||||||||||||||||||
Comprehensive loss | — | — | — | — | — | — | — | (2,323 | ) | |||||||||||||||||||||||||||||||||||||||||||||||
Balances at June 30, 2007 | 24,866 | $ | 25 | 1,052 | $ | (11,285 | ) | $ | 263,229 | $ | 8,292 | $ | (119,825 | ) | $ | 140,436 | 24,866 | $ | 25 | 1,052 | $ | (11,285 | ) | $ | 263,229 | $ | 8,292 | $ | (119,825 | ) | $ | 140,436 | ||||||||||||||||||||||||
Cumulative effect of change in accounting principle—adoption of FIN 48 | — | — | — | — | — | — | 94 | 94 | ||||||||||||||||||||||||||||||||||||||||||||||||
Cumulative effect of change in accounting principle – adoption of FIN 48 | — | — | — | — | — | — | 94 | 94 | ||||||||||||||||||||||||||||||||||||||||||||||||
Issuance of common stock for employee stock purchase plan and upon exercise of stock options | 571 | 1 | (86 | ) | 992 | 4,795 | — | — | 5,788 | 571 | 1 | (86 | ) | 992 | 4,795 | — | — | 5,788 | ||||||||||||||||||||||||||||||||||||||
Vesting of restricted stock awards | 311 | — | — | — | — | — | — | — | 311 | — | — | — | — | — | — | — | ||||||||||||||||||||||||||||||||||||||||
Stock compensation expense | — | — | — | — | 8,803 | — | — | 8,803 | — | — | — | — | 8,803 | — | — | 8,803 | ||||||||||||||||||||||||||||||||||||||||
Exercise of director stock options on a net share settlement basis | 106 | — | 70 | (941 | ) | 941 | — | — | — | 106 | — | 70 | (941 | ) | 941 | — | — | — | ||||||||||||||||||||||||||||||||||||||
Repurchase of common stock to be held in treasury | — | — | 879 | (10,961 | ) | — | — | — | (10,961 | ) | — | — | 879 | (10,961 | ) | — | — | — | (10,961 | ) | ||||||||||||||||||||||||||||||||||||
Tax deficiency associated with non qualified stock option exercises and forfeitures | — | — | — | — | (82 | ) | — | — | (82 | ) | — | — | — | — | (82 | ) | — | — | (82 | ) | ||||||||||||||||||||||||||||||||||||
Share registration costs | — | — | — | — | (26 | ) | — | — | (26 | ) | — | — | — | — | (26 | ) | — | — | (26 | ) | ||||||||||||||||||||||||||||||||||||
Net loss | — | — | — | — | — | — | (5,261 | ) | (5,261 | ) | — | — | — | — | — | — | (5,261 | ) | (5,261 | ) | ||||||||||||||||||||||||||||||||||||
Foreign currency translation adjustment | — | — | — | — | — | (526 | ) | — | (526 | ) | — | — | — | — | — | (526 | ) | — | (526 | ) | ||||||||||||||||||||||||||||||||||||
Comprehensive loss | — | — | — | — | — | — | — | (5,787 | ) | — | — | — | — | — | — | — | (5,787 | ) | ||||||||||||||||||||||||||||||||||||||
Balances at June 30, 2008 | 25,854 | $ | 26 | 1,915 | $ | (22,195 | ) | $ | 277,660 | $ | 7,766 | $ | (124,992 | ) | $ | 138,265 | 25,854 | $ | 26 | 1,915 | $ | (22,195 | ) | $ | 277,660 | $ | 7,766 | $ | (124,992 | ) | $ | 138,265 | ||||||||||||||||||||||||
Issuance of common stock for employee stock purchase plan and upon exercise of stock options | 97 | — | (116 | ) | 1,304 | 152 | — | — | 1,456 | |||||||||||||||||||||||||||||||||||||||||||||||
Vesting of restricted stock awards | 565 | 1 | — | — | — | — | — | 1 | ||||||||||||||||||||||||||||||||||||||||||||||||
Stock compensation expense | — | — | — | — | 9,498 | — | — | 9,498 | ||||||||||||||||||||||||||||||||||||||||||||||||
Repurchase of common stock to be held in treasury | — | — | 406 | (3,469 | ) | — | — | — | (3,469 | ) | ||||||||||||||||||||||||||||||||||||||||||||||
Tax deficiency associated with non qualified stock option exercises and forfeitures | — | — | — | — | (228 | ) | — | — | (228 | ) | ||||||||||||||||||||||||||||||||||||||||||||||
Net loss | — | — | — | — | — | — | (12,288 | ) | (12,288 | ) | ||||||||||||||||||||||||||||||||||||||||||||||
Foreign currency translation adjustment | — | — | — | — | — | (12,686 | ) | — | (12,686 | ) | ||||||||||||||||||||||||||||||||||||||||||||||
Comprehensive loss | — | — | — | — | — | — | — | (24,974 | ) | |||||||||||||||||||||||||||||||||||||||||||||||
Balances at June 30, 2009 | 26,516 | $ | 27 | 2,205 | $ | (24,360 | ) | $ | 287,082 | $ | (4,920 | ) | $ | (137,280 | ) | $ | 120,549 | |||||||||||||||||||||||||||||||||||||||
See accompanying notes.
CONSOLIDATED STATEMENTS OF CASH FLOWS
| Year ended June 30, | Year ended June 30, | |||||||||||||||||||||||
| 2006 | 2007 | 2008 | 2009 | 2008 | 2007 | |||||||||||||||||||
| (in thousands) | (in thousands) | |||||||||||||||||||||||
Operating activities | ||||||||||||||||||||||||
Net loss | $ | (1,834 | ) | $ | (7,030 | ) | $ | (5,261 | ) | $ | (12,288 | ) | $ | (5,261 | ) | $ | (7,030 | ) | ||||||
Adjustments to reconcile net loss to net cash provided by operating activities: | ||||||||||||||||||||||||
Amortization of intangible assets | 4,491 | 9,324 | 11,399 | 15,563 | 11,399 | 9,324 | ||||||||||||||||||
Stock compensation expense | 6,984 | 7,945 | 8,803 | 9,498 | 8,803 | 7,945 | ||||||||||||||||||
Amortization of investment income | (7 | ) | — | — | ||||||||||||||||||||
Depreciation and amortization of property, plant and equipment | 2,674 | 3,183 | 3,511 | 3,914 | 3,511 | 3,183 | ||||||||||||||||||
Acquisition related technology write-offs | 189 | — | — | |||||||||||||||||||||
Deferred income tax benefit | (498 | ) | (896 | ) | (616 | ) | ||||||||||||||||||
Deferred income tax (expense) benefit | 327 | (616 | ) | (896 | ) | |||||||||||||||||||
Provision for allowances on accounts receivable | (77 | ) | (94 | ) | (348 | ) | (152 | ) | (348 | ) | (94 | ) | ||||||||||||
Provision for allowances for obsolescence of inventory | 117 | (6 | ) | 16 | 38 | 16 | (6 | ) | ||||||||||||||||
Excess tax benefits associated with stock compensation | (282 | ) | (104 | ) | (125 | ) | (15 | ) | (125 | ) | (104 | ) | ||||||||||||
Loss on disposal of equipment | — | — | 54 | 15 | 54 | — | ||||||||||||||||||
Gain on foreign exchange | (102 | ) | (112 | ) | (275 | ) | (50 | ) | (275 | ) | (112 | ) | ||||||||||||
Changes in operating assets and liabilities: | ||||||||||||||||||||||||
Accounts receivable | 3,358 | 207 | (2,021 | ) | 3,903 | (2,021 | ) | 207 | ||||||||||||||||
Inventory, prepaid expenses and other current assets and other assets | 869 | 565 | 1,285 | (3,247 | ) | 1,285 | 565 | |||||||||||||||||
Accounts payable, accrued expenses, deferred revenue and deposits and other long-term liabilities | (4,027 | ) | (1,021 | ) | (241 | ) | ||||||||||||||||||
Accounts payable, accrued expenses, deferred revenue and other long-term liabilities | 7,038 | (241 | ) | (1,021 | ) | |||||||||||||||||||
Net cash provided by operating activities | 11,855 | 11,961 | 16,181 | 24,544 | 16,181 | 11,961 | ||||||||||||||||||
Investing activities | ||||||||||||||||||||||||
Acquisition of businesses and assets, net of cash acquired | (18,195 | ) | (17,016 | ) | (36,730 | ) | — | (36,730 | ) | (17,016 | ) | |||||||||||||
Purchases of available-for-sale securities | (41,750 | ) | (16,875 | ) | (225 | ) | — | (225 | ) | (16,875 | ) | |||||||||||||
Proceeds from sales of available-for-sale securities | 13,100 | 31,750 | 27,050 | — | 27,050 | 31,750 | ||||||||||||||||||
Purchases of held-to-maturity securities | (46 | ) | — | (51 | ) | (53 | ) | (51 | ) | — | ||||||||||||||
Proceeds from sales of held-to-maturity securities | 2,084 | — | 51 | 53 | 51 | — | ||||||||||||||||||
Purchases of property and equipment, net | (2,612 | ) | (3,593 | ) | (4,971 | ) | (3,133 | ) | (4,971 | ) | (3,593 | ) | ||||||||||||
Net cash used in investing activities | (47,419 | ) | (5,734 | ) | (14,876 | ) | (3,133 | ) | (14,876 | ) | (5,734 | ) | ||||||||||||
Financing activities | ||||||||||||||||||||||||
Proceeds from exercise of stock options and employee stock purchase plan | 6,288 | 4,154 | 5,788 | 1,456 | 5,788 | 4,154 | ||||||||||||||||||
Repurchase of common stock | (61 | ) | (11,186 | ) | (10,961 | ) | (3,469 | ) | (10,961 | ) | (11,186 | ) | ||||||||||||
Excess tax benefits associated with stock compensation | 282 | 104 | 125 | 15 | 125 | 104 | ||||||||||||||||||
Capital lease payments | (131 | ) | (45 | ) | (90 | ) | ||||||||||||||||||
Payment of bank financing fees | (33 | ) | (15 | ) | (28 | ) | (30 | ) | (28 | ) | (15 | ) | ||||||||||||
Capital lease payments | — | (90 | ) | (45 | ) | |||||||||||||||||||
Proceeds from sale of common stock, net | 46,772 | — | — | |||||||||||||||||||||
Payment of long-term financing obligation | (89 | ) | — | — | ||||||||||||||||||||
Net cash provided by (used in) financing activities | 53,248 | (7,033 | ) | (5,121 | ) | |||||||||||||||||||
Net cash used in financing activities | (2,248 | ) | (5,121 | ) | (7,033 | ) | ||||||||||||||||||
Effect of exchange rate changes on cash | 279 | 1,051 | 135 | (4,224 | ) | 135 | 1,051 | |||||||||||||||||
Increase (decrease) in cash and cash equivalents | 17,963 | 245 | (3,681 | ) | 14,939 | (3,681 | ) | 245 | ||||||||||||||||
Cash and cash equivalents at beginning of year | 20,789 | 38,752 | 38,997 | 35,316 | 38,997 | 38,752 | ||||||||||||||||||
Cash and cash equivalents at end of year | $ | 38,752 | $ | 38,997 | $ | 35,316 | $ | 50,255 | $ | 35,316 | $ | 38,997 | ||||||||||||
Supplemental disclosure of cash flow information: | ||||||||||||||||||||||||
Cash paid during the year for: | ||||||||||||||||||||||||
Interest | $ | 15 | $ | 24 | $ | 9 | $ | 96 | $ | 9 | $ | 24 | ||||||||||||
Income taxes | $ | 508 | $ | 524 | $ | 218 | $ | 1,341 | $ | 218 | $ | 524 | ||||||||||||
Non-cash investing and financing activities: | ||||||||||||||||||||||||
Issuance of common stock in connection with acquisitions | $ | 4,152 | $ | 5,207 | $ | — | $ | — | $ | — | $ | 5,207 | ||||||||||||
See accompanying notes.
BOTTOMLINE TECHNOLOGIES (de), INC.
NOTES TO CONSOLIDATED FINANCIAL STATEMENTS
Year ended June 30, 2006,2009, 2008 and 2007 and 2008
1. Organization and Nature of Business
Bottomline Technologies (de), Inc. (the Company) is a Delaware corporation that markets and provides electronic payment, invoice and document automation solutions to corporations, financial institutions and banks around the world. The Company’s solutions are used to streamline, automate and manage processes and transactions involving global payments, invoice receipt and approval, collections, cash management, document management, reporting and document archive. The Company’s products and services are sold to customers operating in many different industries throughout the world, but principally in the US, Europe and Australia.
2. Significant Accounting Policies
Principles of Consolidation
The consolidated financial statements include the accounts of the Company and its subsidiaries, all of which are wholly owned. All intercompany balances and transactions have been eliminated in consolidation.
Use of Estimates in the Preparation of Consolidated Financial Statements
The preparation of financial statements in conformity with accounting principles generally accepted in the United States requires management to make estimates and assumptions that affect the amounts reported in the financial statements and accompanying notes. Estimates include, but are not limited to, revenue recognition (particularly revenue recognition associated with contracts accounted for on a percentage of completion basis), allowances for doubtful accounts and returns, determining the fair value associated with acquired intangible assets and acquired deferred revenue, asset impairment and certain of the Company’s accrued liabilities. Actual results could differ from those estimates.
Foreign Currency Translation
The Company has various international subsidiaries in Europe (Bottomline Europe) and in Australia (Bottomline Australia), whose functional currencies are either the British Pound Sterling, European Euro (in respect of the European subsidiaries) or the Australian Dollar (in respect of the Australian subsidiaries). Assets and liabilities of Bottomline Europe and Bottomline Australia have been translated into US dollars at year-end exchange rates, and results of operations and cash flows have been translated at the average exchange rates in effect during the year. Gains or losses resulting from foreign currency translation are included as a component of accumulated other comprehensive income or loss. Realized foreign currency transaction gains and losses are included in results of operations as incurred, and are not significant to the Company’s overall operations.
Cash and Cash Equivalents
The Company considers all highly liquid instruments with an original maturity of ninety daysthree months or less to be cash equivalents. The carrying value of these instruments approximates their fair value. At June 30, 20082009 the Company’s cash equivalents consisted of demand deposit accounts and money market funds.
Marketable Securities
The Company accounts for marketable securities in accordance with Statement of Financial Accounting Standards No. 115 “Accounting for Certain Investments in Debt and Equity Securities” (SFAS 115). SFAS 115 establishes the accounting and reporting requirements for all debt securities and for investments in equity securities that have determinable fair values. All marketable securities must be classified as one of the following: held-to-maturity, available-for-sale, or trading.
Historically,From time to time, the Company’s marketable securities consisted in large part of auction rate securities which were invested in agencies and institutions affiliated with US states. Auction rate investments were classified as available-for-sale and were recorded at fair value. During 2008, in response to changing market risks, the Company liquidated its auction rate securities, at par value, and at June 30, 2008 held no such investments. From time to time, marketable securities may also consist of corporate bonds and term deposits at banking institutions. The Company’s available-for-saleheld to maturity investments, which mature within one year, are recorded at fair valueamortized cost and interest income is recognized in earnings when earned. The cost of securities sold is determined based on the specific identification method. At June 30, 2009 and 2008 amortized cost approximated fair value.
The table below presents information regarding the Company’s marketable securities by major security type as of June 30, 20072009 and 2008.
| June 30, 2007 | June 30, 2008 | June 30, 2009 | June 30, 2008 | |||||||||||||||||||||||||||||||||
| Held to Maturity | Available for Sale | Total | Held to Maturity | Available for Sale | Total | Held to Maturity | Available for Sale | Total | Held to Maturity | Available for Sale | Total | |||||||||||||||||||||||||
| (in thousands) | (in thousands) | |||||||||||||||||||||||||||||||||||
Marketable securities: | ||||||||||||||||||||||||||||||||||||
Debt securities issued by U.S. state agencies and institutions | — | $ | 26,825 | $ | 26,825 | — | — | — | ||||||||||||||||||||||||||||
Corporate and other debt securities | — | 51 | 51 | — | 57 | 57 | 48 | — | 48 | 57 | — | 57 | ||||||||||||||||||||||||
Total marketable securities | $ | — | $ | 26,876 | $ | 26,876 | $ | — | $ | 57 | $ | 57 | $ | 48 | $ | — | $ | 48 | $ | 57 | $ | — | $ | 57 | ||||||||||||
Concentration of Credit Risk
Financial instruments that potentially subject the Company to significant concentrations of credit risk consist of cash and cash equivalents, marketable securities and accounts receivable. The Company had approximately $35$50 million of cash, cash equivalents and marketable securities invested primarily with four financial institutions at June 30, 2008.2009. Balances of cash, cash equivalents and marketable securities are typically in excess of any insurance, such as FDIC coverage, that may protect the Company’s deposits.
The Company’s accounts receivable are reported in its consolidated balance sheet net of allowances for uncollectible accounts and customer returns. The Company believes that the concentration of credit risk with respect to accounts receivable is limited due to the large number of companies and diverse industries comprising its customer base. On-going credit evaluations are performed, generally with a focus on new customers or customers with whom the Company has no prior collections history, and collateral is generally not required. The Company maintains reserves for potential credit losses based on customer specific situations as well as its historic experience and such losses, in the aggregate, have not exceeded management’s expectations. There was one customer that accounted for approximately 12%10% and 14% of the Company’s accounts receivable balance at June 30, 20072009 and 2008, respectively.
Financial Instruments
The fair value of the Company’s financial instruments, which include cash and cash equivalents, marketable securities, accounts receivable and accounts payable, are based on assumptions concerning the amount and timing of estimated future cash flows and assumed discount rates reflecting varying degrees of perceived risk. The carrying value of these financial instruments approximated their fair value at June 30, 20072009 and 2008, respectively, due to the short-term nature of the instruments.
Accounts Receivable
Accounts receivable include unbilled receivables of approximately $3.1$0.2 million and $1.9 million at June 30, 20072009 and 2008, respectively. Unbilled receivables predominantly represent revenues recognized on long-term contracts for which billings have not yet been presented to the customers, based on the contractually stipulated billing requirements.
Inventory
Inventory is stated at the lower of the Company’s cost of purchase (first-in, first-out method) or market.
Property, Plant and Equipment
Property, plant and equipment are stated at cost, net of accumulated amortization and depreciation. Property and equipment are depreciated on a straight-line basis over the estimated useful lives of the assets (generally three to six years). Software is depreciated on a straight-line basis over the estimated useful lives of the assets (generally one to three years). The building is depreciated on a straight-line basis over the estimated useful life of the asset (fifty years). Leasehold improvements are amortized on a straight-line basis over the lesser of the estimated useful life of the asset or the respective remaining lease term, inclusive of any expected renewal periods.
Goodwill and Other Intangible Assets
The Company accounts for goodwill and other intangible assets at their estimated fair values in accordance with SFAS No. 142, “Goodwill and Other Intangible Assets.” In connection with prior business and asset acquisitions, the Company recorded goodwill based on the excess of the purchase price over the identifiable tangible and intangible assets acquired and liabilities assumed. Goodwill is tested at least annually for impairment. The historical timing of the Company’s annual impairment review is during its fourth quarter.
The Company’s specifically identifiable intangible assets, which consist principally of acquired core technology and customer related intangible assets, are reported at fair value net of accumulated amortization. These intangible assets are being amortized over their estimated useful lives, which range from one to ten years, at amortization rates that are proportional to each asset’s estimated economic benefit to the Company. The carrying value of these intangible assets is reviewed annually by the Company, or more frequently if indicators of impairment are present, in accordance with the provisions of SFAS No. 144, “Accounting for the Impairment or Disposal of Long-Lived Assets.”
In performing its review of the recoverability of goodwill and other intangible assets the Company considers several factors, including whether there have been significant changes in legal factors or the overall business climate that could affect the underlying value of an asset. The Company also considers whether there is an expectation that the asset will be sold or disposed of before the end of its originally estimated useful life. In the case of goodwill, the Company must also consider, and estimate the fair value of the reporting unit to which the goodwill is assigned. If, as a result of examining any of these factors, the Company concludes that the carrying value of its goodwill or other intangible assets exceeds its estimated fair value the Company will record an impairment charge and reduce the carrying value of the asset to its estimated fair value.
Advertising Costs
The Company expenses advertising costs as incurred. Advertising costs were $1.2 million, $1.3 million, $1.6 million, and $1.3$1.6 million for the years ended June 30, 2006,2009, 2008 and 2007, and 2008, respectively.
Shipping and Handling Costs
The Company expenses all shipping, handling and delivery costs in the period incurred as a component of equipment and supplies cost of revenues.
Commissions Expense
The Company records commissions as a component of sales and marketing expense when earned by the respective salesperson. Excluding software licenses within our Banking Solutions segment, for which commissions are earned as revenue is recorded over the period of project performance, substantially all software commissions are earned in the month in which a customer order is received. Commissions associated with
professional services are typically earned in the month that services are rendered. Commissions associated with post-contract customer support arrangements and subscription-based arrangements are typically earned when the customer is billed for the underlying contractual period. Commissions are normally paid within thirty days of the month in which they are earned.
Research and Development Expenditures
The Company expenses research and development costs in the period incurred.
Income Taxes and Income Tax Uncertainties
The Company accounts for income taxes in accordance with SFAS No. 109, “Accounting for Income Taxes.” Under SFAS 109, deferred tax assets and liabilities are determined based on the differences between the financial reporting and tax basis of assets and liabilities, and are measured by applying tax rates that are expected to be in effect when the differences reverse. SFAS 109 requires a valuation allowance to reduce the amount of deferred tax assets recorded if, based on the weight of available evidence, it is more likely than not that some portion or all of the deferred tax assets will not be realized. The Company has concluded that it is more likely than not that the deferred tax assets associated with its US operations and a component of the deferred tax assets associated with its European operations will not be realized and accordingly, a valuation allowance has been recorded against those assets. Deferred tax assets of Australia have been fully recognized, as those amounts are expected to be realized by the Company’s Australian subsidiaries.
As more fully disclosed in Note 12, theThe Company adopted Financial Accounting Standards board Interpretation No. 48, “Accounting for Uncertainty in Income Taxes” (FIN 48) in fiscal 2008. FIN 48 requires a two-step analysis for all tax positions, the first step involving an evaluation of the tax position based solely on technical merits (such as tax law) and the second step measuring the tax position based on the probability of it being sustained in the event of a tax examination. Under FIN 48, the Company recognizes tax benefits at the largest amount that it deems more likely than not will be realized upon ultimate settlement of any tax uncertainty. Tax positions that fail to qualify for recognition are recognized in the period in which the “more-likely-than-not” standard has been reached, when the tax positions are resolved with the respective taxing authority or when the statute of limitations for tax examination has expired.
The company records any interest or penalties accruing in respect of uncertain tax positions as a component of income tax expense.
Share Based Compensation
In fiscal year 2006, theThe Company adopted Statement of Financial Accounting Standard No. 123 (revised 2004), “Share Based Payment” (SFAS 123R).accounts for stock-based compensation in accordance with SFAS 123R. Under SFAS 123R, the Company is required to recognize as expense the estimated fair value of all share based payments to employees. The Company records expense associated with its share based payment awards on a straight-line basis over the award’s vesting period.
The Company adopted SFAS 123R under the modified prospective method. Under this method, the Company recognized compensation cost for all share-based payments to employees based on the grant date estimate of fair value for those awards, beginning on July 1, 2005 (the date of adoption).
Capitalized Software Costs
Capitalization of software development costs under SFAS No. 86, “Accounting for the Costs of Computer Software to be Sold, Leased, or Otherwise Marketed” begins upon the establishment of technological feasibility. In the development of the Company’s products and its enhancements to existing products, the technological feasibility of the software is not established until substantially all product development is complete, including the development of a working model. The establishment of technological feasibility and the ongoing assessment of recoverability of capitalized software development costs requires considerable judgment by management with
respect to certain external factors, including, but not limited to, technological feasibility, anticipated future gross revenues, estimated economic life, and changes in software and hardware technologies. For the years ended June 30, 2006,2009, 2008 and 2007, and 2008, there were no material costs capitalized since substantially all development costs were incurred prior to attaining technological feasibility.
Revenue Recognition
The Company recognizes revenue on its software license arrangements in accordance with Statement of Position (SOP) 97-2 “Software Revenue Recognition” and related pronouncements. Under SOP 97-2, revenue is recognized when four basic criteria are met: persuasive evidence of an arrangement exists, delivery of the product has occurred, the fee is fixed and determinable and collectibilitycollectability is deemed probable. The Company considers a fully executed, non-cancelable agreement or a customer purchase order to be persuasive evidence of an arrangement. Delivery is deemed to have occurred upon transfer of product title to the customer or the completion of services rendered. The Company considers the arrangement fee to be fixed and determinable if it is not subject to adjustment and if the customer has not been granted extended payment terms. Excluding our long term contract arrangements for which revenue is recorded on a percentage of completion basis, extended payment terms are deemed to be present when any portion of the software license fee is due in excess of 90 days after the date of product delivery. In arrangements that contain extended payment terms, revenue is recorded as customer payments become contractually due, assuming all other revenue recognition criteria have been met. The Company considers the arrangement fee to be probable of collection if its internal credit analysis indicates that the customer will be able to pay committedcontractual amounts as they become due.
The Company’s software arrangements may contain multiple revenue elements, such as software licenses, professional services, hardware and post-contract customer support.
For multiple element arrangements which qualify for separate element accounting treatment, revenue is recognized for each element when each of the four basic criteria is met. Revenue for post-contract customer support agreements is recognized ratably over the term of the agreement, which is generally one year. For software arrangements involving multiple elements which qualify for separate element treatment, revenue is allocated to each element based on vendor specific objective evidence of fair value. Vendor specific objective evidence of fair value is limited to the price charged when the element is sold separately or, for an element not yet being sold separately, the price established by management having the relevant authority. For multiple element revenue arrangements for which the Company does not have vendor specific evidence of fair value for the software license but does have vendor specific evidence of fair value for all of the other elements in the arrangement, revenues arerevenue is allocated to each element according to the residual value method. Under the residual value method, revenue equal to the fair value of each undelivered element is deferred and recognized upon delivery of that element. Any “residual” arrangement fee is allocated to the software license.
Certain of the Company’s software license arrangements require significant customization and modification and involve extended implementation periods and as such do not qualify for separate element treatment. These arrangements are accounted for using percentage of completion contract accounting as defined by Statement of Position No. 81-1 (SOP 81-1), “Accounting for Performance of Construction-Type and Certain Production-Type Contracts.” In such arrangements, since the Company is able to make reasonably reliable estimates of progress toward completion, revenue is recognized over the life of the project as work is performed. Revenue earned in each reporting period is determined based on the percentage of labor hours incurred on the project as a percentage of total estimated labor hours. Customer payment milestones for both software and professional services fees on these long-term arrangements typically occur on a periodic basis over the period of project completion.
For arrangements not involving a software license fee, such as with the Company’s subscription and transaction basedhosted offerings or equipment and supplies only sales, the Company recognizes revenue in accordance with Staff Accounting Bulletin No. 104 (SAB 104), “Revision of Topic 13-Revenue Recognition.” SAB 104 summarizes certain of the SEC’s views in applying generally accepted accounting principles to revenue recognition in financial statements. Under SAB 104, revenue is recognized when four basic criteria are met, and these criteria are similar to the requirements of SOP 97-2: persuasive evidence of an arrangement exists, delivery has occurred or services have been rendered, the arrangement fee is fixed or determinable and collectibilitycollectability is reasonably assured. SAB 104 also requires that up-front fees paid by the customer, even if non-refundable, that do not represent the completion of a separate earnings process be deferred and recognized as revenue over the period of performance. The Company
Company periodically charges up-front fees, generally related to installation and integration services in connection with certain of its hosted offerings. Accordingly, theseThese fees are deferred and recognized as revenue ratably over the estimated customer relationship period, which is generally five years. Theyears, and the revenue recognition period associated with these fees normally commences upon customer implementation. The Company expenses any contract origination costs and incremental direct costs as incurred.
Customer Returns
The sales value of customer returns are estimated and accrued for based upon return authorizations issued and past history. Actual returns, in the aggregate, have been consistent with management’s expectations and have historically not been significant.
Earnings per Share
The Company computes earnings per share in accordance with Statement of Financial Accounting Standards No. 128 “Earnings per Share” (SFAS 128) which requires the calculation and presentation of basic and diluted earnings per share. Basic earnings per share is calculated based on the weighted average number of shares of common stock outstanding and excludes anythe dilutive effect of warrants, stock options or any other type of convertible securities. Diluted earnings per share is calculated based on the weighted average number of shares of common stock outstanding and the dilutive effect of stock options, warrants and other types of convertible securities calculated using the treasury stock method. Dilutive securities are excluded from the diluted earnings per share calculation if their effect is anti-dilutive.
401(k) and Defined Contribution Pension Plans
The Company has a 401(k) Profit Sharing Plan (the Plan), whereby eligible US employees may contribute up to 60% of their eligible compensation, subject to limitations established by the Internal Revenue Code. The Company may contribute a discretionary matching contribution annually equal to 50% of each such participant’s deferred compensation up to the first 5% of their annual eligible compensation. The Company charged approximately $0.4$0.7 million, $0.5 million, and $0.5 million to expense in the fiscal years ended June 2006,30, 2009, 2008 and 2007, and 2008, respectively, associated with its matching contribution for those years.
The Company has a Group Personal Pension Plan (GPPP) for employees in the UK, whereby eligible employees may contribute a portion of their compensation, subject to their age and other limitations established by HM Revenue & Customs. The Company contributes 3% of the employee’s annual compensation regardless of whether or not the employee elects to contribute to the plan. The Company charged approximately $0.7 million, $0.4 million, $0.5 million, and $0.4$0.5 million to expense in the fiscal years ended June 2006,30, 2009, 2008 and 2007, and 2008, respectively, under the GPPP.
The Company is required by Australian government regulation to pay a certain percentage, currently 9%, of gross payrollsalary to a compliant Superannuation Fund for the benefit of its Australian employees. The Company charged approximately $0.1 million to expense in each of the fiscal years ended June 30, 2006,2009, 2008 and 2007, and 2008, reflecting its contribution to the Superannuation Fund.
Comprehensive Income (Loss)
The Company records comprehensive income or loss in accordance with Statement of Financial Accounting Standard No. 130, “Reporting Comprehensive Income” (SFAS 130). SFAS 130 establishes standards for the reporting and display of comprehensive income and its components in the financial statements. Comprehensive income or loss includes all changes in equity during a period from non-owner sources, such as foreign currency translation adjustments and unrealized gains and losses on available-for-sale securities.adjustments.
Recent Accounting Pronouncements:
Determination of the Useful Life of Intangible Assets
In April 2008, the FASBFinancial Accounting Standards Board (FASB) issued FASB Staff Position (FSP) FAS 142-3,Determination “Determination of the Useful Life of Intangible Assets.Assets.” FSP FAS 142-3 amends the factors that should be considered in developing renewal or extension assumptions used to determine the useful life of a recognized intangible asset under FASB Statement No. 142,Goodwill “Goodwill and Other Intangible Assets.Assets.” FSP FAS 142-3 is effective for fiscal years beginning after December 15, 2008 (July 1, 2009 for the Company) and early adoption is prohibited. The Company is currently evaluating the impact ofdoes not expect that this pronouncement will have a material effect on its consolidated financial statements.
Business Combinations
In December 2007, the FASB issued Statement No. 141(R), “Business Combinations” (SFAS 141(R)) which will change the accounting for and reporting of business combination transactions. The most significant changes under SFAS 141(R) include:
Valuation of any acquirer shares issued as purchase consideration will be measured at fair value as of the acquisition date;
Contingent purchase consideration, if any, will generally be measured and recorded at the acquisition date, at fair value, with any subsequent change in fair value reflected in earnings rather than through an adjustment to the purchase price allocation;
Acquired in-process research and development costs, which have historically been expensed immediately upon acquisition, will now be capitalized at their acquisition date fair values, measured for impairment (without recurring amortization) over the remaining development period and, upon completion of a successful development project, amortized to expense over the asset’s estimated useful life;
Acquisition related costs will be expensed as incurred rather than capitalized as part of the purchase price allocation;
Acquisition related restructuring cost accruals will be reflected within the acquisition accounting only if certain specific criteria are met as of the acquisition date. The prior accounting convention, which permitted an acquirer to record restructuring accruals within the purchase price allocation as long as certain, broad criteria had been met, generally around formulating, finalizing and communicating certain exit activities, will no longer be permitted.
SFAS 141(R) is effective for the first annual reporting period beginning on or after December 15, 2008 and earlier adoption is not permitted. Accordingly, the Company will adoptadopted SFAS 141(R) on July 1, 2009. The Company expects that the adoption of this pronouncement will significantly affect how it accounts for business combination transactions consummated after the adoption date, in the areas noted above.
The Company recorded approximately $0.5 million of expense during fiscal 2009 associated with direct acquisition costs that, as of July 1, 2009, were no longer eligible for capitalization. These costs related to the Company’s pending acquisition of PayMode which as of June 30, 2009 had not been completed. These costs are included as a component of general and administrative expenses.
Accounting and Reporting of Noncontrolling Interests
In December 2007, the FASB issued SFAS No. 160, “Noncontrolling Interests in Consolidated Financial Statements, an Amendment of ARB No. 51” (SFAS 160). SFAS 160 clarifies the accounting for noncontrolling interests and establishes accounting and reporting standards for the noncontrolling interest in a subsidiary, including the requirement that the noncontrolling interest be classified as a component of equity. SFAS 160 is
required to be adopted simultaneously with SFAS 141(R). The Company is not presently a party to any transaction in which it has a noncontrolling interest and, accordingly, does not currently believe that this pronouncement will have a significant impact on its financial condition, results of operations or cash flows.
Fair Value Option for Financial Assets and Financial Liabilities
In February 2007, the FASB issued Statement No. 159, “The Fair Value Option for Financial Assets and Financial Liabilities, including an amendment of FASB Statement No. 115” (SFAS 159). The statement permits all entities to choose, at specified election dates, to measure eligible items at fair value. Additionally, the statement requires that entities report unrealized gains and losses on items for which the fair value option has been elected in earnings. The statement also establishes additional presentation and disclosure requirements. SFAS 159 is effective for fiscal years beginning after November 15, 2007, with early adoption permitted, provided that the entity also adopts Statement 157. SFAS 159 became effective for the Company on July 1, 2008,in fiscal 2009, however as the Company did not elect to measure any items at fair value itthis pronouncement did not have an impact on its consolidated financial statements.
Fair Value Measurements
In September 2006, the FASB issued Statement No. 157, “Fair Value Measurements” (SFAS 157). The statement defines fair value, establishes a framework for measuring fair value, and expands disclosures about fair value measurements. In February 2008, the FASB issued FASB Staff Position No. FAS 157-2, “Effective Date of FASB Statement No. 157” (FSP 157-2). FSP 157-2 delays the effective date of SFAS 157 to fiscal years beginning after November 15, 2008 for nonfinancial assets and nonfinancial liabilities, except for items that are recognized or disclosed at fair value in the financial statements on a recurring basis (at least annually). SFAS 157 became effective for the Company on July 1, 2008,in fiscal 2009, excluding the items deferred by FSP 157-2 which will becomebecame effective for the Company on July 1, 2009. The Company expects that SFAS 157 will resultresulted in additional disclosures within itsthe Company’s consolidated financial statements.
Income Tax Uncertainties
In July 2006, the Financial Accounting Standards Board issued FIN 48. FIN 48 created a single accounting and disclosure model for uncertain tax positions, provided guidance on the minimum threshold that a tax uncertainty is required to meet before it can be recognized in the financial statements and applies to all tax positions taken by a company, both those deemed to be routine as well as those for which there may be a high degree of uncertainty.
FIN 48 established a two-step approach for evaluating tax positions. The first step, recognition, occurs when a company concludes (based solely on the technical aspects of the tax matter) that a tax position is more likely than not to be sustained on examination by a taxing authority. The second step, measurement, is only considered after the first step one has been satisfied and measures any tax benefit at the largest amount that is deemed more likely than not to be realized upon ultimate settlement of the uncertainty. Tax positions that fail to qualify for initial recognition are recognized in the first subsequent interim period that they meet the more likely than not standard, when they are resolved through negotiation or litigation with the taxing authority or upon the expiration of the statute of limitations. Derecognition of a tax position previously recognized would occur when a company subsequently concludes that a tax position no longer meets the more likely than not threshold of being sustained. FIN 48 also significantly expanded the financial statement disclosure requirements relating to uncertain tax positions.
The Company adopted FIN 48 on July 1, 2007,in fiscal 2008, and in accordance with the adoption provisions of the pronouncement recorded a decrease to its tax reserves and accumulated deficit in the amount of $0.1 million, respectively.
Reclassifications
Certain prior year amounts have been reclassified to conform to current year presentation.
3. Fair Values of Assets and Liabilities
In September 2006, the Financial Accounting Standards Board issued Statement of Financial Accounting Standards (SFAS) No. 157, “Fair Value Measurements,” or SFAS 157, effective for financial statements issued for fiscal years beginning after November 15, 2007. Accordingly, the Company adopted SFAS 157 in fiscal 2009. SFAS 157 defines fair value, establishes a framework for measuring fair value and expands disclosures about fair value measurements. The Statement applies only to fair value measurements that already are required or permitted by other accounting standards and does not require any new fair value measurements. In February 2008, the FASB issued FASB Staff Position (FSP) No. 157-2, which defers the effective date of SFAS 157 to fiscal years beginning after November 15, 2008 (July 1, 2009 for the Company) for nonfinancial assets and liabilities that are not recognized or disclosed at fair value in the financial statements on a recurring basis.
The adoption of SFAS No. 157 did not have an impact on the Company’s financial position or results of operations. The Company’s nonfinancial assets and liabilities that meet the deferral criteria set forth in FSP No. 157-2 include goodwill, intangible assets, and property, plant and equipment. The Company does not expect that the adoption of SFAS No. 157 for these nonfinancial assets and liabilities will have a material impact on its financial position or results of operations.
In accordance with the provisions of SFAS No. 157, the Company measures fair value at the price that would be received to sell an asset or paid to transfer a liability in an orderly transaction between market participants at the measurement date. SFAS 157 prioritizes the assumptions that market participants would use in pricing the asset or liability (the “inputs”) into a three-tier fair value hierarchy, as follows:
Level 1: Observable inputs such as quoted prices for identical assets or liabilities in active markets.
Level 2: Other inputs that are observable directly or indirectly, such as quoted prices for similar instruments in active markets or for similar markets that are not active.
Level 3: Unobservable inputs for which there is little or no market data and which require the Company to develop its own assumptions about how market participants would price the asset or liability.
Valuation techniques for assets and liabilities may include methodologies such as the market approach, the income approach or the cost approach, and may use unobservable inputs such as projections, estimates and management’s interpretation of current market data. These unobservable inputs are only utilized to the extent that observable inputs are not available or cost-effective to obtain.
At June 30, 2009, assets and liabilities of the Company measured at fair value on a recurring basis included marketable securities of $48,000. These were valued based on reference to quoted prices in active markets (Level 1 inputs).
4. Product and Business Acquisitions
Optio Software, Inc.
On April 21, 2008, the Company acquired Optio Software, Inc. (Optio). Optio is a US based company with operations in the United States, the United Kingdom, Germany and France that provides software solutions dedicated to automating, managing and controlling the entire lifecycle of document intensive processes, while extending the value of its customers’ enterprise resource planning and hospital information systems. The Optio acquisition extended the Company’s capabilities with respect to transactional document automation products and broadened its customer base. The purchase consideration and acquisition related costs for Optio were
approximately $46.5 million, consisting of approximately $44.7 million in cash and $1.8 million in acquisition related costs. Optio operating results are included in the Company’s operating results from the date of acquisition forward, as a component of the Payments and Transactional Documents operating segment.
The preliminary allocation of the purchase price is as follows:
| (in thousands) | (in thousands) | |||||||
Current assets | $ | 13,992 | $ | 14,339 | ||||
Property, plant and equipment | 2,162 | 1,918 | ||||||
Intangible assets | 23,820 | 23,820 | ||||||
Goodwill | 20,809 | 21,406 | ||||||
Other assets | 83 | 84 | ||||||
Current liabilities | (7,851 | ) | (8,544 | ) | ||||
Deferred revenue | (3,471 | ) | (3,471 | ) | ||||
Non-current liabilities | (3,057 | ) | (3,057 | ) | ||||
Total purchase price | $ | 46,487 | $ | 46,495 | ||||
As a result of the acquisition the Company recorded, based on exchange rates in effect at the date of acquisition, the following intangible assets:
| (in thousands) | |||
Customer related assets | $ | 17,243 | |
Acquired technology | 5,526 | ||
Tradename | 669 | ||
Contract backlog | 382 | ||
| $ | 23,820 | ||
The customer related assets are being amortized over five years; acquired technology and tradename are being amortized to expense over three years; contract backlog is being amortized over one year. The rates of amortization are proportional to the estimated economic contribution of the respective asset.
In connection with the acquisition, the Company recorded costs associated with the involuntary termination of certain Optio employees and costs associated with Optio facility exit activities. At June 30, 2008, certain estimated costs were still being finalized. Accordingly, the preliminary estimate of these costs might require adjustment in a subsequent quarter. The Company expects to finalize these estimates no later than December 31, 2008, with any required adjustment resulting in a corresponding adjustment to goodwill. A summary of the severance and facility exit accrual activity for the year ending June 30, 2008 is presented below.
| Year Ended June 30, 2008 | As of June 30, 2009 | |||||||||||||||
| Facility Exit Costs | Severance Costs | Facility Exit Costs | Severance Costs | |||||||||||||
| (in thousands) | (in thousands) | |||||||||||||||
Initial estimate, included in preliminary purchase price allocation for Optio | $ | 1,220 | $ | 1,415 | $ | 1,220 | $ | 1,415 | ||||||||
Adjustments to original estimate, recorded through goodwill | 446 | 49 | ||||||||||||||
Payments charged against the accrual | (40 | ) | (582 | ) | (668 | ) | (1,319 | ) | ||||||||
Impact of changes in foreign currency exchange rates | — | (3 | ) | (25 | ) | (145 | ) | |||||||||
Remaining accrual at June 30, 2008 | $ | 1,180 | $ | 830 | ||||||||||||
Remaining accrual at June 30, 2009 | $ | 973 | $ | — | ||||||||||||
Formscape Group, Ltd.
On October 13, 2006 the Company, through its UK subsidiary, acquired all of the outstanding share capital of Formscape Group, Ltd. (Formscape). Formscape, headquartered in the UK with operations in the United States, the United Kingdom and Germany, provides software solutions for automating purchase-to-pay,
document and financial transaction processes. The purchase consideration for Formscape was approximately $22.2 million, consisting of approximately $17.0 million of cash and $5.2 million (521,159 shares) of the Company’s common stock, as valued on the date of the acquisition. The Formscape acquisition extended the Company’s capabilities and depth with respect to its product offerings, broadened its customer base and expanded its channel partner relationships both domestically and in Europe. Formscape operating results are included in the Company’s operating results from the date of acquisition forward, as a component of the Payments and Transactional Documents segment.
As result of the acquisition the Company recorded, based on exchange rates in effect at the time of acquisition, intangible assets of approximately $29 million consisting of acquired customer related assets of $13.8 million, acquired technology of $4.9 million and goodwill of $10.3 million. The customer related assets and acquired technology are being amortized to expense over periods of five and three years, respectively, at amortization rates that are proportional to the estimated economic contribution of the underlying assets.
Tranmit Plc.
On January 24, 2006, the Company acquired all of the outstanding stock of Tranmit Plc (Tranmit). Tranmit, a UK-based company, provides Web-based purchase-to-pay automation solutions. The purchase consideration for Tranmit was approximately $6.0 million of cash, $4.2 million (316,970 shares) of the Company’s common stock, as valued on the date of acquisition, and acquisition related costs. The addition of Tranmit’s invoice management capabilities further enhanced the Company’s ability to provide global organizations with comprehensive hosted, licensed and outsourced solutions for improving the overall efficiency and productivity of the accounts payable function. Tranmit operating results are included in the Company’s operating results from the acquisition date forward, as a component of the Outsourced Solutions segment.
As a result of the purchase price allocation and the exchange rates in effect at the time of the acquisition, the Company recorded intangible assets of approximately $12.5 million. The intangible assets consist of acquired customer related assets of $3.4 million, acquired technology of $1.5 million, a below market lease arrangement of $0.1 million, and goodwill of $7.5 million. The customer related assets, acquired technology and the below market lease are being amortized to expense over periods of five, three and two years, respectively.
Visibillity, Inc.
On December 31, 2005, the Company acquired all of the outstanding stock of Visibillity, Inc. (Visibillity), a provider of legal e-billing solutions specializing in the insurance industry. The initial purchase consideration for Visibillity was $11.5 million in cash plus acquisition related costs. Subsequent to the payment of the initial purchase consideration, the Company recovered $0.5 million from the Visibillity selling stockholders pursuant to the terms of the acquisition, and this recovery was recorded as a reduction to the amount of goodwill recorded.
Visibillity complemented the Company’s existing Legal eXchange® product and strengthened its position as a leading provider of Web-based legal spend management services. Visibillity operating results are included in the Company’s operating results from the acquisition date forward, as a component of the Outsourced Solutions segment.
As a result of the purchase price allocation, the Company recorded intangible assets of approximately $11 million. The intangible assets consist of acquired customer related assets of $6.4 million, acquired technology of $1.6 million and goodwill of $3.0 million. The customer related assets and acquired technology are being amortized to expense over a period of five and three years, respectively.
Legal e-billing Patent
On January 25, 2006, the Company acquired a patent that addresses the process of online budgeting and evaluation of legal invoices. The purchase price for the patent was $0.9 million in cash plus acquisition related costs. Per the terms of the patent purchase the Company is obligated to make certain earn-out payments should it recover royalty payments from third parties or, beginning in fiscal 2009, should specific legal billing product revenues of the Company exceed $12.5 million on a per annum basis. The patent costs are being amortized over the remaining legal life of the patent, which expires in June 2019.
Pro-forma Information
The following unaudited pro-forma financial information presents the combined results of operations of the Company and Optio as if that acquisition had occurred as of July 1, 2006 and July 1, 2007, and in respect of Formscape as if that acquisition had occurred as of July 1, 2006, after giving effect to certain adjustments such as increased amortization expense of acquired intangible assets, purchase accounting reductions to acquired deferred revenue based on the Company’s estimates of fair value, and a decrease in interest income as a result of the net cash paid for the acquisitions and the dilutive effect of common stock issued by the Company in connection with the acquisitions. This pro-forma financial information does not necessarily reflect the results of operations that would have actually occurred had the Company and the acquired entities been a single entity during these periods.
| Pro Forma June 30, | ||||||||
| 2007 | 2008 | |||||||
(unaudited) (in thousands) | ||||||||
Revenues | $ | 146,893 | $ | 151,867 | ||||
Net loss | $ | (23,531 | ) | $ | (23,096 | ) | ||
Net loss per basic and diluted share | $ | (0.99 | ) | $ | (0.97 | ) | ||
4.5. Property, Plant and Equipment
Property, plant and equipment consist of the following:
| June 30, | June 30, | |||||||||||
| 2007 | 2008 | 2009 | 2008 | |||||||||
| (in thousands) | (in thousands) | |||||||||||
Land | $ | 401 | $ | 398 | $ | 329 | $ | 398 | ||||
Buildings and improvements | 4,274 | 5,600 | 5,434 | 5,600 | ||||||||
Furniture and fixtures | 1,623 | 1,999 | 2,071 | 1,999 | ||||||||
Technical equipment | 14,131 | 17,123 | 17,520 | 17,123 | ||||||||
Software | 4,227 | 5,958 | 6,323 | 5,958 | ||||||||
| 24,656 | 31,078 | 31,677 | 31,078 | |||||||||
Less: Accumulated depreciation and amortization | 16,386 | 19,238 | 21,571 | 19,238 | ||||||||
| $ | 8,270 | $ | 11,840 | $ | 10,106 | $ | 11,840 | |||||
5.6. Goodwill and Other Intangible Assets
At June 30, 2008,2009, the carrying value of the Company’s goodwill was approximately $72.2$64.6 million and consisted of approximately $55.9$49.0 million, $6.5 million and $9.8$9.1 million allocated to the Company’s Payments and Transactional Documents, Banking Solutions, and Outsourced Solutions segments, respectively. The increasedecrease in goodwill in 20082009 was due principally to a decrease in the acquisitionexchange rates of Optio and an increasethe British Pound Sterling, which resulted in a lower U.S. dollar amount upon foreign currency translation rates.translation.
The following tables set forth the information for intangible assets subject to amortization and for intangible assets not subject to amortization under SFAS 142:
| As of June 30, 2008 | ||||||||||
| Gross Carrying Amount | Accumulated Amortization | Net Carrying Value | ||||||||
| (in thousands) | ||||||||||
Amortized intangible assets: | ||||||||||
Customer related | $ | 54,081 | $ | (20,402 | ) | $ | 33,679 | |||
Core technology | 30,408 | (22,492 | ) | 7,916 | ||||||
Patent | 953 | (172 | ) | 781 | ||||||
Other intangible assets | 1,051 | (200 | ) | 851 | ||||||
Total | $ | 86,493 | $ | (43,266 | ) | $ | 43,227 | |||
Unamortized intangible assets: | ||||||||||
Goodwill | 72,187 | |||||||||
Total intangible assets | $ | 115,414 | ||||||||
| As of June 30, 2007 | ||||||||||
| Gross Carrying Amount | Accumulated Amortization | Net Carrying Value | ||||||||
| (in thousands) | ||||||||||
Amortized intangible assets: | ||||||||||
Customer related | $ | 36,851 | $ | (13,330 | ) | $ | 23,521 | |||
Core technology | 24,982 | (18,572 | ) | 6,410 | ||||||
Patent | 953 | (100 | ) | 853 | ||||||
Other intangible assets | 94 | (67 | ) | 27 | ||||||
Total | $ | 62,880 | $ | (32,069 | ) | $ | 30,811 | |||
Unamortized intangible assets: | ||||||||||
Goodwill | 53,485 | |||||||||
Total intangible assets | $ | 84,296 | ||||||||
Amortized intangible assets: Customer related Core technology Patent Other intangible assets Total Unamortized intangible assets: Goodwill Total intangible assets Amortized intangible assets: Customer related Core technology Patent Other intangible assets Total Unamortized intangible assets: Goodwill Total intangible assets As of June 30, 2009 Gross Carrying
Amount Accumulated
Amortization Net Carrying
Value (in thousands) $ 50,194 $ (29,753 ) $ 20,441 28,093 (24,633 ) 3,460 953 (243 ) 710 1,045 (636 ) 409 $ 80,285 $ (55,265 ) $ 25,020 64,569 $ 89,589 As of June 30, 2008 Gross Carrying
Amount Accumulated
Amortization Net Carrying
Value (in thousands) $ 54,081 $ (20,402 ) $ 33,679 30,408 (22,492 ) 7,916 953 (172 ) 781 1,051 (200 ) 851 $ 86,493 $ (43,266 ) $ 43,227 72,187 $ 115,414
Estimated amortization expense for each of the five subsequent fiscal years and thereafter, excluding any impact of acquisitions completed after June 30, 2009, is as follows:
| (in thousands) | (in thousands) | |||||
2009 | $ | 16,813 | ||||
2010 | 12,540 | $ | 11,799 | |||
2011 | 8,486 | 8,059 | ||||
2012 | 3,331 | 3,167 | ||||
2013 | 1,619 | 1,557 | ||||
2014 and thereafter | 438 | |||||
2014 | 84 | |||||
2015 and thereafter | 354 | |||||
6.7. Accrued Expenses
Accrued expenses consist of the following:
| June 30, | June 30, | |||||||||||
| 2007 | 2008 | 2009 | 2008 | |||||||||
| (in thousands) | (in thousands) | |||||||||||
Employee compensation and benefits | $ | 5,174 | $ | 6,343 | $ | 6,095 | $ | 6,343 | ||||
Sales and value added taxes | 659 | 877 | 1,069 | 877 | ||||||||
Professional fees | 716 | 845 | 802 | 845 | ||||||||
Other | 1,926 | 2,932 | 1,324 | 2,932 | ||||||||
| $ | 8,475 | $ | 10,997 | $ | 9,290 | $ | 10,997 | |||||
7.8. Restructuring Costs
During fiscal 2009, the Company reduced its workforce by approximately 40 full time positions and announced the departure of its Chief Operating Officer. In connection with these events, the Company incurred expenses of approximately $3.0 million associated with severance related benefits, including stock compensation expense. As these events were completed in fiscal 2009, the Company does not expect to recognize additional costs in future periods relating to these actions. The restructuring costs have been recorded as expense within the same functional expense category in which the affected employees had been assigned. Excluding the impact of stock compensation, the expense was recorded as follows:
| (in thousands) | |||
Subscriptions and transactions cost of sales | $ | 103 | |
Service and maintenance cost of sales | 270 | ||
Sales and marketing | 320 | ||
Product development and engineering | 189 | ||
General and administrative | 666 | ||
| $ | 1,548 | ||
At June 30, 2009, the Company’s remaining liability for severance related benefits was as follows:
| (in thousands) | ||||
Accrued severance benefits recorded in 2009 | $ | 1,548 | ||
Payments charged against the accrual | (1,152 | ) | ||
Impact of changes in foreign currency exchange rates | 30 | |||
Accrued severance benefits at June 30, 2009 | $ | 426 | ||
The Company also recorded approximately $1.4 million of expense related to stock based compensation, the substantial majority of which was included as a component of general and administrative expenses.
9. Commitments and Contingencies
Leases
The Company leases its principal office facility in Portsmouth, New Hampshire under a non-cancelable operating lease expiring in fiscal year 2012. In addition to the base term, the Company has two five-year options to extend the term of the lease. Rent payments are fixed for the term of the lease, subject to increases each year of 3.1% or five times the consumer price index, whichever is less. The Company is also obligated to pay certain incremental operating expenses over the base rent.
The Company leases an office in Reading, England under a non-cancelable operating lease expiring in fiscal year 2014. Rent payments are fixed for the term of the lease, but include discounted rates granted by the landlord for calendar years 2010 and 2011. The Company is recording rent expense on a straight-line basis over the lease term. The Company is also obligated to pay an annual service charge related to the maintenance of the common areas of the office building.
The Company leases an office facility in Hook, England under a non-cancelable operating lease expiring in fiscal year 2009.2010. Rent payments are fixed for the term of the lease, subject to increases each year based on fluctuations in the consumer price index. The Company is additionally obligated to pay certain incremental operating expenses in addition to the base rent.
The Company also leases office space in certain other cities worldwide. All such leases expire by fiscal year 2015.
Future minimum annual rental commitments under the Company’s facilities, equipment, and vehicle leases at June 30, 20082009 are as follows:
| (in thousands) | (in thousands) | |||||
2009 | $ | 3,922 | ||||
2010 | 3,332 | $ | 3,726 | |||
2011 | 3,131 | 3,409 | ||||
2012 | 2,734 | 2,971 | ||||
2013 and thereafter | 3,297 | |||||
2013 | 1,725 | |||||
2014 and thereafter | 2,038 | |||||
| $ | 16,416 | $ | 13,869 | |||
Included as a component of the minimum lease commitments above is approximately $0.4$0.3 million related to capital lease obligations, of which approximately $38,000$17,000 represented interest. At June 30, 2008,2009, the gross value
of assets recorded under capital lease arrangements was approximately $0.3$0.1 million. Depreciation expense on assets recorded under capital lease arrangements is included as a component of the Company’s consolidated depreciation expense.
Rent expense charged to operations for the fiscal years ended June 30, 2006,2009, 2008 and 2007 and 2008 was $3.1$3.8 million, $3.3$3.5 million, and $3.5$3.3 million respectively. The Company subleases space in several of its offices. Sublease income recorded in the fiscal years ended June 30, 2006,2009, 2008 and 2007 and 2008 was approximately $0.2 million, $0.2$0.1 million, and $0.1$0.2 million, respectively.
Long Term Service Arrangements
The Company has entered into a service agreement, with a three year minimum commitment that expires in fiscal year 2011, for disaster recovery services. In addition to the base term, the Company has the option to extend the term of the service agreement for an additional two years. Payments are fixed for the initial three year term at $0.2 million per year and are subject to a seven percent increase in years four and five in the event that the Company elects to extend the service.
Legal Matters
On August 10, 2001, a class action complaint was filed against the Company in the United States District Court for the Southern District of New York: Paul Cyrek v. Bottomline Technologies, Inc.; Daniel M. McGurl; Robert A. Eberle; FleetBoston Robertson Stephens, Inc.; Deutsche Banc Alex Brown Inc.; CIBC World Markets; and J.P. Morgan Chase & Co. A consolidated amended class action complaint,In re Bottomline Technologies Inc. Initial Public Offering Securities Litigation, was filed on April 20, 2002.
On November 13, 2001, a class action complaint was filed against Optio in the United States District Court for the Southern District of New York: Kevin Dewey v. Optio Software, Inc.; Merrill Lynch, Pierce, Fenner & Smith, Inc.; Bear, Stearns & Co., Inc.; Fleetboston Robertson Stephens, Inc.; Deutsche Bank Securities, Inc.; Dain Rauscher Inc.; U.S. Bancorp Piper Jaffray, Inc.; C. Wayne Cape; and F. Barron Hughes. A consolidated amended class action complaint,In re Optio Software, Inc. Initial Public Offering Securities Litigation, was filed on April 22, 2002.
The amended complaints filed in both the actions against the Company and Optio assert claims under Sections 11, 12(2) and 15 of the Securities Act of 1933, as amended, and Sections 10(b) and 20(a) of the Securities Exchange Act of 1934, as amended. The amended complaints assert, among other things, that the descriptions in the Company’s and Optio’s prospectuses for their initial public offerings were materially false and misleading in describing the compensation to be earned by the underwriters of the offerings, and in not describing certain alleged arrangements among underwriters and initial purchasers of the common stock from the underwriters. The amended complaints seek damages (or, in the alternative, tender of the plaintiffs’ and the class’s common stock and rescission of their purchases of the common stock purchased in the initial public offering), costs, attorneys’ fees, experts’ fees and other expenses.
In July 2002, the Company and Optio joined in an omnibus motion to dismiss, which challenged the legal sufficiency of plaintiffs’ claims. The motion was filed on behalf of hundreds of issuer and individual defendants named in similar lawsuits. On February 19, 2003, the court issued an order denying the motion to dismiss as to Bottomline and denying in part the motion to dismiss as to Optio. In addition, in October 2002, Daniel M. McGurl, Robert A. Eberle, C. Wayne Cape and F. Barron Hughes were dismissed from this case without prejudice. Both Bottomline and Optio authorized the negotiation of a settlement of the pending claims, and the parties negotiated a settlement, which was subject to approval by the court. On August 31, 2005, the court issued an order preliminarily approving the settlement. On December 5, 2006, the United States Court of Appeals for the Second Circuit overturned the District Court’s certification of the class of plaintiffs who are pursuing the claims that would be settled in the settlement against the underwriter defendants. Plaintiffs filed a Petition for Rehearing and Rehearing En Banc with the Second Circuit on January 5, 2007 in response to the Second
Circuit’s decision. On April 6, 2007, plaintiffs’ Petition for Rehearing of the Second Circuit’s decision was denied. On June 25, 2007, the District Court signed an order terminating the settlement. On September 27, 2007, plaintiffs filed a motion for class certification in certain designated “focus cases” in the District Court, and thatCourt. That motion is currently pending before the District Court.was withdrawn. Neither Bottomline nor Optio’s cases are part of the designated focus case group. On November 13, 2007, the issuer defendants in the designated focus cases filed a motion to dismiss the second consolidated amended class action complaints that were filed in those cases. On March 26, 2008, the District Court issued an Opinion and Order denying, in large part, the motions to dismiss the amended complaints in these focus cases. On April 2, 2009, the plaintiffs filed a motion for preliminary approval of a new proposed settlement between plaintiffs, the underwriter defendants, the issuer defendants and the insurers for the issuer defendants. On June 10, 2009, the Court issued an opinion preliminarily approving the proposed settlement, and scheduling a settlement fairness hearing for September 10, 2009.
The Company, and its subsidiary Optio, intend to vigorously defend themselves in these actions. Bottomline does not currently believe that the outcome of these proceedings will have a material adverse impact on its financial condition, results of operations or cash flows.
8.10. Notes Payable and Credit Facilities
In April 2007,June 2009, the Company renewed, through March 24,September 21, 2009, its Loan and Security Agreement with Silicon Valley Bank (Credit Facility). The Credit Facility, as renewed, provides for aggregate borrowings of up to $2 million and requires the Company to maintain certain financial covenants. Borrowings under the Credit Facility are secured by substantially all US-owned assets of the Company, bear interest at the bank’s prime rate (5.0%(3.25% at June 30, 2008)2009) and are due on the expiration date of the Credit Facility. The Credit Facility also provides for the issuance of up to $2 million in letters of credit for, and on behalf of, the Company. The
borrowing capacity under the Credit Facility is reduced by any outstanding letters of credit. At June 30, 20082009, the Company was in the process of establishing a $2$0.5 million letter of credit had beento be issued to the Company’s landlord as part of the lease agreement for its corporate headquarters. This letter of credit was formally issued to the landlord in July, 2009.
9.11. Share Based Payments
In fiscal year 2006, theThe Company adoptedaccounts for share-based payments according to Statement of Financial Accounting Standard No. 123 (revised 2004), “Share Based Payment” (SFAS 123R). Under SFAS 123R, the Company is required to recognize as expense the estimated fair value of all share based payments to employees. The Company records expense associated with its share based payment awards on a straight-line basis over the award vesting period. For the fiscal years ended June 30, 2006,2009, 2008, and 2007, and 2008, the Company recorded expense of approximately $7.0$9.5 million, $7.9$8.8 million and $8.8$7.9 million respectively, in connection with its share-based payment awards.
Share Based Compensation Plans
Employee Stock Purchase Plan
On November 16, 2000, the Company adopted the 2000 Employee Stock Purchase Plan, which was amended on November 18, 2004 (2000 Stock Purchase Plan), and which provides for the issuance of up to a total of 1,500,000 shares of common stock to participating employees. Eligible employees may contribute between 1% and 10% of their base pay to the 2000 Stock Purchase Plan. At the end of a designated purchase period, which occurs every six months on March 31 and September 30, employees purchase shares of the Company’s common stock with contributions accumulated via payroll deductions, at an amount equal to 85% of the lower of the fair market value of the common stock on the first day of each 24-month offering period or the last day of the applicable six-month purchase period.
The Company’s employee stock purchase plan has several complex features that make determining fair value on the grant date impracticable. Accordingly, and as permitted by SFAS 123R, the Company measures the fair value of its awards under the employee stock purchase plan at intrinsic value (the value of the Company’s common stock less the employee purchase price) at the end of each reporting period. For the fiscal years ended June 30, 2006,2009, 2008 and 2007, and 2008, the Company recorded compensation cost of approximately $0.2 million, $0.2$0.3 million and $0.3$0.2 million, respectively, associated with its employee stock purchase plan. As a result of employee stock purchases in fiscal years 2006,2009, 2008 and 2007, and 2008, the Company issued approximately 58,000,116,000, 86,000 and 68,000 and
86,000 shares of its common stock, respectively. The aggregate intrinsic value of shares issued under the employee stock plan during fiscal years 2006,2009, 2008 and 2007 and 2008 was $0.3 million, $0.2 million, $0.4 million and $0.4$0.2 million, respectively. At June 30, 2008,2009, based on employee withholdings and the Company’s common stock price at that date, approximately 27,00038,000 shares of common stock, with an approximate intrinsic value of $47,000$0.1 million would have been eligible for issuance were June 30, 20082009 to have been a designated stock purchase date.
Stock Incentive Plans
1998 Non-Employee Director Stock Option Plan
On November 12, 1998, the Company adopted the 1998 Non-Employee Director Stock Option Plan (the Director Plan), which provided for the issuance of non-statutory stock options with a 10-year contractual term. The Director Plan expired in 2008. The Company reserved up to 300,000 shares of its common stock for issuance under the Director Plan. Under the terms of the Director Plan,Prior to February, 2006 each non-employee director was granted an option to purchase 15,000 shares of common stock upon his or her initial election to the Board of Directors. Such options vest over four years from the date of the grant, with 25% of the award vesting at the end of each year.
Beginning in February 2006, the Company determined that, in lieu of stock option awards, it would now grant restricted stock awards for 8,000 shares of the Company’s common stock to each non-employee director upon his or her initial election to the Board of Directors. These restricted stock awards vest over a period of four
years from the date of grant, with 25% of the shares vesting on the first anniversary of the date of grant and an additional 6.25% of the shares vesting each quarter thereafter. These awards are granted under the Company’s 2000 Stock Incentive Plan.
Additionally, until November 2005, each non-employee director was granted an option to purchase 7,500 shares of common stock at each annual meeting of stockholders following the annual meeting of the initial year of their election. These options vested one year from the date of the grant. Beginning November 17, 2005, the Company determined that in lieu of these annual stock option grants it would now grant restricted stock awards for 3,000 shares of its common stock to each non-employee director on the date of each annual meeting of stockholders, with such awards vesting over a one year period. Accordingly, 18,00024,000 shares of restricted stock were issued by the Company under the Company’s 2000 Stock Incentive Plan in November 20072008 to its non-employee directors.
In February 2008, the Company approved a modification to the Director Plan to permit any director to elect to exercise options that were in-the-money and fully vested on a net share settlement basis. Under such an exercise, anyAny director so exercisingelecting would receive shares of the Company’s common stock with a value equal to the closing market price of the Company’s common stock on the date of exercise less the exercise price of the options. Any director making such an election agrees not to sell or transfer any of the shares received upon exercise for a period of two years from the exercise date. The Company implemented this modification to encourage and promote long-term share ownership by its directors. The modification did not result in any incremental compensation expense, as the fair value of the modified director awards were not in excess of their fair value immediately prior to the modification.
Awards issued to the Company’s directors are granted as compensation for their service as directors.
2000 Employee Stock Incentive Plan
On November 16, 2000, the Company adopted the 2000 Stock Incentive Plan (the 2000 Plan), which provides for the issuance of stock options non-statutory stock options and restricted stock. Stock option awards under this plan have a 10-year contractual term. The 2000 Plan is administered by the Board of Directors which has the authority to determine to whom options may be granted, the period of exercise and what other restrictions, if any, should apply. Vesting for awards granted under the 2000 Plan is principally over four years from the date of the grant, with 25% of the award vesting after one year and 6.25% of the award vesting each quarter thereafter. The Company initially reserved 1,350,000 shares of its common stock for issuance under the 2000 Plan.
On the first day of each fiscal year, beginning in fiscal year 2001 and ending in fiscal year 2010, the number of shares of common stock authorized for issuance under the 2000 Plan will automatically increase, without additional Board or stockholder approval. The number of shares authorized for issuance will increase, when added to the remaining available shares, to total an amount equal to 12% of the number of shares of common stock outstanding on the first day of the fiscal year, or such lesser number as the Board of Directors may determine prior to such increase. The annual increase can never exceed 5,000,000 shares. Stock options issued under the 2000 Plan must be issued at an exercise price not less than 100% of the fair market value of the common stock at the date of grant.
Compensation cost associated with stock options represented approximately $4.1$2.7 million of the total share based payment expense recorded for the fiscal year ended June 30, 2008.2009. The stock options were valued using a Black Scholes method of valuation and the resulting fair value is recorded as compensation cost on a straight line basis over the option vesting period. The assumptions made for purposes of estimating fair value under the Black Scholes model for options granted during the fiscal years ended June 30, 2006,2009, 2008 and 2007 and 2008 were as follows:
| 2006 | 2007 | 2008 | 2009 | 2008 | 2007 | |||||||||||||
Dividend yield | 0 | % | 0 | % | 0 | % | 0 | % | 0 | % | 0 | % | ||||||
Expected term of options (years) | 4.9–5.1 | 4.4–5.1 | 4.3–4.4 | 4.3–4.4 | 4.3–4.4 | 4.4–5.1 | ||||||||||||
Risk-free interest rate | 4.11–5.25 | % | 4.50–5.07 | % | 2.37–4.88 | % | 1.45–3.3 | % | 2.37–4.88 | % | 4.50–5.07 | % | ||||||
Volatility | 59–87 | % | 48–55 | % | 44–48 | % | 45–50 | % | 44–48 | % | 48–55 | % | ||||||
The Company’s estimate of anthe expected option term was derived based on a review of its historic option holding periods, including a consideration of the holding period inherent in currently vested but unexercised options. The estimated stock price volatility was derived based on a review of the Company’s actual historic stock prices over the past five years.
A summary of stock option and restricted stock activity for 20082009 is as follows (infollows; in respect of shares available for grant, the shares are available for issuance by the Company as either a stock option or as a restricted stock award):award:
| Non-vested Stock | Stock Options | Non-vested Stock | Stock Options | |||||||||||||||||||||||||||||||||||||
| Shares Available for Grant | Number of Shares | Weighted Average Grant Date Fair Value | Number of Shares | Weighted Average Exercise Price | Weighted Average Remaining Contractual Term | Aggregate Intrinsic Value | Shares Available for Grant | Number of Shares | Weighted Average Grant Date Fair Value | Number of Shares | Weighted Average Exercise Price | Weighted Average Remaining Contractual Term | Aggregate Intrinsic Value | |||||||||||||||||||||||||||
| (in thousands, except per share data) | (in thousands, except per share data) | |||||||||||||||||||||||||||||||||||||||
Awards outstanding at June 30, 2007 | 2,597 | 666 | $ | 11.26 | 4,386 | $ | 12.23 | 5.79 | $ | 9,708 | ||||||||||||||||||||||||||||||
Awards outstanding at June 30, 2008 | 2,114 | 904 | $ | 12.44 | 4,023 | $ | 12.73 | 5.55 | $ | 2,571 | ||||||||||||||||||||||||||||||
Additional shares reserved | 1,019 | 925 | ||||||||||||||||||||||||||||||||||||||
Awards granted | (1,161 | ) | 554 | $ | 13.20 | 607 | $ | 11.96 | (1,124 | ) | 512 | $ | 8.92 | 612 | $ | 7.05 | ||||||||||||||||||||||||
Shares vested | (311 | ) | $ | 11.28 | (565 | ) | $ | 12.50 | ||||||||||||||||||||||||||||||||
Stock options exercised | (677 | ) | $ | 8.90 | (97 | ) | $ | 7.08 | ||||||||||||||||||||||||||||||||
Awards forfeited or expired | 298 | (5 | ) | $ | 12.48 | (293 | ) | $ | 12.61 | 314 | (39 | ) | $ | 10.81 | (275 | ) | $ | 14.12 | ||||||||||||||||||||||
Options and shares removed from shares available for grant(1) | (639 | ) | ||||||||||||||||||||||||||||||||||||||
Options and shares removed from shares available for grant (1) | (139 | ) | ||||||||||||||||||||||||||||||||||||||
Awards outstanding at June 30, 2008 | 2,114 | 904 | $ | 12.44 | 4,023 | $ | 12.73 | 5.55 | $ | 2,571 | ||||||||||||||||||||||||||||||
Awards outstanding at June 30, 2009 | 2,090 | 812 | $ | 10.26 | 4,263 | $ | 11.95 | 5.21 | $ | 3,085 | ||||||||||||||||||||||||||||||
Stock options exercisable at June 30, 2008 | 2,908 | $ | 13.30 | 4.38 | $ | 2,315 | ||||||||||||||||||||||||||||||||||
Stock options exercisable at June 30, 2009 | 3,132 | $ | 13.04 | 3.85 | $ | 1,696 | ||||||||||||||||||||||||||||||||||
| (1) | Shares eliminated from shares available for grant in connection with the termination of the 1997 Stock Incentive Plan, a legacy equity compensation plan utilized by the |
The weighted average grant date fair value of stock options granted during 2006,2009, 2008 and 2007 was $2.97, $4.81 and 2008 was $8.44, $4.83, and $4.81, respectively. The total intrinsic value of options exercised during the fiscal years ended June 30, 2006,2009, 2008 and 2007 and 2008 was approximately $5.7$0.4 million, $2.2$3.5 million and $3.5$2.2 million, respectively. The total fair value of stock options that vested during the fiscal years ended June 30, 2006,2009, 2008 and 2007 and 2008 was approximately $7.0$3.0 million, $4.9$4.4 million and $4.4$4.9 million, respectively. As of June 30, 2008,2009, there was approximately $5.3$4.0 million of unrecognized compensation cost related to stock option awards that is expected to be recognized as expense over a weighted average period of 2.73.0 years.
The following table presents weighted average price and life information about significant stock option groups outstanding at June 30, 2008:2009:
| Options Outstanding | Options Exercisable | |||||||||||
Range of Exercise Prices | Number Outstanding | Weighted Average Remaining Contractual Life | Weighted Average Exercise Price | Number Exercisable | Weighted Average Exercise Price | |||||||
| (in thousands, except per share data) | ||||||||||||
$ 3.30–$ 8.00 | 589 | 5.25 | $ | 6.25 | 475 | $ | 5.92 | |||||
$ 8.01–$ 9.54 | 703 | 4.96 | 9.00 | 694 | 9.00 | |||||||
$ 9.58–$11.28 | 517 | 8.45 | 10.32 | 159 | 10.40 | |||||||
$11.35–$12.30 | 982 | 7.83 | 12.05 | 463 | 11.93 | |||||||
$12.31–$14.00 | 718 | 3.88 | 13.27 | 626 | 13.26 | |||||||
$14.01–$17.54 | 188 | 2.06 | 15.25 | 165 | 15.12 | |||||||
$17.55–$31.50 | 144 | 1.48 | 30.63 | 144 | 30.63 | |||||||
$32.06–$59.00 | 182 | 1.66 | 39.56 | 182 | 39.56 | |||||||
| 4,023 | 5.55 | $ | 12.73 | 2,908 | $ | 13.30 | ||||||
| Options Outstanding | Options Exercisable | |||||||||||
Range of Exercise Prices | Number Outstanding | Weighted Average Remaining Contractual Life | Weighted Average Exercise Price | Number Exercisable | Weighted Average Exercise Price | |||||||
| (in thousands, except per share data) | ||||||||||||
$ 3.30–$ 7.25 | 890 | 7.54 | $ | 6.40 | 300 | $ | 5.24 | |||||
$ 7.56–$ 9.29 | 535 | 4.40 | 8.09 | 471 | 8.12 | |||||||
$ 9.54–$10.15 | 536 | 5.55 | 9.64 | 447 | 9.59 | |||||||
$10.37–$12.30 | 1,227 | 6.43 | 11.68 | 870 | 11.68 | |||||||
$12.31–$14.00 | 607 | 3.15 | 13.30 | 580 | 13.31 | |||||||
$14.01–$16.00 | 156 | 1.13 | 14.88 | 152 | 14.86 | |||||||
$16.01–$32.06 | 162 | 0.55 | 30.78 | 162 | 30.78 | |||||||
$33.25–$45.56 | 150 | 0.72 | 40.20 | 150 | 40.20 | |||||||
| 4,263 | 5.21 | $ | 11.95 | 3,132 | $ | 13.04 | ||||||
Prior to fiscal year 2006, the Company had not granted awards of restricted stock. The majority of the Company’s restricted stock awards vest over a four year period on a vesting schedule similar to the Company’s employee stock options, however certain restricted stock awards vest over a two year period and restricted stock awards granted annually to the Company’s non-employee directors vest after a one year period. Restricted stock awards are valued based on the closing price of the Company’s common stock on the date of grant, and compensation cost is recorded on a straight line basis over the share vesting period. The Company recorded expense of approximately $4.4$6.6 million associated with its restricted stock awards for the fiscal year ended June 30, 2008.2009. As of June 30, 2008,2009, there was approximately $9.0$6.9 million of unrecognized compensation cost related to restricted stock awards that will be recognized as expense over a weighted average period of 2.32.5 years. There were 311,000Approximately 0.6 million shares of restricted stock awards which vested during the year ended June 30, 2008.2009.
10.12. Earnings per Share
The following table sets forth the computation of basic and diluted loss per share:
| Year Ended June 30, | ||||||||||||
| 2006 | 2007 | 2008 | ||||||||||
| (in thousands, except per share data) | ||||||||||||
Numerator: | ||||||||||||
Net loss | $ | (1,834 | ) | $ | (7,030 | ) | $ | (5,261 | ) | |||
Denominator: | ||||||||||||
Denominator for basic and diluted net loss per share—weighted-average shares outstanding | 22,838 | 23,539 | 23,825 | |||||||||
Net loss per share: | ||||||||||||
Basic and diluted net loss per share | $ | (0.08 | ) | $ | (0.30 | ) | $ | (0.22 | ) | |||
Numerator: Net loss Denominator: Denominator for basic and diluted net loss per share—weighted-average shares outstanding Net loss per share: Basic and diluted net loss per share Year Ended June 30, 2009 2008 2007 (in thousands, except per share data) $ (12,288 ) $ (5,261 ) $ (7,030 ) 24,044 23,825 23,539 $ (0.51 ) $ (0.22 ) $ (0.30 )
Options to purchase 4,416,000,4,263,000, 4,023,000 and 4,386,000 and 4,023,000 shares of the Company’s common stock for the years ended June 30, 2006,2009, 2008 and 2007, and 2008, respectively, were excluded from the calculation of diluted earnings per share as the effect would have been anti-dilutive.
11.13. Operations by Industry Segments and Geographic Area
Segment Information
SFAS No. 131, “Disclosures about Segments of an Enterprise and Related Information,”Information”, establishes standards for reporting information about operating segments in financial statements. Operating segments are defined as components of an enterprise for which separate financial information is available that is evaluated regularly by the chief operating decision maker, or decision making group, in deciding how to allocate resources and in assessing performance.
The Company’s operating segments are organized principally by the type of product or servicesservice offered and by geography. As of July 1, 2007, the Company revised the structure of its internal operating segments and changed the nature of the financial information that is provided to and used by the Company’s chief operating decision maker. The change in segment structure as of July 1, 2007 resulted in the Company’s hosted and outsourced accounts payable automation product offerings being included as a component of its Outsourced Solutions segment rather than its Payment and Transactional Documents segment. This change is reflected for all periods presented. In accordance with SFAS 131, the Company has aggregated similar operating segments into three reportable segments as follows:
Payments and Transactional Documents.The Company’s Payments and Transactional Documents segment is a supplier of software products that provide a range of financial business process management solutions including making and collecting payments, sending and receiving invoices, and generating and storing business documents. This segment also provides a range of standard professional services and equipment and supplies that complement and enhance the Company’s core software products. Revenue associated with this segment is typically recorded upon delivery or, if extended payment terms have been granted to the customer, as payments become contractually due. This segment also incorporates the Company’s check printing solutions in the UK, revenue for which is typically recorded on a per transaction basis or ratably over the expected life of the customer relationship.relationship, as well as certain solutions that are licensed on a subscription basis, revenue for which is typically recorded ratably over the contractual term.
Banking Solutions.The Banking Solutions segment provides solutions that are specifically designed for banking and financial institution customers. These solutions typically involve longer implementation periods and a significant level of professional resources. Due to the customized nature of these products, revenue is generally recognized over the period of project performance, on a percentage of completion basis. Periodically, the Company licenses these solutions on a subscription basis which has the effect of contributing to recurring revenue and the revenue predictability of future periods, but which also delays revenue recognition over a period that is longer than the period of project performance.
Outsourced Solutions.The Outsourced Solutions segment provides customers with outsourced and hosted solution offerings that facilitate invoice receipt and presentment and spend management. The Company’s Legal eXchange solution, which provides the opportunity to create more efficient processes for managing invoices generated by outside law firms, while offering access to important legal spend factors such as budgeting, expense monitoring and outside counsel performance, is included within this segment. This segment also incorporates the Company’s hosted and outsourced accounts payable automation solutions. Revenue within this segment is generally recognized on a subscription or transaction basis or proportionately over the estimated life of the customer relationship.
Each operating segment has separate sales forces and, periodically, a sales person in one operating segment will sell products and services that are typically sold within a different operating segment. In such cases, the transaction is generally recorded by the operating segment to which the sales person is assigned. Accordingly, segment results can include the results of transactions that have been allocated to a specific segment based on the contributing sales resources, rather than the nature of the product or service. Conversely, a transaction can be recorded by the operating segment primarily responsible for delivery to the customer, even if the sales person is assigned to a different operating segment.
The Company’s chief operating decision maker assesses segment performance based on a variety of factors that can include segment revenue and a segment measure of profit or loss. Each segment’s measure of profit or loss is on a pre-tax basis, and excludes stock compensation expense, acquisition-related expenses, amortization
of intangible assets and chargesrestructuring related to acquired in-process research and development.charges. There are no inter- segmentinter-segment sales; accordingly, the measure of segment revenue and profit or loss reflects only revenues from external customers. The costs of certain corporate level expenses, primarily general and administrative expenses, are allocated to the Company’s operating segments at predetermined rates that approximate cost.
The Company does not track or assign its assets by operating segment.
The Company has presented segment information for the years ended June 30, 2006,2009, 2008 and 2007 and 2008 according to the segment descriptions above.
| Fiscal Year Ended June 30, | Fiscal Year Ended June 30, | |||||||||||||||||||||||
| 2006 | 2007 | 2008 | 2009 | 2008 | 2007 | |||||||||||||||||||
| (in thousands) | (in thousands) | |||||||||||||||||||||||
Revenues: | ||||||||||||||||||||||||
Payments and Transactional Documents | $ | 70,622 | $ | 75,099 | $ | 84,962 | $ | 90,786 | $ | 84,962 | $ | 75,099 | ||||||||||||
Banking Solutions | 12,706 | 20,017 | 22,107 | 22,936 | 22,107 | 20,017 | ||||||||||||||||||
Outsourced Solutions | 18,337 | 23,219 | 24,172 | 24,292 | 24,172 | 23,219 | ||||||||||||||||||
Total revenues | $ | 101,655 | $ | 118,335 | $ | 131,241 | $ | 138,014 | $ | 131,241 | $ | 118,335 | ||||||||||||
Segment measure of profit (loss): | ||||||||||||||||||||||||
Payments and Transactional Documents | $ | 9,070 | $ | 12,733 | $ | 14,052 | $ | 14,662 | $ | 14,052 | $ | 12,733 | ||||||||||||
Banking Solutions | (1,155 | ) | 576 | 1,150 | (1,739 | ) | 1,150 | 576 | ||||||||||||||||
Outsourced Solutions | (677 | ) | (7,131 | ) | (2,610 | ) | 2,349 | (2,610 | ) | (7,131 | ) | |||||||||||||
Total measure of segment profit | $ | 7,238 | $ | 6,178 | $ | 12,592 | $ | 15,272 | $ | 12,592 | $ | 6,178 | ||||||||||||
A reconciliation of the measure of segment profit to the Company’s GAAP operating loss for 2006,2009, 2008 and 2007, and 2008, before the provision for income taxes, is as follows:
| Fiscal Year Ended June 30, | Fiscal Year Ended June 30, | |||||||||||||||||||||||
| 2006 | 2007 | 2008 | 2009 | 2008 | 2007 | |||||||||||||||||||
| (in thousands) | (in thousands) | |||||||||||||||||||||||
Segment measure of profit | $ | 7,238 | $ | 6,178 | $ | 12,592 | $ | 15,272 | $ | 12,592 | $ | 6,178 | ||||||||||||
Less: | ||||||||||||||||||||||||
Amortization of intangible assets | (4,491 | ) | (9,324 | ) | (11,399 | ) | (15,563 | ) | (11,399 | ) | (9,324 | ) | ||||||||||||
Stock compensation expense | (6,984 | ) | (7,945 | ) | (8,803 | ) | (9,498 | ) | (8,803 | ) | (7,945 | ) | ||||||||||||
Acquisition related expenses | (189 | ) | — | (269 | ) | (581 | ) | (269 | ) | — | ||||||||||||||
Restructuring charges | (1,548 | ) | — | — | ||||||||||||||||||||
Other income, net | 3,252 | 3,177 | 3,082 | 443 | 3,082 | 3,177 | ||||||||||||||||||
Loss before provision for income taxes | $ | (1,174 | ) | $ | (7,914 | ) | $ | (4,797 | ) | $ | (11,475 | ) | $ | (4,797 | ) | $ | (7,914 | ) | ||||||
The following depreciation expense amounts are included in the segment measure of profit (loss):
| Fiscal Year Ended June 30 | Fiscal Year Ended June 30 | |||||||||||||||||
| 2006 | 2007 | 2008 | 2009 | 2008 | 2007 | |||||||||||||
| (in thousands) | (in thousands) | |||||||||||||||||
Depreciation expense: | ||||||||||||||||||
Payments and Transactional Documents | $ | 1,320 | $ | 1,664 | $ | 1,515 | $ | 1,685 | $ | 1,515 | $ | 1,664 | ||||||
Banking Solutions | 318 | 495 | 528 | 701 | 528 | 495 | ||||||||||||
Outsourced Solutions | 1,036 | 1,024 | 1,468 | 1,528 | 1,468 | 1,024 | ||||||||||||
Total depreciation expense | $ | 2,674 | $ | 3,183 | $ | 3,511 | $ | 3,914 | $ | 3,511 | $ | 3,183 | ||||||
Net sales,The Company has presented geographic information about its revenues below. This presentation allocates revenue based on the point of sales,sale, not the location of the customer. Accordingly, the Company derives revenues from geographic locations, based on the location of the customer, that would vary from the geographic areas listed here; particularly in respect of a financial institution customer located in Australia, for which the point of sale was the United States. Revenues based on the point of sale are as follows:
| Fiscal Year Ended June 30, | Fiscal Year Ended June 30, | |||||||||||||||||
| 2006 | 2007 | 2008 | 2009 | 2008 | 2007 | |||||||||||||
| (in thousands) | (in thousands) | |||||||||||||||||
Sales to unaffiliated customers: | ||||||||||||||||||
United States | $ | 54,331 | $ | 65,064 | $ | 74,846 | $ | 85,698 | $ | 74,846 | $ | 65,064 | ||||||
Europe | 45,471 | 51,507 | 54,673 | 50,826 | 54,673 | 51,507 | ||||||||||||
Australia | 1,863 | 1,764 | 1,722 | 1,490 | 1,722 | 1,764 | ||||||||||||
Total sales to unaffiliated customers | $ | 101,665 | $ | 118,335 | $ | 131,241 | $ | 138,014 | $ | 131,241 | $ | 118,335 | ||||||
Long-lived assets, which are based on geographical designation, were as follows:
| Fiscal Year Ended June 30, | Fiscal Year Ended June 30, | |||||||||||
| 2007 | 2008 | 2009 | 2008 | |||||||||
| (in thousands) | (in thousands) | |||||||||||
Long-lived assets: | ||||||||||||
United States | $ | 4,664 | $ | 9,194 | $ | 12,160 | $ | 9,194 | ||||
Europe | 5,195 | 6,386 | 2,313 | 6,386 | ||||||||
Australia | 195 | 175 | 137 | 175 | ||||||||
Total long-lived assets | $ | 10,054 | $ | 15,755 | $ | 14,610 | $ | 15,755 | ||||
Revenues and long-lived assets attributable to Europe relate predominantly to the UK.
12.14. Income Taxes
The Company accounts for income taxes in accordance with SFAS No. 109. Under SFAS 109, deferred tax assets and liabilities are determined based on the differences between the financial reporting and tax basis of assets and liabilities and are measured by applying tax rates that are expected to be in effect when the differences reverse. Significant components of the Company’s deferred income taxes are as follows:
| June 30, | ||||||||
| 2007 | 2008 | |||||||
| (in thousands) | ||||||||
Deferred tax assets: | ||||||||
Allowances and reserves | $ | 790 | $ | 501 | ||||
Various accrued expenses | 894 | 1,990 | ||||||
Inventory | 126 | 54 | ||||||
Deferred revenue | 1,054 | 178 | ||||||
Intangible assets | 11,932 | 6,553 | ||||||
Property, plant and equipment | 1,065 | 1,533 | ||||||
Capital loss and impairment losses on equity investments | 558 | 558 | ||||||
Stock compensation | 3,281 | 3,696 | ||||||
Net operating loss carryforwards | 12,799 | 20,228 | ||||||
Research and development and other credits | 2,198 | 2,649 | ||||||
Other | 313 | — | ||||||
| 35,010 | 37,940 | |||||||
Valuation allowance against deferred tax assets | (33,520 | ) | (34,604 | ) | ||||
Deferred tax liabilities: | ||||||||
Intangible assets | (6,167 | ) | (6,314 | ) | ||||
Deferred revenue | (91 | ) | (174 | ) | ||||
Other | — | (371 | ) | |||||
Net deferred tax liabilities | $ | (4,768 | ) | $ | (3,523 | ) | ||
Deferred tax assets: Allowances and reserves Various accrued expenses Inventory Deferred revenue Intangible assets Property, plant and equipment Capital loss and impairment losses on equity investments Stock compensation Net operating loss carryforwards Research and development and other credits Valuation allowance against deferred tax assets Deferred tax liabilities: Intangible assets Deferred revenue Other Net deferred tax liabilities June 30, 2009 2008 (in thousands) $ 328 $ 501 1,440 1,990 60 54 1,066 178 9,487 6,553 1,394 1,533 445 558 3,764 3,696 21,903 20,228 2,882 2,649 42,769 37,940 (40,375 ) (34,604 ) (4,402 ) (6,314 ) (2 ) (174 ) — (371 ) $ (2,010 ) $ (3,523 )
SFAS 109 requires a valuation allowance to reduce the deferred tax assets reported if, based on the weight of available evidence, it is more likely than not that some portion or all of the deferred tax assets will not be realized. After consideration of all the evidence, both positive and negative, management has determined that a $34.6$40.4 million valuation allowance at June 30, 20082009 is necessary. The majority (approximately $31.2$37.5 million) of this valuation allowance relates to deferred tax assets associated with the Company’s US operations. Additionally, there is a valuation allowance of approximately $3.4$2.9 million recorded against certain of the Company’s European deferred tax assets due to specific concerns over the ability to realize these amounts. The increase in the valuation allowance during 20082009 was $1.1$5.8 million. Upon liquidation of the valuation allowance, approximately $3.5 million will be reversed through additional paid-in capital as this amount relates to excess tax benefits from non-qualified stock option exercises. Further, approximately $3.5 million will be reversed through goodwill as this amount relatesexercises occurring prior to valuation allowances established in the purchase price allocation of the Company’s prior business acquisitions.adoption of SFAS 123R. The reduction to goodwill (and the corresponding recognition of income tax expense) resulting from the utilization of certain acquired deferred tax assets for which a full valuation allowance had been established in the purchase price allocation of the Company’s prior business acquisitions was approximately $0.9$1.1 million and $1.0 million for fiscal years 20072009 and 2008, respectively.
At June 30, 2008,2009, the Company had gross US net operating loss carryforwards of $47.8$53.3 million, which expire at various times through the year 2027. Included within this amount is approximately $16.3 million of excess tax deductions associated with non-qualified stock options that have been exercised. When these excess tax benefits actually result in a reduction to currently payable income taxes, the tax benefit will be recorded as an increase to additional paid-in capital. In accordance with the accounting requirements of SFAS 109 and SFAS 123R, approximately $7.4 million of the aforementioned excess tax deductions have not been reflected as a component of the Company’s deferred tax assets at June 30, 2008,2009, as these amounts are recognized for financial
reporting purposes only when they actually reduce currently payable income taxes. The Company also had European net operating losses of $11.8 million, which have no statutory expiration date.
The Company also has $2.6$2.8 million of research and development tax credit carryforwards available, which expire at various points through year 2028.2029. The Company’s operating losses and tax credit carryforwards may be subject to limitations under provisions of the Internal Revenue Code.
The Company adopted the provisions of FIN 48, an interpretation of FASB Statement No. 109 (SFAS 109), on July 1, 2007. In accordance with the transition provisions of FIN 48, the cumulative effect of applying the pronouncement was reported as an adjustment to the July 1, 2007 balance of accumulated deficit. As a result of the adoption of FIN 48, the Company recorded a decrease to its tax reserves and its accumulated deficit in the amount of $0.1 million during the first quarter of fiscal year 2008.
As of June 30, 2008,2009, the Company had approximately $1.5$1.8 million of total gross unrecognized tax benefits, of which approximately $0.5$0.6 million represented the amount of unrecognized tax benefits that, if recognized, would favorably affect its effective income tax rate in future periods. Approximately $1.0$1.2 million of the gross unrecognized tax benefits resulted in a reduction to net operating loss and tax credit carryforwards, for which a full valuation allowance had been established. The Company currently anticipates that its unrecognized tax benefits will decrease within the next twelve months by approximately $0.2$0.3 million, as a result of the expiration of certain statutes of limitations associated with intercompany transactions subject to tax in multiple jurisdictions.
A summary of the changes in the gross amount of unrecognized tax benefits for the year ended June 30, 20082009 is shown below:
| (in thousands) | ||||
Balance at July 1, 2007 | $ | 1,021 | ||
Additions related current year tax positions | 576 | |||
Reductions due to lapse of statute of limitations | (57 | ) | ||
Foreign currency translation | 5 | |||
Balance at June 30, 2008 | $ | 1,545 | ||
Balance at July 1, 2008 Additions related to current year tax positions Reductions due to lapse of statute of limitations Foreign currency translation Balance at June 30, 2009 (in thousands) $ 1,545 395 (168 ) (19 ) $ 1,753
The Company recognizes interest and penalties related to uncertain tax positions as a component of income tax expense, but to date has not recorded any amounts related to potential penalties. To the extent that the accrued interest does not ultimately become payable, the amounts accrued will be derecognized and reflected as an income tax benefit in the period that such a determination is made. As of June 30, 2008,2009, the Company’s accrued interest related to uncertain tax positions was not significant.
The Company files U.S. federal income tax returns and returns in various state, local and foreign jurisdictions. Generally, the Company is no longer subject to U.S. federal, state and local, or foreign income tax examinations by tax authorities for years before 2001. Currently, the Company is not under examination in two state jurisdictions for therelating to tax years 2002 through 2007. The Company believesreturns that the ultimate resolution of these open years will not have a material adverse impact on the Company’s consolidated financial position, results of operations or cash flows.been previously filed.
The Company has permanently reinvested the earnings of its international subsidiaries and therefore has not provided for U.S. income taxes that could result from the distribution of such earnings to the USU.S. parent. If these earnings were ultimately distributed to the USU.S. in the form of dividends or otherwise, or if the shares of its international subsidiaries were sold or transferred, the Company would likely be subject to additional USU.S. income taxes, net of the impact of any available foreign tax credits. It is not practicable to estimate the amount of unrecognized deferred US taxes on these undistributed earnings.
The provision (benefit) for income taxes consists of the following:
| Year Ended June 30, | Year Ended June 30, | |||||||||||||||||||||||
| 2006 | 2007 | 2008 | 2009 | 2008 | 2007 | |||||||||||||||||||
| (in thousands) | (in thousands) | |||||||||||||||||||||||
Current: | ||||||||||||||||||||||||
Federal | $ | 49 | $ | (65 | ) | $ | 311 | $ | (112 | ) | $ | 311 | $ | (65 | ) | |||||||||
State | 7 | 19 | 17 | 15 | 17 | 19 | ||||||||||||||||||
Foreign | 1,102 | 58 | 752 | 583 | 752 | 58 | ||||||||||||||||||
| 1,158 | 12 | 1,080 | 486 | 1,080 | 12 | |||||||||||||||||||
Deferred: | ||||||||||||||||||||||||
Federal | 355 | 548 | 847 | 1,222 | 847 | 548 | ||||||||||||||||||
State | 62 | 96 | 148 | 213 | 148 | 96 | ||||||||||||||||||
Foreign | (915 | ) | (1,540 | ) | (1,611 | ) | (1,108 | ) | (1,611 | ) | (1,540 | ) | ||||||||||||
| (498 | ) | (896 | ) | (616 | ) | 327 | (616 | ) | (896 | ) | ||||||||||||||
| $ | 660 | $ | (884 | ) | $ | 464 | $ | 813 | $ | 464 | $ | (884 | ) | |||||||||||
For fiscal year 2008,2009, net tax expense includes the impact of a non-recurring tax benefit of $0.1 million arising from a change in the Company’s German tax rate as a result of a restructuring of its German operations, as well as a tax benefit of $0.2 million arisingresulting from the enactment of legislation that decreasedallowed the Company’sCompany to claim a tax rates in the UKrefund for a portion of its unused research and Germany.development credit carryforwards.
Net income (loss) before income taxes by geographic area is as follows:
| Year Ended June 30, | ||||||||||||
| 2006 | 2007 | 2008 | ||||||||||
| (in thousands) | ||||||||||||
United States | $ | (1,491 | ) | $ | (2,946 | ) | $ | (1,549 | ) | |||
Europe | (205 | ) | (5,471 | ) | (3,808 | ) | ||||||
Australia | 522 | 503 | 560 | |||||||||
| $ | (1,174 | ) | $ | (7,914 | ) | $ | (4,797 | ) | ||||
United States Europe Australia Year Ended June 30, 2009 2008 2007 (in thousands) $ (7,551 ) $ (1,549 ) $ (2,946 ) (4,133 ) (3,808 ) (5,471 ) 209 560 503 $ (11,475 ) $ (4,797 ) $ (7,914 )
A reconciliation of the federal statutory rate to the effective income tax rate is as follows:
| Year Ended June 30, | Year Ended June 30, | |||||||||||||||||
| 2006 | 2007 | 2008 | 2009 | 2008 | 2007 | |||||||||||||
Tax benefit at federal statutory rate | (34.0 | )% | (34.0 | )% | (34.0 | )% | (34.0 | )% | (34.0 | )% | (34.0 | )% | ||||||
State taxes, net of federal benefit | (7.5 | ) | (2.3 | ) | (1.9 | ) | 2.0 | (1.9 | ) | (2.3 | ) | |||||||
Non-deductible share-based payments | 72.7 | 9.0 | 13.2 | 5.7 | 13.2 | 9.0 | ||||||||||||
Change in valuation allowance | 14.4 | 14.0 | 21.7 | 33.0 | 21.7 | 14.0 | ||||||||||||
Tax rate differential on foreign earnings | (1.2 | ) | 2.3 | 2.2 | 1.7 | 2.2 | 2.3 | |||||||||||
Non-deductible other expenses | 8.9 | 1.8 | 4.4 | 1.4 | 4.4 | 1.8 | ||||||||||||
Changes in statutory tax rates | — | — | (4.8 | ) | (0.8 | ) | (4.8 | ) | — | |||||||||
Uncertain tax positions | — | — | 5.7 | 0.2 | 5.7 | — | ||||||||||||
Other | 2.9 | (2.0 | ) | 3.2 | (2.1 | ) | 3.2 | (2.0 | ) | |||||||||
| 56.2 | % | (11.2 | )% | 9.7 | % | 7.1 | % | 9.7 | % | (11.2 | )% | |||||||
13.15. Guarantees
The Company generally offers a standard warranty on its products and services, specifying that its software products will perform in accordance with published product specifications and that any professional services will conform with applicable specifications and industry standards. Further, the Company offers, as an element of its standard licensing arrangements, an indemnification clause that protects the licensee against liability and damages, including legal defense costs arising from claims of patent, copyright, trademark or other similar infringements by the Company’s software products. To date, the Company has not had any significant warranty or indemnification claims against its products. There were no warranty accruals at June 30, 20072009 or 2008.
14.16. Subsequent Events – PayMode Acquisition
On August 5, 2009 the Company entered into an asset purchase agreement with Bank of America N.A. (the “Bank”) to purchase substantially all of the assets and related operations of the Bank’s PayMode business. PayMode facilitates the electronic exchange of payments and invoices between organizations and their suppliers and is operated as a Software as a Service (SaaS) offering. As of August 5, 2009, there were in excess of 80,000 vendors participating in the PayMode network. The Company and the Bank have also agreed to enter into a services agreement under which the Company will provide PayMode services to the Bank and the Bank’s customers for an initial term of five years, with options to renew for successive three-year periods.
Under the terms of the asset purchase agreement, the Company will acquire the PayMode electronic payments business, including the vendor network, application software, intellectual property rights and other assets used in the business. The Company will pay a cash purchase price of $17.0 million and issue the Bank a warrant to purchase 1,000,000 shares of common stock of the Company at a purchase price of $8.50 per share, as purchase consideration. The Company expects to complete this acquisition in September 2009.
For purposes of assessing whether there were any subsequent events warranting disclosure, the Company evaluated events occurring between June 30, 2009 and September 11, 2009, the date the financial statements were issued.
17. Quarterly Financial Data (unaudited)
| For the quarters ended | For the quarters ended | |||||||||||||||||||||||||||||||||||||||||||||||||||||||||||||||
| September 30, 2006 | December 31, 2006 | March 31, 2007 | June 30, 2007 | September 30, 2007 | December 31, 2007 | March 31, 2008 | June 30, 2008 | September 30, 2007 | December 31, 2007 | March 31, 2008 | June 30, 2008 | September 30, 2008 | December 31, 2008 | March 31, 2009 | June 30, 2009 (1) | |||||||||||||||||||||||||||||||||||||||||||||||||
| (in thousands, except per share data) | (in thousands, except per share data) | |||||||||||||||||||||||||||||||||||||||||||||||||||||||||||||||
Revenues | $ | 25,222 | $ | 29,651 | $ | 31,115 | $ | 32,348 | $ | 31,362 | $ | 31,832 | $ | 32,032 | $ | 36,015 | $ | 31,362 | $ | 31,832 | $ | 32,032 | $ | 36,015 | $ | 35,506 | $ | 34,334 | $ | 33,291 | $ | 34,883 | ||||||||||||||||||||||||||||||||
Gross profit | 13,531 | 16,806 | 17,478 | 17,461 | 16,848 | 18,035 | 17,494 | 19,455 | 16,848 | 18,035 | 17,494 | 19,455 | 19,462 | 18,998 | 18,878 | 19,835 | ||||||||||||||||||||||||||||||||||||||||||||||||
Net loss | $ | (1,480 | ) | $ | (2,116 | ) | $ | (1,874 | ) | $ | (1,560 | ) | $ | (801 | ) | $ | (674 | ) | $ | (347 | ) | $ | (3,439 | ) | $ | (801 | ) | $ | (674 | ) | $ | (347 | ) | $ | (3,439 | ) | $ | (3,849 | ) | $ | (2,869 | ) | $ | (1,970 | ) | $ | (3,600 | ) | ||||||||||||||||
Basic and diluted net loss per share | $ | (0.06 | ) | $ | (0.09 | ) | $ | (0.08 | ) | $ | (0.07 | ) | $ | (0.03 | ) | $ | (0.03 | ) | $ | (0.01 | ) | $ | (0.14 | ) | $ | (0.03 | ) | $ | (0.03 | ) | $ | (0.01 | ) | $ | (0.14 | ) | $ | (0.16 | ) | $ | (0.12 | ) | $ | (0.08 | ) | $ | (0.15 | ) | ||||||||||||||||
Shares used in computing basic and diluted net loss per share | 23,430 | 23,622 | 23,529 | 23,573 | 23,602 | 23,887 | 23,927 | 23,884 | 23,602 | 23,887 | 23,927 | 23,884 | 23,883 | 24,033 | 24,047 | 24,212 | ||||||||||||||||||||||||||||||||||||||||||||||||
| (1) | Net loss reflects restructuring costs of approximately $3.0 million based on events occurring during the quarter ended June 30, 2009. |
Pursuant to the requirements of Section 13 or 15(d) of the Securities Exchange Act of 1934, the registrant has duly caused this report to be signed on its behalf by the undersigned, thereunto duly authorized.
| BOTTOMLINE TECHNOLOGIES (DE), INC. | ||
| By: | /s/ KEVIN M. DONOVAN | |
| Kevin M. Donovan | ||
| Chief Financial Officer and Treasurer | ||
| Date: September | ||
Pursuant to the requirements of the Securities Exchange Act of 1934, this report has been signed below by the following persons on behalf of the registrant and in the capacities and on the dates indicated:
Name | Title | Date | ||
/S/ JOSEPH L. MULLEN Joseph L. Mullen | Chairman of the Board | September | ||
/S/ ROBERT A. EBERLE Robert A. Eberle | President, Chief Executive Officer and Director (Principal Executive Officer) | September | ||
/S/ KEVIN M. DONOVAN Kevin M. Donovan | Chief Financial Officer and Treasurer (Principal Financial and Accounting Officer) | September | ||
/S/ JOSEPH L. BARRY JR. Joseph L. Barry Jr. | Director | September | ||
/S/ MICHAEL J. CURRAN Michael J. Curran | Director | September | ||
/S/ JEFFREY C. LEATHE Jeffrey C. Leathe | Director | September | ||
/S/ JAMES L. LOOMIS James L. Loomis | Director | September | ||
/S/ DANIEL M. MCGURL Daniel M. McGurl | Director | September | ||
/S/ GAREN K. STAGLIN Garen K. Staglin | Director | September | ||
/S/ JAMES W. ZILINSKI James W. Zilinski | Director | September | ||
Exhibit No. | Description | |
| 2.1(1)* | Agreement and Plan of Merger, dated as of March 3, 2008, by and among Bottomline Technologies (de), Inc., Olive Acquisition Corp. and Optio Software, Inc. | |
| 2.2(1)* | Voting Agreement, dated as of March 3, 2008, by and among Bottomline Technologies (de), Inc., Optio Software, Inc. and the Stockholders listed on the signature pages thereto. | |
| 3.1(2) | Amended and Restated Certificate of Incorporation of the Registrant. | |
| 3.2(3) | Amended and Restated By-Laws of the Registrant, as amended. | |
| 4.1(2) | Specimen Certificate for Shares of Common Stock. | |
| 10.1(2)# | 1989 Stock Option Plan, as amended, including form of stock option agreement for incentive and non-statutory stock options. | |
| 10.2(2)# | Amended and Restated 1997 Stock Incentive Plan, including form of stock option agreement for incentive and non-statutory stock options. | |
| 10.3(2)# | 1998 Director Stock Option Plan, including form of non-statutory stock option agreement. | |
| 10.4(2)# | 1998 Employee Stock Purchase Plan. | |
| Lease dated July 20, 1999, between the Registrant and 60 Cutter Mill Road Property Corp. | ||
| Lease dated May 22, 2000, between the Registrant and 55 Broad Street L.P. | ||
| Lease dated August 31, 2000, between the Registrant and 325 Corporate Drive II, LLC. | ||
| 2000 Stock Incentive Plan, including form of stock option agreement for incentive and non-statutory stock options and form of stock option agreement for United Kingdom personnel. | ||
| Form of Indemnification Letter dated as of September 21, 2000. | ||
| Second Amendment to Sublease, effective as of October 1, 2001, between the Registrant and 325 Corporate Drive II, LLC. | ||
| Loan and Security Agreement dated as of December 28, 2001 between the Registrant and Silicon Valley Bank. | ||
| Negative Pledge Agreement dated as of December 28, 2001 between the Registrant and Silicon Valley Bank. | ||
| Committed Business Overdraft Facility dated as of December 18, 2001 between Bottomline Technologies Europe Ltd and National Westminster Bank Plc. | ||
| Legal Charge dated as of December 17, 2001 between Bottomline Technologies Europe Ltd and National Westminster Bank Plc. | ||
| Debenture dated as of December 17, 2001 between Bottomline Technologies Europe Ltd and National Westminster Bank Plc. | ||
| First Amendment to Sublease between the Registrant and 325 Corporate Drive II, LLC. | ||
| Service Agreement of Mr. Fortune dated as of March 11, 1999. | ||
| Amended and Restated Employment Agreement dated as of November 21, 2002 between the Registrant and Mr. Mullen. | ||
| Amended and Restated Employment Agreement dated as of November 21, 2002 between the Registrant and Mr. Eberle. | ||
|
| ||
| First Loan Modification Agreement dated as of December 31, 2002 between the Registrant and Silicon Valley Bank. | |||
Exhibit No. | Description | |
| 10.21(10) | Confirmation of Committed Business Overdraft Facility as of January 31, 2003 between Bottomline Technologies Europe Limited and National Westminster Bank Plc. | |
| Second Loan Modification Agreement dated as of January 19, 2004 between the Registrant and Silicon Valley Bank. | ||
| Confirmation of Committed Business Overdraft Facility as of January 9, 2004 between Bottomline Technologies Europe Limited and The Royal Bank of Scotland. | ||
| 2000 Employee Stock Purchase Plan, as amended. | ||
| Third Loan Modification Agreement dated as of February 4, 2005 between the Registrant and Silicon Valley Bank. | ||
| Confirmation of Committed Business Overdraft Facility as of February 7, 2005 between Bottomline Technologies Europe Limited and Royal Bank of Scotland. | ||
| Fourth Loan Modification Agreement dated as of May 4, 2005 between the Registrant and Silicon Valley Bank. | ||
| Letter Agreement dated as of September 30, 2005 between the Registrant and Joseph L. Mullen amending the Amendment and Restated Employment Agreement of Mr. Mullen dated as of November 21, 2002. | ||
| Letter Agreement dated as of September 30, 2005 between the Registrant and Robert A. Eberle amending the Amendment and Restated Employment Agreement of Mr. Eberle dated as of November 21, 2002. | ||
| Restricted Stock Agreement dated as of August 25, 2005 between the Registrant and Joseph L. Mullen. | ||
| Restricted Stock Agreement dated as of August 25, 2005 between the Registrant and Robert A. Eberle. | ||
| Executive Retention Agreement dated as of February 5, 2004 between the Registrant and Kevin M. Donovan. | ||
| Form of Restricted Stock Agreement, dated November 17, 2005, between the Registrant and each of Joseph L. Barry, John W. Barter, William O. Grabe, James L. Loomis, Daniel M. McGurl and James W. Zilinski. | ||
| Restricted Stock Agreement, dated December 2, 2005, between the Registrant and Kevin M. Donovan. | ||
| Forms of Restricted Stock Agreement under 2000 Stock Incentive Plan. | ||
|
| |
| Letter Agreement dated as of November 16, 2006 between Bottomline Technologies (de), Inc. and Joseph L. Mullen. | ||
| Letter Agreement dated as of November 16, 2006 between Bottomline Technologies (de), Inc. and Robert A. Eberle. | ||
| Executive Retention Agreement dated as of November 16, 2006 between Bottomline Technologies (de), Inc. and Kevin M. Donovan. | ||
| Form of Executive Officer Bonus Plan for 2008 with respect to Robert A. Eberle and Peter S. Fortune. | ||
| Amended Executive Officer Bonus Plan for 2008 for Robert A. Eberle. | ||
| 10.41(18)# | Form of Executive Officer Bonus Plan for 2009 with respect to Robert A. Eberle and Peter S. Fortune | |
Exhibit No. | Description | |
| 10.42(18)# | Letter Agreement dated September 18, 2008 with Joseph L. Mullen | |
| 10.43(19)# | Form of Executive Officer Bonus Plan for 2009 with respect to Robert A. Eberle and Peter S. Fortune, as amended | |
| 10.44(19)# | Letter Agreement dated as of December 23, 2008 between Bottomline Technologies (de), Inc. and Robert A. Eberle | |
| 10.45(19)# | Letter Agreement dated as of December 23, 2008 between Bottomline Technologies (de), Inc. and Kevin M. Donovan | |
| 10.46# | Compromise Agreement dated as of April 23, 2009 between Bottomline Technologies (de), Inc. and Peter S. Fortune (filed herewith) | |
| 21.1 | List of Subsidiaries (filed herewith). | |
| 23.1 | Consent of Ernst & Young LLP (filed herewith). | |
| 31.1 | Rule 13a-14(a)/15d-14(a) Certification of Principal Executive Officer (filed herewith). | |
| 31.2 | Rule 13a-14(a)/15d-14(a) Certification of Principal Financial Officer (filed herewith). | |
| 32.1 | Section 1350 Certification of Principal Executive Officer (filed herewith). | |
| 32.2 | Section 1350 Certification of Principal Financial Officer (filed herewith). | |
| * | Certain schedules to this agreement were omitted by the Registrant. The Registrant agrees to furnish any schedule to this agreement supplementally to the Securities and Exchange Commission upon written request. |
| # | Management contract or compensatory plan or arrangement required to be filed as an exhibit pursuant to Item 15(a) of Form 10-K. |
| (1) | Incorporated herein by reference to the Registrant’s Current Report on Form 8-K filed on March 3, 2008 (File No. 000-25259). |
| (2) | Incorporated herein by reference to the Registrant’s Registration Statement on Form S-1 (File No. 333-67309). |
| (3) | Incorporated herein by reference to the Registrant’s Annual Report on Form 10-K for the Fiscal Year Ended June 30, 2007 (File No. 000-25259), filed on September 12, 2007. |
| (4) | Incorporated herein by reference to the Registrant’s Annual Report on Form 10-K for the Fiscal Year Ended June 30, 2000 (File No. 000-25259), filed on September 28, 2000. |
| (5) | Incorporated herein by reference to the Registrant’s Annual Report on Form 10-K for the Fiscal Year ended June 30, 2004 (File No. 000-25259), filed on September 14, 2004. |
| (6) | Incorporated herein by reference to the Registrant’s Quarterly Report on Form 10-Q for the Fiscal Quarter Ended September 30, 2000 (File No. 000-25259), filed on November 14, 2000. |
| (7) | Incorporated herein by reference to the Registrant’s Quarterly Report on Form 10-Q for the Fiscal Quarter Ended September 30, 2001 (File No. 000-25259), filed on November 13, 2001. |
| (8) | Incorporated herein by reference to the Registrant’s Quarterly Report on Form 10-Q for the Fiscal Quarter Ended December 31, 2001 (File No. 000-25259), filed on February 14, 2002. |
| (9) | Incorporated herein by reference to the Registrant’s Annual Report on Form 10-K for the Fiscal Year Ended June 30, 2002 (File No. 000-25259), filed on September 30, 2002. |
| (10) | Incorporated herein by reference to the Registrant’s Quarterly Report on Form 10-Q for the Fiscal Quarter Ended December 31, 2002 (File No. 000-25259), filed on February 12, 2003. |
| (11) | Incorporated herein by reference to the Registrant’s Quarterly Report on Form 10-Q for the Fiscal Quarter Ended December 31, 2003 (File No. 000-25259), filed on February 13, 2004. |
| (12) | Incorporated herein by reference to the Registrant’s Quarterly Report on Form 10-Q for the Fiscal Quarter Ended December 31, 2004 (File No. 000-25259), filed on February 8, 2005. |
| (13) | Incorporated herein by reference to the Registrant’s Quarterly Report on Form 10-Q for the Fiscal Quarter Ended March 31, 2005 (File No. 000-25259), filed on May 6, 2005. |
| (14) | Incorporated herein by reference to the Registrant’s Quarterly Report on Form 10-Q for the Fiscal Quarter Ended September 30, 2005 (File No. 000-25259), filed on November 8, 2005. |
| (15) | Incorporated herein by reference to the Registrant’s Quarterly Report on Form 10-Q for the Fiscal Quarter Ended December 31, 2005 (File No. 000-25259), filed on February 9, 2006. |
| (16) | Incorporated herein by reference to the Registrant’s |
| Incorporated herein by reference to the Registrant’s Quarterly Report on Form 10-Q for the Fiscal Quarter Ended December 31, 2007 (File No. 000-25259), filed on February 8, 2008. |
| (18) | Incorporated herein by reference to the Registrant’s Quarterly Report on Form 10-Q for the Fiscal Quarter Ended September 30, 2008 (File No. 000-25259), filed on November 7, 2008. |
| (19) | Incorporated herein by reference to the Registrant’s Quarterly Report on Form 10-Q for the Fiscal Quarter Ended December 31, 2008 (File No. 000-25259), filed on February 6, 2009. |
8488